2016 obesity fact sheet - kosso.or.kr · 2016 fact sheet definition of obesity, abdominal obesity,...
TRANSCRIPT
2016OBESITYFACT SHEET
2
Summary of 2016 Fact Sheet
Definition of Obesity, Abdominal obesity, and Morbid obesity
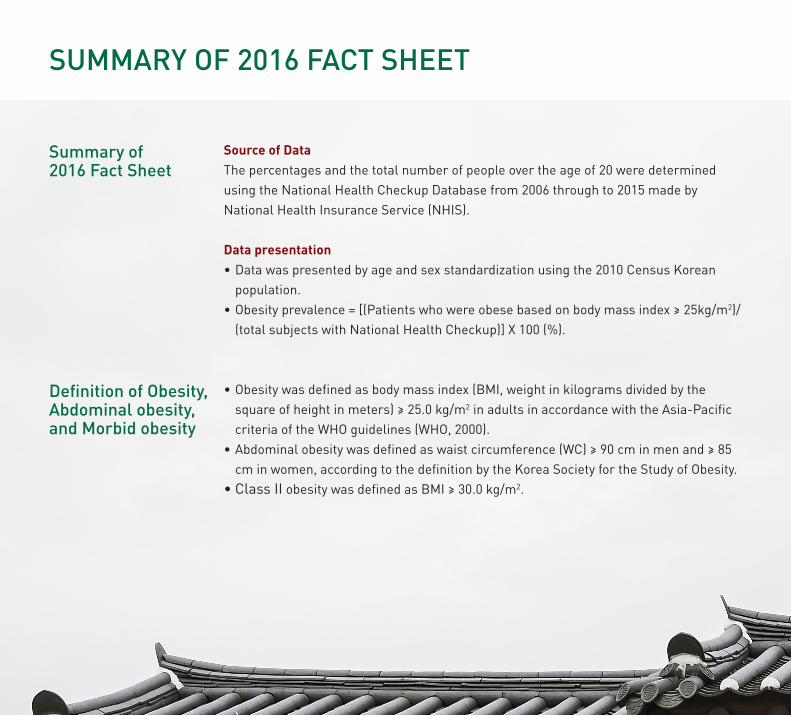
Source of DataThe percentages and the total number of people over the age of 20 were determined using the National Health Checkup Database from 2006 through to 2015 made by National Health Insurance Service (NHIS).
Data presentation•Data was presented by age and sex standardization using the 2010 Census Korean
population.•Obesity prevalence = [(Patients who were obese based on body mass index ≥ 25kg/m2)/
(total subjects with National Health Checkup)] X 100 (%).
•Obesity was defined as body mass index (BMI, weight in kilograms divided by the square of height in meters) ≥ 25.0 kg/m2 in adults in accordance with the Asia-Pacific criteria of the WHO guidelines (WHO, 2000).
•Abdominal obesity was defined as waist circumference (WC) ≥ 90 cm in men and ≥ 85 cm in women, according to the definition by the Korea Society for the Study of Obesity.
•Class II obesity was defined as BMI ≥ 30.0 kg/m2.
SUMMARY OF 2016 FACT SHEET
3
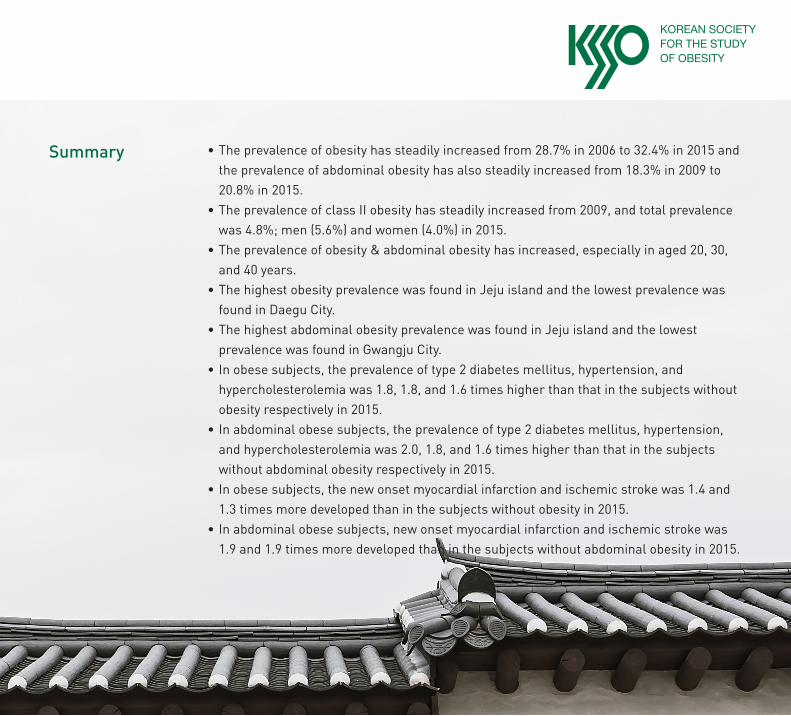
Summary •The prevalence of obesity has steadily increased from 28.7% in 2006 to 32.4% in 2015 and the prevalence of abdominal obesity has also steadily increased from 18.3% in 2009 to 20.8% in 2015.
•The prevalence of class II obesity has steadily increased from 2009, and total prevalence was 4.8%; men (5.6%) and women (4.0%) in 2015.
•The prevalence of obesity & abdominal obesity has increased, especially in aged 20, 30, and 40 years.
•The highest obesity prevalence was found in Jeju island and the lowest prevalence was found in Daegu City.
•The highest abdominal obesity prevalence was found in Jeju island and the lowest prevalence was found in Gwangju City.
•In obese subjects, the prevalence of type 2 diabetes mellitus, hypertension, and hypercholesterolemia was 1.8, 1.8, and 1.6 times higher than that in the subjects without obesity respectively in 2015.
•In abdominal obese subjects, the prevalence of type 2 diabetes mellitus, hypertension, and hypercholesterolemia was 2.0, 1.8, and 1.6 times higher than that in the subjects without abdominal obesity respectively in 2015.
•In obese subjects, the new onset myocardial infarction and ischemic stroke was 1.4 and 1.3 times more developed than in the subjects without obesity in 2015.
•In abdominal obese subjects, new onset myocardial infarction and ischemic stroke was 1.9 and 1.9 times more developed than in the subjects without abdominal obesity in 2015.

4
The trend of prevalence of obesity and abdominal obesity 2006~2015 The prevalence of obesity has steadily increased from 28.7% in 2006 to 32.4% in 2015 and the prevalence of abdominal obesity has also steadily increased from 18.3% in 2009 to 20.8% in 2015.
Obesity
Abdominal obesity
32%Prevalence of obesity 2015
21% prevalence of abdominal obesity 2015
2006
10%
20%
30%
2007
2008
2009
2010
2011
2012
2013
2014
2015
5
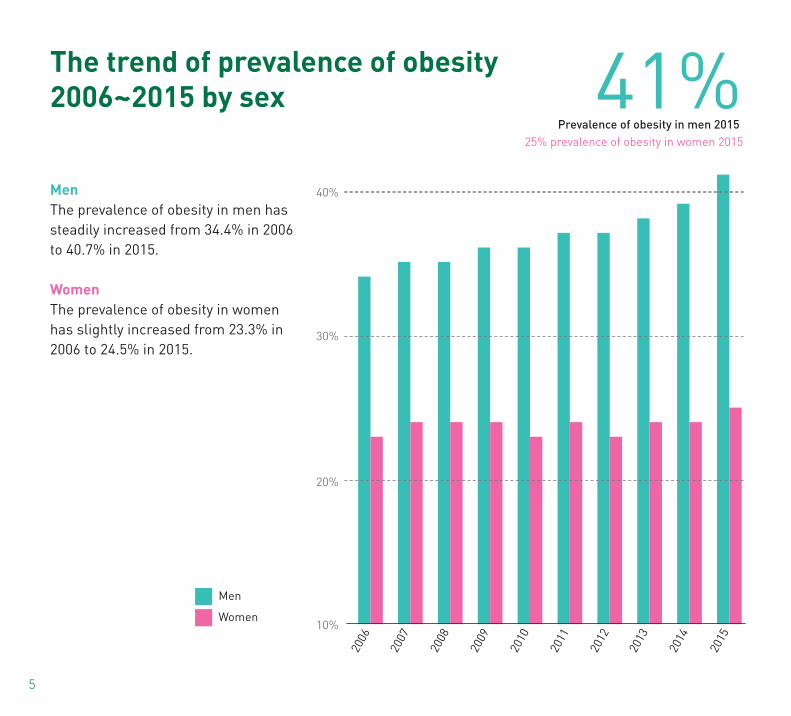
The trend of prevalence of obesity 2006~2015 by sex
MenThe prevalence of obesity in men has steadily increased from 34.4% in 2006 to 40.7% in 2015.
WomenThe prevalence of obesity in women has slightly increased from 23.3% in 2006 to 24.5% in 2015.
2006
10%
20%
30%
40%
Men
Women
2007
2008
2009
2010
2011
2012
2013
2014
2015
41%Prevalence of obesity in men 2015
25% prevalence of obesity in women 2015
6
2009
2010
2011
2012
2013
2014
2015
10%
20%
30%
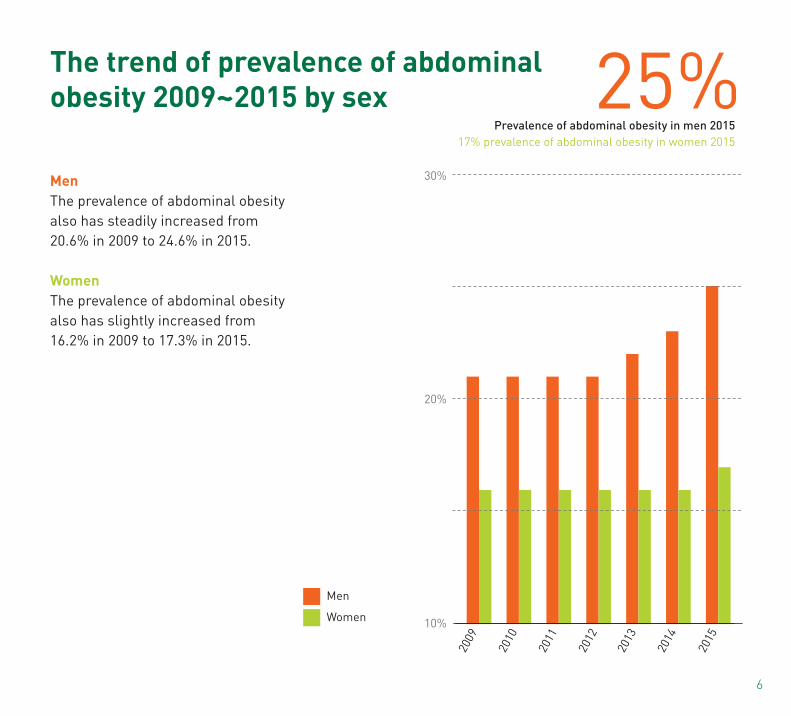
The trend of prevalence of abdominal obesity 2009~2015 by sex
MenThe prevalence of abdominal obesity also has steadily increased from 20.6% in 2009 to 24.6% in 2015.
WomenThe prevalence of abdominal obesity also has slightly increased from 16.2% in 2009 to 17.3% in 2015.
Men
Women
25%Prevalence of abdominal obesity in men 2015
17% prevalence of abdominal obesity in women 2015
7
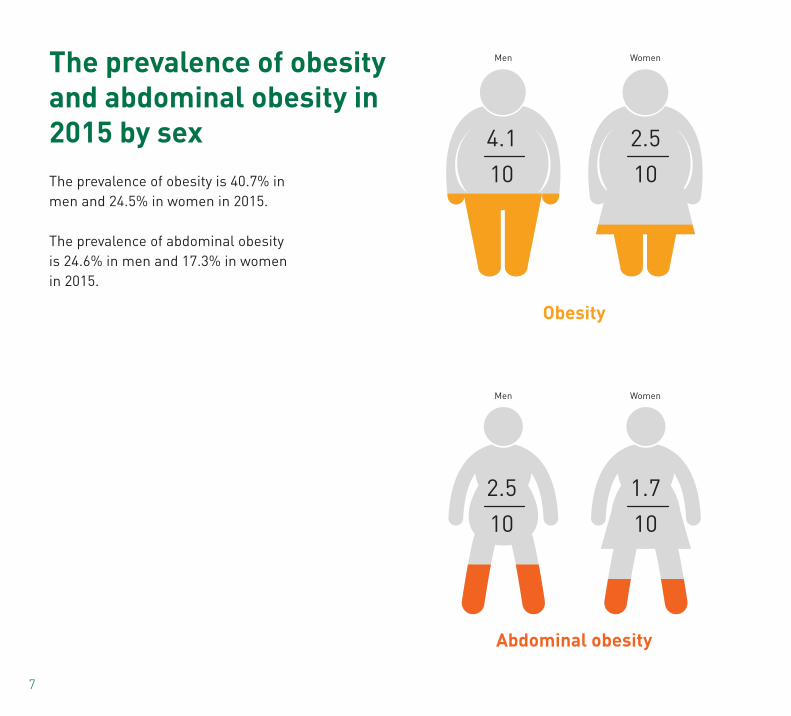
The prevalence of obesity and abdominal obesity in 2015 by sexThe prevalence of obesity is 40.7% in men and 24.5% in women in 2015.
The prevalence of abdominal obesity is 24.6% in men and 17.3% in women in 2015.
4.110
2.510
Men
Men
Women
Women
Obesity
Abdominal obesity
2.510
1.710

8
The trend of prevalence of class II obesity 2006~2015
The prevalence of class II obesity has steadily increased from 2009, and total prevalence was 4.8%; men (5.6%) and women (4.0%) in 2015.
Class II obesity was defined as BMI ≥ 30.0 kg/m2.
2009
2008
2007
2006
2010
2011
2012
2013
2014
2015
6%
5%
4%
MenTotalWomen
5.6%|
4.8%|
4.0%|
4.9%|
4.3%|
3.7%|
4.6%|
4.1%|
3.6%|
4.2%|
3.8%|
3.3%|
4.1%|
3.3%|
3.4%|
2.9%|
3.3%|
2.9%|
3.7%|
3.1%|
3.7%|
3.1%| 3.1%
|
2.8%
3.5%|
2.9%|
3.3%|
2.7%|
3.1%|
2.6%
3%
9
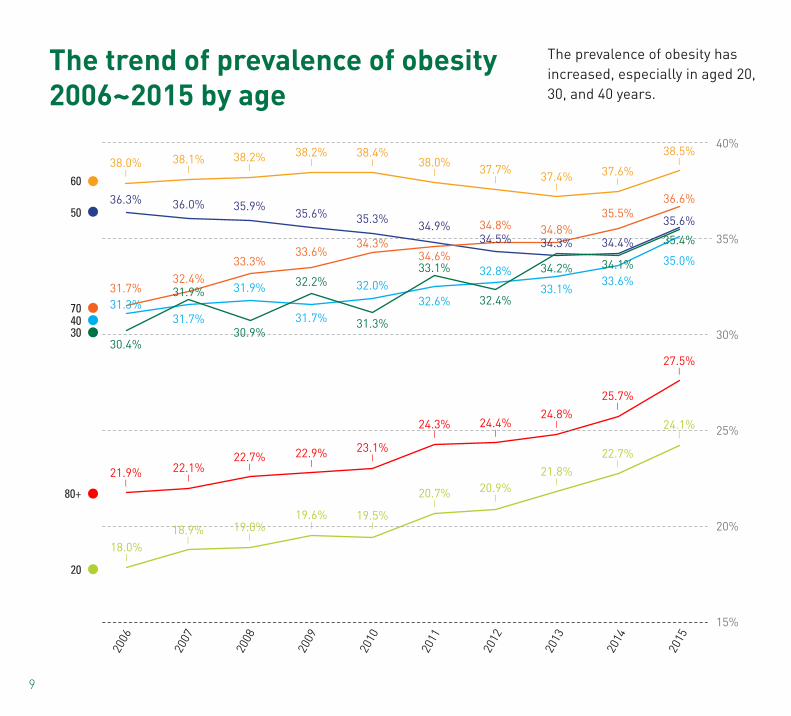
The trend of prevalence of obesity 2006~2015 by age
The prevalence of obesity has increased, especially in aged 20, 30, and 40 years.
20
3040
50
60
70
80+
40%
35%
30%
25%
20%
15%
2006
2007
2008
2009
2010
2011
2012
2013
2014
2015
18.0%|
21.9%|
38.0%|
30.4%
31.3%
36.3%
31.7%
18.9%|
22.1%|
38.1%|
31.9%
31.7%
36.0%
32.4%
19.0%|
22.7%|
38.2%|
30.9%
31.9%
35.9%
33.3%
19.6%|
22.9%|
38.2%|
32.2%
31.7%
35.6%
33.6%
19.5%|
23.1%|
38.4%|
31.3%
32.0%
35.3%
34.3%
20.7%|
24.3%|
38.0%|
33.1%
32.6%
34.9%
34.6%
20.9%|
24.4%|
37.7%|
32.4%
32.8%
34.5%34.8%
24.8%|
37.4%|
34.2%
33.1%
34.3%34.8%
21.8%|
22.7%|
25.7%|
37.6%|
34.1%33.6%
34.4%
35.5%
24.1%|
27.5%|
38.5%|
35.4%
35.0%
35.6%
36.6%

10
20
3040
50
60
70
80+
35%
30%
25%
20%
15%
10%
5%
2009
2010
2011
2012
2013
2014
2015
8.9%|
33.4%|
22.1%|
16.1%|
15.7%
30.3%|
29.6%
9.0%|
33.6%|
21.5%|
16.1%|
15.4%
29.9%|
29.5%
9.8%|
33.2%|
21.2%|
16.7%
16.9%|
29.1%
29.8%|
10.0%|
33.0%|
20.9%|
16.9%
16.7%|
28.5%|
29.8%|
11.0%|
33.0%|
21.0%|
17.5%|
18.6%|
28.5%|
30.2%|
11.5%|
33.4%|
20.9%|
18.0%|
18.9%|
28.4%|
30.7%|
12.5%|
34.6%|
22.2%|
19.5%
20.3%|
29.4%|
32.4%|
The trend of prevalence of abdominal obesity 2009~2015 by ageThe prevalence of abdominal obesity has increased, especially in aged 20, 30, and 40 years.
11
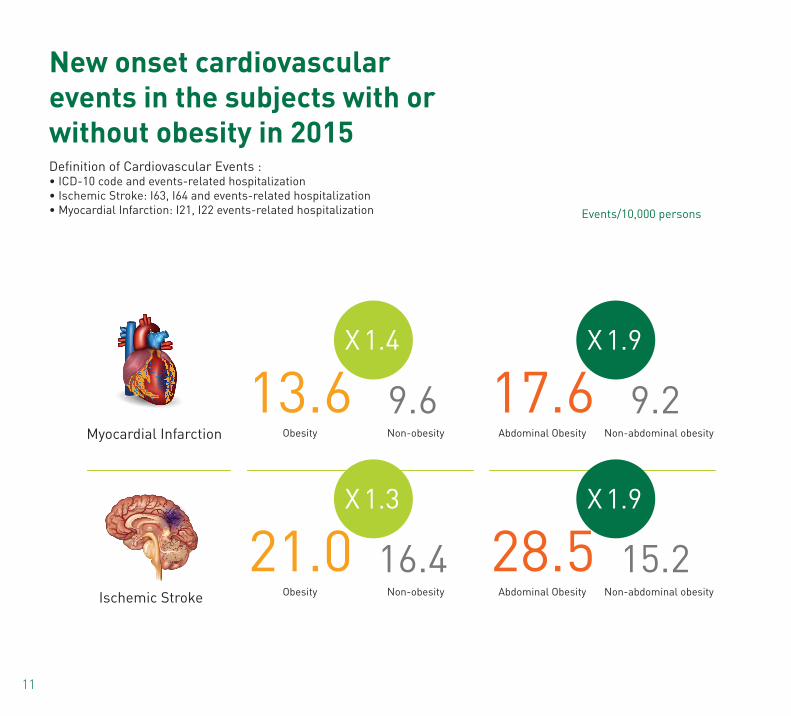
New onset cardiovascular events in the subjects with or without obesity in 2015Definition of Cardiovascular Events :•ICD-10codeandevents-relatedhospitalization•IschemicStroke:I63,I64andevents-relatedhospitalization•MyocardialInfarction:I21,I22events-relatedhospitalization
Myocardial Infarction
Ischemic Stroke
Obesity Abdominal Obesity
Obesity Abdominal Obesity
Non-obesity Non-abdominal obesity
Non-abdominal obesityNon-obesity
13.6 17.6
21.0 28.5
9.6 9.2
16.4 15.2
Events/10,000 persons
X 1.4 X 1.9
X 1.3 X 1.9
12
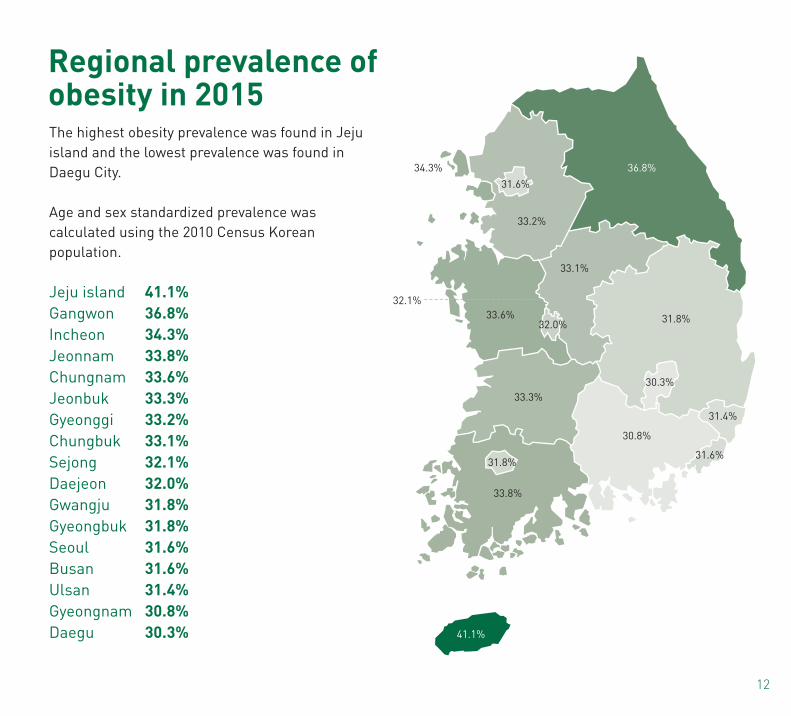
Regional prevalence of obesity in 2015The highest obesity prevalence was found in Jeju island and the lowest prevalence was found in Daegu City.
Age and sex standardized prevalence was calculated using the 2010 Census Korean population.
Jeju island 41.1%Gangwon 36.8%Incheon 34.3%Jeonnam 33.8%Chungnam 33.6%Jeonbuk 33.3%Gyeonggi 33.2%Chungbuk 33.1%Sejong 32.1%Daejeon 32.0%Gwangju 31.8%Gyeongbuk 31.8%Seoul 31.6%Busan 31.6%Ulsan 31.4%Gyeongnam 30.8%Daegu 30.3% 41.1%
36.8%34.3%
33.8%
33.6%
33.3%
31.8%
31.8%
31.6%
31.6%
31.4%
30.8%
30.3%
33.1%
33.2%
32.1%
32.0%
13
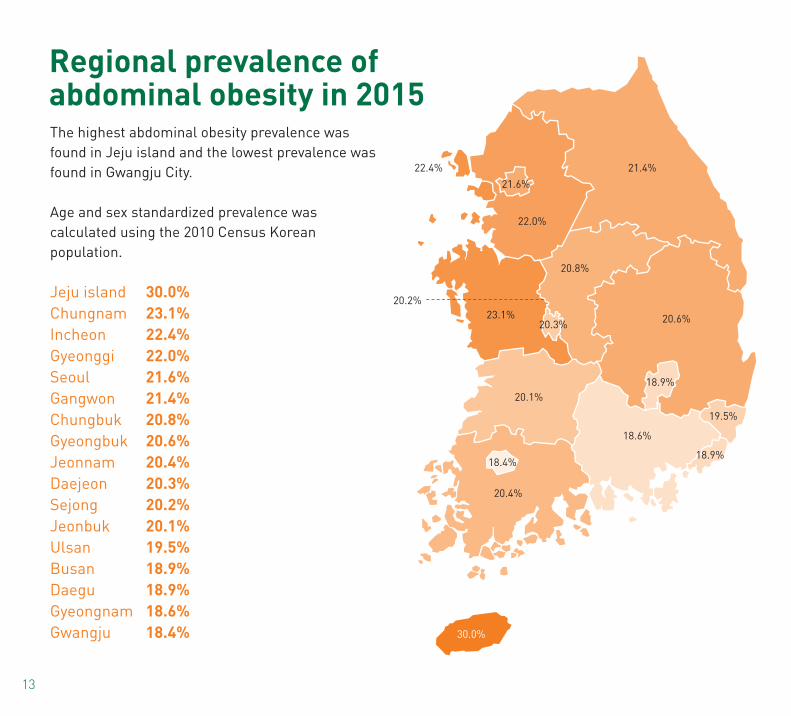
Jeju island 30.0%Chungnam 23.1%Incheon 22.4%Gyeonggi 22.0%Seoul 21.6%Gangwon 21.4%Chungbuk 20.8%Gyeongbuk 20.6%Jeonnam 20.4%Daejeon 20.3%Sejong 20.2%Jeonbuk 20.1%Ulsan 19.5%Busan 18.9%Daegu 18.9%Gyeongnam 18.6%Gwangju 18.4%
Regional prevalence of abdominal obesity in 2015The highest abdominal obesity prevalence was found in Jeju island and the lowest prevalence was found in Gwangju City.
Age and sex standardized prevalence was calculated using the 2010 Census Korean population.
30.0%
21.4%22.4%
20.4%
23.1%
20.1%
18.4%
20.6%
21.6%
18.9%
19.5%
18.6%
18.9%
20.8%
22.0%
20.2%
20.3%
14
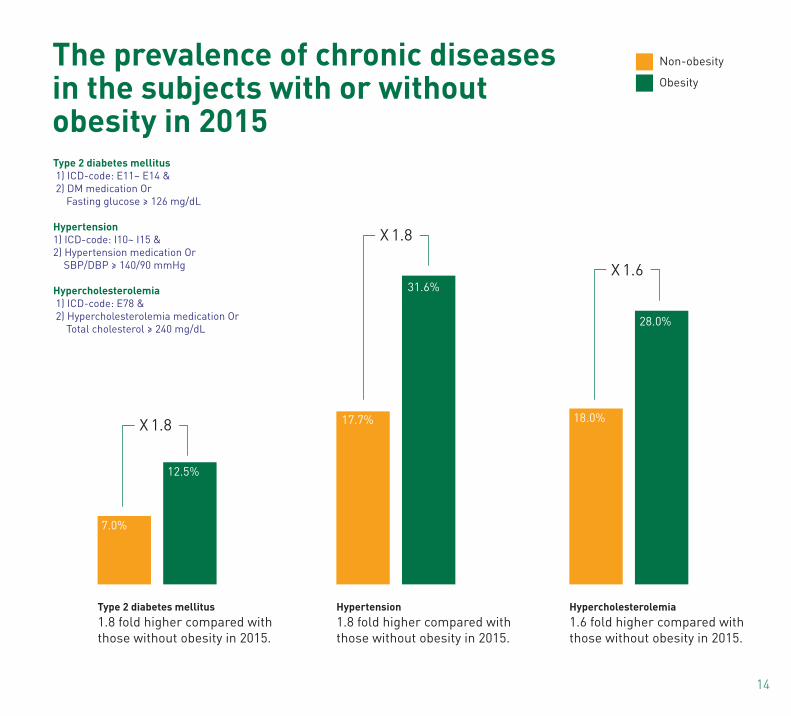
Type 2 diabetes mellitus1.8 fold higher compared with those without obesity in 2015.
Hypertension1.8 fold higher compared with those without obesity in 2015.
Hypercholesterolemia1.6 fold higher compared with those without obesity in 2015.
Type 2 diabetes mellitus 1) ICD-code: E11~ E14 & 2) DM medication Or Fasting glucose ≥ 126 mg/dL
Hypertension1) ICD-code: I10~ I15 &2) Hypertension medication Or SBP/DBP ≥ 140/90 mmHg
Hypercholesterolemia 1) ICD-code: E78 & 2) Hypercholesterolemia medication Or Total cholesterol ≥ 240 mg/dL
7.0%
17.7% 18.0%
12.5%
31.6%
28.0%
Non-obesity
Obesity
The prevalence of chronic diseases in the subjects with or without obesity in 2015
X 1.8
X 1.8
X 1.6
15
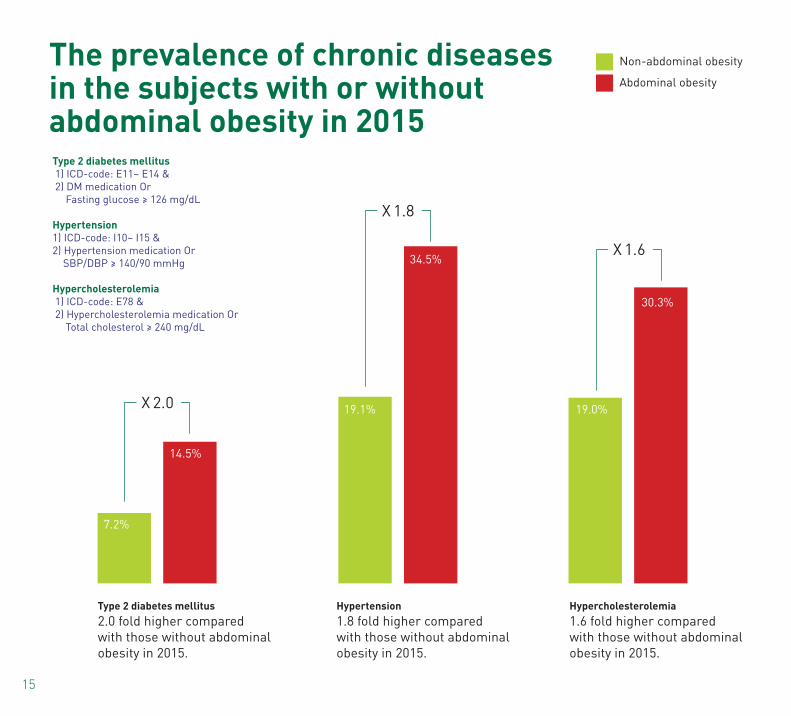
Type 2 diabetes mellitus2.0 fold higher compared with those without abdominal obesity in 2015.
Hypertension1.8 fold higher compared with those without abdominal obesity in 2015.
Hypercholesterolemia1.6 fold higher compared with those without abdominal obesity in 2015.
7.2%
19.1% 19.0%
14.5%
34.5%
30.3%
The prevalence of chronic diseases in the subjects with or without abdominal obesity in 2015Type 2 diabetes mellitus 1) ICD-code: E11~ E14 & 2) DM medication Or Fasting glucose ≥ 126 mg/dL
Hypertension1) ICD-code: I10~ I15 &2) Hypertension medication Or SBP/DBP ≥ 140/90 mmHg
Hypercholesterolemia 1) ICD-code: E78 & 2) Hypercholesterolemia medication Or Total cholesterol ≥ 240 mg/dL
Non-abdominal obesity
Abdominal obesity
X 2.0
X 1.8
X 1.6
2016 OBESITY FACT SHEETwww.kosso.or.kr
This fact sheet was made by mutual cooperation and research between NHIS and KSSO based on MOU.