table s1. ecosystem type, site name, location, latitude ... · web viewresponses of microbial...
TRANSCRIPT

Responses of microbial biomass carbon and nitrogen to experimental warming: a meta-analysis
Wenfang Xu a, b, Wenping Yuan a, c, *a State Key Laboratory of Cryospheric Sciences, Northwest Institute of Eco-Environment and Resources,
Chinese Academy of Sciences, Lanzhou, Gansu 730000, Chinab University of Chinese Academy of Sciences, Beijing 100049, Chinac School of Atmospheric Sciences, Sun Yat-Sen University, Guangzhou, Guangdong 519082, China
*Corresponding author address: State Key Laboratory of Cryospheric Sciences, Northwest Institute of Eco-
Environment and Resources, Chinese Academy of Sciences, Lanzhou, Gansu 730000, China
E-mail: [email protected] (Wenping Yuan)

Table S1. Ecosystem type, site name, location, latitude (lat), longitude (lon), altitude (asl), mean annual temperature (MAT), mean annual precipitation
(MAP), warming method (curtain reflecting infrared radiation (curtains), greenhouse, heating cables (cables), infrared heaters (IR), open top
chambers (OTC)), warming time (continued warming (CW), night warming (NW)) and responses variables of 58 study sites used in this study.
Ecosystem
typeSite name Location Lat Lon Asl (m)
MAT
(℃)
MAP
(mm)Warming
method
Warming
timeResponse variables References
Cropland Hydraulic Technique
Popularization Station
Shanghai, China 31.20 121.12 3.0 17.7 1044.7 IR CW Soil C:N, SOC, TN (Cheng et al., 2013)
Cropland Kangbo village Jiangsu Province, China 31.50 120.55 4.8 16.0 1100-1200 IR CW MBC (Liu et al., 2014)
Cropland Nanjing Jiangsu Province, China 32.27 119.43 6.0 15.6 1100.0 IR CW SOC, Soil C:N, TN, NO3--N (Cui, 2013; Hu et al.,
2013; Liu, Yan, 2013)
Cropland Yucheng Experimental
Station
Shandong Province, China 36.67 116.37 23.4 13.4 567.0 IR CW MBC (Tu & Li, 2016)
Cropland Luancheng Ecological
Station
Hebei Province, China 37.88 114.68 50.0 12.3 481.0 IR CW MBC, MBN, MBC:MBN (Liu et al., 2015)
Cropland London Ontario, Canada 43.03 -81.21 330.0 7.5 818.0 IR CW MBC (Bell et al., 2010)
Cropland Scheyern Experimental
Farm
Germany 48.50 11.35 475.0 7.4 833.0 Cables CW NO3--N, NH4
+-N (Hantschel et al.,
1995)
Cropland University of Hohenheim Germany 48.71 9.19 395.0 8.7 679.0 Cables CW MBC (Poll et al., 2013)
Cropland Aarhus University
Faculty of Agricultural
Sciences
Foulum, Denmark 56.48 9.57 56.0 7.3 627.0 Cables CW TN, NO3--N, NH4
+-N (Patil et al., 2010)
Cropland Zhenjiang City Jiangsu Province, China 31.91 119.50 6.0 16.2 1058.4 Curtains NW MBC, MBN, MBC:MBN (Zhang et al., 2012)
Cropland Xuchang City Henan Province, China 33.94 114.28 56.0 14.3 640.9 Curtains NW MBC, MBN, MBC:MBN (Zhang et al., 2012)
Cropland Xuzhou City Jiangsu Province, China 34.84 116.66 33.0 14.6 630.4 Curtains NW MBC, MBN, MBC:MBN (Zhang et al., 2012)
Cropland Shijiazhuang City Hebei Province, China 38.07 114.35 104.0 13.3 540.5 Curtains NW MBC, MBN, MBC:MBN (Zhang et al., 2012)
Forest Dinghushan Biosphere
Reserve
Guangdong Province, China 23.15 112.55 300.0 21.0 1700.0 OTC CW MBC (Fang et al., 2015)
Ecosystem Site name Location Lat Lon Asl (m) MAT MAP Warming Warming Response variables References

type (℃) (mm) method time
Forest Miyaluo Experimental
Forest of Lixian County
Tibet Autonomous Region,
China
31.58 102.58 3150.0 8.0 600-1100 OTC CW MBC, MBN, MBC:MBN,
Soil C:N, TC, TN, NH4+-N
(Xu et al., 2010a; Xu
et al., 2010b; Xu et
al., 2015)
Forest Pingwu Country Sichuan Province, China 32.82 103.92 3000.0 2.7 801-825 OTC CW MBC, MBN, MBC:MBN,
SOC
(Xu et al., 2013)
Forest Baotianman Nature
Reserve
Henan Province, China 33.33 111.78 600 15.1 885.6 IR CW MBC, MBN, MBC:MBN,
SOC, Soil C:N, TN, NO3--
N, NH4+-N
(Liu, Yanchun, 2013;
Wang, 2015)
Forest Near State College,
Pennsylvania
Pennsylvania, USA 40.67 -77.90 281.0 8.6 1046.0 IR CW MBC, Soil C:N, TC, TN (McDaniel et al.,
2014)
Forest Tomakomai experimental
forest of Hokkaido
University
Janpan 42.67 141.60 80.0 6.3 1051.0 Cables CW Soil C:N, TC, TN (Noh et al., 2015)
Forest North Tyrolean
Limestone Alps
Achenkirch, Austria 47.58 11.64 910.0 6.9 1506.0 Cables CW MBC, MBN, MBC:MBN,
NO3--N, NH4
+-N
(Schindlbacher et al.,
2011; Schindlbacher
et al., 2015)
Forest Arvidsjaur Sweden 65.58 17.25 486.0 -2.0 600.0 OTC CW NH4+-N (Jackson et al., 2013;
Long et al., 2015)
Forest Delta Junction Akasja, USA 63.92 -145.73 480.0 -2.0 303.0 Greenhou
se
CW MBC, MBN, MBC:MBN (Allison et al., 2010)
Forest Maoxian Ecological
Station of Chinese
Academy of Sciences
Sichuan Province, China 31.68 103.88 1820.0 8.9 919.5 IR NW MBC, MBN, MBC:MBN,
SOC, Soil C:N, TC, TN,
NO3--N, NH4
+-N
(Chen et al., 2010;
Xiong et al., 2010;
Wei et al., 2011; Yin
et al., 2012; Yin et al.,
2013; Zhao et al.,
2014)
Grassland University of Canterbury
Cass Field Station
South Island, New Zealand -43.03 171.75 590.0 9.0 1300.0 Cables CW MBC, Soil C:N, TC, TN (Graham et al., 2014)
Grassland Pontville Tasmania, Australia -42.70 147.27 40.0 11.6 560.0 IR CW MBC, NO3--N, NH4
+-N (Hayden et al., 2012)

Ecosystem
typeSite name Location Lat Lon Asl (m)
MAT
(℃)
MAP
(mm)Warming
method
Warming
timeResponse variables References
Grassland Damxung Grassland
Station
Tibet Autonomous Region,
China
30.50 91.05 4313.0 1.3 476.8 OTC CW MBC, MBN, MBC:MBN,
SOC, Soil C:N, NO3--N,
NH4+-N
(Fu et al., 2012; Yu et
al., 2014)
Grassland Climate Change Scientific
Observation Field Station
Tibet Autonomous Region,
China
31.44 101.17 4500.0 -3.0 400-500 OTC CW MBC, MBN, MBC:MBN,
Soil C:N, SOC, TC, TN,
NO3--N, NH4
+-N
(Wang, Xuexia et al.,
2014)
Grassland Dadu River Sichuan Province, China 31.55 102.35 4140.0 1.7 397.3 OTC CW SOC, Soil C:N, TN, NO3--
N, NH4+-N
(Xiong et al., 2016)
Grassland Hongyuan Alpine
Meadow Ecosystem
Research Station
Sichuan Province, China 32.45 102.37 3561.0 1.1 752.4 OTC CW MBC, MBN, MBC:MBN,
Soil C:N, TN, NO3--N,
NH4+-N
(Wang et al., 2011a;
Wang et al., 2011b;
Hu et al., 2013)
Grassland Kakagou Sichuan Province, China 32.85 103.55 3400.0 2.8 718.0 OTC CW MBC, MBN, MBC:MBN,
TN, NO3--N, NH4
+-N
(Shi et al., 2012)
Grassland Alpine swamp meadow
site
Qinghai Province, China 34.73 92.90 4763.0 -5.3 270.0 OTC CW MBC, MBN, MBC:MBN,
SOC, TN
(Li et al., 2010; Li et
al., 2011a; Li et al.,
2011b)
Grassland Beiluhe Observation and
Research Station
Qinghai Province, China 34.83 92.93 4635.0 -3.8 290.9 IR CW MBC, MBN, MBC:MBN,
SOC, Soil C:N, TN, NO3--
N, NH4+-N
(Xiong et al., 2014;
Xu et al., 2014)
Grassland Beiluhe Observation and
Research Station
Qinghai Province, China 34.85 92.93 4659 -3.8 383 OTC CW SOC, TN, Soil C:N (Zhang et al., 2014)
Grassland Great Plain Apiaries Oklahoma, USA 34.98 -97.52 339.0 16.3 915.0 IR CW MBC, MBN, MBC:MBN,
SOC, Soil C:N, TC, TN,
NO3--N, NH4
+-N
(Zhang et al., 2005;
Belay-Tedla et al.,
2009; Xu et al., 2012;
Zhou et al., 2012; Jia
et al., 2014)
Grassland Takayama Field Station Gifu University, Japan 36.13 137.42 1300.0 7.1 2128.0 IR CW MBC, SOC, Soil C:N, TC,
TN, NO3--N, NH4
+-N
(Yoshitake et al.,
2015; Suzuki et al.,
2016)
Ecosystem Site name Location Lat Lon Asl (m) MAT MAP Warming Warming Response variables References

type (℃) (mm) method time
Grassland Haibei Alpine Meadow
Ecosystem Research
Station
Qinghai Province, China 37.62 101.20 3200.0 -2.0 500.0 IR CW MBC, MBN, MBC:MBN,
SOC
(Rui et al., 2011;
Zheng et al., 2012;
Jing et al., 2013; Ma
et al., 2015)
Grassland Haibei Alpine Meadow
Ecosystem Research
Station
Qinghai Province, China 37.62 101.33 3200.0 -2.0 520-560 OTC CW MBC, MBN, MBC:MBN,
SOC, Soil C:N, TC, TN,
NO3--N, NH4
+-N
(Wang, Xuexia et al.,
2014; Yang et al.,
2015)
Grassland Qilian Mountain Qinghai Province, China 37.97 100.92 3512.0 1.0 409.0 OTC CW MBC, MBN, MBC:MBN,
SOC, Soil C:N, TN
(Heng, 2011; Heng et
al., 2011)
Grassland Castle Valley USA 38.67 -109.42 1310.0 12.7 261.7 IR CW SOC, Soil C:N, TN, NO3--
N, NH4+-N
(Zelikova et al., 2012)
Grassland Rocky Mountain
Biological Laboratory
Colorado, USA 38.95 -106.98 2920 10.0 750 IR CW SOC (Saleska et al., 2002)
Grassland Manhattan USA 39.20 -96.58 324.0 13.0 840.0 OTC CW MBC, MBN, MBC:MBN,
Soil C:N, TC, TN
(Williams et al.,
2000)
Grassland USDA-ARS Central
Plains Experimental
Range
Colorado, USA 40.67 -104.75 1650.0 7.5 320.0 OTC CW MBC, MBN, MBC:MBN (Kandeler et al.,
1998)
Grassland USDA-ARS Central
Plains Experimental
Range
Wyoming, USA 41.18 -104.90 1930.0 7.5 384.0 IR CW MBN, NO3--N, NH4
+-N (Dijkstra et al., 2010;
Carrillo et al., 2012)
Grassland Siziwang Banner Inner Monglia, China 41.78 111.89 1456.0 3.4 248.0 IR CW SOC,Soil C:N, TN, NO3--N,
NH4+-N
(Shan, 2008; Bai,
2011; Zhang, 2014)
Grassland Duolun Country Inner Mongolia, China 42.03 116.28 1324.0 2.1 385.5 IR CW MBC, MBN, MBC:MBN,
SOC, Soil C:N, TC, TN,
NO3--N, NH4
+-N
(Liu et al., 2009;
Song et al., 2012; Li
et al., 2013; Zhang,
N. et al., 2013; Zhou
et al., 2013)
Grassland Songnen Grassland
Ecosystem Research
Station
Jilin Province, China 44.75 123.75 160.0 4.9 410.0 IR CW MBC, MBN, MBC:MBN,
SOC, Soil C:N, TN, NO3--
N, NH4+-N
(Tan, 2010; Ma et al.,
2011; Zhang, Nanyi et
al., 2013)

Ecosystem
typeSite name Location Lat Lon Asl (m)
MAT
(℃)
MAP
(mm)Warming
method
Warming
timeResponse variables References
Grassland Xilinhaote Inner Mongolia, China 44.16 116.48 1102.0 2.6 271.4 OTC CW SOC, TN (Zhang, 2013)
Tundra Changbai Mountain Jilin Province, China 42.08 128.05 2028.0 -7.3 1400-1800 OTC CW MBC, MBN, MBC:MBN,
SOC, TN
(Wang, Xuejuan et
al., 2014a; Wang,
Xuejuan et al., 2014b)
Tundra N-Siberia Russia 67.94 74.85 33.0 -8.8 370.0 OTC CW MBN, NO3--N, NH4
+-N (Biasi et al., 2008)
Tundra Abisko Scientific
Research Station
Lapland, Swedish 68.35 18.82 1150.0 -4.8 500.0 OTC CW MBC, MBN, MBC:MBN,
NH4+-N
(Jonasson et al., 1999;
Schmidt et al., 2002;
Weedon et al., 2012)
Tundra Abisko Scientific
Research Station
Lapland, Swedish 68.35 18.82 450.0 -0.7 299.0 OTC CW MBC, MBN, MBC:MBN,
Soil C:N, TC, TN, NH4+-N
(Jonasson et al., 1999;
Schmidt et al., 2002;
Rinnan et al., 2007a;
Rinnan et al., 2007b)
Tundra Toolik Lake Alaska, USA 68.63 -149.57 730.0 -8.5 378.0 Greenhou
se
CW MBN, MBC:MBN, Soil
C:N, TN, NH4+-N
(Schmidt et al., 2002;
Sistla et al., 2013;
Sistla & Schimel,
2013)
Tundra Kilpisjärvi Finland 69.50 20.83 600.0 -2.3 420.0 OTC CW MBN, MBC:MBN, NH4+-N (Rinnan et al., 2009)
Tundra Alexandra Fiord Ellesmere Island, Canada 78.88 -75.92 50.0 -20.0 100-200 OTC CW SOC, Soil C:N, TC, TN,
NO3--N, NH4
+-N
(Deslippe et al., 2005;
Lamb et al., 2011)
Shrubland Capa Caccia Italia 40.60 8.15 143.0 15.1 452.0 Curtains NW Soil C:N, TC, TN (Rousk et al., 2013)
Shrubland Garraf Catalonia, Spain 41.30 1.82 210.0 15.1 455.0 Curtains NW MBC (Beier et al., 2004;
Sowerby et al., 2005)
Shrubland Kiskun Sag Hungria 46.88 19.72 110.0 10.8 515.0 Curtains NW Soil C:N, TC, TN (Rousk et al., 2013)
Shrubland Oldebroek Netherlands 52.40 5.92 25.0 10.1 1042.0 Curtains NW MBC, Soil C:N, TC, TN (Beier et al., 2004;
Sowerby et al., 2005;
Rousk et al., 2013)
Ecosystem Site name Location Lat Lon Asl (m) MAT MAP Warming Warming Response variables References

type (℃) (mm) method time
Shrubland Clocaenog United Kingdom 53.05 -3.47 490.0 8.2 1741.0 Curtains NW MBC, Soil C:N, TC, TN (Beier et al., 2004;
Sowerby et al., 2005;
Rousk et al., 2013)
Shrubland North Zealand Denmark 55.88 11.97 58.0 8.5 606.0 Curtains NW MBC, MBN, MBC:MBN,
Soil C:N, TC, TN, NO3--N,
NH4+-N
(Andresen et al.,
2009; Andresen et al.,
2010; Larsen et al.,
2011; Haugwitz et al.,
2014; Reinsch et al.,
2014)
Shrubland Mols Denmark 56.38 10.95 58.0 9.4 758.0 Curtains NW MBC, Soil C:N, TC, TN (Beier et al., 2004;
Sowerby et al., 2005;
Rousk et al., 2013)

Table S2. The relationship between the natural logarithm of the response ratio (lnRR) of microbial
biomass carbon (MBC), microbial biomass nitrogen (MBN), their ratios (MBC:MBN) and different
environmental and warming variables, including latitude, longitude, elevation, mean annual
precipitation (MAP), mean annual temperature (MAT), elevated temperature, and warming duration.
Variable Slope Intercept R2 P
MBC
Latitude -0.0012 0.0890 0.0050 0.4339Longitude 0.0004 -0.0002 0.0061 0.3870Elevation (m) 0.0001 0.0468 0.0021 0.6093MAT (℃) 0.0029 0.0193 0.0108 0.2514MAP (mm) 0.0001 0.0187 0.0028 0.5624Elevated temperature (℃) -0.0093 0.0527 0.0016 0.6567warming duration (yr) -0.0036 0.0543 0.0044 0.4663
MBN
Latitude -0.0019 0.1068 0.0071 0.4110Longitude 0.0007 -0.0404 0.0083 0.3748Elevation (m) 0.0001 0.0239 0.0001 0.9196MAT (℃) 0.0026 0.0141 0.0050 0.4893MAP (mm) 0.0001 -0.0174 0.0054 0.4752Elevated temperature (℃) 0.0186 -0.0044 0.0039 0.5442warming duration (yr) -0.0017 0.0347 0.0006 0.8121
MBC:MBN
Latitude -0.0005 0.0210 0.0009 0.7783Longitude 0.0008 -0.0831 0.0165 0.2222Elevation (m) 0.0001 0.0053 0.0010 0.7660MAT (℃) 0.0001 -0.0028 0.0001 0.9624MAP (mm) 0.0001 0.0060 0.0003 0.8756Elevated temperature (℃) 0.0017 -0.0050 0.0001 0.9457warming duration (yr) 0.0001 -0.0020 0.0001 0.9971

Table S3. The effects of warming on the microbial biomass carbon (MBC) in different warming magnitudes. The green boldface indicates significant
negative effect and the red boldface indicate significant positive effect, respectively.
Group Size RR++ Cl
Percentage Low warming magnitude Medium warming magnitude High warming magnitude
(%) Size RR++ Cl Size RR++ ClSiz
eRR++ Cl
All 124 0.0354 0.0198 ~ 0.0510 3.6070 35 0.0525 0.0215 ~ 0.0835 63 0.1135 0.0914 ~ 0.1355 26 -0.1412 -0.1727 ~ 0.1098
Tundra 15 0.0045 -0.0575 ~ 0.0666 0.4559 3 -0.0106 -0.1746 ~ 0.1535 12 0.0071 -0.0600 ~ 0.0741 0 -- --
Shrubland 8 0.1048 0.0369 ~ 0.1727 11.0474 7 0.1595 0.0846 ~ 0.2345 1 -- -- 0 -- --
Grassland 53 0.0328 0.0102 ~ 0.0555 3.3371 15 0.0106 -0.0338 ~ 0.0549 29 0.1578 0.1274 ~ 0.1881 9 -0.3146 -0.3675 ~ -0.2617
Forest 29 0.0470 0.0203 ~ 0.0736 4.8080 5 0.0839 0.0249 ~ 0.1428 10 0.1558 0.1108 ~ 0.2008 14 -0.0564 -0.0965 ~ -0.0164
Cropland 19 -0.0288 -0.0883 ~ 0.0307 -2.8373 5 -0.0956 -0.2788 ~ 0.0876 11 -0.0454 -0.1125 ~ 0.0218 3 0.1546 -0.0253 ~ 0.3346
Curtains 16 0.0588 -0.0012 ~ 0.1189 6.0597 12 0.1229 0.0536 ~ 0.1923 4 -0.1332 -0.2533 ~ -0.0132 0 -- --
Greenhouse 9 -0.0287 -0.1245 ~ 0.0672 -2.8273 0 -- -- 9 -0.0287 -0.1245 ~ 0.0672 0 -- --
Heating cables 6 0.0281 -0.0801 ~ 0.1363 2.8521 0 -- -- 2 -0.0215 -0.2074 ~ 0.1644 4 0.0536 -0.0795 ~ 0.1866
Infrared heaters 54 0.0220 -0.0030 ~ 0.0470 2.2217 3 -0.1248 -0.2274 ~ -0.0222 31 0.0934 0.0581 ~ 0.1288 20 -0.0392 -0.0768 ~ -0.0015
OTC 39 0.0465 0.0244 ~ 0.0686 4.7623 20 0.0555 0.0187 ~ 0.0923 17 0.1632 0.1324 ~ 0.1939 2 -0.4746 -0.5380 ~ -0.4113
Continued warming 98 0.0509 0.0331 ~ 0.0687 5.2244 23 0.0349 0.0003 ~ 0.0349 58 0.1264 0.1034 ~ 0.1493 17 -0.2596 -0.3084 ~ -0.2107
Night warming 26 -0.0152 -0.0474 ~ 0.0170 -1.5087 12 0.1229 0.0536 ~ 0.1229 5 -0.0369 -0.1152 ~ 0.0413 9 0.0354 0.0198 ~ 0.0510
Short-term (1-2year) 33 0.0035 -0.0243 ~ 0.0314 0.3543 11 0.1434 0.0765 ~ 0.1434 13 0.0040 -0.0389 ~ 0.0468 9 -0.0571 -0.1009 ~ -0.0132
Mid-term (3-4year) 43 0.0718 0.0479 ~ 0.0957 7.4432 10 0.0428 -0.0345 ~ 0.0428 23 0.1961 0.1669 ~ 0.2253 10 -0.2676 -0.3167 ~ -0.2186
Long-term (≥5year) 48 0.0143 -0.0163 ~ 0.0448 1.4380 14 0.0237 -0.0156 ~ 0.0237 27 0.0059 -0.0479 ~ 0.0597 7 -0.0278 -0.1423 ~ 0.0867
Note: Curtains, curtain reflecting infrared radiation; OTC, open top chambers; size, the number of studies included for meta-analysis; RR++, the weight response ratio; Cl, 95% confidence interval (95 %CI=RR++¿± 1.96 S¿¿). The warming duration are classified as short warming duration (1-2 year), mid warming duration (3-4 year), and long warming duration (≥5year). The warming magnitude are classified as low warming magnitude (≤ 1 ), medium warming magnitude (1-2 ), and high warming ℃ ℃magnitude (>2 ).℃

Table S4. The effects of warming on the microbial biomass nitrogen (MBN) in different warming magnitudes. The green boldface indicates significant
negative effect and the red boldface indicate significant positive effect, respectively.
GroupSi
zeRR++ Cl
Percentage Low warming magnitude Medium warming magnitude High warming magnitude
(%) Size RR++ Cl Size RR++ Cl Size RR++ Cl
All 97 0.0569 0.0392 ~ 0.0746 5.8543 30 -0.1071 -0.1440 ~ -0.0702 43 0.0895 0.0628 ~ 0.1162 24 0.1270 0.0964 ~ 0.1576
Tundra 17 0.0148 -0.0269 ~ 0.0564 1.4888 5 -0.0526 -0.1468 ~ 0.0415 12 0.0312 -0.01525 ~ 0.0776 0 -- --
Shrubland 3 -0.8124 -0.9229 ~ -0.7019 -55.6216 3 -0.8124 -0.9229 ~ -0.7019 0 -- -- 0 -- --
Grassland 48 0.0380 0.0113 ~ 0.0646 3.8723 15 -0.0004 -0.0457 ~ 0.0450 23 0.1196 0.0822 ~ 0.1569 10 -0.1573 -0.2273 ~ -0.0873
Forest 19 0.1786 0.1482 ~ 0.2089 19.5508 2 0.0806 -0.2336 ~ 0.3948 4 0.1197 0.0512 ~ 0.1883 13 0.1943 0.1602 ~ 0.2283
Cropland 10 -0.1189 -0.2521 ~ 0.0144 -11.2082 5 -0.1552 -0.3052 ~ -0.0051 4 0.0011 -0.2997 ~ 0.3018 1 -- --
Curtains 11 -0.5551 -0.6412 ~ -0.4689 -42.5964 8 -0.5814 -0.6703 ~ -0.4924 3 -0.1560 -0.5026 ~ 0.1905 0 -- --
Greenhouse 9 0.0392 -0.0103 ~ 0.0886 3.9927 0 -- -- 9 0.0392 -0.0103 ~ 0.0886 0 -- --
Heating cables 3 -0.0729 -0.2622 ~ 0.1163 -7.0322 0 -- -- 0 -- -- 3 -0.0729 -0.2622 ~ 0.1163
Infrared heaters 42 0.1353 0.1110 ~ 0.1597 14.4927 3 -0.2787 -0.4215 ~ -0.1358 20 0.0983 0.0592 ~ 0.1374 19 0.1807 0.1487 ~ 0.2126
OTC 32 0.0160 -0.0165 ~ 0.0484 1.6099 19 0.0149 -0.0273 ~ 0.0572 11 0.1399 0.0851 ~ 0.1946 2 -0.7020 -0.8347 ~ -0.5694
Continued warming 76 0.0451 0.0237 ~ 0.0664 4.6099 22 -0.0087 -0.0492 ~ 0.0318 39 0.1003 0.0731 ~ 0.1275 15 -0.1313 -0.1961 ~ -0.0665
Night warming 21 0.0827 0.0512 ~ 0.1142 8.6246 8 -0.5814 -0.6703 ~ -0.4924 4 -0.1935 -0.3326 ~ -0.0544 9 0.2012 0.1665 ~ 0.2359
Short-term (1-2 year) 28 0.1625 0.1340 ~ 0.1909 17.6428 10 0.0326 -0.0837 ~ 0.1489 12 0.0533 0.0058 ~ 0.1008 6 0.2433 0.2060 ~ 0.2806
Mid-term (3-4 year) 34 -0.0305 -0.0631 ~ 0.0020 -3.0075 8 -0.3020 -0.3667 ~ -0.2373 15 0.1940 0.1462 ~ 0.2418 11 -0.1547 -0.2158 ~ -0.0937
Long-term (≥5 year) 35 0.0104 -0.0209 ~ 0.0416 1.0406 12 -0.0212 -0.0699 ~ 0.0275 16 0.0327 -0.0110 ~ 0.0764 7 0.0305 -0.0811 ~ 0.1421
Note: Curtains, curtain reflecting infrared radiation; OTC, open top chambers; size, the number of studies included for meta-analysis; RR++, the weight response ratio; Cl, 95% confidence interval (95 %CI=RR++¿± 1.96 S¿¿). The warming duration are classified as short warming duration (1-2 year), mid warming duration (3-4 year), and long warming duration (≥5year). The warming magnitude are classified as low warming magnitude (≤ 1 ), medium warming magnitude (1-2 ), and high warming ℃ ℃magnitude (>2 ).℃

Table S5. The effects of warming on the ratio of microbial biomass carbon to nitrogen (MBC:MBN) in different warming magnitudes. The green
boldface indicate significant negative effect and the red boldface indicate significant positive effect, respectively.
Group Size RR++ ClPercentage Low warming magnitude Medium warming magnitude High warming magnitude
(%) Size RR++ Cl Size RR++ Cl Size RR++ Cl
All 92 -0.0340 -0.0468 ~ -0.0212 -3.3427 28 -0.0096 -0.0378 ~ 0.0186 41 -0.0577 -0.0743 ~ -0.0410 23 0.0106 -0.0180 ~ 0.0392
Tundra 15 -0.0363 -0.0749 ~ 0.0023 -3.5695 3 0.0217 -0.0499 ~ 0.0933 12 -0.0602 -0.1060 ~ -0.0143 0 -- --
Shrubland 2 -0.2207 -0.3007 ~ -0.1407 -19.8024 2 -0.2207 -0.3007 ~ -0.1407 0 -- -- 0 -- --
Grassland 46 0.0079 -0.0135 ~ 0.0292 0.7900 16 0.0173 -0.0234 ~ 0.0579 21 -0.0426 -0.0732 ~ -0.0121 9 0.1008 0.0569 ~ 0.1446
Forest 19 -0.0589 -0.0783 ~ -0.0396 -5.7210 2 -0.0370 -0.1350 ~ 0.0610 4 -0.0613 -0.0842 ~ -0.0384 13 -0.0555 -0.0943 ~ -0.0167
Cropland 10 -0.0204 -0.0710 ~ 0.0302 -2.0156 5 0.0594 -0.0121 ~ 0.1310 4 -0.1084 -0.1884 ~ -0.0284 1 -- --
Curtains 10 -0.0414 -0.0876 ~ 0.0048 -4.0592 7 -0.0651 -0.1184 ~ -0.0117 3 0.0294 -0.0630 ~ 0.1218 0 -- --
Greenhouse 9 -0.0697 -0.1267 ~ -0.0126 -6.7280 0 -- -- 9 -0.0697 -0.1267 ~ -0.0126 0 -- --
Heating cables 3 -0.0418 -0.1342 ~ 0.0506 -4.0916 0 -- -- 0 -- -- 3 -0.0418 -0.1342 ~ 0.0506
Infrared heaters 40 -0.0224 -0.0386 ~ -0.0061 -2.2128 4 0.0671 -0.0067 ~ 0.1410 18 -0.0320 -0.0515 ~ -0.0125 18 -0.0133 -0.0453 ~ 0.0187
OTC 30 -0.0544 -0.0811 ~ -0.0278 -5.2980 17 -0.0020 -0.0393 ~ 0.0352 11 -0.1915 -0.2340 ~ -0.1490 2 0.2373 0.1496 ~ 0.3249
Continued warming 72 -0.0344 -0.0484 ~ -0.0202 -3.3777 21 0.0120 -0.0213 ~ 0.0452 37 -0.0662 -0.0833 ~ -0.0491 14 0.0593 0.0219 ~ 0.0967
Night warming 20 -0.0322 -0.0632 ~ -0.0013 -3.1729 7 -0.0651 -0.1184 ~ -0.0117 4 0.1028 0.0287 ~ 0.1769 9 -0.0580 -0.1024 ~ -0.0136
Short-term (1-2 year) 27 -0.1195 -0.1473 ~ -0.0916 -11.2623 10 -0.1286 -0.1772 ~ -0.0801 11 -0.1232 -0.1679 ~ -0.0784 6 -0.1038 -0.1561 ~ -0.0514
Mid-term (3-4 year) 32 -0.0230 -0.0405 ~ -0.0056 -2.2765 8 0.0430 -0.0134 ~ 0.0994 14 -0.0633 -0.0838 ~ -0.0428 10 0.1055 0.0642 ~ 0.1468
Long-term (≥5 year) 33 0.0150 -0.0107 ~ 0.0407 1.5087 10 0.0562 0.0123 ~ 0.1002 16 0.0063 -0.0309 ~ 0.0435 7 -0.0402 -0.1006 ~ 0.0203
Note: Curtains, curtain reflecting infrared radiation; OTC, open top chambers; size, the number of studies included for meta-analysis; RR++, the weight response ratio; Cl, 95% confidence interval (95 %CI=RR++¿± 1.96 S¿¿). The warming duration are classified as short warming duration (1-2 year), mid warming duration (3-4 year), and long warming duration (≥5year). The warming magnitude are classified as low warming magnitude (≤ 1 ), medium warming magnitude (1-2 ), and high warming ℃ ℃magnitude (>2 ).℃

Fig. S1. The experimental warming sites in this meta-analysis. In this meta-analysis, we choose five
ecosystem types, including grassland (n=22), shrubland (n=7), forest (n=10), tundra (n=6) and
cropland ecosystem (n=13).

Fig. S2. Relationship between environmental variables (i.e., latitude, longitude, elevation) and the
natural logarithm of the response ratio (lnRR) of microbial biomass carbon (MBC), microbial
biomass nitrogen (MBN), and the ratio of MBC to MBN (MBC:MBN). Different color indicate
different warming magnitude: L (blue), low warming magnitude (≤ 1°C); M (green), medium
warming magnitude (1-2°C); H (red), high warming magnitude (>2°C). The red solid line shows the
relationship between the MAT and RR of microbial biomass to warming in high warming magnitude.

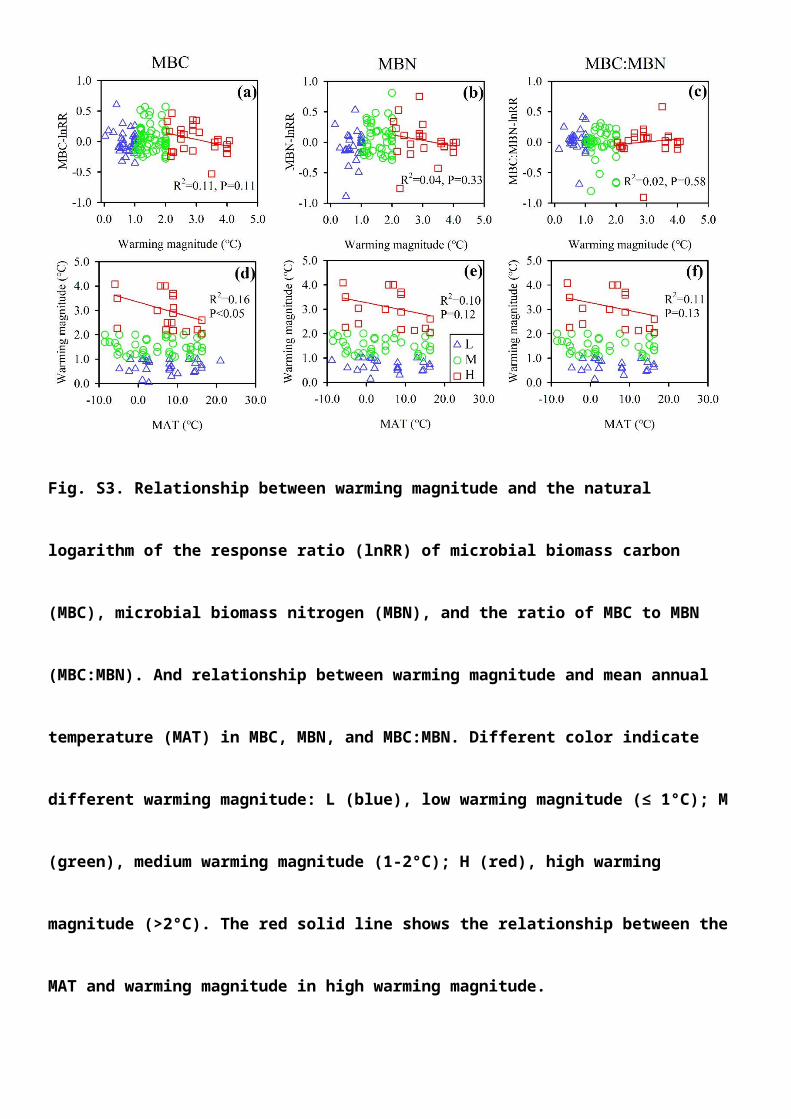
Fig. S3. Relationship between warming magnitude and the natural logarithm of the response ratio
(lnRR) of microbial biomass carbon (MBC), microbial biomass nitrogen (MBN), and the ratio of
MBC to MBN (MBC:MBN). And relationship between warming magnitude and mean annual
temperature (MAT) in MBC, MBN, and MBC:MBN. Different color indicate different warming
magnitude: L (blue), low warming magnitude (≤ 1°C); M (green), medium warming magnitude (1-
2°C); H (red), high warming magnitude (>2°C). The red solid line shows the relationship between the
MAT and warming magnitude in high warming magnitude.

Reference included in the current meta-analysis:
Allison SD, McGuire KL, Treseder KK. 2010. Resistance of microbial and soil properties to warming
treatment seven years after boreal fire. Soil Biology and Biochemistry 42(10): 1872-1878.
Andresen LC, Michelsen A, Ambus P, Beier C. 2010. Belowground heathland responses after 2 years of
combined warming, elevated CO2 and summer drought. Biogeochemistry 101(1): 27-42.
Andresen LC, Michelsen A, Jonasson S, Beier C, Ambus P. 2009. Glycine uptake in heath plants and soil
microbes responds to elevated temperature, CO2 and drought. Acta Oecologica 35(6): 786-796.
Bai C. 2011. The effects of experimental warming and nitrogen addition on soil properties. Master Thesis,
Inner Mongolia Agricultural University. (in Chinese).
Beier C, Emmett B, Gundersen P, Tietema A, Peñuelas J, Estiarte M, Gordon C, Gorissen A, Llorens
L, Roda F, et al. 2004. Novel Approaches to Study Climate Change Effects on Terrestrial
Ecosystems in the Field: Drought and Passive Nighttime Warming. Ecosystems 7(6): 583-597.
Belay-Tedla A, Zhou X, Su B, Wan S, Luo Y. 2009. Labile, recalcitrant, and microbial carbon and nitrogen
pools of a tallgrass prairie soil in the US Great Plains subjected to experimental warming and
clipping. Soil Biology and Biochemistry 41(1): 110-116.
Bell TH, Klironomos JN, Henry HAL. 2010. Seasonal Responses of Extracellular Enzyme Activity and
Microbial Biomass to Warming and Nitrogen Addition. Soil Science Society of America Journal
74(3): 820.
Biasi C, Meyer H, Rusalimova O, Hämmerle R, Kaiser C, Baranyi C, Daims H, Lashchinsky N,
Barsukov P, Richter A. 2008. Initial effects of experimental warming on carbon exchange rates,
plant growth and microbial dynamics of a lichen-rich dwarf shrub tundra in Siberia. Plant and Soil
307(1): 191-205.
Carrillo Y, Dijkstra FA, Pendall E, Morgan JA, Blumenthal DM. 2012. Controls over Soil Nitrogen
Pools in a Semiarid Grassland Under Elevated CO2 and Warming. Ecosystems 15(5): 761-774.
Chen Z, Yin H, Wei Y, Liu Q. 2010. Short-term effects of night warming and nitrogen addition on soil
available nitrogen and microbial properties in subalpine coniferous forest, Western Sichuan, China.
Chinese Journal of Plant Ecology 34(11): 1254-1264.
Cheng H, Ren W, Ding L, Liu Z, Fang C. 2013. Responses of a rice–wheat rotation agroecosystem to
experimental warming. Ecological Research 28(6): 959-967.
Cui H. 2013. Effects of simulated experimental warming and acid rain on N2O emission from soybean-
winter wheat ratation system. Master Thesis, Nanjing University Information Science & Technology.
(in Chinese).

Deslippe JR, Egger KN, Henry GH. 2005. Impacts of warming and fertilization on nitrogen-fixing
microbial communities in the Canadian High Arctic. FEMS Microbiol Ecol 53(1): 41-50.
Dijkstra FA, Blumenthal D, Morgan JA, Pendall E, Carrillo Y, Follett RF. 2010. Contrasting effects of
elevated CO2 and warming on nitrogen cycling in a semiarid grassland. New Phytologist 187(2): 426-
437.
Fang X, Zhou G, Li Y, Liu S, Chu G, Xu Z, Liu J. 2015. Warming effects on biomass and composition of
microbial communities and enzyme activities within soil aggregates in subtropical forest. Biology
and Fertility of Soils 52(3): 353-365.
Fu G, Shen Z, Zhang X, Zhou Y. 2012. Response of soil microbial biomass to short-term experimental
warming in alpine meadow on the Tibetan Plateau. Applied Soil Ecology 61: 158-160.
Graham SL, Hunt JE, Millard P, McSeveny T, Tylianakis JM, Whitehead D. 2014. Effects of soil
warming and nitrogen addition on soil respiration in a New Zealand tussock grassland. Plos One
9(3): e91204.
Hantschel RE, Kamp T, Beese F. 1995. Increasing the soil temperature to study global warming effects on
the soil nitrogen cycle in agroecsystems. Journal of Biogeography 22: 375-380.
Haugwitz MS, Bergmark L, Priemé A, Christensen S, Beier C, Michelsen A. 2014. Soil microorganisms
respond to five years of climate change manipulations and elevated atmospheric CO2 in a temperate
heath ecosystem. Plant and Soil 374(1-2): 211-222.
Hayden HL, Mele PM, Bougoure DS, Allan CY, Norng S, Piceno YM, Brodie EL, Desantis TZ,
Andersen GL, Williams AL, et al. 2012. Changes in the microbial community structure of bacteria,
archaea and fungi in response to elevated CO2 and warming in an Australian native grassland soil.
Environmental Microbiology 14(12): 3081-3096.
Heng T. 2011. The responses of soil C and N, microbial bomass C or N under alpine meadow of Qinghai-
Tibet Plateau to changing in temperature and precipitation. Master Thesis, Southwest University. (in
Chinese).
Heng T, Wu J, Xie S, Wu M. 2011. The responses of soil C and N, microbial biomass C or N under alpine
meadow of Qinghai-Tibet Plateau to the change of temperature and precipitation. Chinese
Agricultural Science Bulletin 27(3): 425-430.
Hu Z, Zhou Y, Cui H, Chen S, Xiao Q, Liu Y. 2013. Effects of diurnal warming on soil N2O emission in
soybean field. Environmental Science 34(8): 2961-2967.
Jackson BG, Nilsson M-C, Wardle DA. 2013. The effects of the moss layer on the decomposition of
intercepted vascular plant litter across a post-fire boreal forest chronosequence. Plant and Soil 367(1-
2): 199-214.

Jia X, Zhou X, Luo Y, Xue K, Xue X, Xu X, Yang Y, Wu L, Zhou J. 2014. Effects of substrate addition
on soil respiratory carbon release under long-term warming and clipping in a tallgrass prairie. Plos
One 9(12): e114203.
Jing X, Wang Y, Chung H, Mi Z, Wang S, Zeng H, He J. 2013. No temperature acclimation of soil
extracellular enzymes to experimental warming in an alpine grassland ecosystem on the Tibetan
Plateau. Biogeochemistry 117(1): 39-54.
Jonasson S, Michelsen A, K. SI, Nielsen EV. 1999. Responses in microbes and plants to changed
temperature, nutrient, and light regimes in the arctic. Ecology 80(6): 1828-1843.
Kandeler E, Tscherko D, Bardgett RD, Hobbs PJ, Kampichler C, Jones TH. 1998. The response of soil
microorganisms and roots to elevated CO2 and temperature in a terrestrial model ecosystem. Plant
and Soil 202(2): 251-262.
Lamb EG, Han S, Lanoil BD, Henry GHR, Brummell ME, Banerjee S, Siciliano SD. 2011. A High
Arctic soil ecosystem resists long-term environmental manipulations. Global Change Biology
17(10): 3187-3194.
Larsen KS, Andresen LC, Beier C, Jonasson S, Albert KR, Ambus PER, Arndal MF, Carter MS,
Christensen S, Holmstrup M, et al. 2011. Reduced N cycling in response to elevated CO2,
warming, and drought in a Danish heathland: Synthesizing results of the CLIMAITE project after
two years of treatments. Global Change Biology 17(5): 1884-1899.
Li N, Wang G, Gao Y, Wang J, Liu L. 2010. Effects of simulated warming on soil nutrients and biological
characteristics of alpine meadow soil in the head waters region of the Yangze River. Acta Pedologica
Sinica 47(6): 63-73.
Li N, Wang G, Yang Y, Gao Y, Liu G. 2011a. Plant production, and carbon and nitrogen source pools, are
strongly intensified by experimental warming in alpine ecosystems in the Qinghai-Tibet Plateau. Soil
Biology and Biochemistry 43(5): 942-953.
Li N, Wang G, Yang Y, Gao Y, Liu L, Liu G. 2011b. Short-term effects of temperature enhancement on
community structure and biomass of alpine meadow in the Qinghai-Tiebetan Plateau. Acta Ecologica
Sinica 31(4): 0895-0905.
Li Q, Bai H, Liang W, Xia J, Wan S, van der Putten WH. 2013. Nitrogen addition and warming
independently influence the belowground micro-food web in a temperate steppe. Plos One 8(3):
e60441.
Liu L, Hu C, Yang P, Ju Z, Olesen JE, Tang J. 2015. Effects of experimental warming and nitrogen
addition on soil respiration and CH4 fluxes from crop rotations of winter wheat–soybean/fallow.
Agricultural and Forest Meteorology 207: 38-47.

Liu W, Zhang Z, Wan S. 2009. Predominant role of water in regulating soil and microbial respiration and
their responses to climate change in a semiarid grassland. Global Change Biology 15(1): 184-195.
Liu Y. 2013. Effects of simulated warming on soil respiration, nitrification and denitrification in a cropland.
Master Thesis, Nanjing University Information Science & Technology. (in Chinese).
Liu Y. 2013. Response of soil respiration and microbial community structure to soil warming and
throughfall exclusion in Warm-temperate oak (Quercus aliena var. acuteserrata) forest. Doctor
Thesis, Chinese Academy of Forestry. (in Chinese).
Liu Y, Li M, Zheng J, Li L, Zhang X, Zheng J, Pan G, Yu X, Wang J. 2014. Short-term responses of
microbial community and functioning to experimental CO2 enrichment and warming in a Chinese
paddy field. Soil Biology and Biochemistry 77: 58-68.
Long JR, Dorrepaal E, Kardol P, Nilsson M-C, Teuber LM, Wardle DA. 2015. Contrasting Responses of
Soil Microbial and Nematode Communities to Warming and Plant Functional Group Removal
Across a Post-fire Boreal Forest Successional Gradient. Ecosystems 19(2): 339-355.
Ma L, Lv X, Liu Y, Guo J, Zhang N, Yang J, Wang R. 2011. The effects of warming and nitrogen addition
on soil nitrogen cycling in a temperate grassland, northeastern China. Plos One 6(11): e27645.
Ma S, Zhu X, Zhang J, Zhang L, Che R, Wang F, Liu H, Niu H, Wang S, Cui X. 2015. Warming
decreased and grazing increased plant uptake of amino acids in an alpine meadow. Ecology and
Evolution 5(18): 3995-4005.
McDaniel MD, Kaye JP, Kaye MW, Bruns MA. 2014. Climate change interactions affect soil carbon
dioxide efflux and microbial functioning in a post-harvest forest. Oecologia 174(4): 1437-1448.
Noh N-J, Kuribayashi M, Saitoh TM, Nakaji T, Nakamura M, Hiura T, Muraoka H. 2015. Responses
of Soil, Heterotrophic, and Autotrophic Respiration to Experimental Open-Field Soil Warming in a
Cool-Temperate Deciduous Forest. Ecosystems 19(3): 504-520.
Patil RH, Laegdsmand M, Olesen JE, Porter JR. 2010. Effect of soil warming and rainfall patterns on
soil N cycling in Northern Europe. Agriculture, Ecosystems & Environment 139(1-2): 195-205.
Poll C, Marhan S, Back F, Niklaus PA, Kandeler E. 2013. Field-scale manipulation of soil temperature
and precipitation change soil CO2 flux in a temperate agricultural ecosystem. Agriculture,
Ecosystems & Environment 165: 88-97.
Reinsch S, Michelsen A, Sárossy Z, Egsgaard H, Schmidt IK, Jakobsen I, Ambus P. 2014. Short-term
utilization of carbon by the soil microbial community under future climatic conditions in a temperate
heathland. Soil Biology and Biochemistry 68: 9-19.
Rinnan R, Michelsen A, Bååth E, Jonasson S. 2007a. Mineralization and carbon turnover in subarctic
heath soil as affected by warming and additional litter. Soil Biology and Biochemistry 39(12): 3014-

3023.
Rinnan R, Michelsen A, BÅÅTh E, Jonasson S. 2007b. Fifteen years of climate change manipulations
alter soil microbial communities in a subarctic heath ecosystem. Global Change Biology 13(1): 28-
39.
Rinnan R, Stark S, Tolvanen A. 2009. Responses of vegetation and soil microbial communities to warming
and simulated herbivory in a subarctic heath. Journal of Ecology 97(4): 788-800.
Rousk J, Smith AR, Jones DL. 2013. Investigating the long-term legacy of drought and warming on the
soil microbial community across five European shrubland ecosystems. Glob Chang Biol 19(12):
3872-3884.
Rui Y, Wang S, Xu Z, Wang Y, Chen C, Zhou X, Kang X, Lu S, Hu Y, Lin Q, et al. 2011. Warming and
grazing affect soil labile carbon and nitrogen pools differently in an alpine meadow of the Qinghai–
Tibet Plateau in China. Journal of Soils and Sediments 11(6): 903-914.
Saleska SR, Shaw MR, Fischer ML, Dunne JA, Still CJ, Holman ML, Harte J. 2002. Plant community
composition mediates both large transient decline and predicted long-term recovery of soil carbon
under climate warming. Global Biogeochemical Cycles 16(4): 3-1-3-18.
Schindlbacher A, Rodler A, Kuffner M, Kitzler B, Sessitsch A, Zechmeister-Boltenstern S. 2011.
Experimental warming effects on the microbial community of a temperate mountain forest soil. Soil
Biol Biochem 43(7): 1417-1425.
Schindlbacher A, Schnecker J, Takriti M, Borken W, Wanek W. 2015. Microbial physiology and soil
CO2 efflux after 9 years of soil warming in a temperate forest - no indications for thermal
adaptations. Glob Chang Biol 21(11): 4265-4277.
Schmidt IK, Jonasson S, Shaver GR, Michelsen A, Nordin A. 2002. Mineralization and distribution of
nutrients in plants and microbes in four arctic ecosystems: responses to warming. Plant and Soil
242(1): 93-106.
Shan D. 2008. The effects of experimental warming and nitrogen addition on plant community and soil in
desert steppe. Doctor Thesis, Inner Mongolia Agricultural University. (in Chinese).
Shi F, Chen h, Chen H, Wu Y, Wu N. 2012. The combined effects of warming and drying suppress CO2
and N2O emission rates in an alpine meadow of the eastern Tibetan Plateau. Ecological Research
27(4): 725-733.
Sistla SA, Moore JC, Simpson RT, Gough L, Shaver GR, Schimel JP. 2013. Long-term warming
restructures Arctic tundra without changing net soil carbon storage. Nature 497(7451): 615-618.
Sistla SA, Schimel JP. 2013. Seasonal patterns of microbial extracellular enzyme activities in an arctic
tundra soil: Identifying direct and indirect effects of long-term summer warming. Soil Biology and

Biochemistry 66: 119-129.
Song B, Niu S, Zhang Z, Yang H, Li L, Wan S. 2012. Light and heavy fractions of soil organic matter in
response to climate warming and increased precipitation in a temperate steppe. Plos One 7(3):
e33217.
Sowerby A, Emmett B, Beier C, Tietema A, Peñuelas J, Estiarte M, Van Meeteren MJM, Hughes S,
Freeman C. 2005. Microbial community changes in heathland soil communities along a
geographical gradient: interaction with climate change manipulations. Soil Biology and Biochemistry
37(10): 1805-1813.
Suzuki M, Suminokura N, Tanami K, Yoshitake S, Masuda S, Tomotsune M, Koizumi H. 2016. Effects
of long-term experimental warming on plants and soil microbes in a cool temperate semi-natural
grassland in Japan. Ecological Research 31(6): 957-962.
Tan C. 2010. Microbial activities responses to simulated warming and nitrogen application. Master Thesis,
Northeast Normal University. (in Chinese).
Tu C, Li F. 2016. Responses of soil CH4 fluxes to simulated warming in conventional tillage and no-tillage
system. Journal of Agro-Environment Science 35(9): 1788-1796.
Wang B, Sun G, Luo P, Wang M, Wu N. 2011a. Labile and recalcitrant carbon and nitrogen pools of an
alpine meadow soil from the eastern Qinghai-Tiebetan Plateau subjected to experimental warming
and grazing. Acta Ecologica Sinica 31(6): 1506-1514.
Wang B, Sun G, Luo P, Wang Z, Zhang Y, Wu N, Luo G. 2011b. Microbial communities of alpine
meadow soil in the Eastern Qinghai-Tibetan Plateau subjected to experimental warming and grazing.
Chinese Journal of Applied and Environmental Biology 17(2): 151-157.
Wang X, Dong S, Gao Q, Zhou H, Liu S, Su X, Li Y. 2014. Effects of short-term and long-term warming
on soil nutrients, microbial biomass and enzyme activities in an alpine meadow on the Qinghai-Tibet
Plateau of China. Soil Biology and Biochemistry 76: 140-142.
Wang X, Zhou Y, Jiang X, Han S. 2014a. Effect of warming on soil microbial community structure in
Changbai Mountain Tundra. Acta Ecologica Sinica 34(20): 5706-5713.
Wang X, Zhou Y, Wang X, JIang X, Han S. 2014b. Responses of soil enzymes in activity and soil
microbes in biomass to warming in tundra ecosystem on Changbai Mountains. Acta Pedologica
Sinica 51(1): 166-175.
Wang Y. 2015. Effect of simulated warming and throughfall reducation on soil respiration and microbial
response in Warm-temperate oak (Quercus aliena var. acuteserrata) forest. Doctor Thesis, Chinese
Academy of Forestry. (in Chinese).
Weedon JT, Kowalchuk GA, Aerts R, van Hal J, van Logtestijn R, Taş N, Röling WFM, van Bodegom
P. 2012. Summer warming accelerates sub-arctic peatland nitrogen cycling without changing enzyme
pools or microbial community structure. Global Change Biology 18(1): 138-150.
Wei Y, Yin H, Liu Q, Li Y. 2011. Responses on rhizosphere effect of two subalpine coniferous species to
night-time warming and nitrogen ferilization in Western Sichuan, China. Acta Ecologica Sinica
31(3): 0698-0708.
Williams MA, Rice CW, Owensby CE. 2000. Carbon dynamics and microbial activity in tallgrass prairie
exposed to elevated CO2 for 8 years. Plant and Soil 227(1-2): 127-137.
Xiong J, Sun H, Peng F, Zhang H, Xue X, Gibbons SM, Gilbert JA, Chu H. 2014. Characterizing
changes in soil bacterial community structure in response to short-term warming. FEMS Microbiol
Ecol 89(2): 281-292.
Xiong P, Xu Z, Lin B, Liu Q. 2010. Short-term response of winter soil respiration to simulated warming in
a Pinus armandii plantation in the upper reaches of Minjiang River, China. Chinese Journal of Plant
Ecology 34(12): 1369-1376.
Xiong Q, Pan K, Zhang L, Wang Y, Li W, He X, Luo H. 2016. Warming and nitrogen deposition are
interactive in shaping surface soil microbial communities near the alpine timberline zone on the
eastern Qinghai–Tibet Plateau, southwestern China. Applied Soil Ecology 101: 72-83.
Xu G, Jiang H, Zhang Y, Korpelainen H, Li C. 2013. Effect of warming on extracted soil carbon pools of
Abies faxoniana forest at two elevations. Forest Ecology and Management 310: 357-365.
Xu M, Peng F, You Q, Guo J, Tian X, Liu M, Xue X. 2014. Effects of warming and clipping on plant and
soil properties of an alpine meadow in the Qinghai-Tibetan Plateau, China. Journal of Arid Land
7(2): 189-204.
Xu X, Sherry RA, Niu S, Zhou J, Luo Y. 2012. Long-term experimental warming decreased labile soil
organic carbon in a tallgrass prairie. Plant and Soil 361(1-2): 307-315.
Xu Z, Hu R, Xiong P, Wan C, Cao G, Liu Q. 2010a. Initial soil responses to experimental warming in two
contrasting forest ecosystems, Eastern Tibetan Plateau, China: Nutrient availabilities, microbial
properties and enzyme activities. Applied Soil Ecology 46(2): 291-299.
Xu Z, Wan C, Xiong P, Tang Z, Hu R, Cao G, Liu Q. 2010b. Initial responses of soil CO2 efflux and C, N
pools to experimental warming in two contrasting forest ecosystems, Eastern Tibetan Plateau, China.
Plant and Soil 336(1-2): 183-195.
Xu Z, Zhao C, Yin H, Liu Q. 2015. Warming and forest management interactively affect the decomposition
of subalpine forests on the eastern Tibetan Plateau: A four-year experiment. Geoderma 239-240: 223-
228.
Yang Y, Zhou H, Yao B, Wang W, Dong S, Yu X, Zhao X. 2015. Effects of long-term simulated warming

on soil physicochemical properties and plant chemical components of Kobresia humilis meadow.
Chinese Journal of Ecology 34(3): 781-789.
Yin H, Chen Z, Liu Q. 2012. Effects of experimental warming on soil N transformations of two coniferous
species, Eastern Tibetan Plateau, China. Soil Biology and Biochemistry 50: 77-84.
Yin H, Xiao J, Li Y, Chen Z, Cheng X, Zhao C, Liu Q. 2013. Warming effects on root morphological and
physiological traits: The potential consequences on soil C dynamics as altered root exudation.
Agricultural and Forest Meteorology 180: 287-296.
Yoshitake S, Tabei N, Mizuno Y, Yoshida H, Sekine Y, Tatsumura M, Koizumi H. 2015. Soil microbial
response to experimental warming in cool temperate semi-natural grassland in Japan. Ecological
Research 30(2): 235-245.
Yu C, Shen Z, Zhang X, Sun W, Fu G. 2014. Response of soil C and N, dissolved organic C and N, and
inorganic N to short-term experimental warming in an Alpine meadow on the Tibetan Plateau.
ScientificWorldJournal 2014: 152576.
Zelikova TJ, Housman DC, Grote EE, Neher DA, Belnap J. 2012. Warming and increased precipitation
frequency on the Colorado Plateau: implications for biological soil crusts and soil processes. Plant
and Soil 355(1-2): 265-282.
Zhang B, Chen S, He X, Liu W, Zhao Q, Zhao L, Tian C. 2014. Responses of soil microbial communities
to experimental warming in alpine grasslands on the qinghai-tibet plateau. Plos One 9(8): e103859.
Zhang L. 2013. Photosynthetic characteristics and soil respiration under warming and precipitation
enhancement in Stipa krylovii steppe in Inner Mongolia. Master Thesis, Inner Mongolia University.
(in Chinese).
Zhang M, Han Z, Chen J, Guo J, Tian Y, Zhang B, Yang B, Zhang W. 2012. Impact of nighttime
warming on soil microbial biomass carbon/nitrogen and activity in main winter wheat cropping areas
in China. Chinese Journal of Eco-Agriculture 20(11): 1464-1470.
Zhang N, Guo R, Song P, Guo J, Gao Y. 2013. Effects of warming and nitrogen deposition on the coupling
mechanism between soil nitrogen and phosphorus in Songnen Meadow Steppe, northeastern China.
Soil Biology and Biochemistry 65: 96-104.
Zhang N, Liu W, Yang H, Yu X, Gutknecht JL, Zhang Z, Wan S, Ma K. 2013. Soil microbial responses
to warming and increased precipitation and their implications for ecosystem C cycling. Oecologia
173(3): 1125-1142.
Zhang W, Parker KM, Luo Y, Wan S, Wallace LL, Hu S. 2005. Soil microbial responses to experimental
warming and clipping in a tallgrass prairie. Global Change Biology 11(2): 266-277.
Zhang Y. 2014. The response of soil properties to experimental warming and nitrogen addition in desert

steppe. Inner Mongolia Agricultural University.
Zhao C, Zhu L, Liang J, Yin H, Yin C, Li D, Zhang N, Liu Q. 2014. Effects of experimental warming
and nitrogen fertilization on soil microbial communities and processes of two subalpine coniferous
species in Eastern Tibetan Plateau, China. Plant and Soil 382(1-2): 189-201.
Zheng Y, Yang W, Sun X, Wang SP, Rui YC, Luo CY, Guo LD. 2012. Methanotrophic community
structure and activity under warming and grazing of alpine meadow on the Tibetan Plateau. Appl
Microbiol Biotechnol 93(5): 2193-2203.
Zhou J, Xue K, Xie J, Deng Y, Wu L, Cheng X, Fei S, Deng S, He Z, Van Nostrand JD, et al. 2012.
Microbial mediation of carbon-cycle feedbacks to climate warming. Nature Climate Change 2(2):
106-110.
Zhou X, Chen C, Wang Y, Xu Z, Han H, Li L, Wan S. 2013. Warming and increased precipitation have
differential effects on soil extracellular enzyme activities in a temperate grassland. Sci Total Environ
444: 552-558.