table of contents...vi proceedings international conference on innovation and management, malaysia...
TRANSCRIPT
Table of Contents FOREWORD…………………………………………………………………………………………………………………i PAPER PRESENTATION………………………………………………………………………………………………5 Theme 1: Innovation in Technology, Manufacturing, R&D, Organization, Business and Service Quality Management……………………………………………………………………………………..…6
Digital Library Access, Requirements and Usability Attributes: A Systematic and Critical Review of Literature
by Yakubu Bala, A. A. Maidabino and Muhammad Salihu Zubair....………………...………7
Innovation Management in Oil Tanker Vessels Safety by Alireza Fili and Ahmad Rahman Songip……..………………………………….…………..……14
Do Social Media Enhance Students Performance? An Essential Insight from Bayero University Kano, Nigeria
by Aliyu Alhaji Abubakar, Tasmin. R, Nuhu Isah, Che Rusuli, M.S, Mudashir Gafar
and Josu Takala………………………………………………………………………………………………..…25 The Nature of Innovation Support in Emerging Economies: Implementation of a Technology Driven Policy Initiative in Malaysia
by Dzulkifli Mukhtar ………………………………………………………………………………….……….32
Investigating Antecedent of Knowledge Sharing among DBA Students by Hizul Hamid, Aizurra Haidah Abdul Kadir and Azman Ibrahim …………..………….45
Tacit Knowledge Innovation and Enterprise Development in Malaysia’s Chinese Family SMEs: Longitudinal Case Studies on Plastic Production Across Generational Change
by John Lee Kean Yew …………………………………………………………………………………………50
Critical Success Factors (CSFs) of ERP Implementation: A Study with TRIZ Perception Mapping
by Teck Loon Lim, Mee Yee Kow, Akbariah Mahdzir and Nooh Abu Bakar..………..…61
Problem Solving Process in Malaysia Automotive Industry by Mohd Yusri Mohd Yusof ………………………………………………………………………………....75
The Effect of Entrepreneurship Training on the Capacity Building Program of Kano State Enterprise Development Training Institutes
by Muazu Hassan Muazu and Najafi Auwalu Ibrahim …………………………………………82
Strategies to Improve Cost and Time Control Using Building Information Model (BIM)
by Muhammad Tahir Muhammad, Nuzul Azam Haron, Aidi Hizami Alias and Aizul Nahar Harun……………………………………………………………………………………………………….95
Conceptual Business Model for MOOCS in Universiti Teknologi Malaysia by Nor Fadzleen Sa don, Rose Alinda Alias and Hiroshi Nakanishi ………………….…111
Developing Building Information Modelling (BIM) Implementation Model for Project Design Team
by Suzila Mohd, Juliana Brahim, Aryani Ahmad Latiffi , Mohamad Syazli Fathi and Aizul Nahar Harun……………………………………………………………………………………..…….119
Web-Based Communication Model Between Teacher and Student in Foreign Language Software
by Yan Watequlis Syaifudin, Imam Fahrur Rozi , Atiqah Nurul Asri…………….…….130
ii
Proceedings International Conference on Innovation and
Management, Malaysia 2016
Theme 2: Environmental Innovation and Sustainable Development…………………………..139 The Suitability, Feasibility and Acceptability (SFA) Model for OTEC Transformation Project
by Hairil Anuar Abu Hassan, Akbariah Mohd Mahdzir……………………………………….140
An Environmental Accounting Impact towards Corporate Innovation: Review by Wan Md Syukri Wan Mohamad Ali, Ainul Mardhiyah Nor Aziz, Ahmad Rahman Songip and Zaipul Anuar Zainu………………………………………………………………………….144
Theme 3: Internet of Things, Big Data and Business Analytics………………………..…………..151 Decision Support Systems (DSS) Capabilities and Competencies Impact on Firm
Performance: A Mediating Role of Absorptive Capacity by Al-Nakib Noofal Ahmed Mohsen Mohammed, Wang Hu and Ahmed Abdulatef Mashli Aina………………………………………………………………………………………….……………152
Theme 4: Banking and Islamic Finance, Corporate Finance………………………………………..160 Islamic Finance in Australia: Require Level Playing Field by Mohammad Z Hasan and Fazle Rabbi……………..…………………………….………………161
A Review on the Board of Directors by Habiba Nabila Ihlasuddini and Mohammad Ali Tareq……………...……………………169
Analysis of Some Factors Affecting the Return Credit on SMEs Center Members in Semarang Regency
by Tubagus Fahmi and Anindya Ardiansari……………………………………………….………178
Theme 5: Business Strategy, Change Management and Risk Management……………….….189 Technological Superiority as the Main Success Factor in Implementing High
Technology Marketing Strategy: A Pseudo Tale for Emerging Renewable Energy by Rozita Shamsuddin, Hiroshi Nakanishi and Aini Suzana………………………………190
Theme 6: Operation Management, Logistics, and Supply-Chain Management………..……199
Selection of Integrators in Malaysia’s local broiler industry: Prioritization of critical factors based on Growers’ perspectives
by Hendrik Lamsali and Ahmad Shabudin Ariffin…………...………………………………….200
An Overview of Procurement Methods in Building Construction Projects by Ng ChiewTeng, Siti Uzairiah binti Mohd Tobi and Mohamad Syazli bin Fathi………………………………………………………………………………………………………………..208
E-Procurement and Supply Chain Performance in TM Berhad by Shahrizal Ahmad Rosli and Ahmad Rahman Songip…………………………………..…214

iii
Proceedings International Conference on Innovation and
Management, Malaysia 2016
Theme 7: Human Resource and Organization Behaviour…………………………………………..220 Management of Technology (Overcoming Maintenance Competency Deficiency) - The Aviation Maintenance Industry Perspective and Structured on Job Training (S-OJT) by Liew Chee Leong and Mohammad Ali Tareq…………………………………………………221
Behave Yourself Please! Start Saving Lifes by Mohd Rizal Omar Baki, Ahmad Rahman Songip and Mohd Shamsuri Khalid….227
Predicting Organizational Citizenship Behaviour with Leadership Style, Ethics and Transformational Leadership in South Asian Perspective: A Case of Pakistani Firms by Muhammad Ramzan, Rizwan Qaiser Danish and Asad Afzal Humayon…………233
Secondary Teachers’ Mathematical Content Knowledge and Teacher Education: A Case Study of Dhaka, Bangladesh
By Sheikh Asadullah……………………………………………………………………………………….…243

iv
Proceedings International Conference on Innovation and
Management, Malaysia 2016
FOREWORD
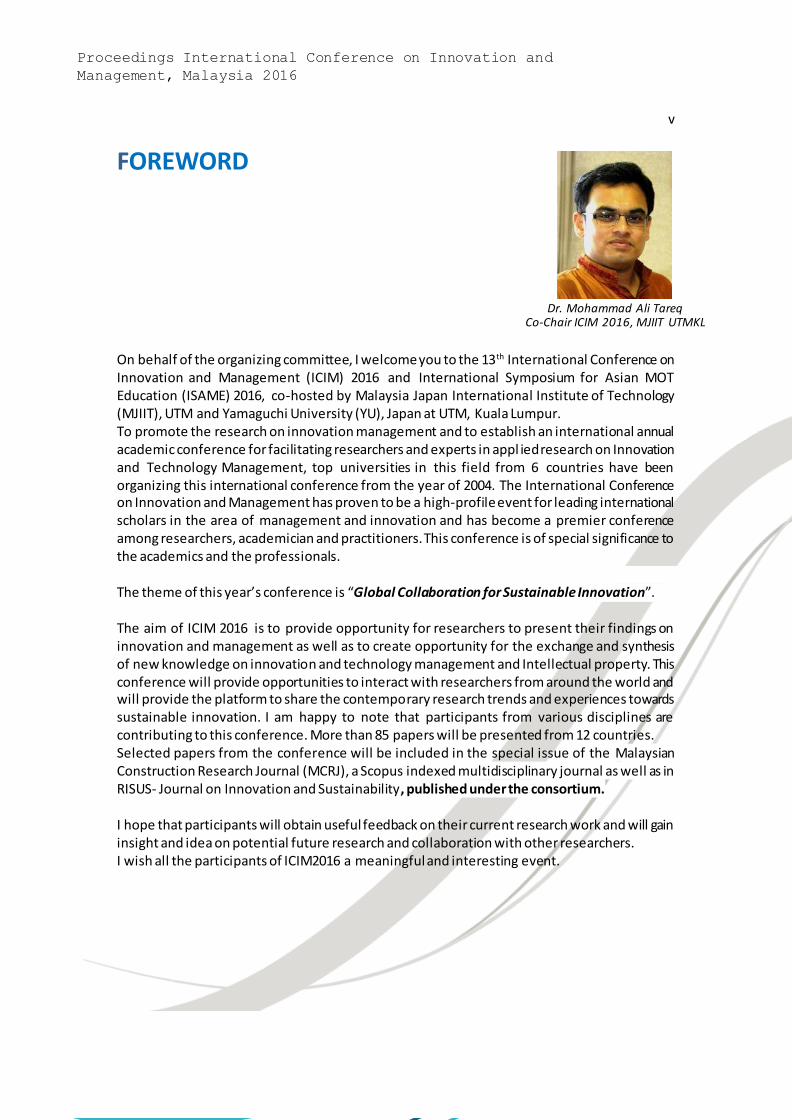
On behalf of the organizing committee of ICIM, I am pleased to welcome you to the 13th meeting held at Malaysia-Japan International Institute of Technology (MJIIT), Universiti Teknologi Malaysia in Kuala Lumpur, Malaysia from November 28 to 30, 2016. We hope that you benefit from the program content as well as guests you will meet during the conference activities. ‘Management of Technology (MOT),’ ‘Innovation Management’ or whatever it might be called, just as its name says, the underlying theme of ICIM, has rapidly achieved its popularity across the globe since ICIM gave its first cry. While we are grateful to witness the rise of societal cognition on the research field, we are somewhat embarrassed to see the diminishing opportunities of meeting researchers who don’t research management of technology as it affirms its own identity. The ICIM of this year is therefore jointly held with the International Symposium on Asia MOT Education (ISAME). The hot topic of the ISAME 2016 focuses on the education and application of Intellectual Property (IP) because we would like the ICIM to be a ‘field’ providing a good chance to run into cutting-edge research in other field and inducing ‘chemical reaction’ as well as marking the frontier of MOT research, particularly the intellectual property awareness in this Asian region is yet at early stage and not all of researchers, students or practitioners have a clear understanding of IP in research, education and application. I hope that your participation in ICIM2016 and ISAME2016 will be enjoyable and memorable one.
Prof. Kaminishi
Chair ICIM2016 ,Yamaguchi Univ.
v
Proceedings International Conference on Innovation and
Management, Malaysia 2016
FOREWORD
On behalf of the organizing committee, I welcome you to the 13th International Conference on Innovation and Management (ICIM) 2016 and International Symposium for Asian MOT Education (ISAME) 2016, co-hosted by Malaysia Japan International Institute of Technology (MJIIT), UTM and Yamaguchi University (YU), Japan at UTM, Kuala Lumpur. To promote the research on innovation management and to establish an international annual academic conference for facilitating researchers and experts in appl ied research on Innovation and Technology Management, top universities in this field from 6 countries have been organizing this international conference from the year of 2004. The International Conference on Innovation and Management has proven to be a high-profile event for leading international scholars in the area of management and innovation and has become a premier conference among researchers, academician and practitioners. This conference is of special significance to the academics and the professionals. The theme of this year’s conference is “Global Collaboration for Sustainable Innovation”. The aim of ICIM 2016 is to provide opportunity for researchers to present their findings on innovation and management as well as to create opportunity for the exchange and synthesis of new knowledge on innovation and technology management and Intellectual property. This conference will provide opportunities to interact with researchers from around the world and will provide the platform to share the contemporary research trends and experiences towards sustainable innovation. I am happy to note that participants from various disciplines are contributing to this conference. More than 85 papers will be presented from 12 countries. Selected papers from the conference will be included in the special issue of the Malaysian Construction Research Journal (MCRJ), a Scopus indexed multidisciplinary journal as well as in RISUS- Journal on Innovation and Sustainability, published under the consortium. I hope that participants will obtain useful feedback on their current research work and will gain insight and idea on potential future research and collaboration with other researchers. I wish all the participants of ICIM2016 a meaningful and interesting event.
Prof. Kaminishi
Chair ICIM2016 ,Yamaguchi Univ.
Dr. Mohammad Ali Tareq
Co-Chair ICIM 2016, MJIIT UTMKL

vi
Proceedings International Conference on Innovation and
Management, Malaysia 2016
Prof. Datin Dr. Rubiyah bt. Yusof
Dean MJIIT, UTMKL
FOREWORD
It is my pleasure to welcome the participants of the 13th International Conference on
Innovation and Management (ICIM) 2016 and International Symposium for Asian MOT Education (ISAME) 2016, co-hosted by Malaysia Japan International Institute of Technology (MJIIT), UTM and Yamaguchi University (YU), Japan at UTM, Kuala Lumpur.
MJIIT, established in 2010 as a result of cooperation between the government of Malaysia and Japan, intended to be the engineering education hub for ASEAN region. It has three engineering departments- Mechanical Precision Engineering (MPE), Electronic Systems Engineering (ESE) and Environmental Engineering and Green Technology (EGT), and the department of Management of Technology (MOT) with a blend of Malaysian, Japanese and International staff. ‘iKohza’, the unique research laboratory system which is set up with the collaboration among Japanese University Consortium (JUC) members, Japanese industries and the government, initiate the transfer of knowledge and technology among the researchers at MJIIT.
As a part of the international collaboration in research and education, MJIIT and Yamaguchi University have jointly established an international research laboratory at MJIIT. This International Joint Intellectual Property Laboratory (IJIPL) aims to be the center of excellence in Management of Technology research, with special emphasis on intellectual property, in ASEAN region. As the partner of this joint research laboratory, Yamaguchi University will extend their expertise in IP research and education. The aim of the IJIPL will be to share technology transfer resources and expertise to deliver a professional and responsive service to Industry, spin out companies and our academic communities. The joint research laboratory will increase Industry engagement with its members and will provide enhanced support for existing and new companies. This conference will be the platform to share the contemporary research trends and experiences in regional common issues as well as to explore research work on Innovation and Intellectual Property from Japan and other countries. I hope you will take advantage of this opportunity and contribute, through presentations, discussion and interaction, to the development of new ideas and new directions in innovation management and Intellectual property.

5
Proceedings International Conference on Innovation and
Management, Malaysia 2016
RESEARCH PRESENTATION

6
Proceedings International Conference on Innovation and
Management, Malaysia 2016
Theme 1: Innovation in Technology, Manufacturing, R&D, Organization,
Business and Service Quality Management
7
Proceedings International Conference on Innovation and
Management, Malaysia 2016
Digital Library Access, Requirements and Usability Attributes: A
Systematic and Critical Review of Literature
Yakubu Bala1, A. A. Maidabino2, Muhammad Salihu Zubair3
1 Abubakar Tafawa Balewa University, Bauchi-Nigeria
2 Bayero University, Kano- Nigeria
3 International Islamic University, Malaysia
(Email: [email protected], [email protected], [email protected])
Abstract In recent years, digital libraries (DLs) have changed the whole process of information
handling. DLS is becoming the lifeline for all human activities in terms of collection, organizing,
storing, retrieval and dissemination of information. This paper examines the access and usability aspect
of DLs by undergraduate students in Nigeria. The paper describes the concept and significance of digital
library from the global perspectives down to Nigerian environment. A number of published literatures in
the area of DLs were identified and critically evaluated. From the review, the paper reports the basic
understanding of the body of knowledge on the access and usability attributes of DLs. The paper
emphasizes that easier and wider access to information is often touted as a primary benefit of digital
libraries. In addition, a number of basic requirements and rubrics for understanding the access and
usability attributes of digital libraries have been extracted and reported. The paper concludes with a
cross-examination of the challenges such as erratic power supply, poor network connectivity; indifferent
attitude of digital library staff etc. as those major obstacles that affects students when using the DLs.
The paper recommends that efforts must be made to ensure wider access to digital collections through
the provision of adequate access points, adequate digital facilities; availability of network and
alternative power sources.
Key words Digital Libraries, Access, Usability attributes, Nigeria
1 Introduction Universities are expected to provide theoretical and practical training to their communities for
the overall development of the nation as a whole. Universities are generally considered as a system which
is made up of people with different backgrounds in terms of needs, skills, talents, status, competencies,
knowledge, behavioural styles, interest and perceptions Alakpadia1. In this regard, universities are the
communities of those who teach and those who learn with the noble vision and mission to generate,
expand, and disseminate knowledge in all disciplines for the advancement of human civilization. They
also produce highly skilled graduates with a capacity for life-long, critical, conceptual and reflective
thinking which is achievable through active involvement and support of university libraries. University
library provides information resources and services for teaching, learning, and research consequent upon
which become an integral part of any institution. The advent and emergence of ICT has become
increasingly popular which brought beneficial developments to higher education particularly in making
information resources available in almost all fields of human endeavours. Consequently, many traditional
libraries and archives have attempted to revolutionize and keep up with new technologies by developing
digital libraries (DLs) Jeng2.
The emergence of digital libraries has provided more opportunities for users to access an d utilize
a variety of information resources Bowden & Viler3. They further stressed that, in the digital age, the
speed of learning and research has become vital differentiator for institutions and individuals in the pursuit
of knowledge and in conducting research. Internet which is the backbone of DLs has greatly influenced
the way learning and research is taking place quickly. Digital Libraries can be seen as a major hypermedia
environment, and possibly the largest information system being used in the wo rld. Digital Libraries have

8
Proceedings International Conference on Innovation and
Management, Malaysia 2016
evolved to become storehouses of information that are available through the Internet. In this regard,
Digital Libraries are medium that link students with the acquisition of information and knowledge that
influences the learning styles of learners in a multi-dimensional ways. DLs enable users to become
independent lifelong learners and use information ethically and legally to solve problems. In this
connection, the concept of DL is unlike other traditional libraries; rather it is the metaphor for the entire
learning process which is part of the responsibilities of all library stakeholders to have a clear perception
and involvement in developing and promotion of digital libraries accessibility and usability. Blandford 4
noted that, ample evidences such as accessing and retrieving very vast information in the world over have
shown the relevance and rationale of DLs in the process of learning and research especially in the
developing world.
This paper examines the access, requirements and usability attributes of digital libraries and
undergraduate students’ searching skills and utilization in a Nigerian Federal University; Abubakar
Tafawa Balewa University, Bauchi (ATBU) through a critical and systematic literature review.
Understanding usability attributes of DLs and searching skills of the undergraduate students will provide
the university management in depth understanding of the need, relevance and importance of digital
libraries in supporting teaching, learning and research as well as in enriching university students’
independent lifelong learning needed for academic and employability standard. In addition, stakeholders
of education like the universities, NUC, NRDC, TETFUND, and other regulatory body in planning and
policy formulation that will strengthen digital library services in their various institutions.
2 The concept and significance of Digital Libraries (DLs) The concept of DLs can be seen from the perspective of network of networks connecting millions of
computers located throughout the world by different organizations, governments, industries, academic
institutions, people etc. In simple term, Omekwu5 described digital libraries as, a set of electronic
resources and associated technical capabilities via internet protocol for creating, searching and using
information. The Digital Library Federation (DLF) (2012) defined digital libraries as “organizations that
provide the resources, including the specialized staff, to select, structure, offer intellectual access,
interpret, distribute, preserve the integrity, and ensure the persistence over time of collections of digital
works so that they are readily and economically available for use by a defined community or set of
communities. Similarly, Debel, & Chapman6 defined a digital library as an organization, which might be
virtual, that comprehensively collects, manages and preserves for the long term rich digital content, and
offers to its user communities specialized functionality on that content, of measurable quality and
according to codified policies.
Therefore, a digital library is not a single entity of itself, rather it requires technology link the
resources of many collections. The links between digital libraries and their resources are transparent to
users. Digital library collections are not limited to document surrogates (bibliographic records). They are
the actual digital objects such as images, texts, etc. It is a network that consists of millions of similar
domestic, institutions, business etc. networks which together carry various information and services.
Digital libraries through the Internet protocols involve the use of e-mail, telnet, file transfer protocols,
web service, the application of search engines such as yahoo, Google, Alta vista, mamma, Infoseek, etc .
make things easy in getting information. Through the digital libraries, one can access full text data bases,
bibliographies, library catalogues on OPAC, electronic mails, journals etc.
In recent years, digital libraries have changed the whole process of information handling. The
information scenario today comprises a whole lot of disjoint sources available around the world. Madu7
stated that, digital library serves as a backbone and connects to these sources of information irrespective
of their location. He further stated that, in present scenario digital library has become the lifeline for all
human activities in terms of collection, organizing, storing, retrieval and dissemination of information .
Digital library has allowed scientist, researchers, students, doctors, journalists, businessmen,

9
Proceedings International Conference on Innovation and
Management, Malaysia 2016
educationists, politicians and the common man to have access to valuable resources scattered in various
forms in different part of the world. Today, information is the most vital resources for any kind of activity,
and digital libraries are playing a key role to support teaching, learning and research in the academic
environment. DLs are constructed, collected and organized by and for a community of users and their
functional capabilities support the information needs and uses of that community Saracevic & Covi8. The
undergraduate students in universities constitute an important segment of the library user community.
Consequent upon the understanding of their information needs and searching mechanism with regards t o
DLs become imperative for effective service provision.
3 Access and usability attributes of DLs Access includes a whole process to make information in the document usable to users. The scope
of the information access is more closely related to the theory and practice of the digital libraries than
information retrieval. Easier and wider access to information is often touted as a primary benefit of digital
libraries. Claims such as the world’s information at your fingertips” and “desktop access to entire library
collections are commonplace. Accessibility of information resources is widely accepted as a primary
determinant of extent of its use Dillion,9. Chowdhury10 did a meta-analysis of empirical work on the
relationship between accessibility to use. They found that propositions on information use most commonly
validated in empirical studies were that information-channel use is a function of channel accessibility,
perceived cost and user awareness. Accessibility of information resources is usually assumed t o depend
on a range of cognitive, social and physical factors such as whether a person is aware of a resource, has
the knowledge and skills needed to access it, and has the resources close at hand. Cunan 11 explored
dimensions of accessibility and in analysing people’s perceptions of physical access to information
resources in different venues, equated the ability to enter a library with the ability to gain access to a
computer terminal and find the system up. In addition to the availability of a working sys tem, Borgman12
concludes that online public access information-retrieval system are hard for people to use because they
require a combination of basic computing skills and knowledge of how to formulate and execute searches.
DLs have changed the way humans interact with information in terms of its origination or
creation, selection, acquisition and delivery as well as its storage. As long as there is an internet connection
available within the DL and the user has an appropriate access device, the requested information can be
accessed from anywhere at any time. Moreover, in so doing, DLs have introduced learning especially
distance learning, to new dimensions. This fact has increased the necessity for learning and in combination
with the new technology opportunities, has led to the emergence of e-learning. DLs has been identified as
the enabler for individuals and institutions to keep up with changes in the global world of academia that
now occur in Internet era and it is one of the most significant recent dev elopments in the Information
System (IS) industry Wang13. E-learning solutions facilitate the delivery of the right information and skills
to the right people at the right time. Similarly, Agbonlahor14 also stated that, the adoption and use of digital
libraries in higher institutions could facilitate access to unlimited and current information for learning and
research irrespective of geographical location and time. Therefore, use of digital libraries centres in
African schools and especially Nigeria could provide college and university students, lecturers and
researchers the opportunity to bridge the knowledge gap between them and their counterparts in developed
countries. Buttressing this need, Jeng2 stressed that, digital libraries have to be designed and developed in
such a way that their use and usage would be simple, easy and error free that would yield satisfaction.
That mean they have to have usability.
Usability is considered as one of the most important factors of DLs by many writers, Alakpadia 1,
Jeng2 and Nelsen15. Jeng2 viewed usability aspect of DLs as the parameter to concentrate, to measure the
extent in which a product can be used by specified users to achieve specified goals with learnability,
effectiveness, efficiency, and satisfaction. While, Nelsen15 outlined five parameters to concentrate as
attributes of usability examination of digital libraries as: learnability, efficiency, memorability, low errors

10
Proceedings International Conference on Innovation and
Management, Malaysia 2016
rate and satisfaction. This study emphasized however that the usability aspect of DLs depends to a large
extent on user searching power or skills. Commenting on the competencies and searching skills,
Alakpadia1 explained that, competency is a self confidence of individual capability to create, search, use,
retrieve, and modify information from the digital library. This means any potential user that is aspiring
to use the digital libraries, he or she must possess the necessary skills and capabilities of know how to
harness the use of digital library effectively. Furthermore, possession of the competency and searching
skills are coined with certain factors that will facilitate the use of digital libraries among the undergraduate
students, and as well as negative factors or challenges that will be faced when using digital libraries among
the undergraduate students are all going to be examine in the paper.
4 Students’ Searching Skills: Requirements and rubric for access and use of DLs
in Nigeria The Nigerian government made some frantic efforts to make digital information available and
accessible to students especially at higher institutions of learning. As a result, students are compelled to
acquire the necessary skills to operate in the new digital information environment, the internet in
particular. Digital information literacy then becomes mandatory for the students to effectively utilize the
information available through the internet. Okon16 equally stated that, access along with study skills,
effective information search and utilization become essential for students’ success in their overall
academic endeavour. He further stressed that finding relevant and appropriate information from digital
libraries is a task. Information retrieval skill has been defined by Okon16 as a set of abilities that enable an
individual to recognize when information is needed and to have the capacity to access, evaluate and make
effective use of the required information. With this all information users including students need to
develop skills for searching, evaluating and managing information if they are to be effective and critical
consumers of information particularly in academic institutions. The National Center for Education
Statistics (NCES) reported by Debell & Chapman17 indicated that about 99% of students in United State
have access to digital information. This has reaffirmed earlier findings that, in the developed countries
just like in the United State, majority of students have access to digital information.
Eyitoro18 stated that, African countries including Nigeria are trying within their capability in the
provision of digital facilities specifically for educational purposes of students. Efforts are being made for
the provision of internet access to students especially at higher institutions. Although the studies
conducted by (Eyitoro18; Tella19 and Jagboro20) fundamentally investigated obstacle to internet access and
utilization, aspect of the digital information access and utilization was facially addressed. Making digital
access and utilization are two different things, having proficiency in the use of digital information
searching is another one that was also not addressed. It is therefore imperative to examine the way and
manner in which students’ access and utilized digital libraries.
Taking Nigeria for example, few Nigerian universities are now available on the net, one beauty
about it is the fact that beside providing access to remote users, they also provide opportunity for libraries
to easily and chiefly update and expand their collections as well of information sharing and delivery.
In the developing countries of Africa especially Nigeria, the application of this digital advanced
technology in libraries is mostly at the exploration and experimental stages. Okon 16 highlighted that, even
though the application of ICT in Nigerian libraries is very recent, its impact in information access,
management, processing, storage, retrieval and dissemination is enormous. He further maintained that, by
this opportunity, some university libraries in Nigeria have subscribed to books, journals, online databases
like AGORA, MEDALINE, HINARI, OCLC, OPAC, RDA etc. in addition to some CD-ROM databases.
Talking on the access to digital information in his study on the availability of ICT in some selected
libraries in Lagos and Ibadan, Faboyinde21 reveals that, 58% of the libraries have wireless access to the
internet through (VSAT) and 35% already have web sites access. This signifies that Nigerian libraries
have joined the trend of world’s digital community just like other counterparts in the world.
11
Proceedings International Conference on Innovation and
Management, Malaysia 2016
From the above, it can be understood that globally libraries embraced digital revolution by
automating their services in order to enhance their collection size, depth and public access to pave way to
the utilization of their resources. There is the outmost need to find out whether university digital libraries
in Nigeria are getting satisfactory digital accessibility and guidance on how to retrieve information from
digital libraries. Despite all these, there is a gap in gaining access to most of the digital libraries in Nigerian
tertiary institution, whereas potential users are required to submit their university network identification
number (NetID) for authentication. Sometimes users must then complete a registration questionnaire that
collects basic identification, demographic data before having access to utilize digital libraries. That is why
Borgman12 stated that, authentication and registration procedures presented an enormous barrier to access
and use, and one that was largely unanticipated. Another gap is that despite h aving barriers to free access,
this barrier has not received much attention in published reports of digital libraries studies. Thus, its
importance as a determinant of use should not be under estimated.
5 Challenges Faced in Using Digital Libraries World wide access to and use of DLs are not without some challenges. Multiple numbers of
challenging problems or obstacles are faced by users in using DLs. Some of the problems are in existence
for long, while others might come along the way. In most instances, erratic power failure, network
problem, lack of basic and adequate essential infrastructures has persistently remained a problem to
appropriate access and use of the digital libraries in Nigerian society. Okachi22 stated that lack of ICT
facilities can be a barrier to using digital resources in Nigerian libraries, this couple with the traditional
mode of carrying out library services and operations that still prevail in most Nigerian libraries.
There are very limited number and availability of digital facilities compare to the number of
students’ enrolment, sometimes student has to booked in order to use the digital library or to wait for quite
some time for his/her turn with a very limited duration, because the number of students outnumbered the
computers by far. Another problem has to do with the low label of self-confidence on the usage of digital
libraries. Certainly, those students with low level self-confidence may end up in having problem of
searching skills in locating and retrieving desired information. Commenting in the same vain 1Alakpadia
(2000) stated that, internet skills are the basic human tools for operating the computer in the digital set -
up. A skilful internet user can be operationally defined as one who is able to search for, locate, retrieved,
download, send, reply from the digital library and also participate in the web based conferences, use
groups, use nets etc. From another angle, 22Okachi stated that, digital library staffs are sometimes reluctant
in regularly assisting patrons on the use of digital library. That is why Etim23 stated that, this may not be
unconnected to the fact that many personnel including the professionals, para-professional and supporting
staffs working in the Nigerian libraries themselves have no basic internet skills and yet professional
training in librarianship and information science in Nigeria do not make provision for conducive
atmosphere in which librarians can be computer literate. They are lacking in the knowledge of how to use
digital libraries or rather to assist users to use. This has implication to search efficacy on users who defend
on assistance.
Network service availability and stability is not constant. Most a times either the service is very
low or rarely available. 24Ugwuanyi stated that high cost of internet connectivity and bandwidth as well
as low speed connectivity established a treat to African universities in joining digital information world
where knowledge and research findings are accessed digitally. There are also problems related to users’
attitudes of misuse and mishandling, as well as spoilage of digital facilities that have all become topical
issue of concern among educationist and other stakeholders. It is also observed that some users dedicate
most of their time on meaningless and social related information at the detriment of meaningful
information for their learning and research. Electricity supply also hinders the constant connectivity within
digital libraries, which cripple the smooth running of many universities library services, as no library will
12
Proceedings International Conference on Innovation and
Management, Malaysia 2016
survive on generating power from the use of generating machine. While, Ogbomo 25 stated that, irregular
and epileptic power supply cripple the Nigerian economy and hundreds of progress research carried out
by institute, groups and individuals.
Other related challenges are lack of ICT infrastructure, lack of adequate funding and lack of
necessary manpower.
6 Conclusion Though, libraries have come to exist in response to needs in human communities. Digital libraries
are no exception. This paper focused on accessibility and usability of digital library by undergraduate
students in ATBU, Bauchi. It dealt extensively with the important themes and variables related to this
paper such as accessibility and usability of digital library. It was paramount for this kind of study to be
conducted in this institution of learning to determine the extent to which access and services of digital
library were available to undergraduate students, to find out whether access influence its usage, determin e
the factors that facilitated or motivated the use of the digital library and find out the purpose for which
digital library was used by students in the university.
The purpose of this research study is to examine access and usability attribute of digital library
and undergraduate students to make it more effective and efficient for users. The review gathered from
the literature shows that there are in adequate point of access and there are some great access barriers that
distract effective and maximum access, there is also under utilization of digital libraries which is very
low. The study also revealed that, majority of the undergraduate students relies and depend on receiving
assistance on how to use digital libraries. Therefore, this shows that they hav e low competency and
searching skills.
It was deducted from the findings of the study that, digital libraries are important in supporting
teaching, learning and research. It is also evident that Abubakar Tafawa Balewa University established
such digital libraries to offer this important service to the university community, although the services are
generally low because of the encountered problems and constraints ranging from poor network
connectivity, inadequate points of access, indifferent staff attitude as well as power outage. There is the
need for urgent attention towards improving the services of the digital libraries.
References [1] Alakpadia, O. K. The Use of Internet Skills among Library and Information Science Studies, the
Experience of Delta State University, Abraka. (J). Information Impact, Journal of Information
Management, 2010, 1(2). 55-60.
[2] Jeng, J. What is usability in the context of the digital library and how can it be measured (J).
Information Technology and Libraries, 2005, 24(2).47-56.
[3] Bawden, D., & Vilar, P. Digital libraries: To meet or manage user expectations. Emerald (J), 2006
58(4), 346-354.
[4] Blandford, A. Interacting with information resources: Digital libraries for education (J).
International Journal of Learning Technologies, 2006, 4(2/3), 185-202.
[5] Omekwu, C. Emerging Challenges and Opportunities for Nigerian Library Association (C) 46 th
Annual National Conference and AGM Held at Arewa House Conference Centre Kaduna, HEBN
Publishers PLC 2008,
[6] Debel, W. F. & Chapman, J. T . Introduction to Digital Libraries (M). London: Facet Publishers,
2003
[7] Madu, E. Use of Internet Access to the Academic Performance of Students. (M) Enugu: Palm beach
publishers, 2008: 43-57.

13
Proceedings International Conference on Innovation and
Management, Malaysia 2016
[8] Saracevic, T. & Lisa Covi. Challenges for Digital Library Evaluation. Annual Meeting of the
American Society for Information Science (M). New Brunswick, 2000
[9] Dillion, A. Evaluation on Time Framework for the expert evaluation of digital Library Interface
Usability (J). International Journal on Digital Libraries, 2006: 2(2),170-178
[10] Chowdhury, G. G. The Intergration of Business Intelligence and Knowledge (J) IBM System Journal
2006: 41 (4), 697-713
[11] Cunan, C. R. Evaluating Digital Libraries: A User-Friendly Guide (M). Harvard England : National
Science Digital Library, 2009: 94
[12] Borgman, C. L., Leazer, G.H., Gilliland-Swetland, A. J & Gazan, R. Evaluating Digital libraries for
teaching and learning in undergraduate education: A case study of Alexandria Digital Earth
Prototype (ADEP) (J). Library Trends,2000: (49). 228-25.
[13] Wang, Y. M. Wang, University faculty use of the Internet (C). Paper presented at the National
Convention of the Association for Educational communication and Technology (AECT), St. Louis,
(2003): MO. Retrieved September 11, 2011 from
http://depts.hre.wvu.edu/hre/facultypres/display_faculty_pres.asp
[14] Agbonlahor, J. The research methods knowledge base (3rd ed.): 2005:. OH: Atomic Dog.
[15] Nelsen, B. T (2005) Ergonomic Requirement for office work with visual display terminals. Part 11:
Guidance on usability (ISO DIS 924-11). London: ISO
[16] Okon, H.O (2007). Information Retrieval Techniques. In Etim F. E. & Nssien, F. U (Eds)
Information Literacy for Library Search (M). Uyo : Abaam Publishing Co.2007: 134-142.
[17] Debell, W. F., & Chapman, J. T. The integration of business intelligence and knowledge (J) IBM
Systems Journal, 2006: 41(4), 697-713.
[18] Eyitoro, O.T. Internet Facilities and Status of Africa’s Connectivity. In Aina, L. O. (Eds.)
Information and knowledge management in the Digital Age: Concepts, Technologies and
African Perspectives (M).Ibadan: The world information Ltd. 2006: 31-49.
[19] Tella, A. University of Botswana Undergraduates Uses of Internet: Implications on Academic
performance (J). Electronic Journal of Academic and Special Librarian, 2007.
[20] Jagboro, P. Open Access Overview. 2003: Retrieve from http://creativecommons.org October 28,
2010.
[21] Faboyinde, E. O. The State of Information Communication Technology (ICT) in Selected Libraries
in Lagos and Ibadan Metropolis (M). 2006
[22] Okachi, S. Information Communication Technology (ICT) as a research tool in Libraries (J).
Nigerbiblios, 2009: 17(1&2)
[23] Etim, F.E. The evolution of Information society (M). In Etim & Nssien(Eds.). Information Literacy
for Library Search. Uyo: Abam Publishing, 2007: 73-89.
[24] Ugwuanyi, C. F. African University Libraries and Internet Connectivity: Challenges & The way
forward (J). Library philosophy and practice, 2010: 1-9.
[25] Ogbomo, A. (2011). Evaluation on Time: a framework for the expert evaluation of digital library
Interface usability (J). International Journal on Digital Libraries,2011: 2(2/3), 170-7
14
Proceedings International Conference on Innovation and
Management, Malaysia 2016
Innovation Management in Oil Tanker Vessels Safety
Alireza Fili Ahmad Rahman Songip
Malaysia–Japan International Institute of Technology (MJIIT), Universiti Teknologi Malaysia (UTM),
54100 Kuala Lumpur, Malaysia
(Email: [email protected])
Abstract Oil pollution is caused by the maritime casualty that effecting safety of environment. While lot
of research, work and investigation carried out in order to find out the cause of oil spillage attributed
during accident in shipping industry, very rare research has been done to determine the aspect of safety in
relation with effectiveness of innovation in structure for oil tanker vessel for controlling oil pollution. The
International Maritime Organization (IMO) believes that innovation in technology is paralleled with the
International Management and Safety Convention somehow reducing the oil spillage. Hence, in this
research great emphasis will be made on its effect globally in relation to aspect of management and
innovation technology in oil tanker vessel safety, ways to improve safety management, reduce casualty
and marine pollution, and review some potential innovations and ideas to achieve the optimal maritime
safety for oil tanker vessels.
Key Words innovation management, oil tanker, vessels safety.
1 Introduction United Nations was the main international body that promotes the maritime safety to be more
effective and reducing the accidents involved maritime casualty. After 1948 conference conducted by
United Nations, the countries were agreed to form the International Maritime Organization (IMO) as the
specialized agency that deal with the international maritime and shipping. The main purpose of this
organization is to improve and develop the maritime safety and protection of the environment of the sea
[1]. The first convention in safety was “Safety of Life At Sea” (SOLAS 1974).
For this purpose, IMO has identified a measurement of technical and operational to improve the
maritime safety, particularly in oil tanker in reducing the oil pollution [2]. Total adoption is about 40
conventions and 700 codes and recommendations pertaining to the prevention of pollution and maritime
safety [3] . The major convention for oil pollution was “International Convention for the Prevention of
Pollution from Ships” (MARPOL 73/78). Main disaster to the maritime ecosystems in worldwide is oil
pollution [4] .
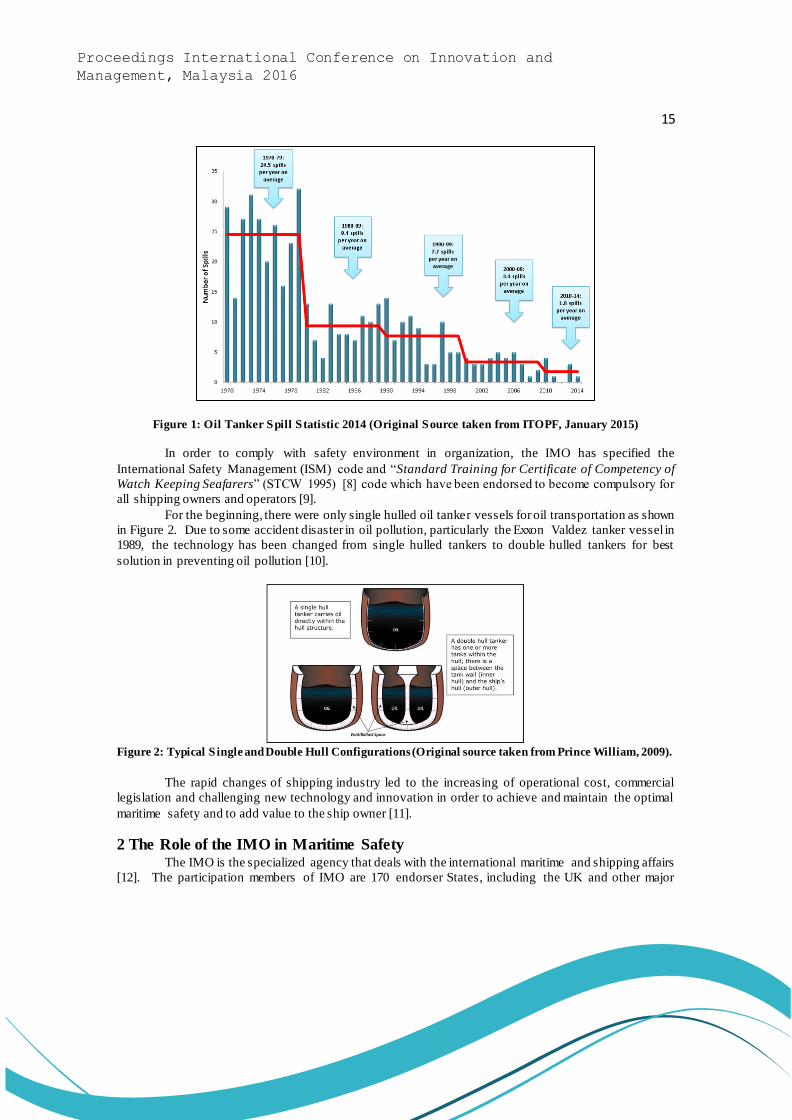
Pollution can be defined as contaminated [5]. Oil pollution is the main source of marine pollution.
Oil pollution can be happened during the shipment of the oils at seas as shown in Figure 1. Despite of
fact that the amount of the oil spills might be in small or large portion, but any oil spills may leave the
effect of ecological damage to coastline or sea [7].
15
Proceedings International Conference on Innovation and
Management, Malaysia 2016
Figure 1: Oil Tanker Spill Statistic 2014 (Original Source taken from ITOPF, January 2015)
In order to comply with safety environment in organization, the IMO has specified the
International Safety Management (ISM) code and “Standard Training for Certificate of Competency of
Watch Keeping Seafarers” (STCW 1995) [8] code which have been endorsed to become compulsory for
all shipping owners and operators [9].
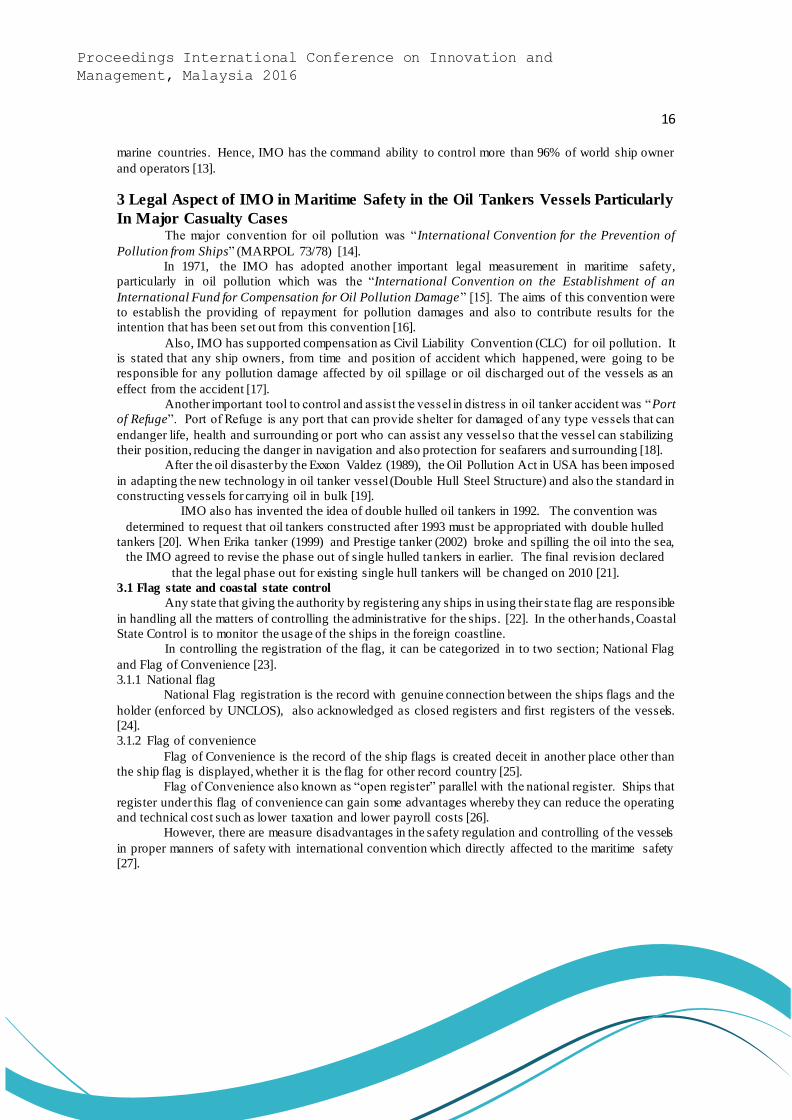
For the beginning, there were only single hulled oil tanker vessels for oil transportation as shown
in Figure 2. Due to some accident disaster in oil pollution, particularly the Exxon Valdez tanker vessel in
1989, the technology has been changed from single hulled tankers to double hulled tankers for best
solution in preventing oil pollution [10].
Figure 2: Typical S ingle and Double Hull Configurations (Original source taken from Prince William, 2009).
The rapid changes of shipping industry led to the increasing of operational cost, commercial
legislation and challenging new technology and innovation in order to achieve and maintain the optimal
maritime safety and to add value to the ship owner [11].
2 The Role of the IMO in Maritime Safety The IMO is the specialized agency that deals with the international maritime and shipping affairs
[12]. The participation members of IMO are 170 endorser States, including the UK and other major
16
Proceedings International Conference on Innovation and
Management, Malaysia 2016
marine countries. Hence, IMO has the command ability to control more than 96% of world ship owner
and operators [13].
3 Legal Aspect of IMO in Maritime Safety in the Oil Tankers Vessels Particularly
In Major Casualty Cases The major convention for oil pollution was “International Convention for the Prevention of
Pollution from Ships” (MARPOL 73/78) [14].
In 1971, the IMO has adopted another important legal measurement in maritime safety,
particularly in oil pollution which was the “International Convention on the Establishment of an
International Fund for Compensation for Oil Pollution Damage” [15]. The aims of this convention were
to establish the providing of repayment for pollution damages and also to contribute results for the
intention that has been set out from this convention [16].
Also, IMO has supported compensation as Civil Liability Convention (CLC) for oil pollution. It
is stated that any ship owners, from time and position of accident which happened, were going to be
responsible for any pollution damage affected by oil spillage or oil discharged out of the vessels as an
effect from the accident [17].
Another important tool to control and assist the vessel in distress in oil tanker accident was “Port
of Refuge”. Port of Refuge is any port that can provide shelter for damaged of any type vessels that can
endanger life, health and surrounding or port who can assist any vessel so that the vessel can stabilizing
their position, reducing the danger in navigation and also protection for seafarers and surrounding [18].
After the oil disaster by the Exxon Valdez (1989), the Oil Pollution Act in USA has been imposed
in adapting the new technology in oil tanker vessel (Double Hull Steel Structure) and also the standard in
constructing vessels for carrying oil in bulk [19]. IMO also has invented the idea of double hulled oil tankers in 1992. The convention was
determined to request that oil tankers constructed after 1993 must be appropriated with double hulled
tankers [20]. When Erika tanker (1999) and Prestige tanker (2002) broke and spilling the oil into the sea,
the IMO agreed to revise the phase out of single hulled tankers in earlier. The final revision declared
that the legal phase out for existing single hull tankers will be changed on 2010 [21].
3.1 Flag state and coastal state control
Any state that giving the authority by registering any ships in using their sta te flag are responsible
in handling all the matters of controlling the administrative for the ships. [22]. In the other hands, Coastal
State Control is to monitor the usage of the ships in the foreign coastline.
In controlling the registration of the flag, it can be categorized in to two section; National Flag
and Flag of Convenience [23].
3.1.1 National flag
National Flag registration is the record with genuine connection between the ships flags and the
holder (enforced by UNCLOS), also acknowledged as closed registers and first registers of the vessels.
[24].
3.1.2 Flag of convenience
Flag of Convenience is the record of the ship flags is created deceit in another place other than
the ship flag is displayed, whether it is the flag for other record country [25].
Flag of Convenience also known as “open register” parallel with the national register. Ships that
register under this flag of convenience can gain some advantages whereby they can reduce the operating
and technical cost such as lower taxation and lower payroll costs [26].
However, there are measure disadvantages in the safety regulation and controlling of the vessels
in proper manners of safety with international convention which directly affected to the maritime safety
[27].
17
Proceedings International Conference on Innovation and
Management, Malaysia 2016
3.2 Port state control
In usual procedure, many vessels are not commonly calling for Flag State and Coastal State which
can reduce the authority for effectiveness of the Flag State to monitor and administer the standard aspect
of the vessels [28].
However, with Port State Control, the movement of all vessels can be monitored accordingly.
Port State Control (PSC) may consider as a third regime of authority that focus on the validity, quality
and activity control of the vessels in respect of safety [29].
3.2.1 Regional port state control
A “Port State Control regime” has been set up under “memorandum of understanding” (MoU) or
very much alike within the same neighboring port state [30]. Its practice the harmony investigation
process that has been designed to aim the inferior vessels with the major objective relates to the IMO
industrial convention such as SOLAS and MARPOL. Some of regional port state controls are Paris
Memorandum, Tokyo memorandum and etc. [31].
3.2.2 International Association of Classification Society (IACS)
IACS can be defined as a non-government society that endorsed and approved for maritime safety
particularly in technical support, construction design, and conformity of certification and also the study
of improvement [32]. This endorsement is aligned with the guideline and standard setup by the IMO [33].
In other words, Any vessel that gotten the endorsed and approved certificate by IACS, are entitled
to get the international insurance that can protect the vessel while on board in internat ional waters and
coastline.
Even though IACS have a crucial character and carry out their role in the shipping industry, but
still the liability of the vessels will be borne by the ship owners, operators and also by marine insurance
providers [34]. As such, IACS main responsibility is to inspect and investigate the compliance of the ship
with the appropriate standard by issuing the related certificate, without any guarantee and liability of the
wellness of the vessel.
4 The Role of Voluntarily Organizations in Oil Tanker’s Safety When it comes to the safety on the vessel, there are lots of aspects that need to be considered
from the condition of technical and up to the operation performance of the vessel. The responsibility in
maintaining this up-to-date condition of the vessel is lies under the jurisdiction of ship -owners and
operators [35].
As a result from the high-risk responsibility of the ship-owners, they agreed to form non-legal
pressure organization to manage the transportation and maritime safety risk of their vessel [36]. Which
are including of International Chamber of Shipping (ICS), International Association of Independent
Tanker Owner (INTERTANKO), Oil Company International Marine Forum (OCIMF), International
Association of Port and Harbor (IAPH), Committee Maritime International (CMI) & EQUASIS.
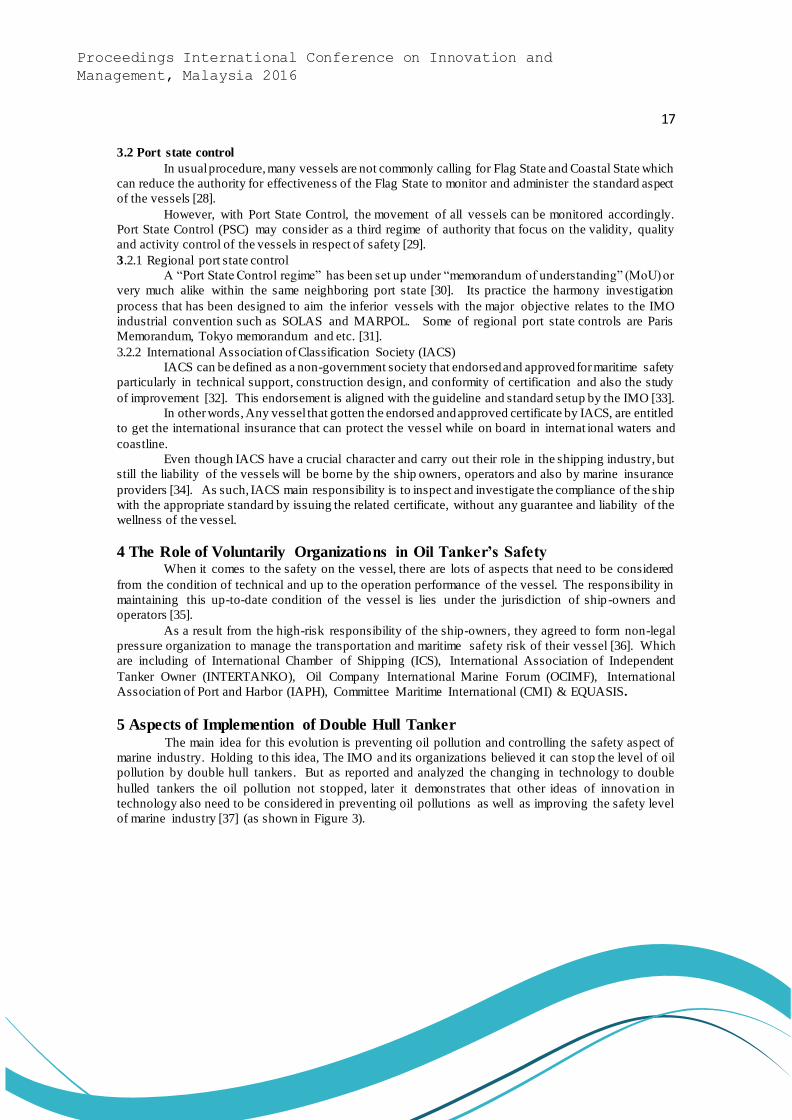
5 Aspects of Implemention of Double Hull Tanker The main idea for this evolution is preventing oil pollution and controlling the safety aspect of
marine industry. Holding to this idea, The IMO and its organizations believed it can stop the level of oil
pollution by double hull tankers. But as reported and analyzed the changing in technology to double
hulled tankers the oil pollution not stopped, later it demonstrates that other ideas of innovation in
technology also need to be considered in preventing oil pollutions as well as improving the safety level
of marine industry [37] (as shown in Figure 3).
18
Proceedings International Conference on Innovation and
Management, Malaysia 2016
Figure 3: Comparison of Oil Spill by Double Hulled and Single Hulled Tanker (Original Source taken from
the Review of Double Hulled Tanker, 2009)
Despite of the accidents happened in double hulled tanker, there are some other advantages and
disadvantages for double hulled oil vessels [38]. The invention in technology of double hulled tankers
show that the operation of loading clearance become faster and produce good rate of loading. In fact, the
cleaning process of double hulled tanker become easy and faster [39]. However, there some increasing
in the cost whereby the manufacturing cost of the vessel under double hulled became high due to usage
of more steel, required more construction time as well as in maintenance aspect of the vessel [40]. On the
operation issue, double hulled tankers are easily leaking caused by the crack in bulkhead between cargo
and the ballast tank.
6 Implemention of Open Innovation in Oil Tanker Vessel In 2004, the IMO and its organization have amended Chapter 11-1 in SOLAS 74 (new Reg. 3-
10) [41]. The Marine Safety Committee under IMO has endorsed a decision MSC.290 (87) which
enclosed with a new SOLAS arrangement that requires new single side skin carrier vessel for oil tankers
and bulk vessels of 150m in length, and above to be formed and manufactured according to the class
society’s guidelines that have been approved and confirmed by the IMO to fit the new Goal Based
Standard (GBS) creation specification, which were also being endorsed by MSC 87 [42]. For strategic
plan, the IMO should authorize the GBS for the design and construction of new ships [43].
Followed by the Bahamas, Greece and IACS, they agreed to use the 5-tiers framework of GBS (as shown
in Figure 4) [44]. The first 3-tiers are comprised by the development of the IMO standards and the last 2-
tiers are comprised of other organization i.e. classification society’ standards [45].

19
Proceedings International Conference on Innovation and
Management, Malaysia 2016
Figure 4: Goal-Base Standards Framework (Original source taken from An Analysis of the Implementation
of Future GBS, 2011).
This new open innovation is developed to increase the possibility of reducing in oil pollutions
and also at the same time, promoting the new innovation with the lower cost. These standards approved
and endorsed by the IMO and the design is confirmed by the IACS are to create the goal-based standards
that being adopted by all ship builders, ship owners and also marine industry [46]. Goal-Based Standards
(GBS) are the standards set up by the IACS for the structure and design of the new vessels for single side
skin to be implemented to the oil tankers and bulk vessel in increasing the safety and reducing the
percentage of oil pollution [47]. The advantages of the standards are low in the construction cost,
maintenance cost and ease of access for inspection, as well as more eco-friendly. The implementation of
the new standards is scheduled on the 1st July 2016. Any ships manufactured before July 2017 is not
comply with the standards. The standards are complying only for the ships that manufactured after July
[48].
Addition to this and on base of these rules, some researchers has invented the idea for n ew
technology as added value to the current technology. One of the new ideas of technology invention is
Sandwich Plate System (SPS) as shown in Figure 5. SPS is a lightweight material that separated two
metal plates with elastomer core to make it stable and solid [49].
Figure 5: Conventional Structure and SPS Structure (Original Source taken from The Performance, Safety
and Production Benefits of SPS Structures for Double Hull Tankers, 2004)
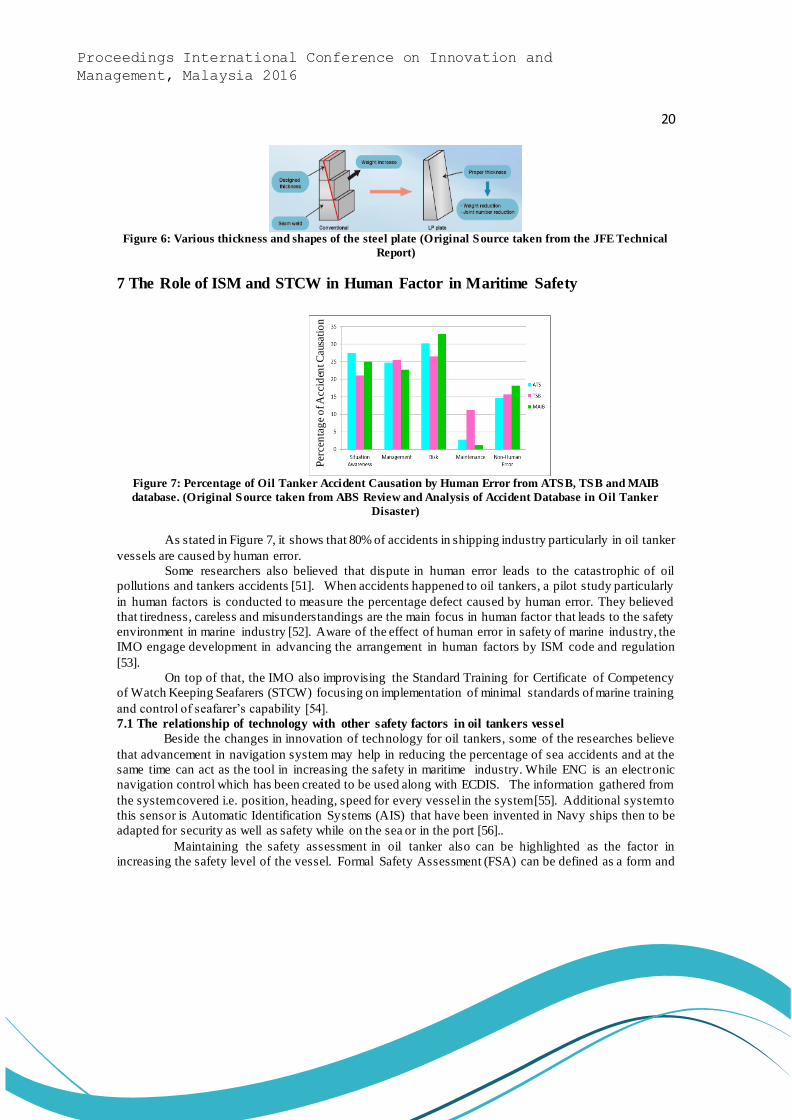
Longitudinal Profile Plate a.k.a. LP also one of the innovation in technology for oil tankers. As
shown in Figure 6, LP can be defined as the continuous changes of the thickness of the plate in longitudinal
way to cut down the construction cost and lighten the steel in many grades with the wide range of plate
dimension for shipping manufacturing [50].
20
Proceedings International Conference on Innovation and
Management, Malaysia 2016
Figure 6: Various thickness and shapes of the steel plate (Original Source taken from the JFE Technical
Report)
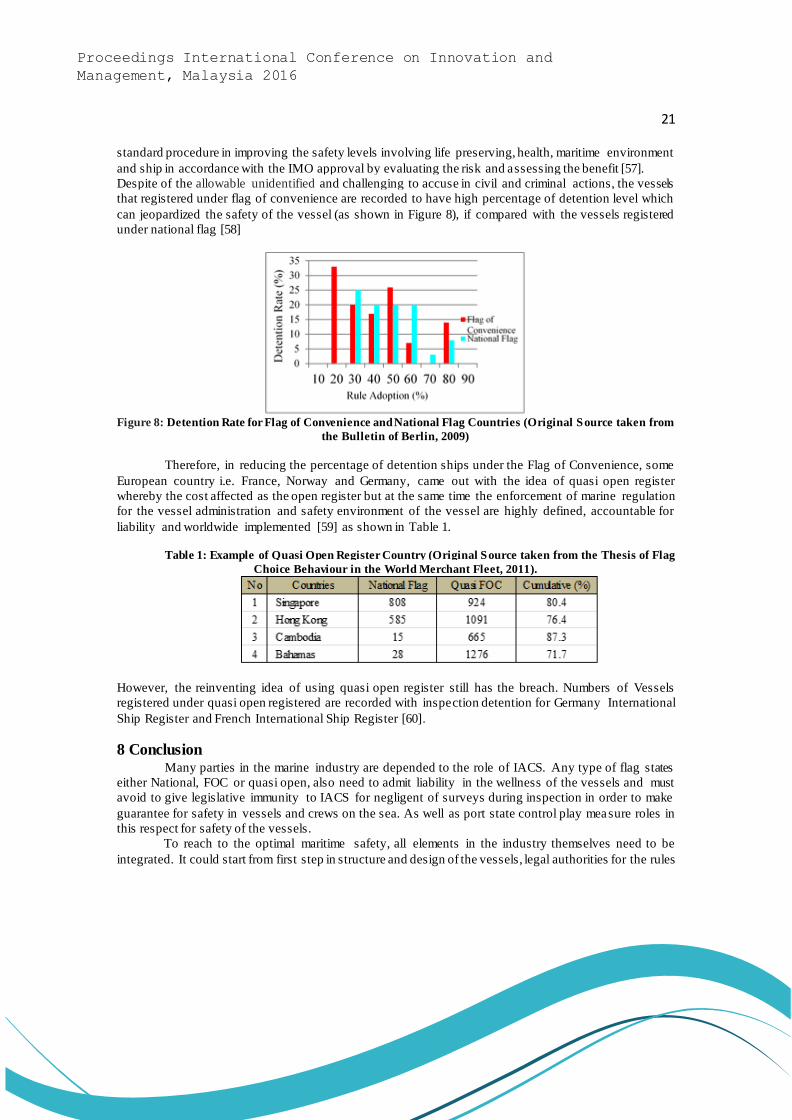
7 The Role of ISM and STCW in Human Factor in Maritime Safety
Figure 7: Percentage of Oil Tanker Accident Causation by Human Error from ATSB, TSB and MAIB
database. (Original Source taken from ABS Review and Analysis of Accident Database in Oil Tanker
Disaster)
As stated in Figure 7, it shows that 80% of accidents in shipping industry particularly in oil tanker
vessels are caused by human error.
Some researchers also believed that dispute in human error leads to the catastrophic of oil
pollutions and tankers accidents [51]. When accidents happened to oil tankers, a pilot study particularly
in human factors is conducted to measure the percentage defect caused by human error. They believed
that tiredness, careless and misunderstandings are the main focus in human factor that leads to the safety
environment in marine industry [52]. Aware of the effect of human error in safety of marine industry, the
IMO engage development in advancing the arrangement in human factors by ISM code and regulation
[53].
On top of that, the IMO also improvising the Standard Training for Certificate of Competency
of Watch Keeping Seafarers (STCW) focusing on implementation of minimal standards of marine training
and control of seafarer’s capability [54].
7.1 The relationship of technology with other safety factors in oil tankers vessel
Beside the changes in innovation of technology for oil tankers, some of the researches believe
that advancement in navigation system may help in reducing the percentage of sea accidents and at the
same time can act as the tool in increasing the safety in maritime industry. While ENC is an electronic
navigation control which has been created to be used along with ECDIS. The information gathered from
the system covered i.e. position, heading, speed for every vessel in the system [55]. Additional system to
this sensor is Automatic Identification Systems (AIS) that have been invented in Navy ships then to be
adapted for security as well as safety while on the sea or in the port [56]..
Maintaining the safety assessment in oil tanker also can be highlighted as the factor in
increasing the safety level of the vessel. Formal Safety Assessment (FSA) can be defined as a form and
Per
cen
tag
e o
f Acc
iden
t Cau
sati
on
21
Proceedings International Conference on Innovation and
Management, Malaysia 2016
standard procedure in improving the safety levels involving life preserving, health, maritime environment
and ship in accordance with the IMO approval by evaluating the risk and assessing the benefit [57].
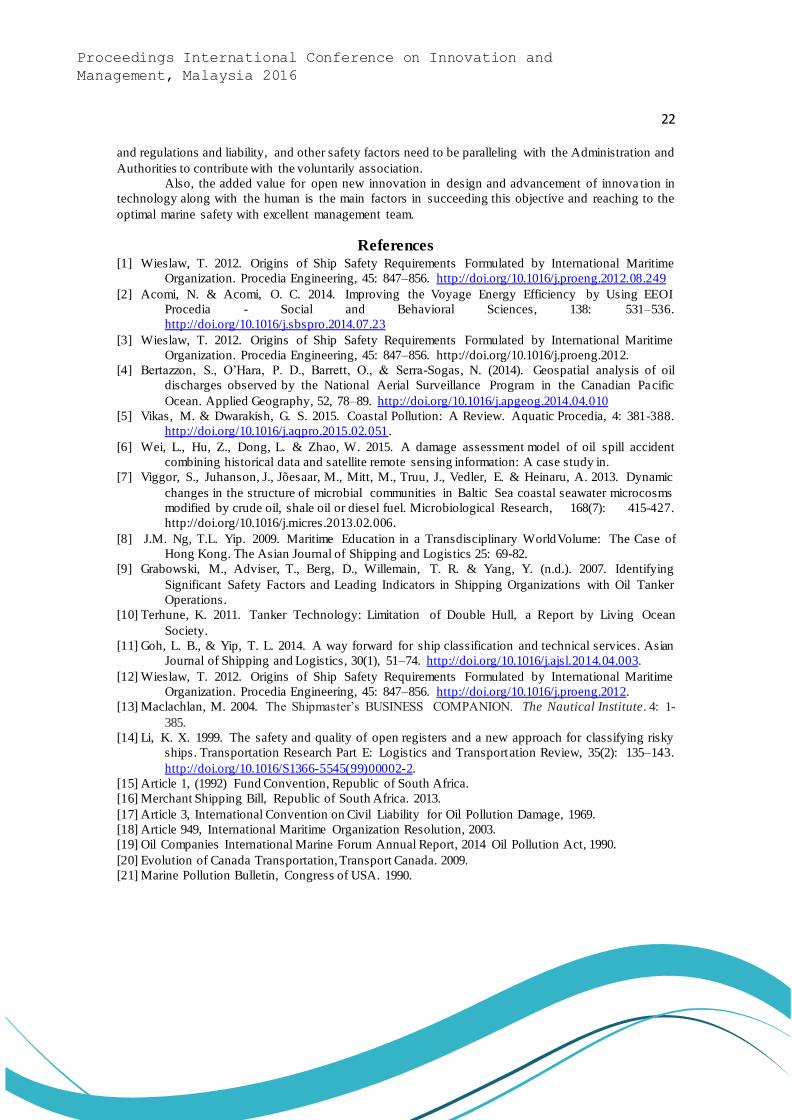
Despite of the allowable unidentified and challenging to accuse in civil and criminal actions, the vessels
that registered under flag of convenience are recorded to have high percentage of detention level which
can jeopardized the safety of the vessel (as shown in Figure 8), if compared with the vessels registered
under national flag [58]
Figure 8: Detention Rate for Flag of Convenience and National Flag Countries (Original Source taken from
the Bulletin of Berlin, 2009)
Therefore, in reducing the percentage of detention ships under the Flag of Convenience, some
European country i.e. France, Norway and Germany, came out with the idea of quasi open register
whereby the cost affected as the open register but at the same time the enforcement of marine regulation
for the vessel administration and safety environment of the vessel are highly defined, accountable for
liability and worldwide implemented [59] as shown in Table 1.
Table 1: Example of Quasi Open Register Country (Original Source taken from the Thesis of Flag
Choice Behaviour in the World Merchant Fleet, 2011).
However, the reinventing idea of using quasi open register still has the breach. Numbers of Vessels
registered under quasi open registered are recorded with inspection detention for Germany International
Ship Register and French International Ship Register [60].
8 Conclusion Many parties in the marine industry are depended to the role of IACS. Any type of flag states
either National, FOC or quasi open, also need to admit liability in the wellness of the vessels and must
avoid to give legislative immunity to IACS for negligent of surveys during inspection in order to make
guarantee for safety in vessels and crews on the sea. As well as port state control play measure roles in
this respect for safety of the vessels.
To reach to the optimal maritime safety, all elements in the industry themselves need to be
integrated. It could start from first step in structure and design of the vessels, legal authorities for the rules
22
Proceedings International Conference on Innovation and
Management, Malaysia 2016
and regulations and liability, and other safety factors need to be paralleling with the Administration and
Authorities to contribute with the voluntarily association.
Also, the added value for open new innovation in design and advancement of innova tion in
technology along with the human is the main factors in succeeding this objective and reaching to the
optimal marine safety with excellent management team.
References [1] Wieslaw, T. 2012. Origins of Ship Safety Requirements Formulated by International Maritime
Organization. Procedia Engineering, 45: 847–856. http://doi.org/10.1016/j.proeng.2012.08.249
[2] Acomi, N. & Acomi, O. C. 2014. Improving the Voyage Energy Efficiency by Using EEOI
Procedia - Social and Behavioral Sciences, 138: 531–536.
http://doi.org/10.1016/j.sbspro.2014.07.23
[3] Wieslaw, T. 2012. Origins of Ship Safety Requirements Formulated by International Maritime
Organization. Procedia Engineering, 45: 847–856. http://doi.org/10.1016/j.proeng.2012.
[4] Bertazzon, S., O’Hara, P. D., Barrett, O., & Serra-Sogas, N. (2014). Geospatial analysis of oil
discharges observed by the National Aerial Surveillance Program in the Canadian Pacific
Ocean. Applied Geography, 52, 78–89. http://doi.org/10.1016/j.apgeog.2014.04.010
[5] Vikas, M. & Dwarakish, G. S. 2015. Coastal Pollution: A Review. Aquatic Procedia, 4: 381-388.
http://doi.org/10.1016/j.aqpro.2015.02.051.
[6] Wei, L., Hu, Z., Dong, L. & Zhao, W. 2015. A damage assessment model of oil spill accident
combining historical data and satellite remote sensing information: A case study in.
[7] Viggor, S., Juhanson, J., Jõesaar, M., Mitt, M., Truu, J., Vedler, E. & Heinaru, A. 2013. Dynamic
changes in the structure of microbial communities in Baltic Sea coastal seawater microcosms
modified by crude oil, shale oil or diesel fuel. Microbiological Research, 168(7): 415-427.
http://doi.org/10.1016/j.micres.2013.02.006.
[8] J.M. Ng, T.L. Yip. 2009. Maritime Education in a Transdisciplinary WorldVolume: The Case of
Hong Kong. The Asian Journal of Shipping and Logistics 25: 69-82.
[9] Grabowski, M., Adviser, T., Berg, D., Willemain, T. R. & Yang, Y. (n.d.). 2007. Identifying
Significant Safety Factors and Leading Indicators in Shipping Organizations with Oil Tanker
Operations.
[10] Terhune, K. 2011. Tanker Technology: Limitation of Double Hull, a Report by Living Ocean
Society.
[11] Goh, L. B., & Yip, T. L. 2014. A way forward for ship classification and technical services. Asian
Journal of Shipping and Logistics, 30(1), 51–74. http://doi.org/10.1016/j.ajsl.2014.04.003.
[12] Wieslaw, T. 2012. Origins of Ship Safety Requirements Formulated by International Maritime
Organization. Procedia Engineering, 45: 847–856. http://doi.org/10.1016/j.proeng.2012.
[13] Maclachlan, M. 2004. The Shipmaster’s BUSINESS COMPANION. The Nautical Institute. 4: 1-
385.
[14] Li, K. X. 1999. The safety and quality of open registers and a new approach for classifying risky
ships. Transportation Research Part E: Logistics and Transportation Review, 35(2): 135–143.
http://doi.org/10.1016/S1366-5545(99)00002-2.
[15] Article 1, (1992) Fund Convention, Republic of South Africa.
[16] Merchant Shipping Bill, Republic of South Africa. 2013.
[17] Article 3, International Convention on Civil Liability for Oil Pollution Damage, 1969.
[18] Article 949, International Maritime Organization Resolution, 2003.
[19] Oil Companies International Marine Forum Annual Report, 2014 Oil Pollution Act, 1990.
[20] Evolution of Canada Transportation, Transport Canada. 2009.
[21] Marine Pollution Bulletin, Congress of USA. 1990.

23
Proceedings International Conference on Innovation and
Management, Malaysia 2016
[22] Mansell, J. N. K. 2009. Flag State responsibility: Historical development and contemporary
issues. Flag State Responsibility: Historical Development and Contemporary Issues: 1–269.
http://doi.org/10.1007/978-3-540-92933-8
[23] Bill Shaw, Winslett, B. J., & Cross, F. B. 1987. The global environment: a proposal to
eliminate marine oil pollution. Natural Resources Journal, 27(1): 157–185.
[24] Frittelli, J. 2014. Shipping U. S. Crude Oil by Water: Vessel Flag Requirements and Safety Issues.
[25] William R. Gregory. 2012. Flag of Convenience: The Development of Open Registries in the
Global Maritime Business and Implications for Modern Seafarers.
[26] Merchant, T., & Act, S. 1927. Safety at Sea. Scientific American, 137(5): 407–408.
[27] Zwinge, T. 2011. Duties of Flag States to Implement and Enforce International Standards and
Regulations-And Measures to Counter Their Failure to Do So. J. Int’l Bus. & L., 10(2), 297.
[28] Port State Control; Bulletin of International Association of Dry Cargo Ship -owners, 2000.
[29] Lloyd Register, Revision Four, 08/05 ; Circulation of IACS.
[30] Christodoulou-Varotsi, I., & Pentsov, D. a. (2008). Maritime work law fundamentals:
Responsible shipowners, reliable seafarers. Maritime Work Law Fundamentals: Responsible
Shipowners, Reliable Seafarers. http://doi.org/10.1007/978-3-540- 72751-4
[31] Suter N. 2012. Qualitative Data, Analysis, and Design. Introduction to Educational Research: A
Critical Thinking Approach: 342 - 386.
[32] Rules of IACS: Journal of International Association of Classification Society, 2011.
[33] Rauta, D. 2004. California Land Commission, Prevention First 2004: 1–7.
[34] L. Lindfelt. 1991. The Underwriter's Perspective, The Society of Naval Architects and Marine
Engineers.
[35] D.J. Eyres, M.Sc., F.R.I.N.A. 2007. Ship Construction. 6th edition. Elsevier Ltd.
[36] Kanjilal, B. 2015. Enhanced Marine Oil Spill Response Regime for Southern British Columbia,
Canada. Aquatic Procedia, 3, 74–84. http://doi.org/10.1016/j.aqpro.2015.02.230.
[37] William, P., & Rcac, S. 2009. A Review of Double Hull Tanker Oil Spill Prevention
Considerations. December.
[38] Carolina, N., Chairman, V., Michel, R. K., & Corporation, H. E. (n.d.). 2001. Environmental
Performance of Tanker Designs in Collision and Grounding: Method for Comparison. Washington: Transportation Research Board Special Report 259.
[39] Calleya, J., Pawling, R., & Greig, a. (2015). Ship impact model for technical assessment and
selection of Carbon dioxide Reducing Technologies (CRTs). Ocean Engineering, 97: 82-89.
http://doi.org/10.1016/j.oceaneng.2014.12.014.
[40] Brown, R. S., & Savage, I. A. N. (1976). Maritime Policy and Management. Maritime
Policy & Management, 4(1): 1–1. http://doi.org/10.1080/03088837600000032. [41] Hoppe, H. (2005). Goal-Based Standards – A New Approach to the International Regulation of
Ship Construction. WMU Journal of Maritime Affairs. 4(2): 6–8.
http://doi.org/10.1007/BF03195072.
[42] International Maritime Organization, Circular Letter on GBS. 2010.
[43] Bureau VERITAS.2010. 28th: MTCC.
[44] Framework of GBS under IACS, the American Club. 2007.
[45] Peng, Y. U. E., Science, M. O. F., & Affairs, M. 2011. An Analysis of the Implementation and
Future Development of IMO Goal-Based Standards.
[46] Wendel. D 2012: What is on the regulatory agenda?
[47] Skjong, R. 2005. IMO MSC 80. Lunch Presentation May 12th, 2005 . 1: 1–22.
[48] Bulletin of International Ship and Offshore Structures Congress, (2009)
[49] Mom, N. (2009). Estimation of Ship Lightweight Reduction by Means of Application of
Sandwich Plate System. 123–128.

24
Proceedings International Conference on Innovation and
Management, Malaysia 2016
[50] Bulletin of JFE, 2011.
[51] The Nautical Institute. 2001. The Mariner's Role in Collecting Evidence.
[52] Wei, L., Hu, Z., Dong, L., & Zhao, W. 2015. A damage assessment model of oil spill accident
combining historical data and satellite remote sensing information: A case study in Penglai
19-3 oil spill accident of China. Marine Pollution Bulletin. 91(1): 258–271.
http://doi.org/10.1016/j.marpolbul.2014.11.036.
[53] Wu, W. J., & Jeng, D. J. F. 2012. Safety management documentation models for the maritime
labour convention, 2006. Asian Journal of Shipping and Logistics. 28(1): 41–66.
http://doi.org/10.1016/j.ajsl.2012.04.003.
[54] Bulletin of the Bahamas Maritime Authority. 2010.
[55] Journal of International Hydrographic Organization. 2010.
[56] Perez, H. M., Chang, R., Billings, R., & Kosub, T. L. 2009. Automatic Identification Systems (AIS)
Data Use in Marine Vessel Emission Estimation. Time, (Cmv). 1–25.
[57] Circular of IMO. 2002.
[58] Cabezas, P. R., & Kasoulides, G. 1988. International Maritime Organization. The International
Journal of Marine and Coastal Law. 3(3): 235–245. http://doi.org/10.1163/187529988X00184.
[59] Hosanee, N. M. 2010. A Critical Analysis of Flag State Studies Duties as Laid Down
Under Article 94 OF The basics to begin with ….Paris Memorandum of Understanding. 2005.

25
Proceedings International Conference on Innovation and
Management, Malaysia 2016
Do Social Media Enhance Students Performance? An Essential
Insight from Bayero University Kano, Nigeria
Aliyu Alhaji Abubakar1, Tasmin. R2, Nuhu Isah2, Che Rusuli, M.S3, Mudashir Gafar4 and Josu Takala5 1Bayero Business School, Bayero University Kano, Nigeria
2Department of Technology Management, Universiti Tun Hussein Onn Malaysia 3Faculty of Entrepreneurship and Business, Universiti Malaysia Kelantan Kampus kota
4Faculty of Environmental Design, Ahmadu Bello University Zaria, Nigeria 5Department of Production, University of Vassa, City of Vassa, Finland
([email protected]; [email protected]; [email protected]; [email protected];
[email protected]; [email protected])
Abstract The uses of social media have already changed the way people communicate with each other.
There is an ongoing debate regarding the integration of social media in education. Advocates of social
media usage point to the benefits of using social media for academic practice while critics are calling for
regulations and/or the removal of such online technologies in the classroom. Hence, this study examine
the relative importance of social media on academic performance and identify which, among the social
media has significant influence on students’ performance of Bayero University Kano and form a model
describing students’ performance. The study employed some hypotheses, in which the hypotheses were
tested using Structural Equation Modelling (SEM). “Facebook, YouTube, and WhatsApp” were the main
concerns reported by the respondents which influence students’ performance.
Key words: Facebook, WhatsApp, YouTube, education, students’ performance
1 Introduction Providing education and training to the masses on gigantic scale, for economic survival and to
meet the ever-changing requirements of the society and also to meet the individual’s special requirements
and tastes, is not possible through the conventional system of education based on brick-and-mortar
schools, colleges and universities. The social media is being used to improve communication ,
collaboration, sharing of resources, promoting active learning, and delivery of education in different
framework. Social media, which is a latest trend in knowledge creation, may be taken as a form of
instrument that will mediate the relations of students and lectures. In recent years, many of the universities
and educational institutions use Facebook, YouTube, and WhatsApp etc. for facilitating the lifelong
learning and to make this compatible with other educational management activities (Rana, & Lal, 2014,
Hauge, 2016).
2 Literature Review 2.1 Social media
Social media, derived from the social software movement, are a collection of Internet websites,
services, and practices that support collaboration, community building, participation, and sharing. As
defined by (Guy, 2012, Castells, 2015), “Social media are technologies that facilitate social interaction,
make possible collaboration, and enable deliberation across stakeholders. Social media can be generally
understood as Internet-based applications that carry consumer-generated content which encompasses
“media impressions created by consumers, typically informed by relevant experience, and archived or
shared online for easy access by other impressionable consumers”. Social media can be classified
according to two key dimensions: social presence / media richness and self-presentation / self-disclosure.
According to another classification social media can be grouped in two broad categories depending on
their main purpose, as a plat form where users express themselves by sharing text, video, picture, music,
26
Proceedings International Conference on Innovation and
Management, Malaysia 2016
or a means of collaboration where users share knowledge and content, in general, and work together for a
common goal (Guy, 2012, Imran, et al., 2015).
The use of social media has surged globally in recent years. A recent report from the Statista
(2016), as of the second quarter of 2016, Facebook had over 1.71 billion monthly active users, YouTube
have a total number of 3.25 billion hours watched each month and as of February 2016 WhatsApp
announced more than 1 billion monthly active users. Despite the popularity social media for personal use,
however, a low number of students in BUK use them for academic practice. As edu cators look for ways
to engage and motivate students, social media technologies are becoming a viable supplement to the
traditional learning environment (Olajide & Alao, 2015).
Hence, the purpose of this study is to examine the use of social media in BUK students. Specifically,
identify which, among the social media has significant influence on students’ performance of Bayero
University Kano and form a model describing students’ performance. Although, previous studies have
suggested that access to technology is inequitable and that students of developing countries are less likely
to use technology, and therefore, have fewer opportunities to use social media tools than those in the
develop countries. There is an ongoing debate regarding the integration of s ocial media in education.
Advocates of social media usage point to the benefits of using social media for academic practice while
critics are calling for regulations and/or the removal of such online technologies in the classroom (Guy,
2012, ACUTA, 2010).
2.2 Social Media Use by Students
Today’s college students are exposed to all types of technologies in many aspects of their lives
(Morreale et al., 2015). On a daily basis students used internet to actively engage in social networking,
text messaging, blogging, content sharing, online learning, and much more. Contemporary college
students have become habituated to a world where social media is the norm; thereby, as an educational
tool, social media enriches the learning experience by allowing students and instructors to exchange ideas,
foster collaboration and discussion, and engage and interact using such emerging social platforms outlines
several benefits to using social media in education (Mr, Rodney & Wakeham 2016). For example, social
media is an effective way to increase student engagement and build communication skills by allowing
students to feel more comfortable expressing themselves in a less intimidating environment. Social media
can also be used to improve communication between students and instructors, while the latter can answer
students’ questions, post homework assignments and lesson plans, send messages and updates, schedule
or announce upcoming events, and share Web sites and multimedia content (ACUTA, 2010).
Despite the aforementioned benefits of social media, some critics’ where of the view that there
are serious risks for using social media in the classroom, because social media technologies are neither
appropriate nor successful vehicles for teaching and learning activities. For example, Facebook and
Twitter divert students’ attention from classroom participation and ultimately are disruptive to the learning
process. Also, social networking sites provide ways for students and lectures to connect; there is a concern
that students are missing valuable lessons in real-life social skills (Guy, 2012).
While the debate continues regarding the pros and cons of using social media for academic
practice, no one can argue the influence that social networking has on today's students (Jeske & Shultz,
2016). Meaning that, finding a middle ground has become a challenge. Thus, social media is consider as
a plat form that will offer a unique opportunity to reform the relationship between students and lectures,
from the conventional way of knowledge sharing to the advance way of knowledge dissemination. As
documented in recent research, students are using these emerging technologies and platforms in all facets
of their daily lives, specifically social media (Dabbagh et al., 2015); yet, a low number of Bayero
University Kano (BUK) students’ users are engaging in such for academic practice (Olajide & Alao,
2015). Hence, the following hypotheses are developed based on the literature review discussed:
Ho1: There is a significant relationship between WhatsApp and social media in BUK.
Ho2: There is a significant relationship between Facebook and social media in BUK.

27
Proceedings International Conference on Innovation and
Management, Malaysia 2016
Ho3: There is a significant relationship between YouTube and social media in BUK.
Ho4: There is a significant relationship between social media and s tudents’ performance in BUK.
3 Methodologies and Data Collection: The survey instrument was developed based on literature review, while the variables included in
the study have been adapted from the existing literature. Data were collected through an on line
questionnaire from Bayero University Kano (BUK). Respondents were randomly chosen from the list of
students. The students’ sample was chosen because they are heavy users of social media in the campus
(Westerman et al., 2016).
Interestingly, 280 students filled up the questionnaires online, in which they were asked to state
their level of agreement with the series of statements, stated using a five-point Likert scale ranging from
“strongly disagree” to “strongly agree.”
4 Data Analysis and Results: Confirmatory factor analysis was conducted in the entire construct to determine the remaining
measures which indicated the validity, unidimensionality and reliability of the measurement model prior
to modelling the structural equation model. The measurement of correlation indicates the strength of the
relationship between the exogenous construct, mediating construct and endogenous construct.
Furthermore, the CFA’s of constructs produced a relatively good fit as indicated by the goodness of fit
indices as indicated in Figure 1. According to Zainudin (2012), the discriminate validity failed if the
correlations are above 0.85, while in this case all the correlations are below 0.85 as it can be seen from
Figure 1, meaning that discriminate validity is achieved. This means that the measuring items provide a
reliable measure of internal consistency. Since, factor loading are newly developed scales, the 0.5 or
higher is considered in this study.
Therefore, after removing the items with factor loading less than 0.5, there are four (4) items
usable to measure the significance of WhatsApp (WHATAPP) on social media, five (5) items to measure
the significance of YouTube (YOUTB) on social media and five (5) items to measure the significance of
social media (SCMD) on students performance, while items like Facebook (FCBOK), and students
performance (STPF) remains on change because the factor loadings are above 0.5 as it can be seen from
Figure 1.
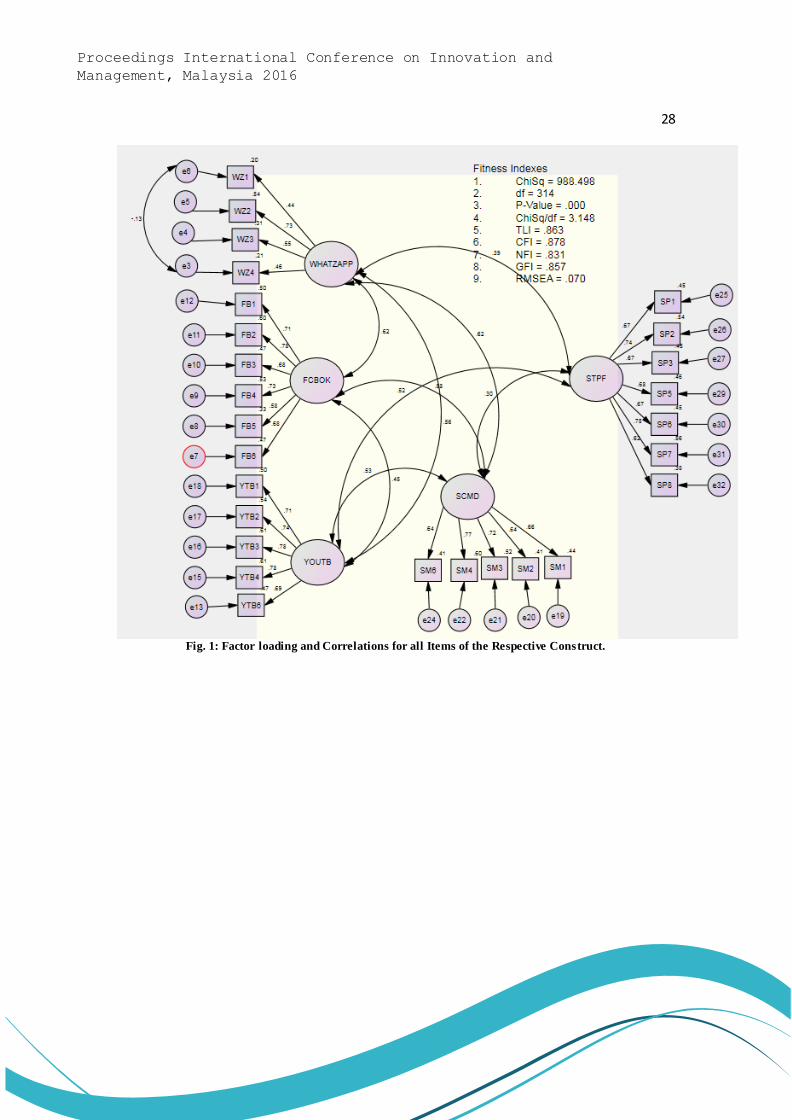
28
Proceedings International Conference on Innovation and
Management, Malaysia 2016
Fig. 1: Factor loading and Correlations for all Items of the Respective Construct.

29
Proceedings International Conference on Innovation and
Management, Malaysia 2016
Fig. 2: Standardized Factor Loading for Each Component of the conceptual Model
The values for the level of acceptance of fitness indexes assessment in Figure 2 shows that
CMIN/DF < 3, GFI is approaching < .89, CFI is approaching < .92, and RMSEA < 0.60, which are all
under the acceptable level (Zainudin, 2012). Therefore, the conceptual standardized model (Figure 2) is
considered as appropriate and has a good fit. The path analysis summary shows that the regression
coefficient of WhatsApp, Facebook and YouTube values on social media are significant for the sample,
where the p- value of social media is 0.00. Meaning that, WhatsApp, Facebook and YouTube factors are
significant predictors for students performance vie social media as the mediator of cu stomer service
delivery.
Table 1 show the goodness of fit of generated or re-specified structural model and it is better compared to
the hypothesized model.

30
Proceedings International Conference on Innovation and
Management, Malaysia 2016
Table 1: Hypothesis testing for the Casual Effect of the entire construct
All the hypotheses are supported, meaning that WhatsApp, Facebook and YouTube have a direct influence
on social media and by extension social media has an overall influence on students’ performance in BUK.
Thus, from the result of the hypothesis testing, the study has proven that all the hypothesis have strong
evidence of students’ performance vie social media as the mediator linking the relationship between social
media and students’ performance.
5 Conclusion The growing interest in social media has led educators to examine its use for academic practice.
As institutions of higher learning are challenged to enhance collaborative learning and community
building amongst students, the findings reveals that social media holds promise for academia. The study
reveals that BUK students have diverse perceptions and experiences with regard to social media
technologies. However, as new model is proposed, questions of who is accessing and using such
technologies will remain paramount if we are to be successful in utilizing social media for academic
practice in BUK. Therefore, specific indicators have emerged with respect to student use of social media
technologies. In addition, this study has revealed the use of social media by students for academic practice
is surpassed by its use for social engagement, direct communications, and relationship building.
As suggested by Rana, & Lal, (2014), providing education and training to the masses on gigantic
scale, for economic survival and to meet the ever-changing requirements of the society and also to meet
the individual’s special requirements and tastes, is not possible through the conventional system of
education based on brick-and-mortar schools, colleges and universities. Social media is apparently a plat
form that institutions can use to improve communication, collaboration, sharing of resources, promoting
active learning, and delivery of education in different framework.
References [1] ACUTA Report (2010), Social Media and Higher Education Literature Review [M]
[2] Castells, M. (2015). Networks of outrage and hope: Social movements in the Internet age [M]. John
Wiley & Sons.
[3] Dabbagh, N., Kitsantas, A., Al-Freih, M., & Fake, H. (2015). Using social media to develop personal
learning environments and self-regulated learning skills: a case study [J]. International Journal of
Social Media and Interactive Learning Environments, 3(3), 163-183.
[4] Gagnon, K., & Sabus, C. (2015). Professionalism in a digital age: opportunities and considerations for
using social media in health care [J]. Physical therapy, 95(3), 406-414.
[5] Guy, R. (2012). The use of social media for academic practice: A review of literature. Kentucky
Journal of Higher Education Policy and Practice [J], 1(2), 7.
[6] Hauge, T. E. (2016). On the Life of ICT and School Leadership in a Large-Scale Reform Movement.
In Digital Expectations and Experiences in Education [M] (pp. 97-115). Sense Publishers.

31
Proceedings International Conference on Innovation and
Management, Malaysia 2016
[7] Imran, Muhammad, Carlos Castillo, Fernando Diaz, and Sarah Vieweg (2015). "Processing social
media messages in mass emergency: A survey." ACM Computing Surveys (CSUR) [J] 47, no. 4 67.
[8] Jeske, D., & Shultz, K. S. (2016). Using social media content for screening in recruitment and
selection: pros and cons. Work, Employment & Society [J], 30(3), 535-546.
[9] Karakiza, M. (2015). The Impact of Social Media in the Public Sector [J]. Procedia-Social and
Behavioral Sciences, 175, 384-392.
[10] Kirschner, P. A., & Karpinski, A. C. (2010). Facebook® and academic performance. Computers in
human behaviour [J], 26(6), 1237-1245.
[11] Morreale, S., Staley, C., Stavrositu, C., & Krakowiak, M. (2015). First-Year College Students'
Attitudes toward Communication Technologies and Their Perceptions of Communication Competence
in the 21st Century. Communication Education [J], 64(1), 107-131.
[12] Mr, D., Rodney, G., & Wakeham Dr, M. (2016). Social Media Marketing Communications Effect on
Attitudes among Millennials in South Africa[J]. The African Journal Of Information Systems, 8(3), 2.
[13] Olajide, A. A., & Alao, A. V. (2015). Social Media Space Presence: A Review of Nigerian
Universities on Social Media Space [J]. In The African Symposium: an online journal of the African
Educational Research Network (Vol. 15, No. 1, pp. 98-106).
[14] Rana, H., & Lal, M. (2014). E-learning: Issues and challenges [J]. International Journal of Computer
Applications, 97(5).
[15] Statista [M] (2016). https://www.statista.com/statistics/264810/number-of-monthly-active-
facebook-users-worldwide/
[16] Zainudin, A., 2012. Structural Equation Modelling Using Amos Graphic[M], Uitm Press, University
Technology MARA, 40450 Shah Alam, Selangor Darul Ehsan, Malaysia .
[17] Westerman, D., Daniel, E. S., & Bowman, N. D. (2016). Learned risks and experienced rewards:
Exploring the potential sources of students' attitudes toward social media and face -to-face
communication [J]. The Internet and Higher Education , 31, 52-57.
32
Proceedings International Conference on Innovation and
Management, Malaysia 2016
The Nature of Innovation Support in Emerging Economies:
Implementation of a Technology Driven Policy Initiative in Malaysia
Dzulkifli Mukhtar
Faculty of Entrepreneurship and Business, University Malaysia Kelantan, 16100 Kota Bharu, Malaysia
(E-mail: [email protected])
Abstract Emerging economies have introduced a portfolio of policies to propel economic development.
Policies are acknowledged as powerful tools to promote industrialisation and economic diversification.
The feature of these policies are not only confined to established emerging economies but also mid-
ranking emerging economies like Malaysia. As the country moves towards a knowledge-based economy,
this study provides insight into how a policy comprising a financial initiative introduced by Malaysian
Government has been used to enhance capabilities of indigenous small and medium enterprises
particularly for innovation. This study is exploratory since it seeks to find out how firms developed and
enhanced their innovation capabilities in the presence of government policy. It identifies the
implementation of the financial initiative in particular is in line with the specific objectives of the policy
which is intended to support commercialisation of research outputs among indigenous small firms. This
study also found that this policy initiative tends to affect the latter end of the innovation process (i.e. in
particular in the exploitation phase) rather to the innovation process in general. This study contributes to
closing some of the gaps in research into public support for innovation and development of knowledge-
based economy within emerging economies. In particular it identifies the target group and impact of such
policy initiative, particularly in the context of policies designed to upgrade firm’s capacity to carry out
new product development process for high-technology products.
Key words Emerging economies, innovation, dynamic capabilities, case study.
1 Introduction The rapid economic growth achieved by emerging economies generated a huge amount of
research interest into the mechanism behind the economic take-off. The main contrast in the literature has
been the role of the government vs markets in catching-up development [6]. Scholars also provide
technology-based view that focuses on explaining how emerging economies have tried to catch up
technologically with developed economies [12]. Industries in advanced economies are at the frontier of
technological advancement. In this view, catching-up is considered as a question of relative speed in a
race involving a fixed multi-directional process [18]. Scholars also highlight that emerging economies do
not simply follow the technological development of advanced countries. They may create their own
individual path which is different from the developed economies.
While many appreciate the rapid economic growth achieved by emerging economies[37], there
has recently been concern that some countries have been more able than others to catch up technologically.
Scholars suggest that the success factor of these emerging economies is based on their ability to build and
develop their national innovative capacity. National innovative capacity refers to a country’s prospective
to produce a stream of commercially relevant innovations [25]. This capacity is not only confined to
production of new products or services, but also echoes the fundamental conditions, investments and
policy choices which create an environment for innovation.
In building up national innovative capacity, governments in emerging economies have
implemented a portfolio of strategies [15]. These strategies have produced different impacts and outcomes
within which strategies that include policy initiatives are also subject to divergence. However, the
implementation of technology-driven policy initiatives in emerging economies is often associated with
failure to achieve their objectives in terms of uplifting national innovative capacity. However, little is

33
Proceedings International Conference on Innovation and
Management, Malaysia 2016
known about what factors contribute to that failure [23]. This is an important insight which could be
brought to studies on implementation of policy initiatives, especially in regard to their screening and
monitoring process.
2 Literature review 2.1 Emerging economies and high-technology industrialisation
Research on economic development pays particular attention to regions or countries that were
able to position themselves as contributors to global wealth. It has been acknowledged that Western
economies1 are the frontiers of the world economy [29]. However, recent evidence suggests that the global
economy started to consider progress beyond the Western economies [29]. Countries from different
continents have emerged as new blocks of economies that have managed to achieve remarkable progress
in economic development. Hoskisson et al. [14] suggest that these economies could be known as emerging
economies.One explanation for the remarkable economic growth within the emerging economies is their
ability to make changes in the economic structure [21]. This was also the same successful recipe for
developed economies’ transition in the eighteenth and nineteenth centuries. However, the changes in
economic structure took place at a faster place within emerging economies out of necessity in order to
catch-up with more advanced economies of the West [8]. Amsden [3] argues one of the major reasons for
emerging economies to embark on manufacturing-led industrialisation is because the states’ intention to
catch-up with advanced economies by emulating their industrial composition through establishing
manufacturing activities that produce high-technology products such as electric and electronic goods.
Szirmai [29] supports Amsden’s proposition by affirming arguments on why manufacturing is essential
for economic development. Pisano and Shih [24] refine this argument based on the experience of the
American manufacturing sectors. They propose that the high-technology sectors is essential in innovation
process because it entails the importance of generating and utilisation of technology in the industry. This
strengthens Szirmai’s argument that high-technology industries is important for technology catching up
especially among emerging economies.
According to Atkinson and Ezell [4], emerging economies face a great challenge to promote
high-technology industrialisation. The aims of this type of industrialisation is different from ordinary
industrialisation that tries to introduce and promote manufacturing activities into emerging economies [2].
High technology industrialisation is a transition process from assembly -type manufacturing to high
technology manufacturing [2]. Nelson and Romer [22] describes this process as a transition from simple,
labour-intensive and low value-added industrial activities to those embodying more intensive use of
human capital and technology. In the context of emerging economies, policies for high -technology
industrialisation are targeting local firms to venture into high-technology sectors. Above all, high-
technology industrialisation does not only require governments’ commitment to encourage local firms to
utilise technology but also to support them to develop new technology into finished products or processes
[5]. For Smith [28], the process of developing new technologies and utilising them into products can be
regarded as an innovation process. Figure 1 illustrates the innovation process.
1 Szirmai (2012) describes the Western economies as countries in Europe and North America that have been promoted
manufacturing sectors as the main engine of accelerating economic growth since nineteen century such as Great Britain,
Germany, Russia and the United States.
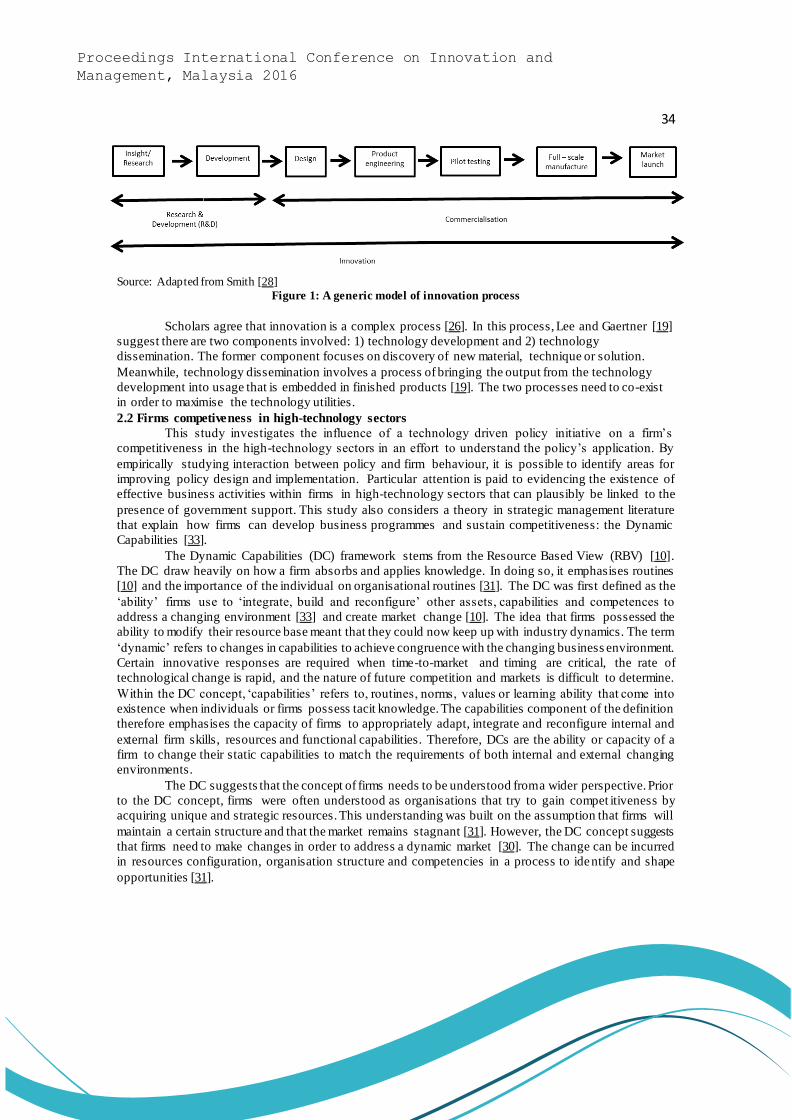
34
Proceedings International Conference on Innovation and
Management, Malaysia 2016
Source: Adapted from Smith [28]
Figure 1: A generic model of innovation process
Scholars agree that innovation is a complex process [26]. In this process, Lee and Gaertner [19]
suggest there are two components involved: 1) technology development and 2) technology
dissemination. The former component focuses on discovery of new material, technique or solution.
Meanwhile, technology dissemination involves a process of bringing the output from the technology
development into usage that is embedded in finished products [19]. The two processes need to co-exist
in order to maximise the technology utilities.
2.2 Firms competiveness in high-technology sectors
This study investigates the influence of a technology driven policy initiative on a firm’s
competitiveness in the high-technology sectors in an effort to understand the policy’s application. By
empirically studying interaction between policy and firm behaviour, it is possible to identify areas for
improving policy design and implementation. Particular attention is paid to evidencing the existence of
effective business activities within firms in high-technology sectors that can plausibly be linked to the
presence of government support. This study also considers a theory in strategic management literature
that explain how firms can develop business programmes and sustain competitiveness: the Dynamic
Capabilities [33].
The Dynamic Capabilities (DC) framework stems from the Resource Based View (RBV) [10].
The DC draw heavily on how a firm absorbs and applies knowledge. In doing so, it emphasises routines
[10] and the importance of the individual on organisational routines [31]. The DC was first defined as the
‘ability’ firms use to ‘integrate, build and reconfigure’ other assets, capabilities and competences to
address a changing environment [33] and create market change [10]. The idea that firms possessed the
ability to modify their resource base meant that they could now keep up with industry dynamics. The term
‘dynamic’ refers to changes in capabilities to achieve congruence with the changing business environment.
Certain innovative responses are required when time-to-market and timing are critical, the rate of
technological change is rapid, and the nature of future competition and markets is difficult to determine.
Within the DC concept, ‘capabilities’ refers to, routines, norms, values or learning ability that come into
existence when individuals or firms possess tacit knowledge. The capabilities component of the definition
therefore emphasises the capacity of firms to appropriately adapt, integrate and reconfigure internal and
external firm skills, resources and functional capabilities. Therefore, DCs are the ability or capacity of a
firm to change their static capabilities to match the requirements of both internal and external changing
environments.
The DC suggests that the concept of firms needs to be understood from a wider perspective. Prior
to the DC concept, firms were often understood as organisations that try to gain compet itiveness by
acquiring unique and strategic resources. This understanding was built on the assumption that firms will
maintain a certain structure and that the market remains stagnant [31]. However, the DC concept suggests
that firms need to make changes in order to address a dynamic market [30]. The change can be incurred
in resources configuration, organisation structure and competencies in a process to identify and shape
opportunities [31].

35
Proceedings International Conference on Innovation and
Management, Malaysia 2016
A major argument underlines by DC theory concerns the importance of recognising firms’ ability
to execute activities as evidence that they have been utilising resources. This view is applicable to
government initiatives to develop new industries because most external interventions, s uch as government
support programs exist as resources for the firms. It becomes more prevalent when the support program
is meant for a specific purpose and has been implemented in a common mechanism such as financial
assistance. The interaction between the supplied resources through that programme demands that firms
execute an array of activities. For some scholars, most activities carried out by firms can be categorised
as DC. However, Easterby-Smith et al. [9] argue against this idea by suggesting that only specific activities
to accommodate opportunities can be considered relevant to the DC framework. Teece [32] addresses the
discussion of the sort of activities that should appear in the DC theory by suggesting that firms’ activities
can be divided into three elements: 1) identification and assessment of opportunities (sensing); 2)
mobilisation of resources to address an opportunity and capture value from doing so (seizing); and 3)
continued renewal (transforming). Each of the clusters has been embodied by a portfolio of sub -processes
that essentially try to create and capture value from opportunities.
The elements include manufacturing activities that are crucial for production of tan gible
products. The manufacturing activities allow firms to address their external environment such as products
regulation through safety testing and customer demand by getting the customers’ feedback. The main
principle is to highlight the importance of transforming static organisational capabilities or creating new
ones to meet changes in the environment. In fact, both areas of DC and industrial economics try to study
ways firms can be more competitive by promoting innovation in the economy. Apart from th is, the DC
framework tries to study innovation in a context of strategic management by connecting innovation with
competitive advantage. In strategic management, innovation is considered as a multifaceted capacity (1)
to sense and shape opportunities and threats, (2) to seize opportunities, and (3) to maintain competitiveness
through enhancing, combining, protecting and reconfiguring firms’ resources [31]. It may involve probing
and re-probing customer needs and technological possibilities. Each activity demands that firms have the
ability to understand latent demand, industry structure and market. Indeed, innovation itself is a dynamic
process because being able to bring invention to the markets requires a different configuration in each
activities, in research, manufacturing and marketing activities. In other words, each activity need to be
progressive which requires a combination of resources and capabilities to respond to changes in external
environments.
This study adapts the DC and at the same time modifies the RBV. The main rationale because in
emerging economies context, Government perceive in order to improve firms’ innovation performance,
they need to invest more in R&D activities. The Malaysian Government has been dependent on industrial
policies to promote innovation but often policy makers do not have a clear idea how these policies work
within firms. Therefore, investment in R&D is very blunt instrument and probably not effective. In fact,
this investigation needs some sort of concept or construct to explain this phenomenon. The RBV provides
internal perspective of innovating firms where they try to consider internal and external factors of
innovating firms. In that case, DC is a much better way of looking at how to improve innovation. The
main argument of DC is firms can spend a lot money (especially in emerging economies) but if they do
not have capabilities to actually use what R&D is producing, there will be no innovation. Therefore, DC
is relevant in this particular context because it promotes the understanding of firms’ capabilities to execute
tasks within innovation process. Besides that, DC also is a concept that just not only focus on one
capability but a number of capabilities. Some of these capabilities are in R&D and some are related to
other activities such as manufacturing and marketing. This means that it is just not R&D capabilities
needed to improve innovation but there are other capabilities (i.e. production and selling capabilities) that
play a crucial part. These capabilities interact and work together. In short, DC has the underpinnings of a
strong theory. First it can show causality as several studies show how dynamic capabilities can cause a
firm to have more innovative capacity [34]. Second, it is measureable because it can be measured through
36
Proceedings International Conference on Innovation and
Management, Malaysia 2016
learning outcomes and technological innovation performances such as new products, sales performance,
market share and employment. Indeed, some of the understanding on how capabilities have changed could
be obtained from econometric analysis. It means that most of the understanding could be gained once
researchers get inside firms. This perspective leads to case study approach.
3 Methodology The focus of this research is an in-depth study of a biotechnology firm. The firm is known as Bio
1, is one of the recipients of financial assistance from Malaysian Government. Using a single but in -depth
case study provides a scope for investigation, which Yin [38] notes is one of the benefits of using case
studies as a research design. Case studies are especially appropriate in research in which the objective is
to examine social phenomena that are complex [38]. Innovation and the process of developing firms
innovativeness are interrelated fields that are individually complex. Innovation process is often evolved
and case studies are seen as a way to capture it. Case study approach also offer opportunities to look inside
the firms and at their practices in particular. It is hard to pick this up from using surveys (questionnaires).
Case study design also enables the researcher to look at the bigger picture. Besides that, case stu dy also
favours for the researcher to have a bit of contact with firms over a period of time which facilities multiple
data collection techniques (i.e. interviews, archival data and observation). These techniques will give and
in-depth and detailed picture of firms’ practices and what they do for innovation. From here, the researcher
could interpret why the firm operates in these ways.
This study employs triangulation technique which involves the application of several methods to
collect data from different sources. Saunders et al. [27] suggest the use of two or more independent sources
of data or data-collection methods within one study is useful to ensure that the data could produce a more
complete portrait of the situation. The primary data source is interview transcriptions and it is triangulated
by the use of documentary and observation narrative. This technique provides a better represen tation and
consistent insight of what actually happened in the firms as the data sources corroborated with each other.
It also enables the strengths and weaknesses of the various methods to be counterbalanced and a more
holistic picture of organisational environment to be developed.
4 Case study Bio 1 was originally incorporated as a start-up firm in 1996 by a scientist, Miss Ht. The firm has
been operating in a promoted industry: biotechnology. The Malaysian Government has identified
biotechnology as one of the core technologies to accelerate the transformation of Malaysia into a
knowledge-based economy and an industrialised nation by 2020. The firm sought to become a product
development company that is capable of manufacturing products for sustainable plantation (mainly oil
palm and paddy plantations) and other agriculture activities. The firm’s products have been developed
based on applications of microbes as fertilisation and decomposition agent aimed at improving crop
productivity, land rehabilitation and soil fertility. Bio 1 has been dependent on R&D capabilities in its
products’ development. In fact, its first product (a bio-fertiliser marketed as MYCOgold) was developed
from research on Mycrorrhizae2. The fungus’ applications remain the firm’s core source of technology
and have provided the central path for the firm’s research and development (R&D) and all its strategic
direction. To date, almost all of Bio 1’s products have been dedicated to these applications.
The firm’s route in innovation has been dependent on its amplification of scientific discovery
and technological breakthrough. This recruitment practice has been continuing in the expansion stage. It
has allowed the firm to have a pool of qualified personnel in interrelated disciplines. The firm’s executive
personnel comprise of universities graduates. They hold Bachelor of Science and qualified as biologist,
2 Mycrorrhizae refers to a group of fungus which forms a mutually beneficial relationship with plants. These fungi grow either inside
of a plant’s roots or attach to the surface of roots.
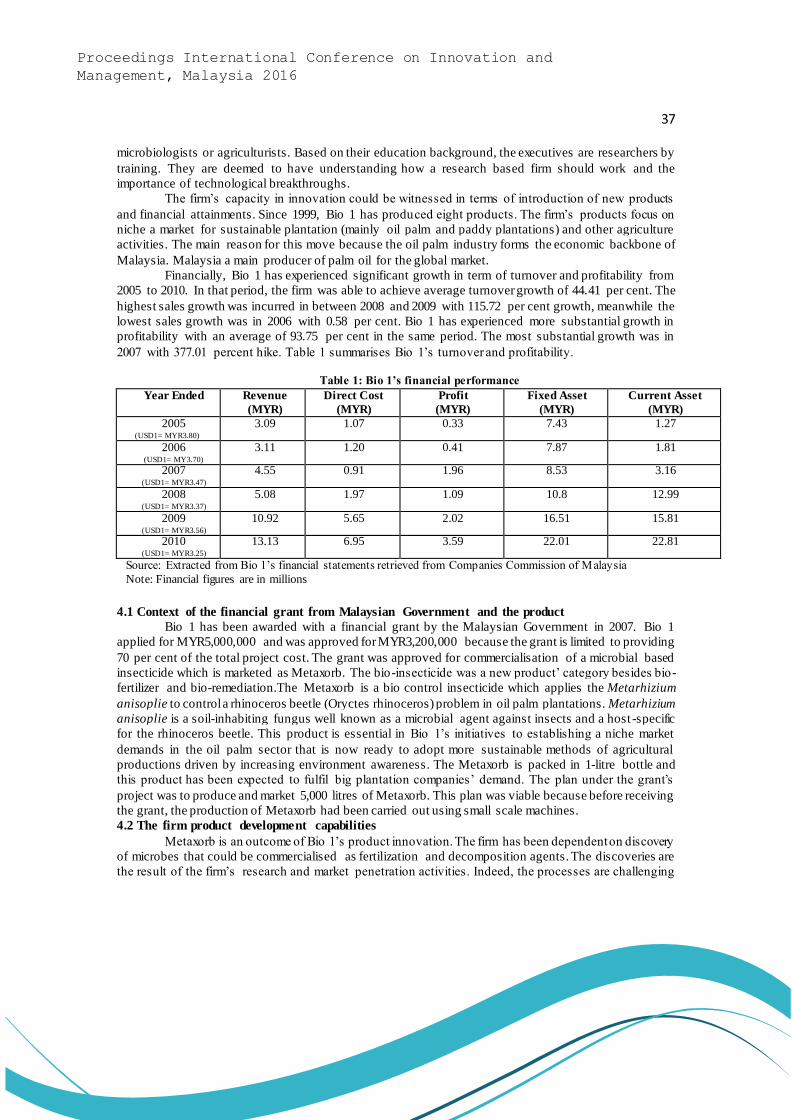
37
Proceedings International Conference on Innovation and
Management, Malaysia 2016
microbiologists or agriculturists. Based on their education background, the executives are researchers by
training. They are deemed to have understanding how a research based firm should work and the
importance of technological breakthroughs.
The firm’s capacity in innovation could be witnessed in terms of introduction of new products
and financial attainments. Since 1999, Bio 1 has produced eight products. The firm’s products focus on
niche a market for sustainable plantation (mainly oil palm and paddy plantations) and other agriculture
activities. The main reason for this move because the oil palm industry forms the economic backbone of
Malaysia. Malaysia a main producer of palm oil for the global market.
Financially, Bio 1 has experienced significant growth in term of turnover and profitability from
2005 to 2010. In that period, the firm was able to achieve average turnover growth of 44.41 per cent. The
highest sales growth was incurred in between 2008 and 2009 with 115.72 per cent growth, meanwhile the
lowest sales growth was in 2006 with 0.58 per cent. Bio 1 has experienced more substantial growth in
profitability with an average of 93.75 per cent in the same period. The most substantial growth was in
2007 with 377.01 percent hike. Table 1 summarises Bio 1’s turnover and profitability.
Table 1: Bio 1’s financial performance
Year Ended Revenue
(MYR)
Direct Cost
(MYR)
Profit
(MYR)
Fixed Asset
(MYR)
Current Asset
(MYR)
2005 (USD1= MYR3.80)
3.09 1.07 0.33 7.43 1.27
2006 (USD1= MY3.70)
3.11 1.20 0.41 7.87 1.81
2007 (USD1= MYR3.47)
4.55 0.91 1.96 8.53 3.16
2008 (USD1= MYR3.37)
5.08 1.97 1.09 10.8 12.99
2009 (USD1= MYR3.56)
10.92 5.65 2.02 16.51 15.81
2010 (USD1= MYR3.25)
13.13 6.95 3.59 22.01 22.81
Source: Extracted from Bio 1’s financial statements retrieved from Companies Commission of Malaysia
Note: Financial figures are in millions
4.1 Context of the financial grant from Malaysian Government and the product
Bio 1 has been awarded with a financial grant by the Malaysian Government in 2007. Bio 1
applied for MYR5,000,000 and was approved for MYR3,200,000 because the grant is limited to providing
70 per cent of the total project cost. The grant was approved for commercialisation of a microbial based
insecticide which is marketed as Metaxorb. The bio-insecticide was a new product’ category besides bio-
fertilizer and bio-remediation.The Metaxorb is a bio control insecticide which applies the Metarhizium
anisoplie to control a rhinoceros beetle (Oryctes rhinoceros) problem in oil palm plantations. Metarhizium
anisoplie is a soil-inhabiting fungus well known as a microbial agent against insects and a host -specific
for the rhinoceros beetle. This product is essential in Bio 1’s initiatives to establishing a niche market
demands in the oil palm sector that is now ready to adopt more sustainable methods of agricultural
productions driven by increasing environment awareness. The Metaxorb is packed in 1-litre bottle and
this product has been expected to fulfil big plantation companies’ demand. The plan under the grant’s
project was to produce and market 5,000 litres of Metaxorb. This plan was viable because before receiving
the grant, the production of Metaxorb had been carried out using small scale machines.
4.2 The firm product development capabilities
Metaxorb is an outcome of Bio 1’s product innovation. The firm has been dependent on discovery
of microbes that could be commercialised as fertilization and decomposition agents. The discoveries are
the result of the firm’s research and market penetration activities. Indeed, the processes are challenging

38
Proceedings International Conference on Innovation and
Management, Malaysia 2016
and time-consuming. Although the development of Metaxorb started in 2004, the firm’s capabilities in
products development have been building up since 1998. At that time, the firm was starting to develop its
first product by making improvement to technology acquired from a university. In that stage, the academic
research was enhanced based on the executives’ basic research that Myhorrhiza has been tested
empirically on vegetable plants. There was no research guidance except the fundamental technology from
a local university.
The experience with their first product has convinced Bio 1 to amplify scient ific discovery and
technological breakthrough. This process is segregated into two sections: 1) discovery of new microbes
and 2) finding quadrupling techniques for microbes’ enrichment. However, developing a new bio-based
agriculture products proved difficult. The firm has been dependent on processes related to identifying and
integrating innovations. This process meant exploration phase of the innovation process. The executives
initiated this process by scouring journals to look for scientific opportunities in term of new potential
microbes. Their qualification proved applicable in this process. However, the empirical works within the
academic literature are limited to certain plants only. This restricts the application of the scientific
discoveries (i.e. potentially beneficial microbes). In Bio 1’s case, the firm is interested in
commercialisation of Mycorrhiza. However, the empirical works in universities does not firmly discuss
which plants are suitable for Mycorrhiza. Bio 1 perceives this as more general application of the fungus.
Therefore, the firm decided to expand their research work into field testing to determine the Mychorrhiza’s
applicability.
In the initial stage, field testing was carried out based on the executives’ basic research
knowledge that Myhorrhiza has been tested on vegetable plants. There was no research guidance except
the fundamental technology from a university. The first field testing was carried out on oil palm and rubber
seedlings. The seedlings are owned by Bio 1’s prospective customers. The result from the field testing
suggested that oil palm and rubber plants are compatible with Myhorrhiza.
The firm is also deemed to have significant experience and proper facilities for manufacturing.
From its inception, the firm has carried out the manufacturing activities on its own. There were no
outsourced activities. This arrangement has facilitated production of eight products within ten years of
operation. On average, Bio 1 spent between two to four years before a product could be sold on the market.
For example, the development of Metaxorb was started in 2004 and was officially launched in 2008. The
development of Metaxorb was expected to have taken a longer period because it is a totally new products.
The firm’s research capabilities are essential in the product formulation. The main outcome was
the product sample (i.e. prototype). At that time the firm did not have any production facilities except to
run the production activities at laboratory scale. Indeed, the production scale in o ne of the obstacles for
Bio 1 in the product development. It became more apparent when the firm did not have an allocated budget
for designated production line. Still, the firm perceived the needs to upgrade the production capacity from
laboratory scale to industrial scale.
The fund from the grant has been used to acquire new machines that lead to the firm’s capacity
upgrading. Before that, for example, the old autoclave for grooming the fungus (i.e. the Metarhizium
anisoplie) could only cater for 50 samples. Certain processes were even performed manually. The firm
has recognised this as its weakness because the production line generated limited output, hence limiting
the firm’s production capacity. The newly acquired autoclave can accommodate 200 samples. In this case,
the grant has increased Bio 1’s investment capacity and manufacturing capability. However, under the
grant’s arrangement, a recipient needs to have incurred expenses before the remaining 70 per cent will be
disbursed on a claimed basis. However, Bio 1 did not have any allocated budget. As an option, Bio 1
decided to approach SME Bank3 for a loan to cover 90 per cent initial outlay to acquire that machine. Bio
1 also made an initiative to renegotiate the terms of grant with the Government pays upfront 10 per cent
3 SME Bank is a full-fledged financial institution for nurturing SMEs excellence in Malaysia.

39
Proceedings International Conference on Innovation and
Management, Malaysia 2016
outlay. Then after Bio 1 took the delivery of that machines, the firm made the reimbursement application
and used that money to pay out the loan from SME Bank. This occurrence is illustrated by Figure 2.
Figure 2: Grant’s application in Bio 1
The grant had facilitated the initial outlay of Metaxorb’s production capital expenditure. From
this initial process, Bio 1 was able to acquire additional machines via reimbursements until the grant has
been fully reimbursed in 2011. However, the partial grant term required Bio 1 needed to be creative in
administering the grant and production. This induced a notion that the grant is working but not as
positively as expected. Firstly, the work of grant through the evaluative session helped Bio 1 in the
production planning. Secondly, the firm needed to list machines needed for production of Metaxorb.
The comment explains that the firm needed to prioritise because the grants disbursements were
by each machine. Secondly, the machines reduce Bio 1 dependency on manual worker as the production
technique became more automated. Each stage of production activities has taken less time. However, Bio
1 needed to face a bigger challenge in terms of manufacturing. The automated system required each
machines to be working well. However, this has been not always the case. In order to avoid this, the
machines need to meet a costly maintenance schedule. The maintenance is not only costly but also
increases the production idle time thereby increasing the overhead cos t.
By focusing on big plantation companies, Bio 1 needed to adopt different approaches especially
in getting in touch with customer for sales purposes. Sales were initiated by directly approaching
plantations and estates. However, this sales approach was less effective because any decision is subject to
plantation managers’ discretion. The managers converged in a special group known as planters. Based on
these circumstances, Bio 1’s personnel needed to join the planters group. During their monthly events,
planters discuss their plantation problem and Bio 1 has benefited from this in terms of recognising unmet
needs of their customer. Bio 1 also tries to maintain good relationships with planters by sponsoring
souvenirs. However, the main challenge is about overcoming competition from chemical products. Bio 1’s
approach is about not directly rejecting chemical product, but instead introducing gradually substitution
technique to customers. This sales technique requires Bio 1 to convince the customer to use their existing
chemical up to certain threshold level and then start to use Bio 1’s product. Most of the advice is derived
from Bio 1 laboratory and field works.
In this regard, the big plantations’ demands have a large bearing on the firm’s strategic path in
term of demand for its products’ innovation. However, this perceived demand did not guarantee market
acceptance. Bio 1 needed to dedicate substantial resources to gaining access and acceptance among
plantation companies. Based on their operation scale, the big plantation companies might have demanded
large quantities of bio-based products. It means that, Bio 1 could have received large orders from their
customers. However, this move created challenges for Bio 1. The plantation companies required product

40
Proceedings International Conference on Innovation and
Management, Malaysia 2016
quality control and requested reliable data on product application. The main reason was that Bio 1 did not
have experience in plantation and its products were new to the market.
5 Case Analysis and Discussion 5.1 Policy implementation
There was a lot of speculation about whether policies could be used to enhance local firms’
technological capacity [17]. This assertion is also applicable to the grant because it is a major policy
initiative to facilitate innovation by ensuring research and discovery will reach the market. In Weiss’s
work [36], he suggests that governments have to put significant efforts into the refinement of policies to
make them more rigorous. This means policy documents need to explain clearly the objectives, aims and
implementation mechanisms. This improvement is essential to minimising risk of a policy failure [36].
The case studies presented here establish that the grant has been well managed by the Government. The
evidence shows that the firm was convinced that grant’s funding is meant for upgrading their ability to
proceed with a new product development (NPD) process although the firms anticipated other challenges
in innovation projects.
Prior studies also highlight that undertaking innovation projects is challenging and thus often
associated with firms’ failure to complete that projects [23]. For some researchers, failure to complete
innovation projects is influenced by factors that are linked to products and markets [11]. These general
findings were adopted by other scholars as the basis of an argument for government support for innovation
projects. In this sense, past evidence seems to suggest that within government policy initiatives in
particular fiscal initiatives (i.e. where money goes to firms), there is a tendency for innovation projects to
never be completed. This study shows more positive outcome for fiscal policy in terms of project
completion. The firm was able to complete the innovation projects under the grant. This suggests that the
grant has been implemented in an effective and prudent manner. Firstly, the grant is a partial grant; firms
was only being approved for 70 per cent of the total the project cost although the maximum funding is
MYR4 million (USD1=MYR3.30). Therefore, the firms needed to come up with the remaining 30 percent
of the project cost in form of cash. This is the grant’s major requirement. This finding implicitly concurs
with a study by Hobday and Rush [13] that looks into initiatives by another government (i.e. Government
of Thailand) in emerging economies to uplift local firms’ technological capabilities. Hobday and Rush’s
work shows that government policies show best results when directed towards firms that have a positive
attitude and commitment towards self-funding aspect of a designated innovation project. Otherwise the
risk of failure will be relatively high. Furthermore, a study by Cooper [7] showed that the matching grant
structure can be considered as fund improvement. This is because programmes to support innova tion
projects are typically seen too generous and carry a bad reputation of being non -selective. This might
expose firms for not being accountable for their designated projects.
The above finding also corroborates the views of Hsu and Chiang [15] whose study looks into
government efforts in another emerging economy (i.e. Taiwan) to support R&D activities for the
advancement of domestic industrial technology. An element shared by the context of both studies is that
firms participating in sponsored innovation projects are expected to contribute required resources, such as
manpower. Unlike the present study, Hsu and Chiang’s study appears not to have explored the issue of
financial commitment in terms of cash required from participating firms in sponsored innovation projects.
Conversely, the findings of this study shows that the Malaysian Government establishes clear guidelines
for 30 per cent financial commitment from the firms.
5.2 Target firm
Studies have established that innovation projects are best carried out by an appropriate group of
firms [26, 35]. For Rasmussen [26] who looks at the Canadian Government’s support for universities to
commercialise research outputs found that the most suitable candidate is spin-off firms. This is relevant
for initiatives involving direct financial support like the grant due to the possibility of miss -targeting [16].
41
Proceedings International Conference on Innovation and
Management, Malaysia 2016
In this sense, the findings of this study support an argument in previous studies that suggests innovation
support programmes should target specific groups. Indeed, evidence from the case study established that
the grant has targeted and reached a specific firm: small, indigenous and high -technology firms. The firm
is also still in operation with some of them becoming fairly profitable.
The findings of this study also suggest that selecting the appropriate target group might be the
decisive element (i.e. small high technology firms) in innovation projects. In reflecting upon the
importance of small high technology firms, this finding lends some support to the study by Hobday and
Rush [13] that suggests only a small fraction of small firms innovate although in a general sense small
firms are more receptive to change compared to large firms. This means that there is certainly a type of
small and medium sized firms but does not necessarily mean all small firms are high-technology firms.
At this point, one primary reason that small firms were seen as the main beneficiaries of this policy
initiative because they appear to be underdeveloped in the context of emerging economies like
Malaysia [2]. Besides that, small firms made up the majority of local firms in high technology sectors and
this factor motivates Malaysian Government to support them. In addition, due to their flat organisational
structure small high technology firms have the required flexibility to deal with technological changes
while fulfilling customer needs.
The case study suggests that the grant has targeted the exploitation phase of the innovation
process as it emphasises manufacturing activities because for the firm, manufacturing is the bottleneck in
commercialisation of research. This is the direct impact of the grant and this study trying to show that the
programme is doing what it supposed to do. In this sense, the programme seems to be efficient. However,
this study also highlights that firms also encounter needs other than those addressed by the grant. This
condition could be explained by the provision in which grant is not targeting at the most serious problems
constraining firms that try to carry out innovation activities.
5.3 Impact
In government efforts to support innovation, the target group (i.e. local firms) are expected to
experience improvement in their resources and also their ability to carry out a NPD process. More
importantly this process entails the firm’s ability to utilise resources and translate them into a set of
capabilities. This study shows evidence that the firm’s has experienced improvement in capabilities that
are closely related to the innovation process. It means that the firm is better at doing innovat ion and these
capabilities are being part of the organisation. Most of the improved capabilities are not in research
development (i.e. exploration phase of innovation process) but in capabilities applicable to the exploitation
phase of innovation process. This finding implicitly concurs with a study by McKelvie and Davidsson
[20] which has also established the same relationship. However, McKelvie and Davidsson propose a
relationship based on discrete capabilities that could be considered independently. Instead, this study
identifies the influence of resources to interrelated capabilities to bring high technology products into
market. This means, capabilities in the exploitation phase are made up of reciprocal activities such as
production, selling and NPD activities.
This is consistent with a study by Aldridge and Audretsch [1] that looks at applicability of a R&D
fund to innovation projects. However, their findings were rather focused on measuring innovation in terms
of spending on research activities that eventually produce intellectual properties such as patents. Thus, the
findings of this study complement Aldridge and Audretch’s work by highlighting that the key innovation
capabilities reside in manufacturing activities, as this seems to be critical for exploitation of the innovation
potential. The main rationale for this occasion is that the firm is a high-technology SME. The firm is
deemed to have significant research capacities because it is being being managed by technical personnel
(i.e. scientist). Yet, the firm is lacking of production facilities, which influences their manufacturing
capacities in terms of scale and scope. Now, the firm is able to manufacture products at industrial scale
and differentiate them as well.
42
Proceedings International Conference on Innovation and
Management, Malaysia 2016
The impact of the grant funding on firms’ innovation process reflects the desirable outcomes of
the programme despite government support initiatives have been extensively scrutinised by researchers
[16]. The main argument of Kaufman and Todtling [16] is on inability for that type of support to reach its
target; in this case producing innovation. The findings of this study suggest that the grant has been
targeting at innovation projects and it has been contributing to firms essentially p roducing innovation.
Therefore, the firm is able to upgrade their innovation capabilities because it has used the grant funding
to improve, enhance and upgrade their innovation capabilities. It means that firms are more capable of
commercialising research as the result of direct usage of the grant’s funding. Innovation within the firms
produced new high technology products. The impacts also explicate the context of the grant within firms ’
innovation process as the grant has been involved in the later part o f innovation process. This possibility
reflects the purpose of Malaysian Government policies to facilitate innovation amongst local firms.
6 Conclusion This study highlights the application of technology driven growth strategies and thus contributes
to knowledge about the effectiveness of this policy (i.e. technological upgrading type of policy). In most
of strategic management literature, inward looking aspects such as firm strategies, firm activities,
managerial competencies and possession of strategic assets have emerged as common competitiveness
factors [32]. This study suggests in the context of policies for technological upgrading, firms are
recommended to develop capabilities that allow them to utilise resources in order to address changing
environment [9]. The main argument of dynamic capabilities is firms in emerging economies can spend a
lot of resources but if they do not have capabilities to utilise the R&D outputs, there will be limited
innovation. This means, firms should have capabilities execute tasks within innovation process.
From the larger context of Malaysia’s innovation policy, this study highlights the challenges of
commercialisation of research in emerging economies. A particular innovation sup port programme like
the grant gives priority to certain stages of commercialisation process, which in this case, is the
exploitation phase of the innovation process (i.e. targeted for full scale manufacturing and product market
launching). Those activities in the exploitation phase, particularly at the latter part of it, received a lot of
emphasis since firms are inclined to buy equipment and machines. However, the firm also need to give
considerable attention to marketing and other elements of NPD [28]. In summary, the evidence from the
case study, confirms that the Malaysian Government’s grant programme is effective in enabling small and
indigenous technology-based firms to modify and extend their resources. This has extended firms’ ability
to successfully undertake activities within the innovation process. The firms’ ability to undertake
innovation projects is more applicable in the exploitation phase of the innovation process rather than
earlier phase of exploration (i.e. R&D related activities). This programme has enabled the firm to
undertake commercialisation activities relevant to the market that it is trying to address more effectively
compared to the absence of the grant. As a result, there is compelling evidence to sugges t the grant scheme
has contributed significantly to raising the innovation capacity of small indigenous and start -up
technology based firms. In this process, it has met the aims of technology-driven growth strategies of an
emerging economy like Malaysia.
References [1] Aldridge, T. and D.B. Audretsch, Does policy influence the commercialization route?. Evidence
from National Institutes of Health funded scientists. Research Policy, 2010. 39(5): p. 583-588.
[2] Ali, A., Malaysia's industrialization. The quest for technology. 1992, Singapore: Oxford University
Press.
[3] Amsden, A.H., The rise of "The Rest". Challenges to the West from late-industrializing economies.
2001, New York: Oxford University Press.
[4] Atkinson, R.D. and S.J. Ezell, Innovation economics: The race for global advantage . 2012, New
43
Proceedings International Conference on Innovation and
Management, Malaysia 2016
Haven: Yale University Press.
[5] Blanes, J.V. and I. Busom, Who participates in R&D subsidy programs?. The case of Spanish
manufacturing firms. Research Policy, 2004. 33(10): p. 1459-1476.
[6] Chang, H.-J., The economic theory of the developmental state, in The developmental state, M.
Woo-Cumings, Editor. 1999, Cornell University Press: Ithaca and London. p. 182-199.
[7] Cooper, R.S., Purpose and performance of Small Business Innovation Research (SBIR) program.
Small Business Economics, 2003. 20(2): p. 137-151.
[8] Dowling, M., Industrialization in Asia: A tale of two regions. Journal of Asian Economics, 1997.
8(2): p. 295-313.
[9] Easterby-Smith, M., M.A. Lyles, and M.A. Peteraf, Dynamic capabilities: Current debates and
future directions. British Journal of Management, 2009. 20(March): p. S1-S8.
[10] Eisenhardt, K.M. and J.A. Martin, Dynamic capabilities: What they are? Strategic Management
Journal, 2000. 21(October-November Special Issue): p. 1105-1121.
[11] Gurdon, M.A. and K.J. Samsom, A longitudinal study of success and failure among scientist -started
ventures. Technovation, 2010. 30: p. 207-214.
[12] Hobday, M., Firm level innovation models: Perspective on research in developed and developing
countries. Technology Analysis & Strategic Management, 2005. 17(2): p. 121-146.
[13] Hobday, M. and H. Rush, Upgrading the technological capabilities of foreign transnational
subsidiaries in developing countries: The case of electronics in Thailand. Research Policy, 2007.
36(9): p. 1335-1356.
[14] Hoskisson, R.E., et al., Strategy in emerging economies. The Academy of Management Journal,
2000. 43(3): p. 249-267.
[15] Hsu, C.-W. and H.-C. Chiang, The Government strategy for upgrading of industrial technology in
Taiwan. Technovation, 2001. 21(2): p. 123-132.
[16] Kaufmann, A. and F. Todtling, How effective is innovation support for SMEs?. An analysis of the
region of Upper Austria. Technovation, 2002. 22(3): p. 147-159.
[17] Kim, L. and R.R. Nelson, Introduction, in Technology, learning & inovation. Experiences of newly
industrializing economies., L. Kim and R.R. Nelson, Editors. 2000, Cambridge University Press:
Cambridge, United Kingdom. p. 1-12.
[18] Lee, K. and C. Lim, Technological regimes, catching-up and leapfrogging: Findings from the
Korean industries. Research Policy, 2001. 30(3): p. 459-483.
[19] Lee, Y. and R. Gaertner, Technology transfer from university to industry: A large-scale experiment
with technology development and commercialization. Policy Studies Journal, 1994. 22(2): p. 384-
399.
[20] McKelvie, A. and P. Davidsson, From resource base to dynamic capabilities: An investigation of
new firms. British Journal of Management, 2009. 20(S1): p. 63-80.
[21] Nelson, R.R. and H. Pack, The Asian miracle and modern growth theory. The Economic Journal,
1999. 109(457): p. 416-436.
[22] Nelson, R.R. and P.M. Romer, Science, economic growth and public policy. Challenge, 1996.
39(2): p. 9-21.
[23] Özcelik, E. and E. Taymaz, R&D support programs in developing countries: The Turkish
experience. Research Policy, 2008. 37(2): p. 258-275.
[24] Pisano, G.P. and W.C. Shih, Producing prosperity. Why America needs a manufacturing
renaissance. 2012, Boston, Massachusetts: Harvard Business Review Press.
[25] Porter, M.E. and S. Stern, National innovative capacity. The global competitiveness report, 2001.
2002: p. 102-118.
[26] Rasmussen, E., Government instrument to support the commercialization of university research:
Lesson from Canada. Technovation, 2008. 28: p. 506-517.

44
Proceedings International Conference on Innovation and
Management, Malaysia 2016
[27] Saunders, M., P. Lewis, and A. Thornhill, Research methods for business students. Fifth Edition ed.
2009, Essex, England: Pearson Education Limited.
[28] Smith, D., Exploring innovation. 3rd Edition ed. 2015, Maidenhead, Berkshire, United Kingdom:
McGraw-Hill Education.
[29] Szirmai, A., Industrialisation as engine of growth in developing countries, 1950-2005. Structural
Change and Economic Dynamics, 2012. 23(4): p. 406-420.
[30] Teece, D. and G. Pisano, The dynamic capabilities of firms: An introduction. Industrial and
Corporate Change, 1994. 3(3): p. 537-556.
[31] Teece, D.J., Explicating dynamic capabilities: The nature and microfoundations of (sustainable)
enterprise performance. Strategic Management Journal, 2007. 28(13): p. 1319-1350.
[32] Teece, D.J., Technological innovation and the theory of the firm: The role of enterprise-level
knowledge, complementaries, and (dynamic) capabilities, in Handbook of the economics of
innovation. Volume 1, B.H. Hall and N. Rosenberg, Editors. 2010, North-Holland: Oxford, United
Kingdom. p. 680-707.
[33] Teece, D.J., G. Pisano, and A. Shuen, Dynamic capabilities and strategic management. Strategic
Management Journal, 1997. 18(7): p. 509-533.
[34] Verona, G. and D. Ravasi, Unbundling dynamic capabilities: An exploratory study of continuous
product innovation. Industrial and Corporate Change, 2003. 12(3): p. 577-606.
[35] Vohora, A., M. Wright, and A. Lockett, Critical junctures in the development of university high-
tech spinout companies. Research Policy, 2004. 33(1): p. 147-175.
[36] Weiss, J., Industrial policy in the twenty-first century: Challenges for the future, in Pathways to
industrialization in the twenty-first century, A. Szirmai, W. Naude, and L. Alcorta, Editors. 2013,
Oxford University Press: Oxford, United Kingdom. p. 393-414.
[37] World Bank, The East Asian miracle. Economic growth and public policy . 1993, New York:
Oxford University Press.
[38] Yin, R.K., Case study research. Design and methods. Fourth Editition ed. 2009, California: SAGE
Publication.

45
Proceedings International Conference on Innovation and
Management, Malaysia 2016
Investigating Antecedent of Knowledge Sharing among DBA Students
Hizul Hamid, Aizurra Haidah Abdul Kadir, Azman Ibrahim
Arshad Ayob Graduate School of Business (AAGBS), Universiti Teknologi MARA, 40450, Shah Alam,
Selangor, Malaysia
(Email: [email protected], [email protected], [email protected])
Abstract This conceptual paper proposes a new framework based on a modified Unified Theory of
Acceptance and Use of Technology (UTAUT) model that look at knowledge sharing b ehaviour through
two antecedents namely Norm of Reciprocity and Learning Self Efficacy and how these influence
knowledge sharing behaviours. Using the modified UTAUT model, we propose that performance
expectancy effort expectancy, and social influence mediate the relationship between Learning Self-
Efficacy and the Norm of Reciprocity and knowledge sharing behaviour.
Keywords UTAUT Model, Knowledge Sharing Behaviour, Knowledge Management
1 Introduction Mobile technology is frequently used in communicating knowledge, and is especially useful in
the education setting. It offers students and academicians increased choices and opportunities in the
context of information dissemination. The advent of information and communication technologies has
enabled the easy sharing of knowledge and information between people through social interactions using
mobile applications that promote opportunities for knowledge sharing [1]. Milrad had identified some
characteristics of mobile technologies that can be beneficial for education: Portability, Social Interactivity,
Individuality, and Sensitivity to context, Connectivity and Fusion of digital and physical worlds [2].
According to Nonaka and Takeuchi [3], knowledge is born of an interaction between explicit knowledge
and tacit knowledge. Tacit knowledge includes innate or acquired skills, know-how and experience. It is
a form of hard knowledge to translate in the speech and to communicate through language. On the other
hand, explicit knowledge is transferable on a support, formalised and transferable through an intermediary
medium such as a document. By validating the individual knowledge through community consultation
mechanisms, it is possible to reach a consensus on a shared vision of what is true in the professional
community.
Knowledge sharing is the behaviour that is to make knowledge available in an organisation.
Knowledge sharing is the dissemination of a person’s acquired knowledge with other people within an
organisation, through identifying existing and accessible knowledge from others and using this knowledge
to solve specific problems better and more efficiently than through other methods [4]. In other words,
knowledge sharing between individuals is the process by which knowledge held by an individual, is
converted into a form that can be understood, absorbed and used by other individuals [5]. There are two
main processes in knowledge sharing, i.e. knowledge donating (communicating existing knowledge to
others) and knowledge collecting (consulting other people to learn what they know) [6].
Knowledge sharing plays an important role in Knowledge Management, but there is a marked distinction
between knowledge contribution and knowledge seeking behaviours in knowledge sharing. It’s been
found that users’ intentions and facilitating organisational conditions predicted knowledge sharing
behaviour; but continuance intention was determined by users’ beliefs and attitudes [7]. It is an assumption
that when a knowledge sharing technology is in place, such as mobile applications , people will
automatically use the technology. Unfortunately, this is not the case, as knowledge sharing is a voluntary
and intangible activity and is not forcible or be mandated by other people [8]. It This is because knowledge
is perceived as valuable and vital resources or assets, thus many people were reluctant to share their
knowledge or expertise [9]. Therefore, there are many factors to consider when implementing a knowledge

46
Proceedings International Conference on Innovation and
Management, Malaysia 2016
sharing technology. Thus, it is important to acknowledge any external moderating variables regarding
technology acceptance if we are to fully see the overall issue.
2 Methodology This study will utilise a modified Unified Theory of Acceptance and Use of Technology
(UTAUT) model to explain to what extent and under what conditions DBA students accept and use mobile
technology to share knowledge, specifically addressing the questions about what makes it easier for the
DBA students to collaborate and share knowledge and how mobile technology can be accepted
successfully and used in the course.
This study proposes to look at knowledge sharing behaviour through two antecedents namely
Norm of Reciprocity and Learning Self Efficacy and how these influence knowledge sharing behaviours.
Using the modified UTAUT model, we propose that performance expectancy effort expectancy, and social
influence mediate the relationship between Learning Self-Efficacy and the Norm of Reciprocity and
knowledge sharing behaviour.
Self-efficacy refers to a person’s inner conviction that they could arrange and accomplish their
actions to attain the desired goals [10]. Based on social capital theory Reciprocity refers to people’s
beliefs that active contributions would be reciprocated [11]. Fulfilling the norm of reciprocity gave people
a sense of mutual interpersonal benefit [12]. As such people frequently reciprocate actions when they have
benefits. Thus, knowledge sharing behaviour occurred when people participate in knowledge exchanges
whereby they share knowledge with the hope of developing favourable rela tionships with other people or
expect to obtain knowledge from others in the future [13]. People will be more likely to share knowledge
when they perceived that knowledge sharing behaviour strengthened self-efficacy and personal abilities
[14]. An organisation having reciprocal relationship amongst its members will exhibit stronger advantage
because the members will then have the capacity to influence each other [15].
3 Proposed Framework UTAUT was proposed by Venkatesh et al. [16] and is a model that attempts to integrate and
empirically compare elements from different technology acceptance models in technology acceptance, as
per figure 1.
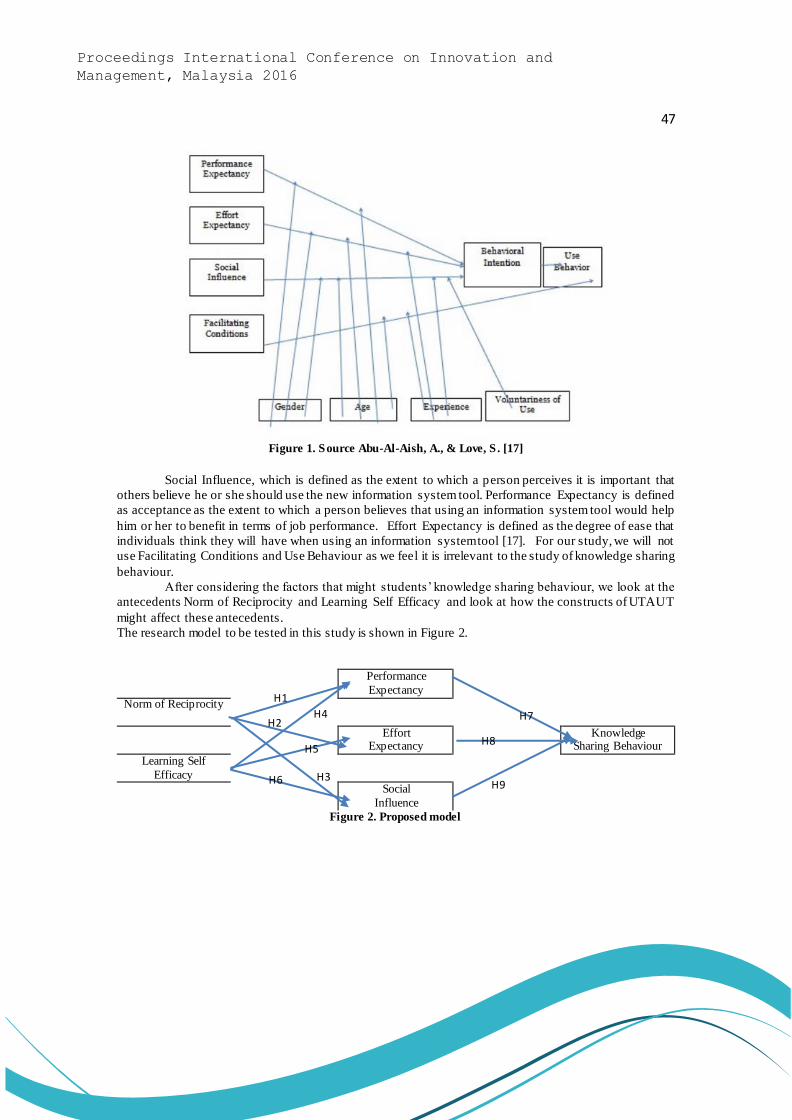
47
Proceedings International Conference on Innovation and
Management, Malaysia 2016
Figure 1. Source Abu-Al-Aish, A., & Love, S . [17]
Social Influence, which is defined as the extent to which a person perceives it is important that
others believe he or she should use the new information system tool. Performance Expectancy is defined
as acceptance as the extent to which a person believes that using an information system tool would help
him or her to benefit in terms of job performance. Effort Expectancy is defined as the degree of ease that
individuals think they will have when using an information system tool [17]. For our study, we will not
use Facilitating Conditions and Use Behaviour as we feel it is irrelevant to the study of knowledge sharing
behaviour.
After considering the factors that might students’ knowledge sharing behaviour, we look at the
antecedents Norm of Reciprocity and Learning Self Efficacy and look at how the constructs of UTAUT
might affect these antecedents.
The research model to be tested in this study is shown in Figure 2.
Performance
Expectancy
Norm of Reciprocity
Effort Expectancy
Knowledge Sharing Behaviour
Learning Self
Efficacy
Social
Influence
Figure 2. Proposed model
H1
H2
H3
H4
H5
H6
H7
H8
H9
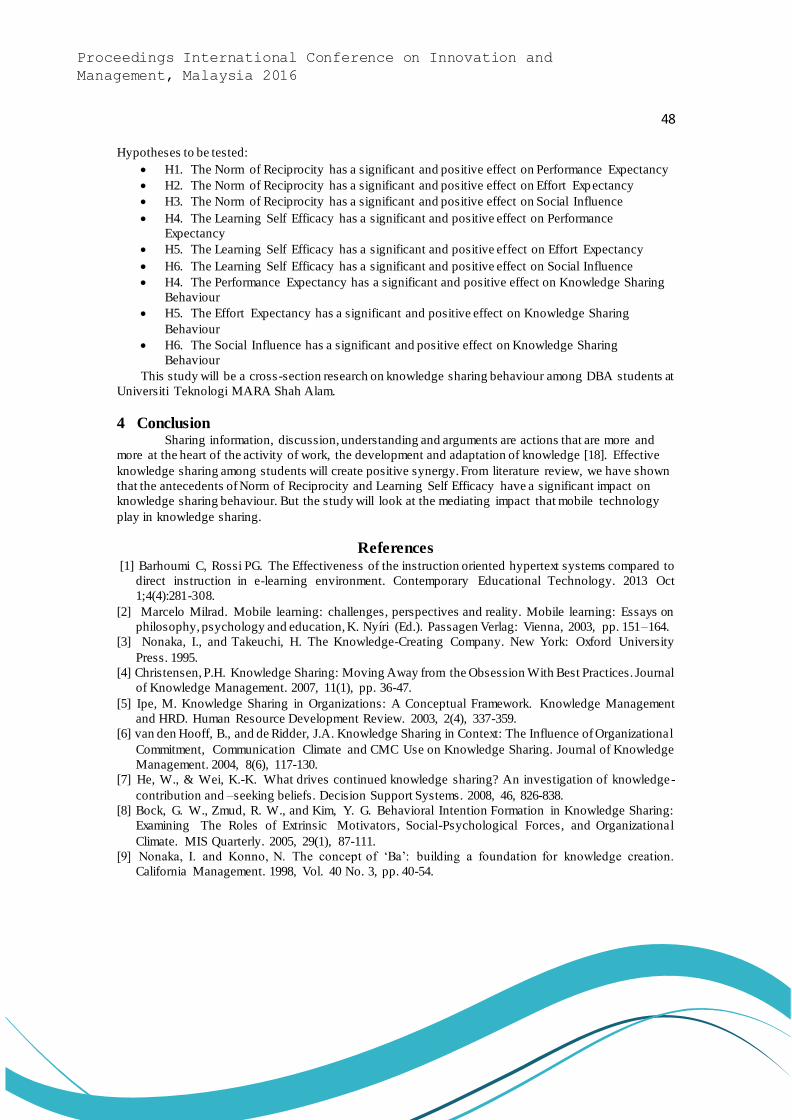
48
Proceedings International Conference on Innovation and
Management, Malaysia 2016
Hypotheses to be tested:
H1. The Norm of Reciprocity has a significant and positive effect on Performance Expectancy
H2. The Norm of Reciprocity has a significant and positive effect on Effort Expectancy
H3. The Norm of Reciprocity has a significant and positive effect on Social Influence
H4. The Learning Self Efficacy has a significant and positive effect on Performance
Expectancy
H5. The Learning Self Efficacy has a significant and positive effect on Effort Expectancy
H6. The Learning Self Efficacy has a significant and positive effect on Social Influence
H4. The Performance Expectancy has a significant and positive effect on Knowledge Sharing
Behaviour
H5. The Effort Expectancy has a significant and positive effect on Knowledge Sharing
Behaviour
H6. The Social Influence has a significant and positive effect on Knowledge Sharing
Behaviour
This study will be a cross-section research on knowledge sharing behaviour among DBA students at
Universiti Teknologi MARA Shah Alam.
4 Conclusion Sharing information, discussion, understanding and arguments are actions that are more and
more at the heart of the activity of work, the development and adaptation of knowledge [18]. Effective
knowledge sharing among students will create positive synergy. From literature review, we have shown
that the antecedents of Norm of Reciprocity and Learning Self Efficacy have a significant impact on
knowledge sharing behaviour. But the study will look at the mediating impact that mobile technology
play in knowledge sharing.
References [1] Barhoumi C, Rossi PG. The Effectiveness of the instruction oriented hypertext systems compared to
direct instruction in e-learning environment. Contemporary Educational Technology. 2013 Oct
1;4(4):281-308.
[2] Marcelo Milrad. Mobile learning: challenges, perspectives and reality. Mobile learning: Essays on
philosophy, psychology and education, K. Nyíri (Ed.). Passagen Verlag: Vienna, 2003, pp. 151–164.
[3] Nonaka, I., and Takeuchi, H. The Knowledge-Creating Company. New York: Oxford University
Press. 1995.
[4] Christensen, P.H. Knowledge Sharing: Moving Away from the Obsession With Best Practices. Journal
of Knowledge Management. 2007, 11(1), pp. 36-47.
[5] Ipe, M. Knowledge Sharing in Organizations: A Conceptual Framework. Knowledge Management
and HRD. Human Resource Development Review. 2003, 2(4), 337-359.
[6] van den Hooff, B., and de Ridder, J.A. Knowledge Sharing in Context: The Influence of Organizational
Commitment, Communication Climate and CMC Use on Knowledge Sharing. Journal of Knowledge
Management. 2004, 8(6), 117-130.
[7] He, W., & Wei, K.-K. What drives continued knowledge sharing? An investigation of knowledge-
contribution and –seeking beliefs. Decision Support Systems. 2008, 46, 826-838.
[8] Bock, G. W., Zmud, R. W., and Kim, Y. G. Behavioral Intention Formation in Knowledge Sharing:
Examining The Roles of Extrinsic Motivators, Social-Psychological Forces, and Organizational
Climate. MIS Quarterly. 2005, 29(1), 87-111.
[9] Nonaka, I. and Konno, N. The concept of ‘Ba’: building a foundation for knowledge creation.
California Management. 1998, Vol. 40 No. 3, pp. 40-54.

49
Proceedings International Conference on Innovation and
Management, Malaysia 2016
[10] Paek, H.J., Bae, B.J., Hove, T. and Yu, H. Theories into practice: a content analysis of anti-smoking
websites. Internet Research. 2011, Vol. 21 No. 1, pp. 5-25.
[11] Maxwell, S., Nye, P. and Maxwell, N. The wrath of the fairness -primed negotiator when the
reciprocity norm is violated. Journal of Business Research. 2003, Vol. 56 No. 5, pp. 399-409.
[12] Shumaker, S.A. and Brownell, A. Toward a theory of social support: closing conceptual gaps. Journal
of Social Issues. 1984, Vol. 40 No. 4, pp. 11-36.
[13] Huang, Q., Davison, R.M. and Gu, J. Impact of personal and cultural factors on knowledge sharing
in China. Asia Pacific Journal of Management. 2008, Vol. 25 No. 3, pp. 451-471.
[14] Kankanhalli, A., Tan, B.C.Y. and Wei, K.K. Contributing knowledge to electronic knowledge
repositories: an empirical investigation. MIS Quarterly. 2005, Vol. 29 No. 1, pp. 113-143.
[15] Chen, G.L., Yang, S.C. and Tang, S.M. Sense of virtual community and knowledge contribution in
a P3 virtual community: motivation and experience. Internet Research. 2013, Vol. 23 No. 1, pp. 4-26.
[16] Venkatesh V, Morris M G, Davis G B, et al. User acceptance of information technology: Towards a
unified view. MIS Quarterly, 2003, 27(3): 425-478.
[17] Abu-Al-Aish, A., and Love, S. Factors influencing students' acceptance of mlearning: an
investigation in higher education. The International Review of Research in Open and Distributed
Learning. 2013, 14(5).
[18] Sze-wing Leung, Janny C.C. Ng, Tyrone K.Y. Chan, Patrick C.K. Hung and Hades C.F. Tam. From
e-Knowledge Sharing to m-Knowledge Sharing: A Theoretical Framework. In Lam, J., Li, K.C.,
Cheung, S.K.S., Wang, F.L. (Eds.). Knowledge Sharing Through Technology: 8th International
Conference on Information and Communication Technology in Teaching and Learning, ICT 2013,
Hong Kong, China, July 10-11, 2013, pp. 178-185.
50
Proceedings International Conference on Innovation and
Management, Malaysia 2016
Tacit Knowledge Innovation and Enterprise Development in
Malaysia’s Chinese Family SMEs: Longitudinal Case Studies on Plastic Production Across Generational Change
John Lee Kean Yew
Faculty of Business and Law, International University of Malaya-Wales, Malaysia
(E-mail: [email protected])
Abstract This paper undertakes the tacit knowledge innovation and the trends of enterprise development
among Chinese family-owned small and medium enterprises (FSMEs) in Malaysia to keep pace with an
increasingly global economy and changes in the policy setting. A World Bank study showed that 67.2
percent of shares quoted on the Bursa Malaysia were owned by Chinese family owned while 13.4 percent
were state owned. Thus, Chinese family firms have a dominant presence in the Malaysian corporate sector.
The economic prosperity of Malaysia is largely dependent upon the success of these Chinese family firms
in an increasingly ‘global’ marketplace as well as the adaption to the local government policy. This paper
thus analytically and empirically delineates to highlight the issues about the tacit knowledge innovation
and the generational change of Malaysia’s Chinese FSMEs in the plastic production by using longitudinal
case studies. This paper also appraises the succession of the new generation as owners of the family
business, to transform the firm’s knowledge. The case studies will assess first -generation, second-
generation and third-generation Chinese family SMEs of family history, family tree and organization
structure. Accessing the contention that a family business does not survive beyond the 3rd generation, this
paper, in fine, provides a set of policy recommendations to facilitating the evolution from family
capitalism to professional firms.
Keywords Tacit Knowledge Innovation, Generational Change, Enterprise Development, Malaysia
Chinese Family SMEs, Plastic.
1 Introduction The growing pressure of global competition has compelled Malaysian Chinese companies to
concentrate on the links between production and marketing in their org anizations so as to effectively
develop new products and services. A similar trend can be discerned among companies in industrialized
Japan as well as in the United States and in Europe (Drucker, 1946). Regarding natural resources,
Malaysia’s government has brought more opportunities in export trading and economic diversification
since its independence in 1957. Rubber accounted for nearly 70 per cent of the total output value of agro -
based industries. During the 1963 to 1967 periods, its share declined to about 65 per cent of total agro-
based output (Lim, 1973). There are two types of diversification related to industries in Malaysia. The
first type focused on agro-based industries, from rubber plantations to palm oil production and other crops
while the second targeted manufacturing-related production, moving from primary into secondary
industries.
During the colonial and immediate post-colonial periods, foreign enterprises, especially those
owned by the British, controlled the economy. However, Puthucheary (1960) noted that the one sector
where the Malaysia’s Chinese had a dominant presence was in manufacturing with mostly family owned
ranging from small businesses to household production. Most of the small scale enterprises were clearly
seen in these sectors (Tan, 1982). This kind of family SMEs mostly owned by Malaysia’s Chinese usually
lacks of capital to develop their business during 1960-1970. As a result, the introduction of the promotion
of the Investment Incentives Act of 1968, the 1971 Free Trade Zone Act and the establishment of the
Malaysian Industrial Development Authority (MIDA) in the mid -1960s are aimed to promote

51
Proceedings International Conference on Innovation and
Management, Malaysia 2016
industrialization as well as providing funding for Malaysia’s SMEs. By 1980-1990, the economy in
Malaysia was more industrialized with the promotion of knowledge-intensive industries such as the
electronic sector, high technology plastic engineering and ICT services which attracted direct foreign
investment (DFI) to achieve a good GDP in the national economy.
Among Malaysia’s top 100 publicly-listed firms by the turn of the century, barely 20 were
involved in manufacturing. A majority of these 20 firms were foreign -owned, an indication that
manufacturing companies of the colonial period had not managed to grow (Gomez, 2007). There were a
few exceptions. Three of these 20-odd firms belong to the Chinese family owned. Hong Leong group; the
Malaysian Pacific Industries (MPI) involved in the electronics sector as well as plastic engineering, OYL
Industries, which is a producer of air-conditioning products and Original Equipment Manufacturing
(OEM), and Hong Leong Industries, a tiles manufacturer. Most domestic manufacturing firms in the top
100 in 2001, have been owned by Chinese since Independence in 1957. A comparison of the top 100
companies in 1970 and 2001 demonstrates that only one enterprise managed to retain its position as a
leading manufacturer which is the foreign-owned Rothmans (Lim, 1981; Gomez 2007). This suggests that
Malaysian companies mostly family owned were not sufficiently investing in R&D with little
development of pioneer tacit knowledge in the manufacturing sector.
Recognizing these issues, the Malaysian government has implemented technologically oriented
clusters that have managed to create a huge community of componen ts manufacturers, namely Original
Equipment Manufacturing (OEM) suppliers consisting of family SMEs in exploring innovation capacities
to enhance technology sharing partnership and collaboration opportunities. Many family SMEs have come
to be ‘locked into’ an OEM relationship and slowly innovating their own branding and expanding their
distribution channels in the marketplace. The implementation of the New Economic Policy (NEP, 1971-
1990) has led to an important structural shift among Chinese family SMEs, resulting in Sino-Malay
alliances though many were seen as ‘Ali-Baba’ alliances where the firm was owned by the Chinese while
the Malay was a silent partner (Searle, 1999; Heng and Sieh, 2000; Wazir, 2000; Gomez, 2003). Thus,
subsequent generations in these Chinese family enterprises in Malaysia faced different challenges due to
changes in government public policy, including the NEP, depending on the sector they were situated in.
It is interesting to investigate the trends of enterprise development among Ma laysia’s Chinese family
SMEs in the manufacturing sector since few Chinese conglomerates have emerged as major publicly-
listed firms in the manufacturing sector. Generational change studies in family SMEs is important to show
how the subsequent generations solve the problems of poor management and control pyramids from the
previous generation who is entrenched in preserving the value of old capital thus damage to creativity and
innovativeness. ‘New wealth’ emerged in the 1990s after the Chinese enterprises in Malaysia successfully
developed in compliance with the NEP and are presently managed by a highly educated second generation
who have little problems creating cooperative ties with government agencies and foreign investors or
Multinational Companies (MNCs).
These ‘New wealth’ Chinese enterprises played a crucial role in the Malaysian government’s
endeavor to rapidly industrialize the country with an emphasis from ‘Japan Incorporation (Inc)’ to
‘Malaysia Incorporation (Inc)’ emphasized in private-public partnership (Gomez, 1994). A new
generation within Chinese family enterprises has also established cooperative ties with the government of
Malaysia. YTL Corporation is one of Malaysia’s largest conglomerates with a track record of 55 percent
growth since it obtained pubic-listing in 1986. Besides its involvement in the construction sector where it
made its name, this enterprise, led by the Yeoh family, is also involved in power generation, property
development, cement production and high-end technology including plastic OEM production. Another
famous family business is IOI. Like YTL, this family firm is now led by the second generation Lee family .
However certain Chinese family enterprises in Malaysia might face the problem of lacked innovation
drive as subsequent generations took over and failed to adapt successfully to the new trends of enterprise
development, resulting in either the decline or stagnation (Heng and Sieh, 2000). These Chinese family
52
Proceedings International Conference on Innovation and
Management, Malaysia 2016
enterprises may have also declined because of slow growth arising from inefficiency caused by entrenched
corporate control, high barriers to external investment, and perhaps a low investment in innovation. A
great example is Yeo Hiap Seng (YHS) where third generation family members were urged to relinquish
their positions as directors because of the company’s poor performance (Gomez, 2009). In the late 1990s ,
following the 1997 Asian currency crisis, the Malaysian government expressed the need to integrate
Malaysian SMEs into global supply chains created by Multinat ional Corporations (MNCs). To aid this
process, the government introduced the Global Supplier Program (GSP) and Industrial Linkage Program
(ILP) as attempts to adopt organizational capabilities that would successfully enhance diversification of
the economy (Dosi et al., 1992).
2 Literature Reviews In 1981-2003, small and medium scale enterprises (SMEs) particularly family owned have been
encouraged by the Malaysian government to strive for excellence to compete in an increasingly globalized
marketplace. The government has supported this endeavour by encouraging SMEs to invest in research
and development (R&D) to enhance their capacity to innovate. The government’s subscription to policies
under the developmental state model from 1981 till 2003, particularly during the two decade-long
premierships of Mahathir Mohamad (Malaysia 4th prime minister), can be said to have contributed to
Malaysia’s fairly rapid economic development. State-led development, replicating post-war Japan’s form
of economic growth, was imperative for Mahathir to support domestic enterprises and encourage the rise
of large business groups. His desire to develop huge conglomerates was strongly influenced by East Asian
corporate models, specifically the South Korean chaebol and the Japanese zaibatsu.
Mahathir appeared more enthusiastic about the family-controlled zaibatsu system than the interlocking
stock ownership keiretsu pattern of corporate development, where corporate equity was very widely
dispersed. The zaibatsu system would later evolve into the keiretsu mode of corporate holding after World
War II (Morck and Masao, 2003) with an emphasis on the close links between the financial and industrial
sectors to advance industrialization. Mahathir used these East Asian corporate development models as
templates while promoting the creation of large, internationally recognized Malaysian Chinese
conglomerates that would also help rapidly industrialize the economy.
2.1 Prominent Chinese Firms in Malaysia
There have been important studies on large Malaysian Chinese firms before the appointment of
Mahathir, former Prime Minister of Malaysia. These studies include those by Lim (1981), Tan (1982),
Sieh (1982). These studies drew attention to extensive interlocking ownership and directorship patterns
among large Chinese firms which had led to significant specialisation, with a focus on foreign companies
and Chinese-owned enterprises. By the turn of the century, the leading enterprises in Malaysia were
government-linked companies though a few Chinese family-based firms also featured as prominent
publicly-listed companies. These firms included those owned by the Lim, Yeoh, Quek, Kuok, Tan and
Lee families (see Gomez, 1999).
In Malaysia, Gomez’s masterpiece on Chinese Business in Malaysia: Accumulation, Ascendance,
Accommodation provides an in-depth examination of eight large publicly-listed Chinese firms which are
all family-owned though that was not his primary focus (Gomez, 1999). Gomez also conducted a
comparative study of small and medium-sized Chinese family enterprises in the United Kingdom (UK)
and Malaysia through an analysis of available data from the UK companies house (Gomez, 2007). Gomez
found that most Chinese family SME owners in Malaysia preferred their heirs to become professionals, a
factor that has hindered the development and direction of these family firms (Gomez, 2004). There were
specific reasons for this lack of desire by Chinese family SMEs to develop their enterprises. One core
issue was their response to discriminatory public policies such as affirmative action. Another was the lack
of government support for Chinese family SMEs, specifically those owned by ethnic Chinese (Gomez,
2009).
53
Proceedings International Conference on Innovation and
Management, Malaysia 2016
2.2 Innovation of Tacit Knowledge in Family Business
The main obstacle of family business literature suggests that corporate organization features limit
their ability to take advantage of incentives to innovate and upgrade the quality of their products (Hobday,
1995). Since economic change leads to market differentiation as changes in customer preference occur,
family firms face the possibility of losing the market they have already captured unless firms invest in
R&D (Appiah-Adu and Singh, 1998). This means that there is a need to cultivate and develop the extent
of innovation based on customer orientation (Vossen, 1999) which directly influences the development of
technical skills and competence knowledge in family enterprises (McConaughy and Phillips, 1999).
As family enterprises grow from one generation to the next, research shows that engagement with or
involvement in decision-making plays an important role in adopting innovation to develop an enterprise
(Aronoff and Ward, 2001). There has, however, been very little empirical research on Malaysian family
firms, which constitute a large segment of SMEs, to assess if the contentions of this literature about their
innovation capacity are valid. Thus, this paper evaluates how generational change, such as succession
when a new generation emerges as owners, influence family firms regarding how the next generation
explores their innovation capacity that is based on the founders’ tacit knowledge. This study specifically
assesses how multi generations in family firms (second and third generation) are transforming their tacit
knowledge efficiently through new managerial styles, enterprise development characteristics and new
product development.
This important topic of knowledge transformation is closely related to the concept of ‘learning
organizations’ where man knows more than he can explain (Polanyi, 1966). In the literature on family
enterprises, a founder’s personal experience, inherent qualities and competence are persistently noted with
many references to transforming this tacit knowledge into codified knowledge (Aoki, 2001). If this
objective is achieved, the codified knowledge will serve as an asset for the firm that subsequent
generations can develop to increase its competitive power. However, this task of transforming,
commercializing and capitalizing on tacit knowledge is not easy. Codifying knowledge is considered a
long term investment within an organization or family enterprise. It depends on how well tacit knowledge
management can be developed within a traditional hierarchical organization to amore horizontal one in
family enterprises.
Innovation is assessed regarding upgrading the technology used to create new products from tacit
knowledge. Innovation helps the enterprise serve society by creating economic value. There is no fixed
model of family innovation. It depends on the family enterprise’s industry, characteristics and capacity to
innovate. Innovation provides a structure and method to help a family business compete with other
enterprises, increasing its revenue, creating brand products and obtaining funds to grow. It is only th rough
innovation that family enterprises can create value in business activities during times of economic crises.
Innovation is dynamic and continuous, and it changes the objectives and forms of value creation within a
family enterprise.
In most family firms, the owner’s leadership and management style have a significant influence
on an enterprise’s development to sustain longevity and achieve a competitive advantage in comparison
to large organizations (Hale et al., 1996). When the leadership is dynamic and focused on innovation,
considerable changes can occur within the firm, particularly regarding the quality of goods and services
produced by converting tacit knowledge into codified knowledge (Voss, 1998). In fact, a crucial factor to
ensure the development of a family enterprise is innovation through which tacit knowledge is developed
in an effective way, thereby creating a niche for the firm, possibly also creating a product brand. Three
basic company functions – research and development (R&D), marketing, and manufacturing – that can
initiate this change from tacit knowledge to codified knowledge as well as create a system that avails itself
to business opportunities that arise in the market as the economy rapidly evolves (Drucker, 1954) are
considered.
54
Proceedings International Conference on Innovation and
Management, Malaysia 2016
2.3 Generational Change and Enterprise Development in Family Business
Innovation is crucial for the development and long-term survival of companies as it stimulates
an enterprise’s growth towards long term sustainability (Porter 1980; Craig and Moores, 2006). Many of
the longest surviving firms are family-owned and have prospered over many generations. Schumpeterian
has classically defined innovation as five entities: new production, new ideas, new marketplace or channel,
new supply chain and a new mode of enterprise (Schumpeter, 1934). Innovative capacity refers to the
extent in which the introduction of new methods can challenge the existing flow of processes in an
organization to achieve their goal and objective (Damanpour, 1991; Hult et al., 2004). From time to time,
change has been researched in different ways (Burns and Stalker, 1961). There is a motivation to learn of
success factors related to top-down relations and leadership, customer relationship management and to
upgrade skills and capabilities. To upgrade is defined as the ability of an enterprise to make better and
value-added products (Giuliani et al., 2005). Networking is seen as an antecedent of innovation with a
view of creating an ongoing process.
Generational change in family enterprises can influence tacit knowledge transformation when
the next generation implements different strategies for innovation aimed achieving a competitive
advantage which includes having an impact on management, marketing and manufacturing techniques, or
the 3Ms (Chandler, 1962; 1977). Chandler (1962) has shown conclusively how, by focusing on the 3Ms,
a small established enterprise, for example, a family firm, can overcome the first -movers’ advantage and
capture a place in an oligopoly. This focus on the 3Ms contributes to the promotion of ‘organization
capabilities’ that foster effective functional and strategic competition by deeply influencing and exploiting
economies of scale (Chandler, 1962).
The development of organizational capabilities helps a firm keep pace with rapid changes within
an industry. Organizational capabilities influence and shape management structure during a generational
change, converting the enterprise from a hierarchical organization to one that has a flattened organization
structure which better encourages the flow of innovative ideas (Davis, 1983; Dyer and Handler, 1994;
Upton and Heck, 1997). Generational change would necessitate investing in research and development
(R&D), developing new markets and creating a new customer base in order to maximize chances of
becoming a modern industrial enterprise (Chandler, 1990; Chandler, 1996).
Fletcher (2000) suggests that historical background and accumulated knowledge as well as experiences
influence and shape present relations, situations and structures in family enterprises. In a multi-generation
family enterprise, more than one family member is involved in ownership management, bringing about a
separation of duties in the organization structure (Astrachan and Shanker, 2003). However, recent studies
have shown that, as this generation grows older, their views of the world does not change. On the contrary,
the new generation is significantly more likely to new ideas and open ‘to enhance the reputation and status
of the business in the local community’ (Westhead, 1998). First generations in firms, on the other hand,
are more likely to prioritize ‘family objectives over business objective’ (Westhead, 2003).
Different generations propose different characteristics, managerial styles and goals (Okorafo,
1999). Each generation brings new ideas and improvements developed from their past experiences and
events (Ward, 1987; Drozdow, 1989). New generations bring new ideas and are more prepared and trained
to develop an enterprise (Fernández and Nieto, 2005; Claver et al., 2009). In family businesses that
operate over a few generations, research have shown that the founders would be less likely to transform
their tacit knowledge (defined here as personal experience) to codified knowledge (that is, knowle dge
embedded in the firm but cannot become immediately available in the market) (Polanyi, 1966; Aoki,
2001).
Furthermore, the attitude and behaviour of family enterprises toward this need to convert tacit knowledge
to codified knowledge can change when a new generation takes over (Swinth and Vinton, 1993). The form
of business management may be influenced by many individuals within the family and is an issue that
may have a bearing on organizational structure (Lambrecht, 2005).Historian and business analys t
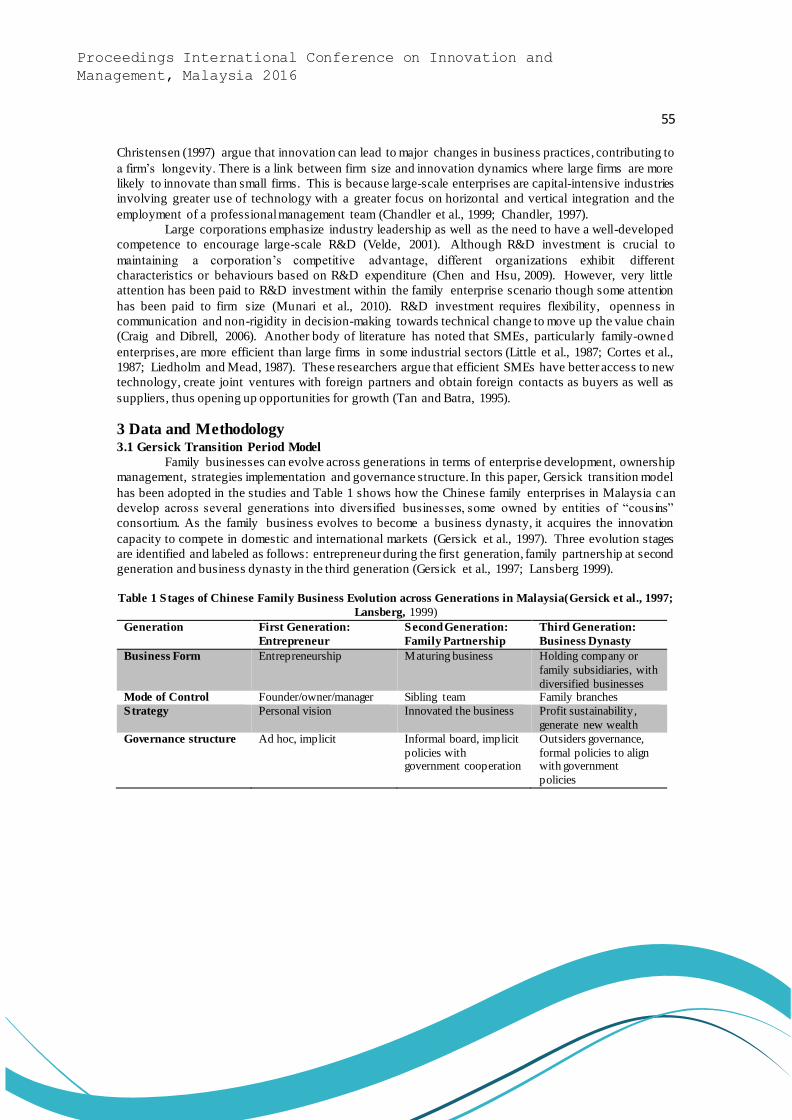
55
Proceedings International Conference on Innovation and
Management, Malaysia 2016
Christensen (1997) argue that innovation can lead to major changes in business practices, contributing to
a firm’s longevity. There is a link between firm size and innovation dynamics where large firms are more
likely to innovate than small firms. This is because large-scale enterprises are capital-intensive industries
involving greater use of technology with a greater focus on horizontal and vertical integration and the
employment of a professional management team (Chandler et al., 1999; Chandler, 1997).
Large corporations emphasize industry leadership as well as the need to have a well-developed
competence to encourage large-scale R&D (Velde, 2001). Although R&D investment is crucial to
maintaining a corporation’s competitive advantage, different organizations exhibit different
characteristics or behaviours based on R&D expenditure (Chen and Hsu, 2009). However, very little
attention has been paid to R&D investment within the family enterprise scenario though some attention
has been paid to firm size (Munari et al., 2010). R&D investment requires flexibility, openness in
communication and non-rigidity in decision-making towards technical change to move up the value chain
(Craig and Dibrell, 2006). Another body of literature has noted that SMEs, particularly family-owned
enterprises, are more efficient than large firms in some industrial sectors (Little et al., 1987; Cortes et al.,
1987; Liedholm and Mead, 1987). These researchers argue that efficient SMEs have better access to new
technology, create joint ventures with foreign partners and obtain foreign contacts as buyers as well as
suppliers, thus opening up opportunities for growth (Tan and Batra, 1995).
3 Data and Methodology 3.1 Gersick Transition Period Model
Family businesses can evolve across generations in terms of enterprise development, ownership
management, strategies implementation and governance structure. In this paper, Gersick transition model
has been adopted in the studies and Table 1 shows how the Chinese family enterprises in Malaysia c an
develop across several generations into diversified businesses, some owned by entities of “cousins”
consortium. As the family business evolves to become a business dynasty, it acquires the innovation
capacity to compete in domestic and international markets (Gersick et al., 1997). Three evolution stages
are identified and labeled as follows: entrepreneur during the first generation, family partnership at second
generation and business dynasty in the third generation (Gersick et al., 1997; Lansberg 1999).
Table 1 Stages of Chinese Family Business Evolution across Generations in Malaysia(Gersick et al., 1997;
Lansberg, 1999)
Generation First Generation:
Entrepreneur
Second Generation:
Family Partnership
Third Generation:
Business Dynasty
Business Form Entrepreneurship Maturing business Holding company or
family subsidiaries, with
diversified businesses Mode of Control Founder/owner/manager Sibling team Family branches
Strategy Personal vision Innovated the business Profit sustainability,
generate new wealth
Governance structure Ad hoc, implicit Informal board, implicit
policies with government cooperation
Outsiders governance,
formal policies to align with government
policies
56
Proceedings International Conference on Innovation and
Management, Malaysia 2016
Table 1 demonstrates the evolution of family enterprises in Malaysia from a simple to a complex
business during first, second and third generations. To achieve growth and development, risks might affect
some of the business assets while being difficult to manage as well as the need to provide other plans for
investment. These issues become more complex with diversified assets when a family business comes
under the control of the third generation. First generation firms often have a “paternalistic” management
culture and style with a personal vision and usually involve a first -mover entrepreneur to start the business.
The governance structure is mostly ad hoc and implicitly and primarily led by a family member. The
mature family business is clearly seen during the second generation, usually when sibling teams renew
the business, providing better services and value-added products. The governance structure tends to have
an informal board with implicit policies as the family business starts to increase its organization
capabilities by promoting the 3Ms, namely management, marketing and manufacturing.
During the third generation when a family business begins to function as a holding company,
more family branches occur and the strategy taken tends to be one that helps sustain profitability or
generate new wealth due to rapid changes in internal and external environments. The governance structure
tends to be one that has board members who are outsiders with the implementation of formal policies to
commercialize tacit knowledge into a form that can last several generations. One key reason why family
firms have survived the test of time is that family members are technically highly proficient in what they
manufacture. Competence, cultural fit and previous experience are crucial while autonomy given during
a generational change influences a family firm’s capacity to hire experienced managers, outsource, fund
R&D and obtain adequate resources to adapt to a “professional” style of management (Dyer, 1988) in
order to create new products and identify more markets.
Gersick et al. (1999) introduced the Transition Period Model (see Figure 1) that deals with what
happens as a business moves across the first three generations: Controlling Owner State (1st generation),
Sibling Partnership (2nd generation) and Cousin Consortium (3rd generation). In a multi-generation study,
Gersick discussed the formation of second generation sibling-partnerships to facilitate decision-making.
At first, siblings either consider duty segregation by assigning management responsibility for certain areas
or set up a top management to discuss major issues (Gersick et al., 1997). As a result, top management
decisions play an important role to avoid a knowledge gap in a top down management to achieve
organization outcomes (Chrisman et al., 2005). However, in reality, the interaction between the family ,
owners, management and business are much more complex, involving knowledge transfer from low-end
to high-end industries or from a labour-intensive industry to a technology-intensive industry. A key
advantage in researching family-owned businesses from an integrated systems perspective is that it
facilitates an understanding of the context in which family firms stress the importance of business survival
rather than product enhancement (Craig and Moores, 2006).
4 Results From the 1930s to 2010s, the strategic location, manufacturing ability and institutional changes in
Malaysia allowed many MNCs to establish themselves in key sectors. Malaysia became one of the largest sources of electronics, plastic production, automobiles, machinery and audio equipment. This historical analysis
of the longitudinal case studies in plastics production show these Chinese family SMEs were undergone
generational shifts and retained a prominent presence particularly between plastic injection and housewares production in terms of knowledge transformation. During the founding generation, knowledge of plastic
production was acquired through hands-on experience and repetitive practice, policies were integrated and internalized in production, and partnerships with MNCs allowed participation in global supply chains. An
analysis of the in-depth case studies of 11 Malaysia’s Chinese SMEs in plastics production indicates that the next generation was allowed sufficient autonomy to perform their duties, from improving tacit knowledge to
build on the reputation of the firm to rebranding core products. Tacit knowledge changed, as evidenced by new products and enterprises.
57
Proceedings International Conference on Innovation and
Management, Malaysia 2016
5 Conclusion MNC partnerships spurred Malaysia’s Chinese SMEs to continuously upgrade their mach ines, develop the range of their products, involve more professional managers and establish new subsidiaries to
increase their sales volume. This is commonly seen in Chinese SMEs in Malaysia such as SKP Resources, Chang Huat, Polynic, Kemajuan, Guppy Plastic and Lam Seng, all of which are companies that frequently
ventured into various industries in order to keep pace with the rapid changes in technology and market demand4. The business history of longitudinal case studies approach indicates that a majority of these Chinese SMEs in
Malaysia relied strongly on projects and orders from MNCs to improve production processes. The major
problem faced by these Chinese firms in nurturing a culture of R&D and new innovation is the high costs involved in designing new moulding with a new series of needed equipment and accessories since Chinese
SMEs in Malaysia hardly get R&D funding from the government.
References
[1] AAoki, M., 2001. Toward A Comparative Institutional Analysis[J]., Cambridge: MIT Press.
[2] pApiah-Adu, K. and Singh, S., 1998. Customer Orientation and Performance: A Study of
SMEs[J].,Management Decision, 36(6): 385-394.
[3] Aronoff, C. E. and Ward, J. L., 1995. Family-owned Businesses: A Thing of The Past or A Model
For the Future? [J]Family Business Review, 8(2): 121-130.
[4] Astrachan, J. H. and Shanker, M. C., 2003. Family Businesses’ Contribution to the US Economy: A
Closer Look[J] . Family Business Review, 16(3): 211-219.
[5] Authority (MIDA), Kuala Lumpur, 8-24 July[R].
[6] Burns, T. and Stalker, G. M., 1961. The Management of Innovations, London: Tavistock[M]..
[7] Chandler, A.D., Jr., 1962. Strategy and Structure: Chapters in the History of the American
Industrial Enterprise[M]., Cambridge: MIT Press.
[8] Chandler, A.D., Jr., 1977. The Visible Hand: The Managerial Revolution in American Business[M].,
Cambridge, Massachusetts (USA): Harvard University Press.
[9] Chandler, A.D., Jr., 1990. Strategy and Structure: Chapters in the History of the Industrial
Enterprise[M]., Cambridge, Massachusetts (USA): MIT Press.
[10]Chandler, A.D., Jr., 1997. The United States: Engines of Economic Growth in the Capital -Intensive
and Knowledge-Intensive Industries[M], Cambridge: Cambridge University Press, 63-101.
[11] Chandler, A.D., Jr., Amatori, F. and Hikino, T., 1999. Big Business and the Wealth of
Nations[M], Cambridge: Cambridge University Press.
[12] Chandler, G. N., 1996. Business Similarity as A Moderator of the Relationship Between Pre -
ownership Experience and Venture Performance[J]. Entrepreneurship Theory and Practice, 20, 51-
65.
[13] Chen, H. L. and Hsu, W. T., 2009. Family Ownership, Board Independence, and R&D Investment[J].
Family business review, 22(4), 347-362.
[14] Chrisman, J. J., Chua, J. H. and Sharma, P., 2005. Trends and Directions in the Development of a
Strategic Management Theory of the Family Firm[J]. Entrepreneurship Theory and Practice, 29(5),
555-576.
[15] Christensen, C., 1997. The Innovator's Dilemma: When New Technologies Cause Great Firms to
Fail, [M] Cambridge, Massachusetts (USA): Harvard University Press.
[16] Claver, E., Rienda, L. and Quer, D., 2009. Family Firms' International Commitment: The Influence
of Family-Related Factors[J]. Family Business Review, 22(2), 125-135.
4 SKP Resources manufactured audio-visual parts from its collaboration with Pioneer technology. Kemajuan
improved carrier-tape packaging process after adopted ideas from ST Microelectronics.

58
Proceedings International Conference on Innovation and
Management, Malaysia 2016
[17] Cortes, M., Berry, A. and Ishaq, A., 1987. Success In Small and Medium Scale Enterprises: The
Evidence From Colombia[M], Oxford: Oxford University Press.
[18] Craig, J. and Dibrell, C., 2006. The Natural Environment, Innovation, and Firm Performance: A
Comparative Study[J]. Family Business Review, 19(4), 275-288.
[19] Craig, J. B. and Moores, K., 2006. A 10‐year Longitudinal Investigation of Strategy, Systems, and
Environment on Innovation in Family Firms [J]. Family Business Review, 19(1), 1-10.
[20] Damanpour, F., 1991. Organizational Innovation: A Meta-Analysis of Effects of Determinants and
Moderators[J]. Academy of Management Journal, 34(3), 555-590.
[21] Davis, P., 1983. Realizing the Potential of the Family Business [J]. Organizational Dynamics, 12(1),
47-56.
[22] Davis, P. S. and Harveston, P. D., 2000. Internationalization and Organizational Growth: The Impact
of Internet Usage and Technology Involvement Among Entrepreneur-led Family Businesses[J].
Family Business Review, 13(2), 107-120.
[23] Dosi, Teece. and Winter., 1992. Toward a Theory of Corporate Coherence In Technology and
Enterprise[M], Oxford: Clarendon Press, 185-211.
[24] Drozdow, N., 1989. Thinking That is Intuitive to The Boss Must be Chartered for the Next
Generation, Business Week Newsletter for Family-owned Business[N], 1 (19).
[25] Drucker, P., 1946. Concept of Corporation[M], New York: The John Day Company.
[26] Drucker, P., 1954. The Practice of Management[M], New York: Harper & Brothers.
[27] Dyer, W. G. and Handler, W., 1994. Entrepreneurship and Family Business: Exploring the
Connections[J]. Entrepreneurship Theory and Practice, 19, 71-71.
[28] Dyer, W. G. 1988. Culture and Continuity In Family Firms [J]. Family Business Review, 1(1), 37-50.
[29] Fernández, Z. and Nieto, M. J., 2005. Internationalization Strategy of Small and Medium‐Sized
Family Businesses: Some Influential Factors. [J] Family Business Review, 18(1), 77-89.
[30] Fletcher, D.E., 2000. Family and Enterprise in Carter, S. and Jones -Evans, D. (Eds.). Enterprise and
Small Business: Principles, Practice and Policy[M], Harlow: Pearson Education.
[31] Gallo, M. A., 1995. Family Businesses in Spain: Tracks Followed and Outcomes Reached by Those
Among the Largest Thousand[J]. Family Business Review, 8(4), 245-254.
[32] Gersick, K. E., Lansberg, I., Desjardins, M. and Dunn, B., 1999. Stages and Transitions: Managing
Change in the Family Business. [J] Family Business Review, 12(4), 287-297.
[33] Gersick, K.E., Davis, J.A., Hampton, M.M. and Lansberg, I., 1997. Generation to Generation: Life
Cycles of the Family Business[M], Boston: Harvard Business School Press.
[34] Giuliani, E., Pietrobelli, C. and Rabellotti, R., 2005. Upgrading in Global Value Chains: Lessons
from Latin American Clusters[J]. World Development, 33(4), 549-573.
[35] Gomez, E.T., 1999. Chinese Business in Malaysia: Accumulation, Accommodation and
Ascendance[M], Honolulu: Hawai’i: University of Hawai’i Press.
[36] Gomez, E. T., 2003. Affirmative Action and Enterprise Development in Malaysia: The New
Economic Policy[J], Business Partnerships and Inter-Ethnic Relations. Kajian Malaysia, 21(1-2),
59-104.
[37] Gomez, E.T., 2007. Family Firms, Generational Change and Identity Formation: The Chinese in
Britain and Malaysia[J]. East Asia: An International Quarterly, 24 (2), 153-72.
[38] Gomez, E.T., 2009. The Rise and Fall of Capital: Corporate Malaysia in Historical Perspective[J].
Journal of Contemporary Asia, 39, 345-81.
[39] Gomez-Mejia, L., Nuñez-Nickel, M. and Gutierrez, I., 2002.The Role of Family Ties in Agency
Contracts[J]. Academy of Management Journal, 44, 81-95.
[40] Hadjimanolis, A., 2000. An Investigation of Innovation Antecedents in Small Firms in the Context
of a Small Developing Country[J]. R&D Management, 30(3), 235-245.
[41] Hale, A. and Cragg, P., 1996. Business Process Reengineering in the Small Firm: A Case Study [J].
59
Proceedings International Conference on Innovation and
Management, Malaysia 2016
INFOR, 34 (1), 15-29.
[42] Handler, W. C., 1989. Methodological Issues and Considerations in Studying Family Businesses[J].
Family business review, 2(3), 257-276.
[43] Heng, P.K. and Sieh, L.M.L., 2000. The Chinese Business Community in Peninsular Malaysia, 1957-
1999 in Lee Kam Hing and Tan Chee Beng (Eds.). The Chinese in Malaysia [M], Shah Alam: Oxford
University Press.
[44] Hobday, M., 1995. Innovation in East Asia, [M] United Kingdom: Edward Elgar.
[45] Hult, G.T.M., Hurley, R.F. and Knight, G.A., 2004, Innovativeness: It’s Antecedents and Impact on
Business Performance[J]. Industrial Marketing Management, 33, 429-438.
[46] Hurley, R.F. and Hult G.T.M., 1998. Innovation, Market Orientation, and Organizational Learning :
An Integration and Empirical Examination. [J] Journal of Marketing, 62, 42-54.
[47] Ibrahim, H. and Samad, F. A. 2010. Family Business in Emerging Markets: The Case o f Malaysia.
[J] African Journal of Business Management, 4(13), 2586-2595.
[48] Lambrecht, J., 2005. Multigenerational Transition in Family Businesses: A New Explanatory
Model[J]. Family Business Review, 18(4), 267-282.
[49] Lansberg, I., 1999. Succeeding Generations: Realizing the Dream of Families in Business[M],
Boston: Harvard Business School Press.
[50] Lee, C. and Lee, G.C., 2007. SME innovation in the Malaysian Manufacturing Sector[J]. Economic
Bulletin, 12 (30), 1-12.
[51] Leonidou, L., Katsikeas, C. and Piercy, N., 1998, Identifying Managerial Influences on Exporting :
Past Research and Future Directions[J]. Journal of International Marketing, 6(2), 74-102.
[52] Liebeskind, J. P., 1996. Knowledge, Strategy and the Theory of the Firm[J]. Strategic Management
Journal, 17, 93-107.
[53] Liedholm, C. and Mead, D., 1987. Small Scale Industries in Developing Countries: Empirical
Evidence and Policy Implications Working Paper, Department of Agricultural Economics [M], USA:
Michigan State University.
[54] Lim, David, 1973. Economic Growth and Development in West Asia 1947–1970[M], Kuala Lumpur:
Oxford University Press.
[55] Lim, M.H., 1981. Ownership and Control of the One Hundred Largest Corporations in
Malaysia[M], Kuala Lumpur: Oxford University Press.
[56] Little, I. M. D., Mazumdar, D. and Page, J., 1987. Small Manufacturing Enterprises in Developing
Countries: A Comparative Study of India and Other Countries[M], New York, Oxford University
Press.
[57] McConaughy, D. L. and Phillips, G. M., 1999. Founder Versus Descendants: The Profitability ,
Efficiency, Growth Characteristics and Financing in Large Public, Founding-Family-Controlled
Firms[J]. Family Business Review, 12 (2), 123-132.
[58] MITI, 2006., Third Industrial Master Plan, 2006-2020[R], Ministry of International Trade and
Industry. Malaysia: MITI.
[59] Morck, R. and Masao Nakamura., 2003. Been There, Done That: The History of Corporate
Ownership in Japan. Finance Working Paper No. 20/2003, Brussels: European Institute of
Corporate Governance.
[60] Munari, F., Oriani, R. and Sobrero, M., 2010. The Effects of Owner Identity and External
Governance Systems on R&D Investments: A Study of Western European Firms [J]. Research
Policy, 39(8), 1093-1104.
[61] Ng, B.K. and Thiruchelvam, K., 2010, Nov. Patterns of Technological Innovation in Malaysia Small
and Medium Wooden Furniture Manufacturers: Learning and Linkages Capabilities[C], Paper
Presented at the Globelics 2010, 8th International Conference on Making Innovation Work for

60
Proceedings International Conference on Innovation and
Management, Malaysia 2016
Society: Linking, Leveraging and Learning Held on 1 November – 3 November 2010, University of
Malaya, Kuala Lumpur, Malaysia.
[62] Nonaka, I., 1994. A Dynamic Theory of Organizational Knowledge Creation [J]. Organization
Science, 5, 14-37.
[63] Okorafo, S. C., 1999. Internationalization of Family Businesses: Evidence from Northwest Ohio,
USA[J]. Family Business Review, 12, 147-158.
[64] Othman, Khairuddin, and Yeoh., 1986. An Overview of the Plastics industry in Malaysia[C], Paper
Presented at Workshop on Plastics Technology, Malaysia Industry Development.
[65] Piore, M. J., 1984. The Second Industrial Divide: Possibilities for Prosperity[M], USA: Basic books.
[66] Polanyi, M. E., 1966). The Tacit Dimension[M], London: Routledge and Kegan Paul.
[67] Porter, M.E., 1980. Strategy and the Internet[J]. Harvard Business Review, 62-78.
[68] Prais, S. J., 1976. The Evolution of the Giant Firm in Britain[M], Cambridge: Cambridge.
[69] Puthucheary, James J., 1960. Ownership and Control in the Malayan Economy [M], Singapore:
Eastern Universities Press.
[70] Rahman, R., 2006. Effective Corporate Governance (1st Eds.) [C], Shah Alam: University
Publication Centre (UPENA), UiTM Shah Alam, Malaysia.
[71] Schumpeter, J., 1934. The Theory of Economic Development[M], New York: Irwin University
Books.
[72] Searle, P., 1999. The Riddle of Malaysian Capitalism: Rent-Seekers or Real Capitalism? [M] St.
Leonards: Allen and Unwin.
[73] Sieh, L.M.L., 1982. Ownership and Control of Malaysian Manufacturing Corporations[M], Kuala
Lumpur: UMCB Publications.
[74] Swinth, R. and Vinton, K., 1993. Do Family-owned Business Have A Strategic Advantage in
International Joint Ventures? [J] Family Business Review, 6(1), 19-30.
[75] Tan, H. W. and Batra, G., 1995. Enterprise Training in Developing Countries: Incidence,
Productivity Effects, and Policy Implications[M], Washington DC: World Bank.
[76] Tan, T.W., 1982. Income Distribution and Determination in West Malaysia[M], Oxford: Oxford
University Press.
[77] Turner, K. L. and Makhija, M. V., 2006. The Role of Organizational Controls in Managing [M].
[78] Upton, N. B. and Heck, R. K., 1997. The Family Business Dimension of Entrepreneurship [M],
Entrepreneurship, Chicago, IL: Upstart Publishing Company.
[79] Velde, D.W., 2001, March. Policies Towards Foreign Direct Investment in Developing Countries:
Emerging Best-Practices and Outstanding Issues[C], Paper Presented a FDI Conference, ODI in
Wignaraja, G. (2002 Eds.). Competitiveness Strategy and Industrial Performance: A Manual for
Policy Analysis, Routledge, London, UK.
[80] Voss, C., 1998. Made in Europe: Small Companies [J]. Business Strategy Review, 9 (4), 1 -19.
[81] Vossen, R., 1999. Relative Strengths and Weaknesses of Small Firms in Innovation[J]. Journal of
International Small Business, 16(3), 88-94.
[82]Ward, J., 1987. Keeping the Family Business Healthy Continuing Growth, Profitability and Family
Leadership[M], San Francisco, CA: Jossey-Bass.
[83] Wazir, J.K., 2000. The Globalization of Southeast Asia and Rooted Capitalism[C]: Sino-Nusantara
Symbiosis in Menkhoff, T. & Solvay, G. (Eds.). Chinese Entrepreneurship and Asian Business
Networks, London: Routledge.
[84] Westhead, P. and Cowling, M., 1998. Family Firm Research: The Need for a Methodolog ical
Rethink[J]. Entrepreneurship Theory and Practice, 23(1), 31-56.
[85] Westhead, P., 2003. Company Performance and Objectives Reported by First and Multi-Generation
Family Companies: A Research Note[J]. Journal of Small Business and Enterprise Development, 10
(1), 93-105.
61
Proceedings International Conference on Innovation and
Management, Malaysia 2016
Critical Success Factors (CSFs) of ERP Implementation:
A Study with TRIZ Perception Mapping
Teck Loon LIM, Mee Yee KOW, Akbariah MAHDZIR, Nooh ABU BAKAR
Malaysia-Japan International Institute of Technology, Universiti Teknologi Malaysia, Malaysia,
(E-mail: [email protected], [email protected], [email protected],
Abstracts Manufacturing solution like Enterprise Resources Planning (ERP) is designed for the
manufacturing organization to streamline business operation by offering a suite of software modules for
business and process improvement. Literatures showed that the success rate of the ERP projects was lesser
than half because the ERP implementation process was rather complex and related to the issues that were
difficult to address like people, process and methodology. There was not much specific finding on the
relationship of the critical success factors (CSFs) and strategic intervention on people, process,
methodology, technology and infrastructure as the best approaches. Hundreds of CSFs were identified
however it was difficult to find literatures on specific CSFs that were indicated as the “most critical success
factors” to address. In this paper, the authors employed content analysis on literatures to identify CSFs
of ERP implementation based on research articles published between years 2005-2016. The constant
comparative methodology was then used to harmonize the 332 identified CSFs to 90 CSFs. TRIZ
perception mapping technique was then used to narrow down the search for the “most critical CSFs”. The
results showed the most critical CSFs of ERP implementation were “benchmark implementation progress
on clear milestone and performance metrics”, “project champion”, “competence project team”, “ERP
system capability” and “user acceptance”. The research findings also showed TRIZ perception mapping
could help to improve the quality of the research output on CSFs studies.
Key words TRIZ Perception Mapping (PMap), Critical Success Factors (CSFs), ERP Implementation
1 Introduction Enterprise Resources Planning (ERP) is the manufacturing solution that is used by the
manufacturing enterprise for business and process improvement. In an effort to remain competitive, there
has been an increasing need in organizations to connect the information supplied by each department into
a common entity [1], [2]. ERP systems are designed for the manufacturing organization to address the
problem of information fragmentation as they integrate and streamline internal processes by providing a
suite of software modules that cover all functional areas of a business [3]. However, increasingly we hear
of the failures of ERP implementations, or the complete abandonment of the system [4], [5]. Resultantly,
there has been expanded research focusing on the implementation process and its critical success factors
(CSFs) [6]–[9].
There are CSFs compilation, classification and taxonomy made available and they are intended
to be used as good reference guide for ERP projects implementation [10]. CSFs shall enhance the
probability of achieving higher success levels and, resultantly in timesaving, cost savings, quality and
efficiency in their ERP system implementation [11]. However, the compilation of CSFs listing is typically
long and there are not many specific findings on the relationship of the CSFs and its strategic intervention
on people, process and methodology as the best approaches. There was none of the CSFs specifically
indicated as the “most critical factors to address” [12]. Some of the CSFs case studies also found out there
was no specific resolution given to attend the CSFs [13]. This has resulted in raised of the research question: “Out of so many CSFs identified through literatures, which CSFs are the most critical ones
and should be putting highest attention in ERP implementation?”

62
Proceedings International Conference on Innovation and
Management, Malaysia 2016
This aim of this study was indented to find the answers for the research question in order to
identify the most critical CSFs of the ERP implementation that would be more understandable and helpful
to the practitioners in the industry. Our research work presented in this paper entailed two methodologies:
the first involved the literature review study on CSFs; and the second related to the analysis and synthesis
for the most critical CSFs. The results of the findings on the most critical CSFs were summarized in the
last section of the article.
2 Literature Review Researches in earlier 80’s had indicated CSFs were those few things that must go well and must
be given special and continual attention by a manager or an organization to bring about high performance
to ensure success [14]. CSFs definition by Rorster & Rockart was “the limited number of areas in which
results, if they are satisfactory, will ensure competitive performance for the organization” [15]. For a
management team, a CSF processed a clear, explicit, and shared understanding of the organization's
business environment and the actions which were necessary [15]. The CSFs concept promised a
systematic way of identifying the key areas, or signposts, that required the constant an d careful attention
of management in order to achieve performance goals [12].
The success rate of the ERP system implementation was low even though companies did not
show the failure of their implementation. The literatures showed there were different factors influence
either positively or negatively on the successful implementation of the ERP, and CSFs were the reasons
that determined the successful implementation [6], [16]. There were 3 stages of ERP implementation as
indicated: pre-implementation, implementation and post-implementation and the CSFs occurred in all
implementation phase stated above [6]. ERP solution implementation was complex and hence CFSs
system processes were related to system selection process, project management process, implementation
strategy, and success measure process [17]. Since the ERP system was used by the end users, CSFs were
associated with users, project team, top management, consultants and vendors [18]. Different set of CSFs
could be categorized under different classification to suite ERP projects lifecycle for different industry
either SMEs or large organization, CSFs taxonomy were compiled the for ease of reference and providing
good guideline for practitioners [10]
A comprehensive search through the relevant literatures for the past 12 years ranging from 2005
to 2016 for the articles from journals and conference proceedings found numbers of research articles that
discussing on CSFs compilation, classification and taxonomy. Research conducted by Finney & Corbett
(2007) over hundreds of journals using key terms search identified 45 CSFs articles. CSF constructs were
then identified using content analysis methodology and inductive coding technique to identify 9 strategic
CSFs and 17 tactical CSFs with total of 26 CSFs [11]. Ngai et. al. (2008) conducted similar search for
relevant literatures for 10 countries/regions and identified 18 CSFs from the 48 related articles, and ‘top
management support’ and ‘training and education’ were found the most frequently cited as the critical
factors [19]. Dezhar and Sulaiman (2009) reviewed 95 articles and identified 17 taxonomy of CSFs
through the literature review [10]. Ahmad et. al (2013) presented the results of a study to identify and
analyze the interrelationships of the critical issues involved in the implementation of ERP in small and
medium sized enterprises (SMEs) [20]. In their findings, the CSFs were mainly contributed by 18
organization factors, 2 neutral factors, and 12 operational factors with total of 33 CSFs. Ram and
Corkindal (2014) search through 236 articles and found out 15 CSFs for the post implementation that
associated with post-implementation performance improvements. Their study showed that still remained
many proposed CSFs that needed to be robustly empirically tested for their actual influence on some
aspect of ERP success [21]. Saade and Nijher (2016) searched for 37 case studies and extracted 64 CSFs
from literature and subsequent detailed analysis found a total of 22 factors that were distinct. The proposed
CSFs can be used by practitioners in five ways: assess implementation of an ERP; ex-ante assessment;
comparative analysis with other implementation experiences; utilize CSFs from model as part of key
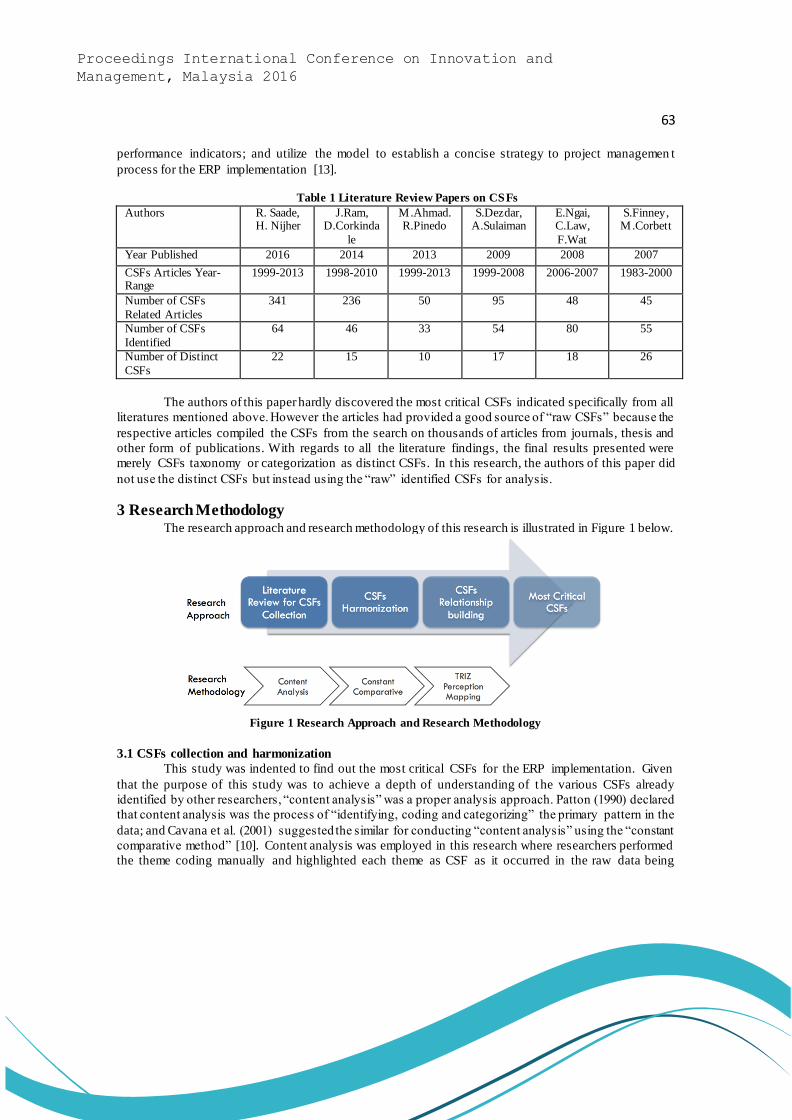
63
Proceedings International Conference on Innovation and
Management, Malaysia 2016
performance indicators; and utilize the model to establish a concise strategy to project managemen t
process for the ERP implementation [13].
Table 1 Literature Review Papers on CSFs
Authors R. Saade, H. Nijher
J.Ram, D.Corkinda
le
M.Ahmad. R.Pinedo
S.Dezdar, A.Sulaiman
E.Ngai, C.Law,
F.Wat
S.Finney, M.Corbett
Year Published 2016 2014 2013 2009 2008 2007
CSFs Articles Year-Range
1999-2013 1998-2010 1999-2013 1999-2008 2006-2007 1983-2000
Number of CSFs
Related Articles
341 236 50 95 48 45
Number of CSFs
Identified
64 46 33 54 80 55
Number of Distinct
CSFs
22 15 10 17 18 26
The authors of this paper hardly discovered the most critical CSFs indicated specifically from all
literatures mentioned above. However the articles had provided a good source of “raw CSFs” because the
respective articles compiled the CSFs from the search on thousands of articles from journals, thesis and
other form of publications. With regards to all the literature findings, the final results presented were
merely CSFs taxonomy or categorization as distinct CSFs. In this research, the authors of this paper did
not use the distinct CSFs but instead using the “raw” identified CSFs for analysis.
3 Research Methodology The research approach and research methodology of this research is illustrated in Figure 1 below.
Figure 1 Research Approach and Research Methodology
3.1 CSFs collection and harmonization
This study was indented to find out the most critical CSFs for the ERP implementation. Given
that the purpose of this study was to achieve a depth of understanding of t he various CSFs already
identified by other researchers, “content analysis” was a proper analysis approach. Patton (1990) declared
that content analysis was the process of “identifying, coding and categorizing” the primary pattern in the
data; and Cavana et al. (2001) suggested the similar for conducting “content analysis” using the “constant
comparative method” [10]. Content analysis was employed in this research where researchers performed
the theme coding manually and highlighted each theme as CSF as it occurred in the raw data being

64
Proceedings International Conference on Innovation and
Management, Malaysia 2016
perused. In this research, the 332 identified CSFs were used instead of the distinct CSFs because those
identified CSFs were considered “raw” CSFs.
The following steps were used to analyze the CSFs in the published articles. The first step of
content analysis was “data collection” that needs to determine which CSFs words or phrases will be
selected as themes and the search was within the compiled related CSFs from the literatures. The second
step was “open coding” where the raw data was coded to theme that allows first attempt of compressing
the mass of data into categories. This stage of the coding process involved determining whether to code
for a specific pre-determined set of CSFs or to permit for a more interactive coding approach. In this part
of the analysis, emphasis was placed on the words or phrase themselves and not on the meaning of the
words. The third step was “axial coding” that needed to work around the central axis of the CSFs until
where it was necessary to decide whether CSFs were to be coded exactly as they appeared, or if they could
be recorded in some changed to achieve the level of generalization. The forth step was “selective coding”
that needed to look for facts that illustrated or justified CSFs and then made a comparison and identifies
contrasts between sub CSFs and CSFs to allowed the researchers to investigate the relationships across
categories. The end of this process would produce a list of harmonized CSFs to be used in next step to
search for the most critical CSFs using TRIZ perception mapping.
3.2 TRIZ Perception Mapping (PMap)
The roots of the perception Mapping tool derives from the work on ‘flow-scaping’ done by
Edward de Bono [22]. The tool is a simple yet powerful way of making sense of the relationships between
the different attributes of problem [23]. Perception Mapping technique offers a systematic approach to
manage the emotional and perceptual complexities present in business problem situations involving
people. The tool uses the way human brain works in order to develop the lists of our perceptions about
the situation under evaluation, and then progresses to examine how each of these connects to the others .
[24]
The first step to do in TRIZ perception mapping was to identify and listing down and the
identified CSFs as possible most critical CSFs from the content analysis. The most possible critical CSFs
were then tabulated and indexed with a running number as illustrated in Table 2. The next process was
building the relation of the potential critical CSFs by pairing them. By starting from the first CSF in the
list, ask the question “what this will lead to?” and looked for the most possible of another potential CSF,
then indicated the “lead to” CSF number at the end column in the table. The process continued with the
second CSF and decided what it will lead to another potential CSF. The “lead to” CSF could be any other
CSFs or same as the previous step. The process continued until the last potential CSF in the table list. All
potential critical CSFs must have a “lead to” pair in the “lead -to” table, as illustrated in Figure 2.
Table 2 Perception Mapping Lead-To Table
CSF# CSF Description LEAD TO
1 CSF#1 2
2 CSF#2 3
3 CSF#3 4
4 CSF#4 1
5 CSF#5 10
6 CSF#6 5
7 CSF#7 8
8 CSF#8 9
9 CSF#9 10
10 CSF#10 1
11 CSF#11 6
12 CSF#12 6

65
Proceedings International Conference on Innovation and
Management, Malaysia 2016
Since it was difficult to visualize the linkages between each of the most possible critical CSFs,
next step was to perform a graphical perception mapping by drawing each CSF with an arrow sign for
each “lead to” pairs. The resulting perception map showed a system map of one attribute -pair leads to
another, leads to another and so on until one led back to the initial pair. The process was continued until
the last CSF was drawn in the perception map. Figure 3 illustrates the graphical view of the CSFs analysis
with perception mapping for Table 2.
Figure 2 Graphical Perception Mapping of CSFs
There were 2 significant points to be observed in the perception map. Firstly, the system in map
might contain at least one closed loop and all these closed-loops were significant (item #1, #2, #3, #4 in
Figure 2). Secondly, there were possibilities that several root cause pairs of the “lead -to” could be pointing
to a same connection point in the perception map, these were called the “collector points”, as indicated
as item #1, #6, #10 in Figure 2. Those CSFs collector points would be the most possible critical CSFs that
we were searching for. Collector points could be the potential most critical CSFs as the other CSFs were
merely perception and ultimately lead to the most critical CSFs [25].
4 Data Collection, Analysis and Results 4.1 Data collection
The data collection was based on the journal articles that focused on the CSFs compilation
through literature reviews. The research papers that searched through were the research articles published
from 2005 to 2016. After the detail reviews, the chosen articles were publication from S.Finney &
M.Corbett (2007) [11], E.Ngai, and C.Law & Wat (2008) [19], S.Dezdar & A.Sulaiman (2009) [10],
M.Ahmad & R.Pinedo (2013) [20], J.Ram et. al. (2013) [21], and R. Saade & H. Nijher (2016) [13]. Total
of 332 CSFs were identified in the first stage of data collection.
4.2 Data analysis
With the collected raw “CSFs”, constant comparison analysis was performed. After details
analysis and harmonization, a total of 90 CSFs were harmonized as listed in Table 3.
Table 3: Perception Mapping Table of CSFs
NO Critical Success Factors
(CSFs)
Lead
To
NO
Critical Success Factors
(CSFs)
Lead
To
1 Appropriate business and IT
legacy systems 4
46 Managing consultants 56
2 Business plan/vision/
goals/justification 1
47 Staff retention 38
3
2
1
4 10
98
5
7
6
11
12
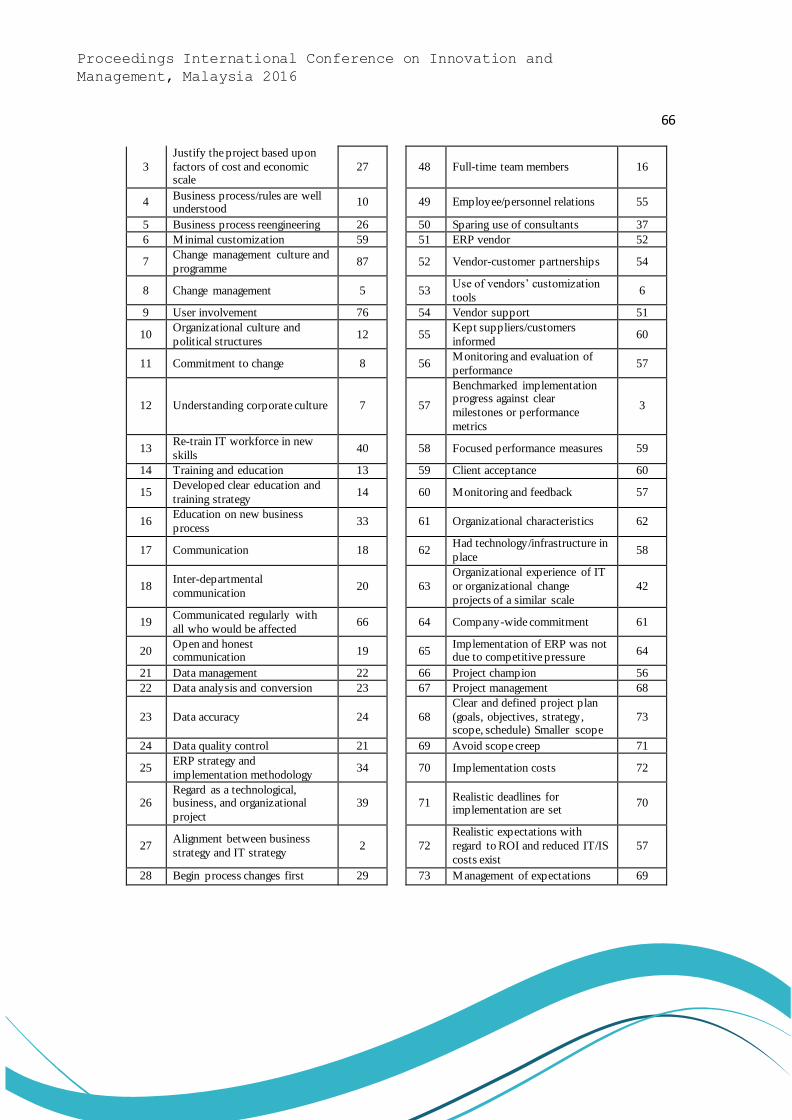
66
Proceedings International Conference on Innovation and
Management, Malaysia 2016
3
Justify the project based upon
factors of cost and economic scale
27
48 Full-time team members 16
4 Business process/rules are well understood
10
49 Employee/personnel relations 55
5 Business process reengineering 26 50 Sparing use of consultants 37
6 Minimal customization 59 51 ERP vendor 52
7 Change management culture and
programme 87
52 Vendor-customer partnerships 54
8 Change management 5
53 Use of vendors’ customization
tools 6
9 User involvement 76 54 Vendor support 51
10 Organizational culture and
political structures 12
55
Kept suppliers/customers
informed 60
11 Commitment to change 8
56 Monitoring and evaluation of
performance 57
12 Understanding corporate culture 7
57
Benchmarked implementation progress against clear
milestones or performance
metrics
3
13 Re-train IT workforce in new
skills 40
58 Focused performance measures 59
14 Training and education 13 59 Client acceptance 60
15 Developed clear education and
training strategy 14
60 Monitoring and feedback 57
16 Education on new business
process 33
61 Organizational characteristics 62
17 Communication 18
62 Had technology/infrastructure in
place 58
18 Inter-departmental
communication 20
63
Organizational experience of IT
or organizational change
projects of a similar scale
42
19 Communicated regularly with
all who would be affected 66
64 Company-wide commitment 61
20 Open and honest communication
19
65 Implementation of ERP was not due to competitive pressure
64
21 Data management 22 66 Project champion 56
22 Data analysis and conversion 23 67 Project management 68
23 Data accuracy 24
68
Clear and defined project plan
(goals, objectives, strategy, scope, schedule) Smaller scope
73
24 Data quality control 21 69 Avoid scope creep 71
25 ERP strategy and
implementation methodology 34
70 Implementation costs 72
26 Regard as a technological, business, and organizational
project
39
71 Realistic deadlines for implementation are set
70
27 Alignment between business
strategy and IT strategy 2
72
Realistic expectations with
regard to ROI and reduced IT/IS
costs exist
57
28 Begin process changes first 29 73 Management of expectations 69
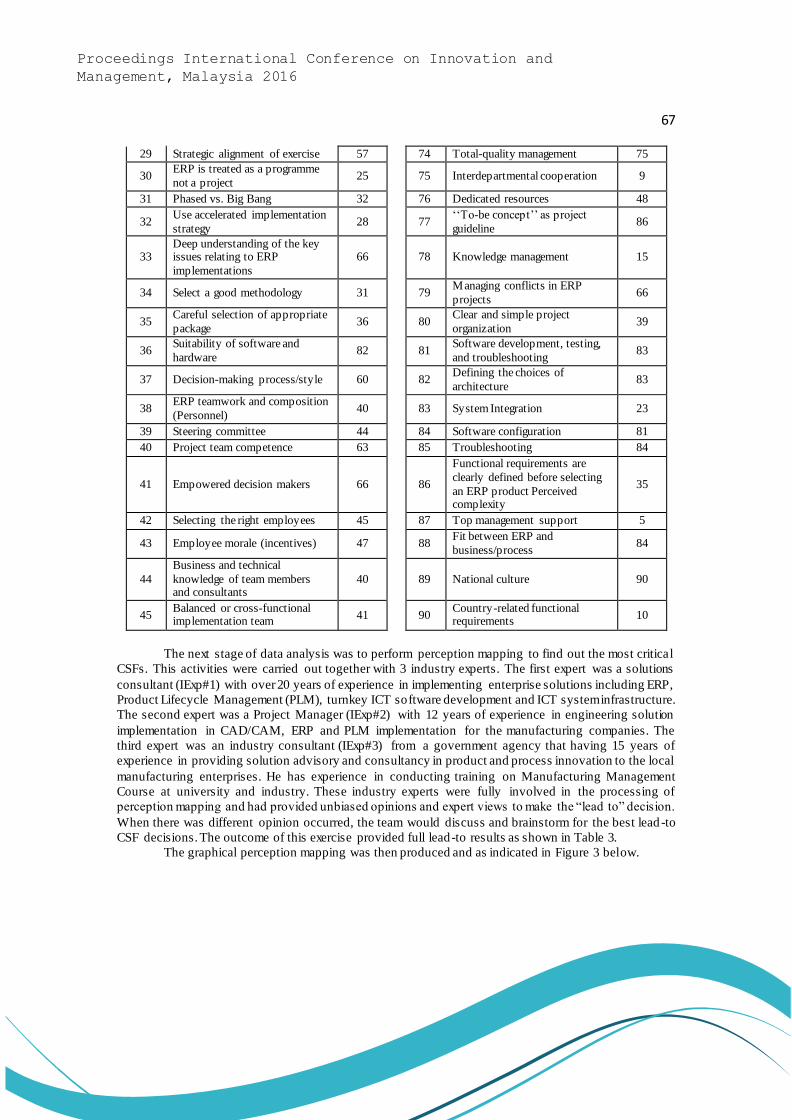
67
Proceedings International Conference on Innovation and
Management, Malaysia 2016
29 Strategic alignment of exercise 57 74 Total-quality management 75
30 ERP is treated as a programme
not a project 25
75 Interdepartmental cooperation 9
31 Phased vs. Big Bang 32 76 Dedicated resources 48
32 Use accelerated implementation
strategy 28
77
‘‘To-be concept’’ as project
guideline 86
33 Deep understanding of the key issues relating to ERP
implementations
66
78 Knowledge management 15
34 Select a good methodology 31
79 Managing conflicts in ERP
projects 66
35 Careful selection of appropriate
package 36
80
Clear and simple project
organization 39
36 Suitability of software and
hardware 82
81
Software development, testing,
and troubleshooting 83
37 Decision-making process/style 60
82 Defining the choices of
architecture 83
38 ERP teamwork and composition
(Personnel) 40
83 System Integration 23
39 Steering committee 44 84 Software configuration 81
40 Project team competence 63 85 Troubleshooting 84
41 Empowered decision makers 66
86
Functional requirements are
clearly defined before selecting
an ERP product Perceived complexity
35
42 Selecting the right employees 45 87 Top management support 5
43 Employee morale (incentives) 47
88 Fit between ERP and
business/process 84
44
Business and technical
knowledge of team members and consultants
40
89 National culture 90
45 Balanced or cross-functional implementation team
41
90 Country-related functional requirements
10
The next stage of data analysis was to perform perception mapping to find out the most critical
CSFs. This activities were carried out together with 3 industry experts. The first expert was a solutions
consultant (IExp#1) with over 20 years of experience in implementing enterprise solutions including ERP,
Product Lifecycle Management (PLM), turnkey ICT software development and ICT system infrastructure.
The second expert was a Project Manager (IExp#2) with 12 years of experience in engineering solution
implementation in CAD/CAM, ERP and PLM implementation for the manufacturing companies. The
third expert was an industry consultant (IExp#3) from a government agency that having 15 years of
experience in providing solution advisory and consultancy in product and process innovation to the local
manufacturing enterprises. He has experience in conducting training on Manufacturing Management
Course at university and industry. These industry experts were fully involved in the processing of
perception mapping and had provided unbiased opinions and expert views to make the “lead to” decision.
When there was different opinion occurred, the team would discuss and brainstorm for the best lead -to
CSF decisions. The outcome of this exercise provided full lead-to results as shown in Table 3.
The graphical perception mapping was then produced and as indicated in Figure 3 below.
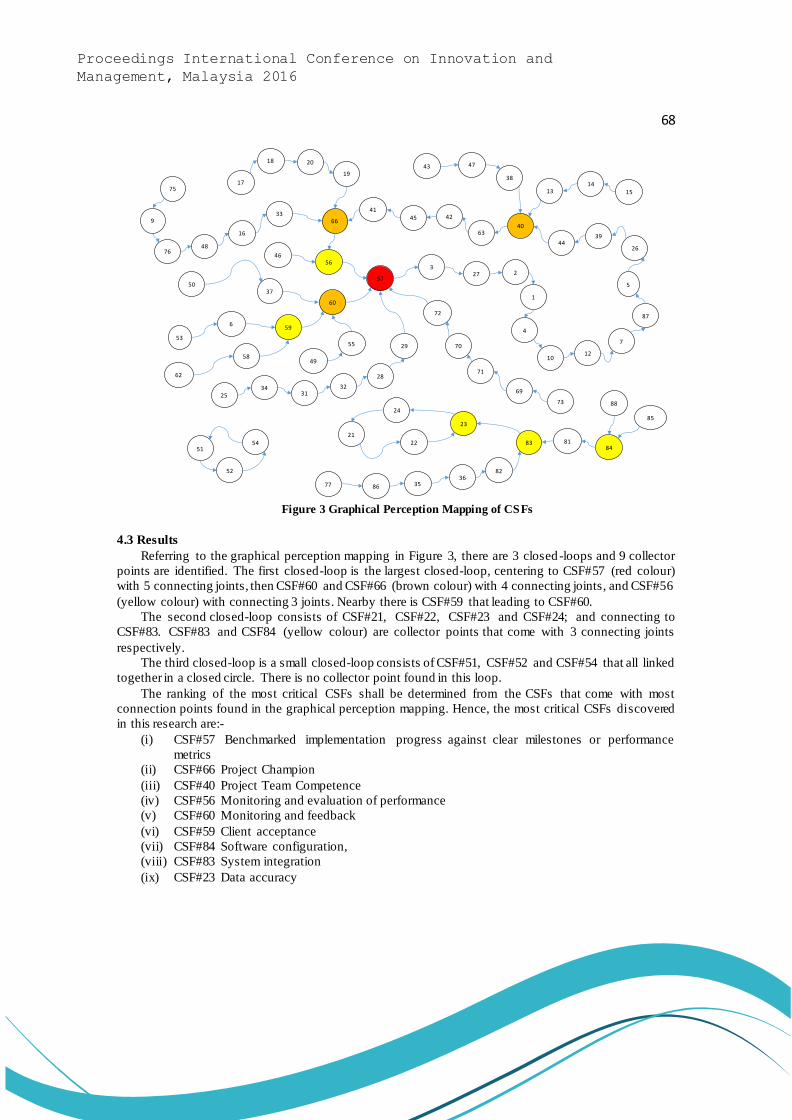
68
Proceedings International Conference on Innovation and
Management, Malaysia 2016
Figure 3 Graphical Perception Mapping of CSFs
4.3 Results
Referring to the graphical perception mapping in Figure 3, there are 3 closed -loops and 9 collector
points are identified. The first closed-loop is the largest closed-loop, centering to CSF#57 (red colour)
with 5 connecting joints, then CSF#60 and CSF#66 (brown colour) with 4 connecting joints, and CSF#56
(yellow colour) with connecting 3 joints. Nearby there is CSF#59 that leading to CSF#60.
The second closed-loop consists of CSF#21, CSF#22, CSF#23 and CSF#24; and connecting to
CSF#83. CSF#83 and CSF84 (yellow colour) are collector points that come with 3 connecting joints
respectively.
The third closed-loop is a small closed-loop consists of CSF#51, CSF#52 and CSF#54 that all linked
together in a closed circle. There is no collector point found in this loop.
The ranking of the most critical CSFs shall be determined from the CSFs that come with most
connection points found in the graphical perception mapping. Hence, the most critical CSFs discovered
in this research are:-
(i) CSF#57 Benchmarked implementation progress against clear milestones or performance
metrics
(ii) CSF#66 Project Champion
(iii) CSF#40 Project Team Competence
(iv) CSF#56 Monitoring and evaluation of performance
(v) CSF#60 Monitoring and feedback
(vi) CSF#59 Client acceptance
(vii) CSF#84 Software configuration,
(viii) CSF#83 System integration
(ix) CSF#23 Data accuracy
57
327 2
1
4
1012
7
87
5
26
3944
4063
424541
66
56
33
7648
9
75
16
46
1314
15
38
4743
60
5037
659
5355
4958
62
72
70
71
69
73
29
28
3231
3425
2018
17
19
21
24
23
2254
52
5183
8236
81
358677
84
85
88
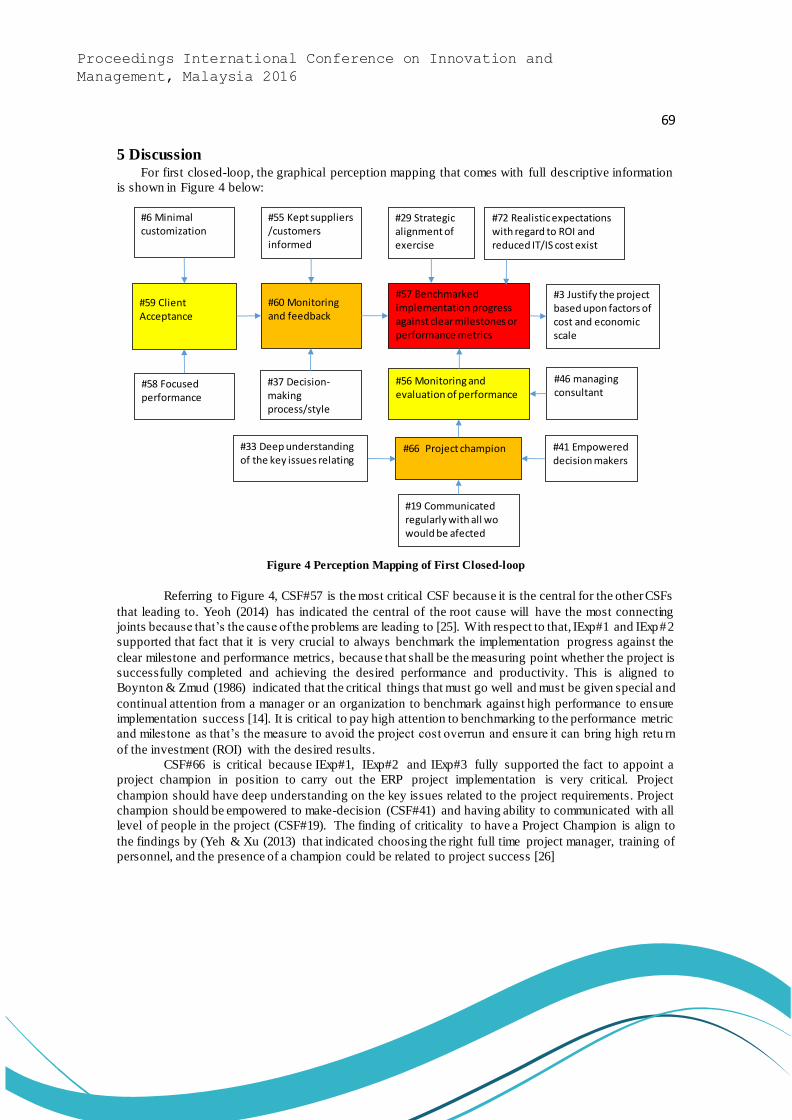
69
Proceedings International Conference on Innovation and
Management, Malaysia 2016
5 Discussion For first closed-loop, the graphical perception mapping that comes with full descriptive information
is shown in Figure 4 below:
Figure 4 Perception Mapping of First Closed-loop
Referring to Figure 4, CSF#57 is the most critical CSF because it is the central for the other CSFs
that leading to. Yeoh (2014) has indicated the central of the root cause will have the most connecting
joints because that’s the cause of the problems are leading to [25]. With respect to that, IExp#1 and IExp#2
supported that fact that it is very crucial to always benchmark the implementation progress against the
clear milestone and performance metrics, because that shall be the measuring point whether the project is
successfully completed and achieving the desired performance and productivity. This is aligned to
Boynton & Zmud (1986) indicated that the critical things that must go well and must be given special and
continual attention from a manager or an organization to benchmark against high performance to ensure
implementation success [14]. It is critical to pay high attention to benchmarking to the performance metric
and milestone as that’s the measure to avoid the project cost overrun and ensure it can bring high retu rn
of the investment (ROI) with the desired results.
CSF#66 is critical because IExp#1, IExp#2 and IExp#3 fully supported the fact to appoint a
project champion in position to carry out the ERP project implementation is very critical. Project
champion should have deep understanding on the key issues related to the project requirements. Project
champion should be empowered to make-decision (CSF#41) and having ability to communicated with all
level of people in the project (CSF#19). The finding of criticality to have a Project Champion is align to
the findings by (Yeh & Xu (2013) that indicated choosing the right full time project manager, training of
personnel, and the presence of a champion could be related to project success [26]
#57 Benchmarked implementation progress against clear milestones or performance metrics
#60 Monitoring and feedback
#59 Client Acceptance
#56 Monitoring and evaluation of performance
#3 Justify the project based upon factors of cost and economic scale
#6 Minimalcustomization
#29 Strategicalignment of exercise
#58 Focusedperformance
#55 Kept suppliers /customersinformed
#37 Decision-makingprocess/style
#72 Realistic expectations with regard to ROI and reduced IT/IS cost exist
#46 managing consultant
#66 Project champion #41 Empowered decision makers
#33 Deep understanding of the key issues relating
#19 Communicated regularly with all wo would be afected
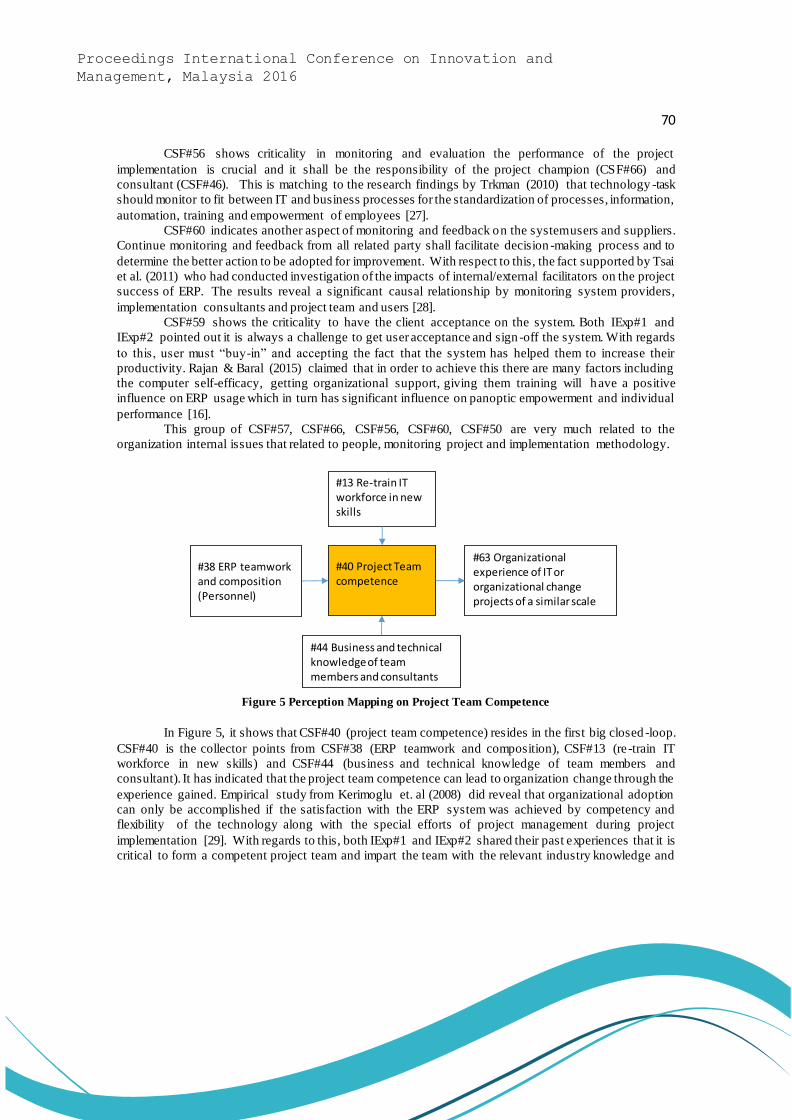
70
Proceedings International Conference on Innovation and
Management, Malaysia 2016
CSF#56 shows criticality in monitoring and evaluation the performance of the project
implementation is crucial and it shall be the responsibility of the project champion (CSF#66) and
consultant (CSF#46). This is matching to the research findings by Trkman (2010) that technology -task
should monitor to fit between IT and business processes for the standardization of processes, information,
automation, training and empowerment of employees [27].
CSF#60 indicates another aspect of monitoring and feedback on the system users and suppliers.
Continue monitoring and feedback from all related party shall facilitate decision -making process and to
determine the better action to be adopted for improvement. With respect to this, the fact supported by Tsai
et al. (2011) who had conducted investigation of the impacts of internal/external facilitators on the project
success of ERP. The results reveal a significant causal relationship by monitoring system providers,
implementation consultants and project team and users [28].
CSF#59 shows the criticality to have the client acceptance on the system. Both IExp#1 and
IExp#2 pointed out it is always a challenge to get user acceptance and sign -off the system. With regards
to this, user must “buy-in” and accepting the fact that the system has helped them to increase their
productivity. Rajan & Baral (2015) claimed that in order to achieve this there are many factors including
the computer self-efficacy, getting organizational support, giving them training will have a positive
influence on ERP usage which in turn has significant influence on panoptic empowerment and individual
performance [16].
This group of CSF#57, CSF#66, CSF#56, CSF#60, CSF#50 are very much related to the
organization internal issues that related to people, monitoring project and implementation methodology.
Figure 5 Perception Mapping on Project Team Competence
In Figure 5, it shows that CSF#40 (project team competence) resides in the first big closed -loop.
CSF#40 is the collector points from CSF#38 (ERP teamwork and composition), CSF#13 (re -train IT
workforce in new skills) and CSF#44 (business and technical knowledge of team members and
consultant). It has indicated that the project team competence can lead to organization change through the
experience gained. Empirical study from Kerimoglu et. al (2008) did reveal that organizational adoption
can only be accomplished if the satisfaction with the ERP system was achieved by competency and
flexibility of the technology along with the special efforts of project management during project
implementation [29]. With regards to this, both IExp#1 and IExp#2 shared their past experiences that it is
critical to form a competent project team and impart the team with the relevant industry knowledge and
#63 Organizational experience of IT or organizational change projects of a similar scale
#40 Project Team competence
#38 ERP teamworkand composition (Personnel)
#13 Re-train IT workforce in new skills
#44 Business and technical knowledge of team members and consultants
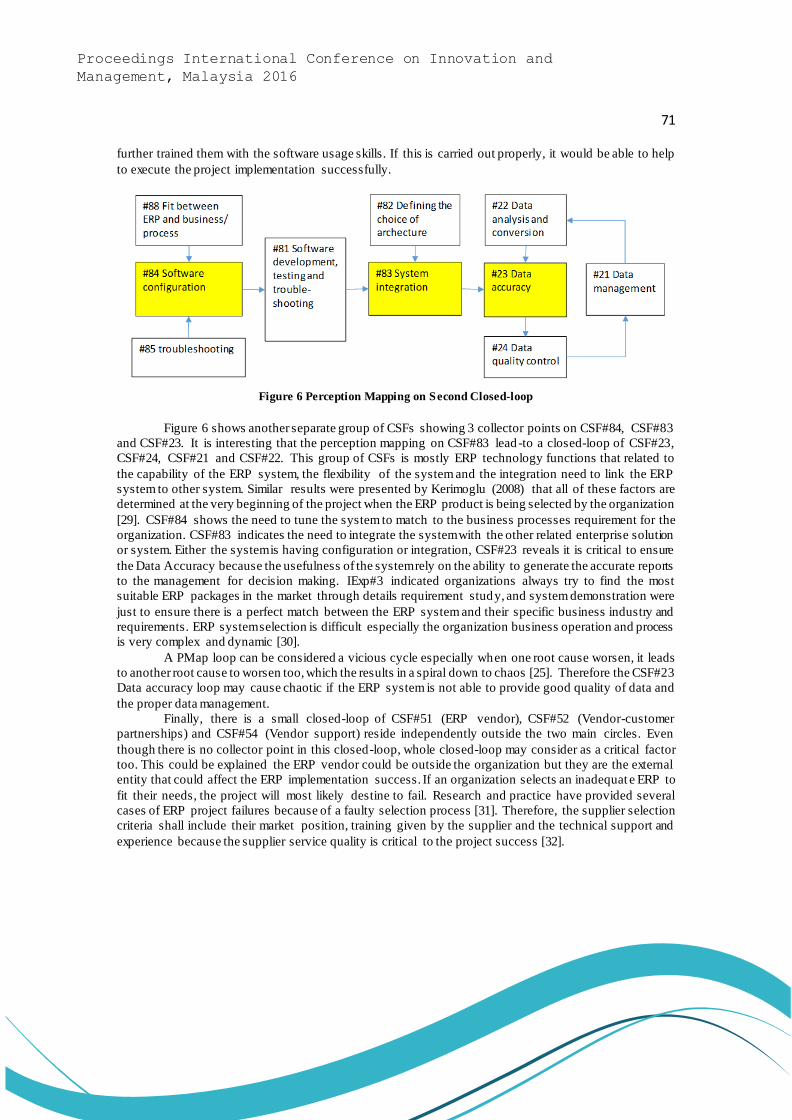
71
Proceedings International Conference on Innovation and
Management, Malaysia 2016
further trained them with the software usage skills. If this is carried out properly, it would be able to help
to execute the project implementation successfully.
Figure 6 Perception Mapping on Second Closed-loop
Figure 6 shows another separate group of CSFs showing 3 collector points on CSF#84, CSF#83
and CSF#23. It is interesting that the perception mapping on CSF#83 lead-to a closed-loop of CSF#23,
CSF#24, CSF#21 and CSF#22. This group of CSFs is mostly ERP technology functions that related to
the capability of the ERP system, the flexibility of the system and the integration need to link the ERP
system to other system. Similar results were presented by Kerimoglu (2008) that all of these factors are
determined at the very beginning of the project when the ERP product is being selected by the organization
[29]. CSF#84 shows the need to tune the system to match to the business processes requirement for the
organization. CSF#83 indicates the need to integrate the system with the other related enterprise solution
or system. Either the system is having configuration or integration, CSF#23 reveals it is critical to ensure
the Data Accuracy because the usefulness of the system rely on the ability to generate the accurate reports
to the management for decision making. IExp#3 indicated organizations always try to find the most
suitable ERP packages in the market through details requirement study, and system demonstration were
just to ensure there is a perfect match between the ERP system and their specific business industry and
requirements. ERP system selection is difficult especially the organization business operation and process
is very complex and dynamic [30].
A PMap loop can be considered a vicious cycle especially when one root cause worsen, it leads
to another root cause to worsen too, which the results in a spiral down to chaos [25]. Therefore the CSF#23
Data accuracy loop may cause chaotic if the ERP system is not able to provide good quality of data and
the proper data management.
Finally, there is a small closed-loop of CSF#51 (ERP vendor), CSF#52 (Vendor-customer
partnerships) and CSF#54 (Vendor support) reside independently outside the two main circles. Even
though there is no collector point in this closed-loop, whole closed-loop may consider as a critical factor
too. This could be explained the ERP vendor could be outside the organization but they are the external
entity that could affect the ERP implementation success. If an organization selects an inadequat e ERP to
fit their needs, the project will most likely destine to fail. Research and practice have provided several
cases of ERP project failures because of a faulty selection process [31]. Therefore, the supplier selection
criteria shall include their market position, training given by the supplier and the technical support and
experience because the supplier service quality is critical to the project success [32].
72
Proceedings International Conference on Innovation and
Management, Malaysia 2016
6 Conclusions The initial research in this study has given a good overview about the CSFs, CSFs taxonomy,
CSFs categories and its classifications. This research has achieved its objective that identified 9 most
critical CSFs from the 90 shortlisted CSFs candidates filtered through the literature reviews. The first
phase of the research compiled the CSFs through literature review on the articles that had searched
hundreds of researches articles on CSFs from research publications. This has given 332 raw CSFs and had
provided sufficient sampling of data for analysis. The subsequent harmonization using constant
comparative methodology had filtered down to 90 CSFs for further investigation. The second phase of the
research using TRIZ Perception mapping had allowed the study on the relationship of the CSFs that c ould
further helping us to narrow down the search for the most critical CSFs.
Based on the outcome of the study, the 9 most critical CSFs can be further consolidated to 5 most
critical CSFs as followings. This shall answer the research question of this research.
#1 Benchmark implementation progress on clear milestone and performance metrics – A close
monitoring of performance review and evaluation on ERP systems implementation can in turn lead
to the achievement of all the business desired goal and object ives.
#2 Project Champion – appoint a dedicated project champion to lead the ERP implementation. Project
champion should have deep understanding of operation of the organization and the key issues related
to the project requirements. Project champion shall be empowered to make-decision and have ability
to communicate with all level of people. Project champion shall conduct regular evaluation and
monitoring the performance.
#3 Competence project team – setup of competence project team can lead to the success of ERP
implementation that can be resulted organization change. Hence the project team shall consist of a
pool of competent members that has been given sufficient training and knowledge transfer to
implement the ERP software.
#4 User Acceptance – End user must “buy-in” to accepting the system and “hands -on” to use the system
to improve their productivity. Project team shall continue to monitor their satisfaction level and give
positive influence on the usage to the others.
#5 ERP System Capability – try to get a right and perfect match for the most suitable ERP system.
The ERP system shall be easy to learn up, easy to configure, tune or customize to bridge -up the
business requirement gap, and to generate accurate reports for decision-making. Select a vendor with
track records to provide a capable system to suite the organization is very crucial.
The limitations of this study comprise the difficulty to conduct generalizations on the CSFs compiled
from the literature articles and the process of making decision on the CSF lead-to in perception mapping.
Therefore the industry experts were invited to participate in the data analysis in order to get some expert
views in the decision making process.
The novelty of this research is using TRIZ perception mapping is new in CSFs study and this research
shows the methodology could help to narrowing down the search to improve the quality of the search
output for CSFs in ERP implementation. The approach can be used for the researches that come with
similar requirements in future.
References [1] J. Ram, D. Corkindale, and M.-L. Wu, ERP adoption and the value creation: Examining the
contributions of antecedents [J], J. Eng. Technol. Manag., vol. 33, no. 0, pp. 113–133, Jul. 2014.
[2] J. K. Nwankpa, ERP system usage and benefit: A model of antecedents and outcomes [J], Comput.
Human Behav., vol. 45, no. 0, pp. 335–344, Apr. 2015.
[3] J. Wei and Y.-S. Ma, Design of a feature-based order acceptance and scheduling module in an ERP

73
Proceedings International Conference on Innovation and
Management, Malaysia 2016
system [J], Comput. Ind., vol. 65, no. 1, pp. 64–78, Jan. 2014.
[4] P.-L. Poon and Y. T. Yu, Investigating ERP systems procurement practice: Hong Kong and
Australian experiences [J], Inf. Softw. Technol., vol. 52, no. 10, pp. 1011–1022, Oct. 2010.
[5] A. Elragal and M. Haddara, The Impact of ERP Partnership Formation Regulations on the Failure
of ERP Implementations [J], Procedia Technol., vol. 9, no. 0, pp. 527–535, 2013.
[6] A. Ijaz, R. N. Lodhi, and S. M. Irfan, A Qualitative Study of the Critical Success Factors of ERP
System - A Case Study Approach [C], in Proceedings of the 2014 International Conference on
Industrial Engineering and Operations Management Bali, Indonesia, January 7 – 9, 2014 A, 2014,
pp. 2556–2566.
[7] M. Al-Mashari, A. Al-Mudimigh, and M. Zairi, Enterprise resource planning: A taxonomy of
critical factors [J], Eur. J. Oper. Res., vol. 146, no. 2, pp. 352–364, Apr. 2003.
[8] A. Amid, M. Moalagh, and A. Zare Ravasan, Identification and classification of ERP critical
failure factors in Iranian industries [J], Inf. Syst., vol. 37, no. 3, pp. 227–237, May 2012.
[9] E. W. T. Ngai, C. C. H. Law, and F. K. T. Wat, Examining the critical success factors in the
adoption of enterprise resource planning [J], Comput. Ind., vol. 59, no. 6, pp. 548–564, Aug. 2008.
[10] S. Dezdar and A. Sulaiman, Successful enterprise resource planning implementation: Taxonomy of
critical factors [J], Ind. Manag. Data Syst., vol. 109, no. 8, pp. 1037–1052, 2009.
[11] S. Finney and M. Corbett, ERP implementation: a compilation and analysis of critical success
factors [J], Bus. Process Manag. J., vol. 13, no. 3, pp. 329–347, 2007.
[12] J. Ram and D. Corkindale, How ‘critical’ are the critical success factors (CSFs)? [J], Bus. Process
Manag. J., vol. 20, no. 1, pp. 151–174, 2014.
[13] R. G. Saade and H. Nijher, Critical success factors in enterprise resource planning systems - A
review of case studies [J], J. Enterp. Inf. Manag., vol. 1, pp. 72–96, 2016.
[14] A. C. Boynton and R. W. Zmud, An Assessment of Critical Succes s Factors [J], Sloan Manage.
Rev., vol. 25, no. 4, p. 17–, 1986.
[15] N. S. Forster and J. F. Rockart, Critical Success Factors: An annotated bibliography [J], MIT Sloan
Rev., no. 191, pp. 3041–3089, 1989.
[16] C. A. Rajan and R. Baral, Adoption of ERP sys tem: An empirical study of factors influencing the
usage of ERP and its impact on end user [J], IIMB Manag. Rev., vol. 27, no. 2, pp. 105–117, Jun.
2015.
[17] V. Bansal and A. Agarwal, Enterprise resource planning: identifying relationships among critical
success factors [J], Bus. Process Manag. J., vol. 21, no. 6, pp. 1337–1352, 2015.
[18] P. Lech, Causes and remedies for the dominant risk factors in Enterprise System implementation
projects: the consultants’ perspective [J], Springerplus, vol. 5, no. 1, pp. 1 –12, 2016.
[19] E. W. T. Ngai, C. C. H. Law, and F. K. T. Wat, Examining the critical success factors in the
adoption of enterprise resource planning [J], Comput. Ind., vol. 59, no. 6, pp. 548–564, Aug. 2008.
[20] M. M. Ahmad and R. Pinedo Cuenca, Critical success factors for ERP implementation in SMEs
[J], Robot. Comput. Integr. Manuf., vol. 29, no. 3, pp. 104–111, Jun. 2013.
[21] J. Ram, D. Corkindale, and M.-L. Wu, Implementation critical success factors (CSFs) for ERP: Do
they contribute to implementation success and post-implementation performance? [J], Int. J. Prod.
Econ., vol. 144, no. 1, pp. 157–174, Jul. 2013.
[22] E. de Bono, Serious creativity [J], J. Qual. Particip., vol. 18, no. 5, p. 12, 1995.
[23] D. Mann, Common Ground - Synergies Between TRIZ, Perception Mapping and Kansei
Engineering [J], vol. 44, no. 1275, 2004.
[24] B. S. Nagendra and K. Prakasan, Balancing customer satisfaction and strategic organizational
devel- opment activities - An application of TRIZ techniques [C], TRIZCON 2007, 2007.
[25] T. S. Yeoh, Perception Mapping [M], in Systematic Innovation in Business & Management, First
Fruits Sdn. Bhd., 2014, p. 38.

74
Proceedings International Conference on Innovation and
Management, Malaysia 2016
[26] C.-H. Yeh and Y. Xu, Managing critical success strategies for an enterprise resource planning
project [J], Eur. J. Oper. Res., vol. 230, no. 3, pp. 604–614, Nov. 2013.
[27] P. Trkman, The critical success factors of business process management [J], Int. J. Inf. Manage.,
vol. 30, no. 2, pp. 125–134, Apr. 2010.
[28] W.-H. Tsai, M. J. Shaw, Y.-W. Fan, J.-Y. Liu, K.-C. Lee, and H.-C. Chen, An empirical
investigation of the impacts of internal/external facilitators on the project success of ERP: A
structural equation model [J], Decis. Support Syst., vol. 50, no. 2, pp. 480–490, Jan. 2011.
[29] O. Kerimoglu, N. Basoglu, and T. Daim, Organizational adoption of information technologies:
Case of enterprise resource planning systems [J], J. High Technol. Manag. Res., vol. 19, no. 1, pp.
21–35, 2008.
[30] B. Aslan, M. Stevenson, and L. C. Hendry, The applicability and impact of En terprise Resource
Planning (ERP) systems: Results from a mixed method study on Make-To-Order (MTO)
companies [J], Comput. Ind., vol. 70, no. 0, pp. 127–143, Jun. 2015.
[31] M. Haddara, ERP Selection: The SMART Way [J], Procedia Technol., vol. 16, no. 0, pp. 394–403,
2014.
[32] W.-H. Tsai, P.-L. Lee, Y.-S. Shen, and H.-L. Lin, A comprehensive study of the relationship
between enterprise resource planning selection criteria and enterprise resource planning system
success [J], Inf. Manag., vol. 49, no. 1, pp. 36–46, Jan. 2012.
75
Proceedings International Conference on Innovation and
Management, Malaysia 2016
Problem Solving Process in Malaysia Automotive Industry
Mohd Yusri Mohd Yusof
Management of Technology Department, Malaysia-Japan International Institute of Technology,
Malaysia1
(Email: [email protected])
Abstract Purpose of this research is to analyse the application of A3 Methodology in problem solving
process of Malaysian automotive manufacturing process. In this paper, the researcher analyse the
problem solving process between OEM of carmaker and its first-tier supplier. Based on the seven steps
of A3 Methodology, the analysis of current OEM practices in managing their defective part claim is
observed. The findings of this research are (i) OEM and supplier conducted problem validation on -site
as first process of the problem solving, (ii) OEM has provided the problem solving report template to
it’s suppliers which to ensure the problem solving analysis is properly recorded, (iii) the root cause
analysis was using 7 QC tools and 5 Why analysis, (iv) verification of supplier corrective action has not
been recorded in report template but recorded in separate minutes of meeting. From the findings result,
the application of A3 Methodology in problem solving process of Malaysian automotive manufacturing
process have not been fully practice between OEM and it’s suppliers. The researcher propose to enhance
the existing OEM problem solving report template with additional guideline of conducting problem
solving analysis and instruction to fill up the template.
Keywords A3 Methodology, Problem solving process, Root Cause Analysis (RCA), Containment
Action, Corrective action
1 Introduction
In the automotive manufacturing industry’s supply chain, carmakers are customers to suppliers.
As customers, the carmakers shall define its product requirements and specifications to its suppliers.
Suppliers are required to produce and deliver products according to customers’ requirements and
specifications. Defective products resulted to customers’ complaint or production stoppages.
According to Clause 8.3 of ISO 9001:2008 Requirements, the suppliers shall identify and control the
product that did not conform to product requirement (also known as defective product) to prevent its
unintended use or deliver to ‘customer’. The actions need to be taken are ‘immediate response’ to preclude
and eliminate the defective product and implement ‘corrective measures’ [1].
The question here is how do suppliers manage defective product discovered by customer?
Currently, most suppliers complain the difficulty in identifying the quality improvement processes in
order to manage and resolve the defective products problem. This is due to the lack of adequate methods
in determining the financial consequences of poor quality [2].
Quality improvement processes such as DMAIC, 8D Problem Solving and A3 Methodology are
prominent problem solving process among manufacturing suppliers. This research focuses on the A3
Methodology which is quality improvement processes that created little attention among researchers and
practitioners. It has been used to determine the root cause and define the corrective action in
manufacturing sector and services.
Initially, Toyota practitioners use A3 paper to make the quality improvement report in defect
elimination [3]. After sometime, the fundamentals of Plan-Do-Check-Action (PDCA) have been adapted
into the A3 report by Toyota management team in order to determine accurate root cause and corrective
action with correct quality tools [4][3]. Toyota has introduced the A3 thinking process (hereafter known
as A3 Methodology) to its suppliers for quality improvement process.
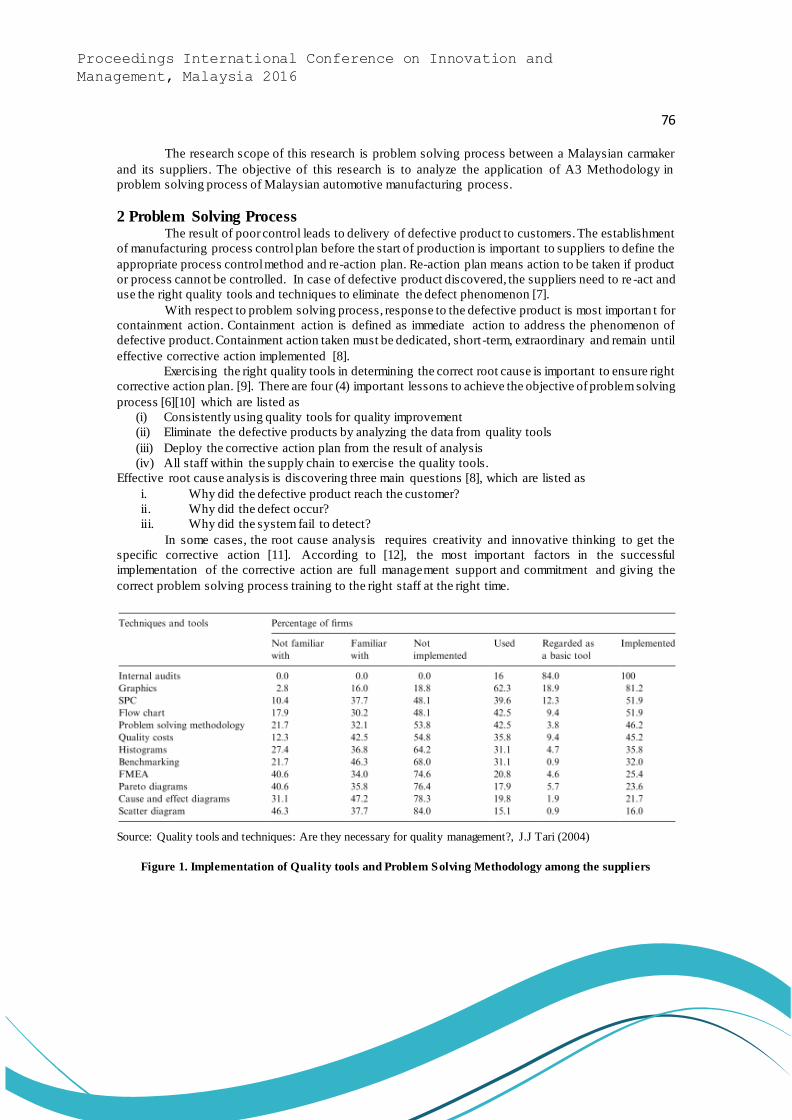
76
Proceedings International Conference on Innovation and
Management, Malaysia 2016
The research scope of this research is problem solving process between a Malaysian carmaker
and its suppliers. The objective of this research is to analyze the application of A3 Methodology in
problem solving process of Malaysian automotive manufacturing process.
2 Problem Solving Process The result of poor control leads to delivery of defective product to customers. The establishment
of manufacturing process control plan before the start of production is important to suppliers to define the
appropriate process control method and re-action plan. Re-action plan means action to be taken if product
or process cannot be controlled. In case of defective product discovered, the suppliers need to re -act and
use the right quality tools and techniques to eliminate the defect phenomenon [7].
With respect to problem solving process, response to the defective product is most importan t for
containment action. Containment action is defined as immediate action to address the phenomenon of
defective product. Containment action taken must be dedicated, short -term, extraordinary and remain until
effective corrective action implemented [8].
Exercising the right quality tools in determining the correct root cause is important to ensure right
corrective action plan. [9]. There are four (4) important lessons to achieve the objective of problem solving
process [6][10] which are listed as
(i) Consistently using quality tools for quality improvement
(ii) Eliminate the defective products by analyzing the data from quality tools
(iii) Deploy the corrective action plan from the result of analysis
(iv) All staff within the supply chain to exercise the quality tools.
Effective root cause analysis is discovering three main questions [8], which are listed as
i. Why did the defective product reach the customer?
ii. Why did the defect occur?
iii. Why did the system fail to detect?
In some cases, the root cause analysis requires creativity and innovative thinking to get the
specific corrective action [11]. According to [12], the most important factors in the successful
implementation of the corrective action are full management support and commitment and giving the
correct problem solving process training to the right staff at the right time.
Source: Quality tools and techniques: Are they necessary for quality management?, J.J Tari (2004)
Figure 1. Implementation of Quality tools and Problem Solving Methodology among the suppliers

77
Proceedings International Conference on Innovation and
Management, Malaysia 2016
Figure 1 shows 53% of suppliers have not implemented problem solving methodology in their
organization [12]. Due to that situation, it is recommended for suppliers to apply any problem solving
methodology like A3 Methodology. Mentioned below is the A3 Methodology found in literatures
2.1 Defective Product in Manufacturing Process
In manufacturing processes, ‘defect’ is one of the threats that leads to poor business performance
in term of quality, cost and delivery. When there are high percentage of defect s occurred in manufacturing
processes, managing defect is crucial to ensure the defect would not disseminate. From OEM’s defect
claim reports, the effects of defective product for examples parts cannot install, production stoppage,
rework and field return are critical to the customer process. Thus, the respective suppliers have to take
appropriate action to eliminate the defects and prevent recurrence. In many cases, defective products are
caused by ‘mistakes’ and there are several type of mistakes that frequently happened; (i) omitted process
(ii) processing mistake (iii) mistake in setting up workpiece, (iv) missing part (v) wrong part (vi)
processing the wrong workpiece (vii) mis -operation (viii) adjustment mistake (ix) equipment not set up
properly, and (x) tools and jigs improperly prepared [5].
Table 1. Type of Defects
Manufacturing Process Type of Defective Product
Plastic Injection Moulding White mark, Shrinkage, Short shot, Dimension error
Metal pressing Burr, Seizure, Scratch, Wrinkle, Dimension error
Welding Nut weld miss, pin hole, weld crack, detached
Assembly Part missing, part malfunction, appearance defect, misprocess Source: A Textbook of Manufacturing Technology: Manufacturing Processes, R.K Rajput (2007)
According to [6], defective products depend on the type of manufacturing processes. Table 1
shows the common type of defects in manufacturing processes.
2.2 The A3 Methodology Problem Solving
The A3 Methodology is a sequential thinking process adapted in Toyota to derive the Plan – Do
– Check – Action (PDCA) cycle in process improvement [3]. The thinking process started with Plan
stage which the team members need to fully understand the background of the problem or project [13].
At this stage, team members have to define also the status of the problem and the objective of future goal.
The team requires approval from management level to start with the next stage of Do and followed by
stage of Check [13]. The corrective action plan of A3 Methodology encourages to implement lean activity
such as 5S, Total Preventive Maintenance, Jidouka and Heijunka [14]. The verification of corrective
action effectiveness is required to ensure the problem of defective products is successfully executed. Only
if the corrective action plan is successfully implemented, new standard will change the current operating
procedures. After the change is made, the stage of Act is completed to close the PDCA cycle as a loop
[13]. Otherwise, the process begins from other new Plan stage [3].
Once the PDCA cycle is successfully completed, the practitioners will establish the A3 report for
record purposes. The term "A3" derives from the paper size used for the report, which is the metric
equivalent to 11" x 17" (or B-sized) paper. The A3 report for problem solving consist of six steps [15] [3]
as listed below
Step 1 – Theme and Background: The themes indicates the problem(s) being addressed to and they are
descriptive.
Step 2 – Current condition: The current problematic processes highlighted on the diagram and future
goal.
Step 3 – Root cause analysis: The analysis is using QC tools to define the root cause such as Why-Why
Analysis.

78
Proceedings International Conference on Innovation and
Management, Malaysia 2016
Step 4 – Countermeasure proposals / plan: The corrective action proposals to eliminate the root cause
of defective product.
Step 5 – Countermeasure execution plan: The schedule to execute the corrective action.
Step 6 – Follow up plan: The verification of corrective action execution.
As a conclusion, the analysis of PDCA in problem solving process is adequate for A3
Methodology application. The below section highlights the problem solving process in Malaysian
automotive manufacturing industry.
3 Methodology and Data Analysis The research on the application of problem solving process in automotive manufacturing industry
was conducted at one of Malaysia-Japan brand name carmaker. For the purpose of this research, the
carmaker is named as OEM and the organization applies A3 Methodology in its problem solving process.
The OEM’s defect claim reports to its suppliers from October 2014 until December 2014 have been
collected.
As a result, ten suppliers which are Malaysian owned companies operating more than 10 years
in the plastic product within automotive supply chain have been chosen. Each of the suppliers may have
one or more plastic product manufacturing process types which are injection molding, blow molding and
thermoforming.
Table 2. Defective product summary of 10 suppliers
Source: This research
CompanyNo. of
claimsType of defect Root cause
Short-shot Start-up sample mix part
Dented Start-up sample mix part
Part broken Customer false
Surface Un-even (wavy) Start-up sample mix part
Sink mark Start-up sample mix part
Short-shot Start-up sample mix part
Sink mark Start-up sample mix part
D 1 Weld line Irregular parameter setting
Sink mark Start-up sample mix part
Part broken Irregular parameter setting
Warping Irregular parameter setting
Dimensional error Mold worn out
Excessive material Mold worn out
Dimensional error Irregular parameter setting
Short shot Start-up sample mix part
Short-shot Start-up sample mix part
Dimensional error Start-up sample mix part
Dented Irregular parameter setting
Dimensional error Mold worn out
Part broken Mold worn out
J 1 Excessive material Irregular parameter setting
Total 21
A
B
I
2
3
2
2
3
2
3
2
C
E
F
G
H
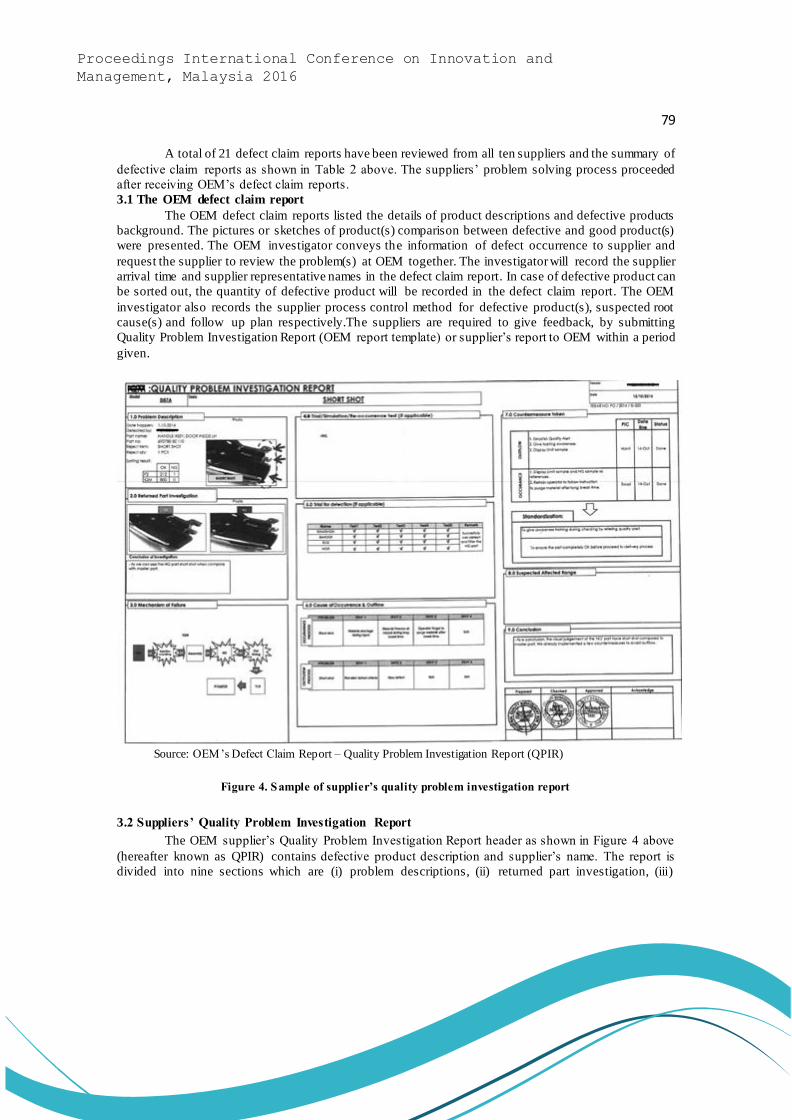
79
Proceedings International Conference on Innovation and
Management, Malaysia 2016
A total of 21 defect claim reports have been reviewed from all ten suppliers and the summary of
defective claim reports as shown in Table 2 above. The suppliers’ problem solving process proceeded
after receiving OEM’s defect claim reports.
3.1 The OEM defect claim report
The OEM defect claim reports listed the details of product descriptions and defective products
background. The pictures or sketches of product(s) comparison between defective and good product(s)
were presented. The OEM investigator conveys the information of defect occurrence to supplier and
request the supplier to review the problem(s) at OEM together. The investigator will record the supplier
arrival time and supplier representative names in the defect claim report. In case of defective product can
be sorted out, the quantity of defective product will be recorded in the defect claim report. The OEM
investigator also records the supplier process control method for defective product(s), suspected root
cause(s) and follow up plan respectively.The suppliers are required to give feedback, by submitting
Quality Problem Investigation Report (OEM report template) or supplier’s report to OEM within a period
given.
Source: OEM’s Defect Claim Report – Quality Problem Investigation Report (QPIR)
Figure 4. Sample of supplier’s quality problem investigation report
3.2 Suppliers’ Quality Problem Investigation Report
The OEM supplier’s Quality Problem Investigation Report header as shown in Figure 4 above
(hereafter known as QPIR) contains defective product description and supplier’s name. The report is
divided into nine sections which are (i) problem descriptions, (ii) returned part investigation, (iii)
80
Proceedings International Conference on Innovation and
Management, Malaysia 2016
mechanism of failure, (iv) trial/simulation/re-occurrence tests (if applicable), (v) trial for detection (if
applicable) (vi) causes of occurrence and outflow, (vii) corrective actions taken, (viii) suspected affected
range, and (ix) conclusion.
Section 1 of the QPIR describe the defective product description. For examples product name,
product number, car model, defect type, quantity of defective product and result of sorting activity. The
supplier’s findings between defective product and good product are presented at Section 2 and the supplier
states the conclusion of the investigation. Section 3 of the QPIR, where suppliers are highlighted the
effected manufacturing process of defective product. The supplier will focus on the highlighted process
as source of possible root cause.
In the QPIR Section 4 and Section 5, the suppliers are encourage to simulate the problem
occurrence and detection. The purpose is to confirm the problem phenomenon. Section 6 of QPIR is
showing the supplier’s analysis of problem root cause and the quality tool why -why analysis has been
used to determine the possible cause of defect and outflow. From the result of root cause analysis, the
supplier table out the corrective action proposals and announce the due date to complete the corrective
actions execution in Section 7. In this section, supplier will state the status and responsible staff of
corrective action execution. The supplier presented the process standardization in this section after the
corrective action taken is successful. Section 8 is for supplier to indicate the other process that effected to
the corrective action. Finally, the supplier will write the conclusion of the effectiveness of problem root
cause and the corrective action taken. From the research data analysis above, the researcher discusses the
finding of A3 Methodology application and problem solving process of automotive manufacturing
industry in following section.
4 Result The problem reviews between OEM and its suppliers are the process of ‘problem know-how’
which can be categorized as an initial step in problem solving process towards root cause analysis. It can
be defined as Plan stage of A3 Methodology process. The outputs of problem review between OEM and
its suppliers will provide the information of problem background, current conditions and future goals for
improvement. The information are recorded as Step 1 and Step 2 in A3 report.
As mentioned in the problem solving report of A3 Methodology, the root cause analysis categorized as
Plan stage of A3 Methodology and mentioned as Step 3 in A3 report. The research data shows the root
cause analysis begins with two steps as listed below;
(i) recognizing the effected manufacturing process and
(ii) eliminating the not-possible causes.
Within these steps, the suppliers are encourage to use two quality tools which are identified as process
flow diagram to recognize the effected manufacturing process and why-why analysis to eliminate the not
possible causes. From the research observations, the suppliers are also required to make simulation of
defect phenomena which A3 Methodology is not required.
Other research observations also found that the analysis of other manufacturing process data has
not been mentioned in QPIR. The example of manufacturing process data are process check sheets,
inspection check sheets, production reports, statistical process con trol sheets and material certifications.
Step 4 and Step 5 in A3 report is supplier’s corrective action plan and execution schedule which
categorized as Do and Check stages in A3 Methodology. In this step, the researcher found that suppliers
provided the corrective action plan to improve the defect occurrence and outflow. The suppliers’
corrective action plan also indicate the responsible staff, due date and status of the executions.
The other finding from this research, OEM verification on supplier corrective action have been
conducted and it was recorded separately in minute of meeting .
81
Proceedings International Conference on Innovation and
Management, Malaysia 2016
At the end of the problem solving stage, the researcher found that suppliers have made a few
changes in their operation standardization such as Work Instruction, Inspection Check sheet, Process
Flow, and foolproof as permanent corrective action.
There are several recommendations discuss in section below for future researchers or industrial
practitioners to improve the A3 Methodology application in problem solving proces s.
7 Conclusion and Recommendations The A3 Methodology has not been applied in full at the problem solving process between OEM and its
supplier. As a result, appropriate quality tools for root cause analysis and corrective action plan are
essential to ensure corrective action actions implemented accordingly. The suppliers have to consider the
availability of current resources and capability to execute the corrective action plan accordingly [16]. For
future research, it is recommended to the other researcher to explore and establish the problem solving
procesguideline and template including the root cause analysis and implement corrective action.
References [1] I. S. Organization, Quality Management System - Requirement ISO 9001, vol. 2008. 2008.
[2] K. Paxton, “Corrective Action in the real world,” Quality Progress ASQ, p. 184, 1996.
[3] D. K. Sobek and S. Art, Understanding A3 Thinking: A Critical Component of Toyota’s PDCA
Management System. CRC Press, 2011.
[4] K. Amoako-Gyampah and M. Acquaah, “Manufacturing strategy, competitive strategy and firm
performance: An empirical study in a developing economy environment,” Int. J. Prod. Econ., vol.
111, no. 2, pp. 575–592, Feb. 2008.
[5] C. M. Hinckley, “Defining the best quality-control systems by design and inspection,” Clin. Chem.,
vol. 43, no. 5, pp. 873–879, 1997.
[6] R. Rajput, A Textbook of Manufacturing Technology: Manufacturing Process. Firewall Media, 2007.
[7] D. Le Saux, “The Effective Use of Process Control Plans and Process Failure Mode Effects Analysis
in a GaAs Semiconductor Manufacturing Environment,” in CS MANTECH Conference, 2006, no.
781, pp. 31–34.
[8] R. Dan R, “Corrective Action Challenge - How to construct a robust problem solving process,”
Quality Progress ASQ, 2013.
[9] R. E. McQuater, C. H. Scurr, B. G. Dale, and P. G. Hillman, “Using quality tools and techniques
successfully,” TQM Mag., vol. 7, no. 6, pp. 37–42, 1995.
[10] R. E. Mcquater, B. G. Dale, M. Wilcox, and R. J. Boaden, “The Effectiveness of Quality
Management Techniques and Tools in the Continuous Improvement Process: An Examination,” in
Factory 2000 - Advanced Factory Automation , 1994, no. 398, pp. 574–580.
[11] T. L. Motschman and S. B. Moore, “Corrective and preventive action,” Transfus. Sci., vol. 21, no.
2, pp. 163–178, Oct. 1999.
[12] J. J. Tarı ́ and V. Sabater, “Quality tools and techniques: Are they necessary for quality
management?,” Int. J. Prod. Econ., vol. 92, no. 3, pp. 267–280, Dec. 2004.
[13] Ri. Maruta, “Maximizing Knowledge Work Productivity: A Time Constrained and Activity
Visualized PDCA Cycle,” Knowl. Process Manag., vol. 19, no. 4, pp. 203–214, 2012.
[14] C. J. Margerison, “Team Management Problem Solving,” Ind. Manag. Data Syst., vol. 88, no. 5/6,
pp. 12–14, 1988.
[15] N. Mohd Saad, “A3 Thinking Approach to Support Lean Product and Process Development,”
Cranfield University, 2013.
[16] M. Macot, “Corrective/Preventive Action: SImplified Process,” in ASQ Annual Quality COngress
Proceeding, 2003, p. 349.
82
Proceedings International Conference on Innovation and
Management, Malaysia 2016
The Effect of Entrepreneurship Training on the Capacity Building
Program of Kano State Enterprise Development Training Institutes
Muazu Hassan Muazu1, Najafi Auwalu Ibrahim2 1Centre for African Entrepreneurship Research
1Bayero Business School
Bayero University, Kano-Nigeria 2Othman Yeop Abdullah Graduate School of Business, Universiti Utara, Malaysia
(Email: [email protected], [email protected])
Abstract Kano state enterprise development training institutes were established with the expectation to
further promote and increase the number of small enterprises owners, improve the sustenance of small
businesses, and reduce unemployment in the society. The institutes have graduated many students some
of whom have ventured into businesses and others did not start any. Even those that have started hardly
sustain them beyond six months. It is against this backdrop, the study therefore aimed at understanding
the effect of entrepreneurship training on capacity building program with concerns to training quality,
trainers competence, and availability and functionality of training facilities in the institutes. A survey
research design was used, hence primary data were collected through questionnaire. A sample of 370
respondents were selected using convenient sampling technique. With the use of multiple regression
analysis, the results of the study showed that training quality, trainers’ competence and training facilities
have significant effect on capacity building effectiveness. The study thus recommended that the training
institutes should standardise the admission process, curricula and improve on post training support
activities. They should also determine trainers training needs and should send them for further training.
The institutes should provide up-to-date training facilities with effective maintenance mechanism. Also,
the study make some recommendations for future studies to in-corporate other effective variables like
government political will and funding that could explain the remaining variance in enterprise
development.
Key words Capacity-building, Entrepreneurship, Training, Trainers and Development
1 Introduction Globally, countries are using entrepreneurship development training as a tool in building and
improving capacities of their people to take on productive enterprises. It is increasingly becoming a means
in the creation of small enterprises as well as employment creation in developing economies. This
entrepreneurial drive and the benefits that comes with it, made Nigerian government to develop programs
and agencies to promote entrepreneurship training at various levels in the country. According to Davidson
et al, (2006) entrepreneurship development is very relevant in the economic development of countries
across the world. These productive enterprises can succeed in managing and growing their businesses if
they have the appropriate skills and expertise that would enable them carry out their daily business
undertakings effectively. The skills and expertise are often learned or acquired through capacity building
programmes.
Capacity building is the process whereby individuals, groups, and organisations abilities are
enhanced to mobilize and use resources in order to achieve their objectives on a sustainable basis (UNDP,
2002). Capacity building consists of activities designed to increase the competence and effectiveness of
individuals and organizations (Stryk, Damon, & Haddaway, 2011). These activities, such as
entrepreneurship training are intended to help participants acquire new skills, methods and capabilities of
creating new and growing their existing enterprises.

83
Proceedings International Conference on Innovation and
Management, Malaysia 2016
De Cenzo and Robbins (2007) argued that training is basically a learning experience, which seeks
a relatively permanent change in an individual’s skills, knowledge, attitudes or social behaviour.
Entrepreneurship development training is a personal development through which an enterprise culture can
be created into the minds of potential entrepreneurs (ILO/UNDP, 1990; Harper, 1993). It is therefore well -
recognised that training opportunities play a key role in cultivating future entrepreneurs and in developing
the abilities of existing entrepreneurs to grow their business to greater levels of success (Henry, Hill and
Leitch, 2003).
Evidence suggests that capacity building program has several positive effects. For example, the
participants in capacity building training experienced, as cited in (OECD, 2014), increased problem-
solving and decision-making abilities. Also experienced were improved interpersonal relationships,
teamwork, money management, enhanced social psychological development (i.e. self-esteem, ego
development, and self-efficacy) and improved creativity. Therefore, entrepreneurship training recognises
the importance of multiple intelligences and talents as prerequisites for creativity, innovation and
entrepreneurship (OECD, 2014). Entrepreneurship training is often viewed within the framework of
lifelong learning.
The notion that entrepreneurs are born, is rather weak, instead it is well recognised now that the
entrepreneurs can be created and nurtured (Kuratko, 2003). When these skills are learned through capacity
building program, the potential entrepreneurs could display change in personality traits, attitudes,
motivations and enterprising tendencies, which will in turn improve the performance of participants’
ventures. Very importantly, the effectiveness of the capacity building program should be an area of
concern. The effectiveness might be affected or influenced by the whole of the entrepreneurship training
process and activities, such as the quality and relevance of the training programme, trainer’s competence
and capabilities and facilities available in the institutes. Trainings could take the form of apprenticeship,
workshops, seminars, schools and or training institutes. Common among the trainings in Nigeria is that of
the training institutes, where people are kept for certain period of time to learn and acquire skills necessary
for their businesses development.
In view of the need to build the capacities of its people so as to encourage small business
development, create employment, reduce poverty level and to improve the economy of the state, as was
buttressed by (Tijjani-Alawiye, 2004; Izedonmi, 2009; and Unachukwu, 2009). Kano state government
established a number of training institutes in the state within the years of 2011-2013. The Kano state
entrepreneurship development institutes offer various programmes and have graduated many people.
Although the capacity building programmes covers people with existing businesses and those who may
start new enterprises, what is not clear is how effective are the capacity building programmes in
developing the desired entrepreneurship skills of the trainees.
Earlier researchers like Rae and Woodier-Harris (2012), highlighted a model for
entrepreneurship education and training that considered ‘effectiveness’ as the key outcome rather than
learning, hence it focused on issues that concerns training design and techniques, trainee mind-set,
capability and training effectiveness. An elaborate research on effectiveness of entrepreneurship training
has been provided by Colette, Hill and Leitch, (2005), they established that there are some difficulties
associated with the design of programs, as well as their objectives, content and delivery methods. There
is still room to conduct this research with additional variables such as trainers competence and training
facilities which were not covered by earlier studies, specifically in Kano state, Nigeria.
This study therefore tries to assess the effect of entrepreneurship training on capacity building
run by these institutes with emphasis on the process of the training as was supported by TIER model. It
is also aimed at understanding specifically the effects of training quality, trainers competence and training
facilities on capacity building effectiveness. It is therefore hypothesised that the quality and relevance of
training program has no significant relationship with capacity building effectiveness; Trainers’
professional competence and experience do not have any effect on capacity building effectiveness; and

84
Proceedings International Conference on Innovation and
Management, Malaysia 2016
availability and functionality of training facilities in the institutes has no effect on capacity building
effectiveness.
2 Literature Review Capacity building is the art of enhancing new and improved entrepreneurship skills. Capacity is
a dynamics involving a complex combination of attitudes, resources, strategies and skills, both tangible
and intangible (Schacter, 2000). Capacity is more of capabilities of performing certain tasks. Capacity
building is a complex notion – it involves individual and organisational learning which builds social
capital and trust, develops knowledge, skills and attitudes and when successful creates an organisational
culture which enables organisations to set objectives, achieve results, solve problems and create adaptive
procedures which enable it to survive in the long term (UNDP, 2002). According to ESRC (2012) capacity
building is a process where individuals, groups, networks, and organisations are encouraged and facilitated
in enhancing their knowledge and skills so as to increase their ability to perform innovative and high
quality social science research. As a process it involves imparting new and improved skills to individuals
or group of individuals. Capacity building can be defined narrowly in this context as the act of increasing
knowledge and skills for starting and growing enterprises and every other support (financial and enabling
environment). The capacities for enterprise development are built through certain activities such as
internship and training.
Entrepreneurship development training is a personal development through which an enterprise
culture can be created into the minds of entrepreneurs to be (ILO/UNDP, 1990; Harper, 1993). It is
therefore well-recognised that training opportunities play a key role in cultivating future entrepreneurs
and in developing the abilities of existing entrepreneurs to grow their business to greater levels of success
(Henry, Hill and Leitch, 2003). Considering its importance worldwide, entrepreneurship training is often
included in national curricula for vocational training in the European Union and other developed countries
(CEDEFOP, 2011). Not only Europe, countries like Nigeria had made it a compulsory course of study in
all tertiary institutions in the country.
The increasing desire to develop and nurture entrepreneurial attitudes and skills through training
necessitated the creation of training institutes and or development cen tres in many states of Nigeria.
According to (Bronte-Tinkew and Redd, 2001; Gibb, 2005) some key features of entrepreneurship training
are interdisciplinary of different settings; development of both soft and hard skills, and particularly the
combination of the two; Learning process is embedded in different contexts that are relevant for different
disciplines; and, Outcomes seek to foster entrepreneurial behaviours, skills and mind -sets.
Entrepreneurship skills such as idea development, problem-solving, network development, resource
management, risk management and leadership are often required competences and generally appeal to
trainees. At the same time, a more narrow set of skills are increasingly taught to support those trainees to
start-up a business. This includes, for example, learning how to draft a business plan, manage the day -to-
day operations of a business (e.g. accounting, management, commercial law, and marketing) and
complying with legal and regulatory requirements (e.g. business registration, filing taxes) (European
Commission, 2009).
The quality of training program comprises of the program structure, training course content and
the methods of conducting the training. Program structure comprises of pre-training, training and post
training activities. One of the major activities in the pre-training phase is the selection of participants and
their respective institutes to be trained in. Once the institutes or centres have been identified to have the
capacity for potential trainees, the program coordinator or the institutes undertakes promotional campaign
(Nwazor, 2012). Screening and selection of trainees could make training more qualitative because all
those selected would have to qualify through which certain traits can be identified and the tra inees would
therefore choose which profession or trade to be trained in. Training programmes undertaken without
adequate promotional campaign fails to evoke much response and this can be a major reason for the failure

85
Proceedings International Conference on Innovation and
Management, Malaysia 2016
of EDPs (Sebastian & Awasthi, 1992). This would enable wider reach to potential trainees who may wish
to enrol into the program.
Training course content is equally an element of training quality, because it shows necessary
skills to be taught in the training program. According to Brown (2000) as cited in the work of Azila -
Gbettor & Harrison, (2013) curriculum has to focus on the features that needed to be conceiving of both
business and technical skills. According to (Nwazor, 2012; Sebastian & Awasthi 1992; Singh, 1990) some
of the major inputs provided in a training content are; behavioural inputs like achievement motivation
training, communication skills, problem solving skills, interpersonal skills, creativity, decision making ,
etc. The objective of this input is to reinforce the motivation and entrepreneurial traits of the trainees. The
other input is to facilitate decision making process to set up a new venture, like business opportunity
guidance, information, project planning and technical inputs.Furthermore, Brown (2000) as cited in the
work of Azila-Gbettor & Harrison, (2013) maintain that the curriculum has to focus on the features that
needed to be conceiving of and starting a new business and or growing an existing enterprise. The said
skills includes technical, management, people skills, sales and marketing skills, time management skills
etc.
Another important factor is the training method. Even if the course or training content is perfectly
appropriate to the target group in question, the training can be rendered quite ineffective if the delivery
methods are not chosen well. To develop entrepreneurial practice requires methods capable of instilling
transversal entrepreneurial skills (Mwamisha & Wanjau, 2013). The way and manner to which the training
is being conducted is the method of training. Okudan & Rzasa (2006) posit that effective entrepreneurship
training should provide opportunities for participants to practice a combination of all the entrepreneurial
leadership components. These components have to do with role play or on the jo b training for the
participants. According to Brown (2000) entrepreneurship training and education should be viewed in
terms of the skills that can be taught and characteristics that can be engendered in trainees in order to help
them develop new and innovative plans for their future business endeavours. Romijn, (1989) argued that
different EDP seems to indicate that practical training, involving a variety of people who actually deal on
a day-to-day basis with the problems of small-scale businesses in different capacities is much more
successful than training that relies more on lectures by professional teachers.
Entrepreneurship development training requires a great deal in terms of competence and
experience on the part of the trainers. Increasingly, trainers are identified as the most important factor
influencing the quality of training (European Commission, 2013). Ideally, different sessions should be
conducted by specialists in different areas. According to Romijn, (1989) achievement motivation training
for instance requires considerable skills, which can only be offered by a mature trainer with a sound
background in psychology and lively interest in people. That is to say a professional trainer with bank of
experience makes more contribution to success of capacity building program. Donovan, Bransford &
Pellegrino (1999), in their review of training evaluation models from the economic and human resource
literature, pointed out that when dealing with the issue of human competence, trainers’ expertise is
critically important. Good quality entrepreneurship training requires qualified personnel responsible for
its conceptualisation and delivery; being qualified as a trainer for entrepreneurial skills means to be in
possession of highly developed individual competencies, in terms of personal and professional
knowledge, skills, attitudes and values. It also means being able to apply these competencies alone (i.e.
autonomously) and in interaction with participants and or other trainers (European Union, 2002).
2.1 The TIER model of Training Effectiveness Research
In this study the TIER model was used in accepting the basis to which this whole work was conducted.
According to Gregory& Thaddeus (2009) the TIER model systematically structures training effectiveness
research across four stages. Stages 1 and 2 are components of formative evaluation in which the objectives
and processes of training are conceptualized, drafted, and refined. During these stages, researchers explore
instructional alternatives to determine which are most appropriate for study. Stages 3 and 4 are
86
Proceedings International Conference on Innovation and
Management, Malaysia 2016
components of summative evaluation—a systematic attempt to determine whether the fully developed
training intervention is meeting its objectives as planned or desired (Scriven 1967, 1991) as cited in th e
work of Gregory& Thaddeus (2009). The model therefore means that research could be conducted at any
of the four stages outlined in figure 1 below.
Stage 1 Stage 2 Stage 3 Stage 4
Formative Research
Process Research
Outcome Research
Impact Research
Figure 1: Logical and progressive stages for training effectiveness research.
2.2 Study Variables Under the TIER Model
The TIER model regards five types of study variables as integral to training effectiveness research:
independent, dependent, modifying, intervening, and confounding variables (see Figure 1). Studies
depend on access to measurable data for these variables. This study considered only independent and
dependent variables under the TIER model.
Training Learning Action
Independent
Variables
Modifying, Intervening
and Cofounding Variables
Dependent
Variables
Figure 2 Variables influencing the effectiveness of the training-learning-action continuum
Independent variables are the working variables —that is, the training inputs and activities that are
implemented and studied. They are presumed to cause or influence certain training outcomes. Depending
on the study, independent variables could include timing, format, and location of training as well as
modifications to the training rationale, content, or educational approach under study (Gagné 1985) as
captured and developed in the work of Gregory& Thaddeus (2009). The Dependent variables on the other
hand are the intended aims of training, which are expected to result from exposure to the independent
variables. As exposure varies, results may differ, allowing effectiveness to be measured. The TIER model
differentiates between dependent variables that are immediate effects of training (termed "outcomes") and
dependent variables that are later-emerging effects of training (termed "impacts") (Mohr 1992) as put by Gregory& Thaddeus (2009). The TIER model was adapted as it positioned this current study on the second stage of the model. At the
second stage, the study focussed on the PROCESS stage as put by the model. The process stage study
says that training effectiveness study can be conducted on the learning elements such as program structure,
training methods and pedagogy, trainer’s competence and facilities for training.
3 Methodology Survey research design was used in carrying out this study because it involves collecting data in order to
test hypothesis or answer research questions. Three variables were identified to include capacity building
as the dependent variable and on the other hand, the independent variables are training quality, trainers’
competence and experience and training facilities.
87
Proceedings International Conference on Innovation and
Management, Malaysia 2016
The variables are represented by Y, X1, X2 and X3.
Y = f(X1, X2, X3 + u)
Yt = bo + b1X1 + b2X2 + b1X3 u … (Linear Form)
Figure 3: Research Conceptual Model
The population of the study covers the graduates of the eight (8) entrepreneurship training institutes in
Kano State. The number of graduates is upto 10000 people, hence a sample size of three hundred and
seventy (370) respondents was chosen based on Krejcie and Morgan (1970). A convenient sampling
technique was used in selecting the respondents, where closed- ended questionnaire was used as the
instrument, considering 5 point Likert scale interval in measuring the data.
Cronbach’s alpha statistics was used in testing the reliability of the instrument. It was measured on the
scale Pearson’s product moment correlation coefficient that varies between 0 and 1, so the closer the alpha
to 1.00 the greater the consistency of questions in the study instrument. Hence,0.60 Cronbach’s alpha was
adopted as supported by Hair et al., (2010).
The data analysis, inferential statistics specifically multiple regression was used, using SPSS software to
test the dependency of the relationship between the dependent and independent variables and was also
used to test the study hypothesis. Pearson’s correlation was used to explain the relationship between the
independent variables. Therefore the cronbach’s alpha obtained in this study for the dependent variable
(Capacity Building) is 0.621 and for the independent variables are 0.707, 0.749 and 0.731 for training
quality, trainers competence and training facilities respectively.
4 Results and Findings Response rate showsthat197 valid copies of the questionnaire were used for further analysis.
Thus, a response rate of 53% was achieved by this study. A response rate of 30% is acceptable for survey
studies (Sekaran, 2003; Hair, Black, Babin & Anderson, 2010).
Independent Variables Dependent Variable
Capacity
Building
Trainers Competence
Training Quality
Training Facilities

88
Proceedings International Conference on Innovation and
Management, Malaysia 2016
Table 1: Inter-correlation among Variables
Constructs 1 2 3 4
Capacity building 1
Training quality .502 1
Trainers competence .449 .235 1
Training facilities .390 .630 .415 1
**. Correlation is significant at the 0.01 level (1-tailed)
The values of Pearson correlation show the relationship between dependent variable (i.e.
Capacity building and independent variables (Training quality, Trainers competence & Training
facilities). Cooper and Schindler (2003) and Allison (1999) indicated that correlation of 0.80 or higher are
problematic despite the maximum of 0.75 acceptable by the rule of thumb.
Table 1 above, the highest correlation between independent variables was between training
quality and training facilities, which was significant at 0.01 level (r = 0.630, p<0.01). On the other hand,
the lowest correlation was between trainers competence and training facilities significant at 0.01 (r =
0.015, p<0.01) this indicates a weaker correlation. The correlation between dependent variable and
independent variables were all positive- showing significance at 0.01 for capacity building and training
quality (r = 0.502, p<0.01), capacity building and trainers competence (r = 0.449, p<0.01) and between
capacity building and training facilities (r = 0.309, p<0.01). Athough the correlation shows significance,
the coefficients were not large enough to cause collinearity problem as argued by Cooper and Schindler
(2003) and Allison (1999). Hence correlation between independent variables and the dependent variable
in this study did not go beyond the acceptable range and as such would not cause multicollinearity
problem.
To generate an ideal conclusion on the results of regression analysis that would enable
application of the model on another population of interest, would require a thorough examination of
normality, collinearity, linearity, homoscedasticity and independence of the residual (Hair, Black, Babin
& Anderson, 2010). The authors put it that, these assumptions are applicable to both dependent and
independent variables and their relationship as a whole.
The results of multiple correlation (R), squared multiple correlation (R2) and adjusted squared
multiple correlation (R2adj) shows how well the combination of independent variables predicts the
dependent variable. This study’s R² of 0.379 in table 3 above indicates that the variability in Capacity
building being the dependent variable was up to 37.9%. This means that the independent variables are
good predictors of capacity building effectiveness. The 1.887 Durbin Watson has fallen within the
acceptable range of 1.5 – 2.5 as recommended by Norusis (1999).
Table 2 : Model Summaryb
Model R R Square Adjusted R Square
Std. Error of the
Estimate Durbin-Watson
1 .616a .379 .369 1.83496 1.887
a. Predictors: (Constant), TRAININGFACILITY, TRAINERSCOMPETENCE, TRAININGQUALITY
b. Dependent Variable: CAPBUILDING
89
Proceedings International Conference on Innovation and
Management, Malaysia 2016
Table 3: ANOVAb
Model Sum of Squares df Mean Square F Sig.
1 Regression 392.427 3 130.809 38.849 .000a
Residual 643.115 191 3.367
Total 1035.541 194
a. Predictors: (Constant), TRAININGFACILITY, TRAINERSCOMPETENCE, TRAININGQUALITY
b. Dependent Variable: CAPBUILDING
Regression model is considered significant when it is 0.000 under Anova. Having Sig. F Change value
(F(3, 191) = 38.849, p< .0005 in table 4 shows that the model used in this study was appropriate as 0.000
significance value was attained.
4.1 Results of Multiple Regression (Hypotheses Testing)
This section presented results of the coefficients, meaning hypotheses testing concerning the
relationship between Enterprise development which is the dependent variable and independent variables
– training quality, trainers competence and training facility. To establish the actual effect of
independent variables on the dependent variable multiple regression analysis was conducted. In testing
the hypotheses developed for this study, the choice of p< .05 and p< .01 as level of significance was
adopted as put by (Cooper & Schindler, 2003; Hair et al., 2010).
Table 4 above showed that Trainers competence is having the highest Beta value of .420
indicating a strong prediction of the dependent variable. With standardized coefficient Beta of .420
relative to other predictors, Trainers competence emerged as the strongest predictor. This implies that
when all other independent variables are held constant, Trainers competence explains exactly 42 percent
variation in the dependent variable of this study. Training Quality appeared to be the second predictor
with Beta value of .251 relative to other predictors in this study’s model. Meaning that, should other
dependent variables be held constant, Training Quality explains 25.1 percent of the relationship with
Capacity building as the dependent variable of the study.
Table 4: Coefficientsa
Model
Unstandardized
Coefficients
Standardized
Coefficients
t Sig.
Correlations
Collinearity
Statistics
B
Std.
Error Beta
Zero-
order Partial Part
Toleranc
e VIF
1 (Constant) 6.443 1.03
7
6.212 .000
TRAININGQUALITY .097 .029 .251 3.321 .001 .467 .234 .189 .570 1.754
TRAINERSCOMPETE
NCE
.480 .069 .420 6.963 .000 .483 .450 .397 .895 1.117
TRAININGFACILITY .184 .075 .180 2.465 .015 .329 .176 .141 .610 1.639
a. Dependent Variable: CAPBUILDING

90
Proceedings International Conference on Innovation and
Management, Malaysia 2016
Additionally, at Beta point .180 in the coefficient table above indicated that Training Facilities
represent the lowest predictive power among the dependent variables. With 18 percent of the variation in
the dependent variable implies that whenever other variables are dropped Training Facilities explains the
weakest relationship in this study.
The multiple regression and the hypotheses testing results as indicated in table 4 and the model
summary in table 2 above showed that the independent variables were able to explain 37.9 percen t of the
variance in the dependent variable. Notwithstanding any other independent variables not used in this
study, the achieved R2 = 0.379 is adequate enough to predict variation in Capacity building for enterprise
development as the dependent variable of this study.
A detail investigation of the contribution of individual independent variables in the explanation
of the dependent variable showed that Training Quality with (β = 0.251, t = 3.321, p = 0.001), Trainers
Competence (β = 0.420, t = 6.963, p = 0.000) with significant contribution and Training Facilities with (β
= 0.180, t = 2.465, p = 0.015). With positive values of Beta, Sig. and t in the regression result, therefore
shows that all the null hypotheses of the study which states that “The quality and relevance o f training
program has no significant relationship with capacity building effectiveness”, “Trainers’ professional
competence and experience do not have any effect on capacity building effectiveness” and “Availability
and functionality of training facilities in the institutes has no effect on capacity building effectiveness” are
not supported and therefore considered rejected.
Table 5: Summary of the Study Hypotheses Testing
Null Hypothesis Statement of Null Hypothesis Remarks
Ho1 Trainers’ professional competence and experience do not have any effect on capacity Not Supported
building effectiveness.
Ho2 The quality and relevance of training program has no significant relationship with Not Supported
capacity building effectiveess.
Ho3 Availability and functionality of training facilities in the institutes has no effect Not Supported
on capacity building effectiveness.
As shown on the summary of findings of the hypothesis of this study, all the null hypotheses are deemed
rejected and the statements remain untrue as regards Capacity building effectiveness.
5 Discussion of Findings The results of this study were earlier presented in the previous section. The result shows clearly
that all the three (3) null hypotheses were dropped or rejected. This is because the independent variables
were found to be good predictors of capacity building effectiveness. In this section therefore, the
discussion on the finding would be based on the study objectives and hypotheses.
One of the objectives was to assess the quality of training programme run by the institutes and
its effects on capacity building effectiveness. This study finding is not in consistent with the null
hypotheses Ho1, which states that training quality has no significant relationship with capacity building
effectiveness. From the finding it shows that there is significant relationship between capacity building
and training quality, meaning that the higher the quality of training the better the effectiveness of capacity
building. This quality comprises of the manner trainees were selected, the training method used and the
post training support and follow-up rendered by the institutes. The more effective these factors are the
better the capacity building effectiveness. This therefore was in consistent with several previous studies
like (Romijn, 1989; Mwamisha & Wanjau, 2013; and Azila-Gbettor & Harrison, 2013) where they both
established that method and content of training are significant in training effectiveness.
91
Proceedings International Conference on Innovation and
Management, Malaysia 2016
Another objective of the study was to assess the professional competence and experience of the
trainers in the training institutes and how it affects capacity building effectiveness. Whereby the
corresponding null hypotheses Ho2 states that trainers professional competence and experience do not
have any effect on capacity building effectiveness. On the contrary, the result showed that, there is positive
relationship between trainers’ competence and capacity building, meaning that trainers’ competence has
great effect on capacity building effectiveness. This is in line with the sayings of Donovan, Bransford &
Pellegrino (1999), pointed out that when dealing with the issue of human competence, trainers’ expertise
is critically important.
The other objective of this study was to examine the availability and functionality of training
facilities in the institutes and how it affects capacity building effectiveness. Consequently, the null
hypothesis Ho3 states that the availability and functionality of training facilities in the institutes has no
effect on capacity building effectiveness. This study’s finding was not consistent with the null hypotheses
because it indicates that availability of training facilities has positive effect on capacity building
effectiveness with p .000.
6 Conclusion Although previous studies established positive link between some of the variables and capacity
building in different contexts, the linkage was not empirically examined on a sample of 370 respondents
who were participants of Kano state enterprise development training institutes. This study was
presumably the first of its kind to be conducted in Kano state Nigeria that examines the effect of training
quality, trainers competence and training facilities on capacity building effectiveness. The study was able
to establish and validated that the higher the quality of training,the more competent the trainers are and
availability and functionality of training facilities the more effective a capacity building program would
be in the development of micro, small and medium enterprises.
The study findings show clearly that these gaps uncovered from the literature review have been
covered. It also laid a foundation for further studies in the near future that would employ other effective
variables capable of predicting capacity building effectiveness which were not examined under the current
study.
7 Recommendations Having discussed the various findings of the current study in previous s ection, this section
presented recommendations based on the findings as well. The recommendations are provided to Kano
state entrepreneurship development training institutes, Kano state government, any other training
institutes within and outside Nigeria, state governments who may wish to establish these kinds of training
institutes in the country and every other stakeholder. Specifically the recommendation concentrated on
the practical and theoretical effects of training quality, trainer’s competence and t raining facilities on
capacity building. Again the recommendation is concerned with policy formulation that can promote
entrepreneurship and enterprise development culture in the society.
i. Improving the quality of training- based on the result of the study, it was established that training
quality had a positive relationship with capacity building effectiveness. Training quality
comprised of the pre-training, training (methods and content) and post-training activities. It thus
became pertinent for training institutes to provide adequate information through the available and
wider reached medium (radio, newspapers, hand bills, television etc.) to prospective trainees for
upcoming training program; and trainees should be screened without bias of any kind (political,
religious, ethnicity and or gender) and be allowed to choose institute of their desire and trade or
profession to be trained upon before admission.
92
Proceedings International Conference on Innovation and
Management, Malaysia 2016
The training method (class room and practical) should be of high standard as obtained in other
parts of the world. Similarly the training content (curriculum) should be rich enough to instil self-
dependence through enterprise development into the minds of trainees. The issues of motivation,
innovation, small business management, marketing, sources of funding, record keeping, working
with others, financial discipline, mentoring etc. should be part of the content of the training.
Post training activities include provision of starting capital/equipment either on soft loan basis or
free of charge to participants and post training supervision/follow-up. It is recommended
therefore, that the training institutes employ adequate mechanism for follow-up supervision of
participants established enterprises. The starting capital be it cash, equipment or machineries be
splitted into two folds; half would be a grant and the other half be a soft loan that would be issued
at developmental stages of the enterprise. This would go a long way in controlling or reducing
problems of beneficiaries selling off the equipment for their selfish interest. Also supervisory
mechanism has to be employed to help check and correct the activities of graduates of the
capacity building programs.
ii. Building on trainers competence – the result of the regression analysis of this study showed
trainers competence having 0.420 (42%) predictive power as the strongest predictor of capacity
building effectiveness, hence the need for training institutes to always consider professional
competence of trainers before recruitment. Also, the institutes should continuously determine
trainers training needs and send them for further trainings and maybe internship, both local and
international to upgrade their competences.
iii. Provision of up-to-date and functional training facilities – even though this variable maintained
the least predictive power of capacity building, it still indicated positive relationship with training
effectiveness, having up-to 0.180 Beta (18%). It is therefore recommended that the
institutes/government to provide up-to-date and adequate facilities like workshop, equipments
and machines in the institutes. This would carter for the practical aspect of the training and it will
make training very effective.
This study’s R2 of 0.379 indicated that the utilised variables as shown by the model variance did not
sufficiently explained capacity building effectiveness, meaning that there are other effective variables
that were not treated in this study. Variables like funding of the institute, affiliations with other
institutes, government political will, duration of the capacity building program etc. It is therefore
recommended that the above mentioned additional variables be incorporated in future studies which
may better explain the remaining 62.1% variance in capacity building.
This study also suggests that further research can be conducted on capacity building assessing
the impact of entrepreneurship training on potential entrepreneurs or existing small business owners.
Again, a study could be conducted on impact of the training measuring before an d aftereffect on
entrepreneurs’ business development and growth.
References [1] Allison P. D. Sociological Methods & Research, 1999, 28 (2), Sage Publications, Inc.
[2] Azila-Gbettor, E. M. and Harrison A. P. Entrepreneurship Training and Capacity Build ing of Ghanaian
Polytechnic Graduates [J]. International Review of Management and Marketing, 2013, 3(3): 102-
111
[3] Bronte-Tinkew, J. and Z. Redd.Logic Models and Outcomes for Youth Entrepreneurship Programs.
D.C. Children and Youth Investment Corporation [R], 2001.
[4] Brown, C. Curriculum for Entrepreneurship Education [N]: A Review Digest Number 00-8. (Online)
2000, .http://www.celcee.edu/publications/digest/Dig00 8.html (accessed 8/10/2012)
93
Proceedings International Conference on Innovation and
Management, Malaysia 2016
[5] CEDEFOP, Guidance Supporting Europe´s Aspiring Entrepreneurs: Policy and Practice to Harness
Future Potential, Luxembourg: Publications Office of the European Union [R], 2011.
[6] Colette, H., Hill, F. and Leitch, C. The Effectiveness of Training for New Businesses: A Longitudinal
Study [J]. International Journal for Small businesses. Sage Publication London, 2005, 4(12).
[7] Cooper, D. R. And Schindler, P. S. Business Research Methods [M]. McGraw-Hill/ Irwin, 2003.
[8] Davidson, P., Delmar, F. and Wiklund, J. Entrepreneurship as Growth: Growth as Entrepreneurs hip.
In P. Davidson, F. Delmar and J. Wiklund (Eds.) Entrepreneurship and the Growth of Firms [M].
Cheltenham; Edward Elgar Publishers, 2006: 21- 38.
[9] DeCenzo, D. A. and Robbins, S. P. Human Resource Management [M]. New York: John Wiley and
Sons, Inc.,2007.
[10] Donovan, S., Bransford, J., and Pellegrino, J. (Eds) How People Learn: Bridging Research and
Practice - National Academy of Sciences [M], 1999.
[11] ESRC. A Strategic Framework for Capacity Building within the ESRC National Centre for Resea rch
Methods [R] (NCRM) Economic and Social Research Council, 2012.
[12] European Commission, Entrepreneurship in Vocation Training and Training [R]. Final Report of the
Expert Group. Best Procedure Project, 2009.
[13] European Commission. Entrepreneurship Training – A Guide for Educators [R], 2013.
[14] European Union. Final Report of the Expert Group “Best Procedure” Project on Education and
Training for Entrepreneurship [R]. Brussels: European Commission Directorate -General for
Enterprise, 2002.
[15] Gibb, A., Towards the Entrepreneurial University – Entrepreneurship Training as a Lever for Change
[M]. NCGE Policy 2005, Paper 003.
[16] Gregory P. L., and Thaddeus F. A Model for Research on Training Effectiveness [M]. National
Institute for Occupational Safety and Health Publications Dissemination 4676 Columbia Parkway
Cincinnati, OH 45226-1999.
[17] Hair, J. F., Black, W. C., Babin, B. J., and Anderson, R.E. Multivariate Data Analysis(7th ed.) [M].
Prentice Hall, Upper Seddle River, New Jersy, 2010.
[18] Harper, M. Selection and Training for Entrepreneurship Development [R]. ILO Geneva, 1993.
[19] Henry, C., Hill, F. And Leitch, C., Entrepreneurship Education and Training [M] – Ashgate,
Aldershot, 2003.
[20] ILO. The Promotion of Small and Medium Sized Enterprises [R]. ILO, Geneva, 1990.
[21] Izedonmi, F.O. I. (2009). Model of Wealth Creation [M] , Benin City, Mindex Publishing Company
[22] Krejcie, R. V. and Morgan, D. W. (1970). Determining Sample for Research Activities [J].
Educational and Psychological Measurement, 30, 607-610.
[23] Kuratko D. F., Entrepreneurship Education: Emerging Trends and Challenges for the 21st Century.
Coleman Foundation White Paper Series for the U. S. Association of Small Business and
Entrepreneurship [R], 2003. Available at http://www.usabe.org/pdf/CW 2003-kuratko.pdf
[24] Mwamisha, D. M. and Wanjau, K., Transforming Implementation of Entrepreneurship Education
Programme in Technical Training Institutions in Kenya [J]. European Journal of Business and
Innovation Research,2013, 1 (3):18-27
[24] Norusis, M. J.,SPSS Base System User's Guide to Data Analysis[M]. Prentice Hall, New Jersey,
1999.
[25] Nwazor, J. C., Capacity Building, Entrepreneurship and Sustainable Development [J].Journal of
Emerging Trends in Educational Research and Policy studies(JETERAPS) 2012, 3(1): 51-54)
[26] OECD, Supporting Entrepreneurship in the Vocational Training System in Tunisia. Reviews on Skills
and Competences for Entrepreneurship [M], 2014.

94
Proceedings International Conference on Innovation and
Management, Malaysia 2016
[27] Okudan, G. E., and Rzasa, S. E., A Project Based Approach to Entrepreneurial Leadership Education
Technovation [M],2006, 26: 195 – 210.
[28] Rae, D. and Woodier-Harris, N. International Entrepreneurship Education: Postgraduate Business
Student Experiences of Entrepreneurship Education [J]. Education and Training, 2012. 54: 8/9.
[29] Romijn H. A., Selected Issues in Entrepreneurship Training for Small Business in Developing
Countries [D]. A working Paper series.1989, No.46.
[30] Sebastian, J. and D. Awasthi Entrepreneurship Development Programmes of North Eastern Industrial
Consultants [R]: A Status Report, Entrepreneurship Development Institute of India,
Ahmedabad,1992.
[31] Schacter, M. (2000). Capacity Building: A New way of Doing Business for Development Assistance
Organizations [M], Policy Brief #6, Institute on Governance, Ottawa
[32] Sekaran, U., Research Methods for Business: A Skill Building Approach (2nd ed.) [M]. New York:
John Willey & Sons, Inc. 2003.
[33] Singh, M. An Evaluation Study of Entrepreneurship Development Programmes (EDPs) [R]
Conducted by NITCON, Department of Management Studies, Punjab University, Patiala, 1990.
[34] Stryk, R. J., Damon, M., and Haddaway, S. R., Evaluating Capacity Building for Policy Research
Organizations [J]. American Journal of Evaluation, 2011. 32(1): 50-69
[35] Tijani-Alawiye, B., Entrepreneurship Processes and Small Business Management [M], Ilaro, Nigeria,
2004.
[36] Unachukwu, G. O., Issues and Challenges in the Development of Entrepreneurship Edu cation in
Nigeria [M], 2009.
[37] UNDP. Capacity Assessment and Development, in a Systems and Strategic Management Context
[M], 2002. Technical Advisory Paper 3.
95
Proceedings International Conference on Innovation and
Management, Malaysia 2016
Strategies to Improve Cost and Time Control Using Building
Information Model (BIM)
Muhammad, Muhammad Tahir1; Haron, Nuzul Azam1; Alias, Aidi Hizami1; Harun, Aizul Nahar2
1 Department of Civil Engineering, Faculty of Engineering, Universiti Putra Malaysia, Malaysia
2 Department of Management of Technology, Malaysia-Japan International Institute of Technology,
Universiti Teknologi Malaysia
(Email: [email protected], [email protected], [email protected],
Abstract The demand for the use of a more advanced technology to manage projects information all
through their life cycle is very important. An increase in construction sector p roductivity also means
employing modern construction technologies, such as improved and increased mechanisation and such
technologies as Building Information Model and Industrialised Building Systems. More also, it is
important that skills are improved and intensify to raise productivity that can handle more sophisticated
building methods. Presently it is believed to a large extent that the emergence of Building Information
Model (BIM) can lead to better productivity in the industry. However, BIM as an alte rnative technology
in Malaysia need to be studied to provide proof that it can satisfy the industry’s need to improve on cost
and time control. The aim of this research is to develop strategies that will be used to improve cost and
time control in the industry through the use of BIM. This will be achieved through the use of a mixed
method of enquiry (semi-structured interview and questionnaire).
Keyword Building Information Modeling (BIM), Causes of cost overrun, Cost and time control, Cause
of delay.
1 Introduction Control of cost and time in a construction is a standout amongst the most critical issues in
development since the advent of the industry (Minchin et al., 2013). In this light, an effective project ought
to meet the quality yield norms, as well as the time and spending targets. Time and cost controls are key
criteria for the achievement of any project. Notwithstanding, delay of construction work finishing are
exceptionally common in the industry, such delays are because of issues of inadequate cost and time
control (Forbes and Ahmed, 2010). The core aim of cost and time control in is to guarantee that projects
are done on time and this is feasible through consistent estimation of progress, assessment of engagements
and taking suitable steps on the project as it progresses (Kerzner 2013). Buttressing this likewise is the
project management body of knowledge (PMBOK) which proposes that with a specific end goal to
accomplish the benchmark targets of any project, there must be an effective checking o n project cost and
time control (PMI, 2013).
However, construction industry has numerous branches as it layers, and in that capacity it
contains much data about construction projects. These data are vital to projects, and can be the
fundamental establishment for making decisions, purchases, and joint efforts. The accomplishment of a
fruitful project requires cost administration among different elements to be considered before the initiation
of the project (Masrom et al., 2015). However, construction industry globally are littered with high
profiled projects which are confronted with delays and cost overrun (Smith, 2014).
Presently, a number of tools that can be used for cost and time control have been developed
(Mohd-Nor & Grant, 2014), some of which differ for their functions, and some are mostly designed for
particular type of projects (Yamin & Harmelink, 2001). Tools such as Earned Value Management (EVM),
Gantt Bar Chart, Program Evaluation and Review Technique (PERT) and Critical Path Method (CPM)

96
Proceedings International Conference on Innovation and
Management, Malaysia 2016
(John, 2003; Lester, 2003). More also, different software have been developed to assist in the use of these
project control tools such as Microsoft Project, Primavera, Asta Power Project etc. Regardless of these
tools and software packages, construction projects still suffer delays and cost overruns.
However for project cost and time control, the industry have put up lots of effort techniques
considering only quantitative factors, but ignoring the qualitative factors (Zhang & Gao, 2013). A research
conducted by CIOB in 2008 indicated that the growth in training, education and skill levels within the
construction industry in the use of time management techniques has not kept pace with the technology
available. The emergence of new technology is believed to solve or minimize the issues re lating project
cost and time control. Furthermore it is also believed that the emergence of Building Information Model
(BIM) can lead to greater efficiency by means of increasing collaboration (Zhang & Gao, 2013).
Aranda-Mena, Crawford, Chevez, and Froese (2009) stated that, “For some, BIM is a software
application, for others it is a process for designing and documenting building information, for others it is
a whole new approach to practice and advancing the profession which requires the implementation of
new policies, contracts and relationships amongst project stakeholders.”
A widely cited definition of BIM is provided by the US National Institute of Building Sciences
(2007) which defined it as “a digital representation of physical and functional characteristics of a facility,
and a shared knowledge resource for information about a facility forming a reliable basis for decisions
during its life-cycle; defined as existing from earliest conception to demolition”.
Similarly, the McGraw-Hill (2009) “The Business Value of BIM” Report [2009], a commonly referenced
document by contractors, defines BIM as, “the process of creating and using digital models for design,
construction and operations of projects.” This report mainly defines the contractors' perspective in
defining BIM.
For the purpose of this research, the definition credited to the National BIM Standard (NBIMS)
Project Committee of the Building SMART alliance (2010) will be adopted, which defines it as, “a digital
representation of physical and functional characteristics of a facility. As such it serves as a shared
knowledge resource for information about a facility forming a reliable basis for decisions during its life -
cycle from inception onward. The BIM is a shared digital representation founded on open standards for
interoperability” (Succar, 2009).
Building information model (BIM) is an optional way to deal with construction design, it does
not just make less demanding the computerized representation for plans, but also all the fundamental data
for any project before it is constructed. Not only is BIM resourceful design tool, it might fundamentally
modify the way a construction project will be secured, built, and managed (Xiao and Respectable, 2014).
The data in BIM models is exceptionally helpful and can be dissected to upgrade the design, planning and
construction processes (Azhar, 2011). BIM is an innovatively improved approach that upgrades digital
representation, storage, management and sharing of building data in a way that permits access to the
project database all through its lifecycle (Eadie, Browne, Odeyinka, McKeown, and McNiff, 2013).
According to Bryde, Broquetas, and Volm (2013), BIM is an appropriate tool for project
managers and should be considered by the project management profession as a way to help manage
construction projects. BIM has been so far proved to be a beneficial technique in construction industry,
which has allowed it users in reducing uncertainties and achiev ing successful completion of a project.
BIM can be applied on all the stages of construction processes starting from planning to operation and
maintenance. Major advantages of BIM are improved scheduling, improved drawing coordinated,
controlling time and cost and single detailed model (Memon, Rahman, Memon, & Azman, 2014).
Problem Statement
The Malaysian construction industry contributed 10 to 12 per cent to the national gross domestic
product (GDP) in the fourth quarter of 2015 in Malaysia (D.O.S, 2016). Increasing construction sector
productivity also means employing modern construction technologies, such as improved and increased
mechanisation and such technologies as Building Information Model and Industrialised Building Systems.

97
Proceedings International Conference on Innovation and
Management, Malaysia 2016
While the labour productivity of the construction sector is expected to rise to RM61,939 per worker by
2020 from RM39,116 in 2015. It therefore becomes very necessary that skills are improved and intensify
to raise productivity that can handle more sophisticated building methods (CIDB, 2016).
The construction industry drives economic growth and development in Malaysia, but
unfortunately, its projects often suffer from delays and cost overruns. The construct ion industry in
Malaysia faces lots of trouble from cost and time overruns that transform what should have been
successful projects, into those projects incurring additional costs, disagreements, litigation and in some
cases abandonment (Ramanathan, Potty, & Idrus, 2012; Shehu, Endut, & Akintoye, 2014; Ting, Khoo, &
Wong, 2009). A study on 359 projects estimated to cost billions of Ringgit was conducted in Malaysia in
2009, it found out that only 42 per cent out of the total projects where completed within the budget (Endut,
Akintoye, & Kelly, 2009).
According to studies conducted on delays and cost overrun in Malaysian construction industry
projects, time and cost performance is an important issue that need to be addressed in the construction
industry (Alaghbari et al., 2007; Bazjanac, 2006; Ramanathan et al., 2012; Sambasivan & Soon, 2007;
Shehu et al., 2014; Ting et al., 2009).
As a result of this, there is a demand for the use of a more advanced technology to manage
projects information all through its life cycle. Presently it is generally believed that the emergence of
Building Information Model (BIM) can lead to greater efficiency by means of increasing collaboration
(Zhang & Gao, 2013). However, BIM as an alternative technology in Malaysia need to be studied to
provide proof that is can satisfy the industry’s need to improve on cost and time control. It is also important
to further find out how cost and time control can be improved using BIM technology.
Research Objectives
The aim of this research is to study how cost and time control can be improved in construction
industry upon the use of BIM technology. To achieve the aim of this study, the following specific
objectives have been defined:
I. To determine and rank the different causes of delay and cost overrun in Malaysian construction
industry.
II. To identify the main application areas of BIM in project management.
III. To develop strategies to improve cost and time control using BIM in Malaysia.
Significance of the Study
Building information model is changing the construction industry to a high productivity and high
technology driven industry (Succar, 2009). Similarly, BIM has a great potential to be used by all the major
stakeholders involved in a construction project. BIM technology can be used by the client to know the
needs of the project, the design team make use of it to design, analyse and develop the project, and the
contractor makes use of it to manage the construction phase of the project and finally by the facility
manager for operation and maintenance of the project.
This research is significant as it is just in time in Malaysia and only few researches done to know
it application in construction management Malaysia. This research is intended to investigate how BIM
can be used to improve project cost and time control through a case study project. A nother significance
of this study is that at the end of the research, a new strategy will be developed to help improve on cost
and time control in construction using BIM technology. At the end of the research, the result is expected
to benefit all the stakeholders in the construction industry especially the project management practitioners
through the provision of an insight on the barriers to cost and time control and how to solve the issues
using BIM technology in Malaysia.
Scope of the Study
This research will be primarily concerned with investigation on the causes of delay and cost
overrun in construction and the application of building information model (BIM). The causes of delay and
cost overrun will be investigated, analysed and ranked to know those that occur more in the construction

98
Proceedings International Conference on Innovation and
Management, Malaysia 2016
industry. Data for this study will be obtained using questionnaire from construction contractors with G7
rating who are members of CIDB in Selangor (Klang Valley).
The study will also investigate the application and benefits of using BIM in construction
industries. Data for this investigation will be obtained from academicians, project managers, and
contractors who have knowledge of BIM. The result from both of the investigation will be correlated to
determine the relationship between the two. The result from the analysis will be used to develop a new
strategy for improving cost and time control in the construction industry using BIM. It is important to note
that this research will not cover the control of quality.
Figure 1 Map Showing Klang Valley.
99
Proceedings International Conference on Innovation and
Management, Malaysia 2016
2 Literature Review The review of relevant literature will evaluate critically the concepts that are been investigated in this
research, which are project management, cost control, time control, existing issues on cost and time
control in the construction industry, current methods of project time and cost control, building information
model application are to be reviewed. These concepts are integrated and directed to relate to the research
problem. Thus, in this chapter, the researcher examines, compare and contrasts previous researches done
on cost and time control and analyse the selected literatures to concentrate on cost and time management
in BIM technology.
Project Time Control
Project time control is the process of monitoring the status of project activities to update project progress
and manage changes to the schedule baseline to achieve the plan (PMI, 2013). This process has a key
benefit as it provides the means of recognising deviations from the actual plan and taking corrective and
preventive measures and as such reduces the risk. The period of time it will take for the execution of a
project is most times very important to the parties involved (Zhang, 2012). However, it is common around
the world especially in developing countries and underdeveloped countries that project are most times not
completed on time (Nassar, Gunnarsson, & Hegab, 2005).
Olawale and Sun (2010), in their research work titled “Importance of Cost and Time in Construction
Project: Inhibiting Factors and Mitigating Measures in Practice”, conducted a questionnaire survey and
found out that 58% of the respondents make use of time control in their projects all the time. While only
11% of the respondents said they seldom or do not apply time control to their projects. From the result
above, one can say that it is important to apply time control to projects.
Many researches have been carried out to find solutions in reducing the difference between the scheduled
time and the actual time taking to complete a project. Presently, there exist a number of tools that are used
for time control for projects, most of them which have disparity in their functions while some are project
specific (Yamin & Harmelink, 2001). Research work are still on seeking for a unified standard that will
integrate the tools (Cho, Hong, & Hyun, 2010).
Project Time Control Process
Project time control process involves three main parameters which are the inputs, tools and techniques,
and outputs. This process is represented in the figure below.
Figure 2 Inputs, tools & techniques, and outputs (PMI, 2013).
100
Proceedings International Conference on Innovation and
Management, Malaysia 2016
Project Cost Management
Project Cost Management involves planning, estimating, budgeting, financing, funding,
managing, and control of cost processes to ensure the completion of the project within the approved
budget. It is primarily concerned with the cost of the resources needed to complete project activities. These
processes are the design of plan cost management, estimation of cost, determining budget for the project,
and control of cost (PMI, 2013).
Project Cost Control
Project cost control is the process of monitoring the status of the project to update the project
costs and managing changes to the cost baseline. This provides means for the recognition of variance from
the plan so as to take corrective actions and reduce risk. It is important for all companies to control cost
irrespective of their sizes, it should be performed by all personnel who incur cost. According to Zhang
(2012), project cost control is a vital ingredient for a successful project.
About 84% of companies and organizations make use of cost control in their various projects (Olawale &
Sun, 2010). This shows how important the use of cost control techniques are in project environments.
According to Gould (2005), there is need for effective cost control as it is difficult to estimate the exact
cost to complete a project due to the presence of numerous factors that need to be considered.
Project Cost Control Process
Project cost control process involves three main parameters which are the inputs, tools and
techniques, and output. The process and its parameters are represented in the figure below.
Figure 3 Project cost control: Input, Tools & Techniques, and Output (PMI, 2013).
Conventional Project Time and Cost Control Tools.
There have been several tools developed by researchers for controlling time and cost resources in
the construction industry. Most of this tools have limitations as some are project or industry specific and
cannot be applied to other projects (Ismail, Rahman, Memon, & Karim, 2013). Tools used for project cost
and time control also are:
Forecasting
To-Complete Performance Index (TCPI)
Variance Analysis
Performance Reviews
Gantt Bar Chart
Milestone Date Programming Techniques
Earned Value Management (EVM)

101
Proceedings International Conference on Innovation and
Management, Malaysia 2016
Program Evaluation and Review Technique(PERT)
Elementary Trend Analysis/Line of Balance Method (LOB)
Precedence Network Diagram
Simulation
Critical Path Method (CPM)
More also, there are computer software used for project cost and time control. This software are used for
instantaneous mathematical computation of cost and duration of activities. These software include: (a)
Primavera Project Planner (b) Microsoft Project (c) Asta Power Project (d) Microsoft Excel (e) Project
Commandar (f) Deltek Open Plan.
Causes of Delay and Cost Overrun in construction Projects.
It is important to note that the study of the different causes of delay and cost overrun in Malaysia
construction projects has been carried out by many researchers also. Delay factors such as shortage of
materials, change orders, delay in payment of suppliers, poor management of site, and late submission of
drawings are the main causes delay (Abdul Kadir, Lee, Jaafar, Sapuan, & Ali, 2005; Ramanathan et al.,
2012). Alaghbari et al. (2007)conducted a study on the causes of delay and the results were analysed to
rank the causes of delay. The researcher found out that financial problems and coordination problems are
the two most important factor causing delay in construction projects in Malaysia.
Sambasivan and Soon (2007) conducted a research using questionnaire to describe the 10 main causes of
delay in Malaysian construction projects which include poor site management, late payment, labour
supply, improper planning, lack of experience, problems with subcontractors, and shortage of materials .
While Al-Tmeemy, Abdul-Rahman, and Harun (2012) listed several causes of delay in Malaysia to
include; labour productivity, slow decision making, inflation, material delivery, and insufficient
equipment. Shehu, Endut, and Akintoye (2014) stated that contract delays are predominantly caused by
the contractors and are factors associated with finance.
S. M. Ahmed, Azhar. S., Kappagntula, P. and Gollapudil. D. (2003) and Al-Aghbari (2005) in their
separate research, classified the factors causing delay and cost overrun in Malaysian construction projects
into four (4) as shown in the table below.
Table 1 Showing the classification and factors causing delay and cost overrun.
S /No. Classification Factors
1 Contractors
responsibilities
Delay in delivery of materials to site; Shortage of materials, equipment, and tools
on site; Construction mistakes and defective work; Poor skills and experience of
labour; Shortage of labour; Low productivity; Financial issues; Poor coordination and site management; Lack of subcontractor’s skills; Lack of site contractor’s
staff.
2 Consultant’s responsibility
Absence of consultant’s site staff; Lack of experience of the consultant; Lack of experience of the consultant’s site staff; Delayed and slow supervision in taking
decisions and giving instruction; Incomplete documents.
3 Owner’s
responsibility
Lack of working knowledge; Slowness in making decisions; Lack of coordination
with contractors; Change in scope; Financial issues.
4 External factors Lack of materials, equipment, and tools in the market; Poor weather conditions;
Poor site conditions; Poor economic conditions; Changes in laws and regulations;
Transportation delays; External work due to public agencies.

102
Proceedings International Conference on Innovation and
Management, Malaysia 2016
Concept of Building Information Model (BIM)
BIM is basically a 3D digital representation of a facility. The model could be used in expressing the entire
facility life-cycle. The quantity of material and it properties can be easily obtained, and the scope of work
required can easily be defined and isolated from the model. Contract documents, drawings, procurement
details, specifications, and other construction documents can easily be interrelated using the model
(Bazjanac, 2006; Khemlani, 2007). The model which is data rich, object-oriented, intelligent, and a digital
representation of the facility in which drawings and appropriate information for various stakeholders can
be extracted for project delivery and decision making (Rogers, Chong, & Preece, 2015). It integrates
architectural, structural, Mechanical, Electrical and Plumbing (MEP) models (Smith & Edgar, 2008).
Figure 4 BIM concept (BuilderStorm, 2016)
According to the BIM industry group (BIWG) (2011), it defined the levels of BIM from level 0-3 as;
Level 0: unmanaged CAD which is most likely 2D, with paper (or electronic paper) as the
exchange mechanism.
Level 1: managed CAD in 2D or 3D format using BS1192:2007 (collaborative management
process) with a collaboration tool providing a common data environment, standard data
structures, and formats most likely.
Level 2: BIM has been defined in the UK as a “Managed 3D environment held in separate
discipline ‘BIM’ tools with attached data. Commercial data managed by an Enterprise Resource

103
Proceedings International Conference on Innovation and
Management, Malaysia 2016
Planning application (ERP). Integration on the basis of proprietary interfaces or bespoke
middleware could be regarded as ‘pBIM’ (proprietary). The approach may utilise 4D
programme data and 5D cost elements as well as feed operational systems”.
Level 3: BIM is defined as “Fully open process and data integration enabled by web services
compliant with emerging IFC/IFD standards, managed by a collaborative model server. It could
be regarded as iBIM or integrated BIM potentially employing concurrent engineering
processes”.
Figure 5 BIM levels (Applecore, 2016)
BIM Tools
A lot of tools are been developed as a result of the spread of the concept of BIM in achieving its
perspectives. These tools are used for management of construction projects. Most of these tools are
designed for specific purposes to meet the need of it users, while few are designed for multiple functions
and information collection. The type of tool to be used depends on the purpose, user, and stage in which
it will be used. BIM tools enable 3D modelling and the management of information. This makes the
adoption of BIM technology more than just changing to the use of software that supports it. The use of
these tools make BIM a unified system which interacts with all it parts. The table below shows BIM tools,
manufacturer and it function. Table 2 BIM Tools
Manufacturer Tool Function
AutoDesk
Navisworks
To manage 3D model-based design and clash detection.
Bentley
Bentlay Navigator
Dynamic coordination between models and disciplines.
Vico Software
Vico Office
Analysis of various 3D models for coordination, scheduling and
estimating.
Gehry Technologies
Digital Project Suit
Full featured suite: for design, review and information
management.
Tekla Tekla Structures 3D structural modelling and detailing.
Solibri
Solibri Model Checker For quality assurance/quality qontrol (QA/QC).
Synchro Ltd.
Synchro Professional Scheduling of systems and planning simulations.
104
Proceedings International Conference on Innovation and
Management, Malaysia 2016
Application of BIM in Project Management
The potentials of the application of Building Information Model (BIM) in the management of
construction projects is similar to the PMBOK knowledge areas. As such, BIM is regarded as an important
tool for effective and efficient project management as it integrates all the stakeholders in the project
(Rokooei, 2015). BIM as a promising technology facilitates project management, the possibility of
integrating building models and products makes BIM to have a high potential for management of projects
life-cycle (Gourlis & Kovacic, 2016). BIM can be used at all the stages of a project in it life-cycle, it is
used in understanding the project needs by the owner, it is also used for analysis, design and development
of the project by the design team. The contractor also makes use of it in managing the const ruction phase,
and it is used for decommissioning, maintenance and operation by the facility manager (Grilo & Jardim-
Goncalves, 2010).
In a nutshell, the application of BIM in project management are stated in table 2.3 below.
Table 3 BIM application
Application of BIM Source
Quality compliance management. (L. Chen & Luo, 2014).
Reduction in information exchange (IE) and resource
waste.
(Bryde et al., 2013; Dubler, Kreider, & Messner, 2010).
Improvement in the accessibility of facility
management data.
(Azhar et al., 2008; Kang & Choi, 2015; Kassem et al.,
2015; Liu, 2010; Meadati, Irizarry, & Akhnoukh, 2010)
Sustainability of project design and building
performance.
(Wong & Fan, 2013).
Clash detection and coordination. (Arayici et al., 2011; Azhar et al., 2008; Bryde et al.,
2013; Foster, 2008; Lahdou & Zetterman, 2011; Young, Jones, Bernstein, & Gudgel, 2009).
Automated safety checking platform. (Zhang & Gao, 2013).
Constructability analysis. (Foster, 2008).
Visualisation and sequencing of activities. (Ding et al., 2014; Memon et al., 2014; Tulke & Hanff,
2007; Wilson & Koehn, 2000).
Cost Estimation of Material and quantities. (Azhar et al., 2008; Hergunsel, 2011; Sabol, 2008).
Integration of key stakeholders. (Foster, 2008).
Optimization of prefabricated construction components. (Hergunsel, 2011; Winberg & Dahlqvist, 2010).
Risk assessment of design component of facility for
prevention through design.
(Kamardeen, 2010).
Scope clarification. (Bryde et al., 2013).
3 Methodology This research aims to develop a strategy for the control of cost and time in construction industry.
This will be achieved through the processes in Figure VI. The analysis of the data obtained will be done
using SPSS 23, to give accurate results which will be interpreted objectively.

105
Proceedings International Conference on Innovation and
Management, Malaysia 2016
Theoretical framework
Concept of project management
Project time control process
Project cost control process
Limitations of conventional cost and
time control tools
Causes of delay and cost overrun
Concept of BIM
Applications of BIM
Figure 6 Theoretical framework and processes
As for the research method, a mixed method will be adopted for this research in achieving the
objectives. A descriptive and exploratory research design will be used for the study. The research design
for this study contains the following:
The research problem and research questions.
Sampling design.
Method of data collection.
Method of data analysis.
106
Proceedings International Conference on Innovation and
Management, Malaysia 2016
Methodology
Qualitative Qantitative
Interview
Interprete
Analysis
Develop
Questionnaire
Pilot study
Testing of Pilot
study result
Positive outcome
Administer
Questionnaire
Analysis
Negative outcome
Discussion of
result
Conclusion
Strategy development
1. Pareto
analysis.
2. Descriptive
analysis.
3. Multiple
regression.
Cronbach's alpha
test
Content analysis
and descriptive
analysis
Figure 7 Research methodology/strategy development process.
From Figure VI above, the processes to be followed for the development of the strategy are shown.
For the qualitative study, expert sampling will be adopted to determine the respondents for the semi-
structured interview to re-affirm the main applications of BIM from literature. This will be analysed using
content analysis and descriptive analysis. For the quantitative study, the target respondent for this phase
of the research are the G7 member group of companies registered with CIDB Malaysia. The result from
this phase of the research will be analysed using Pareto analysis to determine the main causes of delay
and that of cost overrun also. The relationship between the applications of BIM and the causes of delay
and cost overrun will be done using correlation and regression analysis methods.

107
Proceedings International Conference on Innovation and
Management, Malaysia 2016
4 Conclusion The demand for the use of a more advanced technology to manage projects information all through their
life cycle is very important. An increase in construction sector productivity also means employing modern
construction technologies. The result of the study is anticipated to show a negative relationship between
the causes of delay, cost overrun and BIM applications. This means that, as a result of us e of BIM
technology, the occurrence of the causes of delay and cost overrun are reduced to the barest minimum.
References [1] Ahmed, S. (2012). Azhar. S., Kappagntula, P. and Gollapudil. D.(2003),“Delays in construction:
a brief study of the Florida construction industry”. Paper presented at the Proceedings of the 39th
Annual ASC Conference, Clenson University, Clenson, SC.
[2] Al-Aghbari, M. (2005). Factors affecting construction speed of industrialized building system in
Malaysia. Universiti Putra Malaysia.
[3] Alaghbari, W. e., Razali A. Kadir, M., Salim, A., & Ernawati. (2007). The significant factors causing
delay of building construction projects in Malaysia. Engineering, Construction and Architectural
Management, 14(2), 192-206.
[4] 0 Al-Momani, A. H. (2000). Construction delay: a quantitative analysis. International Journal of
Project Management, 18(1), 51-59.
[5] Al-Tmeemy, S. M. H., Abdul-Rahman, H., & Harun, Z. (2012). Contractors' perception of the use
of costs of quality system in Malaysian building construction projects. International Journal of
Project Management, 30(7), 827-838.
[6] Applecore. (2016). BIM - Building Information Modelling. Retrieved from
http://www.applecoredesigns.co.uk/bim
[7] Arayici, Y., Coates, P., Koskela, L., Kagioglou, M., Usher, C., & O'reilly, K. (2011). Technology
adoption in the BIM implementation for lean architectural practice. Automation in Construction,
20(2), 189-195.
[8] Azhar, S. (2011). Building information modeling (BIM): Trends, benefits, risks, and challenges for
the AEC industry. Leadership and Management in Engineering, 11(3), 241-252.
[9] Azhar, S., Hein, M., & Sketo, B. (2008). Building Information Modeling (BIM): Benefits, Risks
and Challenges. McWhorter School of Building Science. Auburn University. Auburn. Alabama,
AL.
[10] Bakis, N., Kagioglou, M., & Aouad, G. (2006). Evaluating the business benefits of information
systems. Paper presented at the 3rd International SCRI Symposium, Salford Centre for Research
and Innovation, University of Salford, Salford.
[11] Baumann, T., Dziadosz, A., Rejment, M., & Kapliński, O. (2014). Range of aplication and
limitations of the earned value method in construction project estimation. Czasopismo Techniczne,
2014(Budownictwo Zeszyt 2-B (6) 2014), 65-72.
[12] Bazjanac, V. (2006). Virtual building environments (VBE)-applying information modeling to
buildings.
[13] Bryde, D., Broquetas, M., & Volm, J. M. (2013). The project benefits of building information
modelling (BIM). International Journal of Project Management, 31(7), 971-980.
[14] BuilderStorm. (2016). BIM - Building Information Modelling - Builder Storm. from
https://www.builderstorm.com/features/bim/
[15] B. I. W. G. (2011). A report for the government construction client group building information
modelling (BIM) Working party strategy paper.
[16] Chen, L., & Luo, H. (2014). A BIM-based construction quality management model and its
applications. Automation in Construction, 46 , 64-73.
108
Proceedings International Conference on Innovation and
Management, Malaysia 2016
[17] Committee, P. S., & Committee, P. S. (2013). A guide to the project management body of
knowledge.
[18] Ding, L., Zhou, Y., & Akinci, B. (2014). Building Information Modeling (BIM) applicat ion
framework: The process of expanding from 3D to computable nD. Automation in Construction,
46, 82-93.
[19] Dubler, C., Kreider, R., & Messner, J. (2010). Determining the frequency and impact of applying
BIM for different purposes on projects. Paper presented at the Proceedings 6th International
Conference on Innovation in Architecture, Engineering and Construction (AEC).
[20] Endut, I. R., Akintoye, A., & Kelly, J. (2009). Cost and time overruns of projects in Malaysia.
retrieved on August, 21, 243-252.
[21] Fleming, Q. W., & Koppelman, J. M. (2002). Earned value management. Cost Engineering, 44,
32-36.
[22] Flyvbjerg, B., Holm, M. S., & Buhl, S. (2002). Underestimating costs in public works projects:
Error or lie? Journal of the American planning association, 68(3), 279-295.
[23] Forbes, L. H., & Ahmed, S. M. (2010). Modern construction: lean project delivery and integrated
practices: CRC Press.
[24] Foster, L. L. (2008). Legal issues and risks associated with Building Information Modeling
Technology: ProQuest.
[24] Francois, B. (2016). Francois Buys | LinkedIn. from https://www.linkedin.com/in/francois -buys-
77592116?trk=pulse-det-athr_prof-art_ftr
[25] Frimpong, Y., Oluwoye, J., & Crawford, L. (2003). Causes of delay and cost overruns in
construction of groundwater projects in a developing countries; Ghana as a case study.
International Journal of Project Management, 21(5), 321-326.
[26] Gould, F. (2005). Managing the construction process: estimating, scheduling, and project control.
2005: Prentice Hall.
[27] Gourlis, G., & Kovacic, I. (2016). Building Information Modelling for analysis of energy efficient
industrial buildings–A case study. Renewable and Sustainable Energy Reviews.
[28] Grilo, A., & Jardim-Goncalves, R. (2010). Value proposition on interoperability of BIM and
collaborative working environments. Automation in Construction, 19(5), 522-530.
[29] Group, B. I. W. (2011). A report for the government construction client group building information
modelling (BIM) Working party strategy paper.
[30] Gündüz, M., Nielsen, Y., & Özdemir, M. (2012). Quantification of delay factors using the relative
importance index method for construction projects in Turkey. Journal of Management in
Engineering, 29(2), 133-139.
[31] Hergunsel, M. F. (2011). Benefits of building information modeling for construction managers and
BIM based scheduling. Worcester Polytechnic Institute.
[32] Ismail, I., Abdul Rahman, I., Memon, A. H., Karim, A., & Tarmizi, A. (2013). Comparative study
on time management practices in construction industry between Kedah and Kelantan.
[33] Ismail, I., Rahman, I. A., Memon, A. H., & Karim, A. T. A. (2013). Application of Time
Management Tools and Techniques by Construction Indus try Players: A Comparative Study
between Kedah and Kelantan.
[34] Kamardeen, I. (2010). 8D BIM modelling tool for accident prevention through design. Paper
presented at the 26th Annual ARCOM Conference, Leeds, Association of Researchers in
Construction Management.
[35] Kaming, P. F., Olomolaiye, P. O., Holt, G. D., & Harris, F. C. (1997). Factors influencing
construction time and cost overruns on high-rise projects in Indonesia. Construction Management
& Economics, 15(1), 83-94.

109
Proceedings International Conference on Innovation and
Management, Malaysia 2016
[36] Kang, T.-W., & Choi, H.-S. (2015). BIM perspective definition metadata for interworking facility
management data. Advanced Engineering Informatics, 29(4), 958-970.
[37] Kassem, M., ED Love, J. M., Steve Lockley, P., Kelly, G., Dawood, N., Serginson, M., & Lockley,
S. (2015). BIM in facilities management applications: a case study of a large university complex.
Built Environment Project and Asset Management, 5(3), 261-277.
[38] Kerzner, H. R. (2013). Project management: a systems approach to planning, scheduling, and
controlling: John Wiley & Sons.
[39] Khemlani, L. (2007). Top criteria for BIM solutions. A survey conducted by AECbytes.
[40] Kim, K., & de la Garza, J. M. (2003). Phantom float. Journal of construction engineering and
management, 129(5), 507-517.
[41] Kim, K., & De La Garza, J. M. (2005). Evaluation of the resource-constrained critical path method
algorithms. Journal of construction engineering and management, 131 (5), 522-532.
[42] Koushki, P., Al‐Rashid, K., & Kartam, N. (2005). Delays and cost increases in the construction of
private residential projects in Kuwait. Construction Management and Economics, 23(3), 285-294.
[43] Lahdou, R., & Zetterman, D. (2011). BIM for Project Managers How project managers can utilize
BIM in construction projects.
[44] Liu, Z. (2010). Feasibility Analysis of BIM Based Information System for Facility Management at
WPI. Worcester Polytechnic Institute.
[45] McGraw-Hill, C. (2009). The Business Value of BIM-Getting Building Information Modeling to
the Bottom Line. SmartMarket Report.
[46] Meadati, P., Irizarry, J., & Akhnoukh, A. K. (2010). BIM and RFID integration: a pilot study.
Advancing and Integrating Construction Education, Research and Practice , 570-578.
[47] Memon, A. H., Rahman, I. A., Memon, I., & Azman, N. I. A. (2014). BIM in Malaysian
construction industry: status, advantages, barriers and strategies to enhance the implementation
level. Research Journal of Applied Sciences, Engineering and Technology, 8 (5), 606-614.
[48] Nassar, K. M., Nassar, W. M., & Hegab, M. Y. (2005). Evaluating cost overruns of asphalt paving
project using statistical process control methods. Journal of construction engineering and
management, 131(11), 1173-1178.
[49] Olawale, Y. A., & Sun, M. (2010). Cost and time control of construction projects: inhibiting factors
and mitigating measures in practice. Construction Management and Economics, 28(5), 509-526.
[50] Purnus, A., & Bodea, C.-N. (2013). Considerations on Project Quantitative Risk Analysis.
Procedia-Social and Behavioral Sciences, 74 , 144-153.
[51] Rahman, I. A., Memon, A. H., Nagapan, S., Latif, Q. B. A. I., & Azis, A. A. A. (2012). Time and
cost performance of costruction projects in southern and cenrtal regions of Penisular Malaysia.
Paper presented at the Humanities, Science and Engineering (CHUSER), 2012 IEEE Colloquium
on.
[52] Ramanathan, C., Potty, N. S., & Idrus, A. B. (2012). Analysis of time and cost overrun in Malaysian
construction. Paper presented at the Advanced Materials Research.
[53] Rogers, J., Chong, H.-Y., & Preece, C. (2015). Adoption of building information modelling
technology (BIM) perspectives from Malaysian engineering consulting services firms.
Engineering, Construction and Architectural Management, 22(4), 424-445.
[54] Rokooei, S. (2015). Building Information Modeling in Project Management: Necessities,
Challenges and Outcomes. Procedia-Social and Behavioral Sciences, 210 , 87-95.
[55] Sabol, L. (2008). Challenges in cost estimating with Building Information Modeling. IFMA World
Workplace.
[56] Sambasivan, M., & Soon, Y. W. (2007). Causes and effects of delays in Malaysian construction
industry. International Journal of Project Management, 25(5), 517-526.

110
Proceedings International Conference on Innovation and
Management, Malaysia 2016
[57] Shehu, Z., Endut, I. R., & Akintoye, A. (2014). Factors contributing to project time and hence cost
overrun in the Malaysian construction industry. Journal of Financial Management of Property and
Construction, 19(1), 55-75.
[58] Smith, D. K., & Edgar, A. (2008). Building information modeling (BIM). Natonal Institute of
Building Sciences, Washington .
[59] Smith, P. (2014). Project Cost Management–Global Issues and Challenges. Procedia-Social and
Behavioral Sciences, 119, 485-494.
[60] Sparrow, P. (2012). Earned Value Management: Advantages and Disadvantages. Retrieved from
http://www.ianswer4u.com/2011/12/earned-value-management-advantages-and.html
[61] Succar, B. (2009). Building information modelling framework: A research and delivery fo undation
for industry stakeholders. Automation in Construction, 18(3), 357-375.
[62] Ting, S., Khoo, H., & Wong, S. (2009). Project Management Development in Malaysia: A Case
Study. Department of Civil Engineering, Faculty of Engineering, University Malaysia.
[63] Tulke, J., & Hanff, J. (2007). 4D construction sequence planning–new process and data model.
Paper presented at the Proceedings of CIB-W78 24th International Conference on Information
Technology in Construction, Maribor, Slovenia.
[64] Wilson, J. M., & Koehn, E. E. (2000). Safety management: problems encountered and
recommended solutions. Journal of construction engineering and management, 126 (1), 77-79.
[65] Winberg, A., & Dahlqvist, E. (2010). BIM-the Next Step in the Construction of Civil Structures.
[66] Wong, K.-d., & Fan, Q. (2013). Building information modelling (BIM) for sustainable building
design. Facilities, 31(3/4), 138-157.
[67] Young, N., Jones, S. A., Bernstein, H. M., & Gudgel, J. (2009). The business value of BIM-getting
building information modeling to the bottom line. Bedford, MA: McGraw-Hill Construction, 51.
[68] Zhang, D. (2012). Project Time and Cost Control Using Building Information Modeling. (Masters),
North Dakota State University Of Agriculture and Applied Science ProQuest LLC. (1550199)
[69] Zhang, D., & Gao, Z. (2013). Project time and cost control using building information modeling.
ICCREM 2013, 545-554.
111
Proceedings International Conference on Innovation and
Management, Malaysia 2016
Conceptual Business Model for MOOCS in Universiti Teknologi
Malaysia
Nor Fadzleen Sa don¹, Rose Alinda Alias²,Hiroshi Nakanishi¹ 1 Malaysia-Japan International Institute of Technology, Universiti Teknologi Malaysia
2 Faculty of Computing, Universiti Teknologi Malaysia
(E-mail: [email protected], [email protected], [email protected])
Abstract Massive Open Online Courses (MOOCs) has exponentially brought forth myriad discussions
on viable business models for higher education due to the disruptive innovation in the democratization
of learning. MOOCs are heralded to be provided free of charge to users worldwide despite the
demographic and socio cultural background. However, the strategic planning, execution and sustainable
development of MOOCs require massive investment from higher education. From the past studies,
business models for MOOCs in higher education are under-researched albeit its importance in
expediting the competitive advantage of global higher education. In the context of Malaysian higher
education, the Ministry of Higher Education has launched Malaysia MOOC, the first country in the
world to implement government-initiated MOOCs for all public universities. The ministry allocates
RM500 million for all public universities to offer the MOOC, under the 2016-2020 Eleventh Malaysia
Plan. Nonetheless, there is not much studies published specifically on MOOCs business model in
Malaysian higher education. Within the parameter of Universiti Teknologi Malaysia, the research
university has developed UTM MOOC which prolifically entering its third cycle of implementation.
Nonetheless, there is a deficit in studies on the business model for UTM MOOC to solidify its execution
in a long run. Hence, this paper aims to explore and develop a Conceptual Business Model for MOOC
in Universiti Teknologi Malaysia which optimizes internal operations, increases brand marketing as well
as extend existing activities to new business based community. A qualitative stud y is conducted based
on nascent literature review and stakeholder analysis with the UTM MOOC champion, administrator
and the users. The development of the Conceptual Business Model for MOOCs for Universiti Teknologi
Malaysia is hoped to be a guideline for policy makers, practitioners and researchers on perpetuating
MOOCs sustainability in the hyper-speed era of innovation.
Keywords Massive Open Online Course; MOOC; business model; Universiti Teknologi Malaysia
1 Introduction Massive Open Online Courses (MOOCs) have distinctively gained traction as the prime force of
global learning innovation in higher education. The escalating implementation of Massive Open Online
Courses (MOOCs) in higher education worldwide propagates higher knowledge accessibility beyond
physical, socio-culture and demographic barriers. In the context of Malaysian higher education, 20 public
universities in Malaysia are implementing Malaysia MOOC which slightly differs from the prior
structures of existing MOOCs implemented in universit ies in Western countries. Although MOOCs has
been heralded as ‘free’ to be accessed by eager learners worldwide, the cost of producing MOOCs The
cost of producing MOOCs course is escalating yet there has been high demands from stakeholders in
producing MOOCs that are of high quality infrastructure, efficiency, viable value proposition of the
institutions yet remains cost-effective. There has been increasing concern on shifting the focus of higher
education in the aspect of sustainability, yet based on literature and empirical studies, very limited studies
have been conducted on business models for MOOCs in Malaysian universities. One of the primary
universities in Malaysia that has prolifically championed Malaysia MOOC is Universiti Teknologi
Malaysia and there is yet study conducted on the business model for MOOC implementation at the

112
Proceedings International Conference on Innovation and
Management, Malaysia 2016
aforementioned institution. Hence, this research main objectives are twofold. First, it analyses existing
MOOCs business models in higher education. Secondly, by synthesizing the findings, a Conceptual
Business Model for MOOC in Universiti Teknologi Malaysia is developed to reach three objectives: (1)
optimize internal operations (2) increase value proposition (3) extend activities to new business based on
the community.
This paper is divided into five sections. The first part explores the prior development of MOOCs
in Global Higher Education. The next section focuses on MOOCs conducted in Malaysian higher
education. In this section, Malaysia MOOC initiative is discussed apart from the national policies that
underpin the initiative. This is followed by literature review on MOOCs in Universiti Teknologi Malaysia
(UTM) which is known as UTM MOOC. The section on Methodology and Design outlines the mapping
of the qualitative research and methodology via Stakeholder Analysis and interviews with Malaysia
MOOCs stakeholders. Section on Result and Discussion synthesizes the data findings using Thematic
Concept Matrix and further discussion on the discourse analysis. A Conceptual Business M odel for UTM
MOOC is proposed based on the synthetization of the findings. Lastly, the paper is concluded with
summarization of this research and propagation of future studies.
2 Literature Review MOOCs provide a new methodology and modality for teaching and learning. The newness does
pose some problems for learners but also provides for exciting new possibilities. MOOCs require learners
to be more proactive in their education and in building their personal learning networks. Everyone can be
successful in a MOOC, provided that certain steps are taken and strategies devised before, during and
after a MOOC. For this research, a Systematic Literature Review (SLR) is conducted where the aim is to
study the existing MOOCs business models based from four major categories; Education, Socio-culture,
Institution and Finance. From this literature analysis, a theoretical framework is developed, as depicted in
Figure 1. This leads to the development of Conceptual Business Model for MOOC in Universiti Teknologi
Malaysia (UTM). Throughout this paper, MOOC in UTM will be addressed as UTM MOOC.
2.1 MOOCs in Higher Education
The inception of MOOCs started in 2008 when Stephen Downes and George Siemens initiated
Connectivism and Connective Knowledge course that propagates the underpinning learning theory of
Connectivism [1]. Since then, MOOCs initiative in higher education has globally gained traction where
some of the leading MOOC platforms are EdX, Coursera and Udacity. To date, more than 12000 MOOC
courses have been offered and more higher educational institutions are using MOOCs or initiating MOOC
platforms [2], [3].
2.2 MOOCs in Malaysia
Malaysia MOOC is initiated by the government in tandem with Malaysian Education Blueprint
for Higher Education, National Economic Model and Economic Transformation Programme [4]. It was
pre-launched on 19 September 2014 by the then Second Education Minister, Datuk Seri Idris Jusoh. It
was a milestone for Malaysian higher education as Malaysia is the first country in the world to implement
the government-initiated Massive Open Online Courses (MOOCs) initiative for public universities. [5]
Contrasting with main objective of global commercial MOOC providers that specifies on monetization,
MOOCs in Malaysia focuses on complementing the blended learning ecosystem with existing on-campus
learning environment [6]. In this context, the main objective was to to ensure online learning complements
the on campus learning experience and ease accessibility to synchronous and asynchronous learning.
The Malaysia MOOC initiative is part of the Ministry of Higher Education strategic plan in expedite the
quality and “boost the ranking of Malaysian higher education on global scale” [5]. Prior to Malaysia
MOOC, Taylor‟s University was the first Malaysian higher educational Institutions that initiated MOOC
courses. Apart from Taylor‟s University, Open University Malaysia has also initiated MOOC courses [7]

113
Proceedings International Conference on Innovation and
Management, Malaysia 2016
and by 2025, all Malaysian universities are expected to adopt MOOCs to add value to on -campus learning
experience [8] Figure 1 depicts the timeline of MOOC progress in Malaysian higher education.
Figure 1. Timeline of MOOCs Progress in Malaysian Higher Education
2.3 MOOCs in Universiti Teknologi Malaysia
Universiti Teknologi Malaysia (UTM) is one of 20 public universities in Malaysia as well as the primary
research university in Malaysia that is the forerunner in MOOCs execution and implementation
extensively. Known as UTM MOOC, it is implemented since 2014 and up to September 2016, it has
reached its third cycle. UTM MOOC is one of the strategies for UTM to be a globally-connected higher
education player that is renowned for its academic and research expertise. UTM MOOC is the hub for
accessing online courses via OpenLearning platform and could be accessed via
https://www.openlearning.com/utm. OpenLearning is an Australian -based MOOC platform provider
which has been appointed as the official MOOCs platform for the Malaysia MOOC initiative. [9] From
the inception of UTM MOOC to its third cycle, 37 courses were developed and offered to UTM
undergraduate students. Table x depicts the enrollment for all the 37 MOOCs on UTM MOOC. Up to
September 2016, 5132 students are taking UTM MOOC. As part of the Malaysian Education Blueprint,
[10] UTM implemented Blended Learning for MOOCs execution where 30 percent of learning is
conducted via MOOCs while 70 percent is carried out via face –to-face and classroom interaction. Figure
2 depicts the screenshot of MOOC courses offered to students.
Figure 2. UTM MOOC on Open Learning platform
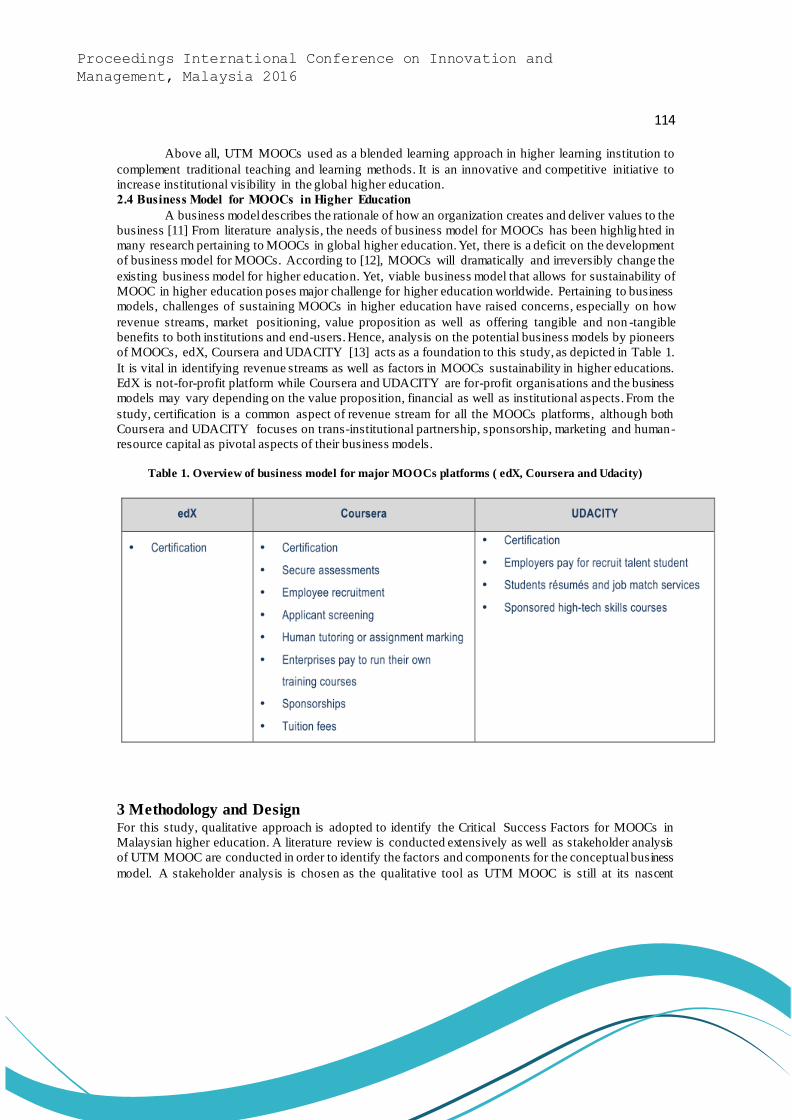
114
Proceedings International Conference on Innovation and
Management, Malaysia 2016
Above all, UTM MOOCs used as a blended learning approach in higher learning institution to
complement traditional teaching and learning methods. It is an innovative and competitive initiative to
increase institutional visibility in the global higher education.
2.4 Business Model for MOOCs in Higher Education
A business model describes the rationale of how an organization creates and deliver values to the
business [11] From literature analysis, the needs of business model for MOOCs has been highlig hted in
many research pertaining to MOOCs in global higher education. Yet, there is a deficit on the development
of business model for MOOCs. According to [12], MOOCs will dramatically and irreversibly change the
existing business model for higher education. Yet, viable business model that allows for sustainability of
MOOC in higher education poses major challenge for higher education worldwide. Pertaining to business
models, challenges of sustaining MOOCs in higher education have raised concerns, especially on how
revenue streams, market positioning, value proposition as well as offering tangible and non -tangible
benefits to both institutions and end-users. Hence, analysis on the potential business models by pioneers
of MOOCs, edX, Coursera and UDACITY [13] acts as a foundation to this study, as depicted in Table 1.
It is vital in identifying revenue streams as well as factors in MOOCs sustainability in higher educations.
EdX is not-for-profit platform while Coursera and UDACITY are for-profit organisations and the business
models may vary depending on the value proposition, financial as well as institutional aspects. From the
study, certification is a common aspect of revenue stream for all the MOOCs platforms, although both
Coursera and UDACITY focuses on trans-institutional partnership, sponsorship, marketing and human-
resource capital as pivotal aspects of their business models.
Table 1. Overview of business model for major MOOCs platforms ( edX, Coursera and Udacity)
3 Methodology and Design For this study, qualitative approach is adopted to identify the Critical Success Factors for MOOCs in
Malaysian higher education. A literature review is conducted extensively as well as stakeholder analysis
of UTM MOOC are conducted in order to identify the factors and components for the conceptual business
model. A stakeholder analysis is chosen as the qualitative tool as UTM MOOC is still at its nascent
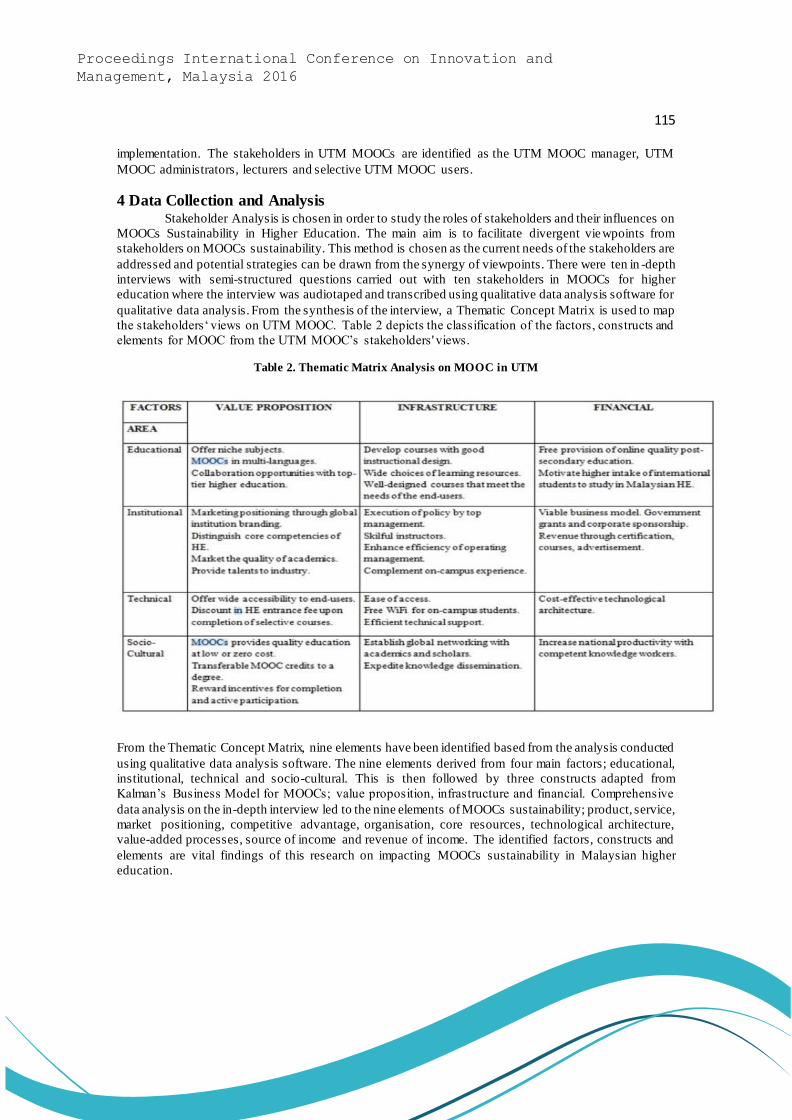
115
Proceedings International Conference on Innovation and
Management, Malaysia 2016
implementation. The stakeholders in UTM MOOCs are identified as the UTM MOOC manager, UTM
MOOC administrators, lecturers and selective UTM MOOC users.
4 Data Collection and Analysis Stakeholder Analysis is chosen in order to study the roles of stakeholders and their influences on
MOOCs Sustainability in Higher Education. The main aim is to facilitate divergent viewpoints from
stakeholders on MOOCs sustainability. This method is chosen as the current needs of the stakeholders are
addressed and potential strategies can be drawn from the synergy of viewpoints. There were ten in -depth
interviews with semi-structured questions carried out with ten stakeholders in MOOCs for higher
education where the interview was audiotaped and transcribed using qualitative data analysis software for
qualitative data analysis. From the synthesis of the interview, a Thematic Concept Matrix is used to map
the stakeholders‘ views on UTM MOOC. Table 2 depicts the classification of the factors, constructs and
elements for MOOC from the UTM MOOC’s stakeholders' views.
Table 2. Thematic Matrix Analysis on MOOC in UTM
From the Thematic Concept Matrix, nine elements have been identified based from the analysis conducted
using qualitative data analysis software. The nine elements derived from four main factors; educational,
institutional, technical and socio-cultural. This is then followed by three constructs adapted from
Kalman’s Business Model for MOOCs; value proposition, infrastructure and financial. Comprehensive
data analysis on the in-depth interview led to the nine elements of MOOCs sustainability; product, service,
market positioning, competitive advantage, organisation, core resources, technological architecture,
value-added processes, source of income and revenue of income. The identified factors, constructs and
elements are vital findings of this research on impacting MOOCs sustainability in Malaysian higher
education.
116
Proceedings International Conference on Innovation and
Management, Malaysia 2016
5 Conceptual Business Model for Moocs in Universiti Teknologi Malaysia Based from the synthesis of literature review and Stakeholder Analysis, a Conceptual Business Model for
MOOCs Sustainability in Higher Education is developed based from Disruptive Innovation Theory and
Connectivism Theory that underpinned the business model. Inductive approach is chosen for the
development of this business model. The reason for developing business models is twofold. First, it is a
pragmatic way for stakeholders to manage strategically-oriented choices in UTM MOOC. Secondly, it
fills the gap of underdeveloped business model for UTM MOOC in a long run. Table 3 depicts the
Constructs and Elements of UTM MOOC based from the synthesis of literature and stakeholders’ analysis.
Table 3: Constructs and Elements of MOOCs in UTM
UTM MOOC
Constructs Elements
Value proposition Product Service, Market Pos itioning, Competitive Advantage
Infrastructure Organization, Core Resources, Technological Architecture, Value-Added
Processes.
Financial Source of Income, Revenue of Income.
For Value Proposition, the three main elements are Product Service, Market Positioning and
Competitive Advantage. In the context of this research, Product Service refers t o MOOC courses and
complementary services such as guidance and tutorials. For Market Positioning, it refers to branding and
marketing the institutions via quality courses as well as reputable academics. For Competitive Advantage,
it refers to offering niche and in demand MOOC courses that would draw the attention of end -users to
sustain their interest in undertaking the MOOC courses. For the second factor, Infrastructure, the four
elements are Organizational, Core Resources, Technological Architecture and Value-added Processes.
Organizational refers to the administration of MOOCs by the policy makers at the respective institutions,
followed by core resources which could be categorized to physical and human resources. Physical
resources could be in the form of computers, Wi-Fi setup in the premise and servers while human
resources refer to trained MOOCs trainers and instructors. Next is technological architecture that supports
the technological maintenance and sustainability for MOOC in the respective institut ion of higher
education. Last but not least, value-added processes refer to the sociability aspects of the MOOCs
processes such as tutorials, live-streaming chats, discussions, badges and certification. The third factor for
the Conceptual Business Model is financial which encompasses two elements; source of income and
revenue structure. Hence, the UTM MOOC business model aims to integrate all the factors and elements
identified from the prior literature analysis and derived from the existing business models and literature
reviews on MOOCs in higher education in perpetuating the current needs of global higher education
effectively and efficiently. Figure 3 illustrates all the constructs and their elements that are integrated and
synthesized to develop the Conceptual Business Model for UTM MOOC.
117
Proceedings International Conference on Innovation and
Management, Malaysia 2016
Figure 3. Conceptual Business Model for UTM MOOC
6 Conclusion
Higher education has an eminent influence on expediting global knowledge capital via innovative
initiatives such as MOOCs. MOOCs implementation has dramat ically shifted the focus of higher
education where it exponentially gained attention as one of the main drivers of global learning innovation
in higher education. Due to the under-researched aspect of business model for UTM MOOC, this research
is timely as it supports UTM vision to be the stalwart leader of learning innovation as well as streamlining
the higher educational strategies. This is in lieu with the stakeholders‘ needs in wider access to cost-
effective quality education in UTM. A viable business model for UTM MOOC is vital in offering
customer value proposition, tangible and intangible benefits to end-users, apart from optimizing revenue
stream. The future studies stemmed from this research will explore the stakeholders‘ views of the
conceptual business model for UTM MOOC in order to optimize competitive advantage to both
institutions and end-users. Hence, the conceptual Business Model for UTM MOOC is hoped to propagate
the knowledge capital, wielding it to expedite value and of higher education bey ond physical, financial
and demographic barriers.
7 Future Studies For future studies, it is hoped that the Conceptual Business Model for MOOCs in UTM could be
tested and verified by the UTM MOOC developers as well as the users, predominantly academic sta ff and
students. A study on the business model impact on UTM MOOC sustainability is currently in progress by
the authors.
References [1] A McAuley, B. Stewart, G. Siemens, D. Cormier, and C. Commons, “The MOOC model for digital
practice,” Massive Open Online Courses Digit. ways knowing Learn., 2010, 1–64.
[2] T. R. Liyanagunawardena, “Massive Open Online Courses,” Humanities, 2015, vol. 4,35–41.
[3] N. Sa’don, N.F., Alias, R.A. and N.Ohshima, “Nascent Research Trends in MOOCs in Higher
Educational Institutions: A Systematic Literature Review,” in International Conference on Web and
Open Access to Learning (ICWOAL), 2014, 1–4.

118
Proceedings International Conference on Innovation and
Management, Malaysia 2016
[4] Ministry of Higher Education, Enhancing University Board Governance and Effectiven ess. Ministry
of Higher Education Malaysia, 2015.
[5] Ministry of Education Malaysia, Malaysia Education Blueprint, Kementerian Pendidikan Malaysia,
2015, vol. 2025, 2013-2025.
[6] “Malaysia first to implement open online courses for public universities,” Malaymail Online,19-Sep-
2014, 2020.
[7] M. Fadzil, L. Abdol, L. Tengku, and A. Munira, “Moocs in Malaysia: A Preliminary Case Study,” In
E-Asem Forum: Renewing The Lifelong Learning Agenda For The Future, 2015.
[8] R. A. Sa don, Nor Fadzleen, Alias and N. Ohshima, “Stakeholders ’ View on MOOCs Sustainability
in Malaysian Higher Education : A Preliminary Study,” Arpn j. Eng. Appl. Sci., 2015,vol. 10, no. 23,
1–9.
[9] OpenLearning, “Featured Courses,”. Available: https://www.openlearning.com/courses/, 2015.
[Accessed: 10-Aug-2015].
[10]U. T. Malaysia, “UTM MOOC,” Open Learning, 2014.Availab le:
https://www.openlearning.com/utm.
[11]C. Zott, R. Amit, and L. Massa, “The Business Model: Recent Developments and Future Research,”
J. Manage., 2011, vol. 37, no. 4, 1019–1042.
[12]J. G. Mazoue, “The MOOC Model : Challenging Traditional Education,” Educ. Rev, 2013,1–9.
[13]L. Yuan and S. Powell, “MOOCs and Open Education: Implications for Higher Education, 2013.

119
Proceedings International Conference on Innovation and
Management, Malaysia 2016
Developing Building Information Modelling (BIM) Implementation
Model for Project Design Team Suzila Mohd1, Juliana Brahim2, Aryani Ahmad Latiffi2, Mohamad Syazli Fathi3 and Aizul Nahar Harun1
1 Malaysia-Japan International Institute of Technology (MJIIT), Universiti Teknologi Malaysia (UTM),
Kuala Lumpur, Malaysia.
2 Faculty of Technology Management and Business, Universiti Tun Hussein Onn Malaysia (UTHM),
86400 Batu Pahat, Johor, Malaysia
3 UTM Razak School of Engineering and Advanced Technology, Universiti Teknologi Malaysia, Kuala
Lumpur, Malaysia.
(E-mail: [email protected], [email protected], [email protected], [email protected],
Abstract Building Information Modelling (BIM) is implemented by the project design team to overcome
the insufficiency of information in project design, which leads to design changes and design clashes.
However, it seems difficult for project design team to implement BIM and get the benefits from its
implementation in the project design stage because they do not know the right way to implement BIM
especially to the beginner. Therefore, this paper proposes a model called ‘BIM Implementation Model for
Project Design Team’. A literature review was carried out to explore on adaptation of BIM in the project
design stage and types of maturity model in construction field. Apart from that, several semi-structured
interviews were conducted with project design team to explore potential improvements to increase BIM
implementation in project design stage. Both data from the literature review and the semi-structured
interviews are important and contributed to the development of ‘BIM Implementation Model for Project
Design Team’.This model is created to assist the project design team to improve the implementation of
BIM in the project design stage and getting benefits from its implementation. The model purposes, the
concept of the model, procedure of its development as well as details of the model elements presented in
this paper will form the basis for the development of the ‘BIM Implementation Model for Project Design
Team’.
Keywords Building Information Modelling (BIM), Construction project, Construction industry, Design
stage, Maturity model, Innovation, Technology.
1 Introduction Building information modelling (BIM) is known as a human activity, which ultimately involves
broad process change in the construction industry [1]. Nowadays, BIM implementation in construction
projects is vital in the achievement of the construction industry development goals in many countries.
Countries such as the United States of America (USA) and Finland were globally implementing BIM in
their construction projects. Meanwhile, other countries such as Australia, Singapore, Hong Kong (HK)
and Malaysia have started to realize the opportunity and have started to implement BIM in their
construction projects [1, 2]. The countries are now starting to invest in order to implement BIM in
construction projects [2].
The main objective of BIM implementation in construction projects is to reduce any threat, which
lead to construction problem such as low of construction productivity, low of project quality, project delay,
construction cost overrun and disputes among construction players [1, 3, 4]. Several authors identify one
of the factors contribute to the problems is related to poor in managing project design [5, 6]. In order to
avoid the problems, the construction players have to improve efficiency and effectiveness of managing

120
Proceedings International Conference on Innovation and
Management, Malaysia 2016
project design. Therefore, the implementation of BIM in project design stage is one of the best way to
improve efficiency and effectiveness of construction projects in reducing construction problems [1, 7].
Many construction players agreed to implement BIM in their project because they believe that
BIM could increase their works performance based on their projects performance especially in preparing
project design [8]. Most of construction players especially the project design team agreed that the process
of preparing project document is faster by using BIM compared with project without BIM [1, 8, 9]. For
example, the ability of BIM in visualise project design in form of 3 dimensional (3D) has increase client
understanding on project design compare to 2 dimensional (2D) design [10]. Therefore, client can identify
any changes earlier and it help design team to produce a better project documents faster than conventional
process.
Moreover, the BIM uses is not only limited to project design stage. It could be used for the whole
project lifecycle. There are twenty-six (26) types of BIM uses that could be applied in a construction
project. BIM could be implemented in all stages of construction project, which are pre-construction stage,
construction stage and post-construction stage. In order to get used all the BIM uses in construction
projects and get the benefits from its implementation, it is necessary to have a proper guideline to assist
the right way to implement BIM.
Therefore, this paper highlight on the barriers and challenges of BIM implementation, potential
improvement to increase BIM implementation in the project design stage as well as presents a maturity
roadmap to facilitate the BIM implementation among the project design team.
2 Data and Methodology There are two (2) methods used to develop BIM Implementation Model for Project Design Team.
Figure 1 illustrates the methods.
Figure 1 Method used for developing the BIM Implementation Model for Project Design Team
Based on the figure, literature review and semi-structured interviews were conducted to gather
information on BIM implementation in project design stage. The literature review was conducted to obtain
information on adaptation of BIM in project design stage and types of maturity model in the area subject
to BIM and construction field. The literature review was made by referring to books, journal articles,
international conference papers and materials available on the internet.

121
Proceedings International Conference on Innovation and
Management, Malaysia 2016
Moreover, semi-structured interviews with project design team (client, architect, civil and
structural engineer, mechanical and electrical (M&E) engineer and contractor) were conducted to explore
potential improvements to increase BIM implementation in project design stage. The face to face
interviews involved eight (8) respondents, which have used and currently using BIM in project design
stage. The respondents come from different organizations; public and private sectors. All respondents are
responsible to manage project design. Apart from that, all respondents have been asked based on a set of
interview questions.
The aim of the interview questions is to obtain data on the current practices of BIM
implementation in project design stage in the Malaysian construction industry. All data gained from the
interviews were recorded with the permission of respondents, transcribed and analysed using content
analysis. Content analysis is one of technique used in this paper to analyse all data from semi-structured
interviews, which all data will be presented in form of texts, tables, figures and expressions.
Both data, from the literature review and findings from semi-structured interviews with respondents
were used to develop BIM Implementation Model for Project Design Team. Detail on the model
development will be discussed on following section.
3 Results This section discusses on results and findings from the interviews. The interviews provided an
in-depth analysis of BIM implementation in project design stage among client, architect, civil and
structural engineer, M&E engineer and contractor. Discussion on results and findings were reported into
three (3) sub-sections as follows:
i. Respondent’s background;
ii. Benefits of BIM for project design;
iii. Potential improvements to increase BIM implementation in project design stage.
All the information lead to development of BIM Implementation Model for Project Design Team. Details
results on each sub-section are discussed in the following section.
3.1 Respondent’s Background
The respondents consist of BIM principle director, BIM coordinator, project manager, client,
architects, civil & structural engineers as well as M&E engineer. Brief on respondent’s background is
shown in Table 1. Table 1 Respondent’s Background
Based on the table, all the respondents have experienced in managing project design using BIM in between
three (3) to six (6) years. All respondents are responsible in managing project design in construction
project using BIM. Most of projects using BIM conducted by all respondents are residential project and
commercial building. Based on the respondents’ positions and experiences in project using BIM, it is
reasonable to conclude that all respondents have knowledge on BIM implementation in project design
stage. Moreover, the longer the experiences of the respondent in project using BIM, the greater of their
understanding and knowledge on BIM implementation in project design stage. This is supported by
Respondent Position in Project Using BIM Experience in Project Using BIM (Year) No. of Project Using BIM
R1 BIM Principle Director 6 3
R2 BIM Coordinator 4 2
R3 Project Manager 3 3 R4 BIM Coordinator 4 4
R5 Client 5 2
R6 Civil & Structural engineer 3 4
R7 M&E engineer 3 2
R8 Architect 4 4

122
Proceedings International Conference on Innovation and
Management, Malaysia 2016
Mendenhall, Oddou and Osland [11], where they stated that personal experience is the essential element
in knowledge creation.
3.2 Barriers and Challenges of BIM Implementation in Design Stage
There are several factors and causes contributed to barriers and challenges of BIM
implementation in design stage. Based on the interviews, all respondents agreed the first factor contributed
to slow implementation of BIM in project design is people. With regards to the people, all respondents
agreed that, most of construction players are comfortable with traditional or conventional process in
managing project design hence they refused to implement BIM in managing project design.
In addition to that, all respondents acknowledged that, lack of awareness on BIM among clients
and top managerial is one of the reasons why construction players are comfortable with traditional process
in managing project design. This problem contributes to slow implementation of BIM in construction
projects. Apart from that, lack of encouragement by top managerial in an organization to implement BIM
in construction projects also contributed to the lack of knowledge and skill on BIM [12].
The second factor contributed to barriers and challenges of BIM implementation in design stage
is the process. All respondents agreed that, there is no standardisation guideline in the M alaysian
construction industry that they can follow. Consequence to that, construction players are mostly
implement BIM improper way and failed to get the benefits [5, 13, 14]. This issue causes the construction
players were despairing to implement BIM in their next projects.
The last factors, which contribute to barriers and challenges to implement BIM in design stage
is technology. According to all respondents, the elements of tools or software, hardware and BIM training
are related to the technology as a barrier and challenges to implement BIM. They agreed that most of top
managerial in construction organisations refuse to invest on BIM tools or softwares, hardwares and
trainings. This might be due to the cost issue as the total amount to implement BIM in construction project
could reach RM 15,000.00 to RM 30,000.00. As a result, only large organisations can afford to own the
technology.
From the interviews, all respondents agreed that the number of BIM expert in the Malaysian
construction industry is limited due to reluctance of construction players to implement BIM in their
projects. This is in line with Ahmad Latiffi et al. [13] and Construction Research Institute of Malaysia
[14] where the reluctance of construction players to implement BIM is contributed to slow adoption of
BIM in the Malaysian construction industry.
Based on the discussion regarding barriers and challenges to implement BIM, it can be concluded
that most of Malaysian construction players are not ready to implement BIM in construction projects
especially in managing project design. Therefore, the barriers and challenges of BIM implementation must
be addressed in order to increase BIM implementation among construction players. Figure 2 illustrates
barriers and challenges stated by all respondents.
123
Proceedings International Conference on Innovation and
Management, Malaysia 2016
Barriers and Challenges to
Implement BIM in Project Design
Stage
Process
People
Technology
1. Comfortable with
traditional process.
2. Lack of Knowledge
on BIM.
3. Lack of skill on
BIM.
1. No BIM Guideline.
1. BIM tool or
software is expensive.
2. New hardware to
support BIM tool is
expensive.
3. The cost of BIM
training is expensive.
Factor
Barriers and
Challenges
2. No specific model
to refer.
Figure 2 Barriers and Challenges to Implement BIM in Project Design Stage
3.3 Potential Improvements to Increase BIM Implementation in Project Design Stage
All respondents have suggested several potential improvements in order to improve BIM
implementation in managing project design stage. There are seven (7) potential improvements to increase
BIM implementation in project design stage revealed from the interviews. The potential improvements
are the ways to increase BIM implementation in project design stage.
All respondents agreed, the first approach to increase BIM implementation in project design stage
is by educating top managerial in construction organisation to understand and aware on benefits of BIM
in project design stage. Understanding and awareness of top managerial on BIM benefits is important to
increase its implementation in projects. This is because, the top managerial have the right to instruct their
staff to implement BIM [15, 16].
On top of that, R2 and R5 explained the best way to increase knowledge and skills on BIM is by
participating in training and seminar related to BIM. The training and seminar will benefit construction
players in their career, organisation and construction projects. However, awareness of BIM must be
extended to top managerial in the organisation, as top managerial is the indicator to encourage their staff
to implement BIM [15, 16].
Furthermore, four (4) respondents (R3, R6, R7 and R8) agreed that other way to increase BIM
implementation in project design stage is cooperation from any government bodies in construction
projects. The enforcement in implementing BIM by the government can help to increase BIM practices
in construction projects [13]. Apart from that, R1, R2 and R3 also agreed that the government should
provide BIM guideline, where the guideline can assits construction players to implement BIM. Further to
that, R6, R7 and R8 explained that their organisation (public authority) is developing BIM guideline for
government projects. Therefore, the guideline can be used by construction players in order to manage

124
Proceedings International Conference on Innovation and
Management, Malaysia 2016
BIM government projects. R6, R7 and R8 also stated that toward the beginning of 2016 all construction
players, which interested to involve in government projects are required to implement BIM. BIM guideline
is one of the approaches to increase BIM implementation in construction projects [15].
Furthermore, all respondents agreed that any strategic approach or model is required in order to
assist construction players to implement BIM in construction projects. R1 and R4 explained that, the
model must able to assist construction players to implement BIM in a right ways. Another potential
improvement to increase BIM implementation in project design stage stated by all respondents is by
educating undergraduate or postgraduate students in any institutions on BIM. R2, R5 and R6 explained
that, the cooperation between practitioner and academia as well as researchers can give early exposure to
students on BIM. Apart from that, the role of researchers is also important in order to share current
practices on BIM in the Malaysian construction industry through research pub lication. This approach at
once could increase knowledge on current practices of BIM in construction projects with other
construction players. Apart from that, the cooperation between government, BIM practitioners and
researchers can increase BIM implementation in construction projects by assisting construction players
on how to implement BIM in construction projects.
Overall, in order to increase BIM implementation in construction projects, all parties, which are
construction players, the government, researcher and academician have to cooperate. Cooperation among
them can increase knowledge on BIM implementation in construction projects among construction players
and youth in any institutions. All respondents agreed that, the cooperation among all the parties accelerate
the process to increase awareness of BIM in the construction industry. Table 2 shows the summary of the
potential improvements to increase BIM implementation in project design stage.
Table 2 Potential Improvements to Increase BIM Implementation in Project Design Stage
No Approaches Respondent Total
Respondent
1 Early understanding by top managerial in an organisation
on BIM.
R1, R2, R3, R4, R5, R6, R7,
R8
8
2 Awareness on BIM by undertaking training and attending seminar on BIM.
R1, R2, R3, R4, R5, R6, R7, R8
8
3 Encouragement from top managerial in organisation to
implement BIM.
R1, R2, R3, R4, R5, R6, R7,
R8
8
4 Enforcement on implementing BIM by the government in
construction projects.
R3, R6, R7, R8 4
5 Government should provide BIM guideline. R1, R2, R3, R4, R5, R6, R7,
R8
8
6 A strategic approach model is needed to assist
construction players to implement BIM in construction
projects.
R1, R2, R3, R4, R5, R6, R7,
R8
8
7 Educate and expose on BIM to undergraduate and
postgraduate students in any institutions.
R1, R2, R4, R5, R6, R7, R8 7
3.3 Development of BIM Implementation Model for Project Design Team
There are two (2) methods used in order to develop the BIM Implementation Model for Project
Design Team. The first method is data from past literature review on types of maturity model and the
second method is data from the current studies of BIM implementation in project design stage based on
semi-structured interviews with project design team. Both methods were used in developin g the model,
so that it is more relevant and can be used in the current situation.
Maturity concept has been used to develop the research model because the research model has
the same intention with the concept, which is to point out the current position to the desire position with

125
Proceedings International Conference on Innovation and
Management, Malaysia 2016
the intention of giving benefits to project design team. There are four (4) steps to develop the BIM
implementation model for project design team, which has been adopted from BIm3, Construction Supply
Chain Maturity Model and Performance Measurement (PM) Migration Path Model [17-19]. The models
have described a clear steps on how to develop a model, which based on maturity concept. The steps are
as follows:
i. Step 1: Model purposes;
ii. Step 2: Concept of the model;
iii. Step 3: Procedure of model development; and
iv. Step 4: Details of the model elements.
All the steps have been adopted to develop BIM Implementation Model for Project Design Team. Details
on each step will be discussed in following sections.
3.3.1 Step 1: BIM Implementation Model for Design Team Purposes
Maturity model is a platform towards achieving a mature process [20]. Each level in maturity
model indicates a level of capability process. Meanwhile, others author assumed that maturity model as
that progress towards goal achievement that comes in stages [21]. Therefore, the progress toward goal
achievement for BIM implementation model for project design team will comes in stages or levels. The
purpose of the maturity model is used to develop BIM implementation model for project design tea m, will
help construction organisation or project design team to structure and organise BIM activities in project
design stage. The maturity shows the currents position of project design team in the project design stage
and the next level to be achieved by them. The BIM Implementation Model for Project Design Team is
developed as follows:
i. To classify the maturity of BIM implementation in project design stage of an organisation;
ii. To guide project design team in an organisation towards an effective of BIM implementation in
project design stage; and
iii. To assists project design team in a place to start and follow several elements in each level of the
model. Each element in each level of the model must be fulfilled by project design team in order
to move to the next level. 3.3.2 Step 2: Concept of BIM Implementation Model for Project Design Team
There are seven (7) maturity models used as reference to develop research model as illustrated
in Figure 3. The main reason for choosing CMM [20], The BPO maturity model [21], People CMM [22],
STEPS maturity model [23], Construction Supply Chain Maturity Model [18] and Performance
Measurement Migration Path Model [24][35] as references for the research model development is that the
research model has similar purposes with the other models. The purpose of the research model is to
provide a structured approach to assist project design team to implement BIM in project design stage.
Moreover, CMM was adopted in developing research model because other maturity models
adopted in this research have been developed based on CMM as reference. Although CMM was created
for a different area, but it can still be accepted as main reference to develop BIM Implementation Model
for Project Design Team. Moreover, the Bew-Richards BIM maturity model [25] and BIm3 [19] are used
as reference to discuss on current level of BIM maturity in the Malaysian construction industry.
Nevertheless, the purpose of all the models was assisting individual, organisation an d industry to achieve
something more and better from its current position.
All adopted models consisted of several levels, stages or phases, which the pattern of each model
shows the lowest level to the highest level in the model. Moreover, each level des cribes different
characteristics to achieve success of each level. The selected levels from each model have been used as
references to develop the BIM Implementation Model for Project Design Team.
126
Proceedings International Conference on Innovation and
Management, Malaysia 2016
Figure 3 Concept of BIM Implementation Model for Project Design Team
3.3.3 Step 3: Procedure to develop BIM Implementation Model for Project Design Team
Construction Supply Chain Maturity Model [18] and Performance Measurement (PM) Migration
Path Model [17] has considered four (4) things to develop maturity model. The things have been
considered and adopted in developing a maturity model for ‘BIM Implementation Model for Project
Design Team’. The things are as follows:
i. Identify criteria to be considered in implementing BIM in project design stage;
ii. Identify number of levels needed for the model;
iii. Identify the first element should be in the first level and later. Give consideration to what should be
achieved at each level, and action taken by whom; and
iv. Identify the lowest level of the model should demonstrate an understanding of BIM concept and
processes. The highest level should show that the design team has awareness of expanding BIM
implementation in project design stage to other stage in construction projects process.
In this research, all these things have been considered before developing ‘BIM Implementation Model for
Project Design Team’. Details on model development are discusses in the next sub -section of this section.
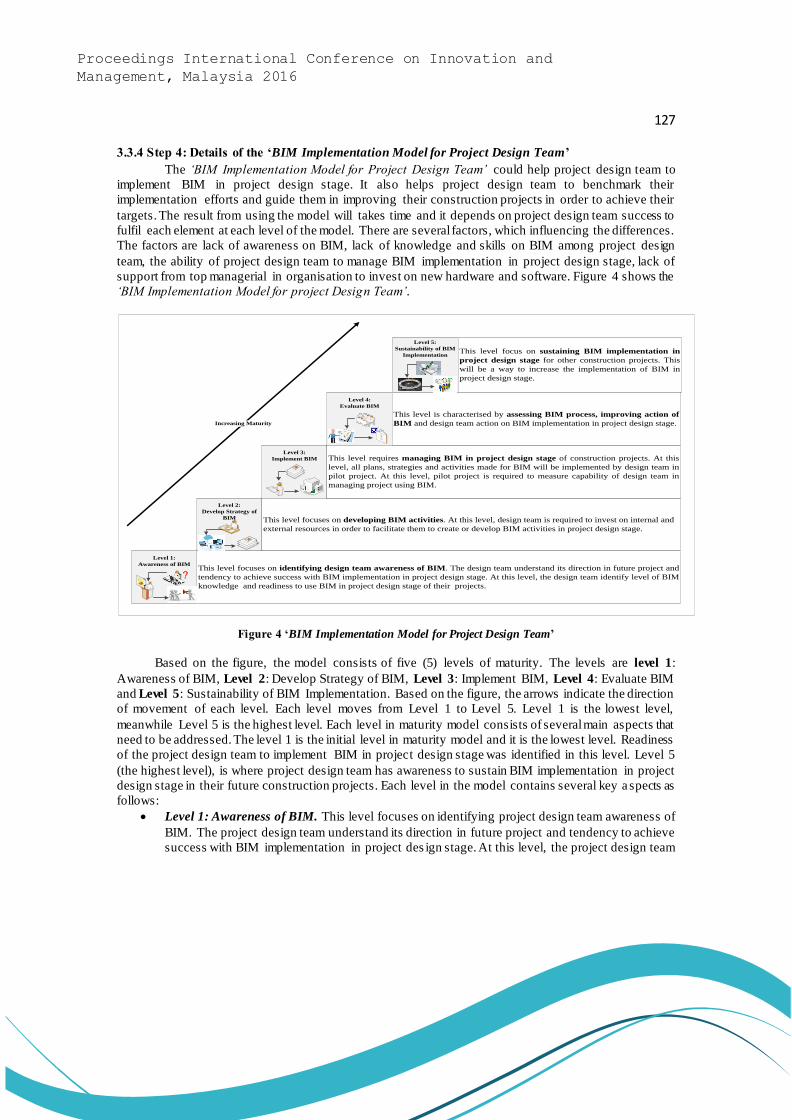
127
Proceedings International Conference on Innovation and
Management, Malaysia 2016
3.3.4 Step 4: Details of the ‘BIM Implementation Model for Project Design Team’
The ‘BIM Implementation Model for Project Design Team’ could help project design team to
implement BIM in project design stage. It also helps project design team to benchmark their
implementation efforts and guide them in improving their construction projects in order to achieve their
targets. The result from using the model will takes time and it depends on project design team success to
fulfil each element at each level of the model. There are several factors, which influencing the differences.
The factors are lack of awareness on BIM, lack of knowledge and skills on BIM among project design
team, the ability of project design team to manage BIM implementation in project design stage, lack of
support from top managerial in organisation to invest on new hardware and software. Figure 4 shows the
‘BIM Implementation Model for project Design Team’.
Level 2:
Develop Strategy of
BIM
Level 3:
Implement BIM
Level 4:
Evaluate BIM
Level 5:
Sustainability of BIM
Implementation
This level focuses on identifying design team awareness of BIM. The design team understand its direction in future project and
tendency to achieve success with BIM implementation in project design stage. At this level, the design team identify level of BIM
knowledge and readiness to use BIM in project design stage of their projects.
This level focuses on developing BIM activities. At this level, design team is required to invest on internal and
external resources in order to facilitate them to create or develop BIM activities in project design stage.
This level requires managing BIM in project design stage of construction projects. At this
level, all plans, strategies and activities made for BIM will be implemented by design team in
pilot project. At this level, pilot project is required to measure capability of design team in
managing project using BIM.
This level focus on sustaining BIM implementation in
project design stage for other construction projects. This
will be a way to increase the implementation of BIM in
project design stage.
This level is characterised by assessing BIM process, improving action of
BIM and design team action on BIM implementation in project design stage. Increasing Maturity
Level 1:
Awareness of BIM
Figure 4 ‘BIM Implementation Model for Project Design Team’
Based on the figure, the model consists of five (5) levels of maturity. The levels are level 1:
Awareness of BIM, Level 2: Develop Strategy of BIM, Level 3: Implement BIM, Level 4: Evaluate BIM
and Level 5: Sustainability of BIM Implementation. Based on the figure, the arrows indicate the direction
of movement of each level. Each level moves from Level 1 to Level 5. Level 1 is the lowest level,
meanwhile Level 5 is the highest level. Each level in maturity model consists of several main aspects that
need to be addressed. The level 1 is the initial level in maturity model and it is the lowest level. Readiness
of the project design team to implement BIM in project design stage was identified in this level. Level 5
(the highest level), is where project design team has awareness to sustain BIM implementation in project
design stage in their future construction projects. Each level in the model contains several key a spects as
follows:
Level 1: Awareness of BIM. This level focuses on identifying project design team awareness of
BIM. The project design team understand its direction in future project and tendency to achieve
success with BIM implementation in project des ign stage. At this level, the project design team
128
Proceedings International Conference on Innovation and
Management, Malaysia 2016
identify level of BIM knowledge and readiness to use BIM in project design stage of their
projects.
Level 2: Develop Strategy of BIM. This level focuses on developing BIM activities. At this level,
project design team is required to invest on internal and external resources in order to facilitate
them to create or develop BIM activities in project design stage.
Level 3: Implement BIM. This level requires managing BIM in project design stage of
construction projects. At this level, all plans, strategies and activities made for BIM will be
implemented by project design team in pilot project. At this level, pilot project is required to
measure capability of project design team in managing project using BIM.
Level 4: Evaluate BIM. This level is characterised by assessing BIM process, improving action
of BIM and project design team action on BIM implementation in project design stage.
Level 5: Sustainability BIM Implementation. This level focus on sustaining BIM
implementation in project design stage for other construction projects. This will be a way to
increase the implementation of BIM in project design stage.
4 Conclusion This paper has revealed that BIM implementation in project design stage could improve
construction projects effectiveness by reducing construction problems. It also gives benefits to
construction projects in term of project duration, construction cost and quality of end product. In order to
increase BIM implementation in project design stage, a model has been created to assist project design
team to implement BIM in project design stage. The model is called as BIM Implementation Model for
Project Design Team. Maturity models concept has been adopted to build the model. The model is
developed to assist project design team a place to start and follow several elements in each level of the
model. Each element in each level of the model needs to be fulfilled by project design team in order to
increase their performance in managing project design stage.
Further research will be conducted to evaluate the capability of the model in assisting project design
team to implement BIM in project design stage. The evaluation will be conducted with several evaluators,
which have experiences in managing project using BIM. The evaluation result will shows either the model
is capable to assist project design team to implement BIM in a right way or not. The results is good in
order to improve the model.
Acknowledgement The authors would like to thank Malaysia-Japan International Institute of Technology
(MJIIT), Universiti Teknologi Malaysia (UTM), Kuala Lumpur, Malaysia for supporting this
research.
References
[1] Eastman, C., C.M. Eastman, P. Teicholz, and R. Sacks, BIM Handbook: A Guide to Building
Information Modeling for Owners, Managers, Designers, Engineers and Contractors . 2011: John
Wiley & Sons.
[2] Government, M., Building Information Modelling (BIM), Industry Strategy: Government and Industry
in Partnership, 2012.
[3] Newman, S., Building Information Modeling: Enabling Smart Design, Construction Facilities
Management. Research Publication, 2013.
[4] Abdul Kadir, M., W. Lee, M. Jaafar, S. Sapuan, and A. Ali, Factors affecting construction labour
productivity for Malaysian residential projects. Structural Survey, 2005. 23(1): p. 42-54.
129
Proceedings International Conference on Innovation and
Management, Malaysia 2016
[5] Gambate, J.A., Pocock, J.B., Dunston, P.S. , Constructability: Concepts and Practice. American
Society of Civil Engineers. , 2007.
[6] (PWD), P.W.D., Unit Building Information Modelling (BIM) 2011.
[7] Klinger, M., and Susong, M. , The Construction Project: Phases, People, Terms, Paperwork,
Processes. . 2006, United States of America: American Bar Association.
[8] Crotty, R., The impact of building information modelling: transforming construction . 2013: Routledge.
[9] Reddy, K.P., BIM for building owners and developers: making a business case for using BIM on
projects. 2011: John Wiley & Sons.
[10] Kymmell, W., Building Information Modeling: Planning and Managing Construction Projects
with 4D CAD and Simulations (McGraw-Hill Construction Series): Planning and Managing
Construction Projects with 4D CAD and Simulations. 2008: McGraw Hill Professional.
[11] Mendenhall, M.E., J. Osland, A. Bird, G.R. Oddou, M.L. Maznevski, M. Stevens, and G.K. Stahl,
Global Leadership 2e: Research, Practice, and Development . 2013: Taylor & Francis.
[12] Lee, A.H., W.-C. Chen, and C.-J. Chang, A fuzzy AHP and BSC approach for evaluating
performance of IT department in the manufacturing industry in Taiwan. Expert systems with
applications, 2008. 34(1): p. 96-107.
[13] Ahmad Latiffi, A., S. Mohd, N. Kasim, and M.S. Fathi, Building information modeling (BIM)
application in Malaysian construction industry. International Journal of Construction Engineering and
Management, 2013. 2(A): p. 1-6.
[14] Construction Research Institute of Malaysia, C., Issues and Challenges in Implementing BIM
For SME's in the Construction Industry., 2014.
[15] Construction Specifications Institute, C., The CSI Construction Contract Administration
Practice Guide. 2011: John Wiley.
[16] Gu, N. and K. London, Understanding and facilitating BIM adoption in the AEC industry.
Automation in construction, 2010. 19(8): p. 988-999.
[17] Ahmad Latiffi, A., Performance Measurement For Construction Businesses, 2012,
Loughborough University.
[18] Meng, X., M. Sun, and M. Jones, Maturity model for supply chain relationships in construction.
Journal of Management in Engineering, 2011. 27(2): p. 97-105.
[19] Succar, B., Building information modelling maturity matrix. Handbook of Research on Building
Information Modeling and Construction Informatics: Concepts and Technologies, IGI Global, 2009:
p. 65-103.
[20] Paulk, M., Capability maturity model for software. 1993: Wiley Online Library.
[21] Lockamy III, A. and K. McCormack, The development of a supply chain management process
maturity model using the concepts of business process orientation. Supply Chain Management: An
International Journal, 2004. 9(4): p. 272-278.
[22] Curtis, D.B., W.E. Hefley, and S.A. Miller, The people capability maturity model: Guidelines
for improving the workforce. 2002: Addison-Wesley.
[23] Seow, C., R. Hillary, H. Robinson, C. Anumba, P. Carrillo, and A. Al-Ghassani, STEPS: a
knowledge management maturity roadmap for corporate sustainability. Business Process
Management Journal, 2006. 12(6): p. 793-808.
[24] Ahmad Latiffi, A., Carrillo, P. M., Ruikar, K., & Anumba, C. J. , Development of Performance
Measurement Migration Path For Construction Organisations. Third International Conference on
Construction In Developing Countries (ICCIDC-III) “Advancing Civil, Architectural and
Construction Engineering & Management” 2010.
[25] Jayasena, H.S. and C. Weddikkara. Assessing the BIM maturity in a BIM infant industry . in
Proceedings of the Second World Construction Symposium 2013: Socio-Economic Sustainability in
Construction. 2013.

130
Proceedings International Conference on Innovation and
Management, Malaysia 2016
Web-Based Communication Model Between Teacher and Student in
Foreign Language Software
Yan Watequlis Syaifudin, Imam Fahrur Rozi , Atiqah Nurul Asri
1 State Polytechnic of Malang, Indonesia
(Email: [email protected], [email protected], [email protected])
Abstact The needs for communication with the world community requires people to be able to master
some kind of foreign language well. In the world of education in Indonesia, one of the foreign languages
most widely taught in English. To support that, several schools and university in Indonesia are required
to have a language lab that can be used as a means of learning a foreign language. But to build a language
lab certainly require no small cost. On the other side, today almost all schools and colleges already have
computer labs. So it is possible for the computer is functioning laboratories such as language laboratories,
in particular by implementing a system of foreign language learning software.
To make the language learning software system becomes interactive and as realtime communication
media between teacher and student, then it should be implemented chatting features on it. Chatting feature
can be used in group mode or private mode. Chatting feature can be used in group mode or private mode.
And just like the learning media feature that require of data t ransportation model effective, likewise with
the chatting features. Chatting features have to be running in realtime with a minimal time delay possible.
On this research will be discussed about the data communication model between computers (servers)
teacher with student computer (client) in supporting streaming feature of learning video data and teacher’s
live video, as well as in supporting the chatting features between teachers and students. Audio and video
streaming technology is more relevant to implement, because this time computer technology, multimedia
and internet are growing up. Delay time which firstly became an issue in the process of audio and video
streaming, has recently been reduced and minimized. The Use of LAMPP stack, Node.js, NPM and VLC
on the server side, the use of RTSP as the protocol to send video/audio data from the server to the client
and the VLC plugin embedded in the client browser, have been able to collaborate optimally to make
audio/video streaming system.
Keywords language learning, communication media, RTSP, audio, video, streaming
1 Introduction Globalization requires every citizen to be able to compete in the international arena. The needs for
communication with the world community requires people to be able to master some kind of foreign
language well. In the world of education in Indonesia, one of the foreign languages most widely taught in
English. Although there are several other foreign languages that be taught in some schools in Indonesia,
but the English still number one as a foreign language that must be mastered by the citizens in Indonesia.
Moreover, English began to be given to students in grade 1 primary school level. It aims to support
Indonesia in preparing the HR community in the era of globalization and competition at ASEAN regional
level. To support that, several schools and university in Indonesia are required to have a language lab that
can be used as a means of learning a foreign language.
But to build a language lab certainly require no small cost. On the other side, today almost all schools
and colleges already have computer labs. So it is possible for the computer is functioning laboratories
such as language laboratories, in particular by implementing a system of foreign language learning
software. Among the features that must be provided by a software system that is learning a foreign
language is (Syaifudin,et.al, 2015):
- Learning media feature
- Group discussion feature
131
Proceedings International Conference on Innovation and
Management, Malaysia 2016
- Quiz feature
- Attendance list feature
By applying information technology for implementing foreign language learning software, it is
expected (can) reduce the cost of procurement language laboratory, can maximize the computer lab usage,
and can ultimately provide a new atmosphere in learning foreign languages and can improve learning
outcomes (Asri, et.al., 2015). One of the key features in language learning software is a feature of learning
media. This feature makes it possible to display a various of media, both text and multimedia media.
Included in the multimedia-based teaching materials is a video tutorial / learning materials and live video
when teacher delivering they materials. Size large of multimedia teaching materials to be delivered from
the teacher's computer to computer students, necessitates a mechanism for effective streaming multimedia
data which can minimize delay and maintain the quality of the data.
Besides feature of learning media, to make the language learning software system becomes
interactive and as realtime communication media between teacher and student, then it should be
implemented chatting features on it. Chatting feature can be used in group mode or private mode. And
just like the learning media feature that require of data transportation model effective, likewise with the
chatting features. Chatting features have to be running in realtime with a minimal time delay possible.
On this research will be discussed about the data communication model between computers (servers)
teacher with student computer (client) in supporting streaming feature of learning video data and teacher’s
live video, as well as in supporting the chatting features between teachers and students.
2 Literature Review 2.1 Literature Review
Some previous research have been implemented to apply information technology in the learning
process. In 2005 Dolzani develop Steraming Video system via the Internet network to support the learning
process called LODE system (Dolzani, 2005). In applying, 66 % students have accessed and used that
system in the learning process. In 2013, Rozi did research to implement VoD (Video on Demand) to
support the process of long distance education at the Politeknik Negeri Malang (Rozi, 2013). The system
can organize and manage instructional video data, user data and provide services to users in the form of
instructional video display in accordance with the request of the user.
In a different research, Hartsell and Yuen, in 2006 did the research about usage of video streaming
on online learning process (Hartsell et al 2006). There are several things to notice in streaming video
technology, such as, (1) making a video in the right format (2) the availability of server streaming media
(3) enough bandwidth to download and upload video files. Streamed video generally has real media
format, Windows Media, Quick Time. All of them support the protocol RTSP (Real Time Streaming
Protocol) which can do streaming in real time. MPEG-2 and MPEG-4 are new formats which can also be
used for streamed video.
Syaifudin in 2015 has made the design of software for learning a foreign language is one o f its main
features is to streaming video and live video learning from teacher to student (Syaifudin, et.al., 2015).
Also in the design of the software also has features to recap student attendance, quiz, question bank, and
other learning data management features. The design of foreign language learning software is oriented on
improving the effectiveness of the process of learning a foreign language. In addition, the drafting is also
intended to improve the efficiency of the use of the computer lab, which has been at the school, as well as
a language lab (Asri, 2015). That is, simply by installing the software in the computer lab, then the school
can function as a computer lab and language lab at once.
2.2 Video Streaming
Along with the development of computer technology, multimedia and networking, the educators
saw the opportunity to create a more productive learning environment. One product of collaboration from

132
Proceedings International Conference on Innovation and
Management, Malaysia 2016
third technologies is video streaming. Video streaming can be used as a facility for delivering on
instructional material in audio and video format. The term is commonly used streaming video to show the
process of compression and buffering the video, so that video content can be viewed in real time by the
user through the Internet. Streaming video service users can see the video you that they want by
downloading some parts of the video and pass on other parts to see next. This method is more effective
than download all the video section in the same time and see it later. In the video streaming process , the
program will download the video file to be displayed in a small packet buffer. If the packet buffers that
have been downloaded are sufficient to display, then the program will start showing. And the download
process for the next part started back. In other words, the process of streaming media can be defined as
the transfer of digital media (such as video, audio and data) that take place simultaneously with the
application server that can be displayed in the client application in real time (Hartsell, et.al., 2006). If the
streaming process has been completed and the file has been displayed, the file is no longer available in
the user's computer (Reed, 2003).
Special for the educator, streaming video technology offers the advantage of creating a virtualized
instructional material that more could attract the attention of students. In addition, good streaming video
management system will help educator to manage instructional video content into a database that is easy
to find time (Hartsell, et.al., 2006).
And of course this technology can expand the dimensions of time and space to do learning process.
If during this time we can only meet a lecturer in a classroom on a specific schedule, then by streaming
video, visualization of the teacher can be presented in a video format and can be accessed by students
wherever and whenever they want.
2.3 RTSP (Real Time Streaming Protocol)
RTSP is one of protocol that is frequently used to do streaming digital media, such as audio or video
in real time. The use of RSTP can allow live viewing video from the direct source (such as encoder or
camera) using the standard media player and compatible with the protocol. What is meant by standard in
this case is it has already implemented RTSP standard that has been listed in RFC2326 (Simon, 2010).
Some examples of media player which have implemented standard RTSP, are VLC, Quicktime Vide LAN
Client and there are many other media players that have implemented it.
RTSP set and control either one or several time-synchronized streams of a continuous media such
as audio and video. It does not typically deliver the continuous streams itself, although interleaving of the
continuous media stream with the control stream is possible. In other words, RTSP acts as a "network
remote control" for multimedia servers. Some operations supported by RTSP protocol are:
a. Retrieval of media from media server: The client can request a presentation description via HTTP
or some other method. If the presentation is being multicast, the presentation descriptio n contains
the multicast addresses and ports to be used for the continuous media. If the presentation is to be
sent only to the client via unicast, the client provides the destination for security reasons.
b. Invitation of a media server to a conference: A media server can be “invited” to join an existing
conference, either to play back media into the presentation or to record all or a subset of the media
in a presentation. This mode is useful for distributed teaching applications. Several parties in the
confer-ence may take turns “pushing the remote control buttons”.
c. Addition of media to an existing presentation: Particularly for live presentations, it is useful if the
server can tell the client about additional media becoming available.
RTSP has some of the same functionality as same as HTTP protocol. Nevertheless, basically have
differences in the data transmission process. HTTP is an asymmetric protocol, where the client can leave
request, and the server will respond to the request behind. In RTSP, both the client and server can leave
request. Also RTSP requests are not stateless; they may set parameters and continue to control a media
stream long after the request has been acknowledged.

133
Proceedings International Conference on Innovation and
Management, Malaysia 2016
2.4 Node.js
NodeJS included in one of the latest software tools for developing web-based applications The
system software is written using language NodeJS Javascript, using the base of events and asynchronous
I / O. If most Javascript applications is run by a web browser, Node.js executed as an application server
(McLaughlin, 2011). Node.js uses non-blocking technique to execute the process. It is means, Node.js
will execute independently. Node.js will make the execution of an operation without waiting for another
operation finishes. It is believed to create web applications that are built by using Node.js can run faster
and more efficiently. Node.js has Node Package Manager (NPM) which can allow the developers to build
and use the modules required to support Node.js. Popularity of Node.js more readily apparent, when
several major IT players such as Google and Microsoft use it to build the application. Some examples of
platforms that use Node is LinkedIn and Azzure. In addition to developing a web application, Node.js can
also be used to develop network applications and cloud. Request processing model on Node.js is shown
in Figure 1.
Figure 1. Node.js Processing Model
2.5 VLC Plugin
VideoLAN is a project to provide streaming video solution. It developed by students of the Ecole
Centrale Paris and developers from all over the world, under the GNU General Public License (GPL).
VideoLAN is designed to stream MPEG videos on high bandwidth networks. Figure 2 , shows a thorough
solution provided by VideoLAN. The VideoLAN solution includes (Fallon, 2003):
a. VLS (VideoLAN Server), which can stream MPEG−1, MPEG−2 and MPEG−4 files, DVDs, digital
satellite channels, digital terrestial television channels and live videos on the network in unicast or
multicast,
b. VLC (initially VideoLAN Client), which can be used as a server to stream MPEG−1, MPEG−2 and
MPEG−4 files, DVDs and live videos on the network in unicast or multicast ; or used as a client to
receive, decode and display MPEG streams under multiple operating systems.

134
Proceedings International Conference on Innovation and
Management, Malaysia 2016
Figure 2. VideoLAN Solution Architecture
Recognizing that the current highly developed web application, then VideoLAN provide the VLC
plugin. So that the browser has been installed VLC plugin in it, can take advantage of VLC player that
supports various formats of video in the browser.
3 Architectural Design Streaming The system's software architecture is illustrated in Figure 3, which consists of resource management
needs, streaming media, group discussion and examination.
Figure 3. Architecture of Streaming

135
Proceedings International Conference on Innovation and
Management, Malaysia 2016
On the streaming features above, there are two types of us er-level they are the control panel
(Teacher) and booth (Students). In Figure 3 the teacher acts as a control panel. teachers have a role or duty
to control the activities of teaching and learning in language laboratory such as giving streaming video to
students who have been determined and have the permission to access such material, sending a message
to students through group chat or private chat and starting video chat to all the students in the lab, the
teacher also has the role to supervise or ask one of the students with private video chat.
While the definition of booth is student, the students have a role to receive learning activities. Like
watching material in the form of streaming video or document, besides students can also contact teachers
through video chat or chatting text through private chat or even through a video chat. Each booth has a
single IP and student. Teaching and learning activities in this system uses the LAN network, where the
LAN network is the connector between teachers and students, this means that when the teacher will
conduct teaching activities in the language laboratory, the teacher will go to the system and use the
interactive learning media facilities where the learning material will be distributed or shared to all the
students that are in the language lab through LAN network. All the students in the lab will be able to
access the learning media and the learning media contains a file of learning in the the form of audio or
video stored on media server
4 Implementation
From architectural design shown in Figure 3, an outline of the software system will be implemented
on the sis server and client. Hardware and software specifications of each server and client that has been
used by researchers in implementing foreign language learning software is shown in Table 1.
Table 1. Software and Harware Specification
Server Client
Software Hardware Software Hardware
-VLC -Computer/Server
intel core i3
-VLC -Computer intel
core i3
-VLC Browser
Plugin
-RAM 1gb -VLC Web plugins -RAM 1gb
-NodeJS -HDD 2gb -Firefox -webcam
-NPM -webcam -headset
-Firefox -headset -RAM 1gb
-LAMP Stack -HDD 2gb
After the software system has complete implemented, the display of the video streaming process is shown
in Figure 4. As Figure 5 shows the process to see streaming audio.

136
Proceedings International Conference on Innovation and
Management, Malaysia 2016
Figure 4. Display of Straming Video and Chatting
Figure 5. Display Streaming Audio and Chatting
Next, there must be a testing process to know the big influence of streamed file and the influence of
the number of clients who do streaming at the same time. The test is aimed to know the delay that may
appear when a video file of a certain size is streamed or seen by some clients. The test is intended to
determine the delay that may appear when a video file with a specific size streamed or viewed by some
client.
The experiment is based on the size of the video:
1. 3 Mb-> the first time the play occurs delay for 5 seconds when streaming but there is no delay
2. 10Mb-> the first time the play occurs delay for 5 seconds when streaming but there is no delay

137
Proceedings International Conference on Innovation and
Management, Malaysia 2016
3. 15Mb-> the first time the play occurs delay for 5 seconds when streaming but there is no delay
4. 20Mb-> the first time the play occurs delay for 5 seconds when streaming but there is no delay
5. 50Mb-> the first time the play occurs delay for 5 seconds when streaming but there is no delay
The experiment is based on the size of the audio:
1. 3 Mb-> the first time the play occurs delay for 2 seconds when streaming but there is no delay
2. 10Mb-> the first time the play occurs delay for 2 seconds when streaming but there is no delay
3. 15Mb-> the first time the play occurs delay for 2 seconds when streaming but there is no delay
4. 20Mb-> the first time the play occurs delay for 2 seconds when streaming but there is no delay
5. 50Mb-> the first time the play occurs delay for 2 seconds when streaming but there is no delay
The experiment is based on the amount of time video streaming client:
1. 1 client-> the first time the play occurs delay for 5 seconds when streaming but there is no delay
2. 2 client-> the first time the play occurs delay for 5 seconds when streaming but there is no delay
3. 3 client-> the first time the play occurs delay for 5 seconds when streaming but there is no delay
The experiment is based on the amount of time audio streaming client:
1. 1 client-> the first time the play occurs delay for 2 seconds when streaming but there is no delay
2. 2 client-> the first time the play occurs delay for 2 seconds when streaming but there is no delay
3. 3 client-> the first time the play occurs delay for 2 seconds when streaming but there is no delay
From the test results, it visible that the delay only occurs at the beginning of the video file when it
is run. And after the video file successfully executed, until the completion delay hardly noticeable at all.
This shows that the combination of architecture and technology used to build the streaming system in this
study has been able to minimize the delay premises more efficiently.
5 Conclusion The use of streaming audio and video technology in the process of learning offers an opportunity to
make the learning process more interesting for students and the process of content management is more
effective for teachers. Audio and video streaming technology is more relevant to implement, because this
time computer technology, multimedia and internet are growing up. Delay time which firstly became an
issue in the process of audio and video streaming, has recently been reduced and minimized. The Use of
LAMPP stack, Node.js, NPM and VLC on the server side, the use of RTSP as the pro tocol to send
video/audio data from the server to the client and the VLC plugin embedded in the client browser, have
been able to collaborate optimally to make audio / video streaming system
References [1] Asri Nurul, Atiqah. Syaifudin W. Yan, Fahrur Rozi, Imam. Developing Language Laboratory by
Utilizing Computer Laboratory to Improve the Teaching of English Language. 2nd National
Conference on Language and Language Teaching (NCOLLT 2). 2015
[2] Dolzani M., Ronchetti M. Video Streaming Over the Internet to Support Learning: the LODE System.
WIT Transactions on Informatics and Communication Technologies, v. 34, p. 61-65. 2005
[3] Fallon, Henry. et.al. VLC User Guide. 2003
[4] Hartsell, T., & Yuen, S. Video streaming in online learning. AACE (Association for the Advancement
of Computing in Education) Journal, 14(1), 31-43. 2006
[5] McLaughlin, Brett. What is Node.js? Accessed from: http://radar.oreilly.com/2011/07/what-is -
node.html, 6th Oct 2016
[6] Reed, R. Streaming technology improves student achievement. T.H.E. Journal, 30(7), 14-20. 2003

138
Proceedings International Conference on Innovation and
Management, Malaysia 2016
[7] Rozi, Imam F., Ariyanto, Rudy. Siswoko. Pengembangan Sistem Video on Demand untuk
Mendukung Pendidikan Jarak Jauh Politeknik Negeri Malang . Distance Learning Research Grant
from Seamolec. 2013
[8] Schulzrinne, A. Rao, R. Lanphier. Real Time Streaming Protocol (RTSP). 1998
[9] Simon, Konrad. Tech Note: Streaming Video from BVIP using RTSP. 2010
[10] Syaifudin W. Yan, Fahrur Rozi, Imam., Nurul Asri, Atiqah. The Design Of Foreign Language
Teaching Software In School Computer Laboratory. First Asia Pacific Conference on Contemporary
Research (APPCR). 2015

139
Proceedings International Conference on Innovation and
Management, Malaysia 2016
Theme 2: Environmental Innovation and Sustainable Development
140
Proceedings International Conference on Innovation and
Management, Malaysia 2016
The Suitability, Feasibility and Acceptability (SFA) Model for OTEC
Transformation Project
Hairil Anuar Abu Hassan, Akbariah Mohd Mahdzir
Department of Management of Technology, Malaysia-Japan International Institute Technology,
Universiti Teknologi Malaysia-Kuala Lumpur, Jalan Yahya Petra (Jalan Semarak)
54100 Kuala Lumpur, Malaysia
(E-mail: [email protected], [email protected])
Abstract The success or failure of any new projects depends on its fitness with the location. This concept
paper will highlight the importance of the socioeconomic indicators adapted from the SFA Model for
OTEC (Ocean Thermal Energy Conversion) Transformation Project (OTEC TP). Based on the literature
reviews, this paper will propose the research framework that enables to inves tigate the relationship
between three main variables which are; the Suitability, Feasibility and Acceptability of the pro ject by the
local communities. It will enable further research on how and to what extent the proposed economic
activities will affect and be shaped by the social processes.
Keywords OTEC, SFA Model, Suitability, Feasibility and Acceptability .
1 Introduction OTEC stand for Ocean Thermal Energy Conversion that works by using the temperature
gradients found in large bodies of water, where the temperature of water found on the surface is
significantly higher than the cold water found deeper down. In gaining the technology development
momentum, the largest experimental OTEC was planted 1000 meters below the surface in Hawaiian
(Makai’s Plant) near freezing water by using the warm ocean water to pull from the surface and fed into
a heat exchanger, where it vaporizes a low-boiling- point liquid such as ammonia. Apparently, the vapor
causes a turbine to create electricity and the cold ocean water is drawn from the deep. Then it is used to
condense the ammonia back into liquid to complete the loop cycle [2]. Basically, OTEC Transformation
Project (OTEC TP) has been acknowledged by the Malaysian Government as one of the priority growth
areas. Based on the current scarcity issues of energy supply that relies on coal and natural gas, Malaysia
need a new renewable energy to support the future demand of power energy.
Since OTEC has never been exist in Malaysia, this research is significant because it c an
demonstrate the linkage of the project’s spill over impact to the local communities. Johnson, G. et al. [1],
suggested that the evaluation of the critical success areas is crucial to ensure that the success or failure of
any new projects; that are highly depends on its fitness with the location. Government policies plays a
vital role to stimulate innovation in energy efficient technology development and implementation. Grubb,
M. et al. [3], found out that excellent policies are not enough to induce greater innovation. The effect of
the energy policies will apparent only in the long run in a complex environment, that requires learning -
by-doing process for the firms to understand the scope and potential for new energy -efficient technology.
2 Research Problems and Objectives The purpose of OTEC is to provide a new alternative solution for a country to redesign its
renewable energy supply by looking into the latest available power technologies. Nevertheless, it will be
a big waste for a country if its end up with failure prior to, during or after it has been implemented. The
most crucial part is to ensure that even if before the new project start, the detail analysis should be
conducted to investigate the potential success of the new technologies.
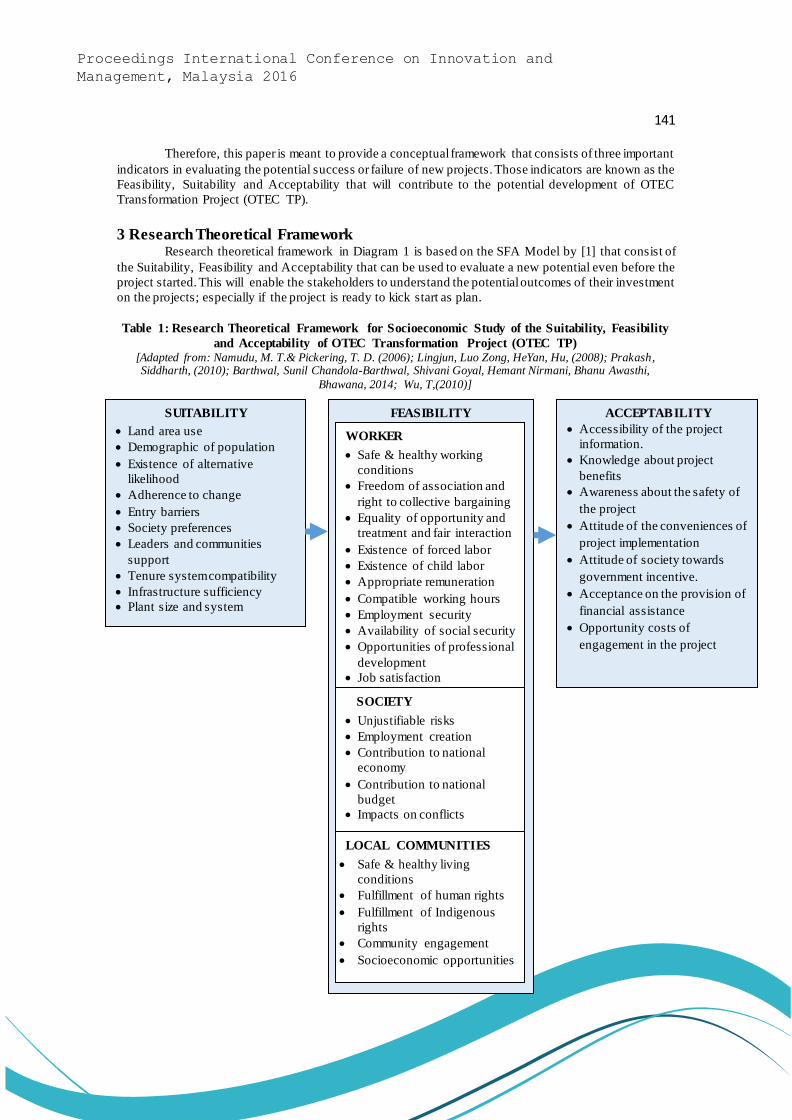
141
Proceedings International Conference on Innovation and
Management, Malaysia 2016
Therefore, this paper is meant to provide a conceptual framework that consists of three important
indicators in evaluating the potential success or failure of new projects. Those indicators are known as the
Feasibility, Suitability and Acceptability that will contribute to the potential development of OTEC
Transformation Project (OTEC TP).
3 Research Theoretical Framework Research theoretical framework in Diagram 1 is based on the SFA Model by [1] that consist of
the Suitability, Feasibility and Acceptability that can be used to evaluate a new potential even before the
project started. This will enable the stakeholders to understand the potential outcomes of their investment
on the projects; especially if the project is ready to kick start as plan.
Table 1: Research Theoretical Framework for Socioeconomic Study of the Suitability, Feasibility
and Acceptability of OTEC Transformation Project (OTEC TP) [Adapted from: Namudu, M. T.& Pickering, T. D. (2006); Lingjun, Luo Zong, HeYan, Hu, (2008); Prakash, Siddharth, (2010); Barthwal, Sunil Chandola-Barthwal, Shivani Goyal, Hemant Nirmani, Bhanu Awasthi,
Bhawana, 2014; Wu, T,(2010)]
SUITABILITY
Land area use
Demographic of population
Existence of alternative
likelihood
Adherence to change
Entry barriers
Society preferences
Leaders and communities
support
Tenure system compatibility
Infrastructure sufficiency
Plant size and system
FEASIBILITY
ACCEPTABILITY
Accessibility of the project
information.
Knowledge about project
benefits
Awareness about the safety of
the project
Attitude of the conveniences of
project implementation
Attitude of society towards
government incentive.
Acceptance on the provision of
financial assistance
Opportunity costs of
engagement in the project
WORKER
Safe & healthy working
conditions
Freedom of association and
right to collective bargaining
Equality of opportunity and
treatment and fair interaction
Existence of forced labor
Existence of child labor
Appropriate remuneration
Compatible working hours
Employment security
Availability of social security
Opportunities of professional
development
Job satisfaction
LOCAL COMMUNITIES
Safe & healthy living
conditions
Fulfillment of human rights
Fulfillment of Indigenous
rights
Community engagement
Socioeconomic opportunities
SOCIETY
Unjustifiable risks
Employment creation
Contribution to national
economy
Contribution to national
budget
Impacts on conflicts
142
Proceedings International Conference on Innovation and
Management, Malaysia 2016
4 Literature Review According to Johnson and Scholes [4] it is very important to investigate on the suitability,
feasibility and acceptability of any decision made by companies when dealing with any project
management. Therefore, for the OTEC TP in Malaysia, there is a need to study on these three important
aspects to ensure the success of the project for the local society and the nation as a whole. For purposes
of this research, the conceptual framework based on the SFA Model by [1] that already incorporate the
previous scholars’ theories.
4.1 Suitability
Suitability is concern about the circumstances in which the new projects operate. When any new
project is in the pipeline, first and foremost, the investigation is compulsory to look into the suitability;
that is if the project if compatible with the location selected and socioeconomic situation of the people.
Based on Lingjun, L. et al. [5] Indicate that suitability of lands usage and infrastructure system in the
various industries can become the trade-off for development of society and the global environment
Suitability means that the thorough understanding on the aspects of suitability of land area use,
demographic of population in the project area that includes age, gender, income and others, the existence
of alternative likelihood towards the new project, society adherence to change, any entry barriers in
engaging in the project, society preferences on the types of project, leaders and communities support,
tenure system compatibility in relation to the project, infrastructure sufficiency such as roads and
transportation and also the plant size and system us by the new plants under the project [6][5].
Previous study on technology and demographic of population indicates that countries that has
lower rates of adult population growth tend to quickly adopt new capital related technologies quicker for
better output per adult [7]. Major technologies producers such as China exports large shares of the
country’s renewable energy to high income countries. The exporters gain tax incentives and demand side
support from the government renewable energy policies [8]. Therefore, the suitability aspects of the OTEC
project is critical to ensure that the new project will operate in conducive situation.
4.2 Feasibility
Feasibility is concern on whether the project can strategically works in practice. Feasibility
evaluation will covers on how the project will generate any positive impact on the socioeconomics such
as income, safety and life conditions of the people and many more through the investment. According to Prakash. S [9], feasibility study must covers three components of the socioeconomics aspects. Firstly, for
the workers, the important indicators are the safe & healthy working conditions, freedom of association
and right to collective bargaining, equality of opportunity and treatment and fair interaction, existence of
forced labour, existence of child labour, appropriate remuneration, compatible working hours,
employment security, availability of social security, opportunities of professional development and job
satisfaction.
Secondly, for the society, the important indicators are unjustifiable risks, employment creation,
contribution to national economy, contribution to national budget and also impacts on conflicts that occur
due to new project.
Thirdly, for the local communities, the important indicators are; safe and healthy living
conditions, fulfilment of human rights, fulfilment of Indigenous rights, community engagement and
socioeconomic opportunities that occurs from the new project. As a result, the analysis on OTEC
feasibility will enable the success of its future implementation.
4.3 Acceptability
Acceptability is concern about the project risks and performance outcomes that are highly related
to the expectations of all project stakeholders. Any new project must consider the acceptability especially
from the local community to ensure the success of the project. Acceptability means that the people and all
parties are able to access the project information, have the knowledge about project benefits, aware about
the safety of the project, have positive attitude of the conveniences of project implementation and

143
Proceedings International Conference on Innovation and
Management, Malaysia 2016
government incentive, have good acceptance on the provision of financial assistance and alert on the
opportunity costs of engagement directly or indirectly in the project itself [10]. Hence, the high
acceptability of new OTEC project will reduce the risks of its investments.
5 Conclusion To conclude, a new power technology project such as OTEC that requires huge investment by a
country’s government and other stakeholders need to be carefully evaluated to ensure that it will be
successful. The Suitability of the new projects will indicate its appropriateness with the selected location;
the Feasibility will access the success of its implementation; while the Acceptability will indicate the risks
of the project investments. All these information is crucial to enable the effective design of successful
strategic planning for the new project.
References [1] G. Johnson, K. Scholes, and R. Whittington, Exploring Corporate Strategy [M], Text Cases. 2008.
[2] R. Courtland, Ocean Thermal Energy: Back From The Deep [J], IEEE Spectr., vol. 51, no. 9, pp. 18–
18, 2014.
[3] M. Grubb and D. Ulph, Energy, The Enviroment and Innovation [J], vol. 18, no. 1, 2002.
[4] T. Wu, Strategic Choice: Johnson and Scholes Suitability, Feasibility, and Acceptability Model [M],
ACCA Learn. Cent., pp. 16–20, 2010.
[5] L. Lingjun, H. Zong, and H. Yan, Study on Land Use Suitability Assessment of Urban -Rural Planning
Based on Remote Sensing—A Case Study of Liangping in Chongqing, Int. Arch. Photogramm.
Remote Sens. Spat. Inf. Sci. [J], vol. 37, no. D, pp. 123–130, 2008.
[6] M. T. DNamudu and T. D. Pickering, Rapid Survey Technique Using Socio -Economic Indicators to
Assess The Suitability of Pacific Island Rural Communities for Kappaphycus Seaweed Farming
Development [J], J. Appl. Phycol., vol. 18, no. 3–5, pp. 241–249, 2006.
[7] P. Beaudry and F. Collard, Recent Technological and Economic Change Among Industrialized
Countries: Insights From Population Growth [J], Scand. J. Econ., vol. 105, no. 3, pp. 441–463, 2003.
[8] F. Groba and J. Cao, Chinese Renewable Energy Technology Exports: The Role of Policy, Innovation
and Markets [J], Environ. Resour. Econ., vol. 60, no. 2, pp. 243–283, 2014.
[9] S. Prakash, Socio-Economic Assessment and Feasibility Study on Sustainable E-Waste Management
in Ghana Commissioned by The Inspectorate of the Ministry of Housing, Spatial Planning and The
Environment of The Dutch Association For The Disposal of Metal [J], vol. 49, no. 0, pp. 30–40, 2010.
[10]S. Barthwal, S. Chandola-Barthwal, H. Goyal, B. Nirmani, and B. Awasthi, Socio-Economic
Acceptance of Rooftop Rainwater Harvesting – A Case Study [J], Urban Water J., vol. 11, no. 3, pp.
231–239, 2014.

144
Proceedings International Conference on Innovation and
Management, Malaysia 2016
An Environmental Accounting Impact towards Corporate
Innovation: Review
Wan Md Syukri Wan Mohamad Ali1, Ainul Mardhiyah Nor Aziz2, Ahmad Rahman Songip1, Zaipul
Anuar Zainu1
1 Management of Technology Department, Malaysia-Japan International Institute of Technology,
Universiti Teknologi Malaysia Kuala Lumpur, Jalan Sultan Yahya Petra, 54100, Kuala Lumpur,
Malaysia
2 Faculty of Management, Universiti Teknologi Malaysia, 81310, Skudai, Johor, Malaysia
(Email: [email protected], [email protected], [email protected],
Abstract This study focus on the Environmental Management Accounting (EMA) impact towards
the innovation in the corporate practice. From the perspective of the accounting the EMA had
improved the efficiency of corporate planning and strategy, however from the perspective of
corporate innovation and creativity it indicates different outcome and performance. This paper
evaluates the impact of the EMA towards organization innovations.
Keywords Environmental Management Accounting, Innovation, Performance, Strategy, Planning.
1 Introduction As a developing zone of research, environmental management accounting (EMA) need
accepted generally minimal consideration starting with accounting analysts. There need been a
percentage case- based analyze that examines those significance and reductions from actualizing
EMA frameworks clinched alongside a particular organizations in the nation alternately industry[1]
[2] [3][4]. Furthermore on outlining a general natural management framework that can a chance to
be utilized toward organizations [5]. However, there may be set academic look into that endeavors on
whichever investigate EMA observationally concentrate on its possibility impacts on inner
procedures and decisions inside organizations, for example, such that those improvements about
innovations. With a developing attention to natural issues, principally concerning illustration an item
of the right way by acknowledged worldwide warming phenomenon, there may be a need to this sort
of research which help organizations previously, connection to asset allotment and decision making .
Innovation is essential to vast majority organizations. Same time the reductions emerging
from innovations might be well documented, those part of sustainability related bookkeeping
frameworks such similarly as EMA. A driver for innovations inside organizations remains
generally unexplored. This consider both item and methodology innovations would recognize
organizational powers behind EMA utilize speaks to in the hole on accounting research specifically
the part of organizational technique. Therefore, two research inquiries are addressed: “Does EMA
use prompt innovations inside organizations?” and, second, “What will be the part of method
for connection to EMA use and innovation?” A prospector-type system may be likewise found
to need an impact for transform improvement through those duties about assets to innovative
work (R&D). However, no such impact is discovered in result of improvement. Investigation
indicates that technique is not a precursor for EMA use, which will be found to be fundamentally
determined toward industry. This contemplate includes of the expositive expression toward giving
work to cross-sectional confirmation of the organizations between strategy, EMA use and
innovation. An extra commitment of the current ponder may be will measure observationally
which profits of EMA used which observed on making a large portion noteworthy for

145
Proceedings International Conference on Innovation and
Management, Malaysia 2016
organizations, consequently accepting the observed commitments from claiming EMA towards
different organizational decision.
2 Environmental Management Accounting Sustainability accounting could make showed for organizations through improvement
of routine accounting systems, including oversee economy accounting frameworks [6]. EMA is a
prime instance of a later improvement done management bookkeeping that speaks to this
improvement. Reasonable advancement need progressively ended up and only the destinations
from claiming a large number organizations, prompting more excellent reception and utilizat ion
of EMA frameworks [7]. EMA constitutes a critical piece about manageability bookkeeping [6].
Also will be a critical instrument flying for organizations that point “to minimize the downrigh t
costs or ecological expenses and relieve the natural effect for their activities, results and services”
[8].
Past investigations have defined EMA is a system that generates, analyses, employments
both financial and non-financial information on enhance the environmental and budgetary
execution of a company and contributes towards an economic benefits of the business [2][9]. EMA
might assistance organizations face their natural responsibilities and could prompt the ID number
for joint natural and budgetary reductions from corporate exercises [5][10]. Furthermore, EMA
expects to furnish physical majority of the data on the utilization of materials, vitality and fiscal
data ahead environment-related costs, income and reserve funds [11][9][12][13][14]. Differen t
physical parts for EMA incorporate item life-cycle assessment, item change analysis, result stock
investigation and ascertaining the carbon foot shaped impression about an organizations. IFAC
(2005) [13] reports that organizations utilizing EMA would probable with behavior more broad
examinat ion and outline exercises for handling naturally cordial results and creating strategies to
upsetting of the surroundings. It will be additionally liable that the individuals in organizations
will use item life-cycle systems, which push the ID number of opportunities to get natural
upgrades [12].
In looking for accomplish manageable polishes and eco-efficiency , organizations are headed
to create new results and should move forward existing forms within request to decrease their
utilization of assets and the natural harm initiated eventually perusing their exercises. Previously ,
different words, organizations would oblige on advance. Innovation may be viewed as a chance to
be a paramount part for a large portion organizations as it might prompt an aggressive preference
[15]. Proof reveals that organizations for more terrific accentuation with respect to a business model.
In light of innovation have faster working edge growth and higher bargains growth [16][17]. Ferrari
and Parker (2006)[16] also figure out that manufacturing organizations, procedure improvement
assumes a paramount part clinched alongside looking after focused advantage. Likewise it will be
large way calculate in securing long haul gainful growth. Innovations could be conceptualized to
different ways and both result including methodology innovations would be recognized. At the
same time, result improvement might fuse critical transforms to existing results alternately those
formations about new products, procedure improvement acknowledges noteworthy progressions of
the inside preparation forms.
Organizations that seek after an analyzer system would hostility over the individuals pursing
a Miller’s technique in any case need aid. The more combative over the individuals pursing a shield
system on item innovation. They keep up a stable build for items and administrations also move
specifically under new regions of the showcase for exhibited guarantee. Finally, organizations
seeking after a reactor strategy need a reliable strategy-structure relationship, changing their
operations and methodologies when there will be a weight starting with the outer surroundings on
the need to recognized will have a chance to be a flimsy type of organization [18][19].

146
Proceedings International Conference on Innovation and
Management, Malaysia 2016
2.1 Benefits of EMA
There are a few possibilities connected with EMA utilization. These incorporate cost
reductions, improved product pricing, fascination of human resource and reputational upgrades
[9][5][20][21][12]. Investigations also note that the utilization for EMA in organizations will be
benefited with different data for decision making [22][9][5]. Such data might uncovered hidden
opportunities, for example, such that better waste management process, energy reduction and
material utilization or chances for material recycle. From the ecological viewpoint this data
might be used within the improvement towards innovation. Furthermore, prompt improvement
instance, Hansen and Mowen (2005) [12] reporting those financial reductions reveled in perusing
organizations, for example Baxter global and interface incorporations from EMA utilize created
reserve funds about roughly $14 million and $12 million for every year, separately.
There may be a proof that an environmental costs could make 20 percentage alternately a
greater amount of organization’s aggregate operating cost [23][24]. Besides, accepted accounting
systems, environmental cost generally concealed in manufacturing overhead costs [5], which makes
it challenging to administrators to see the genuine natural costs identified with their specific
exercises. Under EMA systems, these costs need to identified, arranged and allocated, permitt ing
for driven expenses analysis and could reasonably be expected expenses degenerations will happen
[9][21]. Hence, investment profits are prone will stream from better information in decision
making. Adams (2002) [25] figures that organizations with social information (i.e manageabil ity
reports) have the ability to create better inside control systems and prompt better decision making .
Additionally, recommends that cost-savings need probable will happen over these organizations ,
bringing on continuous improvement .
Improved corporate image and better relations with stakeholders encountered by
organizations utilizing EMA [22]. The changes imposed in organizational standing migh t
emerge starting with citizenship towards producing environmental friendly products. Organizations
might additionally lessen the dangers of purchaser boycotts eventually perusing giving understanding
on social and environmental issues [25]. Environmental data empowers stakeholders to assess the
ecological accomplishment with chances for the organizations practice. Recognizing couple of
organizations give acceptable such informat ion, the individuals that do have a tendency on
experience upgrades for their reputation, which will be interpret under progressed competitive
advantage [25][26].
3 EMA and Corporate Innovation 3.1Strategy and EMA use
EMA utilization over an organization should be liable a chance to be impacted by its business
strategy. Management control systems (MCS) guarantee that supervisors utilize the accessible assets
successfully and proficiently in the quest for the destinations of the organization [27]. Thus, MCS
that would outline with meeting the necessities of the organization help towards accomplish ing
extraordinary execution [28][29][29]. Benefits of the business strategies, distinguish those methods
by which the organization means should accomplish organizational goals, otherwise it is
determinants in the setup of the MCS [30][30][31]. However, EMA is a procedure that emphasizes
effectiveness on what's more adequacy in the utilization of assets and the extensive of MCS. After
all, though methodology may be a determinant about MCS, it may be inclined which impact from
EMA. Gosselin (1997) [32] figures that a prospector strategy may be connected with the activity
management . He claiming on method taken after by an organization determines the advancement
with views of activity management . Furthermore, observes organizations that seek after a prospector
strategy have a tendency implement ing accounting innovations. Those generally promptly stage for
selection also execution of EMA and the certainty, it will be reasonably late phenomenon and

147
Proceedings International Conference on Innovation and
Management, Malaysia 2016
helps the perspective from claiming EMA concerning illustration a sample of an accounting
innovation. Thus, the utilization of EMA is likely on be more terrific on organizations seeking
after a prospector strategy similarly as it might help them for their point about being inventive
[32].
3.2 EMA use and innovation
Due to those determined returns of EMA use, organizations would likely to seek after this
technique, likewise not only the MCS also concerning method for looking after or upgrading their
focal point. It can be attained through Innovation. Innovation is a chance to be characterized similar ly
as the reception for new systems, policies, programs, processes, products or services, which could
make internally or externally produced [33][34][35]. Towards claiming those refinements between
product and process innovation, Utterback and Abernathy (1975) [36], recommend that, the rates
about reception for product also transform innovations will be different throughout different phases
for benefits of the business improvement. Product and process improvement regularly adjunct
one another embraced alongside serving organizations on expanding the profitability [37].
Additionally, product and process elasticity capability on modificat ions of product and production
methods impact organizational expenses. As an outcome of financing, there may be frequently
an exchange-off between methodology and item adaptability that rebuts the assumption, ventures
in both item and transform adaptability. [38][39]. Studies highlights that organizations with better
social and environmental compliance develop better control frameworks thereby bringing on
excellent judgment making processes [22]. The new fresh input sways improvement for new
products, that's only the tip of the iceberg propelled innovative strife and moved forward expense
structures. For other words, EMA utilization is inclined on a chance to be connected with both
result and methodology innovation and might subsequently move forward those focused position
of organizations. Those after effect may be comparable to that noted for activity-based costing, a
techniques on giving a board to oversee the economy for extra and more exact costing data [40]
that can be prompt an increment in the number for process improvement [41].
3.3 Strategy and innovation
Organisational strategy commonly determines those different pressure that organizations
spot on item and transformation innovations done accomplishing their focused preference [42].
Cozzarin and Percival (2006)[43] find that advancement complements numerous organizational
strategies, same time others note that methodology is a precursor of the stress that organizations
looking into result and procedure improvement [42]. A few investigations find organization the
middle of way components for method and business surroundings [44][45]. Miller (1988) [46] figures
organization a capricious and a changing on natural domain and advancement methodology. When
natural ground may generally determined toward evolving customer requests and level for market
fascination there may be more astonishing for organizations to create a plan that puts the customer
needs intact, such as the inventing of new products [47][48]. Organisations that take after an
approach to be the pioneer in the market, indeed with full exertions not all would be lasting with
great [18]. These organisation also will react quickly on signs from business sector necessities.
Therefore, the more excellent those accentuations to be pioneered in the market, the higher expected
of product innovation.
4 Conclusion EMA utilization improving organization with perceive those environmental impacts of their
operational exercises. A few instance investigations framework that the profits identified with
EMA utilize [9][49][20][21][12]. This study engages cross-sectional informat ion which examine the
impact for EMA use on both product and process innovation. Those part of system is explored
and incorporates those regulate impacts about system with respect to EMA utilize and regulate.

148
Proceedings International Conference on Innovation and
Management, Malaysia 2016
Furthermore, indirect impacts of method with respect to advancement are not similarly as solid as
expected. Probable that EMA use need a certain impact on innovation. Hence the outcomes infer
that innovation is a possible emerging from EMA used could change the degree which an
organization enchants over innovation. The effects likewise recommended that EMA use is not
driven by organizational size, and hint at that organizations starting with chemical, mining and
smelting commercial enterprises are less averse on be clients for EMA over every last bit and
different organizations acknowledged in the study. Instead, an impact about technique ahead process
innovation may be uncovered through the promise with R&D activities.
References [1] R. L. Burritt and C. Saka, “Environmental management accounting applications and eco-
efficiency: case studies from Japan,” [J] J. Clean. Prod., vol. 14, no. 14, pp. 1262–1275, 2006.
[2] C. M. Deegan, Environmental management accounting: An introduction and case studies for
Australia.[R] Institute of Chartered Accountants in Australia, 2003.
[3] M. J. Masanet-Llodra, “Environmental management accounting: a case study research on
innovative strategy,”[J] J. Bus. Ethics, vol. 68, no. 4, pp. 393–408, 2006.
[4] J. K. Staniskis, D. Habilitat, and Z. Stasiskiene, “Environmental management accounting in
Lithuania : exploratory study of current practices , possibilities and strategic intents,”[J] J. Clean.
Prod., vol. 14(14), pp. 1252–1261, 2006.
[5] Burrit, L. Rogger, T. Hahn, and S. Schaltegger, “Towards a comprehensive framework for
environmental management accounting - Links between business actors and environmental
management accounting tool,”[J] Aust. Account. Rev., vol. 12, no. 2, pp. 39–50, 2002.
[6] S. Schaltegger, M. Bennett, and R. Burritt, “Sustainability accounting and reporting :
Development, linkages and reflection: An introduction,”[R] Sustain. Account. Report., pp. 1– 33,
2006.
[7] F. Figge, T. Hahn, S. Schaltegger, and M. Wagner, “The Sustainability Balanced Scorecard -
linking sustainability management to business strategy,”[J] Bus. Strateg. Environ., vol. 11, no. 5, pp.
269–284, Sep. 2002.
[8] J. Hyršlová and M. Hájek, “Chapter 19 ENVIRONMENTAL MANAGEM E NT
ACCOUNTING IN CZECH COMPANIES THAT HAVE IMPLEMENT ED
ENVIRONMENTAL,”[M] pp. 433–456, 2006.
[9] M. Bennett, P. Rikhardsson, and S. Schaltegger, “Adopting Environmental Management
Accounting: EMA as a Value-adding Activity,” in Environmental Management Accounting ---
Purpose and Progress, [M] Springer Netherlands, 2003, pp. 1–14.
[10] S. Schaltegger and R. Burritt, “Contemporary environmental accounting, issues, concepts and
practice.,”[M] UK Greenleaf Publ., 2000.
[11] M. Bartolomeo, M. Bennett, J. J. Bouma, P. Heydkamp, P. James, and T. Wolters,
“Environmental management accounting in Europe: current practice and future potential,” [J]Eur.
Account. Rev., vol. 9, no. 1, pp. 31–52, 2000.
[12] D. R. Hansen and M. M. Mowen, Environmental Cost Management, Management
Accounting.
Environmental Cost Management, [M]Management Accounting, 2005.
[13] C. Jasch and Ž. Stasiškienė, “From Environmental Management Accounting to Sustainability
Management Accounting,”[J] Environ. Res. Eng. Manag., vol. 4, pp. 77–88, 2005.
[14] U. N. D. for S. Development, E. W. G. on I. the R. of G. in the P. of E. M. Accounting, A. B.
für Verkehr, and I. und Technologie, Environmental management accounting procedures and
principles.[R] UN, 2001.
[15] M. E. Porter, Competitive Advantage:Creating and sustaining superior performance, [M]vol.

149
Proceedings International Conference on Innovation and
Management, Malaysia 2016
15. 1985.
[16] B. Ferrari and B. Parker, “Digging for innovation,”[J] Supply Chain Manag. Rev., pp. 48–53,
2006.
[17] L. Klomp and G. Van Leeuwen, “Linking Innovation and Firm Performance: A New
Approach,”[J] Int. J. Econ. Bus., vol. 8, no. 3, pp. 343–364, 2001.
[18] H. J. C. J. Raymond E. Miles, Charles C. Snow, Alan D. Meyer, “Organizat ional Strategy ,
Structure, and Process,”[J] Acad. Manag. Rev., p. 546–562;, 1978.
[19] S. M. Shortell and E. J. Zajac, “Perceptual and archival measures of Miles and Snow’s strategic
types: a comprehensive assessment of reliability and validity.,”[J] Acad. Manag. J., vol. 33, no. 4,
pp. 817–832, 1990.
[20] P. de Beer and F. Friend, “Environmental accounting: A management tool for enhancing
corporate environmental and economic performance,”[J] Ecol. Econ., vol. 58, no. 3, pp. 548– 560,
2006.
[21] K. C. Gibson and B. A. Martin, “Demonstrating value through the use of environmental
management accounting,” [J] Environ. Qual. Manag., vol. 13, no. 3, p. 45, 2004.
[22] C. Adams and A. Zutshi, “Corporate Social Responsibility: Why Business Should Act
Responsibly and Be Accountable,” [J] Aust. Account. Rev., vol. 14, no. 34, pp. 31–39, 2004.
[23] D. R. Ditz and R. D. J Banks, Green Ledgers: Case studies in corporate environmental
accounting, [R] no. P01 34. World Resources Institute, Washington, DC (EUA), 1995.
[24] J. A. Hansen and D. Panagiotakopoulos, “Cost assessment in sustainable waste
management,” [J]Waste Manag. Res., vol. 23, pp. 1–2, 2005.
[25] C. Adams, “Internal organisational factors influencing corporate social and ethical reporting :
Beyond current theorising,” [J] Accounting, Audit. Account. J., vol. 15, no. 2, pp. 223–250, 2002.
[26] A. King, “How to get started in corporate social responsibility,”[J] Financ. Manag., vol. 5,
2002.
[27] R. N. Anthony, Planning and Control Systems: A Framework for Analysis[R] [by] . Division
of Research, Graduate School of Business Administration, Harvard University, 1965.
[28] J. F. Dent, “Accounting and organizational cultures: A field study of the emergence of a new
organizational reality,” [R] Accounting, Organ. Soc., vol. 16, no. 8, pp. 705–732, 1991.
[29] D. A. Samson, K. Langfield-Smith, and P. McBride, “The alignment of management
accounting with manufacturing priorities: a strategic perspective,” [J] Aust. Account. Rev., vol. 1, no.
1, pp. 29–40, 1991.
[30] A. Ferreira and D. Otley, “The design and use of performance management systems: An
extended framework for analysis,” [J] Manag. Account. Res., vol. 20, no. 4, pp. 263–282, 2009.
[31] R. Simons, Levers of control: how managers use innovative control systems to drive strategic
renewal. Harvard Business Press, 2013.
[32] M. Gosselin, “The effect of strategy and organizational structure on the adoption and
implementat ion of activity-based costing,”[J] Accounting, Organ. Soc., vol. 22, no. 2, pp. 105– 122,
1997.
[33] R. L. Daft, “Bureaucratic versus nonbureaucratic structure and the process of innovation and
change,”[J] Res. Sociol. Organ., vol. 1, pp. 129–166, 1982.
[34] F. Damanpour and W. M. Evan, “Organizational innovation and performance: the problem
of‘ organizational lag,’” [J] Adm. Sci. Q., pp. 392–409, 1984.
[35] G. Zaltman, R. Duncan, and J. Holbek, “Innovations and organisations (Vol. 1973).” [M]
New York: Wiley, 1973.
[36] J. M. Utterback and W. J. Abernathy, “A dynamic model of process and product innovation,”
[J] Omega, vol. 3, no. 6, pp. 639–656, 1975.
150
Proceedings International Conference on Innovation and
Management, Malaysia 2016
[37] S. Athey and A. Schmutzler, “Product and process flexib ility in an innovative environment ,”
[J] RAND J. Econ., vol. 26, no. 4, pp. 557–574, 1995.
[38] R. H. Hayes and S. C. Wheelwright, “Restoring our competitive edge: competing through
manufacturing,” [M] 1984.
[39] S. C. Wheelwright and K. B. Clark, Dynamic manufacturing: Creating the learning
organization. [M] Simon and Schuster, 1988.
[40] R. Cooper, The Rise of Acitivity Based Costing Part One: What is an Acitivity Based Cost
System? [M] 1988.
[41] A. R. Drake, S. F. Haka, and S. P. Ravenscroft, “Cost system and incentive structure effects
on innovation, efficiency and profitability in teams,” [J] Account. Rev., vol. 74, no. 3, pp. 323– 345,
1999.
[42] J. E. Ettlie, “Organizational policy and innovation among suppliers to the food processing
sector,” [J] Acad. Manag. J., vol. 26, no. 1, pp. 27–44, 1983.
[43] B. P. Cozzarin and J. C. Percival, “Complementarit ies between organisational strategies and
innovation,” [J] Econ. Innov. new Technol., vol. 15, no. 3, pp. 195–217, 2006.
[44] V. K. Chong and K. M. Chong, “Strategic choices, environmental uncertainty and SBU
performance: a note on the intervening role of management accounting systems,” [J] Account. Bus.
Res., vol. 27, no. 4, pp. 268–276, 1997.
[45] P. H. Fuchs, K. E. Mifflin, D. Miller, and J. O. Whitney, “Strategie integration: Compet ing
in the age of capabilities,” [J] Calif. Manage. Rev., vol. 42, no. 3, pp. 118–147, 2000.
[46] D. Miller, “Relating Porter’s business strategies to environment and structure: Analysis and
performance implicat ions,” [J] Acad. Manag. J., vol. 31, no. 2, pp. 280–308, 1988.
[47] S. Perera, G. Harrison, and M. Poole, “Customer-focused manufacturing strategy and the use
of operations-based non-financial performance measures: a research note,” [J] Accounting, Organ .
Soc., vol. 22, no. 6, pp. 557–572, 1997.
[48] K. L. Sim and L. N. Killough, “The performance effects of complementarit ies between
manufacturing practices and management accounting systems,” [J] J. Manag. Account. Res., vol. 10,
no. 1, pp. 325–336, 1998.
[49] R. L. Burritt, T. Hahn, and S. Schaltegger, “Towards a Comprehens ive Framework for
Environmental Management Accounting — Links Between Business Actors and Environmenta l
Management Accounting Tools,” [J] Aust. Account. Rev., vol. 12, no. 27, pp. 39–50, 2002.

151
Proceedings International Conference on Innovation and
Management, Malaysia 2016
Theme 3: Internet of Things, Big Data and Business Analytics
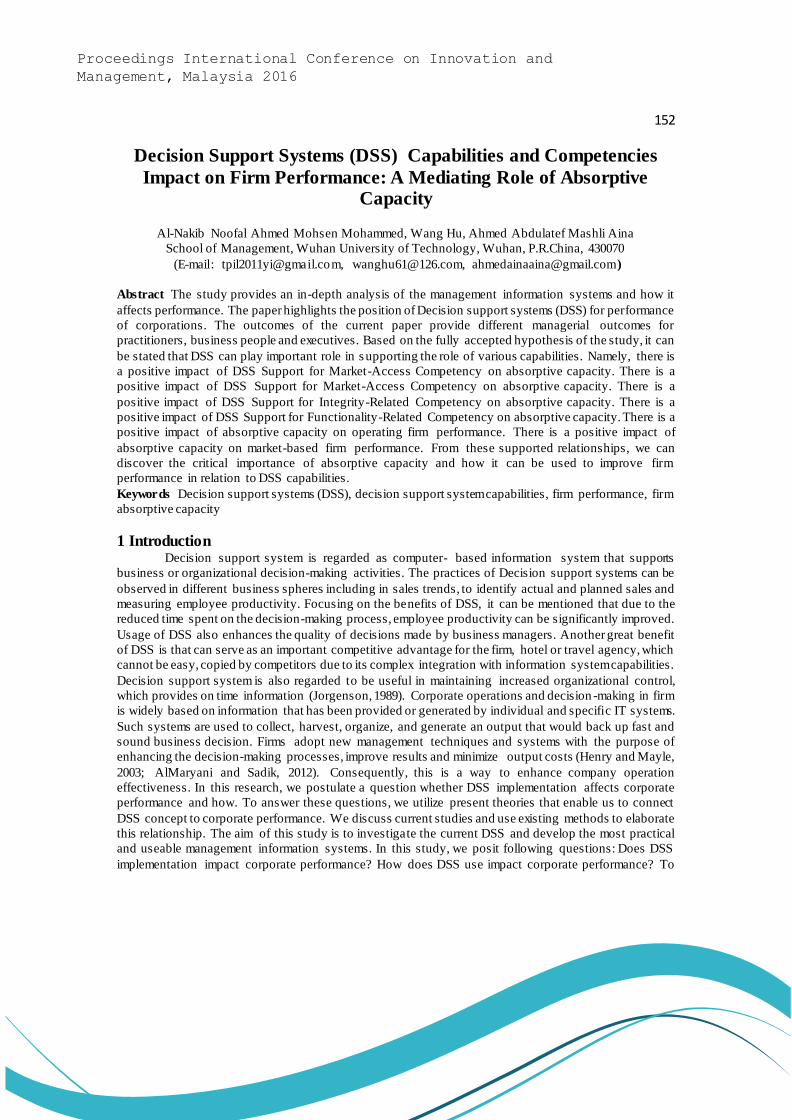
152
Proceedings International Conference on Innovation and
Management, Malaysia 2016
Decision Support Systems (DSS) Capabilities and Competencies
Impact on Firm Performance: A Mediating Role of Absorptive Capacity
Al-Nakib Noofal Ahmed Mohsen Mohammed, Wang Hu, Ahmed Abdulatef Mashli Aina
School of Management, Wuhan University of Technology, Wuhan, P.R.China, 430070
(E-mail: [email protected], [email protected], [email protected])
Abstract The study provides an in-depth analysis of the management information systems and how it
affects performance. The paper highlights the position of Decision support systems (DSS) for performance
of corporations. The outcomes of the current paper provide different managerial outcomes for
practitioners, business people and executives. Based on the fully accepted hypothesis of the study, it can
be stated that DSS can play important role in s upporting the role of various capabilities. Namely, there is
a positive impact of DSS Support for Market-Access Competency on absorptive capacity. There is a
positive impact of DSS Support for Market-Access Competency on absorptive capacity. There is a
positive impact of DSS Support for Integrity-Related Competency on absorptive capacity. There is a
positive impact of DSS Support for Functionality-Related Competency on absorptive capacity. There is a
positive impact of absorptive capacity on operating firm performance. There is a positive impact of
absorptive capacity on market-based firm performance. From these supported relationships, we can
discover the critical importance of absorptive capacity and how it can be used to improve firm
performance in relation to DSS capabilities.
Keywords Decision support systems (DSS), decision support system capabilities, firm performance, firm
absorptive capacity
1 Introduction Decision support system is regarded as computer- based information system that supports
business or organizational decision-making activities. The practices of Decision support systems can be
observed in different business spheres including in sales trends, to identify actual and planned sales and
measuring employee productivity. Focusing on the benefits of DSS, it can be mentioned that due to the
reduced time spent on the decision-making process, employee productivity can be significantly improved.
Usage of DSS also enhances the quality of decisions made by business managers. Another great benefit
of DSS is that can serve as an important competitive advantage for the firm, hotel or travel agency, which
cannot be easy, copied by competitors due to its complex integration with information system capabilities.
Decision support system is also regarded to be useful in maintaining increased organizational control,
which provides on time information (Jorgenson, 1989). Corporate operations and decision -making in firm
is widely based on information that has been provided or generated by individual and specific IT systems.
Such systems are used to collect, harvest, organize, and generate an output that would back up fast and
sound business decision. Firms adopt new management techniques and systems with the purpose of
enhancing the decision-making processes, improve results and minimize output costs (Henry and Mayle,
2003; AlMaryani and Sadik, 2012). Consequently, this is a way to enhance company operation
effectiveness. In this research, we postulate a question whether DSS implementation affects corporate
performance and how. To answer these questions, we utilize present theories that enable us to connect
DSS concept to corporate performance. We discuss current studies and use existing methods to elaborate
this relationship. The aim of this study is to investigate the current DSS and develop the most practical
and useable management information systems. In this study, we posit following questions: Does DSS
implementation impact corporate performance? How does DSS use impact corporate performance? To

153
Proceedings International Conference on Innovation and
Management, Malaysia 2016
answer these questions, we utilize present theories that enable us to connect the DSS concept to corporate
performance.
2 Literature Review Modern companies and the majority of business activities are strongly dependent on technology
use and information systems (IS). According to Prahalad and Hamel (2006), companies can be more open
and integrated to different markets by help of operating systems. Bharadwaj (2000) suggested that there
is a positive impact of information systems on companies performance, financial results, supply-chain
management, and customer satisfaction. Despite the fact that not all companies are utilizing IS, in
foreseeable future, the integration and collaboration of decision-making processes are likely to be
combined with the modern technologies, such as Decision Support Systems (DSS). Referring to Leonardi
and Bailey (2008), DSS can be considered as formal systems for the provision of timely and suitable
information to managers to take important decisions. Moreover, DSS can provide and co llect information
inside and outside the enterprise (Baccarini, 1999). According to Gray (2000), DSS has the main purpose
– timely provision of correct and useful information to executives or managers. Eierman et al. (1995)
stated that DSS capability was approved to be one the most important predictors of the performance. DSS
or MIS are used as a basis for making important decisions and plans (Jorgenson, 1989). Management
information systems take care of planning and control (Leonardi and Bailey, 2008). Each company or
organization, to function properly, must be able to execute particular operations, “whether it is a
wholesaler or car manufacturer or who has to provide water to its area of jurisdiction” (Wu and Lee, 2007).
MIS changes the bigger amount of data into compiled form and thereby avoids the possible ambiguity
that may arise when managers are swamped with detailed facts (Ryals, 2005). According to Bousset et al.
(2007), the operating of any enterprise is based on the strategies and orders of managers as well as the
institutional infrastructures. MIS is successfully used for measuring company performance and making a
necessary change in the organizational plans and procedures (Pfeffer and Sutton, 2000). Moreover,
according to the study conducted by (Naranjo-Gil 2009), DSS has an influence on flexibility-bas ed
strategic performance and cost-based strategic performance, taking into account the decentralization of
responsibilities, updating customer knowledge and customer participation in management, the
cooperation with other units with the scope of increasing the firm budget, and actualization and use of
management information (Slotegraaf and Pauwels, 2008). Referring to Dopuch (1993), systems for
decision-making should provide appropriate information to managers for taking right decisions and thus,
improving the firm’s financial performance. Moreover, referring to Cooper and Kaplan (1992), the main
goal of DSS should be to enhance overall financial performance, but not to obtain more precise costs.
Firms utilize innovation to obtain advantages that indirectly or directly impact economic performance
indicators (Cagwin and Bouwman, 2002); or the primary objective of management information systems
is to improve and enhance the potential role of the system in improving the firm’s overall financial
performance (Ranganathan and Kannabiran, 2004). Cohen and Olsen (2013), emphasized information
systems and human resources contribute to firm performance.
3 Research model development
3.1 DSS functional capabilities
In our research, DSS capability is defined as the ability to receive positive results in getting firm
and profit performance by help of DSS. Ravichandran and Lertwongsatien (2002) proposed that IS
functional capabilities play the important role to reach high firm performance since core competencies are
directly related to IT development. Thus, in our study, we also use core competencies, described by
Hamel. Core competencies were implemented in the research model. We considered the capabilities of
DSS to support main capabilities of companies. Therefore, relationships were expressed with three

154
Proceedings International Conference on Innovation and
Management, Malaysia 2016
particular hypotheses:
H1.1: There is a positive impact of DSS functional capabilities on DSS Support for Market-Access
Competency
H1.2: There is a positive impact of DSS functional capabilities on. DSS Support for Integrity-Related
Competency
H1.3: There is a positive impact of DSS functional capabilities on DSS Support for Functionality-
Related Competency
3.2 IS resources
The current research reveals DSS resources as the basis for DSS capability development. This
relationship has been understood in the definition of capabilities which involves organizations ability to
arrange and make efficient use of resources. The relationship between resources and capabilities can be
clearly seen in active capabilities viewpoint, positions of the asset are found to have an influence on the
development of capability. Based on these arguments, the study proposed a direct positive relationship
between IS resources and IS capabilities. IS literature provides three important categories of resources
including human, technological and relationship resources.
3.3 Absorptive capacity
Cohen and Levinthal (1990) revealed a new concept, named absorptive capacity, which
emphasizes the importance of information and its usage during the process of planning.
H2.1. There is a positive impact of DSS Support for Market-Access Competency on absorptive capacity
H2.2. There is a positive impact of DSS Support for Integrity-Related Competency on absorptive capacity
H2.3. There is a positive impact of DSS Support for Functionality-Related Competency on absorptive
capacity
3.4 Firm performance
Tallon and Pinsonneault (2011) together with Bharadwaj (2000) used the combine indicator
consisting mostly of financial metrics. In our study, firm performance includes several components:
operating performance and market-based performance. According to Bharadwaj (2000) operating
performance depends on some characteristics of the company: the industry in which the firm is
operating plays a crucial role.
H3.1: There is a positive impact of absorptive capacity on operating firm performance.
H3.2: There is a positive impact of absorptive capacity on market-based firm performance.
H4.1: The relationship between DSS support for core competencies and operating firm performance is
mediated by absorptive capacity.
H4.2: The relationship between DSS support for core competencies and market -based firm performance
is mediated by absorptive capacity.
155
Proceedings International Conference on Innovation and
Management, Malaysia 2016
Figure 1 DSS capabilities – firm performance research model
4 Research methodology and results An empirical study was conducted on a sample of 174 DSS users and experts from various
companies across different industries. All the scales were adopted from prior s tudies. The data were
collected using via online questionnaire and analyzed with SPSS statistical package. Multiple regression
analysis was performed and the relationships between the variables of the model were tested. The analysis
has shown that DSS planning sophistication is positively correlated with other variables. It has a strong
positive associations with Market based performance, Operating performance and DSS support for market
access competencies, R-value of these relationships is more than 0.45. There is a positive uphill linear
relationship between DSS planning sophistication and Absorptive capacity (R=0.59). Positive uphill linear
relationships of absorptive capability and Operating performances together with Market based
performance are supported with corresponding correlation coefficients R=0.65 and 0.7. The difference
between R-values, which demonstrates a strong positive correlation between Absorptive capacity and DSS
support maturity along with System operation capability is only 0.02 (R=0.65 and R=0.67 respectively).
Moreover, Market based performance is positively associated with Operating performance, which was
chosen as the second measure for Firm performance. Thus, both Firm performance indicators are strongly
correlated (R=0.8) Summarizing, all the correlations are significant and positive, which gives a good
reason to proceed with further investigation of the relationships between chosen variables. In order to
approve our theoretical assumption, we input our variables into regression mo dels. In the first regression
model in AMOS, we tested the relationship of DSS functional capabilities and DSS support for different
competencies. Critical value of Systems development capability is 2.25 with p -value 0.03 and regression

156
Proceedings International Conference on Innovation and
Management, Malaysia 2016
weight 0.24. While System operation capability’s one is even more (C.R.=3.83 and p=0.000). In the
relationship between DSS functional capabilities and DSS support for integrity related competencies, only
DSS planning sophistication do not influence on the dependent variable. According to the data received,
Systems operations capability and Systems development capability significantly impact on DSS support
for functionality related competencies. P-value of both of them is less than 0.005, while B=0.31 and 0.51.
Interestingly, that DSS planning sophistication is the only variable, which did not prove to be a regressor
of DSS support competencies. Due to the fact that we study the relationship between Absorptive capacity
and Firm performance, which is presented with two variables , there are only regression relationships.
According to the table 38-39, Absorptive capacity is a significant predictor in both cases. The ability to
utilize new information has significant influence on Operating performance (B=0.72). This can be clearly
seen by help of p-value (0.000) and critical ratio (11.1). Meanwhile, these indicators (p=0.000, B=0.86)
also demonstrates the impact of Absorptive capacity on Market based performance.
Table 1 The mediating effect of absorptive capacity
Estimate S.E. C.R.
Absorptive_capacity <--- DSS_support_for_marketaccess_competenci
es .251*** .065 3.838
Absorptive_capacity <--- DSS_support_for_integrity_related_compet
encies .295*** .075 3.965
Absorptive_capacity <--- DSS_support_for_functionality_related_co
mpetencies .165* .070 2.363
Operating_performance <--- Absorptive_capacity .723*** .065 11.101
Market_based_performance <--- Absorptive_capacity .860*** .066 12.972
* 𝑝<.05
** 𝑝<.01
*** 𝑝<.001
5 Discussion and implications of the study
The critical role of DSS and its implications cannot exist and develop without proper progress of
information technologies. The current research found positive relationship between the impacts of DSS
support for market access competencies on absorptive capacity. Absorptive capacity is considered as the
ability of recognizing the value of necessary information and sharing it with others, or disseminating it.
This in turn indicates that high absorptive capacity or in other words, higher education, employee
development and development of innovation is the key to success of the high firm performance. Integrity
related competency is mainly considered with organization environment of the company. Precisely, the
internal environment of the company can be considered as a base of absorptive capacity. When the
operation of the human resource department, information technology and marketing departments are
supported by the DSS, firm is expected to achieve high performance. Therefore, due to the difficulty and
crucially of the decision making process, it is important to mention the necessity of the computer
technologies which play important role in simplifying the process of decision making process. Judging

157
Proceedings International Conference on Innovation and
Management, Malaysia 2016
from the results obtained during the examination of the relationship between DSS and firm performance,
key elements of these relationships can be used to explain a research model for current study. The results
of the study were in the line with findings of other authors Brdesee et al. (2013), Eierman et al. (1995),
Ravichandran et al. (2005), supporting the theory that DSS capabilities are considered as the system
capacities that are used to maintain the individual or group work productivity. Following the path of
research done by Inmyxai and Takahashi (2010), we found out that company’s ability to use DSS to
improve the core competencies is mainly related to the functional software capabilities. The strategic value
of IS functional capabilities should also be paid a considerable amount of attention. Most of the
researchers like Ravichandran (2002) propose that main IS activities should be done with the focus on
cost reduction. In this regard, organizations using IT mainly believed to succeed in IT development in
building these capabilities. Relatively slow implementation of modern DSS in Saudi Arabia can be
explained by unclear results after DSS adoption. According to the study done by Webber and Gretzel
(2000), sometimes, the complexity of the tasks and unclear usage of DSS can be the main obstacle for
using DSS. As it was mentioned by Rahimi et al. (2016) companies which are using IS are not the only
ones which are harvesting from this cooperation. Considering DSS capabilities, it is necessary to mention
that many authors like Ravichandran et al. (2005), Eierman et al. (1995) and Feeny and Willcocks (1998
) tried to describe the constructs and capabilities of DSS capabilities. During the analysis of relationship
between DSS functional capabilities and DSS Support for company competencies, it was revealed that
DSS planning sophistication is the only variable, which did not approve to be a predictor in the relationship
with DSS Support form company competencies. Planning is tightly related to the strategy and business
goals of the company. Taking the strategy as a basis, the company can formulate further steps in form of
written strategic plan. In this regard, referring Cooper and Kaplan (1992), DSS planning is important,
however according to the results of our study, DSS planning sophistication should be considered together
with the strategy of the company. Ping, G. (2011) also emphasized the role of DSS accordance with the
strategy and goals of the company. However, he also mentioned that strategic planning in DSS is only
developing in Saudi Arabia. Despite that majority of organizations are trying to enhance their firm
performance, managers can undertake different risks; adjust the goals of the company at certain stage of
its development (Wijewardena et al., 2004). As a result, DSS planning sophistication is not always
oriented to the improve firm performance. Nowadays, synthesis between IT and business is the necessity
to follow the trends and changes in the world market as well as local. However, referring to Rahimi et al.
(2016), human management and employees and managers involvement is not of less importance. Thus,
managers as well as other representatives of human resource of the enterprise are the most important
figures, which understand the complete mission of the company. According to Kivijärvi and Saarinen
(1995) the type of strategies has crucial importance for financial performance of a company. The influence
of DSS support maturity was also unstable. DSS support maturity is an indicator describing the sensibility
of DSS to any adjustments in the planning. Owing to the fact that the development of DSS is only at the
early stage in Saudi Arabia, it is possible that DSS support maturity is lagging behind. The disparity of
DSS functional capabilities and DSS support for companies competencies can result in low significance
of DSS support maturity. Furthermore, due to the fact current study is mostly focusing on the developing
country – Saudi Arabia, the modest integration can be explained by the economic environment of the
country. Peng et al. (2016) emphasized that companies in economically stable countries with high -level
of life are tend to use the advantages of the IT in business. In addition, referring to Cerpa and Verner
(1998), this indicator is highly correlated with the strategy of the company. Hence, similarly with DSS
planning sophistication, the revealing of primary goals as well as concrete strategic plan is essential. The
relationship between DSS support for core competencies and Absorptive capacity, all three hypotheses
were supported with the empirical evidence. In virtue of the main feature of Absorptive capacity is the
ability to use the data, the utility of data is dependent on its importance. The higher importance, the more
better it can be utilized or adopted. Based on the results obtained during testing the influence of Absorptive
158
Proceedings International Conference on Innovation and
Management, Malaysia 2016
capacity on the firm performance, we can state that Absorptive capacity is one of the most essential
attribute of the company. Moreover, as the firm performance was presented by two elements – Market
based and Operating firm performances, absorptive capacity is a significant regressor in both cases.
Judging from the results obtained by Rai et al. (2015), IT is the key component for an interfirm int egration
capability of the company.
6 Conclusion
Current paper provides useful insights into the concepts of MIS and particularly DSS. The in depth
analysis of MIS and DSS were provided in order to identify their significance in relation to organiza tional
outcomes. Moreover, the current research outlined the importance of different firm related competencies
and capabilities that should be differentiated. The findings of the study can be considered even more
important in the period where the most of the companies are making the best use of IT and management
information systems. The information contained in DSS is considered to be secure and reliable. Decision
support systems is analysed in three different dimensions whereas most of the previous studies used only
the one dimension in order to analyze it. Furthermore, the last but not the least, positive impact of DSS
support for functionality related competency on absorptive capacity have been found. Future studies may
focus on drawback research as well as on the empirical study of DSS benefits, which have a huge influence
and role
References [1] AlMaryani, M. A. H., & Sadik, H. H. (2012). Strategic Management Accounting Techniques in
Romanian Companies: Some Survey Evidence. [C] Procedia Economics and Finan ce, 3, 387-396.
[2] Baccarini, D. (1999). The logical framework method for defining project success. [J] Project
management journal, (Volume 30), 25-32.
[3] Bharadwaj, A. S. (2000). A resource-based perspective on information technology capability and firm
performance: an empirical investigation. [J] MIS quarterly, 169-196.
[4] Bousset, Jean-Paul, et al. "A decision support system for integrated tourism development: rethinking
tourism policies and management strategies." [J] Tourism Geographies 9.4 (2007): 387-404.
[5] Brdesee, H., Corbitt, B., & Pittayachawan, S. (2013). Barriers and motivations affecting Information
Systems usage by Hajj–Umrah religious tourism operators in Saudi Arabia. [J] Australasian Journal
of Information Systems, 18(1).
[6] Cagwin, D., & Bouwman, M. J. (2002). The association between activity-based costing and
improvement in financial performance. [J] Management Accounting Research, 13(1), 1-39.
[7] Cerpa, N., & Verner, J. M. (1998). Case study: The effect of IS maturity on information systems
strategic planning. [J] Information & Management, 34(4), 199-208.
[8] Cohen, J. F., & Olsen, K. (2013). The impacts of complementary information technology resources
on the service-profit chain and competitive performance of South African hospitality firms. [J]
International Journal of Hospitality Management, 34, 245-254,
[9] Cooper, R., & Kaplan, R. S. (1992). Activity-based systems: Measuring the costs of resource usage.
[J] Accounting Horizons, 6(3), 1-13.
[10] Dopuch, N. (1993). A perspective on cost drivers. [J] Accounting Review, 615-620.
[11] Eierman, M. A., Niederman, F., & Adams, C. (1995). DSS theory: A model of constructs and
relationships. [J] Decision Support Systems, 14(1), 1-26.
[12] Feeny, D. and Willcocks, L. (1998). Core IS Capabilities for Exploiting Information Technology.
[J] Sloan Management Review, 39(3), 9–21
[13] Gray, P. H. (2000). The effects of knowledge management systems on emergent teams: towards
a research model. [J] The journal of strategic information systems, 9(2), 175-191.

159
Proceedings International Conference on Innovation and
Management, Malaysia 2016
[14] Inmyxai, S., & Takahashi, Y. (2010). The effect of firm resources on business performance of
male-and female-headed firms in the case of Lao micro-, small-, and medium-sized enterprises
(MSMEs). [J] International Journal of Business and Information, 5(1), 63.
[15] Jorgensen, D. L. (1989). Participant observation. [B] John Wiley & Sons, Inc.
[16] Kivijärvi, H., & Saarinen, T. (1995). Investment in information systems and the financial
performance of the firm. [J] Information & Management, 28(2), 143-163.
[17] Leonardi, P. M., & Bailey, D. E. (2008). Transformational technologies and the creation of new
work practices: Making implicit knowledge explicit in task-based offshoring. [J] MIS quarterly, 411-
436.
[18] Naranjo-Gil, D. (2009). The influence of environmental and organizational factors on innovation
adoptions: Consequences for performance in public sector organizations. [J] Technovation, 29(12),
810-818.
[19] Pfeffer, J., & Sutton, R. I. (2013). The knowing-doing gap: How smart companies turn
knowledge into action. [B] Harvard Business Press.
[20] Prahalad, C. K., & Hamel, G. (2006). The core competence of the corporation. [J] In Strategische
unternehmungsplanung—strategische unternehmungsführung (pp. 275-292). Springer Berlin
Heidelberg.
[21] Rahimi, F., Møller, C., & Hvam, L. (2016). Business process management and IT management:
The missing integration. [J] International Journal of Information Management, 36(1), 142-154.
[22] Ranganathan, C., & Kannabiran, G. (2004). Effective management of information systems
function: an exploratory study of Indian organizations. [J] Internat ional Journal of Information
Management, 24(3), 247-266.
[23] Ravichandran, T., Lertwongsatien, C., & LERTWONGSATIEN, C. (2005). Effect of
information systems resources and capabilities on firm performance: A resource-based perspective. [J]
Journal of management information systems, 21(4), 237-276.
[24] Ryals, L. (2005). Making customer relationship management work: the measurement and
profitable management of customer relationships. [J] Journal of Marketing, 69(4), 252-261.
[25] Slotegraaf, R. J., & Pauwels, K. (2008). The impact of brand equity and innovation on the long-
term effectiveness of promotions. [J] Journal of Marketing Research, 45(3), 293-306.
[26] Tallon, Paul P., & Pinsonneault, Alain. (2011). Competing Perspectives on the link between
Strategic Information Technology Alignment and Organizational Agility: Insights from A Mediation
Model. [J] MIS Quarterly, 35(2), 463-486.
[27] Weber, K., & Gretzel, U. (2000). Tourism manager's adoption of marketing decision support
system. [J] Journal of Travel Research, 39(2), 172-181.
[28] Wu, W. W., & Lee, Y. T. (2007). Selecting knowledge management strategies by using the
analytic network process. [J] Expert systems with Applications, 32(3), 841-847.

160
Proceedings International Conference on Innovation and
Management, Malaysia 2016
Theme 4: Banking and Islamic Finance, Corporate Finance
161
Proceedings International Conference on Innovation and
Management, Malaysia 2016
Islamic Finance in Australia: Require Level Playing Field
Mohammad Z Hasan, Fazle Rabbi
School of Business, University of Notre Dame Australia, Sydney, Australia
(Email: [email protected])
Abstract This research paper assesses current taxation treatment of Islamic Finance products in Australia.
The key difference between conventional and Islamic finance products is that it is demanded that the latter
are free of riba or interest. In addition, there are numerous other credentials that should be fulfilled before
an Islamic finance product is regarded as Sharia compliant. But Australia needs to introduce regulatory
simplicity and to guarantee a level playing field to convert it into a lucrative Islamic financial investment
hub in this part of world. Although the local investment banks have been assertive in the feasibility of an
Islamic wholesale market, additional progress depends on the wider political atmosphere, more
professional opinions from relevant scholars, including Islamic finance researchers and not just the
willingness of Australian regulatory officials. More knowledgeable responses on the efforts of Australian
government, like ‘Johnson Report’ as well as the discussion paper of the Board of Taxation, should be
scrutinized to construct a feasible level playing field for Islamic financial sector in near future.
Keywords Islamic finance; Regulatory framework; Australian tax
1 Introduction In recent years Islamic finance has been experiencing exponential growth and it is considered as
one of the fastest growing segments of the global financial services industry. This industry has been
growing at over 10 per cent per annum over the last 10 years and this trend is expected to continue in the
coming days. The current size of the Islamic finance market ranges from $1.66 Trillion to $2.1 Trillion
with expectations of market size to be $3.4 Trillion by end of 2018. O’Brien (2012) cites a 2011 Ernst &
Young (EY) statement which remarks that Islamic finance offers capital prospects, claims that the basis
for the growth of Islamic finance is comparatively direct. It says: “Islamic instruments have been more
resilient than many conventional instruments during the global financial crisis, and they are likely to see
growing demand from an increasingly wealthy group of Muslim investors”.
Currently, the Middle East and South East Asia are the primary locations for Islamic capital. In
particular, the United Arab Emirates, Bahrain and Malaysia are seen as the main centres of Islamic finance,
with significant activity also taking place in the United Kingdom and more recently in Europe, Africa and
Indonesia. Importantly, the demand for Islamic finance is not evident only in Muslim countries. Countries
with minority Muslims also exhibit demand for Islamic finance products, es pecially for home loan and
saving deposits.
Islamic finance has been available for last 1400 years. However, it was not practised explicitly even in the
Muslim world because of lack of demand and awareness. In the modern world, Islamic finance has been
emerged in 1970s and since then experienced phenomenal results and was established itself as an
alternative to the conventional finance. Currently, Islamic finance is not only available in Muslim world;
it has significance presence in non-Muslim countries. As Islamic finance has fundamental differences
compared to traditional finance, it faces obstacles in the non-Muslim countries. For example, mortgage
products under Islamic finance face double taxation problem. As many Islamic banking and financial
contracts are treated as buying and selling properties and hence are taxed twice. It obviously creates
disadvantage to Islamic finance products and therefore; it remains uncompetitive. Ahmad (2007) asserts
that required Shariah law for the establishment of Islamic finance offers its own structure for the successful
implementation of financial transactions and contracts. It is obvious that non-Muslim countries cannot
directly arrange this Shariah-complaint framework to facilitate the implementation of Islamic finance.
162
Proceedings International Conference on Innovation and
Management, Malaysia 2016
However, these non-Muslim countries can organise required changes in their existing regulatory
framework since Islamic finance receives equal treatment and as a result can be competitive. As Sain,
Rahman and Khanam(2013) suggest that legal and regulatory framework is the basic elements for the
establishment and successful operation of any financial system. Therefore, it has paramount importance
for Australia to arrange appropriate regulatory framework if it needs to implement and sustain Islamic
finance.
Australian Financial Centre Forum (2009) released its first report, called ‘Johnson report’, in
November, 2009, commissioned by the Australian Government. The report identifies that Australia needs
to remove some regulatory barriers to remain efficient and competitive financial sector in the Asia -Pacific
region. The commission recognises the importance of the Islamic Finance in Australian context and
acknowledges that Australia need to create level playing for Islamic Finance. The first Johnson Report
makes two proposals on Islamic finance; the removal of regulatory barriers to the development of Islamic
finance products, and a call for an inquiry by the Board of Taxation into whether Australian tax law needs
to be amended to ensure that Islamic financial products have parity of treatment with conventional
products. In 2010 the assistant Treasurer advised the Board of Taxation to identify the impediments in
current Australian tax laws, to examine the tax policy response to the development of Islamic financial
products in other countries and to make recommendations to Commonwealth and State tax laws. In t his
regard the Board develops some basic principles to create level playing field for Islamic finance: a) the
tax treatment of Islamic financial products should be based on their economic substance rather than their
form b) where an Islamic financial product is economically equivalent to a conventional product, the tax
treatment of the two products should be the same and c) the Board should consider whether adjustments
can be made to existing tax frameworks rather than the development of specific provisions directed solely
at Islamic financial products. To complete the study, the Board of Taxation invited discussion papers from
individuals and organizations. The Board has received 14 discussions papers and it made 13 submissions
available to the public. In this research, we will evaluate these 13 submissions to understand the
impediments in the current structure for the success of the Islamic finance in Australia and to identify the
common recommendations. This research article will also address the available approaches to legal
framework and will recommend the suitable one in Australian context.
The organization of the article is as follows: Section 2 addresses the situation of Islamic finance
in Australia; Section 3 identifies available approaches to legal framework; Section 4 discusses on common
impediments and recommendation to create level playing field for Islamic finance and Section 5 concludes
the study.
2 Islamic Finance in Australia Ahmad and Hassan (2009) mentions that Australia is making small inroads into this fast-growing
segment in comprehensive finance, and with a rising Muslim population which makes up less than 2
percent of the population, it has the probability to become a major centre for Islamic banking and finance.
The demand has been growing rapidly as Muslim population increases at a relatively higher rate.
Moreover, Australia is in close proximity to a region where more than 60 percent of the world’s Muslim
population-with growing need for Islamic finance-resides. The potential for the Islamic finance industry
is immense. Islamic banks are expected to manage about 40% to 50% of total savings of the Muslim
population in eight to ten years. In spite of this opportunity and growing n eed for Islamic finance, there is
little market response from the supply side. One of the main reasons would be to high borrowing costs. It
is reported that one of the key aspects of Australia’s economy is to reliance on foreign capital. In this case,
various financial organizations can channel the off-shore funds to Australia by borrowing from oversees
and lending to business and individuals. As Gulf region has access funds, there is immense opportunity
for the Sariah compliant financial institutions to these funds to Australia. This would ultimately lower the

163
Proceedings International Conference on Innovation and
Management, Malaysia 2016
cost of capital. To ensure this funding, it has significant importance to create appropriate system and
environment.
Australia’s experience with Islamic financing has been relatively recent. The first attempt to
introduce Islamic financing products in Australia was made by the Muslim Community Co -operative
Australia (MCCA) (Ahmad, Osmani, & Karim, 2010). Currently, there are some organizations offer
Shariah compliant products in Australia. However, their operations are at small scale and they offer very
limited number of products. It is apparent that there is unmatched demand of Islamic finance, as few small
scale organizations engage in supply side. As a result, the market is not competitive and many borrowers
find the borrowing cost is significantly higher compared to the conventional financing. Lack of source of
fund due to regulatory impediments is one of main factors for high borrowing cost.
3 Approaches to legal framework An appropriate legal and regulatory framework is a basic requirement for establishing and
operating a sound financial institutions and markets . Similar to the Common law and Civil law systems
the Shariah offers its own framework for the implementation of commercial and financial contracts and
transactions (Ahmad, 2007). However, Australia like many other countries do not have the appropriate
financial, commercial and company laws to facilitate the implementation of Islamic finance and financial
contracts. Without having appropriate legal framework, the Islamic finance industry would not be able to
flourish. As Ghouse (2010) mentions, there are numerous significant aspects that are backing to a rising
interest in Islamic finance, both within the business community and the government sector. Some of these
contain the possible sourcing of capital from the Gulf Cooperation Council (GCC) and the welfares arising
from the speedy progression in Islamic finance which is the fastest growing area in the global financial
structure.
3.1. Total absorption approach
In a total absorption approach, a country can completely islamise its banking system. Under this
approach, conventional banking will be replaced by Islamic banking system and therefore, shariah
commercial law will replace conventional finance law. The main intention of this system is to abolish
interest based system completely. Sudan and Iran have adopted this approach to islamise their banking
system. It is obvious Australia cannot adopt this system because of its secular nature and also for economic
and political reasons.
3.2. A Dual model approach
A dual model approach allows the operation of conventional banking and Islamic banking side
by side. This approach recognises the integrative duality of financial systems in which finance exists
parallel with conventional finance. The dual model approach represents a special case whereby a
government regulated framework allows both conventional and Islamic banking systems to co -exist on an
equal basis while competing and complementing each other at the same time. As total absorption approach
requires complete departure from conventional banking system, it might not seem plausible for some
countries to adopt this model. Malaysia sets an excellent example of embracing dual model approach
allowing the existence of both systems simultaneously. Malaysia enacted Islamic Banking Act in 1983
for the establishment of its first Islamic bank (Bank Islam Malaysia Berhad). In regard to the success of
adopting dual approach, Yackop (2003) states that Malaysia has taken the lead in championing dual
banking to promote Islamic banking. This approach also might not feasible in Australia as only 2.5% of
its population is Muslim and therefore; the market for Islamic banking would not be big enough for the
success of the dual approach.
3.3. An integrative approach
An integrative approach is the minimal approach for the success of the operation of the Islamic
banking alongside with conventional banking. As Islamic banking requires level playing field for making
this system as productive and competitive as conventional banking , tax laws and financial regulations

164
Proceedings International Conference on Innovation and
Management, Malaysia 2016
should not be impediment for the Islamic banking system. The integrative approach allows the Islamic
banking system to have seamless integration within a conventional banking structure by changing tax and
financial regulations. The United Kingdom (UK) takes approach to accommodate Islamic banking. In
2001, the UK took initiative to examine and understand the barriers to adopting Islamic banking. Ainley,
Mashayekhi, Hicks, Rahman and Ravalia (2007) prepared a report for Financial Services Authority (FSA)
in the UK to identify the regulatory obstacles for the development Islamic finance. The FSA decided that
its approach would be ‘no obstacles, but no special favours’. This approach is equivalent t o integrative
approach as to remove regulatory obstacles and change tax laws to make Islamic finance competitive and
sustainable. As financial, demographics and regulatory systems in Australia are comparable to the systems
in the UK, the integrative system is considered as the suitable model for adopting Islamic finance in
Australia.
4 Discussion on impediments and recommendations To understand the potential barriers for the development of Islamic finance and to recommend
appropriate way forward suggested by the first Johnson report in September 2008, the Australian
government advised the Board of Taxation to carry out a study. In regard to Islamic finance, the Johnson
report notes that accessing this market “could increase the diversity of sources of cap ital available to
Australian business and consumers” (cited in Smith, 2010).
The focus of the report of the Board of Taxation was not to give any special treatment to Islamic
finance, but to make sure there is a level playing field for the development of Islamic Finance in Australia.
This work was undertaken by the Board of Taxation in 2010 and to do this the Board invited interested
stakeholders and parties to provide comment on the review of the taxations treatment of Islamic finance
(BoT, 2010). According to Moore (2013), the report was mainly based on recommendations in the 2010
Johnson Report which offered policy options to better position Australia as a financial centre. It was about
ensuring a ‘fair and level playing field’ according to Parliamentary Secretary Bernie Ripoll, and to ensure
that Islamic financial products had parity of tax treatment with conventional products.
The Board of Taxation received 14 responses including professional organizations like Chartered
Public Accountants (CPA), Ernst and Young, and Australian Financial Market Associations (AFMA) and
expert individuals. Some of the responses are comprehensive and there is significant similarity in some
responses.

165
Proceedings International Conference on Innovation and
Management, Malaysia 2016
Table 1: List of the submissions to the Board of Taxation
Name Type
Blake Dawson Individual
Clark, David Individual
Condon, Paul Individual
CPA Australia Organization
Crescent Investment Australasia Organization
Department od NSW Treasury Organization
Ernst and Young Organization
Financial Services Council Organization
Freudenberg and Nathie Individual
Janson, Vickie Individual
Norton Rose Individual
MCCA Ltd Organization
Taxation Institute of Australia Organization
After analysing the submitted responses, we identify that all except two is positive about the
inclusion of Islamic finance into conventional finance and most of them recommend some regulatory
changes in area of tax as Islamic finance can be competitive. The first proposal is by David Clark, a
member of the NSW Legislative Council on behalf of the Liberal Party of Australia, and a resilient activist
of ‘Christian Values’ and the other is by Vickie Janson, the vice-president of Q Society, a group that
opposes what it describes to be the ‘Islamisation’ of Australia (Bhatti, 2015). In that research Bhatti (2015)
cites the notes of Clark as follows:
..the Board should not be relying on the ‘Islamic economic system’ as a basis of the review. This is not
the system that the Islamic finance operates in and in partly why Islamic financial products must replicate
conventional products. As Islamic finance operates in a conventional system and Islamic finance
principles adapt to accommodate this system, in substance Islamic finance principles are convent ional
principles. Thus, the assumption that Islamic finance products are based on Islamic finance principles,
operating in an Islamic economic system has no worth in a practical exercise to determine the appropriate
tax treatment of Islamic finance products.
Bhatti (2015) mentions the comment of Clark as inconsistent as the Board does not depend on
the Islamic economic structure as the foundation of its assessment. The proposal of Janson is identified as
similar as Clark, but more confronting approach by Bhatti (2015):
..I would strongly recommend that the government reassess this commitment to sharia finance with its
connections to Islamic groups, it’s [sic] theological foundations and it’s [sic] undermining of both
western values and economy… It appears support for sharia finance is support for Islamic ideologies
rather than the moderates who utilise conventional banking.
Janson also claims that the leaders in the Islamic finance industry, such as Usmani, have jihadist views.
She is more concerned about the impact that Sharia products will have on ‘Australian values’ than with
the provision of space for Islamic finance products in Australia (Bhatti, 2015).

166
Proceedings International Conference on Innovation and
Management, Malaysia 2016
According to Bhatti (2015), the Board of Taxation’s discussion paper was published in late 2010
and no supplementary tax reforms have taken place since the issue of the Discussion Paper, while judicial
modifications were made to accommodate for Islamic finance products in the United Kingdom as early
as 2003.
In the following discussion, we explore the most common recommendations put forwarded by the
professional bodies and individuals to create level playing field for the Islamic finance.
4.1 Economic vs legal interpretation in tax law
In developing tax law, there are two choices: economic substance approach and legal substance
approach. To achieve neutrality in taxation law for Islamic finance, all the submissions to the Board of
Taxation recommend using economic substance approach instead of legal substance approach. Although
legal substance approach is simpler to use, it leads to anomalies and unexpected complexities. Importantly,
legal substance approach would be disadvantages to develop appropriate tax laws for Is lamic financial
products. On the other hand, the economic substance approach is relatively complex to use, however; it
can lead to greater tax neutrality. Under this approach, similar financial transactions are considered the
same. For example, in Islamic finance, home loan is organised in different manner compared to traditional
system. Current tax law considers arrangement of Islamic home loan not as a one transaction but as
multiple transactions. As a result, taxes incurred multiple times for one event. This makes home loan
under Islamic finance unattractive. To achieve greater neutrality in this type of situation, economic
substance approach is considered suitable.
4.2 Double stamp taxation
As stated in the previous section, home products in Islamic finance face double stamp duty
problem because of the nature of the transaction. The majority of submissions express the view that the
States and Territories should address stamp duty through a targeted exemption approach. Targeted
consultations further revealed that Islamic finance products involving dutiable assets would be unlikely
to be provided without appropriate stamp duty relief. Importantly the Board of Taxation considers that
addressing this issue is a priority in terms of achieving neutrality in tax treatment. Among all the states,
Victorian stamp duty laws in 2004 have eliminated distinctions in treatment between Islamic and
conventional finance products.
4.3 Debt-equity rules
Broadly, the debt/equity rules are important as they govern if the return on the finance instrument
may be deductible to the issuer. The return is deductible in the case of debt interest and non-deductible in
the case of equity interest. The outcome can have further implications under the thin capitalisation and
withholding tax rules. Broadly, an instrument will be a debt interest where the issuer has an effectively
non-contingent obligation to return at least the issue price of the instrument to the holder. Equity interests
include ordinary shares and other instruments that provide an element of contingency on the issuer’s
obligation to return funds to the holder. For example, an instrument may be an equity interest if it carries
a right to a return, which is in substance or effect contingent on the economic performance of the company.
4.4 Uncertainty of income tax issues
The uncertainty issue to the treatment of income tax of financial products in Islamic finance is
disadvantageous. However, this issue is not identified by the most of the responses given to the Board of
Taxation. However, we think in line with Australian Financial Market Association that there is clearly
uncertainty as to the precise income tax treatment under current law of the various Shariah compliant
financing techniques. Where uncertainty exists, it can reasonably be assumed to be a disincentive to
Shariah compliant investments being made. It may be possible to resolve those uncertainties by seeking
rulings from the Australian Taxation Office (ATO). Accordingly, the Professional Bodies consider that
some legislative change is required to both remove uncertainty and to achieve parity of income tax
treatment. The Professional Bodies consider it reasonable to expect that the Australian demand for capital
provided via Shariah compliant financing techniques would be driven by financial sector and other large
167
Proceedings International Conference on Innovation and
Management, Malaysia 2016
business entities. These entities would be expected to already be subject to Division 230 of the ITAA
1997.
5 Conclusion Islamic finance system can ensure an ethical financial arrangement available th rough the process
as former Australian senator Nick Sherry says that these service companies are not allowed to charge
interest rates and do not invest in gambling or alcohol because of shari’ah law. But he aptly doubts that
the unlike ways of conducting business can sometimes put the Islamic finance centre at a disadvantage
under Western tax code (BBC, 2010). This reality is explicable after observing the existing regulatory set-
up of banking and finance in Australia. But as Farrar (2011) sates that this has not stopped the emergence
of local operators who, by and large, have successfully navigated the existing system notwithstanding the
penalising impact and effect of some of those regulations, especially in the area of taxation. Even in the
nonexistence of any governmental or organizational modifications, local Islamic financial developers will
remain to construct their financial products in such a way as to maximise their yields as well as to secure
a halal return.
Progresses over a decade, however, show that thrust is emerging to accommodate Islamic
Financial institutions through Australia. As Farrar (2011) states the legal proposal from various
organisations and individual experts is particularly European in origin, similar to ‘level playing field’
approach of United kingdom. This may demonstrate to be an error in the long term as Australia is likely
to become more dependent on the Asian economies. It should be obvious that Australia should do more
than promote its natural assets and level the playing field if considerable influxes of Islamic foreign
investment are to materialise.
But Australia needs to go a long way to make this happen and needs to do more to alter the
understanding of some of the critics like Muehlenberg (2010) who mentions that all over the Western
world, governments are bending over backwards to accommodate sharia finance. Therefore, regulatory
simplicity, guaranteeing a level playing field and sketching an outline of incentives are required for
attracting foreign Islamic investment funds. Although the local investment banks have been assertive in
the feasibility of an Islamic wholesale market, additional progress depends on the wider political
atmosphere, more professional opinions from relevant scholars, including Islamic finance researchers and
not just the willingness of Australian regulatory officials. More knowledgeable responses on the efforts
of Australian government, like ‘Johnson Report’, should be scrutinized to cons truct a feasible level
playing field for Islamic financial sector in near future.
References [1] AFCF. (2009). Australia as a Financial Centre: Building on Our Strengths; Australian Financial
Centre Forum; [Online]; Available
at:http://afcf.treasury.gov.au/content/final_report%5Cdownloads%5CAFCF_Building_on_Our_Str
engths_Report.pdf ; Accessed on: 20 October, 2015. Barton, ACT: Attorney General's Department.
[2] Ahmad, A. U. F. (2007). Law and Practice of Modern Islamic Finance in Australia. (Doctor of
Philosophy), University of Western Sydney, Sydney.
[3] Ahmad, A. U. F., & Hassan, M. K. (2009). Legal and Regulatory Issues of Islamic Finance in
Australia. International Journal of Islamic and Middle Eastern Finance and Management, 2 (4),
305-322.
[4] Ahmad, A. U. F., Osmani, N. M., & Karim, M. F. (2010). Islamic Finance in Australia: The
Potential Problems And Prospects. Paper presented at the Seventh International Conference, The
Tawhidi Epistemology: Zakat and Waqf Economy, Bangi, Malaysia.
[5] Ainley, M., Mashayekhi, A., Hicks, R., Rahman, A., & Ravalia, A. (2007). Islamic Finance in the

168
Proceedings International Conference on Innovation and
Management, Malaysia 2016
UK: Regulation and Challenges. United Kingdom: Financial Services Authority.
[6] BBC. (2010). Australia to Remove "Impediments" to Islamic Finance Sector ; Credit: Radio
Australia, Melbourne; [Online]; Available at:
http://search.proquest.com/docview/89151656?accountid=36155 ; Accessed on: 17 July, 2016.
Retrieved from London, United Kingdom:
[7] Bhatti, M. (2015). Taxation Treatment of Islamic Finance Products in Australia. Deakin Law
Review, 20(2), 263-298.
[8] BoT. (2010). Review of the Taxation Treatment of Islamic Finance; Discussion Paper; The Board
of Taxation, Australia; [Online]; Available at:
http://taxboard.gov.au/files/2015/07/Islamic_Finance_Discussion_Paper.pdf ; Accessed on: 13 July,
2016. 1-76.
[9] Farrar, S. (2011). Accommodating Islamic Banking and Finance in Australia. UNSW Law Journal,
34(1), 413-442.
[10] Ghouse, A. R. (2010). Islamic Finance: How Serious is Australia? INFINANCE: The Magazine for
Finsia Members (pp. 24-25).
[11] Moore, B. (2013). Government Assess Tax Reforms to Promote Islamic Finance . Chatswood,
Sydney: Cirrus Media.
[12] Muehlenberg, B. (2010). Australia Set to Accommodate Islamic Sharia Finance. News Weekly(June
26), 17-18.
[13] O'Brien, A. (2012). Understanding the Power of Islamic Finance (Vol. 83,6): ProQuest Central.
[14] Sain, M. R. M. R., M.M., & Khanam, R. (2013). Islamic Finance in Australia: History and
Development. Paper presented at the 3rd Malaysian Postgraduate Conference, Sydney, New South
Wales, Australia.
[15] Smith, K. (2010). Board of Taxation Update Charter (pp. 59): ProQuest Central.
[16] Yackop, N. M. (2003). Developing an Islamic Banking System: The Malaysian Model. Paper
presented at the International Islamic Banking Conference, Parto, Italy.

169
Proceedings International Conference on Innovation and
Management, Malaysia 2016
A Review on the Board of Directors
Habiba Nabila Ihlasuddini Mohammad Ali Tareq
Malaysia-Japan International Institute of Technology, Kuala Lumpur, Malaysia
(Email: [email protected], [email protected])
Abstract Theories of the Board of Directors has been developed since 1970’s. Board of Directors has
important roles on a firm. According to scholars, some functions of the Board are controlling, monitoring,
coordinating, and maintenance. This paper provides the overview on the Board of Directors, including its
theories and roles.
Keywords Board of Directors, Corporate Governance, Managerial-Hegemony Theory, Resource
Dependence Theory, Agency Theory, Stewardship Theory
1 Introduction Among the elements of Corporate Governance, there is the Board of Directors which, in recent
years, has gained considerably high attention from the scholars. Board of Directors is considered as a vital
part of the firm, some scholars said they are needed to protect the interests of shareholders (Fama &
Jensen, 1983).
Researchers have been examining Board of Directors. Theories has been coming out from the
reknown scholars, namely (L. Donaldson & Davis, 1991; Fama & Jensen, 1983; A. J. W. Hillman, 2009) .
Other scholars have also made their reviews over the roles of the Board. Even though scholars agree wit h
the importance of Board of Directors, their description over the Board ultimate roles is still vary due to
the different perspectives used in examining them (Jonsson, 2008).
The objective of this paper is to provide a basic overview regarding to the Board of Directors in
which the content can be a starting point for other researcher o f Corporate Governance issues.
Accordingly, this study is divided into some sections: Definition, Composition of the Boad of Directors,
Theories of The Board of Directors, The Roles of The Board of Directors, and Conclusion.
2 Definition Baysinger & Butler (1985) defined Board of Directors as a specialized governance structure that
economizes transaction costs for this particular set of manager-shareholder contracts. The Board of
Directors is a center of Corporate Governance mechanism and a primary means for the shareholders to
exercise control on the top management, which makes it important to be studied (John & Senbet, 1998).
Discussion on the Board of Directors was started by (Fama, 1980) who claimed that there is a conflict of
interest between managers and shareholders. The Board of Directors are formed to resolve the potential
conflicts by doing a monitoring function towards managers in the organization (Fama, 1980). During the
same decade, (Zahra & Pearce II, 1989) made a review over the impacts of Board on a firm’s financial
performance. It was concluded that there is direct and indirect link between Board attributes and the firm’s
performance.
The attributes of the Board, according to (Zahra & Pearce II, 1989) are: composition,
characteristics, structure, and proccess. Composition refers to the share of different type of directors in
one Board, as well as the size of the Board. Characteristics refers to the directors’ characters which will
influence their task performance, such as functional background, working experience, and stock
ownership. Structure refers to the Board organization and labor division. Process refers to the Board
activities, including the decision making. In their study, (Zahra & Pearce II, 1989) proposed an integrative
model which linked these attributes with the Board functions.
170
Proceedings International Conference on Innovation and
Management, Malaysia 2016
Among the main functions of the Board of Directors are monitoring and providing resources (A.
J. Hillman & Dalziel, 2003; Jonsson, 2008; Zahra & Pearce II, 1989). The first function refers to the
responsibility of monitoring managers on behalf of shareholders, while the latter refers to the Board ability
to provide resources to the firm. Resources are interpreted as the strength as well as weakness of the
organization (A. J. Hillman & Dalziel, 2003). What is more, Board of Directors are also responsible for
achieving the target profit and preventing conflict of interests as well as balancing the corporate’s demands
(Maher & Andersson, 1999).
Due to its functions, Board of Directors have given many significant impacts to the firm in
achieving organizational goals. Scholars mentioned the important relationship between board of directors
and firms’ wealth (Abidin, Kamal, & Jusoff, 2009) .
A lot of theories on the Board of Directors has come up from many scholars, even though there
is no ultimate theory that is applied as the main framework in research on this area (Jonsson, 2008). These
theories have different perspectives in which their explanations on Board roles have also become different.
For instance, in the Agency theory, it is stated that Board of Directors have monitoring function (Fama,
1980). While the Stewardship theory believes in the Board of Directors as as a function of independent
decisions of the board and joint decisions with management (Jonsson, 2008).
This has led to different approaches taken by scholars to examine Board of Directors. (Jonsson,
2008) has found two approaches which mostly have been used by researchers : structural bas ed and
process based. The structural based approach takes the composition of Board of Directors as a
measurement function. Related variables moslty found throughout the studies are the board independence,
CEO duality, and board size (Jonsson, 2008). Proccess- based approach
3 The Composition of the Board of Directors In the field of corporate governance, some scholars has taken another perspective in which their
focus is on the composition of the board of directors. this focus has been called the structural-based
perspective of the board (Jonsson, 2008). Composition of the board has also become the usual suspects,
referring to how this has been the classic variables in corporate governance research (Jonsson, 2008).
According to (Li & Harrison, 2008), Board composition reflects the type of ownership of a firm. It also a
mirror of the country’s culture and characteristics. It can be seen that firms with concentrated ownership
in countries like Japan and Sweden incline to focus more on the long-term stakeholder relationships. On
the other hand, the outside directors of Anglo-Saxon countries’ firms do not have substantial capital or
other commercial stake in the company, even though they have more expertise (Li & Harrison, 2008).
Board composition gives various impacts to the firms. Daily & Dalton (1994) stated that board
composition is related with bankruptcy. It also indicates the operation level of the company (Germain ,
Galy, & Lee, 2012). Wealth of the company is also influenced by BoD composition (John & Senbet,
1998). A study by Rosenstein & Wyatt (1997) has shown that in certain level of the insider’s domination,
the stock price will be affected by the announcement of inside directors. When the insiders own less than
5% of the common stock, the announcement will bring a negative effect to the stock price. In contrast, it
will give a positive effect when the insiders have more than 5% of the common stock. Interestingly,
Rosenstein & Wyatt (1997) suggested that an old CEO would appoint inside directors in order to protect
him from pressures which come from the outsiders during his remaining years of leading. It is led by the
negative relationship found in stock price with the age of CEO.
In this study, Board composition refers to the number of independent and non independent as
well as executive and non executive among the directors. Theories differ in viewing the Board
composition. The Agency perspective put the director independence as the pivotal key to function the
control role of the Board (Johnson, Daily, & Elllstrand, 1996).
Scholars’ arguments on the ideal composition of BoD on firms are still going on. Kumar & Singh
(2012) stated that the inside directors have a positive moderating effect on the performance of non -

171
Proceedings International Conference on Innovation and
Management, Malaysia 2016
executive non-independent outside directors, which leads to a better performance of the company. While
non-executive non-independent outsiders have their own interests in which the incentives are parallel with
the greater ownership of inside directors. When the insiders have greater ownership, it boosts the work of
the non-executive non-independent directors. This gives good effects to the firm value (Kumar & Singh,
2012).
3.1 Inside Directors
Inside directors are directors who are also the firm’s employees (Johnson et al., 1996). In the
Stewardship Theory, firms are encouraged to give more authority to their managers. Stewardship theorist
believe that the conflicts between shareholders and managers are unlikely to happen. It is safe to s ay that
this theory believes that there should be more inside directors on the Board (Muth & Donaldson, 1998).
3.2 Outside Directors
The board independency is assumed by the number of outs ide directors. Past literatures show
that most agency theorists believe it is important to have more outside directors. This is because the higher
percentage of outsider, the Board will be more independent (John & Senbet, 1998). Board independency
is necessary to make Board of Directors works effectively (John & Senbet, 1998; Maher & Andersson,
1999; MAtthew, Golden, & Hillman, 2003). This is because when the Directors have any relationship
with the CEO, their control will be less effective (Baysinger & Butler, 1985).
4 Theories of the Board of Directors In this section, the theories of corporate governance are going to be discussed. This will be the
theoretical backgrounds of the Board of Directors.
4.1 Managerial-Hegemony Theory
Managerial Theory perceives Board of Directors as a “rubber stamp” for managerial decision
(Jonsson, 2008). This theory believes that Board members are chosen by the CEO who is also the
chairman, hence the power is held by management. CEO has a higher authority than the Board (Zahra &
Pearce II, 1989).
This theory considers CEO as the center of control and decision making in which their roles are
the roles of the Board emphasized by other theories. Accordingly, a literature rev iew by (Jonsson, 2008)
illustrate some CEO roles: nominating Board members, controlling remuneration, and dual role as CEO
and chairman. Yet, negative impacts are following those kind of authority. The CEO tends to choose
friends and relatives as the Board members, also to dismiss the viable sucessor and candidates (Jonsson,
2008).
Instead of the Board of Directors, CEO plays the role as a key link between Board and managers, where
the information from both sides is passing through. Due to this, CEO has the influence towards the flow
of information (Jonsson, 2008). The Board is only involved in decision making when the firm is facing
crisis. Overall, it can be concluded that in Managerial-Hegemony Theory, the functions of Board of
Directors depend on CEO.
4.2 Resource Dependence Theory
In accordance with (A. J. W. Hillman, 2009), Resource Dependence Theory was proposed by
Jeffrey Pfeffer, Gerald R. Salancik in 1978. It says that an organization is a network, and it cannot work
alone. There is an interdependency among organizations, which becomes a survival constraint. As the
result, a constant success of an organization is uncertain (A. J. W. Hillman, 2009).
In practice, Resource Dependence Theory put the Board of Directors as the resource provider for the firm.
Board’s existence becomes necessary as they will reduce the organization’s dependence towards the
others. According to (A. J. W. Hillman, 2009), these are the roles of Board of Director in a firm:
Information in the form of advice and counsel
Access to channels of information between the firm and environmental contingencies

172
Proceedings International Conference on Innovation and
Management, Malaysia 2016
Preferential access to resources
Legitimacy
Daily & Dalton (1994) took the perspective of Resource Dependence Theory in describing the cause of
bankruptcy. Their result suggested that the Board role as the resource provider have especially become
critical since during the crisis firms tend to get less of resources. Likewise, this resource prov ider role is
linked to firm’s to performance. When the Board exists, it helps to reduce the dependency towards other
organizations and hence the uncertainty becomes lower (A. J. Hillman & Dalziel, 2003; A. J. W. Hillman ,
2009). This way, firm will perform better.
4.3 Agency Theory
The agency theory believes that there should be a separation between ownership and control
(Fama & Jensen, 1983). The firm’s goal is to maximize shareholders’ value. Principal-agent refers to a
condition where the shareholders (the agents) entrust the task of running the company to managers (the
principals) who are in effective control of the company (L. Donaldson & Davis, 1991; Eisenhardt, 1989;
Warsi & Nisa, 2008). Hence, the directors are outsiders . Compared to the insiders, the outside directors
tend to be more independent and neutral in monitoring the company (Fama, 1980). Warsi & Nisa (2008)
depicted that the main feature of this model is the separation of control from ownership arising from
widely dispersed equity ownership among large number of institutional and innumerable small
shareholders. Consequently, outsiders are needed to run the monitoring function in the company.
According to Eisenhardt (1989), this theory has been developed into two approaches: principal-
agent and positivist. The positivist agency theory is said to describe the govern ance mechanism for conflict
resolution between agent and principal (Eisenhardt, 1989). This sub theory offered two propositions :
i. When the contract between the principal and agent is outcome based, the agent is more
likely to behave in the interests of the principal.
ii. When the principal has information to verify agent behavior, the agent is more likely to
behave in the interests of the principal.
Maher & Andersson (1999) elaborated that this system encourages open information and innovation. It
also enhances better risk diversification possibilities to the investors. However, problems caused by the
principal-agent model sometimes cannot be avoided. Pacces (2012) strongly stated that agency problem
is the core problem of corporate governance. Issues found in the agency problem is mostly about the
conflict of interest between shareholders and manager due to various reasons (John & Senbet, 1998; Maher
& Andersson, 1999; Pacces, 2012). The agency problem as explained by Maher & Andersson (1999) is
that the shareholders are less motivated to control the board because of the less benefits gained. This is
due to the full risk that have to be born by each shareholders, while the benefits are divided equally
between them. Davies (2000) argued that the problems arise are between shareholders as a class and the
mangement of the company that in any situation, it would be difficult for the shareholders to control the
company’s management. (Abidin et al., 2009) stated that under the separation between shareholder
(ownership) and managers (control), the managers will try to achieve their own goals using shareholder’s
expenses. Additionally, the managers might increase their compensation if they want.
Scholars have claimed some factors which trigger the agency problem: information assymmetry
between principal and agents, bounded rationality between principal and agents, conflict of interests
between principal and agents, and the principal cannot determine whether the agent behaves properly
(Eisenhardt, 1989; Jonsson, 2008; Maher & Andersson, 1999). The Agency theory argues that Board of
Directors are the solution of agency problem (L. Donaldson & Davis, 1991; Fama, 1980).
According to Agency Theory, the main function of Board of Directors as explained by (Fama & Jensen,
1983) is to be the control system of organizations, in which decision agents do not bear a major share of
the wealth effects of their decision. The monitoring function is very important, especially in the outsider
system (Guest, 2008; John & Senbet, 1998; Maher & Andersson, 1999). The directors, who are not
shareholders (outsider managers) control the key decisions of the company. Hence the board of directors

173
Proceedings International Conference on Innovation and
Management, Malaysia 2016
is to do the monitoring function on behalf of shareholders (A. J. Hillman & Dalziel, 2003; John & Senbet,
1998). Some countries like Germany has put this monitoring function as a major role of the board
(Gantenbein & Volonté, 2012).
This monitoring function is also specifically emphasized by (Agrawal & Knoeber, 1996) who
proposed seven mechanisms to control the agency problem. The mechanisms are differentiated by the
source of monitoring, in which three of them are related to the board of directors:
1. Capital market to monitor the use of debt
2. Prospective employers to monitor the market managers
3. Prospective acquirers to moniter the market for corporate control
4. Inside owners to control insider shareholdings
5. Institutional owners to control institutional shareholdings
6. Large outside owners to control the block holding
7. The board members to control the outsiders on the board
In this theory, function of the board is to be a communication bridge between shareholders and managers
(Davis, Schoorman, & Donaldson, 1997). Other than that, Board of Directors is expected to be a complete
information system in which the information will be used to assess the behavior of the top executives
(Eisenhardt, 1989). The executives is the compensated according to the assessment. In accordance with
(Eisenhardt, 1989), the executives’ actions will more likely be conferred to the shareholders’ interests
when they are being monitored.
4.4 Stakeholder Theory
Under Stakeholder Theory perspective, the Board’s responsibility is not only to the shareholders
but also towards all the firm’s stakeholder. This theory argues all related entities should be under the
Board’s consideration in making decisions (T. Donaldson & Preston, 1995).
In accordance with T. Donaldson & Preston (1995), the main task of Board of Directors is to fulfill the
stakeholder interests. The Board should focus on the interaction between stakeholder,Board, and
management in order to achieve organization goals (Jonsson, 2008).
Consequently, Jonsson (2008) explained that the concept causes two implications towards the Board
functions:
Not only they have to monitor the managers activities, but also the Board needs to be
the example for ethical as well as environmental standards which are not directly based
on the shareholder interests.
Board needs to be a bridge between managers and shareholder interest, not only give a
one-sided support towards either shareholder or managers.
This theory is relatively different with other theories since the focus is not only on the shareholder, but
also the organization environment.
4.5 Stewardship Theory
Conferring to Davis et al., (1997), this theory assumed that manager is a “steward” in which his
behavior is pro organizational and collectivistic such that the utility is higher than individualistic behavior.
Stewardship theory was derived from the perspective of human psychology and sociology, it is used to
examine the situation when the executives act according to the principals’ interest.
A steward in a corporate means that when there is choice between self-serving interest and pro-
organizational behavior, this person would choose the one that is inherent with the organization’s goals.
The steward will not depart from the interests of their organization. In the case of conflict between
principal’s interests and theirs, they would go for the corporation’s choice. By doing this, the steward gain
higher utility (Davis et al., 1997).
Scholars said that stewardship theory is a counter theory of the agency theory (L. Donaldson &
Davis, 1991; Jonsson, 2008; Muth & Donaldson, 1998). It offers an opposing prediction about the
structure of an effective board (Muth & Donaldson, 1998).
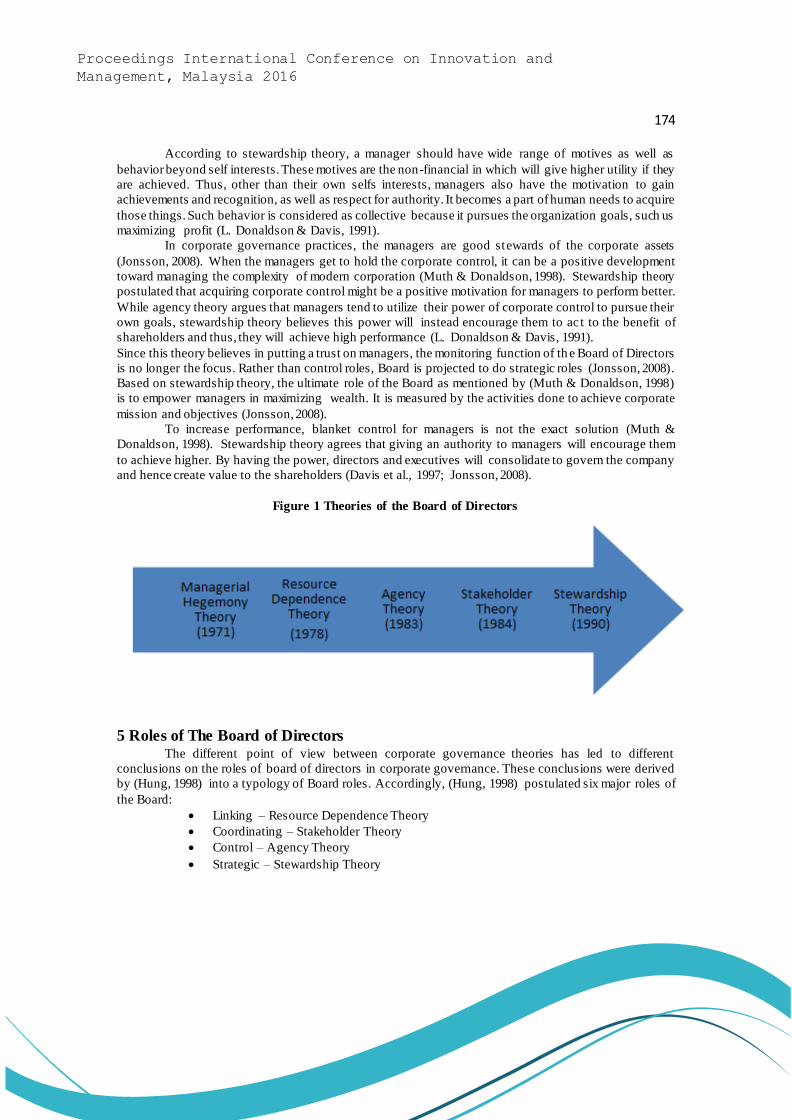
174
Proceedings International Conference on Innovation and
Management, Malaysia 2016
According to stewardship theory, a manager should have wide range of motives as well as
behavior beyond self interests. These motives are the non-financial in which will give higher utility if they
are achieved. Thus, other than their own selfs interests, managers also have the motivation to gain
achievements and recognition, as well as respect for authority. It becomes a part of human needs to acquire
those things. Such behavior is considered as collective because it pursues the organization goals, such us
maximizing profit (L. Donaldson & Davis, 1991).
In corporate governance practices, the managers are good stewards of the corporate assets
(Jonsson, 2008). When the managers get to hold the corporate control, it can be a positive development
toward managing the complexity of modern corporation (Muth & Donaldson, 1998). Stewardship theory
postulated that acquiring corporate control might be a positive motivation for managers to perform better.
While agency theory argues that managers tend to utilize their power of corporate control to pursue their
own goals, stewardship theory believes this power will instead encourage them to ac t to the benefit of
shareholders and thus, they will achieve high performance (L. Donaldson & Davis, 1991).
Since this theory believes in putting a trust on managers, the monitoring function of th e Board of Directors
is no longer the focus. Rather than control roles, Board is projected to do strategic roles (Jonsson, 2008).
Based on stewardship theory, the ultimate role of the Board as mentioned by (Muth & Donaldson, 1998)
is to empower managers in maximizing wealth. It is measured by the activities done to achieve corporate
mission and objectives (Jonsson, 2008).
To increase performance, blanket control for managers is not the exact solution (Muth &
Donaldson, 1998). Stewardship theory agrees that giving an authority to managers will encourage them
to achieve higher. By having the power, directors and executives will consolidate to govern the company
and hence create value to the shareholders (Davis et al., 1997; Jonsson, 2008).
Figure 1 Theories of the Board of Directors
5 Roles of The Board of Directors
The different point of view between corporate governance theories has led to different
conclusions on the roles of board of directors in corporate governance. These conclusions were derived
by (Hung, 1998) into a typology of Board roles. Accordingly, (Hung, 1998) postulated six major roles of
the Board:
Linking – Resource Dependence Theory
Coordinating – Stakeholder Theory
Control – Agency Theory
Strategic – Stewardship Theory
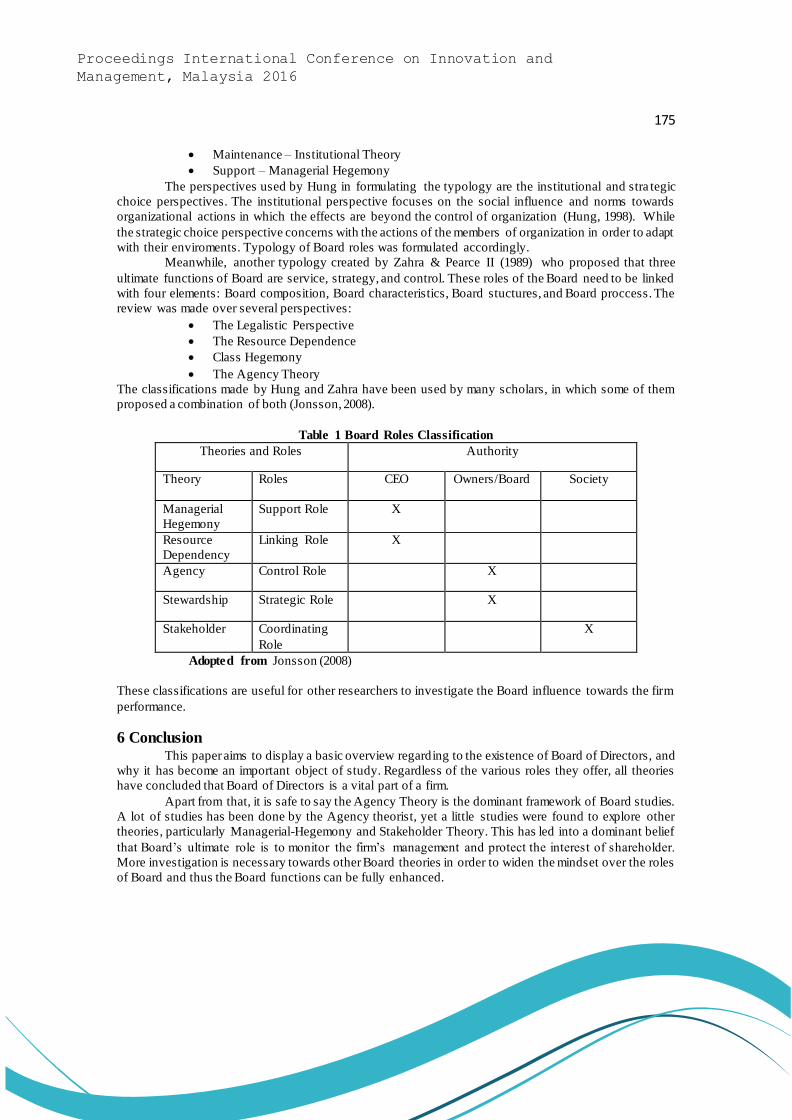
175
Proceedings International Conference on Innovation and
Management, Malaysia 2016
Maintenance – Institutional Theory
Support – Managerial Hegemony
The perspectives used by Hung in formulating the typology are the institutional and stra tegic
choice perspectives. The institutional perspective focuses on the social influence and norms towards
organizational actions in which the effects are beyond the control of organization (Hung, 1998). While
the strategic choice perspective concerns with the actions of the members of organization in order to adapt
with their enviroments. Typology of Board roles was formulated accordingly.
Meanwhile, another typology created by Zahra & Pearce II (1989) who proposed that three
ultimate functions of Board are service, strategy, and control. These roles of the Board need to be linked
with four elements: Board composition, Board characteristics, Board stuctures, and Board proccess. The
review was made over several perspectives:
The Legalistic Perspective
The Resource Dependence
Class Hegemony
The Agency Theory
The classifications made by Hung and Zahra have been used by many scholars, in which some of them
proposed a combination of both (Jonsson, 2008).
Table 1 Board Roles Classification
Theories and Roles Authority
Theory Roles CEO Owners/Board Society
Managerial
Hegemony
Support Role X
Resource
Dependency
Linking Role X
Agency Control Role X
Stewardship Strategic Role X
Stakeholder Coordinating
Role
X
Adopted from Jonsson (2008)
These classifications are useful for other researchers to investigate the Board influence towards the firm
performance.
6 Conclusion This paper aims to display a basic overview regarding to the existence of Board of Directors, and
why it has become an important object of study. Regardless of the various roles they offer, all theories
have concluded that Board of Directors is a vital part of a firm.
Apart from that, it is safe to say the Agency Theory is the dominant framework of Board studies.
A lot of studies has been done by the Agency theorist, yet a little studies were found to explore other
theories, particularly Managerial-Hegemony and Stakeholder Theory. This has led into a dominant belief
that Board’s ultimate role is to monitor the firm’s management and protect the interest of shareholder.
More investigation is necessary towards other Board theories in order to widen the mindset over the roles
of Board and thus the Board functions can be fully enhanced.

176
Proceedings International Conference on Innovation and
Management, Malaysia 2016
References [1] Abidin, Z. Z., Kamal, N., & Jusoff, K. (2009). Board Structure and Corporate Performance in
Malaysia. International Journal of Economic and Finance , 1(1), 150–164. Retrieved from
http://www.sciencedirect.com/science/article/pii/S0929119908000242\nhttp://search.ebscohost.com/
login.aspx?direct=true&profile=ehost&scope=site&authtype=crawler&jrnl=00309729&AN=766027
53&h=lumiUSOYiyiExKlWW9ut5BMKiJ4SBqrhtzgfQgzwt7BjJmSYi4nGiwppMqjyMi/Xty
[2]Agrawal, A., & Knoeber, C. R. (1996). Firm Performance and Mechanisms to Control Agency
Problems between Managers and Shareholders. Journal of Financial and Quantitative Analysis,
31(3).
[3]Baysinger, B. D., & Butler, H. (1985). Corporate governance and the board of directors: Performance
effects of changes in board composition. Journal of Law, Economics, & Organization , 1(1), 101–
124.
[4]Daily, C. M., & Dalton, D. R. (1994). Bankruptcy and Corporate Governance: The Impact of Board
Composition and Structure. Academy of Management Journal, 37(6), 1603–1617.
http://doi.org/10.2307/256801
[5]Davies, P. L. (2000). The Board of Directors: Composition, Structure, Duties and PowersA
Comparative Outlook of Current Trends. Paul L Davies Cassel Professor of Commercial Law
London School of Economics and Political Science Company Law Reform in OECD Countries A
Comparative Outlook of Current Trends, (December), 1–29.
[6]Davis, J. H., Schoorman, D. F., & Donaldson, L. (1997). Toward a Stewardship Theory of
Management Author ( s ): James H . Davis , F . David Schoorman and Lex Donaldson Source : The
Academy of Management Review , Vol . 22 , No . 1 ( Jan ., 1997 ), pp . 20-47 Published by :
Academy of Management Stable URL : htt. Academy of Management Review, 22(1), 20–47.
[7]Donaldson, L., & Davis, J. H. (1991). Stewardship Theory or Agency Theory: CEO Governance and
Shareholder Returns. Australian Journal of Management , 16(1), 49–64.
[8]Donaldson, T., & Preston, L. E. E. E. (1995). The Stakeholder Theory of the Corporation : Concepts ,
Evidence , and Implications Author ( s ): Thomas Donaldson and Lee E . Preston Source : The
Academy of Management Review , Vol . 20 , No . 1 ( Jan ., 1995 ), pp . 65-91 Published by :
Academy of Manag. The Academy of Management Review, 20(1), 65–91.
[9]Eisenhardt, K. M. (1989). Agency Theory : An Assessment and Review. Academy of Management
Review, 14(1), 57–74.
[10]Fama, E. F. (1980). Agency Problems and the Theory of the Firm Agency Problems and the Theory
of the Firm. The Journal of Political Economy, 88(2), 288–307. http://doi.org/10.1086/260866
[11]Fama, E. F., & Jensen, M. C. (1983). Separation of Ownership and Control SEPARATION OF
OWNERSHIP AND CONTROL *. jOURNAL of Laws and Economics, 26(2), 301–325.
http://doi.org/10.1086/467037
[12]Gantenbein, P. a., & Volonté, C. (2012). Does Culture Affect Corporate Governance? WWZ
Discussion Paper 2012/04. Retrieved from http://www.ssrn.com/abstract=1908114
[13]Germain, L., Galy, N., & Lee, W. (2012). The Determinants of Corporate Board Size and
Independence : Evidence from Malaysia. In 29th International Conference of The French Finance
Association (AFFI) (pp. 1–36).
[14]Guest, P. M. (2008). The determinants of board size and composition: Evidence from the UK.
Journal of Corporate Finance, 14(1), 51–72. http://doi.org/10.1016/j.jcorpfin.2008.01.002
[15]Hillman, A. J., & Dalziel, T. (2003). Boards of Directors and Firm Performance: Integrating Agency
and Resource Dependence Perspectives. Academy of Management Review, 28(3), 383–396.
http://doi.org/10.5465/AMR.2003.10196729
[16]Hillman, A. J. W. (2009). Resource Dependence Theory: A Review. Journal of Management, 35(6),

177
Proceedings International Conference on Innovation and
Management, Malaysia 2016
1404–1427. http://doi.org/10.1177/0149206309343469
[17]Hung, H. (1998). A typology of the theories of the roles of governing boards. Corporate
Governance: An International Review, 6(2), 101–111. http://doi.org/10.1111/1467-8683.00089
[18]John, K., & Senbet, L. W. (1998). Corporate governance and board effectiveness. Journal of
Banking & Finance, 22(4), 371–403. http://doi.org/10.1016/S0378-4266(98)00005-3
[19]Johnson, J. L., Daily, C. M., & Elllstrand, A. E. (1996). Boards of Directors: A Review and
Research Agenda. Journal of Management, 22(3), 409–438.
http://doi.org/10.1177/014920639602200303
[20]Jonsson, E. I. (2008). THE ROLE OF BOARDS OF DIRECTORS AND THE RELATIONSHIP
WITH ORGANISATIONAL PERFORMANCE : AN EMPIRICAL INVESTIGATION INTO SMALL
AND MEDIUM SIZED ENTERPRISES IN ICELAND. Brunel University.
[21]Kumar, N., & Singh, J. P. (2012). Outside Directors, Corporate Governance and Firm Performance:
Empirical Evidence from India. Asian Journal of Finance & Accounting , 4(2), 39–55.
http://doi.org/10.5296/ajfa.v4i2.1737
[22]Li, J., & Harrison, J. R. (2008). National culture and the composition and leadership structure of
boards of directors. Corporate Governance, 16(5), 375–385. http://doi.org/10.1111/j.1467-
8683.2008.00697.x
[23]Maher, M., & Andersson, T. (1999). CORPORATE GOVERNANCE : EFFECTS ON FIRM
PERFORMANCE AND ECONOMIC GROWTH. In Conference on Convergence and Divesity in
Corporate Governance Regimes and Capital Markets. Eindhoven.
[24]MAtthew, L., Golden, B., & Hillman, A. J. (2003). Board Composition from Adoloscence to
Maturity: A Multitheoretic View. Academy of Management Journal, 28(3), 416–431.
http://doi.org/10.2307/254663
[25]Muth, M. M., & Donaldson, L. (1998). Stewardship Theory and Board Structure: a contingency
approach. Corporate Governance: An International Review , 6(1), 5–28. http://doi.org/10.1111/1467-
8683.00076
[26]Pacces, A. M. (2012). Rethinking Corporate Governance The Law and Economics of Control
Powers. New York: Routledge.
[27]Rosenstein, S., & Wyatt, J. G. (1997). Inside directors, board effectiveness, and shareholder wealth.
Journal of Financial Economics, 44(2), 229–250. http://doi.org/10.1016/S0304-405X(97)00004-4
[28]Warsi, K. A., & Nisa, S. (2008). The Divergent Corporate Governance Standards and the Need for
Universally Acceptable Governance Practices. Asian Social Science, 4(9), 128–136.
[29]Zahra, S. A., & Pearce II, J. A. (1989). Boards of Directors and Corporate Financial Performance: A
Review and Integrative Model. Journal of Management, 15(2), 291–334.
http://doi.org/10.1177/014920638901500208
178
Proceedings International Conference on Innovation and
Management, Malaysia 2016
Analysis of Some Factors Affecting the Return Credit on SMEs
Center Members in Semarang Regency
Tubagus Fahmi, Anindya Ardiansari
Department of Management, Semarang State University
(E-mail: [email protected], [email protected])
Abstract The aims of this research was to look the influence of some factors that may affected to the
return of credit made by SME center members in Semarang Regency. Members of SMEs centers required
greater capital to expand its business but the number and owned capital limited so they made loans to the
financial institutions. However, there were some factors that influence the rate of loan repayment namely
level of education, number of dependents, business experience, income, amount of loan and repayment
period. This research was an event study conducted of 65 SMEs that belong to members of SME Center
in Semarang regency. The data used was primary data obtained from members of SME Center in
Semarang regency, then test conducted with logistic test. Based on the result by regression analysis
statistical test and logistic regression analysis, it could be concluded that the variable income, loan size,
and repayment period affected to the delinquent loan payments. While the variables education level,
number of dependents, and business experience did not effect on the arrear of loan payments.
Keywords SMEs, Return Credit, loans
1 Introduction
Indonesian economic system has improved significally, one through Small Medium Enterprises
(SMEs) that have an important role in improving the economy of Indonesia. In addition, as an alternative
new jobs, SMEs also has a role in stimulating economic growth after the financial crisis in 1998. At the
time of the big companies have difficulty in developing their business. Until now, SMEs have contributed
a great deal to the local income and national income of Indonesia (Central Bureau of Statistics, 2010).
SME is a form of small business community conducted by human initiative. Enterprises with a very
limited scale include various business sectors, including agriculture, industry, trade, services, and so on.
So it can be said that the advancement of SMEs contribute to the growth of various sectors. Therefore,
this business unit should receive special attention in the development and progress since its role is very
important for the economy (Central Bureau of Statistics, 2010). The development and progress of SMEs
is largely determined by the owners of SMEs, but the support of external parties remain an important role,
because of their limited capacity and the ability of other factors that influence to existency and continuity.
The results of empirical research by Demirbag et la., (2006) in Ardiansari, et al (2014: 1) concluded that
the success of small and medium enterprises have a direct impact on economic development in both the
developed and developing countries. According to data from the central bureau and the Ministry of
Cooperatives and Small Medium Micro Enterprises in 2010 showed that SMEs remain be business actor
units or 99.9% of businesses in Indonesia. A growing number of SMEs are able to absorb 97.04% of the
available productive workers. According to Ardiansari, et al (2014: 29) in her study stated 90.5% of SMEs
Semarang regency use their own capital at the beginning of establishment of their company. However,
there are still 9.5% of the SME did not release its own funds as capital. This means that from the beginning
the company was established, these SMEs used loan capital.The research also obtained the result that
100% of SMEs Semarang regency used the loan capital as the sample in research.Through the results of
interviews conducted, SMEs in semarang regency require a greater capital to expand its business. While
the number and owned limited, so they made loans to financial institutions. SME Center is one group of
SMEs in Semarang regency. it conducted six years ago and constantly increasing of group members every
year. Until 2016, the SME Center has 186 members scattered in various districts in Semarang. The

179
Proceedings International Conference on Innovation and
Management, Malaysia 2016
industrial sector members of the SME Center, namely footwear, home furnishings, handicrafts, building
materials, food, convection, beverages, printing herbs, fertilizers, services, handbags and wallets,
processing of agricultural products, plastics, and so on. One of the financial institution that able to help
SME is bank. It can support productivity process of its activ ity. Capital assistance in credit expected to
be used as best as possible to increase the productivity of SMEs. The increasing of productivity reflects
that the aid loans can be utilized for productive purposes as good as possible. One of indicator to me asure
the growth of productivity is the higher of total revenue of SME Producen. It also can determine of how
big the role and contribution of credit to SMEs revenue. After financing the program goes well, the
problem then arises in the financing program. The problem is meant credit repayment carried out by SMEs
are not always smooth. Many cases of delays in repayment of credit such as arrears of credit installment
payments. This is contradict to the bank orientation or financial institution, which is orien ted to obtain
profits from the money loaned.
According to Pradita (2013: 6) there are some factors that affect the rate of return credit such as
education level, number of dependents, business experience, income, loan amount and repayment period.
According to Thoha (2000) in Arinta (2011: 5), higher education is a factor expected to affect the level of
fluency loan installment since these factors can influence the characteristics of the debtor. The education
level can influence the maturity mindset and perceptions. The higher education of customers, the wider
horizons of thought and the greater ability to do business are the aspect that can determine they can manage
the business. Kashmir (2014: 101) said the level of education will affect the maturity mindset and
perceptions in influencing the characteristics of a debtor. The low of education level will result in
absorption of SMEs to information and markets slowed, so that the efforts that lead to increased
production and incomes will move slowly. Conversely, the higher education level is easier to accept and
develop knowledge and technology, thereby increasing productivity, which will increase revenue, and
installment credit will be smooth. Research conducted by Dwi Yanti Arinta (2011), Anggri Nastiti (2003) ,
and Ikka Widayanthi Luh (2010), concluded that the level of education had no significant effect on the
smooth return of credit. Meanwhile, according to Wahyu Bima Pradita Dandy (2013), concluded that the
level of education a significant and negative effect on the smooth return of credit.
The influence of dependents numbers can be viewed from several perspectives. One of them is
an opinion in the research Grootaert in Pradita (2013: 9), which would have revealed that each additional
head of a household would increase per capita household expenditure by 1.5 percent. The number of each
family members will also increase the burden of life that must be met due to greater consumer spending.
So the higer number of dependents in the family, the greater spending to comply the needs of families,
so most of revenue will be allocated to these needs not to comply the obligation to pay loan installments.
Research conducted by Dwi Yanti Arinta (2011) concluded that the number of family dependents has no
significant effect on the smooth return of credit. While Anggri Nastiti (2003), Wahyu Bima Pradita Dandy
(2013), and Ikka Widayanthi Luh (2010), concluded that the number of family dependents has a positive
significant effect on the smooth return of credit. According to Pradita (2013: 9), Old business is closely
related to the experience that can support business activities. The longer of business experience will affect
a person's ability to manage a business and avoid the risk of causing the failure. Business experience will
affect the skills of SME owners in carrying out some tasks also makes the work more efficient. With
business experience who already owned one can detect some errors, understand mistakes, and seek the
causes of these errors.Therefore, the debtor's business long has a positive effect on the smooth repayment
of credit due to the longer business experience can enhance their understanding and ability to manage the
developing of their business. The success of SMEs owned will provide a source of living expense s and
provide opportunities in credit repayment capability seamlessly. Research conducted by Anggri Nastiti
(2003), Luh Ikka Widayanthi (2010), concluded that the business experience has no significant effect on
the level of fluency loan repayment, while research conducted by Dwi Yanti Arinta (2011) concluded that
the business experience has a significant and positive impact on the the smooth return of credit. According
180
Proceedings International Conference on Innovation and
Management, Malaysia 2016
to Pradita (2013: 9), business income is the average income of borrowers per month and can also be added
from join income earned from their business income as measured in rupiah. The higher of Operating
revenues will boost people to be more active in developing their business. Operating revenues in this study
is calculated monthly. Research conducted by Wahyu Bima Pradita Dandy (2013) concluded revenues did
not significantly affect the smooth repayment of credit. While the research conducted by Dwi Yanti Arinta
(2011), Anggri Nastiti (2003), Ikka Widayanthi Luh (2010) concluded that the variab le revenues had a
significant and positive impact on the smooth return of credit.
According to Pradita (2013: 9), the amount of loans granted by the bank to the maximum limit
depends on the number of requests and the payment ability of a debtor assessment. The greater number of
bank loans it can cause greater expense of debtor in repayment. Therefore, the high number of granting
loan cause a risk of delays in loan repayment by the debtor. Research conducted by Wajhyu Bima Pradita
Dandy (2013), Ikka Widayanthi Luh (2010) concluded that the amount of loan has no significant effect.
While the research conducted by Dwi Yanti Arinta (2011), Anggri Nastiti (2003) concluded that the
variable amount of loan has significant and positive impact on the smooth return of credit. The repayment
period is a time to maturity of a debtor to pay the entire value of loans including interest payments on the
loan. The loan period may reflect the size of the installments to be paid by debtors to the bank every
month. According to Pradita (2013: 9), the longer of loan period can effect the smooth of loan installment
every month. On the other hand, the longer in term of this loan repayment period will reduce the level of
cash flow and liquidity of banks so that the banks will carry out a full consideration in determining the
payback period. Research conducted by Wahyu Bima Pradita Dandy (2013), Dwi Yanti Arinta (2011)
concluded it had no significant effect on the smooth return of credit. While Ikka Widayanthi Luh (2010)
concluded that the payback period variable had significant and negative effect on the smooth return of
credit.
2 Data and Methodology The object of this research is SMEs in Semarang regency by using quantitative research.
Collecting data in this study aimed to obtain materials that are relevant and accurate. While the data used
in this study are primary data and secondary data. The population and the sample must be clearly defined
since the results of statistical analysis is highly dependent on the scope and characteristics possessed by
the population and the sample. According to Ferdinand (2011: 215), a population or universe is a
combination of all the event elements such as things or people who have similar characteristics that
became the center of attention of the researchers because it is seen as a natural universe. The population
in this study is a group of SMEs Semarang regency, namely the SME Center Semarang regency.
According to Sanusi (2011: 87), the sample is defined as a part of the population. The study, us ing a
sample can be quickly resolved because the sample method is only conducted research on the majority of
objects. Therefore, Data collection, data processing can save time.
The method used in this research is the probability sampling. According to Sug iyono (2009: 60),
probability sampling is a sampling techniques that provides equal opportunity for each element of the
population to be elected as members of the sample. The number of samples obtained through Slovin
formula as follows:
𝒏 =𝑵
(𝑵. 𝒆𝟐) + 𝟏
181
Proceedings International Conference on Innovation and
Management, Malaysia 2016
Where :
n = number of samples (sample size)
N = the number of population
e = error rate that can still be tolerated (10%)
Total population (N) in this study was 186 and an error rate of 10% so the result n is 65.034.
Because behind the comma is less than 5 then rounded to 65 respondents. Data collection methods used
in this study was a questionnaire method. According to Ferdinand (2011: 30), the method questionnaire
is a list of questions which covers all statements and questions that will be used to obtain the data, whether
made by telephone, mail, or face to face. A list of written questions which will be filled by respondents
consisted of questions about some of the things on credit undertaken by SMEs. Analysis of the data used
in this research is Descriptive Statistics. According to Sanusi (2011: 76), descriptive analysis is shown in
the analysis of development and growth of a state and only provide a description of a particular situation
by describing the nature of the research object. Hypothesis Testing according to Ghozali (2009: 261) in
this study using logit regression as the dependent variable in a dummy variable (non -metric) and the
independent variable is a combination of metric and non-metric, and does not require the assumption of
normality data on the independent variables. So this regression is used if multivariate normal distribution
assumption is not comply. Equation regression model may help researchers as measurenment to address
the conditions that lead to non-payment of loans made. Data analysis was carried out by assessing overall
model fit.
The equation logit or logistic regression model used in this study are (Ghozali, 2009: 264):
𝐿𝑛 [0𝑑𝑑𝑠 (𝑆| X1,X2,...Xk)] = b0b1 X1 + b2 X2 + b3 X3 + b4 X4 + b5 X5 + b6 X6+ e
or :
𝐿𝑛𝑌
1−𝑌= b0 + b1 X1 + b2 X2 + b3 X3 + b4 X4 + b5 X5 + b6 X6 + e
where:
0𝑑𝑑𝑠 (𝑆| X1,X2,...X6) = 𝑌
1−𝑌
Information :
Y = Category 1 refers to SMEs with loan payments on time, a category 0 is an SME with ever
experienced payment arrears in paying credit.
b0 = Constant
b1-b6 = Coefficient
X1 = Education level
X2 = the number of dependents
X3 = business experience
X4 = revenues
X5 = loan amount
X6 = repayment period
e = Factor Disruptors

182
Proceedings International Conference on Innovation and
Management, Malaysia 2016
This is the Steps in logit regression analysis according to Ghozali (2009: 268):
a. Assessing Model Fit
The output data from logistic regression was then analyzed using assessment model fit. The first step is
to assess the overall fit model to the data. Hypotheses to assess model fit is:
H0: hypothesized model fit to the data
Ha: Model hypothesized does not fit with the data
From this hypothesis it is clear that we would not reject the null hypothesis that the model fit to
the data, so that the statistics used, based on the L Likelihood. Likelihood function of the model is the
probability that the hypothesized model that describes the input data. To test hypothesis null and
alternative hypotheses, L transformed into -2LogL. Statistics -2LogL called the likelihood ratio statistics
c², where c² distribution with a degree of freedom n-q. Q is the number of parameters in the model. SPSS
output provides two grades -2Log L namely for one model that only enter one cons tant is equal to
33.271055 and has c² distribution with df 6 (65-1), although it does not appear in the SPSS output value
of 33 271 -2 Log L, significant at alpha 5% and the null hypothesis rejected, which means that the model
only with constants and just do not fit with the data.
b. Cox and Snell's R Square and Negelkerke's R Square
Cox and Snell's R Square is a measure that seeks to imitate the size of R2 on a multiple regression
based on likelihood estimation techniques with a maximum value of less than 1 so it is difficult to
interpret. Nagelkerke's R-square is a modification of the coefficient Cox and Snell to ensure that the value
varies from 0 to 1. This is done by dividing the Cox and Snell's R² with maximum value. R² Nagelkerke's
value can be interpreted as R² in multiple regression. Judging from SPSS output value of Cox and Snell's
R ² of 0591 and Nagelkerke's R² value is 0.789, which means the variability of the dependent variable that
can be explained by the variability of the independent variable at 78.9%.
c. Hosmer and Lemeshow's Goodness of Fit Test
Hosmer and Lemeshow's Goodness of Fit Test to test the null hypothesis that empirical data fit
the models. If the value of Statistics Hosmer and Lemeshow's Goodness of Fit Test is equal to or less
than 0.05, then the null hypothesis is rejected, which means there are significant differences between the
models with observations that the value of Goodness fit model is not good because the model can not
predict the value of observations. If the value of Statistics Hosmer and Lemeshow's Goodness of Fit is
greater than 0.05, then the null hypothesis can be rejected and mean model is able to predict the value of
observation, or it can be said the model is acceptable because it fits with the data observ ations. SPSS
output display shows that the value of statistics Hosmer and Lemeshow's Goodness of Fit amounted to
10.4492 0.2349 with a significance probability value above 0:05, so it can be concluded that the model is
acceptable.
d. Classification table
2x2 classification table calculates the estimated value of the correct and incorrect. In the column
are two predicted value of the dependent variable and in this case are not in arrears (0) and arrears (1),
while on the line shows actual observed values of the dependent variable is not in arrears (0) and arrears
(1). In a perfect model, all cases will be on the diagonal with forecasting accuracy rate of 100%. If the
logistic model has homoscedasticity, the percentage of correct will be the same for both ro ws.

183
Proceedings International Conference on Innovation and
Management, Malaysia 2016
e. Parameter Estimation and its interpretation
To assess the results of our regression analysis using the equation models that include all the
components of the independent variables that can be seen from the Variable in the Equation. Logistic
regression can be stated as follows:
𝐿𝑛𝑌
1−𝑌= b0 + b1X1 + b2X2 + b3X3 + b4X4 + b5X5 + b6X6 + e
Wald statistic to test the significance of logistic regression coefficient of each predictor, with the
formulation of statistical hypothesis as follows:
H0: r = 0
Ha: r ≠ 0
Where r = 1, 2, 3, ..., n
criteria:
If Sig. > Α, then H0 accepted
If Sig. <Α, then H0
f. Hypothesis testing
Hypothesis testing of this analysis is to determine the effect of independent variables on the
dependent variable. Hypothesis testing is done by comparing the value of probability (sig). If the numbers
significantly smaller than 0.05, then the regression coefficient is significant at the 5% level would mean
H0 rejected and Ha accepted, which means that the independent variables s ignificantly influence the
dependent variable.Vice versa, if the number of significance greater than 0.05 it means that H0 is accepted
and Ha rejected, which means that the independent variables did not significantly affect the dependent
variable.
3 Results 3.1 Logistic Regression Analysis Based on the analysis by SPSS 16 program for Windows obtained multiple regression results as
summarized in the following table:
Table 1. Regression Analysis
Variable in the Equation
B S.E. Wald df Sig.
Step 1 X1 -0.822 0.782 1.103 1 0.294
X2 0.167 0.614 0.074 1 0.785
X3 1.643 0.856 3.681 1 0.055
X4 -2.153 0.875 6.052 1 0.014
X5 1.897 0.793 5.719 1 0.017
X6 1.602 0.73 4.808 1 0.028
Constant -6.843 5.556 1.517 1 0.218
a. Variable(s) entered on step 1: X1, X2, X3, X4, X5, X6.
3.1.1. Regression Equations
According to the table one obtained the multiple regression equation as follows:
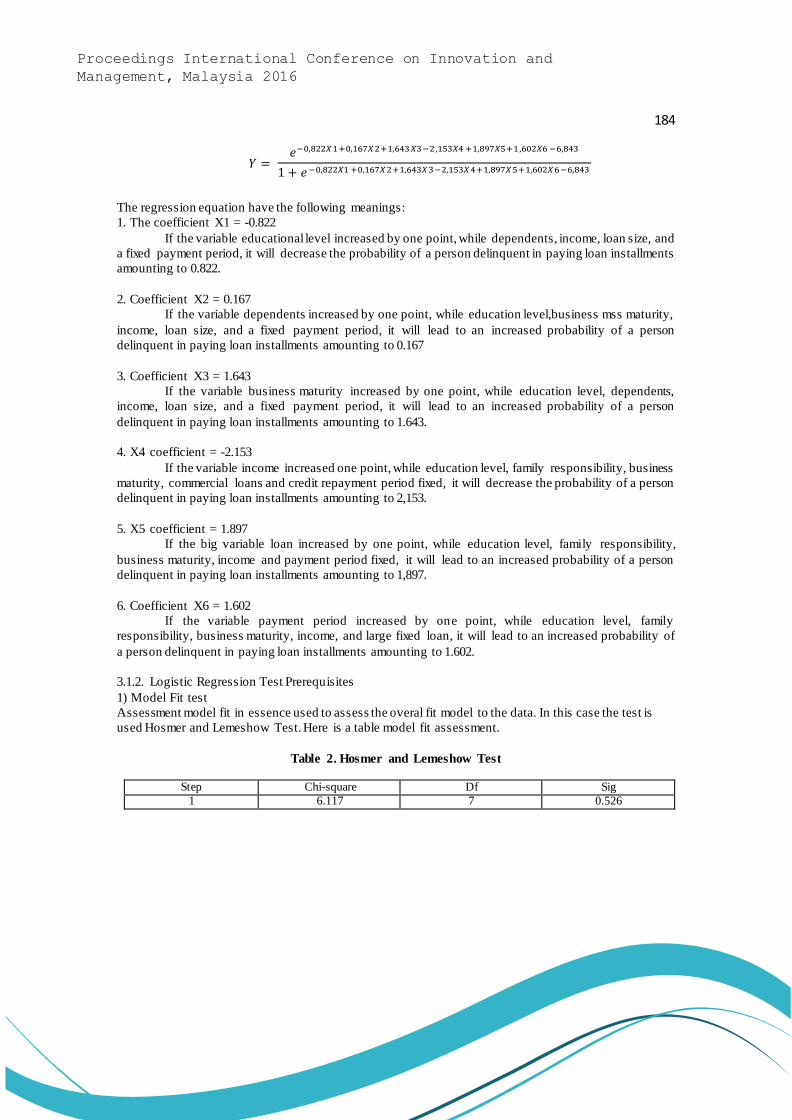
184
Proceedings International Conference on Innovation and
Management, Malaysia 2016
𝑌 = 𝑒−0,822𝑋1+0,167𝑋2+1,643𝑋3−2,153𝑋4 +1,897𝑋5+1,602𝑋6 −6,843
1 + 𝑒 −0,822𝑋1 +0,167𝑋2+1,643𝑋3−2,153𝑋4+1,897𝑋5+1,602𝑋6−6,843
The regression equation have the following meanings:
1. The coefficient X1 = -0.822
If the variable educational level increased by one point, while dependents, income, loan size, and
a fixed payment period, it will decrease the probability of a person delinquent in paying loan installments
amounting to 0.822.
2. Coefficient X2 = 0.167
If the variable dependents increased by one point, while education level,business mss maturity,
income, loan size, and a fixed payment period, it will lead to an increased probability of a person
delinquent in paying loan installments amounting to 0.167
3. Coefficient X3 = 1.643
If the variable business maturity increased by one point, while education level, dependents,
income, loan size, and a fixed payment period, it will lead to an increased probability of a person
delinquent in paying loan installments amounting to 1.643.
4. X4 coefficient = -2.153
If the variable income increased one point, while education level, family responsibility, business
maturity, commercial loans and credit repayment period fixed, it will decrease the probability of a person
delinquent in paying loan installments amounting to 2,153.
5. X5 coefficient = 1.897
If the big variable loan increased by one point, while education level, family responsibility,
business maturity, income and payment period fixed, it will lead to an increased probability of a person
delinquent in paying loan installments amounting to 1,897.
6. Coefficient X6 = 1.602
If the variable payment period increased by one point, while education level, family
responsibility, business maturity, income, and large fixed loan, it will lead to an increased probability of
a person delinquent in paying loan installments amounting to 1.602.
3.1.2. Logistic Regression Test Prerequisites
1) Model Fit test
Assessment model fit in essence used to assess the overal fit model to the data. In this case the test is
used Hosmer and Lemeshow Test. Here is a table model fit assessment.
Table 2. Hosmer and Lemeshow Test
Step Chi-square Df Sig
1 6.117 7 0.526

185
Proceedings International Conference on Innovation and
Management, Malaysia 2016
The hypothesis used in this study are as follows.
hypothesis:
0:0 H = hypothesized model fit to the data.
0:1 H = hypothesized model does not fit with the data.
Decision-making:
Ho accepted if sig ≥ 5%.
Ho is rejected if sig <5%.
The test results obtained significant value in Hosmer and Lemeshow test, Test = 0.526 ≥ 0.05 hypothesized
that the data model fit to the data.
2) Overall Model Fit
Overall model fit was conducted to test whether the entry of independent variables in the
regression model is able to fix the regression model or not. Assessment of fit model is done by comparing
the difference in value -2log likelihood likelihood -2log constants and variables, with a value X tabel on df
= 5 obtained Xtabel = 9.488. The test results overall fit model can be seen in the table below.
Table 3. Test Model Fit
Calculation shows that (L0 - L1) ≥ Xtabel. = 62.67. So we can conclude that the independent variable are
education level, family responsibility, maturity, income, loan size and loan repayment period can improve
the logistic regression model.
3) Accuracy Classification Regression Model testing.
To test the accuracy of the classification seberapabesar regression model can be seen in the table
below classification models.
Table 4. Accuracy of Prediction Test
Classfication table a
Observed
Predicted
Y Percentage Correct
Not arrears Arrears
Step 1 Y Not arrears 20 1 95.2
Arrears 2 42 95.5
Overall Percentage 95.4
From the table above according to the predictions obtained information that there are 21
respondents who have arrears while the results of observation there were 20 respondents who have arrears
so the accuracy of the classification = (20/21 = 95.2%). According to the predictions there were 44
respondents who have no arrears while the results of observation there are 42 respondents who have no
overdue so the accuracy of the classification = 42/44 = 95.5%. The overall accuracy of the classification
model fit test
Stop 0 (L0) Step 1(L1) range (L0-
L1) X2
tabel Criteria
81.792 19.124 62.668 11.071 Fit Model

186
Proceedings International Conference on Innovation and
Management, Malaysia 2016
obtained in this regression model amounted to 95.4%, in the logistic regression analysis showed greater
improvements in the accuracy of the classification regress ion model to be used.
Hypothesis testing
1) Partial test
Hypothesis testing is done to test the effect of independent variables on the status of delinquent
respondents. Partial assay results, are as follows
Tabel 5. Parsial test
Variables in the Equation
B S.E. Wald Sig.
X1 -0.822 0.782 1.103 0.294
X2 0.167 0.614 0.074 0.785
X3 1.643 0.856 3.681 0.055
X4 -2.153 0.875 6.052 0.014
X5 1.897 0.793 5.719 0.017
X6 1.602 0.73 4.808 0.028
Constant -6.843 5.556 1.517 0.218
hypothesis:
0:0 H = independent variable has no effect on the dependent variable
0:1 H = independent variables affect the dependent variable.
Decision making:
Ho accepted if sig ≥ 5%
Ho is rejected if sig <5%
Statistical tests with SPSS variable (X1) acquired the education level sig = 0.294 = 29.4% ≥ 5%
so Ho accepted. This means that the variable educatio level did not significantly affect the amount of
arrears in paying the loan installments. In variable (X2) dependents obtained sig = 0.785 = 78.5% ≥ 5%
so Ho accepted. This means that the variable dependents has no significant effect on the amount of arrears
in paying the loan installments. In variable (X3) business maturity acquired sig = 0.055 = 5.5% ≥ 5% so
Ho accepted. it means the business maturity has no significant effect on the amount of arrears in paying
the loan installments. In variable (X4) income is derived values sig = 0.014 = 1.4% <5% so Ho rejected.
it means that the income variable significant effect on arrears in paying the loan installments. In variable
(X5) of the loans obtained sig = 0.017 = 1.7% <5% so Ho rejected. it means big variables significantly
influence the loan arrears in paying the loan installments. In variable (X6) payment period is obtained sig
= 0.028 = 2.8% <5% so Ho rejected. It means that the variable payment period significant effect on arrears
in paying the loan installments.
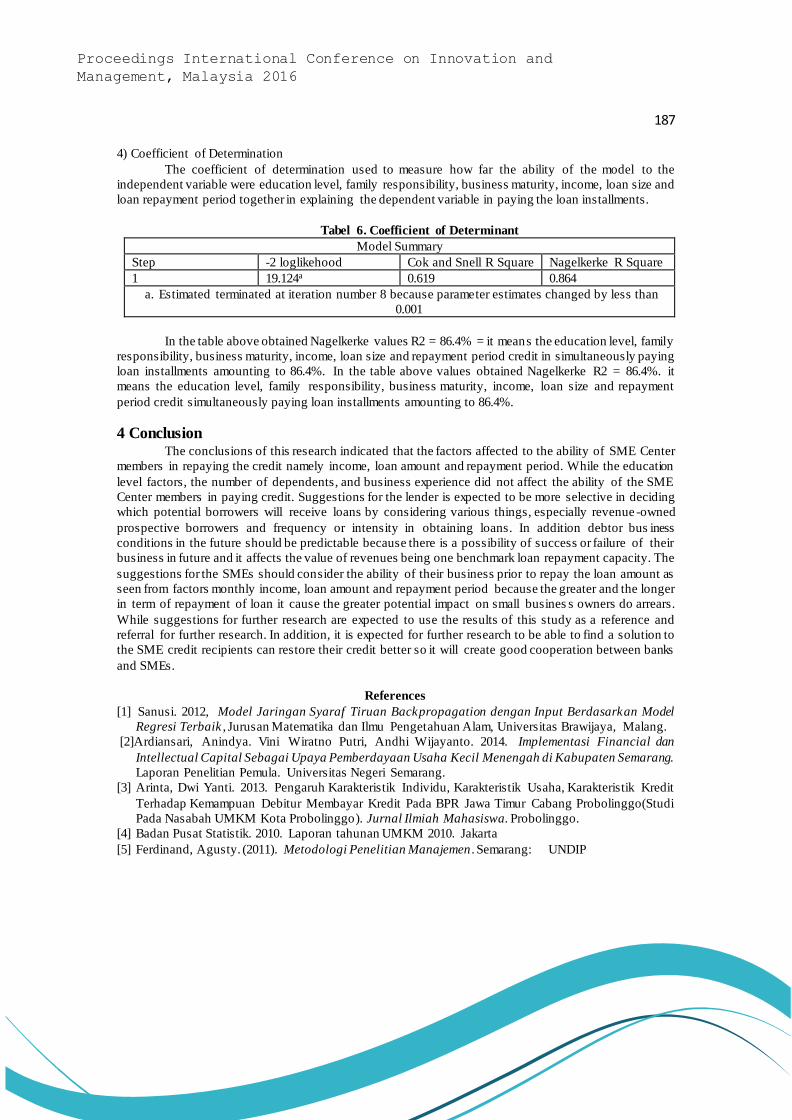
187
Proceedings International Conference on Innovation and
Management, Malaysia 2016
4) Coefficient of Determination
The coefficient of determination used to measure how far the ability of the model to the
independent variable were education level, family responsibility, business maturity, income, loan size and
loan repayment period together in explaining the dependent variable in paying the loan installments.
Tabel 6. Coefficient of Determinant
Model Summary
Step -2 loglikehood Cok and Snell R Square Nagelkerke R Square
1 19.124a 0.619 0.864
a. Estimated terminated at iteration number 8 because parameter estimates changed by less than
0.001
In the table above obtained Nagelkerke values R2 = 86.4% = it means the education level, family
responsibility, business maturity, income, loan size and repayment period credit in simultaneously paying
loan installments amounting to 86.4%. In the table above values obtained Nagelkerke R2 = 86.4%. it
means the education level, family responsibility, business maturity, income, loan size and repayment
period credit simultaneously paying loan installments amounting to 86.4%.
4 Conclusion The conclusions of this research indicated that the factors affected to the ability of SME Center
members in repaying the credit namely income, loan amount and repayment period. While the education
level factors, the number of dependents, and business experience did not affect the ability of the SME
Center members in paying credit. Suggestions for the lender is expected to be more selective in deciding
which potential borrowers will receive loans by considering various things, especially revenue -owned
prospective borrowers and frequency or intensity in obtaining loans. In addition debtor bus iness
conditions in the future should be predictable because there is a possibility of success or failure of their
business in future and it affects the value of revenues being one benchmark loan repayment capacity. The
suggestions for the SMEs should consider the ability of their business prior to repay the loan amount as
seen from factors monthly income, loan amount and repayment period because the greater and the longer
in term of repayment of loan it cause the greater potential impact on small busines s owners do arrears.
While suggestions for further research are expected to use the results of this study as a reference and
referral for further research. In addition, it is expected for further research to be able to find a solution to
the SME credit recipients can restore their credit better so it will create good cooperation between banks
and SMEs.
References
[1] Sanusi. 2012, Model Jaringan Syaraf Tiruan Backpropagation dengan Input Berdasarkan Model
Regresi Terbaik , Jurusan Matematika dan Ilmu Pengetahuan Alam, Universitas Brawijaya, Malang.
[2]Ardiansari, Anindya. Vini Wiratno Putri, Andhi Wijayanto. 2014. Implementasi Financial dan
Intellectual Capital Sebagai Upaya Pemberdayaan Usaha Kecil Menengah di Kabupaten Semarang.
Laporan Penelitian Pemula. Universitas Negeri Semarang.
[3] Arinta, Dwi Yanti. 2013. Pengaruh Karakteristik Individu, Karakteristik Usaha, Karakteristik Kredit
Terhadap Kemampuan Debitur Membayar Kredit Pada BPR Jawa Timur Cabang Probolinggo(Studi
Pada Nasabah UMKM Kota Probolinggo). Jurnal Ilmiah Mahasiswa. Probolinggo.
[4] Badan Pusat Statistik. 2010. Laporan tahunan UMKM 2010. Jakarta
[5] Ferdinand, Agusty. (2011). Metodologi Penelitian Manajemen . Semarang: UNDIP

188
Proceedings International Conference on Innovation and
Management, Malaysia 2016
[6] Ghozali, Imam. 2011. Aplikasi Analisis Multivariate Dengan Program IBM SPSS 19. Semarang :
Universitas Diponegoro
[7] Hair, Joseph F., et al.1998. Multivariate Data Analysis . New Jersey: Prentice Hall, Inc.
[8] Kasmir. 2014. Manajemen Perbankan. Jakarta : Rajawali Pers.
[9] Muljono, Teguh Pudjo. 2001. Manajemen Perkreditan bagi Bank Komersiil. Yogyakarta: BPFE
[10] Nastiti, Anggri. 2003. Analisis Faktor-faktor Yang Mempengaruhi Tingkat Pengembalian Kredit
Pengusaha Kecil Pada Program Kemitraan (Studi Kasus: PT PLN (Persero) Distribusi Jawa timur Area
Malang). Jurnal. Malang: Bisnis Universitas Brawijaya.
[11] Pradita, Dandy Wahyu Bima. 2013. Analisis Karakteristik Debitur Yang Mempengaruhi Tingkat
Pengembalian Kredit Guna Menanggulangi Terjadinya NON PERFORMING LOAN (Studi kasus pada
BRI Kantor Cabang Pembantu Sukun Malang). Jurnal. Malang: Universitas Brawijaya.
[12] Sanusi, Anwar. 2011. Metodologi Penelitian Bisnis. Jakarta : Salemba Empat.
[13] Sugiyono. 2008. Metode Penelitian Kunatitatif Kualitatif dan R&D. Bandung : Alfabeta.
[14]Widayanthi, Luh Ikka. 2012, Pengaruh Karakteristik Debitur UMKM Terhadap Tingkat
Pengembalian Kredit Pundi Bali Dwipa (Studi Kasus Nasabah Pada PT. Bank Pembangunan Daerah
Bali Kantor Cabang Singaraja), Jurnal. Malang: Universitas Brawijaya. Malang.

189
Proceedings International Conference on Innovation and
Management, Malaysia 2016
Theme 5: Business Strategy, Change Management and Risk Management
190
Proceedings International Conference on Innovation and
Management, Malaysia 2016
Technological Superiority as the Main Success Factor in
Implementing High Technology Marketing Strategy: A Pseudo Tale for Emerging Renewable Energy
Rozita Shamsuddin, Hiroshi Nakanishi, Aini Suzana
Management of Technology Department, Malaysia-Japan International Institute of Technology,
University Teknologi Malaysia, Kuala Lumpur, Malaysia
(Email: [email protected], [email protected], [email protected])
Abstract Technological innovation has always played the vital role in economics. Researchers and
innovators who are mostly engineers have long been involved with business development and helped
figuring out returns of investment from the emerging technology. However, the advanced product that is
often seen as the most potential for future growth of the modern globalized scenario, could not even reach
its targeted mainstream market even in the early market entry, what more in an emerging industries. The
evolvement of the high technology marketing innovation and its implementation strategy has been a failure
for many emerging companies. Different technological teams and personnel work in silo and many
departments operated independently. Marketing portfolios were largely a collection of separate tools,
rather than parts of a single engine that worked together. The lack of common business goals contributed
to the ‘cracks’ for technological superiority. This paper will briefly discuss the ‘revised’ Technology
Adoption Life Cycle Model by Geoffrey Moore and look at the ‘crack’ during the market entry. There are
still disparities in implementing the emerging high technology marketing that had long being typically using
the “research, development and commercialization” business model and it is not able to be the greatest
solution to save the world facing future energy sources depletion. Recognizably, data gathered from
primary interviewing of researchers, producers and manufacturers of OTEC industries, the standard model
was swapped and able to reduce the ‘crack’ based on real expansive encounters during its’ inceptions.
Aiming to adopt the best framework for strategic high tech marketing, it suggested a new route of ‘story-
tale experiences’ and coupled with other strategies for the route to successful integrated marketing
implementation strategy for new emerging industries specifically in new economies. Giving us a greater
point of view that technological superiority still remain as ‘tales’ and it is not the main success factor in the
implementation of high technology marketing.
Keywords Emerging industries, emerging high technology marketing, ‘revised’ Technology Adoption Life
Cycle Model, Renewable Energy Technology, OTEC case study
1 Introduction Technological innovation has always played the vital role in economics and often seen as the
most potential for future growth of the modern globalized scenario. New technology will re-shape the
future for better living. A diverse range of breakthrough technologies, including batteries capable of
providing power to whole villages, “socially aware” artificial intelligence and new generation solar
panels, could soon be playing a role in tackling the world’s most pressing challenges, according to the
World Economic Forum 2015. Emerging industries are newly formed or re-formed industries that have
been created by technological innovations, shifts in relative cost relationships, emergence of new
consumer needs or other economic and sociological changes that elevate a new product or service to the
level of a potentially viable business opportunity [1]. The world is facing robust modernization with the
existence of mushrooming technological innovations in various industries – existing or emerging.
However, the advanced product that is often seen as the most potential for future growth of the modern
globalized scenario, could not even reach its targeted mainstream market even in the early market entry,
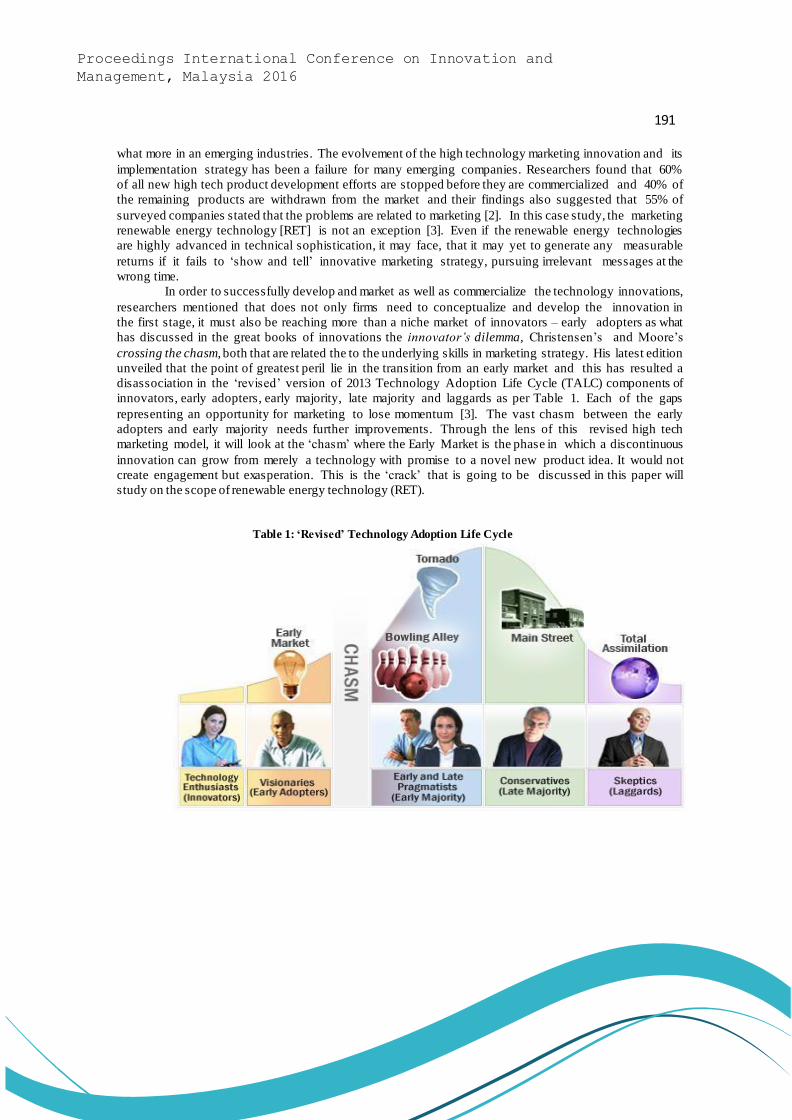
191
Proceedings International Conference on Innovation and
Management, Malaysia 2016
what more in an emerging industries. The evolvement of the high technology marketing innovation and its
implementation strategy has been a failure for many emerging companies. Researchers found that 60%
of all new high tech product development efforts are stopped before they are commercialized and 40% of
the remaining products are withdrawn from the market and their findings also suggested that 55% of
surveyed companies stated that the problems are related to marketing [2]. In this case study, the marketing
renewable energy technology [RET] is not an exception [3]. Even if the renewable energy technologies
are highly advanced in technical sophistication, it may face, that it may yet to generate any measurable
returns if it fails to ‘show and tell’ innovative marketing strategy, pursuing irrelevant messages at the
wrong time.
In order to successfully develop and market as well as commercialize the technology innovations,
researchers mentioned that does not only firms need to conceptualize and develop the innovation in
the first stage, it must also be reaching more than a niche market of innovators – early adopters as what
has discussed in the great books of innovations the innovator’s dilemma, Christensen’s and Moore’s
crossing the chasm, both that are related the to the underlying skills in marketing strategy. His latest edition
unveiled that the point of greatest peril lie in the transition from an early market and this has resulted a
disassociation in the ‘revised’ version of 2013 Technology Adoption Life Cycle (TALC) components of
innovators, early adopters, early majority, late majority and laggards as per Table 1. Each of the gaps
representing an opportunity for marketing to lose momentum [3]. The vast chasm between the early
adopters and early majority needs further improvements. Through the lens of this revised high tech
marketing model, it will look at the ‘chasm’ where the Early Market is the phase in which a discontinuous
innovation can grow from merely a technology with promise to a novel new product idea. It would not
create engagement but exasperation. This is the ‘crack’ that is going to be discussed in this paper will
study on the scope of renewable energy technology (RET).
Table 1: ‘Revised’ Technology Adoption Life Cycle
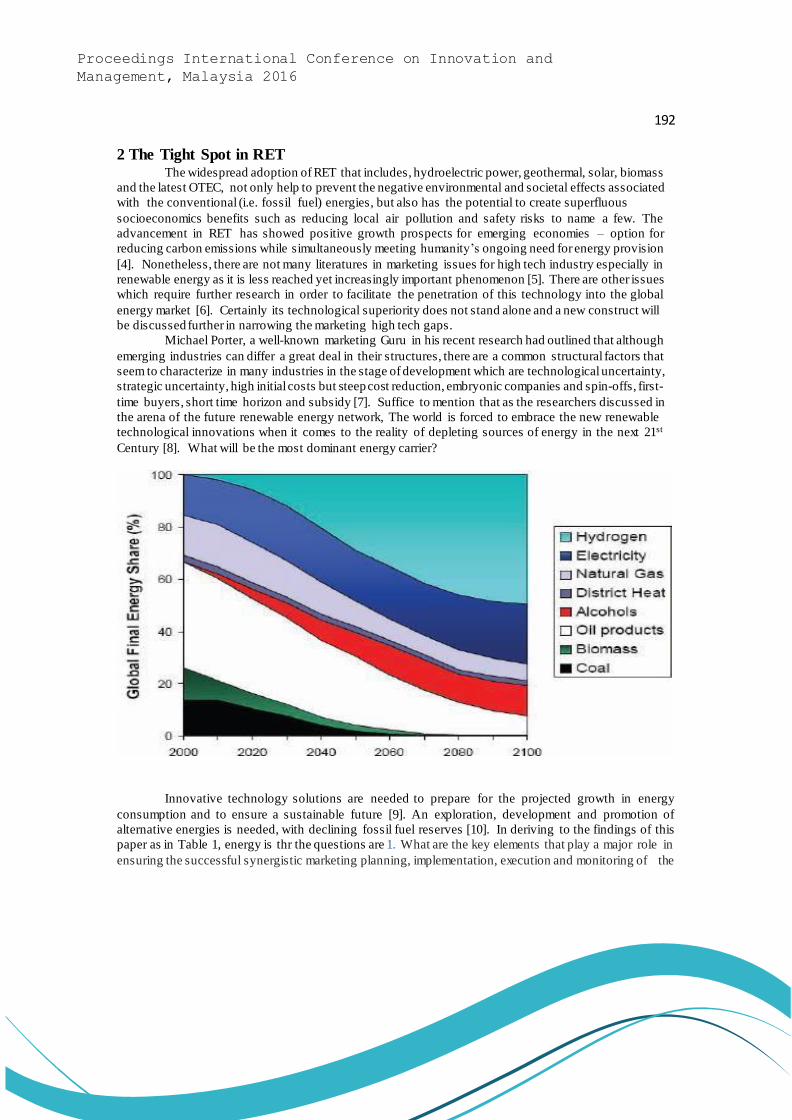
192
Proceedings International Conference on Innovation and
Management, Malaysia 2016
2 The Tight Spot in RET The widespread adoption of RET that includes, hydroelectric power, geothermal, solar, biomass
and the latest OTEC, not only help to prevent the negative environmental and societal effects associated
with the conventional (i.e. fossil fuel) energies, but also has the potential to create superfluous
socioeconomics benefits such as reducing local air pollution and safety risks to name a few. The
advancement in RET has showed positive growth prospects for emerging economies – option for
reducing carbon emissions while simultaneously meeting humanity’s ongoing need for energy provision
[4]. Nonetheless, there are not many literatures in marketing issues for high tech industry especially in
renewable energy as it is less reached yet increasingly important phenomenon [5]. There are other issues
which require further research in order to facilitate the penetration of this technology into the global
energy market [6]. Certainly its technological superiority does not stand alone and a new construct will
be discussed further in narrowing the marketing high tech gaps.
Michael Porter, a well-known marketing Guru in his recent research had outlined that although
emerging industries can differ a great deal in their structures, there are a common structural factors that
seem to characterize in many industries in the stage of development which are technological uncertainty,
strategic uncertainty, high initial costs but steep cost reduction, embryonic companies and spin-offs, first-
time buyers, short time horizon and subsidy [7]. Suffice to mention that as the researchers discussed in
the arena of the future renewable energy network, The world is forced to embrace the new renewable
technological innovations when it comes to the reality of depleting sources of energy in the next 21st
Century [8]. What will be the most dominant energy carrier?
Innovative technology solutions are needed to prepare for the projected growth in energy
consumption and to ensure a sustainable future [9]. An exploration, development and promotion of
alternative energies is needed, with declining fossil fuel reserves [10]. In deriving to the findings of this
paper as in Table 1, energy is thr the questions are 1. What are the key elements that play a major role in
ensuring the successful synergistic marketing planning, implementation, execution and monitoring of the

193
Proceedings International Conference on Innovation and
Management, Malaysia 2016
OTEC ecosystem? 2. What would be the feasible synergistic marketing strategy to be adopted for the
development of OTEC industry in Malaysia as emerging economy?
3 OTEC through the years The long neglected in development, the technological advancements in other fields and
integration of crosscutting industry technology solutions now provide more feasible opportunities for the
OTEC industry. First discovered in 1870, today it renascent as one of the fast evolving technological
innovation. Ocean Thermal Energy Conversion (OTEC) is conversions of the heat trapped in the surface
of the ocean at temperate regions and transforms it into energy at a designated temperature. It harnesses
the heat from the Sun stored in the oceans and the adjacent deep seas wherever there is a significance
temperature differential over 20 degree Celcius.
There is great potential for OTEC to act as the enabling technology for a low carbon economy.
Renewable energy integration, electrified transportation, and independent distributed power production
are just some ways that the OTEC may fundamentally reshape the future energy landscape [12]. The
mother earth may have quality, cleaner air. OTEC has the highest potential (about 300 exajoules (EJ) per
year or, 90% of the global ocean energy potential) when comparing all ocean energy technologies. A
total of 98 nations including Malaysia and territories are deemed geographically suitable for OTEC
development [13]. Technically, its system makes use of the regular occurring differential temperature
(of about 20°C) between the warm surface seawater and the deep ocean water to generate electricity
achieved through (the process of) evaporating and condensing a working fluid to power a turbine, much
like the system of refrigerator [14].
The OTEC systems may be differentiated into the 3 types of cycles. This includes the open
cycle, the closed cycle, and the hybrid cycle. The OTEC open cycle utilizes the ocean water as its working
fluid, whereas an OTEC closed cycle typically uses ammonia. The OTEC hybrid cycle, on the other hand
uses a mixture of ammonia and water. Various researchers are studying the alternative working fluids or
refrigerants, as this may improve the cost and efficiency of the OTEC cycle and differentiated is by the
type of platform used. This may be floating platforms, land based platforms, or moored to the sea
platforms [15]. Therefore, the world needs a super techno-solutions to sustain in the future. The
promotion or the information-sharing for the mass pubic captures interests as the community are majority
techno driven. Could the superiority in the technological energy related issue?
4 OTEC Case Studies: The Marketing Experience Perplexity Power disturbance from the commercial power grids happen everywhere. Studies suggest that
the total worldwide power generation capacity could be supplied by OTEC [16]. The power generation
Yet, similar to other RET, the technological aspects OTEC are characterized as costly, complex and
inertia, resulted from lengthy decision-making and financial intricacy [15]. Why this case study was
chosen because it focused on another angle on how to penetrate the market during it embryonic stage. It
is the challenges for researchers and marketers have to combat the probable bugs and glitches of the
phase.
In this qualitative case study, the marketing strategy for emerging technology is scaled towards
technology that is new to the world, new to the country and new to the organizations related to and it
must be analyzed as a single process [11]. Quoting Creswell there were three factors that the researcher
should be involved in: preliminary considerations at the commencement of the assignment, the steps to
be engaged in and finally the flow in getting the findings [12]. This case study research involves the
written report of a sheath within a real-life, contemporary context or setting [13]. The areas discussed
are based on the RET’s market entry phase in new economy and the marketing strategy used by the
technology providers/experts of the emerging OTEC from USA, Japan, Korea and Netherlands during
194
Proceedings International Conference on Innovation and
Management, Malaysia 2016
the 3rd OTEC International Symposium 2015 held in Kuala Lumpur. Aiming to develop the best
framework for high tech marketing , the semi-structured interviews with the renowned OTEC experts
encompassed the inception stage that discussed 1) market penetration business model 2) marketing plan
and activities 3) marketing challenges for OTEC 4) Integrated marketing mix used for price, place,
people and promotion.
During the initial phase in OTEC development, the experts were asked on what was their market
penetration business model. Since marketing is part of commercializat ion, development and research are
segmented to see the platforms of each encounters and the results as in Table 2.
Table 2 Stages on Commercialisation=>Development=>Research VS
Research=> Development=>Commercialisation
Source : Adapted from Bakar (2014)
Table 3: OTEC Marketing Experiences During Early Stage
Technology
Providers/Experts Organization Experience Result
Professor Dato Abu Bakar Professor Luis Vega Ms. Anne-Sophie Colleaux
Professor Yasuyuki Ikegami
UTMOTEC Hawaii DCNS
Saga University
CDR RCD
CDR
RDC
4 Special Purpose Vehicles in 2 years Research and Pre-commercial Plant
Growing demand from customers
Demonstration d Test - Inertia Dr Hyeon Ju Kim Korean Research Institution of
Ship RDC Research and Development - Inertia
The marketing plan/activities during OTEC initial stage from five technology experts are
illustrated as per Table 3.
Table 4: OTEC Marketing Activities During Early Stage
Technology
Providers/Experts Organization Activities
Professor Dato Abu Bakar Professor Luis Vega Ms. Anne-Sophie Colleaux Professor Yasuyuki Ikegami
UTMOTEC Hawaii
DCNS Saga University
Active face-to-face meetings with government and private agencies Long research and experiments since 1930s Vigorous face-to-face marketing presentations at numerous sites Extensive research since 1970s
Dr Hyeon Ju Kim Korean Research Institution of
Ship Research and demonstration in education and private sectors

195
Proceedings International Conference on Innovation and
Management, Malaysia 2016
Looking ahead, the shared persistent difficulties yet grows miracles in the OTEC early
marketing development when experiences are synergized with technological expertise- bear positive
results in reaching the target audience (Table 5).
Table 5: OTEC Marketing Challenges During Early Stage
Technology
Providers/Experts Organization Challenges
Professor Dato Abu Bakar Professor Luis Vega
Ms. Anne-Sophie Colleaux Professor Yasuyuki Ikegami
UTMOTEC Hawaii DCNS
Saga University
Costs, financial complexity and concerted efforts within agencies Costs and financial complexity Almost Nil – due to self-funded and vigorous face-to-face
interactions activities.
Research tasks by government Dr Hyeon Ju Kim Korean Research Institution of
Ship R&D was concentrated on tidal barrage power plant as
mandated by the government
Adopting the instrumental marketing mix perspective (which is often categorized into the
classic marketing instruments of product, price, promotion, and place, "4 p's” the experts also saw the
inclusion of activities and plans that are integrated and carried out in the form of face-to-face
presentation.
Table 6: OTEC Integrated Marketing Mix During Early Stage
Technology
Providers/Experts Organization Price Place People Promotion
Professor Dato Abu Bakar
Professor Luis Vega
Ms. Anne-Sophie Colleaux Professor Yasuyuki Ikegami
UTMOTEC
Hawaii
DCNS
Saga University
Price Government Technologist Social Media
Instrument Private Strategist Printed Media
NGOs Face-to-Face
GLCs Roadshows Price Government Technologists NIL
Instrument
Self-f unded Global Strategist Face-to-face
Highly Tradeshows educated Conferences
Business
Presentatins Conce aled Educational Researchers Academia
Public Conferences Dr Hyeon Ju Kim Korean Research Institution of
Ship Conce aled Government Resea rc her Academia
Conferences
During the market entry stage, the issues on complexity, cost, technological readiness and
market uncertainties are the typical areas raised. Positive results and the increased number of special
project vehicles (spv) are the benchmark for the technology providers (Table 6). When asked about the
marketing tactic used, both Professor Bakar and Ms Anne Sophie evidently relate experiences as one of
the key elements in the story-line of their business presentations.
196
Proceedings International Conference on Innovation and
Management, Malaysia 2016
5 OTEC Case Study: The Magnitude of Technological Innovation Story-telling of
the CDR Model (Commercialisation, Development, Research) In designing a suitable marketing framework for OTEC business model, the story-telling criteria
integrates the OTEC significance technological success story with the real experiences encountered
during the early stage of market penetration. Sharing the corporate story-board and business model of
Kumejima Island, techno-preneurs and scientists are able to associate with the development of OTEC at a
remarkable technology transferate as shared by Professor Abu Bakar. While Ms Anne Sophie,
aspiringly talked about the corporate profile of DCNS – the industry builders for decades and has a hugh
promising track record on technology and knowledge transfer in an experiential presentations that are
engaging..
OTEC’s unique selling propositions that are able to ‘catch’ the hearts and minds of the audience.
Characterized by clean energy as it uses only seawater as energy resource. It is inexhaustible and
applicable in 98 countries around the globe. It supplies energy at a constant rate stably day and night
throughout the year and obviously, its killer finding – zero-carbon emission.
6 More Discoveries in OTEC-development spins-products The phenomenal development of OTEC spins –off products from Japan, Korea, Hawaii and are
abundance. Many discoveries derived from the spins-of OTEC technology such as;
1. OTEC Electric-Power, Freshwater Supply, and H2 Fuel Production, and Sale of Cold Deep
Sea Water to OTEC Spin-off Companies;
2. Development of OTEC-Techno-Park for the following OTEC Spin-Off Industries:
• Production of Temperate Produce
• Marine Culture of High Value Fish, Prawns, Lobsters, Abalone, Oysters, etc
• Culture of Seaweeds: Umi Budou, Ogu
• “Takumi” Fish-Aggregation
• Production of Micro-algae for Jet-Fuel
• District Cooling
• Lithium Production for Batteries
• Mineral Water Production
3. Hydrogen Fuel Cell for SmartGrid for Localised Distribution of Renewable Electricity
The OTEC spins-off industries derived from the multi-function OTEC plant is foresee to generate and
broaden world economy, OTEC not only cross-cutting technology, but addressing all sustainability
issues like biodiversity, environment, & climate change; security of water, foods, and energy;
commodities, health care; transport and urbanisation.
7 Conclusions Technological superiority in energy industries is hyped and foreseen to be the factor for
successful EHT marketing even if it is risky and costly [14]. The tales once told by the marketers in
energy industry with identified ‘cracks’ across the chasm are repeated. But this tale needs to be addressed
as energy is the cornerstone of societal needs and economic growth[15]. But how and where to start
with? The tales began to slowly unleashed from different angles from the gathering of experts and
technologists at the 3rd OTEC International Conference held in Kuala Lumpur.
The experiential marketing (EM) for this highly advanced eco-system should be choreographed
to engage hearts and minds of the targeted audience. [16] It would be the core feature of the Strategic
Technological Expansive Marketing (STEM) from the branch of EM. Featuring as a complex
infrastructure, and taking effort and money but if considering the real costs of fossil fuels--pollution and
its effects, international tensions over gas and oil supplies, and climate change. [17]. It would be wise to

197
Proceedings International Conference on Innovation and
Management, Malaysia 2016
market its development right from the market entry through the corporate experiential high tech
marketing that integrates with the traditional marketing blueprint used for decades with a strategic
approach in the context of fast-moving technology transitions and instant information sharing. [18] A
comprehensive marketing strategy for a wide OTEC audience, from prospects and customers to investors
and financial partners, as well as specialized media, combining human, technology and manufacturing
assets, would fosters closer relationships across the OTEC value chain to meet the challenges of the
industry in an efficient and sustainable way. [19].
As for Malaysia, nevertheless it is a common knowledge that many government or its linked-
companies still continue in the old RET even though the new ones are more cost-effective in terms of its
reliability, through days and nights [20]. For futures research, there should be a more comprehensive
strategies that comprised of technologies and marketing communication model that should also be
embedded for early penetration of the early market.
References
[1] Porter, M. Competitive Strategy. [M]. New York/USA: Free Press. 2004
[2] Stanley F. Slater,Jakki J. Mohr,Sanjit Sengupta. Radical Product Innovation
Capability: Literature Review, Synthesis, and Illustrative Research Propositions. [J]
Volume 31, Issue 3 May Pages 552–56 2014
[3] Mohr, J.; Sengupta, S.; Slater, S.. Marketing of High—Technology Products and Innovations. New
Jersey. 2010
[4] GEA. Global Energy Assessment-Toward A Sustainable Future. [R] 2012
[5] Enkel, E. & Heil, S.Preparing for distant collaboration: Antecedents to potential absorptive
capacity in cross-industry innovation. Technovation. [J] 34 (4): 242–260.2014
[6] Zemlickiene, V. Analysis of High-technology product development models.[J[ 5(2), 283–
297. 2011
[7] Seyyed Mohsen Mousavi Ehteshami ,S.H.Chan . The role of hydrogen and fuel cells to store
renewable energy in the future energy network – potentials and challenges . [R] Energy
Policy. 2014R
[8] Porter, Michael E. The Competitve Advantage:Creating and Sustaining Superior
Performance. [M]. Macmillian Press.1985
[9] Bakar Jaafar. Overcoming Barriers Through Policy Advocacy & Investment Promot
Case of Ocean Thermal Energy Driven Development in Malaysia. In: 3rd Internatio
Symposium. Kuala Lumpur. [C]p. 17–19. 2015
[10] Hoel, M. & Kverndokk, S. Depletion of Fossil Fuels and the Impacts of Global
Warming. Resource and Energy Economics. [R] 18 (2), 115–136. Available from:
doi:10.1016/0928-7655(96)00005-X 1996[Accessed: 21 October 2015.
[11] International Energy Agency World Energy Outlook 2013. [R]. Available from:
http://v nk.fi /t ied ostot /julkine n/talo usne uv osto/m uist iot/T N -e si tyk set_14 -04 -07. pdf [Accesse d:
21 September 2014.
[12] Ong Gui Xian.Industry Technology Roadmap on Hydrogen Production From the Ocean
Thermal Energy Conversion Industry In Malaysia. [D] UTM .2016.
[13] Lewis, A., Estefen, S., Huckerby, J., Musial, W., et al. Ocean Energy. In: Amjad Abdulla, Jose
M Moreno, & Yage You (eds.). IPCC Special Report on Renewable Energy Sources and
Climate Change Mitigation. Cambridge, United Kingdom and New York, [R] USA, Cambridge
University Press. pp. 497–534. 2011
[14] Ong, G.X. OTEC Development, Strategies and Way Forward. Future Energy: Is
OTEC the Solution?[C] pp.10–13. 2015

198
Proceedings International Conference on Innovation and
Management, Malaysia 2016
[15] Vega L.A. Ocean Thermal Energy Conversion. Encyclopedia of Sustainability Science and
Technology, Springer. [C] 7296–7328. Available from: doi:10.1016/0302- 184X(78)90026-
4. 2012
[16] Smith, Hanover. Smith, K &Hanover. D Experiential Marketing:secrets, strategies and ]success
stories from the world's greatest brands. [M[ Wiley 2016
[17] IRENA.Ocean Thermal Energy Conversion Technology Brief.[R] (June).2014
[18] Murali Dharan S.Assessment of Ocean Thermal Energy Conversion. [J ]Massachusetts
Institute of Technology.2012
[19] Lim, Lee & Kim Lim, S.-T., Lee, H.-S. & Kim, H. Comparison of OTEC Cycle by Various
Refrigerant. In: 3rd International OTEC Symposium. [P] p. 18. 2015
[20] Smith, Hanover. Smith, K &Hanover, D. Experiential Marketing:secrets, strategies and
success storiesfrom the world's greatest brands. [M] Wiley 2016
[21] Norazreen Samsuri . Performance of OTEC Rankine Cycles Using Different Working Fluids.

199
Proceedings International Conference on Innovation and
Management, Malaysia 2016
Theme 6: Operation Management, Logistics, Supply-Chain Management
200
Proceedings International Conference on Innovation and
Management, Malaysia 2016
Selection of Integrators in Malaysia’s local broiler industry:
Prioritization of critical factors based on Growers’ perspectives
Hendrik Lamsali Ahmad Shabudin Ariffin
School of Technology Management and Logistics,Universiti Utara Malaysia,
Sintok 06010, Malaysia
(E-mail: [email protected], [email protected])
Abstract The Malaysian broiler industry is an integral component of the agriculture sector that generate
sustainable food supplies to almost 30 million populations in the country. The industry comprises of
conventional and commercial farms for which the latter is more sustainable with contract farming
schemes and involvement of major integrators and growers. The survival of local growers as one of the
important players within broiler’s supply chain hierarchy is largely depending on the integrators. Hence,
this study aims to identify critical factors that local growers consider when selecting their integrators.
Specifically, the objective is to prioritize integrators’ selection factors and to determine the critical
ranking of each factor. Analytical Hierarchy Process (AHP) approach is employed to evaluate and rank
the importance of the said factors based on inputs from selected broilers’ representatives. Five main
criteria are identified and considered in the AHP analysis that include relationships, reliability, logistics,
input and price. The result indicates that reliability had been given the highest priority, followed by
pricing factor, input criteria, relationships with the integrator, and finally the logistics facility. For
overall sub-criteria, supplied quantity had been ranked number one, followed by price of raw materials,
availability of day-old chick, quality conformance, technology sharing, and in-house logistics facility. In
the end, how this study impacted local broiler industry is explained. Certain issues and future direction
of this study are also discussed.
Keywords Broiler industry, supply chain, Analytical Hierarchy Process (AHP), pairwise comparison,
contract farming
1 Introduction The Malaysian broiler industry is an important part of the agriculture sector providing
employment and producing useful animal protein food for the population, estimated at 25 million people
and also to about 4 million people in Singapore. According to [1], Malaysia has one of the highest per
capita consumption of chicken in the world. Broiler industry in Malaysia comprises of commercial farms
and conventional farms; commercial farms that run business on contract farming basis with integrator and
conventional farms that belong to independent entrepreneurs. According to [2], the contracting scheme is
therefore more likely to sustain. In 2009 there were 3,300 farms in operation carrying a standing
population of nearly 186 million broiler chickens. Of these farms, 22.9% are large farms with more than
50,000 broilers per cycle. According to [3], the states of Johor, Sarawak and Perak were the major
producers of broiler which constituted 52% of total national production. In the industry, broiler contracting
involves the use of improved technology and production practices. Main players normally have a
vertically integrated supply chain and operating as an integrated producer. There are two parties in a
typical contract farming arrangement: the grower and the company (Integrator). Integrators recruit large
farms (growers) to rear broiler chickens for meat according to contractual guidelines. Farming contracts
can also help growers mitigate risks posed by fluctuations of input prices and provide a secure market
outlet for their product. Most integrators in Malaysia participated contract farming with growers for broiler
production. Consequently, the integrators are always involved in every stage of production. While the
important role of integrators is well documented, empirical evidence suggesting which factor to consider
when selecting integrators remain limited and inconclusive. The need to identify and to prioritize
201
Proceedings International Conference on Innovation and
Management, Malaysia 2016
integrators’ selection factors is timely to both growers and integrators. It is a high time for relevant parties
such as the integrators to understand the ‘survival’ need of the growers and to seek further improvement.
Hence, the objective of this study is to determine factors that are critical when selecting potential
integrators. In particular, the study aims to prioritize and rank the criteria (selection factors) using the
Analytical Hierarchy Process (AHP) method. The remaining part of this paper is organized as follows:
Section 2 discusses the AHP method followed by determination of the main criteria and sub-criteria in
Section 3. Section 4 discloses the computational works in which the results and sensitivity analysis are
discussed. Finally, Section 5 concludes the paper with discussion and recommendation of the study.
2 The AHP method The Analytical Hierarchy Process (AHP) is a multi-criteria decision making method developed
by Thomas L. Saaty in 1970s. One can refer to many of his previous studies on hierarchies, prioritization
of decision making factors and the AHP method [4],[5],[6],[7] and [8]. The method has been used
extensively in many different sectors such as government, manufacturing, services, engineering and
management [9]. According to [10], AHP has been widely employed to decision making in areas such as
resource allocation planning. It was also pointed out by [11] that manufacturing sector had been the
biggest user of the AHP method. The applications of AHP method in agribusiness was illustrated by [12]
in which the method had been used to rank the commodities in terms of the feasibility prospects with the
intention of introducing milk futures contracts in Brazil. Study by [13] investigated the usage of AHP for
selecting the most suitable bedding material for broiler production in Brazil. In Indonesia, [14] had
examined supply chain competitiveness in local food industry using a combination of the AHP and ANP
methods. In the meantime, [15] had used AHP method to determine importance ratings and overall index
of sustainability of food supply chains. Hitherto, there had been very limited ap plications of the AHP-
related methods in livestock or poultry industry. The AHP method is based on three key steps in which
are (1) decomposition, (2) comparative judgement, and (3) synthesis of priorities [16]. This research
utilized both primary and secondary data collection methods to get insight into the broiler industry.
Primary data were gathered from interviews with four key senior officers from local growers with
positions ranging from Managing director to chief business officer. The pairwise comparisons were
developed based on key information in the secondary data and input from an experienced chief business
officer of a local grower. Special briefing to all selected respondents had been conducted prior to the
fulfillment of the questionnaire.
3 Determination of main and sub-criteria Two approaches had been employed to determine main and sub-criteria that growers consider
when selecting local integrators. First, secondary data gathering from relevant articles and journals were
carried out in which relevant factors for selection of integrators had been identified. Then, an interview
with a chief business officer from a local grower establishment had been conducted to further verify the
aforementioned factors and to determine important criteria and the sub-criteria. The following Fig.1
illustrates the main and sub-criteria. Table 2 defines the operational definition for each criteria and sub-
criteria. Table 1 depicts the measurement scale that is used in this study and is adopted from [7].
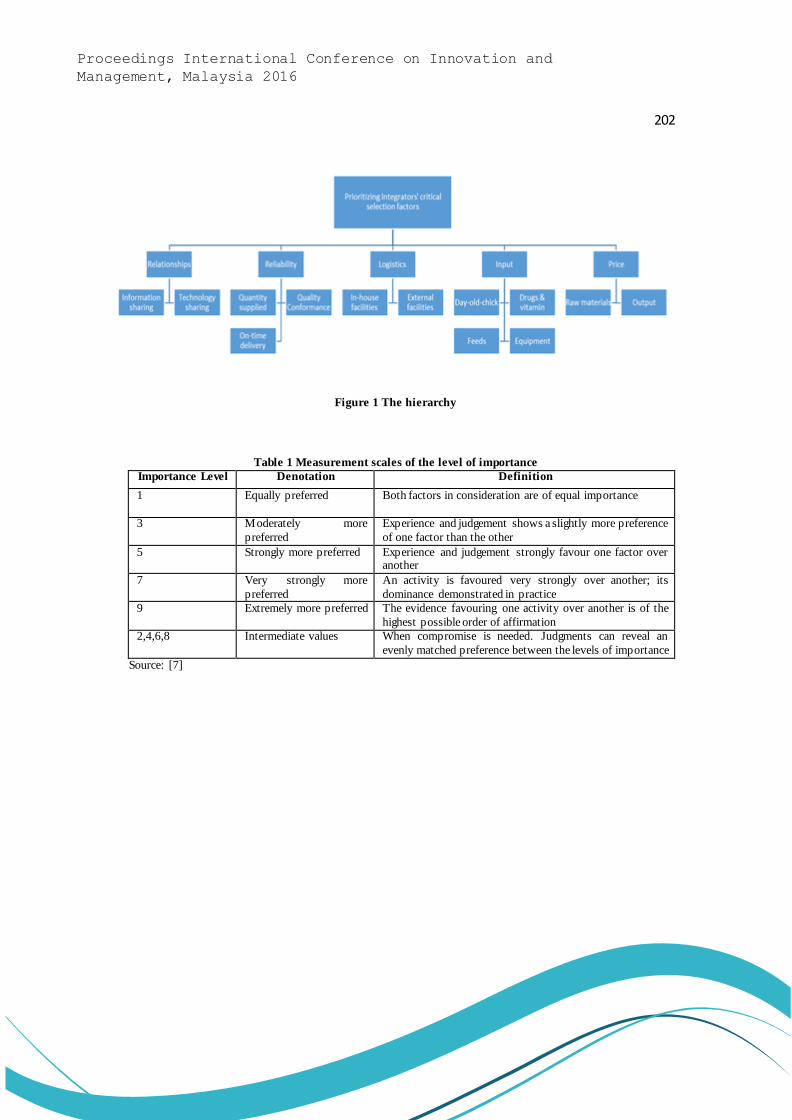
202
Proceedings International Conference on Innovation and
Management, Malaysia 2016
Figure 1 The hierarchy
Table 1 Measurement scales of the level of importance
Importance Level Denotation Definition
1 Equally preferred
Both factors in consideration are of equal importance
3 Moderately more
preferred
Experience and judgement shows a slightly more preference
of one factor than the other
5 Strongly more preferred Experience and judgement strongly favour one factor over another
7 Very strongly more
preferred
An activity is favoured very strongly over another; its
dominance demonstrated in practice
9 Extremely more preferred The evidence favouring one activity over another is of the
highest possible order of affirmation
2,4,6,8
Intermediate values When compromise is needed. Judgments can reveal an
evenly matched preference between the levels of importance
Source: [7]

203
Proceedings International Conference on Innovation and
Management, Malaysia 2016
Table 2 Definitions of the criteria and the sub-criteria
No
Criteria/Sub-
criteria
Definition
1 Relationships The extent of which integrator is willing to foster closer relationships with the grower in terms of sharing of information and technology
2 Reliability Measured by how reliable is the integrator in terms of quality conformance,
accuracy of quantity order fulfillment and on-time delivery
3 Logistics Refer to whether Integrator has available in-house logistics facilities or external 3rd
party logistics (3PL)
4 Input Relevant input factors of which are offered in the form of chicks, drugs and vitamin,
type of feeds, and equipments.
5 Price Price of the raw materials (input from integrator) and outp ut (buyback price)
6 Information sharing Willingness of the integrator to share relevant information with the grower
7 Technology sharing Willingness of the integrator to share the technology and assist the grower how to use them
8 Quantity supplied Ability of the integrator to supply to grower’s demand in terms of quantity
9 Quality conformance Ability of the integrator to supply quality inputs based on predetermined standards
10 On-time delivery Ability of the integrator to deliver grower’s orders on-time
11 In-house facilities Capability of the integrator to provide in-house logistics support and facilities to
the grower
12 External facilities Integrator favors the usage of a 3rd party logistics provider to deliver grower’s
orders
13 Day-old chick Ability of the integrator to supply ‘a day -old chick’ to the grower
14 Drugs & vitamins Types of drugs and vitamins that the integrator use to breed chicks
15 Feeds Integrator’s types of feeds given to the chicks
16 Equipment Types of equipment and technology that integrator used to breed chicks
17 Raw materials price The price of chicks and other relevant raw materials the grower has to pay
18 Output price The buyback price the integrator is willing to pay to the grower
4 The Computational Works The analysis had been conducted using decision making software, the Expert Choice. For the
pairwise comparisons, input from four (4) important respondents were gathered and analyzed. Geometric
means were then calculated to determine group judgement. At the end of the analysis, consistency test
was carried out.
Table 3 Weights and priorities of each criteria
Weight of each main criteria with respect to the Goal
P1 P2 P3 P4 average Rank
Relationships 0.468 0.044 0.045 0.061 0.098 4
Reliability 0.222 0.458 0.441 0.358 0.406 1
Input 0.147 0.127 0.186 0.140 0.168 3
Price 0.075 0.291 0.246 0.351 0.232 2
Logistics 0.089 0.079 0.083 0.091 0.096 5
The result in Table 3 indicate that reliability had been given the highest priority, followed by
pricing factor, input criteria, relationships with the integrator, and finally the logistics facility. Both
reliability and pricing factors were dominantly important, accountable for 63.8% from overall weight with
respect to the goal. The least important factor was the logistics. For the overall sub-criteria, Table 4 show
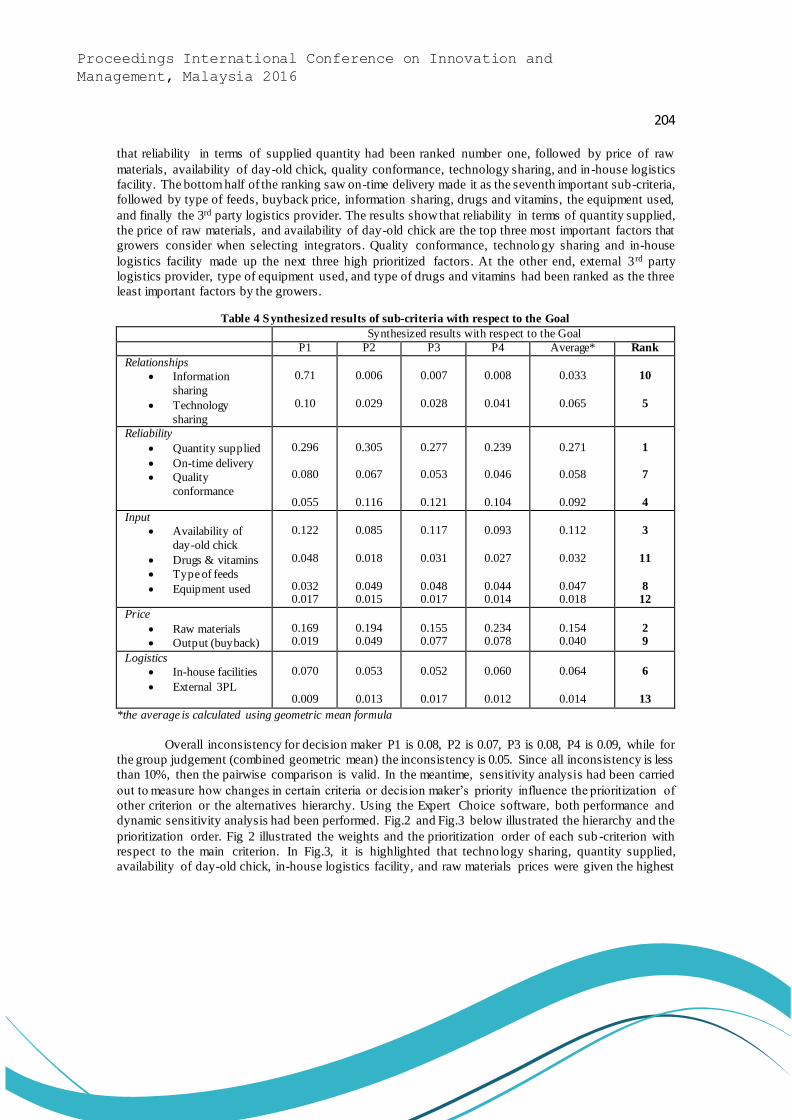
204
Proceedings International Conference on Innovation and
Management, Malaysia 2016
that reliability in terms of supplied quantity had been ranked number one, followed by price of raw
materials, availability of day-old chick, quality conformance, technology sharing, and in-house logistics
facility. The bottom half of the ranking saw on-time delivery made it as the seventh important sub-criteria,
followed by type of feeds, buyback price, information sharing, drugs and vitamins, the equipment used,
and finally the 3rd party logistics provider. The results show that reliability in terms of quantity supplied,
the price of raw materials, and availability of day-old chick are the top three most important factors that
growers consider when selecting integrators. Quality conformance, technolo gy sharing and in-house
logistics facility made up the next three high prioritized factors. At the other end, external 3 rd party
logistics provider, type of equipment used, and type of drugs and vitamins had been ranked as the three
least important factors by the growers.
Table 4 Synthesized results of sub-criteria with respect to the Goal
Synthesized results with respect to the Goal
P1 P2 P3 P4 Average* Rank
Relationships
Information
sharing
Technology
sharing
0.71
0.10
0.006
0.029
0.007
0.028
0.008
0.041
0.033
0.065
10
5
Reliability
Quantity supplied
On-time delivery
Quality
conformance
0.296
0.080
0.055
0.305
0.067
0.116
0.277
0.053
0.121
0.239
0.046
0.104
0.271
0.058
0.092
1
7
4
Input
Availability of
day-old chick
Drugs & vitamins
Type of feeds
Equipment used
0.122
0.048
0.032 0.017
0.085
0.018
0.049 0.015
0.117
0.031
0.048 0.017
0.093
0.027
0.044 0.014
0.112
0.032
0.047 0.018
3
11
8 12
Price
Raw materials
Output (buyback)
0.169 0.019
0.194 0.049
0.155 0.077
0.234 0.078
0.154 0.040
2 9
Logistics
In-house facilities
External 3PL
0.070
0.009
0.053
0.013
0.052
0.017
0.060
0.012
0.064
0.014
6
13
*the average is calculated using geometric mean formula
Overall inconsistency for decision maker P1 is 0.08, P2 is 0.07, P3 is 0.08, P4 is 0.09, while for
the group judgement (combined geometric mean) the inconsistency is 0.05. Since all inconsistency is less
than 10%, then the pairwise comparison is valid. In the meantime, sensitivity analysis had been carried
out to measure how changes in certain criteria or decision maker’s priority influence the prioritization of
other criterion or the alternatives hierarchy. Using the Expert Choice software, both performance and
dynamic sensitivity analysis had been performed. Fig.2 and Fig.3 below illustrated the hierarchy and the
prioritization order. Fig 2 illustrated the weights and the prioritization order of each sub -criterion with
respect to the main criterion. In Fig.3, it is highlighted that techno logy sharing, quantity supplied,
availability of day-old chick, in-house logistics facility, and raw materials prices were given the highest
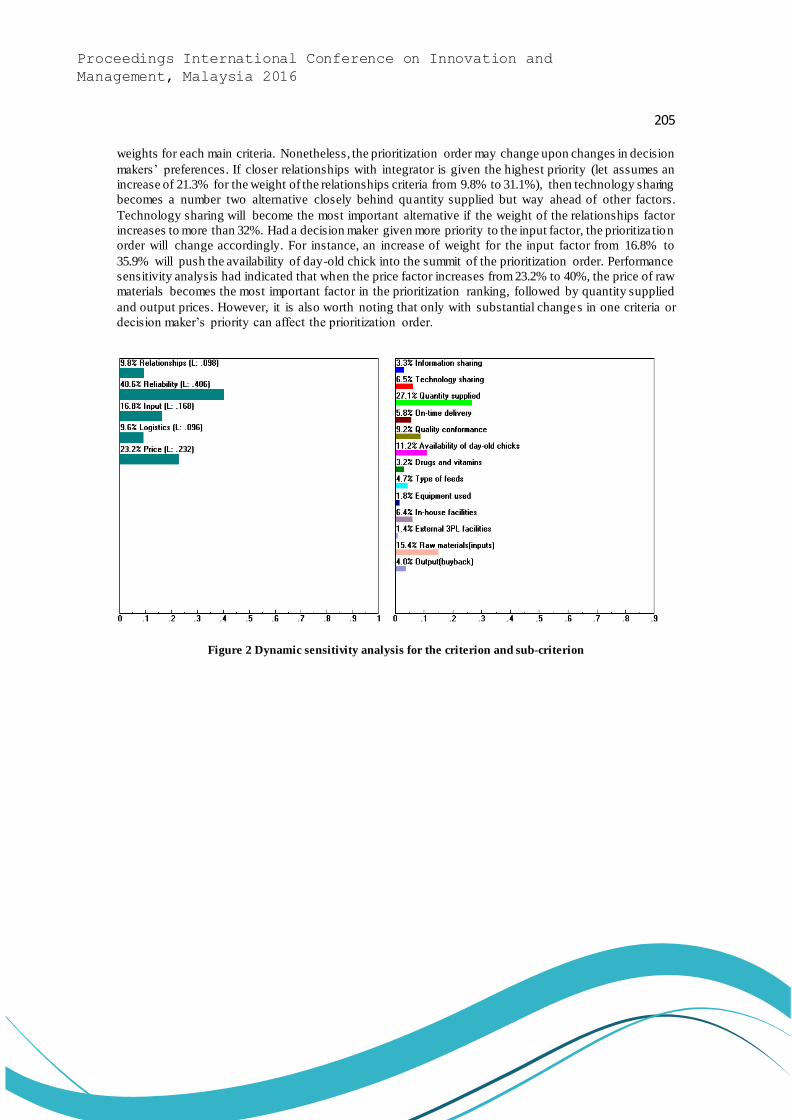
205
Proceedings International Conference on Innovation and
Management, Malaysia 2016
weights for each main criteria. Nonetheless, the prioritization order may change upon changes in decision
makers’ preferences. If closer relationships with integrator is given the highest priority (let assumes an
increase of 21.3% for the weight of the relationships criteria from 9.8% to 31.1%), then technology sharing
becomes a number two alternative closely behind quantity supplied but way ahead of other factors.
Technology sharing will become the most important alternative if the weight of the relationships factor
increases to more than 32%. Had a decision maker given more priority to the input factor, the prioritiza tion
order will change accordingly. For instance, an increase of weight for the input factor from 16.8% to
35.9% will push the availability of day-old chick into the summit of the prioritization order. Performance
sensitivity analysis had indicated that when the price factor increases from 23.2% to 40%, the price of raw
materials becomes the most important factor in the prioritization ranking, followed by quantity supplied
and output prices. However, it is also worth noting that only with substantial changes in one criteria or
decision maker’s priority can affect the prioritization order.
Figure 2 Dynamic sensitivity analysis for the criterion and sub-criterion
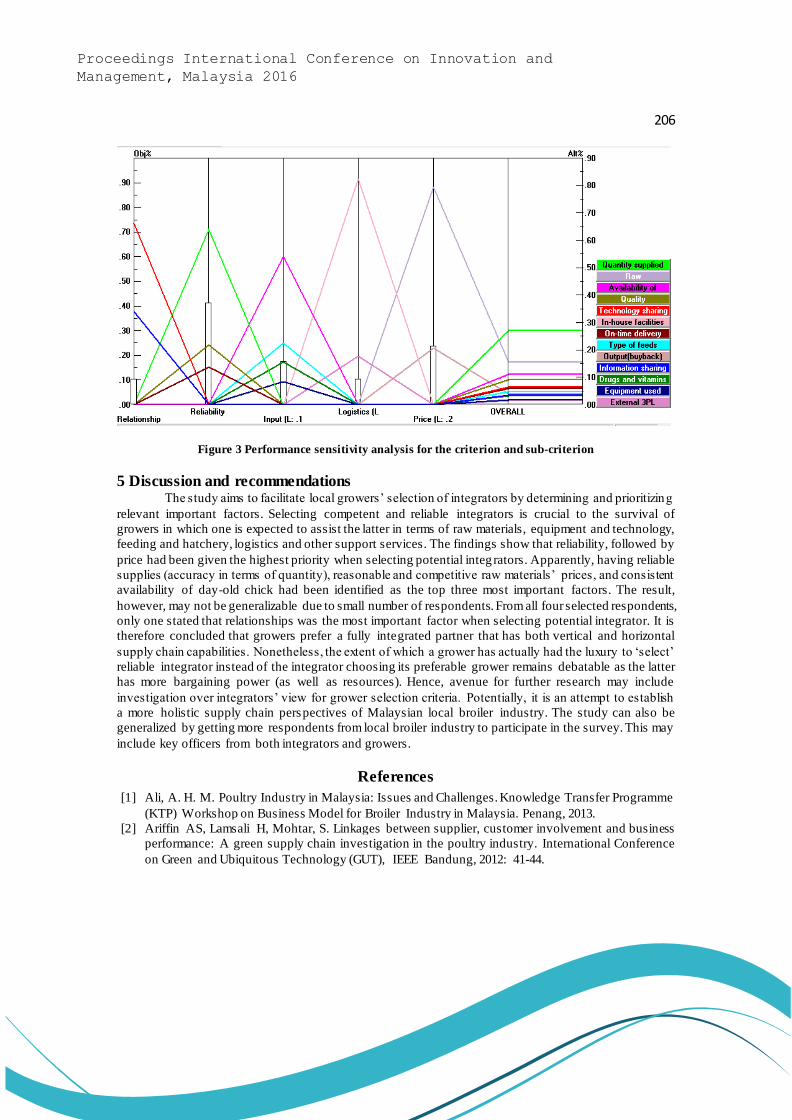
206
Proceedings International Conference on Innovation and
Management, Malaysia 2016
Figure 3 Performance sensitivity analysis for the criterion and sub-criterion
5 Discussion and recommendations The study aims to facilitate local growers’ selection of integrators by determining and prioritizing
relevant important factors. Selecting competent and reliable integrators is crucial to the survival of
growers in which one is expected to assist the latter in terms of raw materials, equipment and technology,
feeding and hatchery, logistics and other support services. The findings show that reliability, followed by
price had been given the highest priority when selecting potential integ rators. Apparently, having reliable
supplies (accuracy in terms of quantity), reasonable and competitive raw materials’ prices, and consistent
availability of day-old chick had been identified as the top three most important factors. The result,
however, may not be generalizable due to small number of respondents. From all four selected respondents,
only one stated that relationships was the most important factor when selecting potential integrator. It is
therefore concluded that growers prefer a fully integrated partner that has both vertical and horizontal
supply chain capabilities. Nonetheless, the extent of which a grower has actually had the luxury to ‘select’
reliable integrator instead of the integrator choosing its preferable grower remains debatable as the latter
has more bargaining power (as well as resources). Hence, avenue for further research may include
investigation over integrators’ view for grower selection criteria. Potentially, it is an attempt to establish
a more holistic supply chain perspectives of Malaysian local broiler industry. The study can also be
generalized by getting more respondents from local broiler industry to participate in the survey. This may
include key officers from both integrators and growers.
References
[1] Ali, A. H. M. Poultry Industry in Malaysia: Issues and Challenges. Knowledge Transfer Programme
(KTP) Workshop on Business Model for Broiler Industry in Malaysia. Penang, 2013.
[2] Ariffin AS, Lamsali H, Mohtar, S. Linkages between supplier, customer involvement and business
performance: A green supply chain investigation in the poultry industry. International Conference
on Green and Ubiquitous Technology (GUT), IEEE Bandung, 2012: 41-44.

207
Proceedings International Conference on Innovation and
Management, Malaysia 2016
[3] Ariffin AS, Lamsali H, Mohtar S. Linkages between Integrator, Grower Involvement and Business
Performance: An Excerpt from Preliminary Findings. International Journal of Supply Chain
Management, 2013, (23): 47-52.
[4] Saaty, Thomas L. Mathematical modeling of dynamic decisions; priorities and hierarchies with time
dependence. Mathematics and computers in Simulation, 1979, 21(4):352-358.
[5] Saaty, Thomas L. How to make a decision: the analytic hierarchy process. European journal of
operational research, 1990, 48(1): 9-26.
[6] Saaty, Thomas L. Highlights and critical points in the theory and application of the analytic hierarchy
process. European journal of operational research, 1994, 74(3): 426-447.
[7] Saaty, Thomas L. Fundamentals of decision making and priority theory with the analytic hierarchy
process. Rws Publications, 2000 (6).
[8] Saaty, Thomas L. Decision making with the analytic hierarchy process. International journal of
services sciences, 2008, 1(1): 83-98.
[9] Opasanon S, Pattarakamol L. Impact analysis of logistics facility relocation using the analytic
hierarchy process (AHP). International Transactions in Operational Research, 2013, 20(3): 325-339.
[10] Vaidya O.S, Sushil K. Analytic hierarchy process: An overview of applications. European Journal
of operational research, 2006, 169(1): 1-29.
[11] Sipahi S, Mehpare T. The analytic hierarchy process and analytic network process: an overview of
applications. Management Decision, 2010, 48(5): 775-808.
[12] Siqueira K. B, da Silva C. A. B, Aguiar D. R. Viability of introducing milk futures contracts in
Brazil: a multiple criteria decision analysis. Agribusiness, 2008, 24(4): 491-509.
[13] Garcia R. G, Almeida I. C. L, Caldara F. R, Nääs I. A, Pereira D. F, Ferreira V. M. O. S. Selecting
the most adequate bedding material for broiler production in Brazil. Revista Brasileira de Ciência
Avícola, 2012, 14(2): 121-127.
[14] Febransyah A, Simangunsong E. Supply chain competitiveness in food industry: An Indonesian
case. Supply Chain Design and Management for Emerging Markets . Springer International
Publishing, (2015), 147-175.
[15] Yakovleva N, Sarkis J, Sloan T. Sustainable benchmarking of supply chains: the case of the food
industry. International Journal of Production Research, 2012, 50(5): 1297-1317.
[16] Korpela J, Tuominen M. A decision support system for strategic issues management of
logistics. International journal of production economics , 1996, (46): 605-620.

208
Proceedings International Conference on Innovation and
Management, Malaysia 2016
An Overview of Procurement Methods in Building Construction
Projects
Ng ChiewTeng1,2, Dr Siti Uzairiah binti Mohd Tobi1, Dr Mohamad Syazli bin Fathi1
1 Razak School of Engineering and Advanced Technology, University Teknologi Malaysia, Kuala
Lumpur, Malaysia
2 Faculty of Engineering and Built Environment, Tunku Abdul Rahman University College, Kuala
Lumpur, Malaysia
(Email: [email protected], [email protected], [email protected])
Abstract There are extensive literatures and studies been done on procurement methods. As a result,
different sets of issues and analysis have been proposed by the previous res earchers. However, there is
still lack of studies that looks into the subject matter of key criteria strategic procurement for building
construction. This review paper will re-assess the current practices of the available procurement methods
for building construction in Malaysia and identify the key procurement selection criteria to develop an
effective decision-making framework. There will be two parts in this paper: First, a review on the various
types of procurement methods that commonly used in Malaysia building construction industry. Second, a
review on key criteria influencing the selection of suitable procurement methods is accessible. As a
conclusion, there is no best procurement method but the development of suitable change management
strategies would allow organisations to move towards a better practice.
Keywords building construction industry, procurement, key criteria
1 Introduction Procurement method defines the management functions of the in project execution and the process
by which the finance design, construction, operation and maintenance activities of a project are executed.
It also establishes the roles, responsibilities and risk allocation of the parties involved in a project and how
the owner pays for the services. An appropriate procurement strategy will have great impact on project
schedule, cost, quality and contract management. There are many different types of procurement methods
that have been developed to overcome the weaknesses of the existing procurement method and to meet
the range of service requirement. The decision makers are faced with challenges when it comes to selecting
the most appropriate procurement method for a specific building as different types of procurement
methods suit different types of projects. Selection of procurement method has a significant importance
effects on the project performance in terms of responsibilities and liabilities [1].
Nowadays, numerous method of procurement method has been established in building construction
procurement in delivering project in order to fulfill the complexity of projects. The most general types
include: Traditional method also known as Design-Bid-Build (DBB), Design-Build (DB), Management
Contracting, Construction Management (CM), Project Finance and Partnering. They have their own
characteristic in terms of risk allocation, responsibilities, activities involved, price certainty and so on.
2 Traditional Procurement Method or Design-Bid-Build (DBB) Traditional procurement method is name as traditional due to it had been exist for a long time in
construction industry and it is only choice for clients to adopt for the past few decades [2]. [3] mentioned
that traditional procurement methods are used to describe procurement which involves the appointment
of design team by client to produce a full construction design before tendered by contractor for the contract
[4]. Traditional procurement methods are pre-defined cost before the commencement of construction
work therefore it results in maximum cost certainty but the sequent ial construction process required longer
209
Proceedings International Conference on Innovation and
Management, Malaysia 2016
time than others procurement methods. Besides that, it is also inflexible in terms of design changes which
result in extra cost and project implications. The clients appointed a lead consultant to carry out the design
work and prepare the contract documents and bill of quantities with assistance of quantity surveyor. A bill
of quantities which had been clearly provides a clear description of item for element of building. Then the
contract will enter into a tendering stage by providing a where allowing contractor to tender for the project.
The presence of bill of quantities can provide certainty of price to client and protect the position of client.
Bidding process is allow tenderer to submit the tender documents which prepared by professional
consultant team and allow the client to select an appropriate contractor through various factor and
requirement for example, pricing factor, reputation of tenderer, financial power of tenderer and etc. After
tender interview and discussion with professional consultant team, a client can do a better decision making
on most suitable tenderer for building contract [5]. Contractor’s obligation is by taking contract to
construct the project in accordance to the requirements of the clien t and professional consultant team.
Construction stage can carry out by contractor once client pass the site possession to contractor. Contractor
must act accordingly and comply with the instruction given by the consultant team (either architect or
engineer).
3 Design and Build (DB) According to [6], due to the separate of design and construct for (DBB), it prolonged the time and
causes the cost overrun concurrently. Therefore, Design and Build been introduced to overcome the
above-mentioned issues. Any organisation management relationship can apply to this procurement
method and responsibility solely allocated to contractor. Contractors replace the design consultant liability
and takes place to design the project and also construct the building according t o their proposed design
which previously approved by client. The design consultant team just direct report to client in order to
seek for solution and this reduce a lot of time [7]. When tendering process, tenderer can submit proposed
design with clear description and present it to client during tender interview. Normally, due to time
constraint, client would choose to apply DB procurement method. Sometimes, client who lack of
knowledge and experience also can impose this procurement method and select the most suitable tenderer
as their contractor to design and construct for the building [8]. Besides that, combination of design and
build stage into single process in this procurement method can significantly reduce the time required and
ensure the cost can be lower [9]. This can help the client to ensure a smooth and strong financial ability
to be proceed and continue contribute within project duration [10].
4 Key Criteria for Procurement Selection [11] categorized the selection criteria into three types which are clients’ requirements, project
characteristics and external environment or can be classified as two groups: external and internal
environment. External environment can be influenced by social culture, policy of politic, growth of
economic and technology factor. Those external environment key criteria which are cannot control by the
project participant. Internal environment factor are happen on project organisation which are project
difficulty, client characteristic, goals that established by client, This internal environment factor can be
control and adjustable by project management team. Time, cost and quality related to project are the key
component that goals established by client which is client requirement. [12] had summarized the list of
client requirement that might affect the selection of procurement methods on Australia construction
industry. As a result, the requirements are speed, risk allocation, complexity, quality level, cost certainty,
price competition, dispute and arbitration, time certainty, flexibility and responsibility. [12] also conclude
that only time certainty and price certainty are definite criteria due to the completion date and price can
be objectively predicted by the client at the initial stage. In contrast, the other seven criteria were regarded
by the experts as subjective.

210
Proceedings International Conference on Innovation and
Management, Malaysia 2016
[2] categorised the criteria into 5 categories which is socio-economic consideration, client
requirements, capital cost, procurement policy, and project characteristics. Socio -economic consideration
consists of political consideration, public/private sector projects, market/economic conditions, and
emerging technology. Client requirements consist of client’s specific requirement, political interences,
globalization and client’s level of knowledge. Capital cost as third group only involves client’s
budget/cash flow. Procurement policy comprise of affirmative action/government policies and funding
arrangements. Project characteristics as last major factor include influence of the life cycle of the project
and size and technical complexity of project.
[13] illustrated that the procurement criteria practices by clients in Banda Aceh, Indonesia are timing ,
controllable variation, complexity, quality, price certainty, competition, responsibility and risk avoida nce.
During the consideration of procurement implementation, it can be divided into four categories which are
participation, approval, supervision and contractor performances. [14] had identified the procurement
methods selection criteria in Iraq construction industry with total of seventeenth criteria: quality level,
speed, responsibility, flexibility for changes, price competition, project size, technology, certainty of cost,
risk avoidance, complexity, accountability, familiarity, time, predictability, c lient involvement,
availability of procurement methods in the local market, legal issues and project type.
[15] said the selection of appropriate procurement methods is a key decision in terms of achieving
client’s goals while an inappropriate choice could resulting into cost overrun, time overrun and potential
dispute between parties. [15] had evaluated all the critical selection criteria where it could be classified
into four major areas of core consideration which are: Project Technicality, Project Business Case and
Financing, Project Risk Management and Public Policy requirement.
[16] reveals clients can be divided into two types which are public clients and private clients. Either
one of the client tend to have different factors on the procurement selection. The criteria been identified
influencing the selection procurement methods in Malaysia construction industry are identified as quality
level, responsibility, price certainty, competition, time, controllable variation, price completion,
government projects, complexity, risk avoidance, and familiarity of clients’ on method of procurement.
Various studies have adopted the [17] as references to established the key criteria of procurement
selection (e.g. [18]; [19]; [20], [21]). [17] states the criteria of procurement selection structure in order to
develop requirement of client as following:
1. Speed (when design and construction stage)
2. Certainty (on price and time that contractor promise to client to complete the project)
3. Flexibility in obliging design changes
4. Quality (on contractors’ reputation and confidence toward design)
5. Complexity (client may specify precise subcontractor, or constructability analysis)
6. Risk allocation/avoidance
7. Accountability (ability to complete project by time, appropriate cost with good quality)
8. Price competition (include value of money, maintenance costs and competitive bidding)
9. Arguments and arbitration
As refer to the criteria set by NEDO (2006), the researcher tried to compare with other researchers
(refer to table 1)
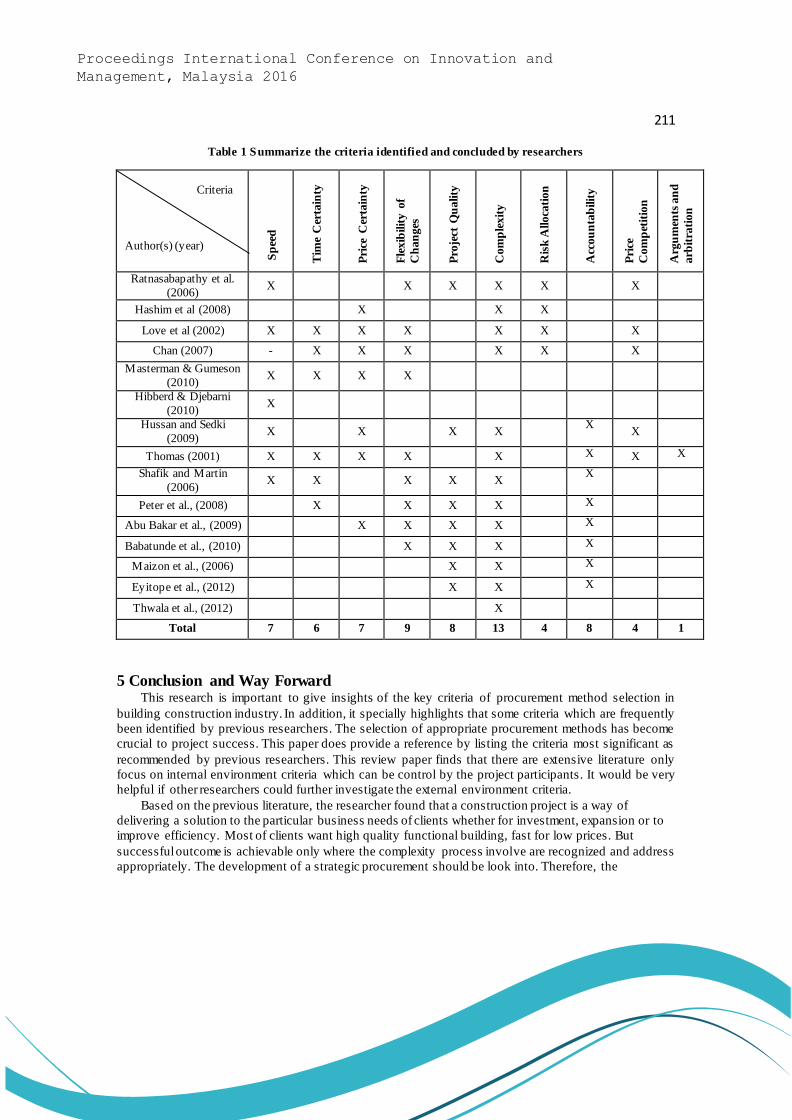
211
Proceedings International Conference on Innovation and
Management, Malaysia 2016
Table 1 Summarize the criteria identified and concluded by researchers
5 Conclusion and Way Forward This research is important to give insights of the key criteria of procurement method selection in
building construction industry. In addition, it specially highlights that some criteria which are frequently
been identified by previous researchers. The selection of appropriate procurement methods has become
crucial to project success. This paper does provide a reference by listing the criteria most significant as
recommended by previous researchers. This review paper finds that there are extensive literature only
focus on internal environment criteria which can be control by the project participants. It would be very
helpful if other researchers could further investigate the external environment criteria.
Based on the previous literature, the researcher found that a construction project is a way of
delivering a solution to the particular business needs of clients whether for investment, expansion or to
improve efficiency. Most of clients want high quality functional building, fast for low prices. But
successful outcome is achievable only where the complexity process involve are recognized and address
appropriately. The development of a strategic procurement should be look into. Therefore, the
Criteria
Author(s) (year)
Sp
eed
Tim
e C
erta
inty
Pri
ce C
erta
inty
Fle
xib
ilit
y o
f
Ch
an
ges
Pro
ject
Qu
ality
Com
ple
xit
y
Ris
k A
lloca
tion
Acc
ou
nta
bilit
y
Pri
ce
Com
pet
itio
n
Arg
um
ents
an
d
arb
itra
tion
Ratnasabapathy et al.
(2006) X X X X X
X
Hashim et al (2008) X X X
Love et al (2002) X X X X X X X
Chan (2007) - X X X X X X
Masterman & Gumeson
(2010) X X X X
Hibberd & Djebarni
(2010) X
Hussan and Sedki
(2009) X X X X
X X
Thomas (2001) X X X X X X X X
Shafik and Martin
(2006) X X X X X
X
Peter et al., (2008) X X X X X
Abu Bakar et al., (2009) X X X X X
Babatunde et al., (2010) X X X X
Maizon et al., (2006) X X X
Eyitope et al., (2012) X X X
Thwala et al., (2012) X
Total 7 6 7 9 8 13 4 8 4 1

212
Proceedings International Conference on Innovation and
Management, Malaysia 2016
researcher will focus into this aspect by investigate and propose a strategic procurement tailored with
the unique needs of client, the role of client, strategies brief project and etc in future research.
References [1] Molenaar, K, Sobin, N, Gransberg, D, Tamera, T.L, Sinem, K.S & Horman, M. Sustainable, High
Performance Projects and Project Delivery Methods [J], The Charles Pankow Foundation and The
Design-Build Institute of America, 2009, 3(1): 1~12
[2] Mathonsi, M.D. & Thwala, W.D. Factors influencing the selection of procurement systems in the
South African construction industry [J], African Journal of Business Management, 2012, 3583~3594
[3] Larmour, A. A study of procurement routes and their use in the commercial sector, 2012, PhD thesis
[D], Interdisplinary Design for the Built Environment
[4] Cheng, J.C., Law, K.H., Bjornsson, H, Jones, A & Sriram, R. A Service oriented Framework for
Construction Supply Chain Integration [J], Automation in Construction, 2010, 19(1): 245~260
[5] Mollick, E. People and Process, Suits and Innovators: The Role of Individuals in Firm Performance
[J], Strategic Management Journal, 2012, 3(3): 1001~1015
[6] Ashworth, A. Contractual Procedures in the Construction Industry, London: Pearson, 2006
[7] Gulati, R & Tushman, M. Meta-Organization Design: Rethinking Design in Interorganizational and
Cummunity Contexts [J], Strategic Management Journal, 2012, 4(2): 308~313
[8] Halpin, D.W. Construction Management, New York: John Wiley & Sons, 2006
[9] Cho, K.M., Hyun, C.T., Koo, K.J. & Hong, T.H. Partnering Process Model for Public-Sector Fast-
Track Design-Build Projects in Korea [J], Journal of Management in Engineering, 2010,
1(3):178~188
[10] Kaplanoglu, S.B. & Arditi, D. Guidelines for Pre-Project peer Reviews in Construction Contracting
[J], International Journal of Project Organisation and Management, 2010, 15(3):190~203
[11] Ratnasabapathy, S, Rameezdeen, R & Gamage, I. Macro level factors affecting the construction
procurement selection: Amulti criteria model [J], Built-Environment Sri Lanka, 2006, 3(4):581~591
[12] Thomas, Ng., Luu, D., and Chen, S. Decision criteria and their subjectivity in construction
procurement selection [J]. The Australian Journal of Construction Economics and building, 2001,
pp.70-80
[13] Abu Bakar, A., Osman, O., Bulba, A. Procurement selection practices in post disaster project
management: A case study in banda aceh, Indonesia [C]. Fifth International Conference on
Construction in the 21st Century (CITC-V), Collaboration and Integration in engineering,
management and Technology , Istanbul, Turkey, 2009
[14] Husam, D and Sedki E.R. Identification of procurement system selection criteria in the construction
industry in Iraq by using Delphi method [J], 2009, Department of engineering Affairs, Baghdad
University, Baghdad, Iraq
[15] Eyitope, A., Ojo, S., Ajibola, M., Gbadebo, R. Critical selection criteria for appropriate procurement
strategy for project delivery in Nigeria [J], Journal of Emerging Trends in Economics and
Management Sciences (JETEMS), 2012 pp. 422-428
[16] Maizon, H., Li, M., Yin, Ng., Hooi, Ng., Heng, S., and Yong, T. Factors influencing the selection of
procurement systems by clients [J], 2006, Faculty of Built Environment, University of Technology
Malaysia
[17] NEDO 2006 Think About Building [R], National Economic Development Office, HMSO, United
Kingdom.
[18] Chan, C.T. Fuzzy procurement selection model for construction projects [J], Construction
Management and Economics, 2007, 25(6):611~618

213
Proceedings International Conference on Innovation and
Management, Malaysia 2016
[19] Love, P E D, Irani, Z, Cheng, E, & Li, H. A model for supporting inter-organizational relations in the
supply chain [J], Engineering Construction and Architectural Managemen t, 2002, 9(1):2~15
[20] Luu, D.T., Ng, S.T., & Chen, S.E. Decision Criteria and Their Subjectivity in Construction
Procurement Selection [J], The Australian Journal of Construction Economics and Building, 2014,
2(1):70~80
[21] Peter E.D. Love Peter R. Davis David J. Edwards David Baccarini, Uncertainty avoidance: public
sector clients and procurement selection [J], International Journal of Public Sector Management,
2008, 21(7):753~776
[22] Hashim, M., Yuet Li, M.C., Yin, N.C., Hooi, N.S., Heng, S.M. & Young, T.L. Factors Influencing
The Selection Of Procurement Systems By Clients [J], Journal of Construction Engineering and
Management, 2008, 1(1):1~10
[23] Chan, C.T. Fuzzy procurement selection model for construction projects [J], Construction
Management and Economics, 2007, 25(6):611~618
[24] Masterman, J.W.E & Gameson, R.N. 2010, Client characteristics and needs in relation to their
selection of building procuremnt system, viewed on 8 October 2016
http://www.irbnet.de/daten/iconda/CIB12576.pdf
[25] Hibberd, P & Djebarni, R. 2010, Criteria of choice for procurement methods. Viewed on 28
September 2016,
[26] Husam, E. & Sedki E.R., 2009. Identification of procurement system selection criteria in the
construction in Iraq by using Delphi method. Department of engineering affairs, Baghdad University,
Baghdad, Iraq
[27] Holt, GD, Proverbs, D & Love, P.E.D.Survey findings on UK construction procurement: Is it
achieving lowest cost, or value? [J] Asia Pacific Building and Construction Management Journal,
2000, 5(1):13~20
[28] Babatunde, S.O., Opawole, A. & Ujaddughe, I.C. Appraisal of project procurement methods in the
Nigerian [J] Journal of civil Engineering Dimension (CED), 2010, 12(1):1~7
[29] Love, Peter E.D. and Davis, Peter and Baccarini, David and Wilson, Geoff and Lopez, Robert 2008
Procurement selection in the public sector : a tale of two states [C], In: Clients Driving Innovation:
Benefiting from Innovation Conference, 12-14 March, 2008 , Gold Coast, Australia
[30] Shafik, M and Martin, P. The impact of procurement methods on the Scottish housebuilding industry
[C] In: Boyd, D (Ed) Procs 22nd Annual ARCOM Conference, 4-6 September 2006, Birmingham,
UK, Association of Researchers in Construction Management, 81-90
214
Proceedings International Conference on Innovation and
Management, Malaysia 2016
E-Procurement and Supply Chain Performance in TM Berhad
Shahrizal Ahmad Rosli1,2 Ahmad Rahman Songip2
1 Group procurement, TM Berhad, Jalan Pantai Baharu, 59200 Kuala Lumpur, Malaysia
2 Department of Management of Technology, Malaysia Japan International Institute Technology,
Universiti Teknologi Malaysia Kuala Lumpur, Jalan Semarak
54100 Kuala Lumpur, Malaysia
(Email: [email protected], [email protected])
Abstract The research prove that the factors affecting the success of e-procurement system sharing
between supply chain integration, information sharing and partner relationships. Based on the
understanding those factors the research provides suggestions on how to improve e -procurement system
in TM Berhad.
Keywords Interviews, Management of supply chain, Performance of Supply chain, Integration of
Supply chain, E-procurement, Survey, Group Procurement TM Berhad.
1 Introduction E-procurement system had been identified one of the medium in business process in the process of
supply chain [1]. Based on previous researchers, e-procurement system basically are the IT based purchase
online system and well known at the input process of the supply chain management at any organization
[3]. In other words, information infrastructures like E-procurement are growth well in previous years and
come together with others technology or infrastructure. This will ensure the success of business activities
in the organization are growth well [4]. E-procurement need to growth in line with the changes it IT
embedded in the system [2, 3]. Organizations that implement the e-procurement systems are able to
generate value because it utilizes information technology resources on supply chain process [14]. The
benefits of e-procurement system will ensure the effectiveness in the supply chain process in the
organizations.
To ensure success TM Berhad business, e-procurement system needs further analysis and
improvement.With E-procurement it will ensure the procurement manager meet the achievement of
competency by really understanding the information technology impact in the business management
process [8]. This research will examine the integration of supply chain, relationships of partners and
sharing in information through e-procurement to ensure the effectiveness of supply chain. E-procurement
system will improve supply chain management for TM and its partners
2 Definition of E-procurement E-procurement is an electronic procurement system or online system that has information technology
capabilities, and it also can be called e-business. It has the ability to improve the effectiveness of operation
schedule or process in supply chain [4]. Performance for supply chain process refers to the evaluation of
supply chain management that includes tangible and intangible factors [11, 12]. Activities of business
through information technology can be called e-procurement. Value creation is an important factor in
determining the effectiveness of supply chain to the organization [2]. Practical features of E-procurement
systems will ensure organizations improve their efficiency based on supply chain value creation. Basically
e-procurement has 4 characteristics of functions that are electronic design, electronic evaluation,
electronic sourcing and electronic negotiation [3, 4, 6].
With e-procurement, it will be able to produce a useful function for management of supply chain and
able to improve the supply chain performance [1, 10, 12]. Integration of Supply chain, relationships

215
Proceedings International Conference on Innovation and
Management, Malaysia 2016
partner and information are processes that connect between performance of supply chain and E-
procurement systems.
3 Research Framework Table 1 represents the research framework that will be used for this study. The DV’s are performance
of supply chain and integration of supply chain while the IV’s is information sharing, partner relationship
and e-procurement. E-procurement has divided into 4 dimensions namely electronic design, electronic
sourcing, electronic negotiation and electronic sourcing. Partner relationship is divided into 2 dimensions
namely reciprocity and bonding. Information sharing is divided into 2 dimensions namely information
flow and information quality. Supply chain integration is divided into 2 dimensions namely coordination
and integration activity. And lastly supply chain performance is divided into 2 dimensions namely tangible
dimension and intangible dimension.
Table 1: Definition of Operational for IV
Variable Definition of operational
Relationship of Partner A relationship among partners and enterprise
E-Procurement Consists of 4 functions as below:
i. Electronic design
ii. Electronic sourcing iii. Electronic negotiation
iv. Electronic evaluation
Sharing of Information Consists of 2 functions as below:
i. Information Flow ii. Information Quality
Performance of Supply Chain Assessment in management of supply chain includes intangible and
tangible factors
Integration of Supply Chain
Involves of 2 functions as below:
i. Activity integration
ii. Coordination
Figure 1: Research Framework
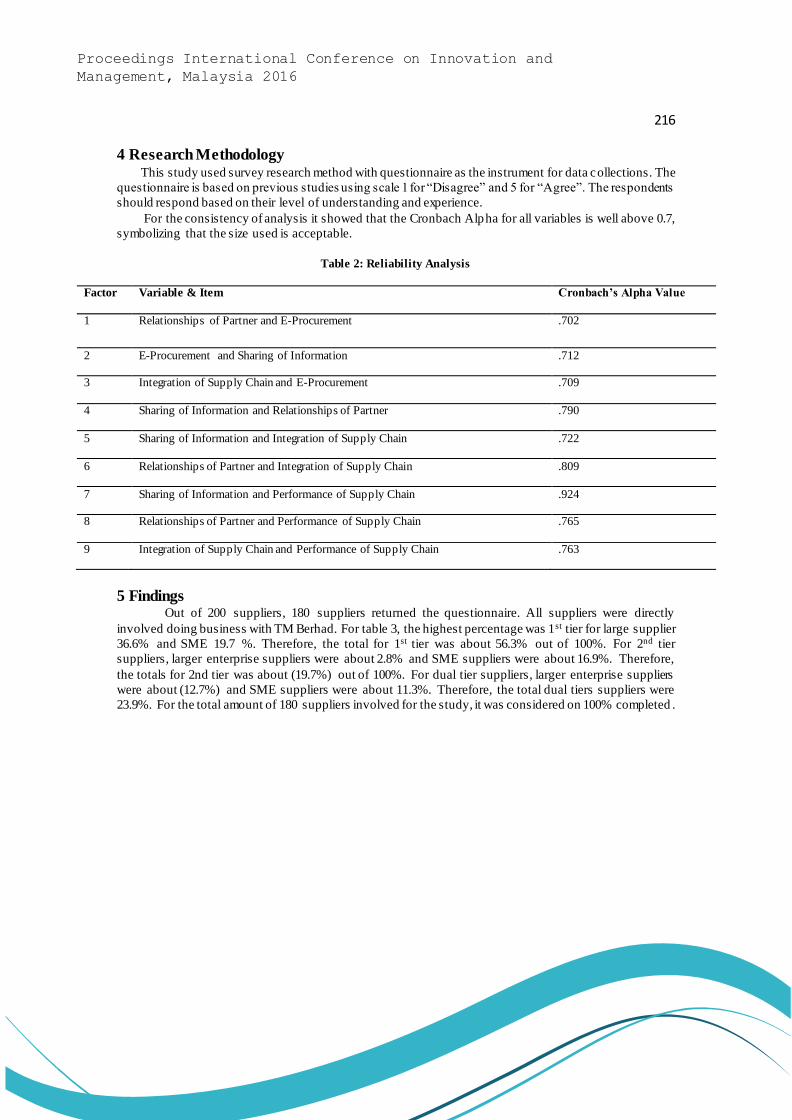
216
Proceedings International Conference on Innovation and
Management, Malaysia 2016
4 Research Methodology This study used survey research method with questionnaire as the instrument for data collections. The
questionnaire is based on previous studies using scale 1 for “Disagree” and 5 for “Agree”. The respondents
should respond based on their level of understanding and experience.
For the consistency of analysis it showed that the Cronbach Alpha for all variables is well above 0.7,
symbolizing that the size used is acceptable.
Table 2: Reliability Analysis
Factor Variable & Item Cronbach’s Alpha Value
1 Relationships of Partner and E-Procurement .702
2 E-Procurement and Sharing of Information .712
3 Integration of Supply Chain and E-Procurement .709
4 Sharing of Information and Relationships of Partner .790
5 Sharing of Information and Integration of Supply Chain .722
6 Relationships of Partner and Integration of Supply Chain .809
7 Sharing of Information and Performance of Supply Chain .924
8 Relationships of Partner and Performance of Supply Chain .765
9 Integration of Supply Chain and Performance of Supply Chain .763
5 Findings Out of 200 suppliers, 180 suppliers returned the questionnaire. All suppliers were directly
involved doing business with TM Berhad. For table 3, the highest percentage was 1st tier for large supplier
36.6% and SME 19.7 %. Therefore, the total for 1st tier was about 56.3% out of 100%. For 2nd tier
suppliers, larger enterprise suppliers were about 2.8% and SME suppliers were about 16.9%. Therefore,
the totals for 2nd tier was about (19.7%) out of 100%. For dual tier suppliers, larger enterprise suppliers
were about (12.7%) and SME suppliers were about 11.3%. Therefore, the total dual tiers suppliers were
23.9%. For the total amount of 180 suppliers involved for the study, it was considered on 100% completed .
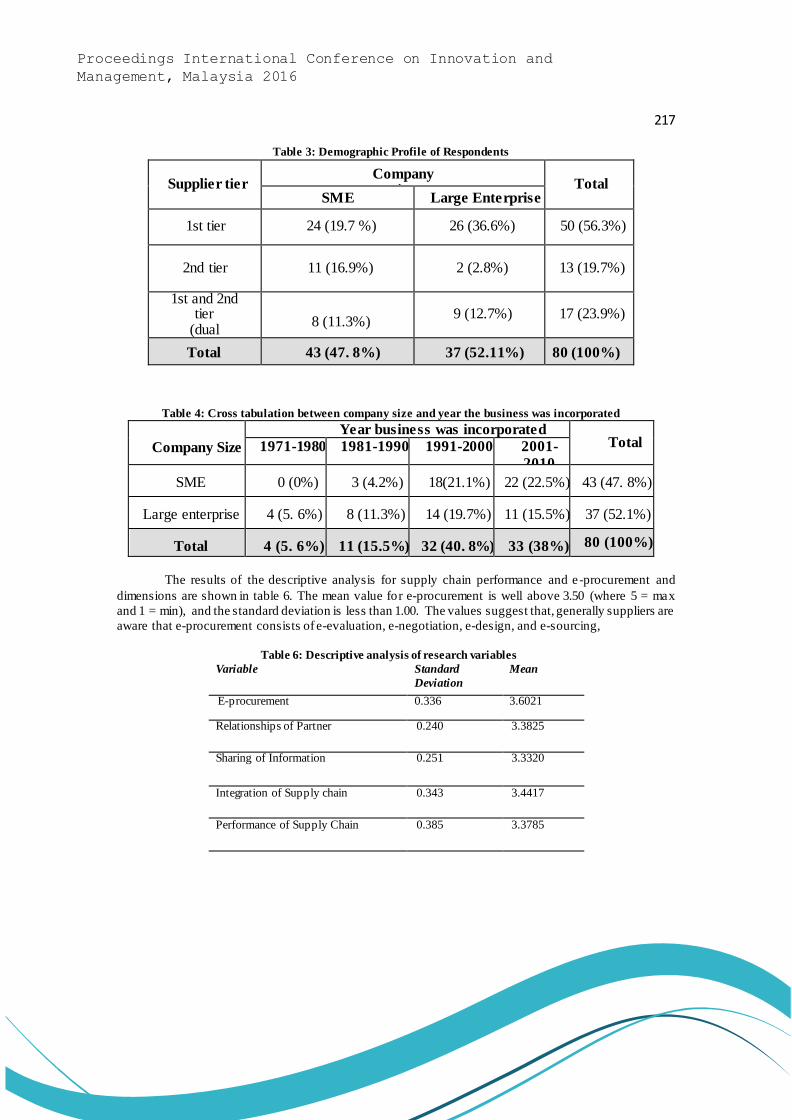
217
Proceedings International Conference on Innovation and
Management, Malaysia 2016
Table 3: Demographic Profile of Respondents
Supplier tier
Company size
Total
SME Large Enterprise
1st tier
24 (19.7 %)
26 (36.6%)
50 (56.3%)
2nd tier
11 (16.9%)
2 (2.8%)
13 (19.7%)
1st and 2nd tier
(dual tiers
suppliers)
8 (11.3%)
9 (12.7%)
17 (23.9%)
Total 43 (47. 8%) 37 (52.11%) 80 (100%)
Table 4: Cross tabulation between company size and year the business was incorporated
Company Size
Year business was incorporated Total 1971-1980 1981-1990 1991-2000 2001-
2010 SME
0 (0%)
3 (4.2%)
18(21.1%)
22 (22.5%)
43 (47. 8%)
Large enterprise
4 (5. 6%)
8 (11.3%)
14 (19.7%)
11 (15.5%)
37 (52.1%)
Total
4 (5. 6%)
11 (15.5%)
32 (40. 8%)
33 (38%) 80 (100%)
The results of the descriptive analysis for supply chain performance and e-procurement and
dimensions are shown in table 6. The mean value for e-procurement is well above 3.50 (where 5 = max
and 1 = min), and the standard deviation is less than 1.00. The values suggest that, generally suppliers are
aware that e-procurement consists of e-evaluation, e-negotiation, e-design, and e-sourcing,
Table 6: Descriptive analysis of research variables
Variable Standard
Deviation
Mean
E-procurement 0.336 3.6021
Relationships of Partner
0.240 3.3825
Sharing of Information 0.251 3.3320
Integration of Supply chain 0.343 3.4417
Performance of Supply Chain 0.385 3.3785
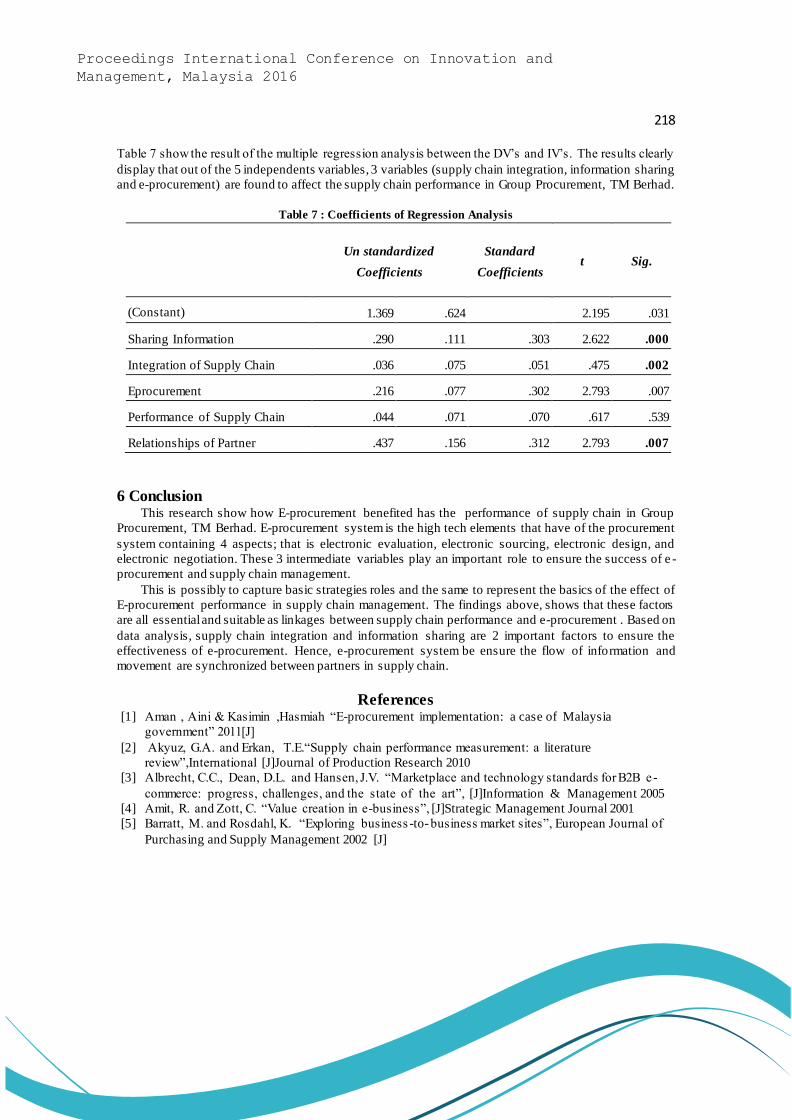
218
Proceedings International Conference on Innovation and
Management, Malaysia 2016
Table 7 show the result of the multiple regression analysis between the DV’s and IV’s. The results clearly
display that out of the 5 independents variables, 3 variables (supply chain integration, information sharing
and e-procurement) are found to affect the supply chain performance in Group Procurement, TM Berhad.
Table 7 : Coefficients of Regression Analysis
Un standardized
Coefficients
Standard
Coefficients t Sig.
(Constant) 1.369 .624
2.195 .031
Sharing Information .290 .111 .303 2.622 .000
Integration of Supply Chain .036 .075 .051 .475 .002
Eprocurement .216 .077 .302 2.793 .007
Performance of Supply Chain .044 .071 .070 .617 .539
Relationships of Partner .437 .156 .312 2.793 .007
6 Conclusion This research show how E-procurement benefited has the performance of supply chain in Group
Procurement, TM Berhad. E-procurement system is the high tech elements that have of the procurement
system containing 4 aspects; that is electronic evaluation, electronic sourcing, electronic design, and
electronic negotiation. These 3 intermediate variables play an important role to ensure the success of e -
procurement and supply chain management.
This is possibly to capture basic strategies roles and the same to represent the basics of the effect of
E-procurement performance in supply chain management. The findings above, shows that these factors
are all essential and suitable as linkages between supply chain performance and e-procurement . Based on
data analysis, supply chain integration and information sharing are 2 important factors to ensure the
effectiveness of e-procurement. Hence, e-procurement system be ensure the flow of information and
movement are synchronized between partners in supply chain.
References [1] Aman , Aini & Kasimin ,Hasmiah “E-procurement implementation: a case of Malaysia
government” 2011[J]
[2] Akyuz, G.A. and Erkan, T.E.“Supply chain performance measurement: a literature
review”,International [J]Journal of Production Research 2010
[3] Albrecht, C.C., Dean, D.L. and Hansen, J.V. “Marketplace and technology standards for B2B e -
commerce: progress, challenges, and the state of the art”, [J]Information & Management 2005
[4] Amit, R. and Zott, C. “Value creation in e-business”, [J]Strategic Management Journal 2001
[5] Barratt, M. and Rosdahl, K. “Exploring business -to- business market sites”, European Journal of
Purchasing and Supply Management 2002 [J]

219
Proceedings International Conference on Innovation and
Management, Malaysia 2016
[6] Cagliano, R., Caniato, F. and Spina, G.“E-business strategy: how companies are shaping their
supply chain [J] through the internet”, International Journal of Operations and Production
Management 2003
[7] Dornier, P.-P., Ernst, R., Fender, M. and Kouvelis, P., Global Operations and Logistics, John
Wiley [J]& Sons, New York, NY 1998
[8] Eng, T.Y. “The role of e-marketplaces in supply chain management”, Industrial Marketing
Management 2004 [J]
[9] Fornell, C. and Larcker, D.F. “Evaluating structural equation models with unobservable variables
and measurement error”, Journal of Marketing Research 1981 [J]
[10] Quesada, Gioconda; E. Gonza´lez, Marvin; Mueller, James and Mueller, Rene “Impact of e -
procurement on procurement practices and performance” 2010 [J]
[11] Gunasekaran, A., Patel, C. and McGaughey, R.E.“A framework for supply chain performance
measurement”, International Journal of Production Economics 2004 [J]
[12] Hsin Chang ,Hsin; Chuan Tsai, Yao and Hao Hsu, Che “E-procurement and supply chain
performance” 2013 [J]
[13] Gamal Aboelmaged, Mohamed ” Predicting e-procurement adoption in a developing country. An
empirical integration of technology acceptance model and theory of planned behavior” 2010 [J]
[14] Rotchanakitumnuai, Siriluck “Assessment of e-procurement auction with a balanced scorecard”
2012 [J]

220
Proceedings International Conference on Innovation and
Management, Malaysia 2016
Theme 7: Human Resource and Organization Behaviour
221
Proceedings International Conference on Innovation and
Management, Malaysia 2016
Management of Technology (Overcoming Maintenance Competency
Deficiency) - The Aviation Maintenance Industry Perspective and Structured on Job Training (S-OJT)
Liew Chee Leong Dr Mohammad Ali Tareq
Management of Technology Department, Malaysian Japan International Institute of Technology
Universiti Teknologi Malaysia Kuala Lumpur, Jalan Sultan Yahya Petra, 54100 Kuala Lumpur, Wilayah
Persekutuan Kuala Lumpur, Malaysia
(E-mail: [email protected], [email protected])
Abstract Competency (knowledge, skills and abilities) deficiency of employees in an engineering
organization is a critical issue as competency deficiency leads to organizational inefficiencies and
ineffectiveness. This results in financial losses and organizational failure. For individuals, competency
deficiency means incapability and degraded performance. This may results in inability to meet
performance targets and eventually affects one’s promotion and career development. While many
organization attempt to address the employees competency deficiency issues, not everyone’s efforts
were fruitful. This is true when an organization require specialized knowledge, skills and abilities .
Besides, there could be specific issues in overcoming the deficiency that may not be fully understood. If
competency deficiencies is critical to both organizations and individuals, and if the organizations and
individuals experience difficulty in overcoming this issue, the know how to overcome these competency
deficiencies is a must. The purpose of this paper is to describe a process that may be adopted in
overcoming competency deficiencies within an organization in an engineering sector such as aircraft
maintenance, repair and overhaul facility.
Keywords Competency, structured on job training, organizational performance
1 Introduction One of the critical issues faced by managers today in an organization is ensuring th at its
employees have the competency to fulfill existing and future work requirements [1]. [2] defined
competency as “things” that individual must demonstrate to be effective in a job, role, function, task or
duty. It includes the behavior, motivation and technical knowledge and skills. For organizations,
competency deficiency leads to organizational inefficiencies and ineffectiveness. This results in financial
losses, organizational failure and sometimes catastrophe. For individuals, competency deficiency means
incapability and degraded performance which increases the incident and accident risk. This may results
in inability to meet performance targets and eventually affects one promotion and career development.
From the context of aviation maintenance industry, competency of the maintenance personnel is
extremely crucial to ensure that the airworthiness and safe operation of the aircraft is maintained at all
times. [3] uses the term airworthiness to define the state of an aircraft where the aircraft confo rms to its
type design and is in a condition for safe operation. In order to achieve the airworthiness of the aircraft to
an acceptable level, the aircraft needs to be maintained in accordance to the manufacturer and authority
requirements.
[4], described one of the key purpose of maintenance is to ensure that the airworthiness of the
aircraft are maintained to meet the manufacturer’s and regulatory requirements. Therefore, it is important
that the maintenance personnel receive the appropriate training to have the right competency.
According to [5], the maintenance of aircraft has been becoming more and more complex.
Technology advancement has caused the aircraft to become more and more sophisticated. The
development of integrated avionics systems and composite material structural construction has been
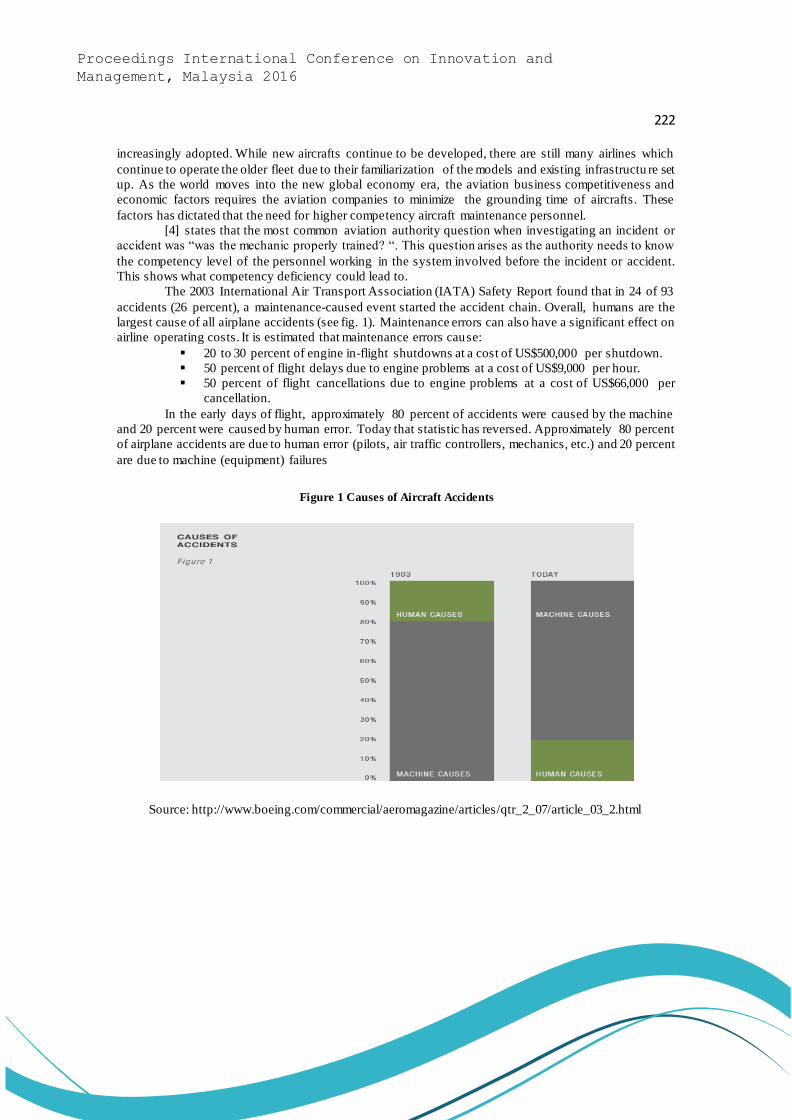
222
Proceedings International Conference on Innovation and
Management, Malaysia 2016
increasingly adopted. While new aircrafts continue to be developed, there are still many airlines which
continue to operate the older fleet due to their familiarization of the models and existing infrastructu re set
up. As the world moves into the new global economy era, the aviation business competitiveness and
economic factors requires the aviation companies to minimize the grounding time of aircrafts. These
factors has dictated that the need for higher competency aircraft maintenance personnel.
[4] states that the most common aviation authority question when investigating an incident or
accident was “was the mechanic properly trained? “. This question arises as the authority needs to know
the competency level of the personnel working in the system involved before the incident or accident.
This shows what competency deficiency could lead to.
The 2003 International Air Transport Association (IATA) Safety Report found that in 24 of 93
accidents (26 percent), a maintenance-caused event started the accident chain. Overall, humans are the
largest cause of all airplane accidents (see fig. 1). Maintenance errors can also have a significant effect on
airline operating costs. It is estimated that maintenance errors cause:
20 to 30 percent of engine in-flight shutdowns at a cost of US$500,000 per shutdown.
50 percent of flight delays due to engine problems at a cost of US$9,000 per hour.
50 percent of flight cancellations due to engine problems at a cost of US$66,000 per
cancellation.
In the early days of flight, approximately 80 percent of accidents were caused by the machine
and 20 percent were caused by human error. Today that statistic has reversed. Approximately 80 percent
of airplane accidents are due to human error (pilots, air traffic controllers, mechanics, etc.) and 20 percent
are due to machine (equipment) failures
Figure 1 Causes of Aircraft Accidents
Source: http://www.boeing.com/commercial/aeromagazine/articles/qtr_2_07/article_03_2.html
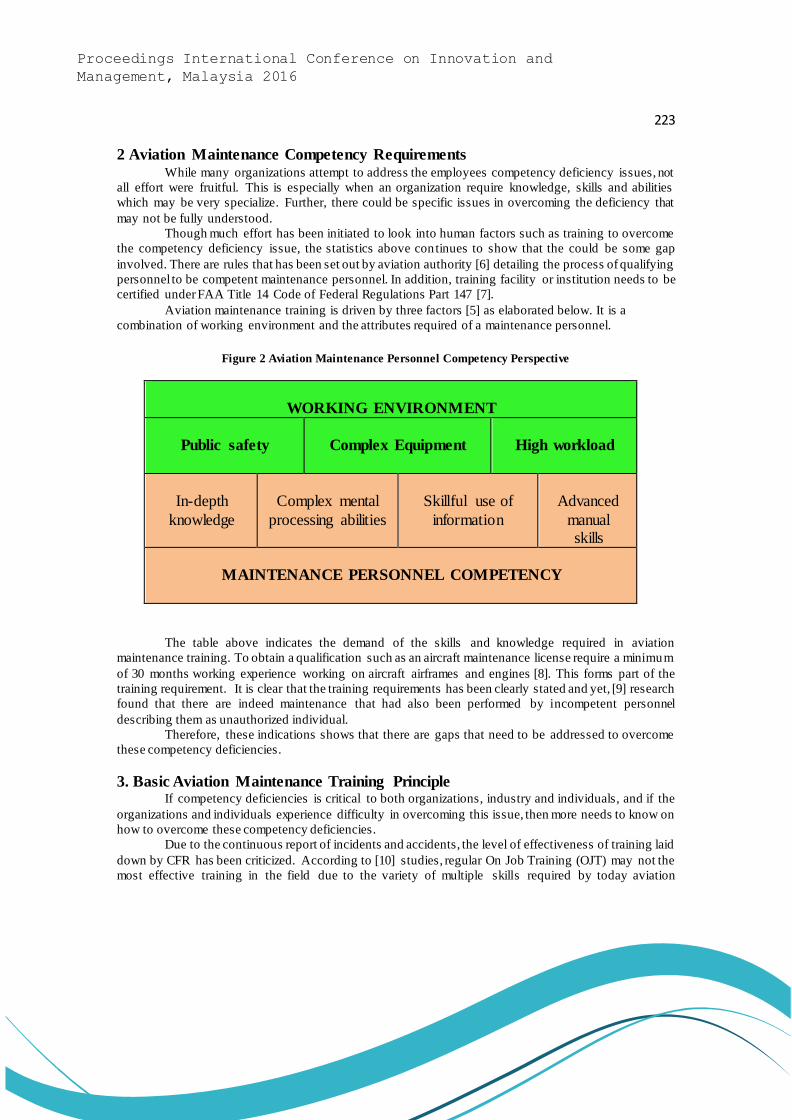
223
Proceedings International Conference on Innovation and
Management, Malaysia 2016
2 Aviation Maintenance Competency Requirements While many organizations attempt to address the employees competency deficiency issues, not
all effort were fruitful. This is especially when an organization require knowledge, skills and abilities
which may be very specialize. Further, there could be specific issues in overcoming the deficiency that
may not be fully understood.
Though much effort has been initiated to look into human factors such as training to overcome
the competency deficiency issue, the statistics above continues to show that the could be some gap
involved. There are rules that has been set out by aviation authority [6] detailing the process of qualifying
personnel to be competent maintenance personnel. In addition, training facility or institution needs to be
certified under FAA Title 14 Code of Federal Regulations Part 147 [7].
Aviation maintenance training is driven by three factors [5] as elaborated below. It is a
combination of working environment and the attributes required of a maintenance personnel.
Figure 2 Aviation Maintenance Personnel Competency Perspective
WORKING ENVIRONMENT
Public safety
Complex Equipment
High workload
In-depth
knowledge
Complex mental
processing abilities
Skillful use of
information
Advanced
manual skills
MAINTENANCE PERSONNEL COMPETENCY
The table above indicates the demand of the skills and knowledge required in aviation
maintenance training. To obtain a qualification such as an aircraft maintenance license require a minimum
of 30 months working experience working on aircraft airframes and engines [8]. This forms part of the
training requirement. It is clear that the training requirements has been clearly stated and yet, [9] research
found that there are indeed maintenance that had also been performed by incompetent personnel
describing them as unauthorized individual.
Therefore, these indications shows that there are gaps that need to be addressed to overcome
these competency deficiencies.
3. Basic Aviation Maintenance Training Principle If competency deficiencies is critical to both organizations, industry and individuals, and if the
organizations and individuals experience difficulty in overcoming this issue, then more needs to know on
how to overcome these competency deficiencies.
Due to the continuous report of incidents and accidents, the level of effectiveness of training laid
down by CFR has been criticized. According to [10] studies, regular On Job Training (OJT) may not the
most effective training in the field due to the variety of multiple skills required by today aviation

224
Proceedings International Conference on Innovation and
Management, Malaysia 2016
maintenance personnel. One of the criticism of the current OJT practices is it tends to be lax as well as
unstructured [5]. In addition, training on the field or maintenance facility tends to be carried out on the
job without a formal and well-structured set up.
It appear that junior aircraft maintenance technician were attached to senior technicians for
unscheduled OJT which appear to be non-systematic. It also appear difficult to ensure that senior
technicians teaching process are sufficient to ensure that there is efficient knowledge and skills transfer to
the junior [11].
Basic training concepts that are generally being adopted by the society has also been applied to
aviation maintenance training. Basic training concepts consist of theory in classrooms setting followed by
video or demo presentation [12]. The effectiveness of training is influenced by the format, content and
delivery mode that is able to match the trainees need.
[13], advocated an approach known as systems approach. This approach claims to be an efficient
training where the knowledge and skills required are delivered at the correct amount at the appropriate
time to the learner. Trainers are expected to understand the maintenance task that the learners are exp ected
to learn and later perform correctly. This appear primarily in the classroom setting. There is doubt of the
level competency that can be achieved with this classroom approach especially in aircraft maintenance
competency.
4. Structured On-Job-Training Approach
There is an increasing number of organizations seeking for the right approaches to develop the
competency of employees [14]. The approach that is proposed is the structured on job training (S-OJT)
[1]. S-OJT is being defined as a planned process by having experienced technicians to train new
technicians on units of task in actual work setting. The approach appeared to be suitable for the aviation
maintenance training due to the fact that an operating aircraft and it’s environment is the avenue where
competency will be applied.
According to [1], majority of the training programs in organization are being set in classroom.
In reality, employees such as aircraft maintenance technicians learns the most skills and knowledge in a
work setting while actually performing their task. Though majority of training institution have good
facilities for training, there is still a vast difference between training facility and actual work setting. As
the S-OJT utilizes the workplace as the training and learning s etting, this presents a closest learning
condition for a learner.
Due to proximity of this this approach to the actual working environment, the level of
predictability of training effectiveness improves as it is being conducted by mostly senior technician in a
working facility. S-OJT has a flexibility where the training approach can be initiated as and when the need
arises with minimal demand on special arrangement within an organization.
As S-OJT is being conducted in an actual working environment (aircraft maintenance facility),
supervisors and managers may serve as trainers who is able to emphasize the specific skills and knowledge
thereby effectively transferring the core knowledge and skills that is essential for the task. This directly
address the competency areas that is crucial for the task or work. Generally this process involves the actual
work setting, learner (new technicians) and trainers (manager, supervisor and senior technicians).
The process [14] covers getting the trainer ready, learner ready, training events during delivery
of the training and means used including periodic feedback, follow-up observations and performance
rating with the objectives that the learner has been able to pick up the content of the training. The S-OJT
ends with a results of achieving the objectives of the training, impact on work and individual self-
development progress. Eventually, the organization is able to ensure that its competency are available as
it continues to sustain and move forward.
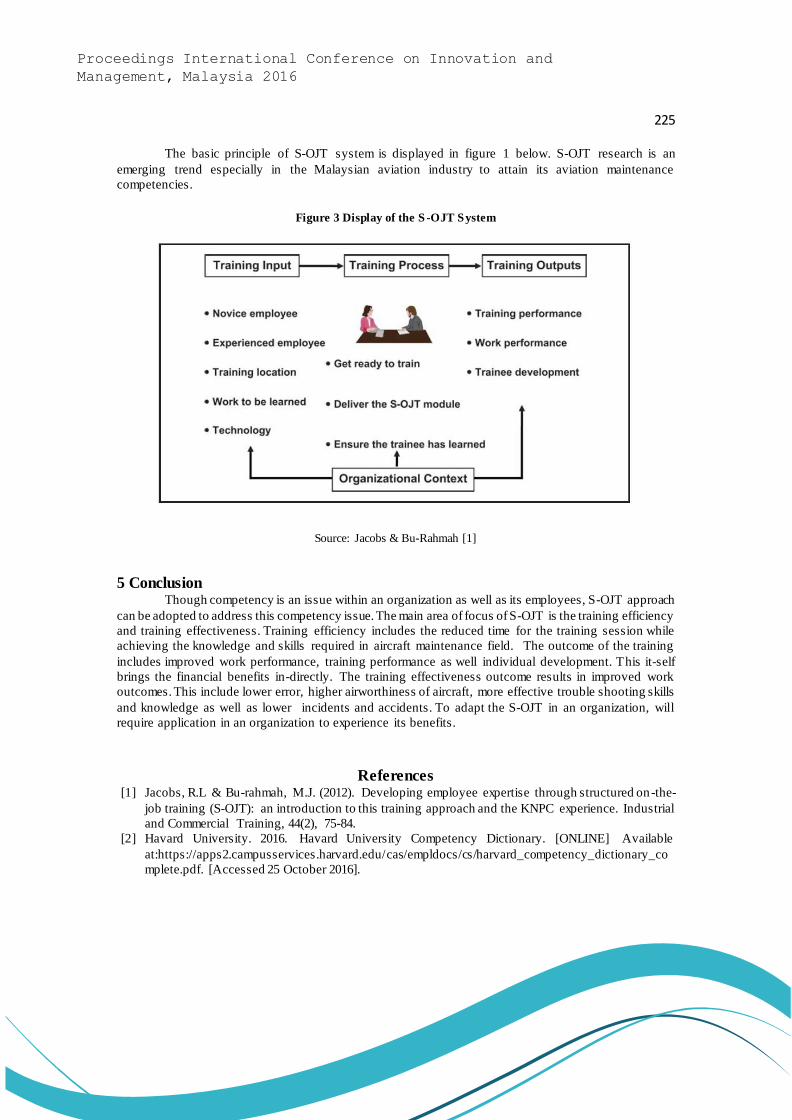
225
Proceedings International Conference on Innovation and
Management, Malaysia 2016
The basic principle of S-OJT system is displayed in figure 1 below. S-OJT research is an
emerging trend especially in the Malaysian aviation industry to attain its aviation maintenance
competencies.
Figure 3 Display of the S -OJT System
Source: Jacobs & Bu-Rahmah [1]
5 Conclusion Though competency is an issue within an organization as well as its employees, S-OJT approach
can be adopted to address this competency issue. The main area of focus of S-OJT is the training efficiency
and training effectiveness. Training efficiency includes the reduced time for the training session while
achieving the knowledge and skills required in aircraft maintenance field. The outcome of the training
includes improved work performance, training performance as well individual development. This it-self
brings the financial benefits in-directly. The training effectiveness outcome results in improved work
outcomes. This include lower error, higher airworthiness of aircraft, more effective trouble shooting skills
and knowledge as well as lower incidents and accidents. To adapt the S-OJT in an organization, will
require application in an organization to experience its benefits.
References
[1] Jacobs, R.L & Bu-rahmah, M.J. (2012). Developing employee expertise through structured on-the-
job training (S-OJT): an introduction to this training approach and the KNPC experience. Industrial
and Commercial Training, 44(2), 75-84.
[2] Havard University. 2016. Havard University Competency Dictionary. [ONLINE] Available
at:https://apps2.campusservices.harvard.edu/cas/empldocs/cs/harvard_competency_dictionary_co
mplete.pdf. [Accessed 25 October 2016].

226
Proceedings International Conference on Innovation and
Management, Malaysia 2016
[3] Federal Aviation Administrator. 2016. faa-8083-30_ch12.pdf. [ONLINE] Available at:
https://www.faa.gov/regulations_policies/handbooks_manuals/aircraft /amt_handbook/media/faa-
8083-30_ch12.pdf [Accessed 25 Oct 2016]
[4] Kinnison, H.A & Siddiqui, T. (2013). Aviation Maintenance Management. (2nd ed.). USA:
McGraw-Hill.
[5] Chandler, T.N. (1998). Training. In Maddox, M (Ed), Human Factors Guide for Aviation
Maintenance (pp. Chapter 7). Washington DC: Federal Aviation Administration
[6] Code of Federal Regulations, Title 14 Part 65 – Certification: Airmen – Other than Flightcrew
Members
[7] Code of Federal Regulations, Title 14 Part 147 – Aviation Maintenance Technician Schools –
Appendices A-D
[8] Code of Federal Regulations, Title 14 Part 121.378, Subpart L – Maintenance, Preventive
Maintenance and Alterations – Certificate Requirements
[9] Boyd, B, Stolzer, A, 2015. Causes and Trends in Maintenance-Related Accidents in FAA-Certified
Single Engine Piston Aircraft. Journal of Aviation Technology and Engineering , 5/1, 17-24
[10] Spencer, F.W & Schurman, D.L (1995). Reliability assessment at airline inspection facilities .
Volume 3: Results of an eddy current inspection reliability experiment (DOT-FAA-CT-92-12-V-3).
Arlington, VA: National Technical Information Service.
[11] Vipond, L.K (1990). FAA’s proposed revision to Parts 145 and 65. In J.F. Parker, Jr.(Ed.), Human
Factor Issues in Aircraft Maintenance and Inpection, Training Issues. Washington, DC: Federal
Aviation Administration.
[12] Professional Aviation Maintenance Association (PAMA) (1992). Required Recurrent Training.
PAMA News. Volume 13, Number 7
[13] Salvendy, G., & Pilitsis , J. (1980). The development and validation of an analytical training program
for medical suturing. Human Factors, 22, 153-170
[14] Jacobs, R.L. (2003), Structured on-the-job Training: Unleashing Employee Expertise in the
Workplace, Berret-Koeher, San Francisco, CA
227
Proceedings International Conference on Innovation and
Management, Malaysia 2016
Behave Yourself Please! Start Saving Lifes
Mohd Rizal Omar Baki1,2, Ahmad Rahman Songip2, Mohd Shamsuri Khalid2,3
1 Federal Land Development Authority (FELDA), Platinium Park, No 11 Persiaran KLCC,
50088 Kuala Lumpur, Malaysia
2 Department of Management of Technology, Malaysia-Japan International Institute Technology
(MJIIT), Universiti Teknologi Malaysia-Kuala Lumpur, Jalan Yahya Petra (Jalan Semarak),
54100 Kuala Lumpur, Malaysia
3 Department Occupational Safety and Health of Malaysia, 56430 Putrajaya, Malaysia
(E-mail: [email protected], [email protected], [email protected])
Abstract Behavior Based Safety (BBS) is a term used to portray the avoidance of mishaps, wounds and
misfortune at the work place. Everyone is responsible for the safe working conditions throughout the
organization. The objective of the BBS has been to urge workers to ingrain safe behav iour, whereby
people perform safety faithfully. The organization needs to address the components of leadership,
inspiration and knowledge in actualization the BBS. These components would impacted the organization
on how they acted upon towards safety. The industrial players are responsible to coordinate in designing
an underlying safety administration system, for the industry. Applying the proposed safety system,
organizations may share the benefits and in a long term, enhancing the execution and their corp orate
image. Keywords Behavior Based Safety, Management, Safety, Occupational Safety
1 Introduction Top Management usually plays an important role and responsibility towards safety program
implementation throughout their organization. Accident prevention and other safety coordination are
given a priority and delegated to responsible person as their main key performance indicators (KPIs).
Alternatively, the industry can apply Behaviour Based Safety (BBS) concept to manage safety matters
such as the prevention of accidents, injuries and loss at the workplace. It includes the utilization of safety
issues faced by the workers in their working environment. Every individual are responsible for their own
safety as well as of others [1].
2 Literature Review 2.1 Safety Culture Behavior
BBS is a method dealing particularly to enhance safety and health at work place. It is a practice
that conform to both perception and criticism towards the individual concern that is superiors and
subordinates to change their behavior [2].
The concept of “Total Safety Culture” is the ultimate goal for most organization. However it is
rarely defined and the enculturation of total safety is yet to be seen especially within organization. A
comprehensive safety culture should inclusively touch on culture. Thus, in culculating safety, the
organization should embrace traits listed below [3];
1. Individuals must practice safety as a ‘value’ element and not just a mere priority;
2. Individuals must uphold of the safety of their co-workers inclusive to themselves; and
3. All employees must willingly and able to respond to their sense of responsibility and act ‘beyond
the call of duty’

228
Proceedings International Conference on Innovation and
Management, Malaysia 2016
BBS is about recognizing on potential changes and reactions resulting in the promotion of
positive responsibility at all levels. While excluding faulting, blaming workers and ignoring hazards. This
leads to performance enhancements [3].
Interventions is being used in people focused behavior-based approach. It can be exercised either
by incorporating group obervation or one to one observation of workers performing routine work,
undertakings, setting objectives painstakingly and of giving auspicious input on safety related conduct,
honing and tutoring [4].
2.2 The Current Scenario
The occupational, safety and health (OSH) standards applications are distinctively different
among countries. These can be seen with various approaches by nations in dealing with enactments,
directional, requirements and incentives for coherence to guarantee work related safety. For examples ,
The Health and Safety at Work Act 1974, has been applied among employers and employees in United
Kingdom, while United State implemented the Occupational Safety and Health Act 1970. Another type
of OSH, called the Occupational Health and Safety Act 1993 is being officially used in South Africa,
while Malaysia is adhering to the Occupational Safety and Health Act 1994. Although this depends on the
consenting owner or directors, these examples explained the fact that, it is optional for any organisations
to used or implement the OSH in accordance to their respective localities [5].
Another outline that we can examine is the U.S. National Mining Association's (NMA)
CORESafety HSMS that was used to light up the observational examination in the mining ventures. The
NMA CORESafety HSMS contains twenty distinctive components, which addresses the specific risks and
dangers associated with mining [6]. The NMA CORESafety handbook demonstrates that the twenty
particular components are reliable with the ANSI/AIHA Z-10 and OHSAS 18001 agreement principles
and adjusts its twenty segments under the conventional HSMS cycle as appeared in table 1 below [7].
Table 1: Organization of CORESafety’s 20 components under the generalized HSMS system cycle
Health and Safety Management System Framework
Plan Do
Checking
& Correcting
Action
Management Review
H & S Policy Commitment
1. F
atal
ity P
reven
tion &
Ris
k M
anag
emen
t
2. T
rain
ing &
Com
pet
ence
3. C
han
ge
Man
agem
ent
4. C
ontr
acto
r M
anag
emen
t
5. E
mer
gen
cy M
anag
emen
t
6. C
ollab
ora
tion &
Co
mm
unic
atio
n
7. R
einfo
rcem
ent
& R
ecognitio
n
8. W
ork
Pro
cedure
s &
Per
mits
9. H
ealth O
ptim
izat
ion
10. C
ulture
Enhan
cem
ent
11. H
R &
Lab
or
Rel
atio
ns
12. B
ehav
ior
Optim
izat
ion
13. E
ngin
eeri
ng
& c
onst
ruct
ion
14. D
ocu
men
tati
on c
ontr
ol
15. C
om
plian
ce &
ass
ura
nce
1. F
atal
ity P
reven
tion &
Ris
k M
anag
emen
t
16. In
ciden
t R
eport
ing &
Inves
tigat
ion
17. S
afet
y &
Hea
lth M
anag
emen
t A
ssura
nce
18. L
eader
ship
Dev
elopm
ent
19. R
esponsi
bility &
Acc
ounta
bility
20. M
anag
emen
t S
yst
em C
oord
inat
ion
Source: Haas, E. J., & Yorio, P. [7]
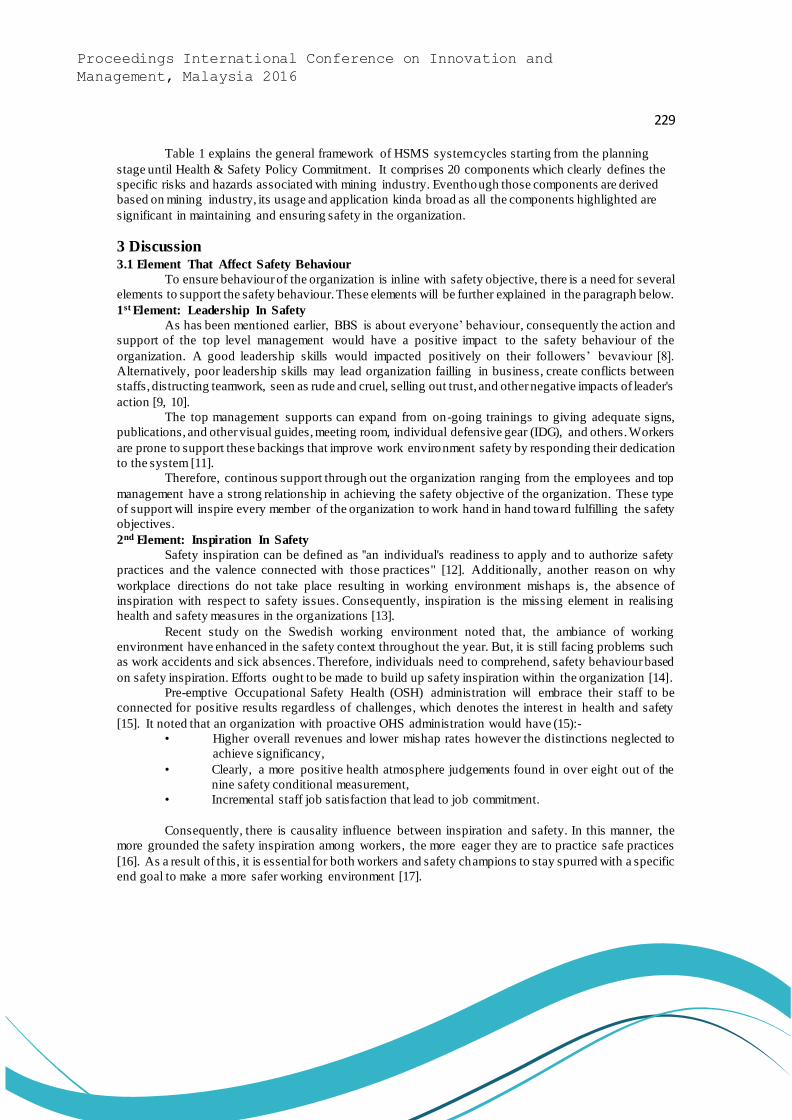
229
Proceedings International Conference on Innovation and
Management, Malaysia 2016
Table 1 explains the general framework of HSMS system cycles starting from the planning
stage until Health & Safety Policy Commitment. It comprises 20 components which clearly defines the
specific risks and hazards associated with mining industry. Eventhough those components are derived
based on mining industry, its usage and application kinda broad as all the components highlighted are
significant in maintaining and ensuring safety in the organization.
3 Discussion 3.1 Element That Affect Safety Behaviour
To ensure behaviour of the organization is inline with safety objective, there is a need for several
elements to support the safety behaviour. These elements will be further explained in the paragraph below.
1st Element: Leadership In Safety
As has been mentioned earlier, BBS is about everyone’ behaviour, consequently the action and
support of the top level management would have a positive impact to the safety behaviour of the
organization. A good leadership skills would impacted positively on their followers’ bevaviour [8].
Alternatively, poor leadership skills may lead organization failling in business, create conflicts between
staffs, distructing teamwork, seen as rude and cruel, selling out trust, and other negative impacts of leader's
action [9, 10].
The top management supports can expand from on-going trainings to giving adequate signs,
publications, and other visual guides, meeting room, individual defensive gear (IDG), and others. Workers
are prone to support these backings that improve work environment safety by responding their dedication
to the system [11].
Therefore, continous support through out the organization ranging from the employees and top
management have a strong relationship in achieving the safety objective of the organization. These type
of support will inspire every member of the organization to work hand in hand toward fulfilling the safety
objectives.
2nd Element: Inspiration In Safety
Safety inspiration can be defined as ''an individual's readiness to apply and to authorize safety
practices and the valence connected with those practices" [12]. Additionally, another reason on why
workplace directions do not take place resulting in working environment mishaps is, the absence of
inspiration with respect to safety issues. Consequently, inspiration is the missing element in realising
health and safety measures in the organizations [13].
Recent study on the Swedish working environment noted that, the ambiance of working
environment have enhanced in the safety context throughout the year. But, it is still facing problems such
as work accidents and sick absences. Therefore, individuals need to comprehend, safety behaviour based
on safety inspiration. Efforts ought to be made to build up safety inspiration within the organization [14].
Pre-emptive Occupational Safety Health (OSH) administration will embrace their staff to be
connected for positive results regardless of challenges, which denotes the interest in health and safety
[15]. It noted that an organization with proactive OHS administration would have (15):-
• Higher overall revenues and lower mishap rates however the distinctions neglected to
achieve significancy,
• Clearly, a more positive health atmosphere judgements found in over eight out of the
nine safety conditional measurement,
• Incremental staff job satisfaction that lead to job commitment.
Consequently, there is causality influence between inspiration and safety. In this manner, the
more grounded the safety inspiration among workers, the more eager they are to practice safe practices
[16]. As a result of this, it is essential for both workers and safety champions to stay spurred with a specific
end goal to make a more safer working environment [17].
230
Proceedings International Conference on Innovation and
Management, Malaysia 2016
3rd Element: Knowledge In Safety
Another element that needs to be addressed in order to create the correct set of behavior toward
safety is knowledge. The element of knowledge can either comes from external or internal factors in any
organization. A dynamic contribution from outside specialists give an additional advantage in inciting the
improvement of a learning lobbyist kind of individual from the Occupationa l Safety and Health
Committee [18] and would take working environment OSH to a more elevated [19].
The Safety and Health Committees (OSHCs) additionally could also act as a channel for learning
creation inside the organization. While individuals from OSHCs and business leaders alike would have a
clearer understanding of the principle elements of OSHCs and how they are inseparable connected to
inform administration [19]. The individuals OSHCs and another individual from the organization needs
to distinguish and shares their prosperity and disappointments stories in executing safety practices
organizational wide.
The idea of sharing knowledge in safety is not in fault finding, it is about learning from each
other’s experiences. The safety committee will need to work together to come up with a proper solutions
and plan it accordingly, as preventive measures. Through these exercises, an organization involves in
Meta-Learning process which embraces outcome of critical relationships (for example-feedbacks from
previous actions) for creating and maintaining safety value by continous development [20]. It will not just
influence the behavior, but at the same times enriching the knowledge for the organization itself.
Figure 1. Safety Behaviour’s Element.
Source: adopted from various articles; Shamir et.al [8], Neil & Griffin [12], Ummu Kolsome Farouk et.al [19]
Based on the three elements mentioned in figure 1 above, it can be deduced that the organization
need to address them in order to influence positively the safety behaviour in the organization with a right
approach(es). It would have a very strong influence on how the organization would have react and behave
towards safety.
4 Conclusion In conclusion, the ultimate goal of BBS is to encourage employees to instil safe behaviour as a
habit. Whereby individuals perform works safely [21] while knowing that it would save their life and
limbs. To meet this goal, the organizations concerned need to be more proactive in managing safety. The
organizations need the elements of knowledge, inspiration and leadership in order to execute successful
BBS. These three elements would ensure organizations have very strong positive influence on how their
entire workforce behave towards safety. Proactive OSH administration is connected to positive results,
which underlines the significance of interest in health and safety.
Additionally, all players of the industries have to coorperate in developing an initial framework
for multi firm industrial safety management with other stakeholders. They should rethink to open the
Safety Behaviour
Leadership
Knowledge
Inspiration

231
Proceedings International Conference on Innovation and
Management, Malaysia 2016
notion of “togetherness” and work cooperatively to improve the industrial safety performance as a whole
at the industrial zones relationship. Through this exercises, organizations from every industry may share
the benefits and in the long term, improve their performance and corporate image [22].
References [1] Jasiulewicz-Kaczmarek, M., Szwedzka, K., & Szczuka, M. Behaviour Based Intervention for
Occupational Safety – Case Study [J], Procedia Manufacturing, 2015, 3, 4876–4883.
http://doi.org/10.1016/j.promfg.2015.07.615
[2] Geller, E. S. Ten principles for achieving a total safety culture [J], Professional Safety, 1994, 39(9),
p18.
[3] Agnew J., & Ashworth C. Behavior-based safety: Setting the record straight [R]. Aubery Daniels
International Inc. 2015,
http://aubreydaniels.com/pmezine/sites/aubreydaniels.com.pmezine/files/SettingTheRecordStraight
_2015.pdf
[4] Health and Safety Authority. Behaviour based safety guide [M], 2013,
http://www.hsa.ie/eng/Publications_and_Forms/Publications/Safety_and_Health_Management/beh
aviour_based_safety_guide.pdf
[5] Rosliza Osman, Noorhasimah Awang, Syed Abdul Hamid Syed Hassan & Norsyahidah Mohammad
Yusof. Level Of Awareness On Behaviour-Based Safety (BBS) In Manufacturing Industry Towards
Reducing Workplace Incidents [J], International Journal of Education and Research, 2015, Vol. 3
No. 1 January 2015.
[6] NMA CORESafety Handbook [M], Coresafety.org, 2014, http://nma2.dev.networkats.com/wp -
content/uploads/2014/12/CORESafety-Handbook.pdf
[7] Haas, E. J., & Yorio, P. Exploring the state of health and safety management system performance
measurement in mining organizations [J], Safety Science, 2016, Vol. 83, 48–58.
http://doi.org/10.1016/j.ssci.2015.11.009
[8] Shamir, B., House, R.J. & Arthur, M.B. The Motivational Effects Of Charismatic Leadership: A
Self-Concept Based Theory [J]. Organization Science, 1993, Vol. 4, No. 4, pp 577–594.
[9] Leslie, J.B. & Van Velsor, E. A Look at Derailment Today [M], Centre for Creative Leadership,
Greensboro, NC, 1996.
[10] Baumeister, R.F. & Bushman, B.J. Social Psychology and Human Nature [M]. Wadsworth, Cengage
Learning, second ed. Belmont, USA. Berlo, 2011.
[11] Tong, D. Y. K., Rasiah, D., Tong, X. F. & Lai, K. P. Leadership empowerment behaviour on safety
officer and safety teamwork in manufacturing industry [J], Safety Science, 2015, Vol 72, pages 190–
198. http://doi.org/10.1016/j.ssci.2014.09.009
[12] Neal, A. & Griffin, M. A study of the lagged relationships among safety climate, safety motivation,
safety behaviour, and accidents at the individual and group levels [J], Journal of Applied Psychology,
2006, Vol. 91, No. 4, pages 946–953. DOI: 10.1037/0021-9010.91.4.946
[13] Kwon, O.J. & Kim, Y.S. An analysis of safeness of work environment in Korean manufacturing: the
‘‘safety climate” perspective [J], Safety Science, 2013, Vol. 53, pages 233–239. http://
dx.doi.org/10.1016/j.ssci.2012.10.009
[14] Hedlund, A., Gummesson, K., Rydell, A. & Andersson, I.-M. Safety motivation at work: Evaluation
of changes from six interventions [J], Safety Science, 2016, Vol. 82, pages 155–163.
http://doi.org/10.1016/j.ssci.2015.09.006
[15] Haslam, C., O’Hara J., Kazi A., Twumasi, R. & Haslam, R. Proactive occupational safety and health
management: Promoting good health and good business [J], Safety Science, 2016, Vol. 81, pages
99-108. http://doi.org/10.1016/j.ssci.2015.06.010
[16] Chen, C.F. & Chen, S.C. Measuring the effects of safety management system practices, morality

232
Proceedings International Conference on Innovation and
Management, Malaysia 2016
leadership and self-efficacy on pilots’ safety behaviors: safety motivation as a mediator [J], Safety
Science, 2014, Vol. 62, pages 376–385. http://dx.doi.org/ 10.1016/j.ssci.2013.09.013.
[17] Helander, M. Safety hazards and motivation for safe work in the construction industry [J]. Int. J. Ind.
Ergonomics, 1991, Vol. 8, Issue 3, pages 205–223. http://dx.doi.org/10.1016/0169- 8141(91)90033-
I.
[18] Hall, A., Forrest, A., Sears, A. & Carlan, N. Making a Difference: Knowledge Activism and Worker
Representation in Joint OHS Committees [J], Industrial Relations/Relations Industrielles, 2006, Vol.
61, No. 3, pages 408-436.
[19] Ummu Kolsome Farouk, Stanley Richardson & Arul Jeganathan Solucis Santhapparaj. Knowledge
Management to Promote Occupational Safety and Health at the Malaysian Manufacturing
Workplace: Reposed in Occupational Safety and Health Committees? [J], Journal of Organizational
Knowledge Management, 2011, Vol. 2011
http://www.ibimapublishing.com/journals/JOKM/jokm.html Vol. 2011 (2011), Article ID 663054,
13 pagesDOI: 10.5171/2011.663054
[20] Lei, D., Hitt M. A., & Bettis R. A., Dynamic core competences through meta-learning and strategic
context [J]. Journal of Management, 1996, Vol. 22, No. 4, pages 549–569.
[21] Li, H., Lu, M., Hsu, S.-C., Gray, M., & Huang, T., Proactive behavior-based safety management for
construction safety improvement[J], Safety Science, Vol. 75, pages 107–117.
http://doi.org/10.1016/j.ssci.2015.01.013
[22] Ramli A., Mokhtar M., & Aziz B. A. The development of an initial framework for multi-firm
industrial safety management based on cooperative relationship: A Malaysia case study [J].
International Journal of Disaster Risk Reduction, 2014, 10, pages 349–361.
http://doi.org/10.1016/j.ijdrr.2014.10.002

233
Proceedings International Conference on Innovation and
Management, Malaysia 2016
Predicting Organizational Citizenship Behaviour with Leadership
Style, Ethics and Transformational Leadership in South Asian Perspective: A Case of Pakistani Firms
Muhammad Ramzan1, Rizwan Qaiser Danish1, Asad Afzal Humayon2
1Hailey College of Commerce, University of the Punjab, Lahore, Pakistan 2COMSATS Institute of Information Technology, Vehari, Pakistan
(Email; [email protected]; [email protected]; [email protected])
Abstract The basic purpose of current study is to investigate how leadership ethics, transformational
leadership and leadership style is associated with organizational citizenship behaviour and what is their
impact in South Asian context, specifically in Pakistan. Data was collected through self-administered
questionnaire which was distributed among staff of public and private sectors, which were holding
managerial and non-managerial positions. SPSS version 17.0 was used to analyse the data. The survey
consisted of various sections like demographics “Organizational Citizenship Behaviour”, Leadership
style, Leadership Ethics, and Transformational leadership. Findings and the result of this research indicate
that there is strong relationship between organizational citizenship behaviour and various other factors i.e.
leadership style, transformational leadership, and leadership ethics. All the variables are positively and
significantly correlated. Moreover Organizational Citizenship Behaviour was predicted by leadership
style, transformational leadership and leadership ethics. Although we tried to chart some new boundaries
in south Asian context how various aspects of leadership impact on OCB and what is their relationship
among each other. However this study was cross sectional in nature and longitudinal study is required for
generalising results with more validity. As the data was collected from single source, that is, from
managerial employees only and not the leaders, it is difficult to analyse that the respondents of this survey
are un-biased and fair. Although the views from public and private both sectors are included from Punjab,
Pakistan but for more generalisability other south Asian countries should also be included. When we
considered various aspects of leaderships with OCB, consistent with the previous studies, leadership ethics
and style is strong predictors of citizenship behaviour of employees in both sectors, public and private.
As the data was collected from organizations that deal in health, telecommunication, educational sector
or financial services, these are the major sectors of an economy that contribute to GDP. Policy implications
of this study are discussed. There are very few studies that relate leadership with OCB although various
other antecedents of OCB have been investigated in south Asian countries. This study will chart new
boundaries for future researchers in the field of business management and social sciences. Keywords Organizational Citizenship Behaviour, Leadership Style, Leadership Ethics, Transformational Leadership.
1 Introduction Organizational citizenship behavior (OCB) construct has been researched from various
perspectives since the era of 1970 that increases the curiosity of organizational citizenship behavior
practices because of its organizational importance. Organizational effectiveness and efficiency are
enhanced through organizational citizenship behavior. First research work was done on Organizational
citizenship behavior by Katz in 1964 and after this plenty of researchers were attracted to this construct
that resulted in various books, articles and measurements scales. Later on meta-analysis were also
published to establish credibility. Dennis Organ works on the Katz theory in 1988 and explains the
organizational citizenship behavior. Dennis Organ is also known as the father of OCB. He defines OBC
234
Proceedings International Conference on Innovation and
Management, Malaysia 2016
as “Individual behavior that is discretionary, not directly or explicitly recognized by the formal reward
system and that in the aggregate promotes the effective functioning of the organization” (Organ, n.d.).
Organizational effectiveness is effects by OCB aspects. These critical aspects are three in number. First,
this definition explains that the actions are voluntary in nature without any compulsion and not part of
duty and done without expecting any formal reward. Secondly, “discretionary individual behavior”
provides a free decision making environment which tends to effect the organization in a positive or
negative sense Third critical aspects when you provides the unrestricted or limitless free environment to
individual for decision making or give own choices irrespective of the reward will results overall
effectiveness and efficiency of the organization.
1.1 Global Perspective:
Organizational citizenship behaviour is multidimensional construct with diversified and wide
range of meaning. As OCB is broader and wider concept that functionally affects organizational
effectiveness through various perspectives and dimensions. It is actually the precursor of organisational
success and performance. Notion of Organizational citizenship behaviour has classification like
empowerment, leadership, gender and management etc. As for as Gender classification is concerns in
organizational citizenship behaviour female and male have their own choices and perspectives. Similarly
in organization the individuals have their own methods for handling and accomplishing the task which
they assigned by supervisor or manager.
Organizational citizenship behaviour practices enhance effectiveness and productivity in
world-wide. In this era of global village there are many dimensions of OCB which have effect organization
such as loyalty, sportsmanship, organizational commitment, organizational justice, leadership ethics,
leadership behaviour, leadership style and others. Due to broader concept of OCB it is impossible to
explain it in one article. OCB provides comfort and it also helpful in decreasing stress an d tension.
“Google” is the very innovative and famous company in this globe. The Organizational citizenship
behaviour is practiced in Google because there is no fixed time limit for working and no deadline to
complete the tasks, individuals working on the project without any restriction and resultant the
productivity proliferation irrespective of award system, without involving tension and stress. Many other
companies like Microsoft, Intel, Apple, and IBM, implemented citizenship behaviour in letter and spirit.
The organization citizenship behaviour concept exercised globally in various multinational organizations,
these practices are implemented according to nature, where organization needs and in different
departments. Leadership commitment, knowledge sharing leadership, leadership power, leadership style,
leadership management, leadership ethics are some essential variables that influenced on organizational
leadership behaviour.
Leadership ethics are very important in organizations because it is the values and priorities
you put on morality and reveal through how leader behave with his colleagues and followers as individual
human being. The leadership style is also significant because it shows how the leader behaves to its sub-
ordinates because it leads towards knowledge sharing and resource sharing. Leadership style also shows
that how the individual understand the leader and how the leader communicates with him. Leadership
management and commitment are also key aspects of OCB concept. The above described variables are
included in OCB concept and those which are not include significantly affects the organization citizenship
behaviour. In developed countries the concept of OCBs, is implemented comprehensively and also
groomed with high velocity. OCB is important very effective in organization that’s why they made up a
part of research and development to enhance the aspects and concept of OCB. The key purpose of R & D
to determine the variable that reduces the overall effectiveness of the organization and is sues that are
associated positively with the behavior in OCB through this and increases the performance of the company
( Karam, 2011)
( Mayfield & Taber, 2010).
235
Proceedings International Conference on Innovation and
Management, Malaysia 2016
1.2 South Asian Perspective:
In developing countries, such as in South Asia, the idea of OCB realized locally but not in a
widespread practice as compare to the developed countries or in multinational organizations. The concept
of OCB is only implemented in private organization, but on limited scale due to unawareness of
leadership. Leadership plays and important role for the effectiveness of an organisation. The main cause
that affects the concept of OCB through leadership is leaders value system and his unique style as is
depicted from his followers. But in South Asian countries like Pakistan, leadership focuses on the short-
term objectives rather than long-term goals in relation to individuals.
Some organizations are partially exercised the concept of OCB which leads to flaws in
completing the operations. In local environment the concept of OCB is valuable but lack of poor role of
leadership lessens the importance of OCB concept. Some critical aspects which are widely used in
organization and local environment like leadership commitment, leadership behaviour, leadership style,
leadership ethics, leadership support, transformational leadership and many others. Attitudes and
behaviour like leadership, commitment and organisational support are vital for the enhancement of
efficiency and effectiveness of organization. The above mentioned variable are exercised comprehensive
and up to the greater extent but leadership ethics, transformational leadership and leadership style and
give less importance almost ignored. 2 Previous Literature/ Theoretical Framework
Konu and Viitanen (2009) argued that when managers are indulged in leading role it can enhance
productivity at high level. There is significant differences originate in various leadership styles were
related to professional background, unit s ize, gender and activity sector. In intra-organizational activities
the leadership style received more attention as compare to extra-organizational roles ( Konu & Viitanen ,
2009).
It is easy to find the difference between giving oneself and dedication with respect of
benevolence, experience. The relationship between transformational leadership and self-sacrifice depends
upon the perceived unit performance and follower’s collective identity ( Singh & R. Krishnan, 2008).
Leadership is very difficult and complicated task because its nature itself complicated. Research findings
disclose that the leader should empower the employees and go beyond the self-interest for developing
followers, transformational leadership qualities and also inspire the followers.(Tabassi & Abu Bakar,
2010)
The study aims is to highlights important of follower’s perception about the leader’s actual
behaviours and expectation of followers. Transformational leadership behaviour was increased with
frequency of rank, but there is no influence of active management-by-exception, perceived behaviour and
expected contingent reward. Also no effect of perceived active management -by exception and contingent
reward and transformational leadership were moderated by follower’s expectations or rank (Kline &Ivey,
2010).While we say “school for all”, are quite different and shows conflict between what is spoken and
what is implemented practically, as the curricula’s sub ject matter ends and upgraded are shown in other
manners. For developing transformational leadership behaviour manager shows more responsibility and
efficiency in special circumstances as compare to normal circumstances.( Fitzgerald & S. Schutte, 2010).
Hierarchical impact of inspirational motivation, individualized consideration, idealized influence and
intellectual stimulation on transformational leadership. Research findings affirm that the inspirational
motivation and idealized influence happen frequently between upper level managers rather than middle
level managers, and there were no differences for individualized consideration and intellectual
stimulation. Also, inspirational motivation, idealized influence, and intellectu al stimulation were
strengthen job satisfaction level in upper level managers rather than middle level managers while
individualized consideration effect both groups ( Bruch & Walter, 2007)

236
Proceedings International Conference on Innovation and
Management, Malaysia 2016
A combined action will produces a stronger results as compare to individual efforts, these action
are combination of value based theories and spiritual leadership. It is very essential for understanding the
spiritual leadership and other theories.(Crossman, 2010)
Research examine that the ethical leadership definition and its practical implementation in leadership
system. Finding conclude that apparent gap is continue which is not function of ethical definition and
enforcement is challengeable under societal, leadership and individuals variables ( Nnabuife,
2010).Results affirm that leader’s relational support and task builds a positive strengthen link between the
follower’s level of creativity and transformational leadership. Leader’s support motivated the followers
(Cheung & Wong, 2011).Full Range leadership model is used in world-wide today. This model helps to
build transformational leadership style for leader’s success. Transformational leadership will develop with
utilizing a “combination of 360 degree feedback using structured workshops, multifactor leadership
questionnaire, and one-to-one coaching sessions ( Kirkbride, 2006)”.
The leaders at Philips were very versatile in their leadership style to build willingness to change and
deliberate atmosphere. Researchers assert that final emergent transformation will only be implemented in
quality management and historical style pays attention during the process of organizational changes (
Karsten, et al., 2009). Library professionals were not sensitive regarding leadership style at work place.
The chief librarian uses autocratic leadership style. Library professionals are seems to be highly
committed with their task and work and they are in favoured of result oriented culture (Awan & Mahmood,
2010).
Odom, Owen, Valley, & Burrell(2010) conveyed that leading example and leadership model of
Obama’s behavior is pronounced and uniformly by Avolio and Bass. The results indicate that it is tough
for organizational functioning and the engagement between leadership style and climate. The
experimental findings assert that three hypothesis are partially supported and fourth was fully supported.
(Haakonsson, Burton, Obel, & Lauridsen, 2008). Corporate responsibility strategy support and recognized
the employees to construct the values. Leadership plays an important role in effective corporate practice
and make the organization structured decentralized based on honourable measures ( Rok, 2009).
Leadership style (ambidextrous and transformational) affects the team learning and related performance.
Research finding affirms that these leadership styles have operational effects as a strategic resou rce within
an organization, team and groups ( Bucic, et al., 2010). Researcher examine that the satisfaction of
followers with leader. Leadership styles like task oriented leads to pressure, and socio -emotional builds
support are effects significantly on follower satisfaction with leader (Casimir & Keith Ng, 2010)
In Western work place generational groups workers have various leadership style and different
work characterises. Research findings indicate that the generational groups have different work style in
manufacturing industries and have no difference of generational groups in educational sector. Results also
indicate that the leader should build various work characteristics among generational groups and adopt
different leadership style ( Yu & Miller, 2005).The empirical analysis asserts that customer relationship
can also be predicted with social capital and ethical leadership and positively associated with them.( Zheng
, et al., 2011).
Based on literature and above arguments following model and hypotheses can be developed
which are presented in figure 1.
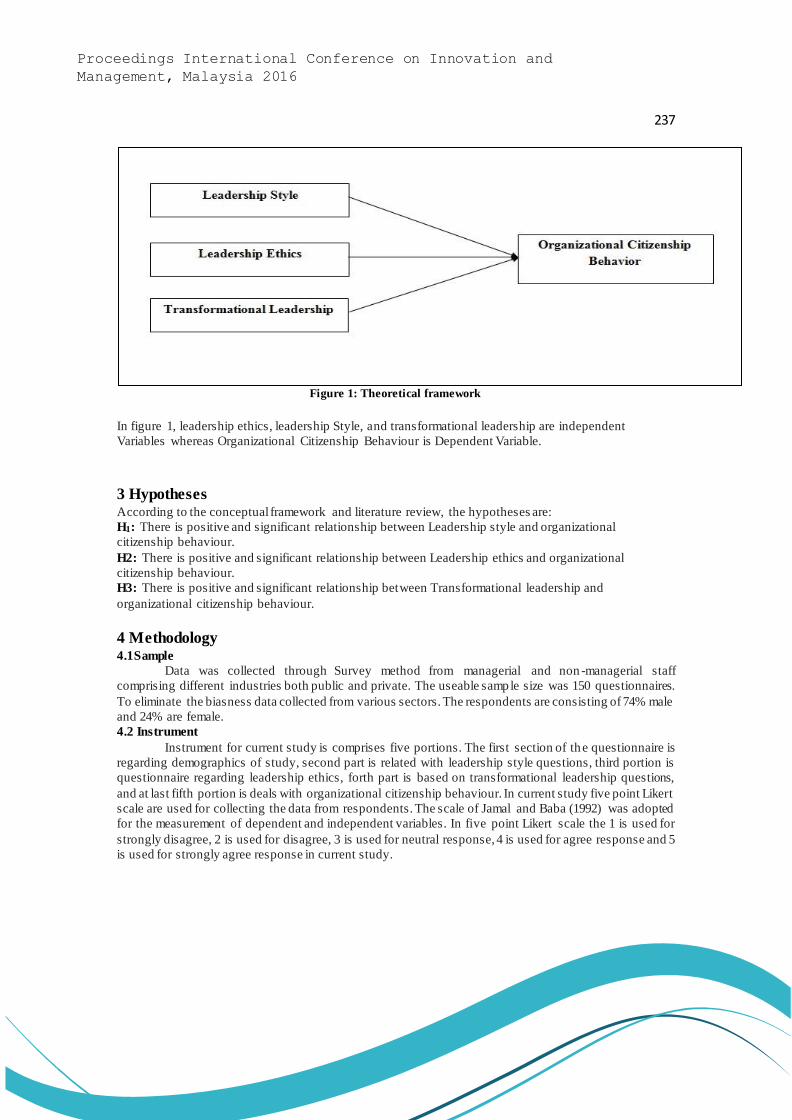
237
Proceedings International Conference on Innovation and
Management, Malaysia 2016
Figure 1: Theoretical framework
In figure 1, leadership ethics, leadership Style, and transformational leadership are independent
Variables whereas Organizational Citizenship Behaviour is Dependent Variable.
3 Hypotheses According to the conceptual framework and literature review, the hypotheses are:
H1: There is positive and significant relationship between Leadership style and organizational
citizenship behaviour. H2: There is positive and significant relationship between Leadership ethics and organizational
citizenship behaviour. H3: There is positive and significant relationship between Transformational leadership and
organizational citizenship behaviour. 4 Methodology 4.1Sample
Data was collected through Survey method from managerial and non -managerial staff
comprising different industries both public and private. The useable sample size was 150 questionnaires.
To eliminate the biasness data collected from various sectors. The respondents are consisting of 74% male
and 24% are female.
4.2 Instrument
Instrument for current study is comprises five portions. The first section of the questionnaire is
regarding demographics of study, second part is related with leadership style questions, third portion is
questionnaire regarding leadership ethics, forth part is based on transformational leadership questions,
and at last fifth portion is deals with organizational citizenship behaviour. In current study five point Likert
scale are used for collecting the data from respondents. The scale of Jamal and Baba (1992) was adopted
for the measurement of dependent and independent variables. In five point Likert scale the 1 is used for
strongly disagree, 2 is used for disagree, 3 is used for neutral response, 4 is used for agree response and 5
is used for strongly agree response in current study.
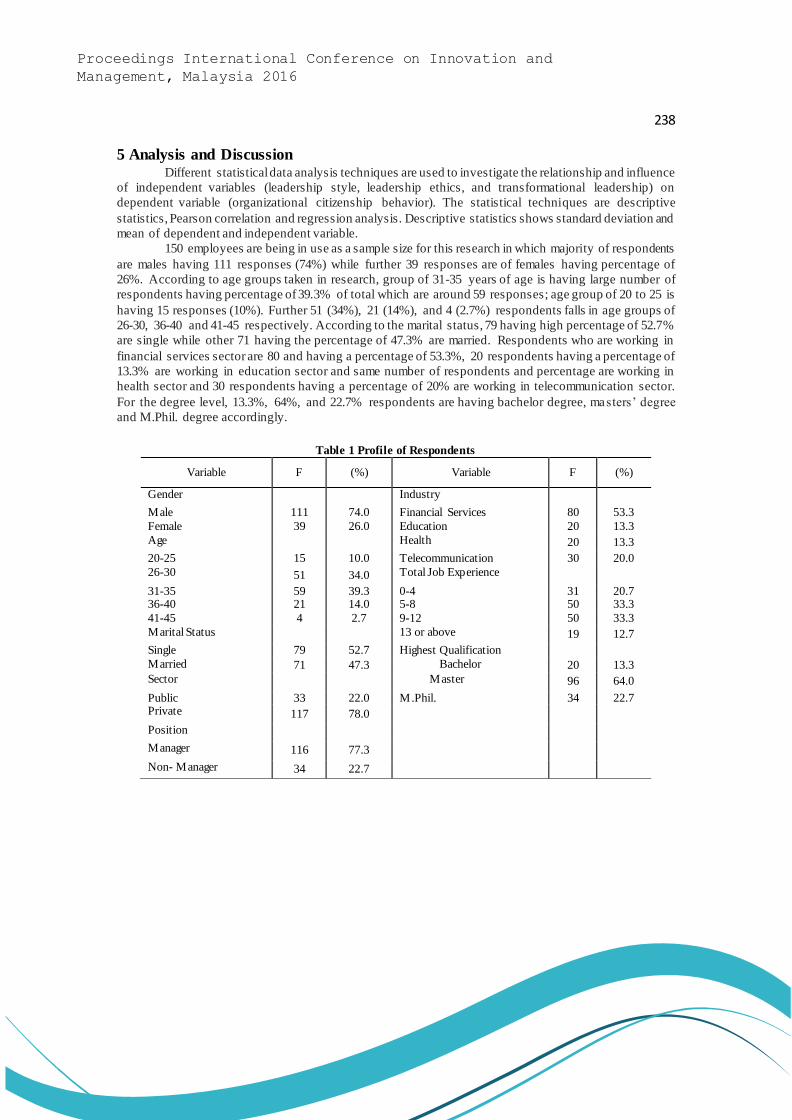
238
Proceedings International Conference on Innovation and
Management, Malaysia 2016
5 Analysis and Discussion Different statistical data analysis techniques are used to investigate the relationship and influence
of independent variables (leadership style, leadership ethics, and transformational leadership) on
dependent variable (organizational citizenship behavior). The statistical techniques are descriptive
statistics, Pearson correlation and regression analysis. Descriptive statistics shows standard deviation and
mean of dependent and independent variable.
150 employees are being in use as a sample size for this research in which majority of respondents
are males having 111 responses (74%) while further 39 responses are of females having percentage of
26%. According to age groups taken in research, group of 31-35 years of age is having large number of
respondents having percentage of 39.3% of total which are around 59 responses; age group of 20 to 25 is
having 15 responses (10%). Further 51 (34%), 21 (14%), and 4 (2.7%) respondents falls in age groups of
26-30, 36-40 and 41-45 respectively. According to the marital status, 79 having high percentage of 52.7%
are single while other 71 having the percentage of 47.3% are married. Respondents who are working in
financial services sector are 80 and having a percentage of 53.3%, 20 respondents having a percentage of
13.3% are working in education sector and same number of respondents and percentage are working in
health sector and 30 respondents having a percentage of 20% are working in telecommunication sector.
For the degree level, 13.3%, 64%, and 22.7% respondents are having bachelor degree, masters’ degree
and M.Phil. degree accordingly.
Table 1 Profile of Respondents
Variable F (%) Variable F (%)
Gender Industry Male 111 74.0 Financial Services 80 53.3
Female 39 26.0 Education 20 13.3
Age Health 20 13.3
20-25 15 10.0 Telecommunication 30 20.0
26-30 51 34.0 Total Job Experience 31-35 59 39.3 0-4 31 20.7 36-40 21 14.0 5-8 50 33.3
41-45 4 2.7 9-12 50 33.3
Marital Status 13 or above 19 12.7
Single 79 52.7 Highest Qualification
Married 71 47.3 Bachelor 20 13.3
Sector Master 96 64.0
Public 33 22.0 M.Phil. 34 22.7 Private 117 78.0 Position Manager 116 77.3 Non- Manager 34 22.7
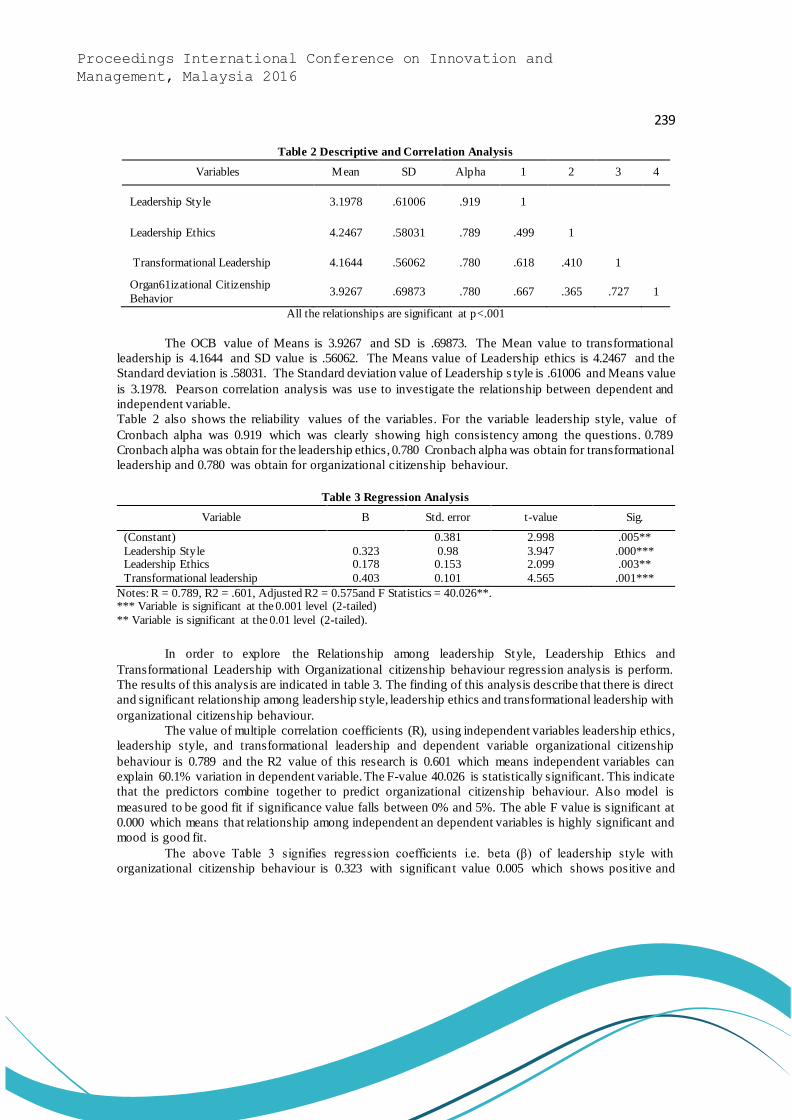
239
Proceedings International Conference on Innovation and
Management, Malaysia 2016
Table 2 Descriptive and Correlation Analysis
Variables Mean SD Alpha 1 2 3 4
Leadership Style 3.1978 .61006 .919 1
Leadership Ethics 4.2467 .58031 .789 .499 1
Transformational Leadership 4.1644 .56062 .780 .618 .410 1
Organ61izational Citizenship
Behavior 3.9267 .69873 .780 .667 .365 .727 1
All the relationships are significant at p<.001
The OCB value of Means is 3.9267 and SD is .69873. The Mean value to transformational
leadership is 4.1644 and SD value is .56062. The Means value of Leadership ethics is 4.2467 and the
Standard deviation is .58031. The Standard deviation value of Leadership s tyle is .61006 and Means value
is 3.1978. Pearson correlation analysis was use to investigate the relationship between dependent and
independent variable.
Table 2 also shows the reliability values of the variables. For the variable leadership style, value of
Cronbach alpha was 0.919 which was clearly showing high consistency among the questions. 0.789
Cronbach alpha was obtain for the leadership ethics, 0.780 Cronbach alpha was obtain for transformational
leadership and 0.780 was obtain for organizational citizenship behaviour.
Table 3 Regression Analysis
Variable B Std. error t-value Sig.
(Constant) 0.381 2.998 .005**
Leadership Style 0.323 0.98 3.947 .000*** Leadership Ethics 0.178 0.153 2.099 .003**
Transformational leadership 0.403 0.101 4.565 .001***
Notes: R = 0.789, R2 = .601, Adjusted R2 = 0.575and F Statistics = 40.026**. *** Variable is significant at the 0.001 level (2-tailed)
** Variable is significant at the 0.01 level (2-tailed).
In order to explore the Relationship among leadership Style, Leadership Ethics and
Transformational Leadership with Organizational citizenship behaviour regression analysis is perform.
The results of this analysis are indicated in table 3. The finding of this analysis describe that there is direct
and significant relationship among leadership style, leadership ethics and transformational leadership with
organizational citizenship behaviour.
The value of multiple correlation coefficients (R), using independent variables leadership ethics,
leadership style, and transformational leadership and dependent variable organizational citizenship
behaviour is 0.789 and the R2 value of this research is 0.601 which means independent variables can
explain 60.1% variation in dependent variable. The F-value 40.026 is statistically significant. This indicate
that the predictors combine together to predict organizational citizenship behaviour. Also model is
measured to be good fit if significance value falls between 0% and 5%. The able F value is significant at
0.000 which means that relationship among independent an dependent variables is highly significant and
mood is good fit.
The above Table 3 signifies regression coefficients i.e. beta (β) of leadership style with
organizational citizenship behaviour is 0.323 with significant value 0.005 which shows positive and

240
Proceedings International Conference on Innovation and
Management, Malaysia 2016
significant relationship among leadership style with organizational citizenship behaviour. This result
support the first research hypothesis, which is leadership style has significant impact on organizational
citizenship behaviour. So, we accept the 1st hypothesis. Regression coefficient i.e. beta (β) of leadership
ethics with organizational citizenship behaviour is 0.178 with significant value 0.000 which shows a
significant and positive impact of leadership ethics on organizational citizenship behaviour. This result
the 2nd hypothesis of this research, which is leadership ethics, has significant impact on organizational
citizenship behaviour. So we accept the 2nd research hypothesis. Regression coefficients i.e. Beta (β) of
transformational leadership style with organizational citizenship behaviour is .403 with significant value
.001 which shows positive and significant impact of transformational leadership style on organizational
citizenship behaviour. This results support the 3rd hypothesis which is Transformational leadership has
significant impact on organizational citizenship behaviour. So we also accept the 3rd hypothesis. 6 Conclusion
In this study, data was collected from total 150 employees of services sector which was the
useable response among which 111 were male and 39 were female. From financial services, 53.3%, from
educational sector 13.3%, from health sector 13.3% and from telecommunication sector 20% employees
make up the whole sample. Employees which are dominant age group lies between 31-35 years and major
chunk of these employees were having 5-12 years working experience and hence we were able to conclude
that most of the employees have enough work experience. Out of total respondents 22% respondent are
working in public sector and remaining 78% respondents are working in private sector. 77.3% respondents
are manager level employees and 22.7% respondents are working or non-manager position.
The relationship between dependent and independent variables of the study are positively
significant. Results indicate that the purposed hypotheses are accepted and we are failed to accept the null
hypotheses. The dependent variable (organizational citizenship behaviour) has positive association
between independent variables (leadership style, transformational leadership and leadership ethics).
There are some practical and policy implications of this study for managers. Specifically if
managers want to increase the commitment level and positive behaviours of employ ees at work they must
focus on favourable leadership style. They must improve their ethics and morality. If employees are well
equipped with modern skills and training these human resources can contribute significantly towards the
growth of organisation. Good leaders can produce good followers and mentoring is also one way of
succession planning for the future needs of an organisation. If leader is available beyond the call of duty
employees will be more willing to spend extra time in organisation.
Although we can assume that the respondents of this study provided unbiased and true responses
to the survey, which is necessary for drawing conclusion, there are still some limitations of this study. The
data of this study is from a developing country and Asian context these results may not be generalised
widely. There is still need to replicate in other regions. Moreover as data was collected from common
source and on the basis of self-reporting which may have common method biasedness. Other qualitative
techniques must be used which can minimise this biasedness. Some other industrial sectors must also be
considered for such type of study.
References
[1] Akhavan Tabassi, A. and Hassan Abu Bakar, A. (2010), “Towards assessing the leadership style
and quality of transformational leadership: the case of construction firms of Iran,” Journal of
Technology Management in China, Vol. 5 No.3, pp. 245-258.
[2] Arredondo Rucinski, D. and Bauch, P.A. (2006), “Reflective, ethical, and moral constructs in
educational leadership preparation: effects on graduates' practices”, Journal of Educational
Administration, Vol. 44 No. 5, pp. 487-508.

241
Proceedings International Conference on Innovation and
Management, Malaysia 2016
[3] Bruch, H. and Walter, F. (2007) “Leadership in context: Investigating hierarchical impacts on
transformational leadership,” Leadership & Organization Development Journal, Vol. 28 No.8, pp.
710-726.
[4] Bucic, T., Robinson, L. and Ramburuth, P. (2010), “Effects of leadership style on team learning,”
Journal of Workplace learning, Vol. 22 No. 4, pp.228-248.
[5] Casimir, G. and Ngee Keith Ng, Y. (2010). Combinative aspects of leadership style and the
interaction between leadership behaviours. Leadership & Organization Development Journal, Vol.31
No. 6, pp. 501-517.
[6] Castiglione, J. (2006) “Organizational learning and transformational leadership in the library
environment,” Library Management, Vol. 27 No. 4, pp. 289-299.
[7] Cheung, M.F. and Wong, C.S. (2011), “Transformational leadership, leader support, and employee
creativity,” Leadership & Organization Development Journal, Vol. 32 No. 7, pp. 656-672.
[8] Chompookum, D. and Brooklyn Derr, C. (2004), “The effects of internal career orientations on
organizational citizenship behavior in Thailand,” Career Development International, Vol. 9 No.4,
pp. 406-423.
[9] Crossman, J. (2010), “Conceptualising spiritual leadership in secular organizational contexts and its
relation to transformational, servant and environmental leadership,” Leadership & Organization
Development Journal, Vol. 31 No. 7, pp. 596-608.
[10] Døjbak Haakonsson, D., Burton, R.M., Obel, B. and Lauridsen, J. (2008), “How failure to align
organizational climate and leadership style affects performance,” Management Decision, Vol. 46
No. 3, pp. 406-432.
[11] Fitzgerald, S. and Schutte, N.S. (2010), “Increasing transformational leadership through enhancing
self-efficacy,” Journal of Management Development, Vol. 29 No. 5, pp. 495-505.
[12] Gregory, B.T., Nathan Moates, K. and Gregory, S.T. (2011), “An exploration of perspective taking
as an antecedent of transformational leadership behavior,” Leadership & Organization Development
Journal, Vol. 32 No.8, pp. 807-816.
[13] Ivey, G.W. and Kline, T.J. (2010), “Transformational and active transactional leadership in the
Canadian military” Leadership & Organization Development Journal, Vol. 31 No. 3, pp. 246-262
[14] Karam, C.M. (2011), “Good organizational soldiers: conflict-related stress predicts citizenship
behavior,” International Journal of Conflict Management, Vol. 22 No. 3, pp. 300-319.
[15] Karsten, L., Keulen, S., Kroeze, R. and Peters, R. (2009), “Leadership style and entrepreneurial
change: The Centurion operation at Philips Electronics,” Journal of Organizational Change
Management, Vol. 22 No. 1, pp. 73-91.
[16] Kate Nwadiogwa Nnabuife, E. (2010), “Defining and enforcing ethical leadership in Nigeria,”
African Journal of Economic and Management Studies, Vol. 1 No. 1, pp. 25-41.
[17] Kirkbride, P. (2006), “Developing transformational leaders: the full range leadership model in
action,” Industrial and Commercial Training, Vol. 38 No. 1, pp. 23-32.
[18] Kolthoff, E., Erakovich, R. and Lasthuizen, K. (2010), “Comparative analysis of ethical leadership
and ethical culture in local government: The USA, The Netherlands, Montenegro and Serbia,”
International Journal of Public Sector Management, Vol. 23 No. 7, pp. 596-612.
[19] Mayfield, C.O. and Taber, T.D. (2010), “A prosocial self-concept approach to understanding
organizational citizenship behavior,” Journal of Managerial Psychology, Vol. 25 No. 7, pp. 741-763.
[20] Mostovicz, I., Kakabadse, N. and Kakabadse, A. (2009), “CSR: the role of leadership in driving
ethical outcomes” Corporate Governance: The international journal of business in Society, Vol. 9
No. 4, pp. 448-460.
[21] Norberg, K. and Johansson, O. (2010), “The ethical dimensions of curriculum leadership in
Scandinavian countries,” Journal of Educational Administration, Vol. 48 No. 3, pp. 327-336.

242
Proceedings International Conference on Innovation and
Management, Malaysia 2016
[22] Odom, L., Owen, R., Valley, A. and Burrell, P. (2011), “Obamacare: an ethical analysis of his
leadership and the health reform initiative,” Leadership in Health services, Vol. 24 No. 4, pp. 325-
336.
[23] Priyadharshini, S.L. and Mahadevan, A. (2014), “Mediating role of organizational citizenship
behavior on hrm practices and turnover intention among production engineers,” International
Journal of Organizational Behaviour & Management Perspectives, Vol. 3 No. 2, p.994.
[24] Rafiq Awan, M. and Mahmood, K. (2010), “Relationship among leadership style, organizational
culture and employee commitment in university libraries” Library Management, Vol. 31 No 4, pp.
253-266.
[25] Rohmann, A. and Rowold, J. (2009), “Gender and leadership style: a field study in different
organizational contexts in Germany,” Equal Opportunities International, Vol 28 No. 7, pp. 545-560.
[26] Rok, B. (2009), “Ethical context of the participative leadership model: taking people into account,”
Corporate Governance: The International Journal of Business in Society, Vol. 9 No. 4, pp. 461-472.
[27] Singh, N. and Krishnan, V.R. (2008), “Self-sacrifice and transformational leadership: mediating
role of altruism,” Leadership & Organization Development Journal, Vol. 29 No. 3, pp. 261-274.
[28] Van Velsor, E. and Ascalon, E. (2008), “The role and impact of leadership development in
supporting ethical action in organisations,” Journal of Management Development, Vol. 27 No. 2, pp.
187-195.
[29] Viitanen, E. and Konu, A. (2009), “Leadership style profiles of middle-level managers in social and
health care,” Leadership in Health Services, Vol. 22 No. 2, pp. 108-120.
[30] Yu, H.C. and Miller, P. (2005), “Leadership style: The X Generation and Baby Boomers compared
in different cultural contexts,” Leadership & Organization Development Journal, Vol. 26 No. 1, pp.
35-50.
[31] Zheng, Q., Wang, M. and Li, Z. (2011), “Rethinking ethical leadership, social capital and customer
relationship,” Journal of Management Development, Vol. 30 No. 7, pp. 663-674.
243
Proceedings International Conference on Innovation and
Management, Malaysia 2016
Secondary Teachers’ Mathematical Content Knowledge and Teacher
Education: A Case Study of Dhaka, Bangladesh
Sheikh Asadullah
School of Education, University of New South Wales, Sydney, NSW 2052, Australia.
(E-mail: [email protected])
Abstract In Bangladesh, there are improvements in secondary education by quantitative indicators but
satisfactory picture is remained far from the quality. The gross deficiency in teaching includes one of the
main reasons for poor quality of secondary education. There are higher failure rates in Mathematics
subject in Secondary School Certificate examination in the last consecutive years. An extensive review
of research has shown that teachers account to a large extent for student learning and achievement gains.
For secondary teacher education in Bangladesh, there is a one year long training program named as
Bachelor of Education (B.Ed.). Therefore, the study sought to find out the effectiveness of B.Ed.
training program on mathematics teachers’ content knowledge as a means of improving secondary
school mathematics in Bangladesh. The study was conducted among 38 mathematics teachers (trained
and untrained) selected from 16 secondary schools of Dhaka city using survey method. Teachers content
knowledge were measured through an assessment test and classroom teaching observation. The study
found that though the B.Ed. trained mathematics teachers (96.3%) possess better content knowledge
than their counterpart (91.7%) but no relationship between teachers’ personal characteristics and their
content knowledge in mathematics.
Keywords Content knowledge, Secondary school mathematics teachers of Bangladesh, Bachelor of
Education, Teachers Training College.
1 Introduction As well as constitutional obligations (GoB, 1972), successive governments have seen education as
critical to poverty reduction, economic progress and prosperity (Andeleeb, 2007; Ministry of Education
[MoE], 2012) and have made “international commitments to ensure the achievement of ‘education for all’
goals and targets for every citizen by the year 2015” (Rahman, Hamzah, Meerah & Rahman, 2010, p.
115). Thus, various government and non-government initiatives have resulted in significant progress with
regard to access to both primary and secondary education such as more schools and teachers, curriculu m
revision and increased enrolment rates especially for girls in secondary education (Rahman et al., 2010).
Also, for enhancing the quality of primary and secondary education the government of Bangladesh has
been considering teacher education as a major factor. In secondary education a one year compulsory B.
Ed teacher education program is being provided by the Teacher Training Colleges (TTCs) to build teacher
capacity in the form of new knowledge, skills and attitudes and in the application of these in pra ctice
(B.Ed. Curriculum, 2006-2007). However, weakness has been identified in the quality of secondary
education particularly in the students’ mathematics achievement (Ahmed, Nath, Hossain & Kalam, 2006;
Nath et al., 2007). For example, poor student performance in year eight (Junior Secondary year ten
(Secondary Certificate) and School Certificate) public examinations has been attributed to consistently
high failure rates in English and Mathematics. An extensive review of research (see Hattie, 2003, 2009)
has shown that teachers account to a large extent for student learning and achievement gains. Several
studies (see Ahmed et al., 2006; Nath et al., 2007) have attributed poor student performance and low
quality education to poor instructional practices of teachers as one of the main reason in Bangladesh.
Again, there is consensus in teaching and teacher education literature (Bransford, Darling -Hammond &
LePage, 2005; Grossman & McDonald, 2008; Hiebert, Morris, Berk & Jansen, 2007; Munby, Russell &
244
Proceedings International Conference on Innovation and
Management, Malaysia 2016
Martin, 2001) that content-specific knowledge, general pedagogical knowledge and skills are important
determinants of instructional quality that affect students’ learning gains.
In mathematics domain, content knowledge establishes an essential foundation for teach er’s
pedagogical knowledge and skills for teaching mathematics (Ernest, 1989). Rowan, Chaing & Miller
(1997) put the rationale that a deep understanding in the subject being taught facilitates teachers in
planning and in the academic interaction in teaching. Consistent with the rationale, studies (Fennema &
Franke 1992: Swafford, Jones & Thornton, 1997) also revealed that mathematical content knowledge can
lead to higher-quality instruction However, researchers had acknowledged that the profession specific
content knowledge is acquired through formal training, university -level training and can be cultivated
through systematic reflection on classroom experience (Ball, Lubienski & Mewborn, 2001; Baumart et
al., 2010; Berliner, 1994; Grossman, 2008).
Therefore, studies are needed to find out the quality of these teacher training programs offered by
different institutions. No empirical studies conducted earlier the present study in the secondary education
sector of Bangladesh to evaluate the effectiveness of teacher education programs. The studies (ADB 2002,
2004; MoE 2004) investigated the factors affecting the quality of secondary education and the prevailing
problems of teacher education system in Bangladesh. The studies were not conducted on teachers’ training
objectives or teacher competencies developed through training. Therefore, this study was the first study
conducted on Bangladesh secondary education in order to investigate the effectiveness of a teacher
education program. However, to examine the quality of all these teacher training programs was not the
scope of this study. This study rather attempted to measure the effectiveness of the Bachelor of Education
(B.Ed.) program on mathematics with regard to developing profession specific mathematical content
knowledge of secondary school mathematics teachers in Bangladesh.
2 Teacher Knowledge From the beginning of research into teacher knowledge, there have been differences in opinion
about the kinds of teacher knowledge. Researchers investigating teachers knowledge have also aimed to
develop a knowledge base for teaching and, where possible, translating it into recommendation for teacher
education (Reynolds, 1989). Stimulated by Shulman’s work and his categories of knowledge bases
(Shulman, 1986, 1987), researchers (Killen, 2013; Turner-Bisset, 2001) tended to develop model of
knowledge base to sketch the requirement of the all the knowledge bases in effective teaching including
defining the knowledge bases. For example, Killen (2013) categorized all the knowledge bases into four
broad types: content knowledge, learner and learning knowledge, pedagogical knowledge, and
pedagogical content knowledge. According to Killen (2013),
Content knowledge is the knowledge of the subject or the discipline. This knowledge comprises of
understanding the subject deeply (the concepts, principles and relationships that define the subject) and
flexibly to help students crate cognitive maps, link ideas, address misconceptions.
Pedagogical knowledge is referred as how to guide students ’ learning in appropriate ways in
specific circumstances, for example, how to attract and hold attention, and how to manage resources.
Learner and learning knowledge includes how students learn that consists of different elements:
empirical knowledge of learners and cognitive knowledge of learners to interpret learners ’ statements and
actions and to shape productive learning experiences. Empirical knowledge is the knowledge in children
physical, social and emotional domains. Cognitive knowledge of learner has two elements- knowledge of
child development which inform practice and the other one is context -bound to a particular group of
learners.
Pedagogical content knowledge (PCK) is conceptualised as an overarching knowledge base
comprising all of the knowledge- content knowledge, knowledge of learner and learning, and pedagogical
knowledge and derived from the interaction and intersection of all these knowledge (Killen, 2013).

245
Proceedings International Conference on Innovation and
Management, Malaysia 2016
3 Bachelor of Education (B. Ed.) in Bangladesh Teacher education program include coursework which focus on equipping teachers with
knowledge and understanding of student needs, development and learning, pedagogical knowledge and,
content area knowledge (Stronge, 2007). The aim of the secondary teacher education in Bangladesh is to
re-orientate secondary teachers’ understanding of what constitutes teaching and produces a change in their
classroom practice that increases student achievement. Its purpose is to build teacher capacity in the form
of new knowledge, skills and attitudes and in the application of these in practice. The curriculum of teacher
education is, therefore, based on a defined set of teacher competencies and its content selected to provide
the programs that enable untrained teachers and teacher trainees to develop and demonstrate a range of
competencies required to promote student learning (B.Ed. Curriculum, 2006-2007). The present B.Ed .
syllabus has been revised under National University Act. 1992 (Act 37 of 1992) and has been in effect in
the government and private TTCs from the academic year 2006-2007.
Bachelor of Education (B. Ed.) program is titled as Bachelor of Education (Secondary Teaching)
and the name of the award is Bachelor of Education. This course is for one academic session (one year
long) and there are 1200 student learning hours. The accrediting institute of this program is National
University and the implementing institutes are Teacher Training College (TTC) administered by the
government and the private sector (B.Ed. Curriculum, 2006-2007, pp- 1 & 8).
3.1 “Teaching Mathematics” course in B.Ed.
“Teaching Mathematics” is a course of the B.Ed. training under ‘Teaching Studies’ learning area.
This course provides a range of learning opportunities designed specifically for trainees seeking to
become secondary mathematics teachers. The purpose of this course is to support trainees to develop the
knowledge, skills and attitudes required to competently teach mathematics in the Bangladesh secondary
school curriculum for years 6-8 and years 9-10. The content of the “Teaching Mathematics” course is
divided into 06 (six) units: Secondary mathematics curriculum in Bangladesh, Teaching learning
approaches in the mathematics classroom, Logical approaches to familiar topics, Approaching difficult
mathematics topics, Planning lessons for effective teaching and learning in mathematics, Assessment
of student progress and achievement, and Independent learning in mathematics.
4 Literature Review on Teacher Education and Content Knowledge Research Researchers had explored the effect of teacher education or teacher training effectiveness using
different approaches. Some researchers (for example, Farooq & Shahzadi, 2006; Palardy & Rumberger,
2008) had attempted the effect of teacher training program by inves tigated direct relationships between
student achievement and teachers’ participation in teacher training and teacher education programs.
Farooq & Shahzadi (2006) study in Pakistan evaluated effectiveness of teaching of trained and untrained
teachers by comparing the mathematics achievement of 400 students by the teachers. Using descriptive
survey design the study found significant differences in the teaching of trained and untrained teachers of
mathematics and stressed that the teaching of trained teachers had significant impact on the mathematics
achievement of the students.
Guarino, Hamilton, Lockwood & Rathbun (2006) conducted a study using data from the Early
Childhood Longitudinal Study, Kindergarten Class of 1998 –99 (ECLS-K) collected by National Centre
for Education Statistics (NCES) in the USA. The study examined the relationship of teachers’ background
variables (teaching certification, coursework in pedagogy, employment status and, teaching experience)
and instructional practices and student achievement (in reading and mathematics) during the kindergarten
year. Using two-level hierarchical linear modelling (HLM), the study showed only teachers’ amount of
coursework in pedagogy had a positive relationship with instructional practices (in reading an d
mathematics) that were associated with higher students’ achievement in both subjects. Also, the study
found instructional practices were positively associated with student achievement gains in both subjects
246
Proceedings International Conference on Innovation and
Management, Malaysia 2016
but, no direct relationship between the qualifications of teachers and student achievement with the
exception of teachers’ employment status (part time and full time).
Investigating the relationship between teachers mathematical content knowledge, instructional
quality, and students’ mathematical score, several studies (Baumert et al., 2010; Harbison & Hanushek,
1992; Mullens, Murnane & Willett, 1996; Rowan et al., 1997) administered mathematical test/quiz to the
teachers. For example, Baumert and colleagues (2010) in Germany investigated the extent to which
content knowledge (CK) and pedagogical content knowledge (PCK) influenced instructional quality that,
in turn, influenced students’ learning gains in mathematics. The study was conducted in Germany for one
year with a representative sample of Grade 10 students and their mathematics teachers. Students’ pre-test
and post-test was used to assess mathematics learning progress, a 13 items paper-and-pencil test to
measure teachers content knowledge in mathematics, three knowledge dimensions (mathematical tasks,
student thinking and multiple representation) to assess PCK, and different data sources (student’s rating,
teachers’ task to students, expert coding, and tapping perceptions) to assess instructional quality into three
dimensions (cognitive activation, individual learning support, and effective classroom management). By
using the multilevel structural equation model the study revealed that both the CK and PCK had
correlation with their instructional approaches as well as students’ learning outcomes.
On the other, some researchers (Ball, 1990; Heaton, 2000; Ma, 1999; Simon, 1993) used
interviewing teachers in investigating teachers’ mathematical content knowledge to provide more
informative picture. However, though research (Ernest, 1989, Rowan et al., 1997; Swafford et al., 1997)
consistently shows the importance of content knowledge in regard to instructional quality and developed
observation checklist to measure the content knowledge of teacher during teaching (for example, EED,
2014), there seem to have paucity of research that evaluated the teachers level of content knowledge using
observation checklist.
5 Conceptual Framework and Research Question The main findings of the literature review above provided the basis for the development of a
conceptual framework for the study. The conceptual framework allowed relative comparison of teachers’
mathematical content knowledge covering the areas in algebra, trigonometry, and geometry to measure
the secondary school mathematics teacher effects particularly the participation in the teacher education
program (B.Ed.) on their secondary mathematics content knowledge. With respect to the purpose of the
study, the single research question guided the study: Is there any difference between trained and untrained
mathematics teachers in their teaching practices of mathematics? . The question refers to the development
of secondary mathematics content knowledge that the teachers had gained through the B.Ed. program.
Besides, this study also examined whether teachers ’ personal characteristics such as age, duration of
service, academic qualification, type of the institute and so forth had any relationship with their content
knowledge.
6 Method and Procedure 6.1 Design and sample
A non-experimental comparative approach was employed in the study in order to measure the
effectiveness of the B.Ed. program on secondary school mathematics teaching by comparing the
secondary mathematics content knowledge of B. Ed trained mathematics teachers’ and untrained
mathematics teachers. Sample of the study was drawn through convenient sampling strategy. 23 B.Ed .
trained secondary school mathematics teachers and 15 untrained secondary school mathematics teachers
were identified form 4 public and 12 private secondary school of Dhaka city. Mathematics teachers who
had already undergone the Bachelor of Education (B.Ed.) training were considered as trained teachers
while those who had neither B. Ed. training nor received any kind of professional training in mathematics
247
Proceedings International Conference on Innovation and
Management, Malaysia 2016
were considered as untrained teachers. Mathematics is taught as a compulsory subject from grade I to
grade X in Bangladesh secondary schools. In order to maintain the reliability of the observation data, the
mathematics teaching either in grade IX or X were observed.
6.2 Data collection
Primary data was collected by administering a mathematical test on two groups of teachers as well
observing their classroom teaching. The items/questions in the assessment test were adopted from the test
used in the Bangladesh Rural Advancement Committee (BRAC) research on “Evaluation of PACE
Training for Mathematics Teachers of the Rural Non-Government Secondary Schools” in 2007. The
assessment test was consisted of ten questions chosen from the contents of Units 3 (Logical approaches
to familiar topics) and Unit 4 (Approaching difficult topics) that concretely deal with the mathematical
subject knowledge. The test of which the duration was one hour was administered at the teacher’s school
in the teachers’ native language, Bangla. The total score for the test was 100 with 10 scores for each
question. All answer sheets of the assessment tests were evaluated by one mathematics instructor of Dhaka
TTC and rechecked by the researcher.
The researcher along with either the headmaster of participant teachers’ school or the B.Ed. trainer
of Dhaka Teacher Training College observed the general mathematics classroom teaching either in grade
IX or grade X of the two groups of teachers to assess the depth of content knowledge in mathematics
teaching. The item ‘Depth of content knowledge’ had been adopted from the observation checklist which
is used as the “Teaching Practice Assessment Form” to assess the teacher trainees’ classroom teaching of
the B.Ed. program. This checklist has a five point rating scale from 1 to 5 where 1 refers to poor, 2 refers
to fair, 3 indicates good, 4 refers to better, and 5 for the best performance in the teaching behaviour.
Scoring for the depth of teachers’ content knowledge was done by observing the two aspects of teaching -
Clear logical steps in lesson delivery and Competency of the solving problems.
6.3 Data analysis
The collected data was analyzed quantitatively. For the quantitative analysis, the descriptive
statistics were computed using the SPSS version 22.0. Pearson Product Moment Correlation (Pearson
Correlation and Kruskal-Wallis H-test) was used to find out the significant correlation between teachers’
personal characteristics (age, teaching experience, academic attainment and the type of institute they
serve) and their content knowledge.
7 Results 7.1 Characteristics of the sample
The demographic data of all the 38 teachers including their age, academic background, gender,
type of institute, experiences in teaching are provided in Table 1. According to the demographical
characteristics of both the untrained and the trained teachers, a significant difference was observed only
with relation to their age and teaching experience.
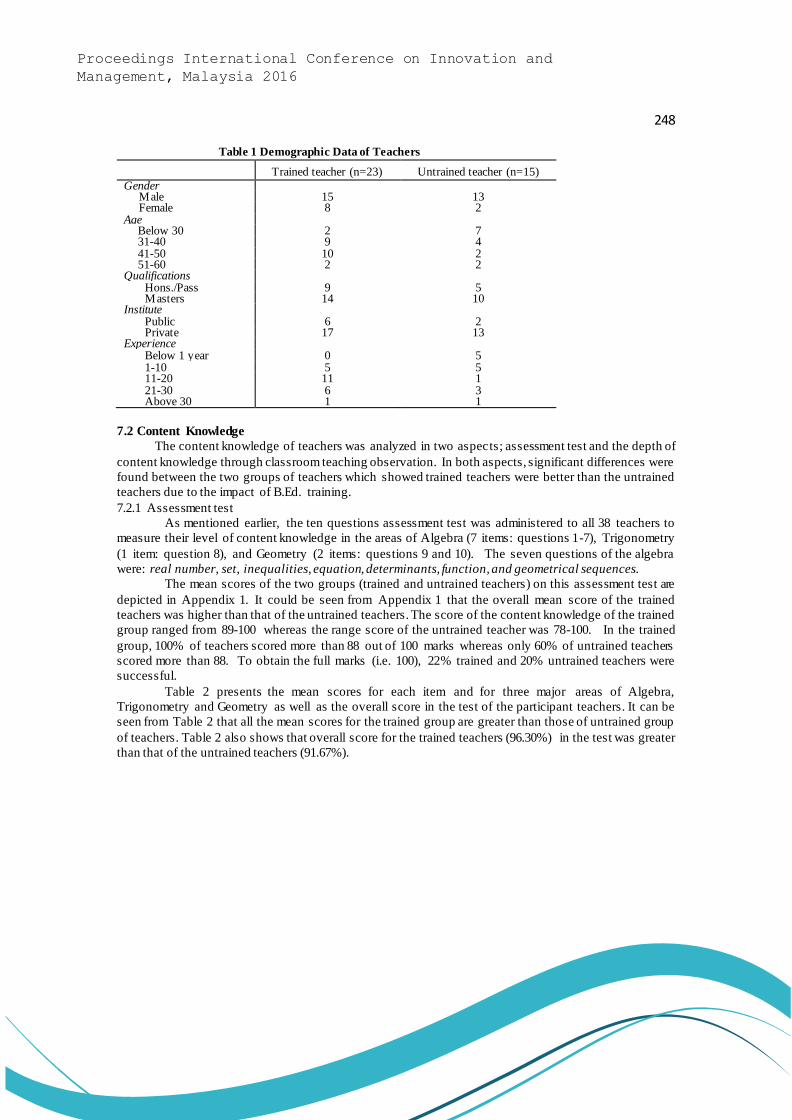
248
Proceedings International Conference on Innovation and
Management, Malaysia 2016
Table 1 Demographic Data of Teachers
Trained teacher (n=23) Untrained teacher (n=15)
Gender Male 15 13 Female 8 2 Age
Below 30 2 7 31-40 9 4 41-50 10 2 51-60 2 2
Qualifications Hons./Pass 9 5 Masters 14 10 Institute Public 6 2 Private 17 13 Experience Below 1 year 0 5 1-10 5 5 11-20 11 1 21-30 6 3 Above 30 1 1
7.2 Content Knowledge
The content knowledge of teachers was analyzed in two aspects; assessment test and the depth of
content knowledge through classroom teaching observation. In both aspects, significant differences were
found between the two groups of teachers which showed trained teachers were better than the untrained
teachers due to the impact of B.Ed. training.
7.2.1 Assessment test
As mentioned earlier, the ten questions assessment test was administered to all 38 teachers to
measure their level of content knowledge in the areas of Algebra (7 items: questions 1-7), Trigonometry
(1 item: question 8), and Geometry (2 items: questions 9 and 10). The seven questions of the algebra
were: real number, set, inequalities, equation, determinants, function, and geometrical sequences.
The mean scores of the two groups (trained and untrained teachers) on this assessment test are
depicted in Appendix 1. It could be seen from Appendix 1 that the overall mean score of the trained
teachers was higher than that of the untrained teachers. The score of the content knowledge of the trained
group ranged from 89-100 whereas the range score of the untrained teacher was 78-100. In the trained
group, 100% of teachers scored more than 88 out of 100 marks whereas only 60% of untrained teachers
scored more than 88. To obtain the full marks (i.e. 100), 22% trained and 20% untrained teachers were
successful.
Table 2 presents the mean scores for each item and for three major areas of Algebra,
Trigonometry and Geometry as well as the overall score in the test of the participant teachers. It can be
seen from Table 2 that all the mean scores for the trained group are greater than those of untrained group
of teachers. Table 2 also shows that overall score for the trained teachers (96.30%) in the test was greater
than that of the untrained teachers (91.67%).
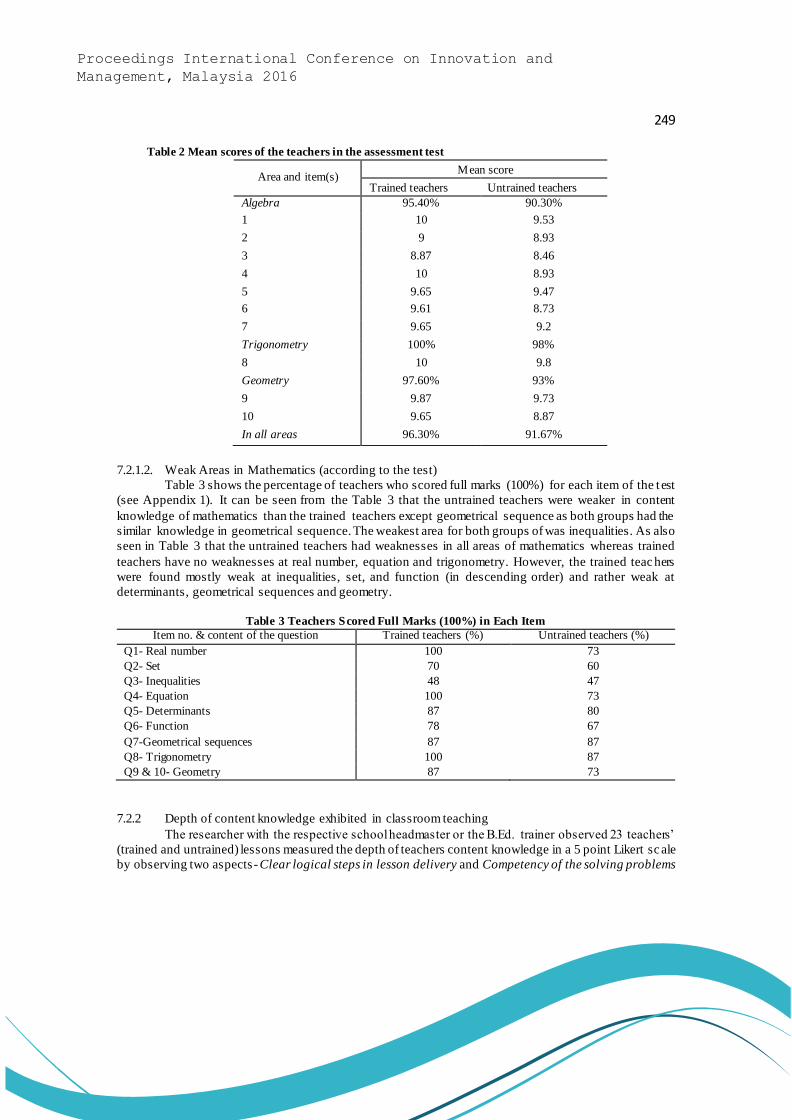
249
Proceedings International Conference on Innovation and
Management, Malaysia 2016
Table 2 Mean scores of the teachers in the assessment test
Area and item(s) Mean score
Trained teachers Untrained teachers
Algebra 95.40% 90.30%
1 10 9.53
2 9 8.93
3 8.87 8.46
4 10 8.93
5 9.65 9.47
6 9.61 8.73
7 9.65 9.2
Trigonometry 100% 98%
8 10 9.8
Geometry 97.60% 93%
9 9.87 9.73
10 9.65 8.87
In all areas 96.30% 91.67%
7.2.1.2. Weak Areas in Mathematics (according to the test)
Table 3 shows the percentage of teachers who scored full marks (100%) for each item of the t est
(see Appendix 1). It can be seen from the Table 3 that the untrained teachers were weaker in content
knowledge of mathematics than the trained teachers except geometrical sequence as both groups had the
similar knowledge in geometrical sequence. The weakest area for both groups of was inequalities. As also
seen in Table 3 that the untrained teachers had weaknesses in all areas of mathematics whereas trained
teachers have no weaknesses at real number, equation and trigonometry. However, the trained teac hers
were found mostly weak at inequalities, set, and function (in descending order) and rather weak at
determinants, geometrical sequences and geometry.
Table 3 Teachers Scored Full Marks (100%) in Each Item
Item no. & content of the question Trained teachers (%) Untrained teachers (%)
Q1- Real number 100 73
Q2- Set 70 60
Q3- Inequalities 48 47
Q4- Equation 100 73
Q5- Determinants 87 80
Q6- Function 78 67
Q7-Geometrical sequences 87 87
Q8- Trigonometry 100 87
Q9 & 10- Geometry 87 73
7.2.2 Depth of content knowledge exhibited in classroom teaching
The researcher with the respective school headmaster or the B.Ed. trainer observed 23 teachers’
(trained and untrained) lessons measured the depth of teachers content knowledge in a 5 point Likert sc ale
by observing two aspects- Clear logical steps in lesson delivery and Competency of the solving problems
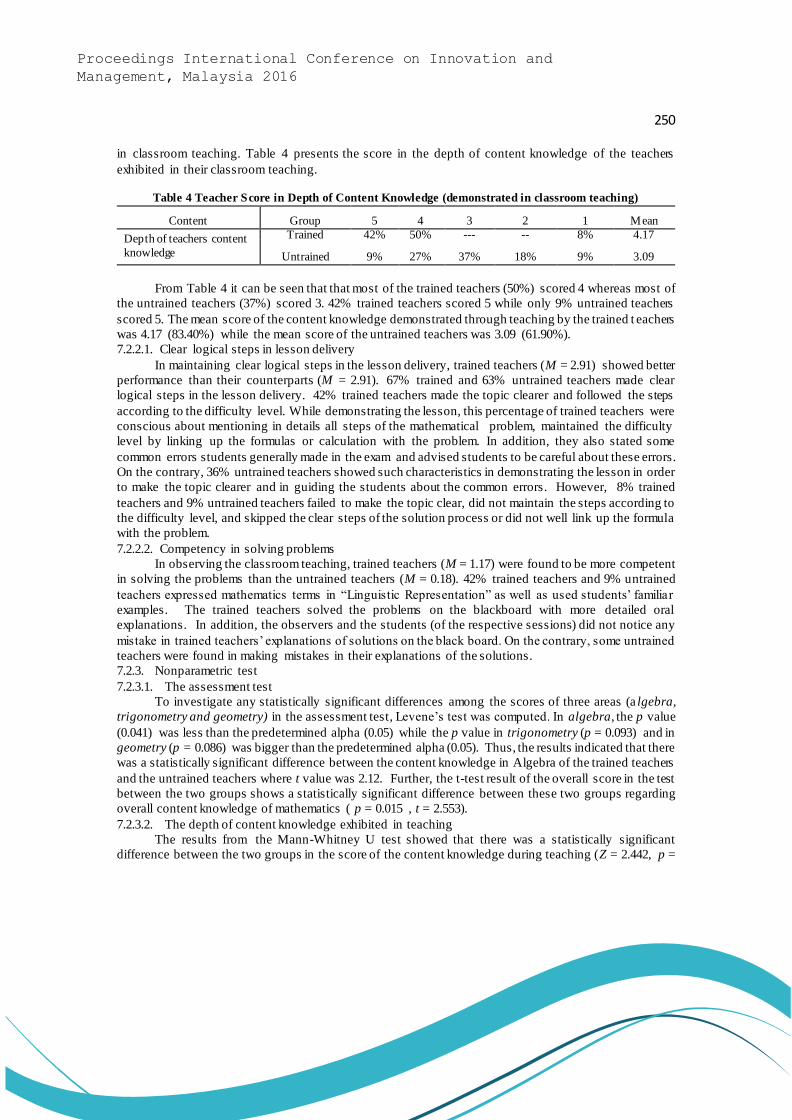
250
Proceedings International Conference on Innovation and
Management, Malaysia 2016
in classroom teaching. Table 4 presents the score in the depth of content knowledge of the teachers
exhibited in their classroom teaching.
Table 4 Teacher Score in Depth of Content Knowledge (demonstrated in classroom teaching)
Content Group 5 4 3 2 1 Mean
Depth of teachers content
knowledge
Trained 42% 50% --- -- 8% 4.17
Untrained 9% 27% 37% 18% 9% 3.09
From Table 4 it can be seen that that most of the trained teachers (50%) scored 4 whereas most of
the untrained teachers (37%) scored 3. 42% trained teachers scored 5 while only 9% untrained teachers
scored 5. The mean score of the content knowledge demonstrated through teaching by the trained t eachers
was 4.17 (83.40%) while the mean score of the untrained teachers was 3.09 (61.90%).
7.2.2.1. Clear logical steps in lesson delivery
In maintaining clear logical steps in the lesson delivery, trained teachers (M = 2.91) showed better
performance than their counterparts (M = 2.91). 67% trained and 63% untrained teachers made clear
logical steps in the lesson delivery. 42% trained teachers made the topic clearer and followed the steps
according to the difficulty level. While demonstrating the lesson, this percentage of trained teachers were
conscious about mentioning in details all steps of the mathematical problem, maintained the difficulty
level by linking up the formulas or calculation with the problem. In addition, they also stated some
common errors students generally made in the exam and advised students to be careful about these errors.
On the contrary, 36% untrained teachers showed such characteristics in demonstrating the lesson in order
to make the topic clearer and in guiding the students about the common errors. However, 8% trained
teachers and 9% untrained teachers failed to make the topic clear, did not maintain the steps according to
the difficulty level, and skipped the clear steps of the solution process or did not well link up the formula
with the problem.
7.2.2.2. Competency in solving problems
In observing the classroom teaching, trained teachers (M = 1.17) were found to be more competent
in solving the problems than the untrained teachers (M = 0.18). 42% trained teachers and 9% untrained
teachers expressed mathematics terms in “Linguistic Representation” as well as used students’ familiar
examples. The trained teachers solved the problems on the blackboard with more detailed oral
explanations. In addition, the observers and the students (of the respective sessions) did not notice any
mistake in trained teachers’ explanations of solutions on the black board. On the contrary, some untrained
teachers were found in making mistakes in their explanations of the solutions.
7.2.3. Nonparametric test
7.2.3.1. The assessment test
To investigate any statistically significant differences among the scores of three areas (a lgebra,
trigonometry and geometry) in the assessment test, Levene’s test was computed. In algebra, the p value
(0.041) was less than the predetermined alpha (0.05) while the p value in trigonometry (p = 0.093) and in
geometry (p = 0.086) was bigger than the predetermined alpha (0.05). Thus, the results indicated that there
was a statistically significant difference between the content knowledge in Algebra of the trained teachers
and the untrained teachers where t value was 2.12. Further, the t-test result of the overall score in the test
between the two groups shows a statistically significant difference between these two groups regarding
overall content knowledge of mathematics ( p = 0.015 , t = 2.553).
7.2.3.2. The depth of content knowledge exhibited in teaching
The results from the Mann-Whitney U test showed that there was a statistically significant
difference between the two groups in the score of the content knowledge during teaching (Z = 2.442, p =

251
Proceedings International Conference on Innovation and
Management, Malaysia 2016
0.015). The finding was further confirmed by the results of the t-test at the 5 % significance level (p =
0.032; t = 2.291).
Based on the above results and analysis of the assessment test, classroom observation and the
nonparametric test, it can be claimed that mathematics trained teachers possessed more content knowledge
than the untrained group did. The difference is significant for the level of content knowledge in a lgebra
and in classroom teaching particularly in solving problems and in presenting clearer logical sequences in
lesson delivery.
8 Relationship between Teachers’ Personal Characteristics and Content
Knowledge One of the purposes of this study was to find out any significant relationship between the two
groups of teachers with regard to their personal characteristics (age, experience, qualification, and
institution type) and their mathematical content knowledge.
8.1 Correlation with teachers’ age and experience
The Pearson correlation (two tails) test at 5% level of significance was used to measure the
correlation of teachers’ age, experience with their content knowledge. The summary results are shown in
Table 5. As shown in Table 5, it can be revealed that there was no significant relationship between
teachers’ age and their experience with their content knowledge.
Table 5 Correlation of teachers’ age and experience with content knowledge
Variables Teachers Age Teaching experience
Content Knowledge lrl = 0.294
p = 0.073 > 0.05
lrl =0.246
p = 0.137 > 0.05
8.2 Correlation with qualification and type of the institute
The Kruskal-Wallis H-test at 5% level of significance was used to observe the relationship. The
summary results are shown in Table 7. According to the results in depicted in Table 7, it was found that
there was no significant relationship between teachers’ qualification and the type of the institutes they
served with their content knowledge in mathematics .
Table 6 Correlation of teachers’ qualification and the type of institute (public/private)
with content knowledge
9 Discussion 9.1 Research question 1: Is there any difference between the trained and the untrained mathematics
teachers in their content knowledge?
The study found that the trained teachers were ahead of the untrained teachers in the content
knowledge level of mathematics. In the assessment test as well as in the depth of content knowledge
while teaching, the trained teachers scored better than their counterparts. The nonparametric tests
confirmed the findings combined with a significance difference in the level of content knowledge (both
in assessment test and depth of content knowledge in classroom teaching) between the trained and the
untrained group.
Variables Qualification Type of Institute
Content knowledge H = 0.045
p = 0.831 > .05
H = 3.718
p = 0.054 > .05
252
Proceedings International Conference on Innovation and
Management, Malaysia 2016
In the assessment test, the variance of the trained teachers’ mathematical knowledge was lower
(100 - 89 = 11) than that of the untrained teachers (100 - 78 = 22). All trained teachers were able to score
89% marks in the test whereas the untrained teachers’ minimum score was 78%. This suggests that that
through the training, the trained teachers could confirm the certain leve l of competency (89%) in
mathematics.
In regard to the problem areas in the assessment test, though the trained teachers had problems in
some areas of mathematics noticeably in inequalities, set, function, determinants, geometrical sequences
and geometry similar to their counterparts, but the level of weaknesses of the untrained teachers was more
than that of the trained teachers. Thus, it seemed that the untrained teachers could be able to improve the
level of content knowledge in those difficult areas of mathematics through participating in the B.Ed .
training. Further, it could be understood that the B.Ed. training had the impact to improve the level of
knowledge in mathematics among teachers who enrolled in the B.Ed. program since the teachers could
solve the problems in mathematics by enrolling in the program.
As observed, the trained teachers showed the depth of content knowledge than the untrained
teachers while teaching mathematics in the classroom. Possessing better content knowledge by the tra ined
teachers reveled in the assessment test could have facilitated them to conduct their sessions by delivering
the lessons more logically and precisely to the students and to perform better in solving problems in the
classroom.
9.2. Research question 2: Is there any relationship between teacher’s personal characteristics and
content knowledges?
In the two groups of teachers in this study, significant differences were found between age and
teaching experiences. Nevertheless, the differences did not have any impact on the differences found in
content knowledge between the two groups of teachers since it was found that their age and teaching
experience did not have any significant relation. No relationship was also found between teachers’
academic qualification and the type of institutes they served. The older age, longer teaching experience
and higher academic qualification did not guarantee better content knowledge. Whether the teachers
worked in either a pubic or a private institute, it did not have any impact on those professional aspects.
Observing the personal characteristics of the teachers participated in this study, it was seen that,
17 (73%) teachers from the age range between 25 and 40 and 7 teachers (44%) from the age range between
41 and 57 possessed master level qualifications (see Table 1). Therefore, it is noteworthy to mention that
more teachers with higher academic qualifications enter the secondary schools as teachers currently than
earlier days; the reason may be due to the rising unemployment in Bangladesh. It was showed in Table
1 that, 26% untrained teachers were over 41 years of age and 74 % were below 40. The reasons may be
due to the effective implementation of educational reforms by the Bangladesh government regarding the
increase of the trained teachers’ percentage in secondary schools. This was clear from the percentages of
trained teachers in the years 2003, 2004, 2005 which were 48.6%, 50.5%, 53.6% respectively (BANBEIS,
2006).
10 Limitations Due to the limitation of time and resources, the study could not maintain the standard sample size.
As a Japanese Development Scholarship (JDS) fellow, the researcher had very limited time to conduct the
field visit. The study utilized a sample size of 38 mathematics teachers from 16 secondary schools of
Dhaka city only due to the time constraint and the availability of the res ources. The study included data
from the teachers in private schools aided by the government. Teachers trained under the previous B.Ed .
program were also included in the sample.
11 Conclusion

253
Proceedings International Conference on Innovation and
Management, Malaysia 2016
According to the finding of the study, the B.Ed. trained mathematics teachers had better content
knowledge than the untrained mathematics teachers. The trained teachers also exhibited in -depth content
knowledge more than their counterparts while teaching mathematics in the classroom. Similar to the
untrained teachers, trained teachers also had problems in some areas of algebra such as Inequalities, Set,
Function, Determinants, and Geometrical Sequences and in Geometry and so forth.
Teachers’ personal characteristics (age, service length, academic background, and type of institute (public
or private)) did not have any significant correlation with teachers’ content knowledge, pedagogical skills,
attitudes and beliefs. Hence, the B.Ed. program was effective in improving the secondary school
mathematics teachers’ content knowledge level.
References [1] Ahmed, M., Nath, R.S., Hossain, A., & Kalam, A.M. Education Watch, 2005. The State of
Secondary Education: Progress and Challenge, Dhaka, Bangladesh: Campaign for Popular
Education (CAMPE), 2005.
[2] Andaleeb, S. (Ed.). Political Culture in Bangladesh: Perspectives and Analysis. Dhaka, Bangladesh:
Bangladesh Development Initiative, 2007.
[3] Asian Development Bank (ADB). Technical Assistance to The People’s Republic Of Bangladesh
For Preparing The Teaching Quality Improvement In Secondary Education Project. Retrieved from
http://www.adb.org/sites/default/files/project-document/71019/r178-02.pdf, 2002.
[4] Asian Development Bank (ADB). Report And Recommendation of The President to The Board of
Directors on A Proposed Loan to the People’s Republic Of Bangladesh For The Teaching Quality
Improvement In Secondary Education Project. Retrieved from
http://www.adb.org/sites/default/files/project-document/71019/r178-02.pdf, 2004.
[5] Bachelor of Education Curriculum, Effective form the Session: 2006-2007. National University,
Gazipur. Ministry of Education, Government of the People’s Republic of Bangladesh.
[6] Ball, D. The Mathematical Understandings That Prospective Teachers Bring to Teacher Education.
The Elementary School Journal, 1990, 90, 449–466.
[7] Ball, D., Lubienski, S., & Mewborn, D. Research on teaching mathematics: The Unsolved Problem
of Teachers’ Mathematical Knowledge. In V. Richardson (Ed.), Handbook of Research on Teaching
(pp. 433 – 456). Washington, DC: American Educational Research Association, 2001.
[8] Bangladesh Bureau of Educational Information and Statistics (BANBEIS). Bangladesh Educational
Statistics 2006. Retrieved from official website www.banbeis.gov.bd
[9] Berliner, C. Expertise: The Wonder of Exemplary Performances. In N. Mangieri & C. Block (Eds.),
Creating Powerful Thinking in Teachers and Students (pp. 161–186). Fort Worth, TX: Holt, Rinehart
& Winston, 1994.
[10] Bransford, J., Darling-Hammond, L., & LePage, P. Introduction. In L. Darling-Hammond & J.
Bransford (Eds.), Preparing Teachers for A Changing World (pp. 1–39). San Francisco: Jossey-Bass,
2005.
[11] Education and Early Development (EED). Teacher Classroom Observation Tool (Alaska Standards).
Retrieved from http://education.alaska.gov/TeacherCertification/edeval.html, 2014.
[12] Ernest, P. The knowledge, beliefs and attitudes of the mathematics teacher: A model. Journal of
education for teaching, 1989, 15, 13-33.
[13] Farooq, M. & Shahzadi, N. Effect of Teachers’ Professional Education on Students’ Achievement
In Mathematics. Bulletin of Education & Research, University of the Punjab, Lahore, Pakistan, 2006,
28.
[14] Fennema, E., & Franke, M. L. Teachers’ Knowledge and Its Impact. In A. Grouws (Ed.), Handbook
of Research on Mathematics Teaching and Learning (pp. 147–164). New York: Macmillan, 1992
254
Proceedings International Conference on Innovation and
Management, Malaysia 2016
[15] Government of Bangladesh (GoB). Constitution of the Republic of Bangladesh. [Online] Retrieved
from http://www1.umn.edu/humanrts/research/bangladesh-constitution.pdf, 1972.
[16] Grossman, P. Responding To Our Critics: From Crisis To Opportunity In Research on Teacher
Education. Journal of Teacher Education, 2008, 59, 10–23.
[17] Grossman, P. L., & McDonald, M. Back To The Future: Directions For Research in Teaching and
Teacher Education. American Educational Research Journal, 2008, 45, 184–205.
[18] Guarino, C., Hamilton, L., Lockwood, J., & Rathbun, A. Teacher Qualifications, Instructional
Practices, and Reading and Mathematics Gains of Kindergartners (NCES 2006-031). Washington,
DC: U.S. Department of Education, National Center for Education Statistics, 2006.
[19] Harbison, R., & Hanushek, E. Educational Performance of the Poor: Lessons From Rural Northeast
Brazil. Oxford, UK: Oxford University Press, 1992.
[20] Hattie, J. Teachers Make a Difference: What is the Research Evidence? Paper presented at the
Australian Council for Educational Research Annual Conference on Building Teacher Quality,
Melbourne, 2003.
[21] Hattie, J. Visible Learning. A Synthesis of Over 800 Meta-Analyses Relating To Achievement.
Routledge Taylor & Francis Group, 2009.
[22] Heaton, R. Teaching Mathematics to the New Standards: Relearning The Dance. New York:
Teachers College Press, 2000.
[23] Hiebert, J., Morris, A., Berk, D., & Jansen, A. Preparing Teachers to Learn From Teaching. Journal
of Teacher Education, 2007, 58, 47–61.
[24] Killen, R. Effective Teaching Strategies: Lessons From Research and Practice (6th Edn). South
Melbourne, VIC: Cengage Learning Australia, 2013.
[25] Ma, L. Knowing and Teaching Elementary Mathematics: Teachers’ Understanding Of Fundamental
Mathematics In China And The United States. Hillsdale, NJ: Erlbaum, 1999.
[26] Ministry of Education (MoE). Development of Education, National Report of Bangladesh .
Retrievedfrom http://www.ibe.unesco.org/International/ICE47/English/Natreps/reports/bangladesh.
pdf, 2013.
[27] Ministry of Education. Official website of Ministry of Education, Bangladesh. www.moe.gov.bd .
2012.
[28] Mullens, J., Murnane, R., & Willett, J. The Contribution of Training and Subject Matter Knowledge
to Teaching Effectiveness: A Multilevel Analysis of Longitudinal Evidence From Belize.
Comparative Education Review, 1996, 40, 139–157.
[29] Munby, H., Russell, T., & Martin, A. Teachers’ Knowledge And How It Develops. In V. Richardson
(Ed.), Handbook of Research on Teaching (pp. 877–904). Washington, DC: American Educational
Research Association, 2001.
[30] Nath, S., Haq, N., Begum,S., Ullah, A., Sattar, A., & Chowdhury, A. Education watch 2007: The
State of Secondary Education Quality And Equity Challenges. Dhaka, Bangladesh: Campaign for
Popular Education (CAMPE), 2007.
[31] Palardy, G., & Rumberger, R. Teacher Effectiveness in First Grade: The Importance of Background
Qualifications, Attitudes, and Instructional Practices for Student Learning. Educational Evaluation
and Policy Analysis, 2008, 30, 111-140. doi:10.3102/0162373708317680
[32] Rahman, M., Hamzah, M., Meerah, T. & Rahman, M. Historical Development of Secondary
Education in Bangladesh: Colonial Period to 21st Century. International Education Studies , 2010, 3,
114-125.
[33] Reynolds, M. (Ed.). Knowledge Base for the Beginning Teacher. New York: Pergamon Press, 1989.
[34] Rowan, B., Chiang, F. S., & Miller, R. J. Using Research on Employees' Performance to Study the
Effects Of Teachers On Students' Achievement. Sociology Of Education, 1997, 256-284.

255
Proceedings International Conference on Innovation and
Management, Malaysia 2016
[35] Shulman, L. Those Who Understand: Knowledge Growth in Teaching. Educational Researcher,
1986, 15, 4–14.
[36] Shulman, L. Knowledge and Teaching: Foundations of the New Reform. Harvard Educational
Review, 1987, 57, 1–22.
[37] Simon, M. Prospective Elementary Teachers’ Knowledge of Division. Journal of Research In
Mathematics Education, 1993, 24, 233–254.
[38] Stronge, J. Qualities Of Effective Teacher. Alexandria, VA: Association for Supervision and
Curriculum Development, 2007.
[39] Swafford, J., Jones, G., & Thornton, C. Increased Knowledge in Geometry and Instructional
Practice. Journal for Research In Mathematics Education, 1997, 28, 476–483.
[40] Turner-Bisset, R. The Knowledge Bases of the Expert Teacher. British Educational Research
Journal, 2001, 25, 39-55.

256
Proceedings International Conference on Innovation and
Management, Malaysia 2016
Appendix 1
Score in the Assessment Test
Teacher’s ID Q1 Q2 Q3 Q4 Q5 Q6 Q7 Q8 Q9 Q10 Total
Experimental Group
1 10 10 10 10 10 10 5 10 10 10 95
2 10 10 10 10 10 10 10 10 10 10 100
3 10 10 10 10 10 10 10 10 10 10 100
4 10 10 8 10 10 10 10 10 10 10 98
5 10 10 8 10 10 9 10 10 10 10 97
6 10 10 9 10 10 10 10 10 10 10 99
7 10 10 8 10 10 10 10 10 10 10 98
8 10 10 10 10 10 7 10 10 9 7 93
9 10 9 10 10 10 10 10 10 10 10 99
10 10 9 9 10 10 10 10 10 10 10 98
11 10 10 8 10 10 10 10 10 10 10 98
12 10 10 8 10 10 10 10 10 10 10 98
13 10 10 8 10 10 10 8 10 10 10 96
14 10 7 7 10 10 9 10 10 10 9 92
15 10 6 10 10 10 10 10 10 10 10 96
16 10 6 7 10 6 10 10 10 10 10 89
17 10 6 6 10 10 8 9 10 10 10 89
18 10 10 10 10 8 8 10 10 10 7 93
19 10 4 8 10 10 10 10 10 8 10 90
20 10 10 10 10 8 10 10 10 10 9 97
21 10 10 10 10 10 10 10 10 10 10 100
22 10 10 10 10 10 10 10 10 10 10 100
23 10 10 10 10 10 10 10 10 10 10 100
Control Group
24 10 10 10 10 10 10 10 10 10 10 100
25 10 10 10 10 10 7 10 9 10 10 96
26 10 10 10 10 10 7 10 10 10 10 97
27 10 10 10 10 10 10 10 10 10 10 100
28 10 10 10 10 10 10 10 10 10 10 100
29 10 10 6 10 10 4 0 10 10 10 80
30 8 10 8 10 8 10 10 10 10 8 92
31 10 10 10 8 10 10 8 10 10 8 94
32 10 10 7 10 10 10 10 10 10 8 95
33 10 8 6 8 10 6 10 8 10 7 83
34 10 6 8 0 6 10 10 10 10 8 78
35 8 6 8 10 8 10 10 10 10 8 88
36 8 7 6 8 10 7 10 10 10 10 86
37 10 9 10 10 10 10 10 10 10 10 99
38 9 8 8 10 10 10 10 10 6 6 87

257
Proceedings International Conference on Innovation and
Management, Malaysia 2016