table 3 - springer static content server10.1007... · web view3,743 = 4.09, p =0.017). table s 2.5....
TRANSCRIPT
A. Salisbury et al. 2017. Enhancing gardens as habitats for invertebrates 1
Online Resource 2: Further details of Results
Enhancing gardens as habitats for plant-associated invertebrates: should we plant native or
exotic species?
Andrew Salisbury1*, Sarah Al-Beidh1, James Armitage1, Stephanie Bird1/2, Helen Bostock1, Anna
Platoni1, Mark Tatchell3, Ken Thompson4, Joe Perry5
1 Royal Horticultural Society, RHS Garden Wisley, Woking, Surrey, GU23 6QB, UK
2 Department of Life Sciences, University of Roehampton, Whitelands College, Holybourne Avenue,
London, SW15 4JD
3Laurels Farm, Oborne, Sherborne, Dorset, DT9 4LA, UK
4 Department of Animal and Plant Sciences, University of Sheffield, Western Bank, Sheffield, S10
2TN, UK
5 Oaklands Barn, Lug’s Lane, Broome, Norfolk, NR35 2HT, UK
*E-mail: [email protected]
Contents
Table S2.1: Fitted regressions for total abundance Herbivores for native (N),
near-native (Z) and exotic (E) treatments
4
Table S2.2: Fitted regressions for abundance of Herbivores (sucking) for native
(N), near-native (Z) and exotic (E) treatments.
6
Table S2.3: Fitted regressions for abundance of Herbivores (chewing) for
native (N), near-native (Z) and exotic (E) treatments.
8
Table S2.4: Fitted regressions for abundance of Herbivore (generalist) for
native (N), near-native (Z) and exotic (E) treatments.
10
Table S2.5: Fitted regressions for abundance of Herbiovore (specalist) for
native (N), near-native (Z) and exotic (E) treatments.
12
Table S2.6: Fitted regressions for abundance of Predators for native (N), near- 14

A. Salisbury et al. 2017. Enhancing gardens as habitats for invertebrates 2
native (Z) and exotic (E) treatments.
Table S2.7: Fitted regressions for abundance of Predators (excluding
Araenidae & Parasitica) for native (N), near-native (Z) and exotic
(E) treatments.
16
Table S2.8: Fitted regressions for abundance Parasitica for native (N), near-
native (Z) and exotic (E) treatments.
18
Table S2.9: Fitted regression of abundance Araneae (web-spinners) for native
(N), near-native (Z) and exotic (E) treatments.
20
Table S2.10: Fitted regressions for abundance of Araneae (hunters) for native
(N), near-native (Z) and exotic (E) treatments.
22
Table S2.11: Fitted regressions for abundance Detritivoure/fungivoures for
native (N), near-native (Z) and exotic (E) treatments.
24
Table S2.12: Fitted regressions for abundance of Omnivoures for native (N),
near-native (Z) and exotic (E) treatments.
26
Fig. S2.1: Dependence of abundance of Herbivores on plant canopy. 5
Fig. S2.2: Dependence of abundance of Herbivores (sucking) on plant
canopy.
7
Fig. S2.3: Dependence of abundance of plant inhabiting invertebrate
Herbivores (chewing) on plant canopy.
9
Fig. S2.4: Dependence of abundance of Herbivore (generalist) on plant
canopy.
11
Fig. S2.5: Dependence of Herbivore (specialist) on plant canopy. 13
Fig. S2.6: Dependence of abundance of Predators on plant canopy. 15
Fig. S2.7: Dependence of abundance of Predators (excluding Araneidae &
Parasitica) on plant canopy.
17
Fig. S2.8: Dependence of abundance of Parasitica on plant canopy. 19
Fig. S2.9: Lack of dependence of abundance of Araneae (web-spinners) on
canopy cover.
21
Fig. S2.10: Dependence of Araneae (hunters) on canopy cover. 23

A. Salisbury et al. 2017. Enhancing gardens as habitats for invertebrates 3
Fig. S2.11: Dependence of abundance of Detritivores on plant canopy. 25
Fig. S2.12: Dependence of abundance of Omnivores on plant canopy. 27

A. Salisbury et al. 2017. Enhancing gardens as habitats for invertebrates 4
Appendix S1: Further details of Results
Table S2.1 Fitted regressions for total abundance of Herbivores for native (N), near-native (Z) and
exotic (E) treatments. The estimated intercepts and slope are fitted values from the best-fitting model,
three parallel lines. F intercept is the F-statistic for the test of differences between the intercepts of the
linear relationships for the three treatments, with probability level given by P intercept. All F-statistics
for intercepts have 2,m degrees of freedom where m>100. No corresponding values of F-statistics are
given for slopes because these were always non-significant.
TreatmentEstimated
interceptSE
F
intercept
P
intercept
Estimated
slopeSE
2010
N
Z
E
0.37
0.27
0.28
0.058 1.66 0.19 0.20 0.12
2011
N
Z
E
0.29
0.28
0.16
0.084 2.38 0.095 0.52 0.12
2012
N
Z
E
0.23
0.28
0.17
0.083 1.97 0.14 0.36 0.11
2013
N
Z
E
0.31
0.22
0.16
0.12 1.89 0.15 0.63 0.14
All years combined
N
Z
E
0.25
0.22
0.16
0.039 4.86 0.008 0.51 0.54

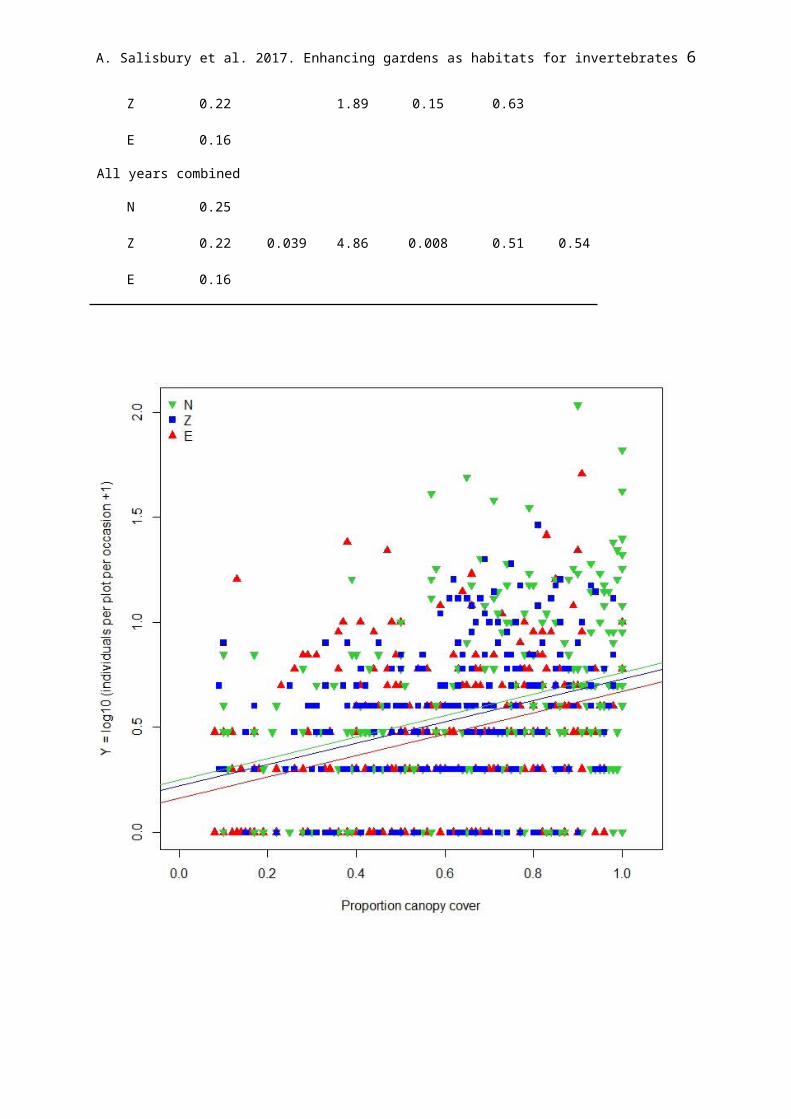
A. Salisbury et al. 2017. Enhancing gardens as habitats for invertebrates 5
Fig. S2.1. Dependence of abundance of Herbivores on plant canopy. Observed data and fitted
regressions for Herbivores (n = 3 273), over all years 2010–2013 combined. Native (N) green,
downward triangles; near-native (Z) blue, squares; exotic (E) red, upward triangles. Estimated
intercepts and slope are shown in Table S2.1. The fitted regressions (intercepts) differ (F3,743 = 4.86,
P =0.008).
A. Salisbury et al. 2017. Enhancing gardens as habitats for invertebrates 6
Table S2.2. Fitted regressions for abundance of Herbivores (sucking) for native (N), near-native (Z)
and exotic (E) treatments. The estimated intercepts and slope are fitted values from the best-fitting
model, three parallel lines. F intercept is the F-statistic for the test of differences between the
intercepts of the linear relationships for the three treatments, with probability level given by P
intercept. All F-statistics for intercepts have 2,m degrees of freedom where m>100. No corresponding
values of F-statistics are given for slopes because these were always non-significant.
TreatmentEstimated
interceptSE
F
interce
pt
P
interceptEstimated
slopeSE
2010
N
Z
E
0.29
0.16
0.23
0.059 2.28 0.11 0.19 0.12
2011
N
Z
E
0.26
0.22
0.14
0.085 1.82 0.16 0.51 0.13
2012
N
Z
E
0.27
0.29
0.19
0.084 1.90 0.15 0.23 0.11
2013
N
Z
E
0.24
0.13
0.093
0.12 1.76 0.18 0.64 0.15
All years combined
N
Z
E
0.20
0.15
0.11
0.040 3.99 0.019 0.50 0.056

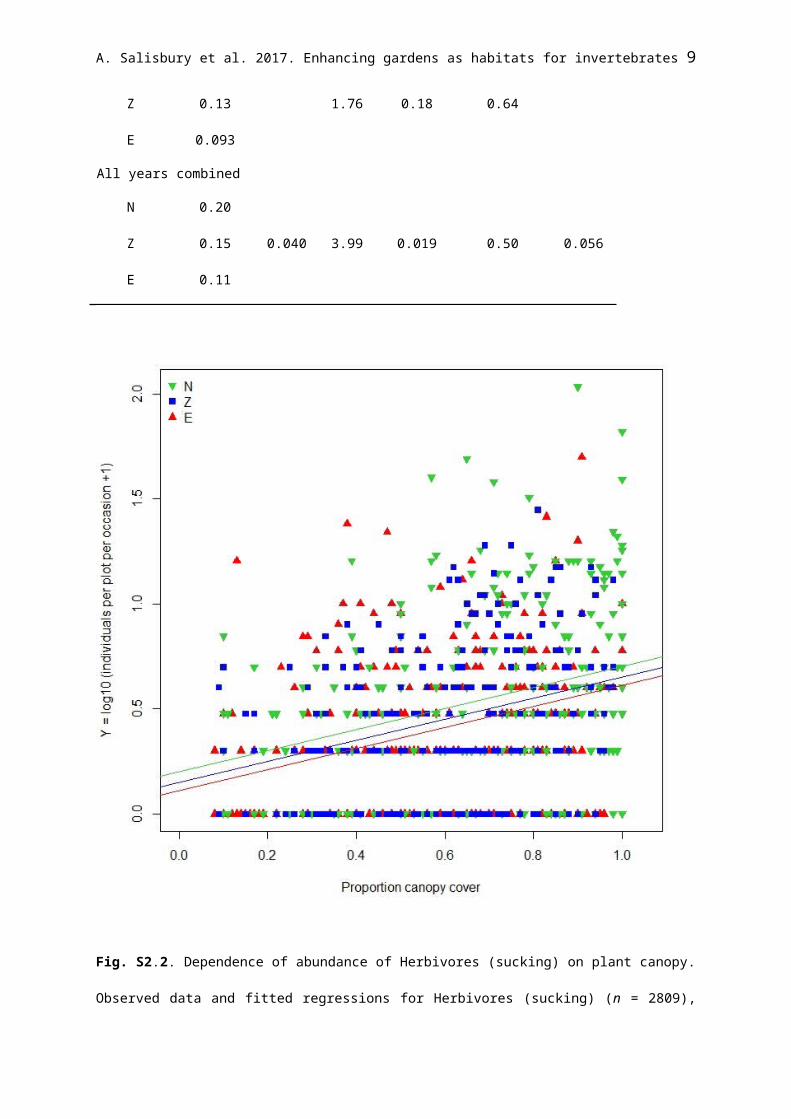
A. Salisbury et al. 2017. Enhancing gardens as habitats for invertebrates 7
Fig. S2.2. Dependence of abundance of Herbivores (sucking) on plant canopy. Observed data and
fitted regressions for Herbivores (sucking) (n = 2809), over all years 2010–2013 combined. Native (N)
green, downward triangles; near-native (Z) blue, squares; exotic (E) red, upward triangles. Estimated
intercepts and slope are shown in Table S2.2. The fitted regressions (intercepts) differ (F3,743 = 3.99,
P =0.019).

A. Salisbury et al. 2017. Enhancing gardens as habitats for invertebrates 8
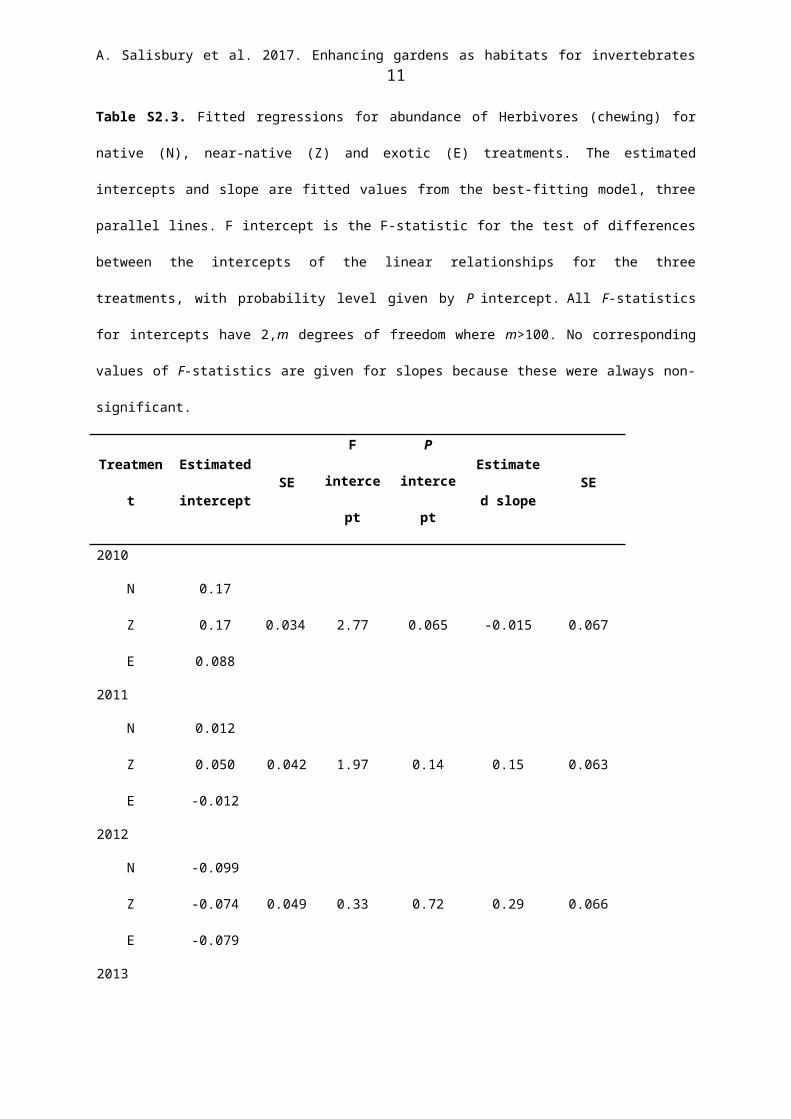
Table S2.3. Fitted regressions for abundance of Herbivores (chewing) for native (N), near-native (Z)
and exotic (E) treatments. The estimated intercepts and slope are fitted values from the best-fitting
model, three parallel lines. F intercept is the F-statistic for the test of differences between the
intercepts of the linear relationships for the three treatments, with probability level given by P
intercept. All F-statistics for intercepts have 2,m degrees of freedom where m>100. No corresponding
values of F-statistics are given for slopes because these were always non-significant.
TreatmentEstimated
interceptSE
F
intercept
P
intercept
Estimated
slopeSE
2010
N
Z
E
0.17
0.17
0.088
0.034 2.77 0.065 -0.015 0.067
2011
N
Z
E
0.012
0.050
-0.012
0.042 1.97 0.14 0.15 0.063
2012
N
Z
E
-0.099
-0.074
-0.079
0.049 0.33 0.72 0.29 0.066
2013
N
Z
E
0.094
0.086
0.0044
0.072 2.13 0.12 0.16 0.086
All years combined
N
Z
E
0.054
0.065
0.019
0.22 3.80 0.023 0.14 0.030
A. Salisbury et al. 2017. Enhancing gardens as habitats for invertebrates 9
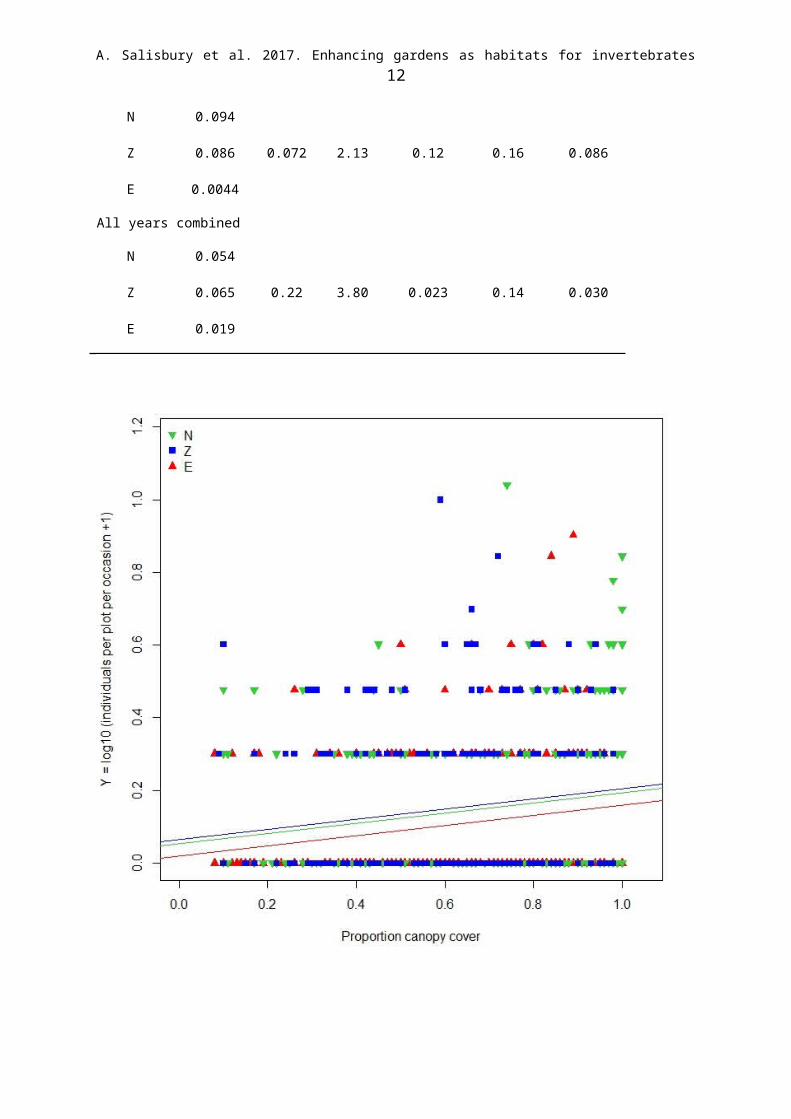
Fig. S2.3. Dependence of abundance of plant inhabiting invertebrate Herbivores (chewing) on plant
canopy. Observed data and fitted regressions for plant inhabiting invertebrate Herbivores (chewing) (n
= 463), over all years 2010–2013 combined. Native (N) green, downward triangles; near-native (Z)
blue, squares; exotic (E) red, upward triangles. Estimated intercepts and slope are shown in Table
S2.3. The fitted regressions (intercepts) differ (F3,743 = 3.80, P =0.023).
A. Salisbury et al. 2017. Enhancing gardens as habitats for invertebrates 10
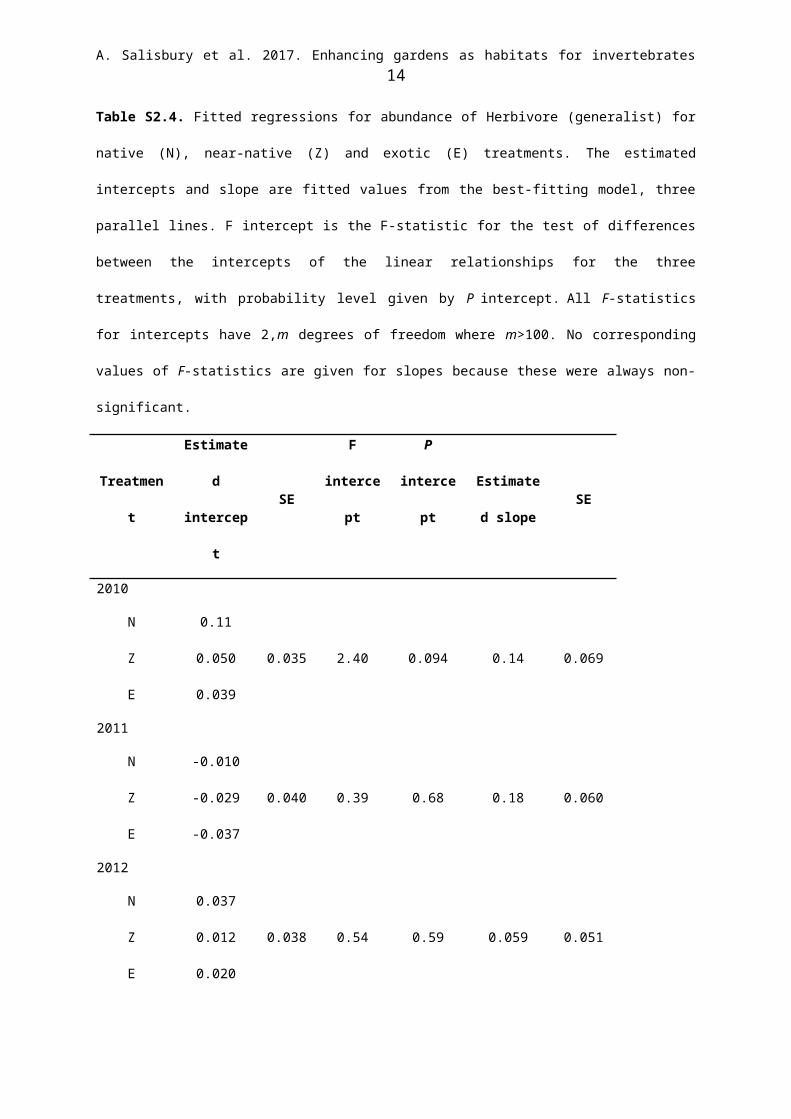
Table S2.4. Fitted regressions for abundance of Herbivore (generalist) for native (N), near-native (Z)
and exotic (E) treatments. The estimated intercepts and slope are fitted values from the best-fitting
model, three parallel lines. F intercept is the F-statistic for the test of differences between the
intercepts of the linear relationships for the three treatments, with probability level given by P
intercept. All F-statistics for intercepts have 2,m degrees of freedom where m>100. No corresponding
values of F-statistics are given for slopes because these were always non-significant.
TreatmentEstimated
interceptSE
F
intercept
P
intercept
Estimated
slopeSE
2010
N
Z
E
0.11
0.050
0.039
0.035 2.40 0.094 0.14 0.069
2011
N
Z
E
-0.010
-0.029
-0.037
0.040 0.39 0.68 0.18 0.060
2012
N
Z
E
0.037
0.012
0.020
0.038 0.54 0.59
0.059 0.051
2013
N
Z
E
-0.079
-0.062
-0.17
0.080 2.42 0.093 0.39 0.096
All years combined
N
Z
E
0.046
0.18
-0.005
0.022 4.09 0.017 0.14 0.030
A. Salisbury et al. 2017. Enhancing gardens as habitats for invertebrates 11
Fig. S2.4. Dependence of abundance of Herbivore (generalist) on plant canopy. Observed data and
fitted regressions for plant inhabiting invertebrate Herbivore (generalist) (n = 387), over all years
2010–2013 combined. Native (N) green, downward triangles; near-native (Z) blue, squares; exotic (E)
red, upward triangles. Estimated intercepts and slope are shown in Table. S2.4. The fitted regressions
(intercepts) differ (F3,743 = 4.09, P =0.017).
A. Salisbury et al. 2017. Enhancing gardens as habitats for invertebrates 12
Table S2.5. Fitted regressions for abundance of Herbiovore (specalist) for native (N), near-native (Z)
and exotic (E) treatments. Differences between intercepts were tested by partial F-tests (F int. with
probablility P int.); similarly for slopes (F slopes with probablility P slopes). All F-statistics have 2,m
degrees of freedom where m>100. For almost all tests, values of both F statistics are non-significant,
indicating that the best-fitting model is a single line with no significant differences between the
treatments.
TreatmentF
int.
P
int.
F slopes P slopes Estimated
interceptSE
Estimate
d slopeSE
2010
N
Z
E0.58 0.56 1.72 0.18 0.093 0.029 0.006 0.061
2011
N
Z
E
0.26 0.77 1.35 0.26 -0.052 0.035 0.20 0.051
2012
N
Z
E
1.47 0.23 0.66 0.52 -0.092 0.41 0.26 0.057
2013
N
Z
E
1.10 0.34 0.28 0.76 -0.0066 0.062 0.22 0.079
All years combined
N
Z
E
1.90 0.15 1.77 0.17 0.002 0.018 0.16 0.027

A. Salisbury et al. 2017. Enhancing gardens as habitats for invertebrates 13
Fig. S2.5. Dependence of Herbivore (specialist) on plant canopy. Observed data and fitted
regressions for plant inhabiting invertebrate Herbivore (specialist) abundance (n = 338), over all years
2010–2013 combined. Native (N) green, downward triangles; near-native (Z) blue, squares; exotic (E)
red, upward triangles. Estimated intercept and slope are shown in Table S2.5. The fitted regression is
significant (F1,746 = 33.04, P < 0.001) and is the same for all three treatments.
A. Salisbury et al. 2017. Enhancing gardens as habitats for invertebrates 14
Table S2.6. Fitted regressions for abundance of Predators for native (N), near-native (Z) and exotic
(E) treatments. The estimated intercepts and slope are fitted values from the best-fitting model, three
parallel lines. F intercept is the F-statistic for the test of differences between the intercepts of the
linear relationships for the three treatments, with probability level given by P intercept. All F-statistics
for intercepts have 2,m degrees of freedom where m>100. No corresponding values of F-statistics are
given for slopes because these were always non-significant.
TreatmentEstimated
interceptSE
F intercept P
intercept
Estimated
slopeSE
2010
N
Z
E
0.47
0.35
0.33
0.047 5.19 0.007 0.37 0.093
2011
N
Z
E
0.30
0.28
0.29
0.85 0.07 0.93 0.65 0.085
2012
N
Z
E
0.61
0.48
0.50
0.068 4.79 0.009 0.012 0.091
2013
N
Z
E
0.79
0.70
0.59
0.071 9.17 <0.001 -0.038 0.86
All years combined
N
Z
E
0.51
0.43
0.39
0.029 11.66 <0.001 0.27 0.041

A. Salisbury et al. 2017. Enhancing gardens as habitats for invertebrates 15
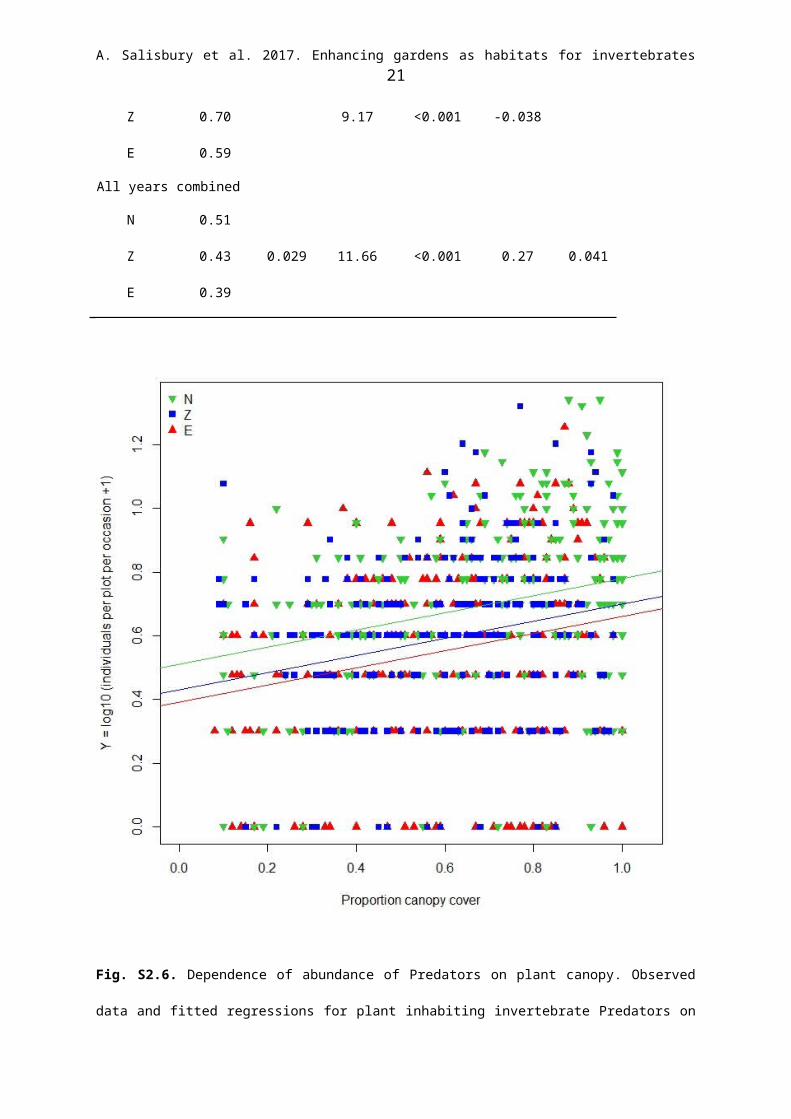
Fig. S2.6. Dependence of abundance of Predators on plant canopy. Observed data and fitted
regressions for plant inhabiting invertebrate Predators on plant canopy (n = 3143 ), over all years
2010–2013 combined. Native (N) green, downward triangles; near-native (Z) blue, squares; exotic (E)
red, upward triangles. Estimated intercepts and slope are shown in Table S2.6. The fitted regressions
(intercepts) differ (F3,743 = 11.66, P <0.001).

A. Salisbury et al. 2017. Enhancing gardens as habitats for invertebrates 16
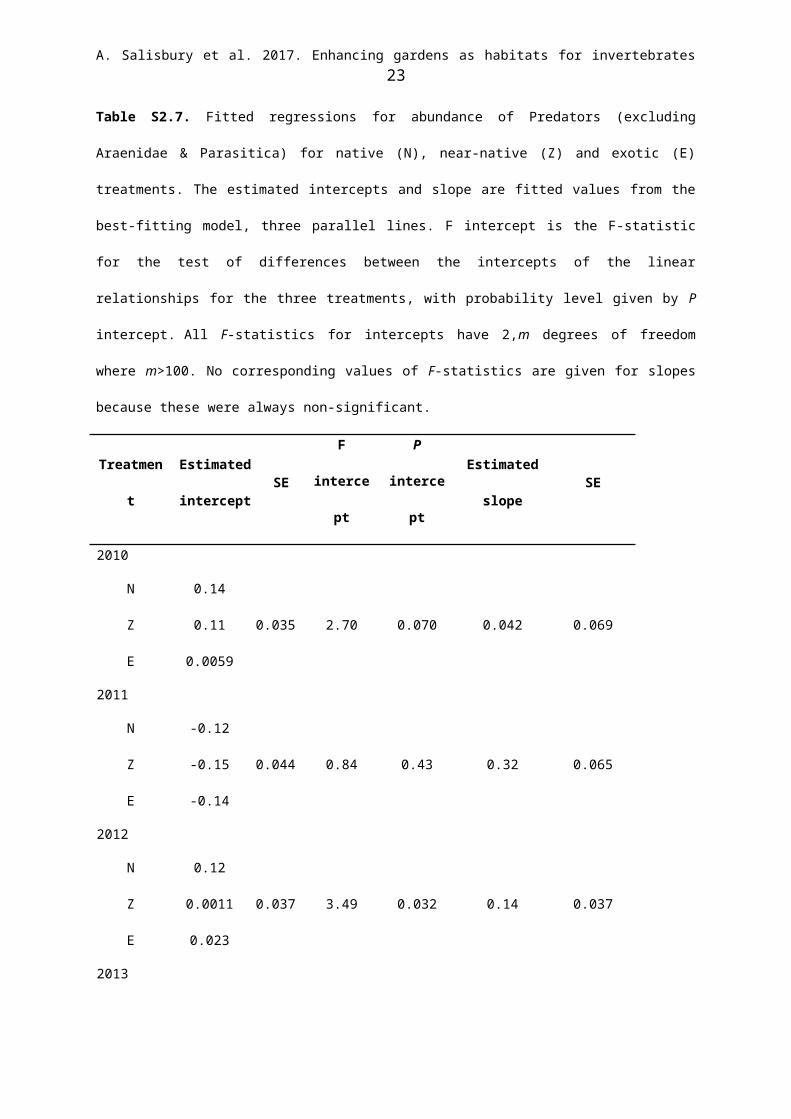
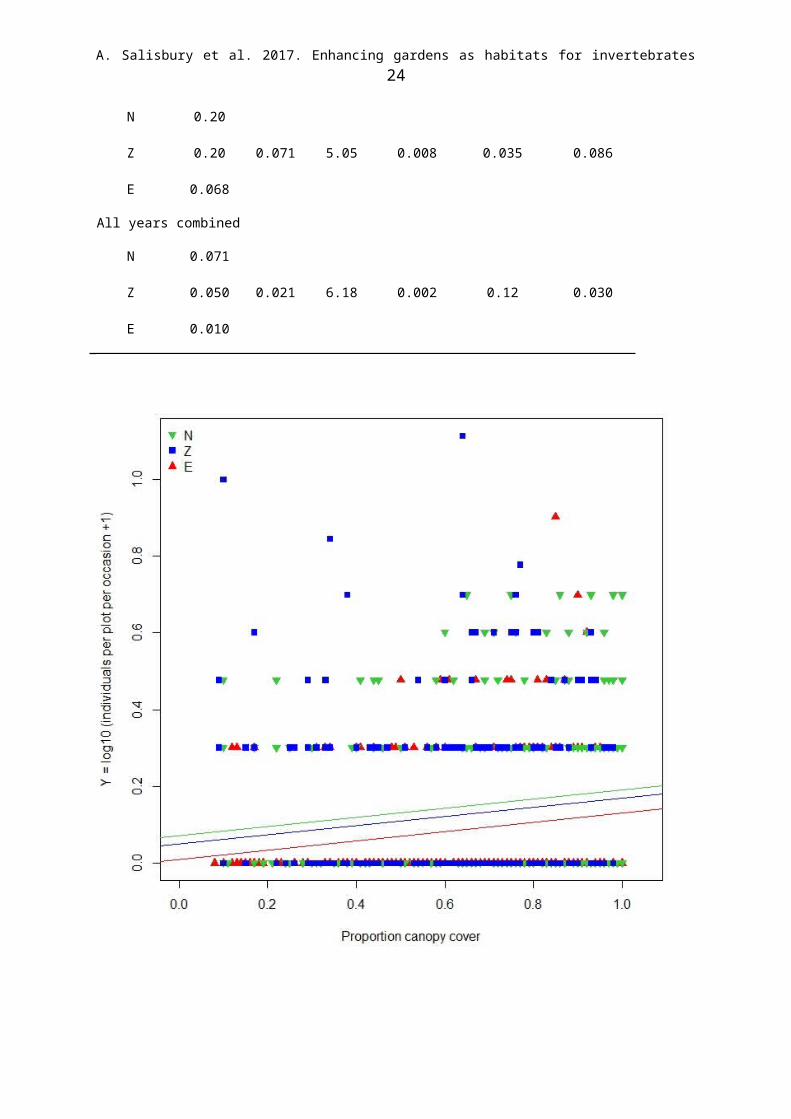
Table S2.7. Fitted regressions for abundance of Predators (excluding Araenidae & Parasitica) for
native (N), near-native (Z) and exotic (E) treatments. The estimated intercepts and slope are fitted
values from the best-fitting model, three parallel lines. F intercept is the F-statistic for the test of
differences between the intercepts of the linear relationships for the three treatments, with probability
level given by P intercept. All F-statistics for intercepts have 2,m degrees of freedom where m>100.
No corresponding values of F-statistics are given for slopes because these were always non-
significant.
TreatmentEstimated
interceptSE
F
intercept
P
intercept
Estimated
slopeSE
2010
N
Z
E
0.14
0.11
0.0059
0.035 2.70 0.070
0.042 0.069
2011
N
Z
E
-0.12
-0.15
-0.14
0.044 0.84 0.43 0.32 0.065
2012
N
Z
E
0.12
0.0011
0.023
0.037 3.49 0.032 0.14 0.037
2013
N
Z
E
0.20
0.20
0.068
0.071 5.05 0.008 0.035 0.086
All years combined
N
Z
E
0.071
0.050
0.010
0.021 6.18 0.002 0.12 0.030

A. Salisbury et al. 2017. Enhancing gardens as habitats for invertebrates 17
Fig. S2.7. Dependence of abundance of Predators (excluding Araneidae & Parasitica) on plant
canopy. Observed data and fitted regressions for plant inhabiting invertebrate predators (excluding
Araneidae & Parasitica) (n = 395), over all years 2010–2013 combined. Native (N) green, downward
triangles; near-native (Z) blue, squares; exotic (E) red, upward triangles. Estimated intercepts and
slope are shown in Table S2.7. The fitted regressions (intercepts) differ (F3,743 = 6.18, P = 0.002).

A. Salisbury et al. 2017. Enhancing gardens as habitats for invertebrates 18
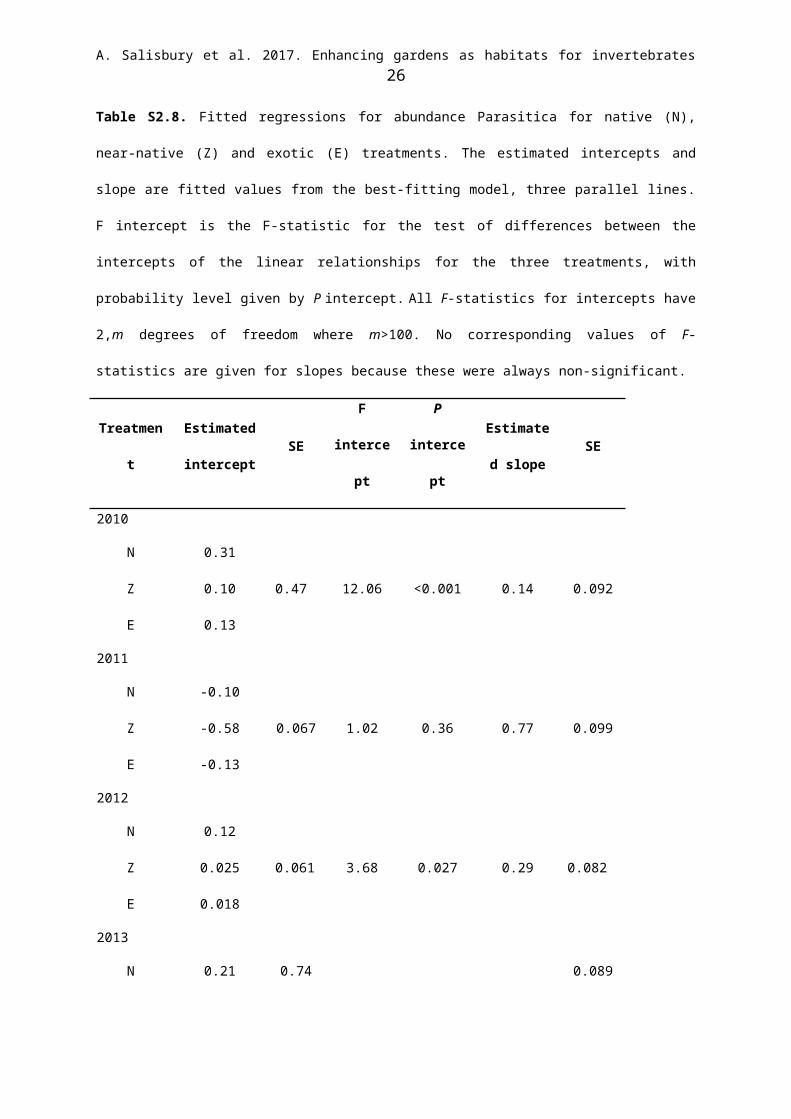
Table S2.8. Fitted regressions for abundance Parasitica for native (N), near-native (Z) and exotic (E)
treatments. The estimated intercepts and slope are fitted values from the best-fitting model, three
parallel lines. F intercept is the F-statistic for the test of differences between the intercepts of the
linear relationships for the three treatments, with probability level given by P intercept. All F-statistics
for intercepts have 2,m degrees of freedom where m>100. No corresponding values of F-statistics are
given for slopes because these were always non-significant.
TreatmentEstimated
interceptSE
F
intercept
P
intercept
Estimated
slopeSE
2010
N
Z
E
0.31
0.10
0.13
0.47 12.06 <0.001
0.14 0.092
2011
N
Z
E
-0.10
-0.58
-0.13
0.067 1.02 0.36 0.77 0.099
2012
N
Z
E
0.12
0.025
0.018
0.061 3.68 0.027 0.29 0.082
2013
N
Z
E
0.21
0.10
0.06
0.74 4.83 0.009 0.23 0.089
All years combined
N
Z
E
0.17
0.052
0.040
0.029 16.47 <0.001 0.33 0.041

A. Salisbury et al. 2017. Enhancing gardens as habitats for invertebrates 19
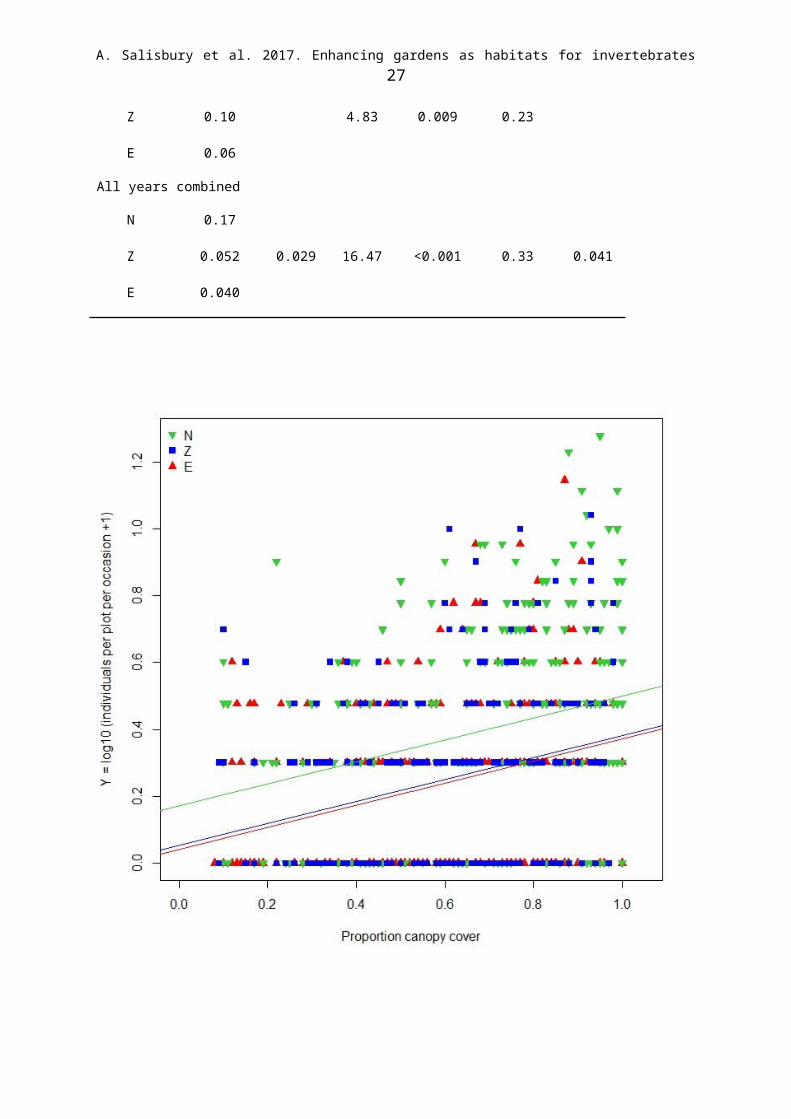
Fig. S2.8. Dependence of abundance of Parasitica on plant canopy. Observed data and fitted
regressions for plant inhabiting Parasitica (n = 1137), over all years 2010–2013 combined. Native (N)
green, downward triangles; near-native (Z) blue, squares; exotic (E) red, upward triangles. Estimated
intercepts and slope are shown in Table S2.8. The fitted regressions (intercepts) differ (F3,743 = 16.47,
P < 0.001).
A. Salisbury et al. 2017. Enhancing gardens as habitats for invertebrates 20
Table S2.9. Fitted regression of abundance Araneae (web-spinners) for native (N), near-native (Z)
and exotic (E) treatments. Differences between intercepts were tested by partial F-tests (F int. with
probablility P int.); similarly for slopes (F slopes with probablility P slopes). All F-statistics have 2,m
degrees of freedom where m>100. Values of both F statistics are non-significant, indicating that the
best-fitting model is a single line with no significant differences between the treatments. The
regression is not significant (F1,745 = 0.94, P = 0.332). Similar results obtained for individual years, not
shown.
Treatmen
t
F
int.
P
int.
F
slopes
P
slopes
Estimated
interceptSE
Estimated
slopeSE
All years combined
N
Z
E
0.27 0.76 0.14 0.87 0.27 0.025 0.037 0.038
A. Salisbury et al. 2017. Enhancing gardens as habitats for invertebrates 21
Fig.S2.9. Lack of dependence of abundance of Araneae (web-spinners) on canopy cover. Observed
data and fitted regressions for plant inhabiting Araneae (web spinners) abundance (n = 1076), over all
years 2010–2013 combined. Native (N) green, downward triangles; near-native (Z) blue, squares;
exotic (E) red, upward triangles. The regression is not significant (F1, 746 = 0.94, P = 0.332). Estimates
of intercept and slope are given in Table S2.9.

A. Salisbury et al. 2017. Enhancing gardens as habitats for invertebrates 22
Table S2.10. Fitted regressions for abundance of Araneae (hunters) for native (N), near-native (Z)
and exotic (E) treatments. Differences between intercepts were tested by partial F-tests (F int. with
probablility P int.); similarly for slopes (F slopes with probablility P slopes). All F-statistics have 2,m
degrees of freedom where m>100. For almost all tests, values of both F statistics are non-significant,
indicating that the best-fitting model is a single line with no significant differences between the
treatments.
TreatmentF
int.
P
int.
F slopes P slopes Estimated
interceptSE
Estimate
d slopeSE
2010
N
Z
E0.19 0.83 0.03 0.97 0.047 0.30 0.31 0.077
2011
N
Z
E
1.30 0.27 1.17 0.31 0.044 0.051 0.24 0.073
2012
N
Z
E
1.35 0.26 1.42 2.63 0.074 0.10 -0.006 0.059
2013
N
Z
E
0.25 0.78 0.30 0.74 0.21 0.06 -0.026 0.077
All years combined
N
Z
E
0.04 0.96 0.35 0.71 0.11 0.022 0.087 0.032
A. Salisbury et al. 2017. Enhancing gardens as habitats for invertebrates 23
Fig. S2.10. Dependence of Araneae (hunters) on canopy cover. Observed data and fitted regressions
for plant inhabiting Araneae (hunters) abundance (n = 1 611), over all years 2010–2013 combined.
Native (N) green, downward triangles; near-native (Z) blue, squares; exotic (E) red, upward triangles.
Estimated intercepts and slope are shown in Table S2.10. The fitted regression is significant (F1,
746 = 7.31, P = 0.007) and is the same for all three treatments.
A. Salisbury et al. 2017. Enhancing gardens as habitats for invertebrates 24
Table S2.11. Fitted regressions for abundance Detritivoure/fungivoures for native (N), near-native (Z)
and exotic (E) treatments. The estimated intercepts and slope are fitted values from the best-fitting
model, three parallel lines. F intercept is the F-statistic for the test of differences between the
intercepts of the linear relationships for the three treatments, with probability level given by P
intercept. All F-statistics for intercepts have 2,m degrees of freedom where m>100. No corresponding
values of F-statistics are given for slopes because these were always non-significant.
TreatmentEstimated
interceptSE
F
intercept
P
intercept
Estimated
slopeSE
2010
N
Z
E
0.72
0.52
0.56
0.082 3.45 0.034 -0.042 0.16
2011
N
Z
E
0.72
0.47
0.62
0.090 7.51 <0.001 0.45 0.13
2012
N
Z
E
1.77
1.55
1.75
0.13 4.64 0.011
-1.05 0.17
2013
N
Z
E
1.45
1.16
1.36
1.44 4.73 0.010 -0.20 0.17
All years combined
N
Z
E
0.82
0.63
0.76
0.047 9.78 <0.001 0.26 0.077
A. Salisbury et al. 2017. Enhancing gardens as habitats for invertebrates 25
Fig. S2.11. Dependence of abundance of Detritivores on plant canopy. Observed data and fitted
regressions for plant inhabiting Detritivore/fungivore invertebrates (n = 10 982), over all years 2010–
2013 combined. Native (N) green, downward triangles; near-native (Z) blue, squares; exotic (E) red,
upward triangles. Estimated intercepts and slope are shown in Table S2.10. The fitted regressions
(intercepts) differ (F 3,743 = 9.78, P < 0.001).
A. Salisbury et al. 2017. Enhancing gardens as habitats for invertebrates 26
Table S2.12. Fitted regressions for abundance of Omnivoures for native (N), near-native (Z) and
exotic (E) treatments. The estimated intercepts and slope are fitted values from the best-fitting model,
three parallel lines. F intercept is the F-statistic for the test of differences between the intercepts of the
linear relationships for the three treatments, with probability level given by P intercept. All F-statistics
for intercepts have 2,m degrees of freedom where m>100. No corresponding values of F-statistics are
given for slopes because these were always non-significant.
TreatmentEstimated
interceptSE
F
intercept
P
intercept
Estimated
slopeSE
2010
N
Z
E
-0.032
-0.024
-0.016
0.044 0.06 0.94 0.47 0.092
2011
N
Z
E
-0.25
-0.065
-0.17
0.058 9.43 <0.001 0.56 0.085
2012
N
Z
E
-0.020
-0.0098
-0.087
0.051 3.31 0.038 0.24 0.068
2013
N
Z
E
0.045
0.069
0.079
0.058 0.41 0.67 0.080 0.069
All years combined
N
Z
E
-0.0038
0.054
-0.006
0.026 5.39 0.005 0.23 0.036
A. Salisbury et al. 2017. Enhancing gardens as habitats for invertebrates 27
Fig. S2.12. Dependence of abundance of Omnivores on plant canopy. Observed data and fitted
regressions for everything (n = 572), over all years 2010–2013 combined. Native (N) green,
downward triangles; near-native (Z) blue, squares; exotic (E) red, upward triangles. Estimated
intercepts and slope are shown in Table S2.12. The fitted regressions (intercepts) differ (F 3,743 = 5.39,
P = 0.005).