t309 - proficiency testing scheme for chemical analyses of water in africa.pdf
TRANSCRIPT

Namibia Water Corporation(NamWater)

Proficiency testing scheme for chemical analysis of Water in Africa
Merylinda Conradie Pr. Sci.NatNamibia Water Corporation (NamWater)Water Quality and Environmental ServicesWindhoek, Namibia
Dr.-Ing. Dipl.-Chem. Michael KochWater Quality and Solid Waste ManagementDepartment Hydrochemistry University of Stuttgart, Germany University of Stuttgart, Germany
Stefan Wallerath / Kathrin WunderlichProject Coordinator Physikalisch-Technische Bundesanstalt (PTB)Braunschweig, Germany
Donald MasukuSADCMET Regional CoordinatorNMISAPretoria, South Africa

Reasons for establishment of the SADCMET PT Scheme
• Access to proper potable water is a human right
• In many countries in Africa this access is not assurednot assured
• To check the potability of existing water supplies and newly developed sources -water analysis is indispensable
• It is necessary to strengthen the competence of the local water laboratories

Project Overview
February 2004 First workshop in Windhoek, Namibia, with participants from 16 countries with training on basic issues of quality
2004 1st PT round; Evaluation workshop (Pretoria)
2005 2nd PT round; Evaluation workshop with training on measurement uncertainty (Dar es Salaam)
2006 3rd PT Round; Evaluation workshop with training on 2006 3rd PT Round; Evaluation workshop with training on method validation and control charts (Gaborone)
2007 4th PT round; Evaluation workshop (Dar es Salaam) with training on method validation and measurement uncertaintyOctober: Poster presentation at the Eurachem Workshop for “Proficiency testing in analytical chemistry, microbiology and laboratory medicine” in Rome
2008 5th PT round; Evaluation workshop (Kampala) with training on management requirements
2009 6th round; Evaluation workshop (Seychelles)Programme need to be finalised

Participation per country
Country 2004 2005 2006 2007 2008 2009Angola 1 1 1 0 1 0Botswana 2 2 2 4 2 3Ethiopia 1 1 1 0 0 0Kenya 2 2 4 3 3 7Lesotho 1 1 0 0 1 1Madagascar 0 0 2 2 3 3Madagascar 0 0 2 2 3 3Malawi 2 2 2 3 1 1Mauritius 1 3 4 3 5 6Mozambique 2 3 2 0 0 0Namibia 2 2 3 3 3 3Republic of Seychelles 1 2 2 1 1 1Swaziland 1 1 0 1 2 3South Africa 0 0 0 1 1 1Tanzania 2 8 5 12 11 12Uganda 1 3 6 5 5 5Zambia 1 4 2 3 1 3Zimbabwe 2 3 3 5 5 5

Growth of PT SADCMET Scheme
30
40
50
60
22
44 3946 45
54
Growth of the PT : 2004 - 2009
2004
2005
0
10
20
20042005
20062007
20082009
22 2005
2006
2007
2008
2009

% Representation / Country
Angola 0%
Botswana6%
Ethiopia0%
Kenya13%
Lesotho2%
Uganda9%
Zambia6%
Zimbabwe9%
Representation / Country
Madagascar6%
Malawi2%
Mauritius11%
Mosambique0%Namibia
6%Seychelles
2%
South Africa2%
Swaziland6%
Tanzania22%

Local Coordinators and Participants
Angola (1) Botswana (3)
Kenya (7)
Lesotho (1)Uganda (5)
Zambia (3)
Zimbabwe (5)
NamibiaPT Provider
Ethiopia (0)
Madagascar (3)
Malawi (1)
Mauritius (6)Seychelles (1)
South Africa (1)
Swaziland (3)
Tanzania (12)

Scope(most important chemical ground water parameters)
Parameter Concentration in mg/l Parameter Concentratio n in mg/l
PT round 1 Additionally in PT round 2
Calcium 25 – 80 Lead 0.1 – 2.6
Magnesium 13 – 50 Copper 1 – 4
Sodium 11 – 55 Zinc 1.4 – 5.8
3 different level for each parameter
Potassium 3.5 – 12 Chromium 0.25 – 2
Iron 0.1 – 4.6 Nickel 0.3 – 3.5
Manganese 0.1 – 2.5 Phosphate 4.5 – 28
Aluminium 0.1 – 4 Additionally in PT round 3
Sulphate 18 – 60 Arsenic 0.15 – 0.9
Chloride 30 – 75 Cadmium 0.15 – 1.8
Fluoride 0.15 – 2.5 Additionally in PT round 5
Nitrate Feb-40 Cobalt

Preparation of samples
• Calculation of target values, masses and volumes
• Accurate weighing of salts & wires• Preparation of stock solutions • Preparation of stock solutions • Weighing of stock solutions • Preparation of bulk samples • Dispensing of samples • Labeling of bottles & packing & distribution

Evaluation and Assessment
• Participants agreed on assigned value�Number of participants were low�Partially high standard deviations in the data
setssets�Consensus mean was not reliable enough�Calculate the reference values from synthetic,
gravimetrical samples and the theoretical values from the weighings is used as assigned value
�Measurement uncertainty budget included

Evaluation and Assessment
• The assessment of performance is based on z-scores
• Calculation of standard deviation - Algorithm A from ISO 13528 provided it is lower than the from ISO 13528 provided it is lower than the fitness-for-purpose value agreed on between participants. ! Limitation of the standard deviation as a “fitness for purpose” requirement
• Where the calculated value is higher, the fitness-for-purpose value is used.

Evaluation and Assessment
• Values < ref.-value/8 and > ref.-value*8 have been excluded before applying statistical procedures
• A method specific evaluation is made and help• A method specific evaluation is made and helpis provided for laboratories that need corrective actions.

Limits for standard deviation
Parameter Std limit Parameter Std limit
Sulphate 10 % Manganese 20 % / 12 %
Chloride 10 % Aluminium 30 %
Fluoride 12 % Lead 40 % / 25 %
Nitrate 15 % Copper 20 %
Phosphate 10 % Zinc 20 %
Calcium 10 % Chromium 25 %
Magnesium 10 % Nickel 25 %
Sodium 10 % Cadmium 30 %
Potassium 10 % Arsenic 30 %
Iron 20 % / 12 % Cobalt 20 %

Measurement uncertainty of reference values
• Uncertainty components of all the weigings - for each balance and weighing range separately
• Purity of the reagents /component -• Purity of the reagents /component -certificate from the manufacturer
• Density test for each sample • Buoyancy correction• Determine combined uncertainty for each
parameter – 3 levels

Measurement uncertainty

Documentation
• Certificates are documented:�Certificate of analyses (COA)for reagents used�Calibration certificate for thermometer �Calibration certificate for pycnometer �Calibration certificate for pycnometer �Calibration certificates for balances
• Weighings are printed and readings were pasted to the calculated mass for proof

Reporting of results
• Graphical display of lab. results vs. assigned value to assist in corrective actions
• Method specific information • Method specific information • Annual evaluation workshop• Detail presentation on problems,
improvements and corrective actions

Sulphate : Alg.A mean and ref.-value from weighings
Quite good agreement
50
60
70
80
90
19
Exp. uncertainty of the Alg.A mean is calculated ac cording to ISO 13528:
Exp. uncertainty of the ref.-value from an uncertai nty budget
0
10
20
30
40
50
1 2 3
ref.-value
mean

Sulphatemean vs. ref.-value
y = 0,9962x
40
50
60
70
80
Alg
. A
mea
n in
mg/
l
Average recovery: 99.6%; in 2007: 103.6%; in 2006: 106.5%
0
10
20
30
40
0 10 20 30 40 50 60 70 80
reference value in mg/l
Alg
. A
mea
n in
mg/
l

Sulphate: calculated standard deviation and limit
Sulphate
20%
25%
30%
rel.
stan
dard
dev
iatio
n 1st PT
2nd PT
0%
5%
10%
15%
15 25 35 45 55 65 75
concentration in mg/l
rel.
stan
dard
dev
iatio
n
2nd PT
3rd PT
4thPT
Limit
5thPT
No improvement over time

Sulphate : Percentage non-satisfactory results
Sulphate
35%
40%
45%
Per
cent
age
non-
satis
fact
ory
resu
lts
0%
5%
10%
15%
20%
25%
30%
2005 2006 2007 2008
Per
cent
age
non-
satis
fact
ory
resu
lts

Individual performance development
• For all labs participating in 2008 and in 2007 (or 2006)
• Calculation of the mean of the absolute values of z-scores of the 3 values
• Graphical display• Graphical display– all values– How man labs are
• Consistently lower than 2.0 (good)• Consistently higher than 2.0 (bad)• Improving from > 2.0 to < 2.0• Getting worse from < 2.0 to > 2.0

SulphateIndividual performance
development
Sulphate
6
7
8
mea
n of
abs
olut
e va
lues
of z
-sco
res
6
0
1
2
3
4
5
6
2006 2007 2008
mea
n of
abs
olut
e va
lues
of z
-sco
res
2.0
11

Sulphate 1
values: 35removed: 1mean: 19,66ref.-value: 18,72recovery: 105,0%std: 5,01660
80
100
120
140
160
conc
entr
atio
n in
mg/
l
std: 5,016rstd: 26,8%std limit: 10%upper limit: 22,47lower limit: 14,98too high: 9too low: 5outside limits: 14
0
20
40
60
39 44 32 4 20 33 28 37 43 41 12 14 15 34 27 18 38 42 11 115
A 6 24 5 45 7 17 16 40 25 26 31 36 2
labcode
conc
entr
atio
n in
mg/
l
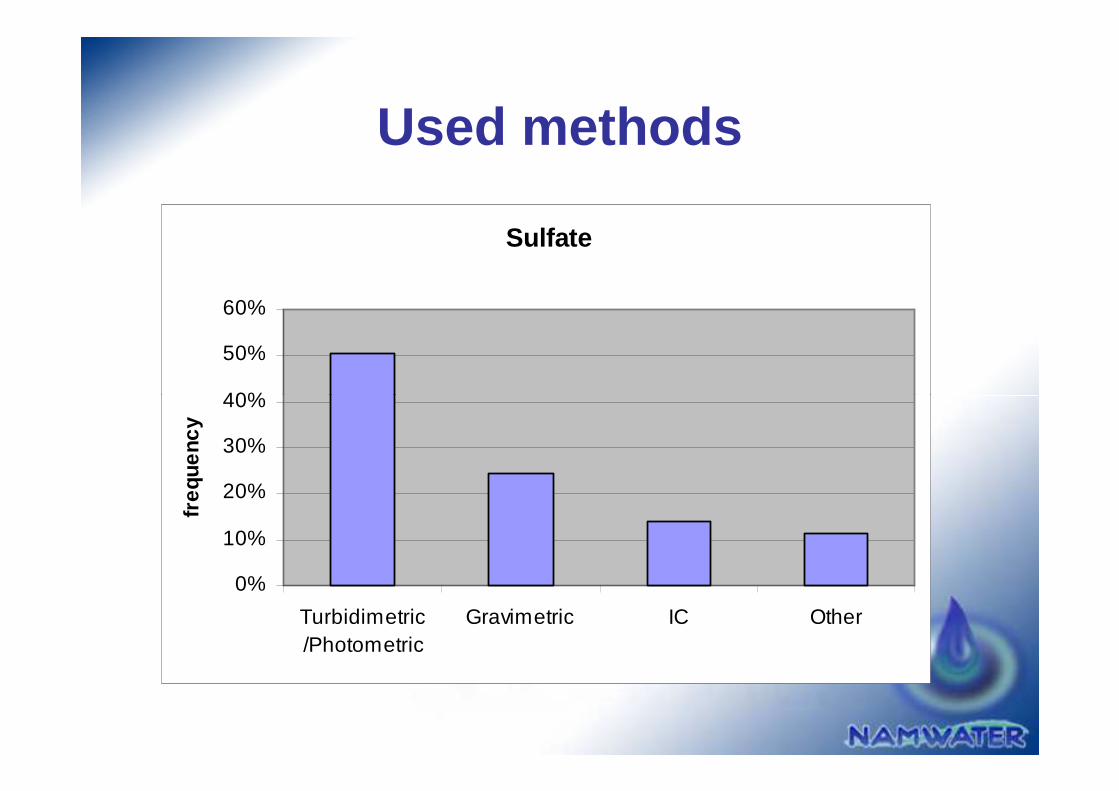
Used methods
Sulfate
40%
50%
60%
0%
10%
20%
30%
40%
Turbidimetric/Photometric
Gravimetric IC Other
freq
uenc
y

Experience
• Standard deviations are often higher than limits• High portion of outliers - gravimetrical methods • Unreliable data & methods • Calibration problems – Na, Ca, Mg, K • Calibration problems – Na, Ca, Mg, K • Reporting of results in wrong units (N and not
NO3 and as P and not PO4 • Average quality is not good – little improvement • Harmonization of methods is needed • Some parameters - small number of values • Corrective actions not implemented

80
100
120
140
Num
ber
of v
alue
s
Number of values per parameter
0
20
40
60
Chloride
Nitrat
e
Iron
Sulfate
Calcium
Potas
sium
Copper
Mag
nesium
Phosp
hate
Man
ganes
eSod
ium Lead
ZincCadm
iumChro
mium
Nickel
Fluorid
eCoba
ltAlum
inium
Arsen
ic
Num
ber
of v
alue
s

Overview on participants’ success
60%
70%
80%
90%
100%
perc
enta
ge s
ucce
sful
l par
amet
ers
606060575147422112424239
30564060
number of determined values
0%
10%
20%
30%
40%
50%
60%
8 40 35 43 9 6 32 24 17 45 25 7 28 37 10 30 5 12 23 38 44 42 41 1 4 2 26 31 13 14 3 39 36 33 21 29 20 22 19 15 16 11 18 27 34
lab code
perc
enta
ge s
ucce
sful
l par
amet
ers

Values not fit for purpose
50%
60%
70%
80%Percentage of values not fit for purpose
0%
10%
20%
30%
40%
1 2 3 1 2 3 1 2 3 1 2 3 1 2 3 1 2 3 1 2 3 1 2 3 1 2 3 1 2 3 1 2 3 1 2 3 1 2 3 1 2 3 1 2 3 1 2 3 1 2 3 1 2 3 1 2 3 1 2 3
SO4 Cl F NO3 PO4 Ca Mg Na K Fe Mn Al Pb Cu Zn Cr Ni As Ad Co

Challenges for SADC labs
• Laboratories within in the SADC region have problems with : �Access to standards�Access to calibration service providers� Access to education and� Access to education and�Technical training providers�Access to suitable reference materials, �Lack of access to equipment�Maintenance providers

Conclusion
• The SADCMET Water PT is a good possibility for the participants to compare with peers and with stated fitness-for-purpose criteria
• SADCMET lab association is a good platform for • SADCMET lab association is a good platform for networking and mutual help to improve the quality
• The results of many laboratories are still not satisfactory or are getting worse
• Emphasis should be put on corrective actions after unsatisfactory participation

Acknowledgments
• PTB assistance � Stefan Wallerath� Kathrin Wunderlich� Annedore Heinichen � Rebecca Alt
• SADCMET • SADCMET � Donald Maseku� Margaret Ngobeni
• University of Stuttgart� Dr Michael Koch
• NamWater• Local coordinators • Participants

PT schemes is a dust speck in the universe – but it is a very significant
tool !