t ' : :. tables for michigan - us forest service
TRANSCRIPT

(_ _i'r_edt,tSte"t'e:'mpirica / Y ie/d'_:_:. Tables for MichiganNorth Central
Forest ExperimentStation Jerold T. Hahn and Joan M. Stelman
General TechincalReport NC-96
0
White nineRed nine=
Jack nine. White soruce
BlacksoruceBalsamfirHemlockTamarack
• White cedarWhite oakRed oakHickoryYellow birchHard maple
. Soft mapleBeechAshBalsam poplar
•
Cottonwood• .
Bigtooth aspen• Quaking aspen
BasswoodYellow poplar
, .- Black walnutBlack cherryButternutElmPaper birch

o
° •
.
North Central Forest Experiment StationForest Service--U.S. Department of Agriculture
1992 Folwell AvenueSt. Paul, Minnesota 55108
Manuscript approved for publication December 27, 1983September 1984
°
°
CONTENTS
PageLiterature Cited ............................... 3Appendix ................................... 3
Definition of Terms ........................ 3_ _ Tree Species Groups in Michigan ............ 4
Tables .................................... 6
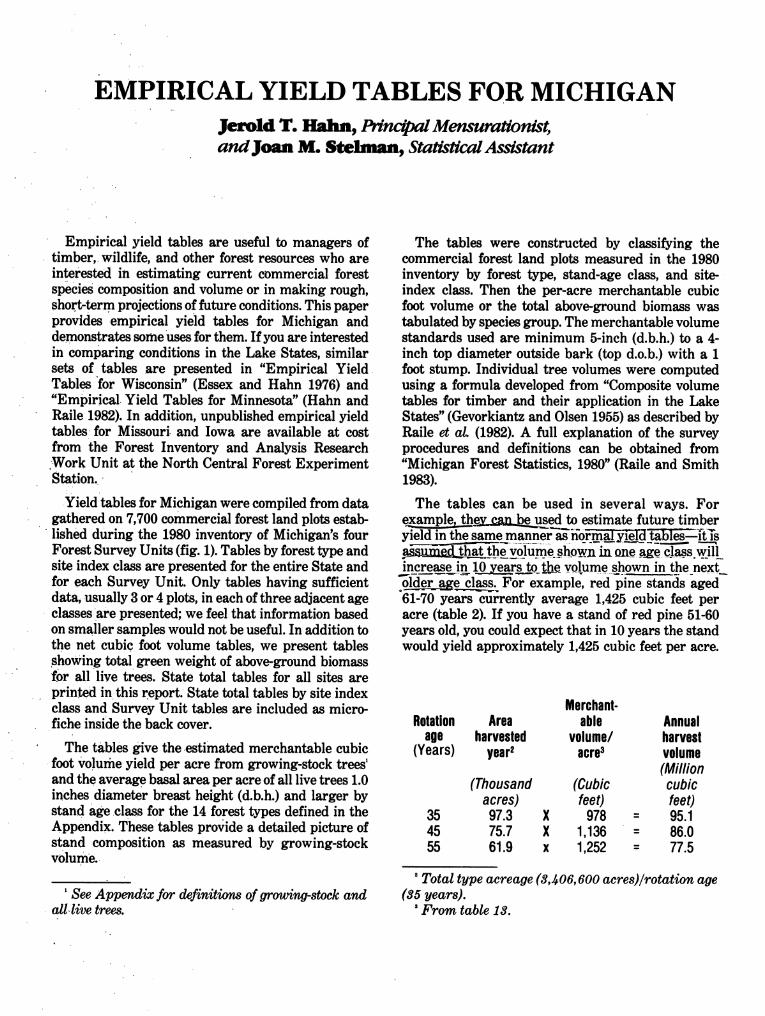
EMPIRICAL YIELD TABLES FOR MICHIGANJerold T. Hahn, Pn'nc/pa/Mensurationist,and Joan M. S__, Statistical Assistant
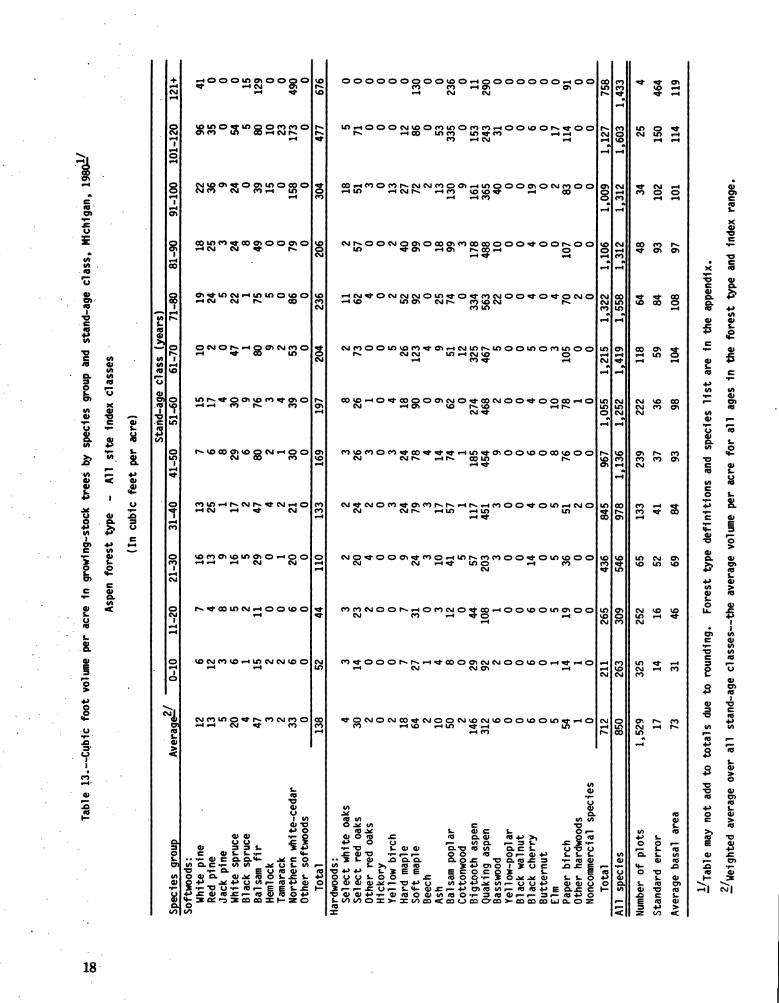
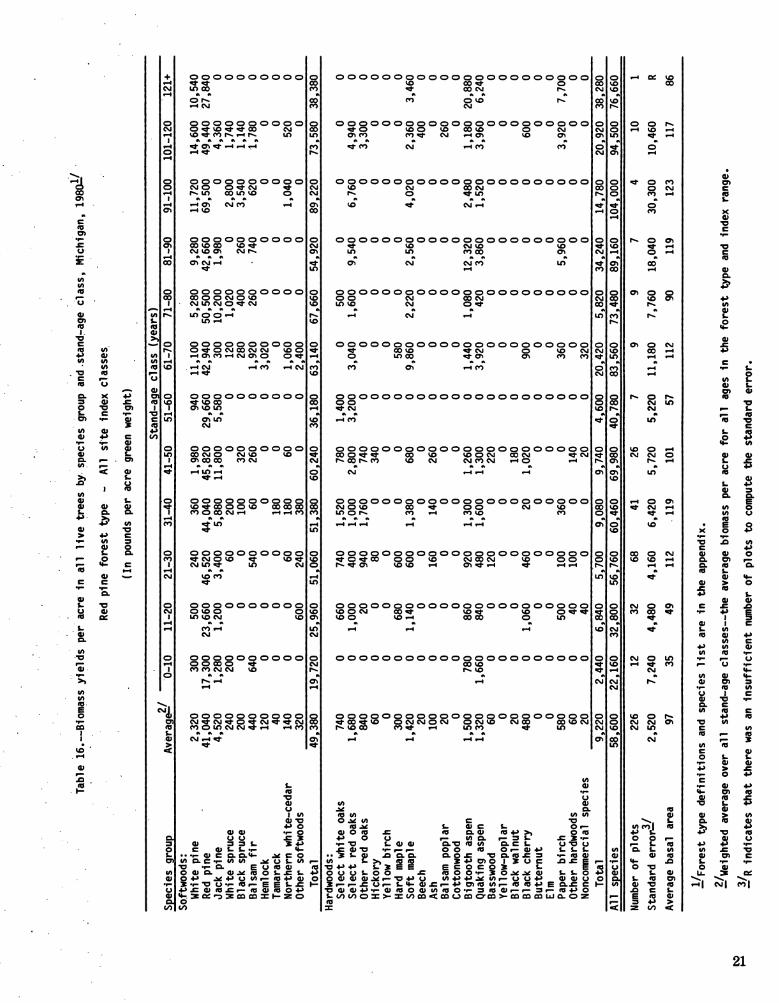
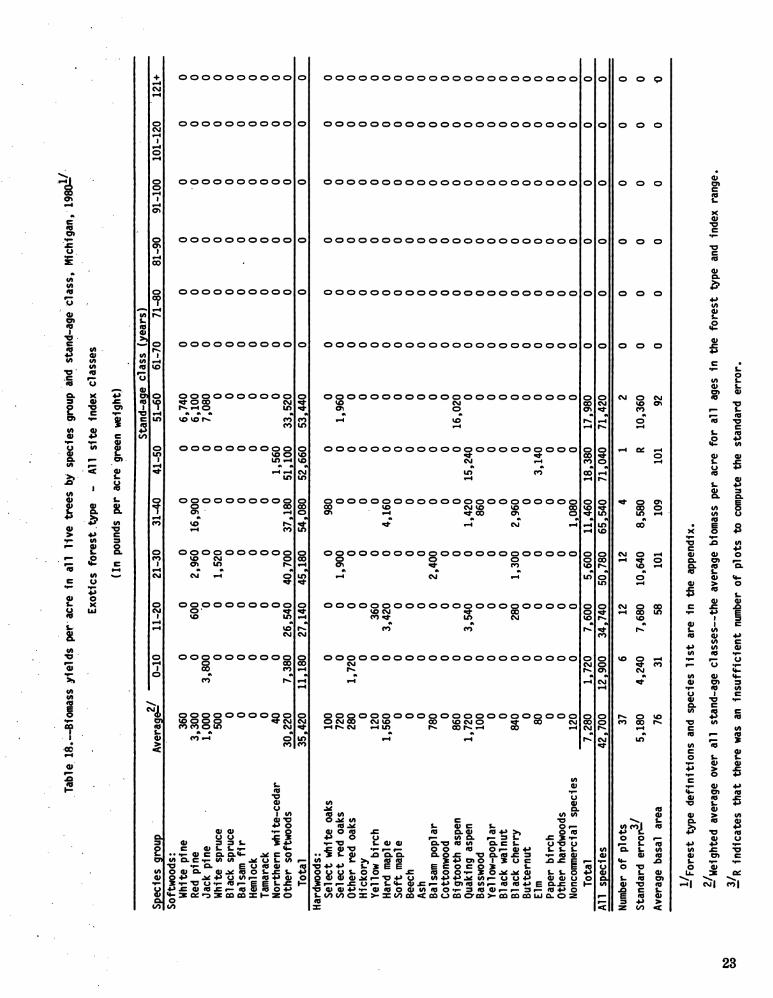
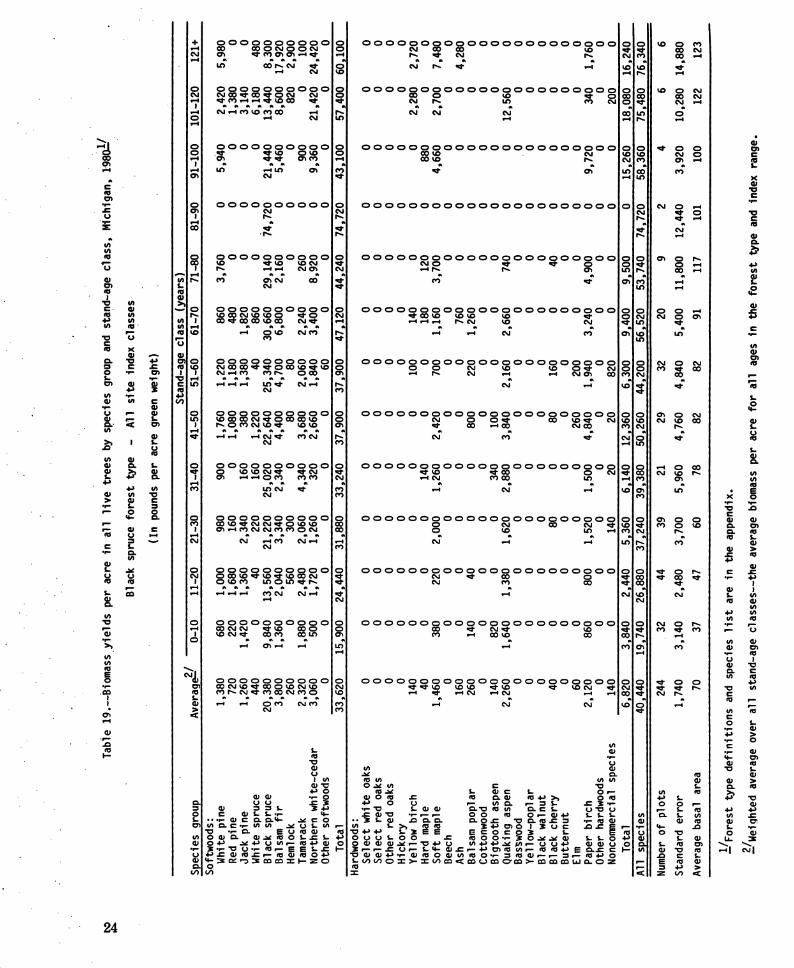
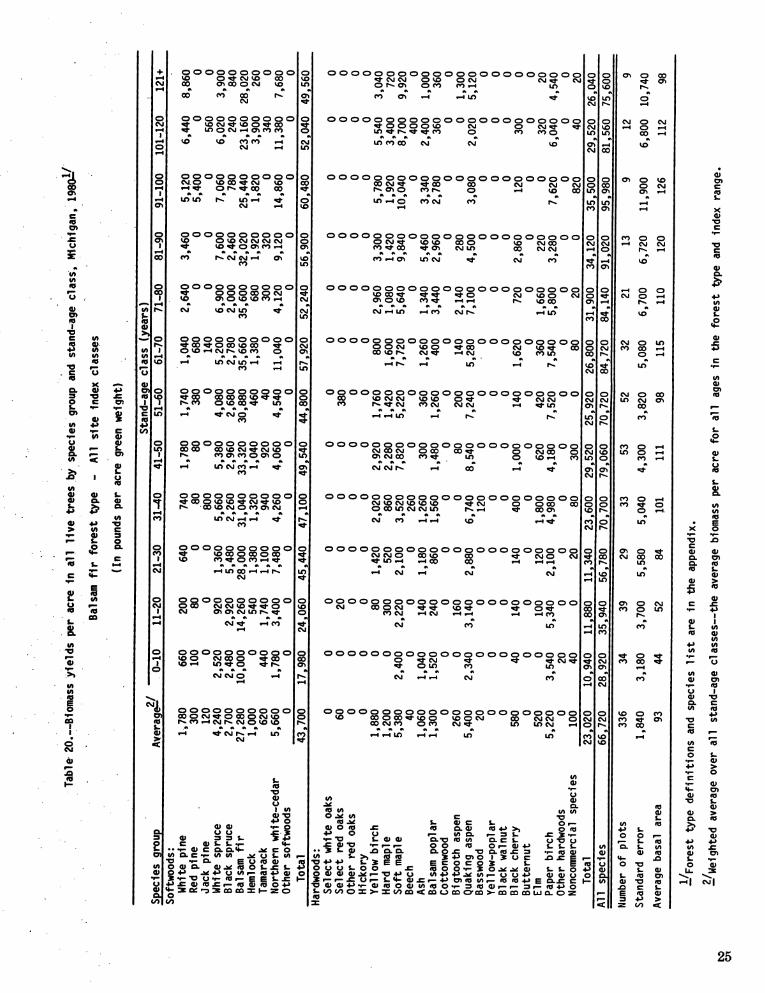
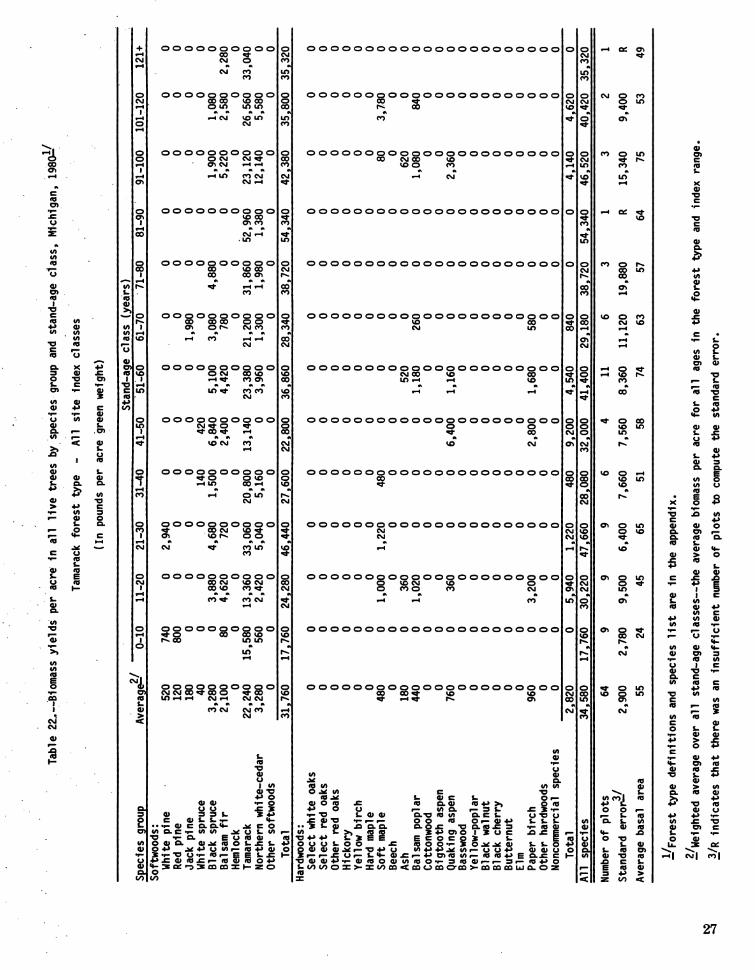
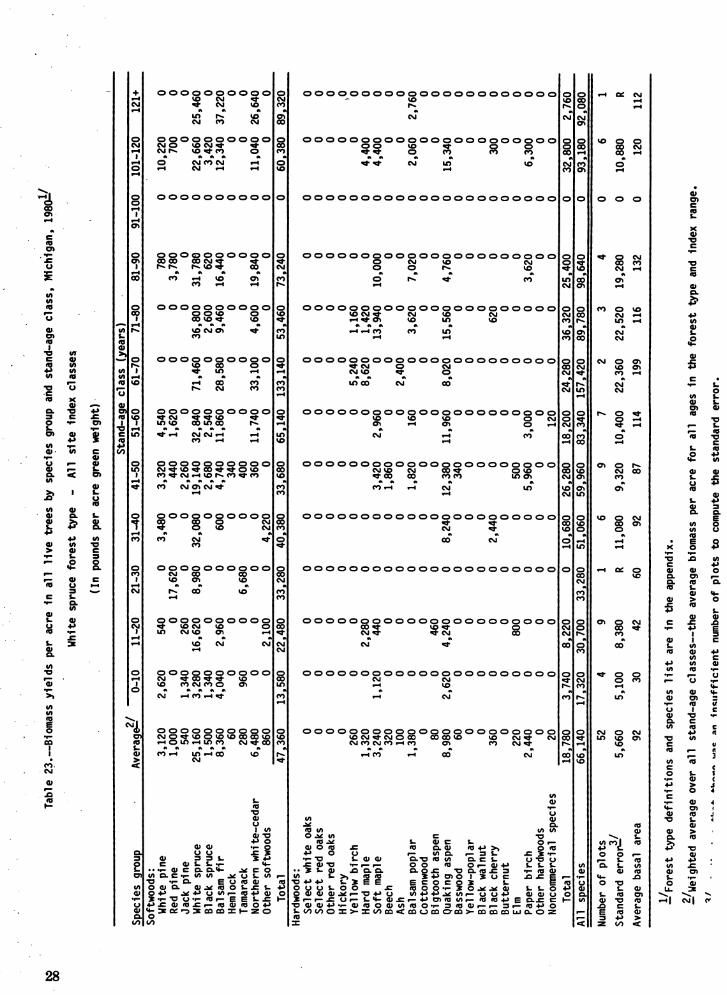
Empirical yield tables are useful to managers of The tables were constructed by classifying thetimber, wildlife, and other forest resources who are commercial forest land plots measured in the 1980interested in estimating current commercial forest inventory by forest type, stand-age class, and site-species composition and volume or in making rough, index class. Then the per-acre merchantable cubicshort-term projections of future conditions. This paper foot volume or the total above-ground biomass wasprovides empirical yield tables for Michigan and tabulated by speciesgroup. The merchantable volumedemonstrates someuses for them. If you are interested standards used are minimum 5-inch (d.b.h.) to a 4-in comparing conditions in the Lake States, similar inch top diameter outside bark (top d.o.b.) with a 1sets of tables are presented in "Empirical Yield foot stump. Individual tree volumes were computedTables for Wisconsin" (Essex and Hahn 1976) and using a formula developed from "Composite volume"Empirical Yield Tables for Minnesota" (Hahn and tables for timber and their application in the LakeRaile 1982). In addition, unpublished empirical yield States" (Gevorkiantz and Olsen 1955) as described bytables for Missouri. and Iowa are available at cost Raile et oL (1982). A full explanation of the surveyfrom the Forest Inventory and Analysis Research procedures and definitions can be obtained fromWork Unit at the North Central Forest Experiment "Michigan Forest Statistics, 1980" (Raile and SmithStation. 1983).
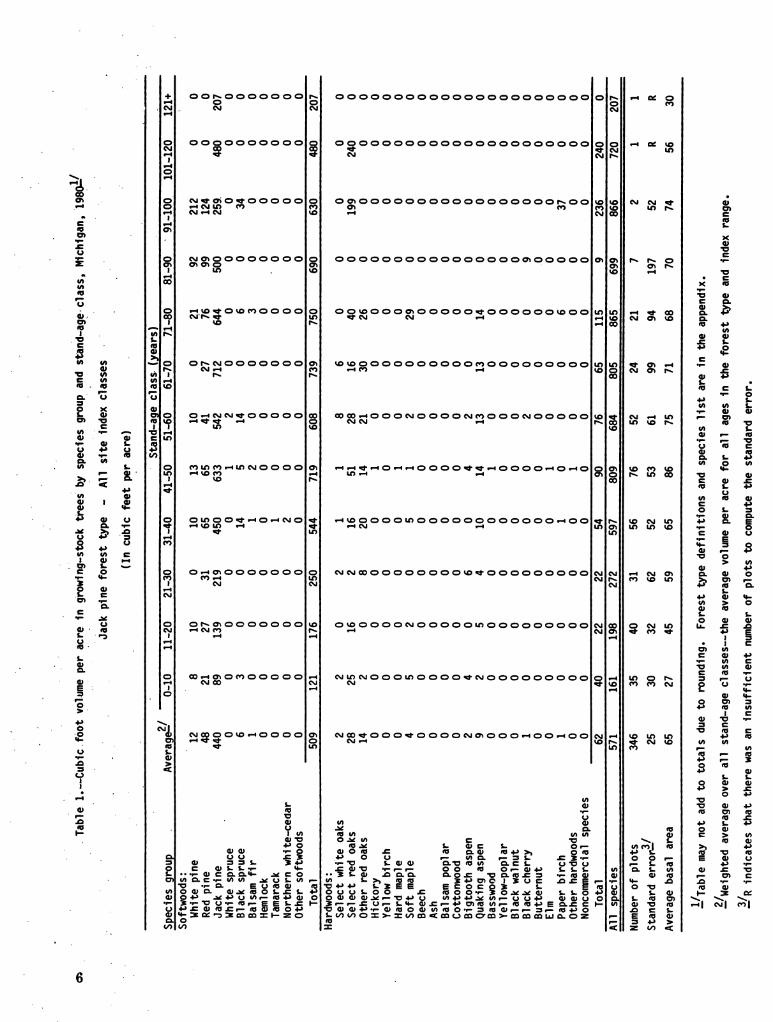
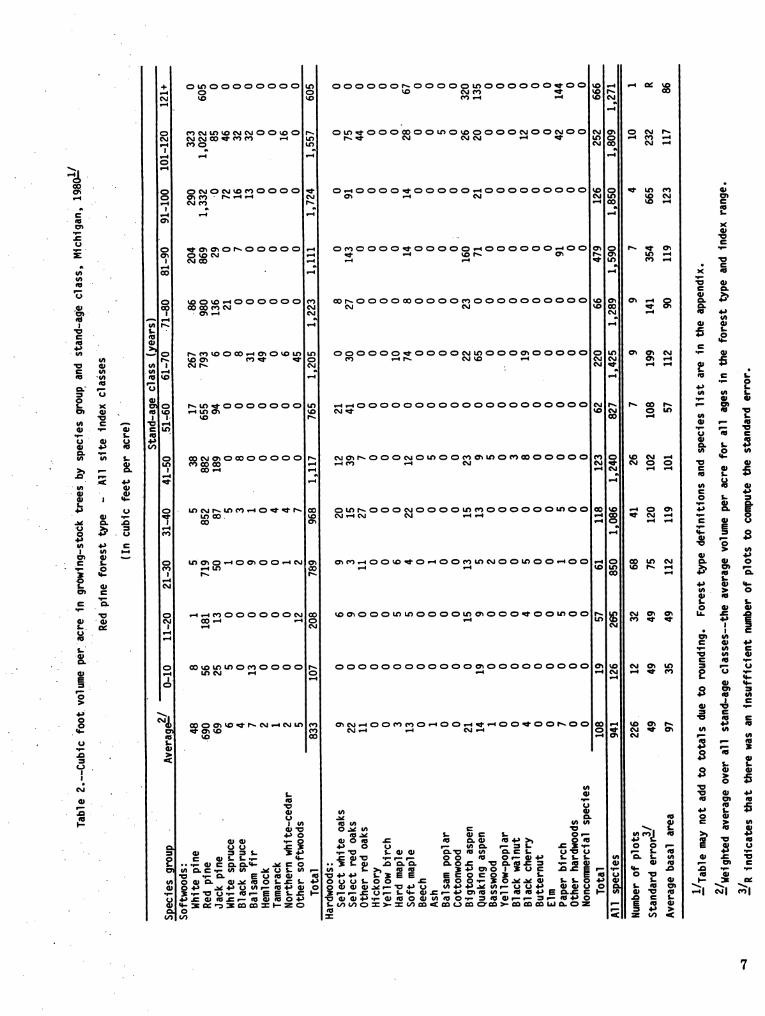
Yield tables for Michigan were compiled from data The tables can be used in several ways. Forgathered on 7,700 commercial forest land plots estab- example _they canbe used to estimate future timberlished dUring the 1980 inventory of Michigan's four yield in the same mann_r_h-o___ffial_ie._J_ld_--_Forest Survey Units (fig. 1). Tables by forest type and j_%mz_aedthatthe volume_sh_ow_nin one age class.will_site index class are presented for the entire State and increase in 10_Ox._rs__ Lh_e_vol_umeshown in the nextfor each Survey Unit. Only tables having sufficient _er a_ge_c_lass__.For example, red pine stands aged-data, usually 3 or 4 plots, in each of three adjacent age 61-70 years currently average 1,425 cubic feet perclasses are presented; we feel that information based acre (table 2). If you have a stand of red pine 51-60on smaller samples would not be useful. In addition to years old, you could expect that in 10 years the standthe net cubic foot volume tables, we present tables would yield approximately 1,425 cubic feet per acre.showing total green weight of above-ground biomassfor all live trees. State total tables for all sites are
•, printed in this report. State total tables by site indexclass and Survey Unit tables are included as micro- Merchant-fiche inside the back cover. Rotation Area able Annual
age harvested volume/ harvestThe tables give the estimated merchantable cubic (Years) year_ acre3 volume
foot Volume yield per acre from growing-stock trees _ (Millionand the averag e basal area per acre of all live trees 1.0 (Thousand (Cubic cubicinches diameter breast height (d.b.h.) and larger by acres) feet) feet)stand age class for the 14 forest types defined in the 35 97.3 X 978 = 95.1Appendix. Thesetables provide a detailed picture of 45 75.7 X 1,136 = 86.0stand composition as measured by growing-stock 55 61.9 x 1,252 = 77.5volume.
' Total type acreage (3,406, 600 acres)/rotation age' See Appendix for definitions of growing-stovE and (35 years).
all.live trees. ' From table 13..
. . _ _
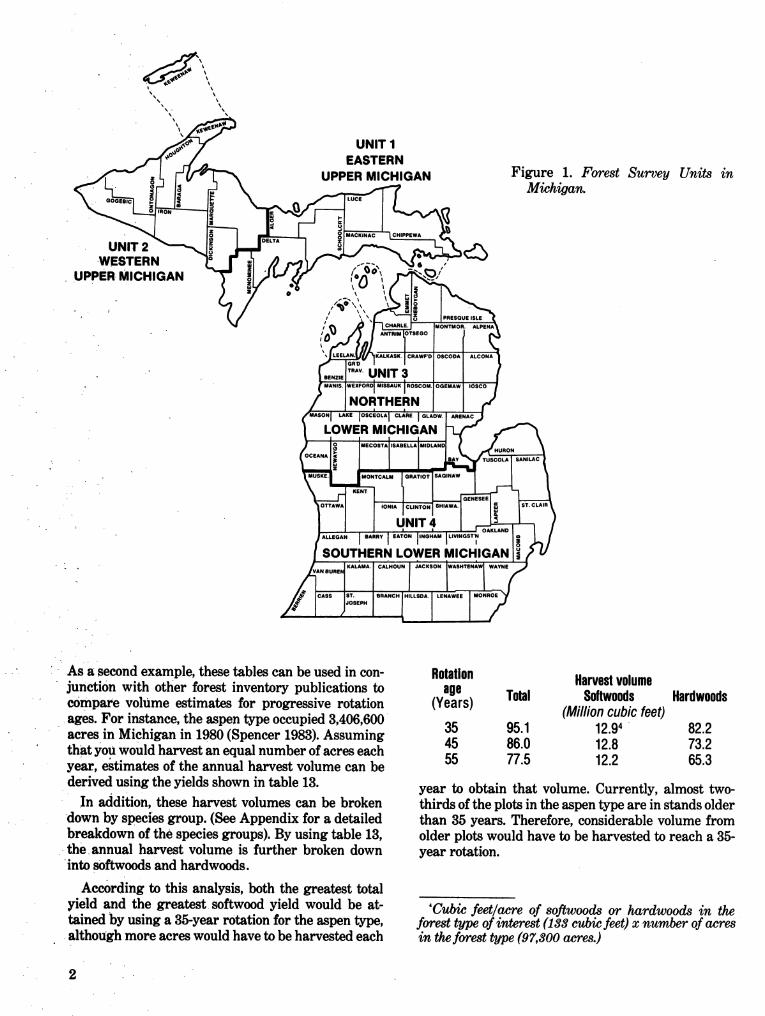
UNIT 1EASTERN
• _ UPPER MICHIGAN Figure 1. Forest Survey Units inMichigan.
UNIT 2
•WESTERN 6 ,,IuPPER-MICHIGAN
" ,'_)oJ it
' "'°'°1f fc..w,oo.coo..co. -..:l.,,,o.ol.,..u.I.o,oo..Io-..I,o,co!• /' INORTHE,RN I I r/
...o,I _-io,o,o_,to.-to_,,,w.I --o_LOWER MICHIGAN In r'-
/o-- ,o.,.icu..oN-..,li, / UNIT 4
I
SOUTHERN LOWER MICHIGAN
..- ' " As_ second example, these tables can be used in con- Rotation Harvestvolumejunction with other forest inventory publications to age Total Softwoods Hardwoods
" compare volume estimates for progressive rotation (Years) (Millioncubic feet)•ages. For instance, the aspen type occupied 3,406,600 35 95.1 12.94" 82.2acres in Michigan in 1980 (Spencer 1983). Assuming
' thatyouWouldharvestanequalnumber ofacreseach 45 86.0 12.8 73.2year,estimatesoftheannualharvestvolumecanbe 55 77.5 12.2 65.3
derivedusingtheyieldsshownintable13. yeartoobtainthatvolume.Currently,almosttwo-In addition,theseharvestvolumescanbe broken thirdsoftheplotsintheaspentypeareinstandsolder
down by speciesgroup.(SeeAppendixfora detailed than35 years.Therefore,considerablevolumefrombreakdownofthespeciesgroups).By usingtable13, olderplotswouldhavetobe harvestedtoreacha 35-theannualharvestvolumeisfurtherbrokendown yearrotation.into Softwoods and hardwoods.
According to this analysis, both the greatest total
yield and the greatest softwood yield would be at- 'Cubic feet/acre of softwoods or hardwoods in thetained by using a 35-year rotation for the aspen type, forest type of interest (133 cubic feet) x number of acres
. -althoughmore acres would have to be harvested each in the forest type (97,300 acres.)
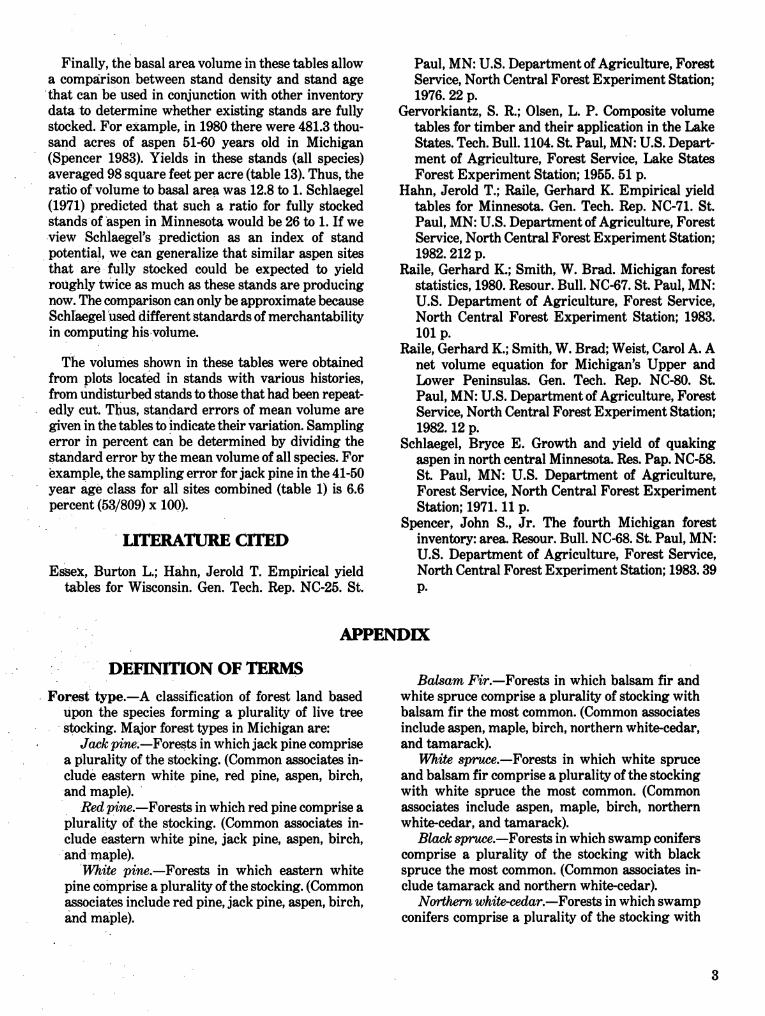
Finally, the basal area volume in these tables allow Paul, MN: U.S. Department of Agriculture, Foresta comparison between stand density and stand age Service, North Central Forest Experiment Station;
that can be used in conjunction with other inventory 1976. 22 p.data to determine whether existing stands are fully Gervorkiantz, S. R.; Olsen, L. P. Composite volumestocked. For example, in 1980 there were 481.3 thou- tables for timber and their application in the Lakesand acres of aspen 51-60 years old in Michigan States. Tech. Bull. 1104. St. Paul, MN: U.S. Depart-(Spencer 1983). Yields in these stands (all species) ment of Agriculture, Forest Service, Lake Statesaveraged 98 square feet per acre (table 13). Thus, the Forest Experiment Station; 1955. 51 p.ratio of volume to basal area was 12.8 to 1. Schlaegel Hahn, Jerold T.; Raile, Gerhard K. Empirical yield(1971) predicted that such a ratio for fully stocked tables for Minnesota. Gen. Tech. Rep. NC-71. St.stands of aspen in Minnesota would be 26 to 1. If we Paul, MN: U.S. Department of Agriculture, Forestview Schiaegel's prediction as an index of stand Service, North Central Forest Experiment Station;potential, we Cangeneralize that similar aspen sites 1982. 212 p.that are fully stocked could be expected to yield Raile, Gerhard K.; Smith, W. Brad. Michigan forestroughly twice as much as these stands are producing statistics, 1980. Resour. Bull. NC-67. St. Paul, MN:now. The comparison can only be approximate because U.S. Department of Agriculture, Forest Service,SchI_gel".used different standards of merchantability North Central Forest Experiment Station; 1983.in computing hisvotume. 101 p.
Raile, Gerhard K.; Smith, W. Brad; Weist, Carol A. AThe volumes shown in these tables were obtained net volume equation for Michigan's Upper and
from plots located in stands with various histories, Lower Peninsulas. Gen. Tech. Rep. NC-80. St.from undisturbed stands to those that had been repeat- Paul, MN: U.S. Department of Agriculture, Forestedly cut. Thus, standard errors of mean volume are Service, North Central Forest Experiment Station;_ven in the tables to !ndicate their variation. Sampling 1982. 12 p.error in percent can be determined by dividing the Schlaegel, Bryce E. Growth and yield of quakingstandard error by the mean volume of all species. For aspen in north central Minnesota. Res. Pap. NC-58.example, the sampling error for jack pine in the 41-50 St. Paul, MN: U.S. Department of Agriculture,year age class for all sites combined (table 1) is 6.6 Forest Service, North Central Forest Experimentpercent (53/809)x 100). Station; 1971. 11 p.
Spencer, John S., Jr. The fourth Michigan forestLITERATURE CII_D inventory: area. Resour. Bull. NC-68. St. Paul, MN:
U.S. Department of Agriculture, Forest Service,Essex, Burton L.; Hahn, Jerold T. Empirical yield North Central Forest Experiment Station; 1983. 39
tables for Wisconsin. Gen. Tech. Rep. NC-25. St. p.
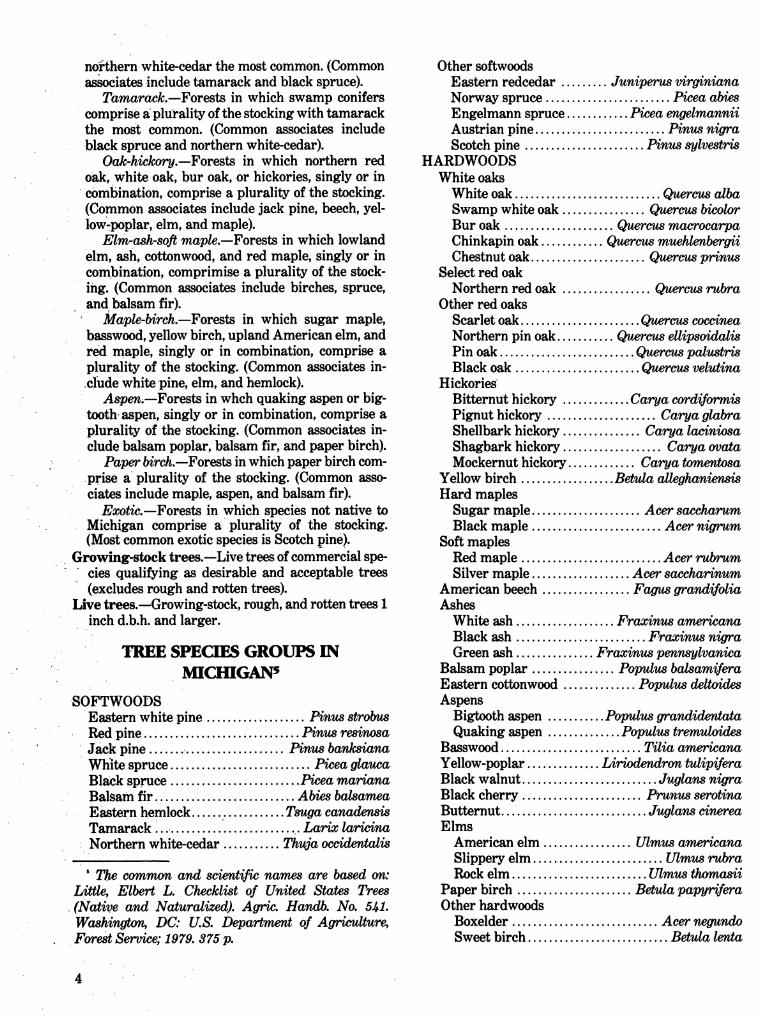
APPENDIX
DEFINITION OF TERMSBaLsam Fir.--Forests in which balsam fir and
Forest type.--A classification of forest land based white spruce comprise a plurality of stocking withUpon the species forming a plurality of live tree balsam fir the most common. (Common associatesstocking. Major forest types in Michigan are: include aspen, maple, birch, northern white-cedar,
Jack p/ne.--Forests in which jack pine comprise and tamarack).a plurality of the stocking. (Common associates in- White spruce.--Forests in which white spruceclude eastern white pine, red pine, aspen, birch, and balsam fir comprise a plurality of the stockingand maple), with white spruce the most common. (Common
Red p/ne.--Forests in which red pine comprise a associates include aspen, maple, birch, northernplurality of the stocking. (Common associates in- white-cedar, and tamarack).clude eastern white pine, jack pine, aspen, birch, Black spruce.--Forests in which swamp conifersandmaple), comprise a plurality of the stocking with black
White pine.--Forests in which eastern white spruce the most common. (Common associates in-pine comprise a plurality of the stocking. {Common clude tamarack and northern white-cedar).associates include red pine, jack pine, aspen, birch, Northern white-cedar.--Forests in which swampand maple), conifers comprise a plurality of the stocking with
,
northern white-cedar the most common. (Common Other softwoodsas_ciates include tamarack and black spruce). Eastern redcedar ......... Juniperus virginiana. .
Tamarack.--Forests in which swamp conifers Norway spruce ........................ Picea abiescomprise a' plurality of the stocking with tamarack Engelmann spruce ............ Picea engelmanniithe most common. (Common associates include Austrian pine ......................... Pinus nigrablack spruceand northern white-cedar). Scotch pine ....................... Pinus sylvestris
Oak-hickory.--Forests in which northern red HARDWOODSoak, white oak, bur oak, or hickories, singly or in White oakscombination, comprise a plurality of the stocking. White oak ............................ Quercus alba(Common associates include jack pine, beech, yel- Swamp white oak ................ Quercus b/co/orlow-poplar, elm, and maple). Bur oak ..................... Quercus macrocarpa
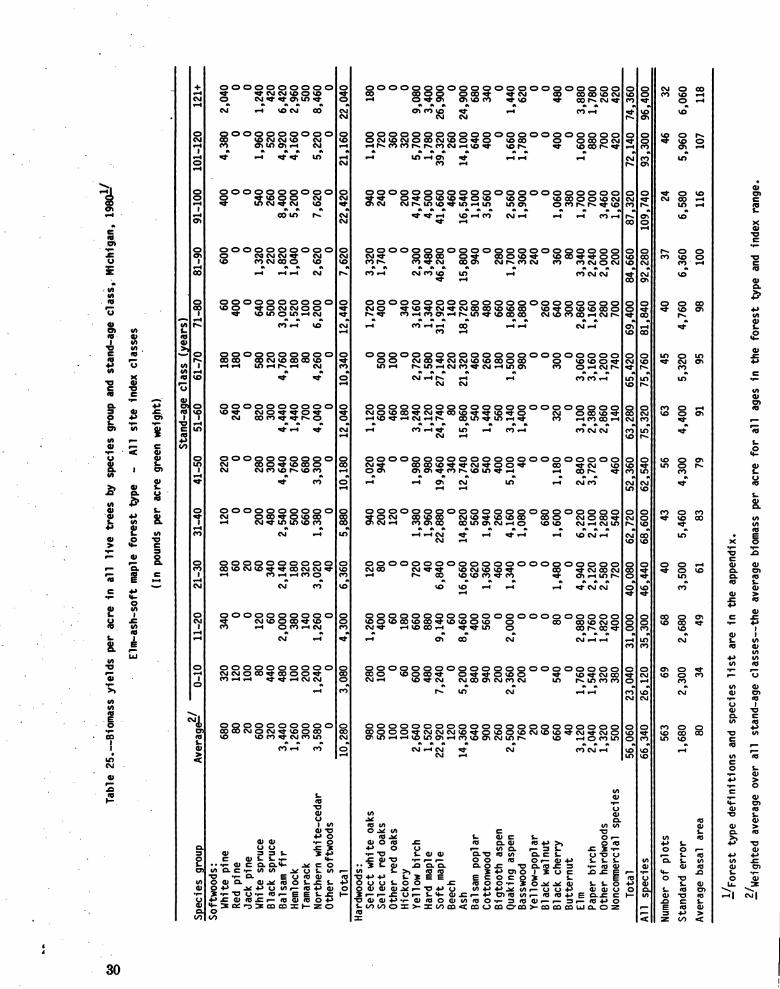
Elm-ash-soft maple.--Forests in which lowland Chinkapin oak ............ _cus muehlenbergiielm, ash, cottonwood, and red maple, singly or in Chestnut oak ...................... _cus pr/nuscombination, comprimise a plurality of the stock- Select red oaking. (Common associates include birches, spruce, Northern red oak ................. _cus rubraand balsam fir). Other red oaks
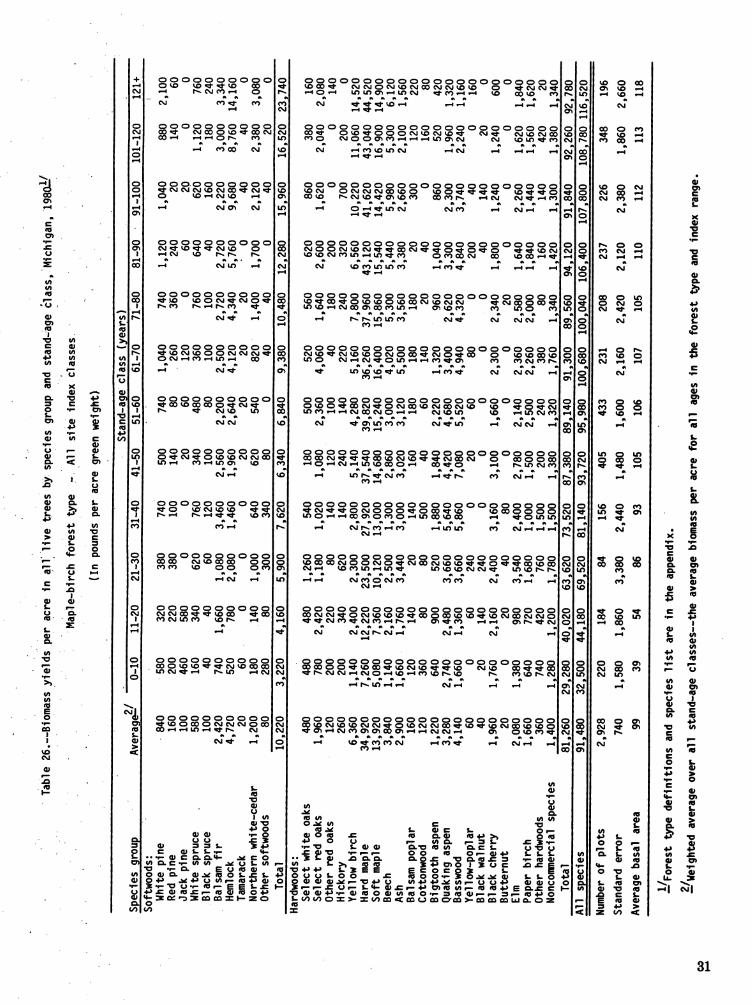
" Maple-birch.--Forests in which sugar maple, Scarlet oak ....................... Quercus coccineabasswood, yellow birch, upland American elm, and Northern pin oak ........... Quercus ellipsoidalisred maple, singly or in combination, comprise a Pin oak .......................... Quzrcuz palustrisplurality of the stocking. (Common associates in- Black oak ........................ Qu_cus velutina.elUde white pine, elm, and hemlock). Hickories '
Aspen.--Forests in whch quaking aspen or big- Bitternut hickory ............. Carya cordiformistooth-aspen, singly or in combination, comprise a Pignut hickory ..................... Carya glabraplurality of the stocking. (Common associates in- Shellbark hickory ............... Carya laciniosaelude balsam poplar, balsam fir, and paper birch). Shagbark hickory ................... Carya ovata
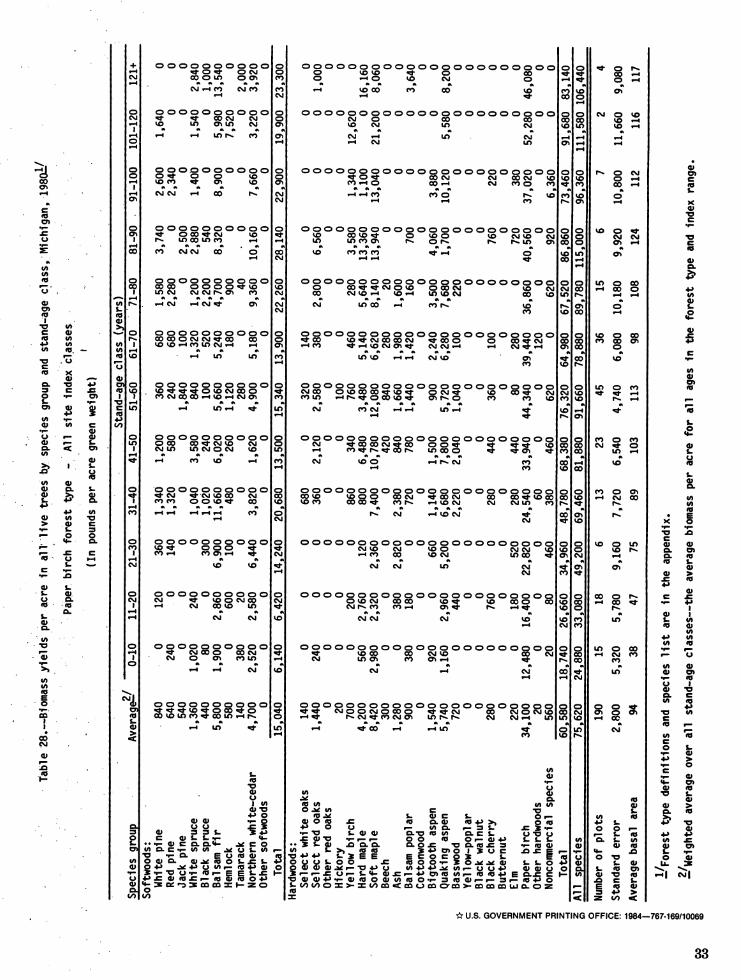
• Paper birch.--Forests in which paper birch com- Mockernut hickory ............. Carya tomentosaprise a plurality of the stocking. (Common asso- Yellow birch .................. Betula alleghaniensisciates include maple, aspen, and balsam fir). Hard maples
Exotic.--Forests in which species not native to Sugar maple ..................... Acer saccharumMichigan comprise a plurality of the stocking. Black maple ......................... Acer nigrum(Most common exotic species is Scotch pine). Soft maples
Growing-stock trees.--Live trees of commercial spe- Red maple ........................... Acer rubrum• cies qualifying as desirable and acceptable trees Silver maple ................... Acer saccharinum
{excludes rough and rotten trees). American beech ................. Fagus grandifoliaLive trees.--Growing-stock, rough, and rotten trees 1 Ashes
inch d.b.h, and larger. White ash ................... Fraxinus americanaBlack ash ......................... Fraxinus nigra
TREE SP]EC_ GROUI_ IN Green ash ............... Fraxinus pennsylvanica• .
MICHIGAN 5 Balsam poplar ................ Populus balsamiferaEastern cottonwood .............. Populus deltoides
SOFTWOODS AspensEastern white pine ................... Pinus strobus Bigt_th aspen ........... Populus grandidm_ataRed pine .............................. Pinus resinosa Quaking aspen .............. Populus tremuloides
' Jack pine ....... ................... Pinus banksiana Basswood ........................... Tilia americanaWhite spruce ........................... Picea glauca Yellow-poplar .............. Lirio_ron tulipiferaBlack spruce ......................... Picea mariana Black walnut .......................... Juglans nigraBalsam fir ........................... A bies balsamea Black cherry ....................... Prunus serotinaEastern hemlock .................. Tsuga canadensis Butternut ............................ Juglans cinereaTamarack... ......................... Larix laricina Elms
• Northern white-cedar ........... Thuja occidzntalis American elm ................. Ulmus americanaSlippery elm ......................... Ulmus rubra
_ The common and scientific names are based on: Rock elm .......................... Ulmus thomasiiLiale, Elbert L. Checklist of United States Trees Paper birch ...................... Betula papyrifera(Native and Naturalized). Agric. Handb. No. 5_1. Other hardwoodsWashi_ DC: U.S. Department of Agriculture, Boxelder ............................ Acernegundn
. Forest Service; 1979. 375 p. Sweet birch ........................... Betula lenta

River birch., - ....................... Betula nigraBlack willow ........................... Salix nigraOhio buckeye ..................... Aesculus glabraFlowering dogwood ............... Comus f/or/daHoneylocust. ................ GleditM_ triacanthosOsage-orange ................... Maclura pomiferaBlack tupelo ................. Nyssa sylvatica vat.
sylvatieaSycamore ................... Platanus owidentalisBlack locust ................ Robinia pseu_acaciaSassafr_... -.................. Sassafras albidumRed mulberry _ Morus rubraAmerican chestnut ............. Castanea dentata
?
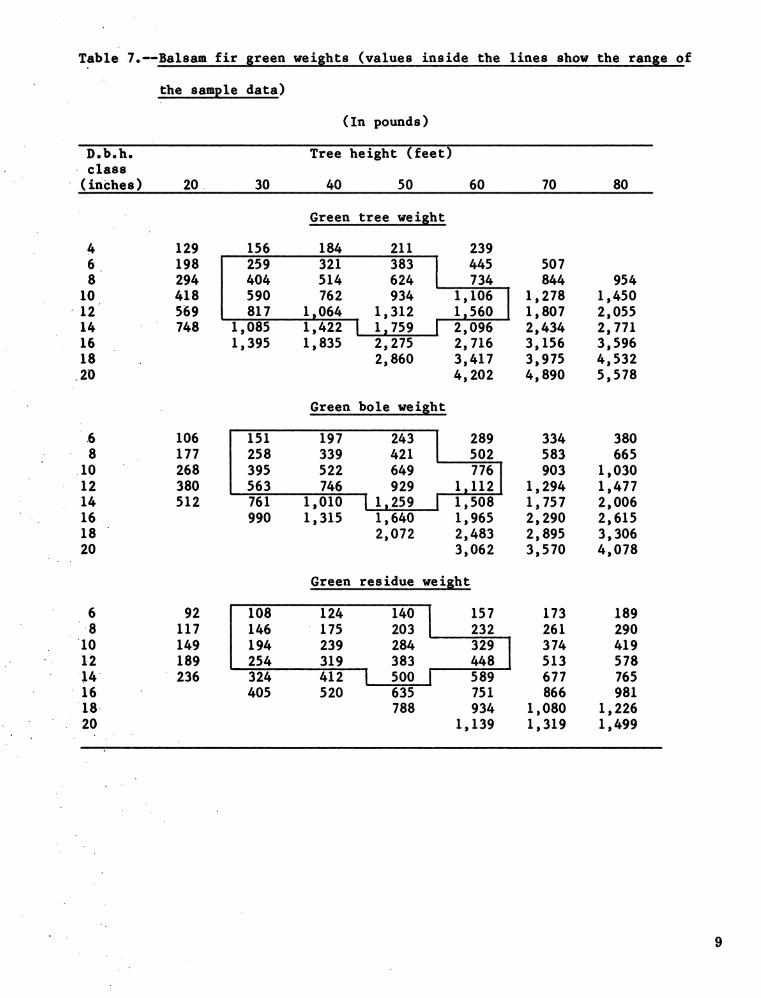
Table 7.--B.alsam fir sreen weishts (values inside the lines show the range of t
th e sampl e data) '
(In pounds),,
V. b.h. Tree he igh t ( fee t)class(inches) 20. 30 40 50 60 70 80
Green tree weight
4 129 156 184 211 2396 198 " 259 321 383 445 5078 294 404 514 624 734 844 954
10 418 590 762 934 1,106 I 1,278 1,45012 569 817 1_064 1,312 1,560 ! 1,807 2,05514 748 1,085 1,422 I 1,759 [ 2,096 2,434 2,77116 1,395 1,835 2,275 2,716 3,156 3,59618 2,860 3,417 3,975 4,532
.20 4, 20 2 4,890 5,5 78
Green bole weight
.6 106 151 197 243 289 334 380.8 177 258 339 421 502 583 665
• I•10 268 395 522 649 776 903 1,03012 380 563 746 929 1,112 1,294 1,47714 512 761 1,010 i 1,259 i 1,508 1,757 2,00616. 990 I,315 1,640 I,965 2,290 2,61518 2,072 2,483 2,895 3,30620 3,062 3,570 4,078
Green residue weisht:,
6 92 108 124 140 I 157 173 189•8 117 146 175 203 [ 232 261 290I0 149 194 239 284 329 I 374 419i2 189 254 319 383 448 [ 513 578!4 " 236 324 412 I 500 i 589 677 76516 405 520 635 751 866 981
18 788 934 1,080 1,22620 1,139 1,319 1,499
,, ,
' 9

\
Table 8,---Sugar maple pulpwood green weights (-_valuesinside the ifnes show
the range of the sampl e data)
(In pounds)
"D.b.h. Tree height (all trees)class
(.inches) 20 30 40 50 60 70 80 90, • =
Green tree weight (all trees)
4 107' 134 161 187 214 241
6 208 ," 268 ......329 ' 389, 450 . 510 571
8 349 1 456 564 671 779 1 886 994' 10 530 698 I 866 1,034 1,202 1_370 1,53812 752 994 1,236 1,478 1,720 1,962 2,203
14 1,343 1,673 2,002 2,331 2,660 2,990
.16 1,747 2,177 2,607 3,037 3,467 3_997
18 2,203 2,748 3_292 3,836 4,381 4,92520 3,386 4,058 I 4,730 5,402 6,07422 4,092 4,905 I 5,718 6,531 7,344
24 4,865 5,832 6,800 i 7_768 8_73526 6,840 7,976 9,112 10,247
Green bole weisht (pulpwood.trees)
6 80 132 185 ..... 237 I 290 3428. 202 296 389 483 576 I 670
10 360 506 I 652 798 944 I 1_090• 12 553 763 973 1 1,183 I_394 I_604 1
• 14 780 1,067 1,353 1 I_639 I 1,925 2,21116 I,417 1,791 2,165 2,538 2,912
18 2,287 2,760 3,233 3,706
Green residue weight (pulpwood trees)• .
6 105 118 13i' 144 1 157 1698 135 158 181 204 227 250
10 174 210 1 246 282 318 35412 221 273 325 377 429 481 i
. 14 277 348 419 489 I 560 63016 434 527 619 711 80318 649 766 882 999
°
10
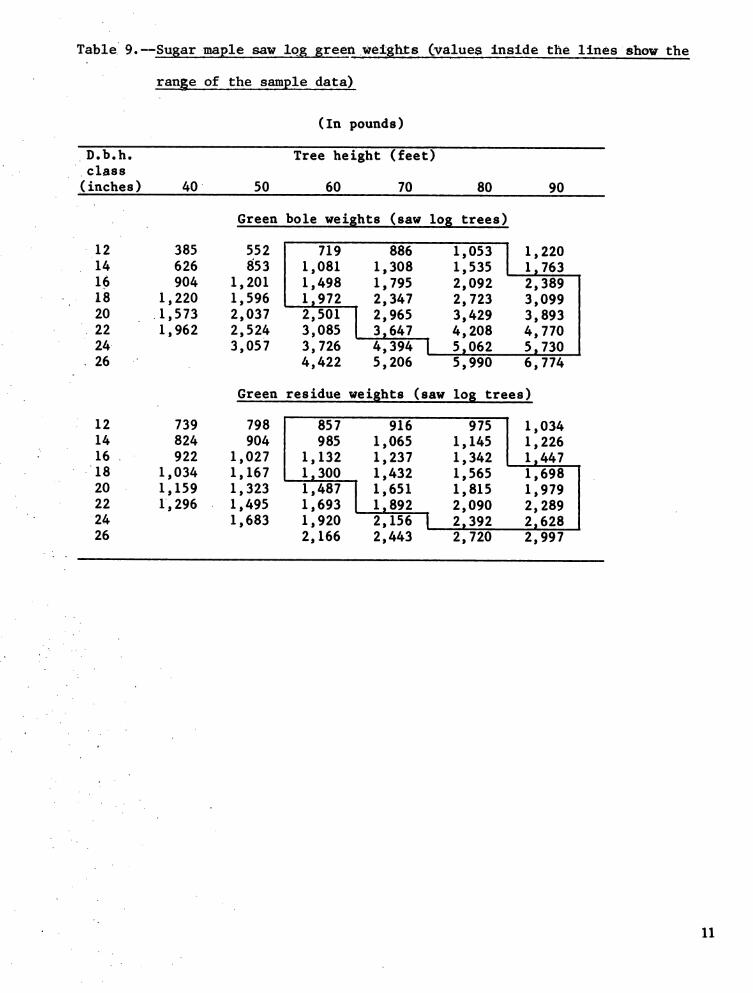
Table 9.--Sugar maple saw lqg green weights _ValueS inside the lines show the
range of the sample data)
(In pounds)
D.b.h. Tree height (feet)class(inches) 40 50 60 70 80 90, , , ,
Green bole weights (saw Io_ trees)
12 385 552 719 886 1,053 I 1,22014 626 853 1,081 1,308 1,535 I_ I,76316 904 1,201 1,498 1,795 2,092 2,38918 1,220 1,596 1,972 2, 347 2, 723 3,09920 1,573 2,037 2,501 I 2,965 3,429 3,89322 1,962 2,524 3,085 [ 3,647 4,208 4,77024 3,057 3,726 4,394 l 5,062 5,73026 " 4,422 5,206 5,990 6,774 ;
Green residue weishts (saw Io$ trees)
12 739 798 857 916 975 1,034 '14 824 904 985 1,065 1,145 1,226 I16 . 922 1,027 1,132 1,237 1,342 1_44718 1,034 1,167 1,300 1,432 1,565 1,69820 1,159 1,323 1,487 [ 1,651 1,815 1,979
22 1, 296 1,495 1,693 | 1,892 2,090 2,289 I24 1,683 1,920 2,156 [ 2,392 2,62826 2,166 2,443 2,720 2, 9§'7
,,,,, , ,
' 11

Table 10.--Red oak green weishts (values inside the lines show the ranse of°
the sample data)
(In pounds)
D. b. h' Tree he igh t ( fee t) ....Clafs
(inches) 20 30 40 50 60 70 80
Green tree weight
2 19 26 34 42 50
4 66 I 98 129 161 193 224_'6 145 217 288 359 430 502 573
8 383 510 I 636 ,, 763 890 1,01610 597 795 993 1,191 1,389 1,58712 1,143 1,428 1,713 _ 1,999 2,28414 1,555 1,943 2,331 2,719 3,107
16 2,030 2,537 3_044 3_551 4,05818 2,569 3,210 3,852 4,493 5,13520 3,963 4,755 5,547 6,339
• Green bole weight
6 143 I 200 256 i 313 3708 275 376 I 478 579 | 680 781
10 446 604 762 920 1,078 1,236I2 882 1,110 1,337 1,565 1,79214 1,211 1,520 1,830 2,140 2,449
• 16 1,590 1,994 2_ 399 2_ 803 3,20818 2,020 2,532 3,044 3,555 4,06720 2,500 3,132 3,764 4,396 5,028
Green residue weight
" 6 67 i 82 98 I 114 1308 103 132 I 160 188 I 216 244
10 151 195 239 283 327 37112 272 336 399 463 52614 364 450 536 623 709
' 16 470 582 695 807 920
'18 589 732 874 1,017 1,15920 723 899 1,075 1,251 1,.427
, ,
/
'12
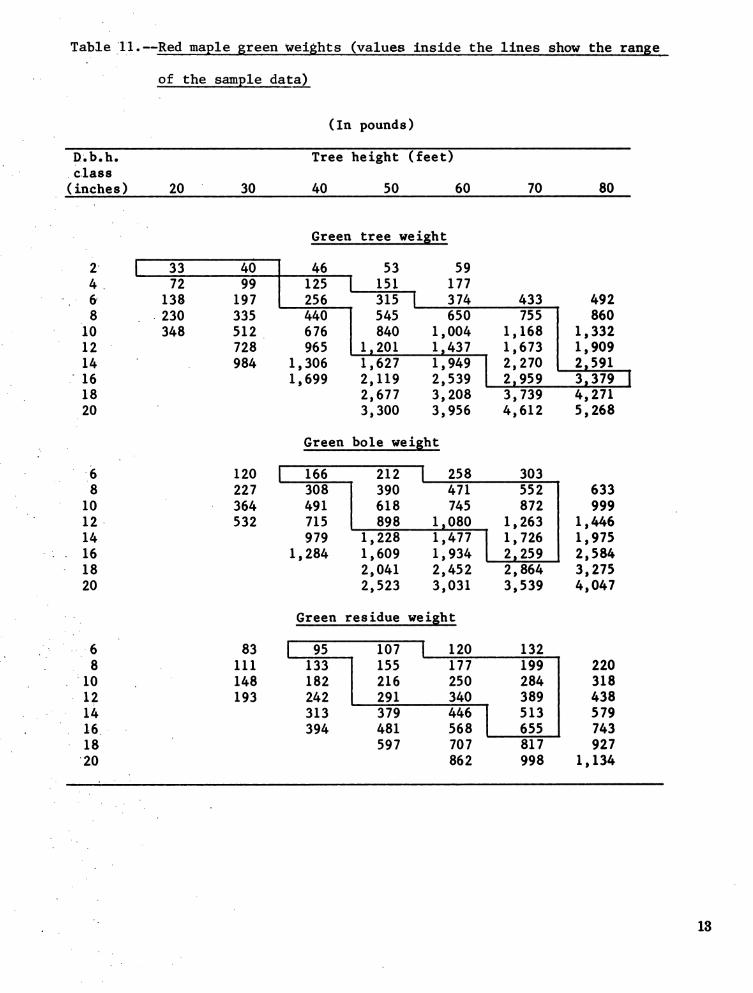
Table l!.--Red maple green weights (values inside the lines show the range
of the sample data)
(In pounds)i
D,b.h. Tree height (feet) .Class
[ ( inches ) 20 30 40 50 60 70 .. 80 r
II
Green tree weighti
2 I 33 40 ' 46 53 594_ 72 99 '125 I 151 177
6 138 197 256 315 i 374 433 4928 230 335 440 545 "650 755 860
10 348 512 676 840 1,004 1,168 1,33212 728 965 1,201 1,437 _ 1,673 1,909
14 984 1,306 1,627 1,949 I 2,270 2_591I I
16 1,699 2,119 2,539 2_959 3,379 I I18 2,677 3,208 3,739 4,271 Ii20 3,300 3,956 4,612 5,268 '
I
Green bole weight• ,, !
i
6 120 I 166 I 2s8 3o38 227 308 i 390 471 552 633
10 364 491 I 618 745 872 99912 532 715 898 1 _080 1,263 1,44614 979 1,228 1,477 1,726 1,975
, 16 1,284 1,609 1,934 2,259 2,58418 2,041 2,452 2,864 3,27520 2,523 3,031 3,539 4,047
Green residue we,ish
,' 6 83 I. 95 107 [ 120 132 '_ 8 111 133 155 177 199 220
,0 ,48 ,82 2,6 2so 284 3,812 193 242 291 340 389 438 i14 313 379 446 513 579 '
, 16 394 481 568 655 743 '18 597 707 817 927
20 862 998 1,134
' i
. 13

Table 12.--White birch green weishts (values inside the lines show the range
of the sample data)
(In pounds)
D. b.h. Tree he igh t ( fee t)class
( inches ) 20 30 40 50 60 70 80
Green tree weight
2 i 23' '29 36 43 50
4 64 I 92 119 147 1756 133 196 258 '32'0 I 382 445 507
' 8 230 341 452 562 673 I 784 894
I0 355 528 701 874 1,047 1 It220 I,39312 756 I,005 1,254 1,503 1,753 I 2,002
14 1,026 1,365 I Ip704 ....2_043 2,382 I 2,72116 1,337 1,780 2,223 2,6661 3,109 3,552 I18 2,251 2,811 3,372 3,932 4,49320 3,469 4,161 4,853 5,545
Green bole weisht
6 112 161 " 211 i 260 3098 227 315 403 490 I 578
10 ' 375 512 649 786 I 923 1,06012 556 753 951 1,148 1,345 I 1,542
14 770 1,038 I 1,307 1,575 1,844 I 2,11216 1,367 1,718 2,068 I 2,419 2,770 I18 1,740 2,184 2,627 3,017 3,51520 2,156 2,704 3,252 3,800 4,348
Green residue weisht
6 77 91 1051118 1328 109 133 158 1821 206 23110 150 188 226 264 I 302 340
' 12 200 255 310 365 419 I 474
14 ' 334 I, 409 483 558 [ 63216 425 523 620 I 717 814 [18 529 652 775 898 1,021.
20 644 796 948 1 , 100 1 , 25 2
14

Table. 13.--Aspen sreen weights (values.inside the lines show the range of°
" the sample data)
(In pounds)
D.b.h. Bole height (number of"100-inch bolts), _ciass
i (inches) I 2 3 . 4 . 5 .6 7 8 ,.,
Green tree weight
4 83 110 137 164 192
6 l 117 178 239 300 I 362 423_8 1'64 _ 273 382 491 600 '! 708 817 926 '10 225 396 I 566 _ 735 906 1,076 I 1,245 1,41612 330 545 790 [ 1_035 1,280 1,524 1,769 2,01414 . 722 1,055 1,388 I 1_722 2,055 2,388 2,72116 ' 1,361 1,796 - 2,232 i 2,667 - 3,102 3,53718 2,558 2,810 3,360 _ 3,911 4,46220 3,456 4,136 4,815 5,496
Green bole weight
6 " i 71 121 170 220 _ 269 3198 110 i 198 286 374 462 [ 550 638 72610 159 297 | 434 572 709 847 i 984 1,12212 220 418 616 1 814 1,012 1,210 1,408 1,60614 561 830 1,100 I 1,369 _ 1,639 1,908 2,17816 1,078 1,430 1,782 I 2,134 2,486 2,838
• " 18 1,804 2,249 2,695 I 3,140 3,58620 . 2,772 3,322 3,871 4,422
Green residue weight
6_ l 45 57 68 - 79 'l 91 102'_ 8 54 [ 74 95 115 135 1 155 176 196
" . 10 65 9'7 't 129 160 192 224 [ 255 28712 79 125 171 [ 216 _ 262 307 '353 39914 158 220 282 I 344 _ 406 469 53016 277 358 439 I 520 601 682
' 18 444 547 649 I 752 855'20 667 794 920 I,047
' 15
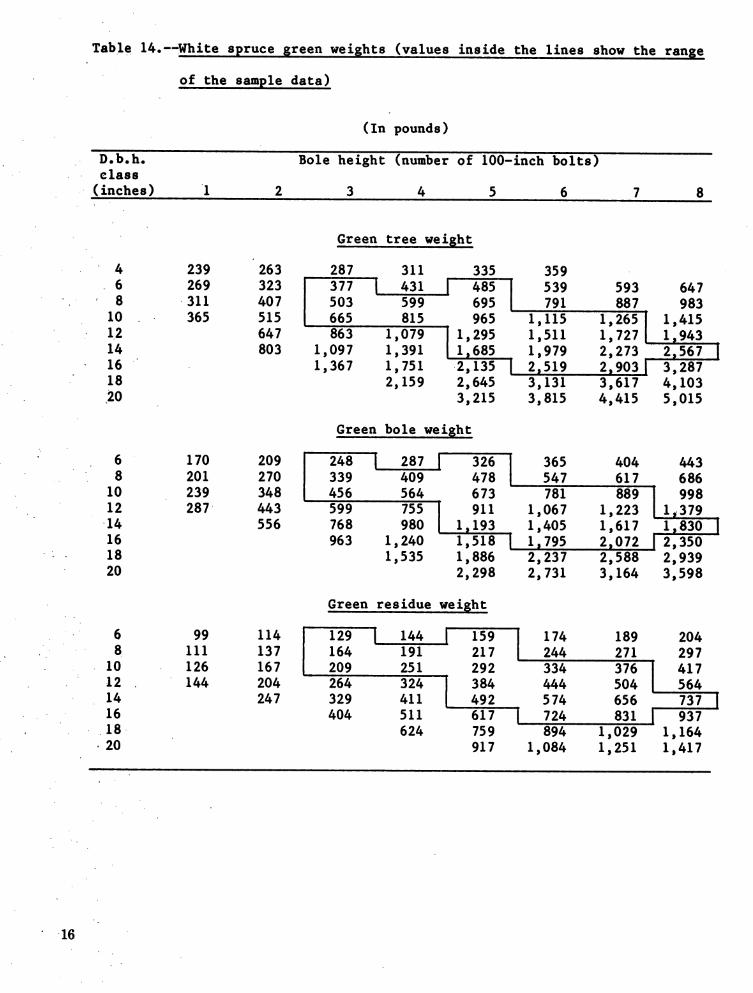
Table 14.--White spruce _reen weishts (values insi.de the lines show the range
of the sample data)
(In pounds)
D.b.h. Bole height (number of 100-inch bolts)class(inches) I 2 3 4 5 6 7 8.,
Green tree weight
4 239 263 287 311 335 359
. 6 269 323 37714311485 539 593 647"8 311 407 503 599 695 791 887 983
10 365 515 665 815 965 1,115 1,2651 1,415• 12 647 863 1,079 I 1,295 1,511 1,727 [ 1_943
14 803 1,097 1,391 [ 1_685 1,979 2,273 2,567 I16 " 1,367 1,751 2,135 [ 2_519 2_903 I 3,28718 2,159 2,645 3,131 3,6i7 4,10320 3,215 3,815 4,415 5,015
Green bole weight
6 170 209 248 [ 287 [ 326 I 365 404 4438 201 270 339 409 478._ 547 . 617 68610 239 348 456 564 673 781 889 99812 287 443 599 755 911 1,067 1,223 I,-37914 556 768 980 1_193 1,405 1,617 _ I_830 I16 963 1,240 1,518 I 1_795 2_072 I 2,350
• • 18 1,535 1,886 2,237 2,588 2,93920 2,298 2,731 3,164 3,598
Green res£du.eweight
6 99 114 ' 129 " [ 144 [ 159 | 174 189 204. 8 III 137 164 191 217 [ 244 271 297
" I0 126 167 209 251 292 334 376 41712 144 204 264 324 [ 384 444 504 564
14 247 329 411 | 492 574 656 ' 737 I16 404 511 617 I 724 S31 i 937'
, 18 624 759 894 1,029 1,164. 20 917 1,084 1,251 1,417
' 16
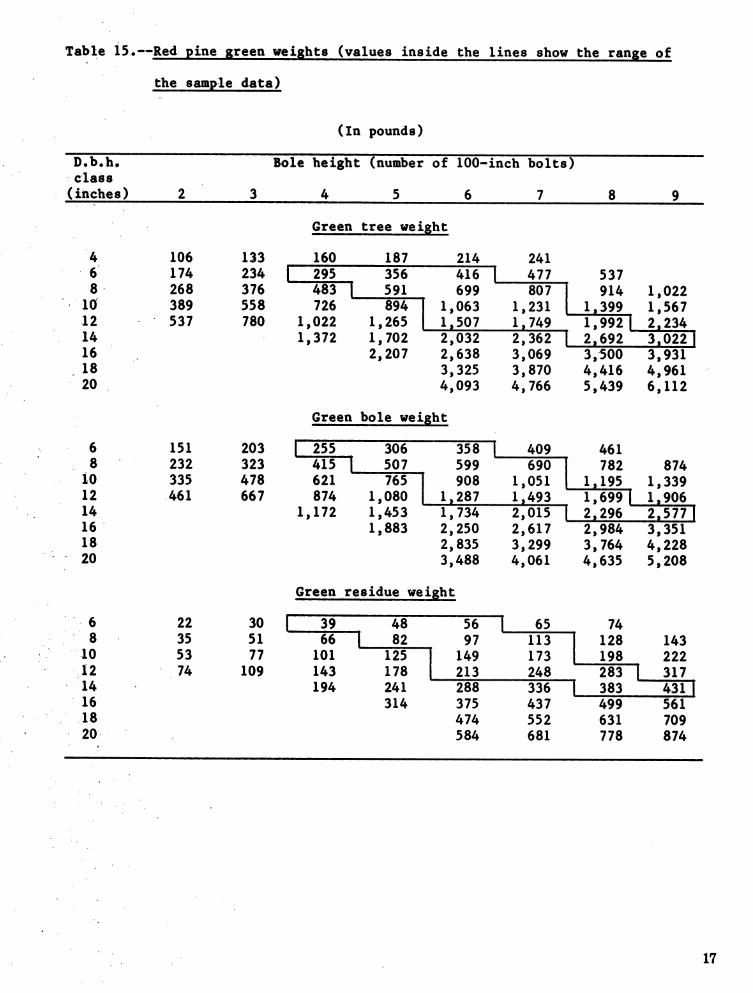
Table is.--Red, pine, green weights (values.,,!nside the lines show the range of
the sample data) ]
I!
(In pounds) Il
'D.b.h. ' Bole height (number of 100-incl_ bolts) i!class
( inches ) 2 3 4 5 6 7 8 9,, ,, , , •.,
I Green tree weight4. 106 133 160 1876 174 234 | 295 356 416 I 477 537I
8 _ 268 376 483 [ 591 699 807 I 914 1,022[ _ 10 389 558 726 894 I 1,063 1,231 ! 1,399 1,567 '
•12 537 780 1,022 1,265 I 1_507 1_749 1,9921 2,23414 1,372 1,702 2,032 2,362 I 2,692 3_022 116 .. 2,207 2,638 3,069 3,500 3,93118 3,325 3,870 4,416 4,961 "20 4,093 4,766 5,439 6,112
Green bole weisht
• 6 151 203 i, 255 306 358 | 409 4618 232 323 415 I 507 599 690 I 782 874
i0 335 478 621 '765 ] 908 1,051 I 1,195 1,33912 .461 667 874 1,080 I 1,287 .1_493 1,699_ 1,90614 1,172 1,453 1,734 2,015 [ 2,296 . 2_577 [16 " 1,883 2,250 2,617 2,984 3,35118. 2,835 3,299 3,764 4,228
• 20 3,488 4, 061 4,635 5,208
Green residue weisht
6 22 30 [ 39 "48 56 | 65 748 _ 35 51 66 _ 82 97 113 [ 128 143
._ , _ '10 53 77 101 125 149 173 [ 198 222. i2 74 109 143 178 213 248 '283 / 317
, _ 14 194 241 288 336 I 383 431 I16 314 375 437 499 561,18 474 552 631 709
' -20, 584 681 778 874
, , , ,,,
I
17
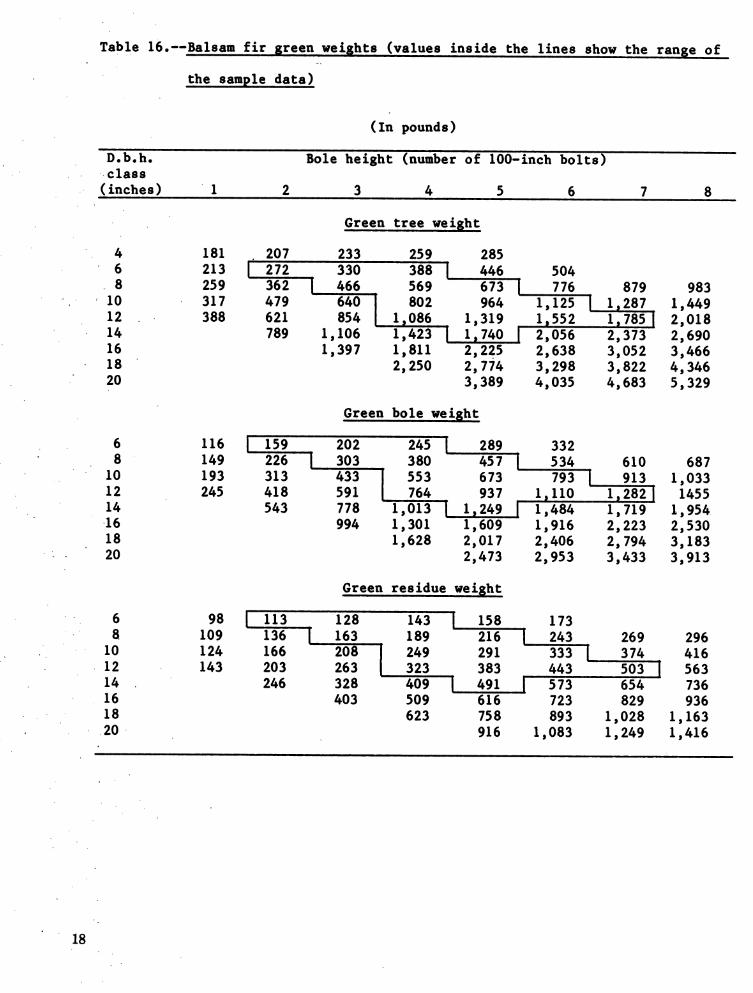
Table 16.--Balsam fir green weights (values inside the.lines show the range of
the sampIe data),
(In pounds)
D.b.h.' Bole height (number of 100-inch bolts)class( inches ) I 2 3 4 5 6 7 8
.,
Green tree weight
4 181 207 233 259 285
6 213 [_ 272 330 388 [. 446 504. 8 259 362 [ 466 569 673 [ 776 879 983
' 10 317 479 640 ] 802 964 1,125 [ 1,287 1,44912 388 621 854 [ 1_086 1,319 _ 1,552 1_785 [ 2,01814 789 1,106 1,423 I 1,740 [ 2,056 2,373 2,69016 1,397 1,811 2,225 2,638 3,052 3,46618 2,250 2,774 3,298 3,822 4,34620 3,389 4,035 4,683 5,329
Green bole weight
6 116 [" 159 " 202 245"] 289 332' 8 149 226' i 303 380 457 l 534 610 687
10 193 313 433 [ 553 673 793 [ 913 1,03312 245 418 591 [ 764 937 1,110 , 1,282 [ 145514 543 778 1,013 I 1,249_[_ 1,484 1,719 1,954-16 994 1,301 1,609 1,916 2,223 2,53018 I,628 2,Ol7 2,406 2,794 3,183
- . 20 2,473 2,953 3,433 3,913
Green residue weight
6 98 [ 113 .....128 143 l 158 1738 109 136 -| 163 189 216 '[ 243 269 296
I0 124 166 208 249 291 333 l 374 416
12 143 203 263 323 383 443 5o3[ 56314 246 328 409[ 491[ 573 654 73616 403 509 616 723 829 936
18 623 758 893 1,028 1,163, 20 916 I,083 I,249 I,416
,,, =, .... ,
18
18-

19

20 "
1
21

22
28
24

26
2?
#

I
' I

r iI

Hahn, Jerold T; Stelman, Joan M.Empirical yield tables for Michigan. Gen. Tech. Rep. NC-96. St. Paul,
MN: U.S. Department of Agriculture, Forest Service, North CentralForest Experiment Station; 1984. 33 p.
Describes the tables derived from the 1980 Forest Survey ofMichigan and presents ways the tables can be used. These tables arebroken down according to Michigan's four Forest Survey Units, 14forest types, and 5 site-index classes.
L
KEY WORDS: Inventory, volume, growth.
°
°
°/
°