t o o l s f o r - houston iso 9000 | performance and
TRANSCRIPT

continue to Tool 6 - Root Cause Analysis...
T O O L S F O R
brought to you by Frontline Resources, Inc.
The purpose for Risk Management is to have a plan to IDENTIFY and RESPOND to the types of risks – not try to figure out every last possible individual risk.
Risk Management helps you AVOID failures as well as take advantage of positive OPPORTUNITIES.
Utilizing Risk Management tools will provide a systematic approach to the early IDENTIFICATION and MANAGEMENT of risks.
This increases the likelihood of achieving your strategic and business objectives and increases the protection of your most important assets – human, property and reputation.
Frontline Resources, Inc:Our philosophy is to help the clients create a user-friendly quality system which is usable by top management as well as the frontline employees. We strive to help the client company refine a system that adds value without adding unnecessary documentation.
Contact John F. Graham at Frontline Resources, Inc. for more information - we look forward to working with you.
713-266-96075773 Woodway Suite 1241 ~ Houston, Texas 77057
Risk Management for ISO 9001:2015

1. Gather a small team familiar with the failure that has occurred and also
familiar with the working environment. Have the team gather as much
background information as possible on the failure and the surrounding system,
history, etc.
2. Review the problem and clearly define the problem.
• Talk about it, without diving into the reasons that it happened.
• Clearly define what happened, when it happened
• Clearly define the surrounding operation conditions, who was involved,
where exactly did it occur and how the failure progressed.
3. Use one of the TOOLS on the following pages to perform the analysis as a
team. One member should act as the facilitator, documenting the discussion up
front on a white board and/or flip chart.
4. Develop solutions based on the analysis.
5. Define and document actions items to remove the root cause.
6. Submit your recommendations to top management.
7. Once the action items are implemented, monitor the solution for
effectiveness.
T O O L S F O R
brought to you by Frontline Resources, Inc.
Root Cause Analysis6
Frontline Resources, Inc. 713-266-9607 • 5773 Woodway, Suite 1241 • Houston, Texas 77057
This method is used after the event has occurred.
Getting to the root of a problem of an event is the reason for using this method. Once you drill down and uncover the real reason(s) why an event has occurred or why a problem persists, the cause can now be removed.
Root Cause Analysis can be applied to single events like a safety mishap, a machine failure, a product failure, a process failure, overall system failure, etc.
This is really not one tool, but more of a concept using different possible tools. There are 2 and 3-day training programs available on the market for Root Cause Analysis. We are going to take the 80/20 approach to the concept and just cover the small number of tool used the majority of the time. These tools can lead to a high degree of effectiveness.
continued...

T O O L S F O R
brought to you by Frontline Resources, Inc.
Root Cause Analysis6...continued
continued...
Frontline Resources, Inc. 713-266-9607 • 5773 Woodway, Suite 1241 • Houston, Texas 77057
5 W – 2 H
Have the group go through the following questions and capture the answers at
the front of the room. Then the group is to refine the answer into one concise
problem.
1. What: What exactly happened
2. Who: Who was involved? Who was not?
3. When: When exactly did the event occur?
4. Where: Where did the event occur? If it happened off site, get evidence
to support the details.
5. Why: What do we already know as to why the event occurred?
1. How: What was the situation? What were the operation conditions?
What was the environment (such as raining)? etc.
2. How many: How many people, how many units, how many locations,
how many vehicles, etc.? Collect all relevant numbers possible.
Using all the above information, have the group clearly summarize the
PROBLEM. And remember, one member should act as the facilitator,
documenting the discussion up front on a white board and/or flip chart to reach
a WELL-DEFINED PROBLEM.
This tool is for defining the problem. Once the problem is defined, move on to
the 5 Why or Fishbone Method below.

T O O L S F O R
brought to you by Frontline Resources, Inc.
Root Cause Analysis6
Frontline Resources, Inc. 713-266-9607 • 5773 Woodway, Suite 1241 • Houston, Texas 77057
continued...
...continued
5 Whys
1. Using the “Well-Defined Problem”, ask “Why did it happen?”
(ex: why did the trailer mounted generator break down?)
Capture and list the answers in the front of the room.
With the help of the group, summarize the answer.
(ex: because it has not been serviced)
2. Then ask “Why did this happen?”
(ex: why was it not serviced?)
3. Then ask why again.
(ex: because the mobile generators have not been included in the
Preventive Maintenance Program)
4. Then ask why again.
5. Continue to ask why until the group is in consensus as to exactly what is
the real root cause of the problem.
The 5 Whys is an repetitive question asking technique that is used to explore
the cause-and-effect relationships underlying a particular problem. The
primary goal is to determine the root cause of a problem.

T O O L S F O R
brought to you by Frontline Resources, Inc.
Root Cause Analysis6
Frontline Resources, Inc. 713-266-9607 • 5773 Woodway, Suite 1241 • Houston, Texas 77057
continue to Fish Bone Diagram...
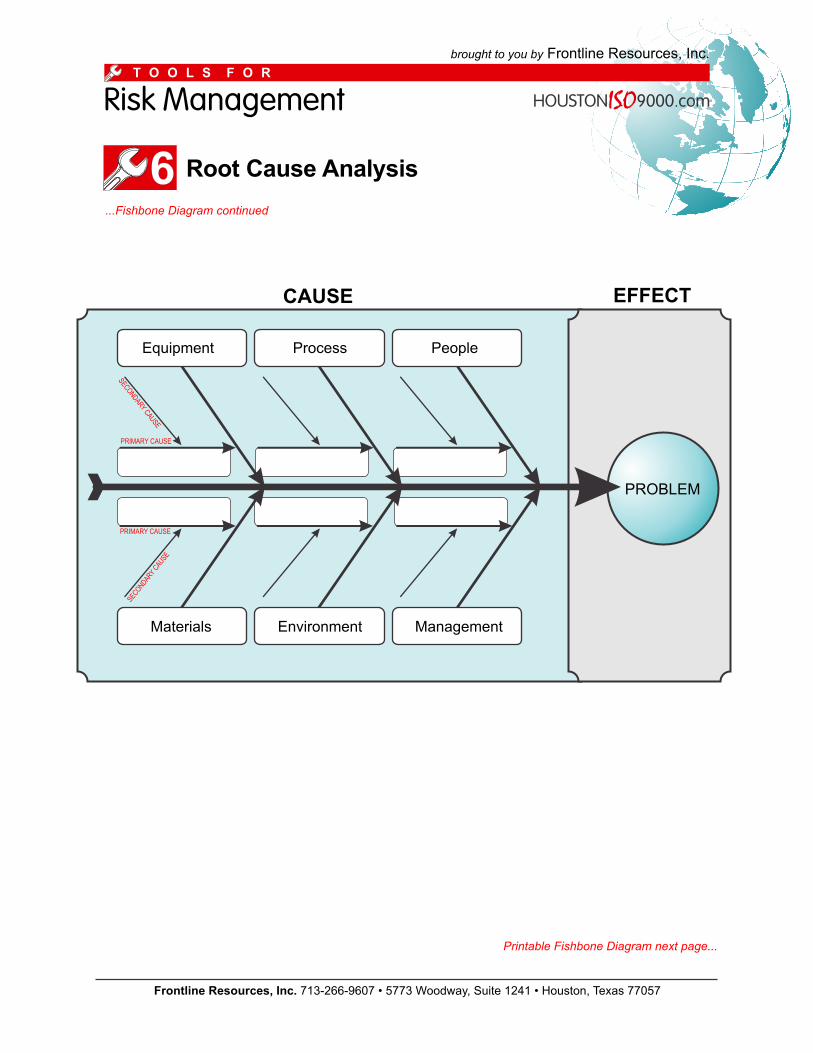
...Fishbone Diagram continued
Fish Bone Diagram (also called Cause and Effect or Ishikawa Diagram)
1. Have a member of the team act as the moderator/facilitator for the group.
His/her job is to work up front and capture the ideas on the white board and/or
flip chart.
2. Using the below diagram or one similar (the Title Causes can be changed to
fit the need), have the group clearly define the Problem and write it on the right
side of the diagram.
3. Start with one of the Title Causes on the left (PEOPLE or MANPOWER) and
list all possible causes related to the people involved in the work on the
diagram under People. The primary causes come off of the main branch line
(such as lack of Training) and secondary causes come off of each main cause
(ex: from Training we branch further and list Safety Training, Computer Training,
Machine Operations Training, etc.). Continue in this manner until all the items of
possible cause are listed by the group under PEOPLE.
4. Now move on to the next Title Cause and repeat the process.
5. Continue until all the Title Causes are completed.
6. Then ask the group “Did we miss anything?” Listen carefully and capture
any additional ideas.
7. Continue this overall exercise using the diagram until the root cause(s) are
all captured and it is clear why the problem happened.
Ishikawa diagram, in fishbone shape, showing factors of Equipment, Process,
People, Materials, Environment and Management, all affecting the overall problem.
Smaller arrows connect the sub-causes to major causes.
T O O L S F O R
brought to you by Frontline Resources, Inc.
Root Cause Analysis6
Frontline Resources, Inc. 713-266-9607 • 5773 Woodway, Suite 1241 • Houston, Texas 77057
...Fishbone Diagram continued
Printable Fishbone Diagram next page...
PROBLEM
PRIMARY CAUSE
PRIMARY CAUSE
SECONDARY CAUSE
SECONDARY CAUSE
CAUSE EFFECT
Equipment Process People
Materials Environment Management

TO
OL
S
FO
R
Fro
ntl
ine R
eso
urc
es,
Inc. 713-2
66
-96
07
• 5
77
3 W
oo
dw
ay,
Su
ite 1
24
1 •
Ho
ust
on
, Te
xas
77
05
7
Fis
h B
on
e D
iag
ram
PR
OB
LE
M
CA
US
EE
FF
EC
T
Eq
uip
me
nt
Pro
cess
Pe
op
le
Ma
teria
lsE
nvi
ron
me
nt
Ma
na
ge
me
nt