systems engineering and assurance modeling (seam): a …
TRANSCRIPT

FACTA UNIVERSITATIS
Series: Electronics and Energetics Vol. 34, No 1, March 2021, pp. 1-20
https://doi.org/10.2298/FUEE2101001R
© 2021 by University of Niš, Serbia | Creative Commons License: CC BY-NC-ND
Review paper
SYSTEMS ENGINEERING AND ASSURANCE MODELING
(SEAM): A WEB-BASED SOLUTION FOR INTEGRATED
MISSION ASSURANCE
Kaitlyn L. Ryder1, Ryan Alles2, Gabor Karsai1,
Nagabhushan Mahadevan1, John W. Evans3, Arthur F. Witulski1,
Michael J. Campola4, Rebekah A. Austin4, Ronald D. Schrimpf1
1Vanderbilt University, Department of Electrical Engineering and Computer Science,
Nashville, Tennessee, United States of America 2Aerospace Engineering, Auburn University, Auburn, Alabama,
United States of America 3National Aeronautics and Space Administration, Headquarters, Washington D. C.,
United States of America 4National Aeronautics and Space Administration, Goddard Space Flight Center,
Greenbelt, Maryland, United States of America
Abstract. We present an overview of the Systems Engineering and Assurance Modeling
(SEAM) platform, a web-browser-based tool which is designed to help engineers
evaluate the radiation vulnerabilities and develop an assurance approach for electronic
parts in space systems. The SEAM framework consists of three interconnected modeling
tools, a SysML compatible system description tool, a Goal Structuring Notation (GSN)
visual argument tool, and Bayesian Net and Fault Tree extraction and export tools. The
SysML and GSN sections also have a coverage check application that ensures that every
radiation fault identified on the SysML side is also addressed in the assurance case in
GSN. The SEAM platform works on space systems of any degree of radiation hardness
but is especially helpful for assessing radiation performance in systems with commercial-
off-the-shelf (COTS) electronic components.
Key words: SEAM, radiation assurance, COTS, radiation hardness, radiation reliability
Received October 20, 2020
Corresponding author: John W Evans NASA Headquarters, 300 E. Street SW, Suite 5R30, Washington, DC 20546, USA
E-mail: [email protected]

2 K. L. RYDER, R. ALLES, G. KARSAI, ET AL.
1. INTRODUCTION
The advent of the small spacecraft or CubeSat has enabled much greater access to space
at relatively low cost. CubeSats can be rapidly assembled from a variety of available
commercial off the shelf electronic (COTS) subsystems to fulfill spacecraft functions, from
sensors to command and data handling. Clearly CubeSats or similar space systems with
majority COTS parts require a new paradigm for mission assurance of the system that is
compatible to cost, schedule, and development constraints of the “small” mission.
Radiation assurance is of prime concern and depending on the mission requirements, the
impact of single event effects (SEE), total ionizing dose (TID), and displacement damage
dose (DDD) must be considered. While radiation testing is ever important, assurance
models can be of significant value to CubeSat development in providing for mission
success. In this regard, the Systems Engineering and Assurance Modeling (SEAM)
platform1 has been developed and deployed in a collaborative NASA -University project.
The benefits of Systems Engineering for small spacecraft, even at the fundamental level
of capability, are well documented by INCOSE [1]. Systems Modeling Language (SysML)
starter models for CubeSats are available and in use [2, 3]. Further, standards for these
models are emerging [4]. In addition, we can see the benefits of building assurance models
as SysML has continued to increasing usage [5, 6]. Assurance models focused on failure
mitigation are needed to complement Systems Engineering models to improve success
rates, as many CubeSat missions have failed.
An assurance platform for small missions presents several challenges unique to the
modeling environment. As indicated, the platform must be able to provide rapid analysis results
compatible with the CubeSat development environment and workstyle. Furthermore, the tool
must have low barriers to entry, both in terms of cost and usability. Other desirable features
include standard graphical representations with well-defined visual syntax, embedded guidance
focused on assurance, a collaborative web-based implementation, flexibility in modeling, and
interoperability with other platforms. For these reasons, WebGME2: a web--based environment
for creating domain-specific modeling tools, emerged as an excellent foundation for
implementing SEAM and for evaluating concepts for Model Based Assurance for small
missions. However, the graphical constructs presented herein as a part of SEAM are generic
and not necessarily exclusive to any implementation framework. Currently, a free version of
SEAM is maintained at modelbasedassurance.org.
The modeling and analysis platform encompasses the necessary components for an easy-
to-use, flexible, mission assurance tool. Models constructed using the platform represent the
subject system from various aspects. Each modeling aspect is subsequently described in terms
of its graphical constructs that represent concepts of a small mission assurance framework. This
is followed by descriptions of the use and deployment of the platform, focusing on radiation
assurance, and already successfully demonstrated capabilities of SEAM.
1 https://modelbasedassurance.org/ 2 https://webgme.org/

Systems Engineering and Assurance Modeling (Seam) 3
2. THE GRAPHICAL CONSTRUCTS OF SEAM
SEAM has several key components built around several modeling aspects and assurance
flexibility that can be linked or used independently depending on user preferences. The SEAM
approach encompasses:
▪ SysML internal block diagrams to represent the system architecture models, extended
with fault propagation, with limited SysML import capability
▪ Functional decomposition models that relate system functions to individual
components, which allow for the generation of reliability representations of the
system including Bayesian Nets (BN) and auto generated fault trees exportable to
other applications
▪ Goal Structuring Notation (GSN) Assurance Case models that support NASA Standard
8729.1A
▪ Tools for exporting Bayesian net topologies and fault trees showing the probable impact
of radiation on system performance in standard formats.
SEAM allows for these models to be incorporated into a single project. Fig. 1 shows
the top-level view of a SEAM project that contains all the models. On the left of the Fig.
are reference materials including a GSN model of NASA’s R&M Objectives Hierarchy
[7], templates for a requirements model, system level definitions including fault labels,
links to useful external apps, and a project-specific library of components. These reference
materials can make modeling in SEAM more user-friendly. In the center of Fig. 1 are the
links to the different models: GSN, functional decomposition model, and SysML models.
Each model exists independently of the others, though SEAM does allow for the models to
be linked if desired.
Fig. 1 Top level of a project folder. Contains the NASA R&M Standards, project definitions,
relevant external applications, the project family library, functional decomposition
model, system model and the GSN assurance model.

4 K. L. RYDER, R. ALLES, G. KARSAI, ET AL.
SysML and Assurance Extensions for SEAM
SysML is widely used as a descriptive language for capturing the structure and
dependencies of complex systems, consisting of a set of canonical diagrams that capture the
system behavior. In SEAM, the SysML block diagram describes the architectural structure
of a system. It focuses on the flow of power and data through a system instead of precise
electrical connections. Fig. 2 shows a SysML diagram of a generic embedded system
comprised of four subsystems: Power, sensor S1, microcontroller M1, and Output. Power
connections are shown in black, and data connections are shown in green. The purpose of the
system is to respond to an environmental stimulus and to change its state accordingly. Each
block, or subsystem, can be as specific or abstract, as necessary. For example, the Power
subsystem in this example is a higher level of abstraction and is comprised of a battery and
three voltage regulators (shown in the lower part of Fig. 2). Sensor S1, on the other hand, is
the lowest level of abstraction for that subsystem and represents a single component.
Fig. 2 (Top) SysML block diagram of a generic embedded system that uses a sensor to
determine the next state of the system. Each block represents an abstraction of a
subsystem: Sensor subsystem (S1), Microcontroller subsystem (MC1), Output
subsystem, and Power subsystem. (Bottom) Lower level abstraction of the Power
subsystem.
Systems Engineering and Assurance Modeling (Seam) 5
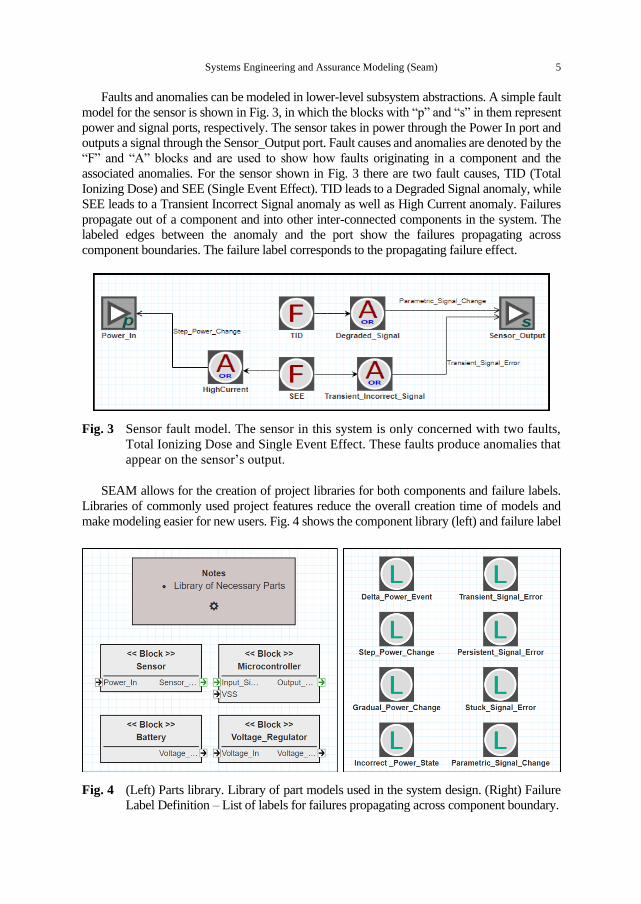
Faults and anomalies can be modeled in lower-level subsystem abstractions. A simple fault
model for the sensor is shown in Fig. 3, in which the blocks with “p” and “s” in them represent
power and signal ports, respectively. The sensor takes in power through the Power In port and
outputs a signal through the Sensor_Output port. Fault causes and anomalies are denoted by the
“F” and “A” blocks and are used to show how faults originating in a component and the
associated anomalies. For the sensor shown in Fig. 3 there are two fault causes, TID (Total
Ionizing Dose) and SEE (Single Event Effect). TID leads to a Degraded Signal anomaly, while
SEE leads to a Transient Incorrect Signal anomaly as well as High Current anomaly. Failures
propagate out of a component and into other inter-connected components in the system. The
labeled edges between the anomaly and the port show the failures propagating across
component boundaries. The failure label corresponds to the propagating failure effect.
Fig. 3 Sensor fault model. The sensor in this system is only concerned with two faults,
Total Ionizing Dose and Single Event Effect. These faults produce anomalies that
appear on the sensor’s output.
SEAM allows for the creation of project libraries for both components and failure labels.
Libraries of commonly used project features reduce the overall creation time of models and
make modeling easier for new users. Fig. 4 shows the component library (left) and failure label
Fig. 4 (Left) Parts library. Library of part models used in the system design. (Right) Failure
Label Definition – List of labels for failures propagating across component boundary.

6 K. L. RYDER, R. ALLES, G. KARSAI, ET AL.
definitions for this example project. Four (4) components were identified as likely to be used
multiple times in this system and were created as library templates. Whenever one of these
components is used in the SysML model, an instance of that template is created. If changes need
to be made to all the instances of a component, the template in the library can be modified and
all instances will be updated. This makes it easy to update the models as components change.
Failure labels are all defined in the project definitions to be used throughout the SysML model.
For this example, a small number of generic failure labels were created to standardize the
language used throughout the SysML model.
Functional Decomposition Model
Another diagram incorporated in SEAM that is not present in the standard SysML
diagram set is the Functional Decomposition Model (FDM) shown in Fig. 5. A system
may have many functions. Functions are specific descriptions of system capability
established by requirements or specifications. The functions serve as a key abstraction level
for assessing reliability, availability, and safety of a system. In the FDM, functions (upper
case F) are associated with sub-functions (lower case f), which in turn are associated with
specific instances of components that support the sub-function. In Fig. 5, only one
component is associated with each sub-function, in practice each sub-function can be
associated with many component instances. The FDM is a hierarchical assignment of
responsibility for the accomplishment of a function to sub-functions and components.
Fig. 5 Functional Decomposition Model. The top-level function is supported by five
primitive functions each of which is related to a component/ subsystem that
implements it.
As shown in Fig. 5 for a typical embedded system, the sub-functions nearly always involve
power, probing the environment (sensing), calculating the system condition and response to the
environment according to algorithms built into system software (computation), and constructing
a response to the environment (actuation). Other typical embedded functions are user input and
output, and remote communication, which could be added to this diagram, as necessary. In a
space radiation environment, another typical subfunction would be mitigation of radiation
effects, which assigns responsibility for mitigation measures to components such as voltage
regulators or load switches to avoid single event latch up.
The FDM creates a network or topology of the system correlation of system functions
with component-level functionality.

Systems Engineering and Assurance Modeling (Seam) 7
GSN Assurance Case
Goal Structuring Notation (GSN) assurance cases are used to document and develop
assurance cases and can be developed in parallel with the SysML and Functional
Decomposition models within the SEAM tool. References to the GSN Community Standard
and NASA Std 8719.1A are provided within SEAM, and the NASA R&M Objectives
Hierarchy (from NASA Std 8719.1A) is provided in GSN format for reference. More detail on
the use of GSN are given in [8] and [9]. Fig. 6 shows the top-level view of the R&M Objectives
Hierarchy, which provides a guide for developing GSN assurance cases and can be used as a
starting point for users to develop their own GSN assurance cases.
Fig. 6 A hierarchical view of the NASA R&M Objectives Hierarchy.
A simplified GSN assurance case for the generalized embedded system example is
shown in Fig. 7. In this figure, The GSN nodes within red boxes come directly from the NASA
R&M Hierarchy and were used as starting points for development of the more specific
assurance case being made here. In this incomplete GSN assurance case, the argument for Goal
2.2 has been completed while the other subgoals are still in development. Goal 2.2 applies to
the Sensor Subsystem, and requires that the subsystem be tolerant to faults, failures, and
other anomalous internal and external events. The strategy for meeting this goal, from the
NASA R&M Hierarchy, is to prevent faults and failures or to provide mitigation for the
faults and failures. Two subgoals were identified to meet this strategy, both related to the
known radiation effects possible in the sensor. The solutions (or evidence to support) Goal
2.2.1 and 2.2.2, total ionizing dose (TID) degradation and single event effects (SEE) errors,
respectively, are found through radiation testing of the sensor. TID is found to not be a
concern for the mission requirements in this project and SEEs are to be mitigated by the
Microcontroller subsystem, which could involve another goal/strategy argument chain.

8 K. L. RYDER, R. ALLES, G. KARSAI, ET AL.
Both solutions are specific to this mission and if the requirements were to change, they
would need to be reevaluated.
Fig. 7 GSN Assurance Model: A simplified GSN assurance argument model where the boxes
in red indicate generic goals/ strategies advocated by NASA R&M standards. The other
GSN nodes correspond to the specific system and its parts.
System Reliability Models
The integrated models in SEAM – the functional decomposition model, the system
architecture model, and the underlying fault propagation model – can be translated into
computational models that are part of the system reliability study. Currently SEAM models
have been translated into fault tree models and Bayesian network models.

Systems Engineering and Assurance Modeling (Seam) 9
Fault tree models
Fault trees [10] are graphical models that represent how low-level events, like
component faults, combine and propagate to high-level events (like system-wide failures).
The combination of the low–level events is expressed using an AND/OR tree-like structure.
The extraction of fault trees, as well as other reliability artifacts, from SysML has been
demonstrated as viable means of rapidly building reliability models [11, 12].
In this tree primary events are the leaves, intermediate nodes are either logical
combinators (disjunctive or conjunctive) or intermediate (e.g. sub-system level) events,
and the top (root) node of the tree is the system level event. The arrows connecting the
nodes (from leaves towards the root) indicate causation or enablement. The AND/OR
operators operate on probabilities of events assigned by the modeler. Fault-trees allow not
only the review and logical analysis of how local faults combine and lead to system-level
events, but also the calculation of the probability of those events as a function of the
probabilities of the low-level events. Thus, they are very useful tools for evaluating the
reliability of the system, and in design. For the latter, when the designer changes the system
(e.g. by introducing redundancy), the fault tree can help the quantitative evaluation of how
the reliability improves (or degrades).
Fault Tree Generation
The SEAM tool set includes generators that convert the SEAM model into a fault tree
model. Initially, the fault tree is generated from the functional decomposition model. Each
function is translated into a “Lost Function” intermediate or top event in the fault tree. The AND
(OR) nodes in the fault tree correspond to the OR(AND) nodes in the functional decomposition
model. A basic event-Lost Component (LC)-is introduced for each component node at the
bottom of the functional decomposition model. The fault tree generated from the functional
decomposition model is refined based on the system model and the underlying fault propagation
model. Components with failure modes are converted to intermediate events and a basic event
corresponding to each failure mode is added.
The fault model is traversed starting from each of the failure modes. For each anomaly
(AND/ OR) encountered in the path, a corresponding logic gate (AND/OR) is added to the
fault tree. For each effect node encountered in the path, a corresponding logic relationship
between the fault event and the lost function event is added to the fault tree (if it is not already
present). For each response/ mitigation node encountered in the path, the fault tree is modified
so that the failure mode event is blocked until the mitigation function is lost. Finally, the fault
tree is simplified by eliminating logic gates that are redundant and unnecessary.
Fig. 8 shows the fault tree generated from the Functional Decomposition Model
(Fig. 5), the System Model (Fig. 2) and the underlying fault propagation model [13]. The
top and intermediate level nodes colored in blue represent the events corresponding to the
“Lost Function” (LF). The nodes in brown represent the events that correspond to the “Lost
Component” (LC). Certain LC nodes are basic event (terminated with a circle) as the
component models do not include any failure modes (e.g. LC_Power, LC_Output etc.).
Other LC nodes are intermediate events as they are followed by basic events corresponding
to the failure modes (nodes in red).
When the fault propagation is arrested by a mitigation/ response function, the generated
fault tree is modified. The failure mode events (FM_S1_SEE, FM_MC1_SEL) do not lead

10 K. L. RYDER, R. ALLES, G. KARSAI, ET AL.
to higher level events in the fault tree unless the mitigation function is lost (and the node
with LF_Mitigation).
The generated fault tree is output as an xml file in Open-PSA model exchange format
so the fault tree can be evaluated in any FT evaluation platform. For example, the
open-source SCRAM fault tree analysis engine can load the generated fault tree model to
identify minimum cut sets, as well as risk analysis based on fault probabilities which could
be used as evidences in the GSN assurance case models.
Fig. 8 Fault Tree generated by SEAM based on the functional decomposition model,
system model and the underlying fault propagation model. Boxes represent top-
event or intermediate event in the fault tree. Boxes with a circle below represent
the basic event. Loss of Function (LF) events are in blue, Loss of component (LC)
events are in brown and Failure mode events are in red. Triangle represents the
loss of mitigation function.
Bayesian Nets
Bayesian (Belief) Networks (BN) are a graphical formalism for representing and
implementing probabilistic inference networks [14, 15]. Bayesian nets are directed acyclic
graphs, with 3 types of nodes: nodes without inputs (‘leaves’), nodes without outputs (‘top’),
and nodes with both inputs and outputs (‘intermediate nodes’). Each node represents a random
(probabilistic) variable in a system. Leaf nodes can be assigned a ‘prior’ probability value for
each possible value of the random variable. An intermediate or ‘top’ node can be assigned a
table of conditional probability values that determine the probability distribution for the value
of that node as a function of the probability of the nodes attached to the incoming edges. The

Systems Engineering and Assurance Modeling (Seam) 11
BN performs probabilistic inference: it propagates the probability values of the leaves to the
intermediate and then to the ‘top’ node. Note that BN-s allow quite complex probabilistic
relationships, more than what one can do with the AND/OR nodes of fault trees. Note also, that
the nodes (i.e. variables) can take values from a discrete set or a continuous (but finite) set.
Bayesian Net Generation
The SEAM models can be used as the basis for creating the structure of the Bayesian
Network (BN) models. Fig. 9 shows the structure of the BN model corresponding to the
system architecture in Fig. 2 and the functional decomposition model in Fig. 5.
The root (leaf) nodes of the Bayesian network model would correspond to the mission
variables such as Mission Time and Single Event Environment in Fig. 9. These mission
nodes determine the strength of environment effects. In Fig. 9, the environment effect
nodes correspond to Total Ionizing Dosage (TID), Single Event Upset (SEU) and Single
Event Latch up (SEL).
Fig. 9 Bayesian Network model based on the SEAM model for the embedded system example.

12 K. L. RYDER, R. ALLES, G. KARSAI, ET AL.
The next set of nodes in the BN models correspond to the health of the components. In
Fig. 9, S1_Health and MC1_Health correspond to the health of the sensor component (S1)
and the microprocessor (MC1). The health of the components is affected by the
environment effects.
Component health affects the performance of the components, which is indicated by
the quality of the functions provided by the components. So, the next layer in the BN
corresponds to the functions provided by the component. In Fig. 9, these correspond to the
nodes –Probe_Env and Calculate_Response. The quality of the lower level functions
affects the quality of the higher-level functions and hence the overall system performance
(BN Node System_Function in Fig. 9).
Additionally, the fault propagation model introduces additional edges between the
component health and the quality of the functions. This is because the quality of a function
is not just governed by the health of the component responsible for delivering the function,
but also the health of other inter-connected components. In the case of Fig. 9, the
Calculate_Response function is not only affected by the health of the component providing
the function (MC1), but also the health of component S1.
The BN model could help in understanding the reliability of the system function, given
the current status of the mission variables. It could be useful to study the sensitivity of the
goodness of the functions to the health of the individual components.
3. STRUCTURE AND COVERAGE CHECKS
The integrated modeling environment in SEAM allows cross-referencing of the
elements in the
▪ System Architecture Model
▪ Functional Decomposition Model
▪ GSN Assurance model.
This cross referencing allows users to relate parts of the GSN assurance arguments
(Goals, Strategies, and Solutions) to the relevant components in the system model, the
functionality provided by the component and any radiation-induced faults associated with
the component [16].
To aid in this effort, the SEAM toolset performs a coverage check which informs the user
through simple spreadsheet-like tables the coverage from different perspectives. While this
is useful even in the context of a simple system presented here, it is particularly useful as the
system scales up and the assurance argument needs to account for the increasing number of
components, their inter-dependence in terms of functionality provided and failures propagated.
The results of a coverage check are presented as a set of tables. These include:
▪ Parts List: This table includes hyperlinks to each of the part type models in the parts
library that is associated with the current system model. The hyperlinks allow the
user to navigate to the part model and its internal fault model. Fig. 10 shows the list
of parts associated with the system in Fig. 2 and parts library in Fig. 4.
▪ Instance List: This table presents the component instances in the system architecture
model. For each component instance (row), it shows the corresponding part from the
part library. Fig. 11 shows the instance list as part of the coverage check. As shown

Systems Engineering and Assurance Modeling (Seam) 13
in this table, it is possible that the multiple instances of the same part (Voltage
Regulator) are used in the system.
Fig. 10 Coverage check – Parts list. Each row corresponds to a part model in the parts library.
Fig. 11 Coverage check - Instance list. Each row corresponds to a component instance in
the system model and its associated part in the part library.
▪ Function Coverage: This list presents a summary of the functional decomposition model. For each function, it lists the implementing component(s) in the system model. Functions that do not have a corresponding implementation component in the system are appropriately flagged. This informs the user that either the functionality is not implemented in the system or the relationships have not been captured in the functional decomposition model. Fig. 12 shows the function coverage table generated as part of coverage check for the function decomposition model (Fig. 5) and the system (Fig. 2)

14 K. L. RYDER, R. ALLES, G. KARSAI, ET AL.
Fig. 12 Coverage check – Function Coverage - Each row corresponds to a function in the
function decomposition model and the component (part) in the system design that
implements the function.
▪ Component Coverage: This table maps component instances in the system model
to the appropriate function(s) in the functional decomposition model. It is likely
that component instances of the same part support different functions in the system.
Entries that are not related to any function are appropriately flagged.
▪ GSN Coverage: This table presents the coverage of the assurance argument in the
GSN model relative to the components in the system. The table lists the GSN goals
and solutions for the assurance argument related to each component instance in the
system. It further identifies the specific GSN goals related to each of the underlying
component faults, each functional degradation effect that the fault propagates to and
each mitigation strategy associated with the fault propagation.
Fig. 13 shows an example GSN coverage table generated as part of the coverage check. The first column corresponds to the component instance; the next column corresponds to any fault originating from within the component; this is followed by the effect (E) and the
Fig. 13 Coverage check – GSN Coverage: The table maps the parts in the system design
and their underlying faults to the GSN arguments (goals/ solutions).

Systems Engineering and Assurance Modeling (Seam) 15
mitigation response (R) related to the fault propagation. The links to the GSN arguments are listed in the next column. Entries with no associated GSN arguments are flagged with a red question mark (“?”) symbol.
The next few columns reveal the status of the specific GSN goal (Developed/ In-development), and the result of the argument based on if it meets the specifications or not (yes/ no/ partial). “Information Source” indicates if the argument pertains to the specific component instance or the part it corresponds to. Action column reveals the user decision on the completion status of the argument (completed/needs attention/ ignore). The penultimate column allows for traceability and assignment of individual arguments to persons. The comments column keeps a record of the comments related to the decisions made pertaining to the arguments.
4. INTEGRATING THE MODELS AND SYSTEMS ANALYSIS – STAR TRACKER EXAMPLE
Star trackers are embedded systems of a satellite that gather image data from the surrounding stars to orient the satellite by comparing the real-time image data to a stored star map. Often, a CMOS imaging sensor with a lens is used to gather the real-time data. The data is sent through a Kalman filter to help predict the satellite position. The image is filtered to reduce image noise and the star positions are determined by identifying the centroids of areas of higher light levels. In Fig. 14, the data from the star tracker is processed through the attitude determination and control systems, and then sent to the control components to reorient the satellite [17]. This satellite control system is used as a baseline to translate a real-world embedded system example into SEAM to provide a simple tangible example for the space community. As seen in the block diagram, satellite control systems can be complex, therefore the star tracker subsystem was chosen to create a simplified model.
Fig. 14 Block diagram representing a satellite control system. The path highlighted in red
depicts the path of interest translated into SEAM [18].
Fig. 15 represents the functional decomposition [19] of the star tracker embedded system.
The overall function of the system is to orient the satellite. This is achieved by taking the raw
image data from the CMOS imaging sensor block, represented by the Sensor reference block

16 K. L. RYDER, R. ALLES, G. KARSAI, ET AL.
here. The data is then processed and compared to the stored star map in the Logic block. The
Compare_to_Stored_Data low-level function is broken out from the Process_Image_Data
function because the raw image data needs to have noise filtered out and have high light levels
be identified by software processing before the data can be compared to a stored reference star
map. The position and attitude data are then translated, and the data is converted to signal
commands to be sent to the controls and reoriented using the thrusters and reaction devices.
Fig. 15 SEAM model view of a functional decomposition of a star tracker embedded
system. The top and mid-level functions are represented by blocks with capital
F(x), and the lowest-level functions are represented by the blocks with lowercase
f(x). The topmost function represents the overall goal of the star tracker embedded
system: to orient the satellite.
Fig. 16 shows the model view of the star tracker system, depicting a simple sensor logic
reaction embedded system. The power block feeds power to each of the components using
linear regulators. Power flow is represented by the black paths. The CMOS_Imaging_Sensor
block represents a direct component, while the Logic, Power, and Controls_Actuators blocks
represent subsystems. Data is received from the CMOS sensor, processed in the logic block,
and the reactions are executed with the controls and actuators. Data flow is represented by the
green paths.
Fig. 16 SEAM model view of the star tracker embedded system physical components. Green
paths represent signal flow between components, while black paths represent power
flow between components. Each component has embedded subsystems within its
block.
A large range of faults may occur, and must be considered, when designing and working
with components of a real system. These can be accounted for in the SEAM interface to
determine propagation paths of the faults to consider how their effects may cause faults in
other components. Many components in a system can be affected by physical fault causes.

Systems Engineering and Assurance Modeling (Seam) 17
For example, in the star tracker embedded system, the focusing lens of the CMOS imager
may be knocked out of place and become unfocused due to vibration effects on
launch-vehicle ascent. Another physical fault that affects the imager is represented by a
dirty lens, which may result in bad imaging data. Electronic components are also often
affected by radiation effects such as total ionizing dose (TID). In Fig. 17, the total ionizing
dose fault creates a degraded signal anomaly. The incorrect data then propagates out of the
signal port to the logic block. The incorrect data enters the logic block where it then flows
into the microcontroller depicted in Fig. 18 situated within the logic block.
Fig. 17 SEAM model view of the CMOS Sensor block. Various physical faults and
radiation effects are considered. They are modelled and anomalies caused by the
faults are propagated out to power and signal ports to other system components.
Fig. 18 SEAM Model View of the microcontroller subsystem within the logic block. The
radiation effect, single event latch up, is considered like the case in the CMOS
sensor. Incoming faults from the CMOS image sensor signal port enter the
microcontroller causing levels of data deviance anomalies, which then propagate
out to each of the control systems.

18 K. L. RYDER, R. ALLES, G. KARSAI, ET AL.
The incorrect data propagates into the microcontroller from the input port. This creates a
large data deviation that then propagates out of the respective ports to the Controls_Actuators
subsystem. The fault then enters each of the orientation controls from the respective incoming
signal ports shown in Fig. 19.
Fig. 19 SEAM model view of the Controls and Actuators block. Faults enter from the
incoming signal ports and effect the controls, which then cause the reaction devices
to have degraded reactions. Note that the thrusters are controlled using material
ports instead of signal ports, as thrusters are controlled by hydraulic valves and not
electric signals.
One of the orientation control blocks is depicted in Fig. 20. The incorrect data from the
total ionizing dose radiation effect is evaluated as propagating to either cause an unreadable
signal resulting in no system response or create a large orientation command inaccuracy
resulting in the reaction wheels further disorienting the satellite.
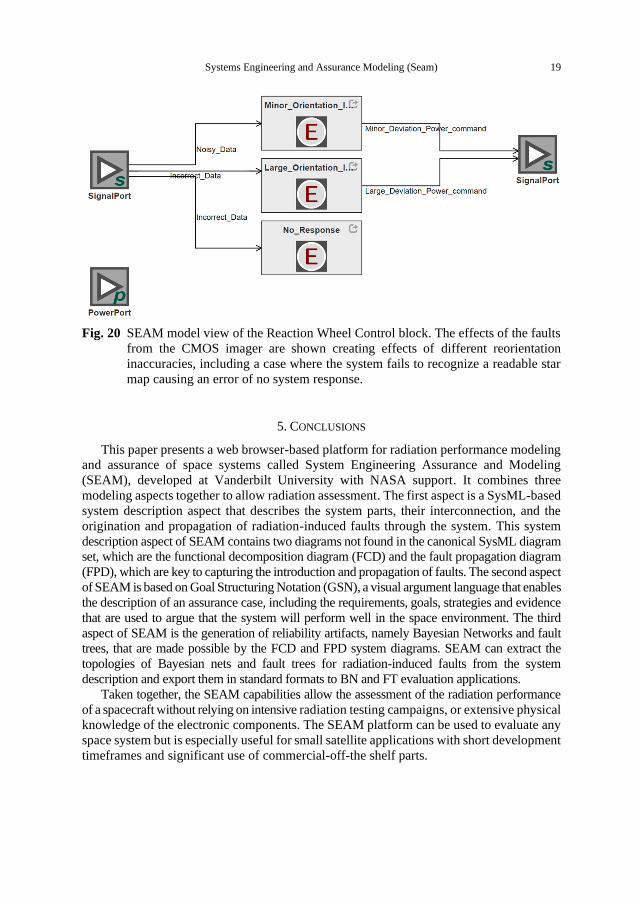
Systems Engineering and Assurance Modeling (Seam) 19
Fig. 20 SEAM model view of the Reaction Wheel Control block. The effects of the faults
from the CMOS imager are shown creating effects of different reorientation
inaccuracies, including a case where the system fails to recognize a readable star
map causing an error of no system response.
5. CONCLUSIONS
This paper presents a web browser-based platform for radiation performance modeling
and assurance of space systems called System Engineering Assurance and Modeling
(SEAM), developed at Vanderbilt University with NASA support. It combines three
modeling aspects together to allow radiation assessment. The first aspect is a SysML-based
system description aspect that describes the system parts, their interconnection, and the
origination and propagation of radiation-induced faults through the system. This system
description aspect of SEAM contains two diagrams not found in the canonical SysML diagram
set, which are the functional decomposition diagram (FCD) and the fault propagation diagram
(FPD), which are key to capturing the introduction and propagation of faults. The second aspect
of SEAM is based on Goal Structuring Notation (GSN), a visual argument language that enables
the description of an assurance case, including the requirements, goals, strategies and evidence
that are used to argue that the system will perform well in the space environment. The third
aspect of SEAM is the generation of reliability artifacts, namely Bayesian Networks and fault
trees, that are made possible by the FCD and FPD system diagrams. SEAM can extract the
topologies of Bayesian nets and fault trees for radiation-induced faults from the system
description and export them in standard formats to BN and FT evaluation applications.
Taken together, the SEAM capabilities allow the assessment of the radiation performance
of a spacecraft without relying on intensive radiation testing campaigns, or extensive physical
knowledge of the electronic components. The SEAM platform can be used to evaluate any
space system but is especially useful for small satellite applications with short development
timeframes and significant use of commercial-off-the shelf parts.

20 K. L. RYDER, R. ALLES, G. KARSAI, ET AL.
Acknowledgement: This work is supported by the NASA Electrical Parts and Packaging Program
(NEPP), contract number 80NSSC20K0424. The authors would also like to express thanks for
support for SEAM development in past years by NEPP, the Jet Propulsion Laboratory and NASA
Office of Safety and Mission Assurance.
REFERENCES
[1] Introduction to Model-based System Engineering and SysML. Document available at: https://www.incose.
org/docs/default-source/delaware-valley/mbse-overview-incose-30-july-2015.pdf.
[2] Architecting Spacecraft with SysML. Document available at: http://sysml-models.com/spacecraft/
models.html. [3] CubeSat Reference Model. Document available at: https://www.omg.org/hot-topics/cube-sat.html.
[4] Object Management Group SysML website, http://www.omgsysml.org/. [5] R. Cressant, P. David, V. Idiasiak and F. Kratz, "Increasing Reliability of Embedded Systems in a SysML
Centered MBSE Process: Application to LEA Project", M-BED 2010, Dresden, Germany, 2010.
[6] F. Mhenni, J-Y. Choley, A. Riviere, N. Nguyen and H. Kadima, "SysML and safety analysis for mechatronic systems", In Proceedings of the 9th France-Japan and 7th Europe-Asia Congress on Mechatronics/13th Int’l
Workshop on on Research and Education in Mechatronics (REM), Paris, France, 2012, pp. 417-424.
[7] F. J. Groen, J. W. Evans and A. J. Hall, "A vision for spaceflight reliability: NASA's objectives-based strategy", In Proceedings of the 2015 Annual Reliability and Maintainability Symposium (RAMS), Palm Harbor, FL, 2015,
pp. 1-6.
[8] R. A. Austin, N. Mahadevan, B. D. Sierawski, G. Karsai, A. F. Witulski and J. Evans, "A CubeSat-payload radiation-reliability assurance case using goal structuring notation", In Proceedings of the 2017 Annual
Reliability and Maintainability Symposium (RAMS), Orlando, FL, 2017, pp. 1–8.
[9] R. Austin, "A Radiation-Reliability Assurance Case Using Goal Structuring Notation for a CubeSat Experiment", M.S. Thesis, Vanderbilt University, 2016.
[10] W. E. Vesely, F. F. Goldberg, N. H. Roberts and D. F. Haasl, Fault tree handbook. No. NUREG-0492.
Nuclear Regulatory Commission, Washington DC, 1981. [11] J. Day, K. Donahue, M. Ingham, A. Kadesch, A. Kennedy and E. Post, "Modeling Off-Nominal Behavior
in SysML", In Proceedings of the AIAA Infotech, Garden Grove, CA, 2012, pp. 1-10.
[12] M. Izygon, H. Wagner, S. Okon, L. Wang, M. Sargusingh and J. Evans, "Facilitating R&M in spaceflight systems with MBSE", In Proceedings of the 2016 Annual Reliability and Maintainability Symposium
(RAMS), Tucson, AZ, 2016, pp. 1-6.
[13] R.A. Austin, N. Mahadevan, G. Karsai, A. Witulski, B. Sierawski, R. Schrimpf, and R.A. Reed, "Automatic Fault Tree Generation from Radiation-Induced Fault Models", In Proceedings of the 2020 Reliability and
Maintainability Symposium (RAMS), Palm Springs, California, 2020, pp. 1-7.
[14] J. Pearl, "Probabilistic reasoning in intelligent systems: networks of plausible inference", Elsevier, 2014. [15] A. H. A. Melani, and G. F. M. de Souz, "Mapping SysML Diagrams into Bayesian Networks: A Systems
Engineering Approach for Fault Diagnosis", ASME J. Risk Uncertainty Part B, vol. 6, no. 3, pp. 031003,
Sep. 2020 [16] A. Witulski, B. Sierawski, R. Austin, G. Karsai, N. Mahadevan, R. Reed, R. Schrimpf, K. LaBel, J. Evans,
and P. Adell, "Development of a Flight-Program-Ready Model-Based Assurance Platform", In Proceedings
of the IEEE Aerospace Conference, Big Sky, Montana, 2020, pp. 1-8. [17] M. N. Sarvi, D. Abbasi-Moghadam, M. Abolghasemi, and H. Hoseini, "Design and implementation of a
star-tracker for LEO satellite", Optik, vol. 208, 164343, April 2020.
[18] Document with personal communication from K. B. Miller, August 19, 2020. [19] A. Witulski, B. Sierawski, R. Austin, G. Karsai, N. Mahadevan, R. Reed, R. Schrimpf, K. LaBel, J. Evans,
and P. Adell, "Model-Based Assurance for Satellites with Commercial Parts in Radiation Environments ",
In Proceedings of AIAA Small Satellite Conference, Logan, Utah, 2018, SSC18-WKV-04.