systemic therapy for plaque stabilization: new drugs ... · systemic therapy for plaque...
TRANSCRIPT
IBIS-2
Systemic Therapy for Plaque Stabilization: New Drugs Targeting LP-PLA2
Patrick W. Serruys, MD, PhDon behalf of the IBIS-2 study investigators
13:30-13:45, April 22, Symposium Arena, Level 3Asian Pacific TCT
No conflict of interest to declare
IBIS-2
Lp-PLA2
Lp-PLA2
sn-2 oxidativetruncation
nLDL
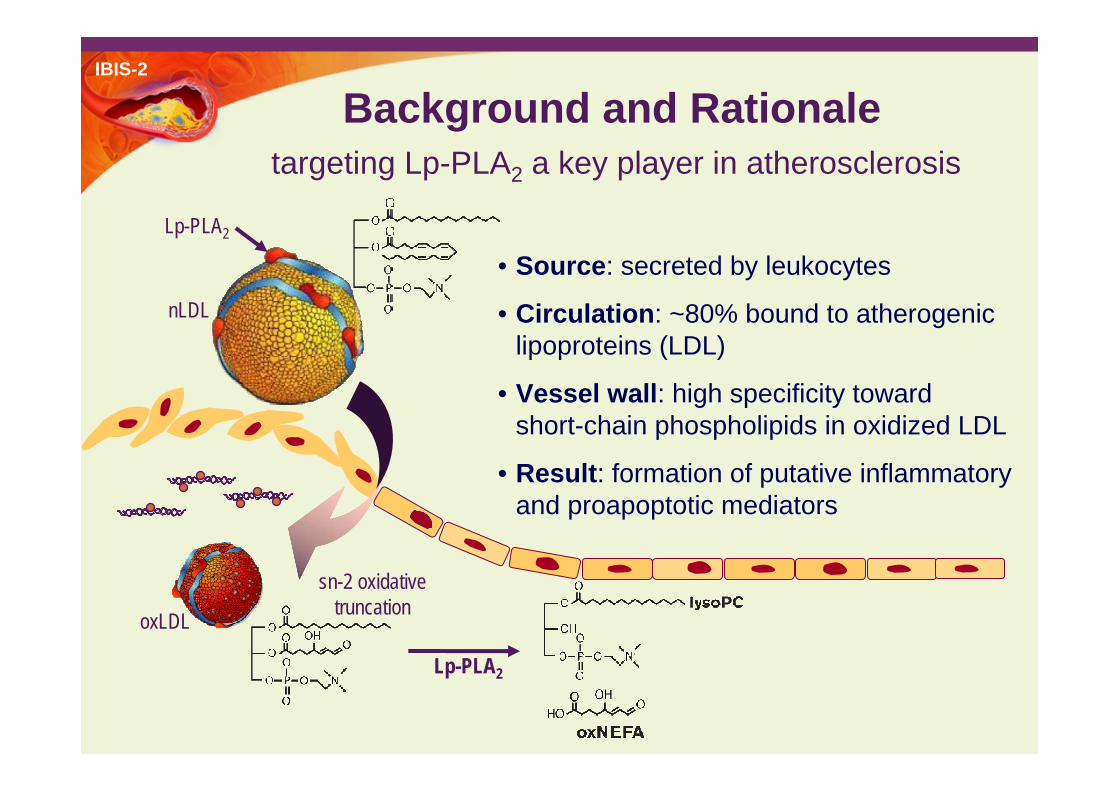
• Source: secreted by leukocytes
• Circulation: ~80% bound to atherogeniclipoproteins (LDL)
• Vessel wall: high specificity toward short-chain phospholipids in oxidized LDL
• Result: formation of putative inflammatory and proapoptotic mediators
oxLDL
Background and Rationale targeting Lp-PLA2 a key player in atherosclerosis

IBIS-2 Background and Rationale targeting Lp-PLA2 a key player in atherosclerosis
Lumen
Intima
native LDL carrier of Lp-PLA2
Oxidized LDL substrate for Lp-PLA2
Sustained Inflammation
Necrotic CoreExpansion
LysoPCand
oxidized NEFA
Leukocyte
Darapladib(Lp-PLA2 inhibitor)
Atheroma
Lp-PLA2
Lp-PLA2

IBIS-2
PATIENTS: Acute Coronary Syndrome (ACS) or Chronic CAD (n=330)
IVUS IMAGINGnon-intervened segment
Study Design and Endpoints
Randomization (1:1)PLACEBO vs. DARAPLADIB 160 mg
stratification by ACS status
0
1
3
6
9
12
hs-CRPSystemic inflammatory marker
IVUS-Palpography: Density of high strain
Plaque Deformability
co-primary endpointsco-primary endpoints
IVUS-Grey Scale: Atheroma volume (mm3) Percent atheroma volume (%)
Plaque Size
Target-related effect in plasmaLp-PLA2 activity
IVUS-VH: Necrotic core volume (mm3) Plaque Composition
key secondary endpointskey secondary endpoints
months
IVUS IMAGINGnon-intervened segment
Sample size determined using an estimation approach (due to unknown effects of Lp-PLA2 inhibition on novel imaging endpoints) accounting for SD of changes in IVUS-palpography from the IBIS-1pilot study

IBIS-2 IBIS-2 Imaging MethodologyImaging beyond measurement of plaque size
Frequency (beneath the amplitude) of echo signal can vary
depending on tissue content
Only the amplitude (echo intensity)- greyscale image
IVUS- Virtual Histology
a
*
Frequency (beneath the amplitude) of echo signal can vary
depending on tissue content
Only the amplitude (echo intensity)is used to construct the IVUS -
*
hhNecrotic Core
Dense Calcium
Fibro-fatty
Fibrous
1
2
3
4 5
Low
STRAIN
High
IVUS- Palpography

IBIS-2 Baseline CharacteristicsSafety Population
Placebo n=151
Darapladibn=172
DemographicsAge: mean (SD)Gender: male (%)
57 (11)83
59 (10)81
Risk Factors (%)DiabetesHypertensionHypercholesterolemiaHDL (<40 mg/dL)Current smoker
15 59 6326 38
13 67 63 26 37
Index hospitalization (%)ACSPCI
4981
5176
Medications (%)Any anti-platelet therapyStatinsACE inhibitors or ARBsBeta-blockers
>99 89 58 79
99 91 59 80

IBIS-2
Plaque Deformabilityby IVUS - Palpography
change from baseline in high strain density
-1mean
chan
ge(n
/10 m
m)
p=0.22
p=0.96p=0.14
-1p=0.87
* p=0.001 * p=0.002
Between groups comparison: ANCOVA adjusted for ACS, pooled country, baseline value and segment length; within groups comparison: paired t test
the worst 10 mm subsegment
placebo (plus standard of care) n=115 darapladib 160 mg (plus standard of care) n=131
entire region of interest [mean 49 mm]co-primary endpoint
mean
chan
ge(n
/10 m
m)

IBIS-2BL
FUP
Changes in gresycale signal are also observed

IBIS-2BL
FUP
3.59 m54%0.56 mm2,
9%
1.94 mm2, 30%
0.42 mm2,7%
5.18 mm2
68%
1.74 mm2, 23%
0.56 mm2, 7%
0.16 mm2, 2%BL
FUP

IBIS-2
Consistent mild decrease in percent atheroma area throughout the coronary
vessel
PB(%)
Distance from distal (mm)
BLFUP
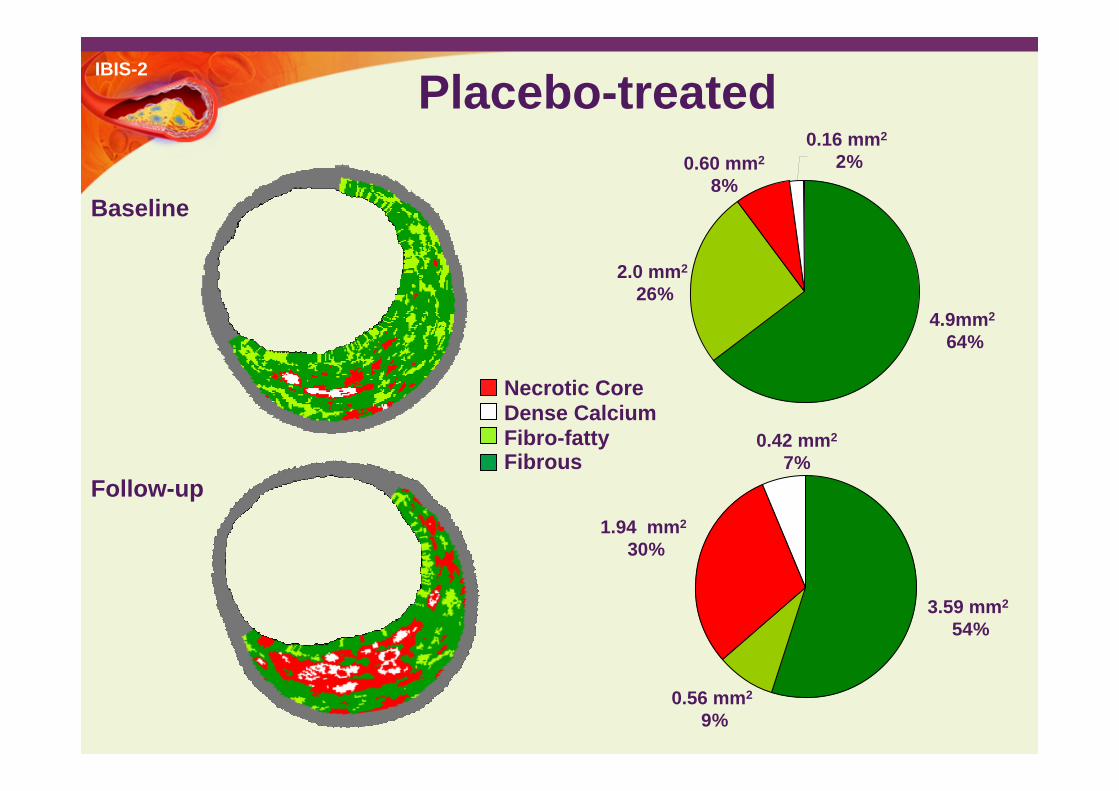
Placebo treated
Percent atheroma area
Pullback40 mm
LumenArea
LumenArea
EEM AreaEEM Area
Atheroma AreaAtheroma Area

IBIS-2
PB(%)
Distance from distal (mm)
BaselineFollow-up
NC (mm2)
“Percent atheroma area”
Necrotic core (mm2)
Pullback40 mm
40 mm
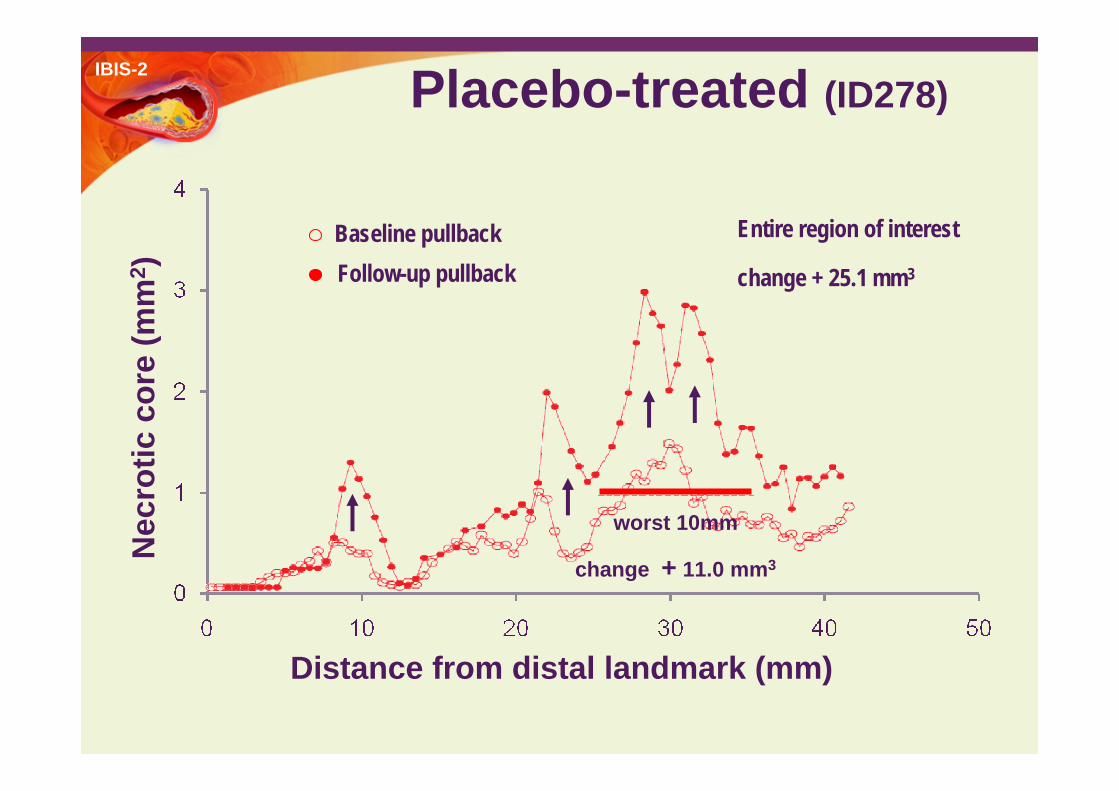
Placebo treated
Entire region of interest
change + 25.1 mm3
(ID278)
Baseline pullbackFollow-up pullback
worst 10mm
change + 11.0 mm3

IBIS-2BL
FUP
Darapladib treated
3.92 mm2
51%
0.31 mm2, 4%
2.6 mm2, 34%
0.89 mm2,11%
5.04 mm2, 58%
1.13 mm2, 13%
1.78 mm2, 21%
0.65 mm2,8%

IBIS-2BL
FUP
Darapladib treated

IBIS-2
PB(%)
BaselineFollow-upPercent atheroma area
Darapladib treated
no change in percent atheroma area throughout
the coronary vessel LumenArea
LumenArea
EEM AreaEEM Area
Atheroma AreaAtheroma Area

IBIS-2
PB(%)
Distance from distal (mm)
BaselineFollow-up
NC (mm2)
BaselineFollow-up
Percent atheroma volume
Necrotic core (mm2)
Pullback 60 mm
60 mm
Darapladib treated
worst 10mm
change - 8.7 mm3
(ID465)
Baseline pullbackFollow-up pullback
Entire region of interest change - 19.1 mm3

IBIS-2
-2
0
2
Plaque Compositionby IVUS - VH
change from baseline in necrotic core volume
-2
5
entire region of interest [mean 48 mm]key secondary endpoint
mean
chan
ge (m
m3 )
p=0.012
* p=0.009
p=0.71
7
the worst 10 mm subsegment
mean
chan
ge (m
m3 )
p=0.003
p=0.162
* p=0.008
placebo (plus standard of care) n=110 darapladib 160 mg (plus standard of care) n=129
Between groups comparison: ANCOVA adjusted for ACS, pooled country, baseline value and segment length; within groups comparison: paired t test

IBIS-2IBIS-2: changes in overall plaque composition:
differential effects of darapladib
necro t ic co re, calcium,
f ibro -fat ty,
f ibro us,
-10
-5
0
5
∆fro
m b
aseli
ne (m
m3 ) p=0.009*
mean nominal change in mm3 from baseline table 11.56R pp. 1-6, 20.5003R,
differences between groups Table 11.58R
necro t ic co re,
calcium,
f ibro -fat ty,
f ibro us, -10
-5
0
5
∆fro
m b
aseli
ne (m
m3 )
p=0.71*
Placebo Darapladib
* change from baseline within-group comparisonTable 11.57R, 20.5002R
p=0.012
Change in all VH plaque components (4)
-10
-5
0
∆fro
m b
aseli
ne (m
m3 )
p=0.07
p=0.59
* p=0.001

IBIS-2 Plaque CompositionSubgroup analysis
<65 yrs (n=172) ≥65 yrs (n=67)
Female (n=38) Male (n=201)
Smoker (n=90)Non-smoker (n=149)
DM (n=33)non-DM (n=206)
BP <140/90 mmHg (n=174)BP ≥140/90 mmHg (n=65)
eGFR <60 ml/min/1.73 m2 (n=19)eGFR ≥60 ml/min/1.73 m2 (n=217)
Prior statins (n=70)No prior statins (n=160)
ACS (n=118)non-ACS (n=121)
on-treatment LDL <70 mg/dL (n=67)on-treatment LDL ≥70 mg/dL (n=169)
on-treatment HDL <40 mg/dL (n=45)on-treatment HDL ≥40 mg/dL (n=194)
darapladib favours placeboDifference in Necrotic Core Volume (mm3)
-30 -20 -10 0 10
Overall (n=239)

IBIS-2
BiomarkersLp-PLA2, LDL-c, hs-CRP
Significant reduction in Lp-PLA2 activity in the darapladib-treated group:• placebo: 153 µM/min/L (95% CI, 147 to 159) vs darapladib: 62 µM/min/L (95% CI, 58 to 65); -59% reduction, p<0.001
Comparable on-treatment LDL-c values:• placebo: 88 ± 34 mg/dL vs darapladib: 84 ± 31 mg/dL, p=0.37
Significant reduction in Lp-PLA2 activity in the darapladib-treated group:• placebo: 153 µM/min/L (95% CI, 147 to 159) vs darapladib: 62 µM/min/L (95% CI, 58 to 65); -59% reduction, p<0.001
Comparable on-treatment LDL-c values:• placebo: 88 ± 34 mg/dL vs darapladib: 84 ± 31 mg/dL, p=0.37
Between groups comparison: ANCOVA adjusted for ACS, pooled country, and treatment as covariates.
hs-CRP at 12 monthsco-primary endpoint*
Placebo: 1.11 mg/L (95% CI, 0.9 to 1.4)Darapladib: 0.86 mg/L (95% CI, 0.7 to 1.0)
-22%, p=0.08 observed values analysis-15%, p=0.22 repeated measures analysis-12%, p=0.35 LOCF analysis (> 3mo.)*
achieved hs-CRP <1 mg/L at 12 months(post-hoc)
0
70
patie
nts (%
)
p=0.008
45%56/124
62%90/145
placebo darapladib 160 mg

IBIS-2 Chromosome 9p21 locus and CAD– X-Sectional Studies
Overall risk (r)/non-Risk (nr) allele frequency : ~ 50/50%Overall genotype frequency : 25% nr/nr, 50% r/nr, 25% r/rOverall risk for CAD : ~35% increase per risk alleleIncreased risk for AAA, Stroke, cerebral aneuvrysmNo Association with known CVRFs. Mechanism unknown
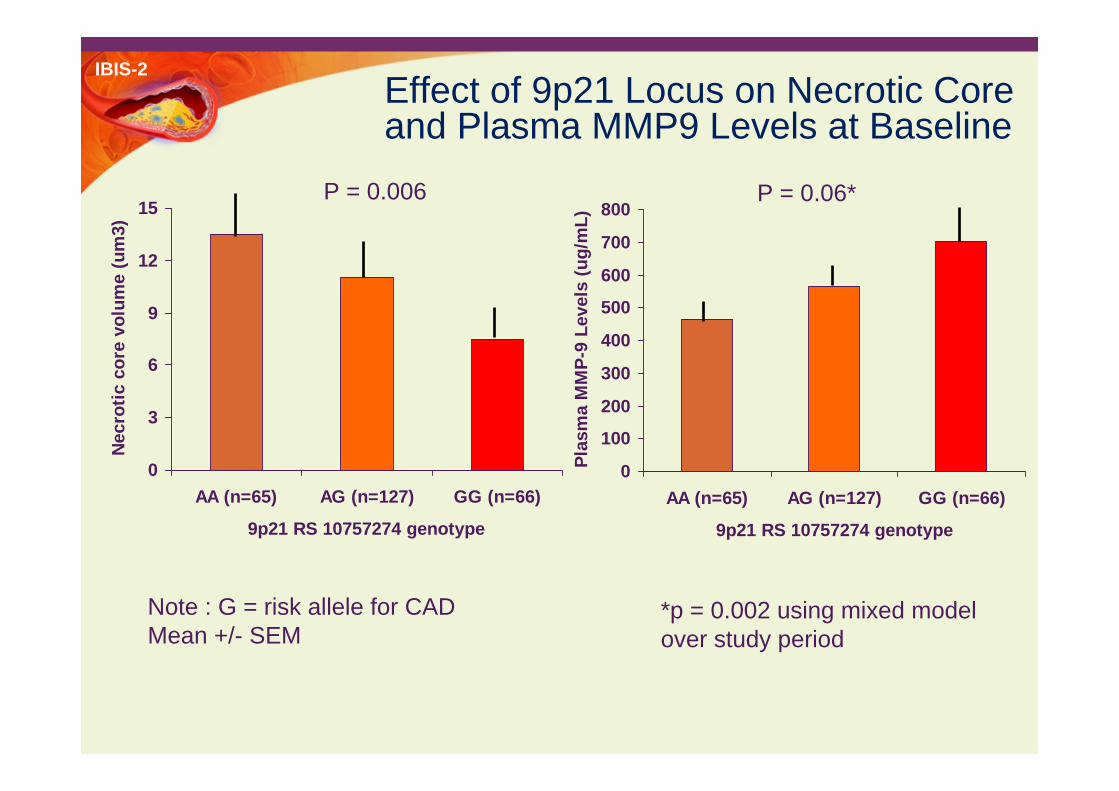
IBIS-2Effect of 9p21 Locus on Necrotic Core and Plasma MMP9 Levels at Baseline
Note : G = risk allele for CADMean +/- SEM
0
3
6
9
12
15
AA (n=65) AG (n=127) GG (n=66)
9p21 RS 10757274 genotype
Nec
rotic
cor
e vo
lum
e (u
m3)
0
100
200
300
400
500
600
700
800
AA (n=65) AG (n=127) GG (n=66)
9p21 RS 10757274 genotype
Plas
ma
MM
P-9
Leve
ls (u
g/m
L)
P = 0.006 P = 0.06*
*p = 0.002 using mixed modelover study period

IBIS-2
One interpretation9p21 non-risk allele
9p21 risk allele
AITFT
FA
TCFA
TCFA
MMP9
The inverse relationship between necrotic core and risk allele for 9p21 might be explained by positive relationship with metalloproteinase; Plaque rupture occurs prematurely in those with 9p21 risk allele through disruptive effect of MMP-9 without giving time for build-up of large necrotic core like in patients with 9p21 non-risk allele.

IBIS-2
Conclusions• Darapladib, a potent and selective Lp-PLA2 inhibitor, did
not significantly affect plaque deformability or hs-CRP levels
• Darapladib halted expansion of necrotic core when compared to standard of care alone. This effect was consistent across several clinical subgroups and was observed after only 12 months of treatment
• The results confirm a pro-atherogenic role of Lp-PLA2and its impact on the composition of atherosclerotic plaques in humans
• Chronic Lp-PLA2 inhibition may represent a novel approach for plaque stabilization, if clinical benefit of this therapy is confirmed in future event-driven trials

IBIS-2
Publication of complete results of IBIS-2 in Circulation

IBIS-2
Methods : Analysis of 9p21 Locus in IBIS-2
• Baseline subjects with genotypes n=258– Follow-up IVUS n=226– Follow-up biomarker n=250
• Genotypes : – 3 SNPs for 9p21 locus
• Analysis : additive model, nominal and empirical p-value (10.000 permutations)

IBIS-2
Darapladib-treated
3.92 mm2
(51%)
0.31 mm2
(4%)
2.6 mm2
(34%)
0.89 mm2
(11%)
5.04 mm2
(58%)1.13 mm2
(13%)
1.78 mm2
(21%)
0.65 mm2
(8%)
Baseline
Follow-up
Necrotic CoreDense CalciumFibro-fattyFibrous
IBIS-2
Distance from distal landmark (mm)
Baseline pullbackFollow-up pullback
Nec
rotic
cor
e (m
m2 )
Entire region of interest
change + 25.1 mm3
worst 10mm
change + 11.0 mm3
Placebo-treated (ID278)
IBIS-2
3.59 mm2
54%
0.56 mm2
9%
1.94 mm2
30%
0.42 mm2
7%
Baseline
Follow-up
Placebo-treated
Necrotic CoreDense CalciumFibro-fattyFibrous
4.9mm2
64%
2.0 mm2
26%
0.60 mm2
8%
0.16 mm2
2%

IBIS-2
Darapladib-treated (ID465)N
ecro
tic c
ore
(mm
2 )
Distance from distal landmark (mm)
Baseline pullbackFollow-up pullback
worst 10mm
change - 8.7 mm3
Entire region of interest change - 19.1 mm3

IBIS-2
Darapladib-treated
3.92 mm2
(51%)
0.31 mm2
(4%)
2.6 mm2
(34%)
0.89 mm2
(11%)
5.04 mm2
(58%)1.13 mm2
(13%)
1.78 mm2
(21%)
0.65 mm2
(8%)
Baseline
Follow-up
Necrotic CoreDense CalciumFibro-fattyFibrous

IBIS-2
Distance from distal landmark (mm)
Baseline pullbackFollow-up pullback
Nec
rotic
cor
e (m
m2 )
Entire region of interest
change + 25.1 mm3
worst 10mm
change + 11.0 mm3
Placebo-treated (ID278)

IBIS-2
One interpretation9p21 non-risk allele
9p21 risk allele
MMP9

IBIS-2
FAFT
Ca FA
TCFAPIT
CaTCFA
FCAIT
Atheroma heterogeneity
Adaptative intimalthickening
Fibrocalcific Calcified FACalcified TCFA
Pathological intimalthickening
Fibrotic Fibroatheroma Thin cap
fibroatheroma

CAD Genetics and Darapladib
Cardiolysis MeetingRotterdam 02/24/09
Vincent Mooser MDwith the contribution by : IBIS-2 Investigators !Dawn Waterworth, Andrew Zalewski, KijoungSong, Noha Lim, Xin Yuan, Mike Mosteller and Lon Cardon

Chromosome 9p21 locus and CAD – X-Sectional Studies
Overall risk (r)/non-Risk (nr) allele frequency : ~ 50/50%Overall genotype frequency : 25% nr/nr, 50% r/nr, 25% r/rOverall risk for CAD : ~35% increase per risk alleleIncreased risk for AAA, Stroke, cerebral aneuvrysmNo Association with known CVRFs. Mechanism unknown

9p21 and CAD – Prospective Study
Northwick Park Heart Study II
2742 healthy middle-aged men270 CAD events occurring15-year prospective study
Note : 9p21-associated risk of secondary event not reported

9p21 and Darapladib : Questions
1. Does the 9p21 locus impact on the morphological and mechanical properties of coronary plaques ?
2. Does the 9p21 locus impact on the response to Darapladib-mediated inhibition of LpPLA2 ?
Potential relevance : Better understanding of the biology of CADEnrichment with high-risk/high responders for future darapladib trials

Methods : Analysis of 9p21 Locus in IBIS-2
Baseline subjects with genotypes n=258– Follow-up IVUS n=226– Follow-up biomarker n=250
Genotypes : – 3 SNPs for 9p21 locus
Analysis : additive model, nominal and empirical p-value (10.000 permutations)

Effect of 9p21 Locus on Necrotic Core and PlasmaMMP9 Levels at Baseline
Note : G = risk allele for CADMean +/- SEM
0
3
6
9
12
15
AA (n=65) AG (n=127) GG (n=66)
9p21 RS 10757274 genotype
Nec
rotic
cor
e vo
lum
e (u
m3)
0
100
200
300
400
500
600
700
800
AA (n=65) AG (n=127) GG (n=66)
9p21 RS 10757274 genotype
Plas
ma
MM
P-9
Leve
ls (u
g/m
L)
P = 0.006 P = 0.06*
*p = 0.002 using mixed modelover study period

9p21 vs Darapladib
Betas and 95%CI shown.Darapladib variables Z-score transformed9p21 variables logged and Z-score transformed
Effect of 1 yr Darapladib treatment
Calcium % VolumeVolume
Fibrous % VolumeVolume
Ncr. Core % VolumeVolume
Totl plaque % VolumeVolume
MMP-9
Effect of lifetime exposure to 9p21 risk alleles

One interpretation
9p21 non-risk allele
9p21 risk allele
MMP9

Summary
9p21 risk allele for CAD/AAA associated with smaller plaques
9p21 associated with plaque size, not compositionDarapladib associated with plaque composition, not size
First direct evidence that 9p21 is a susceptibility locus for plaque rupture, possibly through increased MMP9 levels*
No significant association between 9p21 and drug response or progression of the plaques (data not shown)
Notes : No effect of 9p21 on number of lesions, lumen size in LCAS Study (BMC Jan 27th, 2009, back-up slide) and in Salt Lake City Study (Am Heart J, Dec 2008, back-up slide). *Consistent with increased compliance of abdominal aorta (J Int Med 2009, epub, back-up slide).

9p21 : Next Steps ?
Publication ? Additional material/analyses required ?Replication with Approach : ongoingSystematic analysis of the effect of 9p21 genotype on ‘omic’biomarkers in AtheroRemo ?
Expected results : – Better understanding of the biology of 9p21in humans ?– Biomarkers for plaque instability ( surrogate markers for
interventions aimed at plaque stabilization ?)
Need to collect DNA for all participants of Darapladib TrialExpected results :
– Post-hoc analysis of the effect of 9p21 on response to LpPLA2 inhibition
Back-Up Slides
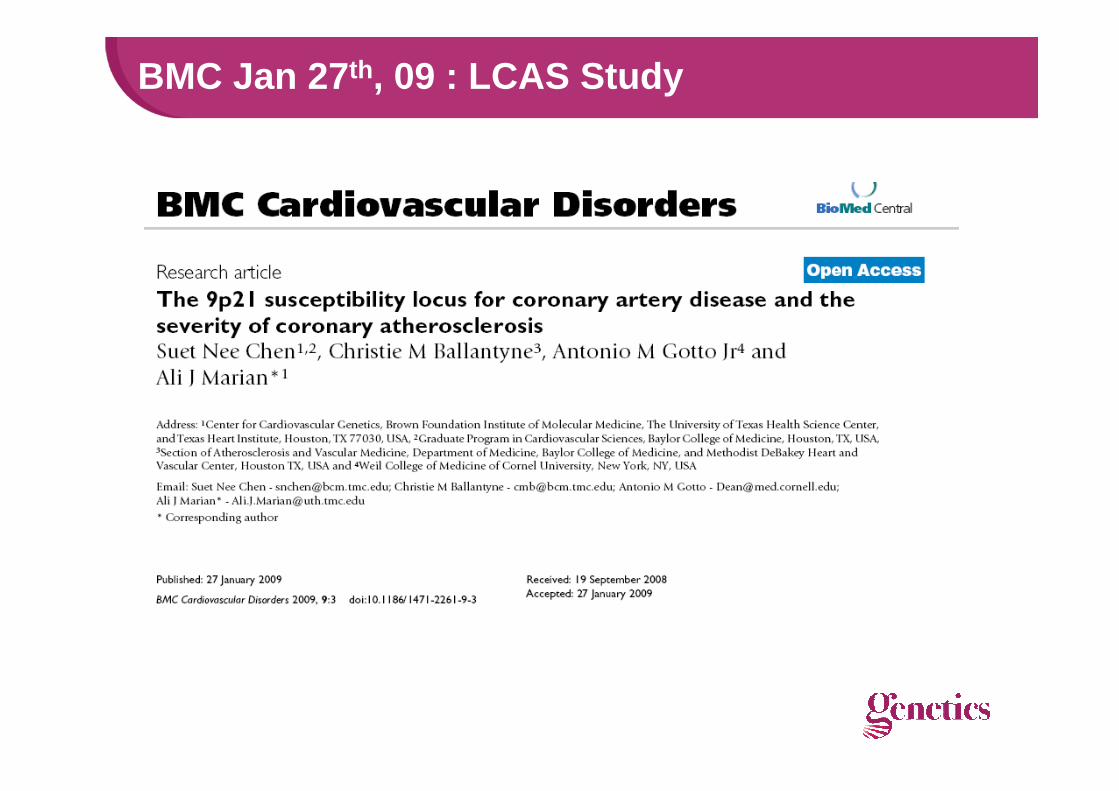
BMC Jan 27th, 09 : LCAS Study

BMC / LCAS

Am Heart J, Dec 08

JIM - epub 09

JIM - epub 09
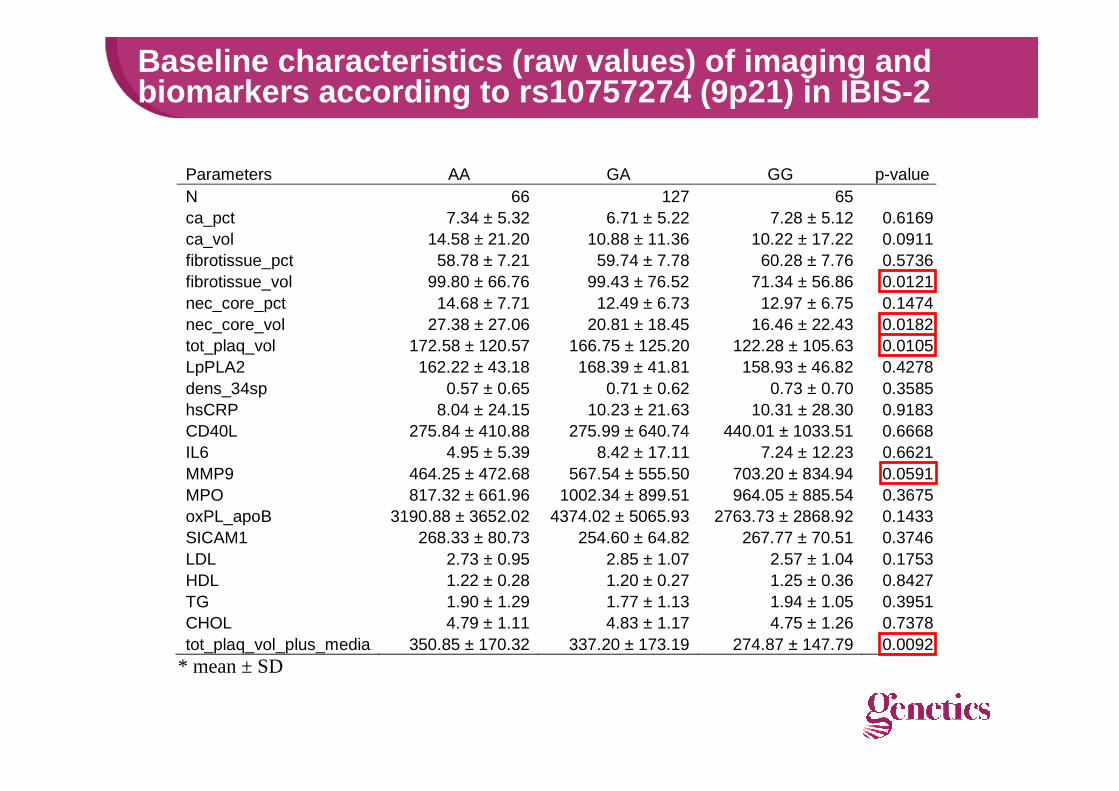
Baseline characteristics (raw values) of imaging and biomarkers according to rs10757274 (9p21) in IBIS-2
Parameters AA GA GG p-valueN 66 127 65ca_pct 7.34 ± 5.32 6.71 ± 5.22 7.28 ± 5.12 0.6169ca_vol 14.58 ± 21.20 10.88 ± 11.36 10.22 ± 17.22 0.0911fibrotissue_pct 58.78 ± 7.21 59.74 ± 7.78 60.28 ± 7.76 0.5736fibrotissue_vol 99.80 ± 66.76 99.43 ± 76.52 71.34 ± 56.86 0.0121nec_core_pct 14.68 ± 7.71 12.49 ± 6.73 12.97 ± 6.75 0.1474nec_core_vol 27.38 ± 27.06 20.81 ± 18.45 16.46 ± 22.43 0.0182tot_plaq_vol 172.58 ± 120.57 166.75 ± 125.20 122.28 ± 105.63 0.0105LpPLA2 162.22 ± 43.18 168.39 ± 41.81 158.93 ± 46.82 0.4278dens_34sp 0.57 ± 0.65 0.71 ± 0.62 0.73 ± 0.70 0.3585hsCRP 8.04 ± 24.15 10.23 ± 21.63 10.31 ± 28.30 0.9183CD40L 275.84 ± 410.88 275.99 ± 640.74 440.01 ± 1033.51 0.6668IL6 4.95 ± 5.39 8.42 ± 17.11 7.24 ± 12.23 0.6621MMP9 464.25 ± 472.68 567.54 ± 555.50 703.20 ± 834.94 0.0591MPO 817.32 ± 661.96 1002.34 ± 899.51 964.05 ± 885.54 0.3675oxPL_apoB 3190.88 ± 3652.02 4374.02 ± 5065.93 2763.73 ± 2868.92 0.1433SICAM1 268.33 ± 80.73 254.60 ± 64.82 267.77 ± 70.51 0.3746LDL 2.73 ± 0.95 2.85 ± 1.07 2.57 ± 1.04 0.1753HDL 1.22 ± 0.28 1.20 ± 0.27 1.25 ± 0.36 0.8427TG 1.90 ± 1.29 1.77 ± 1.13 1.94 ± 1.05 0.3951CHOL 4.79 ± 1.11 4.83 ± 1.17 4.75 ± 1.26 0.7378tot_plaq_vol_plus_media 350.85 ± 170.32 337.20 ± 173.19 274.87 ± 147.79 0.0092
* mean ± SD

9p21 Other Findings in IBIS-2
No significant effect on progression of plaques in placebo or treatment armsNo significant interactions between genotype and size of the treatment effectRisk allele associated with increased plasma levels of MMP9 (p =0.002 using mixed model)
MMP9 (rs10757274)
300
500
700
900
1100
1300
B/L WK4 WK13 WK26 WK52
Treatment(AA) Treatment(AG) Treatment(GG)Placebo(AA) Placebo(AG) Placebo(GG)