systematic reviews in health care || principles of and procedures for systematic reviews
TRANSCRIPT

Part I: Systematic reviews of controlled trials

2 Principles of and procedures for systematic reviewsMATTHIAS EGGER, GEORGE DAVEY SMITH
Summary points
• Reviews and meta-analyses should be as carefully planned as anyother research project, with a detailed written protocol prepared inadvance.
• The formulation of the review question, the a priori definition ofeligibility criteria for trials to be included, a comprehensive search forsuch trials and an assessment of their methodological quality, arecentral to high quality reviews.
• The graphical display of results from individual studies on a commonscale (“Forest plot”) is an important step, which allows a visualexamination of the degree of heterogeneity between studies.
• There are different statistical methods for combining the data inmeta-analysis but there is no single “correct” method. A thoroughsensitivity analysis should always be performed to assess the robust-ness of combined estimates to different assumptions, methods andinclusion criteria and to investigate the possible influence of bias.
• When interpreting results, reviewers should consider the importanceof beneficial and harmful effects of interventions in absolute and rela-tive terms and address economic implications and implications forfuture research.
Systematic reviews allow a more objective appraisal of the evidence thantraditional narrative reviews and may thus contribute to resolve uncer-tainty when original research, reviews and editorials disagree. Systematicreviews are also important to identify questions to be addressed in futurestudies. As will be discussed in the subsequent chapter, ill conducted
23

reviews and meta-analyses may, however, be biased due to exclusion ofrelevant studies, the inclusion of inadequate studies or the inappropriatestatistical combination of studies. Such bias can be minimised if a fewbasic principles are observed. Here we will introduce these principlesand give an overview of the practical steps involved in performingsystematic reviews. We will focus on systematic reviews of controlledtrials but the basic principles are applicable to reviews of any type ofstudy (see Chapters 12–14 for a discussion of systematic reviews ofobservational studies). Also, we assume here that the review is based onsummary information obtained from published papers, or from theauthors. Systematic reviews and meta-analyses based on individualpatient data are discussed in Chapter 6. We stress that the presentchapter can only serve as an elementary introduction. Readers who wantto perform systematic reviews should consult the ensuing chapters andconsider joining forces with the Cochrane Collaboration (see Chapters25 and 26).
Developing a review protocol
Systematic reviews should be viewed as observational studies of theevidence. The steps involved, summarised in Box 2.1, are similar to anyother research undertaking: formulation of the problem to be addressed,collection and analysis of the data, and interpretation of the results.Likewise, a detailed study protocol which clearly states the question tobe addressed, the subgroups of interest, and the methods and criteria tobe employed for identifying and selecting relevant studies and extractingand analysing information should be written in advance. This is impor-tant to avoid bias being introduced by decisions that are influenced bythe data. For example, studies which produced unexpected or undesiredresults may be excluded by post hoc changes to the inclusion criteria.Similarly, unplanned data-driven subgroup analyses are likely to pro-duce spurious results.1,2 The review protocol should ideally be conceivedby a group of reviewers with expertise both in the content area and thescience of research synthesis.
Objectives and eligibility criteria
The formulation of detailed objectives is at the heart of any researchproject. This should include the definition of study participants, inter-ventions, outcomes and settings. As with patient inclusion and exclusioncriteria in clinical studies, eligibility criteria can then be defined for thetype of studies to be included. They relate to the quality of trials and to
SYSTEMATIC REVIEWS IN HEALTH CARE
24

PRINCIPLES OF AND PROCEDURES FOR SYSTEMATIC REVIEWS
25
1 Formulate review question
2 Define inclusion and exclusioncriteria
• participants• interventions and comparisons• outcomes• study designs and methodologi-
cal quality
3 Locate studies (see alsoChapter 4)
Develop search strategy consideringthe following sources:
• The Cochrane Controlled TrialsRegister (CCTR)
• electronic databases and trialsregisters not covered by CCTR
• checking of reference lists• handsearching of key journals• personal communication with
experts in the field
4 Select studies• have eligibility checked by more
than one observer• develop strategy to resolve dis-
agreements• keep log of excluded studies,
with reasons for exclusions
5 Assess study quality (see alsoChapter 5)
• consider assessment by morethan one observer
• use simple checklists rather thanquality scales
• always assess concealment of
treatment allocation, blindingand handling of patient attrition
• consider blinding of observers toauthors, institutions and journals
6 Extract data• design and pilot data extraction
form• consider data extraction by more
than one observer• consider blinding of observers to
authors, institutions and journals
7 Analyse and present results(see also Chapters 8–11, 15, 16)
• tabulate results from individualstudies
• examine forest plot• explore possible sources of hetero-
geneity• consider meta-analysis of all trials
or subgroups of trials• perform sensitivity analyses,
examine funnel plots• make list of excluded studies
available to interested readers
8 Interpret results (see also Chapters 19–24)
• consider limitations, includingpublication and related biases
• consider strength of evidence• consider applicability• consider numbers-needed-to-treat
to benefit / harm• consider economic implications• consider implications for future
research
Box 2.1 Steps in conducting a systematic review*
* Points 1–7 should be addressed in the review protocol.

the combinability of patients, treatments, outcomes and lengths offollow-up. As discussed in detail in Chapter 5, quality and designfeatures of clinical trials can influence the results.3–5 Ideally, onlycontrolled trials with proper patient randomisation which report on allinitially included patients according to the intention-to-treat principleand with an objective, preferably blinded, outcome assessment would beconsidered for inclusion.6 Formulating assessments regarding studyquality can be a subjective process, however, especially since theinformation reported is often inadequate for this purpose.7–10 It is there-fore generally preferable to define only basic inclusion criteria, to assessthe methodological quality of component studies, and to perform athorough sensitivity analysis, as illustrated below.
Literature search
The search strategy for the identification of the relevant studiesshould be clearly delineated. As discussed in Chapter 4, identifyingcontrolled trials for systematic reviews has become more straightforwardin recent years. Appropriate terms to index randomised trials and con-trolled trials were introduced in the widely used bibliographic databasesMEDLINE and EMBASE by the mid 1990s. However, tens ofthousands of trial reports had been included prior to the introduction ofthese terms. In a painstaking effort the Cochrane Collaboration checkedthe titles and abstracts of almost 300 000 MEDLINE and EMBASErecords which were then re-tagged as clinical trials if appropriate. It wasimportant to examine both MEDLINE and EMBASE because the over-lap in journals covered by the two databases is only about 34%.11 Themajority of journals indexed in MEDLINE are published in the USwhereas EMBASE has better coverage of European journals (see Box4.1 in Chapter 4 for a detailed comparison of MEDLINE andEMBASE). Re-tagging continues in MEDLINE and EMBASE andprojects to cover other databases are ongoing or planned. Finally, thou-sands of reports of controlled trials have been identified by manualsearches (“handsearching”) of journals, conference proceedings andother sources.
All trials identified in the re-tagging and handsearching projects havebeen included in the The Cochrane Controlled Trials Register which isavailable in the Cochrane Library on CD ROM or online (see Chapter25). This register currently includes over 250 000 records and is clearlythe best single source of published trials for inclusion in systematicreviews. Searches of MEDLINE and EMBASE are, however, stillrequired to identify trials that were published recently (see the searchstrategy described in Chapter 4). Specialised databases, conference pro-
SYSTEMATIC REVIEWS IN HEALTH CARE
26
ceedings and the bibliographies of review articles, monographs and thelocated studies should be scrutinised as well. Finally, the searching byhand of key journals should be considered, keeping in mind that manyjournals are already being searched by the Cochrane Collaboration.
The search should be extended to include unpublished studies, astheir results may systematically differ from published trials. As discussedin Chapter 3, a systematic review which is restricted to published evi-dence may produce distorted results due to publication bias. Registrationof trials at the time they are established (and before their results becomeknown) would eliminate the risk of publication bias.12 A number of suchregisters have been set up in recent years and access to these hasimproved, for example through the Cochrane Collaboration’s Register ofRegisters or the internet-based metaRegister of Controlled Trials whichhas been established by the publisher Current Science (see Chapters 4and 24). Colleagues, experts in the field, contacts in the pharmaceuticalindustry and other informal channels can also be important sources ofinformation on unpublished and ongoing trials.
Selection of studies, assessment of methodologicalquality and data extraction
Decisions regarding the inclusion or exclusion of individual studiesoften involve some degree of subjectivity. It is therefore useful to havetwo observers checking eligibility of candidate studies, with disagree-ments being resolved by discussion or a third reviewer.
Randomised controlled trials provide the best evidence of the efficacyof medical interventions but they are not immune to bias. Studies relat-ing methodological features of trials to their results have shown that trialquality influences effect sizes.4,5,13 Inadequate concealment of treatmentallocation, resulting, for example, from the use of open random numbertables, is on average associated with larger treatment effects.4,5,13 Largereffects were also found if trials were not double-blind.4 In someinstances effects may also be overestimated if some participants, forexample, those not adhering to study medications, were excluded fromthe analysis.14–16 Although widely recommended, the assessment of themethodological quality of clinical trials is a matter of ongoing debate.7
This is reflected by the large number of different quality scales andchecklists that are available.10,17 Empirical evidence10 and theoreticalconsiderations18 suggests that although summary quality scores may insome circumstances provide a useful overall assessment, scales shouldnot generally be used to assess the quality of trials in systematic reviews.Rather, as discussed in Chapter 5, the relevant methodological aspectsshould be identified in the study protocol, and assessed individually.
PRINCIPLES OF AND PROCEDURES FOR SYSTEMATIC REVIEWS
27

Again, independent assessment by more than one observer is desirable.Blinding of observers to the names of the authors and their institutions,the names of the journals, sources of funding and acknowledgmentsshould also be considered as this may lead to more consistent assess-ments.19 Blinding involves photocopying of papers removing the titlepage and concealing journal identifications and other characteristics witha black marker, or scanning the text of papers into a computer andpreparing standardised formats.20,21 This is time consuming and poten-tial benefits may not always justify the additional costs.22
It is important that two independent observers extract the data, so errorscan be avoided. A standardised record form is needed for this purpose.Data extraction forms should be carefully designed, piloted and revised ifnecessary. Electronic data collection forms have a number of advantages,including the combination of data abstraction and data entry in one step,and the automatic detection of inconsistencies between data recorded bydifferent observers. However, the complexities involved in programmingand revising electronic forms should not be underestimated.23
Presenting, combining and interpreting results
Once studies have been selected, critically appraised and dataextracted the characteristics of included studies should be presented intabular form. Table 2.1 shows the characteristics of the long term trialsthat were included in a systematic review24 of the effect of beta blockadein secondary prevention after myocardial infarction (we mentioned thisexample in Chapter 1 and will return to it later in this chapter).Freemantle et al.24 included all parallel group randomised trials thatexamined the effectiveness of beta blockers versus placebo or alternativetreatment in patients who had had a myocardial infarction. The authorssearched 11 bibliographic databases, including dissertation abstracts andgrey literature databases, examined existing reviews and checked thereference lists of each identified study. Freemantle et al. identified 31trials of at least six months’ duration which contributed 33 comparisonsof beta blocker with control groups (Table 2.1).
Standardised outcome measure
Individual results have to be expressed in a standardised format toallow for comparison between studies. If the endpoint is binary (e.g.disease versus no disease, or dead versus alive) then relative risks orodds ratios are often calculated. The odds ratio has convenient mathe-matical properties, which allow for ease in the combination of data and
SYSTEMATIC REVIEWS IN HEALTH CARE
28

29
Tab
le 2
.1 C
hara
cter
isti
cs o
f lo
ng t
erm
tri
als
com
pari
ng b
eta
bloc
kers
wit
h co
ntro
l. A
dapt
ed f
rom
Fre
eman
tle
et a
l.24
Aut
hor
Yea
rD
rug
Stu
dy d
urat
ion
Con
ceal
men
t of
Dou
ble-
blin
dM
orta
lity
(No.
/tot
al n
o.)
(yea
rs)
trea
tmen
t al
loca
tion
Bet
a bl
ocke
rC
ontr
ol
Bar
ber
1967
Pra
ctol
ol2
Unc
lear
Unc
lear
33/
207
38/
213
Rey
nold
s19
72A
lpre
nolo
l1
Yes
Yes
3/ 3
83/
39
Ahl
mar
k19
74A
lpre
nolo
l2
Unc
lear
Unc
lear
5/ 6
911
/ 93
Wilh
elm
sson
1974
Alp
reno
lol
2U
ncle
arY
es7/
114
14/
116
Mul
tice
ntre
Int
erna
tion
al19
75P
ract
olol
2U
ncle
arY
es10
2/ 1
533
127/
152
0Y
usuf
1979
Ate
nolo
l1
Unc
lear
Yes
1/ 1
11/
11
And
erse
n19
79A
lpre
nolo
l1
Unc
lear
Yes
61/2
3862
/242
Reh
nqvi
st19
80M
etro
prol
ol1
Unc
lear
Unc
lear
4/59
6/52
Bab
er19
80P
ropr
anol
ol0·
75U
ncle
arY
es28
/355
27/3
65W
ilcox
(A
teno
lol)
1980
Ate
nolo
l1
Yes
Yes
17/1
3219
/129
Wilc
ox (
Pro
pano
lol)
1980
Pro
pran
olol
1Y
esY
es19
/ 12
719
/ 12
9H
jalm
arso
n19
81M
etop
rolo
l2
Unc
lear
No
40/
698
62/
697
Nor
weg
ian
Mul
tice
ntre
1981
Tim
olol
1·4
Unc
lear
Yes
98/
945
152/
939
Han
stee
n19
82P
ropr
anol
ol1
Unc
lear
Yes
25/
278
37/
282
Julia
n19
82S
otal
ol1
Yes
Yes
64/
873
52/
583
BH
AT
1982
Pro
pran
olol
2·1
Yes
Yes
138/
191
618
8/ 1
921
Tay
lor
1982
Oxp
reno
lol
4D
one
Yes
60/
632
48/
471
Man
ger
Cat
s19
83M
etop
rolo
l1
Unc
lear
Yes
9/ 2
7316
/ 28
0R
ehnq
vist
1983
Met
ropr
olol
3U
ncle
arY
es25
/ 15
431
/ 14
7A
ustr
alia
n-S
wed
ish
1983
Pin
dolo
l2
Unc
lear
Yes
45/
263
47/
266
Maz
ur19
84P
ropr
anol
ol1·
5U
ncle
arN
o5/
101
11/
103
EIS
1984
Oxp
reno
lol
1U
ncle
arY
es57
/ 85
345
/ 88
3S
alat
hia
1985
Met
opro
lol
1U
ncle
arY
es49
/ 41
652
/ 34
8R
oqué
1987
Tim
olol
2U
ncle
arY
es7/
102
12/
98L
IT19
87M
etop
rolo
l1·
5U
ncle
arY
es86
/ 11
9593
/ 12
00K
aul
1988
Pro
pran
olol
0·5
Unc
lear
Yes
3/ 2
53/
25
AS
PI
1990
Ace
buto
lol
0·87
Yes
Yes
17/
298
34/
309
Sch
war
tz (
high
ris
k)19
92O
xpre
nolo
l1·
8U
ncle
arN
o2/
48
12/
56S
chw
artz
(lo
w r
isk)
1992
Oxp
reno
lol
1·8
Unc
lear
Yes
15/
437
27/
432
SS
SD
1993
Met
opro
lol
3U
ncle
arN
o17
/ 13
09/
123
Dar
asz
1995
Xam
oter
ol0·
5U
ncle
arY
es3/
23
1/ 2
4B
asu
1997
Car
vedi
lol
0·5
Unc
lear
Yes
2/ 7
53/
71
Aro
now
1997
Pro
pran
olol
1U
ncle
arU
ncle
ar44
/ 79
60/
79

the testing of the overall effect for statistical significance, but, as dis-cussed in Box 2.2, the odds ratio will differ from the relative risk if theoutcome is common. Relative risks should probably be prefered overodds ratios because they are more intuitively comprehensible to mostpeople.25,26 Absolute measures such as the absolute risk reduction or thenumber of patients needed to be treated for one person to benefit27 aremore helpful when applying results in clinical practice (see below). Ifthe outcome is continuous and measurements are made on the samescale (e.g. blood pressure measured in mm Hg) the mean differencebetween the treatment and control groups is used. If trials measuredoutcomes in different ways, differences may be presented in standarddeviation units, rather than as absolute differences. For example, theefficacy of non-steroidal antiinflammatory drugs for reducing pain inpatients with rheumatoid arthritis was measured using different scales.28
The choice and calculation of appropriate summary statistics is coveredin detail in Chapters 15 and 16.
Graphical display
Results from each trial are usefully graphically displayed together withtheir confidence intervals in a “forest plot”, a form of presentationdeveloped in the 1980s by Richard Peto’s group in Oxford. Figure 2.1represents the forest plot for the trials of beta-blockers in secondary pre-vention after myocardial infarction which we mentioned in Chapter 1.24
Each study is represented by a black square and a horizontal line whichcorrespond to the point estimate and the 95% confidence intervals ofthe relative risk. The 95% confidence intervals would contain the trueunderlying effect in 95% of the occasions, if the study was repeatedagain and again. The solid vertical line corresponds to no effect of treat-ment (relative risk 1·0). If the confidence interval includes 1, then thedifference in the effect of experimental and control therapy is notstatistically significant at conventional levels (P > 0·05). The confidenceinterval of most studies cross this line. The area of the black squaresreflects the weight of the study in the meta-analysis (see below).
A logarithmic scale was used for plotting the relative risk in Figure2.2. There are a number of reasons why ratio measures are best plottedon logarithmic scales.29 Most importantly, the value of a risk ratio andits reciprocal, for example 0·5 and 2, which represent risk ratios of thesame magnitude but opposite directions, will be equidistant from 1·0.Studies with relative risks below and above 1·0 will take up equal spaceon the graph and thus visually appear to be equally important. Also,confidence intervals will be symmetrical around the point estimate.
SYSTEMATIC REVIEWS IN HEALTH CARE
30

PRINCIPLES OF AND PROCEDURES FOR SYSTEMATIC REVIEWS
31
Box 2.2 Odds ratio or relative risk?
Odds ratios are often used in order to bring the results of different trialsinto a standardised format. What is an odds ratio and how does it relateto the relative risk? The odds is defined as the number of patients whofulfill the criteria for a given endpoint divided by the number of patientswho do not. For example, the odds of diarrhoea during treatment with anantibiotic in a group of 10 patients may be 4 to 6 (4 with diarrhoeadivided by 6 without, 0·66), as compared to 1 to 9 (0·11) in a controlgroup. A bookmaker (a person who takes bets, especially on horse-races,calculates odds, and pays out winnings) would, of course, refer to this asnine to one. The odds ratio of treatment to control group in this exampleis 6 (0·66 divided by 0·11). The risk, on the other hand, is calculated asthe number of patients with diarrhoea divided by all patients. It would be4 in 10 in the treatment group and 1 in 10 in the control group, for a riskratio, or a relative risk, of 4 (0·4 divided by 0·1). As shown in Figure 2.1,the odds ratio will be close to the relative risk if the endpoint occursrelatively infrequently, say in less than 15%. If the outcome is morecommon, as in the diarrhoea example, then the odds ratio will differincreasingly from the relative risk. The choice of binary outcome measuresis discussed in detail in Chapter 16.
Figure 2.1
Odd
s ra
tio /
rela
tive
risk
10
2
1
0·5
0·1
1 3 5 10 15 25 40 60
Overall event rate (%)
Odds ratio
Odds ratio
Relative risk

Heterogeneity between study results
The thoughtful consideration of heterogeneity between study results isan important aspect of systematic reviews.30,31 As mentioned above, thisshould start when writing the review protocol, by defining potentialsources of heterogeneity and planning appropriate subgroup analyses.Once the data have been assembled, simple inspection of the forest plotis informative. The results from the beta-blocker trials are fairly homo-geneous, clustering between a relative risk of 0·5 and 1·0, with widelyoverlapping confidence intervals (Figure 2.2). In contrast, trials of BCGvaccination for prevention of tuberculosis32 (Figure 2.3) are clearlyheterogeneous. The findings of the UK trial, which indicate substantialbenefit of BCG vaccination are not compatible with those from theMadras or Puerto Rico trials which suggest little effect or only a modestbenefit. There is no overlap in the confidence intervals of the threetrials. Other graphical representations, discussed elsewhere, are particu-larly useful to detect and investigate heterogeneity. These includeGalbraith plots29 (see Chapter 9), L’Abbé plots33 (see Chapters 8, 10and 16) and funnel plots34 (see Chapter 11).
Statistical tests of homogeneity (also called tests for heterogeneity)assess whether the individual study results are likely to reflect a singleunderlying effect, as opposed to a distribution of effects. If this test fails
SYSTEMATIC REVIEWS IN HEALTH CARE
32
Figure 2.3 Forest plot of trials of BCG vaccine to prevent tuberculosis. Trialsare ordered according to the latitude of the study location, expressed as degreesfrom the equator. No meta-analysis is shown. Adapated from Colditz et al.32

33
Fig
ure
2.2
For
est
plot
sho
win
g to
tal
mor
talit
y fr
om t
rial
s of
bet
a-bl
ocke
rs i
n se
cond
ary
prev
enti
on a
fter
myo
card
ial
infa
rcti
on.
The
bla
ck s
quar
e an
d ho
rizo
ntal
lin
e co
rres
pond
to
the
rela
tive
ris
k an
d 95
% c
onfid
ence
int
erva
ls.
The
are
a of
the
bla
cksq
uare
s re
flect
s th
e w
eigh
t ea
ch t
rial
con
trib
utes
to
the
met
a-an
alys
is.
The
dia
mon
d at
the
bot
tom
of
the
grap
h re
pres
ents
the
com
bine
d re
lati
ve r
isk
and
its
95%
con
fiden
ce i
nter
val,
indi
cati
ng a
20%
red
ucti
on i
n th
e ri
sk o
f de
ath.
The
sol
id v
erti
cal
line
corr
espo
nds
to n
o ef
fect
of
trea
tmen
t (r
elat
ive
risk
1·0
), t
he d
otte
d ve
rtic
al l
ine
to t
he c
ombi
ned
rela
tive
ris
k (0
·8).
The
rel
ativ
eri
sk,
95%
con
fiden
ce i
nter
val
and
wei
ghts
are
als
o gi
ven
in t
abul
ar f
orm
. T
he g
raph
was
pro
duce
d in
ST
AT
A (
see
Cha
pter
18).
Ada
pted
fro
m F
reem
antl
e et
al.24

to detect heterogeneity among results, then it is assumed that thedifferences observed between individual studies are a consequence ofsampling variation and simply due to chance. A chi-square test ofhomogeneity gives P = 0·25 for the beta-blocker trials but P < 0·001 forthe BCG trials. The BCG trials are an extreme example, however, anda major limitation of statistical tests of homogeneity is their lack ofpower – they often fail to reject the null hypothesis of homogeneousresults even if substantial inter-study differences exist. Reviewers shouldtherefore not assume that a non-significant test of heterogeneityexcludes important heterogeneity. Heterogeneity between study resultsshould not be seen as purely a problem for systematic reviews, since italso provides an opportunity for examining why treatment effects differ in different circumstances, as discussed below and in Chapters 8and 9.
Methods for estimating a combined effect estimate
If, after careful consideration, a meta-analysis is deemed appropriate,the last step consists in estimating an overall effect by combining thedata. Two principles are important. Firstly, simply pooling the datafrom different studies and treating them as one large study would fail topreserve the randomisation and introduce bias and confounding. Forexample, a recent review and “meta-analysis” of the literature on therole of male circumcision in HIV transmission concluded that the riskof HIV infection was lower in uncircumcised men.35 However, theanalysis was performed by simply pooling the data from 33 diversestudies. A re-analysis stratifying the data by study found that an intactforeskin was in fact associated with an increased risk of HIV infection.36
Confounding by study thus led to a change in the direction of theassociation (a case of “Simpson’s paradox” in epidemiologicalparlance37). The unit of the trial must therefore always be maintainedwhen combining data.
Secondly, simply calculating an arithmetic mean would be inappro-priate. The results from small studies are more subject to the play ofchance and should, therefore, be given less weight. Methods used formeta-analysis employ a weighted average of the results in which thelarger trials generally have more influence than the smaller ones. Thereare a variety of statistical techniques available for this purpose (seeChapter 15), which can be broadly classified into two models.38 Thedifference consists in the way the variability of the results between thestudies is treated. The “fixed effects” model considers this variability asexclusively due to random variation and individual studies are simplyweighted by their precision.39 Therefore, if all the studies were infinitely
SYSTEMATIC REVIEWS IN HEALTH CARE
34
large they would give identical results. The main alternative, the “randomeffects” model,40 assumes a different underlying effect for each study andtakes this into consideration as an additional source of variation. Effectsare assumed to be randomly distributed and the central point of thisdistribution is the focus of the combined effect estimate. The randomeffects model leads to relatively more weight being given to smallerstudies and to wider confidence intervals than the fixed effects model.The use of random effects models has been advocated if there is hetero-geneity between study results. This is problematic, however. Ratherthan simply ignoring it after applying some statistical model, theapproach to heterogeneity should be to scrutinise, and attempt toexplain it.30,31
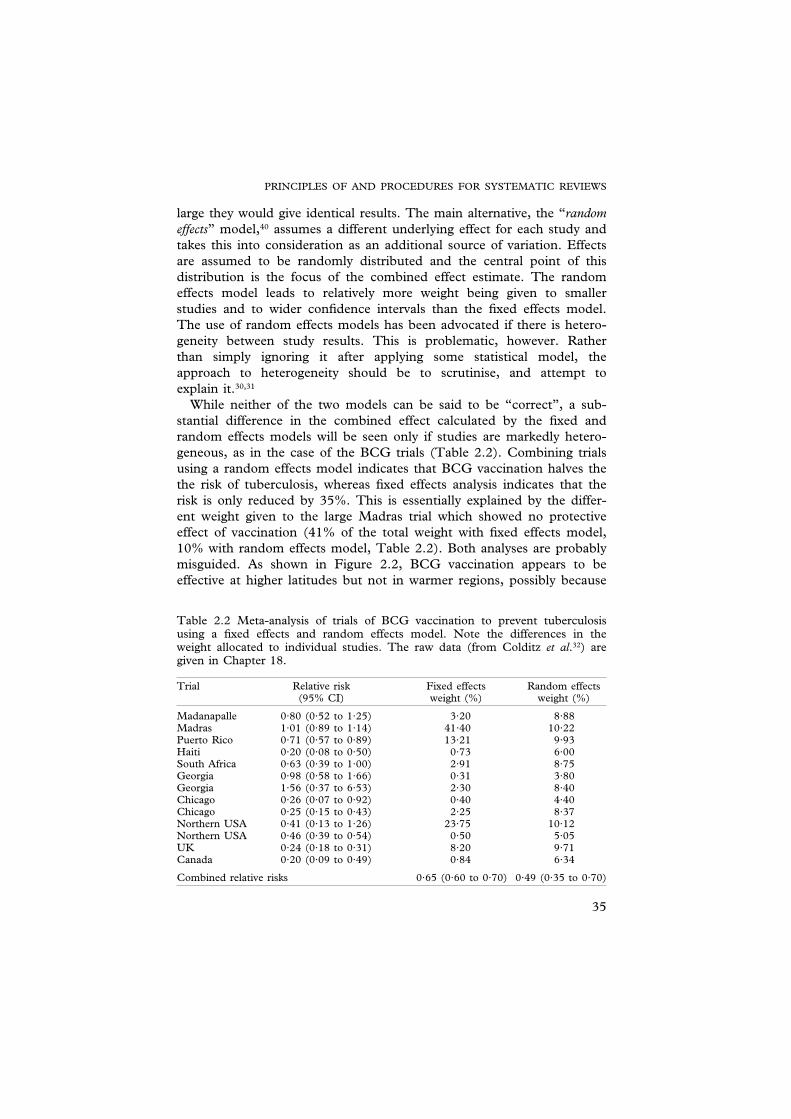
While neither of the two models can be said to be “correct”, a sub-stantial difference in the combined effect calculated by the fixed andrandom effects models will be seen only if studies are markedly hetero-geneous, as in the case of the BCG trials (Table 2.2). Combining trialsusing a random effects model indicates that BCG vaccination halves thethe risk of tuberculosis, whereas fixed effects analysis indicates that therisk is only reduced by 35%. This is essentially explained by the differ-ent weight given to the large Madras trial which showed no protectiveeffect of vaccination (41% of the total weight with fixed effects model,10% with random effects model, Table 2.2). Both analyses are probablymisguided. As shown in Figure 2.2, BCG vaccination appears to beeffective at higher latitudes but not in warmer regions, possibly because
PRINCIPLES OF AND PROCEDURES FOR SYSTEMATIC REVIEWS
35
Table 2.2 Meta-analysis of trials of BCG vaccination to prevent tuberculosisusing a fixed effects and random effects model. Note the differences in theweight allocated to individual studies. The raw data (from Colditz et al.32) aregiven in Chapter 18.
Trial Relative risk Fixed effects Random effects(95% CI) weight (%) weight (%)
Madanapalle 0·80 (0·52 to 1·25) 3·20 8·88Madras 1·01 (0·89 to 1·14) 41·40 10·22Puerto Rico 0·71 (0·57 to 0·89) 13·21 9·93Haiti 0·20 (0·08 to 0·50) 0·73 6·00South Africa 0·63 (0·39 to 1·00) 2·91 8·75Georgia 0·98 (0·58 to 1·66) 0·31 3·80Georgia 1·56 (0·37 to 6·53) 2·30 8·40Chicago 0·26 (0·07 to 0·92) 0·40 4·40Chicago 0·25 (0·15 to 0·43) 2·25 8·37Northern USA 0·41 (0·13 to 1·26) 23·75 10·12Northern USA 0·46 (0·39 to 0·54) 0·50 5·05UK 0·24 (0·18 to 0·31) 8·20 9·71Canada 0·20 (0·09 to 0·49) 0·84 6·34
Combined relative risks 0·65 (0·60 to 0·70) 0·49 (0·35 to 0·70)

exposure to certain environmental mycobacteria acts as a “natural”BCG inoculation in warmer regions.41 In this situation it is moremeaningful to quantify how the effect varies according to latitude thanto calculate an overall estimate of effect which will be misleading,independent of the model used (see Chapter 18 for further analyses ofthe BCG trials).
Bayesian meta-analysis
There are other statistical approaches, which some feel are moreappropriate than either of the above. One uses Bayes’ theorem, namedafter the 18th century English clergyman Thomas Bayes.42–44 Bayesianstatisticians express their belief about the size of an effect by specifyingsome prior probability distribution before seeing the data – and thenupdate that belief by deriving a posterior probability distribution, takingthe data into account.45 Bayesian models are available in both a fixedand random effects framework but published applications have usuallybeen based on the random effects assumption. The confidence interval(or more correctly in bayesian terminology: the 95% credible intervalwhich covers 95% of the posterior probability distribution) will beslightly wider than that derived from using the conventional models.46,47
Bayesian methods allow probability statements to be made directlyregarding, for example, the comparative effects of two treatments (“theprobability that treatment A is better than B is 0·99”).48 Bayesianapproaches to meta-analysis can integrate other sources of evidence, forexample findings from observational studies or expert opinion and areparticularly useful for analysing the relationship between treatmentbenefit and underlying risk (see Chapter 10).44,49 Finally, they provide anatural framework for cumulative meta-analysis.49,50
Bayesian approaches are, however, controversial because the definitionof prior probability will often involve subjective assessments and opinionwhich runs against the principles of systematic review. Furthermore,analyses are complex to implement and time consuming. More method-ological research is required to define the appropriate place of bayesianmethods in systematic reviews and meta-analysis.44,49
Sensitivity analysis
There will often be diverging opinions on the correct method forperforming a particular meta-analysis. The robustness of the findings todifferent assumptions should therefore always be examined in athorough sensitivity analysis. This is illustrated in Figure 2.4 for thebeta-blocker after myocardial infarction meta-analysis.24 First, the overall
SYSTEMATIC REVIEWS IN HEALTH CARE
36

effect was calculated by different statistical methods, both using a fixedand a random effects model. It is evident from the figure that the over-all estimate is virtually identical and that confidence intervals are onlyslightly wider when using the random effects model. This is explainedby the relatively small amount of between trial variation present in thismeta-analysis.
Methodological quality was assessed in terms of concealment of alloca-tion of study participants to beta-blocker or control groups and blinding ofpatients and investigators.24 Figure 2.4 shows that the estimated treatmenteffect was similar for studies with and without concealment of treatmentallocation. The eight studies that were not double-blind indicated morebenefit than the 25 double-blind trials but confidence intervals overlapwidely. Statistically significant results are more likely to get published thannon-significant findings51 and this can distort the findings of meta-analyses(see Chapter 3). Whether such publication bias is present can be examinedby stratifying the analysis by study size. Smaller effects can be statisticallysignificant in larger studies. If publication bias is present, it is expected thatof published studies, the larger ones will report the smaller effects. The
PRINCIPLES OF AND PROCEDURES FOR SYSTEMATIC REVIEWS
37
Figure 2.4 Sensitivity analyses examining the robustness of the effect on totalmortality of beta-blockers in secondary prevention after myocardial infarction.The dotted vertical line corresponds to the combined relative risk from the fixedeffects model (0·8).

figure shows that in the present example this is indeed the case with the 11smallest trials (25 deaths or less) showing the largest effect. However,exclusion of the smaller studies has little effect on the overall estimate.Studies varied in terms of length of follow up but this again had little effecton estimates. Finally, two trials52,53 were terminated earlier than anticipatedon the grounds of the results from interim analyses. Estimates of treatmenteffects from trials which were stopped early because of a significanttreatment difference are liable to be biased away from the null value. Biasmay thus be introduced in a meta-analysis which includes such trials.54
Exclusion of these trials, however, again affects the overall estimate onlymarginally.
The sensitivity analysis thus shows that the results from this meta-analysis are robust to the choice of the statistical method and to theexclusion of trials of lesser quality or of studies terminated early. It alsosuggests that publication bias is unlikely to have distorted its findings.
Relative or absolute measures of effect?
The relative risk of death associated with the use of beta-blockersafter myocardial infarction is 0·80 (95% confidence interval 0·74 to0·86) (Figure 2.2). The relative risk reduction, obtained by substractingthe relative risk from 1 and expressing the result as a percentage, is20% (95% confidence interval 14 to 26%). The relative measuresignore the underlying absolute risk. The risk of death among patientswho have survived the acute phase of myocardial infarction, however,varies widely.55 For example, among patients with three or more cardiacrisk factors, the probability of death at two years after discharge rangedfrom 24 to 60%.55 Conversely, two-year mortality among patients withno risk factors was less than three percent. The absolute risk reduction, orrisk difference, reflects both the underlying risk without therapy and therisk reduction associated with therapy. Taking the reciprocal of the riskdifference gives the number of patients who need to be treated toprevent one event, which is abbreviated to NNT or NNT(benefit).27
The number of patients that need to be treated to harm one patient,denoted as NNH or, more appropriately, NNT(harm)56 can also becalculated.
For a baseline risk of one per cent per year, the absolute riskdifference indicates that two deaths are prevented per 1000 treatedpatients (Table 2.3). This corresponds to 500 patients (1 divided by0·002) treated for one year to prevent one death. Conversely, if the riskis above 10%, less than 50 patients have to be treated to prevent onefatal event. Many clinicians would probably decide not to treat patientsat very low risk, considering the large number of patients who would
SYSTEMATIC REVIEWS IN HEALTH CARE
38

have to be exposed to the adverse effects of beta-blockade to postponeone death. Appraising the NNT from a patient’s estimated risk withouttreatment, and the relative risk reduction with treatment, is a helpful aidwhen making a decision in an individual patient. A nomogram to deter-mine NNTs at the bedside is available57 and confidence intervals can becalculated.56
Meta-analysis using absolute effect measures such as the risk differencemay be useful to illustrate the range of absolute effects across studies.The combined risk difference (and the NNT calculated from it) will,however, be essentially determined by the number and size of trials inlow, intermediate and high-risk patients. Combined results will thus beapplicable only to patients at levels of risk corresponding to the averagerisk of the trial participants. It is therefore generally more meaningful touse relative effect measures when summarising the evidence whileconsidering absolute measures when applying it to a specific clinical orpublic health situation. The use of numbers-needed-to-treat in meta-analysis is discussed in more detail in Chapter 20.
Conclusions
Systematic reviews involve structuring the processes through which athorough review of previous research is carried out. The issues of thecompleteness of the evidence identified, the quality of component studiesand the combinability of evidence are made explicit. How likely is itthat publication and related biases have been avoided? Is it sensible tocombine the individual trials in meta-analysis or is there heterogeneitybetween individual study results which renders the calculation of an
PRINCIPLES OF AND PROCEDURES FOR SYSTEMATIC REVIEWS
39
Table 2.3 Beta-blockade in secondary prevention after myocardial infarction.Absolute risk reductions and numbers-needed-to-treat for one year to preventone death, NNT(benefit), for different levels of control group mortality.
One-year mortality Absolute risk reduction NNT(benefit)risk among controls
(%)
1 0·002 5003 0·006 1675 0·01 100
10 0·02 5020 0·04 2530 0·06 1740 0·08 1350 0·1 10
Calculations assume a constant relative risk reduction of 20%.

overall estimate questionable? If meta-analysis was performed, howrobust are the results to changes in assumptions? Finally, has the analy-sis contributed to the process of making rational health care decisions?These issues will be considered in more depth in the following chapters.
Acknowledgements
This chapter draws on material published earlier in the BMJ.58
We are grateful to Iain Chalmers for helpful comments on an earlierdraft of this chapter.
1 Gelber RD, Goldhirsch A. From the overview to the patient: how to interpret meta-analysis data. Recent Results Cancer Res 1993;127:167–76.
2 Oxman AD, Guyatt GH. A consumer’s guide to subgroup analyses. Ann Intern Med1992;116:78–84.
3 Sacks H, Chalmers TC, Smith H Jr. Randomized versus historical controls for clinicaltrials. Am J Med 1982;72:233–40.
4 Schulz KF, Chalmers I, Hayes RJ, Altman D. Empirical evidence of bias. Dimensionsof methodological quality associated with estimates of treatment effects in controlledtrials. JAMA 1995;273:408–12.
5 Moher D, Pham B, Jones A, et al. Does quality of reports of randomised trials affectestimates of intervention efficacy reported in meta-analyses? Lancet 1998;352:609–13.
6 Prendiville W, Elbourne D, Chalmers I. The effects of routine oxytocic administrationin the management of the third stage of labour: an overview of the evidence fromcontrolled trials. Br J Obstet Gynaecol 1988;95:3–16.
7 Moher D, Jadad AR, Tugwell P. Assessing the quality of randomized controlled trials.Current issues and future directions. Int J Technol Assess Hlth Care 1996;12:195–208.
8 Begg C, Cho M, Eastwood S, et al. Improving the quality of reporting of randomizedcontrolled trials. The CONSORT statement. JAMA 1996;276:637–9.
9 Schulz KF. Randomised trials, human nature, and reporting guidelines. Lancet1996;348:596–8.
10 Jüni P, Witschi A, Bloch R, Egger M. The hazards of scoring the quality of clinicaltrial for meta-analysis. JAMA 1999;282:1054–60.
11 Smith BJ, Darzins PJ, Quinn M, Heller RF. Modern methods of searching the medicalliterature. Med J Aust 1992;157:603–11.
12 Dickersin K. Research registers. In: Cooper H, Hedges LV, eds. The handbook ofresearch synthesis. New York: Russell Sage Foundation, 1994.
13 Chalmers TC, Celano P, Sacks HS, Smith H. Bias in treatment assignment incontrolled clinical trials. N Engl J Med 1983;309:1358–61.
14 Sackett DL, Gent M. Controversy in counting and attributing events in clinical trials.N Engl J Med 1979;301:1410–12.
15 Peduzzi P, Wittes J, Detre K, Holford T. Analysis as-randomized and the problem ofnon-adherence: an example from the veterans affairs randomized trial of coronaryartery bypass surgery. Stat Med 1993;12:1185–95.
16 May GS, Demets DL, Friedman LM, Furberg C, Passamani E. The randomizedclinical trial: bias in analysis. Circulation 1981;64:669–73.
17 Moher D, Jadad AR, Nichol G, Penman M, Tugwell P, Walsh S. Assessing the qualityof randomized controlled trials: an annotated bibliography of scales and checklists.Controlled Clin Trials 1995;16:62–73.
18 Greenland S. Quality scores are useless and potentially misleading. Am J Epidemiol1994;140:300–2.
19 Jadad AR, Moore RA, Carrol D, et al. Assessing the quality of reports of randomizedclinical trials: is blinding necessary? Controlled Clin Trials 1996;17:1–12.
SYSTEMATIC REVIEWS IN HEALTH CARE
40

20 Chalmers TC. Problems induced by meta-analyses. Stat Med 1991;10:971–80.21 Moher D, Fortin P, Jadad AR, et al. Completeness of reporting of trials published in
languages other than English: implications for conduct and reporting of systematicreviews. Lancet 1996;347:363–6.
22 Berlin JA, on behalf of University of Pennsylvania Meta-analysis Blinding Study Group.Does blinding of readers affect the results of meta-analyses? Lancet 1997;350:185–6.
23 Cochrane Reviewer’s Handbook (updated July 1999). In: The Cochrane Library (databaseon disk and CD-ROM). The Cochrane Collaboration. Oxford: Update Software, 1999.
24 Freemantle N, Cleland J, Young P, Mason J, Harrison J. Beta blockade after myocar-dial infarction: systematic review and meta regression analysis. BMJ 1999;318:1730–7.
25 Sackett DL, Deeks JJ, Altman D. Down with odds ratios! Evidence-Based Med1996;1:164–7.
26 Deeks J. When can odds ratios mislead? BMJ 1998;317:1155.27 Laupacis A, Sackett DL, Roberts RS. An assessment of clinically useful measures of
the consequences of treatment. N Engl J Med 1988;318:1728–33.28 Gøtzsche PC. Sensitivity of effect variables in rheumatoid arthritis: a meta-analysis of
130 placebo controlled NSAID trials. J Clin Epidemiol 1990;43:1313–18.29 Galbraith R. A note on graphical presentation of estimated odds ratios from several
clinical trials. Stat Med 1988;7:889–94.30 Bailey K. Inter-study differences: how should they influence the interpretation and
analysis of results? Stat Med 1987;6:351–8.31 Thompson SG. Why sources of heterogeneity in meta-analysis should be investigated.
BMJ 1994;309:1351–5.32 Colditz GA, Brewer TF, Berkley CS, et al. Efficacy of BCG vaccine in the prevention
of tuberculosis. JAMA 1994;271:698–702.33 L’Abbé KA, Detsky AS, O’Rourke K. Meta-analysis in clinical research. Ann Intern
Med 1987;107:224–33.34 Light RJ, Pillemer DB. Summing up. The science of reviewing research. Cambridge, MA:
Harvard University Press, 1984.35 Van Howe RS. Circumcision and HIV infection: review of the literature and meta-
analysis. Int J STD AIDS 1999;10:8–16.36 O’Farrell N, Egger M. Circumcision in men and the prevalence of HIV infection: a
meta-analysis revisited. Int J STD AIDS 2000; 11:137–42.37 Last JM. A dictionary of epidemiology. New York: Oxford University Press, 1995.38 Berlin J, Laird NM, Sacks HS, Chalmers TC. A comparison of statistical methods for
combining event rates from clinical trials. Stat Med 1989;8:141–51.39 Yusuf S, Peto R, Lewis J, Collins R, Sleight P. Beta blockade during and after
myocardial infarction: an overview of the randomized trials. Prog Cardiovasc Dis1985;17:335–71.
40 DerSimonian R, Laird N. Meta-analysis in clinical trials. Controlled Clin Trials1986;7:177–88.
41 Fine PEM. Variation in protection by BCG: implications of and for heterologousimmunity. Lancet 1995;346:1339–45.
42 Carlin JB. Meta-analysis for 2 × 2 tables: a Bayesian approach. Stat Med1992;11:141–58.
43 Bland JM, Altman DG. Bayesians and frequentists. BMJ 1998;317:1151.44 Spiegelhalter DJ, Myles JP, Jones DR, Abrams KR. An introduction to bayesian
methods in health technology assessment. BMJ 1999;319:508–12.45 Lilford RJ, Braunholtz D. The statistical basis of public policy: a paradigm shift is
overdue. BMJ 1996;313:603–7.46 Su XY, Li Wan Po A. Combining event rates from clinical trials: comparison of
bayesian and classical methods. Ann Pharmacother 1996;30:460–5.47 Thompson SG, Smith TC, Sharp SJ. Investigating underlying risk as a source of
heterogeneity in meta-analysis. Stat Med 1997;16:2741–58.48 Fredman L. Bayesian statistical methods. BMJ 1996;313:569–70.49 Song F, Abrams KR, Jones DR, Sheldon TA. Systematic reviews of trials and other
studies. Health Technol Assess 1998;2(19).
PRINCIPLES OF AND PROCEDURES FOR SYSTEMATIC REVIEWS
41

50 Eddy DM, Hasselblad V, Shachter R. Meta-analysis by the confidence profile method. Thestatistical synthesis of evidence. Boston: Academic Press, 1992.
51 Easterbrook PJ, Berlin J, Gopalan R, Matthews DR. Publication bias in clinicalresearch. Lancet 1991;337:867–72.
52 Anon. A randomized trial of propranolol in patients with acute myocardial infarction.I. Mortality results. JAMA 1982;247:1707–14.
53 Boissel JP, Leizorovicz A, Picolet H, Ducruet T. Efficacy of acebutolol after acutemyocardial infarction (the APSI trial). The APSI Investigators. Am J Cardiol1990;66:24C–31C.
54 Green S, Fleming TR, Emerson S. Effects on overviews of early stopping rules forclinical trials. Stat Med 1987;6:361–7.
55 The Multicenter Postinfarction Research Group. Risk stratification and survival aftermyocardial infarction. N Engl J Med 1983;309:331–6.
56 Altman DG. Confidence intervals for the number needed to treat. BMJ1998;317:1309–12.
57 Chatellier G, Zapletal E, Lemaitre D, Menard J, Degoulet P. The number needed totreat: a clinically useful nomogram in its proper context. BMJ 1996;312:426–9.
58 Egger M, Davey Smith G, Phillips AN. Meta-analysis: principles and procedures. BMJ1997;315:1533–7.
SYSTEMATIC REVIEWS IN HEALTH CARE
42