system s thinkin g basicspeople.sabanciuniv.edu/...systemsthinkingbasics.pdfsystems thinking basics:...
TRANSCRIPT

Systems Thinking Basics


Systems Thinking Basics
From Concepts to Causal Loops
Virginia AndersonAND Lauren Johnson
PEGASUS COMMUNICATIONS, INC.
Westford, Massachusetts
© 1997 by Pegasus Communications, Inc.First printing March 1997
All rights reserved. No part of this publication may be reproduced or transmitted in any form
or by any means, electronic or mechanical, including photocopying and recording, or by any
information storage or retrieval system, without written permission from the publisher.
For additional copies, information about other titles published by Pegasus Communications, Inc.,
or general inquiries, contact:
PEGASUS COMMUNICATIONS, INC.
319 Littleton Road, Suite 103
Westford, MA 01886 USA
Phone 800-272-0945 / 781-398-9700
Fax 781-894-7175
[email protected] [email protected]
www.pegasuscom.com
Library of Congress Cataloging-in-Publication Data
Anderson, Virginia, 1947–
Systems Thinking Basics: From Concepts to Causal Loops / by Virginia Anderson and Lauren Johnson.
p. cm.
ISBN 1-883823-12-9
1. Industrial management—Case studies—Problems, exercises, etc.
2. Systems analysis—Problems, exercises, etc. 3. Decision making—exercises, etc.
I. Johnson, Lauren. II. Title.
HD30. 19. A53 1997
658.4’032—dc21 96-39762
CIP
Acquiring editor: Kellie Wardman O’Reilly
Project editor: Lauren Johnson
Production, art, and design: Boynton Hue Studio
First edition.

To the Reader: Why Use This Book? vii
SECTION 1 WHAT ARE SYSTEMS? 1
What Is a System? 2
Events, Patterns, Structure 5
L E A R N I N G A C T I V I T I E S 101: Identifying Systems 102: Reflecting on System Characteristics 133: Understanding System Feedback 14
SECTION 2 WHAT IS SYSTEMS THINKING? 17
The Principles of Systems Thinking 18
Systems Thinking as a Special Language 20
L E A R N I N G A C T I V I T I E S 221: Stretching the Timeline 222: The Shape of the Problem 253: Is Time on Your Side? 294: From Short Term to Long Term 305: In the Midst of a Problem 34
SECTION 3 UNCOVERING SYSTEMIC STRUCTURES:DRAWING BEHAVIOR OVER TIME GRAPHS 37
Formulating a Problem 38
Identifying Variables 40
Drawing Behavior Over Time Graphs 42
L E A R N I N G A C T I V I T I E S 451: The Problem with Price Promotions 452: The Case of the Energy Drain 463: The Case of the Audio-Electronic Roller Coaster 48
v
C O N T E N T S

SECTION 4 UNCOVERING SYSTEMIC STRUCTURES:BUILDING CAUSAL LOOP DIAGRAMS 51
Anatomy of a Causal Loop Diagram 52
Building a Causal Loop Diagram 58
About Multiloop Diagrams 64
L E A R N I N G A C T I V I T I E S 651: The Case of the Plateauing Profits 652: The Case of the Collapsing Banks 663: The “Organic To Go” Story 674: The Case of the Restricted Revenues 705: The All-for-One Cooperative 736: The Problem with Used CDs 75
SECTION 5 COMPLEX SYSTEMS 77
Characteristics of Complex Systems 78
The Strengths and Weaknesses of Complex Systems 79
ComputeFast: The Story of a Complex System 80
SECTION 6 FROM LOOPS TO LEVERAGE:APPLYING AND PRACTICING SYSTEMS THINKING 87
The Do’s and Don’ts of Systems Thinking on the Job 88
Practicing Life-Long Systems Thinking 91
The Learning Journey 94
APPENDIX A: ADDITIONAL LEARNING ACTIVITIES 95
APPENDIX B: LEARNING ACTIVITY KEY POINTS AND SUGGESTED RESPONSES 105
APPENDIX C: A PALETTE OF SYSTEMS THINKING TOOLS 119
APPENDIX D: THE SYSTEMS ARCHETYPES 123
APPENDIX E: A GLOSSARY OF SYSTEMS THINKING TERMS 127
APPENDIX F: ADDITIONAL RESOURCES 131
vi CONTENTS
Congratulations! By picking up this book, you’ve taken the first step inlearning to use the powerful array of systems thinking tools. These toolsoffer a fresh, highly effective way to grasp the complexities of organi-
zational life and to address the stubborn problems that often confront us inthe business world. Systems Thinking Basics: From Concepts to Causal Loops isdesigned to help you discover the principles of systems and systems think-ing and begin actually using systems thinking tools. There is a broad paletteof systems thinking tools available; this book emphasizes two foundationaldevices: behavior over time graphs and causal loop diagrams.
Why Systems Thinking?
Why take time out of your busy schedule to read this book? Because systemsthinking offers a valuable new perspective on our most persistent organiza-tional problems and our role in them. One of the major points that systemsthinking makes is that everything—and everyone—is interconnected in aninfinitely complex network of systems. When we begin to see the world—and one another—through this “lens,” we start seeing our circumstances ina new light, taking more responsibility for our own role in problems, andidentifying more effective ways of addressing recurring difficulties. Systemsthinking has a power and a potential that, once you’ve been introduced, arehard to resist. You’ll learn more about the benefits of systems thinking inSection 2.
How to Use This Book
The world of systems and systems thinking marks a dramatic shift from themore linear, analytic way of thinking that many of us are used to. It’s espe-cially challenging to convey the abstract characteristics of systems in print.Because systems themselves are so complex and so interconnected witheverything around them, it’s also impossible to capture any one entire sys-tem on paper. For this reason, the tools and activities in this book are meantto offer primarily a glimpse into systems behavior.
We also hope you will see the book as the starting point to a long, learn-ing-filled journey. Systems research and theories are constantly evolving,and the concepts and tools in this book offer only one of many methods forlooking at the whole. When you finish the book, you can continue youradventure into exploring systems thinking tools by using some of theresources listed in Appendix F.
In writing Systems Thinking Basics, we not only needed to decide whattools to include; we had to choose a plan for sequencing the sections. We
vii
T O T H E R E A D E R
Why Use This Book?

opted for a format that allows each section to build on the one that camebefore, because that arrangement seemed best suited for new systemsthinkers. For this reason, we recommend that you read the sections innumerical order, although you are certainly free to choose a different orderdepending on your interests and your familiarity with the material. We alsohope that you’ll work as often as possible with others on the readings andactivities—it’s when people use systems thinking tools together that thesetools are their most potent.
Your journey through Systems Thinking Basics will begin with an explo-ration of the unique characteristics of systems (Section 1), and then moveon to a definition of systems thinking and an explanation of its importance,especially to organizational life (Section 2). In sections 3 and 4, you willhave the opportunity to create your own diagrams of systemic structures,step by step. Section 5 then gives you a taste of complex systems. Finally,Section 6 answers the question, “What next?,” by offering advice on prac-ticing systems thinking in your day-to-day life.
About the Learning Activities
Mastering systems thinking tools requires practice with lots of real-lifeexamples. Accordingly, each section in this book contains a wealth of illus-trations from the business world. Most sections then present a series oflearning activities that challenge you to apply your new knowledge. Thelearning activities can be done as self-study or in groups, but again, weencourage you to work in groups as much as possible. We invite you toshare with each other your responses to the activities and the insights yougain as you work with the activities.
The learning activities range from reflection and discussion to graphingand diagramming, and are filled with case studies adapted from recentanalyses published in leading business journals, including The SystemsThinker™ newsletter. There is also a section (Appendix A) that offers extralearning activities should you desire additional practice. For the majority ofthe learning activities, you can check your responses against the “LearningActivity Key Points and Suggested Responses” in Appendix B. Remember,however, that there is no one right way to describe and diagram a system.These activities, and the suggested responses, are meant to spark your imag-ination and serve as a starting point for you to think about systems.
Acknowledgments
The work contained in this book is built on the prior work of many others.First, we acknowledge Peter Senge for introducing the concept of systemsthinking to a broad management audience in The Fifth Discipline. In manyways, the tremendous success of his book is what made the writing of thisworkbook possible in the first place. We also acknowledge the many peoplewho were involved in the development of systems thinking principles, con-cepts, and tools before they ever appeared in The Fifth Discipline, includingJohn Sterman, Dennis Meadows, Dana Meadows, Michael Goodman, DavidKreutzer, Jenny Kemeny, Jack Pugh, George Richardson, James Lyneis,
viii TO THE READER � Why Use This Book?

Nathaniel Mass, Barry Richmond, and others. In addition, we thank all thesystems thinking workshop participants and contributors to The SystemsThinker newsletter, who have given us valuable insights into understandingand applying systems thinking to organizational life. Finally, we honor JayForrester’s brilliance and insight in founding the field of system dynamics,which we believe has much to contribute to the practice of management.
We’d like to thank the following colleagues who kindly reviewed themanuscript for this book. Each of them offered valuable insights andthoughtful suggestions that greatly strengthened the book:
Turina Bakken, MAQIN
Polly Bashore, General Motors
Dave Buffenbarger, New Dimensions in Learning
Lou Ann Daly, Innovation Associates
Richard Karash, Speaker, Facilitator, Trainer, “Towards LearningOrganizations”
Daniel H. Kim, The MIT Center for Organizational Learning, andPegasus Communications
Keith Perry, McClellan Air Force Base
Kellie Wardman O’Reilly, Pegasus Communications
Carol Ann Zulauf, Suffolk University
and, finally, all the folks at Coca-Cola:
Michael Canning, Connie Carroad, Dianne Culhane, Teresa Hogan,Scott Moyer, Cheryl Oates, and Rodolfo Salgado
We hope you’ll find your adventure into systems thinking stimulatingand rewarding on both a personal and a professional level. We also
invite you to contact us with any comments, questions, or suggestionsabout using this book or about systems thinking in general.
Bon voyage!
Virginia (“Prinny”) Anderson ([email protected])Lauren Johnson ([email protected])
TO THE READER � Why Use This Book? ix

Welcome to the world of systems and systems thinking! You may beasking yourself, Why is it important to explore systems? One reasonis that we live in and are influenced by systems all around us, from
the natural environment to healthcare, education, government, and fam-ily and organizational life. Understanding how these systems work lets usfunction more effectively and proactively within them. The more we buildour understanding of system behavior, the more we can anticipate thatbehavior and work with the system to shape the quality of our lives.
This section introduces you to the idea of systems and what makesthem unique. In the learning activities at the end of the section, you willhave the opportunity to identify some major systems in your own worklife and to think about typical system behavior.
1
S E C T I O N 1
What Are Systems?
WHAT IS A SYSTEM?
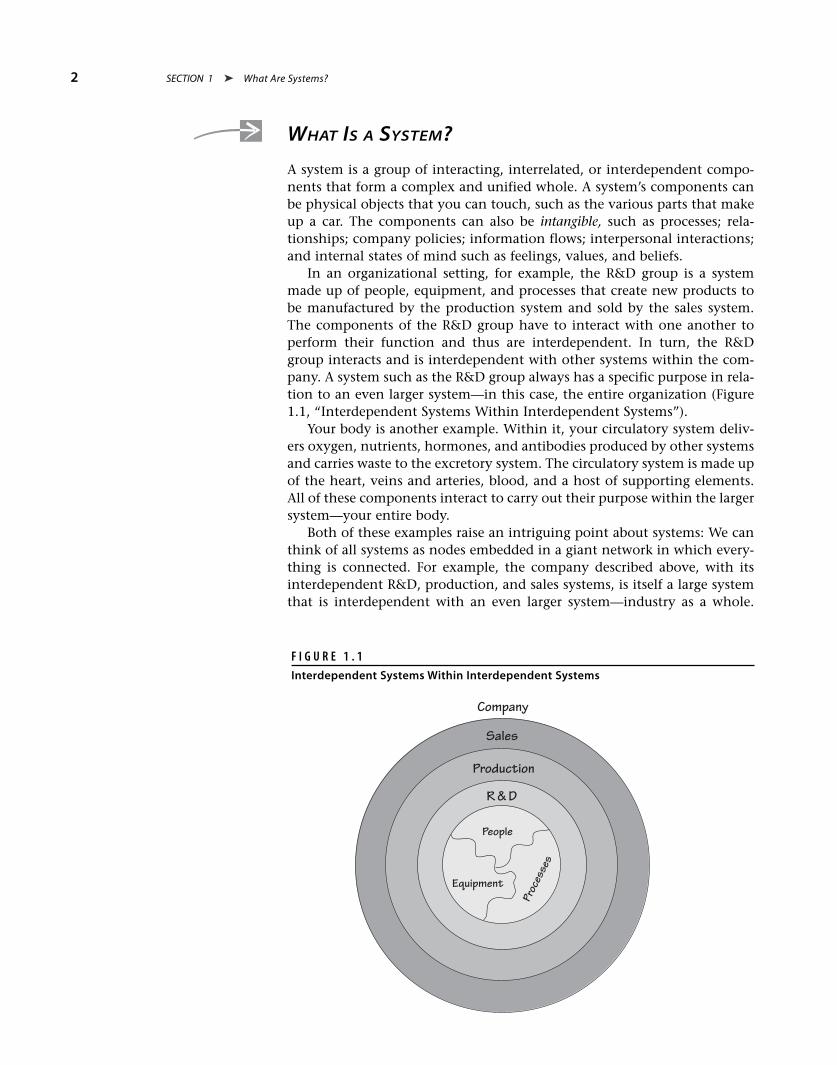
A system is a group of interacting, interrelated, or interdependent compo-nents that form a complex and unified whole. A system’s components canbe physical objects that you can touch, such as the various parts that makeup a car. The components can also be intangible, such as processes; rela-tionships; company policies; information flows; interpersonal interactions;and internal states of mind such as feelings, values, and beliefs.
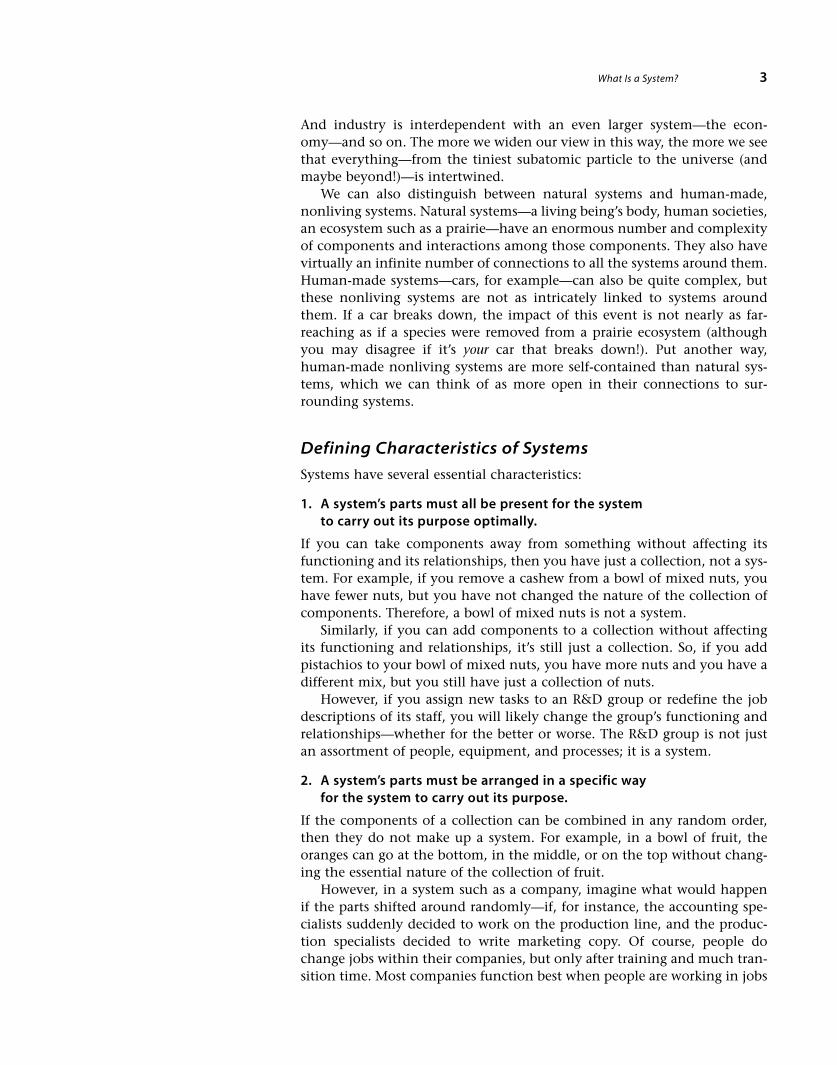
In an organizational setting, for example, the R&D group is a systemmade up of people, equipment, and processes that create new products tobe manufactured by the production system and sold by the sales system.The components of the R&D group have to interact with one another toperform their function and thus are interdependent. In turn, the R&Dgroup interacts and is interdependent with other systems within the com-pany. A system such as the R&D group always has a specific purpose in rela-tion to an even larger system—in this case, the entire organization (Figure1.1, “Interdependent Systems Within Interdependent Systems”).
Your body is another example. Within it, your circulatory system deliv-ers oxygen, nutrients, hormones, and antibodies produced by other systemsand carries waste to the excretory system. The circulatory system is made upof the heart, veins and arteries, blood, and a host of supporting elements.All of these components interact to carry out their purpose within the largersystem—your entire body.
Both of these examples raise an intriguing point about systems: We canthink of all systems as nodes embedded in a giant network in which every-thing is connected. For example, the company described above, with itsinterdependent R&D, production, and sales systems, is itself a large systemthat is interdependent with an even larger system—industry as a whole.
2 SECTION 1 � What Are Systems?
Equipment
People
Proc
esse
s
R & D
Production
Sales
Company
F I G U R E 1 . 1
Interdependent Systems Within Interdependent Systems
And industry is interdependent with an even larger system—the econ-omy—and so on. The more we widen our view in this way, the more we seethat everything—from the tiniest subatomic particle to the universe (andmaybe beyond!)—is intertwined.
We can also distinguish between natural systems and human-made,nonliving systems. Natural systems—a living being’s body, human societies,an ecosystem such as a prairie—have an enormous number and complexityof components and interactions among those components. They also havevirtually an infinite number of connections to all the systems around them.Human-made systems—cars, for example—can also be quite complex, butthese nonliving systems are not as intricately linked to systems aroundthem. If a car breaks down, the impact of this event is not nearly as far-reaching as if a species were removed from a prairie ecosystem (althoughyou may disagree if it’s your car that breaks down!). Put another way,human-made nonliving systems are more self-contained than natural sys-tems, which we can think of as more open in their connections to sur-rounding systems.
Defining Characteristics of Systems
Systems have several essential characteristics:
1. A system’s parts must all be present for the systemto carry out its purpose optimally.
If you can take components away from something without affecting itsfunctioning and its relationships, then you have just a collection, not a sys-tem. For example, if you remove a cashew from a bowl of mixed nuts, youhave fewer nuts, but you have not changed the nature of the collection ofcomponents. Therefore, a bowl of mixed nuts is not a system.
Similarly, if you can add components to a collection without affectingits functioning and relationships, it’s still just a collection. So, if you addpistachios to your bowl of mixed nuts, you have more nuts and you have adifferent mix, but you still have just a collection of nuts.
However, if you assign new tasks to an R&D group or redefine the jobdescriptions of its staff, you will likely change the group’s functioning andrelationships—whether for the better or worse. The R&D group is not justan assortment of people, equipment, and processes; it is a system.
2. A system’s parts must be arranged in a specific wayfor the system to carry out its purpose.
If the components of a collection can be combined in any random order,then they do not make up a system. For example, in a bowl of fruit, theoranges can go at the bottom, in the middle, or on the top without chang-ing the essential nature of the collection of fruit.
However, in a system such as a company, imagine what would happenif the parts shifted around randomly—if, for instance, the accounting spe-cialists suddenly decided to work on the production line, and the produc-tion specialists decided to write marketing copy. Of course, people dochange jobs within their companies, but only after training and much tran-sition time. Most companies function best when people are working in jobs
What Is a System? 3
that match their skills and experience, and when the staff is organizedaccording to a specific plan.
3. Systems have specific purposes within larger systems.
All systems have a specific purpose in relationship to the larger system inwhich they’re embedded, as we saw in the examples of the R&D departmentand human circulatory system above. Because each system has its own pur-pose, each is a discrete entity and has a kind of integrity that holds ittogether. In other words, you can’t force two or more systems together andget a new, single, larger system. Nor can you subdivide a system and auto-matically end up with two smaller identical, functioning systems.
As the saying goes, if you divide an elephant in half, you don’t end upwith two smaller elephants. And if you put two small elephants together,you don’t have a new, single, larger elephant (although some day you mayend up with a new system—known as a herd!).
4. Systems maintain their stability through fluctuationsand adjustments.
Left to themselves, systems seek to maintain their stability. Your organiza-tion does its best to maintain a designated profit margin just as mosthuman bodies work to maintain a temperature of about 98.6 degreesFahrenheit. If you examined your organization’s revenues against expendi-tures every week or graphed your body temperature every five minutes, youwould probably draw a wobbly, fluctuating line that nevertheless holdssteady overall. Margins appear and disappear as a company pays its suppli-ers and collects checks from customers. Your body temperature rises andfalls depending on your mood and your level of physical exertion. On aver-age, however, your body temperature remains stable. And, with reasonablemanagement and no cataclysmic change, your organization’s margin alsoremains stable overall.
Systems achieve this stability through the interactions, feedback, andadjustments that continually circulate among the system parts, andbetween the system and its environment. Let’s say a corporation receives anunusually large stack of suppliers’ invoices (external stimuli) in the mail.The accounts payable department responds by paying the bills. As thechecks go out the door, the accounting department, alarmed, compares rev-enue versus expenditures and gives feedback to management: Expendituresare up and revenues aren’t covering them. Management then adjusts thesystem by reminding key customers to pay overdue invoices. Similarly, ifyou go for a run, your exertion warms your body. The sensation of heat isfed back to your sweat glands, which begin to work. Over time, sweatingreadjusts your temperature back to the norm.
5. Systems have feedback.
Feedback is the transmission and return of information. For example, imag-ine that you are steering your car into a curve. If you turn too sharply, youreceive visual cues and internal sensations that inform you that you areturning too much. You then make adjustments to correct the degree of yourturn. The most important feature of feedback is that it provides the catalystfor a change in behavior.
4 SECTION 1 � What Are Systems?

A system has feedback within itself. But because all systems are part oflarger systems, a system also has feedback between itself and external sys-tems. In some systems, the feedback and adjustment processes happen soquickly that it is relatively easy for an observer to follow. In other systems,it may take a long time before the feedback is returned, so an observerwould have trouble identifying the action that prompted the feedback. Forexample, if you sunbathed a lot in your teens, you may develop skin prob-lems after age 40—but because so much time passed between the twoevents, you may not recognize the connection between them.
Finally, feedback is not necessarily transmitted and returned through thesame system component—or even through the same system. It may travelthrough several intervening components within the system first, or returnfrom an external system, before finally arriving again at the componentwhere it started.
For instance, imagine that the company you work for is suffering finan-cially and decides to lay off 20 percent of the work force. That quarter, thelayoff does indeed improve the looks of the financial bottom line. On thisbasis, the upper management might decide that layoffs are a reliable way toimprove the financial picture.
However, let’s say you survived the layoff; how would you describe yourstate of mind and that of your other remaining colleagues? Besides cuttingcosts, layoffs are also famous for damaging morale and driving people to“jump ship” in search of more secure waters. Eventually, as low morale per-sists, you and your colleagues might start coming to work late and leavingearly, and caring less and less about the quality of your work. Productivitycould drop. In addition, everyone who leaves—whether voluntarily or bybeing laid off—takes valuable skills and experience with them, so the over-all capability of the work force goes down, further hurting productivity.Lowered productivity leads to expensive mistakes and lost sales from dis-gruntled customers. All this eats away even more at the company’s revenue,tempting management to think about having even more layoffs to cutcosts.
In this example, the feedback that made layoffs look like good policywas returned quickly—probably within one quarter. The feedback about thelong-term costs of layoffs went through more steps and took a lot longer toreturn. Yet this information was essential for the management team to seethe full impact of their decisions.
EVENTS, PATTERNS, STRUCTURE
In reading all this information, you may be wondering what actually givesrise to systems. Systems are built on structures that leave evidence of theirpresence, like fingerprints or tire marks, even if you can’t see them. Butwhat is structure, exactly? The concept is difficult to describe. In simplestterms, structure is the overall way in which the system components areinterrelated—the organization of a system. Because structure is defined bythe interrelationships of a system’s parts, and not the parts themselves, struc-ture is invisible. (As we’ll see later, however, there are ways to draw ourunderstanding of a system’s structure.)
What Is a System? 5
Why is it important to understand a system’s structure? Because it’s sys-tem structure that gives rise to—that explains—all the events and trendsthat we see happening in the world around us.
Perhaps the best way to grasp the role of structure is to explore theEvents / Patterns / Structure pyramid, shown in Figure 1.2.
Events
We live in an event-focused society (Figure 1.3, “The Tip of the Pyramid”).A fire breaks out in the neighborhood; a project misses a deadline; amachine breaks down. We tend to focus on events rather than think abouttheir causes or how they fit into a larger pattern. This isn’t surprising; in ourevolutionary development as a species, this ability to respond to immediateevents ensured our very survival.
But focusing on events is like wearing blinders: You can only react toeach new event rather than anticipate and shape them. What’s more, solu-tions designed at the event level tend to be short lived. Most important,they do nothing to alter the fundamental structure that caused that event.For example, if a building is burning, you would want local firefighters toreact by putting out the fire. This is a necessary and essential action. How-ever, if it is the only action ever taken, it is inadequate from a systems think-ing perspective. Why? Because it has solved the immediate problem buthasn’t changed the underlying structure that caused the fire, such as inad-equate building codes, lack of sprinkler systems, and so on.
By uncovering the elusive systemic structure that drives events, you canbegin identifying higher-leverage actions. The next step to comprehendingsystemic structure is to move from thinking at the event level to thinkingat the pattern level.
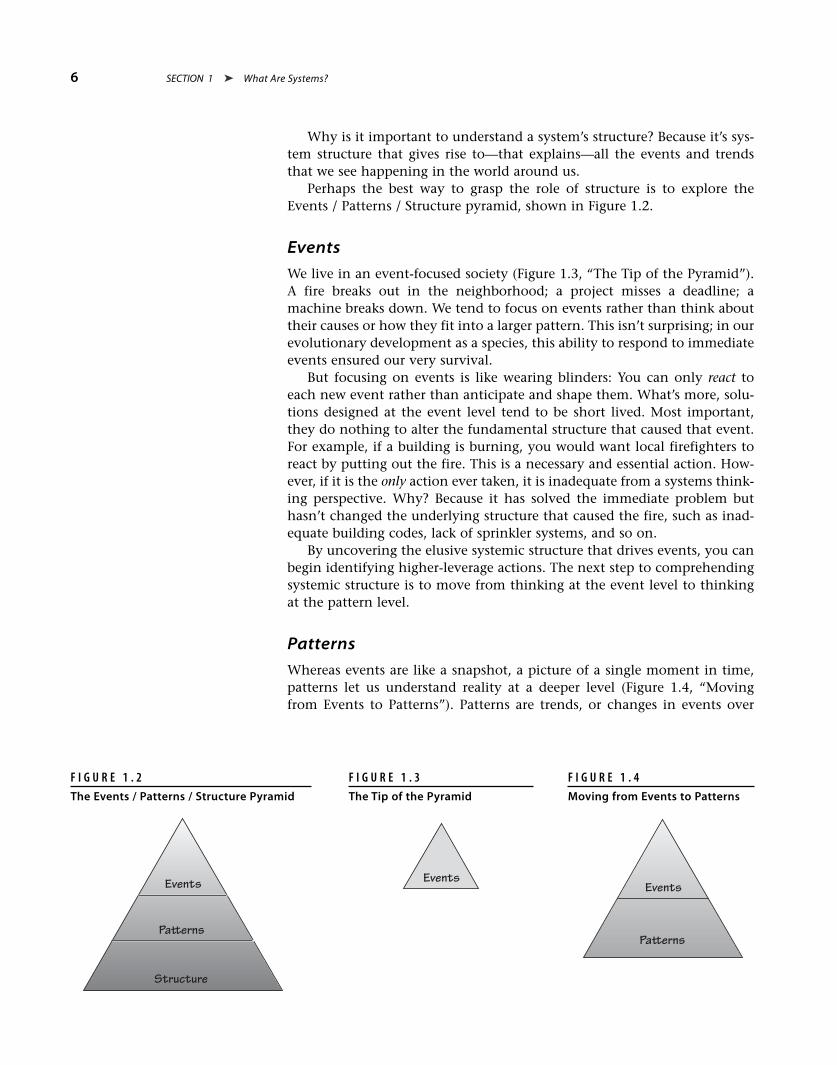
Patterns
Whereas events are like a snapshot, a picture of a single moment in time,patterns let us understand reality at a deeper level (Figure 1.4, “Movingfrom Events to Patterns”). Patterns are trends, or changes in events over
6 SECTION 1 � What Are Systems?
F I G U R E 1 . 2
The Events / Patterns / Structure Pyramid
Events
Pa�erns
Structure
F I G U R E 1 . 3
The Tip of the Pyramid
Events
F I G U R E 1 . 4
Moving from Events to Patterns
Events
Pa�erns
time. Whenever you see a pattern of events—for example, sales have beendeclining over the past few years, or two-thirds of the department’s projectshave gone over budget in the last year, or several senior engineers have leftthe company recently, most of them in the last six months—you’re gettingone step closer to grasping the systemic structure driving that pattern.
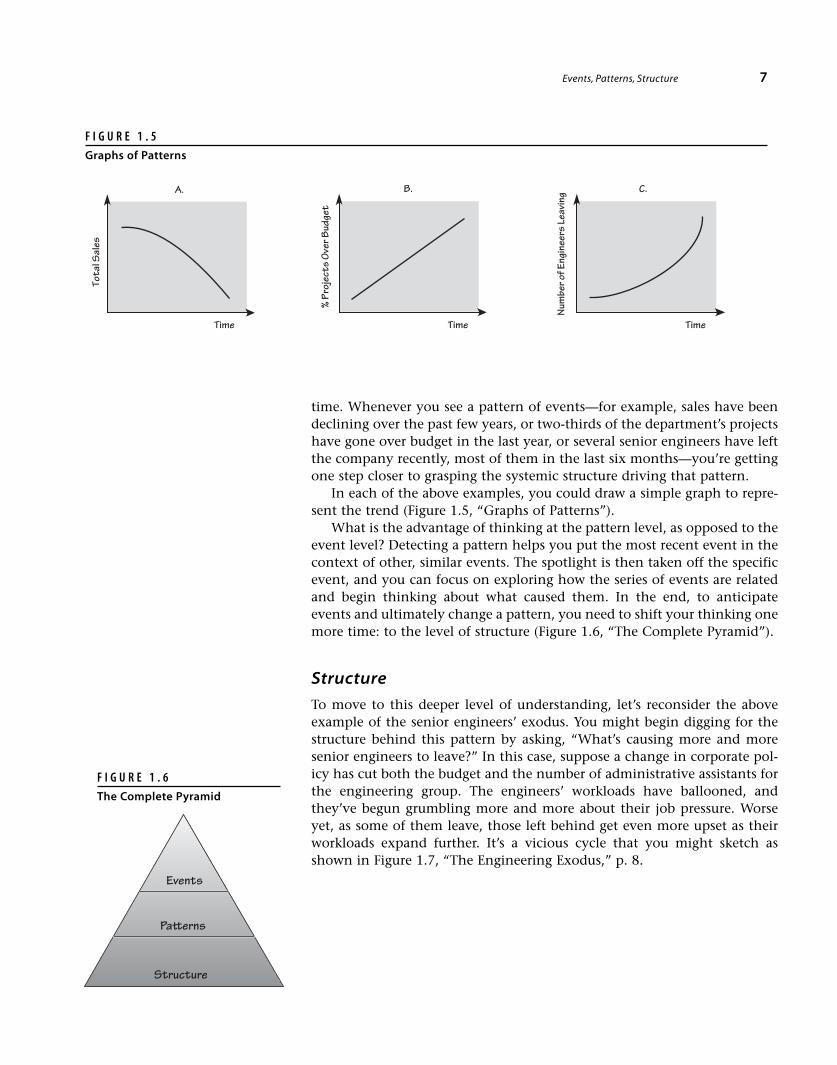
In each of the above examples, you could draw a simple graph to repre-sent the trend (Figure 1.5, “Graphs of Patterns”).
What is the advantage of thinking at the pattern level, as opposed to theevent level? Detecting a pattern helps you put the most recent event in thecontext of other, similar events. The spotlight is then taken off the specificevent, and you can focus on exploring how the series of events are relatedand begin thinking about what caused them. In the end, to anticipateevents and ultimately change a pattern, you need to shift your thinking onemore time: to the level of structure (Figure 1.6, “The Complete Pyramid”).
Structure
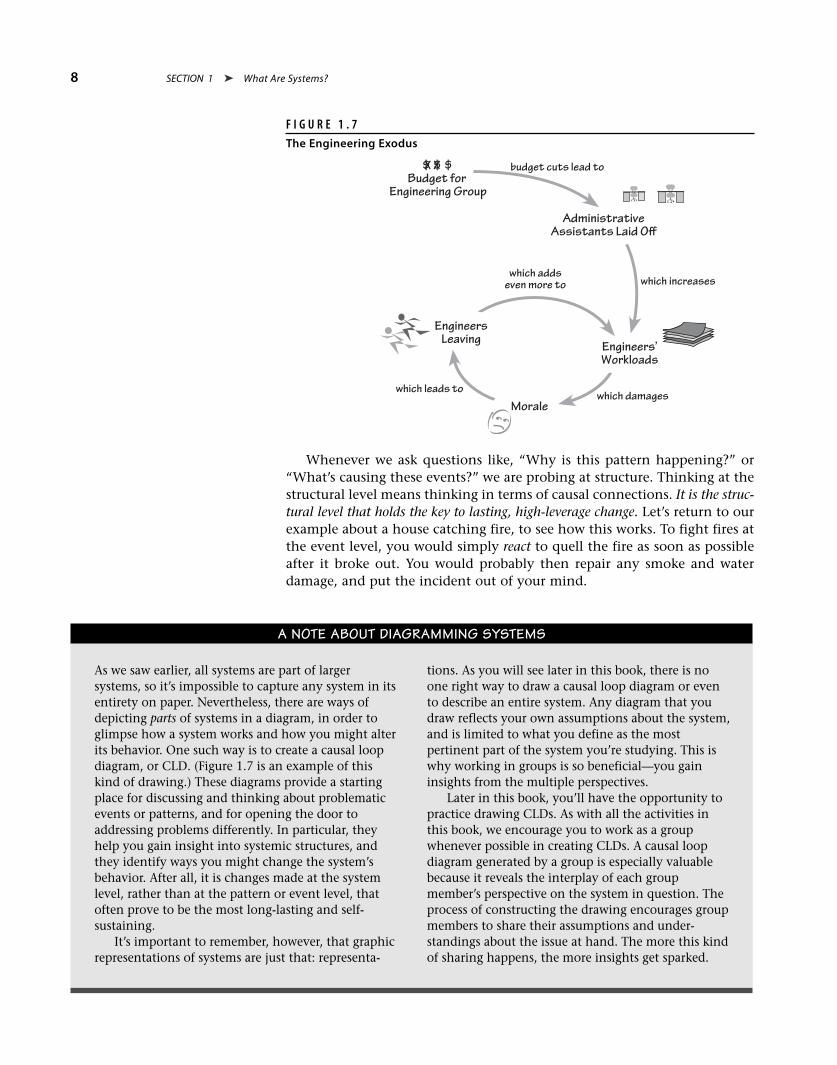
To move to this deeper level of understanding, let’s reconsider the aboveexample of the senior engineers’ exodus. You might begin digging for thestructure behind this pattern by asking, “What’s causing more and moresenior engineers to leave?” In this case, suppose a change in corporate pol-icy has cut both the budget and the number of administrative assistants forthe engineering group. The engineers’ workloads have ballooned, andthey’ve begun grumbling more and more about their job pressure. Worseyet, as some of them leave, those left behind get even more upset as theirworkloads expand further. It’s a vicious cycle that you might sketch asshown in Figure 1.7, “The Engineering Exodus,” p. 8.
Events, Patterns, Structure 7
F I G U R E 1 . 5
Graphs of Patterns
Time Time Time
Num
bero
fEng
inee
rsLe
avin
g C.
%Pr
ojec
tsO
verB
udge
t
B.
Tota
lSal
es
A.
F I G U R E 1 . 6
The Complete Pyramid
Events
Pa�erns
Structure
Whenever we ask questions like, “Why is this pattern happening?” or“What’s causing these events?” we are probing at structure. Thinking at thestructural level means thinking in terms of causal connections. It is the struc-tural level that holds the key to lasting, high-leverage change. Let’s return to ourexample about a house catching fire, to see how this works. To fight fires atthe event level, you would simply react to quell the fire as soon as possibleafter it broke out. You would probably then repair any smoke and waterdamage, and put the incident out of your mind.
As we saw earlier, all systems are part of largersystems, so it’s impossible to capture any system in itsentirety on paper. Nevertheless, there are ways ofdepicting parts of systems in a diagram, in order toglimpse how a system works and how you might alterits behavior. One such way is to create a causal loopdiagram, or CLD. (Figure 1.7 is an example of thiskind of drawing.) These diagrams provide a startingplace for discussing and thinking about problematicevents or patterns, and for opening the door toaddressing problems differently. In particular, theyhelp you gain insight into systemic structures, andthey identify ways you might change the system’sbehavior. After all, it is changes made at the systemlevel, rather than at the pattern or event level, thatoften prove to be the most long-lasting and self-sustaining.
It’s important to remember, however, that graphicrepresentations of systems are just that: representa-
8 SECTION 1 � What Are Systems?
A NOTE ABOUT DIAGRAMMING SYSTEMS
tions. As you will see later in this book, there is noone right way to draw a causal loop diagram or evento describe an entire system. Any diagram that youdraw reflects your own assumptions about the system,and is limited to what you define as the mostpertinent part of the system you’re studying. This iswhy working in groups is so beneficial—you gaininsights from the multiple perspectives.
Later in this book, you’ll have the opportunity topractice drawing CLDs. As with all the activities inthis book, we encourage you to work as a groupwhenever possible in creating CLDs. A causal loopdiagram generated by a group is especially valuablebecause it reveals the interplay of each groupmember’s perspective on the system in question. Theprocess of constructing the drawing encourages groupmembers to share their assumptions and under-standings about the issue at hand. The more this kindof sharing happens, the more insights get sparked.
Engineers’Workloads
Morale
EngineersLeaving
AdministrativeAssistants Laid Off
$ $ $Budget for
Engineering Group
X X budget cuts lead to
which increases
which damageswhich leads to
which addseven more to
F I G U R E 1 . 7
The Engineering Exodus
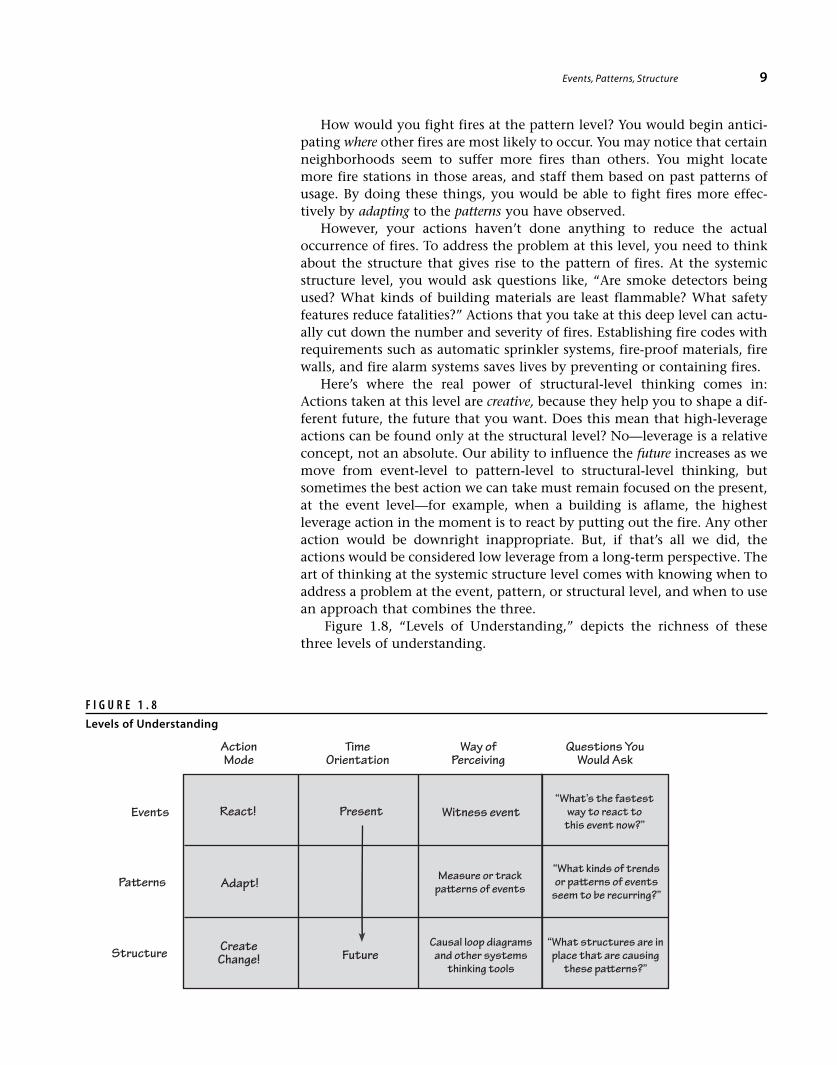
How would you fight fires at the pattern level? You would begin antici-pating where other fires are most likely to occur. You may notice that certainneighborhoods seem to suffer more fires than others. You might locatemore fire stations in those areas, and staff them based on past patterns ofusage. By doing these things, you would be able to fight fires more effec-tively by adapting to the patterns you have observed.
However, your actions haven’t done anything to reduce the actualoccurrence of fires. To address the problem at this level, you need to thinkabout the structure that gives rise to the pattern of fires. At the systemicstructure level, you would ask questions like, “Are smoke detectors beingused? What kinds of building materials are least flammable? What safetyfeatures reduce fatalities?” Actions that you take at this deep level can actu-ally cut down the number and severity of fires. Establishing fire codes withrequirements such as automatic sprinkler systems, fire-proof materials, firewalls, and fire alarm systems saves lives by preventing or containing fires.
Here’s where the real power of structural-level thinking comes in:Actions taken at this level are creative, because they help you to shape a dif-ferent future, the future that you want. Does this mean that high-leverageactions can be found only at the structural level? No—leverage is a relativeconcept, not an absolute. Our ability to influence the future increases as wemove from event-level to pattern-level to structural-level thinking, butsometimes the best action we can take must remain focused on the present,at the event level—for example, when a building is aflame, the highestleverage action in the moment is to react by putting out the fire. Any otheraction would be downright inappropriate. But, if that’s all we did, theactions would be considered low leverage from a long-term perspective. Theart of thinking at the systemic structure level comes with knowing when toaddress a problem at the event, pattern, or structural level, and when to usean approach that combines the three.
Figure 1.8, “Levels of Understanding,” depicts the richness of thesethree levels of understanding.
Events, Patterns, Structure 9
F I G U R E 1 . 8
Levels of Understanding
Events
Pa�erns
Structure
Questions YouWould Ask
Way ofPerceiving
TimeOrientation
ActionMode
“What’s the fastestway to react to
this event now?”React! Present Witness event
“What kinds of trendsor pa�erns of events
seem to be recurring?”
“What structures are inplace that are causing
these pa�erns?”
Measure or trackpa�erns of events
Causal loop diagramsand other systems
thinking toolsFuture
Adapt!
CreateChange!

L E A R N I N G A C T I V I T I E S
These activities can be done either by yourself or with a group. For self-study, you might con-sider starting a systems thinking journal, and doing the following learning activities over thecourse of a week or two. However you approach them, take plenty of time to think abouteach activity. Be honest, too. No one else will see your notes or your journal!
If you are helping a group to do the activities, have them read and think about the mater-ial ahead of the meeting time. Then go over it when you meet, answering questions andlooking for additional examples to help illustrate key points.
ACTIVITY 1 I D E N T I F Y I N G S Y S T E M S
Purpose: To identify systems and their componentsTo recognize interrelated systems
Outcome: Recognition of systems within your organization, their interrelationships, and their purposesInsights about intangible and possibly powerful components of systems that affect what hap-
pens in your organization.
Instructions: Identify three systems in your organization, including at least one that includes some impor-tant but intangible components.
Example � Informal information system
Purpose: To supplement the “official” information system so people feel they can makemore informed decisions. The informal system may also help defuse tension by offeringan avenue for chatting or gossiping.
Components: People, the electronic mail system
Intangible components: Information or “gossip,” time to communicate, motivation toshare information
Larger system: The overall information system, which also has a formal communicationsystem
1. List your three systems below:
10 SECTION 1 � What Are Systems?

2. In the spaces provided below, fill in the following information:• The name of your system• The purpose that your system fulfills within the larger system• The components that make up your system• The intangible components of your system• The larger system of which your system is a part
Your First System:
Purpose:
Components:
Intangible components:
Larger system:
Your Second System:
Purpose:
Components:
Learning Activities 11

Intangible components:
Larger system:
Your Third System:
Purpose:
Components:
Intangible components:
Larger system:
12 SECTION 1 � What Are Systems?
ACTIVITY 2 R E F L E C T I N G O N S Y S T E M C H A R A C T E R I S T I C S
Purpose: To think about the behavior of the systems you see around youTo identify patterns of behavior over time, and think about what causes that behavior
Outcome: Simple graphs of observed behavior patternsAwareness of the forces that drive behavior patterns
Instructions: Write your answers to the following questions in the space provided.
QUESTIONS
1. Identify a chronic problem or ongoing issue that you wrestle with at work (for example, “Sales dowell for a while, then drop, then pick up again”; or “Every year more and more people get laidoff”).
2. Try drawing a graph of what seems to be happening. (Tip: Ask yourself, Is the pattern going up?Going down? Oscillating over time? Going up or down and then leveling off?)
3. Looking at your graph, what do you see?
Learning Activities 13
4. Is there any way that actions taken to solve the problem might actually be making things worse?If so, how?
ACTIVITY 3 U N D E R S T A N D I N G S Y S T E M F E E D B A C K
Purpose: To begin using simple diagrams to show how components of a system are related and howfeedback is returned through the system
Outcome: Diagrams of the three systems you identified in Activity 1
Instructions: For each system you identified in Activity 1, draw a map or diagram of how the parts arerelated and how one part gives feedback to another. You may find there are many or only afew feedback connections. You may also find that some feedback travels through multiplesteps before arriving back at its original source.
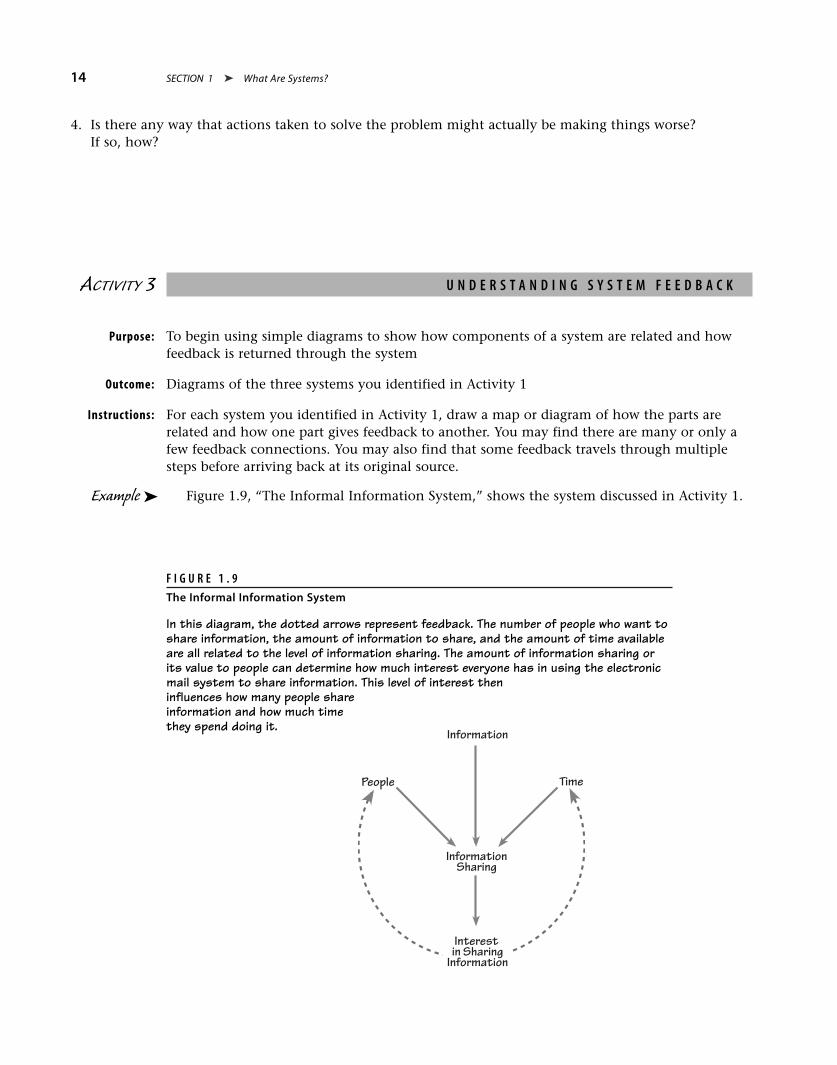
Example � Figure 1.9, “The Informal Information System,” shows the system discussed in Activity 1.
F I G U R E 1 . 9
The Informal Information System
In this diagram, the dotted arrows represent feedback. The number of people who want toshare information, the amount of information to share, and the amount of time availableare all related to the level of information sharing. The amount of information sharing orits value to people can determine how much interest everyone has in using the electronicmail system to share information. This level of interest theninfluences how many people shareinformation and how much timethey spend doing it.
14 SECTION 1 � What Are Systems?
People Time
Information
InformationSharing
Interestin Sharing
Information

Now try diagramming your three systems:
Your First System:
Your Second System:
Learning Activities 15

Your Third System:
Finally, try trading diagrams with someone else. Take turns explaining the diagrams and yourunderstanding of the systems you drew.
16 SECTION 1 � What Are Systems?
There are many ways of looking at systems thinking. It offers not onlya set of tools, but also a framework for looking at issues as systemicwholes. For some people, it can even become a way of life! Systems
thinking is a language, too, that offers a way to communicate aboutdynamic complexities and interdependencies. Most Western languages arelinear—their basic sentence construction, noun-verb-noun, encourages aworldview of “x causes y.” Because of this, we tend to focus on linear causalrelationships rather than circular or mutually causative ones. Yet many ofthe most vexing problems confronting managers and corporations todayare caused by a web of interconnected, circular relationships. To enhanceour understanding and communication of such problems, we need a lan-guage and a set of tools better suited to the task. This is where systemsthinking comes in.
In this section, we examine the foundational principles of systemsthinking in more detail, and explore the special qualities of systems think-ing as a language. The learning activities at the end of the section will letyou begin actually practicing systems thinking.
17
S E C T I O N 2
What Is Systems Thinking?
THE PRINCIPLES OF SYSTEMS THINKING
In general, systems thinking is characterized by these principles:
• thinking of the “big picture”
• balancing short-term and long-term perspectives
• recognizing the dynamic, complex, and interdependent nature ofsystems
• taking into account both measurable and nonmeasurable factors
• remembering that we are all part of the systems in which we function,and that we each influence those systems even as we are being influ-enced by them
The “Big Picture”
During stressful times, we tend to focus on the immediate, most pressingproblem. With this narrow focus, we can perceive only the effects of changeselsewhere in the system. One of the disciplines of systems thinking, how-ever, involves being able to step back from that immediate focus and lookat the bigger picture. As you know, whatever problem you’re involved inright now is part of a larger system. To discover the source of a problem, youhave to widen your focus to include that bigger system. With this wider per-spective, you’re more likely to find a more effective solution.
For example, imagine that you work for a regional appliance distributorthat is experiencing growing delays in providing timely service to its cus-tomers. As a manager in this company, you might be tempted to focus firston the service technicians, perhaps on the service order-taking system, oreven on service-order dispatching. But take a step back. What if you knewthat about six weeks before the service crisis started, the sales group hadimplemented an incentive program that included free set-up and installa-tion of new appliances? To sell more appliances, the sales force encouragedcustomers to make service appointments as soon as their delivery dates wereset. Then a service person could come out to install the appliance and makeall the electrical and water connections. However, because the customer ser-vice department had not been informed of the incentive program, it had noopportunity to add staff to handle the installation incentive. With thiswider view, you might conclude that the delays in providing customer ser-vice do not come from the customer service department, and you mightchoose a different path to solving the problem.
Long Term, Short Term
How often does your organization expect to see results of its activities? In ayear? A quarter? A week? In addition to checking the health of the companyat these kinds of intervals, some businesses also make major strategicchanges—such as cost-cutting campaigns, layoffs, new hiring, productionincreases—every time they check how the business is doing.
18 SECTION 2 � What Is Systems Thinking?
Yet systems thinking shows that behavior that leads to short-term suc-cess or that is prompted by short-term assessments can actually hurt long-term success. However, the point is not that the long-term view is “better”than the short-term view. After all, if a little boy runs out into traffic, grab-bing him by the arm at risk of injuring his shoulder or startling him makesfar more sense than moving slowly or speaking softly while a bus speedsdown the street. In thinking about any decision, the best approach is tostrike a balance, to consider short-term and long-term options and to lookfor the course of action that encompasses both. At the very least, try mak-ing your decisions by first thinking through their likely ramifications—bothshort term and long term.
Here’s an example: As a business grows, it may use consultants to han-dle its human resource and training functions. In the short run, this sensi-ble business decision can bring in a high level of professional expertise. Ifthe company decides that consulting help is getting too expensive, how-ever, it will eventually move to develop its own in-house HR and trainingdepartment. To balance the long and the short term, the company couldphase in internal expertise at certain levels of revenue, sales volume, orstaffing, and overlap internal and outside resources while the new staffmembers get their bearings.
Whether you’re focusing on the long term or the short term, the key isto be aware of all the potential impacts of whichever strategy you choose.
Dynamic, Complex, and Interdependent
When you look at the world systemically, it becomes clear that everythingis dynamic, complex, and interdependent. Put another way: Things changeall the time, life is messy, and everything is connected.
We may know all this. However, when we’re struggling with an over-whelming problem or an uncertain future, we tend to want to simplifythings, create order, and work with one problem at a time. Systems think-ing doesn’t advocate abandoning that approach altogether; instead, itreminds us that simplification, structure, and linear thinking have theirlimits, and can generate as many problems as they solve. The main point isthat we need to be aware of all the system’s relationships—both within itand external to it.
Measurable vs. Nonmeasurable Data
Some organizations value quantitative (measurable) over qualitative (non-measurable) data. Others are just the opposite. Systems thinking encouragesthe use of both kinds of data, frommeasurable information such as sales fig-ures and costs to harder-to-quantify information like morale and customerattitudes. Neither kind of data is better; both are important.
Systems thinking also alerts us to our tendency to “see” only what wemeasure. If we focus our measuring on morale, working relationships, andteamwork, we might miss the important signals that only statistics canshow us. On the other hand, if we stay riveted on “the numbers,” on howmany “widgets” go out the door, we could overlook an important, escalat-ing conflict between the purchasing and the production departments.
The Principles of Systems Thinking 19
We Are Part of the System
One of the more challenging systems thinking principles says that we usu-ally contribute to our own problems. When we look at the big picture, overthe long term, we often find that we’ve played some role in the problemsfacing us.
Unintended consequences. Sometimes the connection is simple—theproblem plaguing us today is an unintended consequence of a solution weimplemented yesterday. For example, to control costs, a bank managerdecides to limit the number of tellers on Thursday evenings and Saturdaymornings. Eventually, the manager notices that—surprise!—other banksseem to be getting all the customers who rely on having access to the bankduring evenings and weekends.
Assumptions. Sometimes our assumptions are what get us into trouble.Imagine, for example, that you’re the manager of Frank’s Steak House, arestaurant that specializes in affordable family dining. You’ve noticed thatbusiness at the restaurant has flagged a bit for two or three months in a row.You conclude that this is an enduring trend, because you’ve read essays inthe newspapers about a possible resurgence in the health of the nationaleconomy. People are feeling freer to dine at more expensive restaurants, youdecide. To prepare Frank’s to weather the new trend, you lay people off.However, demand bounces back a few months later, and you’re forced toscramble to bring workers back. Some of these workers are rehired at higherpay than before, some on overtime. These kinds of assumptions about howthe world works (also known as mental models) are powerful drivers of thedecisions we make.
Values and beliefs. Deeply held values and beliefs can lock us into coun-terproductive ways of making decisions. The Cold War is a perfect example:As long as the U.S. and the former U.S.S.R. each firmly believed that theother was intent on annihilating its ideological enemy, the arms race wasinevitable. Even worse, the longer the conflict continued, the harder it wasto call it off. Both nations were highly invested in justifying their “saber-rat-tling” in the past, present, and future. In this case, too, mental modelsplayed a major role.
SYSTEMS THINKING AS A SPECIAL LANGUAGE
As a language, systems thinking has unique qualities that make it a valuabletool for discussing complex systemic issues:
• It emphasizes looking at wholes rather than parts, and stresses the roleof interconnections. Most important, as we saw earlier, it recognizes thatwe are part of the systems in which we function, and that we thereforecontribute to how those systems behave.
20 SECTION 2 � What Is Systems Thinking?

• It is a circular rather than linear language. In other words, it focuses on“closed interdependencies,” where x influences y, y influences z, and zcomes back around to influence x.
• It has a precise set of rules that reduce the ambiguities and miscommu-nications that can crop up when we talk with others about complexissues.
• It offers visual tools, such as causal loop diagrams and behavior overtime graphs. These diagrams are rich in implications and insights. Theyalso facilitate learning because they are graphic and therefore are ofteneasier to remember than written words. Finally, they defuse the defen-siveness that can arise in a discussion, because they emphasize thedynamics of a problem, not individual blame.
• It opens a window on our mental models, translating our individual per-ceptions into explicit pictures that can reveal subtle yet meaningful dif-ferences in viewpoints.
To sum up, the language of systems thinking offers a whole different wayto communicate about the way we see the world, and to work togethermore productively on understanding and solving complex problems.
Systems Thinking as a Special Language 21
In this section, each learning activity focuses on one or two systems principles. As with theSection 1 learning activities, the exercises here can be done either by yourself or with agroup. If you are working with a group, focus on the activities that highlight principles youconsider the most valuable for your organization. Keep in mind that some of the activitiesare active exercises; some are meant for individual reflection and group discussion—try to usea mix.
Finally, remember that there is no one right response to the exercises. The idea is to useyour imagination, and to have some fun!
ACTIVITY 1 S T R E T C H I N G T H E T I M E L I N E
Purpose: To think in “big picture” termsTo consider both short-term and long-term perspectives on a problemTo practice seeing patterns and trends in a problemTo identify the roots of a current problem
Outcome: A timeline showing the history of a current problemInsights about recurring patterns in an organization
Number: Minimum 1; maximum about 15
Equipment: For self-study: A white board or a couple of flip-chart pages and colored markersFor a group: Colored yarn, pushpins or tape, several pairs of scissors, and a large wall or floor
space OR long sheets of flip-chart paper, three or more colored markers for each person
Space: For a group, enough wall or floor space so that pairs or trios of people have at least six feet tothemselves
STEPS
1. Lay your flip-chart paper on its side, horizontally, and position yourself near the far right end ofthe page. (You might even want to tape two flip-chart pages together horizontally, to give your-self lots of writing space.) If you are working at a white board, adapt the directions accordingly.
2. Identify a current problem or issue facing your immediate work group or department. If nothingcomes to mind, use a problem within your family or community. Choose a moderate-size issuewith which you have direct personal experience.
22 SECTION 2 � What Is Systems Thinking?
L E A R N I N G A C T I V I T I E S
Learning Activities 23
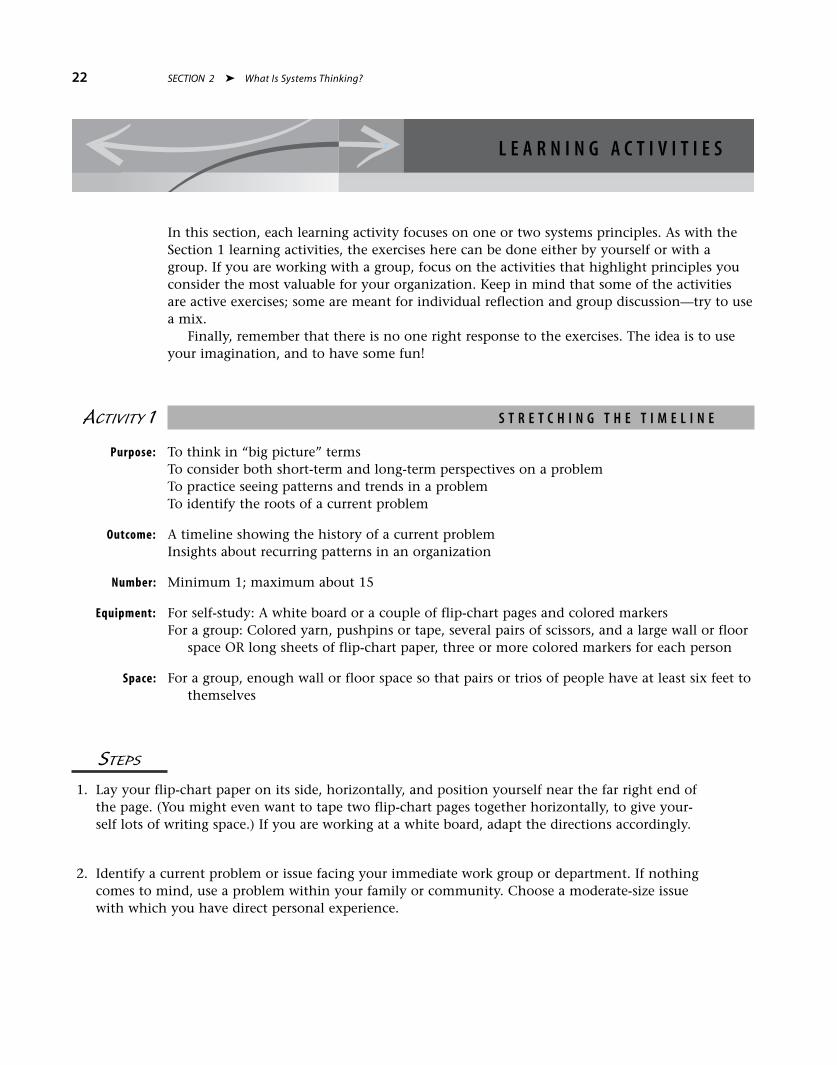
3. Make a mark on the paper to symbolize the present, and name the issue in one or two words.For example:
4. To the best of your knowledge, when did this problem start? Pick a distance to the left across thepaper that represents the amount of time you think has elapsed since the problem began. Markthe beginning point with your marker. Draw a line between the beginning point and the present.Write in the time span.
5. Now project yourself back in time to the “Beginning” point. To the best of your knowledge, whatwas happening around that time to cause the beginning of the problem? Write your answer as abrief phrase, as shown in the example below.
6. With a new marker color, extend your timeline even farther back in time, as shown below. Add atime span between “Earlier beginning” and “Beginning.”
7. Now project yourself back once more, to “Earlier beginning.” Think of what was happening atthat point that led to the problem you wrote under “Beginning.” Name it and mark it on thetimeline in a third color.
XSales
droppingNew product
late to market
PRESENTBEGINNING
Mistakes madein product
development
EARLIER BEGINNING
6 months10 months
XSales
dropping
PRESENT
XSales
droppingNew product
late to market
PRESENTBEGINNINGEARLIER BEGINNING
6 months10 months
XSales
droppingNew product
late to market
PRESENTBEGINNING
6 months
XSales
dropping
PRESENTBEGINNING
6 months
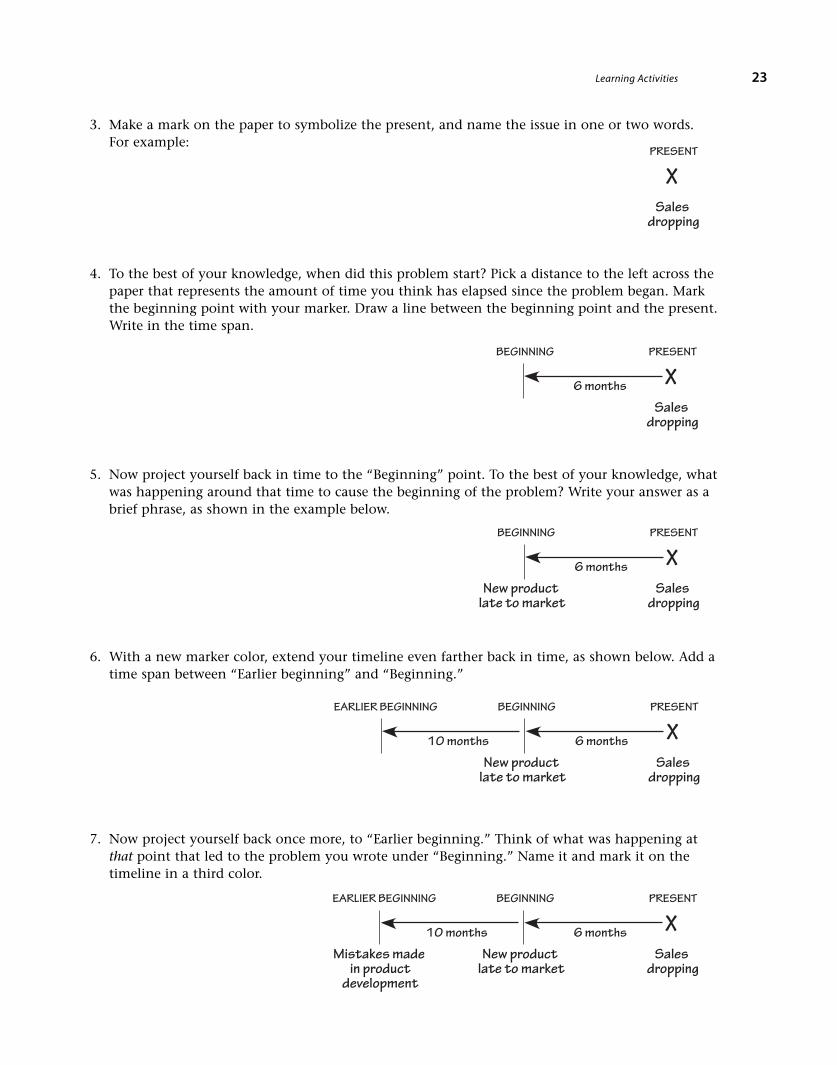
8. Continue the process one more time, by adding “Earliest beginning” as shown below. Add whatwas happening at that time, and fill in a time span between “Earliest beginning” and “Earlierbeginning.”
9. Now imagine yourself present at any of the three beginning points you have identified. Is thereanything else going on at that time that resembles the original problem you chose? Or is thereanother kind of problem that alternates with yours? Is there another problem going on inparallel to yours right now? (In the timeline boxes above, for example, maybe there was a hiringdifficulty going on at the “Earliest beginning” stage of the problem.) If you can identify a parallelproblem, add it to your timeline as a parallel line, using a distinctive color.
10. Now try one more step with your timeline. Instead of projecting backward in time, project for-ward. Given the sequence of events you’ve drawn, what do you expect to happen in the future ifnothing is done about the problem? Add another piece of flip-chart paper if necessary, andextend your timeline to the right. Using a new marker color, add your thoughts about the futureto this new part of your timeline.
QUESTIONS
1. What was it like to create a visual image of the time and events surrounding the current problemyou identified? Any surprises? Any insights? Write your thoughts below. If you worked on thisactivity with a group, discuss your insights together.
2. What did you learn?
XSales
droppingNew product
late to market
PRESENTBEGINNING
Mistakes madein product
development
EARLIER BEGINNING
6 months10 months
Not enoughproduct
developers
EARLIEST BEGINNING
1.5 years
24 SECTION 2 � What Is Systems Thinking?

3. If you were able to identify parallel problem timelines in Step 9, what did you learn?
4. If you were not able to trace back to earlier beginnings, what did you learn?
5. What helps you to see the “big picture” of your problem?
6. What obscures it?
ACTIVITY 2 T H E S H A P E O F T H E P R O B L E M
Purpose: To explore the connections and interdependencies among the components of a problemTo discover the intangible aspects of a problemTo practice widening your view of a problemTo see the complexity within a problem
Outcomes: A map of the connections and interdependencies of a problemInsights about the structure of the problem
Number: Minimum 1; maximum 20
Equipment: Flip-chart paper and three or four colored markers per person
Space: For groups, enough wall, floor, or table space for everyone to lay out a flip-chart pageand draw
Learning Activities 25
STEPS
1. Identify a problem or an issue currently facing you or your immediate work group. (Your workgroup might be your department, division, unit, and so forth.) In the center of your flip-chartpaper, draw a circle and write in the name of your group. Write one or two words to identify theissue you chose, as shown in the example in Figure 2.1, “The Center Circle.”
2. Who else outside your group is directly involved in or affected by this issue? Write your answerswithin their own circles in a ring around your central issue. Connect each outer circle with themiddle circle, similar to Figure 2.2, “The Circle Expands.”
26 SECTION 2 � What Is Systems Thinking?
F I G U R E 2 . 2
The Circle Expands
Training:Work
Overload
NewHires
Managers
Instructors
AdministratorsDevelopers
SalesPeople
ProductionWorkers
Training:Work
Overload
F I G U R E 2 . 1
The Center Circle
4. If there are any other connections beyond what you’ve already drawn, map them in. The con-nections are not limited to human beings. They can include items such as “Revenues” or “OtherGroups’ Work.” Your map can have as many circles or layers as make sense to you, as shown inFigure 2.4, “The Final Picture.”
Learning Activities 27
F I G U R E 2 . 3
Even More Connections
Training:Group
Overload
NewHires
Managers
Instructors
AdministratorsDevelopers
SalesPeople
ProductionWorkers
Customers
Departments
OtherCourses
MaintenanceDepartment
AccountingDepartment
F I G U R E 2 . 4
The Final Picture
Training:Group
Overload
NewHires
Managers
Instructors
AdministratorsDevelopers
SalesPeople
ProductionWorkers
Customers
Departments
OtherCourses
MaintenanceDepartment
AccountingDepartment
Quality
Revenues
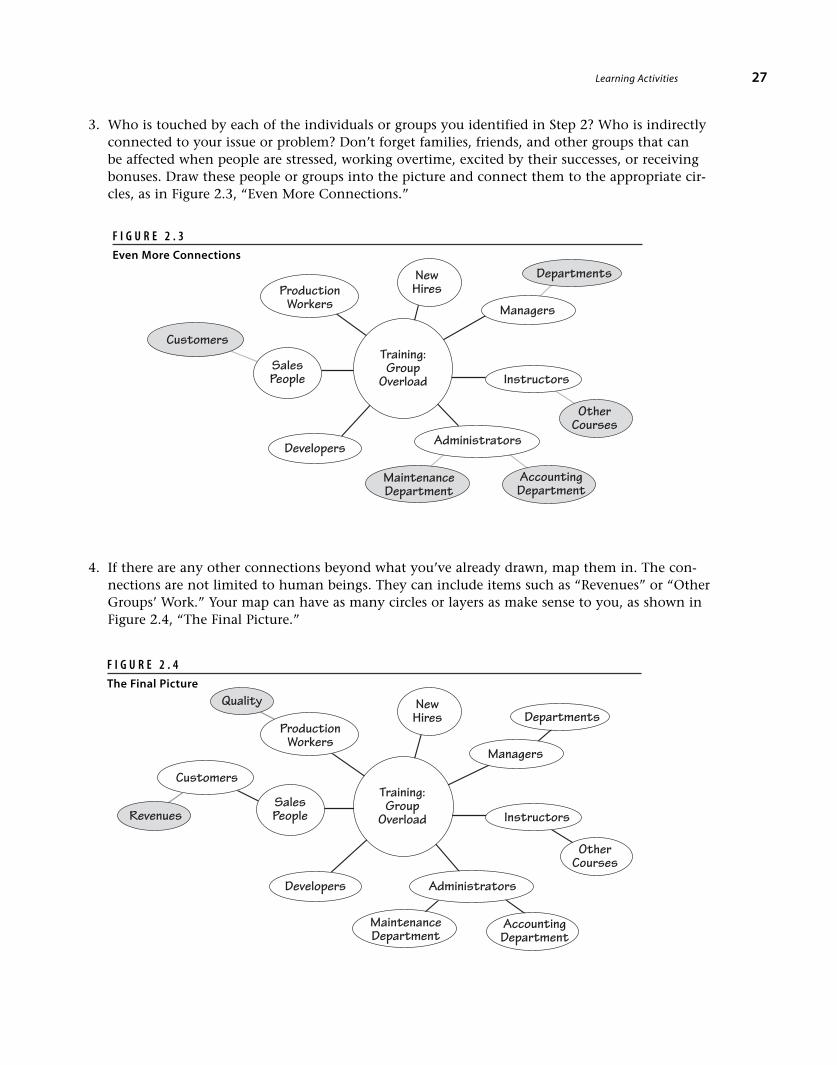
3. Who is touched by each of the individuals or groups you identified in Step 2? Who is indirectlyconnected to your issue or problem? Don’t forget families, friends, and other groups that canbe affected when people are stressed, working overtime, excited by their successes, or receivingbonuses. Draw these people or groups into the picture and connect them to the appropriate cir-cles, as in Figure 2.3, “Even More Connections.”

QUESTIONS
1. In your diagram, what happens to the outer circles when things are going well in the centercircle? When they’re not going well? Examples?
2. What happens to the center circle when things are going well in the other circles? When they’renot going well? Examples?
3. Looking at the interconnections, can you see any ways in which something you do in the centercircle causes a change in a connected circle that then comes back and affects the center circle?Examples?
4. Did you find it difficult to add many circles to your original circle? If so, what are some possiblereasons for this difficulty?
5. If you worked on your map with others, discuss your insights together. If you worked withothers, but each of you made your own map, exchange your maps and share the insights aboutthe maps.
28 SECTION 2 � What Is Systems Thinking?

ACTIVITY 3 I S T I M E O N Y O U R S I D E ?
Purpose: To think about how your organization sets goals, and how frequently it measures resultsTo explore the impact of the time cycles involved in setting goals and measuring results
Outcome: Insights about how time frames influence what we pay attention to and what we accomplish
Number: Minimum 1; maximum as many as desired
Equipment: Flip chart and markers (optional)
Instructions: Reflect on the following questions, and discuss them with others if possible.
QUESTIONS
1. What is your organization’s stated goal or mission? What is it trying to achieve? (State the mis-sion as simply as possible. “Organization” can refer to your immediate work group, your divisionor department, or the overall organization.)
2. Is there a desired time frame for achieving the goal or mission? If so, what is it?
3. What results does the organization measure or pay attention to? (Examples: sales volume, rev-enue, meals served, passenger miles, return on assets, return to shareholders)
4. How often does the organization measure those results? (Examples: sales volume per quarter,meals served per week, passenger miles per vehicle, return on assets per year)
5. What goals does the organization have regarding what it measures? (Example: 2 percent salesgrowth per quarter)
Learning Activities 29
6. How long does the organization take to produce, create, or deliver what is measured? (Examples:selling groceries takes 5–10 minutes; selling a car takes 1 hour–2 weeks; selling a house takes 1day–1 year; selling a large management-information system takes 6–18 months)
7. What do you notice about the time frames for your organization’s mission; for its target results;for its measurements; and for production, service, or delivery?
8. What do you think are the effects of those time horizons?
ACTIVITY 4 F R O M S H O R T T E R M T O L O N G T E R M
Purpose: To discover which aspects of your work are short term and which are long term
Outcome: Timelines of short-term and long-term events or outcomes
Number: Minimum 1; maximum as many as desired
Equipment: Flip-chart paper, tape, and markers OR lined paper and pens or pencils
Round 1: Your Organization—Short Term or Long Term?
Instructions: Write your answers to each question in the accompanying box.
QUESTIONS
1. What is the shortest-term discrete product, service, or other deliverable from your organization?How long does it take to produce or deliver it?
Examples � A soft drink / 90 seconds to fill and serveA tank of gas / 5 minutes to fillA consultation / 1 hourAn express package / 15 hours from pick-up to deliveryA house / 4 months from ground-breaking to finished siding
30 SECTION 2 � What Is Systems Thinking?
Shortest-term deliverable: How long?
2. What is the longest-term product, service, or other deliverable from your organization? How longdoes it take to produce or deliver it?
Examples � A bridge / 3 yearsA communication system / 18 monthsA new management competency / 12 months
Longest-term deliverable: How long?
3. What, if anything, falls into a middle-term length of time? How long does it take to produce ordeliver it?
Middle-term deliverable: How long?
4. How much of your routine work is spent on the short-term end of the spectrum? At the long-term end?
% Short-term: % Long-term:
5. Looking at your answers, how would you define “short term” and “long term” in yourorganization?
Learning Activities 31

6. How do you think your organization’s sense of short and long term compares to otherorganizations’? How does this sense differ? How is it similar?
7. Where is the emphasis in your organization—long term or short term? Why? What drivesthat focus?
Round 2: You—Short Term or Long Term?
Instructions: In the space provided, jot down your responses to the following questions.
1. What do you want to accomplish today?
2. This week?
3. This month?
4. This year?
5. Within five years?
32 SECTION 2 � What Is Systems Thinking?
6. Within 10 years?
7. By the time you’re very old?
8. Looking at your answers to the above questions, how would you define “short term” and “longterm” in your own life? At what point is short term differentiated from long term?
9. How do you think your sense of short and long term compares to your organization’s? How doesthis sense differ? How is it similar?
10. What do you emphasize in your own life—long term or short term? Why? What drives thatfocus?
Learning Activities 33
11. When you made your list, was there a point at which your vision of what you want to accom-plish shifted? If so, where, and how?
12. Do you think this kind of shift happens within your organization, too? If so, at what point in thetimeline?
ACTIVITY 5 I N T H E M I D S T O F A P R O B L E M
Purpose: To gain familiarity with the concepts of interconnectedness or interdependencyTo recognize the human tendency to assign blame
Outcome: Insights about our role in the problems we experience
Number: Minimum 1; maximum as many as desired
Instructions: Write your answers to the following questions in the space provided.
QUESTIONS
1. Briefly describe a situation in which you knew that an individual or group having a problem wascontributing to the problem, but wasn’t aware of their contribution.
Example �
I used to work with someone, Valerie, who swore a lot at the office—really rough language. Oneday, she came in upset because her eight-year-old daughter, Nina, had been sent home fromschool for swearing. Valerie couldn’t understand where Nina picked up this behavior! It was soobvious to the rest of us, but she just couldn’t see it.
34 SECTION 2 � What Is Systems Thinking?

2. Now describe a situation in which you or your work group turned out to be contributing to yourown problem.
Example �
I was experiencing deteriorating communications with a senior project team leader, Alan. I triedto clarify the relationship—I left him voice mails and got no response. I sent him memos andheard nothing back. Projects came up that I was perfect for, but Alan didn’t include me. I wasfurious with him. When I finally managed to meet with him, I discovered that he was communi-cating less with me because he felt confident about our relationship and had other problems totake care of. My deluge of voice mails and memos made him think I was under a lot of stress, sowhen it came time to staff demanding projects, he decided to give me a break and leave me off.At the same time, though, Alan was beginning to wonder if I was becoming unreliable.
3. Consider a persistent, recurrent, or chronic problem you are experiencing now. Tell or record thestory of the problem very briefly:
4. Now ask yourself:
A. Is there any way you or your group may be causing or contributing to the problem?If so, how?
Learning Activities 35

B. Is there anything you did in the past that has generated an unintended consequence?If so, what?
C. What might happen if you were to focus on the short-term aspects of the problem andignore the longer term?
D. Sometimes feedback comes to you slowly or in roundabout ways. What, if any, aspect of theproblem might stem from delayed or indirect feedback?
5. Do you now have any new insights into your problem? If so, what are they?
6. What, if any, difference does it make to see the part you are playing in a problem?
36 SECTION 2 � What Is Systems Thinking?
In sections 1 and 2, we introduced the idea that systemic structures gen-erate patterns of behavior and are therefore at the root of many of ourproblems. In this section, we explore several steps for uncovering these
structures:
1. Formulating the problem
2. Identifying the key variables in the situation; in other words, themain actors in the systemic structure
3. Graphing the behavior of those variables over time
Section 4 then takes you through the next step in identifying systemicstructure: building causal loop diagrams.
As you read Section 3, remember that thinking systemically is anexperimental process involving trial and error. The guidelines and theexamples in this book may look orderly and straightforward, but apply-ing systems thinking in real life is often messy and leads to lots of twistsand turns. Thinking systemically always involves an iterative process of
37
S E C T I O N 3
Uncovering Systemic Structures:Drawing Behavior Over Time Graphs
formulating problems with care, creating hypotheses to explain what isgoing on, tracking and revising the reasoning behind your explanations,testing possible solutions to problems, and reformulating the problembased on new understandings.
FORMULATING A PROBLEM
Let’s say you’ve just finished a course on systems thinking and have identi-fied a problem you want to address. Could you apply systems thinking toolsto figure it out? Of course! All problems have systemic origins; the key is tochoose one that is appropriate and significant to you. Here are some tips:
Guidelines for Identifying Systemic Problems
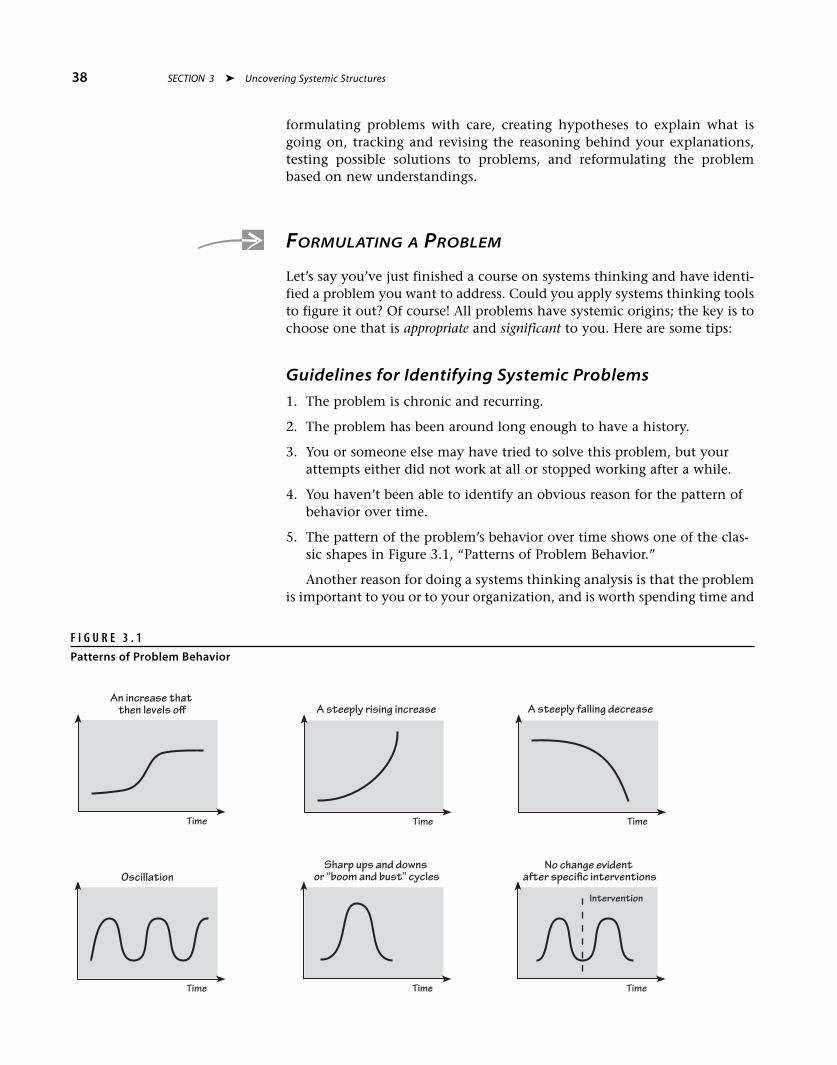
1. The problem is chronic and recurring.
2. The problem has been around long enough to have a history.
3. You or someone else may have tried to solve this problem, but yourattempts either did not work at all or stopped working after a while.
4. You haven’t been able to identify an obvious reason for the pattern ofbehavior over time.
5. The pattern of the problem’s behavior over time shows one of the clas-sic shapes in Figure 3.1, “Patterns of Problem Behavior.”
Another reason for doing a systems thinking analysis is that the problemis important to you or to your organization, and is worth spending time and
38 SECTION 3 � Uncovering Systemic Structures
Time
Oscillation
TimeTime
Time Time
Intervention
Time
An increase thatthen levels off A steeply rising increase A steeply falling decrease
No change evidentafter specific interventions
Sharp ups and downsor “boom and bust” cycles
F I G U R E 3 . 1
Patterns of Problem Behavior

effort on solving it. Maybe the problem is currently under discussion, oryou have a hunch that an old problem is about to strike again.
Here are some examples of problems that show typical systemic behavior:
• We’ve been having trouble getting our refrigerators assembled fastenough to fulfill customer orders. So, we reconfigured the flow ofmaterials on the manufacturing floor to try to improve the assemblyprocess. However, after we made this change, the assembly processactually took more time than before. Somehow, the change seems tohave made everything worse.
• We introduced a line of high-grade investment portfolio productstwo years ago, but our agents continue to sell the older products.We’ve tried changing the incentive schemes, and we’ve put outstacks of marketing and information materials, but nothing seems tomotivate agents to focus on the newer line.
• Every six months we go through another round of cost-cutting cam-paigns, from laying off workers to lengthening maintenance intervalsto simplifying marketing. Costs go down for a while but then startrising again.
Guidelines for Formulating the Problem
Once you’ve targeted a problem for a systemic approach, work on develop-ing a clear, succinct statement of the problem. This is often the toughestpart of systems thinking, but it’s very worthwhile. The more clearly andspecifically you can state your issue, the more focused your systemic analy-sis will be. Be sure to brainstorm with other people who can contribute theirviews of the issue as well as their knowledge of its history. If necessary, pro-ceed with two or three formulations of the problem and learn from the dif-ferent views.
Don’t get discouraged! It’s natural—even beneficial—for this stage ofthe process to take a while. You and your group will generate the mostinsights into the problem by taking the time to ask lots of probing ques-tions, share your perspectives on the issue, and revise your problem state-ment several—sometimes many—times.
Here are some examples of problem statements:
• In our blood lab, errors in sample analyses have doubled over the lasteight months.
• Customer-service problems have increased 25 percent over the lastyear.
• Before our last two training conferences, we failed to return one-thirdof the registration confirmations to our customers on time.
Problem statements often include the following components (though theydon’t have to):
• the behavior (example: customer-service problems)
• a description of the behavior over time (example: the problems haveincreased)
Formulating a Problem 39

• a measurement of how the behavior has changed over time(example: the problems have increased 25 percent)
• the time frame of the behavior(example: the problems have increased 25 percent in the last year)
IDENTIFYING VARIABLES
Once you formulate the problem, it’s time to identify its key variables.(Remember, variables are the components of the problem whose value canvary over time; that is, go up or down.) To begin this process, tell the storyof the problem briefly. Telling the story means building on your problemstatement—fleshing out some of the details so that you have a fuller pictureof the issue and the variables involved.
Example � The Case of A-to-Z
At A-to-Z, a semiconductor company, we’ve been puzzling over aseries of events that occurred in our most recent quarter. We postedrecord sales for the quarter, with the majority of our sales forcemeeting or exceeding sales quotas. All products scheduled forrelease were launched, with additional products ready for earlyrelease in the next quarter. At the same time, however, our profitsactually declined for the first time in our company’s history, asoverhead costs as a percentage of sales reached an all-time high.
What are the pertinent variables in A-to-Z’s story? Here’s the list that A-to-Z’s managers identified after some discussion:
SalesNew product releasesProfitsSales force
Guidelines for Identifying Variables
Deciding which variables to work with is as important as clearly defining theproblem, because your choice of variables shapes the rest of your analysis.As with formulating the problem, identifying variables is usually an itera-tive process. You might start off listing several, and then after much discus-sion and thought, decide to delete some or add new ones, or go back andrework your story of the problem.
Here are some guidelines for starting out:
• List all the variables that could reasonably be included, both quanti-tative and qualitative. For example, your list could include measur-able variables such as “Sales” and “Size of sales force,” as well ashard-to-measure variables like “Morale” and “Commitment to com-pany goals.” Again, do this as a group if possible, to get input from awide variety of viewpoints. The idea is to start off with a big list ofvariables.
• Narrow your list down to the most important variables. You can dothis by combining some variables because they represent roughly the
40 SECTION 3 � Uncovering Systemic Structures
same kind of information—for example, “Morale” and “Job satisfac-tion.” You can also remove some variables from your list because youand your group decide that they’re not as firmly linked to the centralproblem as other variables. To determine the most relevant variables,identify which variables seem to play the most prominent roles inthe central issue you described in your problem statement. Thesevariables will likely have a relationship to each other that you eithercan describe or want to explore. For example, in the case of A-to-Z’sdeclining profits, the variables “Profits,” “Sales,” and “New productreleases” are related to what the company defined as the centralproblem—and they have a significant dynamic relationship to eachother.
As with every stage of the systems thinking process, you may decide togo back and revise your problem statement if your list of variables gives younew ideas about the nature or scope of your problem.
Guidelines for Naming Variables
After choosing your variables, it’s time to refine their names precisely. Theguidelines below will be especially important when you move on to creat-ing causal loop diagrams in Section 4.
• Use nouns or noun phrases, not verbs or verb phrases.
Example � New products in the pipelineRevenuesExperience level of engineers
Not:Developing new productsBeing profitableSellProduce
• A well-named variable fits into phrases such as “the level of,” “theamount of,” “the number of,” “the size of”.
Example � The number of new products in the pipelineThe amount of revenuesThe experience level of the engineersThe size of the profit margin
• Use a neutral or positive term whenever possible to name a variable.
Example � “Job satisfaction” rather than “Job dissatisfaction”“Morale” rather than “Bad feelings”
That way, you’ll be able to describe the way the variable changes(“increases,” “decreases,” “improves,” “worsens”) without introducingconfusing double-negatives. For example, the phrase “Job satisfactiondeclined” is much easier to grasp conceptually than “Job dissatisfactiondeclined.”
Identifying Variables 41
• Keep in mind that variables can be concrete entities such as memorychips, buildings, or production workers, as well as intangibles such asmorale, job satisfaction, or alignment with company values.
DRAWING BEHAVIOR OVER TIME GRAPHS
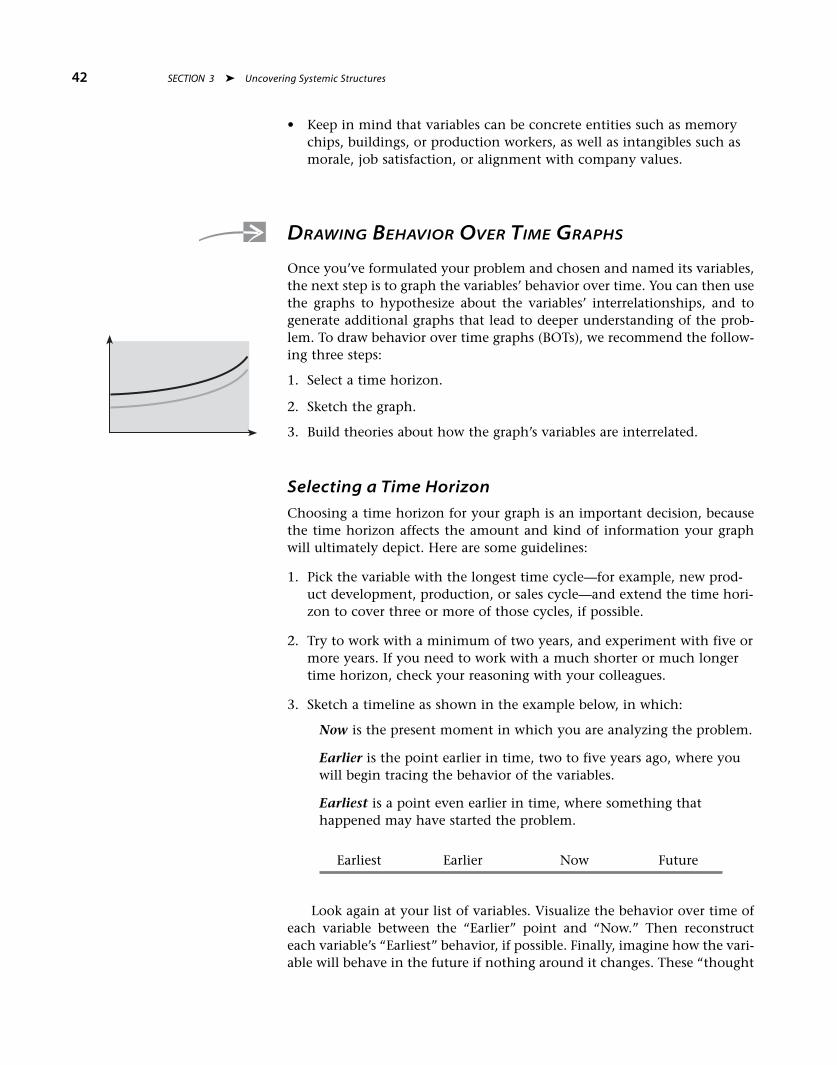
Once you’ve formulated your problem and chosen and named its variables,the next step is to graph the variables’ behavior over time. You can then usethe graphs to hypothesize about the variables’ interrelationships, and togenerate additional graphs that lead to deeper understanding of the prob-lem. To draw behavior over time graphs (BOTs), we recommend the follow-ing three steps:
1. Select a time horizon.
2. Sketch the graph.
3. Build theories about how the graph’s variables are interrelated.
Selecting a Time Horizon
Choosing a time horizon for your graph is an important decision, becausethe time horizon affects the amount and kind of information your graphwill ultimately depict. Here are some guidelines:
1. Pick the variable with the longest time cycle—for example, new prod-uct development, production, or sales cycle—and extend the time hori-zon to cover three or more of those cycles, if possible.
2. Try to work with a minimum of two years, and experiment with five ormore years. If you need to work with a much shorter or much longertime horizon, check your reasoning with your colleagues.
3. Sketch a timeline as shown in the example below, in which:
Now is the present moment in which you are analyzing the problem.
Earlier is the point earlier in time, two to five years ago, where youwill begin tracing the behavior of the variables.
Earliest is a point even earlier in time, where something thathappened may have started the problem.
Earliest Earlier Now Future
Look again at your list of variables. Visualize the behavior over time ofeach variable between the “Earlier” point and “Now.” Then reconstructeach variable’s “Earliest” behavior, if possible. Finally, imagine how the vari-able will behave in the future if nothing around it changes. These “thought
42 SECTION 3 � Uncovering Systemic Structures

experiments” can help you visualize the behavior of your variables over abroad span of time—to get the “big picture” of how they changed.1
Keep in mind that BOTs may be more free-form than other graphs youare used to seeing, especially if you work primarily with quantitative data.The lines are intended to indicate qualitative patterns over time rather thanprecise values. Of course, these patterns may eventually need to be verifiedby quantitative data later in the process.
Sketching the Graph
Here are some guidelines for drawing a BOT graph once you’ve selected atime horizon:
1. Graph your key variables together on the same graph. That way, youcan see the variables’ interrelationships—parallel variations, oppositevariations, and delayed effects.
Even though the variables are measured in different units, BOTs revealhow variations in behavior of variables might be dynamically related.
2. Label the lines clearly. If possible, use different colors to draw eachvariable.
3. On the horizontal axis, write the time horizon, either the number ofyears covered or the dates.
4. Optional: If a significant event occurred during this time frame—forexample, a massive marketing campaign that directly preceded a jumpin sales—draw and label a vertical line on the graph to show when itoccurred.
NOTE: If you find that a series of significant events associated withvariables in the graph have occurred, you may have identified anothervariable to include in your graph. For example, suppose your graphshowed that about every three years, a large percentage of people leftthe company voluntarily. In this case, you might add “Resignations” asa new variable and graph it alongside your other variables.
Using Your BOT Graph to Build Testable Hypotheses
Once you’ve sketched your initial BOT graph, the next step is to hypothe-size about how the variables’ behavior might be interrelated. This step oftenleads to ideas for new variables, additional BOT graphs, and yet more theo-ries about how all the variables are connected. As with earlier stages of thisprocess, at times you may feel as if you’re “going backwards,” but in fact it’sthis iterative quality of systems thinking that makes it so valuable for gen-erating insights.
Drawing Behavior Over Time Graphs 43
1. See Appendix F: Additional Resources for information about computer simulation. Theseprograms can actually simulate the behavior over time of your chosen variables—muchfaster and more accurately than you can draw them out on paper!

In the A-to-Z semiconductor story, the managers selected a time hori-zon, set up their first graph, and drew lines representing the behavior ofeach variable (Figure 3.2, “A-to-Z’s Performance Over Time”). Then, as theycontinued examining the problem, they asked questions, hypothesizedabout relationships among the variables, and drew additional graphs.
A-to-Z’s initial graph depicted the behavior of sales, the sales force, prof-its, and new product releases. Observing that while sales were rising, profitswere falling, the A-to-Z managers hypothesized that the problem might liein the relationship between the total number of new products and the unitcost of carrying new products. Their second hypothesis theorized that theproblem might stem from the relationship between the number of low-revenue new products and the level of the average selling price. These newhypotheses led them to create their second graph, shown in Figure 3.3,“Pressure on New Product Development.”
Notice that the variables in this second graph are subsets or refinementsof the original variables. These new variables were identified as the man-agers collected data, discussed the problem among themselves, and createdtheir first graph.
As you try your hand at drawing BOTs in the learning activities that fol-low, be aware that it can take more than one attempt to identify the prob-lem and the variables and to create a graph. The effort will pay off, however.Once you’ve completed these steps, you’ll be ready to draw a picture of thesystem structure that has been generating the patterns you see on yourBOTs: the causal loop diagram, discussed in Section 4.
44 SECTION 3 � Uncovering Systemic Structures
Time
Sales
Sales Force
New ProductReleases
Profits
Sales revenue at A-to-Z had risen every quarter for thepast 10 years, but profit growth had been falling for thelast several quarters. Meanwhile, new product launchesand the size of the sales staff were increasingevery year.
Time
Total Numberof ProductsUnit Cost ofCarrying Products
Average Selling Price
New Products with< $10K Revenues
When A-to-Z’s managers looked at their products’ sales overtime, they realized that although the number of products hadbeen growing steadily, the cost of carrying the products wasgrowing at an even faster rate. Drawing this BOT helped identifya self-perpetuating cycle, in which increasing revenue pressuresput pressure on new product development to pump out newproducts that were easier to develop and launch, rather thaninnovative and potentially more profitable ones.
F I G U R E 3 . 2
A-to-Z’s Performance Over Time
F I G U R E 3 . 3
Pressure on New Product Development
After trying the learning activities below, compare your responses with those in Appendix B.Don’t worry if your responses look different from those in the appendix; there’s no one right“answer” in a systems thinking analysis. These activities are meant mainly to get you startedthinking about formulating problems, choosing variables, and graphing behavior over time.
ACTIVITY 1 T H E P R O B L E M W I T H P R I C E P R O M O T I O N S
Purpose: To identify the central problem in a complex situation
Outcome: A statement of the central problem in the case studyA description of a deeper problem that may lie beneath the central problem
described in the case
Instructions: Read the case below and then answer the questions that follow.
Case Study � The Problem with Price Promotions
In the early nineties, a slowdown in U.S. population growth translated intosmaller annual increases in consumer consumption, particularly of foodproducts. Moreover, manufacturers’ product innovation slacked off, andcompanies had trouble distinguishing their brands in meaningful ways otherthan through price. Their response: Offer price-cutting promotions to boostsales.
Manufacturers and retailers acknowledged that continual promotionscould erode brand image and encourage consumers to shop solely on price.Also, companies could become dependent on short-term promotions topump up sales numbers. Furthermore, manufacturers’ promotions gavesupermarkets especially great power, for they controlled the promotions onfood products. Supermarkets could demand a wide range of subsidies, includ-ing fees for prime shelf space and money to pay for promotional materialand newspaper ads.
The focus on price promotions spawned practices such as “forward buy-ing,” in which a supermarket bought more of a discounted product than itplanned to sell during a promotion and then boosted its profit margin byselling the rest of the product at the regular price. Some supermarkets also“diverted” some of their low-priced shipments at a slight markup (but stillwell below the wholesale list price) to supermarkets outside the promotionalarea. For manufacturers, this meant that a large percentage of discountsintended for consumers wound up in retailers’ pockets instead.
Learning Activities 45
L E A R N I N G A C T I V I T I E S
QUESTIONS
1. What are all the problems described in the case? List as many as you can.
2. From the point of view of the food manufacturers, what would you say is the overarching prob-lem that includes many of the specific problems you named in Question 1?
3. Is there an even deeper problem behind the one you named in Question 2? If so, what is it?
ACTIVITY 2 T H E C A S E O F T H E E N E R G Y D R A I N
Purpose: To practice drawing a behavior over time graph
Outcome: A statement of the overall problem in the storyA list of key variablesA graph of those variables’ behavior over time
Instructions: Read the case below and then answer the questions that follow.
Case Study � The Energy Drain
It’s 6:00 AM on Monday. The alarm blares, jolting you out of bed. You shuffledown to the kitchen to grab a cup of coffee. A few gulps and . . . ahhh. Youreyes start to open and the fog begins to clear.
10:30 AM, time for the weekly staff meeting. “I feel so groggy,” you think.“I gotta have something to keep me awake through this one.” You pouryourself another cup of coffee and head for the conference room.
Noon, and you’re chatting with your colleagues at a quick lunch break.Someone refers to an article in the newspaper about fashion models’ fitness
46 SECTION 3 � Uncovering Systemic Structures

routines. “Honest, it said that those high-priced runway models have toreally watch it on caffeine. The way they keep their energy up is daily exer-cise and lots of sleep . . . ‘beauty sleep,’ I’ll bet!”
Comments fly about who has time for daily exercise, getting paid to workout, and so on.
3:30 PM, you’re feeling the mid-afternoon energy slump. You head to thecrowded coffee cart to get another cup. “I really ought to cut down on thisstuff,” you comment to your friend in line. He nods. “I’m a five-cup-a-dayguy, myself,” he confesses. “I just can’t give it up.”
QUESTIONS
1. What’s the problem in this story?
2. What are the three or four most important variables in the case?
3. What is the behavior of those variables over time? Graph them in the space below.
4. What do you observe about the behavior of the variables? For example, do any of them increaseor decrease steadily over time? Are there dramatic changes (sudden upswings or plunges)? Do anyof the variables seem to go through a cycle, as indicated by up-and-down patterns? Do any ofthem hold steady?
Learning Activities 47
5. Do you observe any relationships among the behavior patterns of the variables? If so, what? Forexample, does one variable seem to rise or fall, followed by another variable’s rising or falling?
ACTIVITY 3 T H E C A S E O F T H E A U D I O - E L E C T R O N I C R O L L E R C O A S T E R
Purpose: To practice drawing a behavior over time graph
Outcome: A statement of the overall problem in the storyA list of key variablesA graph of those variables’ behavior over time
Instructions: Read the case below and then answer the questions that follow.
Case Study � The Audio-Electronic Roller Coaster
AudioMax Corporation was on its way up. During the mid-1980s, the com-pany enjoyed rapid growth and rising revenues. A manufacturer of specialaudio-electronics products, AudioMax served a growing core of clients whowere willing to pay a higher price for better sounding, better quality innova-tions. AudioMax’s products were well received because experts said theyreally did sound better. Initially AudioMax focused on maintaining a highdegree of technical innovation, and this strategy generated a steady streamof new products.
Unfortunately, problems associated with AudioMax’s subsequent rapidgrowth soon led the company into financial trouble. The company’s CEO,Diane Schuster, had promised the investment banking community thatimmediately after going public in 1990 the company would beef up its man-agement team. However, Schuster didn’t bring in new people from the out-side until 1991. When she finally added experienced management talentwho could improve AudioMax’s corporate strategizing, Schuster found itincreasingly difficult to keep the company focused on R&D. Corporateexpenses exploded, and productivity plummeted.
Meanwhile, the company began losing market strength, partly owing toits resistance to introducing models with simple cosmetic changes. Becausethe company was not introducing enough new products to keep customersinterested, its dealer base began to deteriorate. In 1994, AudioMax had only230 dealers, half as many as in 1990. Net income skidded sharply after 1991,
48 SECTION 3 � Uncovering Systemic Structures

followed by a heavy sales slump in early 1993 (Figure 3.4, “AudioMax’sIncome Slide”).
AudioMax’s problems persisted. The company cut costs by laying off one-third of the work force, but when sales rebounded, it could not rebuild stafffast enough to meet the new demand.
During the second half of 1994, AudioMax tried to get back on track bydeveloping and releasing 18 new products. But as these new product lineswere developed, the core products became even more dated.
During 1995, AudioMax saw net income rebound and sales increase over1994. This time the CEO hoped the quality improvements would make alasting difference. But the continuing cycle of ups and downs that followedAudioMax’s rapid growth suggest an uncertain future for the company.
Learning Activities 49
2500
'90 '91 '92 '93 '94 '95 '96
2000
15001000
500
0
–500
–1000–1500
–2000
Net
Inco
me
(Tho
usan
ds)
F I G U R E 3 . 4
AudioMax’s Income Slide
QUESTIONS
1. What was the long-standing, chronic problem facing AudioMax Corp.?
2. What two variables fed the initial steady growth in demand from AudioMax’s customers?
3. Once AudioMax went public, what variable limited its ability to continue handling the growth indemand?

4. In the space below, graph the behavior over time of the two variables you identified in Question2 and the one from Question 3. Then, add the behavior over time of two more variables:“Demand” and “Ability to meet customers’ needs.”
5. What do you observe about the behavior of the variables over time?
6. What relationships do you observe among the variables?
50 SECTION 3 � Uncovering Systemic Structures
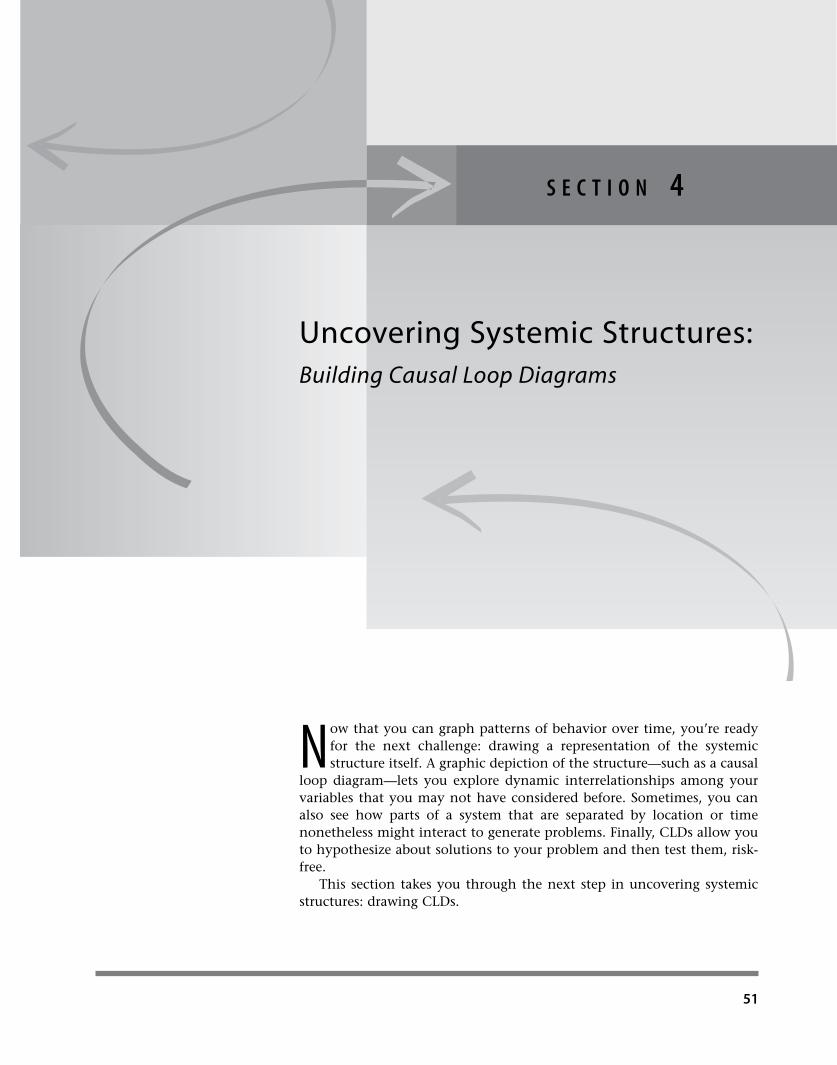
Now that you can graph patterns of behavior over time, you’re readyfor the next challenge: drawing a representation of the systemicstructure itself. A graphic depiction of the structure—such as a causal
loop diagram—lets you explore dynamic interrelationships among yourvariables that you may not have considered before. Sometimes, you canalso see how parts of a system that are separated by location or timenonetheless might interact to generate problems. Finally, CLDs allow youto hypothesize about solutions to your problem and then test them, risk-free.This section takes you through the next step in uncovering systemic
structures: drawing CLDs.
51
S E C T I O N 4
Uncovering Systemic Structures:Building Causal Loop Diagrams
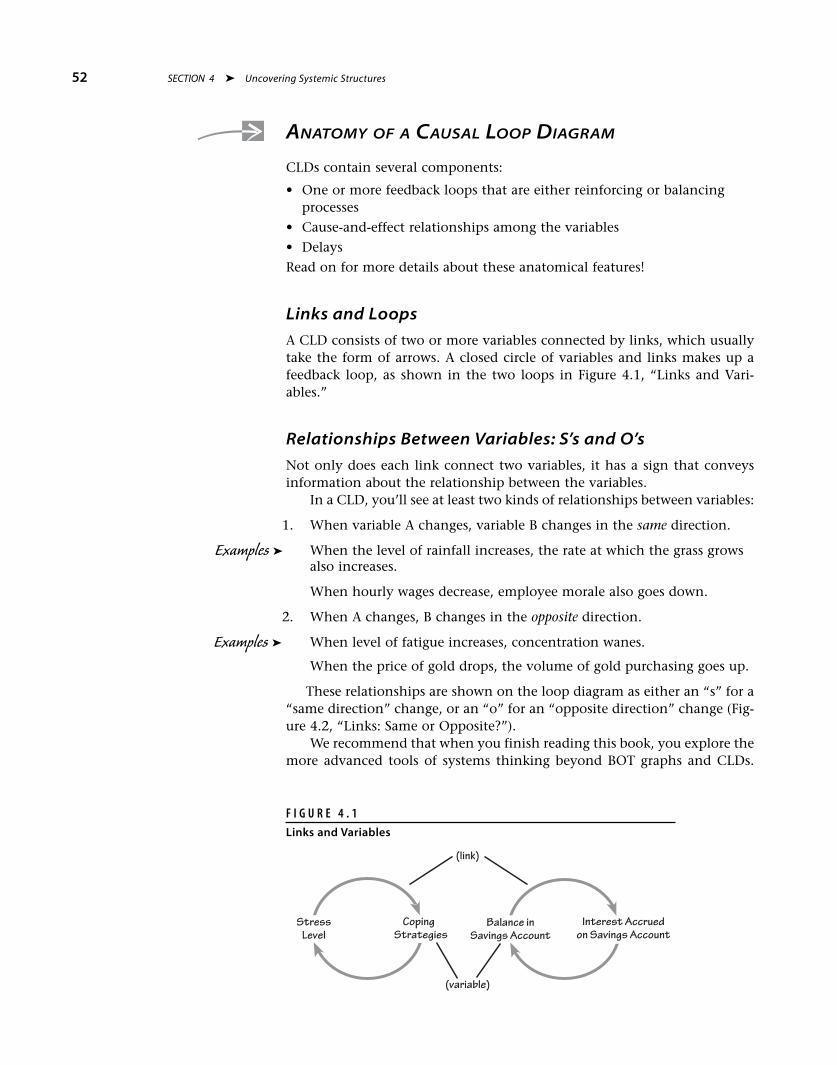
ANATOMY OF A CAUSAL LOOP DIAGRAM
CLDs contain several components:
• One or more feedback loops that are either reinforcing or balancingprocesses
• Cause-and-effect relationships among the variables
• Delays
Read on for more details about these anatomical features!
Links and Loops
A CLD consists of two or more variables connected by links, which usuallytake the form of arrows. A closed circle of variables and links makes up afeedback loop, as shown in the two loops in Figure 4.1, “Links and Vari-ables.”
Relationships Between Variables: S’s and O’s
Not only does each link connect two variables, it has a sign that conveysinformation about the relationship between the variables.
In a CLD, you’ll see at least two kinds of relationships between variables:
1. When variable A changes, variable B changes in the same direction.
Examples � When the level of rainfall increases, the rate at which the grass growsalso increases.
When hourly wages decrease, employee morale also goes down.
2. When A changes, B changes in the opposite direction.
Examples � When level of fatigue increases, concentration wanes.
When the price of gold drops, the volume of gold purchasing goes up.
These relationships are shown on the loop diagram as either an “s” for a“same direction” change, or an “o” for an “opposite direction” change (Fig-ure 4.2, “Links: Same or Opposite?”).
We recommend that when you finish reading this book, you explore themore advanced tools of systems thinking beyond BOT graphs and CLDs.
52 SECTION 4 � Uncovering Systemic Structures
CopingStrategies
StressLevel
Interest Accruedon Savings Account
Balance inSavings Account
(link)
(variable)
F I G U R E 4 . 1
Links and Variables
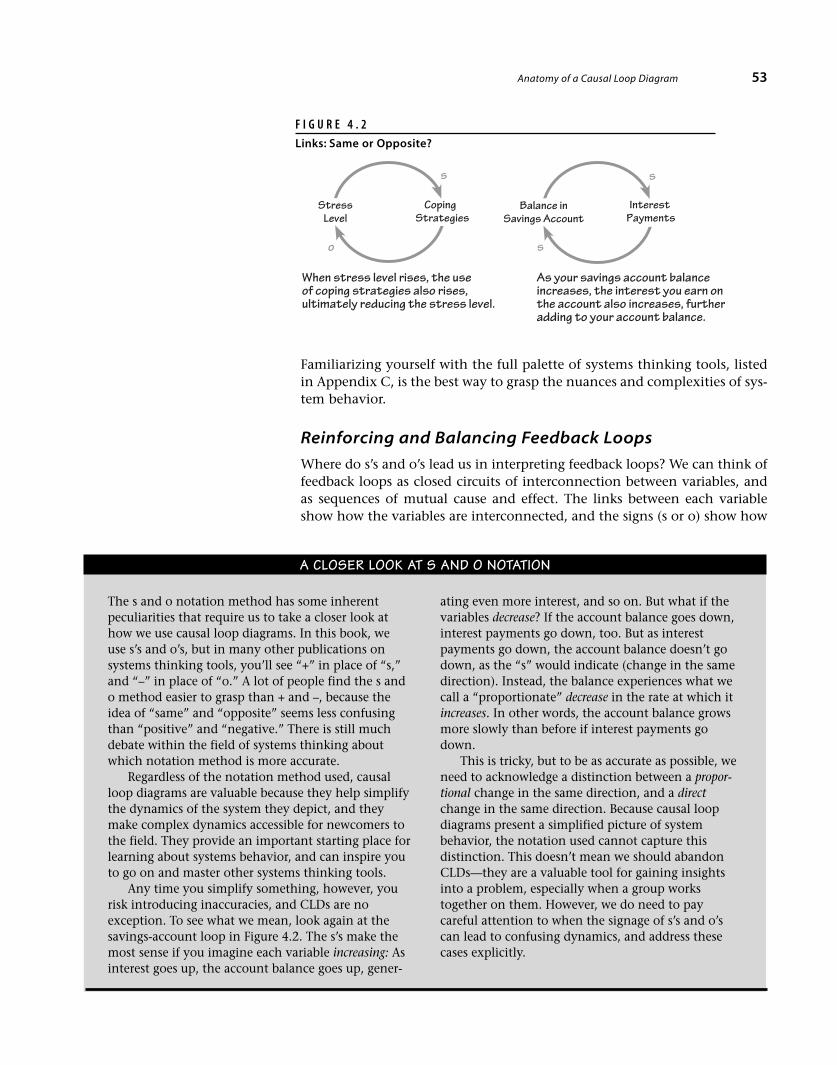
Familiarizing yourself with the full palette of systems thinking tools, listedin Appendix C, is the best way to grasp the nuances and complexities of sys-tem behavior.
Reinforcing and Balancing Feedback Loops
Where do s’s and o’s lead us in interpreting feedback loops? We can think offeedback loops as closed circuits of interconnection between variables, andas sequences of mutual cause and effect. The links between each variableshow how the variables are interconnected, and the signs (s or o) show how
Anatomy of a Causal Loop Diagram 53
F I G U R E 4 . 2
Links: Same or Opposite?
CopingStrategies
o
s
StressLevel
InterestPayments
s
s
Balance inSavings Account
When stress level rises, the useof coping strategies also rises,ultimately reducing the stress level.
As your savings account balanceincreases, the interest you earn onthe account also increases, furtheradding to your account balance.
The s and o notation method has some inherentpeculiarities that require us to take a closer look athow we use causal loop diagrams. In this book, weuse s’s and o’s, but in many other publications onsystems thinking tools, you’ll see “+” in place of “s,”and “–” in place of “o.” A lot of people find the s ando method easier to grasp than + and –, because theidea of “same” and “opposite” seems less confusingthan “positive” and “negative.” There is still muchdebate within the field of systems thinking aboutwhich notation method is more accurate.
Regardless of the notation method used, causalloop diagrams are valuable because they help simplifythe dynamics of the system they depict, and theymake complex dynamics accessible for newcomers tothe field. They provide an important starting place forlearning about systems behavior, and can inspire youto go on and master other systems thinking tools.
Any time you simplify something, however, yourisk introducing inaccuracies, and CLDs are noexception. To see what we mean, look again at thesavings-account loop in Figure 4.2. The s’s make themost sense if you imagine each variable increasing: Asinterest goes up, the account balance goes up, gener-
A CLOSER LOOK AT S AND O NOTATION
ating even more interest, and so on. But what if thevariables decrease? If the account balance goes down,interest payments go down, too. But as interestpayments go down, the account balance doesn’t godown, as the “s” would indicate (change in the samedirection). Instead, the balance experiences what wecall a “proportionate” decrease in the rate at which itincreases. In other words, the account balance growsmore slowly than before if interest payments godown.
This is tricky, but to be as accurate as possible, weneed to acknowledge a distinction between a propor-tional change in the same direction, and a directchange in the same direction. Because causal loopdiagrams present a simplified picture of systembehavior, the notation used cannot capture thisdistinction. This doesn’t mean we should abandonCLDs—they are a valuable tool for gaining insightsinto a problem, especially when a group workstogether on them. However, we do need to paycareful attention to when the signage of s’s and o’scan lead to confusing dynamics, and address thesecases explicitly.
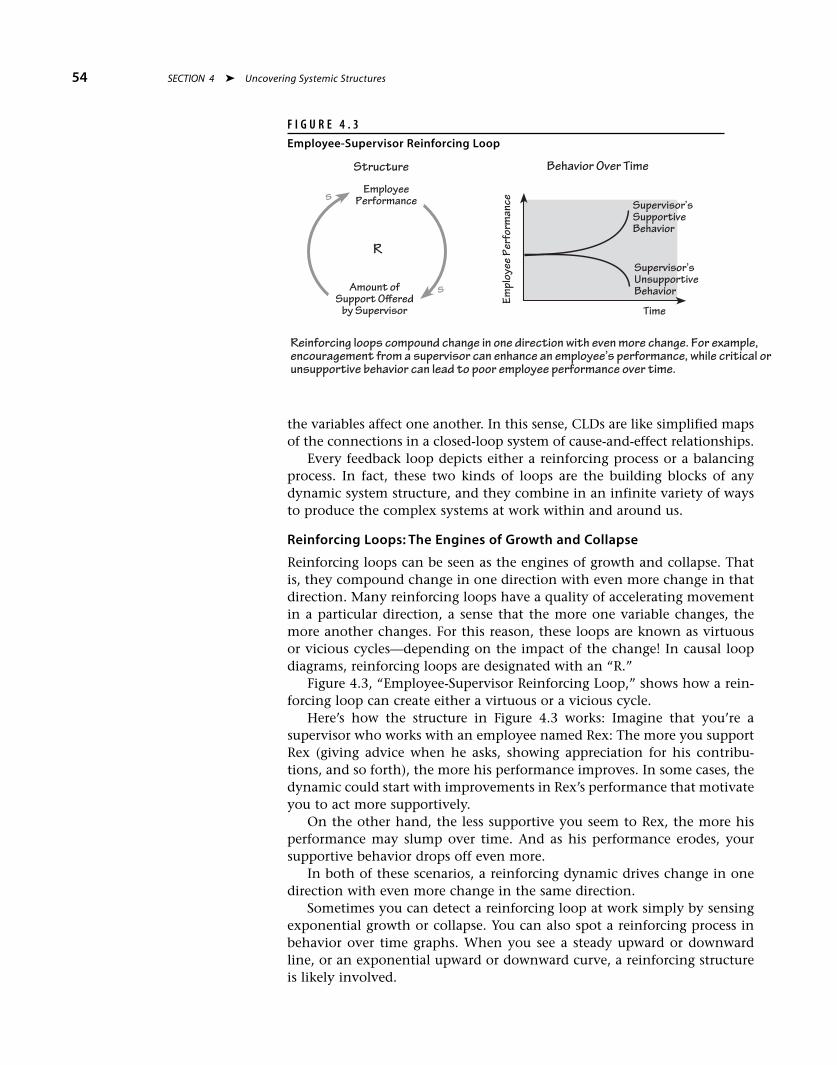
the variables affect one another. In this sense, CLDs are like simplified mapsof the connections in a closed-loop system of cause-and-effect relationships.Every feedback loop depicts either a reinforcing process or a balancing
process. In fact, these two kinds of loops are the building blocks of anydynamic system structure, and they combine in an infinite variety of waysto produce the complex systems at work within and around us.
Reinforcing Loops: The Engines of Growth and Collapse
Reinforcing loops can be seen as the engines of growth and collapse. Thatis, they compound change in one direction with even more change in thatdirection. Many reinforcing loops have a quality of accelerating movementin a particular direction, a sense that the more one variable changes, themore another changes. For this reason, these loops are known as virtuousor vicious cycles—depending on the impact of the change! In causal loopdiagrams, reinforcing loops are designated with an “R.”Figure 4.3, “Employee-Supervisor Reinforcing Loop,” shows how a rein-
forcing loop can create either a virtuous or a vicious cycle.Here’s how the structure in Figure 4.3 works: Imagine that you’re a
supervisor who works with an employee named Rex: The more you supportRex (giving advice when he asks, showing appreciation for his contribu-tions, and so forth), the more his performance improves. In some cases, thedynamic could start with improvements in Rex’s performance that motivateyou to act more supportively.On the other hand, the less supportive you seem to Rex, the more his
performance may slump over time. And as his performance erodes, yoursupportive behavior drops off even more.In both of these scenarios, a reinforcing dynamic drives change in one
direction with even more change in the same direction.Sometimes you can detect a reinforcing loop at work simply by sensing
exponential growth or collapse. You can also spot a reinforcing process inbehavior over time graphs. When you see a steady upward or downwardline, or an exponential upward or downward curve, a reinforcing structureis likely involved.
54 SECTION 4 � Uncovering Systemic Structures
Amount ofSupport Offered
by Supervisor
EmployeePerformance
R
s
s
Time
Empl
oyee
Perf
orm
ance
Structure Behavior Over Time
Supervisor’sSupportiveBehavior
Supervisor’sUnsupportiveBehavior
Reinforcing loops compound change in one direction with even more change. For example,encouragement from a supervisor can enhance an employee’s performance, while critical orunsupportive behavior can lead to poor employee performance over time.
F I G U R E 4 . 3
Employee-Supervisor Reinforcing Loop
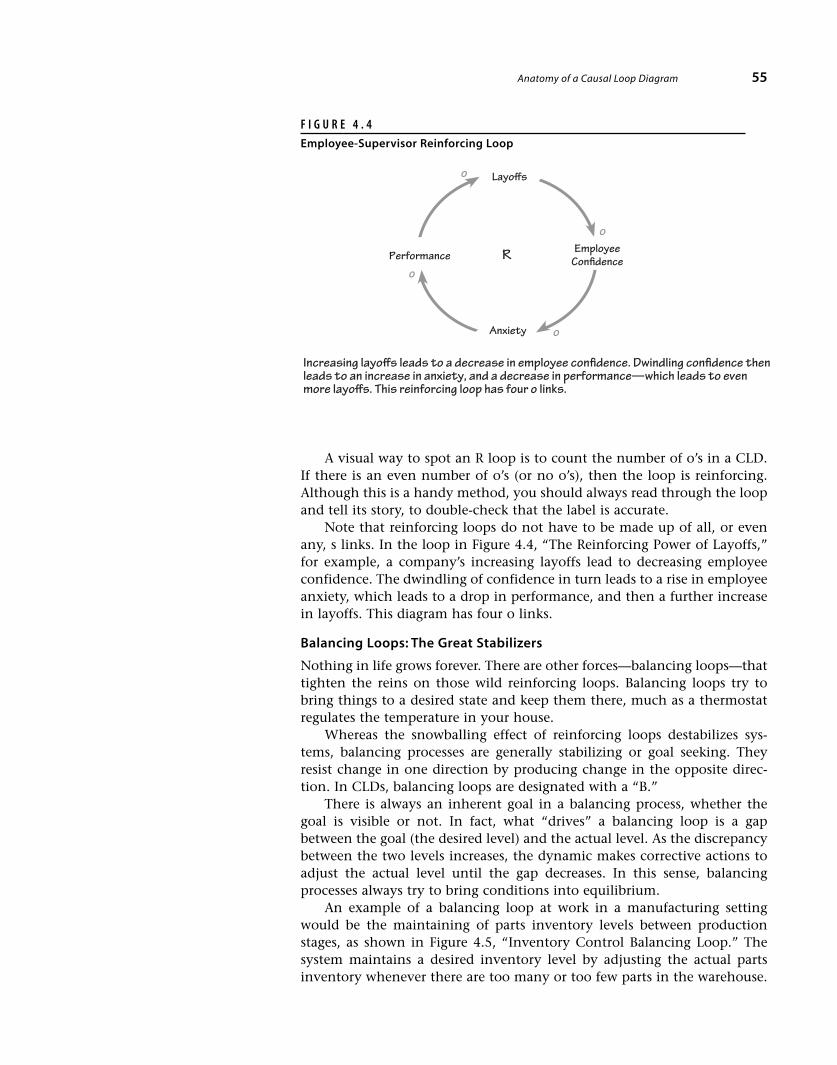
A visual way to spot an R loop is to count the number of o’s in a CLD.If there is an even number of o’s (or no o’s), then the loop is reinforcing.Although this is a handy method, you should always read through the loopand tell its story, to double-check that the label is accurate.
Note that reinforcing loops do not have to be made up of all, or evenany, s links. In the loop in Figure 4.4, “The Reinforcing Power of Layoffs,”for example, a company’s increasing layoffs lead to decreasing employeeconfidence. The dwindling of confidence in turn leads to a rise in employeeanxiety, which leads to a drop in performance, and then a further increasein layoffs. This diagram has four o links.
Balancing Loops: The Great Stabilizers
Nothing in life grows forever. There are other forces—balancing loops—thattighten the reins on those wild reinforcing loops. Balancing loops try tobring things to a desired state and keep them there, much as a thermostatregulates the temperature in your house.
Whereas the snowballing effect of reinforcing loops destabilizes sys-tems, balancing processes are generally stabilizing or goal seeking. Theyresist change in one direction by producing change in the opposite direc-tion. In CLDs, balancing loops are designated with a “B.”
There is always an inherent goal in a balancing process, whether thegoal is visible or not. In fact, what “drives” a balancing loop is a gapbetween the goal (the desired level) and the actual level. As the discrepancybetween the two levels increases, the dynamic makes corrective actions toadjust the actual level until the gap decreases. In this sense, balancingprocesses always try to bring conditions into equilibrium.
An example of a balancing loop at work in a manufacturing settingwould be the maintaining of parts inventory levels between productionstages, as shown in Figure 4.5, “Inventory Control Balancing Loop.” Thesystem maintains a desired inventory level by adjusting the actual partsinventory whenever there are too many or too few parts in the warehouse.
Anatomy of a Causal Loop Diagram 55
Anxiety
Layoffs
Increasing layoffs leads to a decrease in employee confidence. Dwindling confidence thenleads to an increase in anxiety, and a decrease in performance—which leads to evenmore layoffs. This reinforcing loop has four o links.
R
o
o
Performance
o
EmployeeConfidence
o
F I G U R E 4 . 4
Employee-Supervisor Reinforcing Loop
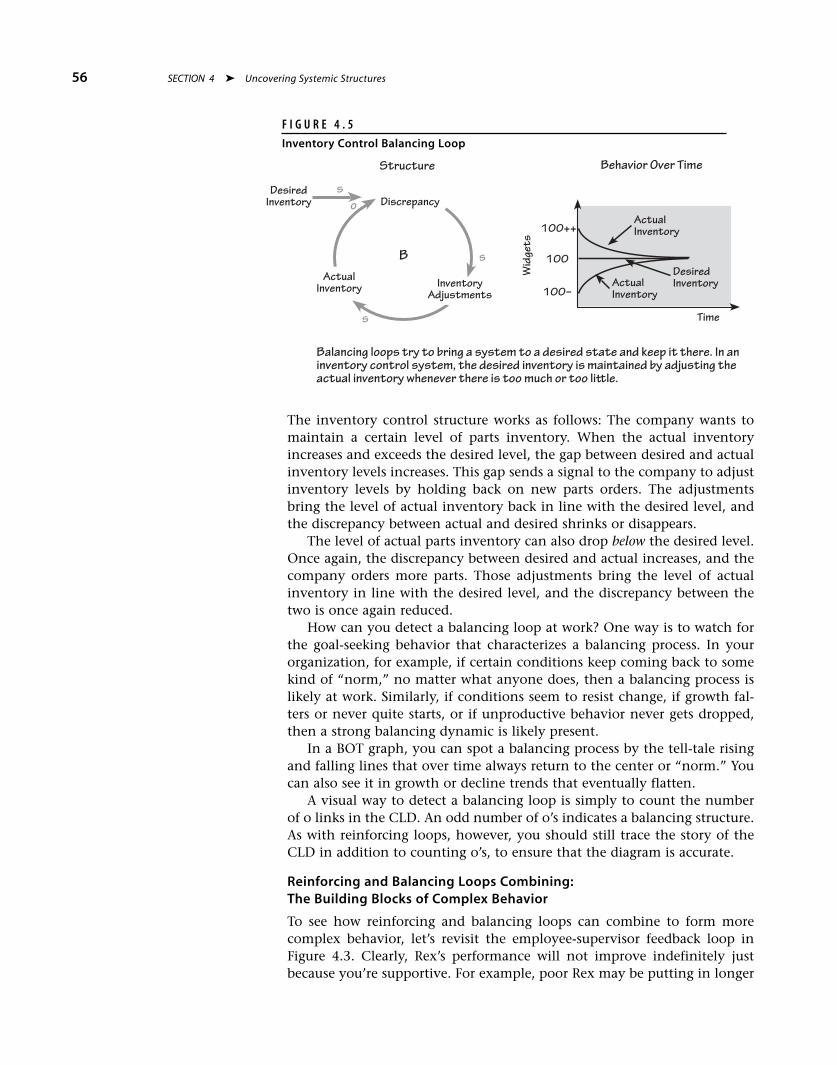
The inventory control structure works as follows: The company wants tomaintain a certain level of parts inventory. When the actual inventoryincreases and exceeds the desired level, the gap between desired and actualinventory levels increases. This gap sends a signal to the company to adjustinventory levels by holding back on new parts orders. The adjustmentsbring the level of actual inventory back in line with the desired level, andthe discrepancy between actual and desired shrinks or disappears.The level of actual parts inventory can also drop below the desired level.
Once again, the discrepancy between desired and actual increases, and thecompany orders more parts. Those adjustments bring the level of actualinventory in line with the desired level, and the discrepancy between thetwo is once again reduced.How can you detect a balancing loop at work? One way is to watch for
the goal-seeking behavior that characterizes a balancing process. In yourorganization, for example, if certain conditions keep coming back to somekind of “norm,” no matter what anyone does, then a balancing process islikely at work. Similarly, if conditions seem to resist change, if growth fal-ters or never quite starts, or if unproductive behavior never gets dropped,then a strong balancing dynamic is likely present.In a BOT graph, you can spot a balancing process by the tell-tale rising
and falling lines that over time always return to the center or “norm.” Youcan also see it in growth or decline trends that eventually flatten.A visual way to detect a balancing loop is simply to count the number
of o links in the CLD. An odd number of o’s indicates a balancing structure.As with reinforcing loops, however, you should still trace the story of theCLD in addition to counting o’s, to ensure that the diagram is accurate.
Reinforcing and Balancing Loops Combining:The Building Blocks of Complex Behavior
To see how reinforcing and balancing loops can combine to form morecomplex behavior, let’s revisit the employee-supervisor feedback loop inFigure 4.3. Clearly, Rex’s performance will not improve indefinitely justbecause you’re supportive. For example, poor Rex may be putting in longer
56 SECTION 4 � Uncovering Systemic Structures
ActualInventory
Discrepancy
B
s
s Time
Wid
gets
Structure Behavior Over Time
ActualInventory
DesiredInventory
Balancing loops try to bring a system to a desired state and keep it there. In aninventory control system, the desired inventory is maintained by adjusting theactual inventory whenever there is too much or too li!le.
oDesired
Inventory
InventoryAdjustments
s
100++
100
100–ActualInventory
F I G U R E 4 . 5
Inventory Control Balancing Loop
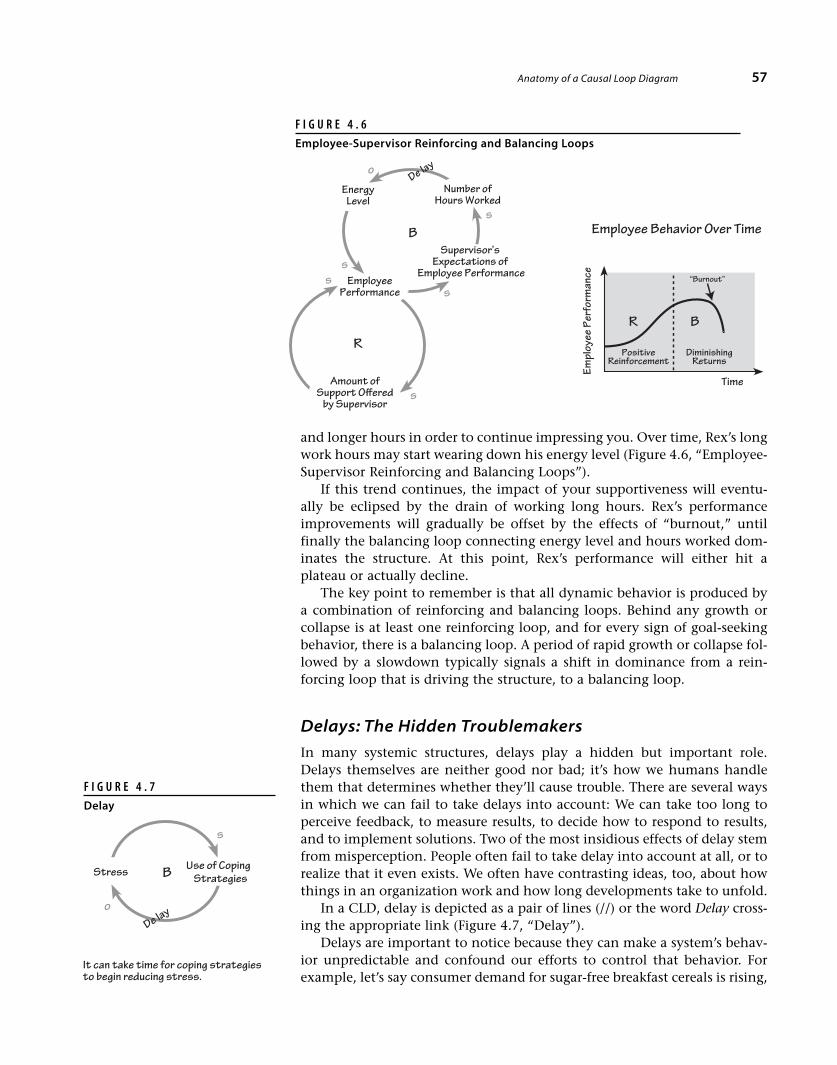
and longer hours in order to continue impressing you. Over time, Rex’s longwork hours may start wearing down his energy level (Figure 4.6, “Employee-Supervisor Reinforcing and Balancing Loops”).If this trend continues, the impact of your supportiveness will eventu-
ally be eclipsed by the drain of working long hours. Rex’s performanceimprovements will gradually be offset by the effects of “burnout,” untilfinally the balancing loop connecting energy level and hours worked dom-inates the structure. At this point, Rex’s performance will either hit aplateau or actually decline.The key point to remember is that all dynamic behavior is produced by
a combination of reinforcing and balancing loops. Behind any growth orcollapse is at least one reinforcing loop, and for every sign of goal-seekingbehavior, there is a balancing loop. A period of rapid growth or collapse fol-lowed by a slowdown typically signals a shift in dominance from a rein-forcing loop that is driving the structure, to a balancing loop.
Delays: The Hidden Troublemakers
In many systemic structures, delays play a hidden but important role.Delays themselves are neither good nor bad; it’s how we humans handlethem that determines whether they’ll cause trouble. There are several waysin which we can fail to take delays into account: We can take too long toperceive feedback, to measure results, to decide how to respond to results,and to implement solutions. Two of the most insidious effects of delay stemfrom misperception. People often fail to take delay into account at all, or torealize that it even exists. We often have contrasting ideas, too, about howthings in an organization work and how long developments take to unfold.In a CLD, delay is depicted as a pair of lines (//) or the word Delay cross-
ing the appropriate link (Figure 4.7, “Delay”).Delays are important to notice because they can make a system’s behav-
ior unpredictable and confound our efforts to control that behavior. Forexample, let’s say consumer demand for sugar-free breakfast cereals is rising,
Anatomy of a Causal Loop Diagram 57
Amount ofSupport Offered
by Supervisor
R
s
sTime
Empl
oyee
Perf
orm
ance
Employee Behavior Over Time
EnergyLevel
Bs
oNumber of
Hours Worked
sEmployee
Performance
De lay
“Burnout”
PositiveReinforcement
DiminishingReturns
BR
Supervisor’sExpectations of
Employee Performance
s
F I G U R E 4 . 6
Employee-Supervisor Reinforcing and Balancing Loops
Use of CopingStrategies
o
s
Stress
It can take time for coping strategiesto begin reducing stress.
B
De lay
F I G U R E 4 . 7
Delay
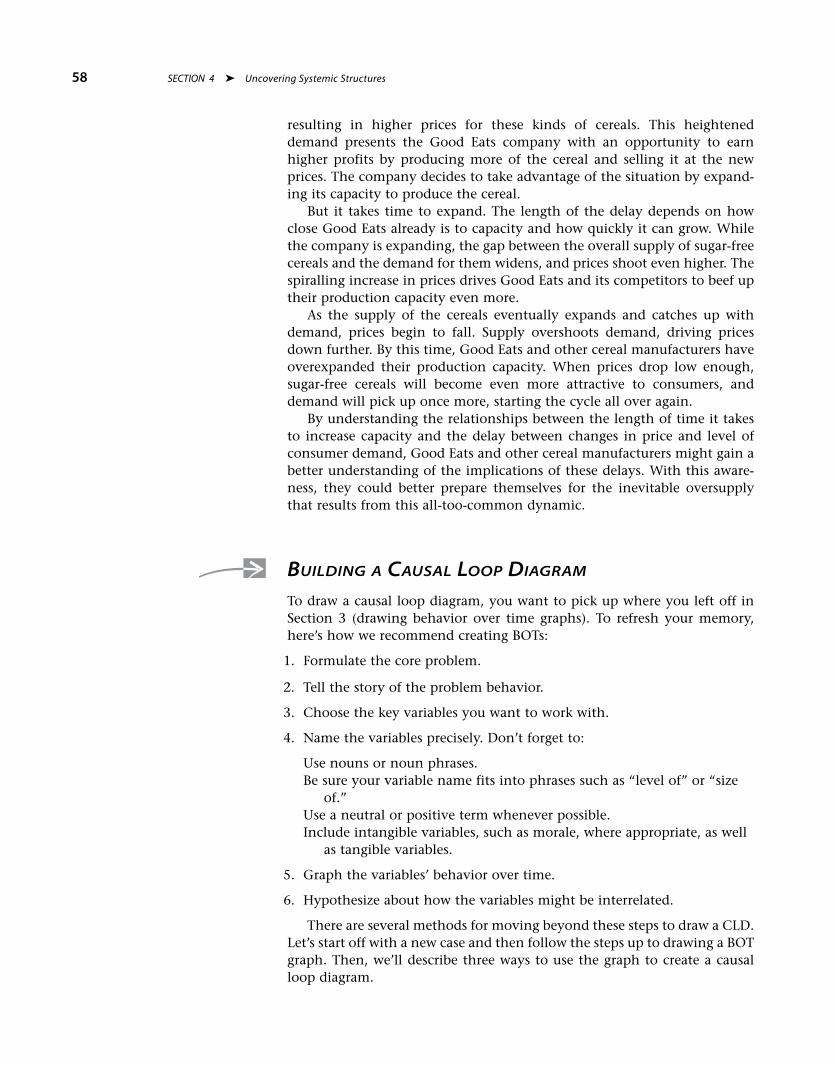
resulting in higher prices for these kinds of cereals. This heighteneddemand presents the Good Eats company with an opportunity to earnhigher profits by producing more of the cereal and selling it at the newprices. The company decides to take advantage of the situation by expand-ing its capacity to produce the cereal.But it takes time to expand. The length of the delay depends on how
close Good Eats already is to capacity and how quickly it can grow. Whilethe company is expanding, the gap between the overall supply of sugar-freecereals and the demand for them widens, and prices shoot even higher. Thespiralling increase in prices drives Good Eats and its competitors to beef uptheir production capacity even more.As the supply of the cereals eventually expands and catches up with
demand, prices begin to fall. Supply overshoots demand, driving pricesdown further. By this time, Good Eats and other cereal manufacturers haveoverexpanded their production capacity. When prices drop low enough,sugar-free cereals will become even more attractive to consumers, anddemand will pick up once more, starting the cycle all over again.By understanding the relationships between the length of time it takes
to increase capacity and the delay between changes in price and level ofconsumer demand, Good Eats and other cereal manufacturers might gain abetter understanding of the implications of these delays. With this aware-ness, they could better prepare themselves for the inevitable oversupplythat results from this all-too-common dynamic.
BUILDING A CAUSAL LOOP DIAGRAM
To draw a causal loop diagram, you want to pick up where you left off inSection 3 (drawing behavior over time graphs). To refresh your memory,here’s how we recommend creating BOTs:
1. Formulate the core problem.
2. Tell the story of the problem behavior.
3. Choose the key variables you want to work with.
4. Name the variables precisely. Don’t forget to:
Use nouns or noun phrases.Be sure your variable name fits into phrases such as “level of” or “sizeof.”
Use a neutral or positive term whenever possible.Include intangible variables, such as morale, where appropriate, as wellas tangible variables.
5. Graph the variables’ behavior over time.
6. Hypothesize about how the variables might be interrelated.
There are several methods for moving beyond these steps to draw a CLD.Let’s start off with a new case and then follow the steps up to drawing a BOTgraph. Then, we’ll describe three ways to use the graph to create a causalloop diagram.
58 SECTION 4 � Uncovering Systemic Structures
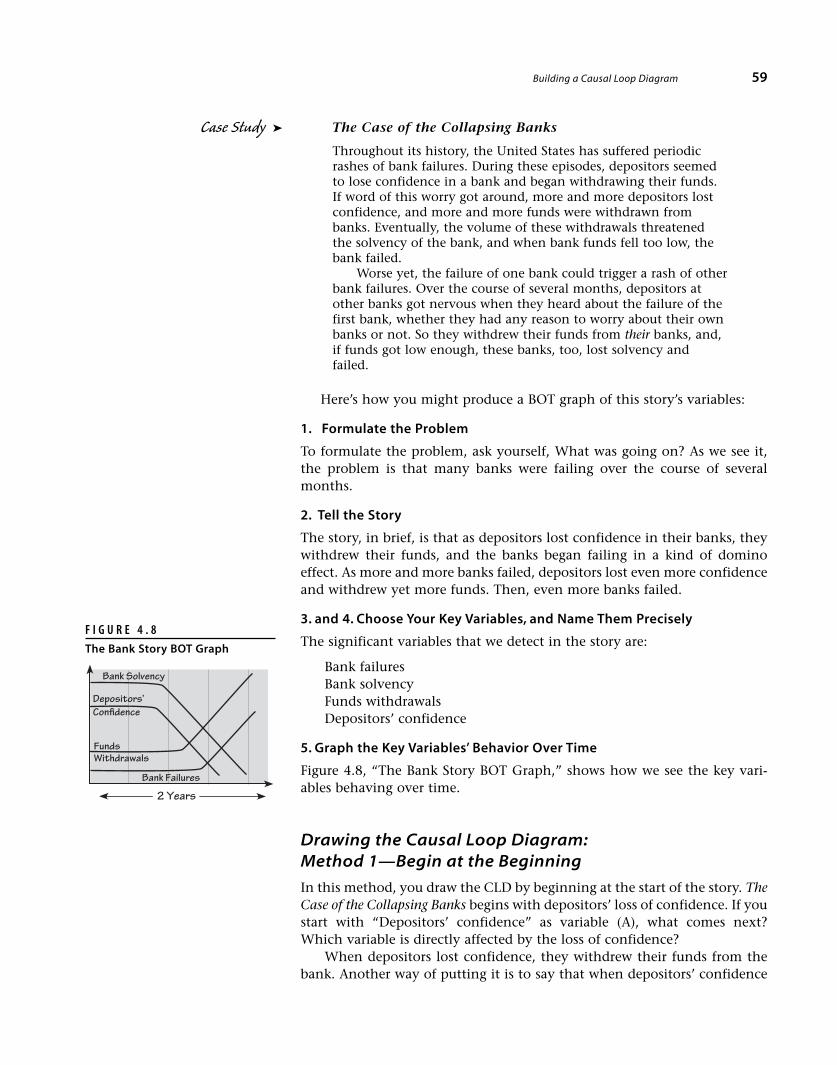
Case Study � The Case of the Collapsing Banks
Throughout its history, the United States has suffered periodicrashes of bank failures. During these episodes, depositors seemedto lose confidence in a bank and began withdrawing their funds.If word of this worry got around, more and more depositors lostconfidence, and more and more funds were withdrawn frombanks. Eventually, the volume of these withdrawals threatenedthe solvency of the bank, and when bank funds fell too low, thebank failed.
Worse yet, the failure of one bank could trigger a rash of otherbank failures. Over the course of several months, depositors atother banks got nervous when they heard about the failure of thefirst bank, whether they had any reason to worry about their ownbanks or not. So they withdrew their funds from their banks, and,if funds got low enough, these banks, too, lost solvency andfailed.
Here’s how you might produce a BOT graph of this story’s variables:
1. Formulate the Problem
To formulate the problem, ask yourself, What was going on? As we see it,the problem is that many banks were failing over the course of severalmonths.
2. Tell the Story
The story, in brief, is that as depositors lost confidence in their banks, theywithdrew their funds, and the banks began failing in a kind of dominoeffect. As more and more banks failed, depositors lost even more confidenceand withdrew yet more funds. Then, even more banks failed.
3. and 4. Choose Your Key Variables, and Name Them Precisely
The significant variables that we detect in the story are:
Bank failuresBank solvencyFunds withdrawalsDepositors’ confidence
5. Graph the Key Variables’ Behavior Over Time
Figure 4.8, “The Bank Story BOT Graph,” shows how we see the key vari-ables behaving over time.
Drawing the Causal Loop Diagram:Method 1—Begin at the Beginning
In this method, you draw the CLD by beginning at the start of the story. TheCase of the Collapsing Banks begins with depositors’ loss of confidence. If youstart with “Depositors’ confidence” as variable (A), what comes next?Which variable is directly affected by the loss of confidence?
When depositors lost confidence, they withdrew their funds from thebank. Another way of putting it is to say that when depositors’ confidence
Building a Causal Loop Diagram 59
2 Years
Bank Solvency
Depositors’Confidence
Bank Failures
FundsWithdrawals
F I G U R E 4 . 8
The Bank Story BOT Graph
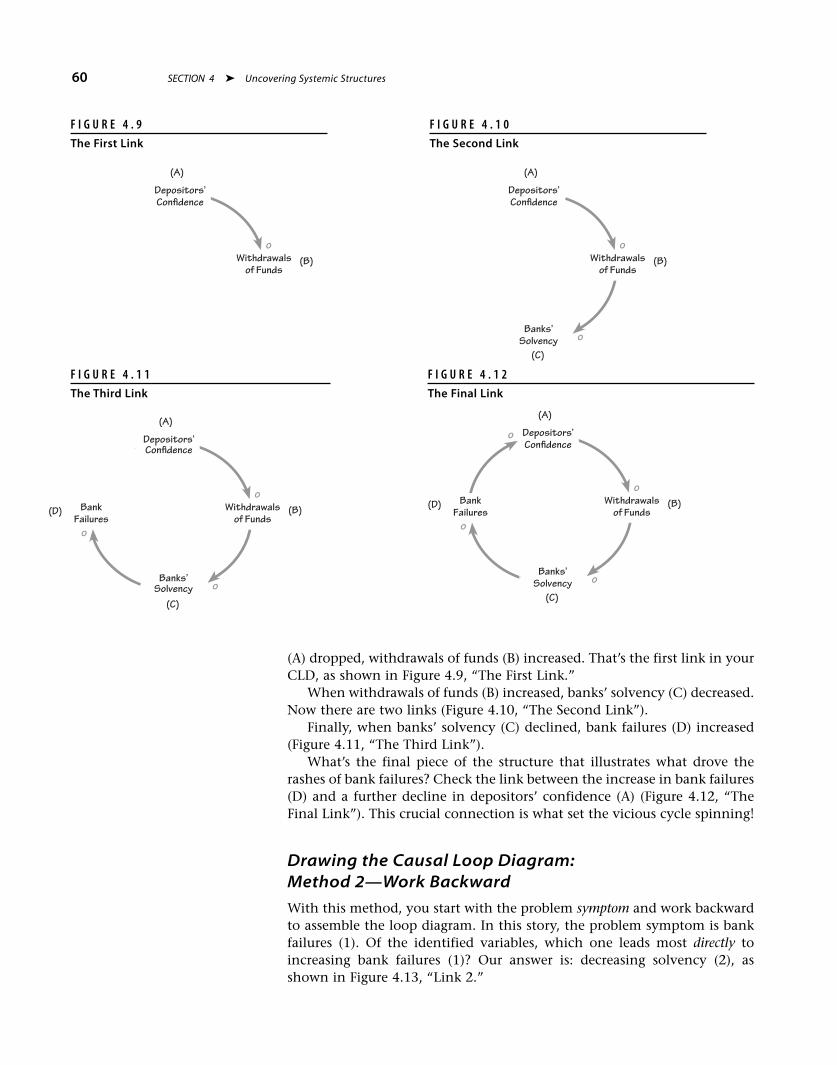
(A) dropped, withdrawals of funds (B) increased. That’s the first link in yourCLD, as shown in Figure 4.9, “The First Link.”When withdrawals of funds (B) increased, banks’ solvency (C) decreased.
Now there are two links (Figure 4.10, “The Second Link”).Finally, when banks’ solvency (C) declined, bank failures (D) increased
(Figure 4.11, “The Third Link”).What’s the final piece of the structure that illustrates what drove the
rashes of bank failures? Check the link between the increase in bank failures(D) and a further decline in depositors’ confidence (A) (Figure 4.12, “TheFinal Link”). This crucial connection is what set the vicious cycle spinning!
Drawing the Causal Loop Diagram:Method 2—Work Backward
With this method, you start with the problem symptom and work backwardto assemble the loop diagram. In this story, the problem symptom is bankfailures (1). Of the identified variables, which one leads most directly toincreasing bank failures (1)? Our answer is: decreasing solvency (2), asshown in Figure 4.13, “Link 2.”
60 SECTION 4 � Uncovering Systemic Structures
Depositors’Confidence
Withdrawalsof Funds
o
(A)
(B)
F I G U R E 4 . 9
The First Link
Withdrawalsof Funds
o
(A)
(B)
Banks’Solvency o
(C)
Depositors’Confidence
F I G U R E 4 . 1 0
The Second Link
Depositors’Confidence
Withdrawalsof Funds
o
(A)
(B)
Banks’Solvency o
(C)
BankFailures
(D)
o
F I G U R E 4 . 1 1
The Third Link
Depositors’Confidence
o
BankFailures
o
Withdrawalsof Funds
o
(A)
(B)
Banks’Solvency o
(C)
(D)
F I G U R E 4 . 1 2
The Final Link
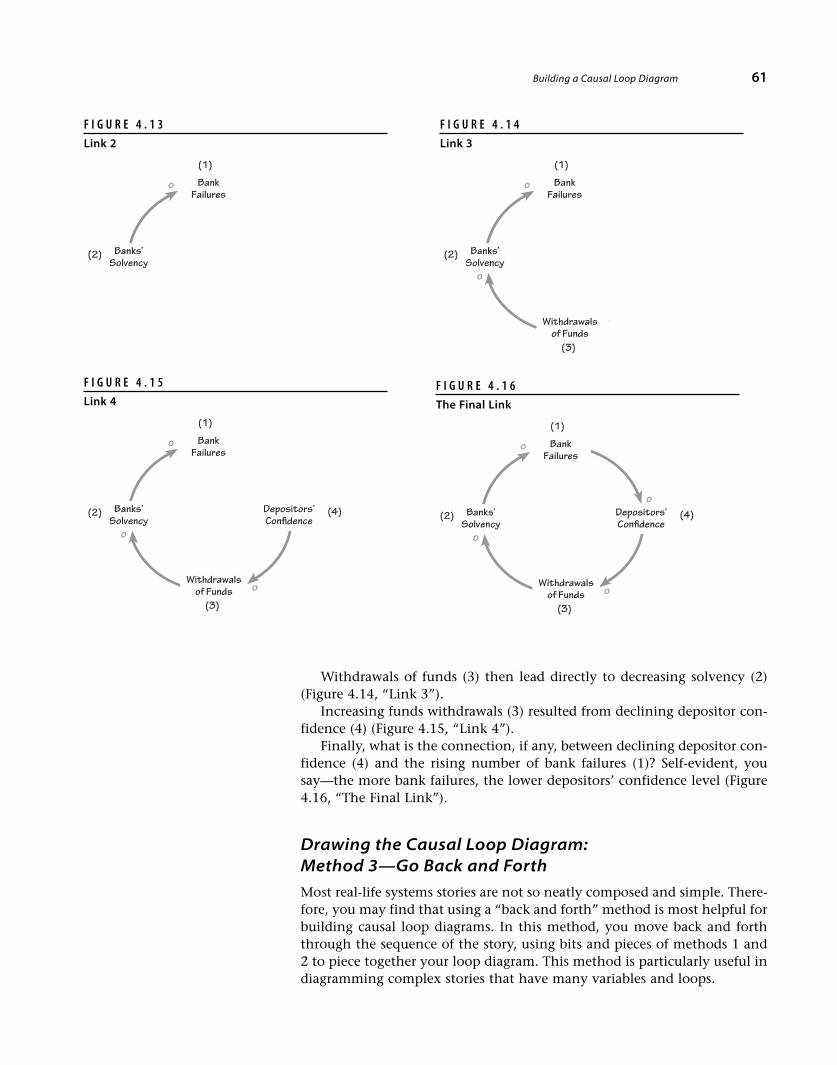
Withdrawals of funds (3) then lead directly to decreasing solvency (2)(Figure 4.14, “Link 3”).Increasing funds withdrawals (3) resulted from declining depositor con-
fidence (4) (Figure 4.15, “Link 4”).Finally, what is the connection, if any, between declining depositor con-
fidence (4) and the rising number of bank failures (1)? Self-evident, yousay—the more bank failures, the lower depositors’ confidence level (Figure4.16, “The Final Link”).
Drawing the Causal Loop Diagram:Method 3—Go Back and Forth
Most real-life systems stories are not so neatly composed and simple. There-fore, you may find that using a “back and forth” method is most helpful forbuilding causal loop diagrams. In this method, you move back and forththrough the sequence of the story, using bits and pieces of methods 1 and2 to piece together your loop diagram. This method is particularly useful indiagramming complex stories that have many variables and loops.
Building a Causal Loop Diagram 61
o BankFailures
(1)
Banks’Solvency
(2)
F I G U R E 4 . 1 3
Link 2
o BankFailures
o
(1)
Banks’Solvency
(3)
(2)
Withdrawalsof Funds
F I G U R E 4 . 1 4
Link 3
o BankFailures
o
(1)
(4)Banks’Solvency
o
(3)
(2) Depositors’Confidence
Withdrawalsof Funds
F I G U R E 4 . 1 5
Link 4
o BankFailures
o
o
(1)
(4)Banks’Solvency
o
(3)
(2) Depositors’Confidence
Withdrawalsof Funds
F I G U R E 4 . 1 6
The Final Link

You may also want to immerse yourself in several versions of the story.In a group effort, especially, just the act of identifying the variables, graph-ing their behavior over time, and describing their causal relationships canbring out the diversity of knowledge, perspectives, and opinions within thegroup. In some cases, building the causal loop diagram becomes secondaryto exploring the breadth of views among team members.
So, although the “back and forth” method is time consuming and canseem messy, it is especially valuable when you don’t have full knowledge ofthe system. In the end, it may even turn out to be the most fruitful methodof all. Whichever method you use, the key is to stick with tracing a loopcompletely through before diverging onto other branches of the diagram.Otherwise, you may quickly find yourself in a mess of partially connectedlinks with no clear focus. It takes discipline to stay with closing the currentloop rather than pursuing what may look like more interesting paths thatcan come up in the diagramming process. But be patient—you can get tothe other ones after you close the current loop.
Guidelines for Building Loop Diagrams
As you try the learning activities at the end of this section, keep the fol-lowing guidelines in mind for building CLDs:
1. Remember to:
• Use links and arrows to show the direction of the variables’ cause-and-effect relationships.
• Mark the links with s’s and o’s to show the nature (same or opposite) ofthe link.
• Label the center of every loop with either an R for “reinforcing” or a Bfor “balancing.”
2. If a variable has multiple consequences, try lumping them into oneterm while finishing the rest of the loop. For example, increasing stressmay lead some people to increase how much they exercise, others toincrease their alcohol consumption, and others to stay at work longer.All three of these consequences can be grouped together as “Use of cop-ing strategies” (Figure 4.17, “Grouping Variable Names”). You can“unpack” these later when you’re ready to explore the importance ofspecific strategies.
62 SECTION 4 � Uncovering Systemic Structures
Use of CopingStrategies
Level ofStress
s
o
BCopingStrategy 1
CopingStrategy 2
CopingStrategy 3
Level ofStress
s s s
o
B
o o BB
F I G U R E 4 . 1 7
Grouping Variable Names

3. Almost every action has differing long-term and short-term conse-quences. To show increasingly longer-term consequences or side-effects,add new loops or links to your diagram. For example, in Figure 4.18,“Short Term and Long Term,” increasing stress may lead to more use ofalcohol, which, in the short run, can diminish the sense of stress. How-ever, over time, the increased use of alcohol begins to destroy health,which leads to reduced productivity and worsens stress.
4. If a link between two variables is not clear to other people and requiresa lot of explaining, try redefining the variables or inserting an interme-diate variable to clarify the connection.
For example, it may be clear to you that increasing demand for a con-sumer product could lead to reduced quality of the product. However,this simple expression of the connection may not be obvious to others.If you show that increased demand first raises production pressure, theresulting decline in quality becomes more understandable (Figure 4.19,“Inserting a Variable”).
5. Check the reasoning behind your causal loop diagram by going aroundthe loop and telling the story depicted by the links and the s’s and o’s.For example, the loop in Figure 4.20, “Telling the Story,” depicts thefollowing: “When the level of quality goes down, the gap betweendesired quality and actual quality gets larger. When that gap gets larger,actions to improve quality intensify. Eventually, after actions toimprove quality have intensified, the level of quality goes back up.”
Building a Causal Loop Diagram 63
AlcoholUseStress
s
o
B
Health
Productivity
o
o
s
R
F I G U R E 4 . 1 8
Short Term and Long Term
Demando
Quality
Demands
ProductionPressure
oQuality
F I G U R E 4 . 1 9
Inserting a Variable
Quality
B
s
s
o
Gap BetweenDesired Quality
and Actual Qualitys
Actionsto Improve
Quality
DesiredQuality
F I G U R E 4 . 2 0
Telling the Story
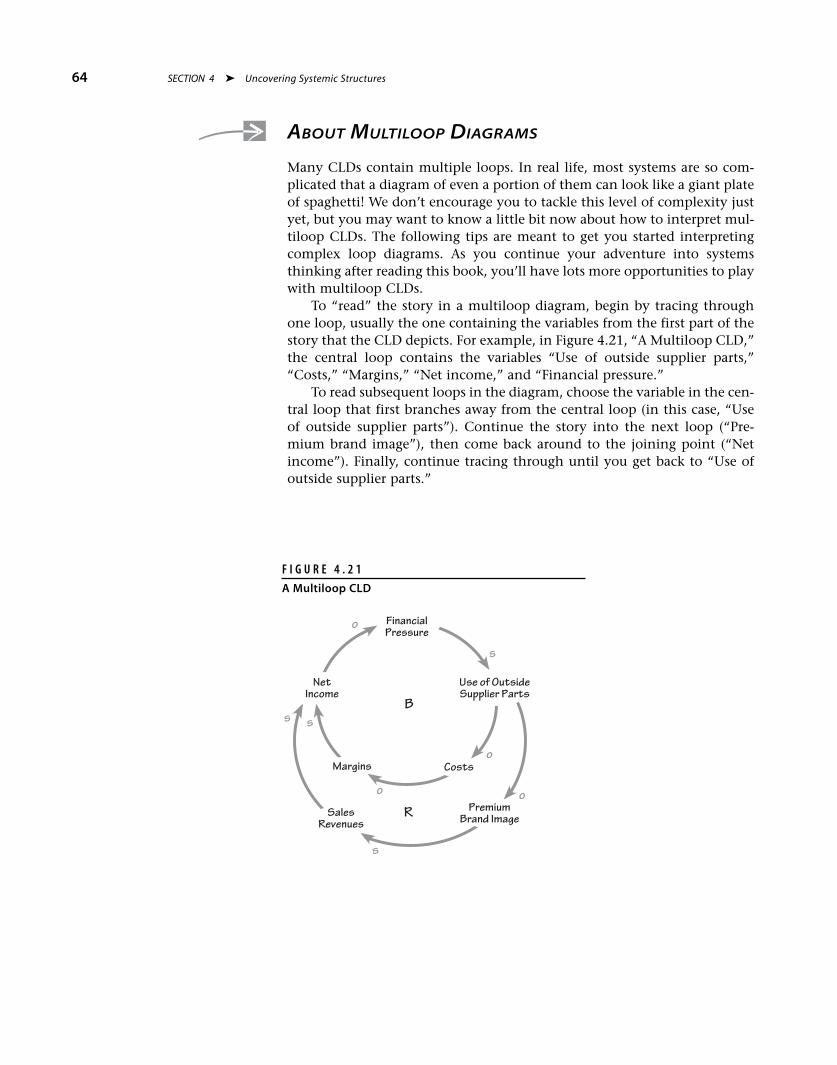
ABOUT MULTILOOP DIAGRAMS
Many CLDs contain multiple loops. In real life, most systems are so com-plicated that a diagram of even a portion of them can look like a giant plateof spaghetti! We don’t encourage you to tackle this level of complexity justyet, but you may want to know a little bit now about how to interpret mul-tiloop CLDs. The following tips are meant to get you started interpretingcomplex loop diagrams. As you continue your adventure into systemsthinking after reading this book, you’ll have lots more opportunities to playwith multiloop CLDs.
To “read” the story in a multiloop diagram, begin by tracing throughone loop, usually the one containing the variables from the first part of thestory that the CLD depicts. For example, in Figure 4.21, “A Multiloop CLD,”the central loop contains the variables “Use of outside supplier parts,”“Costs,” “Margins,” “Net income,” and “Financial pressure.”
To read subsequent loops in the diagram, choose the variable in the cen-tral loop that first branches away from the central loop (in this case, “Useof outside supplier parts”). Continue the story into the next loop (“Pre-mium brand image”), then come back around to the joining point (“Netincome”). Finally, continue tracing through until you get back to “Use ofoutside supplier parts.”
64 SECTION 4 � Uncovering Systemic Structures
FinancialPressure
B
s
s
o
Use of OutsideSupplier Parts
NetIncome
Margins Costso
o
s
s
SalesRevenues
PremiumBrand Image
oR
F I G U R E 4 . 2 1
A Multiloop CLD
After completing these learning activities, compare your responses with those in Appendix B.
ACTIVITY 1 T H E C A S E O F T H E P L A T E A U I N G P R O F I T S
Purpose: To learn to distinguish reinforcing and balancing processes
Outcome: Awareness of the distinguishing characteristics of reinforcing and balancing loops
Instructions: Read the case study below and then answer the questions that follow.
Case Study � Plateauing Profits
Medicorp, an HMO, opened its doors for business in 1985. During its firstfive years, it advertised heavily, and its customer base climbed by an impres-sive 35 percent annually. Medicorp was the first HMO in the area to offer itscustomers an unusually broad selection of physicians for the same price asother HMOs’ policies, and as word of mouth intensified, more and more cus-tomers flocked to Medicorp. At Medicorp’s five-year-anniversary mark, themanagement team celebrated in high spirits, confident that Medicorp’s spec-tacular success was bound to continue.In the early 1990s, however, a few other HMOs, attracted by Medicorp’s
success, moved into the area and began offering similarly appealing coveragepolicies. As the mid-1990s rolled by, Medicorp noticed a slowdown in therate of growth of its customer base. The 35-percent annual rise began dwin-dling to 25 percent and then 15 percent, and then it leveled off at a luke-warm—though respectable—10 percent.
QUESTIONS
1. Considering just the story, and without listing variables or drawing BOT graphs, which kind ofprocess—reinforcing or balancing—do you suspect was at play during Medicorp’s early years?Explain your answer.
2. Do you sense a shift in process during Medicorp’s history? If so, which kind of dynamic—rein-forcing or balancing—prevailed near the end of Medicorp’s story? Explain your answer.
Learning Activities 65
L E A R N I N G A C T I V I T I E S
3. Draw a simple BOT graph that shows just the pattern of the growth of Medicorp’s customer base.Based on your graph, which kind of process—reinforcing or balancing—do you think describesthe overall Medicorp story?
4. What do you think made Medicorp’s growth hit a plateau?
ACTIVITY 2 T H E C A S E O F T H E C O L L A P S I N G B A N K S
Purpose: To learn to distinguish reinforcing and balancing loops
Outcome: Awareness of the defining characteristics of reinforcing and balancing loops
STEPS
1. Look again at The Case of the Collapsing Banks on page 59. By simply reviewing the story (don’tcount the s’s and o’s in the finished CLD), what kind of dynamic—reinforcing or balancing—doyou sense at work?
2. Look again at the finished CLD for the collapsing-banks story (Figure 4.12 on page 60), andcount the o’s in the diagram.
3. What kind of loop is the collapsing-banks CLD? Explain your answer here and label Figure 4.12with the appropriate letter: R or B.
66 SECTION 4 � Uncovering Systemic Structures
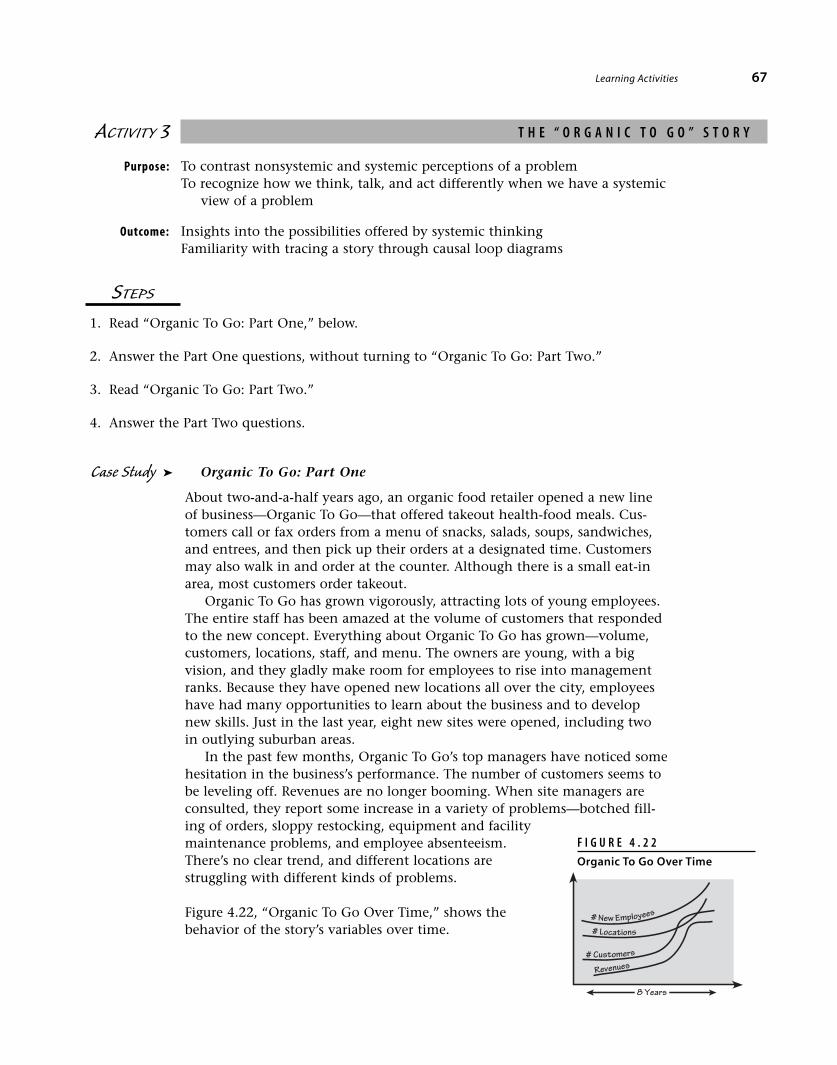
ACTIVITY 3 T H E “ O R G A N I C T O G O ” S T O R Y
Purpose: To contrast nonsystemic and systemic perceptions of a problemTo recognize how we think, talk, and act differently when we have a systemicview of a problem
Outcome: Insights into the possibilities offered by systemic thinkingFamiliarity with tracing a story through causal loop diagrams
STEPS
1. Read “Organic To Go: Part One,” below.
2. Answer the Part One questions, without turning to “Organic To Go: Part Two.”
3. Read “Organic To Go: Part Two.”
4. Answer the Part Two questions.
Case Study � Organic To Go: Part One
About two-and-a-half years ago, an organic food retailer opened a new lineof business—Organic To Go—that offered takeout health-food meals. Cus-tomers call or fax orders from a menu of snacks, salads, soups, sandwiches,and entrees, and then pick up their orders at a designated time. Customersmay also walk in and order at the counter. Although there is a small eat-inarea, most customers order takeout.Organic To Go has grown vigorously, attracting lots of young employees.
The entire staff has been amazed at the volume of customers that respondedto the new concept. Everything about Organic To Go has grown—volume,customers, locations, staff, and menu. The owners are young, with a bigvision, and they gladly make room for employees to rise into managementranks. Because they have opened new locations all over the city, employeeshave had many opportunities to learn about the business and to developnew skills. Just in the last year, eight new sites were opened, including twoin outlying suburban areas.In the past few months, Organic To Go’s top managers have noticed some
hesitation in the business’s performance. The number of customers seems tobe leveling off. Revenues are no longer booming. When site managers areconsulted, they report some increase in a variety of problems—botched fill-ing of orders, sloppy restocking, equipment and facilitymaintenance problems, and employee absenteeism.There’s no clear trend, and different locations arestruggling with different kinds of problems.
Figure 4.22, “Organic To Go Over Time,” shows thebehavior of the story’s variables over time.
Learning Activities 67
# New Employees
# Locations
# Customers
Revenues
8 Years
F I G U R E 4 . 2 2
Organic To Go Over Time
QUESTIONS
1. How would you explain the troubling trends at Organic To Go?
2. Is there anything else the managers should take into account?
3. In your opinion, what should the Organic To Go managers do?
4. What typically happens in your organization when sales volume, number of customers, or profitmargin slows down?
Note: In the story below, variables are followed by letter labels that match the variables in theaccompanying causal loop diagram (Figure 4.23, “The Organic To Go Loop”).
Case Study � Organic To Go: Part Two
Once Organic To Go was established and successful in its first location, itsmanagers allowed themselves to dream about the future. They knew theywere onto a “hot” idea. They could visualize how, as they opened new loca-tions (A), copying the successful model created in the original “motherstore” would help them increase their customer base (B). As growing salesvolume (C) brought in more revenue (D), funds would become available forinvestment (E) in more locations. Organic To Go could be another Star-bucks—bicoastal, maybe even international!If we expand the loop as shown in Figure 4.24, “The Bigger Picture,”
however, we can see how problems began to arise at Organic To Go.As the number of locations (A) increased, the number of new employees
(1) increased. Fewer of those employees (2) had previously worked in theoriginal “mother store.” That meant that an increasing number of newemployees didn’t know the policies, operating procedures, and behaviorexpectations that had made the original business such a big hit with cus-tomers. As they tried to learn on the job, the new employees put an
68 SECTION 4 � Uncovering Systemic Structures

increasing load (3) on their managers. Sometimes the newer employees gotfrustrated and upset, and came late, left early, or took a day off without noti-fying their managers (4).In addition, occasional problems with late or incomplete orders and with
messy serving and eating areas (5) turned off some customers, who eithercame less often or stopped coming in at all. Some of those customers com-plained to their friends, so Organic To Go stopped attracting as much newbusiness (B) as it had before.
QUESTIONS
1. Look again at the first Organic To Go causal loop diagram, in Figure 4.23 above. Does it representa reinforcing or a balancing process? Label the loop with an R or a B to show your decision.
2. Look at the second causal loop diagram, in Figure 4.24 above. Does the new section of the dia-gram represent a reinforcing or balancing process? Label the section with an R or a B.
3. When you look at both the original vision and the expanded depiction of the story’s actual out-come, do you see the issues at Organic To Go differently than you did at first? If so, how?
4. What suggestions would you offer the Organic To Go managers?
Learning Activities 69
FundsAvailable (E)
s
s
s
# of NewLocations (A)
Revenue(D)
SalesVolume (C)
CustomerBase (B)
s
s
Messinessand Order
Problems (5)o o
# of NewEmployees (1)
% EmployeesFamiliar with
Original Policies (2)
Load onManagement (3)
EmployeePerformance (4)
s
o
o
o
F I G U R E 4 . 2 4
The Bigger Picture
FundsAvailable (E)
s
s
s
# of NewLocations (A)
Revenue(D)
SalesVolume (C)
CustomerBase (B)
s
s
F I G U R E 4 . 2 3
The Organic To Go Loop
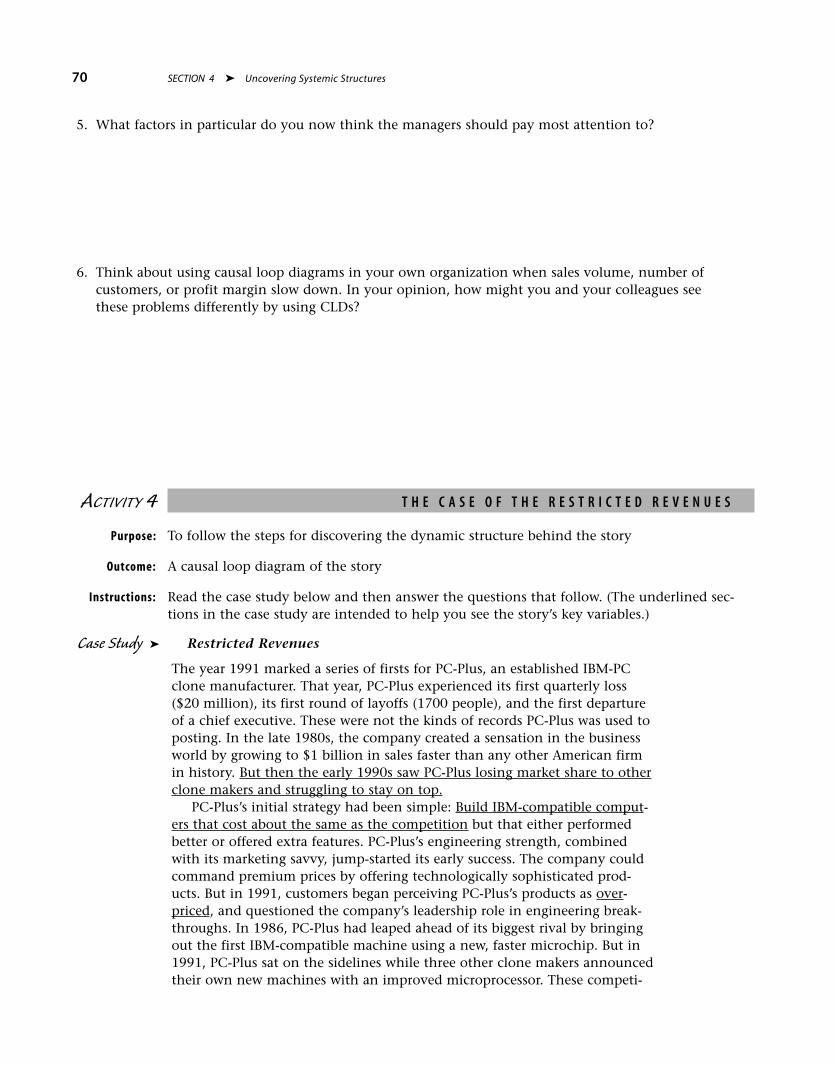
5. What factors in particular do you now think the managers should pay most attention to?
6. Think about using causal loop diagrams in your own organization when sales volume, number ofcustomers, or profit margin slow down. In your opinion, how might you and your colleagues seethese problems differently by using CLDs?
ACTIVITY 4 T H E C A S E O F T H E R E S T R I C T E D R E V E N U E S
Purpose: To follow the steps for discovering the dynamic structure behind the story
Outcome: A causal loop diagram of the story
Instructions: Read the case study below and then answer the questions that follow. (The underlined sec-tions in the case study are intended to help you see the story’s key variables.)
Case Study � Restricted Revenues
The year 1991 marked a series of firsts for PC-Plus, an established IBM-PCclone manufacturer. That year, PC-Plus experienced its first quarterly loss($20 million), its first round of layoffs (1700 people), and the first departureof a chief executive. These were not the kinds of records PC-Plus was used toposting. In the late 1980s, the company created a sensation in the businessworld by growing to $1 billion in sales faster than any other American firmin history. But then the early 1990s saw PC-Plus losing market share to otherclone makers and struggling to stay on top.PC-Plus’s initial strategy had been simple: Build IBM-compatible comput-
ers that cost about the same as the competition but that either performedbetter or offered extra features. PC-Plus’s engineering strength, combinedwith its marketing savvy, jump-started its early success. The company couldcommand premium prices by offering technologically sophisticated prod-ucts. But in 1991, customers began perceiving PC-Plus’s products as over-priced, and questioned the company’s leadership role in engineering break-throughs. In 1986, PC-Plus had leaped ahead of its biggest rival by bringingout the first IBM-compatible machine using a new, faster microchip. But in1991, PC-Plus sat on the sidelines while three other clone makers announcedtheir own new machines with an improved microprocessor. These competi-
70 SECTION 4 � Uncovering Systemic Structures
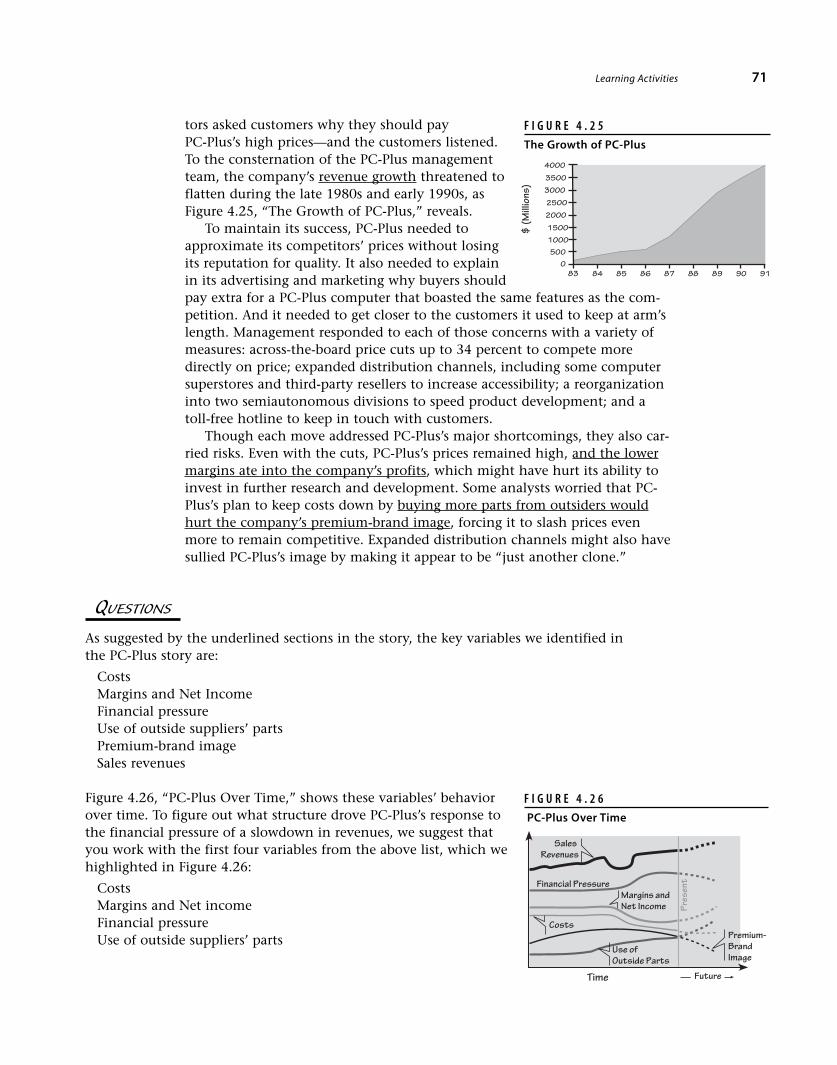
tors asked customers why they should payPC-Plus’s high prices—and the customers listened.To the consternation of the PC-Plus managementteam, the company’s revenue growth threatened toflatten during the late 1980s and early 1990s, asFigure 4.25, “The Growth of PC-Plus,” reveals.To maintain its success, PC-Plus needed to
approximate its competitors’ prices without losingits reputation for quality. It also needed to explainin its advertising and marketing why buyers shouldpay extra for a PC-Plus computer that boasted the same features as the com-petition. And it needed to get closer to the customers it used to keep at arm’slength. Management responded to each of those concerns with a variety ofmeasures: across-the-board price cuts up to 34 percent to compete moredirectly on price; expanded distribution channels, including some computersuperstores and third-party resellers to increase accessibility; a reorganizationinto two semiautonomous divisions to speed product development; and atoll-free hotline to keep in touch with customers.Though each move addressed PC-Plus’s major shortcomings, they also car-
ried risks. Even with the cuts, PC-Plus’s prices remained high, and the lowermargins ate into the company’s profits, which might have hurt its ability toinvest in further research and development. Some analysts worried that PC-Plus’s plan to keep costs down by buying more parts from outsiders wouldhurt the company’s premium-brand image, forcing it to slash prices evenmore to remain competitive. Expanded distribution channels might also havesullied PC-Plus’s image by making it appear to be “just another clone.”
QUESTIONS
As suggested by the underlined sections in the story, the key variables we identified inthe PC-Plus story are:
CostsMargins and Net IncomeFinancial pressureUse of outside suppliers’ partsPremium-brand imageSales revenues
Figure 4.26, “PC-Plus Over Time,” shows these variables’ behaviorover time. To figure out what structure drove PC-Plus’s response tothe financial pressure of a slowdown in revenues, we suggest thatyou work with the first four variables from the above list, which wehighlighted in Figure 4.26:
CostsMargins and Net incomeFinancial pressureUse of outside suppliers’ parts
Learning Activities 71
83 84 85 86 87 88 89
4000
3500
3000
2500
2000
1500
1000500
0
$(M
illio
ns)
90 91
F I G U R E 4 . 2 5
The Growth of PC-Plus
Time
Costs
Future
Pres
ent
Use ofOutside Parts
SalesRevenues
Premium-BrandImage
Margins andNet Income
Financial Pressure
F I G U R E 4 . 2 6
PC-Plus Over Time

In the space below build a causal loop diagram of the structure, using these steps as guidelines:
1. The problem seems to be PC-Plus’s increasing financial pressure (A).
What variable (B) led to the increasing financial pressure? (Draw the link, and label it with an sor an o.)
2. Which other variable (C) is associated with (B) and caused (B) to change?
3. Which variable (D) did PC-Plus decide to change in order to affect (C)? (In other words, PC-Plushoped that if they did more of (D), (C) would be reduced.)
4. To complete the loop, add a link between (A) and (D).
72 SECTION 4 � Uncovering Systemic Structures
5. What process does this loop represent—reinforcing or balancing? Label your finished loopwith an R or a B.
6. Check your loop for soundness. Be sure you drew all the links, with arrows to show the directionof movement, and that you have labeled all your links with s’s and o’s, to show how each vari-able changes in relation to the one that influences it. Go around the loop and tell the story.
ACTIVITY 5 T H E A L L - F O R - O N E C O O P E R A T I V E
Purpose: To practice the steps for discovering the structure behind a pattern of behavior
Outcome: A list of the story’s key variablesA behavior over time graph of the key variablesA causal loop diagram that depicts the case story
Instructions: Read the case study below and then answer the questions that follow.
Case Study � The All-for-One Cooperative
The All-for-One Cooperative is a stunning example of a community that hasembraced and mastered business collaboration. The cooperative was foundedseveral decades ago with funds raised from local townspeople to open asmall factory that employed only 25 people. Today, All-for-One has morethan 160 cooperative enterprises, employing more than 23,000 members.The member enterprises’ actions are based on a single guiding principle:“How can we do this in a way that serves equally both those in the enter-prise and those in the community, rather than serving one at the expense ofthe other?”Interviews with members of the cooperative revealed the centrality of this
shared vision between the business and the community. Trusting in theirshared beliefs and values had encouraged the founders to collaborate closelyto design the original cooperative. Reinforcement of their common beliefshad allowed newer, younger members to propose the changes required forAll-for-One to adapt as it grew.The experience of collaborative design supported various joint experi-
ments in profit sharing, diversification of members’ benefits, apprentice-ships, and exploration of new markets. Although some of the experimentsfailed, the losses were spread across the entire association. As a result, theexperimenters were encouraged to discuss their ventures at cooperative gov-ernance meetings and to publicize the causes of both success and failure toall cooperative members. Old timers and newcomers believe that this sharingof business knowledge has consistently reinforced the sense of shared visionand beliefs.
Learning Activities 73

QUESTIONS
1. Briefly sum up the All-for-One story.
2. Identify four or five key variables from the story.
3. Graph the variables’ behavior over time.
4. Decide how the variables interrelate, and draw a causal loop diagram to show the connections.Work in pencil, and don’t be afraid to use that eraser! Label your loop diagram R or B.
5. Walk through the causal loop diagram, telling the story it depicts and checking it against theoriginal story.
74 SECTION 4 � Uncovering Systemic Structures
ACTIVITY 6 T H E P R O B L E M W I T H U S E D C D S
Purpose: To practice all the steps of discovering the structure underlying a pattern of behavior
Outcome: A list of the story’s key variablesA graph of the variables’ behavior over timeA causal loop diagram of the story
Instructions: Read the case study below and then answer the questions that follow.
Case Study � Used CDs: What Now?
The compact disc, although quite expensive, has a huge advantage over theold LP: It lasts almost forever. This feature is highly attractive to consumers,but poses a concern for record companies because of the growth of the used-CD business. Indeed, the popularity of CDs has triggered an inevitable con-frontation over the selling of used discs—a clash that pits the giant recordcompanies against retail outlets. LP retailers complain that much of theirused-CD inventory comes from record clubs or from free promotions.Although not illegal, this practice, the retailers argue, cuts into the sales ofnew CDs, diminishes their value, and deprives recording artists of royalties.At the heart of the controversy over the sale of used CDs is the decision
by a large record chain, SoundAlive, to carry half-priced used CDs alongsidenew ones. The issue is further complicated by the fact that SoundAlive hasalways been viewed as an industry innovator, opening the possibility thatother large chains may start to carry used CDs to remain competitive.Ironically, the actions of some record companies have actually con-
tributed to the rise in used-CD sales. For example, when SoundAlive offeredits customers a no-hassle return policy on CDs, some suppliers stoppedaccepting returns of opened CDs from retailers. Instead, they offered a1-percent credit. With many returned CDs on their hands, SoundAlivefound it more profitable to resell the discs at a discounted price than toreturn them to the record company.
QUESTIONS
1. What was the original problem that CDs posed for record companies?
2. What did the record companies do to overcome this problem?
Learning Activities 75
3. What was the next problem or issue facing the record companies?
4. Identify a total of four key variables reflecting the original problem and the later problem.
5. Create a graph of the variables’ behavior over time.
6. Draw a simple two-loop diagram that shows the original problem and the later problem, includ-ing how the later problem is linked to the original problem. (See “The Case of the Restricted Rev-enues,” page 70, if you need help getting started.) Label your loops R or B.HINT: Draw the loop that shows the original problem first. Then add the loop that shows the sub-sequent problem.
76 SECTION 4 � Uncovering Systemic Structures

In the earlier sections of this book, you focused on simple causal loopdiagrams, with one or two loops. These are fine for depicting relativelybasic systems and even for capturing the most fundamental dynamics
of a more complicated system. However, most systems we encounter atwork, in our communities, or in news of current events are large, complex,and extremely difficult to diagram. For example, imagine trying to createa causal loop diagram of an entire corporation, a city, a national economy,or an ecosystem such as a forest. All of these are complex systems, andtheir diagrams would contain vast numbers of reinforcing and balancingloops and complicated interconnections among the loops.
This section outlines some of the inherent characteristics of complexsystems1 and then presents the story of ComputeFast—a company whosetrials and challenges vividly demonstrate complex system behavior.
77
S E C T I O N 5
Complex Systems
1. Adapted from Draper Kauffman, Jr.’s, Systems 1: An Introduction to Systems Thinking (FutureSystems, Inc.), 1980.
CHARACTERISTICS OF COMPLEX SYSTEMS
Complex systems behave differently from simple systems and pose specialchallenges for systems thinkers. In action, a complex system appears to havemany variables, many factors at play, and many semi-independent butinterlocking components. In a diagram of a complex system, the domi-nance of the different feedback loops shifts, and the timing and length ofdelays vary. The diagram may also depict a number of structures that evenseem to be in conflict with one another.
Here are some further defining characteristics of complex systems:
1. Complex systems tend to be self-stabilizing.
A causal loop diagram of a complex system is likely to contain a great manybalancing loops, each of which acts to keep some smaller component of thesystem in balance, or functioning close to some desired level. Picture all thelegs of a centipede moving the insect toward its goal. Even if a few of thelegs are broken or wobbly, the sheer number of them allows the creature tokeep crawling forward quite smoothly.
This characteristic suggests why so many complex organizations resistchange or improvement campaigns, and eventually return to status quo: Allthe balancing loops are designed to keep things the way the system origi-nally intended them.
2. Complex systems are or appear to be purposeful.
Complex systems contain numerous balancing loops, each of whichattempts to maintain a desired level of performance or a goal. A complexsystem may contain a number of reinforcing loops, too, each of whichserves to augment or diminish some kind of phenomenon within the sys-tem. In a complex system such as an organization, sometimes the goals ofboth the growth and the balancing processes are explicit and known to thepeople who make up the organization. But very often, they are contradic-tory, ambiguous, or implicit, and the system appears to function with amind of its own.
3. Complex systems, like simpler systems, are capableof using feedback to modify their behavior.
All systems use feedback to modify their behavior. This ability provides akey opportunity for change and growth within the system—especially if thefeedback is explicit and accessible. For example, an organization has a bet-ter chance of improving its performance if it seeks to gather informationabout problems such as shipping delays or procedural complexities. For any-one studying systems, a good understanding of the structure and workingsof a system makes it easier to take advantage of this important capability soas to catalyze change within the system.
78 SECTION 5 � Complex Systems
4. Complex systems can modify their environments.
Because systems seek to fulfill a purpose and can modify their own behav-ior, it’s not surprising that they can also modify their environments, thebetter to achieve their goals. These modifications may be subtle, such aspedestrians’ wearing a diagonal path across a square of lawn, or quite bold,such as a development company’s decision to build a suspension bridge ordemolish a mountainside.
For anyone wishing to change their surrounding environment, a vitalstep is to identify the links between the system in question and its envi-ronment. With this awareness of how each system is part of a larger system,we can anticipate how changes we might make in one system will lead tochanges in the system’s environment.
5. Complex systems are capable of replicating, maintaining,repairing, and reorganizing themselves.
Franchises and branch offices are examples of how an organizational systemreplicates itself. However, because systems also change in response to theirenvironment, even apparent clone organizations are likely to containunique quirks or mutations.
In addition, organizations that are abruptly altered, let’s say through atake-over or layoffs, often find ways to carry on their essential functions orreorganize themselves to continue pursuing their essential goals. All naturalsystems have this power to invent, reframe, learn, and adjust to their envi-ronments.
THE STRENGTHS AND WEAKNESSES OF COMPLEX SYSTEMS
The more complex a system is, the greater its potential to process largequantities of information, learn quickly, and act flexibly. However, complexsystems also have many subsystems to coordinate, and therefore morepotential for things to go wrong. Complex systems often meet with fourkinds of problems:
• Conflicting goals
• The centralization vs. decentralization dilemma
• Distorted feedback
• Loss of predictability
In a complex system, it is not uncommon for subsystems to have goalsthat compete directly with or diverge from the goals of the overall system.For example, an organization may advocate local decision-making, only todiscover that some local decisions conflict with the goals of the overallorganization. The organization may react by swinging toward centralizeddecision-making. Feedback gathered from small, local subsystems for useby larger subsystems may be either inaccurately conveyed or inaccurately
The Strengths and Weaknesses of Complex Systems 79

interpreted. Yet it is this very flexibility and looseness that allow large,complex systems to endure, although it can be hard to predict what theseorganizations are likely to do next. Compare the endurance and vitality ofa market economy, for instance, to a controlled economy.
COMPUTEFAST: THE STORY OF A COMPLEX SYSTEM
The story below—about a company that’s thinking of expanding—high-lights some typical behavior patterns of complex systems. We’ve also illus-trated the ComputeFast case with several examples of the graphs and causalloop diagrams discussed in this book, to give you a sense of what more com-plicated CLDs look like. Perhaps most important, the story and diagramsshow you how an actual organization—a complex system—might use sys-tems thinking tools to begin to gain insights into its business issues andexplore the many ramifications of its decisions.
Can ComputeFast Service Its Success?
In the world of mail-order computers, maintaining a balance betweenimproving technology and developing new markets has always been a chal-lenge. ComputeFast is facing this issue, experiencing increased competitionat home while preparing to expand into new overseas and domestic mar-kets. The company must find a strategy that encompasses this expansion—while still keeping its service quality high and its initial customer basehappy.
ComputeFast took the lead in the U.S. mail-order PC computer businessby combining low production costs with a customer base of small busi-nesses and technically knowledgeable users. A “no-frills” corporate stylealso allowed the company to undercut competitors on price. These benefitshave enabled ComputeFast to offer its customers an affordable, high-qual-ity product along with good customer service.
Yet the company has to keep growing its revenues while maintainingquality and service—and not losing control of costs. For the first time sinceit opened its doors for business, ComputeFast suffered a drop in sales overthe past year. The company’s CEO attributes the decline to a backlog oforders from last December that inflated first-quarter results. Future drops insales, however, may hint at a larger problem: declining customer servicequality.
Finding and training local technical and assembly-line workers quicklyenough to keep up with customer demand has been difficult. This staffshortage has worsened customer complaints of delayed deliveries and longwaits on customer service phone lines. By adding 70 new phone lines andexpanding its cadre of 180 technical support personnel, ComputeFast hasmanaged to halve the time that customers must wait to speak to a techni-cian. Still, some customers may spend up to six minutes on hold.
80 SECTION 5 � Complex Systems
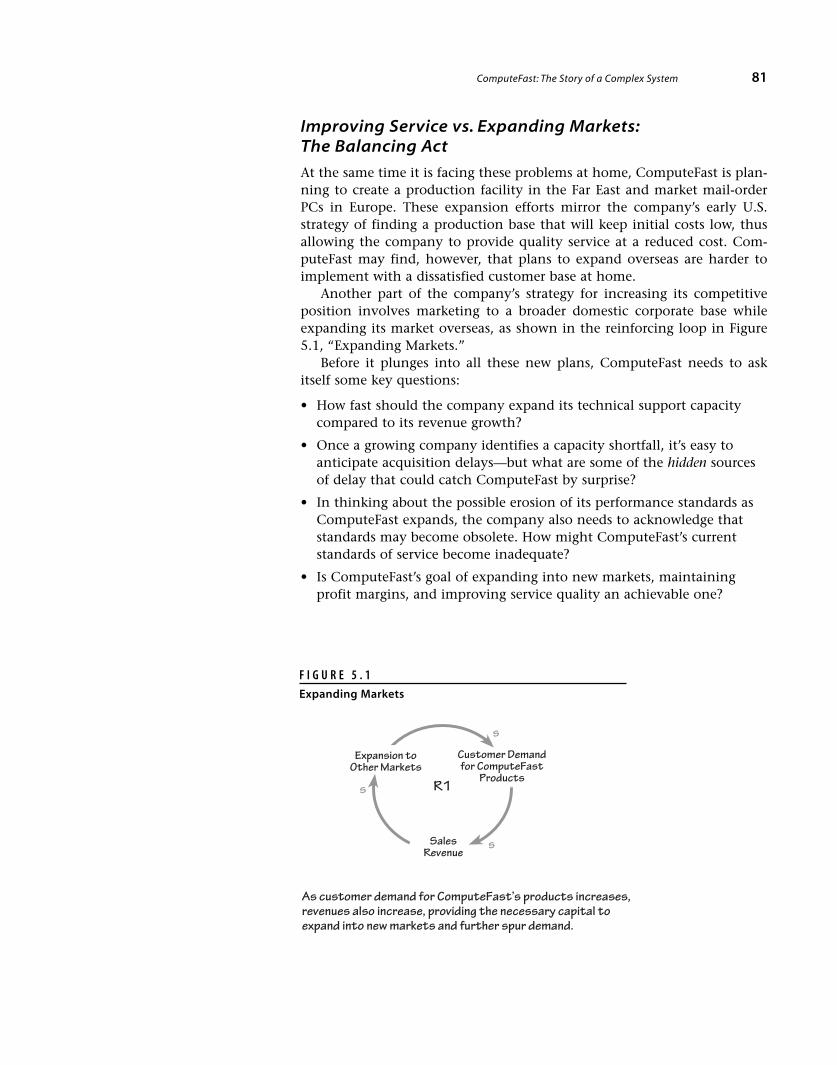
Improving Service vs. Expanding Markets:The Balancing Act
At the same time it is facing these problems at home, ComputeFast is plan-ning to create a production facility in the Far East and market mail-orderPCs in Europe. These expansion efforts mirror the company’s early U.S.strategy of finding a production base that will keep initial costs low, thusallowing the company to provide quality service at a reduced cost. Com-puteFast may find, however, that plans to expand overseas are harder toimplement with a dissatisfied customer base at home.
Another part of the company’s strategy for increasing its competitiveposition involves marketing to a broader domestic corporate base whileexpanding its market overseas, as shown in the reinforcing loop in Figure5.1, “Expanding Markets.”
Before it plunges into all these new plans, ComputeFast needs to askitself some key questions:
• How fast should the company expand its technical support capacitycompared to its revenue growth?
• Once a growing company identifies a capacity shortfall, it’s easy toanticipate acquisition delays—but what are some of the hidden sourcesof delay that could catch ComputeFast by surprise?
• In thinking about the possible erosion of its performance standards asComputeFast expands, the company also needs to acknowledge thatstandards may become obsolete. How might ComputeFast’s currentstandards of service become inadequate?
• Is ComputeFast’s goal of expanding into new markets, maintainingprofit margins, and improving service quality an achievable one?
ComputeFast: The Story of a Complex System 81
F I G U R E 5 . 1
Expanding Markets
Expansion toOther Markets
SalesRevenue
R1
s
As customer demand for ComputeFast’s products increases,revenues also increase, providing the necessary capital toexpand into new markets and further spur demand.
s
Customer Demandfor ComputeFast
Products
s

The Problem of Success
In ComputeFast’s situation, the current technical-support service problemsstem directly from the company’s sales success. Revenues skyrocketed froma mere $100,000 in 1990 (its first year) to $70 million in 1994, and topped$1.11 billion in 1996. Estimated revenues for 1998 are around $1.7 billion.As the number of units sold continues to climb, the number of customersrequiring service also increases. This trend suggests that the companyshould expand its service capacity at least as rapidly as the growth in ship-ments. In terms of total number of employees, ComputeFast appears tohave kept pace with revenue growth. From 1994 to 1996, the employeeranks grew almost fivefold, from 400 to almost 1,860.
But, as ComputeFast has learned, simply adding workers is one thing;finding people with the appropriate skills and experience is altogether dif-ferent. In particular, acquiring and training service technicians has provedmore challenging than the company may have first realized. Consequently,ComputeFast customers have been experiencing delivery delays and busycustomer service phone lines. Over time, these annoyances will dampendemand, according to the balancing loop B2 in Figure 5.2, “BalancingDemand.”
When a company experiences eroding service quality, halting the sliderequires beefing up capacity as quickly as possible. Yet in making the deci-sion to invest in capacity, the company must immediately recognize whenperformance actually falls off and when the needed capacity should beadded. In many cases, the delay between recognizing declining levels of ser-vice and adding needed capacity widens because the company is unable orunwilling to face up to the inadequacy of its current efforts to halt the qual-ity decline.
In addition, the challenge of keeping after-sales support on track is com-plicated by two unavoidable facts: When sales are growing linearly, theinstalled base is growing exponentially; and when sales are growing expo-nentially, the installed base is growing super-exponentially, as suggested in
82 SECTION 5 � Complex Systems
F I G U R E 5 . 2
Balancing Demand
Expansion toOther Markets
SalesRevenue
R1
s
As customer demand increases, the quality of ComputeFast’stechnical support decreases, which reduces demand (B2). If thelow demand persists, the customer base will be easier to service,and technical support quality will then increase.
s
Customer Demandfor ComputeFast
Products
s s
B2
TechnicalSupportQuality
o
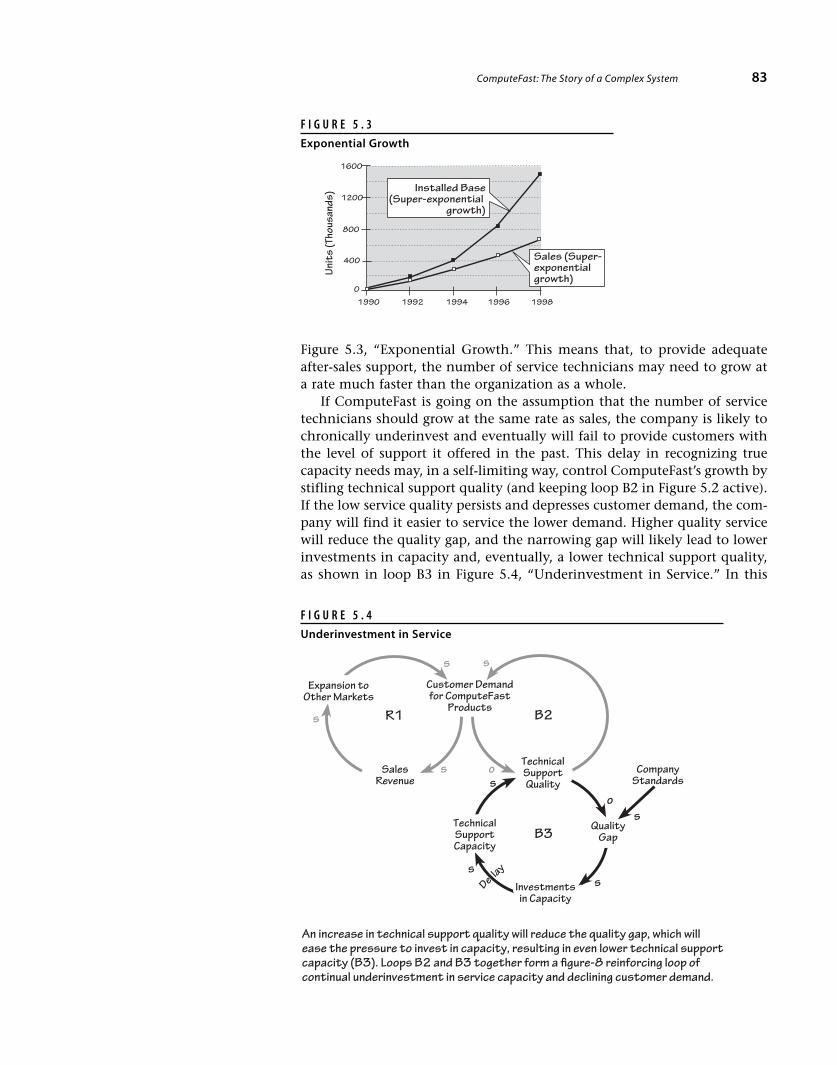
Figure 5.3, “Exponential Growth.” This means that, to provide adequateafter-sales support, the number of service technicians may need to grow ata rate much faster than the organization as a whole.
If ComputeFast is going on the assumption that the number of servicetechnicians should grow at the same rate as sales, the company is likely tochronically underinvest and eventually will fail to provide customers withthe level of support it offered in the past. This delay in recognizing truecapacity needs may, in a self-limiting way, control ComputeFast’s growth bystifling technical support quality (and keeping loop B2 in Figure 5.2 active).If the low service quality persists and depresses customer demand, the com-pany will find it easier to service the lower demand. Higher quality servicewill reduce the quality gap, and the narrowing gap will likely lead to lowerinvestments in capacity and, eventually, a lower technical support quality,as shown in loop B3 in Figure 5.4, “Underinvestment in Service.” In this
ComputeFast: The Story of a Complex System 83
F I G U R E 5 . 3
Exponential Growth
1990 1992 1994 1996 1998
1600
1200
800
400
0
Unit
s(T
hous
ands
) Installed Base(Super-exponential
growth)
Sales (Super-exponentialgrowth)
F I G U R E 5 . 4
Underinvestment in Service
Investmentsin Capacity
s
B3TechnicalSupportCapacity
o
Expansion toOther Markets
SalesRevenue
R1
s
An increase in technical support quality will reduce the quality gap, which willease the pressure to invest in capacity, resulting in even lower technical supportcapacity (B3). Loops B2 and B3 together form a figure-8 reinforcing loop ofcontinual underinvestment in service capacity and declining customer demand.
s
Customer Demandfor ComputeFast
Products
s s
B2
TechnicalSupportQuality
o
s
QualityGap
s
CompanyStandards
s
De lay
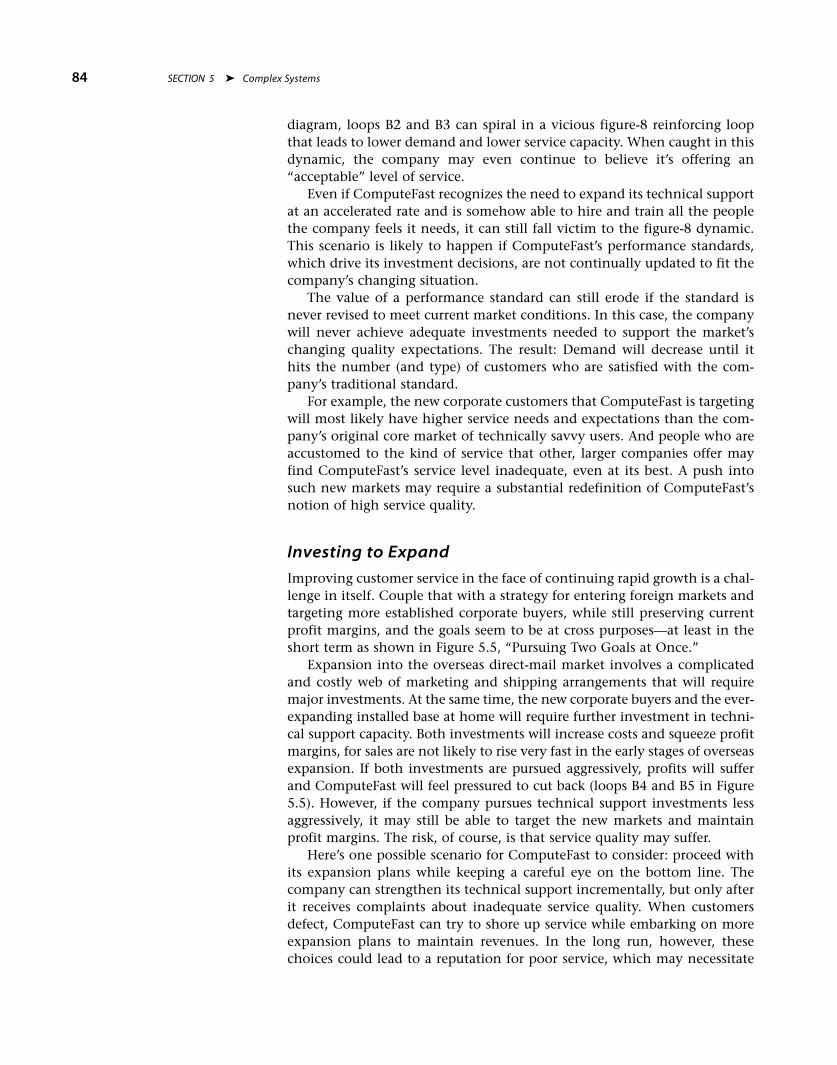
diagram, loops B2 and B3 can spiral in a vicious figure-8 reinforcing loopthat leads to lower demand and lower service capacity. When caught in thisdynamic, the company may even continue to believe it’s offering an“acceptable” level of service.
Even if ComputeFast recognizes the need to expand its technical supportat an accelerated rate and is somehow able to hire and train all the peoplethe company feels it needs, it can still fall victim to the figure-8 dynamic.This scenario is likely to happen if ComputeFast’s performance standards,which drive its investment decisions, are not continually updated to fit thecompany’s changing situation.
The value of a performance standard can still erode if the standard isnever revised to meet current market conditions. In this case, the companywill never achieve adequate investments needed to support the market’schanging quality expectations. The result: Demand will decrease until ithits the number (and type) of customers who are satisfied with the com-pany’s traditional standard.
For example, the new corporate customers that ComputeFast is targetingwill most likely have higher service needs and expectations than the com-pany’s original core market of technically savvy users. And people who areaccustomed to the kind of service that other, larger companies offer mayfind ComputeFast’s service level inadequate, even at its best. A push intosuch new markets may require a substantial redefinition of ComputeFast’snotion of high service quality.
Investing to Expand
Improving customer service in the face of continuing rapid growth is a chal-lenge in itself. Couple that with a strategy for entering foreign markets andtargeting more established corporate buyers, while still preserving currentprofit margins, and the goals seem to be at cross purposes—at least in theshort term as shown in Figure 5.5, “Pursuing Two Goals at Once.”
Expansion into the overseas direct-mail market involves a complicatedand costly web of marketing and shipping arrangements that will requiremajor investments. At the same time, the new corporate buyers and the ever-expanding installed base at home will require further investment in techni-cal support capacity. Both investments will increase costs and squeeze profitmargins, for sales are not likely to rise very fast in the early stages of overseasexpansion. If both investments are pursued aggressively, profits will sufferand ComputeFast will feel pressured to cut back (loops B4 and B5 in Figure5.5). However, if the company pursues technical support investments lessaggressively, it may still be able to target the new markets and maintainprofit margins. The risk, of course, is that service quality may suffer.
Here’s one possible scenario for ComputeFast to consider: proceed withits expansion plans while keeping a careful eye on the bottom line. Thecompany can strengthen its technical support incrementally, but only afterit receives complaints about inadequate service quality. When customersdefect, ComputeFast can try to shore up service while embarking on moreexpansion plans to maintain revenues. In the long run, however, thesechoices could lead to a reputation for poor service, which may necessitate
84 SECTION 5 � Complex Systems

additional price cuts to regain customers. Price cuts, in turn, would squeezemargins and create pressure to improve them, perhaps by cutting back onservice investments.
Here’s an alternative, possibly better scenario: ComputeFast might com-mit to the necessary investments in tech support and overseas expansionplans, but expect lower profit margins in the short term. By relaxing theprofit margin goal in the short term, the company may be better able to sus-tain healthy profit margins in the long run, once it has built the necessaryinfrastructure to support its new markets.
ComputeFast as a Complex System
The ComputeFast story displays several characteristics of a complex system:
• At the company’s highest levels, there’s an ever-present risk of conflictbetween the goals of expanding markets and the need to maintain ade-quate service quality.
• To compound this conflict, there’s the persistent possibility that feed-back about current service-quality levels will be distorted, delayed, ormisinterpreted. On the other hand, the company has the power tomodify its behavior if it chooses to gather and track as much feedbackas possible about service quality.
ComputeFast: The Story of a Complex System 85
F I G U R E 5 . 5
Pursuing Two Goals at Once
Investmentsin Capacity
s
B3TechnicalSupportCapacity
o
Expansion toOther Markets
SalesRevenue
R1
s
If investments in technical support capacity and overseas market expansion are pursuedsimultaneously, ComputeFast’s profit margins will be squeezed (B4 and B5). Two possiblealternatives are to pursue one goal at the expense of the other, or to accept lower profitmargins in the short term as the company builds the necessary infrastructure to supportboth markets.
s
Customer Demandfor ComputeFast
Products
s s
B2
TechnicalSupportQuality
o
s
QualityGap
sDe lay
CompanyStandards
sB4
B5Costs
s
s
s
ProfitMargin
s
o
s

• Service quality at ComputeFast has a tendency to drift back to its previ-ous norms—a sign of one or more balancing processes at work.
• ComputeFast has the potential to replicate itself elsewhere in its envi-ronment, as well as modify its environment, if it succeeds in its expan-sion goals.
Understanding the special nuances of a complex system like Compute-Fast and being able to diagram the system is not a “quick fix.” However, ifyou were a manager at ComputeFast, you and your colleagues could usecausal loop diagrams, like those shown in the story, to better see thedynamics of the company and design and test potential strategies. An evenmore effective exercise would be to use computer modeling to simulate andtest the various scenarios—this kind of software lets you explore the impactof decisions much faster and more accurately than you can on paper. Youwould then have a better chance of anticipating the consequences of yourchoices and preparing yourself for the inevitable delays and side-effects ofyour policies.
86 SECTION 5 � Complex Systems

Now that you have some familiarity with interpreting and creatingcausal loop diagrams, and with complex systems and the idea of sys-tems thinking overall, what next? Systems thinking tools are useful
only if you can actually practice and apply them. Many people have com-pared the process of learning to think systemically to that of learning anew language—and no one expects to master Japanese by reading a singleworkbook! As with any new language, fluency in systems thinking requireslots of study and practice.Don’t get discouraged yet, however: There are many ways of applying
systems thinking tools immediately—both individually and in your orga-nization. In this final section, we offer an array of practical tips—from alist of “do’s” and “don’ts” for systems thinking on the job, to ideas formaking systems thinking an individual, life-long practice.
87
S E C T I O N 6
From Loops to Leverage:Applying and Practicing Systems Thinking

THE DO’S AND DON’TS OF SYSTEMS THINKINGON THE JOB1
Besides using BOT graphs and CLDs to generate insights into problems, howelse can you begin using systems thinking on the job, especially if you wantto introduce it to others? Your best bet is to approach this endeavor in thespirit of “learning to walk before you run.” Here are some suggestions:
General Guidelines
DON’T use systems thinking to further your own agenda.Systems thinking is most effective when it’s used to look at a problem in anew way, not to advocate a predetermined solution. Strong advocacy willcreate resistance—both to your ideas, and to systems thinking itself. Presentsystems thinking in the spirit of inquiry, not inquisition.
DO use systems thinking to sift out major issues and factors.Systems thinking can help you break through the clutter of everyday eventsto recognize general patterns of behavior and the structures that are pro-ducing them. It also helps in separating solutions from underlying prob-lems. Too often we identify problems in terms of their solution; for exam-ple, “The problem is that we have too many _______ (fill in the blank:people, initiatives, steps in our process),” or “The problem is that we havetoo little _______ (resources, information, budget).”
DON’T use systems thinking to blame individuals.Chronic unresolved problems are more often the result of systemic break-downs than individual mistakes. Solutions to these problems lie at the sys-temic, not the individual, level.
DO use systems thinking to promote inquiry andchallenge preconceived ideas.Here are some clues that nonsystemic thinking is going on: phrases such as“We need to have immediate results,” “We just have to do more of what wedid last time,” or “It’s just a matter of trying harder.”
Getting Started
DON’T attempt to solve a problem immediately.Don’t expect persistent and complex systemic problems to be represented,much less understood, overnight. The time and concentration requiredshould be proportional to the difficulty and scope of the issues involved. Yourgoal should be to achieve a fuller and wider understanding of the problem.
88 SECTION 6 � From Loops to Leverage
1. This section was written by Michael Goodman and originally published in The SystemsThinkerTM Newsletter, Volume 3, No. 6. Michael Goodman is a principal of Innovation Asso-ciates, an Arthur D. Little Company, and heads IA’s Systems Thinking Group.

DO start with smaller-scale problems.Don’t attempt to diagram the whole system—otherwise you’ll quicklybecome overwhelmed. Instead, try to focus on a problem issue and draw theminimum variables and loops you’ll need to capture the problem.
DON’T work with systems thinking techniques under pressure, or in frontof a group that is unprepared for or intolerant of the learning process.If your audience is not familiar with the concepts and methods of systemsthinking, they might not understand that the process reveals mental mod-els, can be controversial, and is highly iterative in nature. It is far more ben-eficial to have the group engage in their own loop building after appropri-ate instruction and foundation have been given.
DO develop your diagrams gradually and informally,in order to build confidence in using systems thinking.Look at newspaper articles and try to draw a few loops that capture thedynamics of a problem being described.
DON’T worry about drawing loops right away.One of the strongest benefits of the systems thinking perspective is that itcan help you learn to ask the right questions. This is an important first steptoward understanding a problem.
Drawing Causal Loop Diagrams
DO start with the process of defining variables,and encourage airing of assumptions.This approach leads to a better shared understanding of a problem. Dia-gramming is a very effective tool for promoting group inquiry into a prob-lem or issue.
DO start with a central loop or process,then add loops to “fill in” detail.For example, the central loop may show how the system is supposed towork, and the additional loops can explore what is pushing it out of whack.
DON’T get bogged down in details.Start simply, at a high level of generalization, but with enough detail to sumup the observed behavior. For example, if you’re exploring the causes ofmissed delivery dates in a factory, lump together the types of products thatare experiencing similar delays.
DO begin by looking for generic structures that might clarify the problem.Generic structures such as archetypes provide a focal point or a storyline tobegin the process of understanding a problem.
DO work with one or more partners.Multiple viewpoints add richness and detail to the understanding of aproblem.
Do’s and Don’ts of Systems Thinking on the Job 89

DO check with others to see if they can addsome insight or improve upon your diagram.Especially consult people in other functional areas who might have adifferent perspective on the problem. For example, with a manufactur-ing delay problem, you might check with finance to see whether thereare any dynamics in the finance arena that are affecting the manufac-turing delays (capital investments and purchases, etc.). The same can bedone for marketing, sales, and so forth.
DO work iteratively.There’s no “final” or “correct” causal loop diagram. Looping is a learningprocess that should continue to evolve with new data and perspectives.
DON’T present “final” loop diagrams as finished products.Instead, present a diagram as a tentative and evolving picture of how youare seeing things. To gain buy-in and maximize learning, make sure youraudience participates in the modeling process.
DO learn from history.When possible, check data to see if your diagram correctly describes pastbehavior.
Designing Interventions
DO get all stakeholders involved in the process.This will help ensure that all viewpoints have been considered, and willincrease the chance that the stakeholders will accept the intervention.
DON’T go for vague, general, or open-ended solutions.For example, instead of proposing a solution such as “Improve communi-cations,” rephrase your thought as “Reduce the information delay betweensales and manufacturing by creating a new information system.”
DO make an intervention specific, measurable,and verifiable.For example, “Cut the information delay between sales and manufacturingdown to 24 hours.”
DO look for potential unintended side effects of an intervention.Remember the general principle: “Today’s problems often come from yes-terday’s solutions.” Any solution is bound to have trade-offs, so use systemsthinking to explore the implications of any proposed solution before tryingto implement it.
DON’T be surprised if some situations defy solution,especially if they are chronic problems.Rushing to action can thwart learning and ultimately undermine efforts toidentify higher leverage interventions. Resist the tendency to “solve” theissue, and focus on gaining a deeper understanding of the structures pro-ducing the problem. Be wary of a symptomatic fix disguised as a long-term,high-leverage intervention.
90 SECTION 6 � From Loops to Leverage
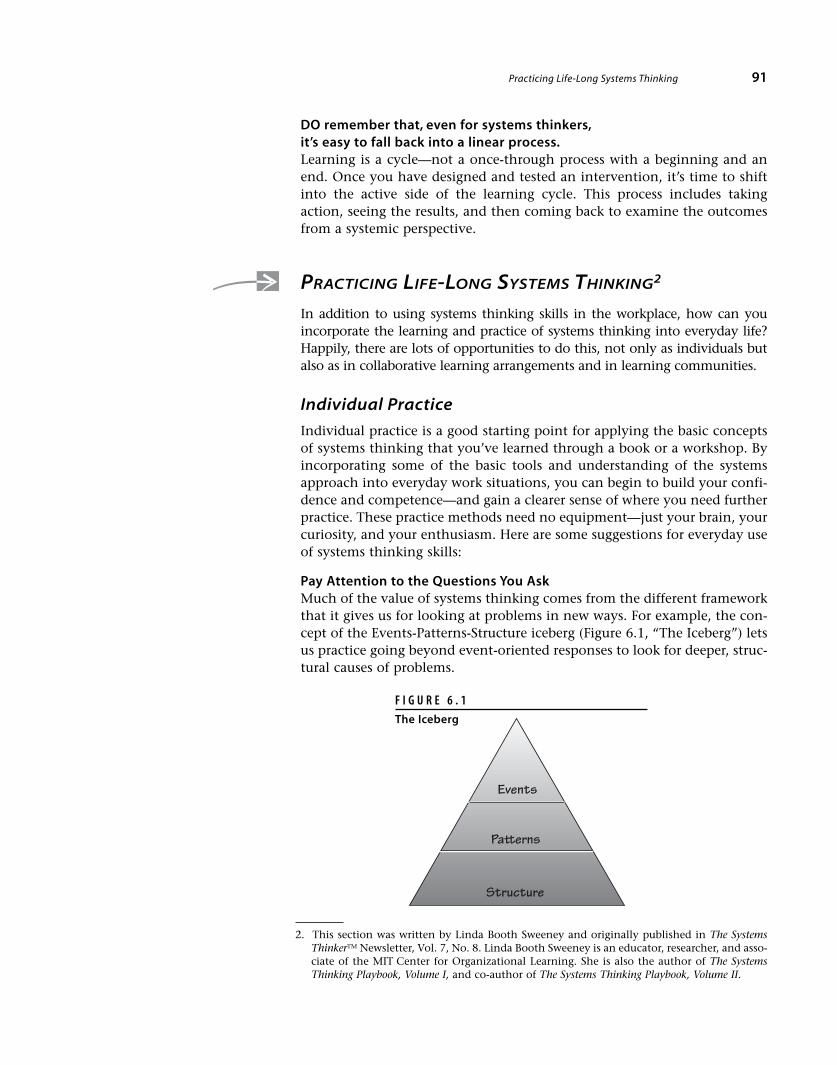
DO remember that, even for systems thinkers,it’s easy to fall back into a linear process.Learning is a cycle—not a once-through process with a beginning and anend. Once you have designed and tested an intervention, it’s time to shiftinto the active side of the learning cycle. This process includes takingaction, seeing the results, and then coming back to examine the outcomesfrom a systemic perspective.
PRACTICING LIFE-LONG SYSTEMS THINKING2
In addition to using systems thinking skills in the workplace, how can youincorporate the learning and practice of systems thinking into everyday life?Happily, there are lots of opportunities to do this, not only as individuals butalso as in collaborative learning arrangements and in learning communities.
Individual Practice
Individual practice is a good starting point for applying the basic conceptsof systems thinking that you’ve learned through a book or a workshop. Byincorporating some of the basic tools and understanding of the systemsapproach into everyday work situations, you can begin to build your confi-dence and competence—and gain a clearer sense of where you need furtherpractice. These practice methods need no equipment—just your brain, yourcuriosity, and your enthusiasm. Here are some suggestions for everyday useof systems thinking skills:
Pay Attention to the Questions You AskMuch of the value of systems thinking comes from the different frameworkthat it gives us for looking at problems in new ways. For example, the con-cept of the Events-Patterns-Structure iceberg (Figure 6.1, “The Iceberg”) letsus practice going beyond event-oriented responses to look for deeper, struc-tural causes of problems.
Practicing Life-Long Systems Thinking 91
Events
Pa�erns
Structure
2. This section was written by Linda Booth Sweeney and originally published in The SystemsThinkerTM Newsletter, Vol. 7, No. 8. Linda Booth Sweeney is an educator, researcher, and asso-ciate of the MIT Center for Organizational Learning. She is also the author of The SystemsThinking Playbook, Volume I, and co-author of The Systems Thinking Playbook, Volume II.
F I G U R E 6 . 1
The Iceberg
To practice moving from events to structure, start by simply payingattention to the questions you ask. Practice asking questions that get atdeeper meanings, that inquire into others’ viewpoints, or that elicit addi-tional information. Examples include:
• Questions that look for patterns(“Has this same problem occurred in the past?”);
• Genuinely curious questions that enable new information to be shared(“What makes you say that?”);
• Questions that push for a deeper understanding of the problem(“What structures might be causing this behavior?”);
• Questions that probe for time delays(“What effect will project delays have on our resources?”);
• Questions that look for hidden loops(“What might be causing this feeling that we are ‘spinning ourwheels?’”); and
• Questions that look for unintended consequences(“What would happen if we got what we wanted?”).
When probing for potential unintended consequences, the challenge isto ask the question without causing people to feel threatened or havingyourself labeled as the “naysayer.” One organization came up with a cleverway to combat the negative labeling of those who raised concerns: The CEOand his senior team established a “qualming” period during each teammeeting. During this time, team members were encouraged and expected toraise their concerns about the topic at hand. By setting aside a designatedtime for this activity, they turned the practice of looking for unintentendedconsequences into a positive and creative part of the group’s process.
Sense and Notice the Systems Around YouThe great poet and philosopher Rumi once wrote: “New organs of percep-tion come into being as a result of necessity. Therefore . . . increase yournecessity so that you may increase your perception.” We can increase ourability to perceive and sense the three levels of events-patterns-structuresoperating simultaneously by actively looking for feedback loops in everydaysituations. How? We simply need to stop, look, listen, and sense.For one colleague, the daily practice of thinking systemically comes with
taking care of her house and garden, as she reflects on how her actions areaffecting the Earth, the water, the air, and all the other living creatures. Lit-tle by little, that practice is leading her to use different cleaning agents, cutout most pesticides, let the clover take over the lawn, and plant lots ofshrubs and trees to provide a rich, varied habitat. For her, the connection tosystems thinking is to remember the Earth as a system, of which she is apart, and to try to imagine the impact of her actions on that larger system.
Draw a Loop-a-Day (or one a week)Try instituting a new morning ritual: Sit down with your cup of coffee, thenewspaper, a pad of paper, and a pen, and look for stories that can beexplored through causal loop diagrams. Search for stories that describe pat-
92 SECTION 6 � From Loops to Leverage
terns of behavior over time (“The unemployment rate rose over the past 10years, as did the number of families seeking welfare assistance.”) and sketchout the systemic structure that you think might have produced those pat-terns of behavior. This is an excellent way to gain practice in recognizingsystemic structures at work, and to master the mechanics of drawing causalloop diagrams.
Collaborative Learning
When it comes to practice, we are each other’s greatest assets. You cangreatly enhance your understanding and application of systems thinking byworking in a group, in which you can offer feedback and learn from eachother’s experience. Here are several ideas for creating group processes thatcan further your systems thinking practice:
Apprenticeship/Mentoring/CoachingIf you can find the right person or organization, try to establish an appren-ticeship with someone who is more skilled than you in the tools and tech-niques of systems thinking. As part of your “training,” see if you canshadow that person during the workday (if he or she is a manager) or ontheir next engagement (if he or she is a consultant).You can also identify someone to be your coach or mentor. Fill a large
file folder with causal loops from newspaper and magazine articles and aska colleague who is well versed in the field of system dynamics to act as yourcoach. Pick one example a week from your daily coffee-and-causal-loopexercise and fax your coach both the article and your causal loop diagramexplanation. Then meet—even if by telephone—to discuss the loop andconsider alternative scenarios and possible interventions.
Book GroupAnother possibility is to find a partner or group with whom you can con-nect on a regular basis (perhaps monthly) to read a book on systems think-ing or organizational learning. Perhaps you want to pick up a copy of a sem-inal book, such as Limits to Growth or Principles of Systems, and agree with acolleague to read a chapter a week, arranging a time to discuss that particu-lar chapter (either in person, by phone, or via e-mail). You may also wantto convene a small group to work through exercises in experientially basedbooks such as The Fifth Discipline Fieldbook or The Systems Thinking Play-book—or even a workbook like this one! Even the president of a large non-profit recently revealed that she and her staff meet once a week for severalhours to work through a different systems thinking–related exercise everyweek.
Learning Communities
Learning communities involve individuals from cross-disciplinary back-grounds who come together to learn and practice in a group setting. Thereare currently several groups around the country that have formed to practicethe skills of systems thinking, and the number continues to grow. In addi-tion to face-to-face gatherings, several electronic forums have been created
Practicing Life-Long Systems Thinking 93

for people who want to exchange ideas and experiences in using the tools ofsystems thinking (see Appendix F: Additional Resources).For example, to create a practice field for local practitioners and mem-
bers of organizations interested in systems thinking, a colleague from Port-land, Maine, organized monthly meetings at the houses of different groupmembers. Group members brought stories from their business experi-ences—typically chronic problems that persisted despite ongoing efforts toresolve them. After several members told their “stories,” one would beselected for the group to focus on. The rest of the meeting would be spentaround a flip chart, exploring the roots of the problem through thoughtfulinquiry and the construction of causal loop diagrams.
THE LEARNING JOURNEY
The most important underpinning of life-long systems thinking practice,whether in your personal or professional life, is an attitude of curiosity andmindfulness—that is, the ability to adopt a beginner’s mindset and to main-tain a heightened awareness of your thought processes. Most of the tips andpractice opportunities described in this section provide a mirror that reflectsyour automatic responses in dealing with complex, systemic issues. Do youfind yourself responding with openness and inquiry, or do you lapse intodefensiveness and a need for “absolute” answers?As you experiment with the various approaches to practicing and apply-
ing systems thinking, keep in mind that there is no one “right” way to mas-ter these new skills. These guidelines are simply intended to get you started.Over time, you may discover additional approaches that work well for you.For those adventurous souls who are attempting to take an unknown routeto their destination, a lovely quote reminds us: “Traveler, there is no path.We make the road by walking.”
Congratulations on working your way through this book! Now that you’ve had ataste of using systems thinking tools, we encourage you to continue your learn-
ing. There are lots of opportunities to practice systems thinking in your everydaylife, and many resources for exploring the broad complement of systems thinkingtools. We hope you found the information and activities in this workbook valu-able. As we stated in the beginning, feel free to share your thoughts with us aboutwhat it was like to use this book, and about systems thinking overall. We look for-ward to hearing from you!
94 SECTION 6 � From Loops to Leverage
This appendix offers additional practice in using the tools of systems thinking. Some ofthese extra learning activities focus on the steps needed for uncovering systemic structures:formulating a problem, identifying variables, drawing BOTS, and creating CLDs. Othersencourage you to stretch your thinking a little more by working with multiloop diagrams.But don’t stop here! As you saw in Section 6, there are lots of opportunities to practice
systems thinking in your everyday life. We hope you’ll take advantage of them and becomea life-long systems thinker.
ACTIVITY 1 B U D G E T B U G A B O O S
Purpose: To uncover the systemic structure at work in the story
Outcome: Insights into the systemic nature of the storyA behavior over time graph and causal loop diagram
Instructions: Read the story below and then answer the questions that follow.
� Budget Bugaboos
Budgets are great for tracking money as it flows through a company. Butwhen they are used for other purposes—long-range planning or gaugingperformance—they can distort reality and mislead managers. When budgetsbecome an end in themselves, the company suffers. The result: Managersend up managing the budget rather than managing the company.Here’s what typically happens: As a result of the annual budgeting
process, each division is given a budget, a target level of spending. If actualcosts exceed the budget, everyone in the division begins to experience bud-get pressure. A division may respond in a variety of ways: laying offemployees, cutting back the work week, dropping “perks,” and eliminatingexpenditures for training and outside conferences. Eventually, to manage-ment’s relief, the monthly and quarterly results improve.
QUESTIONS
1. To formulate the problem, briefly summarize the above story.
95
A P P E N D I X A
Additional Learning Activities
2. What are the story’s key variables? (Hint: Try to look for four.) List them below.
3. Graph these variables’ behavior over time.
4. Draw a causal loop diagram that represents the variables’ interrelationships. Be sure to indicateany important delays and to label each link with an s or an o. Label the overall loop with a B oran R for balancing or reinforcing.
5. Trace around your diagram, telling the story, to test the soundness of your diagram.
96 APPENDIX A � Additional Learning Activities
ACTIVITY 2 M A N A G I N G T H E E L E C T R I C C O M P A N Y
Purpose: To uncover the systemic structure at work in the story
Outcome: Insights into the systemic nature of the storyA behavior over time graph and causal loop diagram
Instructions: Read the story below and then answer the questions that follow.
� Managing the Electric Company
Like other members of the American electric utility industry, Statewide Power Companyfaced fundamental challenges to its core business. These challenges came from pricepressures from large industrial customers, trends in deregulation, and state regulation.For companies like Statewide, large industrial customers competing
directly or indirectly in the global economy were pressuring electricity sup-pliers to match world standards of productivity and quality. By heighteningexpectations for continuous improvements in these areas, these customersdrew power companies into the global competition of the world market.The industries competing in the global market had traditionally worked
through the state regulatory system to gain the electricity prices they neededto be competitive. For the most part, however, state regulation had not low-ered prices enough, in these companies’ opinion. Global competitors there-fore advocated federal deregulation of electric utilities and open access forconsumers to choose among competing electricity generators. In addition,national and international investment houses and the competitive businesscommunity saw the profit potential that could result from freeing large com-panies from regulation.All these developments put pressure on Congress to pass federal laws to
promote competition through the open access of existing electric utilities’transmission grids. This idea of electricity deregulation revealed a major shiftin the way electric utilities and regulators think about how the systemshould operate, and the kinds of results the system should produce.Despite federal interest in pursuing the kind of deregulation seen in the
airline, telephone, and natural gas industries, the American electric utilityindustry remained one of the few regulated U.S. industries until recently. In1992, Congress passed the Policy Energy Act, which promoted competitionbetween electric utilities.
QUESTIONS
1. Those in favor of deregulation of the electric utilities have a theory about how competition canlower electricity prices. What is their theory?
2. To uncover the structure that underlies this theory, begin by listing the key variables in thetheory. (Hint: Try to list four.)
APPENDIX A � Additional Learning Activities 97
3. Graph the behavior of these variables over time.
4. Now draw a causal loop diagram that shows how the variables influence each other. As withActivity 1, make sure each link in your diagram has an s or an o. Label your loop with an R or aB. Add any necessary delays. Finally, check the diagram’s accuracy when you’re finished.
ACTIVITY 3 A D D I C T E D T O O I L
Purpose: To uncover the systemic structure at work in the story
Outcome: Insights into the systemic nature of the storyA multiloop causal diagram
Instructions: Read the story below and then answer the questions that follow.
� Addicted to Oil
In an effort to ease periods of energy shortages, Americans since the mid-1980s have imported more and more barrels of oil to ensure their daily “fix.”Unwilling as a country to restrict use of our cars and other luxuries, we havegrown addicted to foreign oil supplies. The U.S. government has evenengaged in a military buildup in the Middle East to secure this short-termsource of oil.
98 APPENDIX A � Additional Learning Activities
At the same time, American scientists have tried to develop options foralternate energy sources. Switching from an oil-based economy to one basedon multiple energy sources poses quite a challenge and requires a long-termcommitment to the strategy. It is difficult to focus on developing alternativesolutions when, every day, the country hungers for more and more oil andgives in to the temptation to buy foreign oil. As more attention is turnedtoward obtaining foreign oil for short-term satisfaction, less is invested indeveloping alternative energy sources.
QUESTIONS
1. To build a causal loop diagram of this story, start by identifying the key variable that leads toeverything else. That is, what prompts Americans to buy foreign oil and to look for alternatesources of energy?
2. Without worrying about loops yet, think about the nature of this dynamic. As energy shortagesincrease, Americans buy more foreign oil and develop other energy resources, and then theenergy shortage gets eased. What kind of process do you sense at work here: reinforcing orbalancing?
3. Draw a simple multiloop diagram that shows how energy shortages, oil imports, and develop-ment of alternate energy sources influence each other.
APPENDIX A � Additional Learning Activities 99

4. Now think about the role that oil addiction—the craving for a short-term “fix”—plays in this sce-nario. Each time the U.S. buys foreign oil, it becomes more and more dependent on that energysource. As this addiction grows stronger, it diverts attention away from efforts to develop alter-nate energy sources. Neglecting alternate sources in turn only forces Americans to become evenmore reliant on imports. What kind of process does this part of the scenario sound like to you:reinforcing or balancing?
5. Try adding an arrow that links “Addiction to Oil Imports” to the diagram you drew in Step 3.Add any important delays.
6. What does the new version of your diagram suggest about the impact that an intense,short-term need can have on long-range, more effective solutions to the original problem ofenergy shortages?
ACTIVITY 4 T H E N A T I O N A L E C O N O M Y
Purpose: To uncover the systemic structure at work in the story
Outcome: Insights into the systemic nature of the storyA behavior over time graph and causal loop diagram
Instructions: Read the story below (excerpted from Jay Forrester’s description of the national economy asstudied through the National Model), and then answer the questions that follow.
� The National Economy
When consumer demand increases, as it did in the 1950s, after World War II,production rises. With expanding production, the need for more workersmeans manufacturing wages rise. At the same time, increasing productionleads manufacturers to want to make even more profits. They need toexpand, building more factories, warehouses, and distribution facilities, andthey need to invest in more labor and raw materials. They have an insatiabledemand for capital. With optimism high, banks are willing to finance agrowing stream of loans, which go into, among other things, wages for theworkers who construct the new plant and build the new equipment. In gen-eral, wages for both construction and production workers boom. This newlyaffluent middle class of workers satisfies its desire for the “good life” byspending ever more on cars, appliances, clothing, and electronics.
100 APPENDIX A � Additional Learning Activities

QUESTIONS
1. Write a brief synopsis of the story.
2. Identify the story’s key variables. (Hint: Try to list seven.)
3. Graph these variables’ behavior over time.
4. Draw the causal loop diagram. (Hint: The diagram contains two loops of the same type.)
APPENDIX A � Additional Learning Activities 101

ACTIVITY 5 T H E R I S I N G C O S T O F H E A L T H C A R E
Purpose: To uncover the systemic structure at work in the story
Outcome: Insights into the systemic nature of the storyA behavior over time graph and causal loop diagram
Instructions: Read the story below and then answer the questions that follow.
� The Rising Cost of Healthcare
In the business world, companies hoping to control the rising cost of health-care benefits have begun studying the ways in which healthcare services areused by employees. For a while, these studies helped businesses to restrictunnecessary care. One study, for example, analyzed several hundred insuredgroups over a three-year period and concluded that hospital admissions haddecreased 13 percent. Overall, employers were able to cut medical costs 3percent through using such studies.However, concerns arose about the financial benefits of these strategies
because of the heavy administrative burden they placed on doctors andhospitals. Indeed, some analysts estimated that as much as 20 percent of thecost of healthcare could be attributed to excess paperwork and otheradministrative tasks that befall providers. By the year 2020, they warned,such spending could amount to half of total healthcare dollars.Studying healthcare use had become popular because the cost savings far
outweighed the insurance fees charged to employers. Yet over the long term,the increased costs to healthcare providers would lead to higher costs for ser-vices, further shifting costs to patients, and—in the end—to employers.These increased costs were especially insidious because the extra time it takesfor a physician to answer a phone call or chase down information for areport is not measured.
QUESTIONS
1. To uncover the system at work in this story, begin by looking again at the first paragraph. Whattwo variables do you detect are being discussed in that paragraph?
2. Graph the two variables’ behavior over time.
102 APPENDIX A � Additional Learning Activities

3. Now draw a simple loop that shows these variables’ interrelationship. Is the loop reinforcing orbalancing? Label it with an R or a B.
4. Reread the second and third paragraphs of the story. What two additional key variables do theseparagraphs introduce?
5. Draw a new behavior over time graph that includes the variables you graphed in Step 2 and theadditional variables you listed in Step 4.
APPENDIX A � Additional Learning Activities 103

6. Now draw a new CLD that incorporates all four variables of the story. (Hint: This will be adouble-loop CLD.) Be sure all the links are labeled with an s or an o, and that each loop islabeled with an R or a B. Add any important delays.
104 APPENDIX A � Additional Learning Activities
Before you become anxious comparing your responses to those in this section, remember thatfor many learning activities, there’s no one right answer. We offer the following suggestedresponses as guidelines, to invite you to stretch your thinking about the various problems andscenarios presented in the learning activities. You may well come up with your own originalinsights into the activities. After all, an important benefit of using systems thinking tools isthat they bring to the surface our assumptions about issues and problems and give us a start-ing place to address them.
Note: For learning activities that asked for very subjective answers, we have not listed anysuggested responses.
SECTION 3 U N C O V E R I N G S Y S T E M I C S T R U C T U R E S : D R A W I N G B E H A V I O R O V E R T I M E G R A P H S
ACTIVITY 1 THE PROBLEM WITH PRICE PROMOTIONS
1. What are the problems described in the case?
Slowdown in U.S. population growthSmaller annual increases in consumptionPromotions eroding brand imagePromotions encouraging price-based shoppingManufacturers and retailers getting hooked on promotionsSupermarkets’ growing control over the promotionsSupermarkets demanding subsidiesForward buyingDiverted low-price goods
2. From the point of view of the manufacturers, what is the overarching prob-lem that includes many of the specific problems you named in Question 1?
Price promotions eroded brand image, encouraged consumers to shopon price only, and led supermarkets to misuse promotions. The use ofprice promotions was a problem.
3. Is there an even deeper problem behind the one you named in Question 2?If so, what is it?
A deeper problem is that manufacturers are unable to create meaning-ful distinctions among their brands. An even deeper problem is theslowdown in population growth and the rate of consumption.
105
A P P E N D I X B
Learning Activity Key Points and Suggested Responses

ACTIVITY 2 THE CASE OF THE ENERGY DRAIN
1. What’s the problem in this story?
Your first thought might be that the problem is the amount of coffeethe narrator is consuming. But why does the narrator drink coffee? Towake up, to stay awake in the middle of the morning, and to perk up inthe middle of the afternoon. From that perspective, you could say theproblem is that the narrator keeps running out of energy.
2. What are the three or four most important variables in the case?
Energy levelCoffee or Drinking coffee or Use of coffee or caffeineDependence on coffee or caffeine
3. What is the behavior of those variables over time? Graph them.
4. What do you observe about the behavior of the variables?
In this scenario, the use of coffee rises steadily, while dependence oncoffee rises sharply. Energy level fluctuates but declines overall.
5. What relationships among the behavior patterns of the variables do youobserve?
Use of coffee and dependence on coffee seem paired in this situation.Also, the more the use of coffee and dependence on it rises, the moreenergy level drops—exactly the opposite of what was desired!
ACTIVITY 3 THE CASE OF THE AUDIO-ELECTRONIC ROLLER COASTER
1. What was the long-standing, chronic problem facing AudioMax Corp.?
The apparent problem is that after a period of steady growth, AudioMaxCorp. suffered from shaky financial performance that started with aserious decline, and continued as a “boom and bust” pattern.AudioMax’s uneven management quality was another problem. In fact,it looks as if the quality of the entire management team was uneven. Astrong focus on technological improvements at the expense of otherbusiness processes could also lie at the root of the company’s problems.
Now
Dependence on Coffee
Use of Coffee
Energy Level
Start 5 Years
106 APPENDIX B � Learning Activity Key Points and Suggested Responses
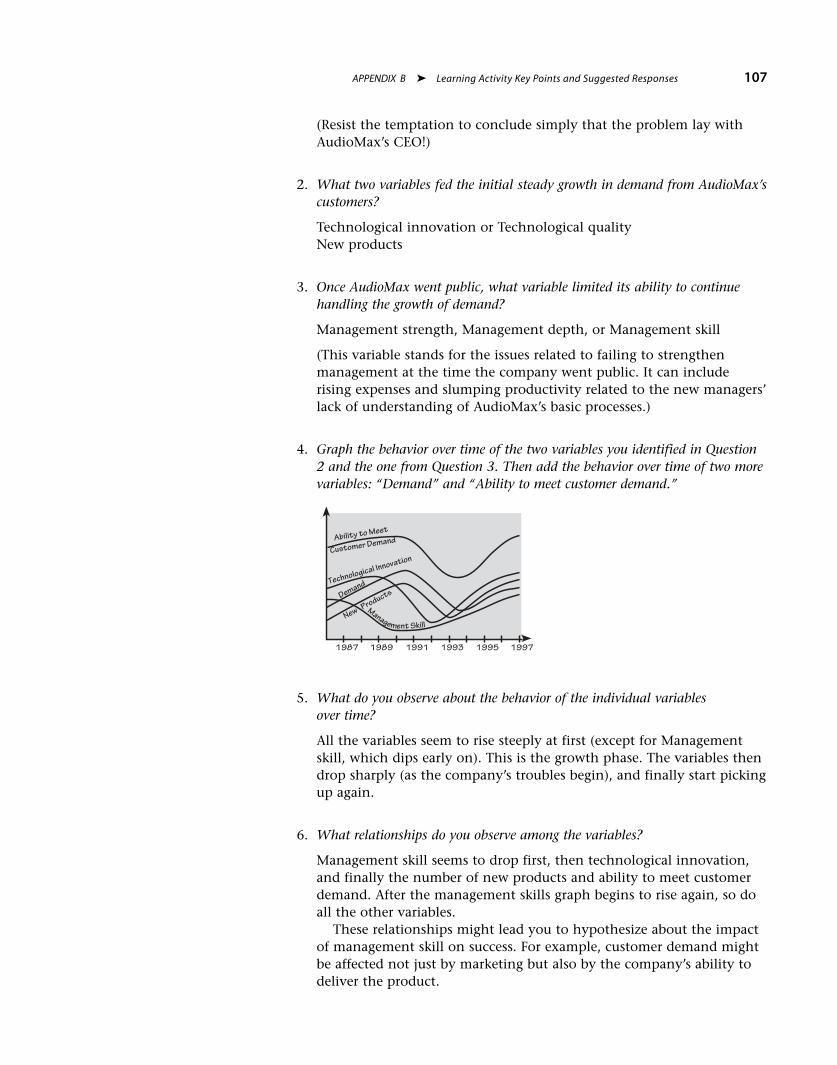
(Resist the temptation to conclude simply that the problem lay withAudioMax’s CEO!)
2. What two variables fed the initial steady growth in demand from AudioMax’scustomers?
Technological innovation or Technological qualityNew products
3. Once AudioMax went public, what variable limited its ability to continuehandling the growth of demand?
Management strength, Management depth, or Management skill
(This variable stands for the issues related to failing to strengthenmanagement at the time the company went public. It can includerising expenses and slumping productivity related to the new managers’lack of understanding of AudioMax’s basic processes.)
4. Graph the behavior over time of the two variables you identified in Question2 and the one from Question 3. Then add the behavior over time of two morevariables: “Demand” and “Ability to meet customer demand.”
5. What do you observe about the behavior of the individual variablesover time?
All the variables seem to rise steeply at first (except for Managementskill, which dips early on). This is the growth phase. The variables thendrop sharply (as the company’s troubles begin), and finally start pickingup again.
6. What relationships do you observe among the variables?
Management skill seems to drop first, then technological innovation,and finally the number of new products and ability to meet customerdemand. After the management skills graph begins to rise again, so doall the other variables.
These relationships might lead you to hypothesize about the impactof management skill on success. For example, customer demand mightbe affected not just by marketing but also by the company’s ability todeliver the product.
1987 1989 1991 1993 1995 1997
Ability to Meet
Customer Demand
Technological Innovation
Demand
New Products
Management Skill
APPENDIX B � Learning Activity Key Points and Suggested Responses 107
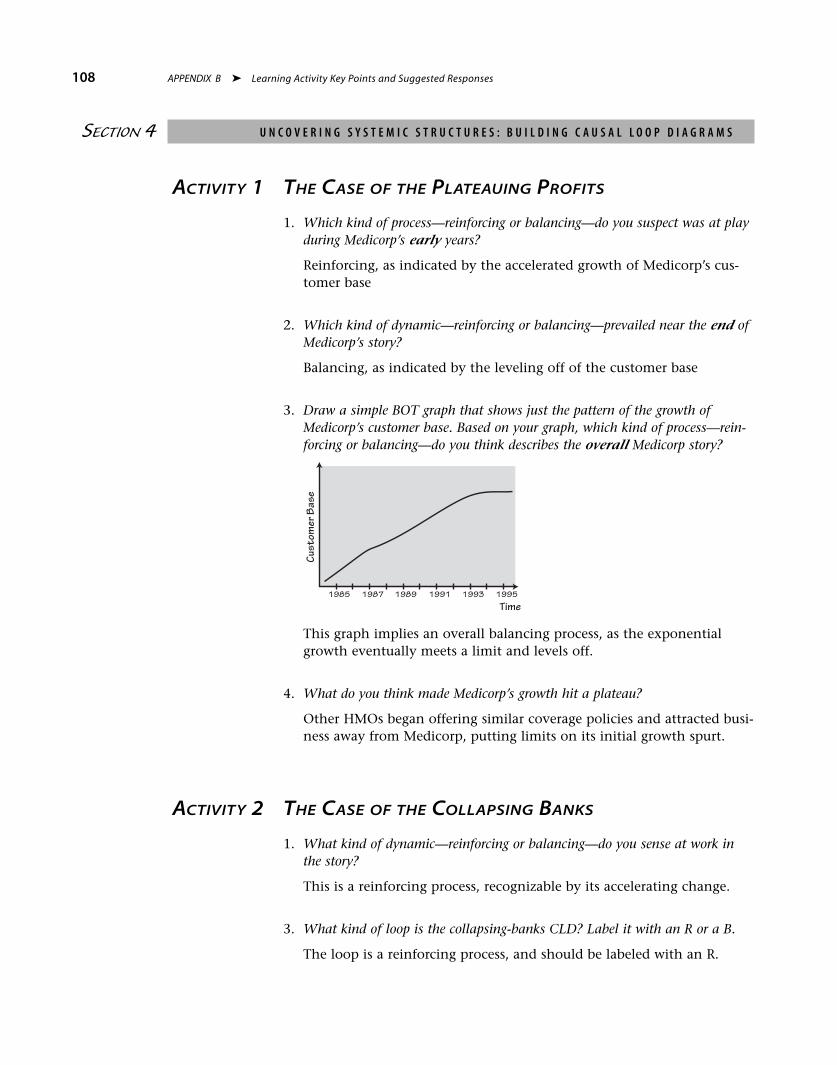
SECTION 4 U N C O V E R I N G S Y S T E M I C S T R U C T U R E S : B U I L D I N G C A U S A L L O O P D I A G R A M S
ACTIVITY 1 THE CASE OF THE PLATEAUING PROFITS
1. Which kind of process—reinforcing or balancing—do you suspect was at playduring Medicorp’s early years?
Reinforcing, as indicated by the accelerated growth of Medicorp’s cus-tomer base
2. Which kind of dynamic—reinforcing or balancing—prevailed near the end ofMedicorp’s story?
Balancing, as indicated by the leveling off of the customer base
3. Draw a simple BOT graph that shows just the pattern of the growth ofMedicorp’s customer base. Based on your graph, which kind of process—rein-forcing or balancing—do you think describes the overall Medicorp story?
This graph implies an overall balancing process, as the exponentialgrowth eventually meets a limit and levels off.
4. What do you think made Medicorp’s growth hit a plateau?
Other HMOs began offering similar coverage policies and attracted busi-ness away from Medicorp, putting limits on its initial growth spurt.
ACTIVITY 2 THE CASE OF THE COLLAPSING BANKS
1. What kind of dynamic—reinforcing or balancing—do you sense at work inthe story?
This is a reinforcing process, recognizable by its accelerating change.
3. What kind of loop is the collapsing-banks CLD? Label it with an R or a B.
The loop is a reinforcing process, and should be labeled with an R.
1987 1989 1991 1993 19951985
Time
Cust
omer
Bas
e
108 APPENDIX B � Learning Activity Key Points and Suggested Responses
ACTIVITY 3 THE “ORGANIC TO GO” STORY
Part One
We have not provided suggested responses for the Part One “Organic ToGo” questions; at this stage, the questions ask you simply to speculate onthe company’s situation.
Part Two
1. Look again at the first Organic To Go causal loop diagram. Does it representa reinforcing or a balancing process? Label the loop with an R or a B.
This is a reinforcing process, and the loop should be labeled with an R.
2. Look at the second causal loop diagram. Does the new section of the diagramrepresent a reinforcing or balancing process? Label the section with an R or aB.
This is a balancing process, and the loop should be labeled with a B.
3. When you look at both the original version and the expanded depiction of thestory’s actual outcome, do you see the issues at Organic To Go differentlythan you did at first? If so, how?
You might decide that the Organic To Go managers need to see beyondthe initial “flush” of success that is depicted by the original reinforcingprocess of expansion. The high-energy growth during the company’searly stages is not enough to sustain itself indefinitely.
4. Given what you can see from the loop diagrams, what suggestions would youoffer the managers?
Perhaps they could invest time and funds in more training for newemployees in policies and expectations, before having them plunge intostaffing the new stores. They might also think about slowing the paceof their growth a bit, to let the new staff get “up to speed.” Attendingto order filling, stocking, and maintenance problems is another idea.Finally, they could take steps to support newer managers and boostemployee morale.
5. What factors in particular do you now think the managers should pay mostattention to?
Training of new employees and pace of overall growth are two impor-tant possibilities.
APPENDIX B � Learning Activity Key Points and Suggested Responses 109
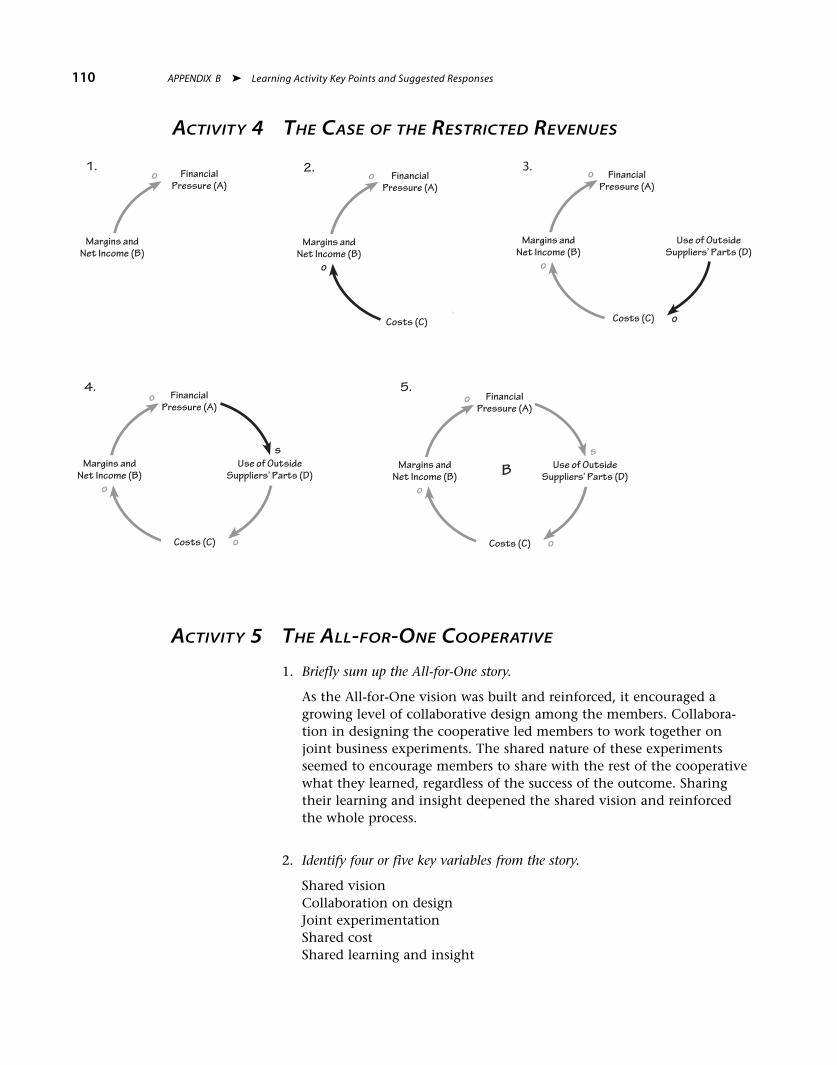
ACTIVITY 5 THE ALL-FOR-ONE COOPERATIVE
1. Briefly sum up the All-for-One story.
As the All-for-One vision was built and reinforced, it encouraged agrowing level of collaborative design among the members. Collabora-tion in designing the cooperative led members to work together onjoint business experiments. The shared nature of these experimentsseemed to encourage members to share with the rest of the cooperativewhat they learned, regardless of the success of the outcome. Sharingtheir learning and insight deepened the shared vision and reinforcedthe whole process.
2. Identify four or five key variables from the story.
Shared visionCollaboration on designJoint experimentationShared costShared learning and insight
ACTIVITY 4 THE CASE OF THE RESTRICTED REVENUES
110 APPENDIX B � Learning Activity Key Points and Suggested Responses
o
Margins andNet Income (B)
FinancialPressure (A)
1.o
o
Margins andNet Income (B)
Costs (C)
FinancialPressure (A)
2. o
o
Margins andNet Income (B)
o
Use of OutsideSuppliers’ Parts (D)
Costs (C)
FinancialPressure (A)
3.
o
o
sMargins and
Net Income (B)
o
Use of OutsideSuppliers’ Parts (D)
Costs (C)
FinancialPressure (A)
4.o
o
sMargins and
Net Income (B)
o
Use of OutsideSuppliers’ Parts (D)
Costs (C)
FinancialPressure (A)
B
5.

3. Graph the variables’ behavior over time.
4. Decide how the variables interrelate, and draw a causal loop diagram to showthe connections. Label the loop with an R or a B.
ACTIVITY 6 THE PROBLEM WITH USED CDS
1. What was the original problem that CDs posed for record companies?
Because CDs cost a good deal more than LPs, record companies’ origi-nal problem was how to persuade consumers to buy CDs.
2. What did the record companies do to overcome this problem?
Their strategy was to promote CDs in various ways, including cheapdeals through record clubs.
3. What was the next problem or issue facing the record companies?
The next problem was a conflict with retailers over sales of used CDs.Record companies were concerned that sales of used CDs would cutinto sales of higher priced, new CDs.
4. Identify a total of four key variables reflecting the original problem and thelater problem.
Record industry need to sell new CDs or Record industry pressure to sellnew CDs
Record industry CD promotionsRetailer sales of new CDsAvailability and sales of used CDs
Time
Shared Vision
Collaboration
Joint Experimentation
Shared Cost
Shared Learning
SharedVision
s
s
s
Collaboration onCooperative Design
Shared Learningand Insight
SharedCost
Joint Experiments andSense of Shared Responsibility
s
s
R
APPENDIX B � Learning Activity Key Points and Suggested Responses 111
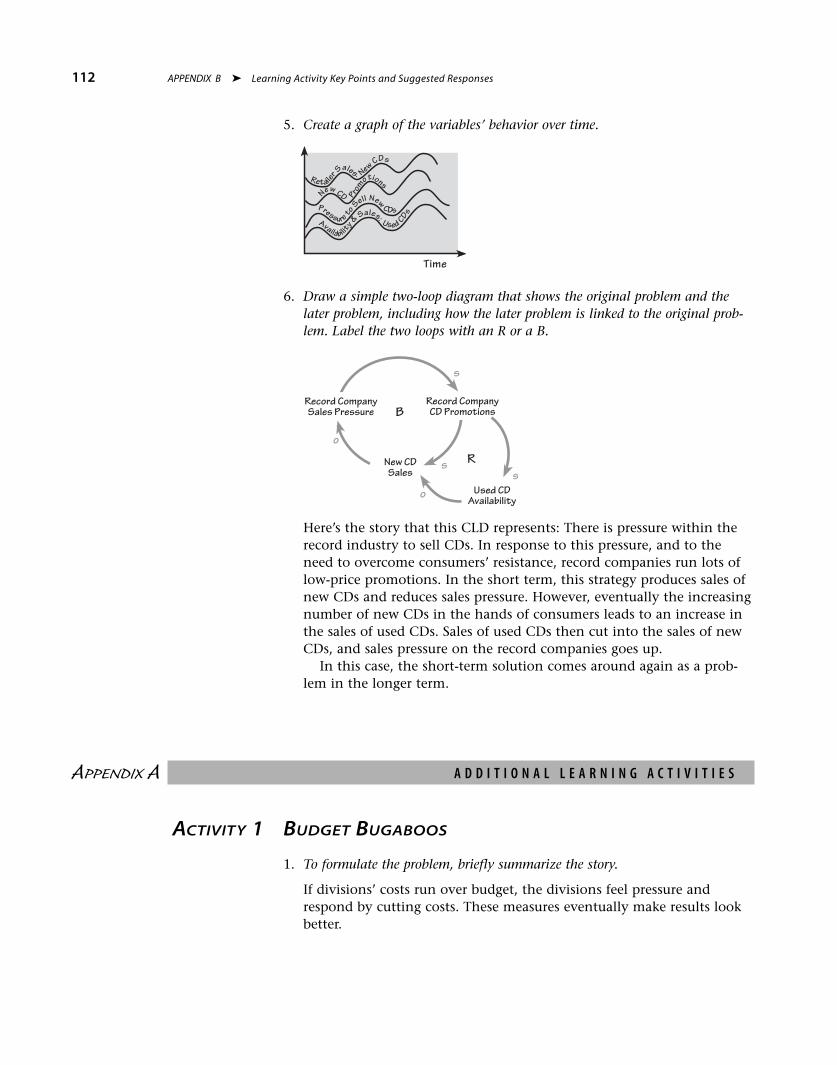
5. Create a graph of the variables’ behavior over time.
6. Draw a simple two-loop diagram that shows the original problem and thelater problem, including how the later problem is linked to the original prob-lem. Label the two loops with an R or a B.
Here’s the story that this CLD represents: There is pressure within therecord industry to sell CDs. In response to this pressure, and to theneed to overcome consumers’ resistance, record companies run lots oflow-price promotions. In the short term, this strategy produces sales ofnew CDs and reduces sales pressure. However, eventually the increasingnumber of new CDs in the hands of consumers leads to an increase inthe sales of used CDs. Sales of used CDs then cut into the sales of newCDs, and sales pressure on the record companies goes up.
In this case, the short-term solution comes around again as a prob-lem in the longer term.
APPENDIX A A D D I T I O N A L L E A R N I N G A C T I V I T I E S
ACTIVITY 1 BUDGET BUGABOOS
1. To formulate the problem, briefly summarize the story.
If divisions’ costs run over budget, the divisions feel pressure andrespond by cutting costs. These measures eventually make results lookbetter.
Record CompanySales Pressure
New CDSales
B
s
o
s
Record CompanyCD Promotions
Used CDAvailability
s
o
R
Time
Availability & Sales: Used CDsPressure to Sell New
CDs
New CD PromotionsRetaile
r Sales: New CDs
112 APPENDIX B � Learning Activity Key Points and Suggested Responses
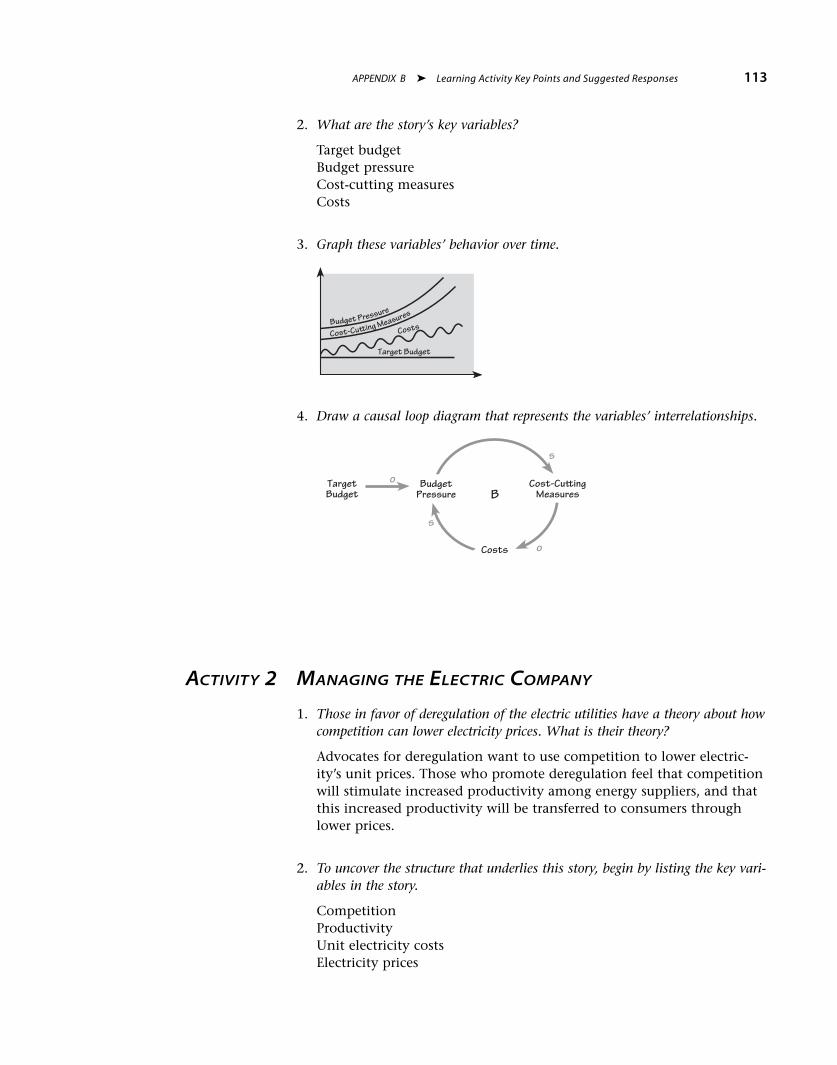
2. What are the story’s key variables?
Target budgetBudget pressureCost-cutting measuresCosts
3. Graph these variables’ behavior over time.
4. Draw a causal loop diagram that represents the variables’ interrelationships.
ACTIVITY 2 MANAGING THE ELECTRIC COMPANY
1. Those in favor of deregulation of the electric utilities have a theory about howcompetition can lower electricity prices. What is their theory?
Advocates for deregulation want to use competition to lower electric-ity’s unit prices. Those who promote deregulation feel that competitionwill stimulate increased productivity among energy suppliers, and thatthis increased productivity will be transferred to consumers throughlower prices.
2. To uncover the structure that underlies this story, begin by listing the key vari-ables in the story.
CompetitionProductivityUnit electricity costsElectricity prices
BudgetPressure
Costs
B
o
s
s
Cost-Cu ingMeasures
TargetBudget
o
Target Budget
CostsCost-Cu�ing MeasuresBudget Pressure
APPENDIX B � Learning Activity Key Points and Suggested Responses 113

3. Graph the behavior of these variables over time.
4. Now draw a causal loop diagram that shows how the variables influenceeach other.
ACTIVITY 3 ADDICTED TO OIL
1. To build a causal loop diagram of this story, start by identifying the key vari-able that leads to everything else. What prompts Americans to buy foreign oiland to look for alternate sources of energy?
Energy shortages
2. What kind of process do you sense here: reinforcing or balancing?
Balancing
3. Draw a simple multiloop diagram that shows how energy shortages, oilimports, and development of alternate energy sources influence each other.
s
oEnergy
Shortage
OilImports
B
s
o
B
AlternateEnergy
Development
s
o
s
Productivity
s
ElectricityPrices
UnitElectricityCosts
Competition
Unit Electricity CostsElectricity Prices
Competition
Productivity
114 APPENDIX B � Learning Activity Key Points and Suggested Responses
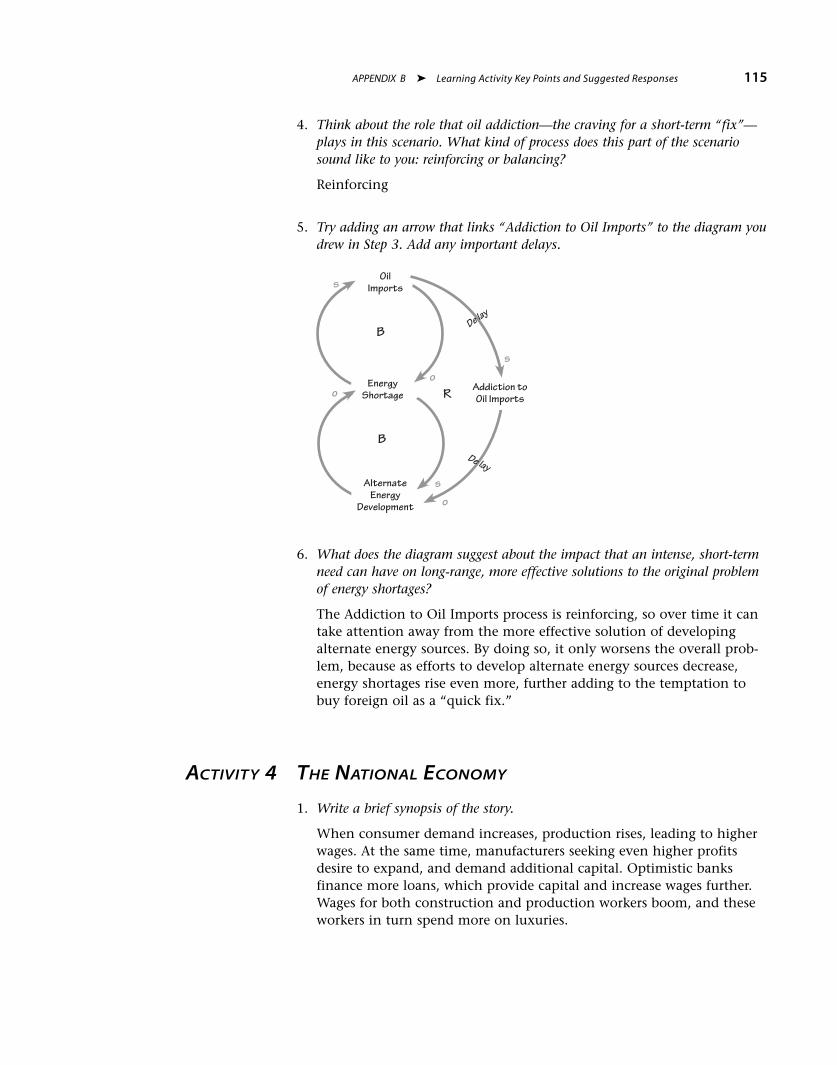
4. Think about the role that oil addiction—the craving for a short-term “fix”—plays in this scenario. What kind of process does this part of the scenariosound like to you: reinforcing or balancing?
Reinforcing
5. Try adding an arrow that links “Addiction to Oil Imports” to the diagram youdrew in Step 3. Add any important delays.
6. What does the diagram suggest about the impact that an intense, short-termneed can have on long-range, more effective solutions to the original problemof energy shortages?
The Addiction to Oil Imports process is reinforcing, so over time it cantake attention away from the more effective solution of developingalternate energy sources. By doing so, it only worsens the overall prob-lem, because as efforts to develop alternate energy sources decrease,energy shortages rise even more, further adding to the temptation tobuy foreign oil as a “quick fix.”
ACTIVITY 4 THE NATIONAL ECONOMY
1. Write a brief synopsis of the story.
When consumer demand increases, production rises, leading to higherwages. At the same time, manufacturers seeking even higher profitsdesire to expand, and demand additional capital. Optimistic banksfinance more loans, which provide capital and increase wages further.Wages for both construction and production workers boom, and theseworkers in turn spend more on luxuries.
s
oEnergy
Shortage
OilImports
B
s
o
B
AlternateEnergy
Development o
Addiction toOil ImportsR
s
De lay
De lay
APPENDIX B � Learning Activity Key Points and Suggested Responses 115
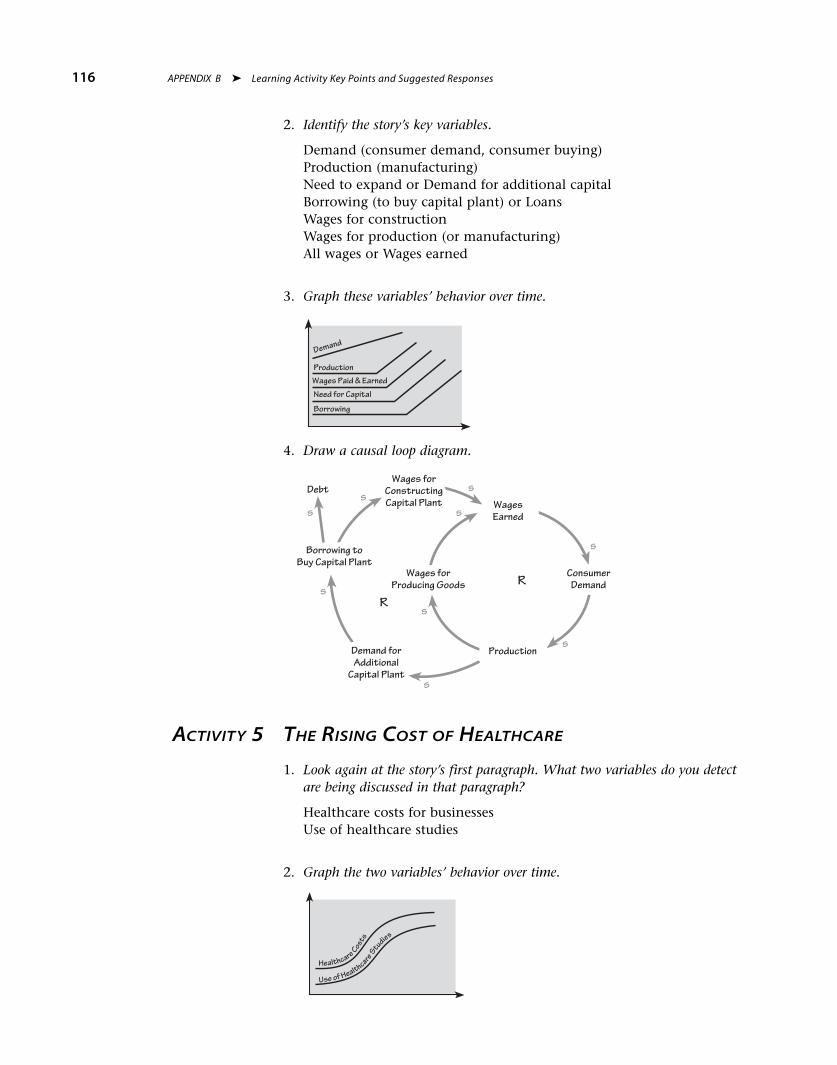
2. Identify the story’s key variables.
Demand (consumer demand, consumer buying)Production (manufacturing)Need to expand or Demand for additional capitalBorrowing (to buy capital plant) or LoansWages for constructionWages for production (or manufacturing)All wages or Wages earned
3. Graph these variables’ behavior over time.
4. Draw a causal loop diagram.
ACTIVITY 5 THE RISING COST OF HEALTHCARE
1. Look again at the story’s first paragraph. What two variables do you detectare being discussed in that paragraph?
Healthcare costs for businessesUse of healthcare studies
2. Graph the two variables’ behavior over time.
Healthcare Costs
Use of HealthcareStudies
sWagesEarned
s
s
Wages forProducing Goods
s
ConsumerDemand
Production
sWages for
ConstructingCapital Plants
Borrowing toBuy Capital Plant
s
Demand forAdditional
Capital Plants
s
Debt
R
R
Borrowing
Need for Capital
Production
Demand
Wages Paid & Earned
116 APPENDIX B � Learning Activity Key Points and Suggested Responses
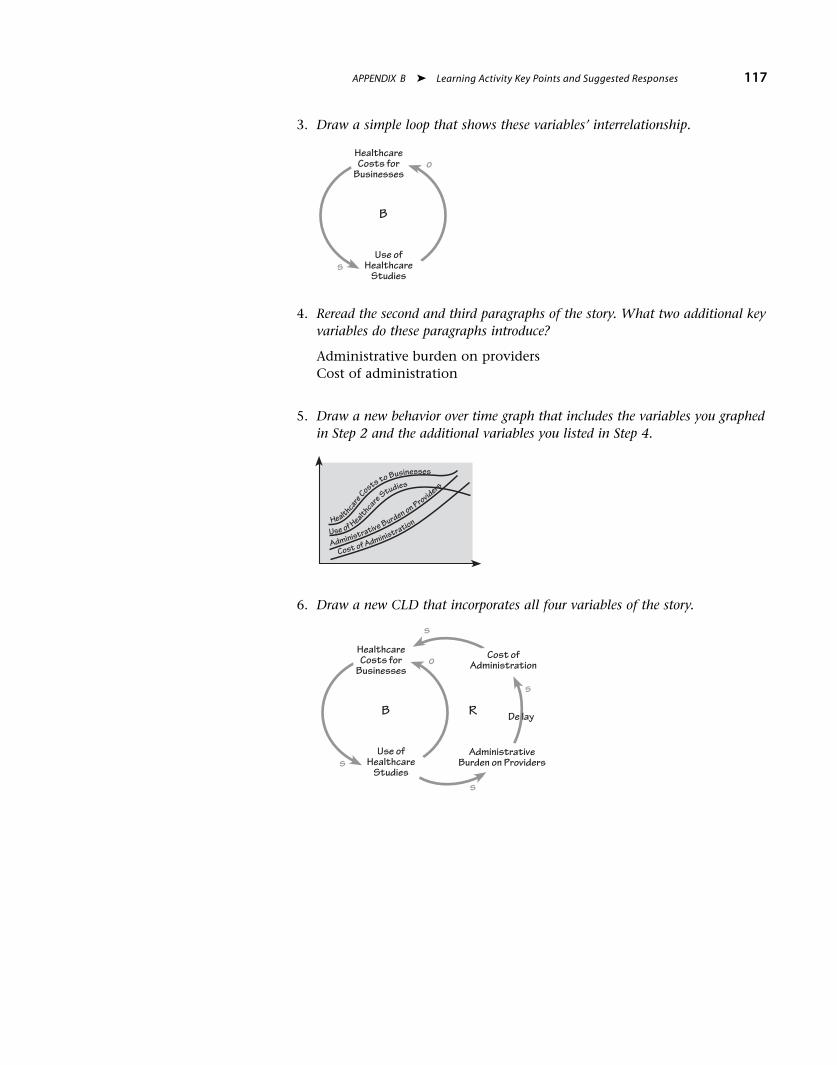
3. Draw a simple loop that shows these variables’ interrelationship.
4. Reread the second and third paragraphs of the story. What two additional keyvariables do these paragraphs introduce?
Administrative burden on providersCost of administration
5. Draw a new behavior over time graph that includes the variables you graphedin Step 2 and the additional variables you listed in Step 4.
6. Draw a new CLD that incorporates all four variables of the story.
Use ofHealthcare
Studies
HealthcareCosts for
Businesses
B
s
o
s
Cost ofAdministration
s
AdministrativeBurden on Providers
s
De layR
Administrative Burden on Providers
Cost of AdministrationUse of Healthcare
Studies
HealthcareCosts to Businesses
Use ofHealthcare
Studies
HealthcareCosts for
Businesses
B
s
o
APPENDIX B � Learning Activity Key Points and Suggested Responses 117

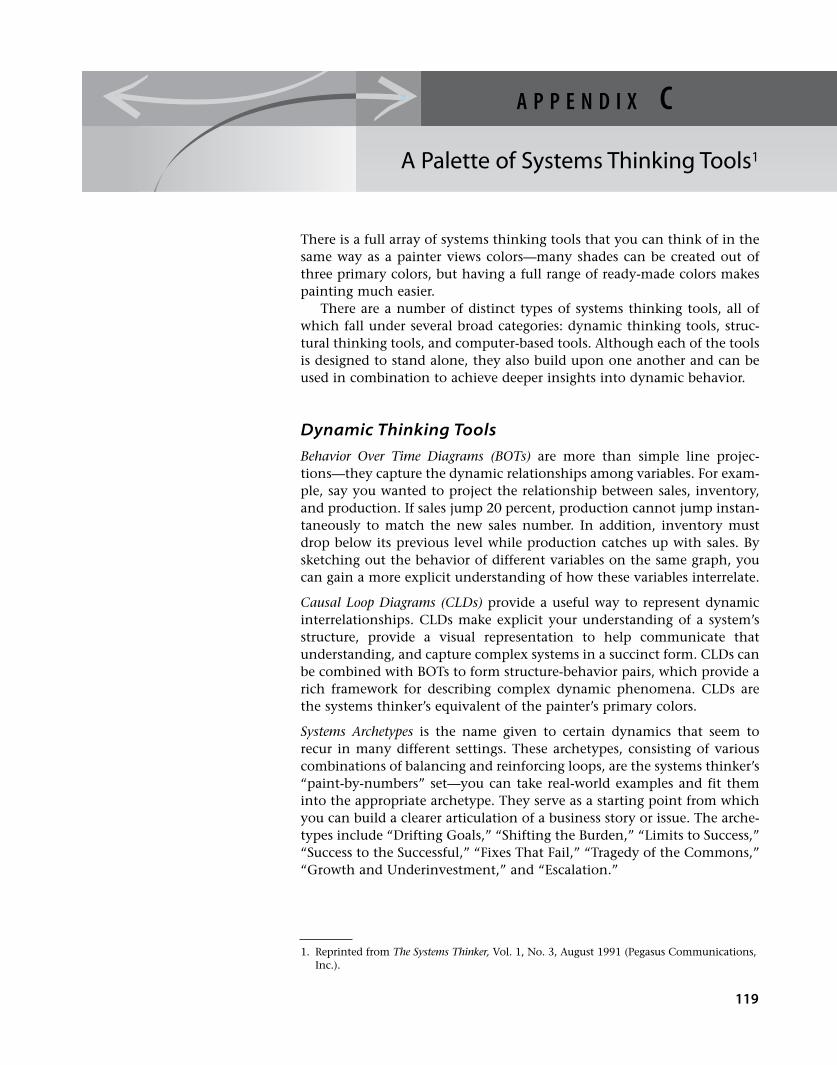
There is a full array of systems thinking tools that you can think of in thesame way as a painter views colors—many shades can be created out ofthree primary colors, but having a full range of ready-made colors makespainting much easier.
There are a number of distinct types of systems thinking tools, all ofwhich fall under several broad categories: dynamic thinking tools, struc-tural thinking tools, and computer-based tools. Although each of the toolsis designed to stand alone, they also build upon one another and can beused in combination to achieve deeper insights into dynamic behavior.
Dynamic Thinking Tools
Behavior Over Time Diagrams (BOTs) are more than simple line projec-tions—they capture the dynamic relationships among variables. For exam-ple, say you wanted to project the relationship between sales, inventory,and production. If sales jump 20 percent, production cannot jump instan-taneously to match the new sales number. In addition, inventory mustdrop below its previous level while production catches up with sales. Bysketching out the behavior of different variables on the same graph, youcan gain a more explicit understanding of how these variables interrelate.
Causal Loop Diagrams (CLDs) provide a useful way to represent dynamicinterrelationships. CLDs make explicit your understanding of a system’sstructure, provide a visual representation to help communicate thatunderstanding, and capture complex systems in a succinct form. CLDs canbe combined with BOTs to form structure-behavior pairs, which provide arich framework for describing complex dynamic phenomena. CLDs arethe systems thinker’s equivalent of the painter’s primary colors.
Systems Archetypes is the name given to certain dynamics that seem torecur in many different settings. These archetypes, consisting of variouscombinations of balancing and reinforcing loops, are the systems thinker’s“paint-by-numbers” set—you can take real-world examples and fit theminto the appropriate archetype. They serve as a starting point from whichyou can build a clearer articulation of a business story or issue. The arche-types include “Drifting Goals,” “Shifting the Burden,” “Limits to Success,”“Success to the Successful,” “Fixes That Fail,” “Tragedy of the Commons,”“Growth and Underinvestment,” and “Escalation.”
1. Reprinted from The Systems Thinker, Vol. 1, No. 3, August 1991 (Pegasus Communications,Inc.).
119
A P P E N D I X C
A Palette of Systems Thinking Tools1
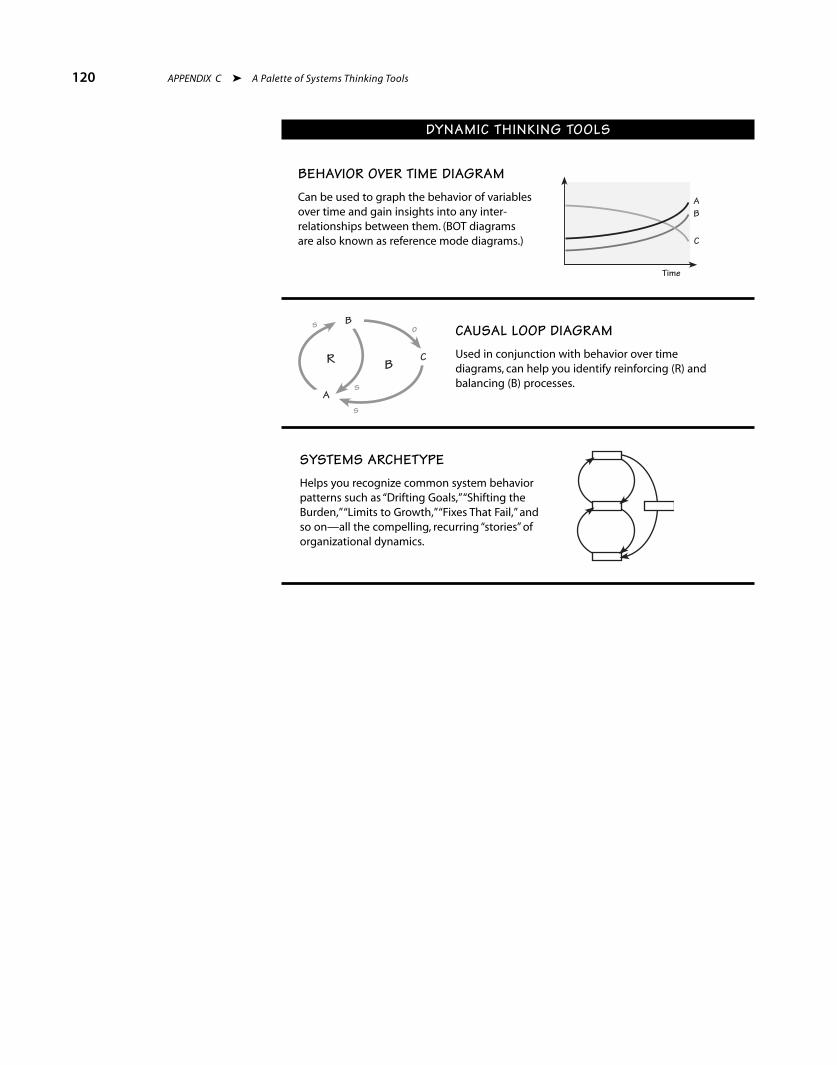
120 APPENDIX C � A Palette of Systems Thinking Tools
Time
BA
C
C
B
A
s o
s
s
R B
DYNAMIC THINKING TOOLS
BEHAVIOR OVER TIME DIAGRAMCan be used to graph the behavior of variablesover time and gain insights into any inter-relationships between them. (BOT diagramsare also known as reference mode diagrams.)
CAUSAL LOOP DIAGRAMUsed in conjunction with behavior over timediagrams, can help you identify reinforcing (R) andbalancing (B) processes.
SYSTEMS ARCHETYPEHelps you recognize common system behaviorpatterns such as “Drifting Goals,”“Shifting theBurden,”“Limits to Growth,”“Fixes That Fail,” andso on—all the compelling, recurring “stories”oforganizational dynamics.
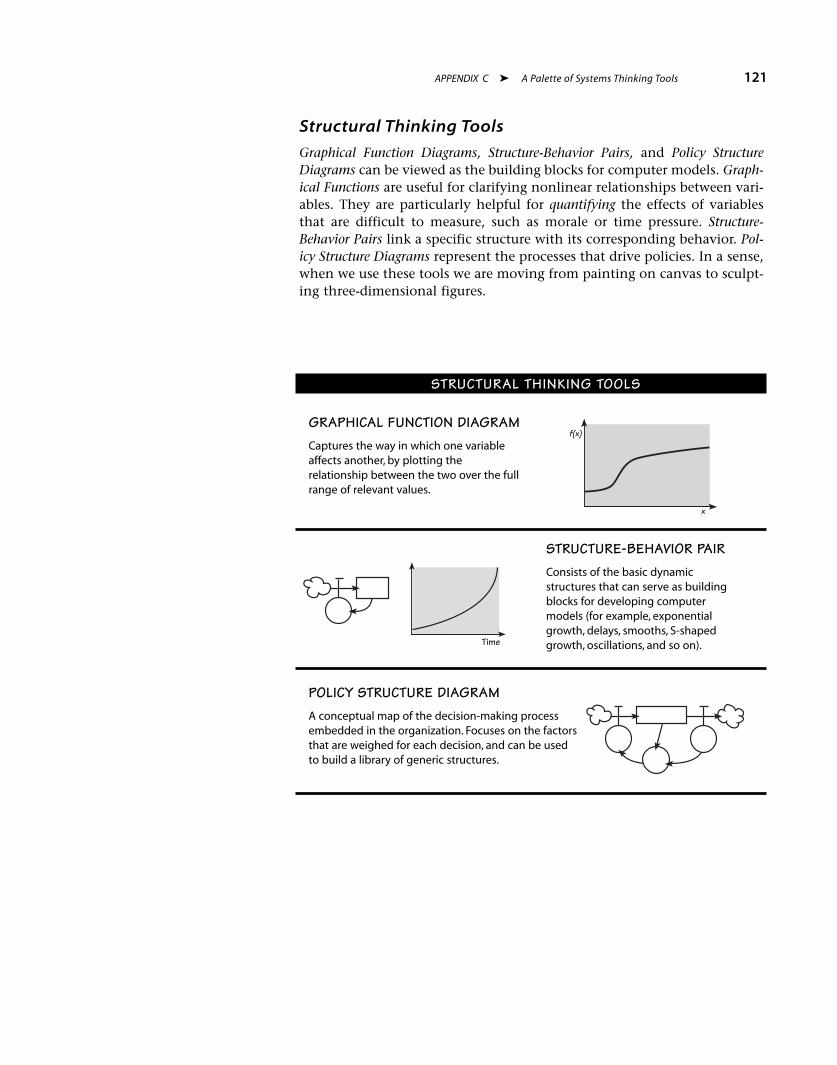
APPENDIX C � A Palette of Systems Thinking Tools 121
STRUCTURAL THINKING TOOLS
x
f(x)
Time
GRAPHICAL FUNCTION DIAGRAMCaptures the way in which one variableaffects another, by plotting therelationship between the two over the fullrange of relevant values.
STRUCTURE-BEHAVIOR PAIRConsists of the basic dynamicstructures that can serve as buildingblocks for developing computermodels (for example, exponentialgrowth, delays, smooths, S-shapedgrowth, oscillations, and so on).
POLICY STRUCTURE DIAGRAMA conceptual map of the decision-making processembedded in the organization. Focuses on the factorsthat are weighed for each decision, and can be usedto build a library of generic structures.
Structural Thinking Tools
Graphical Function Diagrams, Structure-Behavior Pairs, and Policy StructureDiagrams can be viewed as the building blocks for computer models. Graph-ical Functions are useful for clarifying nonlinear relationships between vari-ables. They are particularly helpful for quantifying the effects of variablesthat are difficult to measure, such as morale or time pressure. Structure-Behavior Pairs link a specific structure with its corresponding behavior. Pol-icy Structure Diagrams represent the processes that drive policies. In a sense,when we use these tools we are moving from painting on canvas to sculpt-ing three-dimensional figures.
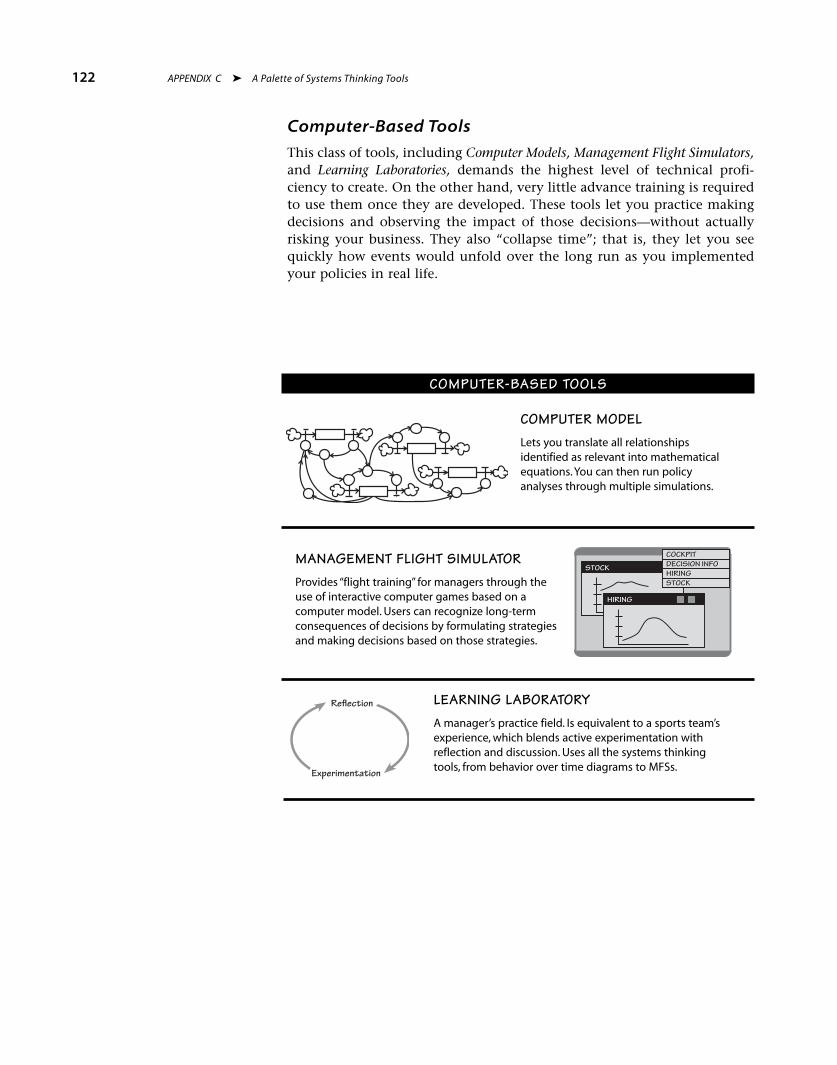
Computer-Based Tools
This class of tools, including Computer Models, Management Flight Simulators,and Learning Laboratories, demands the highest level of technical profi-ciency to create. On the other hand, very little advance training is requiredto use them once they are developed. These tools let you practice makingdecisions and observing the impact of those decisions—without actuallyrisking your business. They also “collapse time”; that is, they let you seequickly how events would unfold over the long run as you implementedyour policies in real life.
122 APPENDIX C � A Palette of Systems Thinking Tools
STOCK
HIRING
STOCKHIRINGDECISION INFOCOCKPIT
Experimentation
Reflection
COMPUTER-BASED TOOLS
COMPUTER MODELLets you translate all relationshipsidentified as relevant into mathematicalequations.You can then run policyanalyses through multiple simulations.
MANAGEMENT FLIGHT SIMULATORProvides “flight training” for managers through theuse of interactive computer games based on acomputer model. Users can recognize long-termconsequences of decisions by formulating strategiesand making decisions based on those strategies.
LEARNING LABORATORYA manager’s practice field. Is equivalent to a sports team’sexperience,which blends active experimentation withreflection and discussion. Uses all the systems thinkingtools, from behavior over time diagrams to MFSs.
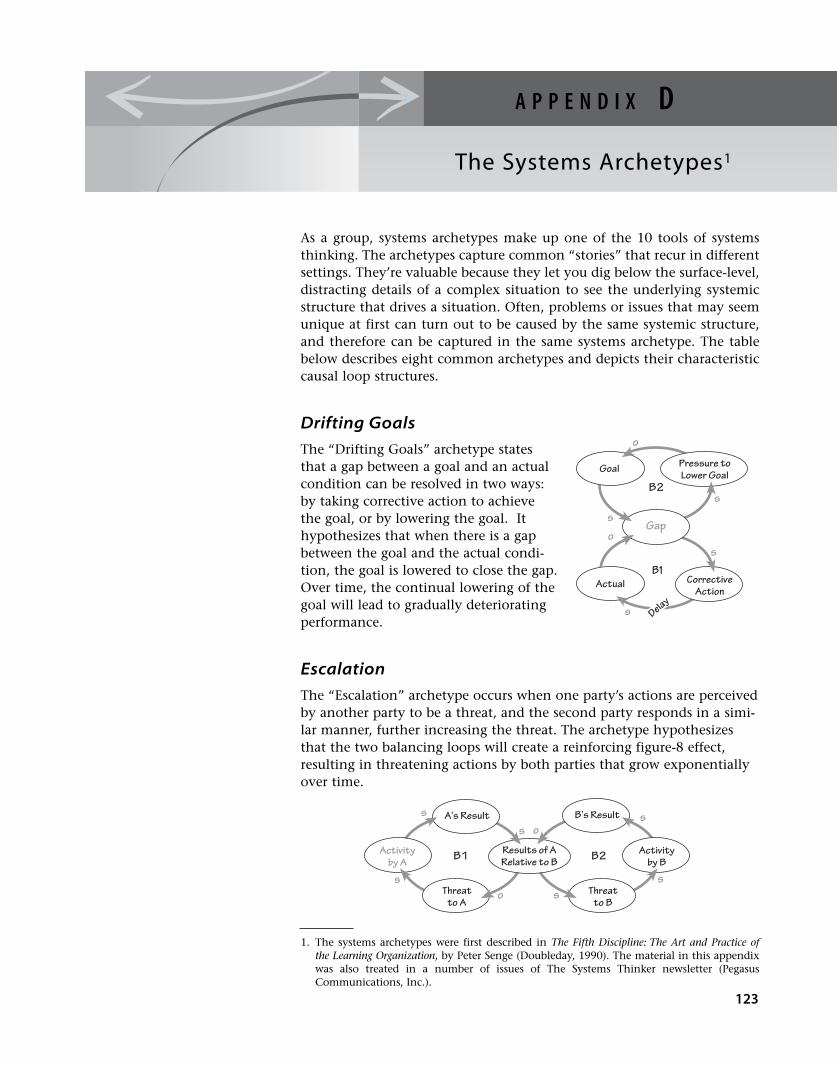
As a group, systems archetypes make up one of the 10 tools of systemsthinking. The archetypes capture common “stories” that recur in differentsettings. They’re valuable because they let you dig below the surface-level,distracting details of a complex situation to see the underlying systemicstructure that drives a situation. Often, problems or issues that may seemunique at first can turn out to be caused by the same systemic structure,and therefore can be captured in the same systems archetype. The tablebelow describes eight common archetypes and depicts their characteristiccausal loop structures.
Drifting Goals
The “Drifting Goals” archetype statesthat a gap between a goal and an actualcondition can be resolved in two ways:by taking corrective action to achievethe goal, or by lowering the goal. Ithypothesizes that when there is a gapbetween the goal and the actual condi-tion, the goal is lowered to close the gap.Over time, the continual lowering of thegoal will lead to gradually deterioratingperformance.
Escalation
The “Escalation” archetype occurs when one party’s actions are perceivedby another party to be a threat, and the second party responds in a simi-lar manner, further increasing the threat. The archetype hypothesizesthat the two balancing loops will create a reinforcing figure-8 effect,resulting in threatening actions by both parties that grow exponentiallyover time.
1. The systems archetypes were first described in The Fifth Discipline: The Art and Practice ofthe Learning Organization, by Peter Senge (Doubleday, 1990). The material in this appendixwas also treated in a number of issues of The Systems Thinker newsletter (PegasusCommunications, Inc.).
123
A P P E N D I X D
The Systems Archetypes1
Actual CorrectiveAction
Pressure toLower Goal
Gap
B2
B1
s
s
s
s
o
o
Goal
Delay
Threatto B
Results of ARelative to B
s
o
Activityby B
B’s Result
B2
s
Activityby A
Threatto A
A’s Result
ss
s
s o
B1
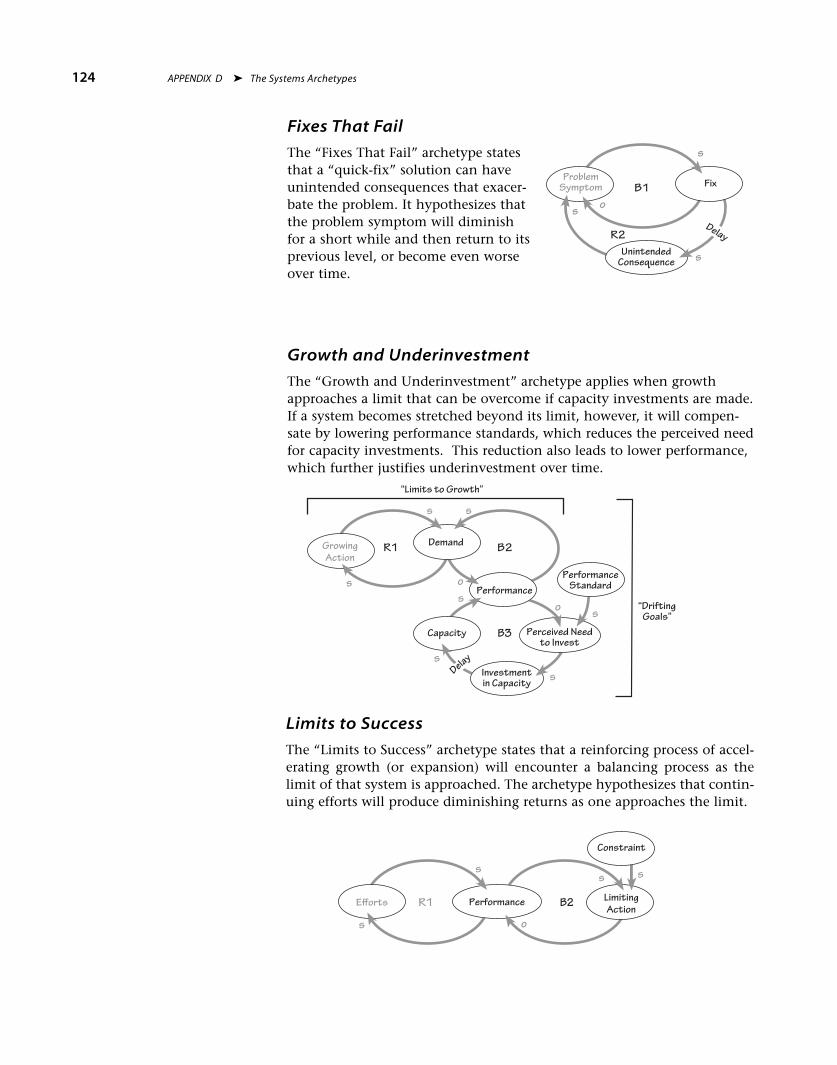
Fixes That Fail
The “Fixes That Fail” archetype statesthat a “quick-fix” solution can haveunintended consequences that exacer-bate the problem. It hypothesizes thatthe problem symptom will diminishfor a short while and then return to itsprevious level, or become even worseover time.
Growth and Underinvestment
The “Growth and Underinvestment” archetype applies when growthapproaches a limit that can be overcome if capacity investments are made.If a system becomes stretched beyond its limit, however, it will compen-sate by lowering performance standards, which reduces the perceived needfor capacity investments. This reduction also leads to lower performance,which further justifies underinvestment over time.
124 APPENDIX D � The Systems Archetypes
FixProblem
Symptom
UnintendedConsequence s
s
s
oB1
R2Delay
Performance
s
LimitingAction
B2Efforts
o
s
R1
s
s
Constraint
Capacity Perceived Needto Invest
Performance
B2
B3
s
s
s
o
s
o
Demand
DelayInvestmentin Capacity
R1
PerformanceStandard
s
GrowingAction
s
s
“DriftingGoals”
“Limits to Growth”
Limits to Success
The “Limits to Success” archetype states that a reinforcing process of accel-erating growth (or expansion) will encounter a balancing process as thelimit of that system is approached. The archetype hypothesizes that contin-uing efforts will produce diminishing returns as one approaches the limit.

APPENDIX D � The Systems Archetypes 125
Resourcesto B
Allocation to AInstead of B
s Successof B
R2
Resourcesto A
Successof A
o
o
R1
s
s s
Shifting the Burden
The “Shifting the Burden” archetypestates that a problem symptom can beresolved either by using a symptomaticsolution or applying a fundamentalsolution. The archetype hypothesizesthat once a symptomatic solution isused, it alleviates the problem symp-tom and reduces pressure to imple-ment a more fundamental solution.The symptomatic solution also pro-duces a side effect that systematicallyundermines the ability to develop afundamental solution or capability.
Success to the Successful
The “Success to the Successful” archetype states that if one person orgroup (A) is given more resources than another equally capable group (B),A has a higher likelihood of succeeding. The archetype hypothesizes thatA’s initial success justifies devoting more resources to A, further wideningthe performance gap between the two groups over time.
Side-effectProblemSymptom
B1
B2
s
s
o
SymptomaticSolution
FundamentalSolution
Delay
s
o
o R3
Tragedy of the Commons
The “Tragedy of the Com-mons” archetype identifiesthe causal connectionsbetween individual actionsand the collective results (ina closed system). It hypothe-sizes that if the total usage ofa common resource becomestoo great for the system tosupport, the commons willbecome overloaded ordepleted, and everyone willexperience diminishingbenefits.
Dela
y
o
Net Gainsfor B
B’s Activity
Net Gainsfor A
A’s Activity
TotalActivity
Gain perIndividual Activity
ResourceLimit
R1
R2
B3
B4
s
s
s
s
s
s
s
s
s


Systems thinking can serve as a language for communicating about com-plexity and interdependencies. To be fully conversant in any language,you must gain some mastery of the vocabulary, especially the phrases andidioms unique to that language. This glossary lists many terms that maycome in handy when you’re faced with a systems problem.
Accumulator Anything that builds up or dwindles; for example, waterin a bathtub, savings in a bank account, inventory in a warehouse. Inmodeling software, a stock is often used as a generic symbol for accu-mulators. Also known as Stock or Level.
Balancing Process/Loop Combined with reinforcing loops, balancingprocesses form the building blocks of dynamic systems. Balancingprocesses seek equilibrium: They try to bring things to a desired stateand keep them there. They also limit and constrain change generatedby reinforcing processes. A balancing loop in a causal loop diagramdepicts a balancing process.
Balancing Process with Delay A commonly occurring structure. Whena balancing process has a long delay, the usual response is to overcor-rect. Overcorrection leads to wild swings in behavior. Example: realestate cycles.
Behavior Over Time (BOT) Diagram One of the tools of systems think-ing. BOT diagrams capture the history or trend of one or more vari-ables over time. By sketching several variables on one graph, you cangain an explicit understanding of how they interact over time. Alsocalled Reference Mode.
Causal Loop Diagram (CLD) One of the tools of systems thinking.Causal loop diagrams capture how variables in a system are interre-lated. A CLD takes the form of a closed loop that depicts cause-and-effect linkages.
Drifting Goals A systems archetype. In a “Drifting Goals” scenario, agradual downward slide in performance goals goes unnoticed, threat-ening the long-term future of the system or organization. Example:lengthening delivery delays.
Escalation A systems archetype. In the “Escalation” archetype, two par-ties compete for superiority in an arena. As one party’s actions put itahead, the other party “retaliates” by increasing its actions. The resultis a continual ratcheting up of activity on both sides. Examples: pricebattles, the Cold War.
Feedback The return of information about the status of a process.Example: annual performance reviews return information to anemployee about the quality of his or her work.
127
A P P E N D I X E
A Glossary of Systems Thinking Terms
Fixes That Fail A systems archetype. In a “Fixes That Fail” situation, a fixis applied to a problem and has immediate positive results. However,the fix also has unforeseen long-term consequences that eventuallyworsen the problem. Also known as “Fixes That Backfire.”
Flow The amount of change something undergoes during a particularunit of time. Example: the amount of water that flows out of a bathtubeach minute, or the amount of interest earned in a savings accounteach month. Also called a Rate.
Generic Structures Structures that can be generalized across many differ-ent settings because the underlying relationships are fundamentallythe same. Systems archetypes are a class of generic structures.
Graphical Function Diagram (GFD) One of the tools of systems think-ing. GFDs show how one variable, such as delivery delays, interactswith another, such as sales, by plotting the relationship between thetwo over the entire range of relevant values. The resulting diagram is aconcise hypothesis of how the two variables interrelate. Also calledTable Function.
Growth and Underinvestment A systems archetype. In this situation,resource investments in a growing area are not made, owing to short-term pressures. As growth begins to stall because of lack of resources,there is less incentive for adding capacity, and growth slows evenfurther.
Learning Laboratory One of the tools of systems thinking. A learninglaboratory embeds a management flight simulator in a learning envi-ronment. Groups of managers use a combination of systems thinkingtools to explore the dynamics of a particular system and inquire intotheir own understanding of that system. Learning labs serve as a man-ager’s practice field.
Level See Accumulator.
Leverage Point An area where small change can yield large improve-ments in a system.
Limits to Success A systems archetype. In a “Limits to Success” scenario,a company or product line grows rapidly at first, but eventually beginsto slow or even decline. The reason is that the system has hit somelimit—capacity constraints, resource limits, market saturation, etc.—that is inhibiting further growth. Also called “Limits to Growth.”
Management Flight Simulator (MFS) One of the tools of systems think-ing. Similar to a pilot’s flight simulator, an MFS allows managers to testthe outcome of different policies and decisions without “crashing andburning” real companies. An MFS is based on a system dynamics com-puter model that has been changed into an interactive decision-mak-ing simulator through the use of a user interface.
Policy Structure Diagram One of the tools of systems thinking. Policystructure diagrams are used to create a conceptual “map” of the deci-sion-making process that is embedded in an organization. It highlightsthe factors that are weighed at each decision point.
128 APPENDIX E � A Glossary of Systems Thinking Terms
Rate See Flow.
Reference Mode See Behavior Over Time Diagram.
Reinforcing Process/Loop Along with balancing loops, reinforcing loopsform the building blocks of dynamic systems. Reinforcing processescompound change in one direction with even more change in thatsame direction. As such, they generate both growth and collapse. Areinforcing loop in a causal loop diagram depicts a reinforcing process.Also known as vicious cycles or virtuous cycles.
Shifting the Burden A systems archetype. In a “Shifting the Burden” sit-uation, a short-term solution is tried that successfully solves an ongo-ing problem. As the solution is used over and over again, it takes atten-tion away from more fundamental, enduring solutions. Over time, theability to apply a fundamental solution may decrease, resulting inmore and more reliance on the symptomatic solution. Examples: drugand alcohol dependency.
Shifting the Burden to the Intervener A special case of the “Shiftingthe Burden” systems archetype that occurs when an intervener isbrought in to help solve an ongoing problem. Over time, as the inter-vener successfully handles the problem, the people within the systembecome less capable of solving the problem themselves. They becomeeven more dependent on the intervener. Example: ongoing use of out-side consultants.
Simulation Model One of the tools of systems thinking. A computermodel that lets you map the relationships that are important to a prob-lem or an issue and then simulate the interaction of those variablesover time.
Stock See Accumulator.
Structural Diagram Draws out the accumulators and flows in a system,giving an overview of the major structural elements that produce thesystem’s behavior. Also called flow diagram or accumulator/flowdiagram.
Structure-Behavior Pair One of the tools of systems thinking. A struc-ture-behavior pair consists of a structural representation of a businessissue, using accumulators and flows, and the corresponding behaviorover time (BOT) diagram for the issue being studied.
Structure The manner in which a system’s elements are organized orinterrelated. The structure of an organization, for example, couldinclude not only the organizational chart but also incentive systems,information flows, and interpersonal interactions.
Success to the Successful A systems archetype. In a “Success to the Suc-cessful” situation, two activities compete for a common but limitedresource. The activity that is initially more successful is consistentlygiven more resources, allowing it to succeed even more. At the sametime, the activity that is initially less successful becomes starved forresources and eventually dies out. Example: the QWERTY layout oftypewriter keyboards.
APPENDIX E � A Glossary of Systems Thinking Terms 129
System Dynamics A field of study that includes a methodology forconstructing computer simulation models to achieve better under-standing of social and corporate systems. It draws on organizationalstudies, behavioral decision theory, and engineering to provide atheoretical and empirical base for structuring the relationships incomplex systems.
System A group of interacting, interrelated, or interdependent elementsforming a complex whole. Almost always defined with respect to a spe-cific purpose within a larger system. Example: An R&D department is asystem that has a purpose in the context of the larger organization.
Systems Archetypes One of the tools of systems thinking. Systems arche-types are the “classic stories” in systems thinking—common patternsand structures that occur repeatedly in different settings.
Systems Thinking A school of thought that focuses on recognizing theinterconnections between the parts of a system and synthesizing theminto a unified view of the whole.
Table Function See Graphical Function Diagram.
Template A tool used to identify systems archetypes. To use a template,you fill in the blank variables in causal loop diagrams.
Tragedy of the Commons A systems archetype. In a “Tragedy of theCommons” scenario, a shared resource becomes overburdened as eachperson in the system uses more and more of the resource for individualgain. Eventually, the resource dwindles or is wiped out, resulting inlower gains for everyone involved. Example: the Greenhouse Effect.
The above glossary is a compilation of definitions from many sources, including:• Innovation Associates’ and GKA’s Introduction to Systems Thinking coursebooks• The Fifth Discipline: The Art and Practice of the Learning Organization, by Peter Senge• High Performance Systems’ Academic User’s Guide to STELLA• The American Heritage Dictionary and The Random House Dictionary.
130 APPENDIX E � A Glossary of Systems Thinking Terms

Newsletters
The Systems Thinker® (Pegasus Communications)
Leverage Points® for a New Workplace, New World
WorkbooksSystems Archetypes Basics: From Story to Structure, Daniel H. Kim and Virginia
Anderson (Pegasus Communications, 1998)
BooksThe Fifth Discipline: The Art and Practice of the Learning Organization, Peter M. Senge
(Doubleday, 1990)
The Fifth Discipline Fieldbook, Peter Senge et al. (Doubleday, 1994)
The Dance of Change: The Challenges of Sustaining Momentum in LearningOrganizations, Peter Senge et al. (Doubleday, 1999)
The Systems Thinking Playbook, Linda Booth Sweeney and Dennis Meadows(The Turning Point Foundation, 1996)
The Tip of the Iceberg: Managing the Hidden Forces That Can Make or Break YourOrganization, by David Hutchens (Pegasus Communications, 2001)
When a Butterfly Sneezes: A Guide for Helping Kids Explore Interconnections inOur World Through Favorite Stories, Linda Booth Sweeney (PegasusCommunications, 2001)
Billibonk & the Thorn Patch, Philip Ramsey (Pegasus Communications, 1997)
Frankl’s “Thorn Patch” Fieldbook, Philip Ramsey (Pegasus Communications, 1998)
Billibonk & the Big Itch, Philip Ramsey (Pegasus Communications, 1998)
Frankl’s “Big Itch” Fieldbook, Philip Ramsey (Pegasus Communications, 1999)
Modeling for Learning Organizations, John D. W. Morecroft and John Sterman(Productivity Press, 1994)
Introduction to System Dynamics Modeling with DYNAMO, George P. Richardson andAlexander L. Pugh III (Productivity Press, 1981)
Introduction to Computer Simulation: A System Dynamics Modeling Approach, NancyRoberts et al. (Productivity Press, 1983)
Short VolumesIntroduction to Systems Thinking, Daniel H. Kim (Pegasus Communications, 1999)
Systems Archetypes I: Diagnosing Systemic Issues and Designing High-LeverageInterventions, Daniel H. Kim (Pegasus Communications, 1992)
131
A P P E N D I X F
Additional Resources

Systems Archetypes II: Using Systems Archetypes to Take Effective Action, Daniel H. Kim(Pegasus Communications, 1994)
Systems Archetypes III: Understanding Patterns of Behavior and Delay, Daniel H. Kim(Pegasus Communications, 2000)
Systems Thinking Tools: A User’s Reference Guide, Daniel H. Kim (PegasusCommunications, 1994)
Applying Systems Archetypes, Daniel H. Kim and Colleen Lannon (PegasusCommunications, 1996)
Designing a Systems Thinking Intervention: A Strategy for Leveraging Change, MichaelGoodman et al. (Pegasus Communications, 1997)
The “Thinking” in Systems Thinking: Seven Essential Skills, Barry Richmond (PegasusCommunications, 2000)
From Mechanistic to Social Systemic Thinking: A Digest of a Talk by Russell L. Ackoff,Lauren Johnson (Pegasus Communications, 1996)
Toward Learning Organizations: Integrating Total Quality Control and Systems Thinking,Daniel H. Kim (Pegasus Communications, 1997)
The Tale of Windfall Abbey, Margaret Welbank (BP Exploration Operating CompanyLimited, 1992)
Laminated Reference GuidesSystems Archetypes at a Glance (Pegasus Communications)
A Pocket Guide to Using the Archetypes (Pegasus Communications)
Guidelines for Drawing Causal Loop Diagrams (Pegasus Communications)
Audiotapes and VideotapesFrom Mechanistic to Social Systemic Thinking, Russell L. Ackoff (Pegasus
Communications, 1993)
Designing Corporations for Success in the 21st Century, Jay Forrester (PegasusCommunications, 1995)
System Dynamics: The Foundation of the Learning Organization, John Sterman(Pegasus Communications, 1994)
Introduction to Systems Thinking: An Approach to Organizational Learning, DavidKreutzer (Pegasus Communications, 1995) Audiotape only.
Simulation Softwareithink®, isee systems, Hanover, NH
STELLA®, isee systems, Hanover, NH
Vensim®, Ventana Systems, Inc., Belmont, MA
Powersim®, Powersim Corp., Herndon, VA
132 APPENDIX F � Additional Resources

PEGASUS COMMUNICATIONS, INC. is dedicated to providing resourcesthat help people explore, understand, articulate, and address the challenges theyface in managing the complexities of a changing world. Since 1989, Pegasus hasworked to build a community of organizational learning practitioners throughThe Systems Thinker®, Leverage Points® for a New Workplace, New World newsletters,books, audios and videos, and its annual Systems Thinking in Action® Conference,webinars and other events. For additional copies or other information contact:
PEGASUS COMMUNICATIONS, INC.
319 Littleton Road, Suite 103
Westford, MA 01886 USA
Phone: (781) 398-9700
Fax: (781) 894-7175
E-mail: [email protected]
Web Site: www.pegasuscom.com