system analysis and design safaa s.y. dalloul. data flow diagrams
TRANSCRIPT

SYSTE
M ANALY
SIS A
ND
DESIGN
SA
F AA
S. Y
. D
AL L O
UL

DATA FLOW DIAGRAMS

UNIT 6: DATA FLOW DIAGRAMS
Creating Data Flow Diagrams
Introduction Data Flow Diagrams (DFD)
Reading Data Flow Diagrams
Elements of Data Flow Diagrams
Using DFD to Define Business Process
Process Descriptions
Creating Data Flow Diagrams Context Diagram Level 0 Diagram Level 1 Diagram (and
Below) Validating Data Flow
Diagrams
CREATING DATA FLOW DIAGRAMS
Process model describes business process-the activities
that people do. Process models are developed for the as-
is system and/or the to-be system.
Data flow diagramming, one of the most commonly used
process modeling techniques.

INTRODUCTION
Process model
A formal way of representing how a business system operates.
Illustrates/Explain the activities that are performed and how data moves
among them.
Data flow diagramming
A common technique for creating process models

INTRODUCTION
Logical process models describe processes without suggesting how they are conducted
Physical process models provide information that is needed to build the system

ELEMENTS OF DFD
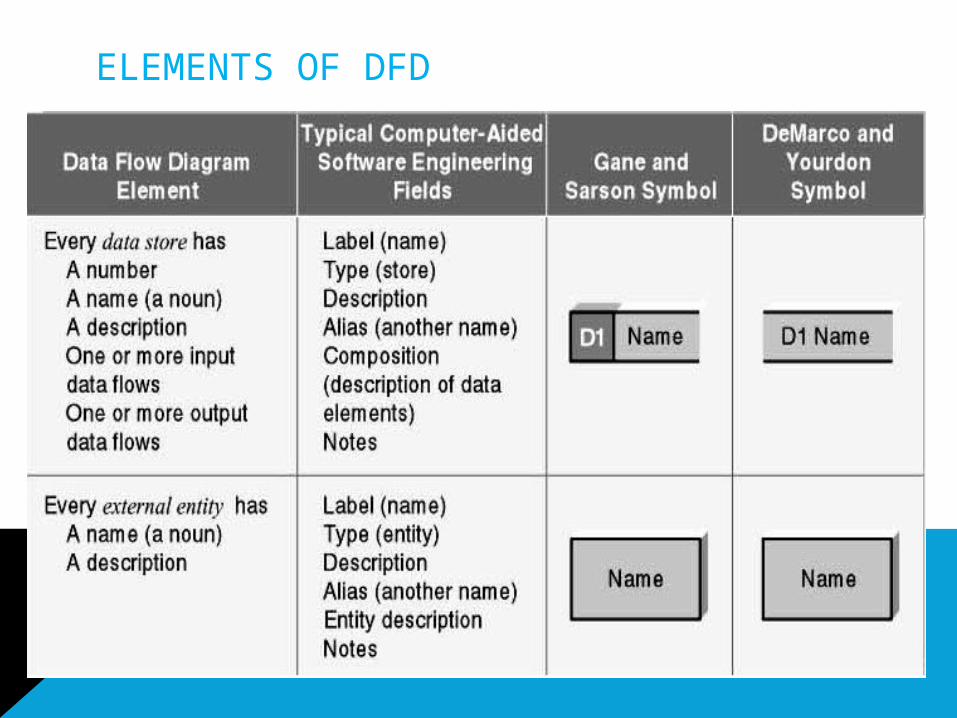
ELEMENTS OF DFD

USING DFD TO DEFINE BUSINESS PROCESS Business processes are too complex to be shown on a
single DFD.
Decomposition is the process of representing the system in a hierarchy of DFD diagrams.
Child diagrams show a portion of the parent diagram in greater detail.
Balancing involves insuring that information presented at one level of a DFD is accurately represented in the next level DFD.

USIN
G D
FD T
O D
EFI
NE B
USIN
ES
S
PR
OC
ESS

PROCESS DESCRIPTIONS
Text-based process descriptions provide more information about the process than the DFD alone.
If the logic underlying the process is quite complex, more detail may be needed in the form of
Structured English
Decision trees
Decision tables

CREATING DATA FLOW DIAGRAMS

CONTEXT DIAGRAMS
The first DFD in every business process model.
Context Diagram shows the entire system as context with it's environment.
All process models have only one context diagram.
Context diagram shows overall process as just one process.
Context Diagram shows data flows with external entities or/and any other systems in the organization.

CONTEXT DIAGRAMS

CONTEXT DIAGRAMS
In a Patient Information system in a hospital, the system will interact with three entities (Patient, Insurance company, and doctors).
CONTEXT DIAGRAMS
There are many data exchanging between the system and the patient, such as:
Collect patient information (i.e. name, phone and
address …).
Receive an appointment request from the patient.
Receive payment information from the patient
Deliver appointments schedule to the patient
Deliver bills details to the patients

CONTEXT DIAGRAMS
And there are only two data flows with Insurance company:
Sending bills to the company
And receiving Payment information

CONTEXT DIAGRAMS
And finally the system will produce the following reports to doctors:
Appointment report
Patient report
Financial reports

QUESTION
Draw the context diagram for student information system
LEVEL 0 DIAGRAM
Once you have the set of DFD fragments (One for each use case) you simply combine them into one DFD drawing that becomes Level 0 DFD.
In this DFD you'll add data stores.
Level 0 diagrams show the major process within the system, and major process within external entities, which are the sources or destination of data flows.

LEVEL 0 DIAGRAM
Try to put the first chronologically process to the left top corner, and then draw the diagram bottom right ways.
Reduce the number of crosses as few as possible.
Iteration is the cornerstone of good DFD design, the first time draw DFD to understand the system.
Second iteration; draw it for better understanding and to reduce number of crosses. And so on.

LEVEL 0 DIAGRAM
On Doctors office system, we have four different use cases in level 1, make appointment, maintain patient info, perform billing, and prepare management reports.
So you ( as analysts) have a choice to draw them all in one diagram (witch is preferred) or to divide them into four different diagrams.
The following is a cut of the level 0 diagram
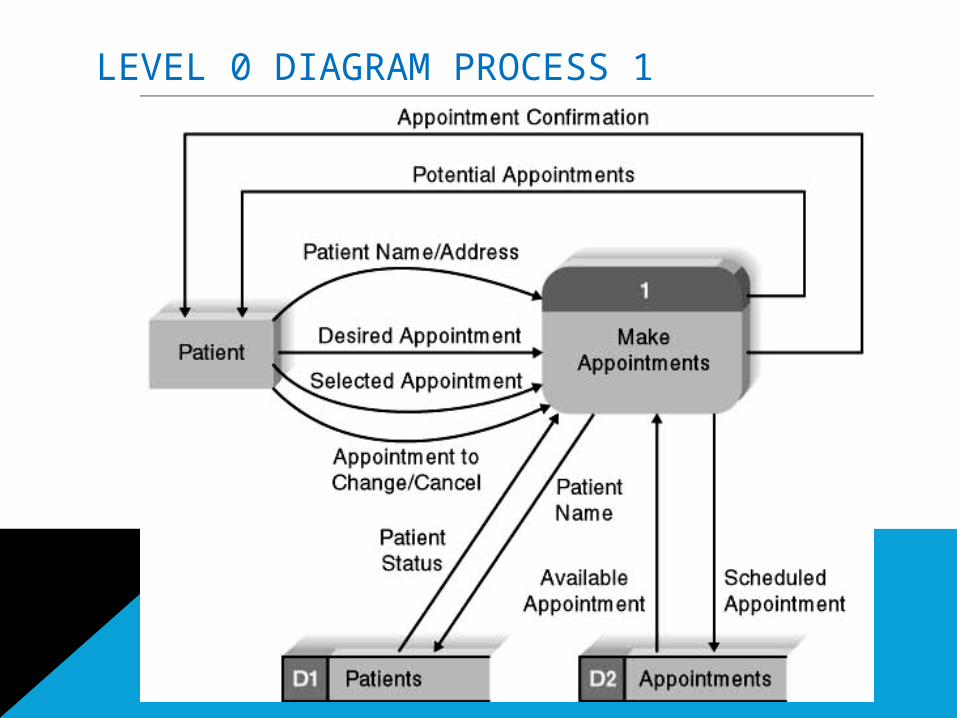
LEVEL 0 DIAGRAM PROCESS 1

LEVEL 0 DIAGRAM PROCESS 2

LEVEL 0 DIAGRAM PROCESS 3
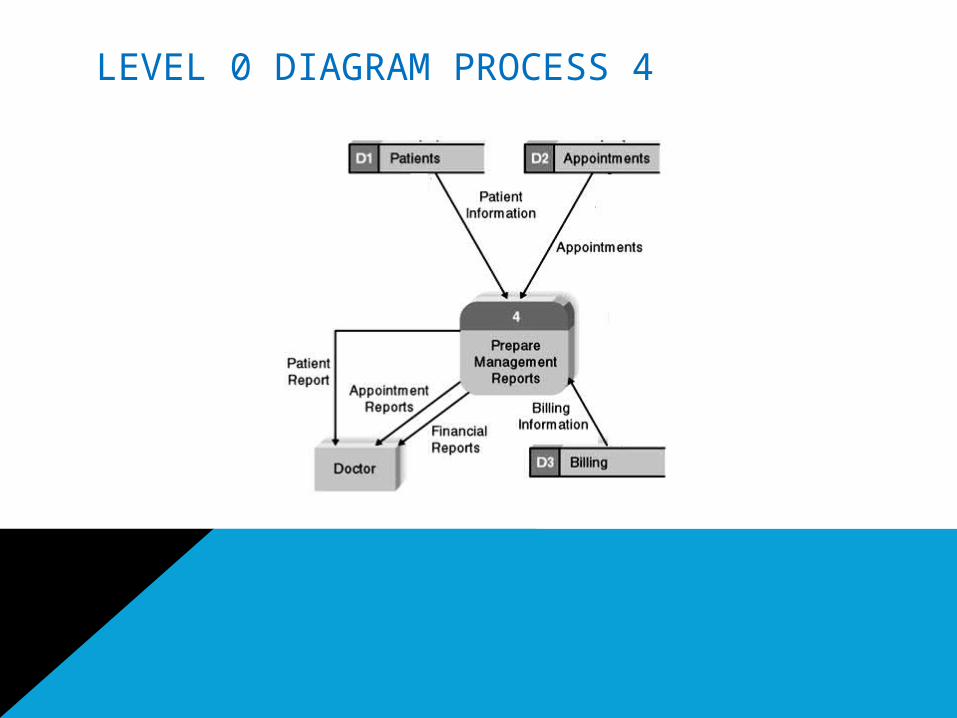
LEVEL 0 DIAGRAM PROCESS 4

LEVEL 0 DIAGRAM “EXPLAIN”
Patient provides his/here information (Name, and Address).
Process 1 checks patient's state in Patients Data Store, to update or insert …
Patient requests an appointment in a suitable time for him/her.
The process checks availability of these times by querying Appointments Data Store.

LEVEL 0 DIAGRAM “EXPLAIN”
Then Process 1 provides the patient with a potential appointments
So the patient will select the most suitable appointment.
And the Process finally updates Appointments Data Store to assign the selected appointment.
And finally informs the patient with this/here selection to be confirmed.

LEVEL
0 D
IAG
RAM
EXAM
PLE

LEVEL 1 DIAGRAM
Generally, one level 1 diagram is created for every major process on the level 0 diagram.
Shows all the internal processes that comprise a single process on the level 0 diagram.
The process for creating the level 1 DFDs is to take the steps as written on the use cases and convert them into a DFD in much the same way as for the level 0.

LEVEL 1 DIAGRAM
Shows how information moves from and to each of these processes
If a parent process is decomposed into, for example, three child processes, these three child processes wholly and completely make up the parent process

Level 1 Diagram Example

Reading Data Flow Diagrams

TO EXPLAIN THE CHART
This chart for a doctor office.
People start reading the diagrams from top-left corner of the DFD.
The item "Patient" is an external entity.
"Patient" entity has four different arrows pointing away from itself, represent bundles of data.

TO EXPLAIN THE CHART
Rounded rectangles such as "Get Patient Name and Address" are actions/process that are performed.
Arrows are data flows, an arrow that pointing to an entity, or pointing to a process represent the inputs for this entity or process.
Arrows that pointing out of the entity/process represent outputs for this entity/process.

VALIDATING DATA FLOW DIAGRAMS

VALIDATING DATA FLOW DIAGRAMS
There are two fundamentally different types of problems that can occur in DFDs, syntax errors and semantic errors.
Syntax Errors: refers to structure of the DFDs and whether the DFDs follow the rules of the language.
Semantic Errors: refers to the meaning of the DFDs and whether they accurately describe the business process being modeled.

FOR EACH DFD:
Check each data flow for:
A unique name: noun; description
Connects to at least one process
Shown in only one direction (no two-headed arrows)
A minimum number of crossed lines

FOR EACH DFD:
Check each data store for:
A unique name: noun; description
At least one input data flow
At least one output data flow

FOR EACH DFD:
Check each external entity for:
A unique name: noun; description
At least one input or output data flow

ACROSS DFDS:
Context Diagram:
Every set of DFDs must have one Context Diagram
Viewpoint:
There is a consistent viewpoint for the entire set of
DFDs

ACROSS DFDS:
Decomposition:
Every process is wholly and complete described by the
processes on its children DFDs
Balance:
Every data flow, data store, and external entity on a
higher level DFD is shown on the lower level DFD that decomposes it No data stores or data flows appear on lower-lever DFDs that do not appear on their parent DFD.

SUMMARIZE THE LECTURE
DFD DFD Elements DFD Levels
Context DiagramLevel 0Level 1Level 2
Validating DFD

SAFAA S
.Y. D
ALLOUL
SA
F AA
DA
L L OU
L . WO
RD
PR
ES
S. C
OM
Tha
nk
You