synthon polymorphs of sulfacetamide−acetamide cocrystal ... · university po, hyderabad 500 046,...
TRANSCRIPT

S1
Synthon polymorphs of sulfacetamide−acetamide cocrystal based on
N−H···O=S and N−H···O=C hydrogen bonding†
N. Rajesh Goud, and Ashwini Nangia*
School of Chemistry, University of Hyderabad, Prof. C.R. Rao Road, Gachibowli, Central
University PO, Hyderabad 500 046, India. E-mail: [email protected]
Electronic Supplementary Information†
Table S1 List of polymorphic molecules with the SO2-NH-CO fragment in Organic crystal
structures retrieved from the Cambridge Structural Database (CSD, ver. 5.34, Conquest 1.15,
November 2012 release).
Chlorpropamide, BEDMIG
5 polymorphs
Glimepiride, TOHBUN
2 polymorphs
Torasemide, TORSEM
3 polymorphs
Carbamazepine-Saccharin, UNEZAO
2 polymorphs
Electronic Supplementary Material (ESI) for CrystEngCommThis journal is © The Royal Society of Chemistry 2013

S2
Ethenzamide-Saccharin, VUHFIO
2 polymorphs
Tolbutamide, ZZZPUS
6 polymorphs
Table S2 Hydrogen bond synthon patterns (rings, chains, etc.) in polymorphic compounds with
the SO2NHCO functional group (listed in Table S1).
Chlorpropamide – 5 polymorphs
P21
Urea tape-motif, with one of the hydrogen atom
in the tape bifurcating to form N–H···O=S H-
bond
Pbcn
Catemeric N–H···O=C H-bond
Electronic Supplementary Material (ESI) for CrystEngCommThis journal is © The Royal Society of Chemistry 2013

S3
Pbca
Two point synthon comprised of N–H···O=C
and N–H···O=S H-bonds
Pna21
Synthon similar to P21 structure
P212121
Synthon similar to P21 structure
Glimepiride – 2 polymorphs
Electronic Supplementary Material (ESI) for CrystEngCommThis journal is © The Royal Society of Chemistry 2013

S4
Pbca
Urea-tape motif
P21/n
Carboxamide dimer
Torasemide – 3 polymorphs
P21/c
Carboxamide dimer and catemer
P2/n
N–H···O=S dimer ring motif
Electronic Supplementary Material (ESI) for CrystEngCommThis journal is © The Royal Society of Chemistry 2013

S5
P21/c
Zwitterionic polymorph N–H···O=S dimer type
along with bifurcated N–H···C=O and N–
H···S=O H-bonds
Tolbutamide – 3 polymorphs
P21/n
Cyclic synthon of N–H···O=C and N–H···O=S
H-bonds
P21/c
Cyclic motif of N–H···O=C and N–H···O=S
H-bonds
Electronic Supplementary Material (ESI) for CrystEngCommThis journal is © The Royal Society of Chemistry 2013
S6
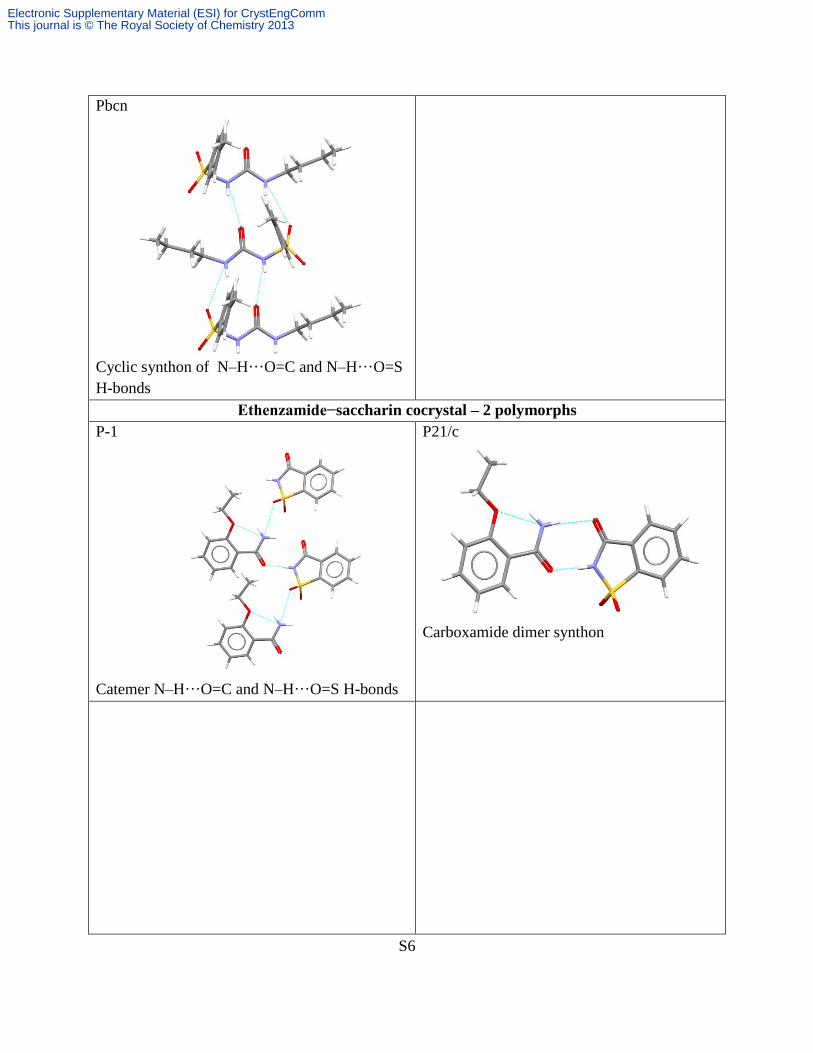
Pbcn
Cyclic synthon of N–H···O=C and N–H···O=S
H-bonds
Ethenzamide−saccharin cocrystal – 2 polymorphs
P-1
Catemer N–H···O=C and N–H···O=S H-bonds
P21/c
Carboxamide dimer synthon
Electronic Supplementary Material (ESI) for CrystEngCommThis journal is © The Royal Society of Chemistry 2013

S7
Carbamazepine−saccharin cocrystal
P-1
Carboxamide homodimer along with N–
H···O=S H-bond with saccharin
P21/c
N–H···O=S and N–H···O=C heterodimer
Table S3 CSD Refcodes of neutral polymorphic cocrystals retrieved from the last full release of
the CSD, ver. 5.34, Conquest 1.15, November 2012 release).
Entry Cocrystal Polymorph REFCODEs
1
ABEKUN
ABEKUN01
ABEKUN02
2
ABUNIU
ABUNIU01
3
ACOYOG
ACOYOG01
Electronic Supplementary Material (ESI) for CrystEngCommThis journal is © The Royal Society of Chemistry 2013

S8
4
AJAJEA
AJAJEA01
5
ANTCYB,
ANTCYB12
ANTCYB11
ANTCYB13
ANTCYB14
ANTCYB15
ANTCYB16
6
ANUMEC
ANUMEC01
7
BIVSIJ01
BIVSIJ02
8
CAZLAR,
CAZLAR01
CAZLAR02
9
COHWIF,
COHWIF02,
COHWIF03
COHWIF01
10
DOKGUG
DOKGUG01
Electronic Supplementary Material (ESI) for CrystEngCommThis journal is © The Royal Society of Chemistry 2013
S9
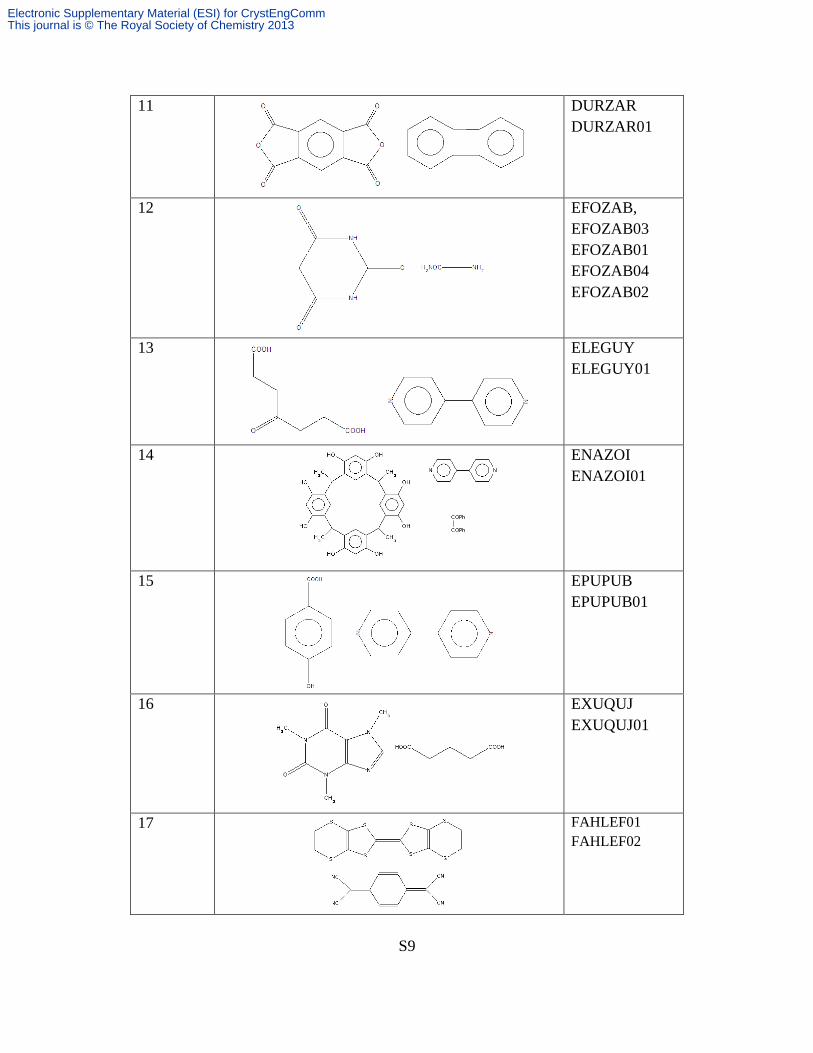
11
DURZAR
DURZAR01
12
EFOZAB,
EFOZAB03
EFOZAB01
EFOZAB04
EFOZAB02
13
ELEGUY
ELEGUY01
14
ENAZOI
ENAZOI01
15
EPUPUB
EPUPUB01
16
EXUQUJ
EXUQUJ01
17
FAHLEF01
FAHLEF02
Electronic Supplementary Material (ESI) for CrystEngCommThis journal is © The Royal Society of Chemistry 2013

S10
18
FIHYEA
FIHYEA02
19
HADKUT
HADKUT01
20
IJETOG
IJETOG02
21
IJIBEJ
IJIBEJ01
22
KIBQOC
KIBQOC01
23
KIHYOQ
KIHYOQ01
24
LOCVOO
LOCVOO01
Electronic Supplementary Material (ESI) for CrystEngCommThis journal is © The Royal Society of Chemistry 2013

S11
25
LOFKIB
LOFKIB01
26
MIYKOU
MIYKOU01
27
MOXVIF
MOXVIF01
28
MUROXA
MUROXA01
29
NAPYMA
NAPYMA01
30
NARSOP
NARSOP01
NARSOP02
31
NITRIR
NITRIR01
Electronic Supplementary Material (ESI) for CrystEngCommThis journal is © The Royal Society of Chemistry 2013

S12
32
NOVSIA
NOVSIA01
33
NUGZEV
NUGZEV01
34
NUKWEW
NUKWEW01
35
NUKXEX
NUKXEX01
36
ODOBIT
ODOBIT01
37
PTZTCQ
PTZTCQ01
38
QUIDON
QUIDON01
QUIDON02
Electronic Supplementary Material (ESI) for CrystEngCommThis journal is © The Royal Society of Chemistry 2013

S13
39
QULLUF
QULLUF01
QULLUF02
40
RIFQAY
RIFQAY01
41
RIWWEA
RIWWEA01
42
RURROM
RURROM01
43
SAYMUB
SAYMUB01
44
TAMBUE
TAMBUE01
45
TECCAF01
TECCAF02
Electronic Supplementary Material (ESI) for CrystEngCommThis journal is © The Royal Society of Chemistry 2013

S14
46
TEHNAW
TEHNAW01
47
TIPWIY
TIPWIY01
48
TONDUV
TONDUV02
49
TUPRBN01
TUPRBN10
50
ULAWAF
ULAWAF01
ULAWAF02
51
UNEZAO
UNEZAO01
52
VAKTOS
VAKTOS01
Electronic Supplementary Material (ESI) for CrystEngCommThis journal is © The Royal Society of Chemistry 2013

S15
53
VEJXAJ
VEJXAJ01
54
VUHFIO
VUHFIO01
55
VUJSOJ
VUJSOJ01
56
WANNUV
WANNUV01
57
WATREP,
WATREP01
WATREP04
WATREP02
WATREP03
58
WOBQEK
WOBQEK01
59
WOTZAG
WOTZAG01
Electronic Supplementary Material (ESI) for CrystEngCommThis journal is © The Royal Society of Chemistry 2013

S16
60
WUZHOP
WUZHOP01
61
XETZIG
XETZIG01
62
XOLHUC
XOLHUC01
XOLHUC02
63
YABHAM
YABHAM01
64
ZODWIY
ZODWIY01
65
ZZZGMW01
ZZZGMW02
66
EWAPAU
EWAPAU01
Electronic Supplementary Material (ESI) for CrystEngCommThis journal is © The Royal Society of Chemistry 2013

S17
67
EXAPID
EXAPID01
68
UBUJIM
UBUJIM01
69
PANQUS
PANQUS01
70
AWIHOE02
AWIHOE03
AWIHOE04
AWIHOE05
AWIHOE06
AWIHOE07
AWIHOE08
AWIHOE09
AWIHOE10
71
YASGOQ
YASGOQ01
YASGOQ02
YASGOQ03
72
N
N
CH3
HOOC
COOH
WOQBAF
WOQBAF01
Electronic Supplementary Material (ESI) for CrystEngCommThis journal is © The Royal Society of Chemistry 2013

S18
Fig. S1 Overlay of SACT and ACT molecules in cocrystal form 1 (blue) and 2 (magenta).
Electronic Supplementary Material (ESI) for CrystEngCommThis journal is © The Royal Society of Chemistry 2013

S19
Fig. S2 Comparison of PXRD patterns of the samples obtained in the grinding experiments of
1:1 mixture of SACT and ACT. Solvent used in grinding experiments is indicated on the right.
The resulting powder pattern did not follow any trend based on the polarity of solvent used.
Electronic Supplementary Material (ESI) for CrystEngCommThis journal is © The Royal Society of Chemistry 2013

S20
Table S4 ss-NMR 13
C chemical shifts (, ppm) of SACT−ACT cocrystal polymorphs.
Carbon No. SACT-ACT-FORM-1 SACT-ACT-FORM-2
8 20.8 20.3
10 24.4 25.4
2,6 112.9 111.4, 113.2
4 123.1 120.2
5 129.3 127.5
3 134.3 132.7
1 154.6 154.5
9 172.8 173.5
7 175.3 175.8
(a)
(b)
Fig. S3 IR and Raman spectra of SACT-ACT cocrystal polymorphs.
Electronic Supplementary Material (ESI) for CrystEngCommThis journal is © The Royal Society of Chemistry 2013

S21
Fig. S4 Heat-cool-heat DSC heating curve of SACT-ACT Form 2 indicated that the high
temperature phase is form 1.
Eqn. S1 Calculation of melting point of SACT−ACT metastable form 2 (taken from ref. 15).
ΔHfus (form 2) = Enthalpy of fusion of form 2 (Enthalpy of fusion of form 1 + Enthalpy of
Transition) = 32.3 kJ/mol
Tfus (form 1) = Temperature of fusion of form 1 = 106.5°C
Ttrs = Temperature of transition from form 2 to form 1 = 79°C
Electronic Supplementary Material (ESI) for CrystEngCommThis journal is © The Royal Society of Chemistry 2013

S22
ΔHfus (form 1) = Enthalpy of fusion of form 1 = 29.5 kJ/mol
Tfus (form 2) = Temperature of fusion of form 2 (calculated) = 103.4°C
Form 1
Form 2
Fig. S5 HSM snapshots of SACT−ACT cocrystal polymorphs. Significant morphological
changes were observed between 81-83 °C in form 2 whereas form 1 exhibited clean melting
behavior.
Electronic Supplementary Material (ESI) for CrystEngCommThis journal is © The Royal Society of Chemistry 2013
S23
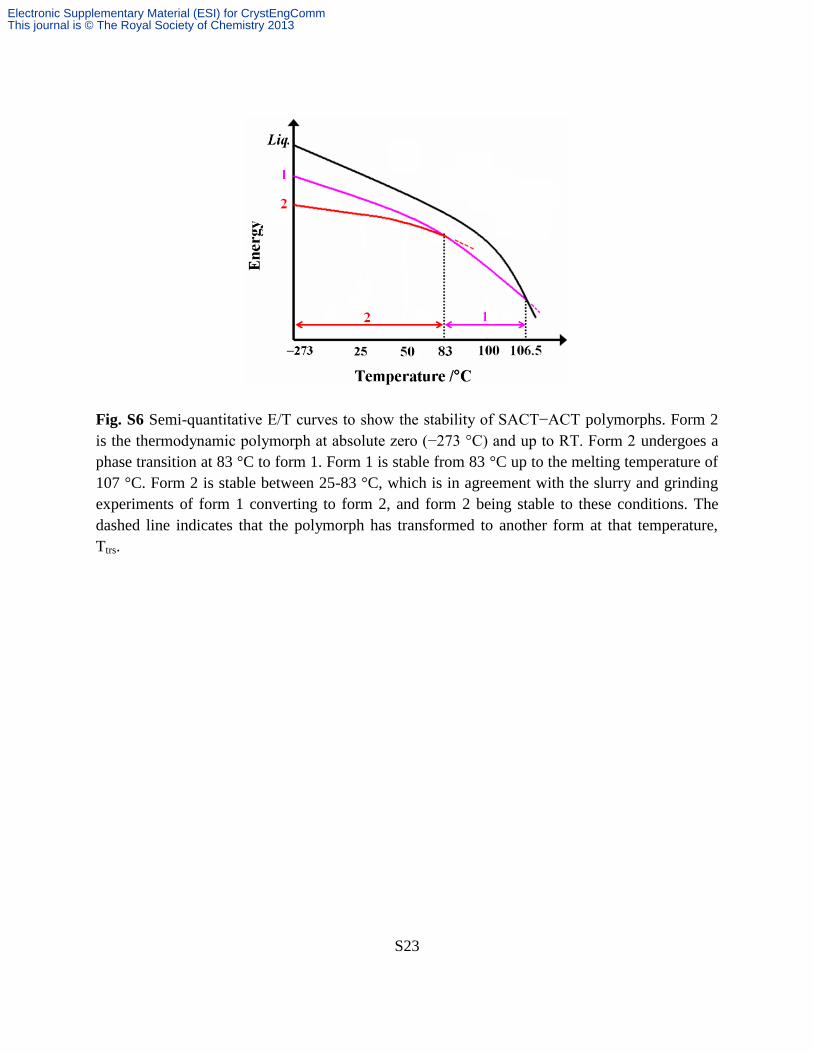
Fig. S6 Semi-quantitative E/T curves to show the stability of SACT−ACT polymorphs. Form 2
is the thermodynamic polymorph at absolute zero (−273 °C) and up to RT. Form 2 undergoes a
phase transition at 83 °C to form 1. Form 1 is stable from 83 °C up to the melting temperature of
107 °C. Form 2 is stable between 25-83 °C, which is in agreement with the slurry and grinding
experiments of form 1 converting to form 2, and form 2 being stable to these conditions. The
dashed line indicates that the polymorph has transformed to another form at that temperature,
Ttrs.
Electronic Supplementary Material (ESI) for CrystEngCommThis journal is © The Royal Society of Chemistry 2013

S24
(a)
(b)
(c)
Fig. S7 (a) Experimental PXRD of SACT−ACT form 1 after neat grinding in ball mill for 30
min matches with that of form 2. There is no change for form 2. (b) Experimental PXRD of a 1:1
mixture of SACT−ACT form 1 and 2 converted to form 2 after neat grinding in ball mill for 10
min. (c) Experimental PXRD of SACT−ACT form 2 did not show any change after neat grinding
in ball mill for 3 h.
Electronic Supplementary Material (ESI) for CrystEngCommThis journal is © The Royal Society of Chemistry 2013

S25
Fig. S8 Melt cooling of SACT–ACT form 1 or form 2 resulted in the crystallization of form 1 in
either case, consistent with the Ostwald’s Law of Stages. Thus melt cooling establishes form 1 as
the kinetic, metastable modification.
Electronic Supplementary Material (ESI) for CrystEngCommThis journal is © The Royal Society of Chemistry 2013

S26
0 50 100 150 200 250
0
100
200
300
400
500
600
700
800
900
1000
Cu
mu
lati
ve
am
ou
nt
dis
solv
ed i
n m
g/c
m2
Time in mins
SACT
SACT-ACT-FORM-1
SACT-ACT-FORM-2
Fig. S9 IDR curves of SACT–ACT polymorphs in pH7 buffer medium.
Table S5 Intrinsic dissolution rates of SACT polymorphs along with their molar extinction
coefficient (), and AUC values. The number of times enhancement of IDR and AUC with
respect to SACT is given in parentheses.
Compound Molar Extinction
coefficient (/mM/cm) Equi. Sol.
(g/L) IDR
(mg/cm2/min)
AUC0-4h
(mg h/L)
SACT 22.8 14.5 2.18 64,763
SACT–
ACT
form 1
17.9 -- 3.4 (x 1.57) 105,679 (x1.63)
SACT–
ACT
form 2
19.9 -- 2.8 (x 1.27) 80,853 (x1.25)
Electronic Supplementary Material (ESI) for CrystEngCommThis journal is © The Royal Society of Chemistry 2013

S27
(a)
(b)
Electronic Supplementary Material (ESI) for CrystEngCommThis journal is © The Royal Society of Chemistry 2013

S28
(c)
Fig. S10 Stability measurement at the end of the solubility experiment (24 h) in the slurry
medium. (a) PXRD of SACT at the end of the equilibrium solubility experiment matches with
the calculated XRD lines of the crystal structure, indicating form stability. (b) PXRD of
SACT−ACT form 1 at the end of the equilibrium solubility experiment matches with the
calculated XRD lines of SACT, indicating dissociation of the cocrystal. (c) PXRD of
SACT−ACT form 2 at the end of the equilibrium solubility experiment (24 h) matches with the
calculated XRD lines of SACT, indicating dissociation of the cocrystal
Electronic Supplementary Material (ESI) for CrystEngCommThis journal is © The Royal Society of Chemistry 2013

S29
(a)
(b)
Fig. S11 PXRD plots of SACT and its cocrystal polymorphs at the end of the dissolution
experiment (4 h). (a) PXRD of SACT−ACT form 1 at the end of the dissolution experiment (4 h)
matches with the calculated XRD lines of SACT, indicating dissociation of the cocrystal. (b)
PXRD of SACT−ACT form 2 at the end of dissolution experiment (4 h) matches with the
calculated XRD lines of SACT, indicating dissociation of the cocrystal.
Electronic Supplementary Material (ESI) for CrystEngCommThis journal is © The Royal Society of Chemistry 2013

S30
Experimental Section
Phase transformation experiments
Grinding experiments were done on 100 mg scale. Competitive grinding experiments were
carried out on 1:1 stoichiometric ratio of the polymorphs (100 mg each). A Retsch mixer-mill
equipped with a 5 mL stainless steel grinding jar and SS balls of 4 mm diameter was used for
mechanical grinding. Slurry experiments were also done on 100 mg scale. Competitive slurry
experiments were carried out on 1:1 stoichiometric ratio of the polymorphs (100 mg each).
Toluene (5 mL in each experiment) was used as solvent in slurry experiments.
Single crystal X-ray diffraction
Crystal structures of the polymorphs were collected on CrysAlisPro, Oxford Diffraction Ltd.,
Version 1.171.33.55 with SCALE3 ABSPACK absorption correction, Xcalibur, EOS, Gemini
measurement device and Mo-Kα (λ = 0.71073 Å) radiation.1 Data reduction and structure
refinement was performed using OLEX2 software.2 Non-hydrogen atoms were refined
anisotropically. C–H hydrogen atoms were positioned geometrically and refined in the riding
model approximation. The methyl group in the ACT molecule has relatively large ADPs due to
libration of H atoms. Attempts to split the electron density over two locations gave negative s.o.f.
for the second C position, and so the process was abandoned. A check of the final CIF file using
PLATON3 did not show any missed symmetry. Hydrogen bond distances shown in Table 2 are
neutron normalized to fix the D–H distance to its accurate neutron value in the X-ray crystal
structures (O–H 0.983 Å, N–H 1.009 Å, and C–H 1.083 Å). After the final refinement, structure
analysis and preparation of art works were carried out using MERCURY and X-SEED
4 software.
Vibrational spectroscopy
Thermo-Nicolet 6700 Fourier transform infrared spectrophotometer with NXR-Fourier transform
Raman module (Thermo Scientific, Waltham, Massachusetts) was used to record IR and Raman
spectra. IR was recorded on samples dispersed in KBr pellets. Raman spectra were recorded on
samples contained in standard NMR diameter tubes or on compressed samples contained in a
gold-coated sample holder. Data were analyzed using the Omnic software (Thermo Scientific,
Waltham, Massachusetts).
Thermal analysis
Differential scanning calorimetry was performed on a Mettler-Toledo DSC 822e module
(Mettler-Toledo, Columbus, Ohio). Samples were placed in crimped but vented aluminum pans
for these experiments. The typical sample size is 3−5mg for the experiment. The temperature
range for the heating curve was 30−150 °C and the sample was heated at a rate of 10°C/min.
Samples were purged in a stream of dry nitrogen flowing at 80 mL/ min. Melting point of SACT-
ACT form 2 was determined by heating the sample from 30−150 °C at a heating rate of 125
°C/min.
Powder X-ray diffraction
Electronic Supplementary Material (ESI) for CrystEngCommThis journal is © The Royal Society of Chemistry 2013

S31
Powder X-ray diffraction of the polymorphs were recorded on Bruker D8 Focus diffractometer
(Bruker-AXS, Karlsruhe, Germany) using Cu-Kα X-radiation (λ = 1.5406 Å) at 40 kV and 30
mA power. X-ray diffraction patterns were collected over the 2θ range 5–50° at a scan rate of 1º
/min. Powder Cell 2.4 (Federal Institute of Materials Research and Testing, Berlin, Germany)
5
was used for Rietveld refinement of experimental PXRD and calculated lines from the X-ray
crystal structure. VT-PXRD was performed on the same instrument equipped with a variable
temperature stage -TTK450 module. PXRD patterns for both the forms were collected at 30, 60,
80, 86 and 92 ºC. All the powder patterns were plotted using Origin 7.0 software.
Hot stage microscopy
HSM was performed on a Wagner & Munz PolythermA Hot Stage and Heiztisch microscope. A
Moticam 1000 (1.3 MP) camera supported by software Motic Image Plus 2.0ML is used to
record images.
Solid-state NMR spectroscopy
Solid-state 13
C NMR spectra were recorded on Bruker Avance 400 MHz spectrometer (Bruker-
Biospin, Karlsruhe, Germany). SS-NMR measurements were carried out on Bruker 4-mm double
resonance CP-MAS probe in zirconia rotors with a Kel-F cap at 5.0-kHz spinning rate with a
cross-polarization contact time of 2.5 ms and a delay of 8 s. 13
C NMR spectra were recorded at
100 MHz and referenced to the methylene carbon of glycine, and then recalibrated to the TMS
scale (δglycine = 43.3 ppm).
Cambridge Structural Database
The CSD (version 5.34, ConQuest 1.15, November 2012 release)6 was searched for cocrystal
polymorphs. The parameters “all polymorphic structures with 3D coordinates determined”, “no
errors”, “no polymeric”, and “no ions” were searched to give 6539 hits. Crystal structures were
visualized with Mercury 2.0, and 72 sets of cocrystal polymorphs were manually retrieved (3D
coordinates reported for all polymorph sets). Crystal structures with any degree of disorder were
excluded. Details of polymorphic cocrystal sets are listed in the Supporting Information, Table
S3.
Dissolution and Solubility measurements
The solubility curves of cocrystal polymorphs were measured using the Higuchi and Connor
method7 in pH 7 buffer medium at 30 °C. First, the absorbance of a known concentration of the
polymorphs was measured at the given λmax (SACT at 256 nm and SACT-ACT form 1 and 2 at
257 nm) in pH 7 buffer medium on Thermo Scientific Evolution 300 UV–vis spectrometer
(Thermo Scientific, Waltham, MA). These absorbance values were plotted against several known
concentrations to prepare the concentration vs. intensity calibration curve. From the slope of the
calibration curves, molar extinction coefficients for the polymorphs were calculated. An excess
amount of the sample was added to 6 mL of pH 7 buffer medium. The supersaturated solution
was stirred at 300 rpm using a magnetic stirrer at 30 °C. After 24 h, the suspension was filtered
through 0.45μ syringe filter. The filtered aliquots were diluted sufficiently, and the absorbance
was measured at the given λmax. IDR experiments were carried out on USP-certified Electrolab
Electronic Supplementary Material (ESI) for CrystEngCommThis journal is © The Royal Society of Chemistry 2013

S32
TDT-08L dissolution tester (Mumbai, India). Dissolution experiments were performed for 4 hrs
in pH 7 buffer medium at 37 °C. Prior to IDR estimation, standard curves for all the compounds
were obtained spectrophotometrically at their respective λmax. The calculated molar extinction
coefficients were used to determine the IDR values. For IDR measurements, 500 mg of the
compound was taken in the intrinsic attachment and compressed to 0.5-cm2 disk using a
hydraulic press 2.5 ton/in2 pressure for 4 min. The intrinsic attachment was placed in a jar of 900
mL medium preheated to 37 °C and rotated at 150 rpm. 5 mL of the aliquot was collected at
specific time intervals, and the concentration of the aliquots was determined with appropriate
dilutions from the predetermined standard curves of the respective compounds. The IDR of the
compound was calculated in the linear region of the dissolution curve (which is the slope of the
curve or amount of drug dissolved/surface area of the disk) per unit time. The identity of the
undissolved material after the dissolution experiment was ascertained by PXRD. The nature of
the solid samples after disk compression and solubility/dissolution measurements were verified
by PXRD.
References
1. CrysAlis CCD and CrysAlis RED, Versions 1.171.33.55, Oxford Diffraction, Oxford,
2008.
2. O. V. Dolomanov, L. J. Bourhis, R. J. Gildea, J. A. K. Howard and H. Puschmann, J.
Appl. Crystallogr., 2009, 42, 339.
3. (a) A. L. Spek, PLATON: A Multipurpose Crystallographic Tool; Utrecht University:
Utrecht, The Netherlands, 2002. (b) A. L. Spek, J. Appl Crystallogr., 2003, 7, 36.
4. (a) L. J. Barbour, Supramol. Chem. 2001, 1, 189; (b) L. J. Barbour, X-Seed, Graphical
Interface to SHELX-97 and POV-Ray; University of Missouri-Columbia: Columbus,
MO, 1999.
5. Powder Cell, a program for structure visualization, powder pattern calculation and profile
fitting. http://www.ccp14.ac.uk/tutorial/powdcell/.
6. Cambridge Structural Database, CSD, version 5.34, ConQuest 1.15, Nov 2013 update.
7. T. Higuchi and K. A. Connors, Adv. Anal. Chem. Instrum., 1965, 4, 117.
Electronic Supplementary Material (ESI) for CrystEngCommThis journal is © The Royal Society of Chemistry 2013