synthesis of pe-based nanoparticles from an original ... · synthesis of pe-based nanoparticles...
TRANSCRIPT
Synthesis of PE-based nanoparticles from an original surfactant-free
emulsion polymerization process of Ethylene using RAFT technique
Ricardo Luís Ferreira da Silva
Thesis to obtain the Master of Science Degree in
Chemical Engineering
Supervisors:
Prof. Dr. Maria do Rosário Gomes Ribeiro
Dr. Frank D’Agosto
Dr. Muriel Lansalot
Dr. Vincent Monteil
Examination Committee
Chairperson: Prof. Dr. Maria Filipa Gomes Ribeiro
Supervisor: Prof. Dr. Maria do Rosário Gomes Ribeiro
Member of the Committee: Prof. Dr. Ana Margarida Sousa Dias Martins
2015

This page was left intentionally in blank.
i
Acknowledgments
Foremost, I would like to express my gratitude to my supervisor Prof. Dr. Maria do Rosário Ribeiro for accepting my internship, all the guidance and support and for examining my Master thesis. Besides my advisor, I would like to thank the rest of my thesis committee, Prof. Dr. Ana Margarida
Sousa Dias Martins for accepting to examine my thesis and Prof. Dr. Maria Filipa Gomes Ribeiro, chairperson of the jury.
I am extremely grateful to Dr. Vincent Monteil, Dr. Frank D’Agosto and Dr. Muriel Lasanlot for accepting me in this research project and providing all the conditions that allowed me to work on it. I would like to thank them for their support, motivation, and fruitful discussions, sharing their immense scientific knowledge. Furthermore, their guidance and patience helped me in all stages of the research project and specially when writing this thesis.
My sincere thanks also goes to all the LCPP team, who kindly supported and provided me knowledge that allowed me to perform the experimental procedures and analyse the data acquired in this project. In particular, I would like to thank to Arthur Zarrouki, Thiago Guimarães, Islem Belaid, Manel Taam, Pierre-Yves Dugas and Ming Koh.
A special thanks to Mathieu Fuentes for his friendship and all the help in this project, to Matthieu Humbert and all the Portuguese co-workers and friends for providing me unforgettable moments during my stay in Lyon.
Lastly, and most important, I would like to thank my family: to my mother, my brother and Catarina for their endless love and support in every moment of my life.

ii
This page was left intentionally in blank.

iii
Abstract Taking advantage of the recently established controlled radical polymerization of ethylene
mediated by xanthates and the expertise of the C2P2 team in the emulsion polymerization of ethylene,
this thesis is a contribution to the study of the synthesis of polyethylene-based nanoparticles by
implementation of reversible addition-fragmentation chain transfer (RAFT) polymerization of ethylene
in the emulsion process from water-soluble functional polymers. The mechanism of particle formation
proceeds without surfactants by polymerization-induced self-assembly of amphiphilic block
copolymers (PISA process).
This project was divided into four sections. The first part of this project consisted in the
synthesis and purification of the macroRAFT (polyethylene glycol end-functionalized with xanthate,
PEG-X) used in the polymerizations mediated by xanthates, which was prepared by post-modification
of an existing polymer. The characterization of the resulting product validated its properties, which
allowed to proceed to the polymerization procedures.
The second section consisted in the acquisition of experimental data to evaluate the effect of
the presence of PEG-X in the ethylene polymerization. Thus, several polymerizations were performed
at 70℃ and 100 bar of ethylene pressure, with and without surfactant, in the presence of either the
macroRAFT agent or its non-functional counterpart (PEG-OH). It was found that indeed the
polymerizations were strongly influenced by the presence of the macroxanthate.
The third part consisted in the study of the influence of the macroRAFT/initiator molar ratio
on the polymerization. This study was carried out at 70℃ and 100 bar maintaining the standard
initiator concentration, varying the quantity of the macroRAFT. It appeared that the ratio strongly
influenced the yield of PE.
The last part involved the kinetic study of the polymerization in the presence of the macroRAFT
agent (at 70℃) and inherently a study on the effect of the pressure on this polymerization given that
this study was performed at two different pressures (100 and 200 bar). The increase in pressure
appeared to affect the stabilization of the obtained latexes, particularly for long polymerization times.
Key words: Polyethylene, free radical emulsion polymerization, RAFT, MADIX, PISA.

iv
This page was left intentionally in blank.
v
Resumo
Tendo por base a polimerização controlada do etileno mediada por xantatos estabelecida
recentemente pela equipa de investigação do C2P2 e beneficiando do vasto conhecimento da equipa
na polimerização em emulsão do etileno, esta tese é uma contribuição para o estudo da síntese de
nano-partículas baseadas em polietileno. A síntese ocorreu através da implementação da técnica de
controlo de polymerização reversible addition-fragmentation chain transfer (RAFT) em emulsão, a
partir de polímeros funcionais solúveis em água. O mecanismo pelo qual as partículas se formam
ocorre sem surfactante pelo processo polymerization-induced self-assembly (PISA), onde se dá a
formação das nanopartículas por auto-assemblagem de copolímeros anfifílicos em bloco.
Este projeto foi dividido em quatro secções. A primeira consistiu na síntese e purificação do
agente macroRAFT (polietileno glicol funcionalizado com xantato na terminação da cadeia, PEG-X)
usado nas polimerizações mediadas por xantatos, que foi preparado por funcionalização de uma
cadeia polimérica pré-existente. A caracterização do produto resultante validou as suas propriedades
(estrutura, massa molar, etc.), o que permitiu prosseguir para os procedimentos de polimerização.
A segunda parte consistiu na aquisição de dados experimentais de forma a avaliar o efeito da
presença de PEG-X na polimerização de etileno. Assim, as polimerizações foram efetuadas a 70℃ e
100 bar (pressão de etileno), com e sem surfactante, na presença de macroRAFT (PEG-X) ou na
presença do seu homólogo não funcional (PEG-OH). Ficou demonstrado que as polimerizações são
fortemente influenciadas pela presença do macroxantato.
Na terceira parte do projeto foi realizado um estudo da influência do rácio molar entre o
agente macroRAFT e a espécie iniciadora da polimerização. Este estudo foi novamente realizado a 70℃
e 100 bar mantendo a concentração inicial de iniciador e variando a quantidade de macroRAFT.
Aparentemente o rácio entre estas espécies influenciou fortemente o rendimento da polimerização
em PE.
A quarta e última parte deste projeto consistiu no estudo cinético da polimerização em
presença do agente macroRAFT PEG-X (a 70℃) que envolveu intrinsecamente um estudo do efeito da
pressão no sistema, realizado a duas pressões diferentes (100 e 200 bar). A polimerização aparentou
ser afetada pelo aumento da pressão, originado latexes menos estáveis, principalmente a elevados
tempos de reação.
Palavras Chave: Polietileno, polimerização radicalar em emulsão, RAFT, MADIX, PISA

vi
This page was left intentionally in blank.
vii
Table of contents
Acknowledgments ................................................................................................................................... i
Abstract ................................................................................................................................................. iii
Resumo .................................................................................................................................................. v
List of tables .......................................................................................................................................... ix
List of figures .......................................................................................................................................... x
Glossary ............................................................................................................................................... xiii
Introduction ......................................................................................................................................... xv
Chapter I - Literature Review ................................................................................................................ 1
1 - Polyethylene...................................................................................................................................... 3
1.1 – Polyethylene properties ............................................................................................................ 4
1.1.1 – Polyethylene specific properties ......................................................................................... 4
2- Synthesis routes of Polyethylene ....................................................................................................... 7
2.1 Free radical polymerization of ethylene – LDPE ........................................................................... 7
2.1.1 – Free Radical polymerization of ethylene - General mechanism .......................................... 8
2.2 - Industrial production of LDPE ................................................................................................... 11
2.3 - Free radical ethylene Polymerization at C2P2 - LCPP ............................................................... 13
2.4 - Emulsion polymerization: general mechanism ......................................................................... 16
2.5 - Free radical emulsion polymerization of ethylene ................................................................... 19
2.5.1 – First studies on free radical emulsion polymerization of ethylene ................................... 19
2.5.2 - Free radical emulsion polymerization of ethylene at C2P2 ............................................... 20
2.6 – Controlled Radical Polymerization ........................................................................................... 22
2.6.1 – General comments on controlled Radical Polymerization ................................................ 23
2.6.2 - Reversible addition-fragmentation chain transfer polymerization (RAFT) ......................... 24
2.7 - Controlled radical polymerization of ethylene by RAFT at C2P2 .............................................. 26
3 – CRP in emulsion through PISA .................................................................................................... 28
Conclusions .......................................................................................................................................... 29
Chapter II – Experimental part ............................................................................................................ 31
1- Materials .......................................................................................................................................... 33
2- Procedures ....................................................................................................................................... 33
2.1 - Synthesis of the macroRAFT agent – PEG-X.............................................................................. 33
2.1 - High pressure polymerization................................................................................................... 35
2.1.1 - High pressure polymerization apparatus ........................................................................... 35
2.2 - Free radical emulsion of ethylene ............................................................................................ 36
viii
3 - Polymer characterization ................................................................................................................ 36
3.1 - Gravimetry ............................................................................................................................... 36
3.2 – Molar mass measurements - Size Exclusion Chromatography (SEC) ........................................ 37
3.3 - Differential Scanning Calorimetry (DSC) ................................................................................... 38
3.4 - Colloidal analyses - Dynamic Light Scattering (DLS) ................................................................. 38
3.5 - Nuclear Magnetic Resonance (NMR) .................................................................................... 39
3.6 – Transmission Electron Microscopy (TEM) ............................................................................ 39
Chapter III – Results and Discussion .................................................................................................... 41
1 - Introduction .................................................................................................................................... 43
2 – Synthesis of the macroRAFT agent – PEG-X .................................................................................... 44
2.1 - PEG-X synthesis ........................................................................................................................ 44
3 - Free radical emulsion polymerization of ethylene .......................................................................... 47
3.1 - Comparison between different types of polymerization .......................................................... 47
3.1.1 - Comparison between the appearance of the different types of polymerization............... 48
3.1.2 - Comparison between the yield of the four types of polymerization ................................. 49
3.1.3 - Comparison of the particle morphology for the different types of polymerization .......... 49
3.1.4 - Comparison of the Dynamic Light Scattering data ............................................................ 51
3.1.5 – Comparison of Differential Scanning Calorimetry (DSC) data ........................................... 53
3.1.6 – Comparison between polymer molar masses ................................................................... 54
3.2 – Effect of the macroRAFT (PEG-X) amount on polymerization .................................................. 56
3.3 – Kinetic study on the polymerization of ethylene in the presence of PEG-X ............................. 59
3.3.1 – Polymerizations of ethylene in the presence of PEG-X at 100 bar .................................... 59
3.3.1 – Polymerizations of ethylene in the presence of PEG-X at 200 bar .................................... 63
Conclusions and perspectives .............................................................................................................. 69
References ........................................................................................................................................... 72
Annexes ................................................................................................................................................ 77
ix
List of tables Table 1-kpkt-1/2 values for dependence of: i) pressure at 129℃ ii) Temperature (pressure reduced at 1
atm). ..................................................................................................................................................... 12
Table 2 -Comparison of yields for the different types of polymerizations (4h, 50 mg AIBA, T=70℃, and
Pethylene≈100 bar). ............................................................................................................................. 49
Table 3 -Comparison of particle sizes and PDI of the four polymerizations. (4h, 50 mg AIBA, T=70℃,
and Pethylene≈100 bar). ...................................................................................................................... 51
Table 4 - Comparison of DSC values for the different types of polymerizations (4h, 50 mg AIBA, 70℃,
and Pethylene≈100 bar). .......................................................................................................................... 53
Table 5 -Comparison of Mn and Ð for the different types of polymerizations (4h, 50 mg AIBA, 250
rpm, T=70℃, and Pethylene≈100 bar). ................................................................................................ 54
Table 6 –Yields, Zav and PDI of the polymerizations performed with different quantities of PEG-X. ([1
g, 0.5 and 0.3 g of PEG-X], 4h, 50 mg AIBA, T=70℃, and Pethylene≈100 bar). ........................................ 56
Table 7 - Mn and Đ (RL-PE 07;08; RL-PE 09) ([1 g, 0.5 and 0.3 g of PEG-X], 4h, 50 mg AIBA, T=70℃, and
Pethylene≈100 bar). ................................................................................................................................. 58
Table 8- Yields of FREPE at 100 bar in the presence of PEG-X (1h, 2h, 4h, 8h) (50 mg AIBA, 0.3 g PEG-X,
250 rpm, T=70℃). ............................................................................................................................... 59
Table 9 - Mn peak and Đ of FREP of ethylene at 100 bar and with PEG-X (50 mg AIBA, 0.3 g PEG-X, 250
rpm, T=70℃). ....................................................................................................................................... 62
Table 10 - Yields of FREP of ethylene at 200 bar and in the presence of PEG-X (1h, 2h, 4h and 8h) (50
mg AIBA, 0.3 g PEG-X, 250 rpm, T=70℃). ............................................................................................ 64
Table 11 - Mn and dispersity of FREPE (1h, 2h, 4h and 8h) (200 bar, 50 mg AIBA, 0.3 g PEG-X, 250 rpm,
T=70℃). ................................................................................................................................................ 66
x
List of figures
Figure 1-Cristalline (orange background), amorphous, and interfacial domains of PE. .......................... 3
Figure 2- LDPE. ....................................................................................................................................... 5
Figure 3- LLPE. ........................................................................................................................................ 5
Figure 4- VLDPE. ..................................................................................................................................... 5
Figure 5 - HDPE ....................................................................................................................................... 6
Figure 6-FRP initiation reaction. ............................................................................................................. 9
Figure 7 - FRP propagation step. ............................................................................................................ 9
Figure 8 - Combination reaction in FRP. ................................................................................................. 9
Figure 9- Disproportionation in FRP. ...................................................................................................... 9
Figure 10 -Example of chain transfer in FRPE, with R= alkyl or aryl group or some other organic
moiety. [10] .......................................................................................................................................... 10
Figure 11 - Example of intermolecular chain transfer in FRPE. ............................................................. 10
Figure 12 -Example of intramolecular chain transfer in FRPE. .............................................................. 11
Figure 13- Autoclave (left) and Tubular (right) high pressure reactors. ............................................... 12
Figure 14 - Transfer to THF in radical polymerization of ethylene (2-polyethylenyl-THF). ................... 14
Figure 15- Pressure influence on ethylene radical polymerization (4h, 70℃, 50 mg AIBN and 50 mL
solvent). toluene, THF. ................................................................................................................. 14
Figure 16 -Kinetic study of the effect of the solvent on polymerization yield (x).THF● DEC
toluene ................................................................................................................................................. 15
Figure 17- Initial state of Emulsion polymerization (surfactant concentration above cmc). ................ 17
Figure 18- Intervals in emulsion polymerization (from [34]). ............................................................... 18
Figure 19 –FREPE yield and □ average particle diameter vs ethylene pressure (80 mg AIBA, 50
mL water, 4h at 70 ℃); yield and ∆ average particle diameter vs ethylene pressure (80 mg
AIBA, 50 mL water, 4h at 70 ℃ and 1 gL-1 CTAB). ................................................................................. 20
Figure 20-TEM of PE particles synthesized by FREPE (AIBA, 100 bar of ethylene and 70 °C). [30] ....... 21
Figure 21 - TEM of PE particles synthesized by FREPE in the presence of surfactant (AIBA, 100 bar of
ethylene at 70 °C and CTAB – 2 gL-1). [30] ............................................................................................ 21
Figure 22 - Cryo-TEM picture of a PE latex synthesized with 3 g L−1. .................................................... 22
Figure 23- Examples of Thiocarbonylthio RAFT agents [53]. ................................................................ 24
Figure 24- Initiation step in RAFT. ........................................................................................................ 25
Figure 25- Addition to RAFT agent. ...................................................................................................... 25
Figure 26- Reinitiation step in RAFT polymerization. ........................................................................... 25
Figure 27 - Chain equilibration by reversible addition fragmentation. ................................................. 25
Figure 28 - Termination by the combination of 2 active polymer chains. ............................................ 25
Figure 29 -Evolution of Mn (experimental: , theoretical:∙ − ∙ −) and MWD (□) with the
polymerization yield ........................................................................................................................... 27
Figure 30 - Xanthates used in CRP of ethylene [57]. ............................................................................. 27
Figure 31 - Evolution of MWD during the chain-extension reaction of PE-X with ethylene. ................ 27
Figure 32 - PISA using RAFT in aqueous system.................................................................................... 28
Figure 33 - 1st step of PEG-X synthesis................................................................................................. 34
Figure 34 - 2nd step of PEG-X synthesis. .............................................................................................. 34
Figure 35- Ethylene high pressure polymerization apparatus (C2P2) - Ballast (left) and reactor (right).
............................................................................................................................................................. 35
Figure 36- Viscotek Malvern® HT-GPC Module 350 A used to determine polymer molar masses and
dispersities by SEC. ............................................................................................................................... 37
xi
Figure 37 - Malvern® Zetasizer Nano ZS used in the DLS analyses (determine Zav and PDI). ................ 38
Figure 38 - Bruker® Avance II (400 MHz). ............................................................................................. 39
Figure 39 - Philips CM120 transmission electron microscope in Ct𝜇. ................................................... 40
Figure 40 - PEG-X macroRAFT structure (n=44). ................................................................................... 44
Figure 41 - 1H NMR of PEG-X in CDCl3. .................................................................................................. 45
Figure 42 -Retention volume curve of PEG-X from SEC analysis in THF (Mn ≈2300 g mol-1 and Đ≈1.03).
............................................................................................................................................................. 45
Figure 43 -DSC analyses of PEG-X. ........................................................................................................ 46
Figure 44 – [1] - AIBA; [2] – CTAB (1 g L-1); [3] - PEG-OH;...................................................................... 47
Figure 45 - Latexes obtained by FREPE (1- Blank; 2 - CTAB; 3 - PEG-OH; 4- PEG-X) (4h, 50 mg AIBA, 250
rpm, T=70℃, and Pethylene≈100 bar). .................................................................................................... 48
Figure 46 - TEM of PE particles: [1] – Blank; [2] – CTAB; [3] – PEG-OH; [4] – PEG-X. ............................ 50
Figure 47 – TEM (left) and Cryo-TEM (right) of PE particles performed with PEG-X (RL-PE 09) (200nm).
............................................................................................................................................................. 51
Figure 48 - Particle size distribution by Intensity (RL-PE 18, blank - left) (RL-PE 14, blank - right) (4h, 50
mg AIBA, 250 rpm, T=70℃, and Pethylene≈100 bar). .......................................................................... 52
Figure 49 - Particle size distribution by Intensity (RL-PE 09[PEG-X], left) (RL-PE 20[CTAB]- right) (4h, 50
mg AIBA, 250 rpm, T=70℃, and Pethylene≈100 bar). .......................................................................... 52
Figure 50 - DSC analyses of RL-PE 14 sample (1 g PEG-OH, 4h, 50 mg AIBA, 250 rpm, T=70℃, and
Pethylene≈100 bar). ................................................................................................................................. 53
Figure 51- DSC analyses of RL-PE 09 sample (0.3 g PEG-X, 4h, 50 mg AIBA, 250 rpm, T=70℃, and
Pethylene≈100 bar). ............................................................................................................................. 54
Figure 52 – Chromatogram of the samples RL-PE 09 (PEG-X); RL-PE 14 (PEG-OH); RL-PE 18 (Blank); RL-
PE 20 (CTAB) (4h, 50 mg AIBA, 250 rpm, T=70℃, and Pethylene≈100 bar). ......................................... 55
Figure 53 - Yield (g) vs. PEG-X (g) for the standard polymerization conditions ([1 g, 0.5 and 0.3 g of
PEG-X], 4h, 50 mg AIBA, T=70℃, and Pethylene≈100 bar). ..................................................................... 56
Figure 54 - Particle size distribution by Intensity (RL-PE 07) (1 g PEG-X, 4h, 50 mg AIBA, 250 rpm,
T=70℃, and Pethylene≈100 bar). ......................................................................................................... 57
Figure 55 - Particle size distribution by Intensity (RL-PE 08) (0.5 g PEG-X 4h, 50 mg AIBA, 250 rpm,
T=70℃, and Pethylene≈100 bar). ......................................................................................................... 57
Figure 56 -DSC analyses of RL-PE 07 sample (1 g PEG-X, 4h, 50 mg AIBA, 250 rpm, T=70℃, and
Pethylene≈100 bar). ............................................................................................................................. 57
Figure 57 - Chromatogram of the samples RL-PE 07; RL-PE 08; RL-PE 09(4h, 50 mg AIBA, T=70℃, and
Pethylene≈100 bar). ................................................................................................................................. 58
Figure 58 - Polymerization sample of FREPE (RL-PE 26) (1h, 100 bar, 50 mg AIBA, 0.3 g PEG-X, 250
rpm, T=70℃). ...................................................................................................................................... 59
Figure 59 – Yield as function of time in FREPE with PEG-X. (1h, 2h, 4h, 8h) (100 bar, 50 mg AIBA, 0.3 g
PEG-X, 250 rpm, T=70℃). ..................................................................................................................... 60
Figure 60 - Particle size distribution by Intensity (RL-PE 26) (1h, 100 bar, 50 mg AIBA, 0.3 g PEG-X, 250
rpm, T=70℃). ....................................................................................................................................... 60
Figure 61 - Particle size distribution by Intensity (RL-PE 26) (2h, 100 bar, 50 mg AIBA, 0.3 g PEG-X, 250
rpm, T=70℃). ....................................................................................................................................... 61
Figure 62 - Particle size distribution by Intensity (RL-PE 29) (2h, 100 bar, 50 mg AIBA, 0.3 g PEG-X, 250
rpm, T=70℃). ....................................................................................................................................... 61
Figure 63 - Zav as function polymerization time in FREP of ethylene using PEG-X (100 bar, 50 mg AIBA,
0.3 g PEG-X, 250 rpm, T=70℃). ............................................................................................................ 61
Figure 64 -TEM RL-PE 27 (100 nm, left) and Cryo-TEM (100 nm, right) (8 h, 100 bar, 50 mg AIBA, 0.3 g
PEG-X, 250 rpm, T=70℃). ..................................................................................................................... 62
xii
Figure 65 - Chromatogram of the samples RL-PE 26 (1h); RL-PE 29 (2h); RL-PE 09 (4h); RL-PE 27 (8h)
(50 mg AIBA, 70℃, Pethylene≈100 bar). .............................................................................................. 62
Figure 66 -Mpeak vs. Yield in FREPE using PEG-X – samples RL-PE 26 (1h); RL-PE 29 (2h); RL-PE 09
(4h); RL-PE 27 ....................................................................................................................................... 63
Figure 67 - Latex produced via FREPE with 0.3 g of PEG-X (RL-PE 28, 2h)(left); (RL-PE 32, 8h)(right)
(200 bar, 50 mg AIBA, 250 rpm, T=70℃). ............................................................................................. 64
Figure 68 -Yield vs. polymerization time in FREPE using PEG-X (1h, 2h, 4h, 8h) (200 bar, 50 mg AIBA,
0.3 g PEG-X, 250 rpm, T=70℃). ............................................................................................................ 64
Figure 69 -TEM RL-PE 28 (1 µm, left) and (200 nm, right) (2h, 200 bar, 50 mg AIBA, 0.3 g PEG-X, 250
rpm, T=70℃). ....................................................................................................................................... 65
Figure 70 - Particle size distribution by Intensity (RL-PE 31, 1h), (RL-PE 28, 2h), (RL-PE 30, 4h), (RL-PE
32, 8h) (200 bar, 50 mg AIBA, 0.3 g PEG-X, 250 rpm, T=70℃). ............................................................. 65
Figure 71 – Particle size as a function of time for small and large particle size populations (circle
proportional to the intensity signal) in FREPE (RL-PE 31, 1h), (RL-PE 28, 2h), (RL-PE 30, 4h), (RL-PE 32,
8h) (200 bar, 50 mg AIBA, 0.3 g PEG-X, 250 rpm, T=70℃). ................................................................... 66
Figure 72- Chromatogram of the samples (RL-PE 28, 1h); (RL-PE 30, 2h); (RL-PE 31, 4h); (RL-PE 32, 8h)
(200 bar, 50 mg AIBA, 0.3 g PEG-X, 250 rpm, T=70℃). ......................................................................... 67
Figure 73 –Mpeak vs. Yield in FREP of ethylene using PEG-X (200 bar, 50 mg AIBA, 0.3 g PEG-X, 250
rpm, T=70℃). ....................................................................................................................................... 67
xiii
Glossary
AA Acrylic Acid ACPA 4,4′-Azobis(4-cyanovaleric acid AIBA 2,2′-Azobis(2-methylpropionamidine) dihydrochloride AIBN 2,2'-Azobisisobutyronitrile APS Ammonium Persulfate CMC Critical micelle concentration Cryo-TEM Cryogenic transmission electron microscopy CRP Controlled radical polymerization CTAB Cetyl trimethylammonium bromide Ð Dispersity D2O Deuterium oxide DCM Dichloromethane DEC Diethyl carbonate DLS Dynamic light scattering DMC Dimethyl carbonate DSC Differential scanning calorimetry FREPE Free radical emulsion polymerization of ethylene FRP Free radical polymerization FRPE Free radical polymerization of ethylene IPA Isopropyl alcohol HDPE High density polyethylene LCB Long chain branching LDPE Low density polyethylene LLDPE Linear low density polyethylene Mn Number-average molar mass Mw Weight-average molar mass MWD Molar weight distribution MADIX Macromolecular Design via the Interchange of Xanthates NMR Nuclear magnetic resonance P Pressure PAA-X2 Polyacrylic acid end-functionalized with xanthate PC Polymer content Pcrit Critical pressure PDI Polydispersity index PE-X Polyethylene-xanthate PEG-OH Poly(ethylene glycol) PEG-X Xanthate-functionalized polyethylene glycol Pethylene Ethylene pressure PE Polyethylene PISA Polymerization-induced self-assembly RAFT Reversible addition-fragmentation chain transfer SCB Short chain branching SDS Sodium dodecylsulfate SEC Size exclusion chromatography SC Solid content T Temperature Tc Crystallization temperature Tcrit Critical temperature TCB 1,2,4-trichlorobenzene
xiv
TEA Triethylamine TEM Transmission electron microscopy THF Tetrahydrofuran Tm Melting temperature UHMWPE Ultra-high molecular weight polyethylene VAc Vinyl acetate VLDPE Very low density polyethylene VOCs Volatile organic compounds Xc Crystallinity percentage
Zav Average particle size, obtained by DLS
xv
Introduction Scope & Aim
Being the most produced polymer in the world, polyethylene (PE) success is due mainly to its
low production cost, easy processability, chemical inertia and mechanical properties, which provides
it with a wide range of applications. PE is produced via two types of processes: a catalytic way, under
mild conditions (T<150℃ and P>40 bar) and through a radical process under harsh conditions (T>200℃
and P>40 bar).
Additionally, PE can be used in an aqueous dispersion form, with application such as in
coatings (e.g. for papers). After more than 70 years since its industrial production started, the team of
C2P2 showed that it was still possible to innovate in free radical polymerization of ethylene (FRPE),
recently reporting the free radical emulsion polymerization of ethylene (FREPE) under mild conditions
(T<100℃ and P<250 bar).
Taking advantage of the progress in FRPE under mild conditions, the team investigated the
controlled radical polymerization (CRP) of ethylene in an organic solvent through reversible addition-
fragmentation chain transfer (RAFT) polymerization mediated by xanthates, presenting the first
example of a controlled radical polymerization (CRP) of ethylene using RAFT.
The emulsion polymerization (EP) process requires the use of surfactants that may sometimes
be detrimental to the final application. Hence, it was appealing to find alternatives in which
surfactants, such as amphiphilic di-block copolymers, are both produced in situ and covalently
anchored at the surface of the final particles. With the developments of the CRP in water, FREPE was
performed according to the polymerization-induced self-assembly (PISA) process – in which basically
a hydrophilic living polymer chain is grown in a first step and chain-extended in water with a
hydrophobic monomer, creating block copolymers that will self-assemble into nano-sized self-
stabilized particles. The C2P2 team recently managed to perform PISA using RAFT according to a one
pot process where the hydrophilic and the hydrophobic block are formed successively in the same
reactor in water.
Gathering the recently established CRP of ethylene mediated by xanthates and the expertise
of the C2P2 team in the emulsion polymerization of ethylene, the PISA process of ethylene achieved
through RAFT mediated by xanthates was found to be a very interesting research area to investigate.
This constitutes the aim of this project: develop the synthesis of PE-based nanoparticles from an
original surfactant-free emulsion polymerization of ethylene using RAFT technique.
Outline of the manuscript
This thesis comprises three chapters. The first chapter (chapter I) corresponds to an up-to-
date bibliographic review of the most relevant aspects of polymerization to this project.
Chapter II presents the experimental part, including materials, experimental set-up,
polymerization procedures and polymer characterization methodologies.
Chapter III concerns the experimental results and the discussion of the different
polymerizations studies, with the possible conclusions from these studies.

xvi
This page was left intentionally in blank.
1
Chapter I - Literature Review

2
This page was left intentionally in blank.
3
1 - Polyethylene
Polyethylene, PE, is the most produced polymer in the industry of synthetic polymers. Being considered a commodity, the production of this highly demanded polymer reached around 78 Million tons in 2012. Furthermore, its consumption continues to show a clear increase in the world every year.
[1]
PE is produced from ethylene, a gaseous monomer obtained predominantly from the petrochemical industry, by thermal cracking of natural gas or crude oil, however other sources independent from the latter, such as bioethanol, are acquiring an increasing importance. [2], [3]
A great number of reasons can be enumerated to explain the enormous commercial success of polyethylene in the world and its day-to-day use. One of these main reasons is the low production cost of PE, being one of the least expensive polymers in the market, about 1500 $ m-3 in 2012. [1]
Polyethylene is the simplest polymer that can be produced, if considered that it is only composed by carbon and hydrogen atoms. They can be arranged in the simplest structure of polyethylene, a long backbone formed of an even number of covalently bonded carbons with a pair of hydrogen atoms linked to each carbon, except for the chain ends that are terminated by methyl groups. [1], [2]
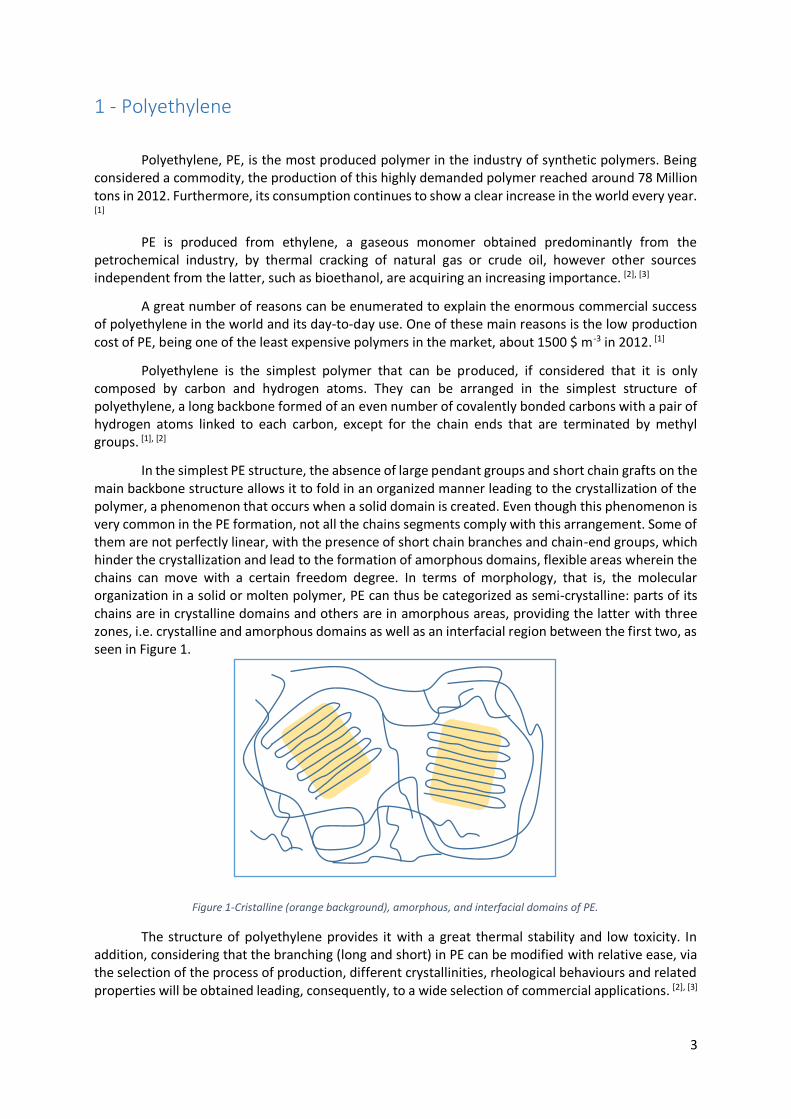
In the simplest PE structure, the absence of large pendant groups and short chain grafts on the main backbone structure allows it to fold in an organized manner leading to the crystallization of the polymer, a phenomenon that occurs when a solid domain is created. Even though this phenomenon is very common in the PE formation, not all the chains segments comply with this arrangement. Some of them are not perfectly linear, with the presence of short chain branches and chain-end groups, which hinder the crystallization and lead to the formation of amorphous domains, flexible areas wherein the chains can move with a certain freedom degree. In terms of morphology, that is, the molecular organization in a solid or molten polymer, PE can thus be categorized as semi-crystalline: parts of its chains are in crystalline domains and others are in amorphous areas, providing the latter with three zones, i.e. crystalline and amorphous domains as well as an interfacial region between the first two, as seen in Figure 1.
The structure of polyethylene provides it with a great thermal stability and low toxicity. In addition, considering that the branching (long and short) in PE can be modified with relative ease, via the selection of the process of production, different crystallinities, rheological behaviours and related properties will be obtained leading, consequently, to a wide selection of commercial applications. [2], [3]
Figure 1-Cristalline (orange background), amorphous, and interfacial domains of PE.
4
1.1 – Polyethylene properties
As it will be shown below, two main synthetic routes can be considered to produce polyethylene, radical and catalytic, yielding, consequently, different kinds of polymer. The polymerization via a radical process, which is largely employed in industry, operates under harsh conditions (high pressure of ethylene, P ≈ 1000 to 4000 bar, T ≈ 300℃) generating high branching degree with large amounts of long-chain (LCB) and short-chain branches (SCB). On the other hand, the conditions involved in the catalytic route are much milder (relative low pressure of ethylene P ≈ 30 −40 bar, T < 100℃). The polymers produced via this route are provided with a controlled branching degree and basically, at the industrial scale, only the short chain branching occurs with controlled branches’ lengths. [2], [4]
Depending on the synthetic route of production of polyethylene different kinds of PE will be yielded. A common way to classify these kinds of PE consists in sorting them by density, i.e., low and high density, polyethylene grades. The density is tightly linked to the branching type of the polymer (and branching degree) and to the crystallinity, which allows to predict the physical properties of the PEs fairly well.
Additionally, polyethylene is by its nature relatively chemically inert. [2] Among the inherent properties of the different types of PE, this particular characteristic provides a broad range of applications to PE, because it presents a good resistance to environmental degradation and solvents, which allows it to be used in packaging for example (films, containers, etc.). However, the advantage of these properties can raise environmental concerns, given that if not treated properly, wastes of PE can accumulate for long periods of time. [5]
1.1.1 – Polyethylene specific properties
As said above polyethylene can be divided in two main categories, low and high density PEs, which include different types of PE that have their own properties. Herein are presented, for each kind of PE, some of the properties that have a particular importance to this polymer, such as density, crystallinity and melting temperature.
1.1.1.2 Low Density Polyethylene
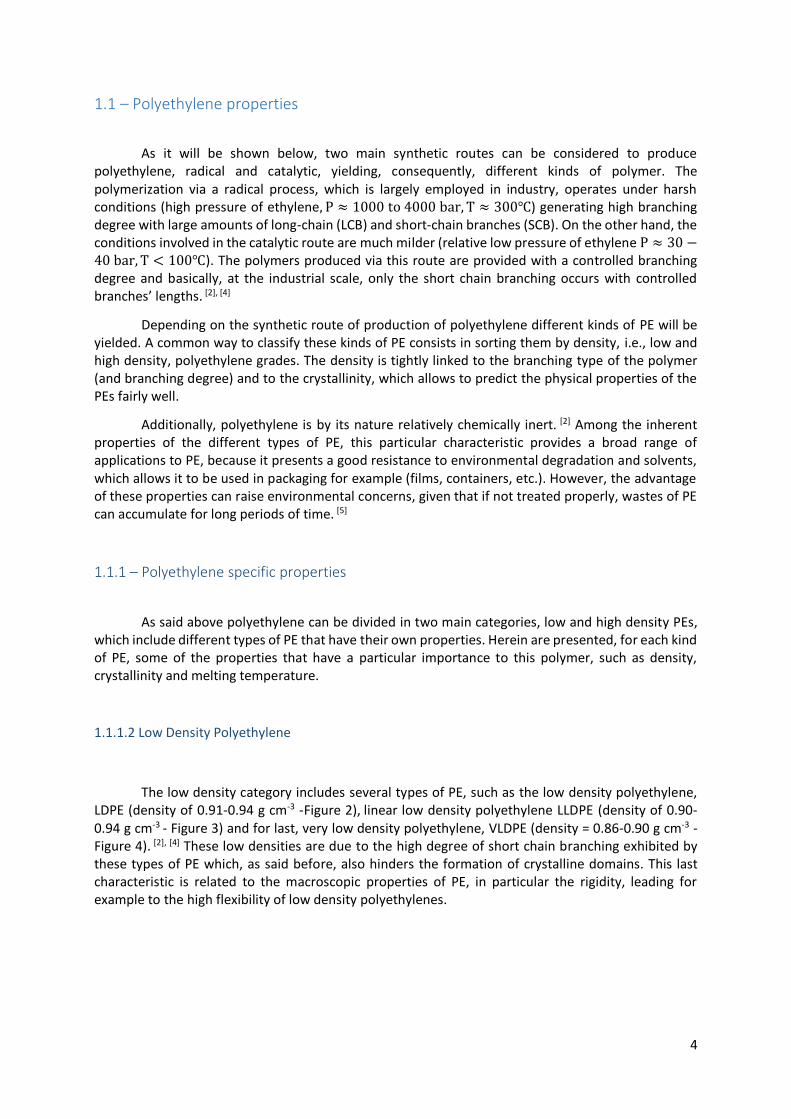
The low density category includes several types of PE, such as the low density polyethylene, LDPE (density of 0.91-0.94 g cm-3 -Figure 2), linear low density polyethylene LLDPE (density of 0.90-0.94 g cm-3 - Figure 3) and for last, very low density polyethylene, VLDPE (density = 0.86-0.90 g cm-3 - Figure 4). [2], [4] These low densities are due to the high degree of short chain branching exhibited by these types of PE which, as said before, also hinders the formation of crystalline domains. This last characteristic is related to the macroscopic properties of PE, in particular the rigidity, leading for example to the high flexibility of low density polyethylenes.

5
LDPE, also called high-pressure polyethylene, [6] is synthesized through a free radical polymerization process unlike the other low density PEs. Due to existence of a high density of both long and short-chain branches, along the main backbone LDPE is characterized by having low tensile modulus, being extremely ductile and generally translucent and easily pliable - a films of LDPE can deform uniformly when stretched, with little (if any) whitening in the strained regions, showing substantial deformation before the onset of tearing, which does not proceed readily – this characteristic provides it with several applications in the packaging field (films, bags, etc.). [2] The degree of crystallinity of LDPE varies between 42 and 62% and its melting temperature, Tm, which ranges from 98 to 115℃.
Unlike LDPE, LLDPE contains only SCB, and is characterized by having a broad molar mass distribution. LLDPE is produced through a catalytic process and when made using Ziegler-Natta catalysts tends to have more polymer of the lower molar mass fraction and less of the high molar mass fraction. [4] The tensile modulus of LLDPE is higher than LDPE and usually has lower values of crystallinity, ranging from 34 to 62% and its melting temperature is comprised between 100 and 125℃.
[2] LLDPE can have applications similar to the ones of LDPE, being produced in thin transparent films that are highly resistant to puncture or tear.
At last VLDPE presents similar characteristics to LLDPE, although it has a higher density of short chain branching that, once again prevents the formation of large crystalline domains, decreasing its crystallinity. The degree of crystallinity varies between 4 and 34% and its melting temperature ranges from 60 to 100℃. [2] In terms of applications it can be used in packaging films but has a lower tensile strength. Thus these films are very soft and are readily deformed. [2], [4]
In this group (low density PEs), LDPE differs from the other low density PEs mainly due to the presence long chain branches that strongly affect the rheological behaviour of the polymer, in both shear and extension. This has a significant importance in the processing of LDPE, mainly in the shear thinning and strain hardening phenomena, allowing the better performance of the extrusion process at low temperature and requiring less power to operate. [3]
Figure 3- LLPE.
Figure 4- VLDPE.
Figure 2- LDPE.
6
1.1.1.2 – High density polyethylene
High density polyethylene, HDPE, alongside LDPE, represents the majority of the thermoplastic world market, [7] being the most produced PE in the world, with around 36 Mtons in 2012. [1] HDPE is synthesized through a catalytic route using coordination catalysts. [6] This type of polyethylene is a predominantly linear polymer being chemically the closest in structure to pure PE (i.e. linear PE chain). As seen in Figure 5, HDPE is basically unbranched (low degree of short chain branching). Consequently, with a very low level of defects to hinder organization, a very high degree of crystallinity can be achieved, resulting in PE that has high density. [4] When compared to LDPE, HDPE has increased tensile strength, stiffness and chemical resistance. In addition, most HDPEs have number-average molar masses ranging from 50 to 250 kDa. The produced materials have a wide range of applications, being mainly used in containers, housewares, industrial wrappings, pipes etc., complementing the applications of LDPEs category. The density of HDPE ranges from 0.94 to 0.97 g cm-3, the degree of crystallinity varies in the range from 62 to 82% and its melting temperature, Tm, varies from 125 to 135℃. [2], [4]
Besides the typical HDPE there are various specialty types of HDPEs, such as high and ultra-high molecular weight. Materials with such types of PE have some interesting/peculiar characteristics, like increased tensile strength, elongation, etc. High-molecular-weight high-density, HMWPE polyethylene (0,25 to 1,5 MDa) for instance, is used for pressure piping in mining, industrial, oil, and water applications. Ultrahigh-molecular-weight high-density polyethylene (>1.5 MDa) has very high abrasion resistance and impact strength, the highest of any thermoplastic material with applications in the mining and freight industries as well as in agricultural and earthmoving machinery. [6]
In sum, low density polyethylenes are characterized by having low molar mass, exhibiting a rather low degree of crystallinity and flexibility. The higher density PEs are prone to have higher crystallinity, with their main features being the combination of light weightiness and strong mechanical properties, which allows to complement the applications of low density PEs.
Knowing the enormous commercial importance of polyethylene and properties of the several polyethylene grades it is found relevant to briefly describe the synthesis routes that lead to the different types of PE mentioned above, with particular interest in the free radical process, used in this study, before reviewing the underpinning concepts of this project.
Figure 5 - HDPE
7
2- Synthesis routes of Polyethylene
The polymerization of ethylene can be performed via two main routes. Either by a free radical polymerization process, which requires the use of radical initiators being normally performed at high pressure and relative high temperature, or by the catalytic route, which involves the use of organometallic catalysts (coordination insertion polymerization) and normally requires much lower pressures than the free radical process. [8] As mentioned before, the two production methods influence the structure of the obtained polymer, yielding different types of polyethylene. The free radical process originates branched polymer chains, exhibiting long and short chain branches, whereas organometallic coordination catalysts leads to the synthesis of linear or regularly branched polymer chains. The polymerization of ethylene can be carried out either in solution, slurry or in bulk, given that at pressures above 100MPa, ethylene is in its supercritical state (Tcrit= 9,2°C, Pcrit=50,4 bar) [9] acts as solvent for polyethylene. [8], [10]
This section is not meant to provide the reader with an accurate review of all possible
production processes, which would be out of scope of this work, and will thus focus on the description
of the free radical process used in this project.
2.1 Free radical polymerization of ethylene – LDPE
Historically, the development of PE, nowadays, a highly demanded polymer and an integral
part of everyday life did not proceed smoothly. As many other scientific discoveries polyethylene was
produced serendipitously several times before the utility of synthetic polymer field was appreciated.
Thus, the production of polyethylene can be separated in several distinct periods. It was not until the
1930s that chemists, attempting to produce an entirely different product, inadvertently created
polyethylene and recognized its potential. However, previously to that period, the (pre-1930’s)
incidental production of PE took place with the first record of the preparation being reported in 1898
by H. von Pechmann, followed shortly after by his colleagues, E. Bamberger and F. Tschirner, that
characterized the white, waxy substance that was produced, recognizing that it contained long -CH2-
chains and termed it polymethylene. [11] In both cases PE was produced by the decomposition of a
diazomethane mixture. However the commercial significance of this discovery was unappreciated at
the time and further investigations were only resumed in the early 30’s of the twentieth century. [12]
Alongside other studies being realized in the 1930s, the British company Imperial Chemical
Industries, ICI, set a great research program in order to investigate the high pressure chemistry of some
organic compounds, including ethylene. Where other contemporaries ended-up failing to understand,
once again, the potential of the obtained material, the researchers of ICI, E. Fawcett and R. Gibbon,
after several attempts of an experiment that failed in its intended purpose1, they noticed that a small
quantity of a white waxy solid was found lining the reaction vessel. The product was later identified as
a polymer of ethylene, being this the first time that its existence was recognized. [12]
The reaction was not reproducible and after several attempts that led to uncontrollable
outcomes especially in terms of exothermicity, accompanied by the inherent increase of pressure, in
1935 the proper conditions that would allow the consistent polymerization of ethylene to take place
were set. In 1936 ICI took out the first patent on the manufacture of polyethylene. [13]
1 High pressure reaction of ethylene with benzaldehyde (the benzaldehyde was recovered unchanged).
8
The materials yielded by this process were ductile with melting temperature of about 115°C
and had some of the characteristics of the PE type that we call today LDPE. [14] These properties were
investigated and some of them like their flexibility and chemical inertness led to the recognition of
these materials as a great electric insulators for coaxial cables aiming at the commercialization in the
open market.
Great efforts to scale up the production of PE were made, involving the design of a reaction
vessel capable of withstanding a pressure over 1500 bar. However, at the time that the production
lines were ready to produce PE and to commercialize it, the Second World War, WWII, broke out and
the British government kept PE a secret in order to use it as electrical insulating material in their
military equipment. [2]
After WWII the production of PE went to full commercial scale with American companies such
as Union Carbide, Du Pont and the Bakelite Corporation taking under license the method developed
by ICI. Within 10 years the variety of products made from polyethylene expanded dramatically and the
total amount of produced PE reached 7500 tons, demonstrating the enormous commercial success of
polyethylene. In the following decades, the development of LLDPE in the 1960’s and the oil crises in
the 1970’s, led to the development of large capacity and high pressure polymerization plants.
Nowadays, around 20 million tons of PE are obtained each year by high pressure polymerization
(Pethylene ≈ 1000-4000 bar, T ≈ 300°C). [10]
2.1.1 – Free Radical polymerization of ethylene - General mechanism
Currently, free radical polymerization represents approximately 50% of the production of all
synthetic polymers. This particular process has been changing people’s lives, providing access to
materials that otherwise would not be available to the average consumer, even though that, at the
time of its commercialization, the proper scientific understanding of the concepts involved in FRP was
lacking. [15], [16]
Furthermore, the commercial success of free radical polymerization can be attributed to the
broadness of monomers available to perform this kind of polymerization, mainly due to the tolerance
of radicals to several functionalities (acidic, hydroxyl, etc.), [15] and their ability to copolymerize, giving
a wide variety of produced materials and leading, consequently, to a large range of applications. [15], [16]
Conventional free radical polymerization proceeds via a chain growth mechanism. [17] The FRP
of ethylene occurs in the same way as other typical liquid monomers which basically consists of
different types of reactions involving free radicals. [18] These elementary reactions are the initiation,
where occurs the radical generation from non-radical species and their subsequent addition to the
monomer (Figure 6), the propagation step where the propagating (oligo or macro)radicals continue
the addition to the monomer (Figure 7), promoting the chain growth and the termination reactions
giving that the latter one can be divided in two sub-types as bimolecular termination between two
radical centres consisting in disproportionation (Figure 8) (atom transfer and atom abstraction
reactions) and combination (Figure 9) (radical–radical recombination reactions). In the free radical
polymerization of ethylene, there are other reactions, such as transfer reactions that will be deepen
below. [18]
9
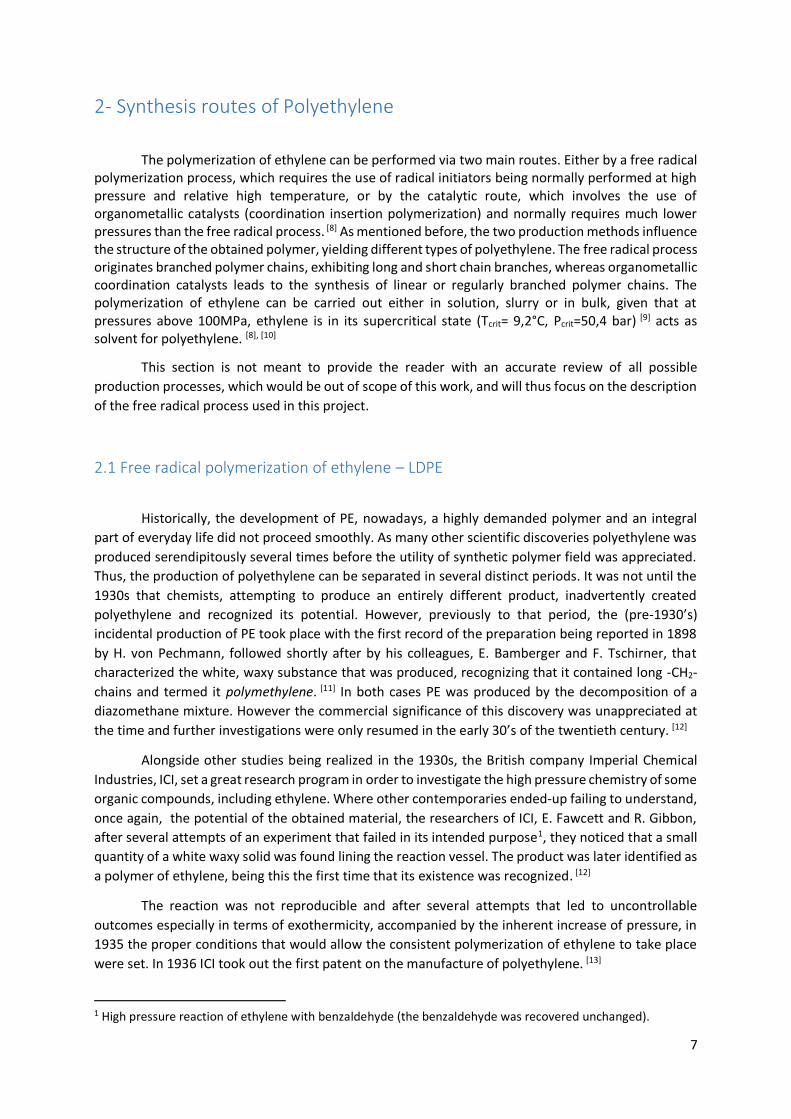
Initiation
In this first reaction radicals are generated (and can continue to do so during the
polymerization) by the decomposition of the initiator species either by thermal cleavage, by redox
reactions or by the effect of an incident radiation. [18] As seen in Figure 6 after the first step, the primary
or initiator radicals will react with the carbon-carbon double bond of the monomer, setting what is
called the initiation reaction. In the industrial field, the initiation reaction for the polymerization of
ethylene that is frequently used is the thermal decomposition of initiator species, such as peroxides or
oxygen. [8]
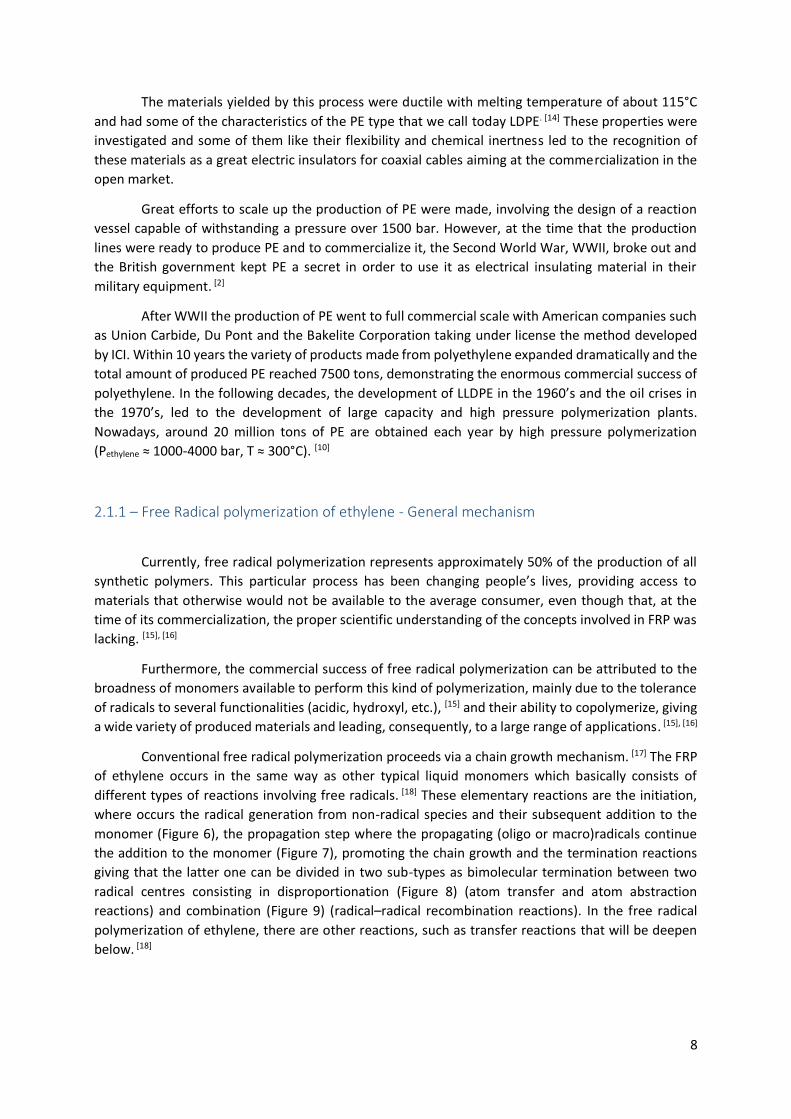
Propagation
The propagation reaction is responsible for the growth of the polymer chains by the successive
addition of monomer, end to end, to a radical centre, extending the oligomer chain - Figure 7.
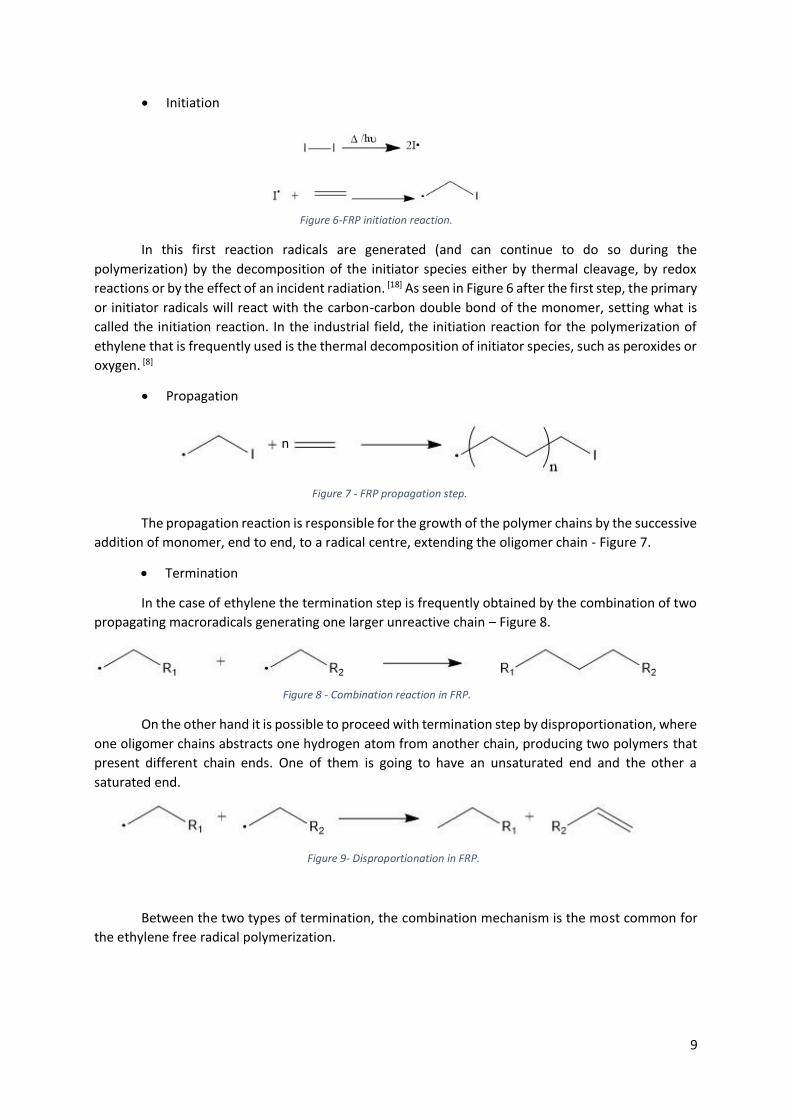
Termination
In the case of ethylene the termination step is frequently obtained by the combination of two
propagating macroradicals generating one larger unreactive chain – Figure 8.
On the other hand it is possible to proceed with termination step by disproportionation, where
one oligomer chains abstracts one hydrogen atom from another chain, producing two polymers that
present different chain ends. One of them is going to have an unsaturated end and the other a
saturated end.
Between the two types of termination, the combination mechanism is the most common for
the ethylene free radical polymerization.
Figure 7 - FRP propagation step.
Figure 8 - Combination reaction in FRP.
Figure 9- Disproportionation in FRP.
Figure 6-FRP initiation reaction.
n
10
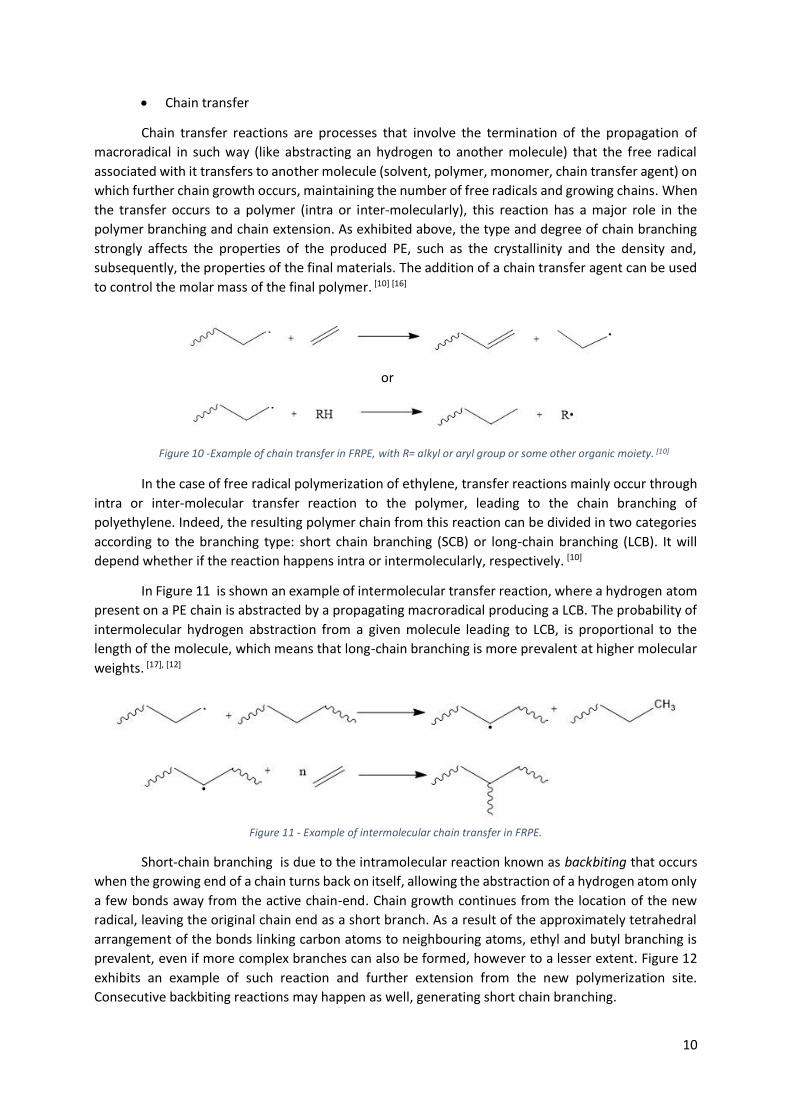
Chain transfer
Chain transfer reactions are processes that involve the termination of the propagation of
macroradical in such way (like abstracting an hydrogen to another molecule) that the free radical
associated with it transfers to another molecule (solvent, polymer, monomer, chain transfer agent) on
which further chain growth occurs, maintaining the number of free radicals and growing chains. When
the transfer occurs to a polymer (intra or inter-molecularly), this reaction has a major role in the
polymer branching and chain extension. As exhibited above, the type and degree of chain branching
strongly affects the properties of the produced PE, such as the crystallinity and the density and,
subsequently, the properties of the final materials. The addition of a chain transfer agent can be used
to control the molar mass of the final polymer. [10] [16]
In the case of free radical polymerization of ethylene, transfer reactions mainly occur through
intra or inter-molecular transfer reaction to the polymer, leading to the chain branching of
polyethylene. Indeed, the resulting polymer chain from this reaction can be divided in two categories
according to the branching type: short chain branching (SCB) or long-chain branching (LCB). It will
depend whether if the reaction happens intra or intermolecularly, respectively. [10]
In Figure 11 is shown an example of intermolecular transfer reaction, where a hydrogen atom
present on a PE chain is abstracted by a propagating macroradical producing a LCB. The probability of
intermolecular hydrogen abstraction from a given molecule leading to LCB, is proportional to the
length of the molecule, which means that long-chain branching is more prevalent at higher molecular
weights. [17], [12]
Short-chain branching is due to the intramolecular reaction known as backbiting that occurs
when the growing end of a chain turns back on itself, allowing the abstraction of a hydrogen atom only
a few bonds away from the active chain-end. Chain growth continues from the location of the new
radical, leaving the original chain end as a short branch. As a result of the approximately tetrahedral
arrangement of the bonds linking carbon atoms to neighbouring atoms, ethyl and butyl branching is
prevalent, even if more complex branches can also be formed, however to a lesser extent. Figure 12
exhibits an example of such reaction and further extension from the new polymerization site.
Consecutive backbiting reactions may happen as well, generating short chain branching.
Figure 10 -Example of chain transfer in FRPE, with R= alkyl or aryl group or some other organic moiety. [10]
or
Figure 11 - Example of intermolecular chain transfer in FRPE.
11
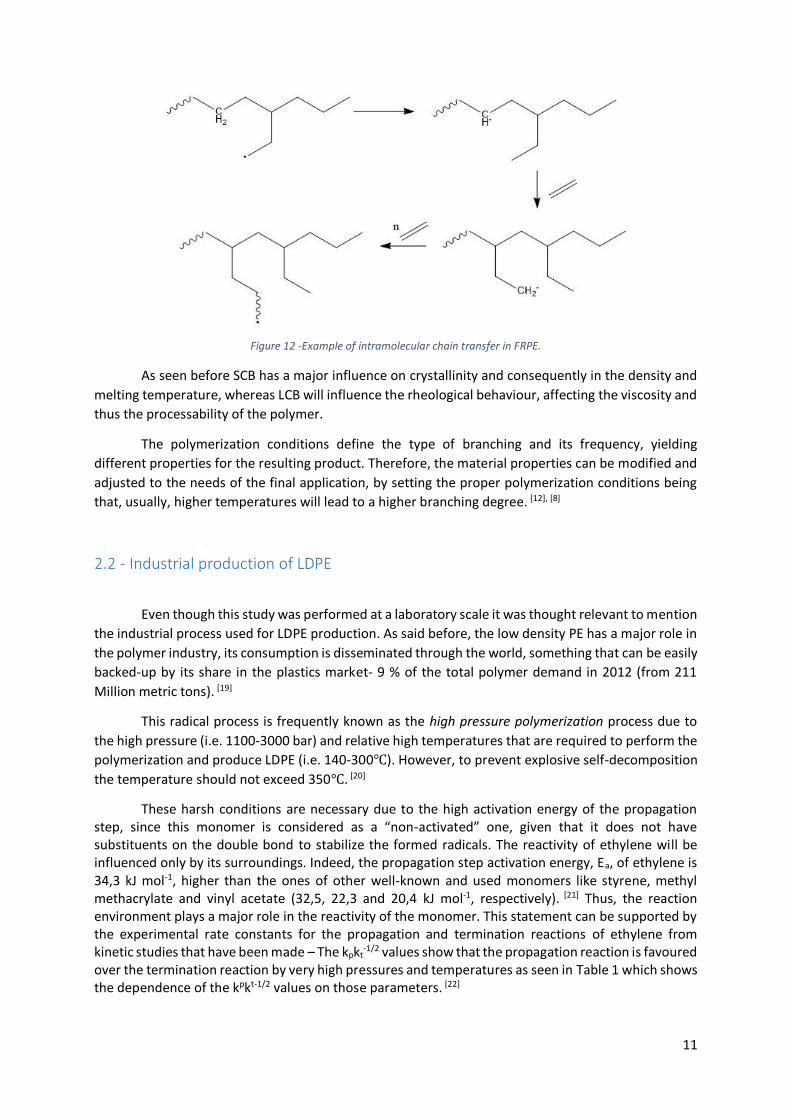
As seen before SCB has a major influence on crystallinity and consequently in the density and
melting temperature, whereas LCB will influence the rheological behaviour, affecting the viscosity and
thus the processability of the polymer.
The polymerization conditions define the type of branching and its frequency, yielding
different properties for the resulting product. Therefore, the material properties can be modified and
adjusted to the needs of the final application, by setting the proper polymerization conditions being
that, usually, higher temperatures will lead to a higher branching degree. [12], [8]
2.2 - Industrial production of LDPE
Even though this study was performed at a laboratory scale it was thought relevant to mention
the industrial process used for LDPE production. As said before, the low density PE has a major role in
the polymer industry, its consumption is disseminated through the world, something that can be easily
backed-up by its share in the plastics market- 9 % of the total polymer demand in 2012 (from 211
Million metric tons). [19]
This radical process is frequently known as the high pressure polymerization process due to
the high pressure (i.e. 1100-3000 bar) and relative high temperatures that are required to perform the
polymerization and produce LDPE (i.e. 140-300℃). However, to prevent explosive self-decomposition
the temperature should not exceed 350℃. [20]
These harsh conditions are necessary due to the high activation energy of the propagation step, since this monomer is considered as a “non-activated” one, given that it does not have substituents on the double bond to stabilize the formed radicals. The reactivity of ethylene will be influenced only by its surroundings. Indeed, the propagation step activation energy, Ea, of ethylene is 34,3 kJ mol-1, higher than the ones of other well-known and used monomers like styrene, methyl methacrylate and vinyl acetate (32,5, 22,3 and 20,4 kJ mol-1, respectively). [21] Thus, the reaction environment plays a major role in the reactivity of the monomer. This statement can be supported by the experimental rate constants for the propagation and termination reactions of ethylene from kinetic studies that have been made – The kpkt
-1/2 values show that the propagation reaction is favoured over the termination reaction by very high pressures and temperatures as seen in Table 1 which shows the dependence of the kpkt-1/2 values on those parameters. [22]
Figure 12 -Example of intramolecular chain transfer in FRPE.
12
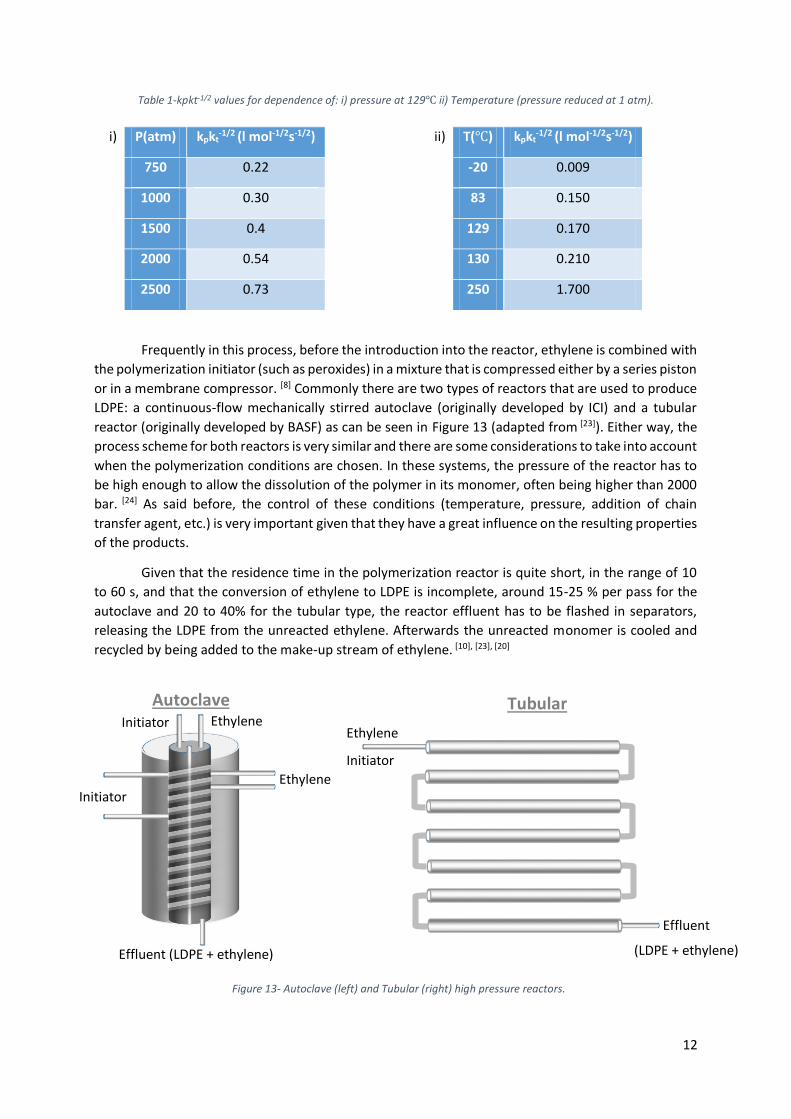
Table 1-kpkt-1/2 values for dependence of: i) pressure at 129℃ ii) Temperature (pressure reduced at 1 atm).
Frequently in this process, before the introduction into the reactor, ethylene is combined with
the polymerization initiator (such as peroxides) in a mixture that is compressed either by a series piston
or in a membrane compressor. [8] Commonly there are two types of reactors that are used to produce
LDPE: a continuous-flow mechanically stirred autoclave (originally developed by ICI) and a tubular
reactor (originally developed by BASF) as can be seen in Figure 13 (adapted from [23]). Either way, the
process scheme for both reactors is very similar and there are some considerations to take into account
when the polymerization conditions are chosen. In these systems, the pressure of the reactor has to
be high enough to allow the dissolution of the polymer in its monomer, often being higher than 2000
bar. [24] As said before, the control of these conditions (temperature, pressure, addition of chain
transfer agent, etc.) is very important given that they have a great influence on the resulting properties
of the products.
Given that the residence time in the polymerization reactor is quite short, in the range of 10
to 60 s, and that the conversion of ethylene to LDPE is incomplete, around 15-25 % per pass for the
autoclave and 20 to 40% for the tubular type, the reactor effluent has to be flashed in separators,
releasing the LDPE from the unreacted ethylene. Afterwards the unreacted monomer is cooled and
recycled by being added to the make-up stream of ethylene. [10], [23], [20]
i) P(atm) kpkt-1/2 (l mol-1/2s-1/2) ii) T(℃) kpkt
-1/2 (l mol-1/2s-1/2)
750 0.22 -20 0.009
1000 0.30 83 0.150
1500 0.4 129 0.170
2000 0.54 130 0.210
2500 0.73 250 1.700
Initiator Ethylene
Initiator Ethylene
Effluent (LDPE + ethylene)
Ethylene
Initiator
Effluent
(LDPE + ethylene)
Autoclave Tubular
Figure 13- Autoclave (left) and Tubular (right) high pressure reactors.
13
2.3 - Free radical ethylene Polymerization at C2P2 - LCPP
As stated above, the polymerization of ethylene via a free radical process occurs under very
harsh condition that can be potentially unsafe if not well controlled. Although feasible, these
polymerization condition are very difficult to reproduce on a research laboratory scale. Indeed, free
radical polymerization processes of ethylene involving relatively low pressures and temperatures
were, for a very long time, considered to be inefficient.
At C2P2 laboratories, an apparatus was design to perform the polymerization of ethylene
under mild conditions (pressure and temperature). Originally, the reactor was designed to study
catalytic or hybrid radical/catalytic homo- and co polymerization of ethylene under temperatures up
to 150℃ and 250 bar within safe conditions – the description of the reactor and auxiliary equipment
is presented in the following chapter (experimental chapter). [25] Until recently, it was common
knowledge that the LDPE production process could only be performed efficiently under very harsh
condition. However, during a blank experiment using a thermal initiator and an unusual solvent in that
reactor, it was found that indeed, the free radical polymerization of ethylene was possible under much
lower temperatures and pressures than the ones used in the industrial production if an unusual solvent
was used. [25]
Similar observations were reported in the 1970s when performing the polymerization of
ethylene in the pressure range from 100 to 500 bar in organic solvent or in water using a thermal
initiator or (gamma) radiation. [26] The results from the recent experiments allowed the C2P2 team to
reassess these researches considering the advances in the field of polymer chemistry since then, re-
opening a field of free radical polymerization of ethylene under a low pressure range (Pethylene< 300
bar). This allowed studying ethylene polymerizations using classical radical initiators, such as diazo
compounds (2,2'-Azobisisobutyronitrile (AIBN) for example). [27], [28]
Indeed, the effect of the solvent in the FRP of ethylene was notably studied at the C2P2. It was
shown that the solvent has a major influence on the polymerization activity and on the molecular
weight of the obtained polyethylenes. PE with either low molecular weight and high chain-end
functionality or non-functional/higher molecular weight can be synthesized according to the solvent
used. [27], [28] A number of organic solvents were thus studied, solvents including toluene,
dialkylcarbonates (Diethyl Carbonate, DEC and Dimethyl Carbonate, DMC) and Tetrahydrofuran, THF.
However, all the solvents did not lead to the same activation. It was found that the nonpolar ones were
less efficient than the polar ones. Some of the solvents (particularly THF, DMC and DEC) showed
interesting properties in terms of yield or molar masses.
The experiments of FRP of ethylene in toluene were performed at 70℃ in the range 10 to 250
bar using the diazo compound, AIBN, as initiator. This solvent was used in a first approach given that
it is a typical solvent for the slurry catalytic process under similar polymerization conditions. PE was
not formed for ethylene pressures under 50 bar and from 50 to 250 bar, the polymerization yielded a
very low quantity of PE (3% of conversion) with molar masses around 2300 gmol-1. [28]
When THF, was used as solvent at 100 bar of ethylene pressure, 3.9 g of PE were recovered (in
a system with 50 mg of AIBN and 50 mL of THF at 70℃ in 4 hours) and the molar mass was low, around
1200 g mol-1. [27]
14
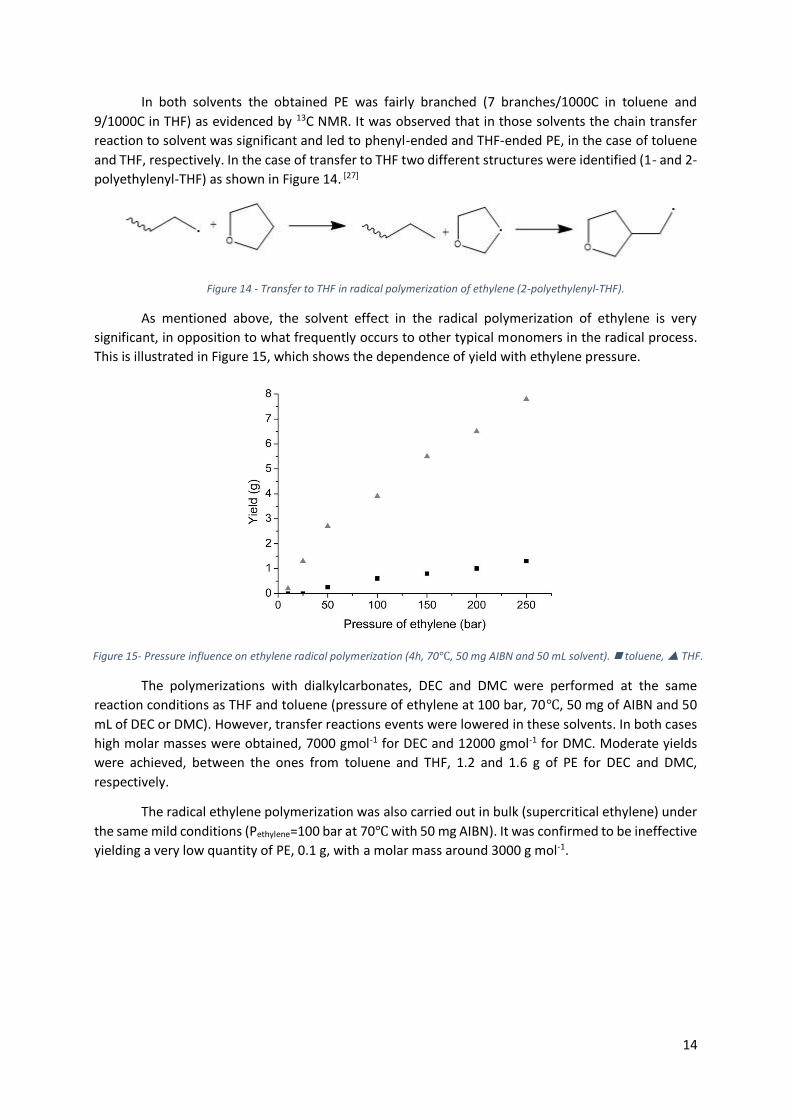
In both solvents the obtained PE was fairly branched (7 branches/1000C in toluene and
9/1000C in THF) as evidenced by 13C NMR. It was observed that in those solvents the chain transfer
reaction to solvent was significant and led to phenyl-ended and THF-ended PE, in the case of toluene
and THF, respectively. In the case of transfer to THF two different structures were identified (1- and 2-
polyethylenyl-THF) as shown in Figure 14. [27]
As mentioned above, the solvent effect in the radical polymerization of ethylene is very
significant, in opposition to what frequently occurs to other typical monomers in the radical process.
This is illustrated in Figure 15, which shows the dependence of yield with ethylene pressure.
The polymerizations with dialkylcarbonates, DEC and DMC were performed at the same
reaction conditions as THF and toluene (pressure of ethylene at 100 bar, 70℃, 50 mg of AIBN and 50
mL of DEC or DMC). However, transfer reactions events were lowered in these solvents. In both cases
high molar masses were obtained, 7000 gmol-1 for DEC and 12000 gmol-1 for DMC. Moderate yields
were achieved, between the ones from toluene and THF, 1.2 and 1.6 g of PE for DEC and DMC,
respectively.
The radical ethylene polymerization was also carried out in bulk (supercritical ethylene) under
the same mild conditions (Pethylene=100 bar at 70℃ with 50 mg AIBN). It was confirmed to be ineffective
yielding a very low quantity of PE, 0.1 g, with a molar mass around 3000 g mol-1.
Figure 15- Pressure influence on ethylene radical polymerization (4h, 70℃, 50 mg AIBN and 50 mL solvent). toluene, THF.
Figure 14 - Transfer to THF in radical polymerization of ethylene (2-polyethylenyl-THF).
15
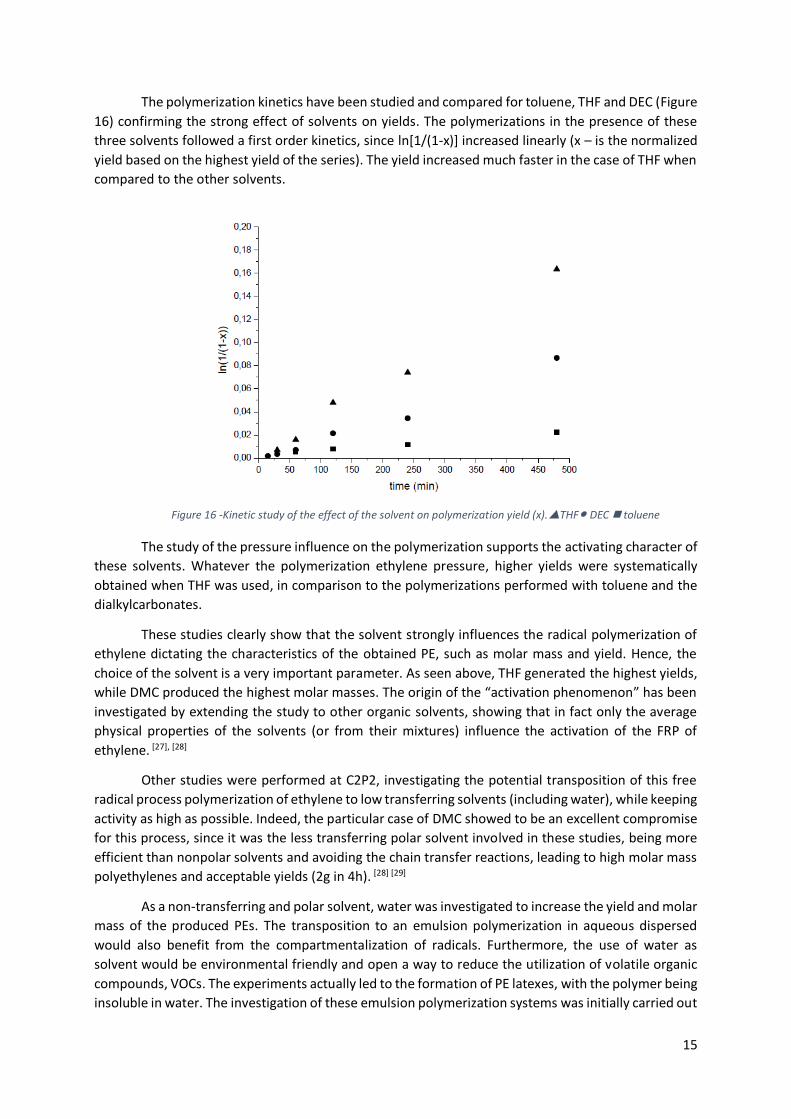
The polymerization kinetics have been studied and compared for toluene, THF and DEC (Figure
16) confirming the strong effect of solvents on yields. The polymerizations in the presence of these
three solvents followed a first order kinetics, since ln[1/(1-x)] increased linearly (x – is the normalized
yield based on the highest yield of the series). The yield increased much faster in the case of THF when
compared to the other solvents.
The study of the pressure influence on the polymerization supports the activating character of
these solvents. Whatever the polymerization ethylene pressure, higher yields were systematically
obtained when THF was used, in comparison to the polymerizations performed with toluene and the
dialkylcarbonates.
These studies clearly show that the solvent strongly influences the radical polymerization of
ethylene dictating the characteristics of the obtained PE, such as molar mass and yield. Hence, the
choice of the solvent is a very important parameter. As seen above, THF generated the highest yields,
while DMC produced the highest molar masses. The origin of the “activation phenomenon” has been
investigated by extending the study to other organic solvents, showing that in fact only the average
physical properties of the solvents (or from their mixtures) influence the activation of the FRP of
ethylene. [27], [28]
Other studies were performed at C2P2, investigating the potential transposition of this free
radical process polymerization of ethylene to low transferring solvents (including water), while keeping
activity as high as possible. Indeed, the particular case of DMC showed to be an excellent compromise
for this process, since it was the less transferring polar solvent involved in these studies, being more
efficient than nonpolar solvents and avoiding the chain transfer reactions, leading to high molar mass
polyethylenes and acceptable yields (2g in 4h). [28] [29]
As a non-transferring and polar solvent, water was investigated to increase the yield and molar
mass of the produced PEs. The transposition to an emulsion polymerization in aqueous dispersed
would also benefit from the compartmentalization of radicals. Furthermore, the use of water as
solvent would be environmental friendly and open a way to reduce the utilization of volatile organic
compounds, VOCs. The experiments actually led to the formation of PE latexes, with the polymer being
insoluble in water. The investigation of these emulsion polymerization systems was initially carried out
Figure 16 -Kinetic study of the effect of the solvent on polymerization yield (x).THF● DEC toluene
16
at C2P2 by E. Grau with a cationic system using a (cationic) water-soluble initiator, 2,2-azobis(2-
amidinopropane)dihydrochloride (AIBA) in water at 70 ℃, with and without a cationic surfactant
(cetyltrimethylammonium bromide, CTAB), which was used to help nucleation and particle
stabilization. [30]
Further studies in emulsion polymerization were then undertaken at C2P2 by G. Billuart who
performed additional characterization of PE nanoparticles obtained in the cationic systems and worked
on the development of anionic polymerizations systems. [30] [31] These studies will be detailed in the
next section of this manuscript.
2.4 - Emulsion polymerization: general mechanism
Emulsion polymerization leads to the production of a fine dispersion of a polymer in a
continuous medium, which most often is water; the dispersion is called latex. This type of
polymerization plays a major role in the free radical process.
Emulsion polymerization was first developed in industrial laboratories in the late 1920s for the
production of synthetic rubber latexes as an alternative to the use of natural rubber latexes in tyre
manufacture. With the WWII came the need to have a synthetic alternative to the highly demanded
natural rubber, and the emulsion process became a technology of great importance to the world. Since
then, with a worldwide annual production of around 20 Mtons this process has been applied to the
production of a wide range of products, from commodities to specialty polymers, including adhesives,
paints, textiles, construction materials, high-end medical products etc. [32], [33]
The reason for the great acceptance of synthetic polymer dispersions and its ubiquitous use
relies on the flexibility related to this process. Latex properties can be tailored to the application.
Indeed, the use of various types of monomers, processing methods, and additives during emulsion
polymerization, allows the synthesis of a wide variety of products with specialised properties. Emulsion
polymerization thus allows for the production of a broad range of particles in terms of size, particle
morphology, molecular weight, composition of the polymer and the surface functionality. These
features will define the properties of the final product.
In most other types of polymerizations, the rate of polymerization is inversely proportional to
the molar mass due to the large number of radicals necessary to produce a high polymerization rate,
which results in the formation of low molar mass polymers. However, in the case of emulsion
polymerization, the rate of polymerization and the molar mass can be simultaneously high as a result
of the segregation of radicals by compartmentalization within polymerizing particles. [31]
The low viscosities of polymer latexes permit a high rate of heat transfer during polymerization
and allow the latexes to flow over a substrate to be coated. Water can then be rapidly evaporated so
that the latex particles can coalesce to form a continuous polymer film. Water-based emulsion polymer
coatings are commonly used in the paper and pulp industry as a mean to reinforce and protect paper
from water (a study was performed on this subject at C2P2 with PE produced via emulsion
polymerization). These type of coatings are environmentally friendlier than solvent-based coatings.
Environmental regulations limit the release of VOCs, which discourages the use of solvent-based
polymer applications. [31] [34]
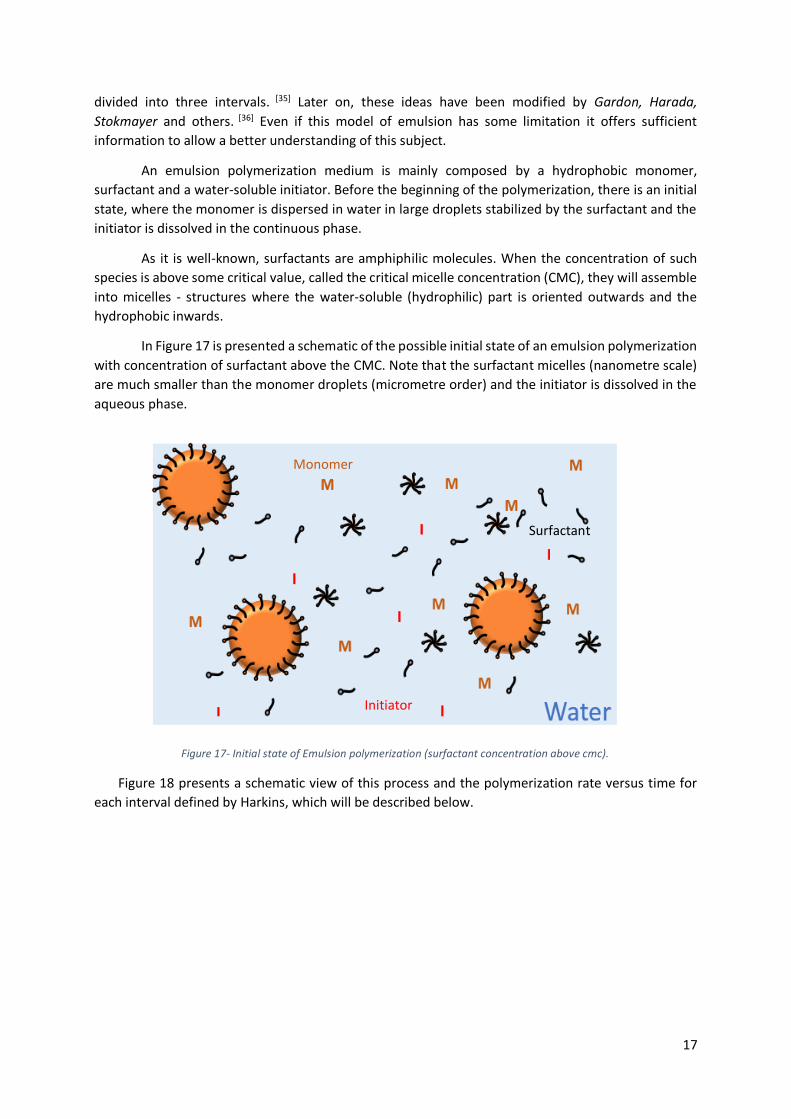
As first introduced and defined by Harkins in 1945 in the theory of the mechanism of emulsion
polymerization (with studies of nucleation in presence of surfactant) this process can be theoretically
17
divided into three intervals. [35] Later on, these ideas have been modified by Gardon, Harada,
Stokmayer and others. [36] Even if this model of emulsion has some limitation it offers sufficient
information to allow a better understanding of this subject.
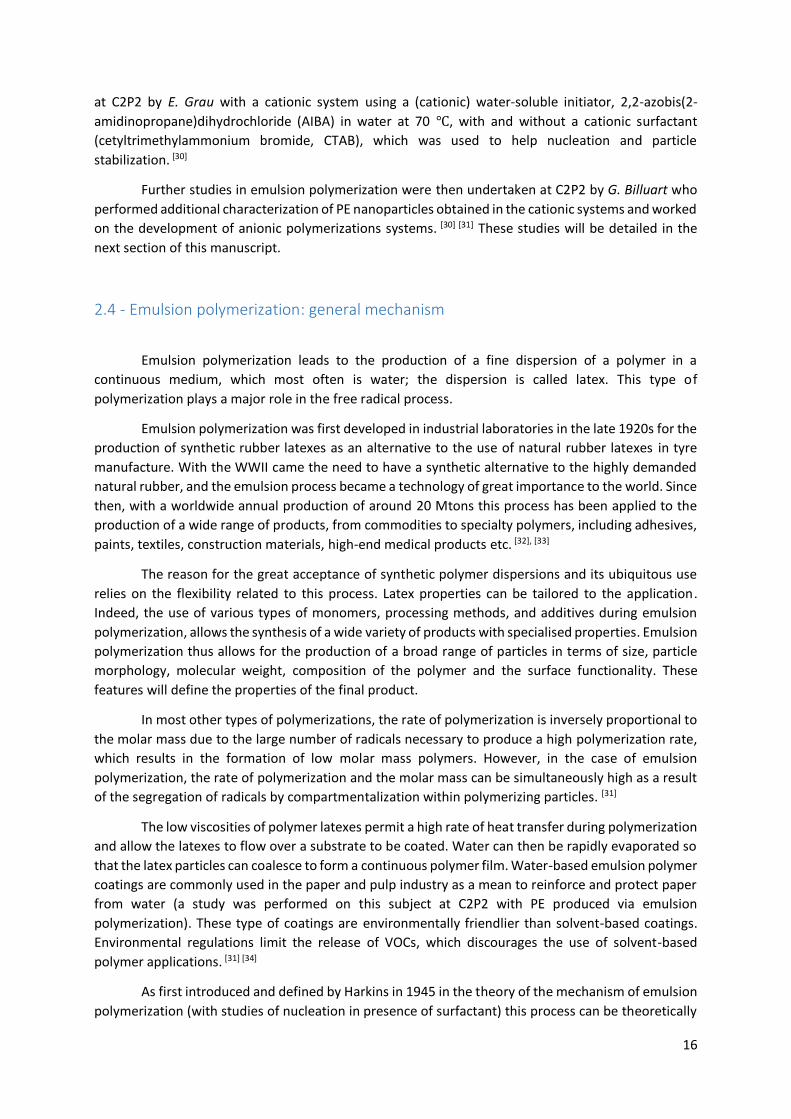
An emulsion polymerization medium is mainly composed by a hydrophobic monomer,
surfactant and a water-soluble initiator. Before the beginning of the polymerization, there is an initial
state, where the monomer is dispersed in water in large droplets stabilized by the surfactant and the
initiator is dissolved in the continuous phase.
As it is well-known, surfactants are amphiphilic molecules. When the concentration of such
species is above some critical value, called the critical micelle concentration (CMC), they will assemble
into micelles - structures where the water-soluble (hydrophilic) part is oriented outwards and the
hydrophobic inwards.
In Figure 17 is presented a schematic of the possible initial state of an emulsion polymerization
with concentration of surfactant above the CMC. Note that the surfactant micelles (nanometre scale)
are much smaller than the monomer droplets (micrometre order) and the initiator is dissolved in the
aqueous phase.
Figure 18 presents a schematic view of this process and the polymerization rate versus time for
each interval defined by Harkins, which will be described below.
Figure 17- Initial state of Emulsion polymerization (surfactant concentration above cmc).
Initiator
Monomer
Surfactant
18
Interval I –Nucleation
Polymerization occurs when an initiator-derived radical reacts with the monomer that is
present in the water phase and continues to propagate until it reaches a critical chain length where its
solubility in water diminishes greatly and it is forced to enter in a monomer-swollen micelle. In this
monomer-rich environment, the oligomer can rapidly propagate once that there is an enormous
quantity of monomer molecules.
This fast polymerization step requires a large consumption of surfactant molecules to stabilize
the formed particle surface, with the great majority of the micelles being consumed at this step. If the
surfactant concentration is above its CMC, the nucleation will cease when the surface area of the
particles is sufficient to reduce the amount of free surfactant below the CMC. In these systems, particle
formation thus occurs via micellar nucleation.
If the solubility of the hydrophobic monomer is high and/or in the absence of micelles, the
oligoradical chains can precipitate with themselves to form polymer particles. This is referred to as
homogeneous nucleation. [34]
Interval II – Particle growth This is the stage where the particles grow by consumption of the monomer present inside the
particles. Monomer droplets act as reservoirs, feeding the particles by monomer diffusion through the
aqueous phase, keeping the monomer concentration high and constant inside the particles. The
initiation is still taking place in water, with the formation of oligoradicals, which are constantly entering
the particles. The end of this interval occurs when all the monomer droplets have disappeared. [32]
Figure 18- Intervals in emulsion polymerization (from [34]).
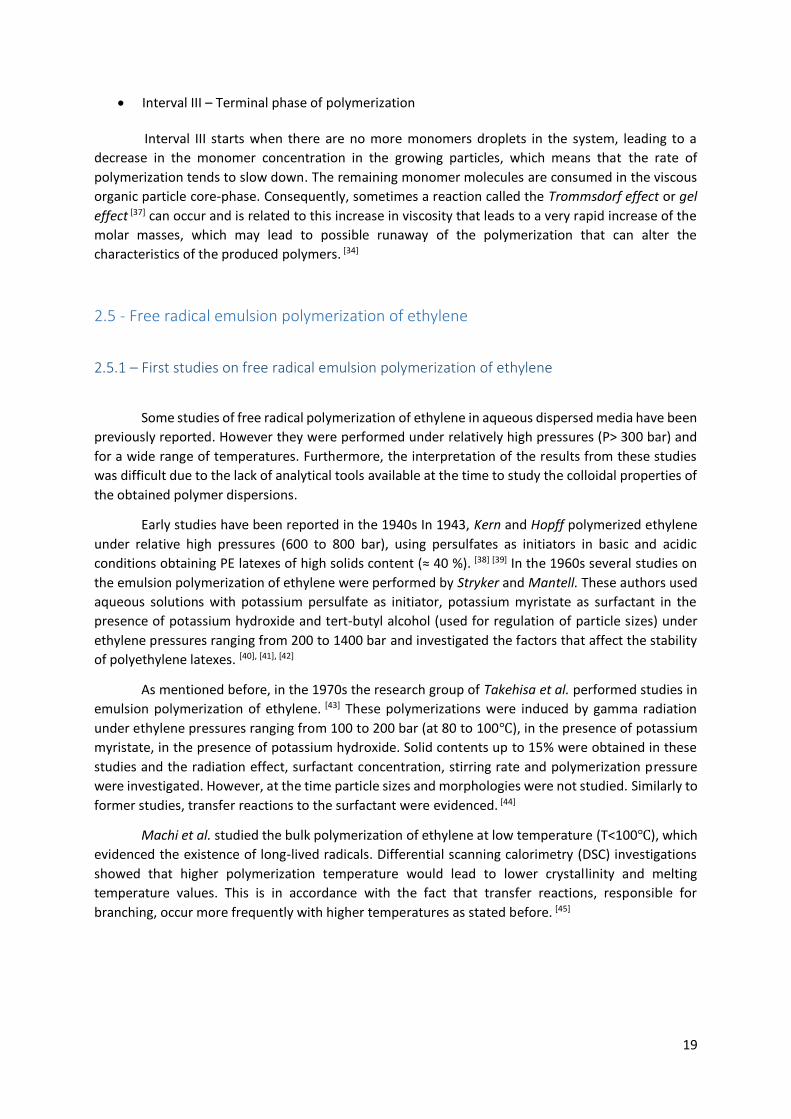
19
Interval III – Terminal phase of polymerization
Interval III starts when there are no more monomers droplets in the system, leading to a
decrease in the monomer concentration in the growing particles, which means that the rate of
polymerization tends to slow down. The remaining monomer molecules are consumed in the viscous
organic particle core-phase. Consequently, sometimes a reaction called the Trommsdorf effect or gel
effect [37] can occur and is related to this increase in viscosity that leads to a very rapid increase of the
molar masses, which may lead to possible runaway of the polymerization that can alter the
characteristics of the produced polymers. [34]
2.5 - Free radical emulsion polymerization of ethylene
2.5.1 – First studies on free radical emulsion polymerization of ethylene
Some studies of free radical polymerization of ethylene in aqueous dispersed media have been
previously reported. However they were performed under relatively high pressures (P> 300 bar) and
for a wide range of temperatures. Furthermore, the interpretation of the results from these studies
was difficult due to the lack of analytical tools available at the time to study the colloidal properties of
the obtained polymer dispersions.
Early studies have been reported in the 1940s In 1943, Kern and Hopff polymerized ethylene
under relative high pressures (600 to 800 bar), using persulfates as initiators in basic and acidic
conditions obtaining PE latexes of high solids content (≈ 40 %). [38] [39] In the 1960s several studies on
the emulsion polymerization of ethylene were performed by Stryker and Mantell. These authors used
aqueous solutions with potassium persulfate as initiator, potassium myristate as surfactant in the
presence of potassium hydroxide and tert-butyl alcohol (used for regulation of particle sizes) under
ethylene pressures ranging from 200 to 1400 bar and investigated the factors that affect the stability
of polyethylene latexes. [40], [41], [42]
As mentioned before, in the 1970s the research group of Takehisa et al. performed studies in
emulsion polymerization of ethylene. [43] These polymerizations were induced by gamma radiation
under ethylene pressures ranging from 100 to 200 bar (at 80 to 100℃), in the presence of potassium
myristate, in the presence of potassium hydroxide. Solid contents up to 15% were obtained in these
studies and the radiation effect, surfactant concentration, stirring rate and polymerization pressure
were investigated. However, at the time particle sizes and morphologies were not studied. Similarly to
former studies, transfer reactions to the surfactant were evidenced. [44]
Machi et al. studied the bulk polymerization of ethylene at low temperature (T<100℃), which
evidenced the existence of long-lived radicals. Differential scanning calorimetry (DSC) investigations
showed that higher polymerization temperature would lead to lower crystallinity and melting
temperature values. This is in accordance with the fact that transfer reactions, responsible for
branching, occur more frequently with higher temperatures as stated before. [45]
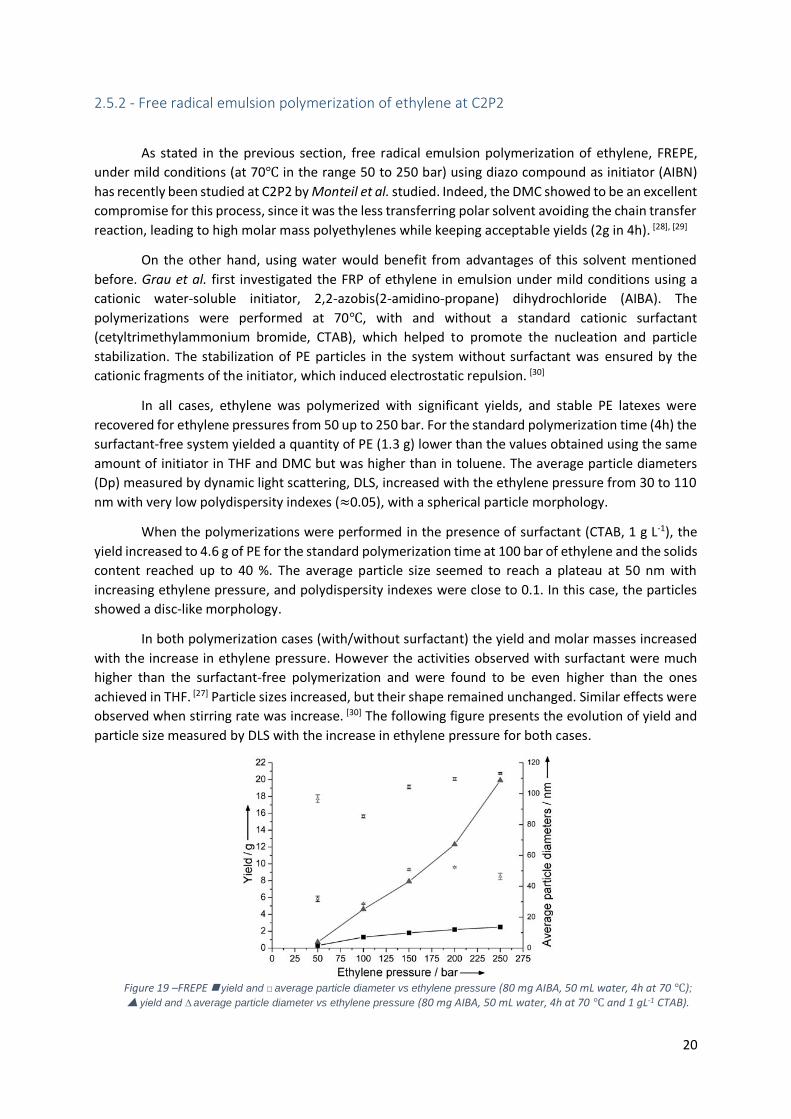
20
2.5.2 - Free radical emulsion polymerization of ethylene at C2P2
As stated in the previous section, free radical emulsion polymerization of ethylene, FREPE,
under mild conditions (at 70℃ in the range 50 to 250 bar) using diazo compound as initiator (AIBN)
has recently been studied at C2P2 by Monteil et al. studied. Indeed, the DMC showed to be an excellent
compromise for this process, since it was the less transferring polar solvent avoiding the chain transfer
reaction, leading to high molar mass polyethylenes while keeping acceptable yields (2g in 4h). [28], [29]
On the other hand, using water would benefit from advantages of this solvent mentioned
before. Grau et al. first investigated the FRP of ethylene in emulsion under mild conditions using a
cationic water-soluble initiator, 2,2-azobis(2-amidino-propane) dihydrochloride (AIBA). The
polymerizations were performed at 70℃, with and without a standard cationic surfactant
(cetyltrimethylammonium bromide, CTAB), which helped to promote the nucleation and particle
stabilization. The stabilization of PE particles in the system without surfactant was ensured by the
cationic fragments of the initiator, which induced electrostatic repulsion. [30]
In all cases, ethylene was polymerized with significant yields, and stable PE latexes were
recovered for ethylene pressures from 50 up to 250 bar. For the standard polymerization time (4h) the
surfactant-free system yielded a quantity of PE (1.3 g) lower than the values obtained using the same
amount of initiator in THF and DMC but was higher than in toluene. The average particle diameters
(Dp) measured by dynamic light scattering, DLS, increased with the ethylene pressure from 30 to 110
nm with very low polydispersity indexes (≈0.05), with a spherical particle morphology.
When the polymerizations were performed in the presence of surfactant (CTAB, 1 g L-1), the
yield increased to 4.6 g of PE for the standard polymerization time at 100 bar of ethylene and the solids
content reached up to 40 %. The average particle size seemed to reach a plateau at 50 nm with
increasing ethylene pressure, and polydispersity indexes were close to 0.1. In this case, the particles
showed a disc-like morphology.
In both polymerization cases (with/without surfactant) the yield and molar masses increased
with the increase in ethylene pressure. However the activities observed with surfactant were much
higher than the surfactant-free polymerization and were found to be even higher than the ones
achieved in THF. [27] Particle sizes increased, but their shape remained unchanged. Similar effects were
observed when stirring rate was increase. [30] The following figure presents the evolution of yield and
particle size measured by DLS with the increase in ethylene pressure for both cases.
Figure 19 –FREPE yield and □ average particle diameter vs ethylene pressure (80 mg AIBA, 50 mL water, 4h at 70 ℃); yield and ∆ average particle diameter vs ethylene pressure (80 mg AIBA, 50 mL water, 4h at 70 ℃ and 1 gL-1 CTAB).
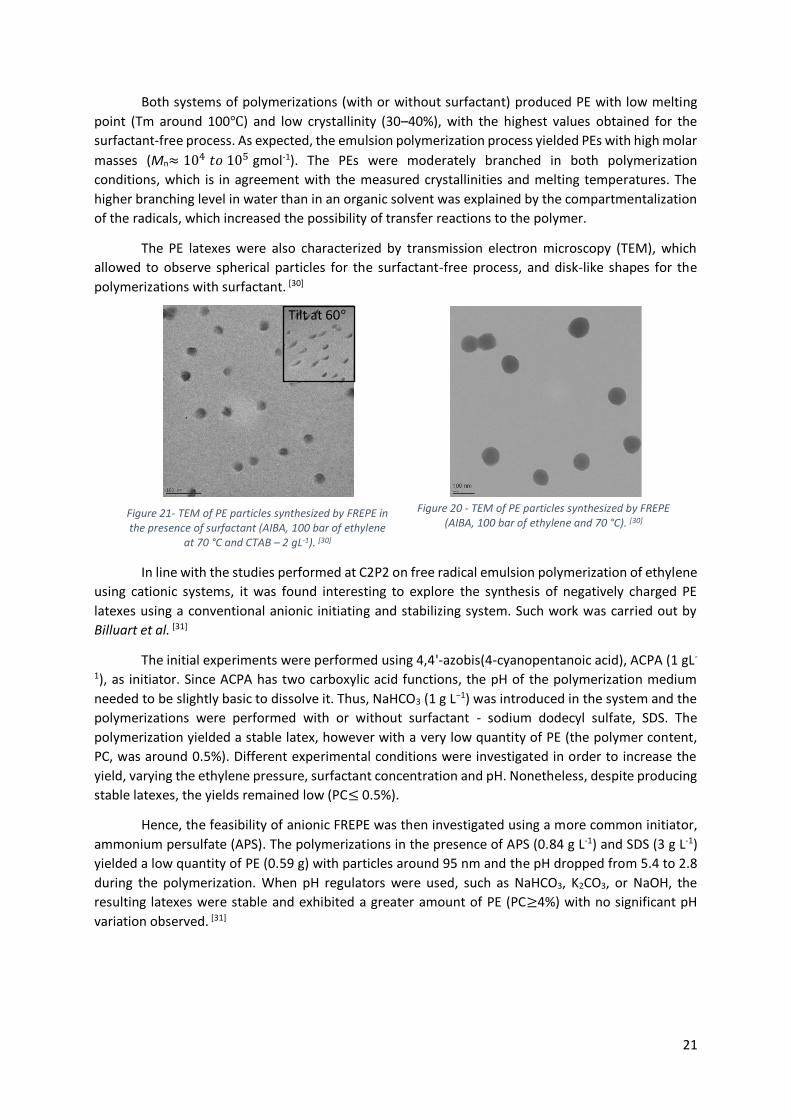
21
Both systems of polymerizations (with or without surfactant) produced PE with low melting
point (Tm around 100℃) and low crystallinity (30–40%), with the highest values obtained for the
surfactant-free process. As expected, the emulsion polymerization process yielded PEs with high molar
masses (Mn≈ 104 𝑡𝑜 105 gmol-1). The PEs were moderately branched in both polymerization
conditions, which is in agreement with the measured crystallinities and melting temperatures. The
higher branching level in water than in an organic solvent was explained by the compartmentalization
of the radicals, which increased the possibility of transfer reactions to the polymer.
The PE latexes were also characterized by transmission electron microscopy (TEM), which
allowed to observe spherical particles for the surfactant-free process, and disk-like shapes for the
polymerizations with surfactant. [30]
In line with the studies performed at C2P2 on free radical emulsion polymerization of ethylene
using cationic systems, it was found interesting to explore the synthesis of negatively charged PE
latexes using a conventional anionic initiating and stabilizing system. Such work was carried out by
Billuart et al. [31]
The initial experiments were performed using 4,4'-azobis(4-cyanopentanoic acid), ACPA (1 gL-
1), as initiator. Since ACPA has two carboxylic acid functions, the pH of the polymerization medium
needed to be slightly basic to dissolve it. Thus, NaHCO3 (1 g L−1) was introduced in the system and the
polymerizations were performed with or without surfactant - sodium dodecyl sulfate, SDS. The
polymerization yielded a stable latex, however with a very low quantity of PE (the polymer content,
PC, was around 0.5%). Different experimental conditions were investigated in order to increase the
yield, varying the ethylene pressure, surfactant concentration and pH. Nonetheless, despite producing
stable latexes, the yields remained low (PC≤ 0.5%).
Hence, the feasibility of anionic FREPE was then investigated using a more common initiator,
ammonium persulfate (APS). The polymerizations in the presence of APS (0.84 g L-1) and SDS (3 g L-1)
yielded a low quantity of PE (0.59 g) with particles around 95 nm and the pH dropped from 5.4 to 2.8
during the polymerization. When pH regulators were used, such as NaHCO3, K2CO3, or NaOH, the
resulting latexes were stable and exhibited a greater amount of PE (PC≥4%) with no significant pH
variation observed. [31]
Figure 21- TEM of PE particles synthesized by FREPE in the presence of surfactant (AIBA, 100 bar of ethylene
at 70 °C and CTAB – 2 gL-1). [30]
Tilt at 60°
Figure 20 - TEM of PE particles synthesized by FREPE (AIBA, 100 bar of ethylene and 70 °C). [30]
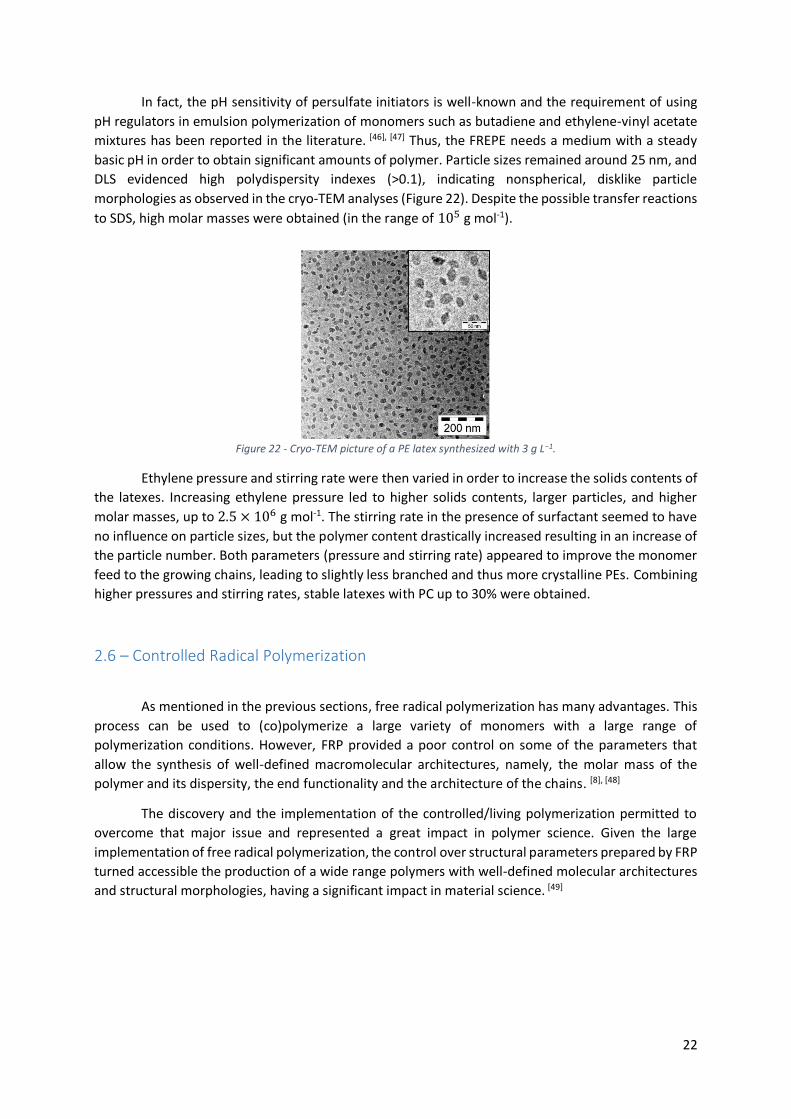
22
In fact, the pH sensitivity of persulfate initiators is well-known and the requirement of using
pH regulators in emulsion polymerization of monomers such as butadiene and ethylene-vinyl acetate
mixtures has been reported in the literature. [46], [47] Thus, the FREPE needs a medium with a steady
basic pH in order to obtain significant amounts of polymer. Particle sizes remained around 25 nm, and
DLS evidenced high polydispersity indexes (>0.1), indicating nonspherical, disklike particle
morphologies as observed in the cryo-TEM analyses (Figure 22). Despite the possible transfer reactions
to SDS, high molar masses were obtained (in the range of 105 g mol-1).
Ethylene pressure and stirring rate were then varied in order to increase the solids contents of
the latexes. Increasing ethylene pressure led to higher solids contents, larger particles, and higher
molar masses, up to 2.5 × 10⁶ g mol-1. The stirring rate in the presence of surfactant seemed to have
no influence on particle sizes, but the polymer content drastically increased resulting in an increase of
the particle number. Both parameters (pressure and stirring rate) appeared to improve the monomer
feed to the growing chains, leading to slightly less branched and thus more crystalline PEs. Combining
higher pressures and stirring rates, stable latexes with PC up to 30% were obtained.
2.6 – Controlled Radical Polymerization
As mentioned in the previous sections, free radical polymerization has many advantages. This
process can be used to (co)polymerize a large variety of monomers with a large range of
polymerization conditions. However, FRP provided a poor control on some of the parameters that
allow the synthesis of well-defined macromolecular architectures, namely, the molar mass of the
polymer and its dispersity, the end functionality and the architecture of the chains. [8], [48]
The discovery and the implementation of the controlled/living polymerization permitted to
overcome that major issue and represented a great impact in polymer science. Given the large
implementation of free radical polymerization, the control over structural parameters prepared by FRP
turned accessible the production of a wide range polymers with well-defined molecular architectures
and structural morphologies, having a significant impact in material science. [49]
Figure 22 - Cryo-TEM picture of a PE latex synthesized with 3 g L−1.
23
2.6.1 – General comments on controlled Radical Polymerization
In this section is present an introduction to the controlled radical polymerization, CRP, and its
relation with ethylene.
The CRP could not be approached without referring to the first reported living polymerization
systems. The term living polymer was first introduced by Michael Szwarc to describe the products of
the anionic polymerization of styrene initiated by electron transfer in THF. With experiments where
block copolymers were synthesized via sequential monomer addition, Szwarc inspired many more to
proceed with studies in this field. [49] As defined by Szwarc, the term living refers to a chain growth
process without chain breaking reactions, such as transfer and termination reactions. This living state
provides the ability to polymer chains to further add another monomer after the prior monomer batch
is consumed, allowing the synthesis of block copolymers. [8] In reality, it is difficult to completely
suppress those reactions so the subject has been discussed in terms of how rigorous it should be. Later
on Szwarc modified his definition to: “A polymerization is living when the resulting polymer retains its
integrity for a sufficiently long time to allow the operator to complete its task, whether a synthesis or
any desired observation or measurement. Even in that time some decomposition or isomerization may
occur, provided it is virtually undetectable and does not affect the results”. [49]
Hence, the living polymerization does not necessarily implies that the resulting polymer has a
controlled molar mass and a narrow molar mass distribution (low dispersity, Đ), with some additional
conditions being needed to actually achieve those objectives, such as the total consumption of initiator
in the early stage of polymerization and the fast exchange between several species of different
reactivities (at least as fast as the propagation step).
The term Controlled polymerization rose from the achievement of those criteria, being
suggested in 1987 by A. Müller and K. Matyjaszewski, and is defined as “a synthetic method to prepare
polymers, which are well-defined with respect to topology (e.g., linear, star-shaped, comb-shaped,
dendritic, and cyclic), terminal functionality, composition, and arrangement of comonomers (e.g.,
statistical, periodic, block, graft, and gradient), and which have molecular weights predetermined by
the ratio of concentrations of reacted monomer to introduced initiator, as well as a designed (not
necessarily narrow) molecular weight distribution, MWD”. [49]
Hence, even that in the ideal case a living polymerization should be controlled as well, that
does not necessarily always happens. On other hand, a controlled polymerization is also not always a
living polymerization.
This is particularly true in the field of CRP where bimolecular termination cannot be avoided.
The main methods of achieving CRP can be divided into two categories, through the mechanism
responsible for the reversible deactivation of the propagating radicals, which are balanced in an
equilibrium between the active and the dormant species, either via reversible termination or via
reversible (degenerative) chain transfer.
The most common techniques to control free radical polymerization are the Nitroxide-
Mediated Polymerization (NMP) and the Atom Transfer Radical Polymerization (ARTP) that belong to
the first category and the Degenerative Transfer polymerization (DT) or the Reversible Addition-
Fragmentation Chain Transfer (RAFT) polymerization belonging to the latter one. This last technique,
which has been used in the frame of this work, is detailed in the following paragraphs.
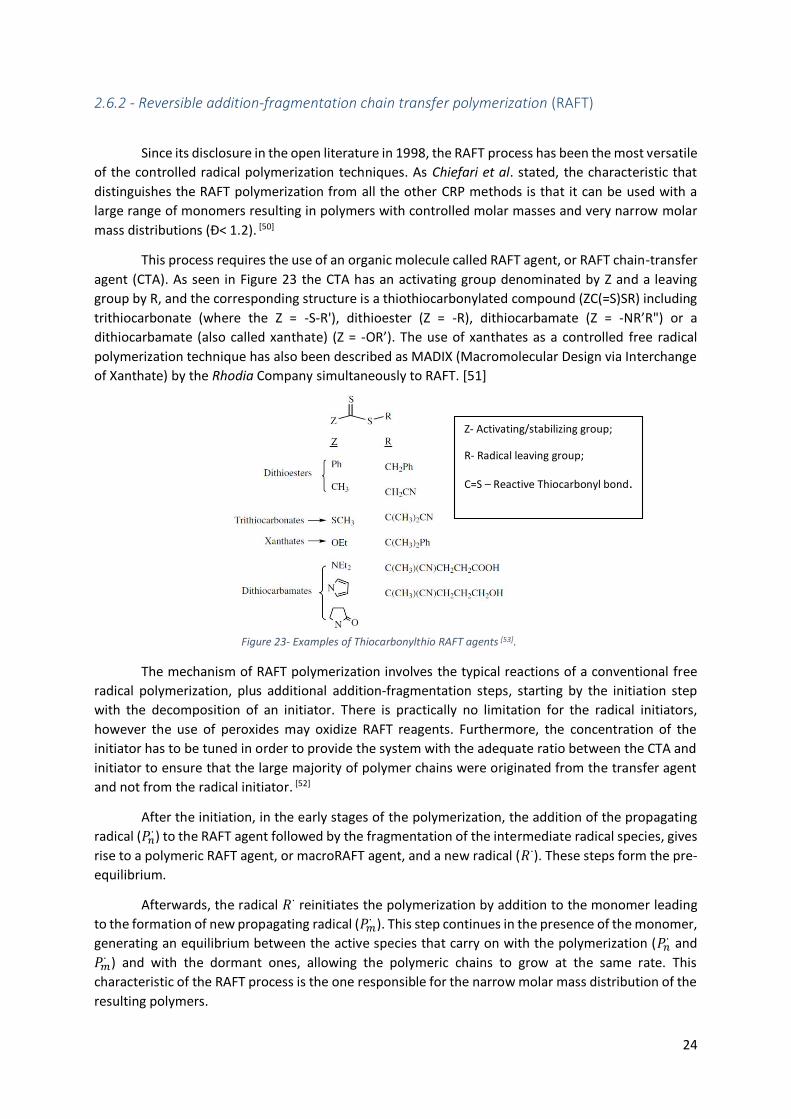
24
2.6.2 - Reversible addition-fragmentation chain transfer polymerization (RAFT)
Since its disclosure in the open literature in 1998, the RAFT process has been the most versatile
of the controlled radical polymerization techniques. As Chiefari et al. stated, the characteristic that
distinguishes the RAFT polymerization from all the other CRP methods is that it can be used with a
large range of monomers resulting in polymers with controlled molar masses and very narrow molar
mass distributions (Đ˂ 1.2). [50]
This process requires the use of an organic molecule called RAFT agent, or RAFT chain-transfer
agent (CTA). As seen in Figure 23 the CTA has an activating group denominated by Z and a leaving
group by R, and the corresponding structure is a thiothiocarbonylated compound (ZC(=S)SR) including
trithiocarbonate (where the Z = -S-R'), dithioester (Z = -R), dithiocarbamate (Z = -NR’R") or a
dithiocarbamate (also called xanthate) (Z = -OR’). The use of xanthates as a controlled free radical
polymerization technique has also been described as MADIX (Macromolecular Design via Interchange
of Xanthate) by the Rhodia Company simultaneously to RAFT. [51]
The mechanism of RAFT polymerization involves the typical reactions of a conventional free
radical polymerization, plus additional addition-fragmentation steps, starting by the initiation step
with the decomposition of an initiator. There is practically no limitation for the radical initiators,
however the use of peroxides may oxidize RAFT reagents. Furthermore, the concentration of the
initiator has to be tuned in order to provide the system with the adequate ratio between the CTA and
initiator to ensure that the large majority of polymer chains were originated from the transfer agent
and not from the radical initiator. [52]
After the initiation, in the early stages of the polymerization, the addition of the propagating
radical (𝑃𝑛∙ ) to the RAFT agent followed by the fragmentation of the intermediate radical species, gives
rise to a polymeric RAFT agent, or macroRAFT agent, and a new radical (𝑅∙). These steps form the pre-
equilibrium.
Afterwards, the radical 𝑅∙ reinitiates the polymerization by addition to the monomer leading
to the formation of new propagating radical (𝑃𝑚∙ ). This step continues in the presence of the monomer,
generating an equilibrium between the active species that carry on with the polymerization (𝑃𝑛∙ and
𝑃𝑚∙ ) and with the dormant ones, allowing the polymeric chains to grow at the same rate. This
characteristic of the RAFT process is the one responsible for the narrow molar mass distribution of the
resulting polymers.
Z- Activating/stabilizing group;
R- Radical leaving group;
C=S – Reactive Thiocarbonyl bond.
Figure 23- Examples of Thiocarbonylthio RAFT agents [53].
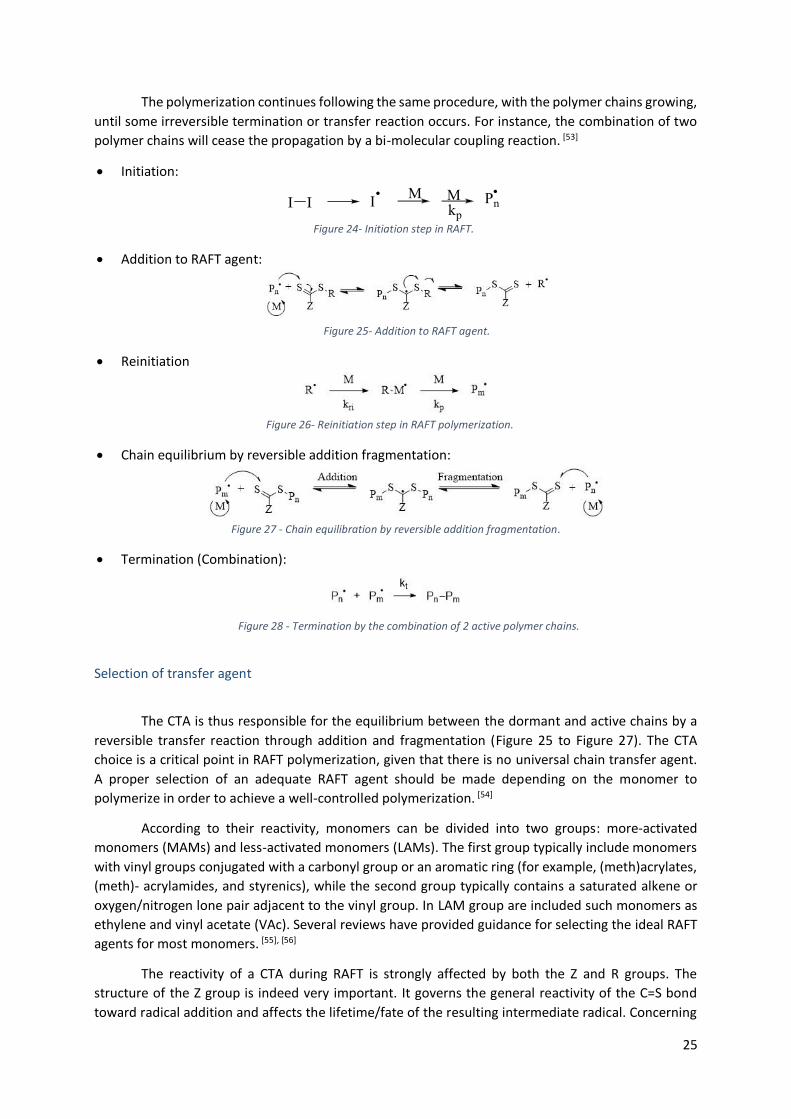
25
The polymerization continues following the same procedure, with the polymer chains growing,
until some irreversible termination or transfer reaction occurs. For instance, the combination of two
polymer chains will cease the propagation by a bi-molecular coupling reaction. [53]
Initiation:
Addition to RAFT agent:
Reinitiation
Chain equilibrium by reversible addition fragmentation:
Termination (Combination):
Selection of transfer agent
The CTA is thus responsible for the equilibrium between the dormant and active chains by a
reversible transfer reaction through addition and fragmentation (Figure 25 to Figure 27). The CTA
choice is a critical point in RAFT polymerization, given that there is no universal chain transfer agent.
A proper selection of an adequate RAFT agent should be made depending on the monomer to
polymerize in order to achieve a well-controlled polymerization. [54]
According to their reactivity, monomers can be divided into two groups: more-activated
monomers (MAMs) and less-activated monomers (LAMs). The first group typically include monomers
with vinyl groups conjugated with a carbonyl group or an aromatic ring (for example, (meth)acrylates,
(meth)- acrylamides, and styrenics), while the second group typically contains a saturated alkene or
oxygen/nitrogen lone pair adjacent to the vinyl group. In LAM group are included such monomers as
ethylene and vinyl acetate (VAc). Several reviews have provided guidance for selecting the ideal RAFT
agents for most monomers. [55], [56]
The reactivity of a CTA during RAFT is strongly affected by both the Z and R groups. The
structure of the Z group is indeed very important. It governs the general reactivity of the C=S bond
toward radical addition and affects the lifetime/fate of the resulting intermediate radical. Concerning
Figure 24- Initiation step in RAFT.
Figure 25- Addition to RAFT agent.
Figure 26- Reinitiation step in RAFT polymerization.
Figure 27 - Chain equilibration by reversible addition fragmentation.
Figure 28 - Termination by the combination of 2 active polymer chains.
26
the R group, should be a good homolytic leaving group, being more stable than 𝑃𝑛∙ , in order to be
formed and be able to reinitiate the polymerization. [49]
The RAFT agents such as dithioesters or trithiocarbonates suitable for controlling
polymerization of more-activated monomers inhibit or retard polymerizations of less-activated
monomers. Similarly RAFT agents suitable for controlling polymerizations of LAMs, such as xanthates,
tend to be ineffective with MAMs. The reduced effectiveness of the dithiocarbamate RAFT agents with
MAMs relates to their lower reactivity toward radical addition and consequent smaller transfer
constants. The double-bond character of the thiocarbonyl is reduced by the contribution of
zwitterionic canonical forms that localize a positive charge on nitrogen and a negative charge on sulfur. [55]
On the other hand, the tendency of dithioesters or trithiocarbonates to inhibit polymerization
of LAMs is due to the poor ability of the radical leaving-group to propagate species with a terminal
LAM unit. Dithiocarbamates that possess electron-withdrawing groups adjacent to nitrogen or where
the nitrogen lone pair is part of an aromatic ring system are effective with MAMs but inhibit
polymerizations of LAMs. [54], [55]
Hence, if the stabilizing effect of the Z groups is strong, as the one of phenyl groups, they will
be very efficient for such monomers as styrene and methacrylate. However, the Ph groups have a
setback because they will stabilize the intermediate radical, resulting in the retardation of the
polymerization of acrylates, for example, and the inhibition of the polymerization of vinyl esters, such
as vinyl acetate, and ethylene. On the other hand, very weakly stabilizing groups, such as –OR in
xanthates can have the opposite effect in styrene although they perform well with vinyl esters. [49]
2.7 - Controlled radical polymerization of ethylene by RAFT at C2P2
As seen in this section a controlled radical polymerization can be achieved from various
techniques. However, none of these techniques were successfully applied to control ethylene
polymerization. As previously mentioned, the FRP of ethylene typically yields PE with large molar mass
distributions and results in branching via backbiting. This, combined with the unstabilized nature of
ethylene makes difficult the control of ethylene polymerization via RAFT. Furthermore, the conditions
that are normally involved in the synthesis of PE through radical polymerization are very harsh, which
increases the difficulty to control the macromolecular architecture. Thus, it was appealing to identify
original ways to polymerize ethylene under conditions that allow the fine control of the chain growth
through a free radical process. [57]
Indeed, taking advantage of the recent progress from the C2P2 team in efficiently performing
the free radical polymerization of ethylene under mild conditions, and considering ethylene as a LAM,
the team investigated the RAFT polymerization of ethylene mediated by xanthates. [27], [28] This study
was carried out by Dommanget et al. constituting the first example of a controlled radical
polymerization of ethylene using RAFT in the presence of xanthates. [57]
The selected xanthates are shown in Figure 29. Relying on the knowledge gained from the
studies on the FRP of ethylene, dimethylcarbonate, DMC was chosen as the solvent. Indeed it was
demonstrated that in order to minimize irreversible chain-transfer reactions while maintaining an
acceptable yield, the use of DMC, was essential. The polymerizations were thus performed in this
solvent in the presence of AIBN as initiator at 200 bar and 70℃. [27], [29]
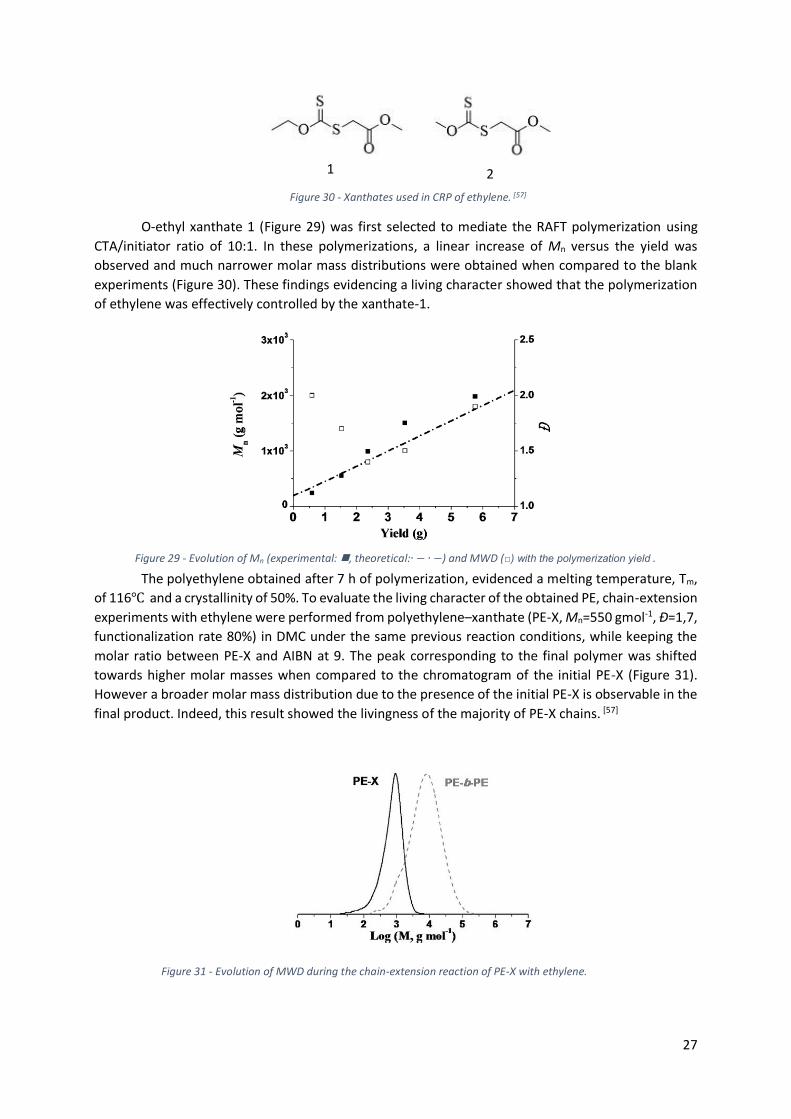
27
O-ethyl xanthate 1 (Figure 29) was first selected to mediate the RAFT polymerization using
CTA/initiator ratio of 10:1. In these polymerizations, a linear increase of Mn versus the yield was
observed and much narrower molar mass distributions were obtained when compared to the blank
experiments (Figure 30). These findings evidencing a living character showed that the polymerization
of ethylene was effectively controlled by the xanthate-1.
The polyethylene obtained after 7 h of polymerization, evidenced a melting temperature, Tm,
of 116℃ and a crystallinity of 50%. To evaluate the living character of the obtained PE, chain-extension
experiments with ethylene were performed from polyethylene–xanthate (PE-X, Mn=550 gmol-1, Đ=1,7,
functionalization rate 80%) in DMC under the same previous reaction conditions, while keeping the
molar ratio between PE-X and AIBN at 9. The peak corresponding to the final polymer was shifted
towards higher molar masses when compared to the chromatogram of the initial PE-X (Figure 31).
However a broader molar mass distribution due to the presence of the initial PE-X is observable in the
final product. Indeed, this result showed the livingness of the majority of PE-X chains. [57]
Figure 29 - Evolution of Mn (experimental: , theoretical:∙ − ∙ −) and MWD (□) with the polymerization yield .
1 2
Figure 30 - Xanthates used in CRP of ethylene. [57]
Figure 31 - Evolution of MWD during the chain-extension reaction of PE-X with ethylene.
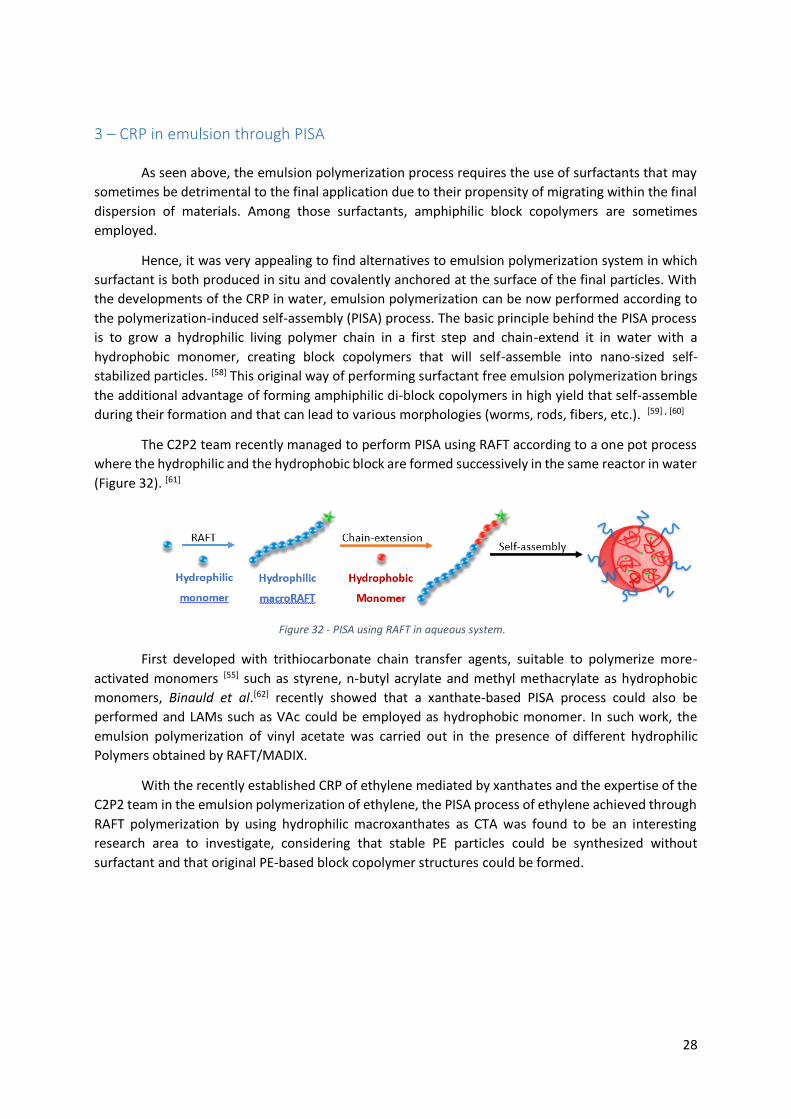
28
3 – CRP in emulsion through PISA
As seen above, the emulsion polymerization process requires the use of surfactants that may
sometimes be detrimental to the final application due to their propensity of migrating within the final
dispersion of materials. Among those surfactants, amphiphilic block copolymers are sometimes
employed.
Hence, it was very appealing to find alternatives to emulsion polymerization system in which
surfactant is both produced in situ and covalently anchored at the surface of the final particles. With
the developments of the CRP in water, emulsion polymerization can be now performed according to
the polymerization-induced self-assembly (PISA) process. The basic principle behind the PISA process
is to grow a hydrophilic living polymer chain in a first step and chain-extend it in water with a
hydrophobic monomer, creating block copolymers that will self-assemble into nano-sized self-
stabilized particles. [58] This original way of performing surfactant free emulsion polymerization brings
the additional advantage of forming amphiphilic di-block copolymers in high yield that self-assemble
during their formation and that can lead to various morphologies (worms, rods, fibers, etc.). [59] , [60]
The C2P2 team recently managed to perform PISA using RAFT according to a one pot process
where the hydrophilic and the hydrophobic block are formed successively in the same reactor in water
(Figure 32). [61]
First developed with trithiocarbonate chain transfer agents, suitable to polymerize more-
activated monomers [55] such as styrene, n-butyl acrylate and methyl methacrylate as hydrophobic
monomers, Binauld et al.[62] recently showed that a xanthate-based PISA process could also be
performed and LAMs such as VAc could be employed as hydrophobic monomer. In such work, the
emulsion polymerization of vinyl acetate was carried out in the presence of different hydrophilic
Polymers obtained by RAFT/MADIX.
With the recently established CRP of ethylene mediated by xanthates and the expertise of the
C2P2 team in the emulsion polymerization of ethylene, the PISA process of ethylene achieved through
RAFT polymerization by using hydrophilic macroxanthates as CTA was found to be an interesting
research area to investigate, considering that stable PE particles could be synthesized without
surfactant and that original PE-based block copolymer structures could be formed.
Figure 32 - PISA using RAFT in aqueous system.
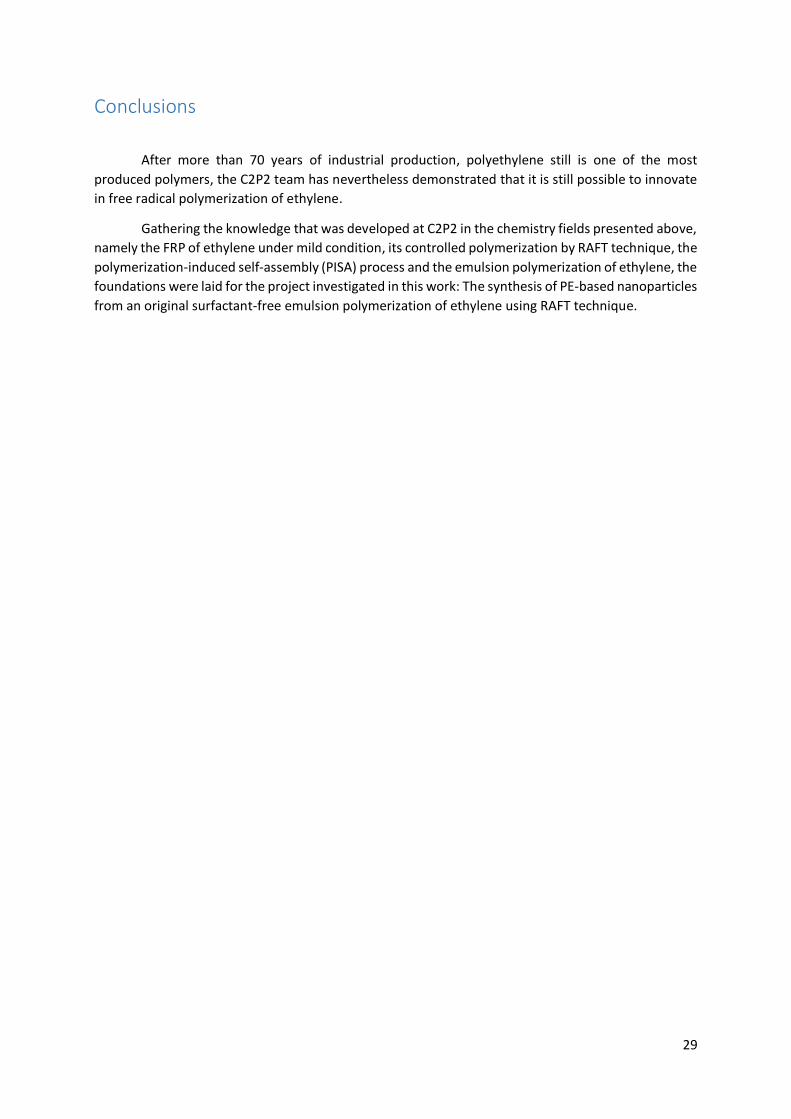
29
Conclusions
After more than 70 years of industrial production, polyethylene still is one of the most
produced polymers, the C2P2 team has nevertheless demonstrated that it is still possible to innovate
in free radical polymerization of ethylene.
Gathering the knowledge that was developed at C2P2 in the chemistry fields presented above,
namely the FRP of ethylene under mild condition, its controlled polymerization by RAFT technique, the
polymerization-induced self-assembly (PISA) process and the emulsion polymerization of ethylene, the
foundations were laid for the project investigated in this work: The synthesis of PE-based nanoparticles
from an original surfactant-free emulsion polymerization of ethylene using RAFT technique.

30
This page was left intentionally in blank.
31
Chapter II – Experimental part

32
This page was left intentionally in blank.
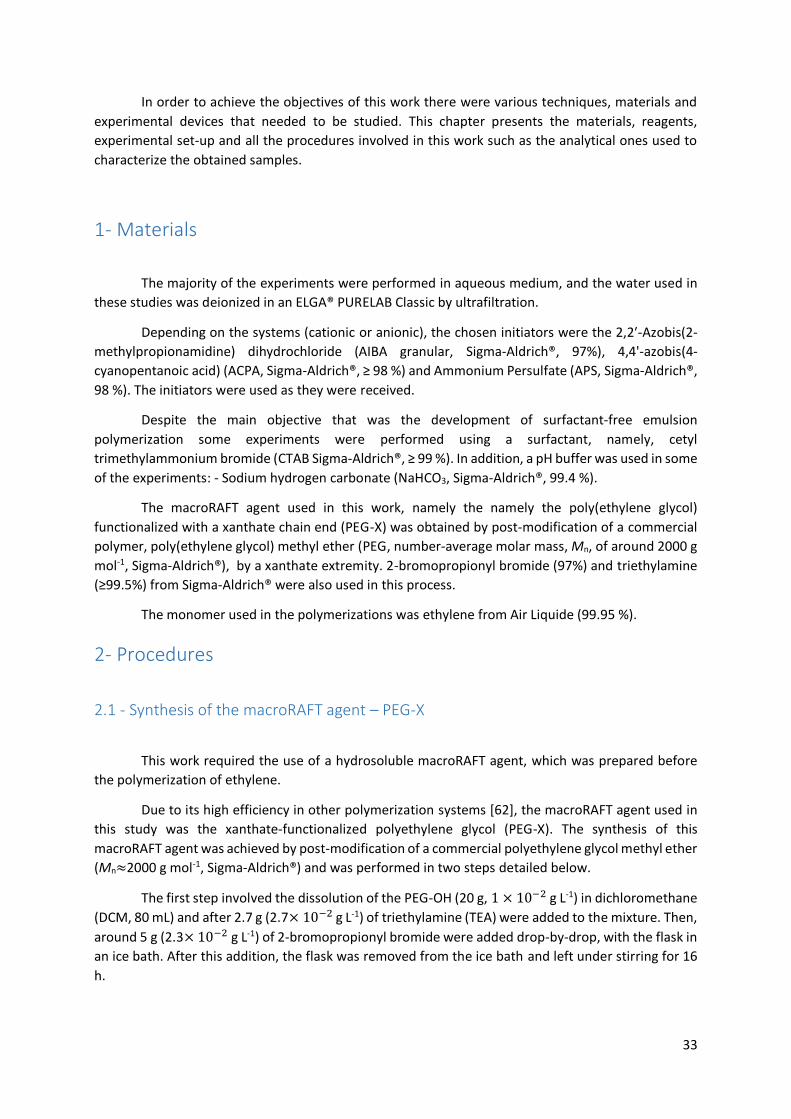
33
In order to achieve the objectives of this work there were various techniques, materials and
experimental devices that needed to be studied. This chapter presents the materials, reagents,
experimental set-up and all the procedures involved in this work such as the analytical ones used to
characterize the obtained samples.
1- Materials
The majority of the experiments were performed in aqueous medium, and the water used in
these studies was deionized in an ELGA® PURELAB Classic by ultrafiltration.
Depending on the systems (cationic or anionic), the chosen initiators were the 2,2′-Azobis(2-
methylpropionamidine) dihydrochloride (AIBA granular, Sigma-Aldrich®, 97%), 4,4'-azobis(4-
cyanopentanoic acid) (ACPA, Sigma-Aldrich®, ≥ 98 %) and Ammonium Persulfate (APS, Sigma-Aldrich®,
98 %). The initiators were used as they were received.
Despite the main objective that was the development of surfactant-free emulsion
polymerization some experiments were performed using a surfactant, namely, cetyl
trimethylammonium bromide (CTAB Sigma-Aldrich®, ≥ 99 %). In addition, a pH buffer was used in some
of the experiments: - Sodium hydrogen carbonate (NaHCO3, Sigma-Aldrich®, 99.4 %).
The macroRAFT agent used in this work, namely the namely the poly(ethylene glycol)
functionalized with a xanthate chain end (PEG-X) was obtained by post-modification of a commercial
polymer, poly(ethylene glycol) methyl ether (PEG, number-average molar mass, Mn, of around 2000 g
mol-1, Sigma-Aldrich®), by a xanthate extremity. 2-bromopropionyl bromide (97%) and triethylamine
(≥99.5%) from Sigma-Aldrich® were also used in this process.
The monomer used in the polymerizations was ethylene from Air Liquide (99.95 %).
2- Procedures
2.1 - Synthesis of the macroRAFT agent – PEG-X
This work required the use of a hydrosoluble macroRAFT agent, which was prepared before
the polymerization of ethylene.
Due to its high efficiency in other polymerization systems [62], the macroRAFT agent used in
this study was the xanthate-functionalized polyethylene glycol (PEG-X). The synthesis of this
macroRAFT agent was achieved by post-modification of a commercial polyethylene glycol methyl ether
(Mn≈2000 g mol-1, Sigma-Aldrich®) and was performed in two steps detailed below.
The first step involved the dissolution of the PEG-OH (20 g, 1 × 10⁻² g L-1) in dichloromethane
(DCM, 80 mL) and after 2.7 g (2.7× 10⁻² g L-1) of triethylamine (TEA) were added to the mixture. Then,
around 5 g (2.3× 10⁻² g L-1) of 2-bromopropionyl bromide were added drop-by-drop, with the flask in
an ice bath. After this addition, the flask was removed from the ice bath and left under stirring for 16
h.
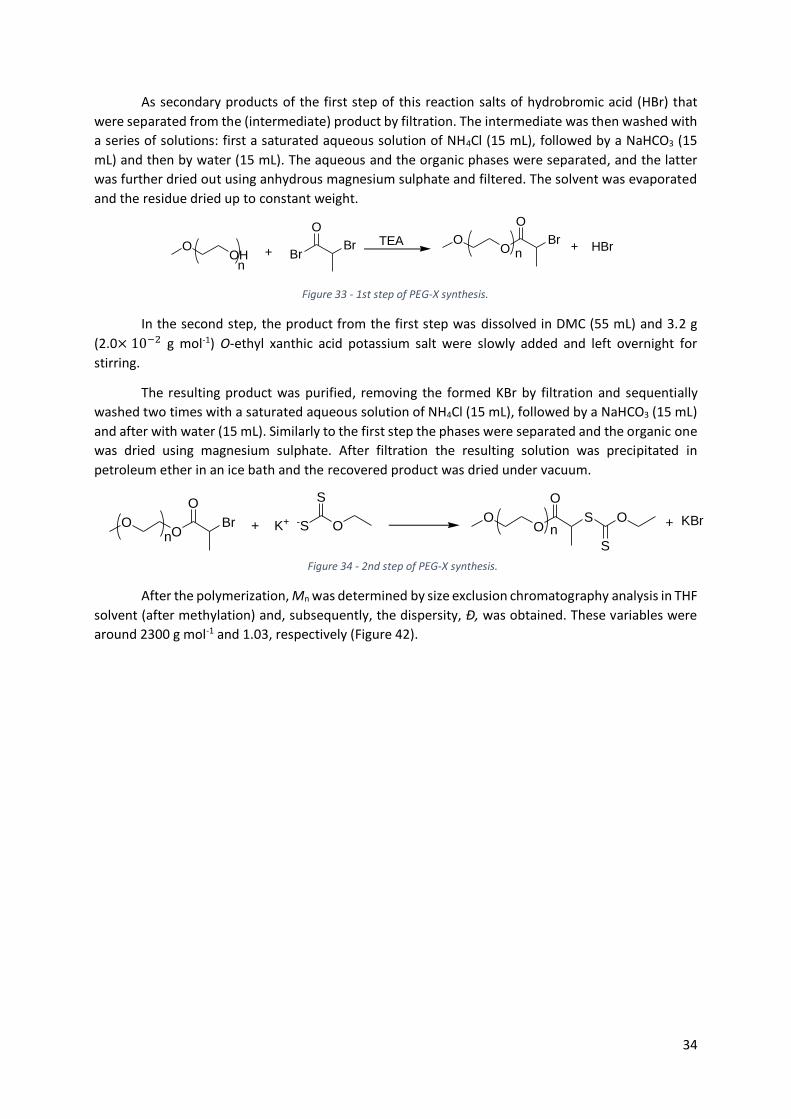
34
As secondary products of the first step of this reaction salts of hydrobromic acid (HBr) that
were separated from the (intermediate) product by filtration. The intermediate was then washed with
a series of solutions: first a saturated aqueous solution of NH4Cl (15 mL), followed by a NaHCO3 (15
mL) and then by water (15 mL). The aqueous and the organic phases were separated, and the latter
was further dried out using anhydrous magnesium sulphate and filtered. The solvent was evaporated
and the residue dried up to constant weight.
In the second step, the product from the first step was dissolved in DMC (55 mL) and 3.2 g
(2.0× 10⁻² g mol-1) O-ethyl xanthic acid potassium salt were slowly added and left overnight for
stirring.
The resulting product was purified, removing the formed KBr by filtration and sequentially
washed two times with a saturated aqueous solution of NH4Cl (15 mL), followed by a NaHCO3 (15 mL)
and after with water (15 mL). Similarly to the first step the phases were separated and the organic one
was dried using magnesium sulphate. After filtration the resulting solution was precipitated in
petroleum ether in an ice bath and the recovered product was dried under vacuum.
After the polymerization, Mn was determined by size exclusion chromatography analysis in THF
solvent (after methylation) and, subsequently, the dispersity, Đ, was obtained. These variables were
around 2300 g mol-1 and 1.03, respectively (Figure 42).
OOH
nBr
Br
O
+ +TEA OO n
Br
O
HBr
Figure 33 - 1st step of PEG-X synthesis.
OOn
Br
O
+ -S O
S
K+ OO n
S
O
O
S
+ KBr
Figure 34 - 2nd step of PEG-X synthesis.
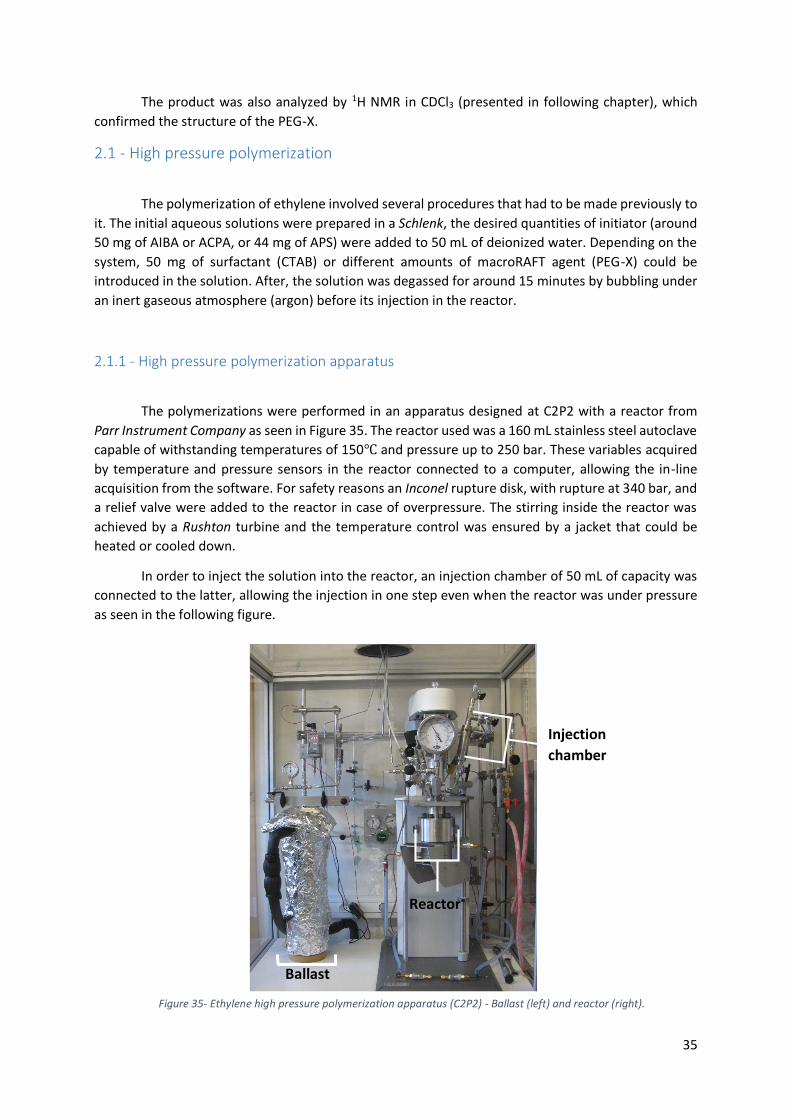
35
The product was also analyzed by 1H NMR in CDCl3 (presented in following chapter), which
confirmed the structure of the PEG-X.
2.1 - High pressure polymerization
The polymerization of ethylene involved several procedures that had to be made previously to
it. The initial aqueous solutions were prepared in a Schlenk, the desired quantities of initiator (around
50 mg of AIBA or ACPA, or 44 mg of APS) were added to 50 mL of deionized water. Depending on the
system, 50 mg of surfactant (CTAB) or different amounts of macroRAFT agent (PEG-X) could be
introduced in the solution. After, the solution was degassed for around 15 minutes by bubbling under
an inert gaseous atmosphere (argon) before its injection in the reactor.
2.1.1 - High pressure polymerization apparatus
The polymerizations were performed in an apparatus designed at C2P2 with a reactor from
Parr Instrument Company as seen in Figure 35. The reactor used was a 160 mL stainless steel autoclave
capable of withstanding temperatures of 150℃ and pressure up to 250 bar. These variables acquired
by temperature and pressure sensors in the reactor connected to a computer, allowing the in-line
acquisition from the software. For safety reasons an Inconel rupture disk, with rupture at 340 bar, and
a relief valve were added to the reactor in case of overpressure. The stirring inside the reactor was
achieved by a Rushton turbine and the temperature control was ensured by a jacket that could be
heated or cooled down.
In order to inject the solution into the reactor, an injection chamber of 50 mL of capacity was
connected to the latter, allowing the injection in one step even when the reactor was under pressure
as seen in the following figure.
Figure 35- Ethylene high pressure polymerization apparatus (C2P2) - Ballast (left) and reactor (right).
Ballast
Reactor
Injection
chamber
36
2.2 - Free radical emulsion of ethylene
Before starting the polymerization, the reactor undergoes successive cycles of argon
pressurization and vacuum atmospheres. Meanwhile the reactor was preheated to the desired
polymerization temperature. The initial solution, which previously had been under an argon
atmosphere, was transferred to the injection chamber through a cannula, pushed by argon.
After the injection chamber was filled with the solution and the inert conditions were set, the
solution was loaded into the reactor and the ethylene was immediately introduced in order to initiate
the polymerization. Since it was a semi-batch polymerization system, the pressure of ethylene
decreased as the reaction went on, so it was necessary to frequently add ethylene to keep the reactor
in isobaric conditions.
To provide the necessary ethylene pressure for the experiments, a 1.5 liter steel ballast (on the
left of Figure 35) was used in this apparatus instead of high pressure compressors (ethylene was
supplied to the laboratory in a bottle at 70 bar). Thus, to guarantee the desired pressure, the ballast
had a jacket with a cooling or heating system, which would be cooled down to -20℃ by a cryostat
liquid and fed with ethylene coming from the bottle at around 40 bar, conditions under which ethylene
is in liquid state. When the pressure inside the ballast reached 40 bar, the system would be in
equilibrium and ethylene feed valve would be closed. Afterwards the ballast was heated until room
temperature, reaching around 200 bar of ethylene, normally sufficient to maintain the differential in
pressure between the ballast and the reactor. Whenever higher pressures were needed, the ballast
had to be heated, getting pressures up to 300 bar.
After the desired polymerization time was reached, the reactor was cooled down and slowly
degassed until atmospheric pressure. Then the reactor was opened in order to collect the resulting
latex. Samples from these latexes were taken to perform colloidal characterizations and other fractions
of these latexes were dried to determine the solids content, which was used to calculate the polymer
content after subtracting the non-polymeric components such as the initiator and surfactant.
3 - Polymer characterization
3.1 - Gravimetry
The characterization of the polymers was divided in several categories. The first one was the
gravimetric analysis where a set of analytic methods were performed based on the mass of the sample.
The solids content (SC) of each polymerization was measured by drying a known mass of the obtained
latex (mlatex) at 70℃ and under vacuum. After total evaporation of the solvent (water) the remaining
mass (mdry extract) was weighted and the solids content in mass was determined by the equation below:
𝑆𝐶 (%) =𝑚𝑑𝑟𝑦 𝑒𝑥𝑡.
𝑚𝑙𝑎𝑡𝑒𝑥× 100
To determine the polymer content (PC) of the latex, the masses of the other species (i.e.
initiator, PEG-X and surfactant, if present) were subtracted from the total mass and this was taken into
account in the determination of the polymerization yield. On the other hand, in the case of formation
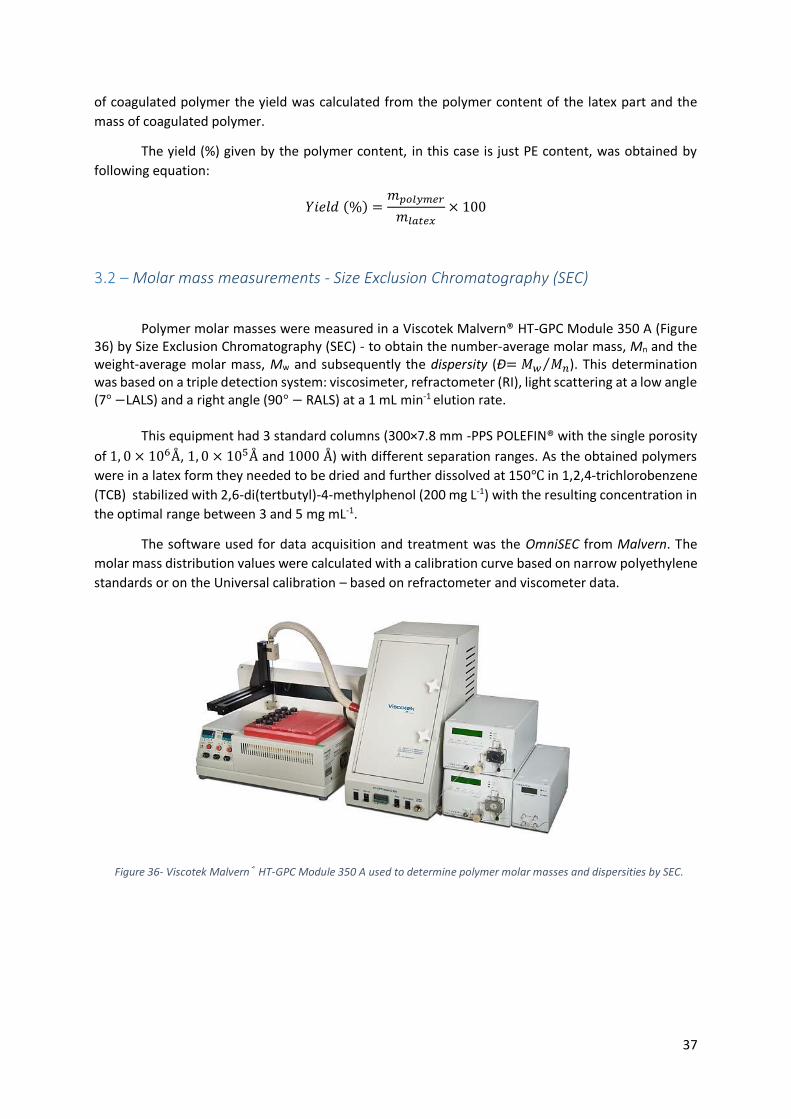
37
of coagulated polymer the yield was calculated from the polymer content of the latex part and the
mass of coagulated polymer.
The yield (%) given by the polymer content, in this case is just PE content, was obtained by
following equation:
𝑌𝑖𝑒𝑙𝑑 (%) =𝑚𝑝𝑜𝑙𝑦𝑚𝑒𝑟
𝑚𝑙𝑎𝑡𝑒𝑥× 100
3.2 – Molar mass measurements - Size Exclusion Chromatography (SEC)
Polymer molar masses were measured in a Viscotek Malvern® HT-GPC Module 350 A (Figure 36) by Size Exclusion Chromatography (SEC) - to obtain the number-average molar mass, Mn and the weight-average molar mass, Mw and subsequently the dispersity (Đ= 𝑀𝑤 𝑀𝑛⁄ ). This determination was based on a triple detection system: viscosimeter, refractometer (RI), light scattering at a low angle (7° −LALS) and a right angle (90° − RALS) at a 1 mL min-1 elution rate.
This equipment had 3 standard columns (300×7.8 mm -PPS POLEFIN® with the single porosity
of 1, 0 × 106Å, 1, 0 × 105Å and 1000 Å) with different separation ranges. As the obtained polymers
were in a latex form they needed to be dried and further dissolved at 150℃ in 1,2,4-trichlorobenzene
(TCB) stabilized with 2,6-di(tertbutyl)-4-methylphenol (200 mg L-1) with the resulting concentration in
the optimal range between 3 and 5 mg mL-1.
The software used for data acquisition and treatment was the OmniSEC from Malvern. The
molar mass distribution values were calculated with a calibration curve based on narrow polyethylene
standards or on the Universal calibration – based on refractometer and viscometer data.
Figure 36- Viscotek Malvern® HT-GPC Module 350 A used to determine polymer molar masses and dispersities by SEC.
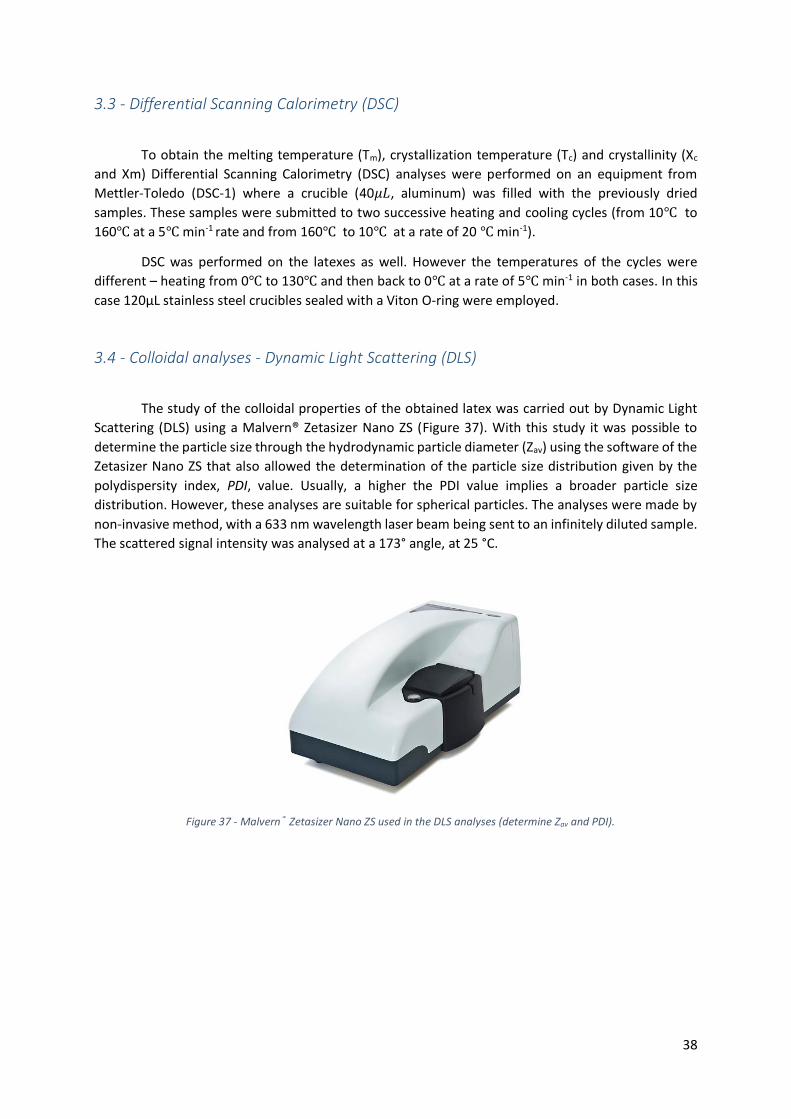
38
3.3 - Differential Scanning Calorimetry (DSC)
To obtain the melting temperature (Tm), crystallization temperature (Tc) and crystallinity (Xc
and Xm) Differential Scanning Calorimetry (DSC) analyses were performed on an equipment from
Mettler-Toledo (DSC-1) where a crucible (40𝜇𝐿, aluminum) was filled with the previously dried
samples. These samples were submitted to two successive heating and cooling cycles (from 10℃ to
160℃ at a 5℃ min-1 rate and from 160℃ to 10℃ at a rate of 20 ℃ min-1).
DSC was performed on the latexes as well. However the temperatures of the cycles were
different – heating from 0℃ to 130℃ and then back to 0℃ at a rate of 5℃ min-1 in both cases. In this
case 120μL stainless steel crucibles sealed with a Viton O-ring were employed.
3.4 - Colloidal analyses - Dynamic Light Scattering (DLS)
The study of the colloidal properties of the obtained latex was carried out by Dynamic Light
Scattering (DLS) using a Malvern® Zetasizer Nano ZS (Figure 37). With this study it was possible to
determine the particle size through the hydrodynamic particle diameter (Zav) using the software of the
Zetasizer Nano ZS that also allowed the determination of the particle size distribution given by the
polydispersity index, PDI, value. Usually, a higher the PDI value implies a broader particle size
distribution. However, these analyses are suitable for spherical particles. The analyses were made by
non-invasive method, with a 633 nm wavelength laser beam being sent to an infinitely diluted sample.
The scattered signal intensity was analysed at a 173° angle, at 25 °C.
Figure 37 - Malvern® Zetasizer Nano ZS used in the DLS analyses (determine Zav and PDI).
39
3.5 - Nuclear Magnetic Resonance (NMR)
To analyse the structure of the products obtained in this work such as macroRAFT, the
polymers, 1H NMR analyses in CDCl3 were performed on a Bruker Avance II (400 MHz) available at the
C2P2 laboratory.
3.6 – Transmission Electron Microscopy (TEM)
The electronic microscopy analyses were performed at the Centre Technologique des Microstructures, Ct𝜇, Platform of the campus Lyon 1 - Université Claude Bernard (Villeurbanne, France) on a Philips CM120 transmission electron microscope capable of supplying tensions between 60 and 120 kV (Figure 39).
Transmission electron microscopy (TEM) was performed on the samples, which were prepared
by diluting a fraction of the latexes. A drop (30𝜇𝐿) of the diluted solution was then deposited onto a
Formvar/carbon-coated copper grid and left to dry at room temperature for several minutes.
Afterwards, the excess solution was removed by using a filter paper and the grid was isolated and left
for further drying at room temperature.
The cryogenic transmission electron microscopy (cryo-TEM) analyses were performed in order
to preserve the latex in its original structure, unlike TEM analyses. This process would allow trapping
the particles in amorphous ice allowing them to keep their morphology. The samples were prepared
on site. Similarly to the procedure for TEM, the latex sample was diluted to an appropriate
concentration. After, a drop from this solution was deposited on the grid surface (Quantifoil® R2/1
copper grid with 100 Holey carbon film) and the grid was submerged in a liquid ethane container to
freeze the latex as fast as possible.
Figure 38 - Bruker® Avance II (400 MHz).
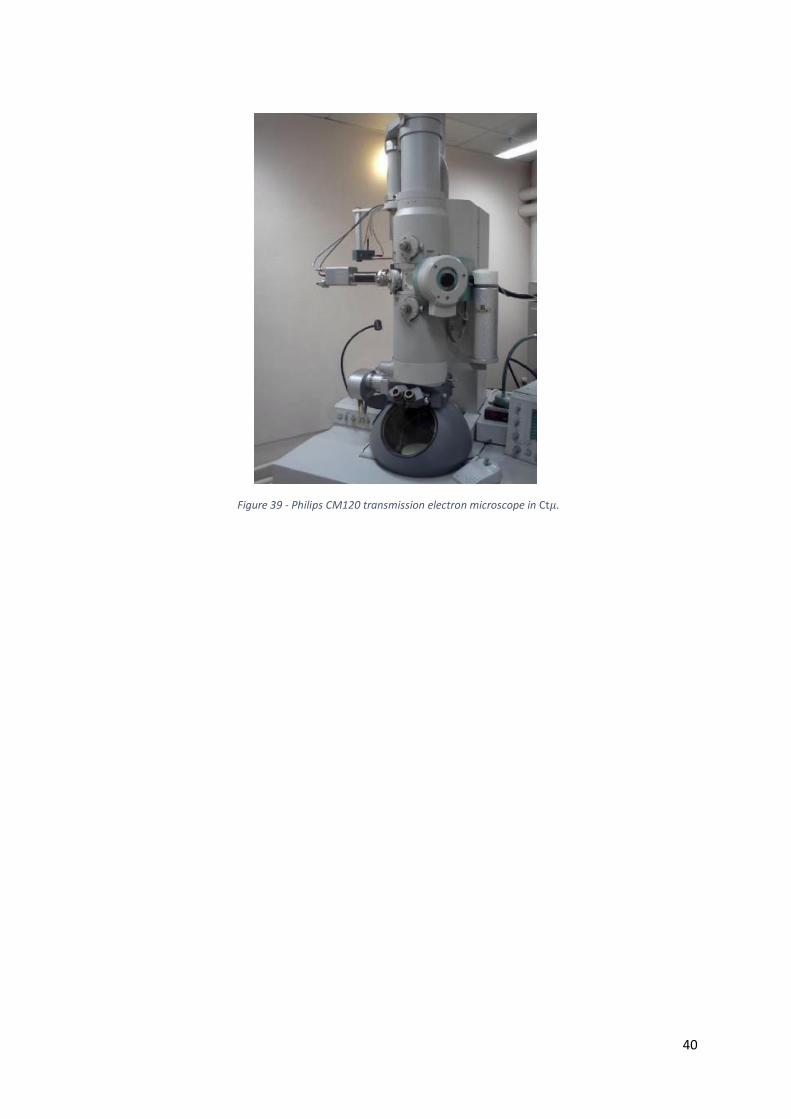
40
Figure 39 - Philips CM120 transmission electron microscope in Ct𝜇.
41
Chapter III – Results and Discussion
42
This page was left intentionally in blank.
43
1 - Introduction
As introduced during this report, the present work resulted from the knowledge developed at
the Laboratory of Chemistry Catalysis, Polymers and Processes (C2P2) in the last few years. The work
developed that team showed that the harsh polymerization conditions, mainly used in industry, for
the free radical polymerization process of ethylene were not necessarily unavoidable. [30] Indeed, it was
evidenced that the polymerization could proceed under mild conditions. However, the solvent choice
played a major role in the polymerization of ethylene. [27], [28] These experiments were performed in
organic solvent and transfer to solvent reactions were the main concern.
As a non-transferring polar solvent, water was then an interesting case to study. This was
carried on using commercial 2,2'-azobis(2-methylpropionamidine) dihydrochloride (AIBA) as an
hydrosoluble alternative to AIBN, used with organic solvents. [27], [30] Using cetyltrimethylammonium
bromide (CTAB) as surfactant, polymerization of ethylene could be conducted in water successfully
generating PE latex particles. These studies have been of paramount importance to the present work
since they were set as benchmarks. They allowed us to sort out the reactor work up very quickly, by
comparing our experimental polymerization procedures and the resulting data to these references
experiments. They were also valuable to evaluate the data obtained from the experiments with
macroRAFT agents.
Another field of great interest and largely studied at C2P2 was the control of macromolecular
architectures by living polymerization techniques. The milder polymerization conditions of ethylene
played a major role in the feasibility of alternatives to the current methods used to control the growth
of the chains, and obviously in the properties of the final material. The work of C. Dommanget was
possible due to these mild polymerization conditions, reporting the first case of controlled radical
polymerization of ethylene through reversible addition-fragmentation chain transfer in the presence
of xanthates.
Combining the fields of knowledge previously mentioned, a surfactant-free emulsion
polymerization of ethylene using RAFT as control technique to produce PE-based nanoparticles
revealed itself a relevant study to be developed. The subject is the aim of this work.
Hence, this chapter reports the results associated to the study, their treatment and the
conclusions drawn from these data. The chapter is divided into several parts, starting by a focus on the
synthesis of the PEG-X macroRAFT agent (a polyethylene glycol end-functionalized with xanthate) and
its characterization. The second section presents the different polymerizations carried out in this work
and analyse of the resulting products’ characteristics. This section of the chapter ends with a
comparison between the behaviour of the different kinds of polymerization. Next, a study was then
undertaken to evaluate the influence of the macroRAFT amount used in the polymerization system
(for a constant initiator amount). The last part of this chapter presents a kinetic study of ethylene
polymerization performed in the presence of the macroRAFT agent. The experiment was performed
at either 100 or 200 bar, allowing to draw further conclusion on the effect of pressure in these systems.
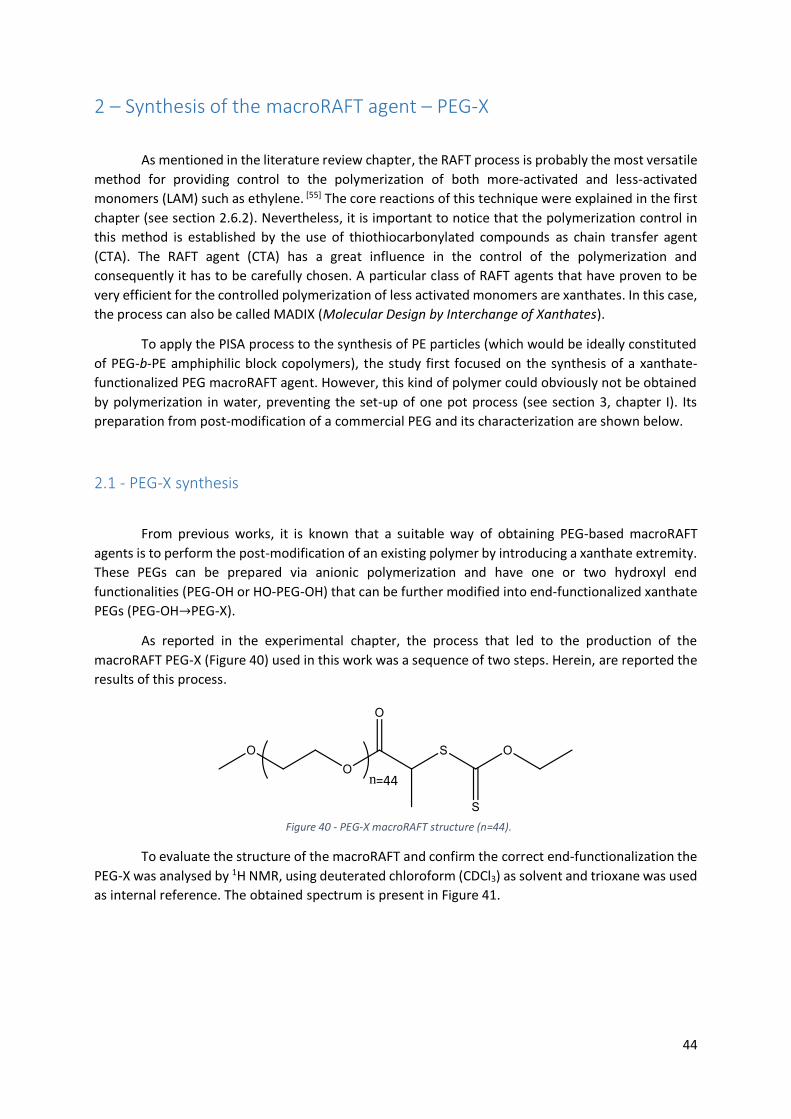
44
2 – Synthesis of the macroRAFT agent – PEG-X
As mentioned in the literature review chapter, the RAFT process is probably the most versatile
method for providing control to the polymerization of both more-activated and less-activated
monomers (LAM) such as ethylene. [55] The core reactions of this technique were explained in the first
chapter (see section 2.6.2). Nevertheless, it is important to notice that the polymerization control in
this method is established by the use of thiothiocarbonylated compounds as chain transfer agent
(CTA). The RAFT agent (CTA) has a great influence in the control of the polymerization and
consequently it has to be carefully chosen. A particular class of RAFT agents that have proven to be
very efficient for the controlled polymerization of less activated monomers are xanthates. In this case,
the process can also be called MADIX (Molecular Design by Interchange of Xanthates).
To apply the PISA process to the synthesis of PE particles (which would be ideally constituted
of PEG-b-PE amphiphilic block copolymers), the study first focused on the synthesis of a xanthate-
functionalized PEG macroRAFT agent. However, this kind of polymer could obviously not be obtained
by polymerization in water, preventing the set-up of one pot process (see section 3, chapter I). Its
preparation from post-modification of a commercial PEG and its characterization are shown below.
2.1 - PEG-X synthesis
From previous works, it is known that a suitable way of obtaining PEG-based macroRAFT
agents is to perform the post-modification of an existing polymer by introducing a xanthate extremity.
These PEGs can be prepared via anionic polymerization and have one or two hydroxyl end
functionalities (PEG-OH or HO-PEG-OH) that can be further modified into end-functionalized xanthate
PEGs (PEG-OH→PEG-X).
As reported in the experimental chapter, the process that led to the production of the
macroRAFT PEG-X (Figure 40) used in this work was a sequence of two steps. Herein, are reported the
results of this process.
To evaluate the structure of the macroRAFT and confirm the correct end-functionalization the
PEG-X was analysed by 1H NMR, using deuterated chloroform (CDCl3) as solvent and trioxane was used
as internal reference. The obtained spectrum is present in Figure 41.
Figure 40 - PEG-X macroRAFT structure (n=44).
=44
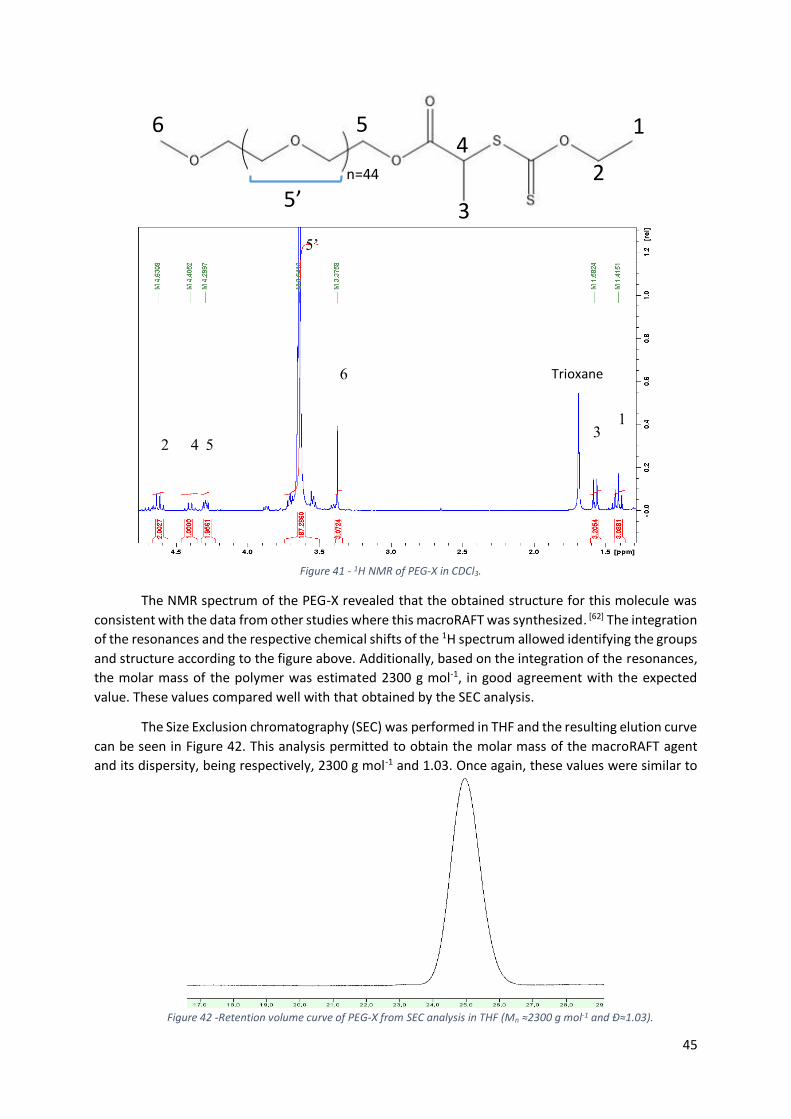
45
The NMR spectrum of the PEG-X revealed that the obtained structure for this molecule was
consistent with the data from other studies where this macroRAFT was synthesized. [62] The integration
of the resonances and the respective chemical shifts of the 1H spectrum allowed identifying the groups
and structure according to the figure above. Additionally, based on the integration of the resonances,
the molar mass of the polymer was estimated 2300 g mol-1, in good agreement with the expected
value. These values compared well with that obtained by the SEC analysis.
The Size Exclusion chromatography (SEC) was performed in THF and the resulting elution curve
can be seen in Figure 42. This analysis permitted to obtain the molar mass of the macroRAFT agent
and its dispersity, being respectively, 2300 g mol-1 and 1.03. Once again, these values were similar to
Figure 41 - 1H NMR of PEG-X in CDCl3.
1
2 3
4
6
5’
5
1
2
4
3
5
5’
6
Trioxane
n=44
Figure 42 -Retention volume curve of PEG-X from SEC analysis in THF (Mn ≈2300 g mol-1 and Đ≈1.03).
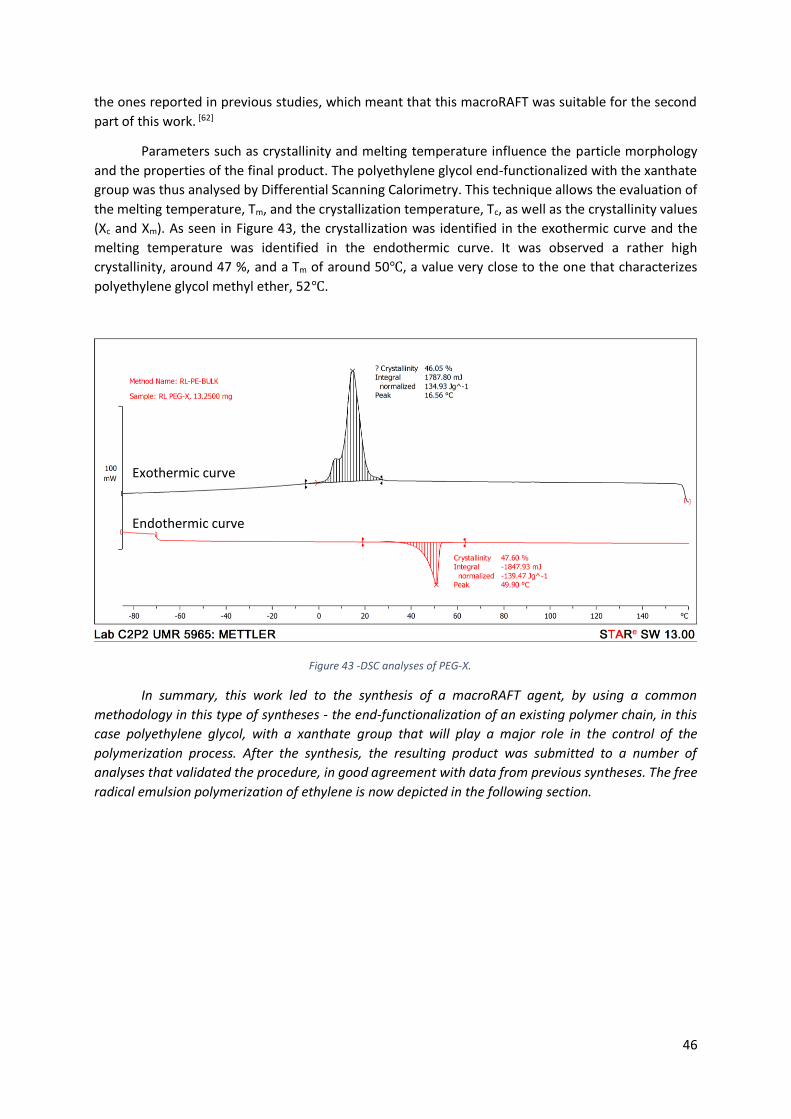
46
the ones reported in previous studies, which meant that this macroRAFT was suitable for the second
part of this work. [62]
Parameters such as crystallinity and melting temperature influence the particle morphology
and the properties of the final product. The polyethylene glycol end-functionalized with the xanthate
group was thus analysed by Differential Scanning Calorimetry. This technique allows the evaluation of
the melting temperature, Tm, and the crystallization temperature, Tc, as well as the crystallinity values
(Xc and Xm). As seen in Figure 43, the crystallization was identified in the exothermic curve and the
melting temperature was identified in the endothermic curve. It was observed a rather high
crystallinity, around 47 %, and a Tm of around 50℃, a value very close to the one that characterizes
polyethylene glycol methyl ether, 52℃.
In summary, this work led to the synthesis of a macroRAFT agent, by using a common
methodology in this type of syntheses - the end-functionalization of an existing polymer chain, in this
case polyethylene glycol, with a xanthate group that will play a major role in the control of the
polymerization process. After the synthesis, the resulting product was submitted to a number of
analyses that validated the procedure, in good agreement with data from previous syntheses. The free
radical emulsion polymerization of ethylene is now depicted in the following section.
Figure 43 -DSC analyses of PEG-X.
Endothermic curve
Exothermic curve
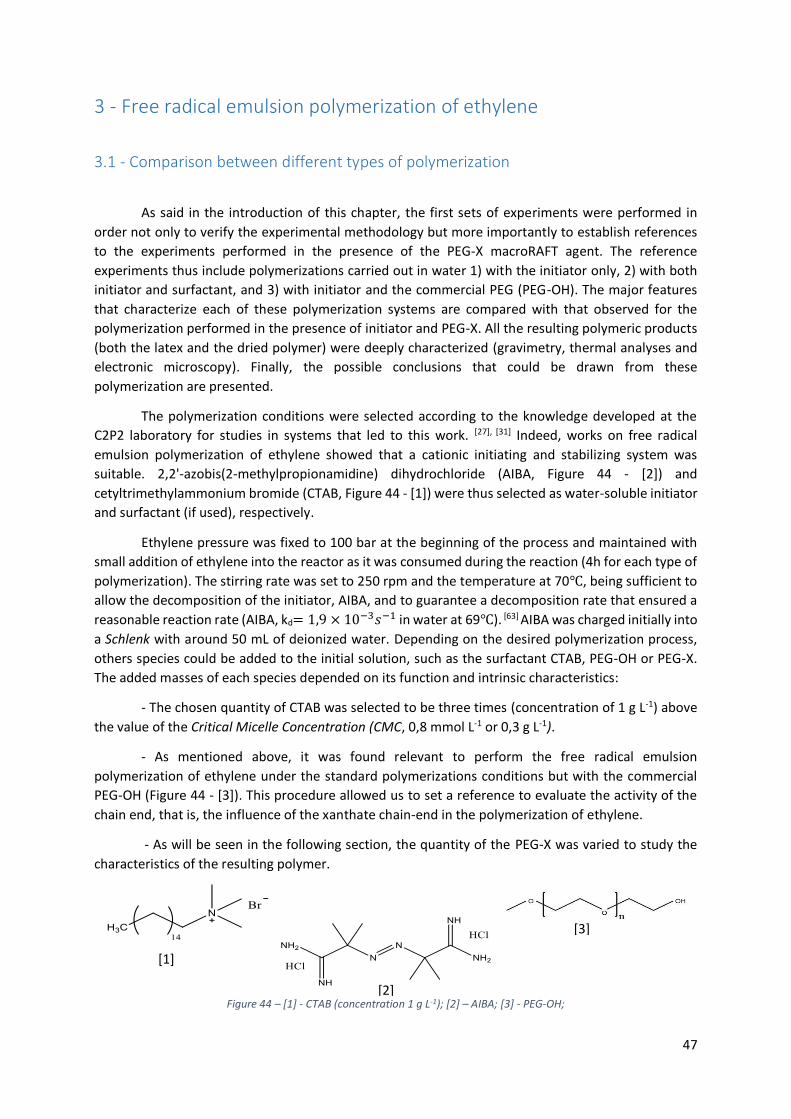
47
3 - Free radical emulsion polymerization of ethylene
3.1 - Comparison between different types of polymerization
As said in the introduction of this chapter, the first sets of experiments were performed in
order not only to verify the experimental methodology but more importantly to establish references
to the experiments performed in the presence of the PEG-X macroRAFT agent. The reference
experiments thus include polymerizations carried out in water 1) with the initiator only, 2) with both
initiator and surfactant, and 3) with initiator and the commercial PEG (PEG-OH). The major features
that characterize each of these polymerization systems are compared with that observed for the
polymerization performed in the presence of initiator and PEG-X. All the resulting polymeric products
(both the latex and the dried polymer) were deeply characterized (gravimetry, thermal analyses and
electronic microscopy). Finally, the possible conclusions that could be drawn from these
polymerization are presented.
The polymerization conditions were selected according to the knowledge developed at the
C2P2 laboratory for studies in systems that led to this work. [27], [31] Indeed, works on free radical
emulsion polymerization of ethylene showed that a cationic initiating and stabilizing system was
suitable. 2,2'-azobis(2-methylpropionamidine) dihydrochloride (AIBA, Figure 44 - [2]) and
cetyltrimethylammonium bromide (CTAB, Figure 44 - [1]) were thus selected as water-soluble initiator
and surfactant (if used), respectively.
Ethylene pressure was fixed to 100 bar at the beginning of the process and maintained with
small addition of ethylene into the reactor as it was consumed during the reaction (4h for each type of
polymerization). The stirring rate was set to 250 rpm and the temperature at 70℃, being sufficient to
allow the decomposition of the initiator, AIBA, and to guarantee a decomposition rate that ensured a
reasonable reaction rate (AIBA, kd= 1,9 × 10⁻³𝑠−1 in water at 69℃). [63] AIBA was charged initially into
a Schlenk with around 50 mL of deionized water. Depending on the desired polymerization process,
others species could be added to the initial solution, such as the surfactant CTAB, PEG-OH or PEG-X.
The added masses of each species depended on its function and intrinsic characteristics:
- The chosen quantity of CTAB was selected to be three times (concentration of 1 g L-1) above
the value of the Critical Micelle Concentration (CMC, 0,8 mmol L-1 or 0,3 g L-1).
- As mentioned above, it was found relevant to perform the free radical emulsion
polymerization of ethylene under the standard polymerizations conditions but with the commercial
PEG-OH (Figure 44 - [3]). This procedure allowed us to set a reference to evaluate the activity of the
chain end, that is, the influence of the xanthate chain-end in the polymerization of ethylene.
- As will be seen in the following section, the quantity of the PEG-X was varied to study the
characteristics of the resulting polymer.
[1]
[2]
[3]
Figure 44 – [1] - CTAB (concentration 1 g L-1); [2] – AIBA; [3] - PEG-OH;
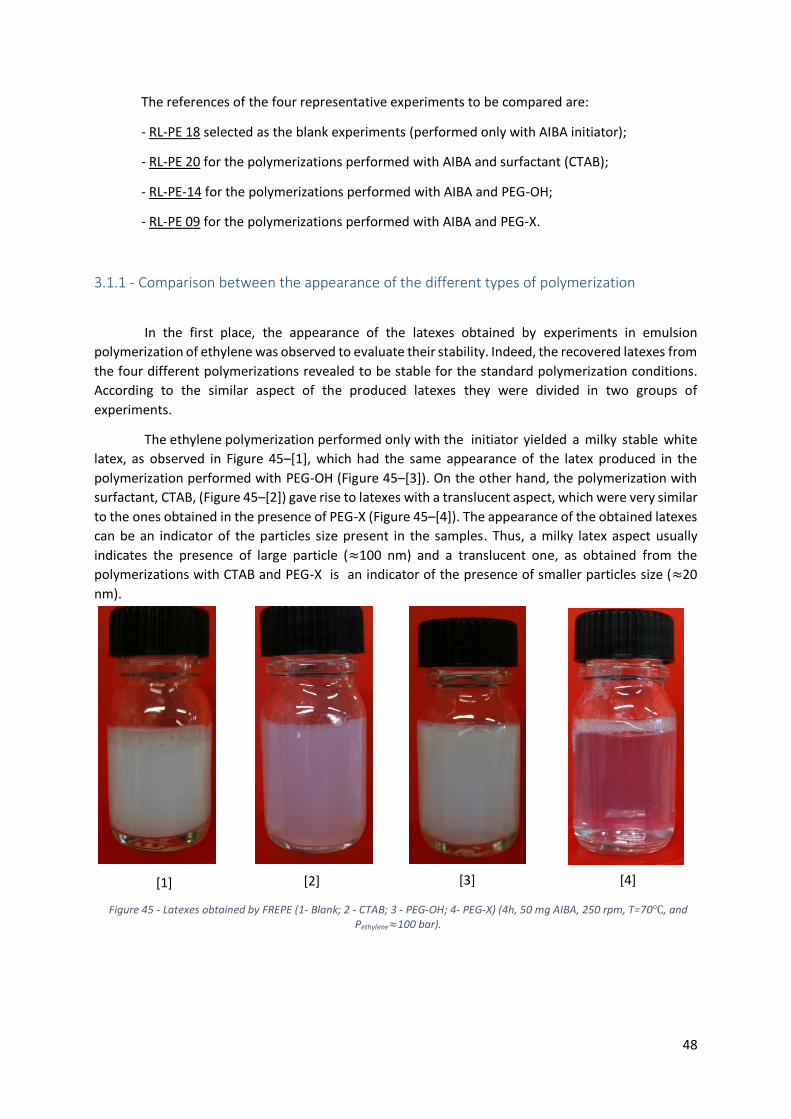
48
The references of the four representative experiments to be compared are:
- RL-PE 18 selected as the blank experiments (performed only with AIBA initiator);
- RL-PE 20 for the polymerizations performed with AIBA and surfactant (CTAB);
- RL-PE-14 for the polymerizations performed with AIBA and PEG-OH;
- RL-PE 09 for the polymerizations performed with AIBA and PEG-X.
3.1.1 - Comparison between the appearance of the different types of polymerization
In the first place, the appearance of the latexes obtained by experiments in emulsion
polymerization of ethylene was observed to evaluate their stability. Indeed, the recovered latexes from
the four different polymerizations revealed to be stable for the standard polymerization conditions.
According to the similar aspect of the produced latexes they were divided in two groups of
experiments.
The ethylene polymerization performed only with the initiator yielded a milky stable white
latex, as observed in Figure 45–[1], which had the same appearance of the latex produced in the
polymerization performed with PEG-OH (Figure 45–[3]). On the other hand, the polymerization with
surfactant, CTAB, (Figure 45–[2]) gave rise to latexes with a translucent aspect, which were very similar
to the ones obtained in the presence of PEG-X (Figure 45–[4]). The appearance of the obtained latexes
can be an indicator of the particles size present in the samples. Thus, a milky latex aspect usually
indicates the presence of large particle (≈100 nm) and a translucent one, as obtained from the
polymerizations with CTAB and PEG-X is an indicator of the presence of smaller particles size (≈20
nm).
Figure 45 - Latexes obtained by FREPE (1- Blank; 2 - CTAB; 3 - PEG-OH; 4- PEG-X) (4h, 50 mg AIBA, 250 rpm, T=70℃, and Pethylene≈100 bar).
[1] [2] [3] [4]
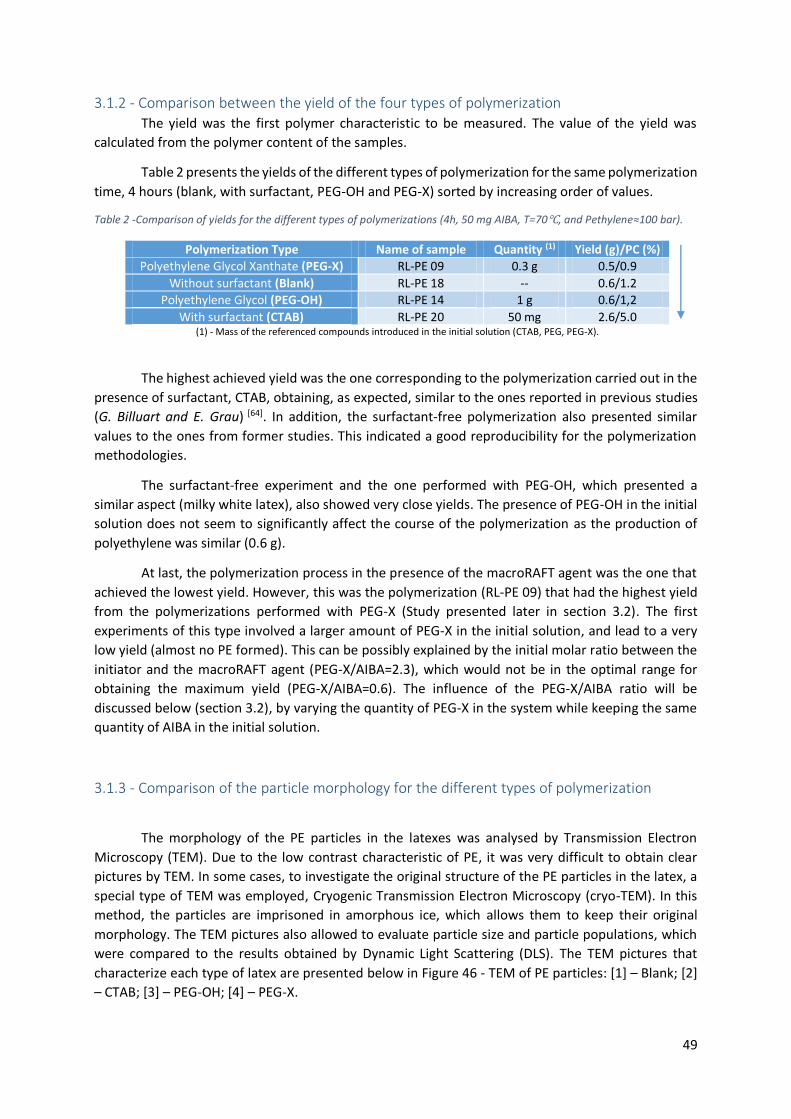
49
3.1.2 - Comparison between the yield of the four types of polymerization
The yield was the first polymer characteristic to be measured. The value of the yield was
calculated from the polymer content of the samples.
Table 2 presents the yields of the different types of polymerization for the same polymerization
time, 4 hours (blank, with surfactant, PEG-OH and PEG-X) sorted by increasing order of values.
Table 2 -Comparison of yields for the different types of polymerizations (4h, 50 mg AIBA, T=70℃, and Pethylene≈100 bar).
Polymerization Type Name of sample Quantity (1) Yield (g)/PC (%)
Polyethylene Glycol Xanthate (PEG-X) RL-PE 09 0.3 g 0.5/0.9
Without surfactant (Blank) RL-PE 18 -- 0.6/1.2
Polyethylene Glycol (PEG-OH) RL-PE 14 1 g 0.6/1,2
With surfactant (CTAB) RL-PE 20 50 mg 2.6/5.0 (1) - Mass of the referenced compounds introduced in the initial solution (CTAB, PEG, PEG-X).
The highest achieved yield was the one corresponding to the polymerization carried out in the
presence of surfactant, CTAB, obtaining, as expected, similar to the ones reported in previous studies
(G. Billuart and E. Grau) [64]. In addition, the surfactant-free polymerization also presented similar
values to the ones from former studies. This indicated a good reproducibility for the polymerization
methodologies.
The surfactant-free experiment and the one performed with PEG-OH, which presented a
similar aspect (milky white latex), also showed very close yields. The presence of PEG-OH in the initial
solution does not seem to significantly affect the course of the polymerization as the production of
polyethylene was similar (0.6 g).
At last, the polymerization process in the presence of the macroRAFT agent was the one that
achieved the lowest yield. However, this was the polymerization (RL-PE 09) that had the highest yield
from the polymerizations performed with PEG-X (Study presented later in section 3.2). The first
experiments of this type involved a larger amount of PEG-X in the initial solution, and lead to a very
low yield (almost no PE formed). This can be possibly explained by the initial molar ratio between the
initiator and the macroRAFT agent (PEG-X/AIBA=2.3), which would not be in the optimal range for
obtaining the maximum yield (PEG-X/AIBA=0.6). The influence of the PEG-X/AIBA ratio will be
discussed below (section 3.2), by varying the quantity of PEG-X in the system while keeping the same
quantity of AIBA in the initial solution.
3.1.3 - Comparison of the particle morphology for the different types of polymerization
The morphology of the PE particles in the latexes was analysed by Transmission Electron
Microscopy (TEM). Due to the low contrast characteristic of PE, it was very difficult to obtain clear
pictures by TEM. In some cases, to investigate the original structure of the PE particles in the latex, a
special type of TEM was employed, Cryogenic Transmission Electron Microscopy (cryo-TEM). In this
method, the particles are imprisoned in amorphous ice, which allows them to keep their original
morphology. The TEM pictures also allowed to evaluate particle size and particle populations, which
were compared to the results obtained by Dynamic Light Scattering (DLS). The TEM pictures that
characterize each type of latex are presented below in Figure 46 - TEM of PE particles: [1] – Blank; [2]
– CTAB; [3] – PEG-OH; [4] – PEG-X.
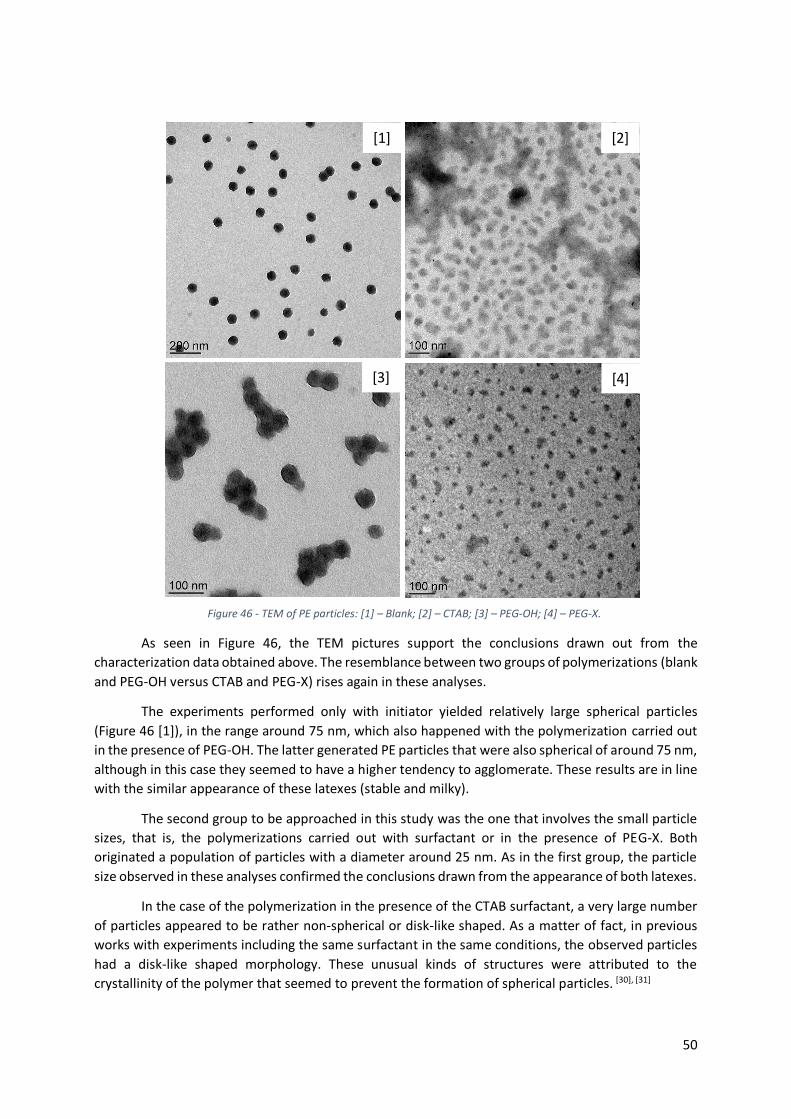
50
As seen in Figure 46, the TEM pictures support the conclusions drawn out from the
characterization data obtained above. The resemblance between two groups of polymerizations (blank
and PEG-OH versus CTAB and PEG-X) rises again in these analyses.
The experiments performed only with initiator yielded relatively large spherical particles
(Figure 46 [1]), in the range around 75 nm, which also happened with the polymerization carried out
in the presence of PEG-OH. The latter generated PE particles that were also spherical of around 75 nm,
although in this case they seemed to have a higher tendency to agglomerate. These results are in line
with the similar appearance of these latexes (stable and milky).
The second group to be approached in this study was the one that involves the small particle
sizes, that is, the polymerizations carried out with surfactant or in the presence of PEG-X. Both
originated a population of particles with a diameter around 25 nm. As in the first group, the particle
size observed in these analyses confirmed the conclusions drawn from the appearance of both latexes.
In the case of the polymerization in the presence of the CTAB surfactant, a very large number
of particles appeared to be rather non-spherical or disk-like shaped. As a matter of fact, in previous
works with experiments including the same surfactant in the same conditions, the observed particles
had a disk-like shaped morphology. These unusual kinds of structures were attributed to the
crystallinity of the polymer that seemed to prevent the formation of spherical particles. [30], [31]
[1] [2]
[3] [4]
Figure 46 - TEM of PE particles: [1] – Blank; [2] – CTAB; [3] – PEG-OH; [4] – PEG-X.
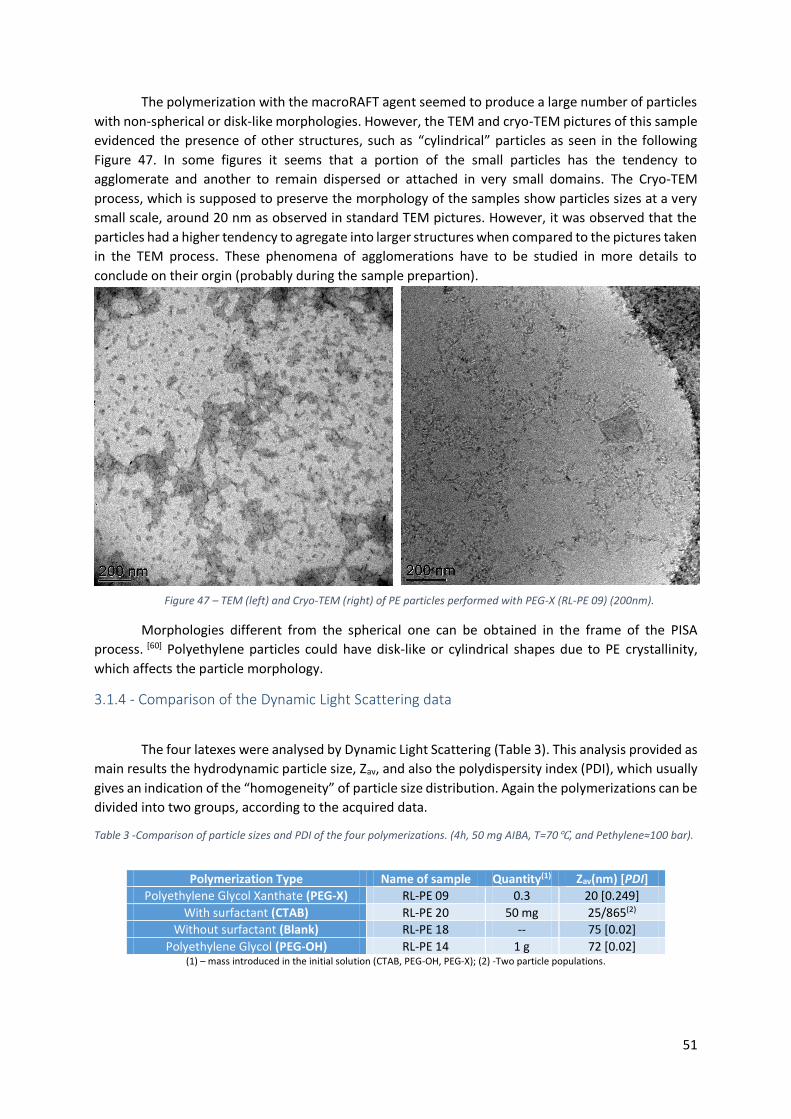
51
The polymerization with the macroRAFT agent seemed to produce a large number of particles
with non-spherical or disk-like morphologies. However, the TEM and cryo-TEM pictures of this sample
evidenced the presence of other structures, such as “cylindrical” particles as seen in the following
Figure 47. In some figures it seems that a portion of the small particles has the tendency to
agglomerate and another to remain dispersed or attached in very small domains. The Cryo-TEM
process, which is supposed to preserve the morphology of the samples show particles sizes at a very
small scale, around 20 nm as observed in standard TEM pictures. However, it was observed that the
particles had a higher tendency to agregate into larger structures when compared to the pictures taken
in the TEM process. These phenomena of agglomerations have to be studied in more details to
conclude on their orgin (probably during the sample prepartion).
Morphologies different from the spherical one can be obtained in the frame of the PISA
process. [60] Polyethylene particles could have disk-like or cylindrical shapes due to PE crystallinity,
which affects the particle morphology.
3.1.4 - Comparison of the Dynamic Light Scattering data
The four latexes were analysed by Dynamic Light Scattering (Table 3). This analysis provided as
main results the hydrodynamic particle size, Zav, and also the polydispersity index (PDI), which usually
gives an indication of the “homogeneity” of particle size distribution. Again the polymerizations can be
divided into two groups, according to the acquired data.
Table 3 -Comparison of particle sizes and PDI of the four polymerizations. (4h, 50 mg AIBA, T=70℃, and Pethylene≈100 bar).
Polymerization Type Name of sample Quantity(1) Zav(nm) [PDI]
Polyethylene Glycol Xanthate (PEG-X) RL-PE 09 0.3 20 [0.249]
With surfactant (CTAB) RL-PE 20 50 mg 25/865(2)
Without surfactant (Blank) RL-PE 18 -- 75 [0.02]
Polyethylene Glycol (PEG-OH) RL-PE 14 1 g 72 [0.02] (1) – mass introduced in the initial solution (CTAB, PEG-OH, PEG-X); (2) -Two particle populations.
Figure 47 – TEM (left) and Cryo-TEM (right) of PE particles performed with PEG-X (RL-PE 09) (200nm).
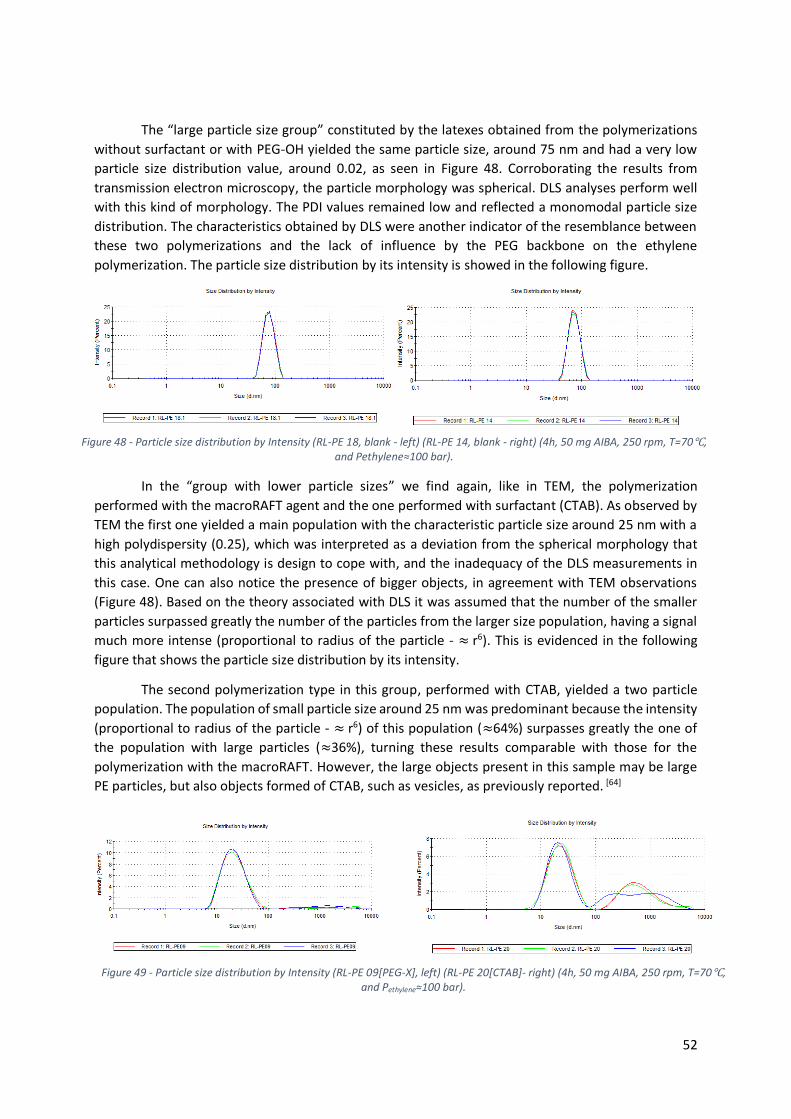
52
The “large particle size group” constituted by the latexes obtained from the polymerizations
without surfactant or with PEG-OH yielded the same particle size, around 75 nm and had a very low
particle size distribution value, around 0.02, as seen in Figure 48. Corroborating the results from
transmission electron microscopy, the particle morphology was spherical. DLS analyses perform well
with this kind of morphology. The PDI values remained low and reflected a monomodal particle size
distribution. The characteristics obtained by DLS were another indicator of the resemblance between
these two polymerizations and the lack of influence by the PEG backbone on the ethylene
polymerization. The particle size distribution by its intensity is showed in the following figure.
In the “group with lower particle sizes” we find again, like in TEM, the polymerization
performed with the macroRAFT agent and the one performed with surfactant (CTAB). As observed by
TEM the first one yielded a main population with the characteristic particle size around 25 nm with a
high polydispersity (0.25), which was interpreted as a deviation from the spherical morphology that
this analytical methodology is design to cope with, and the inadequacy of the DLS measurements in
this case. One can also notice the presence of bigger objects, in agreement with TEM observations
(Figure 48). Based on the theory associated with DLS it was assumed that the number of the smaller
particles surpassed greatly the number of the particles from the larger size population, having a signal
much more intense (proportional to radius of the particle - ≈ r6). This is evidenced in the following
figure that shows the particle size distribution by its intensity.
The second polymerization type in this group, performed with CTAB, yielded a two particle
population. The population of small particle size around 25 nm was predominant because the intensity
(proportional to radius of the particle - ≈ r6) of this population (≈64%) surpasses greatly the one of
the population with large particles (≈36%), turning these results comparable with those for the
polymerization with the macroRAFT. However, the large objects present in this sample may be large
PE particles, but also objects formed of CTAB, such as vesicles, as previously reported. [64]
Figure 48 - Particle size distribution by Intensity (RL-PE 18, blank - left) (RL-PE 14, blank - right) (4h, 50 mg AIBA, 250 rpm, T=70℃, and Pethylene≈100 bar).
Figure 49 - Particle size distribution by Intensity (RL-PE 09[PEG-X], left) (RL-PE 20[CTAB]- right) (4h, 50 mg AIBA, 250 rpm, T=70℃, and Pethylene≈100 bar).
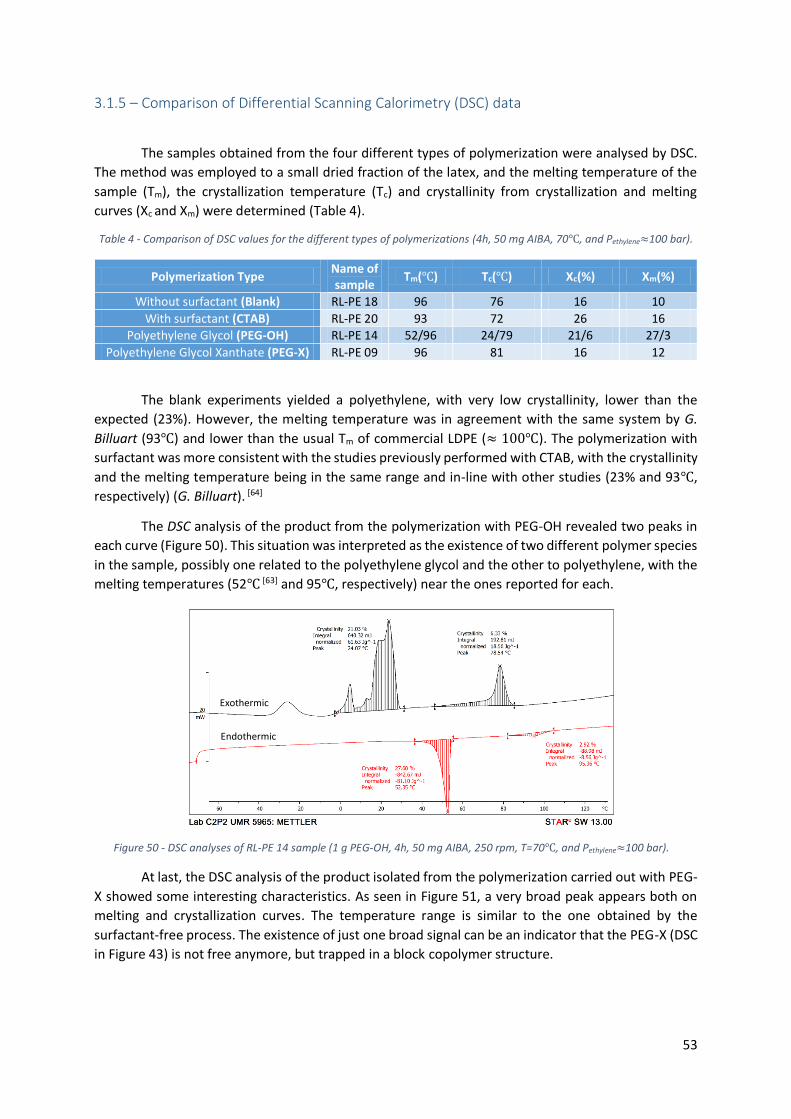
53
3.1.5 – Comparison of Differential Scanning Calorimetry (DSC) data
The samples obtained from the four different types of polymerization were analysed by DSC.
The method was employed to a small dried fraction of the latex, and the melting temperature of the
sample (Tm), the crystallization temperature (Tc) and crystallinity from crystallization and melting
curves (Xc and Xm) were determined (Table 4).
Table 4 - Comparison of DSC values for the different types of polymerizations (4h, 50 mg AIBA, 70℃, and Pethylene≈100 bar).
The blank experiments yielded a polyethylene, with very low crystallinity, lower than the
expected (23%). However, the melting temperature was in agreement with the same system by G.
Billuart (93℃) and lower than the usual Tm of commercial LDPE (≈ 100℃). The polymerization with
surfactant was more consistent with the studies previously performed with CTAB, with the crystallinity
and the melting temperature being in the same range and in-line with other studies (23% and 93℃,
respectively) (G. Billuart). [64]
The DSC analysis of the product from the polymerization with PEG-OH revealed two peaks in
each curve (Figure 50). This situation was interpreted as the existence of two different polymer species
in the sample, possibly one related to the polyethylene glycol and the other to polyethylene, with the
melting temperatures (52℃ [63] and 95℃, respectively) near the ones reported for each.
At last, the DSC analysis of the product isolated from the polymerization carried out with PEG-
X showed some interesting characteristics. As seen in Figure 51, a very broad peak appears both on
melting and crystallization curves. The temperature range is similar to the one obtained by the
surfactant-free process. The existence of just one broad signal can be an indicator that the PEG-X (DSC
in Figure 43) is not free anymore, but trapped in a block copolymer structure.
Polymerization Type Name of sample
Tm(℃) Tc(℃) Xc(%) Xm(%)
Without surfactant (Blank) RL-PE 18 96 76 16 10
With surfactant (CTAB) RL-PE 20 93 72 26 16
Polyethylene Glycol (PEG-OH) RL-PE 14 52/96 24/79 21/6 27/3
Polyethylene Glycol Xanthate (PEG-X) RL-PE 09 96 81 16 12
Figure 50 - DSC analyses of RL-PE 14 sample (1 g PEG-OH, 4h, 50 mg AIBA, 250 rpm, T=70℃, and Pethylene≈100 bar).
Endothermic
Exothermic
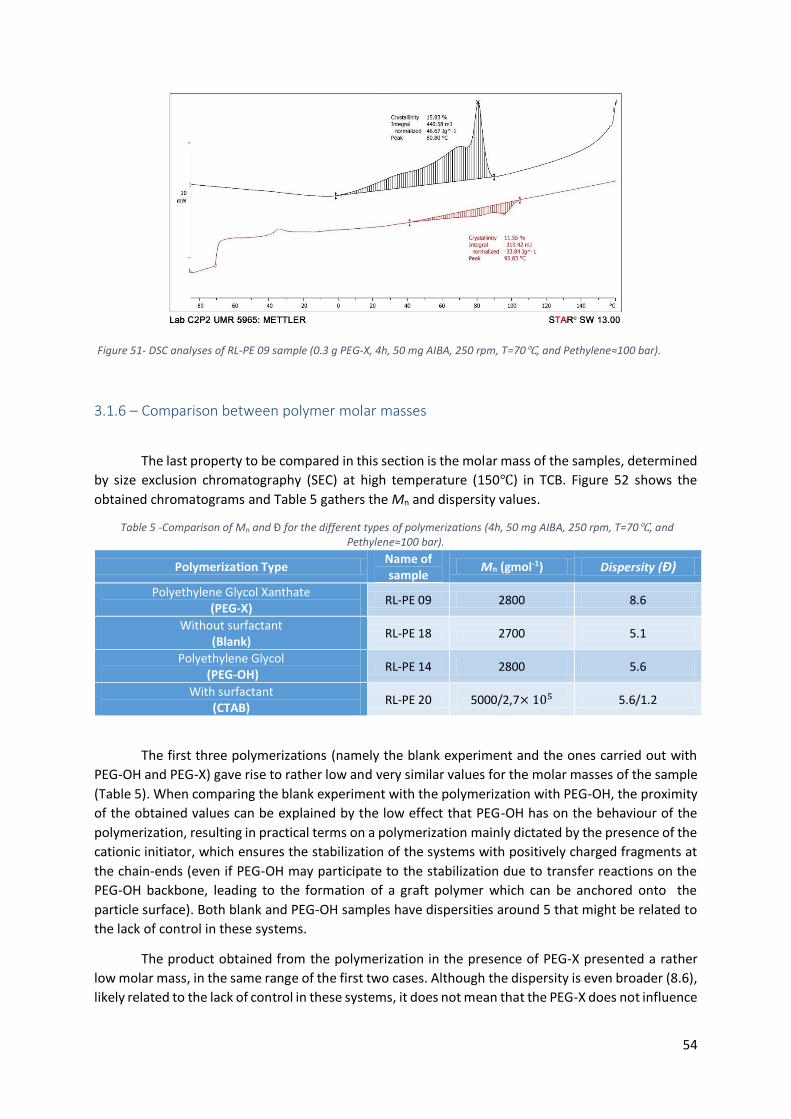
54
3.1.6 – Comparison between polymer molar masses
The last property to be compared in this section is the molar mass of the samples, determined
by size exclusion chromatography (SEC) at high temperature (150℃) in TCB. Figure 52 shows the
obtained chromatograms and Table 5 gathers the Mn and dispersity values.
Table 5 -Comparison of Mn and Ð for the different types of polymerizations (4h, 50 mg AIBA, 250 rpm, T=70℃, and Pethylene≈100 bar).
The first three polymerizations (namely the blank experiment and the ones carried out with
PEG-OH and PEG-X) gave rise to rather low and very similar values for the molar masses of the sample
(Table 5). When comparing the blank experiment with the polymerization with PEG-OH, the proximity
of the obtained values can be explained by the low effect that PEG-OH has on the behaviour of the
polymerization, resulting in practical terms on a polymerization mainly dictated by the presence of the
cationic initiator, which ensures the stabilization of the systems with positively charged fragments at
the chain-ends (even if PEG-OH may participate to the stabilization due to transfer reactions on the
PEG-OH backbone, leading to the formation of a graft polymer which can be anchored onto the
particle surface). Both blank and PEG-OH samples have dispersities around 5 that might be related to
the lack of control in these systems.
The product obtained from the polymerization in the presence of PEG-X presented a rather
low molar mass, in the same range of the first two cases. Although the dispersity is even broader (8.6),
likely related to the lack of control in these systems, it does not mean that the PEG-X does not influence
Polymerization Type Name of sample
Mn (gmol-1) Dispersity (Ð)
Polyethylene Glycol Xanthate (PEG-X)
RL-PE 09 2800 8.6
Without surfactant (Blank)
RL-PE 18 2700 5.1
Polyethylene Glycol (PEG-OH)
RL-PE 14 2800 5.6
With surfactant (CTAB)
RL-PE 20 5000/2,7× 105 5.6/1.2
Figure 51- DSC analyses of RL-PE 09 sample (0.3 g PEG-X, 4h, 50 mg AIBA, 250 rpm, T=70℃, and Pethylene≈100 bar).
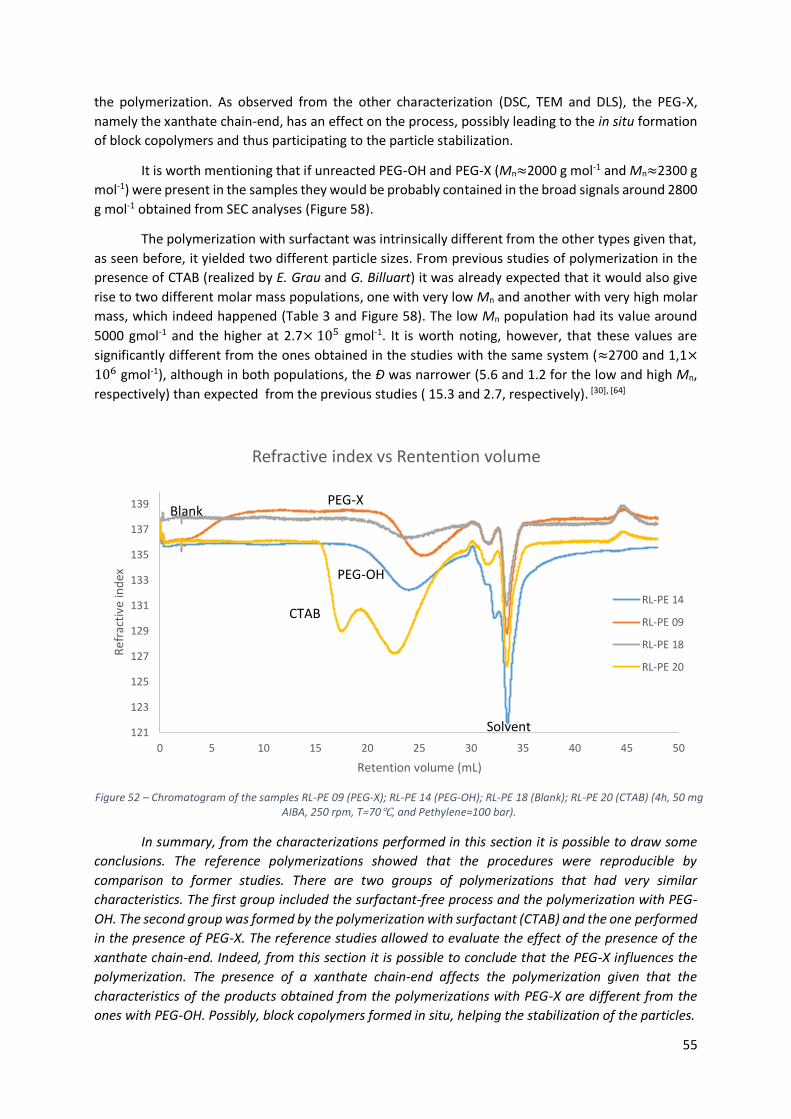
55
the polymerization. As observed from the other characterization (DSC, TEM and DLS), the PEG-X,
namely the xanthate chain-end, has an effect on the process, possibly leading to the in situ formation
of block copolymers and thus participating to the particle stabilization.
It is worth mentioning that if unreacted PEG-OH and PEG-X (Mn≈2000 g mol-1 and Mn≈2300 g
mol-1) were present in the samples they would be probably contained in the broad signals around 2800
g mol-1 obtained from SEC analyses (Figure 58).
The polymerization with surfactant was intrinsically different from the other types given that,
as seen before, it yielded two different particle sizes. From previous studies of polymerization in the
presence of CTAB (realized by E. Grau and G. Billuart) it was already expected that it would also give
rise to two different molar mass populations, one with very low Mn and another with very high molar
mass, which indeed happened (Table 3 and Figure 58). The low Mn population had its value around
5000 gmol-1 and the higher at 2.7× 10⁵ gmol-1. It is worth noting, however, that these values are
significantly different from the ones obtained in the studies with the same system (≈2700 and 1,1×
106 gmol-1), although in both populations, the Đ was narrower (5.6 and 1.2 for the low and high Mn,
respectively) than expected from the previous studies ( 15.3 and 2.7, respectively). [30], [64]
In summary, from the characterizations performed in this section it is possible to draw some
conclusions. The reference polymerizations showed that the procedures were reproducible by
comparison to former studies. There are two groups of polymerizations that had very similar
characteristics. The first group included the surfactant-free process and the polymerization with PEG-
OH. The second group was formed by the polymerization with surfactant (CTAB) and the one performed
in the presence of PEG-X. The reference studies allowed to evaluate the effect of the presence of the
xanthate chain-end. Indeed, from this section it is possible to conclude that the PEG-X influences the
polymerization. The presence of a xanthate chain-end affects the polymerization given that the
characteristics of the products obtained from the polymerizations with PEG-X are different from the
ones with PEG-OH. Possibly, block copolymers formed in situ, helping the stabilization of the particles.
Figure 52 – Chromatogram of the samples RL-PE 09 (PEG-X); RL-PE 14 (PEG-OH); RL-PE 18 (Blank); RL-PE 20 (CTAB) (4h, 50 mg AIBA, 250 rpm, T=70℃, and Pethylene≈100 bar).
121
123
125
127
129
131
133
135
137
139
0 5 10 15 20 25 30 35 40 45 50
Ref
ract
ive
ind
ex
Retention volume (mL)
Refractive index vs Rentention volume
RL-PE 14
RL-PE 09
RL-PE 18
RL-PE 20
Solvent
CTAB
PEG-OH
PEG-X Blank
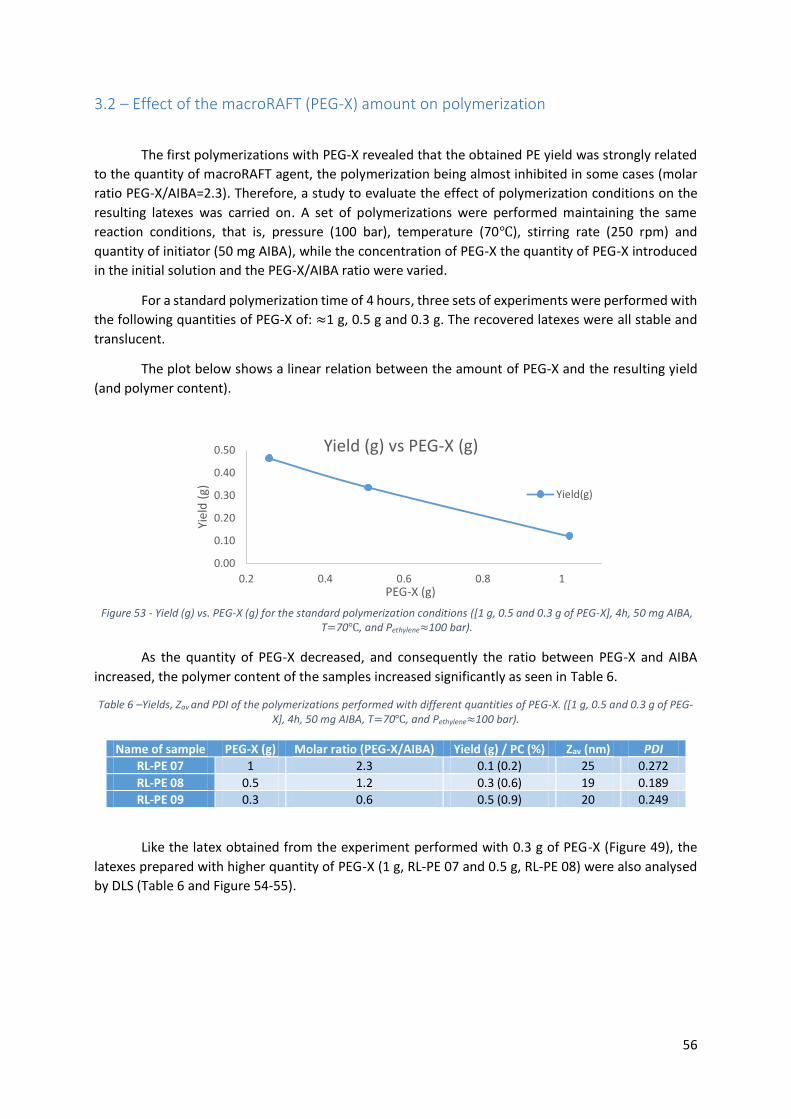
56
3.2 – Effect of the macroRAFT (PEG-X) amount on polymerization
The first polymerizations with PEG-X revealed that the obtained PE yield was strongly related
to the quantity of macroRAFT agent, the polymerization being almost inhibited in some cases (molar
ratio PEG-X/AIBA=2.3). Therefore, a study to evaluate the effect of polymerization conditions on the
resulting latexes was carried on. A set of polymerizations were performed maintaining the same
reaction conditions, that is, pressure (100 bar), temperature (70℃), stirring rate (250 rpm) and
quantity of initiator (50 mg AIBA), while the concentration of PEG-X the quantity of PEG-X introduced
in the initial solution and the PEG-X/AIBA ratio were varied.
For a standard polymerization time of 4 hours, three sets of experiments were performed with
the following quantities of PEG-X of: ≈1 g, 0.5 g and 0.3 g. The recovered latexes were all stable and
translucent.
The plot below shows a linear relation between the amount of PEG-X and the resulting yield
(and polymer content).
As the quantity of PEG-X decreased, and consequently the ratio between PEG-X and AIBA
increased, the polymer content of the samples increased significantly as seen in Table 6.
Table 6 –Yields, Zav and PDI of the polymerizations performed with different quantities of PEG-X. ([1 g, 0.5 and 0.3 g of PEG-X], 4h, 50 mg AIBA, T=70℃, and Pethylene≈100 bar).
Name of sample PEG-X (g) Molar ratio (PEG-X/AIBA) Yield (g) / PC (%) Zav (nm) PDI
RL-PE 07 1 2.3 0.1 (0.2) 25 0.272
RL-PE 08 0.5 1.2 0.3 (0.6) 19 0.189
RL-PE 09 0.3 0.6 0.5 (0.9) 20 0.249
Like the latex obtained from the experiment performed with 0.3 g of PEG-X (Figure 49), the
latexes prepared with higher quantity of PEG-X (1 g, RL-PE 07 and 0.5 g, RL-PE 08) were also analysed
by DLS (Table 6 and Figure 54-55).
Figure 53 - Yield (g) vs. PEG-X (g) for the standard polymerization conditions ([1 g, 0.5 and 0.3 g of PEG-X], 4h, 50 mg AIBA, T=70℃, and Pethylene≈100 bar).
0.00
0.10
0.20
0.30
0.40
0.50
0.2 0.4 0.6 0.8 1
Yiel
d (
g)
PEG-X (g)
Yield (g) vs PEG-X (g)
Yield(g)
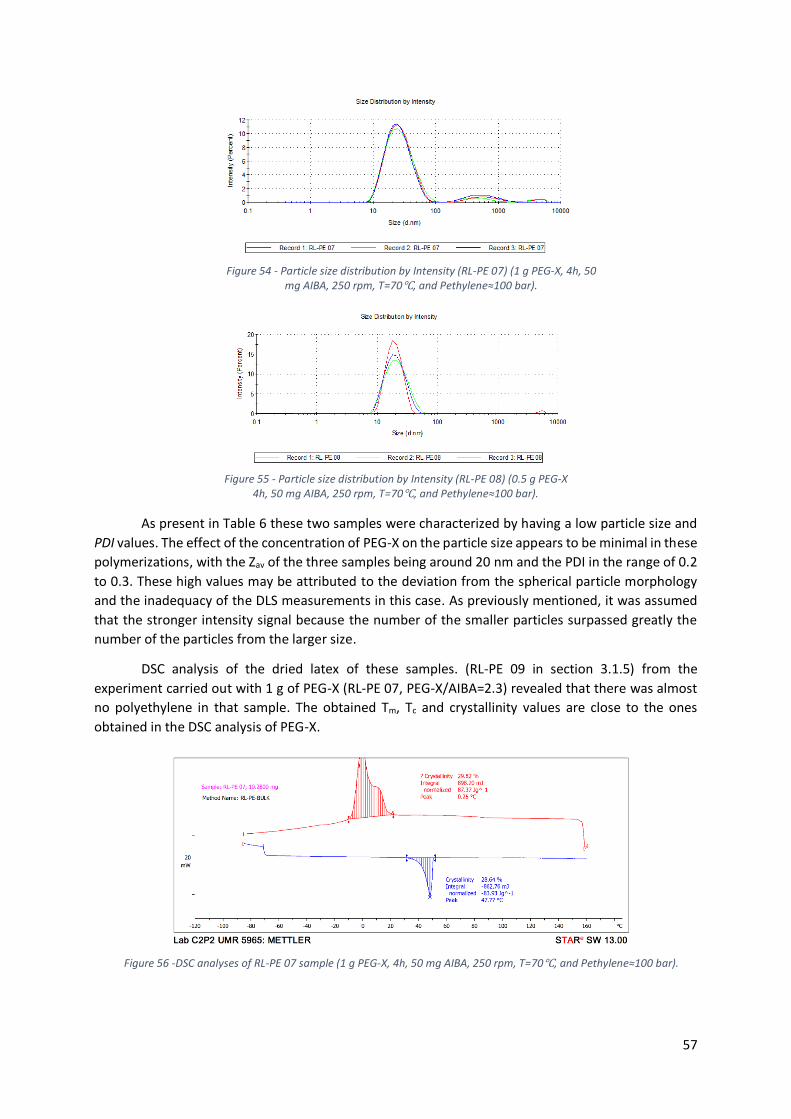
57
As present in Table 6 these two samples were characterized by having a low particle size and
PDI values. The effect of the concentration of PEG-X on the particle size appears to be minimal in these
polymerizations, with the Zav of the three samples being around 20 nm and the PDI in the range of 0.2
to 0.3. These high values may be attributed to the deviation from the spherical particle morphology
and the inadequacy of the DLS measurements in this case. As previously mentioned, it was assumed
that the stronger intensity signal because the number of the smaller particles surpassed greatly the
number of the particles from the larger size.
DSC analysis of the dried latex of these samples. (RL-PE 09 in section 3.1.5) from the
experiment carried out with 1 g of PEG-X (RL-PE 07, PEG-X/AIBA=2.3) revealed that there was almost
no polyethylene in that sample. The obtained Tm, Tc and crystallinity values are close to the ones
obtained in the DSC analysis of PEG-X.
Figure 54 - Particle size distribution by Intensity (RL-PE 07) (1 g PEG-X, 4h, 50 mg AIBA, 250 rpm, T=70℃, and Pethylene≈100 bar).
Figure 55 - Particle size distribution by Intensity (RL-PE 08) (0.5 g PEG-X 4h, 50 mg AIBA, 250 rpm, T=70℃, and Pethylene≈100 bar).
Figure 56 -DSC analyses of RL-PE 07 sample (1 g PEG-X, 4h, 50 mg AIBA, 250 rpm, T=70℃, and Pethylene≈100 bar).
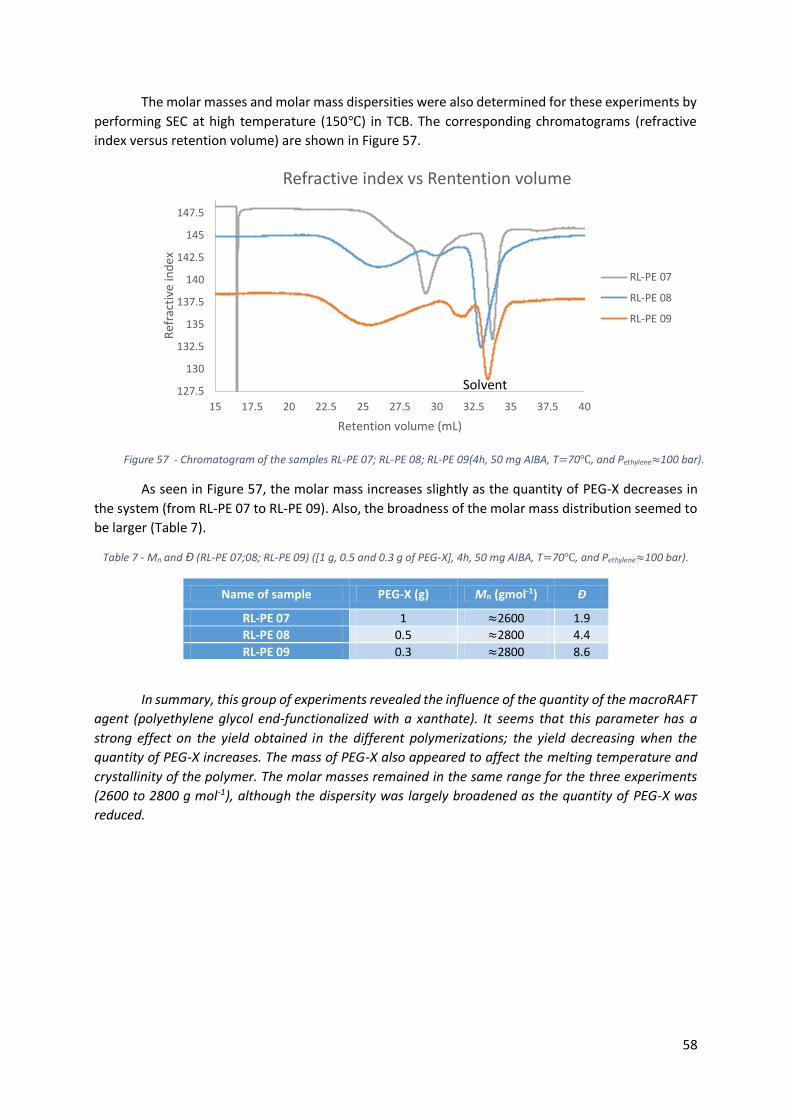
58
The molar masses and molar mass dispersities were also determined for these experiments by
performing SEC at high temperature (150℃) in TCB. The corresponding chromatograms (refractive
index versus retention volume) are shown in Figure 57.
As seen in Figure 57, the molar mass increases slightly as the quantity of PEG-X decreases in
the system (from RL-PE 07 to RL-PE 09). Also, the broadness of the molar mass distribution seemed to
be larger (Table 7).
Table 7 - Mn and Đ (RL-PE 07;08; RL-PE 09) ([1 g, 0.5 and 0.3 g of PEG-X], 4h, 50 mg AIBA, T=70℃, and Pethylene≈100 bar).
Name of sample PEG-X (g) Mn (gmol-1) Đ
RL-PE 07 1 ≈2600 1.9
RL-PE 08 0.5 ≈2800 4.4
RL-PE 09 0.3 ≈2800 8.6
In summary, this group of experiments revealed the influence of the quantity of the macroRAFT
agent (polyethylene glycol end-functionalized with a xanthate). It seems that this parameter has a
strong effect on the yield obtained in the different polymerizations; the yield decreasing when the
quantity of PEG-X increases. The mass of PEG-X also appeared to affect the melting temperature and
crystallinity of the polymer. The molar masses remained in the same range for the three experiments
(2600 to 2800 g mol-1), although the dispersity was largely broadened as the quantity of PEG-X was
reduced.
Figure 57 - Chromatogram of the samples RL-PE 07; RL-PE 08; RL-PE 09(4h, 50 mg AIBA, T=70℃, and Pethylene≈100 bar).
127.5
130
132.5
135
137.5
140
142.5
145
147.5
15 17.5 20 22.5 25 27.5 30 32.5 35 37.5 40
Ref
ract
ive
ind
ex
Retention volume (mL)
Refractive index vs Rentention volume
RL-PE 07
RL-PE 08
RL-PE 09
Solvent
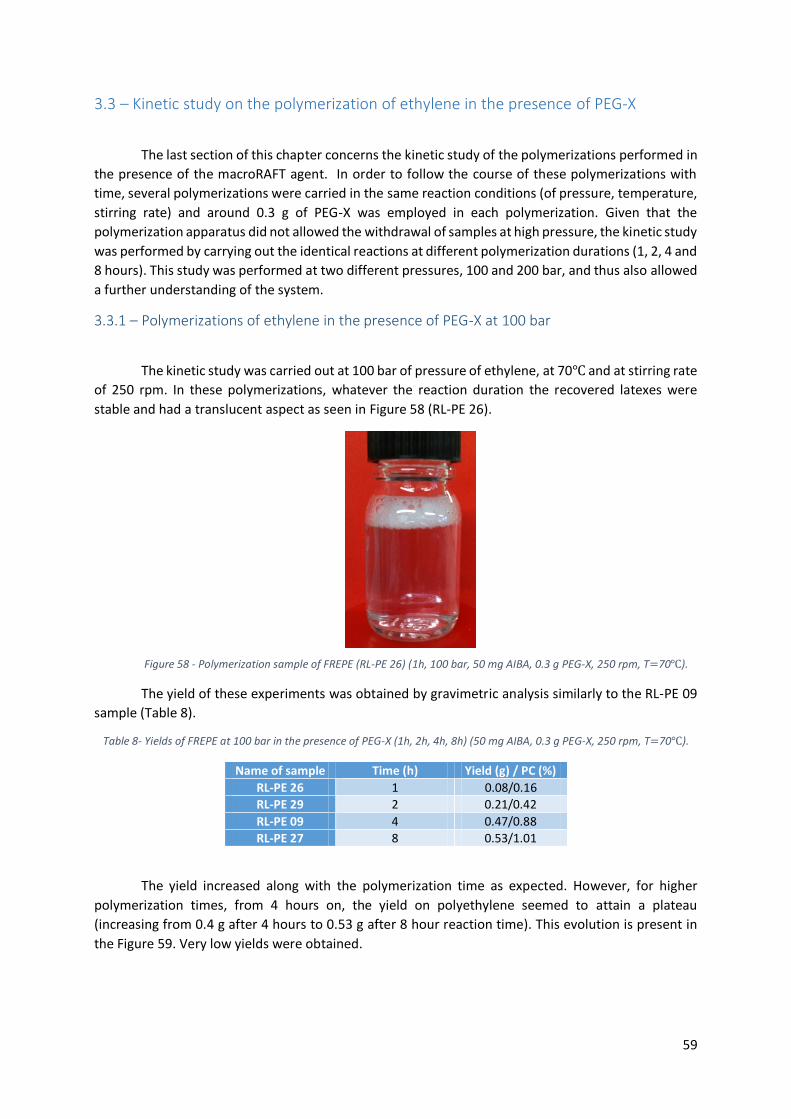
59
3.3 – Kinetic study on the polymerization of ethylene in the presence of PEG-X
The last section of this chapter concerns the kinetic study of the polymerizations performed in
the presence of the macroRAFT agent. In order to follow the course of these polymerizations with
time, several polymerizations were carried in the same reaction conditions (of pressure, temperature,
stirring rate) and around 0.3 g of PEG-X was employed in each polymerization. Given that the
polymerization apparatus did not allowed the withdrawal of samples at high pressure, the kinetic study
was performed by carrying out the identical reactions at different polymerization durations (1, 2, 4 and
8 hours). This study was performed at two different pressures, 100 and 200 bar, and thus also allowed
a further understanding of the system.
3.3.1 – Polymerizations of ethylene in the presence of PEG-X at 100 bar
The kinetic study was carried out at 100 bar of pressure of ethylene, at 70℃ and at stirring rate
of 250 rpm. In these polymerizations, whatever the reaction duration the recovered latexes were
stable and had a translucent aspect as seen in Figure 58 (RL-PE 26).
The yield of these experiments was obtained by gravimetric analysis similarly to the RL-PE 09
sample (Table 8).
Table 8- Yields of FREPE at 100 bar in the presence of PEG-X (1h, 2h, 4h, 8h) (50 mg AIBA, 0.3 g PEG-X, 250 rpm, T=70℃).
Name of sample Time (h) Yield (g) / PC (%)
RL-PE 26 1 0.08/0.16
RL-PE 29 2 0.21/0.42
RL-PE 09 4 0.47/0.88
RL-PE 27 8 0.53/1.01
The yield increased along with the polymerization time as expected. However, for higher
polymerization times, from 4 hours on, the yield on polyethylene seemed to attain a plateau
(increasing from 0.4 g after 4 hours to 0.53 g after 8 hour reaction time). This evolution is present in
the Figure 59. Very low yields were obtained.
Figure 58 - Polymerization sample of FREPE (RL-PE 26) (1h, 100 bar, 50 mg AIBA, 0.3 g PEG-X, 250 rpm, T=70℃).
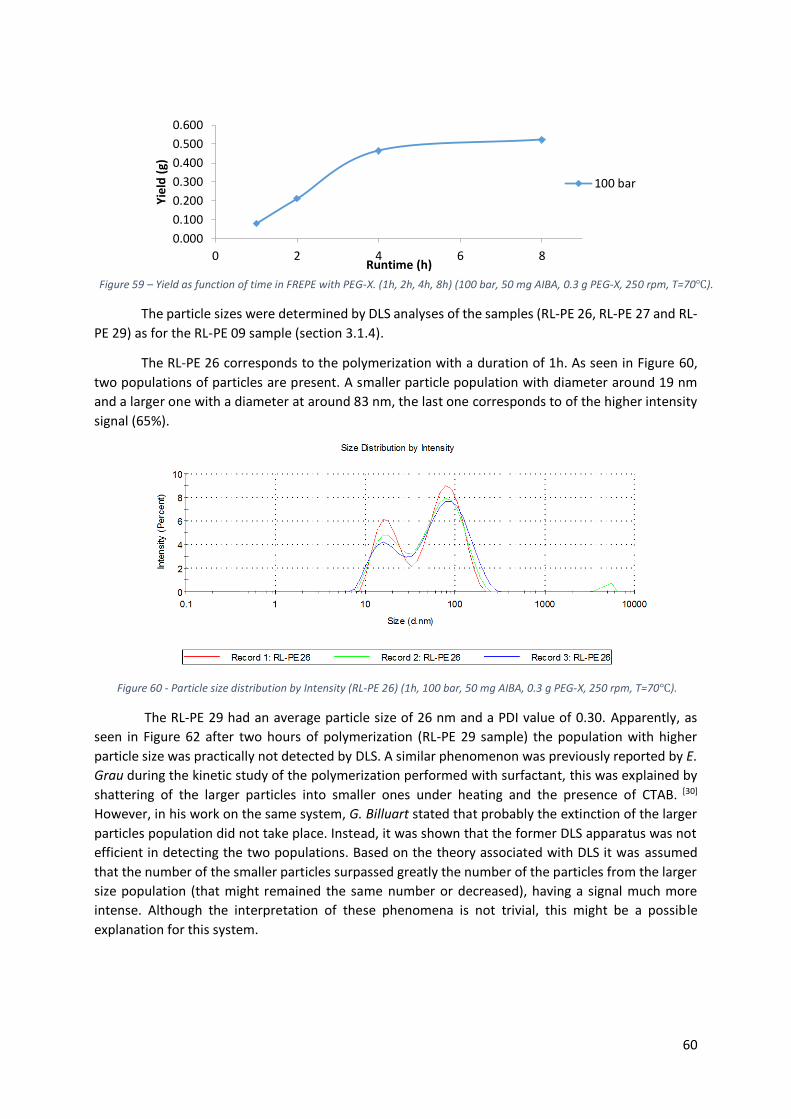
60
The particle sizes were determined by DLS analyses of the samples (RL-PE 26, RL-PE 27 and RL-
PE 29) as for the RL-PE 09 sample (section 3.1.4).
The RL-PE 26 corresponds to the polymerization with a duration of 1h. As seen in Figure 60,
two populations of particles are present. A smaller particle population with diameter around 19 nm
and a larger one with a diameter at around 83 nm, the last one corresponds to of the higher intensity
signal (65%).
The RL-PE 29 had an average particle size of 26 nm and a PDI value of 0.30. Apparently, as
seen in Figure 62 after two hours of polymerization (RL-PE 29 sample) the population with higher
particle size was practically not detected by DLS. A similar phenomenon was previously reported by E.
Grau during the kinetic study of the polymerization performed with surfactant, this was explained by
shattering of the larger particles into smaller ones under heating and the presence of CTAB. [30]
However, in his work on the same system, G. Billuart stated that probably the extinction of the larger
particles population did not take place. Instead, it was shown that the former DLS apparatus was not
efficient in detecting the two populations. Based on the theory associated with DLS it was assumed
that the number of the smaller particles surpassed greatly the number of the particles from the larger
size population (that might remained the same number or decreased), having a signal much more
intense. Although the interpretation of these phenomena is not trivial, this might be a possible
explanation for this system.
0.000
0.100
0.200
0.300
0.400
0.500
0.600
0 2 4 6 8
Yie
ld (
g)
Runtime (h)
100 bar
Figure 59 – Yield as function of time in FREPE with PEG-X. (1h, 2h, 4h, 8h) (100 bar, 50 mg AIBA, 0.3 g PEG-X, 250 rpm, T=70℃).
Figure 60 - Particle size distribution by Intensity (RL-PE 26) (1h, 100 bar, 50 mg AIBA, 0.3 g PEG-X, 250 rpm, T=70℃).
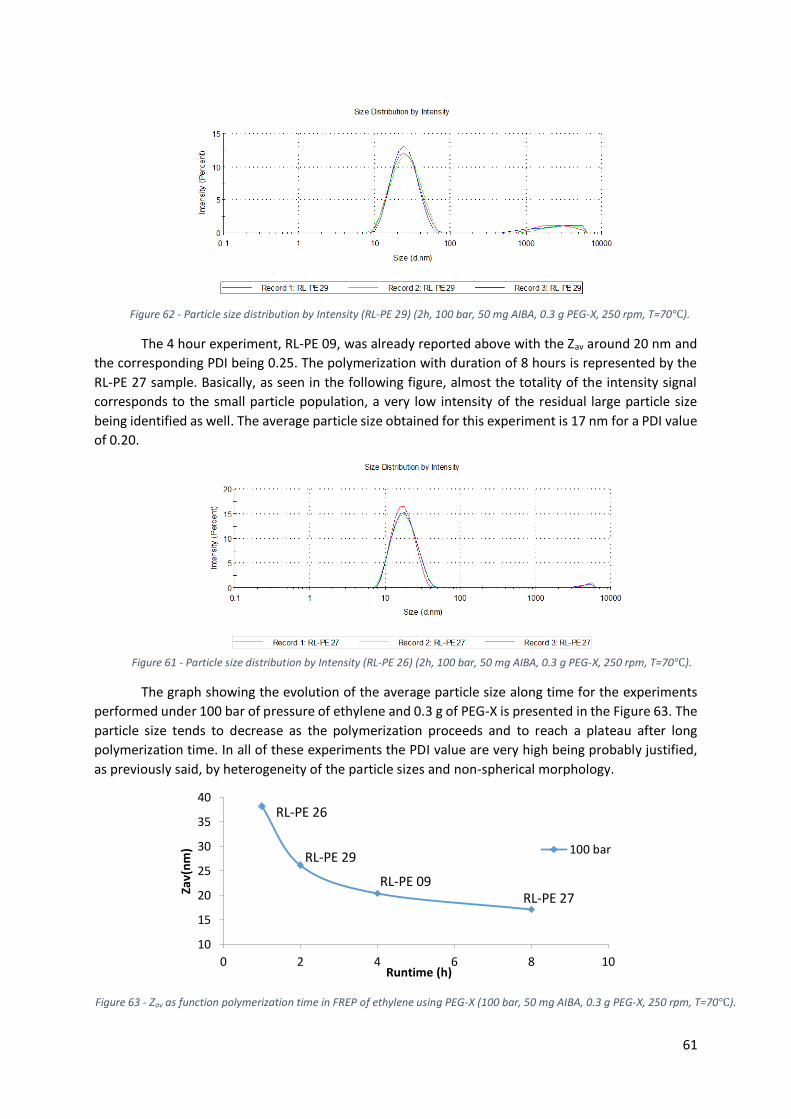
61
The 4 hour experiment, RL-PE 09, was already reported above with the Zav around 20 nm and
the corresponding PDI being 0.25. The polymerization with duration of 8 hours is represented by the
RL-PE 27 sample. Basically, as seen in the following figure, almost the totality of the intensity signal
corresponds to the small particle population, a very low intensity of the residual large particle size
being identified as well. The average particle size obtained for this experiment is 17 nm for a PDI value
of 0.20.
The graph showing the evolution of the average particle size along time for the experiments
performed under 100 bar of pressure of ethylene and 0.3 g of PEG-X is presented in the Figure 63. The
particle size tends to decrease as the polymerization proceeds and to reach a plateau after long
polymerization time. In all of these experiments the PDI value are very high being probably justified,
as previously said, by heterogeneity of the particle sizes and non-spherical morphology.
Figure 62 - Particle size distribution by Intensity (RL-PE 29) (2h, 100 bar, 50 mg AIBA, 0.3 g PEG-X, 250 rpm, T=70℃).
Figure 61 - Particle size distribution by Intensity (RL-PE 26) (2h, 100 bar, 50 mg AIBA, 0.3 g PEG-X, 250 rpm, T=70℃).
Figure 63 - Zav as function polymerization time in FREP of ethylene using PEG-X (100 bar, 50 mg AIBA, 0.3 g PEG-X, 250 rpm, T=70℃).
10
15
20
25
30
35
40
0 2 4 6 8 10
Zav(
nm
)
Runtime (h)
100 bar
RL-PE 26
RL-PE 29
RL-PE 09 RL-PE 27
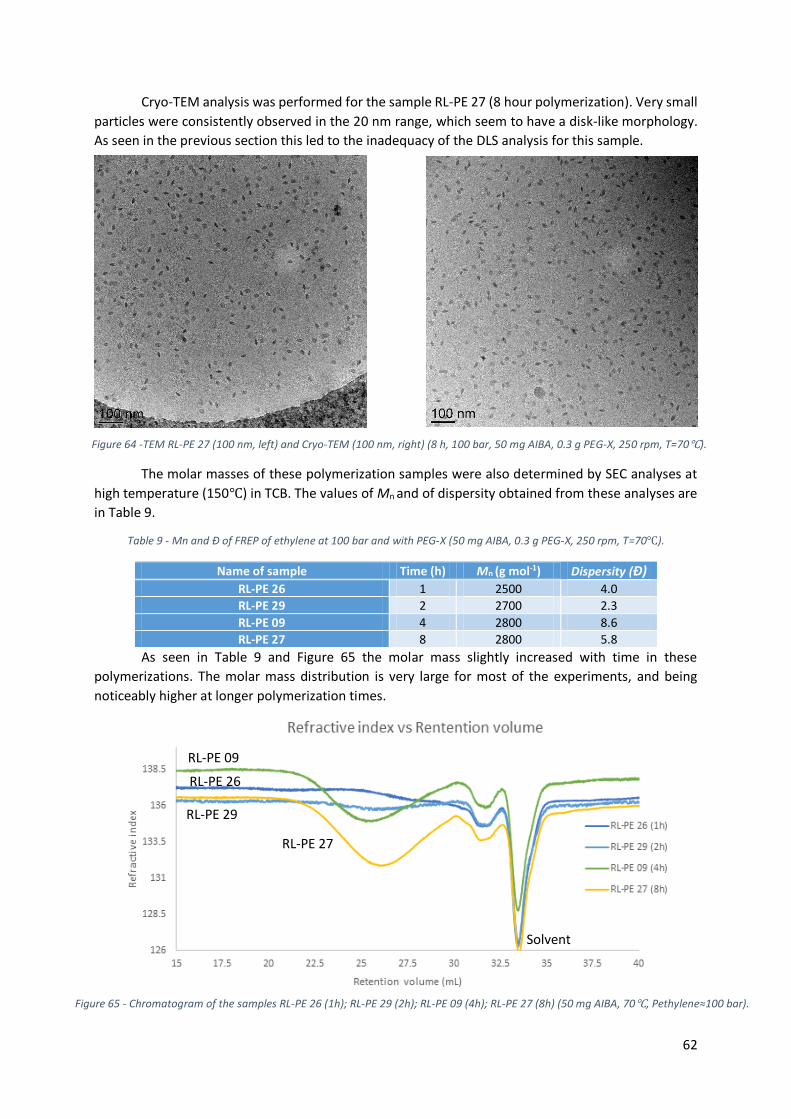
62
Cryo-TEM analysis was performed for the sample RL-PE 27 (8 hour polymerization). Very small
particles were consistently observed in the 20 nm range, which seem to have a disk-like morphology.
As seen in the previous section this led to the inadequacy of the DLS analysis for this sample.
The molar masses of these polymerization samples were also determined by SEC analyses at
high temperature (150℃) in TCB. The values of Mn and of dispersity obtained from these analyses are
in Table 9.
Table 9 - Mn and Đ of FREP of ethylene at 100 bar and with PEG-X (50 mg AIBA, 0.3 g PEG-X, 250 rpm, T=70℃).
Name of sample Time (h) Mn (g mol-1) Dispersity (Ð) RL-PE 26 1 2500 4.0
RL-PE 29 2 2700 2.3
RL-PE 09 4 2800 8.6
RL-PE 27 8 2800 5.8
As seen in Table 9 and Figure 65 the molar mass slightly increased with time in these
polymerizations. The molar mass distribution is very large for most of the experiments, and being
noticeably higher at longer polymerization times.
Solvent
RL-PE 27
RL-PE 29
RL-PE 26
RL-PE 09
Figure 64 -TEM RL-PE 27 (100 nm, left) and Cryo-TEM (100 nm, right) (8 h, 100 bar, 50 mg AIBA, 0.3 g PEG-X, 250 rpm, T=70℃).
Figure 65 - Chromatogram of the samples RL-PE 26 (1h); RL-PE 29 (2h); RL-PE 09 (4h); RL-PE 27 (8h) (50 mg AIBA, 70℃, Pethylene≈100 bar).
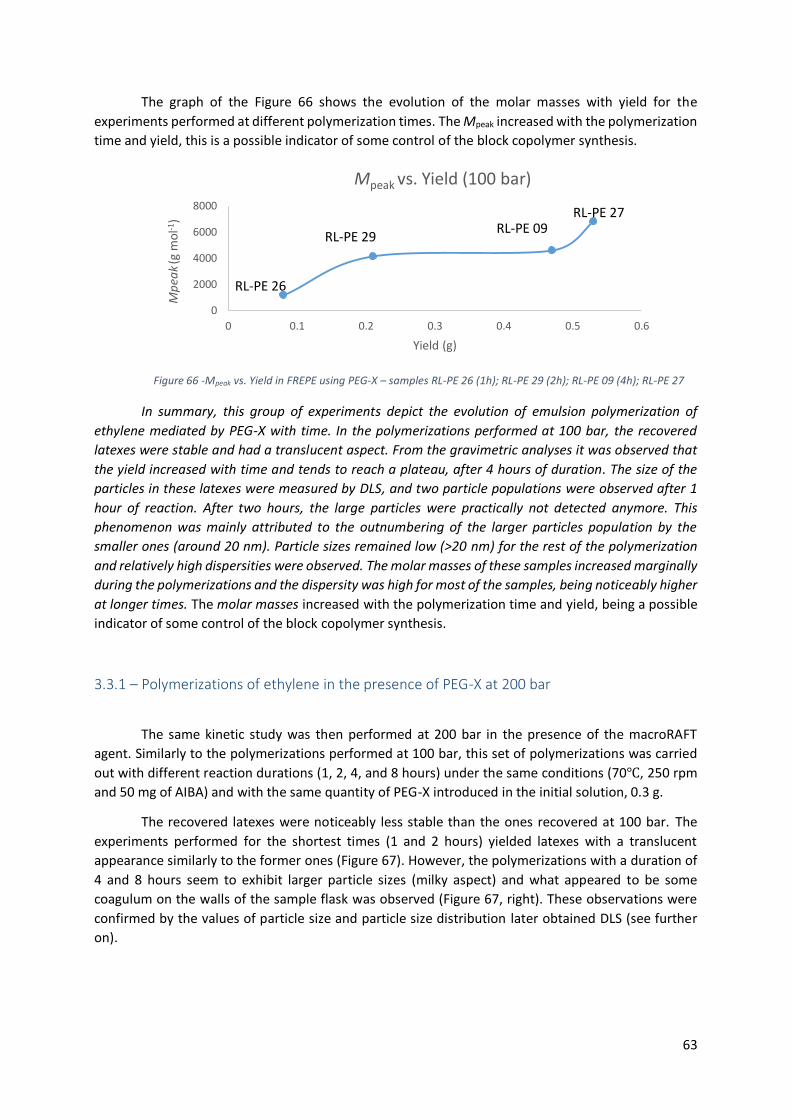
63
The graph of the Figure 66 shows the evolution of the molar masses with yield for the
experiments performed at different polymerization times. The Mpeak increased with the polymerization
time and yield, this is a possible indicator of some control of the block copolymer synthesis.
In summary, this group of experiments depict the evolution of emulsion polymerization of
ethylene mediated by PEG-X with time. In the polymerizations performed at 100 bar, the recovered
latexes were stable and had a translucent aspect. From the gravimetric analyses it was observed that
the yield increased with time and tends to reach a plateau, after 4 hours of duration. The size of the
particles in these latexes were measured by DLS, and two particle populations were observed after 1
hour of reaction. After two hours, the large particles were practically not detected anymore. This
phenomenon was mainly attributed to the outnumbering of the larger particles population by the
smaller ones (around 20 nm). Particle sizes remained low (>20 nm) for the rest of the polymerization
and relatively high dispersities were observed. The molar masses of these samples increased marginally
during the polymerizations and the dispersity was high for most of the samples, being noticeably higher
at longer times. The molar masses increased with the polymerization time and yield, being a possible
indicator of some control of the block copolymer synthesis.
3.3.1 – Polymerizations of ethylene in the presence of PEG-X at 200 bar
The same kinetic study was then performed at 200 bar in the presence of the macroRAFT
agent. Similarly to the polymerizations performed at 100 bar, this set of polymerizations was carried
out with different reaction durations (1, 2, 4, and 8 hours) under the same conditions (70℃, 250 rpm
and 50 mg of AIBA) and with the same quantity of PEG-X introduced in the initial solution, 0.3 g.
The recovered latexes were noticeably less stable than the ones recovered at 100 bar. The
experiments performed for the shortest times (1 and 2 hours) yielded latexes with a translucent
appearance similarly to the former ones (Figure 67). However, the polymerizations with a duration of
4 and 8 hours seem to exhibit larger particle sizes (milky aspect) and what appeared to be some
coagulum on the walls of the sample flask was observed (Figure 67, right). These observations were
confirmed by the values of particle size and particle size distribution later obtained DLS (see further
on).
0
2000
4000
6000
8000
0 0.1 0.2 0.3 0.4 0.5 0.6
Mp
eak
(g m
ol-1
)
Yield (g)
Mpeak vs. Yield (100 bar)
RL-PE 26
RL-PE 29 RL-PE 09
RL-PE 27
Figure 66 -Mpeak vs. Yield in FREPE using PEG-X – samples RL-PE 26 (1h); RL-PE 29 (2h); RL-PE 09 (4h); RL-PE 27
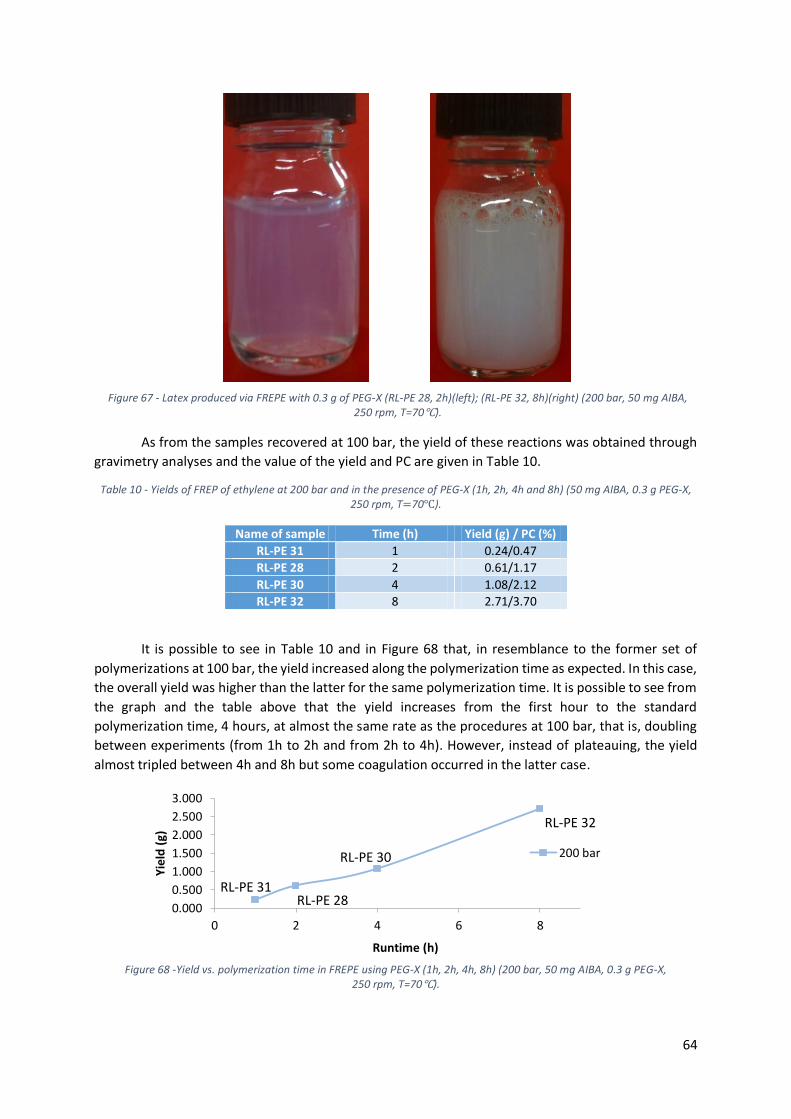
64
As from the samples recovered at 100 bar, the yield of these reactions was obtained through
gravimetry analyses and the value of the yield and PC are given in Table 10.
Table 10 - Yields of FREP of ethylene at 200 bar and in the presence of PEG-X (1h, 2h, 4h and 8h) (50 mg AIBA, 0.3 g PEG-X, 250 rpm, T=70℃).
Name of sample Time (h) Yield (g) / PC (%)
RL-PE 31 1 0.24/0.47
RL-PE 28 2 0.61/1.17
RL-PE 30 4 1.08/2.12
RL-PE 32 8 2.71/3.70
It is possible to see in Table 10 and in Figure 68 that, in resemblance to the former set of
polymerizations at 100 bar, the yield increased along the polymerization time as expected. In this case,
the overall yield was higher than the latter for the same polymerization time. It is possible to see from
the graph and the table above that the yield increases from the first hour to the standard
polymerization time, 4 hours, at almost the same rate as the procedures at 100 bar, that is, doubling
between experiments (from 1h to 2h and from 2h to 4h). However, instead of plateauing, the yield
almost tripled between 4h and 8h but some coagulation occurred in the latter case.
Figure 67 - Latex produced via FREPE with 0.3 g of PEG-X (RL-PE 28, 2h)(left); (RL-PE 32, 8h)(right) (200 bar, 50 mg AIBA, 250 rpm, T=70℃).
0.000
0.500
1.000
1.500
2.000
2.500
3.000
0 2 4 6 8
Yie
ld (
g)
Runtime (h)
200 bar
RL-PE 31 RL-PE 28
RL-PE 30
RL-PE 32
Figure 68 -Yield vs. polymerization time in FREPE using PEG-X (1h, 2h, 4h, 8h) (200 bar, 50 mg AIBA, 0.3 g PEG-X, 250 rpm, T=70℃).
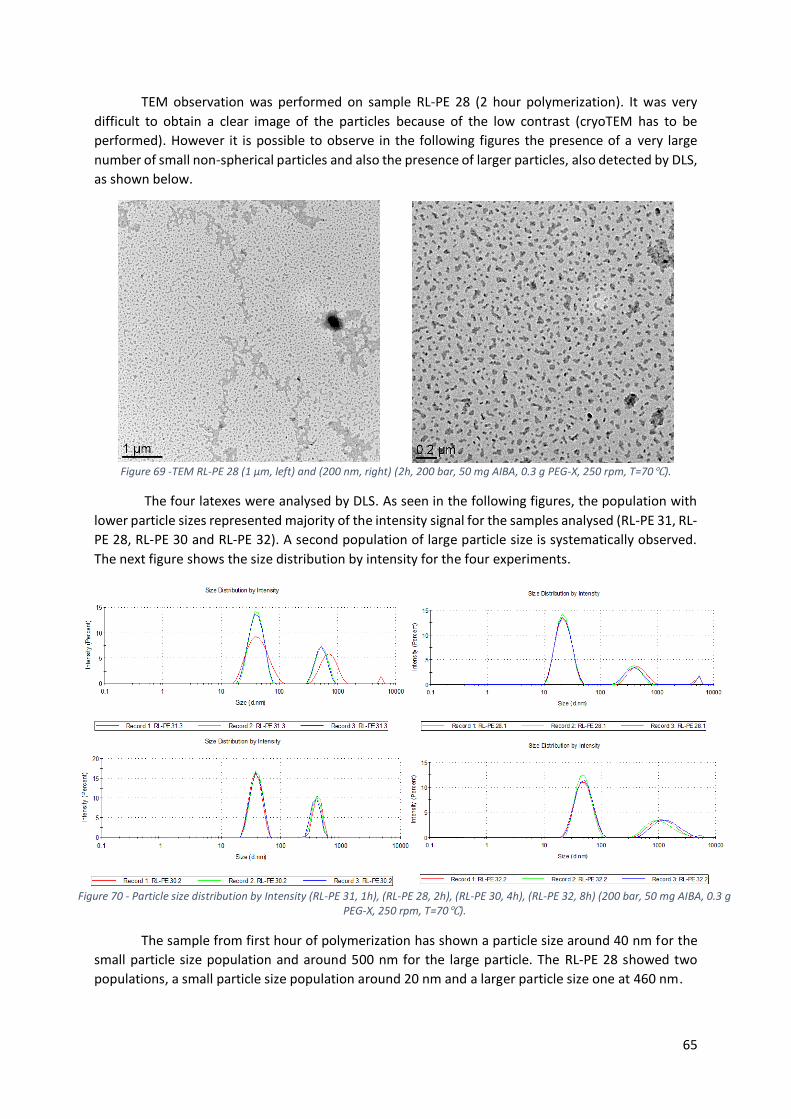
65
TEM observation was performed on sample RL-PE 28 (2 hour polymerization). It was very
difficult to obtain a clear image of the particles because of the low contrast (cryoTEM has to be
performed). However it is possible to observe in the following figures the presence of a very large
number of small non-spherical particles and also the presence of larger particles, also detected by DLS,
as shown below.
The four latexes were analysed by DLS. As seen in the following figures, the population with
lower particle sizes represented majority of the intensity signal for the samples analysed (RL-PE 31, RL-
PE 28, RL-PE 30 and RL-PE 32). A second population of large particle size is systematically observed.
The next figure shows the size distribution by intensity for the four experiments.
The sample from first hour of polymerization has shown a particle size around 40 nm for the
small particle size population and around 500 nm for the large particle. The RL-PE 28 showed two
populations, a small particle size population around 20 nm and a larger particle size one at 460 nm.
Figure 69 -TEM RL-PE 28 (1 µm, left) and (200 nm, right) (2h, 200 bar, 50 mg AIBA, 0.3 g PEG-X, 250 rpm, T=70℃).
Figure 70 - Particle size distribution by Intensity (RL-PE 31, 1h), (RL-PE 28, 2h), (RL-PE 30, 4h), (RL-PE 32, 8h) (200 bar, 50 mg AIBA, 0.3 g PEG-X, 250 rpm, T=70℃).
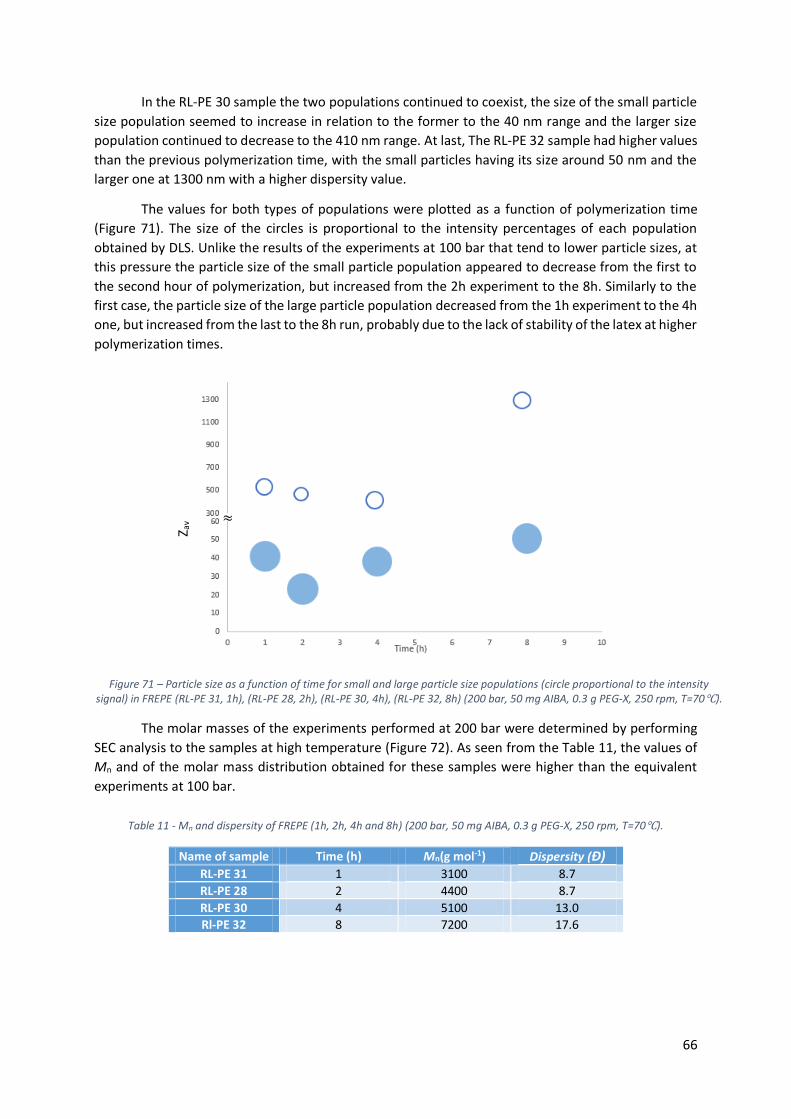
66
In the RL-PE 30 sample the two populations continued to coexist, the size of the small particle
size population seemed to increase in relation to the former to the 40 nm range and the larger size
population continued to decrease to the 410 nm range. At last, The RL-PE 32 sample had higher values
than the previous polymerization time, with the small particles having its size around 50 nm and the
larger one at 1300 nm with a higher dispersity value.
The values for both types of populations were plotted as a function of polymerization time
(Figure 71). The size of the circles is proportional to the intensity percentages of each population
obtained by DLS. Unlike the results of the experiments at 100 bar that tend to lower particle sizes, at
this pressure the particle size of the small particle population appeared to decrease from the first to
the second hour of polymerization, but increased from the 2h experiment to the 8h. Similarly to the
first case, the particle size of the large particle population decreased from the 1h experiment to the 4h
one, but increased from the last to the 8h run, probably due to the lack of stability of the latex at higher
polymerization times.
The molar masses of the experiments performed at 200 bar were determined by performing
SEC analysis to the samples at high temperature (Figure 72). As seen from the Table 11, the values of
Mn and of the molar mass distribution obtained for these samples were higher than the equivalent
experiments at 100 bar.
Table 11 - Mn and dispersity of FREPE (1h, 2h, 4h and 8h) (200 bar, 50 mg AIBA, 0.3 g PEG-X, 250 rpm, T=70℃).
Name of sample Time (h) Mn(g mol-1) Dispersity (Ð) RL-PE 31 1 3100 8.7
RL-PE 28 2 4400 8.7
RL-PE 30 4 5100 13.0
Rl-PE 32 8 7200 17.6
Z av
(nm
)
≈
Figure 71 – Particle size as a function of time for small and large particle size populations (circle proportional to the intensity signal) in FREPE (RL-PE 31, 1h), (RL-PE 28, 2h), (RL-PE 30, 4h), (RL-PE 32, 8h) (200 bar, 50 mg AIBA, 0.3 g PEG-X, 250 rpm, T=70℃).
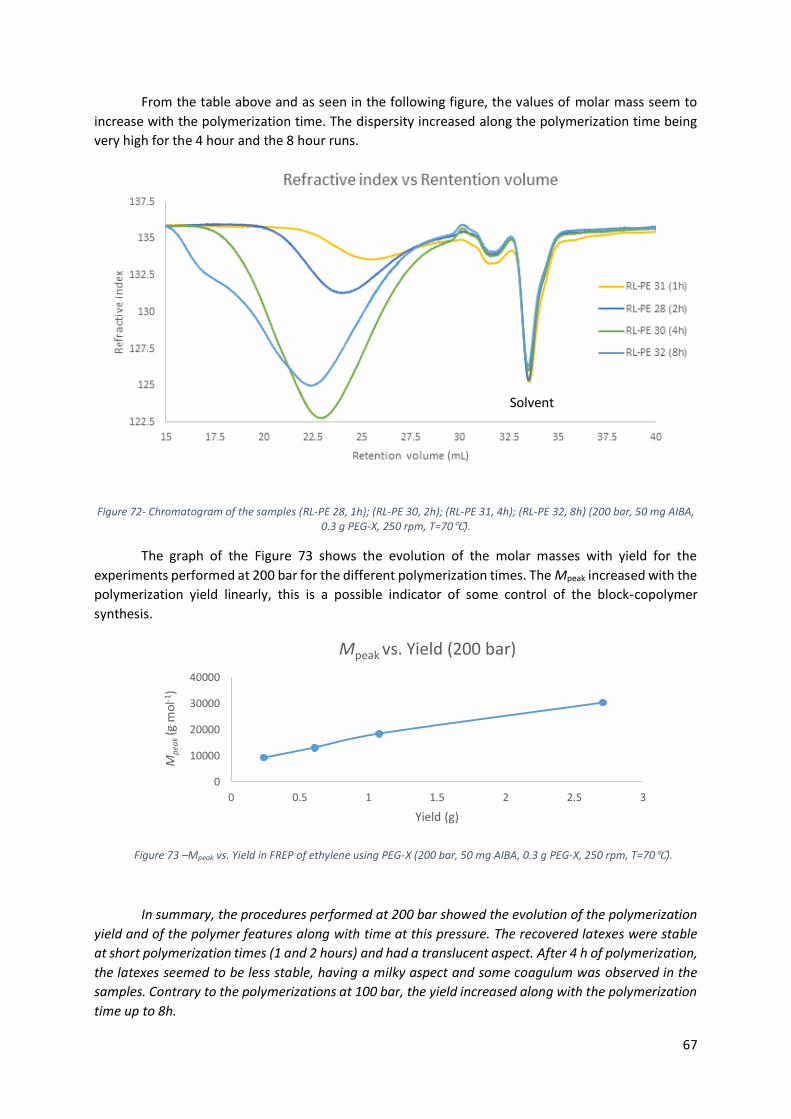
67
From the table above and as seen in the following figure, the values of molar mass seem to
increase with the polymerization time. The dispersity increased along the polymerization time being
very high for the 4 hour and the 8 hour runs.
The graph of the Figure 73 shows the evolution of the molar masses with yield for the
experiments performed at 200 bar for the different polymerization times. The Mpeak increased with the
polymerization yield linearly, this is a possible indicator of some control of the block-copolymer
synthesis.
In summary, the procedures performed at 200 bar showed the evolution of the polymerization
yield and of the polymer features along with time at this pressure. The recovered latexes were stable
at short polymerization times (1 and 2 hours) and had a translucent aspect. After 4 h of polymerization,
the latexes seemed to be less stable, having a milky aspect and some coagulum was observed in the
samples. Contrary to the polymerizations at 100 bar, the yield increased along with the polymerization
time up to 8h.
Figure 73 –Mpeak vs. Yield in FREP of ethylene using PEG-X (200 bar, 50 mg AIBA, 0.3 g PEG-X, 250 rpm, T=70℃).
Figure 72- Chromatogram of the samples (RL-PE 28, 1h); (RL-PE 30, 2h); (RL-PE 31, 4h); (RL-PE 32, 8h) (200 bar, 50 mg AIBA, 0.3 g PEG-X, 250 rpm, T=70℃).
Solvent
0
10000
20000
30000
40000
0 0.5 1 1.5 2 2.5 3
Mp
eak
(g m
ol-1
)
Yield (g)
Mpeak vs. Yield (200 bar)
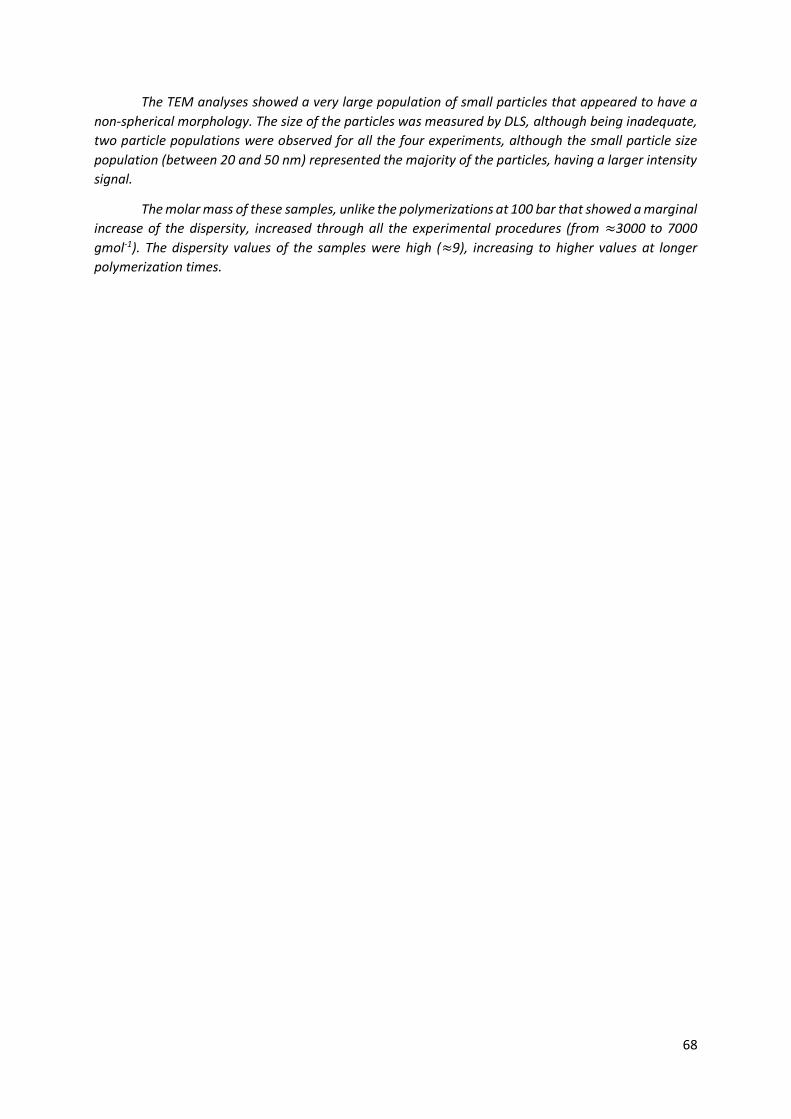
68
The TEM analyses showed a very large population of small particles that appeared to have a
non-spherical morphology. The size of the particles was measured by DLS, although being inadequate,
two particle populations were observed for all the four experiments, although the small particle size
population (between 20 and 50 nm) represented the majority of the particles, having a larger intensity
signal.
The molar mass of these samples, unlike the polymerizations at 100 bar that showed a marginal
increase of the dispersity, increased through all the experimental procedures (from ≈3000 to 7000
gmol-1). The dispersity values of the samples were high (≈9), increasing to higher values at longer
polymerization times.
69
Conclusions and perspectives
The primary aim of the present work was the implementation of the RAFT polymerization of
ethylene in a surfactant-free emulsion process to obtain, from water-soluble functional polymers,
aqueous dispersions of PE-based nanoparticles by the polymerization-induced self-assembly of
amphiphilic block copolymers (PISA process). It relied on the knowledge developed at the C2P2
laboratory, on the possibility of performing free radical emulsion polymerization of ethylene under
mild conditions (T<100℃ and P<250 bar) and the controlled radical polymerization (CRP) of ethylene
via RAFT. In addition the concepts developed at C2P2 for the synthesis of block copolymers produced
by emulsion polymerization according to the PISA process were also considered, and relied on the
chain extension of a preformed hydrophilic polymer produced by RAFT by a hydrophobic monomer in
water. This was presently tentatively applied to the case of ethylene.
The first part of this work consisted in the synthesis of the hydrophilic macroRAFT agent,
produced before the polymerization of ethylene. For that purpose, a commercially available
polyethylene glycol (PEG-OH) prepared via anionic polymerization was used. The hydroxyl chain end
can be further end-functionalized with a xanthate, producing xanthate-functionalized PEGs (PEG-X).
These xanthate based molecules are well-suited for the RAFT polymerization of ethylene. [57] The
characterization of the PEG-X was performed by SEC, and by 1H NMR .The molar masses obtained by
both techniques were in good agreement, close to 2300 g mol-1.
The second part of this work focused on the free radical emulsion polymerization of ethylene.
At first, there was the need to establish benchmarks experiments. Thus, a set of four different reactions
was performed. In the first place, the polymerization was carried out uniquely in the presence of a
cationic initiator (AIBA). In the second one, the experiment was performed in the presence of both
AIBA and a cationic surfactant, CTAB. Two more experiments were performed with either the
commercial PEG-OH or with the macroRAFT agent PEG-X. PEG-OH was used in order to evaluate the
activity of the xanthate chain-end. The main results from these polymerizations were compared
afterwards.
In terms of visual aspect it was possible to set two groups of latexes: ethylene polymerization
carried out only with AIBA yielded a stable and milky white latex. The same observation could be made
for the latex produced in the presence of PEG-OH. This suggested the presence of relatively large size
particles (around 100 nm). On the other hand, the second group is formed by the stable translucent
latex synthesized either in the presence of surfactant (CTAB) or in the process with PEG-X. The
translucent aspect suggested the presence of small size particles (around 25 nm) in the latexes. The
size range was confirmed by other analyses.
Indeed, cryo-TEM observations allowed estimating both the size and the morphology of the
particles. The polymerization performed only with initiator showed relatively large spherical particles
(around 75 nm), which also occurred with the polymerization in the presence of PEG-OH. The similarity
between the two experiments would indicate that PEG-OH had no influence in the polymerization of
ethylene. For the polymerizations carried out with surfactant and the ones performed with PEG-X it
was observed a vast majority of small size particles (≈25 nm). As expected, the morphology of the
particles from the latexes obtained in the presence of CTAB was disk-like shaped. In the case of the
polymerization with PEG-X, other morphologies were observed: a large number of particles appeared
to be disk-like shaped but cylindrical shapes were also observed. These unusual kinds of structures can
be of obtained by the PISA process. The crystallinity may favour the formation of such non-spherical
70
particles. The aspect of the latexes and the TEM pictures revealed a striking difference between the
polymerization performed in the presence of PEG-OH and PEG-X.
DLS analysis supported TEM observations. Polymerizations performed with only initiator or in
the presence of PEG-OH yielded relatively large spherical particles (around 75 nm) and had a low
polydispersity index, PDI (0.02 for both). The polymerization with PEG-X yielded a single particle size
population (≈25 nm) with a high PDI, which was interpreted as a deviation from the spherical
morphology (DLS was inadequate in such case).
The yield was determined for the four polymerizations after the same reaction time (4h). The
polymerization only with initiator and the one in presence of PEG-OH had the same yield, supporting
the conclusions drawn above on the role of PEG-OH. The lowest yield was obtained for the
polymerization conducted in presence of the macroRAFT agent and the influence of the quantity of
the macroRAFT agent in the polymerization of ethylene was further studied.
DSC analyses of the PE obtained with AIBA and with AIBA and CTAB showed crystallinity and
melting temperature values similar to those reported in previous studies for similar systems. In the
case of PEG-OH, two peaks were observed, which was correlated with the presence of two polymer
species in the sample, probably PEG-OH and PE. On the other hand the DSC of the product obtained
from the polymerization with PEG-X revealed a broad signal with no evidence of isolated PEG-X, which
could be interpreted as the formation of a block copolymer structure, together with PE homopolymer.
The main conclusions brought by these analyses are the following: The presence of PEG-OH
did not influence the process of polymerization. On the other hand, the polymerizations performed
with PEG-OH and PEG-X showed different behaviour, indicating that the xanthate-functionalized PEG
chains participated to the free radical process.
The first polymerizations with PEG-X yielded a very low amount of PE. Thus, the influence of
the quantity of macroRAFT agent on the resulting latexes characteristics was studied. This study
showed that this parameter has a great effect on the yield obtained - As the quantity of PEG-X
increased the yield decreased. On the other hand, the amount of PEG-X had no or little effect on the
particle size, with the Zav remaining around the 25 nm for the three samples, or on the molar masses,
which remained in the same range for the three experiments (2600 to 2800 g mol-1). The dispersity
however increased as the quantity of PEG-X was reduced.
At last, a kinetic study was made with polymerizations in the presence of the PEG-X. The
withdrawal of samples being not possible, several experiments were carried out in the same conditions
but with different durations (1, 2, 4, and 8h). This study was performed at two different pressures, 100
and 200 bar, allowing to study the influence of the pressure in these systems. At 100 bar, the recovered
latexes were stable and had a translucent aspect. However, after 1 hour of polymerization two particle
populations were observed. After two hours they were no longer observed. This phenomenon was
mainly attributed to the outnumbering of the larger particles population by the smaller ones (Zav≈20
nm). The molar masses increased with yield, although not completely linear, a possible indication of
some control of the block copolymer synthesis.
At 200 bar the recovered latexes were stable at short polymerization times (1 and 2 hours)
and had a translucent aspect. After 4 h, the latexes appeared to be less stable, having a milky aspect
and some coagula were observable. In resemblance to the polymerizations at 100 bar, the yield
increased along with the polymerization time, but were higher than in the first system. The molar mass
increased linearly with the polymerization yield, which again could be an indicator of some livingness
of the polymerization.
71
With all the acquired data it is possible to conclude that indeed, the aim of this project was
achieved. The emulsion polymerization of ethylene mediated by a xanthate macroRAFT can lead to the
formation of PE-based nanoparticles by a PISA process. The block copolymers formed in situ would
provide the stabilization of particles.
Future studies could continue on the characterization of the particles obtained in the
polymerizations with PEG-X, focusing on the morphology of the non-spherical particles and their
formation mechanism. Additionally, the use of other macroRAFT agents could be interesting to study,
and compared to the polymerizations performed in the presence of PEG-X, and open an opportunity
to increase the number of applications for this process.
72
References
[1] E. Segel, "Polyethylene Global Overview," 2012. [Online]. Available:
http://www.ptq.pemex.com/productosyservicios/eventosdescargas/Documents/Foro%2.pdf.
[Accessed 20 June 2015].
[2] A. J. Peacock, em Handbook of Polyethylene. Structures, Properties and Applications, New York,
Marcel Dekker, Inc., 2000, 1-42.
[3] C. F. Cordeiro, F. P. Petrocelli, em Encyclopedia of Polymer Science and Technology, John Wiley
& Sons, Inc., 2002, 412-441, vol. 2.
[4] C. F. Cordeiro, F. P. Petrocelli, Encyclopedia of Polymer Science and Technology, John Wiley &
Sons, Inc., 2002, pp. 382-482, vol. 2.
[5] Y. Tokiwa, B. P. Calabia, C. U. Ugwu e S. Aiba, “ Biodegradability of Plastics” International
Journal of Molecular Science, 3722-3742, vol. 10, 2009.
[6] G. ODIAN, em Principles of Polymerization, New Jersey, JOHN WILEY & SONS, INC., 2004, 301.
[7] J. K. Th. Meyer, Handbook of Polymer Reaction Engineering, Weinheim, Germany, WILEY-VCH
Verlag GmbH & Co, 2005, 1-15.
[8] H. R. Kricheldorf, O. Nuyken e G. Swift, Handbook of Polymer Synthesis, New York, Marcel
Dekker, 2005, 12-39.
[9] B. Poling, J. M. Prausnitz e J. P. O’Connell, Properties of Gases and Liquids, Fifth Edition, New
York, McGraw-Hill Education, 2001.
[10] J. A. Peacock, Handbook of Polyethylene Structures, Properties and Applications, New York,
Marcel Dekker, Inc., 2000, 43-66.
[11] E. Bamberger e . F. Tschirner, “"Ueber die Einwirkung von Diazomethan auf β-
Arylhydroxylamine",” Berichte der Deutschen chemischen Gesellschaft zu Berlin, 955-959, 1900.
[12] A. J. Peacock, Handbook of Polyethylene Structures, Properties and Applications, New York,
Marcel Dekker, 2000, 27-40.
[13] E. W. Fawcett, R. O. Gibson e M. W. Perrin, “POLYMERIZATION OF OLEFINS”. US Patente
2,153,553, 1939.
[14] J. T. M. Keurentjes, Handbook of Polymer, Weinheim, WILEY-VCH Verlag GmbH & Co. KGaA,
2005, 1-15.
[15] A. H. Muller, K. Matyjaszewski, Controlled and Living, Weinheim, WILEY-VCH Verlag GmbH &
Co. KGaA, 103-156, 2009
[16] K. Matyjaszewski, T. P. Davis, Handbook of Radical Polymerization, Hoboken, John Wiley &
Sons, Inc., vii-x., 2002
73
[17] K. Matyjaszewski e T. P. Davis, em Handbook of Radical Polymerization, Hoboken, John Wiley &
Sons, Inc, 2002, pp. 1-76.
[18] K. S. Whiteley, T. G. Heggs, H. Koch, R. L. Mawer e W. Immel, em Ullmann’s Encyclopedia of
Industrial Chemistry, Seventh Edition, Wiley-VCH Verlag GmbH & Co., 2002.
[19] E. Segel, “ "Polyethylene Global Overview,",” 2012. [Online]. Available:
http://www.ptq.pemex.com/productosyservicios/eventosdescargas/Documents/Foro%2.pdf..
[Acessed 20 June 2015].
[20] C. F. Cordeiro and F. P. Petrocelli, Encyclopedia of Polymer Science and Technology, vol. 2, John
Wiley & Sons, Inc., 2002, 382-482.
[21] C. BARNER-KOWOLLIK, P. VANA e T. P. DAVIS, “The Kinetics of Free radical” Handbook of
Radical Polymerization, Sydney, John Wiley & Sons, Inc., 2002, 187-262.
[22] G. A. Mortimer, “Fundamentals of the Free radical Polymerization”, Advances in Polymer
Science, Vol. 7, New york, Springer, 1970, 386-448.
[23] H. Knuuttila, A. Lehtinen, A. Nummila-Pakarinen, “Controlled Material Properties”, Advanced
Polyethylene Technologies, Porvoo, Finland, Springer-Verlag Berlin Heidelberg, 2004, 16-22.
[24] J. K. T. Meyer, em Handbook of Polymer Reaction Engineering, Weinheim, WILEY-VCH Verlag
GmbH & Co. KGaA, 2005, 17-18.
[25] A. Leblanc, E. Grau, J.-P. Broyer, C. Boisson, R. Spitz e V. Monteil, Macromolecules, 44, 3293–
3301, 2011.
[26] T. Suwa, H. Nakajima, M. Takehisa e S. Machi, “Preparation of emulsifier-free polyethylene
latecies by radiation polymerization,” Journal of Polymer Science: Polymer Letters Edition, 13,
369–375, 1975.
[27] E. Grau, J. Broyer, C. Boisson, R. Spitz e V. Monteil, “Free Ethylene Radical Polymerization under
Mild conditions: the impact of the solvent,” Macromolecules, 42, 7279–7281, 2009.
[28] E. Grau, J.P. Broyer, C. Boisson, R. Spitz e V. Monteil, “Unusual activation by solvent of the
ethylene free radical polymerization,” Polymer chemistry, 2, 2328–2333, 2011.
[29] C. Dommanget et. al., “Enhanced Spin Capturing Polymerization of Ethylene”, Macromolecules,
46, 29-36, 2013.
[30] E. Grau, P.-Y. Dugas, J.-P. Broyer, C. Boisson, R. Spitz e V. Monteil, Angew Chem. international
ed, 122, 6962–6964, 2010.
[31] G. Billuart, E. Bourgeat-Lami, M. Lansalot e V. Monteil, Macromolecules, 47, 6591-6600, 2014.
[32] C. Barner-Kowollik, Handbook of RAFT polymerization, Weinheim, WILEY-VCH Verlag GmbH &
Co. KGaA, 2008, 285-295.
[33] K. T. Meyer, Handbook of Polymer Reaction Engineering, Weinheim, WILEY-VCH Verlag GmbH &
Co. KGaA, 2005, 249-312.
74
[34] C. D. Anderson, E. S. Daniels, em Emulsion Polymerisation and Applications of Latex, Shropshire,
Rapra Technology Limited, 2003, 3-10.
[35] W. Harkins, “Theory of the mechanism of emulsion polymerization,” Journal of the American
Chemical Society, 1947, 69, 1428–1444.
[36] M. G. I. L. G. Khaddazh, “An Advanced Approach on the Study of Emulsion Polymerization: Effect
of the Initial Dispersion State of the System on the Reaction Mechanism, Polymerization Rate,
and Size Distribution of Polymer-Monomer Particles”, InTech, 2012, 164-200.
[37] G. T. Russell, R. G. Gilbert e D. Napper, “Chain-length-dependent termination rate processes in
free radical polymerizations. 1. Theory,” Macromolecules, vol. 25, 2459–2469, 1992.
[38] H. Heinrich, G. Siebert, “Process for the production of polymerization products”. Patent
US2334195 A, 1943.
[39] H. Heinrich, C. W. Rautenstrauch, G. Siebert, “Production of polymerization products from
ethylene”. Patent US2342400 A, 1944.
[40] H. K. Stryker, A. F. Helin, G. J. Mantell, “Emulsion polymerization of ethylene. II. Effect of recipe
on particle size and distribution,” J. Appl. Polym. Sci., 10, 1214, 1966.
[41] H. K. Stryker, A. F. Helin, G. J. Mantell, “Emulsion polymerization of ethylene III - factors
afecting the stability of polyethylene latexes,” J. of Applied Polymer Science, vol. 10, 81-96,
1966.
[42] G. J. Mantell, H. . K. Stryker, A. F. Helin, D. R. Jamieson, C. H. Wright, “Emulsion polymerization
of ethylene. IV. Effect of recipe and polymerization conditions on polymer properties,” Journal
of Applied Polymer Science, vol. 10 (12), 1845–1862, 1966.
[43] S. Senrui, T. Suwa, K. Konishi, M. Takehisa, J. Polym. Sci. Polym. Chem., vol. 12, 83–92, 1974.
[44] T. Suwa, H. Nakajima, M. Takehisa, S. Machi, Polym Lett Ed, 1975.
[45] S. Machi, S. Kise, M. Hagiwara, T. Kagiya, J. Polym. Sci., vol. 4, 585–588, 1966.
[46] A. L. German, P. A. Weerts, R. G. Gilbert, “Kinetic aspects of the emulsion polymerization of
butadiene,” Macromolecules, 24, 1622–1682, 1991.
[47] J. Wu, J. P. Tomba, J. K. Oh, M. A. Winnik, R. Farwaha, J. Rademacher, “Synthesis of Dye-Labeled
Poly(vinyl acetate- co-ethylene) (EVA) Latex and Polymer Diffusion in their Latex Films,” Journal
of polymer science, Part A, Pol. chem., 43, 5581–5596.
[48] J. K. Th. Meyer, “Living Polymerization in Emulsion,” Handbook of Polymer Reaction
Engineering, Weinheim, WILEY-VCH Verlag GmbH & Co. KGaA, 2005, 275-285.
[49] A. Muller, K. Matyjaszewski, Controlled and Living Polymerizations, Weinheim, WILEY-VCH
Verlag GmbH & Co., 2009, xv-xvii.
[50] J. C. et. al., “Living Free radical Polymerization by Reversible Addition-Fragmentation Chain
Transfer: The RAFT Process,” Macromolecules, 31, 5559-5562, 1998.
75
[51] C. Barner-Kowollik, Handbook of RAFT polymerization, Weinheim, WILEY-VCH Verlag GmbH &
Co. KGaA, 2008, 235-284.
[52] A. H. Muller, K. Matyjaszewski, Controlled and Living Polymerization, Weinheim, WILEY-VCH
Verlag GmbH & Co., 2009, 126-155.
[53] J. CHIEFARI, E. RIZZARDO, Handbook of Radical Polymerization, Hoboken, John Wiley and Sons,
Inc., 2002, 629-690.
[54] M. Hill, R. N. Carmean, B. S. Sumerlin, Macromolecules, 48, 5459−5469, 2015.
[55] D. J. Keddie, G. Moad, E. Rizzardo, S. H. Thang, “RAFT Agent Design and Synthesis”
Macromolecules, 2012, 45 (13), 5321–5342
[56] M. Benaglia, J. Chiefari, Y. K. Chong, G. Moad, E. Rizzardo, S. H. Thang, “Universible (switchable)
RAFT agents,” J. Am. Chem. Soc. , 131, 6914–6915, 2009.
[57] C. Dommmanget, F. D'Agosto, V. Monteil, “Polymerization of Ethylene through Revirsible
Addition-Fragmentation Chain Transfer (RAFT),” Angewandte Chemie int. ed., 53, Wiley-VHC
verlag GmbH & Co., 2014.
[58] B. Charleux, G. Delaittre, J. Rieger e F. D'Agosto, “Polymerization-Induced Self-Assembly: From
Soluble Macromolecules to block copolymer Nano-Objects in one Step,” Macromolecules, 45
(17), 6753-6765, 2012.
[59] Szwarc, M., Nature (London), 178, 1168, 1956.
[60] M. Lansalot, J. Rieger, F. D'Agosto, “"Polymerization-Induced Self-Assembly: the Contribution of
Controlled Radical Polymerization to the Formation of Self-Stabilized Polymer Particles of
Various Morphologies” em Macromolecular self-assembly, Wiley, 2016- in press.
[61] M. Lansalot, J. Rieger, F. D'Agosto “Polymerization-Induced Self-Assembly: The contribution of
Controlled Radical polymerization to the formation of Self-Stabilized Polymer Particles of
various Morphologies,” 2016- in press.
[62] S. Binauld, L. Delafresnaye, B. Charleux, F. D'Agosto, M. Lansalot, Macromolecules, 47 (10),
3461-3472, 2014.
[63] Sigma-Aldrich, “sigmaaldrich.com,” [Online]. Available:
http://www.sigmaaldrich.com/content/dam/sigma
aldrich/docs/Aldrich/General_Information/thermal_initiators.pdf. [Acedido em 2015].
[64] G. Billuart, PhD Thesis -Free radical emulsion polymerization of ethylene, 2015.
[65] M. Szwarc, M. Levy, R. Milkovich, J. Am. Chem. Soc., 78, 2656, 1956.
[66] T. P. Davis, Handbook of Radical Polymerization, Hoboken, John Wiley & Sons, Inc, 2002, pp.
775-785.
[67] E. Grau, P.-Y. Dugas, J.-P. Broyer, C. Boisson, R. Spitz, V. Monteil, Angew Chem. international
ed., 49 (38), 6810–6812, 2010.
76
[68] S. P. Armes, N. J. Warren, “Polymerization-Induced Self-Assembly of Block Copolymer
Nanoobjects via RAFT Aqueous Dispersion Polymerization,” Journal of the American Chemical
Society, 136 (29), 10174-10185, 2014.
[69] A. L. German, P. A. Weerts e R. G. Gilbert, “Kinetic aspects of the emulsion polymerization of
butadiene,” Macromolecules, 24, 1622–1682.
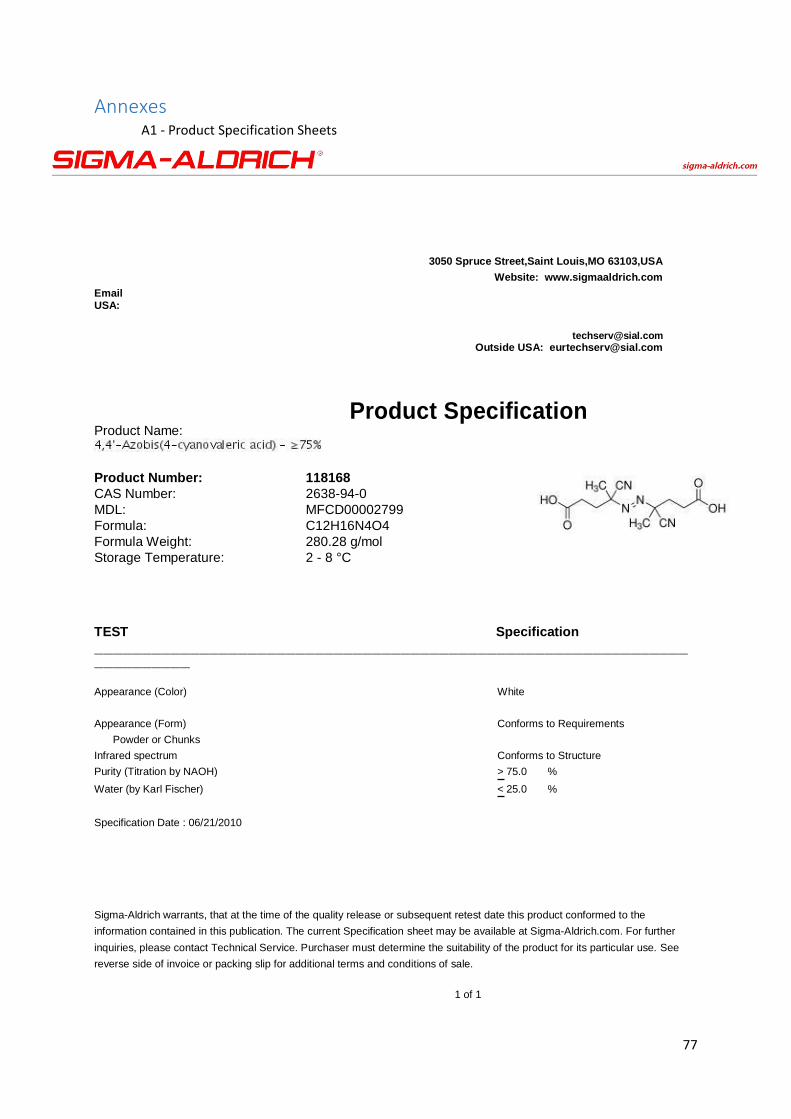
77
Annexes A1 - Product Specification Sheets
3050 Spruce Street,Saint Louis,MO 63103,USA
Website: www.sigmaaldrich.com Email USA:
Outside USA: [email protected]
Product Name: Product Specification
Product Number: 118168
CAS Number: 2638-94-0
MDL: MFCD00002799
Formula: C12H16N4O4
Formula Weight: 280.28 g/mol
Storage Temperature: 2 - 8 °C
TEST Specification ________________________________________________________________________ Appearance (Color) White
Appearance (Form) Conforms to Requirements Powder or Chunks
Infrared spectrum Conforms to Structure Purity (Titration by NAOH) > 75.0 % Water (by Karl Fischer) < 25.0 %
Specification Date : 06/21/2010 Sigma-Aldrich warrants, that at the time of the quality release or subsequent retest date this product conformed to the
information contained in this publication. The current Specification sheet may be available at Sigma-Aldrich.com. For further
inquiries, please contact Technical Service. Purchaser must determine the suitability of the product for its particular use. See
reverse side of invoice or packing slip for additional terms and conditions of sale.
1 of 1
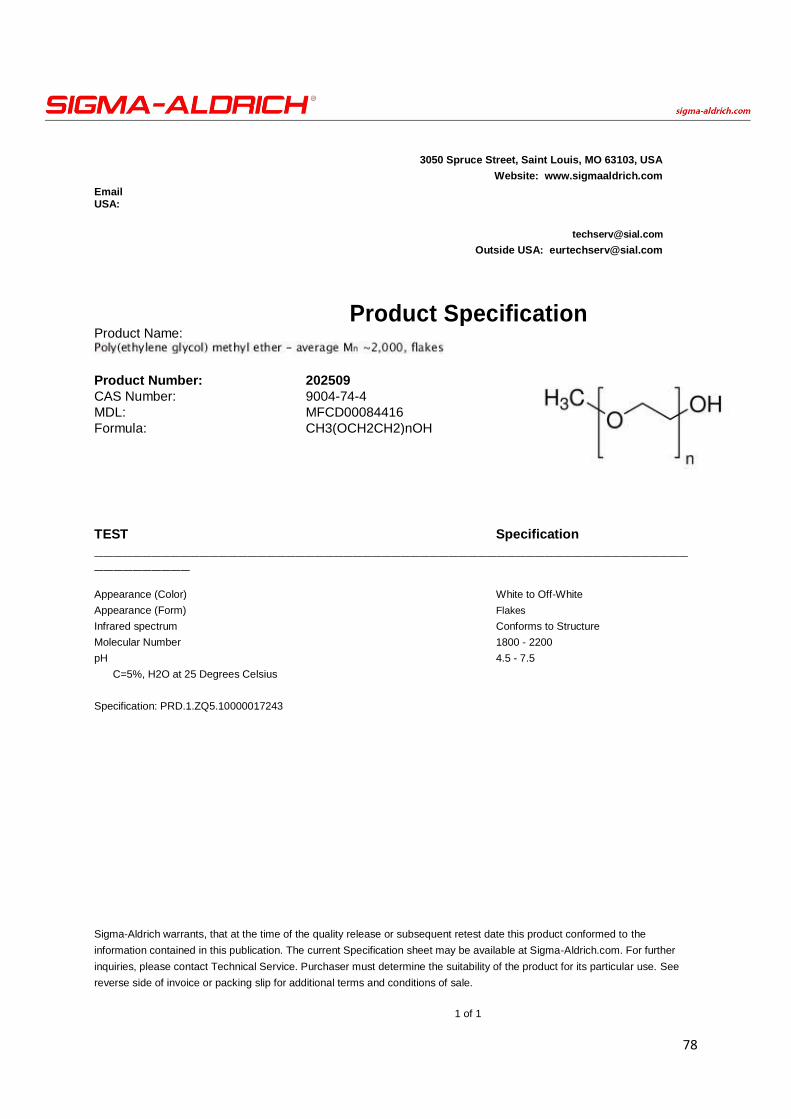
78
3050 Spruce Street, Saint Louis, MO 63103, USA Website: www.sigmaaldrich.com
Email USA:
Outside USA: [email protected]
Product Name: Product Specification
Product Number: 202509
CAS Number: 9004-74-4
MDL: MFCD00084416
Formula: CH3(OCH2CH2)nOH
TEST Specification ________________________________________________________________________ Appearance (Color) White to Off-White Appearance (Form) Flakes Infrared spectrum Conforms to Structure Molecular Number 1800 - 2200 pH 4.5 - 7.5
C=5%, H2O at 25 Degrees Celsius
Specification: PRD.1.ZQ5.10000017243 Sigma-Aldrich warrants, that at the time of the quality release or subsequent retest date this product conformed to the
information contained in this publication. The current Specification sheet may be available at Sigma-Aldrich.com. For further
inquiries, please contact Technical Service. Purchaser must determine the suitability of the product for its particular use. See
reverse side of invoice or packing slip for additional terms and conditions of sale.
1 of 1
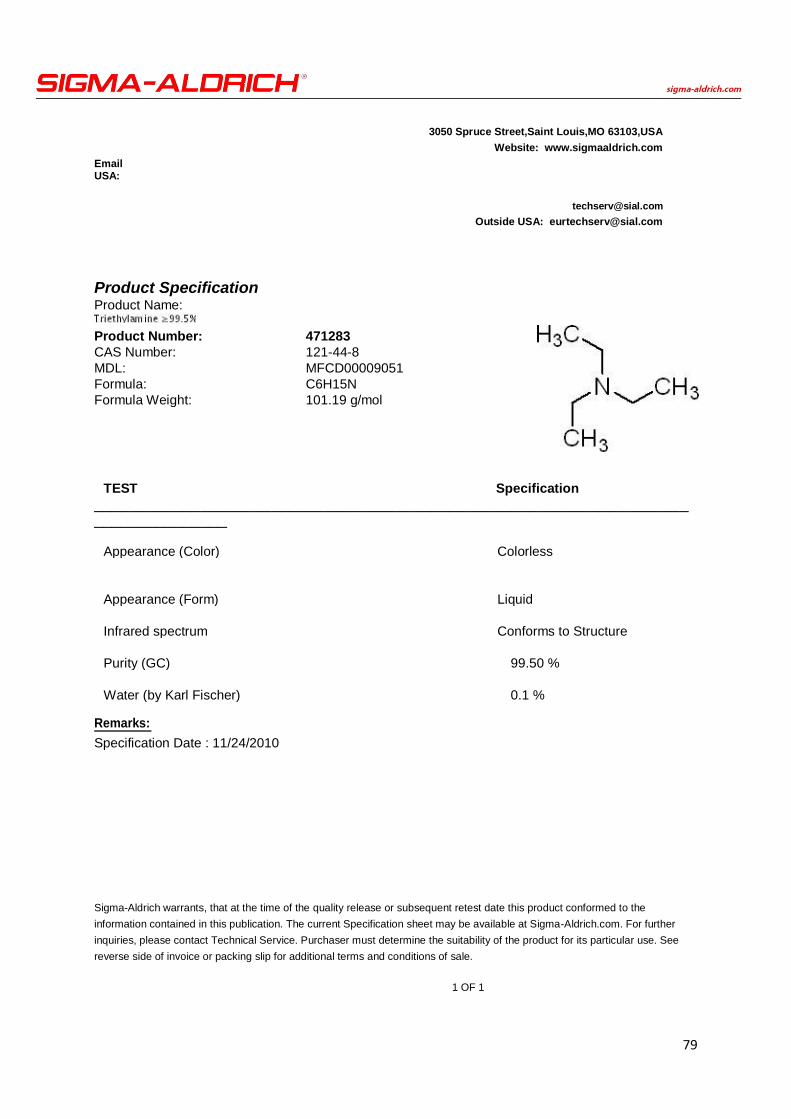
79
3050 Spruce Street,Saint Louis,MO 63103,USA Website: www.sigmaaldrich.com
Email USA:
Outside USA: [email protected]
Product Specification Product Name: Product Number: 471283 CAS Number: 121-44-8 MDL: MFCD00009051 Formula: C6H15N Formula Weight: 101.19 g/mol
TEST Specification
__________________________________________________________________________________
Appearance (Color) Colorless
Appearance (Form) Liquid
Infrared spectrum Conforms to Structure
Purity (GC) 99.50 %
Water (by Karl Fischer) 0.1 %
Remarks:
Specification Date : 11/24/2010 Sigma-Aldrich warrants, that at the time of the quality release or subsequent retest date this product conformed to the
information contained in this publication. The current Specification sheet may be available at Sigma-Aldrich.com. For further
inquiries, please contact Technical Service. Purchaser must determine the suitability of the product for its particular use. See
reverse side of invoice or packing slip for additional terms and conditions of sale.
1 OF 1