magnetic nanoparticles through organometallic synthesis ... · magnetic nanoparticles through...
TRANSCRIPT
Magnetic nanoparticles through organometallic synthesis:
evolution of the magnetic properties from isolated nanoparticles
to organised nanostructures
Frederic Dumestre,ab Susana Martinez,yb David Zitoun,b Marie-Claire Fromen,c
Marie-Jose Casanove,c Pierre Lecante,c Marc Respaud,d Arnaud Serres,d
Robert E. Benfield,e Catherine Amiens*b and Bruno Chaudretb
a Digital DNA Labs, Semiconductor Products Sector, Motorola, le Mirail B.P. 1029,
31023 Toulouse, Franceb Laboratoire de Chimie de Coordination, UMR 8241-CNRS, 205, Route de Narbonne,
31077 Toulouse Cedex 04, France. E-mail: [email protected] Centre d’Elaboration des Materiaux et d’Etudes Structurales, CNRS, 29, Rue Jeanne
Marvig, BP 4347, 31055 Toulouse Cedex, Franced Laboratoire National des Champs Magnetiques Pulses et Laboratoire de Physique de la
Matiere Condensee, INSA, 135 Av. de Rangueil, 31077 Toulouse, Francee Functional Materials Group, School of Physical Sciences, University of Kent,
Canterbury, UK CT2 7NR
Received 25th March 2003, Accepted 23rd April 2003First published as an Advance Article on the web 28th August 2003
Co and NiFe nanoparticles (2.7 to 3.3 nm mean diameter) of narrow size distribution havebeen obtained through the decomposition of organometallic precursors in organicsolutions of long alkyl chain ligands, namely oleic acid and hexadecylamine. Materials ofvarious volume fractions were produced. The particles have been structurally characterisedby WAXS. Both adopt the bulk structure: HCP in the case of cobalt; a mixture of FCCand BCC for NiFe. Their aptitude to self-assemble either on flat supports or in bulk solidstate has been investigated by means of TEM and SAXS. This study suggests thecrystallisation of the nanoparticles upon solvent evaporation, especially a local FCCarrangement was observed for the NiFe material. Magnetic measurements (SQUID)confirm this tendency. The blocking temperature depends on the metal volume fraction, i.e.on the anisotropy generated by the dipolar couplings (Ki). We show that, for densesamples, the particles of high intrinsic anisotropy, Ku , (Co) still display an individualbehaviour while the soft ones (NiFe) display a collective behaviour.
y Present address: Laboratorio de Sintesis Organometalica, Escuela de Quimica, Facultad de Ciencias, UCV,1041-A Caracas, Venezuela.
DOI: 10.1039/b303376g Faraday Discuss., 2004, 125, 265–278 265
This journal is # The Royal Society of Chemistry 2003
I. Introduction
Driven by potential applications in optics,1 electronics2 or magnetic data storage,3 an importantresearch effort has been directed towards the study of size controlled nanoparticles. Size reductioneffects have been intensively studied on assemblies of isolated nanoparticles. However, packing ofnanoparticles, which is mandatory in many applications, may greatly modify their individualbehaviour.4 For example, dipolar couplings or even exchange couplings may arise between mag-netic particles.5 If strong exchange or dipolar couplings take place, the magnetisation reversalprocess changes from rotation controlled to domain-nucleation controlled and thus a particlecannot be used as a unit cell for data storage. New magnetic behaviours are also expected for 2Dassemblies: depending on the kind of arrangement the nanoparticles adopt on the surface, thedipolar interactions may be either demagnetising or magnetising, leading in the latter case to aferromagnetic behaviour of the nanoparticle assembly.6 Hence the control of the organisation ofnanoparticles whether it is a self-assembly,7 or induced by a specifically designed functionalisationof the particles8 is very challenging.
One strategy to obtain regularly organised nanostructures is the synthesis of nanoparticlessurrounded by ligands that promote their self-assembly, in general after size selection (to reduce thesize dispersion to less than 5%), and help to control the distance between the nanoparticles.9 Sunand Murray10 have, for example, reported a high temperature preparation of 9 nm cobalt nano-particles displaying a long-range self-organization. This method has been extended to the synthesisof Fe/Pt particles in order to increase the magnetic anisotropy of the materials with the goal ofproducing high-density memories.11 Cobalt nanoparticles that self-assemble into 2D superlatticeshave also been reported by the group of Pileni by reverse micelle synthesis.12 Recently, formationof 3D crystals of Co3Pt and FePt nanoparticles has been achieved by very slow diffusion techniquesby Rogach et al.13
The coordination of the ligands to the nanoparticles surface must not alter the intrinsic specificphysical properties of the particles nor those induced by their nanometric size. This latter point isimportant in order to take advantage of both the intrinsic and collective properties for futureapplications.
Our group has developed an organometallic route towards the synthesis of metallic nanoparticles(such as Pt, Ru, Rh, Cu, In, Zn, PtRu, PdCu . . .) of narrow size distribution.14 This method hasalso been applied to the synthesis of magnetic nanoparticles of Co,15 Ni,16 or even bimetallic onessuch as CoPt,17 CoRh.18 This method is based on the decomposition of an olefinic complexunder a controlled atmosphere of H2 in mild conditions of pressure. It was shown that the surfaceof the nanoparticles is free of contaminating agents: the magnetic properties are identical to thoseobserved for nanoparticles produced and studied in ultra high vacuum.19 Furthermore, we havedemonstrated that s-donor ligands such as amines or carboxylic acids do not alter the magneticproperties of the nanoparticles.20 They are thus good candidates for the synthesis of ligandstabilised magnetic nanoparticles.
We report here the synthesis of magnetic Co and NiFe nanoparticles with sizes from 2.7 to 3.3nm, stabilised by oleic acid or hexadecylamine and their structural characterisation by TEM andWAXS. We also discuss their self-assembly into 2D or 3D super-structures and long-rangeordering on the basis of TEM and SAXS. We finally focus on the magnetic properties of thenanoparticle assemblies, especially those arising from magnetic couplings, and their effect onthe effective anisotropy of the system, with respect to the average particle–particle distance, and tothe organisation of the particles in the materials.
II. Synthesis and structural characterisation
Synthesis of magnetic nanoparticles is a difficult process. Thus, in addition to the control of the sizeand size distribution, magnetic couplings that tend to favour the agglomeration of the particleshave to be dealt with. Moreover, the magnetic properties of such small particles highly depend ontheir surface state and the metals involved are extremely reactive towards dioxygen. A carefulchoice of the stabilising ligands and of the synthesis conditions is thus required. As already statedabove, amines and carboxylic acids do not modify the surface magnetism of the particles.
266 Faraday Discuss., 2004, 125, 265–278
Furthermore they have already been used to promote self-assembly of various nanoparticle sys-tems21 and exist with sufficiently long chains to avoid exchange coupling between the magneticparticles. Among the possible metal precursors, organometallic complexes with olefin or polyolefinligands are the more interesting since they decompose easily and generate bare metal atoms andonly alkanes as by-products. Olefinic precursors of cobalt: Co(C8H12)(C8H13), synthesizedaccording to published procedures22 and nickel: Ni(C8H12)2 , have been used here to synthesizemagnetic nanoparticles of Co and, in association with Fe(CO)5 , NiFe nanoparticles. These pre-cursors have already proven to be well adapted for the synthesis of size controlled nano-particles.15,16,20,23
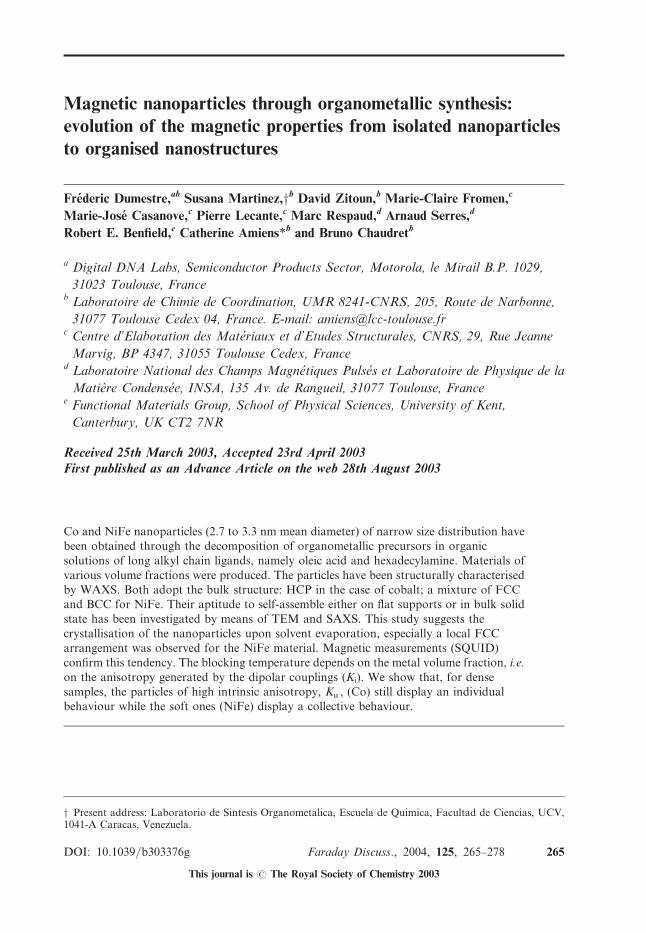
Two distinct procedures have been used. The cobalt precursor is very reactive and usuallydecomposes at room temperature. However, Co nanoparticles were obtained through hydro-genation (3 bar H2) of the precursor in anisole, in the presence of oleic acid at 150 �C.24 Very fastdecomposition is observed. This, associated with a high nucleation rate ensures the formation ofsmall particles. The decomposition leads only to cyclooctane as by product. The final material wasrecovered either by evaporation of the solvent and alkane to dryness Co1, or after precipitation ofthe concentrated crude solution into excess pentane Co2. The objective of the precipitation step wasnot to select the size of the particles but to get rid of excess ligand. Accordingly, compound Co1 hasvery low cobalt content (10.4%) when comparing to Co2 (48.8%). Moreover, some shadowyregions, corresponding to excess ligand, can be observed on the TEM25 images of Co1 (see Fig. 1).On the contrary, the decomposition of the iron precursor requires thermal activation, even in the
presence of the nickel organometallic complex. Furthermore, upon decomposition of the ironprecursor, a large quantity of carbon monoxide is formed which could adsorb and react at thenanoparticles surface if not driven out of the reaction medium. Thus, to synthesise the NiFenanoparticles, we refluxed a 1/1 mixture of the two precursors in anisole.26 Hexadecylamine waschosen in this case to stabilise the particles, since it had already proven of good value in the sta-bilisation of nickel nanoparticles20a and was successfully used to induce long range self-assembly ofIn or Sn particles.21 The solution turns black very quickly under these conditions. The reaction wasmonitored by IR spectroscopy, especially we have checked that there was no Fe(CO)5 left in themedium after 3 h. The final material was recovered by evaporation of the solvent to dryness. Noadsorbed CO could be evidenced at the nanoparticles surface by IR spectrocopy conducted on KBrpellets of the solid final material. Two different syntheses, following the same procedure, lead totwo materials: NiFe1 and NiFe2 that differ only by the mean diameter of the particles. This pointwill be discussed later.The chemical conditions used in these syntheses generate nanoparticles of narrow size dis-
tribution, as can be deduced from TEM images of the materials Co1-2, NiFe1-2 and typical sizehistograms (Figs. 1–4). This is a great advantage for self-assembly, because it suppresses the timeconsuming and low yield size selection steps. Cobalt particles are obtained with two different sizes2.5 and 3 nm for Co1 and Co2 respectively. NiFe1 and NiFe2 consist of NiFe nanoparticles ofrespectively 2.7 nm and 3.3 nm. The difference in size observed between Co1 and Co2, should be
Fig. 1 TEM of cobalt nanoparticles stabilised by oleic acid, Co1, as deposited on amorphous carbon and sizehistogram.
Faraday Discuss., 2004, 125, 265–278 267
related to a slight difference in the heating process more than to the precipitation step, since nometal residue could be observed in the filtrate. The fact that the mean size of NiFe nanoparticlesvaries from one synthesis to the other can most probably be attributed to the same reason, as thenucleation process is the determining step and, unfortunately, yet the less controlled one.7f,27
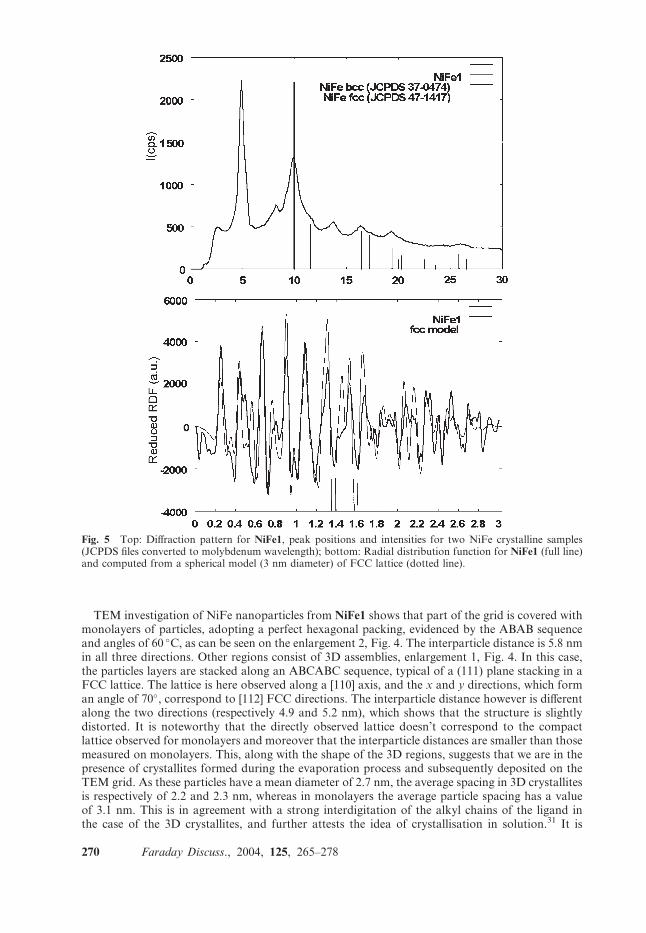
Atomic structures within the nanoparticles have been further investigated by WAXS.28 Cobaltnanoparticles display an HCP structure with parameters identical to that of bulk cobalt.15b,20b Ascan be deduced from Fig. 5 (bottom scheme), the radial distribution function (RDF) associated toNiFe nanoparticles displays a narrow first peak corresponding to a metal–metal bond of circa 251pm, evidencing the metallic character of the particles. This RDF globally corresponds to thatcomputed from a spherical particle with a FCC lattice; however the agreement is not perfect.Accordingly, the corresponding diffraction pattern, Fig. 5 (top scheme), displays peaks that cor-relate either to FCC or to BCC phases. For bulk NiFe, it has been reported that BCC and FCCphases coexist at low temperatures (below 250 �C) for Ni contents between 10 and 70%.29 A similarbehaviour is observed here for the NiFe nanoparticles. Distribution of both Ni and Fe in theparticles is difficult to determine. However magnetic measurements,30 especially the very lowanisotropy value of these nanoparticles, are in good agreement with the formation of an alloy.
III. Organisation
The organisation of the particles has been investigated both on the crude powder by SAXSmeasurements and via TEM imaging of carbon coated copper grids on which a drop of a toluenesolution of the material has been evaporated. No precaution was taken to control the evaporationrate of the solvent film.
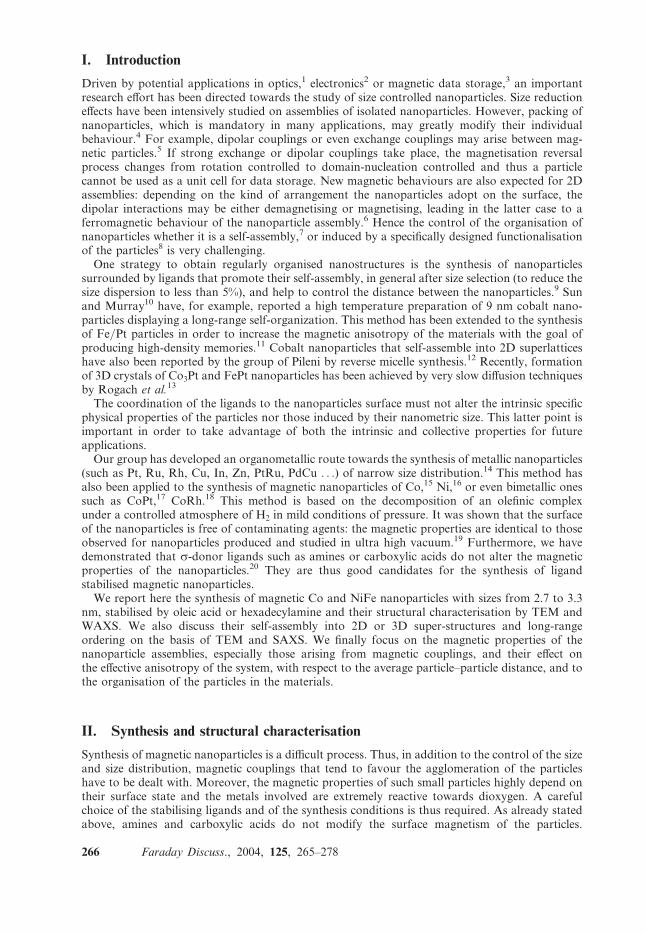
Fig. 2 TEM of cobalt nanoparticles stabilised by oleic acid, Co2, as deposited on amorphous carbon anddistance histograms.
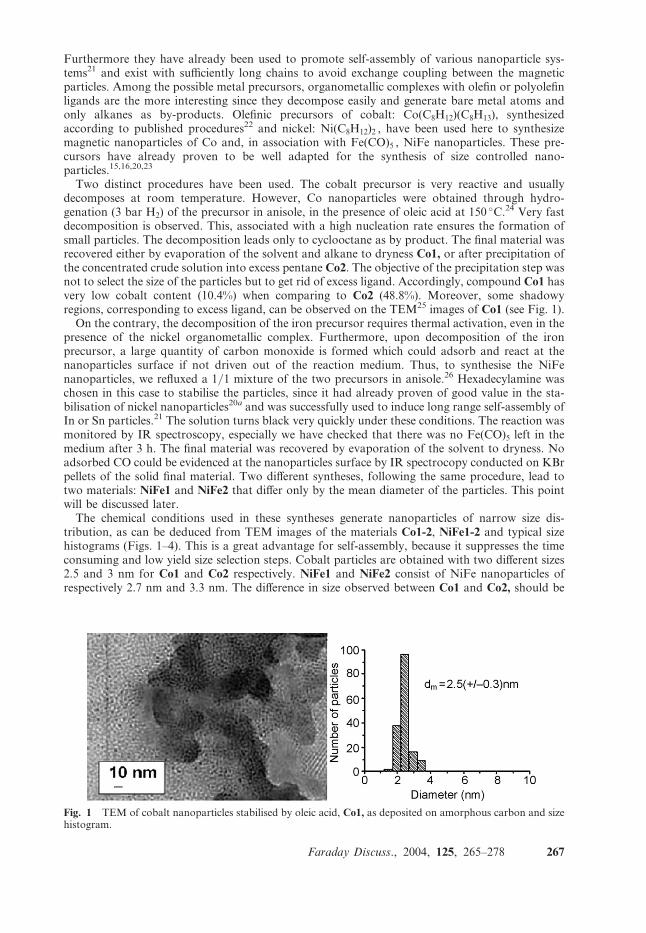
Fig. 3 TEM of hexadecylamine stabilised NiFe nanoparticles, NiFe2, as deposited on amorphous carbon, sizeand distance histograms. Scale bar: 10 nm.
268 Faraday Discuss., 2004, 125, 265–278
The different self-organisation patterns observed on the grids (Figs. 1–4) can be related to boththe particle content in the material and the nature of the surrounding ligand. In the case of NiFe2,the organisation is scarce, most probably because of a slightly too broad size distribution. Themean distances between NiFe nanoparticles measured in dense regions fall on an average value of6 nm (Fig. 3). From the mean diameter of these particles, 3.3 nm, we deduce an average spacing of2.7 nm. As coordinated hexadecylamine extends its saturated alkyl chain to a maximum of 2.2 nm,the average spacing measured implies either constrained configurations for the alkyl chain or theoccurrence of some interdigitation between the chains of adjacent particles.
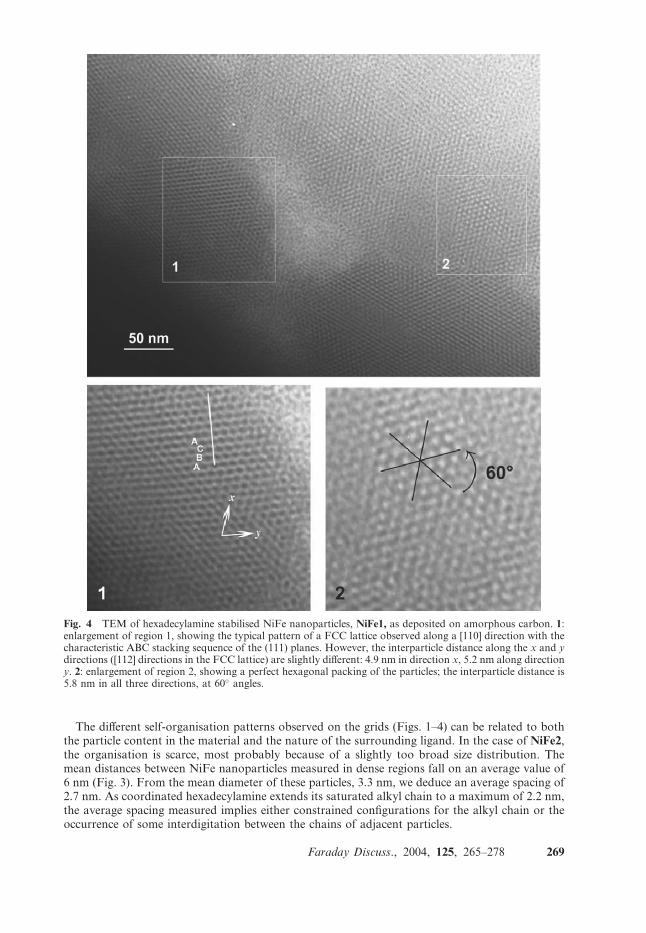
Fig. 4 TEM of hexadecylamine stabilised NiFe nanoparticles, NiFe1, as deposited on amorphous carbon. 1:enlargement of region 1, showing the typical pattern of a FCC lattice observed along a [110] direction with thecharacteristic ABC stacking sequence of the (111) planes. However, the interparticle distance along the x and ydirections ([112] directions in the FCC lattice) are slightly different: 4.9 nm in direction x, 5.2 nm along directiony. 2: enlargement of region 2, showing a perfect hexagonal packing of the particles; the interparticle distance is5.8 nm in all three directions, at 60� angles.
Faraday Discuss., 2004, 125, 265–278 269
TEM investigation of NiFe nanoparticles from NiFe1 shows that part of the grid is covered withmonolayers of particles, adopting a perfect hexagonal packing, evidenced by the ABAB sequenceand angles of 60 �C, as can be seen on the enlargement 2, Fig. 4. The interparticle distance is 5.8 nmin all three directions. Other regions consist of 3D assemblies, enlargement 1, Fig. 4. In this case,the particles layers are stacked along an ABCABC sequence, typical of a (111) plane stacking in aFCC lattice. The lattice is here observed along a [110] axis, and the x and y directions, which forman angle of 70�, correspond to [112] FCC directions. The interparticle distance however is differentalong the two directions (respectively 4.9 and 5.2 nm), which shows that the structure is slightlydistorted. It is noteworthy that the directly observed lattice doesn’t correspond to the compactlattice observed for monolayers and moreover that the interparticle distances are smaller than thosemeasured on monolayers. This, along with the shape of the 3D regions, suggests that we are in thepresence of crystallites formed during the evaporation process and subsequently deposited on theTEM grid. As these particles have a mean diameter of 2.7 nm, the average spacing in 3D crystallitesis respectively of 2.2 and 2.3 nm, whereas in monolayers the average particle spacing has a valueof 3.1 nm. This is in agreement with a strong interdigitation of the alkyl chains of the ligand inthe case of the 3D crystallites, and further attests the idea of crystallisation in solution.31 It is
Fig. 5 Top: Diffraction pattern for NiFe1, peak positions and intensities for two NiFe crystalline samples(JCPDS files converted to molybdenum wavelength); bottom: Radial distribution function for NiFe1 (full line)and computed from a spherical model (3 nm diameter) of FCC lattice (dotted line).
270 Faraday Discuss., 2004, 125, 265–278
noteworthy that spontaneous crystallisation of tin nanoparticles in the presence of hexadecylaminehas already been observed in our group.21
In solution in a good solvent, and due to the high curvature of the nanoparticle surface, the alkylchain of the ligand is very mobile.32 This insures the stability of the colloidal solutions. Indeed, ifthe particles got close, the motions of the alkyl chain would be restricted, which is not favourablefrom an entropic point of view, moreover osmotic effects would also tend to repel the particles.However, as the solvent evaporates the particles are forced to get close to one another. Van derWaals interactions, either between the particles metallic core or between the alkane chains, can takeplace. The interdigitation process would then favour these Van der Waals interactions inducingcrystallisation of the alkyl chain in the particle interspacing and crystallization of the particleassembly.In the case of cobalt nanoparticles protected by oleic acid, the TEM images display different
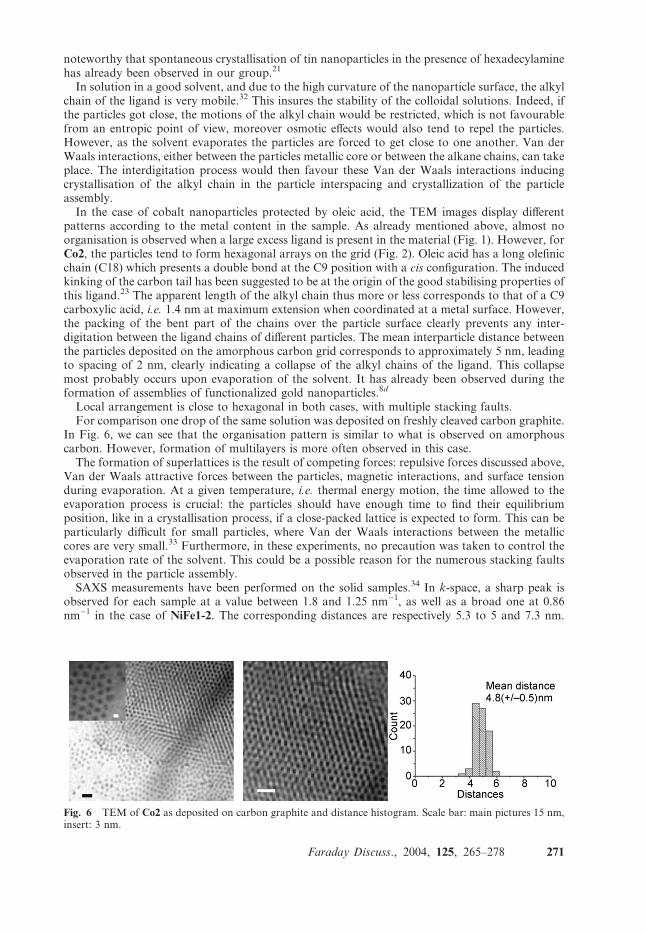
patterns according to the metal content in the sample. As already mentioned above, almost noorganisation is observed when a large excess ligand is present in the material (Fig. 1). However, forCo2, the particles tend to form hexagonal arrays on the grid (Fig. 2). Oleic acid has a long olefinicchain (C18) which presents a double bond at the C9 position with a cis configuration. The inducedkinking of the carbon tail has been suggested to be at the origin of the good stabilising properties ofthis ligand.23 The apparent length of the alkyl chain thus more or less corresponds to that of a C9carboxylic acid, i.e. 1.4 nm at maximum extension when coordinated at a metal surface. However,the packing of the bent part of the chains over the particle surface clearly prevents any inter-digitation between the ligand chains of different particles. The mean interparticle distance betweenthe particles deposited on the amorphous carbon grid corresponds to approximately 5 nm, leadingto spacing of 2 nm, clearly indicating a collapse of the alkyl chains of the ligand. This collapsemost probably occurs upon evaporation of the solvent. It has already been observed during theformation of assemblies of functionalized gold nanoparticles.8d
Local arrangement is close to hexagonal in both cases, with multiple stacking faults.For comparison one drop of the same solution was deposited on freshly cleaved carbon graphite.
In Fig. 6, we can see that the organisation pattern is similar to what is observed on amorphouscarbon. However, formation of multilayers is more often observed in this case.The formation of superlattices is the result of competing forces: repulsive forces discussed above,
Van der Waals attractive forces between the particles, magnetic interactions, and surface tensionduring evaporation. At a given temperature, i.e. thermal energy motion, the time allowed to theevaporation process is crucial: the particles should have enough time to find their equilibriumposition, like in a crystallisation process, if a close-packed lattice is expected to form. This can beparticularly difficult for small particles, where Van der Waals interactions between the metalliccores are very small.33 Furthermore, in these experiments, no precaution was taken to control theevaporation rate of the solvent. This could be a possible reason for the numerous stacking faultsobserved in the particle assembly.SAXS measurements have been performed on the solid samples.34 In k-space, a sharp peak is
observed for each sample at a value between 1.8 and 1.25 nm�1, as well as a broad one at 0.86nm�1 in the case of NiFe1-2. The corresponding distances are respectively 5.3 to 5 and 7.3 nm.
Fig. 6 TEM of Co2 as deposited on carbon graphite and distance histogram. Scale bar: main pictures 15 nm,insert: 3 nm.
Faraday Discuss., 2004, 125, 265–278 271
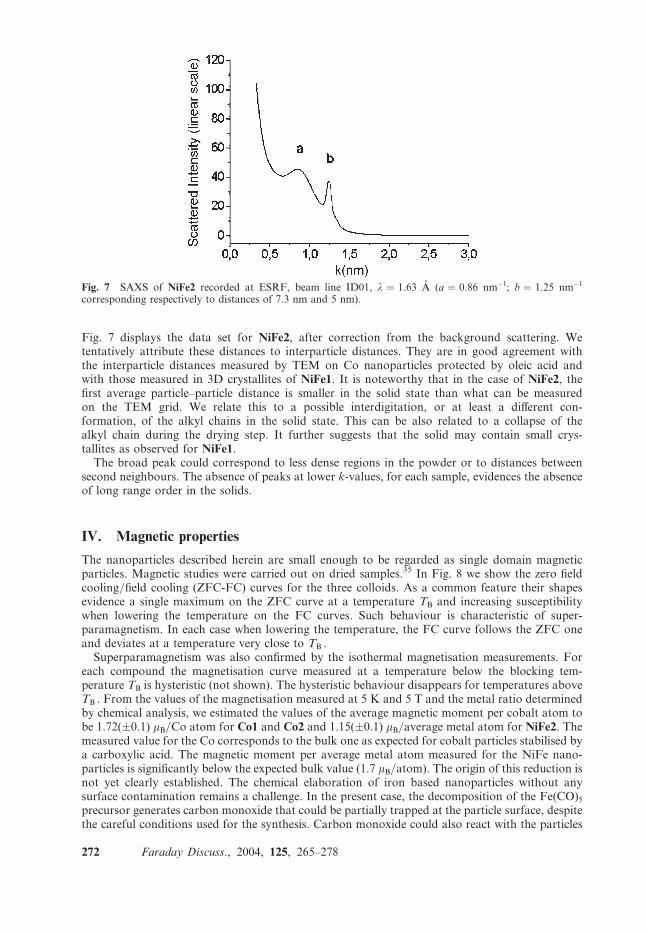
Fig. 7 displays the data set for NiFe2, after correction from the background scattering. Wetentatively attribute these distances to interparticle distances. They are in good agreement withthe interparticle distances measured by TEM on Co nanoparticles protected by oleic acid andwith those measured in 3D crystallites of NiFe1. It is noteworthy that in the case of NiFe2, thefirst average particle–particle distance is smaller in the solid state than what can be measuredon the TEM grid. We relate this to a possible interdigitation, or at least a different con-formation, of the alkyl chains in the solid state. This can be also related to a collapse of thealkyl chain during the drying step. It further suggests that the solid may contain small crys-tallites as observed for NiFe1.
The broad peak could correspond to less dense regions in the powder or to distances betweensecond neighbours. The absence of peaks at lower k-values, for each sample, evidences the absenceof long range order in the solids.
IV. Magnetic properties
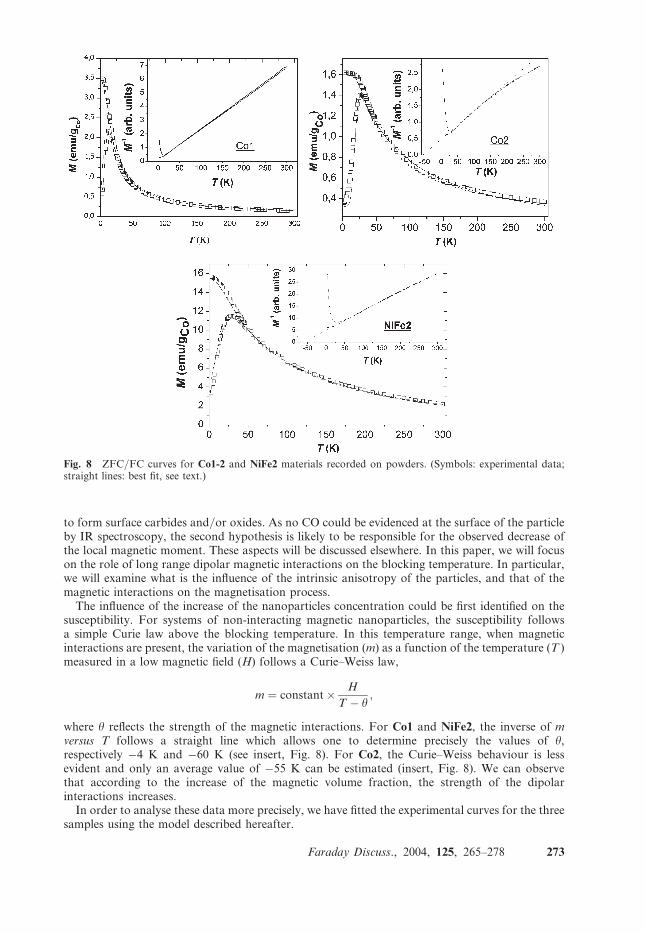
The nanoparticles described herein are small enough to be regarded as single domain magneticparticles. Magnetic studies were carried out on dried samples.35 In Fig. 8 we show the zero fieldcooling/field cooling (ZFC-FC) curves for the three colloids. As a common feature their shapesevidence a single maximum on the ZFC curve at a temperature TB and increasing susceptibilitywhen lowering the temperature on the FC curves. Such behaviour is characteristic of super-paramagnetism. In each case when lowering the temperature, the FC curve follows the ZFC oneand deviates at a temperature very close to TB .
Superparamagnetism was also confirmed by the isothermal magnetisation measurements. Foreach compound the magnetisation curve measured at a temperature below the blocking tem-perature TB is hysteristic (not shown). The hysteristic behaviour disappears for temperatures aboveTB . From the values of the magnetisation measured at 5 K and 5 T and the metal ratio determinedby chemical analysis, we estimated the values of the average magnetic moment per cobalt atom tobe 1.72(�0.1) mB/Co atom for Co1 and Co2 and 1.15(�0.1) mB/average metal atom for NiFe2. Themeasured value for the Co corresponds to the bulk one as expected for cobalt particles stabilised bya carboxylic acid. The magnetic moment per average metal atom measured for the NiFe nano-particles is significantly below the expected bulk value (1.7 mB/atom). The origin of this reduction isnot yet clearly established. The chemical elaboration of iron based nanoparticles without anysurface contamination remains a challenge. In the present case, the decomposition of the Fe(CO)5precursor generates carbon monoxide that could be partially trapped at the particle surface, despitethe careful conditions used for the synthesis. Carbon monoxide could also react with the particles
Fig. 7 SAXS of NiFe2 recorded at ESRF, beam line ID01, l ¼ 1.63 A (a ¼ 0.86 nm�1; b ¼ 1.25 nm�1
corresponding respectively to distances of 7.3 nm and 5 nm).
272 Faraday Discuss., 2004, 125, 265–278
to form surface carbides and/or oxides. As no CO could be evidenced at the surface of the particleby IR spectroscopy, the second hypothesis is likely to be responsible for the observed decrease ofthe local magnetic moment. These aspects will be discussed elsewhere. In this paper, we will focuson the role of long range dipolar magnetic interactions on the blocking temperature. In particular,we will examine what is the influence of the intrinsic anisotropy of the particles, and that of themagnetic interactions on the magnetisation process.The influence of the increase of the nanoparticles concentration could be first identified on the
susceptibility. For systems of non-interacting magnetic nanoparticles, the susceptibility followsa simple Curie law above the blocking temperature. In this temperature range, when magneticinteractions are present, the variation of the magnetisation (m) as a function of the temperature (T )measured in a low magnetic field (H) follows a Curie–Weiss law,
m ¼ constant� H
T � y;
where y reflects the strength of the magnetic interactions. For Co1 and NiFe2, the inverse of mversus T follows a straight line which allows one to determine precisely the values of y,respectively �4 K and �60 K (see insert, Fig. 8). For Co2, the Curie–Weiss behaviour is lessevident and only an average value of �55 K can be estimated (insert, Fig. 8). We can observethat according to the increase of the magnetic volume fraction, the strength of the dipolarinteractions increases.In order to analyse these data more precisely, we have fitted the experimental curves for the three
samples using the model described hereafter.
Fig. 8 ZFC/FC curves for Co1-2 and NiFe2 materials recorded on powders. (Symbols: experimental data;straight lines: best fit, see text.)
Faraday Discuss., 2004, 125, 265–278 273
We assume that ZFC magnetisation and FC magnetisation both result from superparamagneticand blocked contributions, as described in the following expressions:
mZFC ¼ M2SðTÞH3V
1
kBðT � yÞ
Z vmðTÞ
0
v2fðvÞdvþ 1
3Keff
Z 1
vmðTÞvfðvÞdv
" #;
mFC ¼ M2SðTÞH3V
1
kBðT � yÞ
Z vmðTÞ
0
v2fðvÞdvþ lnðtm=t0Þ3Keff
Z 1
vmðTÞvfðvÞdv
" #;
where V ¼R10 vf(v)dv, MS is the spontaneous magnetisation, vm(T ) is the transition volume above
which the particle is in the blocked state, below which the particle is in the superparamagnetic state.In the case of a system of interacting magnetic particles, the relaxation time (t) associated to the
superparamagnetic behaviour is defined by,
t ¼ t0 expKeffv
kBðT � yÞ
� �;
where t0 ¼ 10�9 s. For a measurement time of tm ¼ t, vm(T ) is defined as
vmðTÞ ¼ lntmt0
� �kBðT � yÞ
Keff:
Using the Weiss temperature deduced from the m�1(T ) curves, we then fit the ZFC/FC curvesusing a Log-normal size distribution (f(v)) of particles to describe the magnetic size distributions.
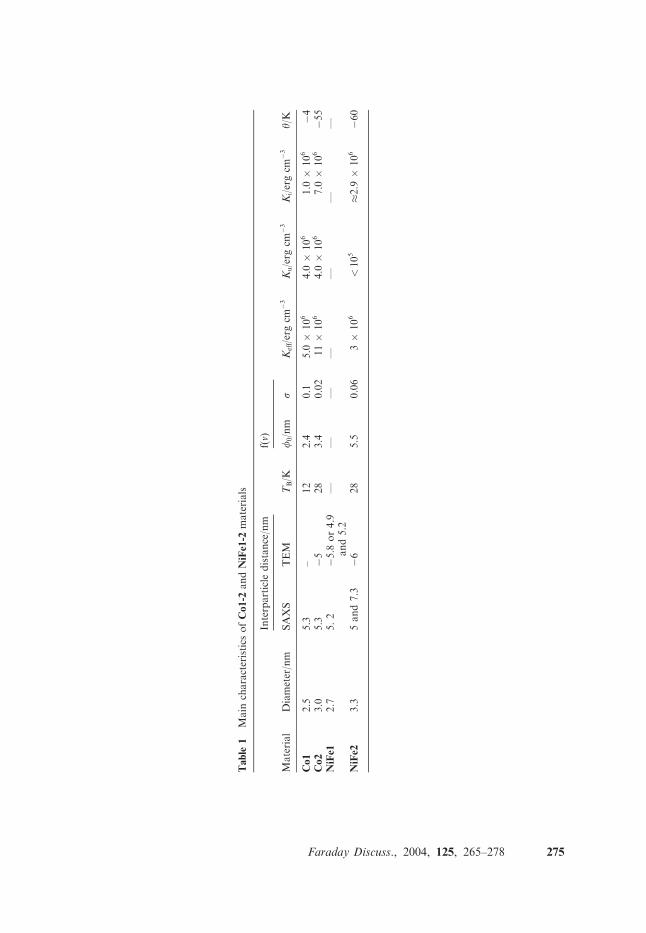
A very good fit was achieved for all three systems, allowing accurate determination of theeffective anisotropy (Keff). The parameters used are listed in Table 1.
We can observe that the magnetic size, i.e. the average size activated in the superparamagneticrelaxation, is identical to that measured by TEM for the Co1-2 samples, within experimental errors.The effective anisotropy is much higher for the system of higher magnetic volume fraction. Thisincrease can be ascribed to the influence of the magnetic dipolar interactions, which give a con-tribution to the total anisotropy barrier (Ki). The second contribution is due to the intrinsicanisotropy of the nanoparticles (Ku). Taking into account the value of the intrinsic effectivemagnetic anisotropy (Ku) measured in non-interacting system, which is close to the bulk one (4 �106 erg cm�3), we calculated the value of Ki from the expression Keff ¼ Ku+Ki . The calculatedvalues for Ki are thus 106 erg cm�3 and 7 � 106 erg cm�3 for Co1 and Co2 respectively. Ki can berelated to the magnetic volume fraction through the expression derived by Dorman et al.,Ki ¼ naM2
S,36 where n is the number of first nearest neighbours, and a, the magnetic volume
fraction. Considering a compact packing with n ¼ 12, the magnetic volume fractions a are esti-mated to 5% and 30% for Co1 and Co2 respectively. Actually, sample Co2 has the higher metalcontent, with a volume fraction close to 10%. On the contrary, sample Co1 consists of dilutednanoparticles with a volume fraction of 1%. Both the SAXS and magnetic measurements evidencemore dense regions, pointing to a non-homogeneous sample. We tentatively relate this to abeginning of organisation and to the presence of excess ligand.
The NiFe sample, NiFe2, displays a much more complicated behaviour. The activated volumeinvolved in the superparamagnetic regime is much larger than the volume calculated from TEMobservations. In this system, the intrinsic anisotropy of the particles is small (close to 104 erg cm�3
in the bulk),3a and thus the main contribution to the effective anisotropy is due to the magneticdipolar anisotropy, which value can be estimated close to 2.9 � 106 erg cm�3. The value obtainedfor the magnetic volume fraction falls around 28% which is consistent with the structural data(22%). However this is much higher than the 1% value deduced from the micro-analysis on thebasis of a homogeneous material. The higher magnetic volume fraction is a further evidence thatthese nanoparticles tend to crystallise.
It is difficult to interpret the role of dipolar interactions on the blocking temperature on the basisof this sole set of experiments. However, its first influence leads to an increase of the blockingtemperature, as can be seen for Co1-2 samples. Furthermore, it is interesting to compare the twosamples with the higher magnetic volume fraction: Co2 and NiFe2. The large magnetic volumedetermined in the case of NiFe2 can be interpreted as an evidence of the simultaneous rotation of
274 Faraday Discuss., 2004, 125, 265–278
Table
1Main
characteristics
ofCo1-2
andNiFe1-2
materials
Material
Diameter/nm
Interparticle
distance/nm
TB/K
f(v)
Keff/erg
cm�3
Ku/erg
cm�3
Ki/ergcm
�3
y/K
SAXS
TEM
f0/nm
s
Co1
2.5
5.3
–12
2.4
0.1
5.0
�106
4.0
�106
1.0
�106
�4
Co2
3.0
5.3
�5
28
3.4
0.02
11�
106
4.0
�106
7.0
�106
�55
NiFe1
2.7
5.2
�5.8
or4.9
and5.2
——
——
——
—
NiFe2
3.3
5and7.3
�6
28
5.5
0.06
3�
106
<105
�2.9
�106
�60
Faraday Discuss., 2004, 125, 265–278 275
several particles. The rotation of the magnetisation seems to remain individual in the case of Co2.The main difference between these two samples consists in the hard and soft characters of Co andNiFe respectively. Thus, it seems that the hard intrinsic anisotropy preserves the individualbehaviour, while soft systems display an easier transition to the collective one. These tendenciesmust be checked on a wider range of systems of various intrinsic anisotropies and various volumefractions, in order to have a more precise picture.
From the theoretical point of view, these phenomenons are not well identified. The magneti-sation process of such materials cannot be described by analytical models. Monte-Carlo calcula-tions have demonstrated their ability to simulate the magnetic properties of non-interactingnanoparticles.37 The case of interacting nanoparticles is more difficult to address since it requiresthe calculation at each nanoparticle site of the local field due to the long range dipolar fields.Preliminary calculations have been performed in order to investigate the role of the interparticledistance on a system of Co nanoparticles with a HCP crystallisation, in agreement with publishedworks.38 Qualitatively, the first clear tendency is that, increasing the magnetic volume fraction leadsto an increase of the blocking temperature as can be observed experimentally on Co1-2 samples.Further calculations are in progress in order to determine precisely the influence of Ki/Ku on themagnetization process, especially, the activated volume and correlation length.
V. Conclusion
We have synthesised nanoparticles of Co and NiFe displaying narrow size distributions. Thestability and size control was achieved by use of oleic acid in the case of the Co particles andhexadecylamine in the case of NiFe particles. Structural and magnetic measurements show thatthese particles tend to self-assemble either when deposited on carbon surfaces or in the solid stateduring the evaporation process. Especially, in the case of NiFe capped by hexadecylamine,nanocrystallites probably form spontaneously from the solution, which implies a precise posi-tioning of the particles. This could be related to the magnetic properties of the particles assemblies.Interestingly, we have found that the magnetic behaviour of the particles varies from an individualto a collective one, as the anisotropy ratio Ki/Ku increases. This is particularly important ifapplications in data storage are aimed at. Materials with high anisotropy will both allow decreasingthe critical size of the magnetic dot and help maintain an individual behaviour even if strongdipolar couplings are present, as it will be the case for high density media. These tendencies must beconfirmed by analysing the influence of the anisotropy ratio Ki/Ku on the magnetization process,on different materials with different magnetic volume fraction.
Acknowledgements
The authors thank Alain Mari for recording the magnetic measurements, Vincent Colliere fortechnical assistance in TEM imaging. We gratefully acknowledge financial support from CNRSand Motorola and the Cooperation Program PCP ‘‘Nanosystemes-Nanomesures ’’ betweenVenezuela (Fonacit) and France (Ministere des Affaires etrangeres).
References
1 (a) Z.-Z. Gu, R. Horie, S. Kubo, Y. Yamada, A. Fujishima and O. Sato, Angew. Chem., Int. Ed. Engl.,2002, 41, 1153; (b) Y. Lu, Y. Yin, Z.-Y. Li and Y. Xia, Nano Lett., 2002, 2, 785; (c) G. Santamaria,V. Salgueirino-Maceira, C. Lopez and L. M. Liz-Marzan, Langmuir, 2002, 18, 4519.
2 (a) S. Liu, R. Maoz, G. Schmid and J. Sagiv, Nano Lett., 2002, 2(10), 1055; (b) U. Simon, Adv. Mater.,1998, 10, 1487; (c) D. L. Klein, R. Roth, A. K. L. Lim, A. P. Alivisatos and P. L. McEuen, Nature, 1997,389, 699.
3 (a) Modern Magnetic Materials, ed. R. C. O’Handley, Wiley-Interscience, New-York, 1999; (b) Clustersand Colloids. From theory to applications, ed. G. Schmid, VCH, Wienheim, 1994.
4 (a) M.-P. Pileni, J. Phys. Chem. B, 2001, 105, 3358; (b) A. A. Mikhailovsky, A. V. Malko, J. A.Hollingsworth, M. G. Bawendi and V. I. Klimov, Appl. Phys. Lett., 2002, 80(13), 2380.
5 (a) H. Zeng, S. Sun, T. S. Vedantam, J. P. Liu, Z.-R. Dai and Z.-L. Wang, Appl. Phys. Lett., 2002, 8(14),2583; (b) H. Zeng, J. Li, Z. L. Wang and S. Sun, Nature, 2002, 420, 395.
276 Faraday Discuss., 2004, 125, 265–278
6 (a) V. F. Puntes, K. M. Krishnan and P. Alivisatos, Appl. Phys. Lett., 2001, 78(15), 2187; (b) J. Legrand,C. Petit, D. Bazin and M.-P. Pileni, Appl. Surf. Sci., 2000, 164, 186; (c) V. Russier, C. Petit, J. Legrandand M.-P. Pileni, Appl. Surf. Sci., 2000, 164, 193.
7 (a) I. Sloufova-Srnova and B. Vlckova, Nano Lett., 2002, 2, 121; (b) S. Kang, J. W. Harrell and D. E.Nikles, Nano Lett., 2002, 2, 1033; (c) M. Chen and D. E. Nikles, Nano Lett., 2002, 2, 211; (d ) D. V.Talapin, E. V. Shevchenko, A. Kornowski, N. Gaponik, M. Haase, A. L. Rogach and H. Weller, Adv.Mater., 2001, 13, 1868; (e) S. L. Tripp, S. V. Pusztay, A. E. Ribbe and A. Wei, J. Am. Chem. Soc., 2002,124, 7914; ( f ) V. F. Puntes, D. Zanchel, C. K. Erdonmez and A. P. Alivisatos, J. Am. Chem. Soc., 2002,124, 12 874; (g) M. T. Reetz, M. Winter and B. Tesche, Chem. Commun., 1997, 147; (h) P. J. Thomas, G. U.Kulkarni and C. N. R. Rao, J. Phys. Chem. B, 2000, 104, 8138.
8 (a) K. Akamatsu, J. Hasegawa, H. Nawafune, H. Katayama and F. Ozawa, J. Mater. Chem., 2002, 12,2862; (b) L. Nagle, D. Ryan, S. Cobbe and D. Fitzmaurice, Nano Lett., 2003, 3, 51; (c) S. Gomez, L.Erades, K. Philippot, B. Chaudret, V. Colliere, O. Balmes and J.-O. Bovin, Chem. Commun., 2001, 16,1474; S. Cobbe, S. Connolly, D. Ryan, L. Nagle, R. Eritja and D. Fitzmaurice, J. Phys. Chem. B, 2003,107, 470; (d ) T. B. Norsten, B. L. Frankamp and V. M. Rotello, Nano Lett., 2002, 2, 1345; (e) S. Mann,S. A. Davis, S. R. Hall, M. Li, K. H. Rhodes, W. Shenton, S. Vaucher and B. Zhang, J. Chem. Soc.,Dalton Trans., 2000, 3753.
9 J. E. Martin, J. P. Wilcoxon, J. Odinek and P. Provencio, J. Phys. Chem. B, 2000, 104, 9475.10 S. Sun and C. B. Murray, J. Appl. Phys., 1999, 85, 4325.11 S. Sun, C. B. Murray, D. Weller, L. Folks and A. Moser, Science, 2000, 287, 1989.12 J. Legrand, A. T. Ngo, C. Petit and M. P. Pileni, Adv. Mater., 2001, 13, 58.13 (a) E. V. Shevchenko, D. V. Talapin, A. L. Rogach, A. Kornowski, M. Haase and H. Weller, J. Am. Chem.
Soc., 2002, 124, 11 480; (b) E. V. Shevchenko, D. V. Talapin, A. Kornowski, F. Wiekhorst, J. Kotzler,M. Haase, A. L. Rogach and H. Weller, Adv. Mater., 2002, 14, 286.
14 (a) C. Amiens, D. de Caro, B. Chaudret and H. Wally, J. Chem. Soc., Chem. Commun., 1994, 1891; A.Rodriguez, C. Amiens, B. Chaudret and J. S. Bradley, Chem. Mater., 1996, 8, 1978; (b) R. Choukroun, D.de Caro, S. Mateo, C. Amiens, B. Chaudret, E. Snoeck and M. Respaud, New J. Chem., 2001, 25, 525; (c)K. Soulantica, A. Maisonnat, M.-C. Fromen, M.-J. Casanove, P. Lecante and B. Chaudret, Angew. Chem.,Int. Ed. Engl., 2001, 40, 448; (d ) F. Rataboul, C. Nayral, M.-J. Casanove, A. Maisonnat and B. Chaudret,J. Organomet. Chem., 2002, 643–644, 307.
15 (a) J. Osuna, D. de Caro, C. Amiens, B. Chaudret, E. Snœck, M. Respaud, J.-M. Broto and A. Fert,J. Phys. Chem., 1996, 100, 14 571; (b) F. Dassenoy, M.-J. Casanove, P. Lecante, M. Verelst, E. Snoeck,A. Mosset, T. Ould Ely, C. Amiens and B. Chaudret, J. Chem. Phys., 2000, 112, 8137–8145.
16 T. Ould Ely, C. Amiens, B. Chaudret, E. Snoeck, M. Verelst, M. Respaud and J.-M. Broto, Chem. Mater.,1999, 11, 526.
17 T. Ould Ely, C. Pan, C. Amiens, B. Chaudret, F. Dassenoy, P. Lecante, M.-J. Casanove, A. Mosset,M. Respaud and J.-M. Broto, J.Phys. Chem., 2000, 104, 695.
18 D. Zitoun, M. Respaud, C. Amiens, B. Chaudret, A. Serres, M.-J. Casanove, M.-C. Fromen andP. Lecante, Phys. Rev. Lett., 2002, 89, 37 203.
19 M. Respaud, J.-M. Broto, H. Rakoto, A. Fert, M. Verelst, E. Snoeck, P. Lecante, A. Mosset, L. Thomas,B. Barbara, J. Osuna, T. Ould Ely, C. Amiens and B. Chaudret, Phys. Rev. B, 1998, 57, 2925.
20 (a) N. Cordente, C. Amiens, M. Respaud, F. Senocq, M.-J. Casanove and B. Chaudret, Nano Lett., 2001,1, 526; (b) F. Dumestre, B. Chaudret, C. Amiens, M.-C. Fromen, M.-J. Casanove, P. Renaud andP. Zurcher, Angew. Chem., Int. Ed. Engl., 2002, 41(22), 4286.
21 (a) K. Soulantica, A. Maisonnat, F. Senocq, M.-C. Fromen, M.-J. Casanove and B. Chaudret, Angew.Chem., Int. Ed. Engl., 2001, 40(16), 2984; (b) K. Soulantica, A. Maisonnat, M.-C. Fromen, M.-J. Casanoveand B. Chaudret, Angew. Chem., 2003, 42, 1945.
22 S. Otsuka and M. Rossi, J. Chem. Soc. A, 1968, 2630.23 K. S. Suslick, M. Fang and T. Hyeon, J. Am. Chem. Soc., 1996, 18(47), 11 960.24 The reaction is conducted under argon to avoid any surface oxidation of the particles. In a typical
experiment, 1 mmol Co(C8H12)(C8H13) was decomposed in 20 mL anisole at 150 �C under 3 bar H2 , in thepresence of one equivalent oleic acid. After 48 h, the solvent is either evaporated to dryness, leading tosample 1; or the solution is concentrated and poured into a large volume of cold pentane to ensureprecipitation of the particles (sample 2). Cobalt content in each sample was determined by chemicalmicroanalysis at the CNRS center, Vernaison, France.
25 Transmission electron microscopy (TEM) was used to determine both particle size, size distribution andinterparticle distances. Low-resolution TEMmeasurements were performed on a JEOL 200 CX (200 kV) atthe TEMSCAN facility, Universite Paul-Sabatier, Toulouse. More than 200 particles were measured todraw each size or distance histogram.
26 In a typical experiment, a 1/1 mixture of the two precursors (Ni(COD)2 , Fe(CO)5) in anisole was heated atreflux for 3 h in the presence of one equivalent (versus the total metal content) of HDA. During this timethe initial orange solution turns black. The reaction is conducted under argon to avoid any surface oxi-dation of the particles. After evaporation of the crude solution to dryness, the solid material has beencharacterised without further purification step. The nickel and iron contents were determined by chemicalmicroanalysis. Ni: 6.85% Fe: 5.67%. (i.e. metal content 12.52%).
Faraday Discuss., 2004, 125, 265–278 277
27 Z. A. Peng and X. Peng, J. Am. Chem. Soc., 2002, 124, 3343.28 WAXS structural characterisations by WAXS were performed in the solid state. The fine powder was
introduced in a thin walled Lindemann capillary of 1 mm diameter subsequently sealed under argon.Measurements of the X-ray intensity scattered by the samples irradiated with graphite-monochromatisedmolybdenum Ka radiation (0.071069 nm) were performed using a dedicated two-axis diffractometer.Fluorescence from iron and nickel was removed at the measurement step by filtering. Time for data col-lection was typically 20 h for a set of 457 measurements collected at room temperature in the range0� < y < 65� for equidistant s values [s ¼ 4p(siny/l)].
29 F. Lihl, Arch. Eisenhuttenwes., 1954, 25, 475.30 To be published.31 FCC packing of nanoparticles, resulting from layer by layer growth on a compact 2D assembly of particles,
has already been reported. In this case the interparticle spacings were identical in 2D and 3D assemblies; (a)A. Korgel, S. Fullam, S. Connolly and D. Fitzmaurice, J. Phys. Chem. B, 1998, 102, 8379; (b) M. P. Pileni,J. Phys. Chem. B, 2001, 105, 3358.
32 (a) F. Dassenoy, K. Philippot, T. Ould Ely, C. Amiens, P. Lecante, E. Snoeck, A. Mosset, M.-J. Casanoveand B. Chaudret, New J. Chem., 1998, 22, 703; (b) C. Pan, K. Pelzer, K. Philippot, B. Chaudret, F.Dassenoy, P. Lecante and M.-J. Casanove, J. Am. Chem. Soc, 2001, 123, 7584.
33 G. Viau, R. Brayner, L. Poul, N. Chakroune, E. Lacaze, F. Fievet-Vincent and F. Fievet, Chem. Mater.,2003, 15, 486.
34 The SAXS experiments were conducted on beamline ID01 at the European Synchrotron Radiation Facility(ESRF), Grenoble, France (ESRF web site: http//www.esrf.fr/exp_facilities/ID1/user_guide/), operatingunder beam conditions of 6 GeV, 200 mA, and 2/3 filling mode. The X-ray energy was 7610 eV, corre-sponding to a wavelength of 1.629 A. A beam size 0.8 mm � 0.2 mm was used. The samples were containedin thin walled Lindemann capillaries of 1 mm diameter sealed under argon mounted horizontally per-pendicular to the X-ray beam. The samples were at ambient temperature. The SAXS intensity profiles weremeasured with a CCD detector, with an active array of 1242 � 1152 pixels each of 55 mm � 55 mm. Thecentral area was masked by a beam stop 6 mm in diameter. The detector was positioned at distancesbetween 0.6 m and 4.5 m from the sample, giving a range for the scattering vector k of up to 3.0 nm�1.Typical counting times for the 0.6 m detector position were 2.5 min. Background counts, recorded with anempty sample tube, were very low and showed no specific features. The 2D-diffraction patterns wereradially integrated using the software package FIT2D (A. P. Hammersley, ESRF Internal Report,ESRF97HA02T, 1997, ‘‘FIT2D: An Introduction and Overview’’) to display the intensity profile as afunction of the scattering angle or vector.
35 Magnetisation measurements were performed on a SQUID magnetometer (MPMS Quantum Design). Thetemperature was varied between 2 and 300 K according to a classical zero field cooling/field cooling (ZFC/FC) procedure in the presence of a very weak applied magnetic field (10 Oe) and the hysteresis cycles wereobtained at different temperatures in a magnetic field varying from+50 to �50 kOe. The samples wereprepared in gelatine capsules in a glove box to avoid any oxidation of the materials.
36 J. L. Dormann, F. D’Orazio, F. Lucarri, E. Tronc, P. Prene, D. Fiorani, D. Cherkaoui and R. Nogues,Phys. Rev. B, 1996, 53, 14 291.
37 D. A. Dimitrov and G. M. Wysin, Phys. Rev. B, 1996, 54, 9237.38 (a) D. Kekrachos and N. K. Trohidou, Phys. Rev. B, 1998, 58, 12 169; (b) R. W. Chantrell, N. Walmsley,
J. Gore and M. Maylin, Phys. Rev. B, 2000, 63, 24 410; (c) C. Binns, M. J. Maher, Q. A. Pankhurst,D. Kechrakos and K. N. Trohidou, Phys. Rev. B, 2002, 66, 184 413.
278 Faraday Discuss., 2004, 125, 265–278