synthesis and crystal chemistry of the hybrid perovksite ... and crystal... · 1 synthesis and...
TRANSCRIPT
1
Synthesis and crystal chemistry of the hybrid perovskite (CH3NH3)PbI3 for
solid-state sensitised solar cell applications
Tom Baikie,1* Yanan Fang,1 Jeannette M. Kadro,1 Martin Schreyer,2 Fengxia Wei,3
Subodh Mhaisalkar,1 Michael Graetzel,4 Tim J. White3
1 Energy Research Institute @ NTU (ERI@N), Research Technoplaza, Nanyang
Technological University, Nanyang Drive, 637553, Singapore.
2 Institute of Chemical Engineering Sciences, 1 Pesek Road, Jurong Island, 627833, Singapore.
3 School of Materials Science and Engineering, Nanyang Technological University, Nanyang
Avenue, 639798, Singapore.
4 Laboratory for Photonics and Interfaces, Institute of Chemical Sciences and Engineering, School of
Basic Sciences, Ecole Polytechnique Fédérale de Lausanne, CH-1015 Lausanne, Switzerland.
*Corresponding author – [email protected]
2
Abstract
The hybrid organic-inorganic perovskite (CH3NH3)PbI3 may find application in next generation
solid-state sensitised solar cells. Although this material and related perovskites were discovered
many decades ago, questions remain concerning their diverse structural chemistry and unusual
properties. The article presents a review of previous work and provides a detailed description of
the preparation, structural characterisation and physical characteristics of (CH3NH3)PbI3. The
phase changes exhibited by (CH3NH3)PbI3 have been probed using variable temperature powder
and single crystal X-ray diffraction, combined with differential scanning calorimetry,
thermogravimetic analysis and phase contrast transmission electron microscopy. The optical
band gap for (CH3NH3)PbI3 determined by UV-Visible spectroscopy was compared to values
obtained from density-of-state simulation of electronic band structure.
3
1. Introduction
Recent reports of high conversion efficiencies (> 9%) for solid-state sensitised solar cell devices
based on the ABX3 inorganic-organic hybrid perovskite (CH3NH3)PbI3,1,2, 3
hold the promise of
cost effective solar energy production although reproducible device performance has not been
achieved. Many questions remain to be addressed regarding the crystal chemistry of these
materials, and the nature of charge transfer, before it will be possible to rationally modify and
tailor chemistries and nanostructures in prototype solar cells for greater efficiencies. It is also
notable that the rapid expansion of the device literature has overlooked important fundamental
studies reaching back some 60 years. Therefore, it is timely to review the sometimes conflicting
reports concerning (CH3NH3)PbI3 and related materials, and exploit state-of-the-art methods to
revise and evaluate their crystal structures and photo-conversion mechanisms.
2. Crystallographic and Functional Character of Hybrid Perovskites
The perovskite aristotype is a cubic Pm-3m framework structure of composition ABX3, where A
(Wyckoff position 1a) is commonly a large cation coordinated to 12 X (3c) anions, B (1b) a
smaller metal bonded to six X anions, and BX6 octahedra are corner-connected to form a
three-dimensional framework. The hinged octahedra allow for wide adjustment of the B-X-B
bond angle, and several sets of cooperative rotations, known as tilt transitions, promote
symmetry reduction of the aristotype.4-6 The process of octahedral tilting must adhere to the
principles of space group hierarchy and these relationships provide a powerful tool for guiding
structure determination and detecting false structures. In this respect, it is noted that some
4
structures for the (CH3NH3)PbX3 polymorphs are inconsistent with space group principles.
Furthermore, for organic-inorganic hybrid-perovskites the interaction of cation ordering and
acoustic modes can generate incommensurate phases in many of these compounds.7
ABX3 (A = alkali; B = Ge, Sn, Pb; X = halide): The unusual, and potentially useful, electronic
and photoconductive properties of plumbohalide perovskites were identified several decades ago
by Møller8, 9 who determined the crystal structures of CsPbX3 (X = Cl, Br, I) and found intense
colours ranging from yellow, orange to black for the chloride, bromide and iodide analogues
respectively. All the materials were photoconductive with spectral sensitivity maximised in the
violet (X = Cl), blue-green (X = Br) and red (X = I).9 X-ray diffraction revealed perovskite
hettotypes at ambient that undergo a displacive phase-transition to cubic symmetry at higher
temperature. CsPbCl3 was optically birefringent at room temperature, but upon heating, the
interference colours changed continuously and disappeared at 46.9°C. This phenomenon was
completely reversible and on cooling the interference colours reappeared. Møller8 reported that
below the transition temperature the CsPbCl3 was tetragonal, with chlorine displaced from the
Pm-3m special position (½, 0, 0) to (½, ±1/15, ±1/15) and caesium ideally at (½, ½, ½) drawn
out in directions perpendicular to the unit-cell faces. Significantly, this early work found 3D
symmetry could not unambiguously describe the mean positions of chlorine, but only their
‘statistical centres of gravity’; subsequently it was suggested a high level of anion disorder10
and/or incommensuration11, 12 was present.
The positioning of Pb2+ at the octahedral ‘B’ site of ABX3 perovskites is unusual, as in most
perovskites lead is an A-site cation, but this placement becomes feasible when a large
electropositive cation occupies the ‘A’ site. Cs+ most evidently meets this criteria, as do
5
similarly sized organic units including methylammonium (MA) (CH3NH3)+, formamidinium
(H2N-CH=NH2)+ (FA) and tetramethylammonium ((CH3)4N)+ (TMA). The first ‘hybrid’
organic-inorganic perovskites, described almost 35 years ago,13 were based on halide salts of the
group 14 chalcogenides, with germanium, tin and lead occupying the octahedral B-sites, and MA
and TMA radicals inserted in the cages formed by the BX6 octahedra. For these perovskites,
superlattices often result due to orientational ordering of the organic cations coupled with tilting
and distortion of the octahedra. By introducing longer chain organic components,
perovskite-type layer compounds comparable to the Ruddlesden-Popper series are created.
These modifications have been comprehensively reviewed by Mitzi.14, 15
In group 14 elements the outer s2 electron pair can become sterochemically active lone pairs,
rather than participating in bonding, a tendency most evident at higher atomic number. Clark et
al.16 undertook an extensive study of the CsM2+X3 (M2+ = Ge, Sn, Pb; X = Cl, Br, I) compounds
and found evidence for the band structure being populated by non-bonding electron pairs. The
optical behaviour and electrical conductivity of these phases was presumed to arise from the
donation of electron density from M2+ lone-pair electrons to the conduction band formed by
overlap with the halogen d states. The greater ionic character of the Pb2+, as compared to Sn2+or
Ge2+, reduced the electron density transfer and dominated the optical spectra of the Pb-rich
phases. For CsM2+I3 the donation of electron-pairs to iodine d bands was favoured over the
self-population by iodine electrons.
A recent temperature-dependent powder synchrotron X-ray diffraction study17 confirmed earlier
reports18 by showing that at room temperature CsSnI3 is orthorhombic (Pnma) and with gentle
heating converts to the Pm-3m aristotype via a P4/mbm tetragonal variety (Table 1). In this work,
6
the CsSnI3 system appeared to be unique in combining two generally contraindicative properties,
strong photoluminescence and high electrical conductivity. More recently the F doped phase
CsSnI2.95F0.05 has achieved one of the highest conversion efficiencies (8.5%) found in solid-state
dye-sensitised solar cells.19
ABX3 (A = organic cation; B = Ge, Sn, Pb; X = halide): The effect of s-orbital hybridisation in
ABX3 perovskites is to drive the B-atom off the octahedral centre, resulting in alternating long
and short B-X bonds in the basal plane that creates a range of functionalities. In the widely
studied Ge analogues, ferroelectric behaviour is found in CsGeCl3,20, 21 antiferroelectricity in
TMAGeCl3,22 and high Cl-ion conductivity in MAGeCl3.
23 For the cubic phases of MAGeCl3,23
TMAGeCl324 and TMAGeBr3
25 the disordered halide ions half-fill and statistically occupy the 6f
Wyckoff site of Pm-3m, rather than a fully occupied 3c site, due to bond switching between
Ge -X…Ge and Ge...X-Ge, i.e. distortion associated with lone-pair activity is a very soft-coupled
dynamic reorientation with respect to the organic (TMA or MA) cation. In these cases, the GeX6
the coordination is often described as pyramidal with 3 short and 3 long bonds rather than
octahedral. In MAGeCl3 35Cl nuclear quadrapole (NQR) measurements found reorientation of
the pyramidal GeCl3- is the origin of the high ionic conductivity.23-26
X-ray diffraction has been the primary source of crystallographic information for these
perovskites, but scattering is dominated by higher atomic number elements, and is relatively
insensitive to the organic component that controls phase transitions. This was addressed by
Yamada et al.26 who carried out a powder neutron diffraction study on deuterated
MAGeCl3 ≡ CD3ND3GeCl3, but substitution of H for D strongly shifted the polymorphic phase
transition temperatures with four distinct structures in the temperature range 2 – 475K (Table 2).
7
The crystallochemical properties of Sn-based analogues are intermediate to Ge and Pb
compounds, such that the inorganic sublattice of MASnBr3 in the Pm-3m phase has stronger and
more complex octahedral distortions than the Pb-based analogues. A powder X-ray diffraction
study of MASnCl3 showed successive transitions to high symmetry phases at 283, 307, 331 and
463 K with increasing temperature (Table 3);27 the high temperature (463 K) phase was cubic
perovskite with lower temperature distortions containing a pyramidal SnCl3- ion. Modification
of Sn-coordination was established with 119Sn NMR spectra and suggested the onset of
chloride-ion diffusion just below the phase-transition to cubic symmetry.
A powder neutron diffraction study of deuterated MASnBr3 ≡ CD3ND3SnBr3 found a cubic
polymorph (Pm-3m, Z = 1, a = 5.899 Å) at room temperature, that at 195K transformed to a
rhombohedral superstructure with cell doubling in three directions (R3c or R-3c, Z = 8,
a = 11.767 Å α = 88.997°).28 A subsequent synchrotron XRD study found no evidence of the
rhombohedral phase on cooling from 230 – 100K, but did identify an orthorhombic phase in the
temperature range 230 – 188K (Pmc21, Z = 2, a = 5.89406(17) Å, b = 8.3862(2) Å,
c = 8.2406(2) Å).29 At 30K the presence of a triclinic phase was suggested, and indexing of
Bragg reflections gave the best candidate cell as a = 8.345 Å b = 8.135 Å c = 5.899 Å α = 92.14°
β = 89.95° γ = 91.42° in P1 symmetry. The lack of an inversion centre (P-1) was assumed due to
its absence in the orthorhombic cell, but as noted in this study, it is impossible to directly
transform Pm-3m to Pmc21 from pure octahedral tilts, and an intermediary phase was not
identified. A tetragonal P4/mbm phase was suggested as the most likely candidate, by analogy
with the non-cubic phase encountered on cooling the alkali analogue CsSnBr3.30
8
A single crystal neutron diffraction study of the high temperature Pm-3m phase of MAPbBr3
revealed a highly disordered structure. This work suggested positions for the C/N and H sites of
the methylammonium groups but it was noted that there was a large anisotropy in all the atomic
displacement parameters.31 A powder neutron diffraction study of partially deuterated
MAPbBr3 ≡ CH3ND3PbBr3 found the ‘phase IV’ of this series was centrosymmetric, Pnma:
Z = 4, a = 7.9434(4) Å, b = 11.8499(5) Å, c = 8.5918(4) Å at 11 K,32 leading to speculation that
the corresponding iodide would be isostructural. In the original work of Poglitsch and Weber
four different phases were identified for the lead bromide series and space groups suggested from
the X-ray extinction conditions at various temperatures (T > 236.9 cubic Pm-3m; 155.1 < T <
236.9 tetragonal I4/mcm; 149.5 < T < 155.1 tetragonal P4/mmm; T < 144.5 orthorhombic
Pna21).33 The space group P4/mmm was erroneously suggested for a second tetragonal
intermediary phase as this cannot be achieved by octahedral tilting from the Pm-3m aristotype.6
High pressure structural studies on MAPbBr3 showed that just below 1GPa the sample
transformed from Pm-3m to Im-3 and amorphised at 2.8GPa without the cations undergoing
long-range orientational ordering.34 The Im-3 cell has a doubled cell parameter with respect to
the un-tilted Pm-3m phase and the sample recrystallised upon the release of pressure. In general,
phase transitions through cooling or applied pressure often track but for hybrid organic-inorganic
perovskites the Pm-3m Im-3 transition under compression is presently unique. This implies
the energy gain for orientational ordering was low and volume reduction is the driving force for
transitions of these compounds under pressure.
The synthesis of the MAPbI3 was first described by Weber13 who reported the cubic perovskite
(Pm-3m, Z = 1) at high temperature. Since the cubic structure only contains one formula unit per
9
unit cell, the noncentrosymmetric methylammonium ions (CH3NH3)+ with C3v symmetry must be
orientationally disordered to satisfy Oh symmetry, such that the radial cation is statistically
distributed over eight identical (x, x, x) positions, in which the C and N atoms show random
distribution inside the eight tetrahedral interstices of the A-site cubooctahedra of the perovskite
aristotype i.e. 24 disordered states. Rapid reorientation motions of (CH3NH3)+ were detected by
variable temperature NMR that revealed two phase transitions as the temperature decreases, as a
result of progressive ordering of the (CH3NH3)+ ions.35 The first phase change to tetragonal
I4/mcm (Tc = 327.4K), lowered the number of disordered states of the (CH3NH3)+ to 8, while in a
lower temperature Pmc21 orthorhombic phase (Tc = 162.2K) the organic cations are fixed.
Kawamura et al.36 studied the tetragonal to cubic transition by means of single crystal X-ray
diffraction and found with decreasing temperature the rotation angle of the octahedron increased
monotonically, suggesting that this is an order parameter of the cubic-tetragonal transition. The
cubic structures of the MAPbX3 (X = Cl, Br, I) were also studied by single crystal X-ray
diffraction, which revealed heavily disordered structures with high atomic displacement
parameters, particularly those of the anions.10
The phase transitions in MAPbI3 have also been studied using calorimetric and infrared
spectroscopy.37 This work found an orthorhombic tetragonal transition at 161.4K, with the
tetragonal cubic transition at 330.4K. While both phase transitions were first-order, the
higher temperature phase change was close to second-order. The observed entropies were
consistent with order-disorder transitions interpreted with three models where the
methylammonium ions disorder with respect to the orientation of the C-N axis itself and around
the C-N axis. It was found that the infrared line width of particular vibrations of the
10
methylammonium ion changed markedly with temperature due to hindered rotational motion in
the cubic and tetragonal phases.37
The dielectric properties of MAPbI3 33, 38 show a discontinuity of the real part of the dielectric
permittivity at the orthorhombic tetragonal phase transition, but with the tetragonal cubic
transition. These observations would be consistent with the methylammonium ions being fully
disordered in the cubic and tetragonal phases, and completely ordered in the orthorhombic phase.
Herein, we report the synthesis of MAPbI3 in both poly- and single crystalline form that have
been crystallographically characterised using variable temperature single crystal X-ray
diffraction, variable temperature powder X-ray diffraction and phase contrast transmission
electron microscope imaging. The higher temperature polymorphic transitions were monitored
using thermogravimetic analysis and differential scanning calorimetry. The optical band gap for
MAPbI3 determined by UV-Visible spectroscopy was compared to values obtained from
density-of-state simulation of the electronic band structure.
3. Experimental
3.1 Synthesis
Method 1 – Polycrystalline MAPbI3 was prepared by precipitation from a hydroiodic acid
solution. Following Poglitsch et. al.33 2.5g of lead(II) acetate (Chemical Reagents, Sigma) was
dissolved in 10 ml of a concentrated (57% by weight) aqueous HI contained in a pyrex test tube
and heated in a water bath. An additional 2 ml of HI solution with 0.597g of CH3NH2 (40%
11
soluble in water, Merck) was added to the solution. A black precipitate that formed upon cooling
from 100 ºC to 46 ºC over 6 hours was then filtered and dried (100 ºC/10 hours). It proved
essential to maintain the solution above 40°C as lower temperatures favour the incorporation of
water of crystallisation and the formation of yellow crystals of MA4PbI6·2H2O.39 Large MAPbI3
crystals were grown as described but with a very much slower cooling rate. Black crystals up to
2mm long were obtained by cooling the solution over 4 days. Crystallisation proceeded most
rapidly at approximately 70°C.
Method 2 – MAPbI3 was synthesised using the method described by Im et. al.1 from an equimolar
mixture of MAI and PbI2 in gamma-butyrolactone. To begin, MAI was synthesised by reacting a
concentrated aqueous solution of hydroiodic acid (Sigma Aldrich) with methylamine (40% in
methanol) at 0°C for 2h with constant stirring. After evaporation at 50°C in a rotary evaporator
the resulting precipitant was washed three times with ethyl ether and dried in vacuum at 60°C for
24h. Equimolar mixtures of the as-synthesised MAI and PbI2 (99%, Sigma Aldrich) in
gamma-butyrolactone (Sigma Aldrich) were left to stir overnight at 60°C. The MAPbI3 product
was obtained by drop-casting the as-prepared solutions on to glass substrates, which were then
heated to 100°C and annealed for 30min. Crystalline MAPbI3 was recovered from the glass after
cooling.
3.2 Crystallographic Characterisation
Powder X-ray diffraction: Phase purity was confirmed by powder X-ray diffraction (PXRD)
patterns collected with a Bruker D8 Advance diffractometer (Bragg-Brentano geometry)
12
equipped with a Cu Kα X-ray tube operated at 40 kV and 40 mA using a step size of 0.02° and a
time per step of 4s. Samples were mounted in a top-loaded trough, which was rotated during
data collection. Under these conditions, the intensity of the strongest reflection was
approximately 10000 counts. Experimental fitting of the X-ray data was carried out from
10-140° 2θ using TOPAS V4.140 and employing the fundamental parameters approach41 and a
full axial divergence model.42
The tetragonal cubic phase transition was investigated using variable temperature powder
X-ray diffraction. In-situ XRD data were collected in asymmetric reflection mode under a static
helium atmosphere on an INEL Equinox 3000 (Inel, Artenay, France) equipped with an
XRK-900 reactor chamber (Anton-Paar, Graz, Austria), a curved position sensitive detector
(Inel, Artenay, France), a copper Kα source and a Ge-(111) focussing mirror. The material was
mounted on a closed steel sample holder and measured with a fixed incident beam angle of 5°.
Two different heating experiments were conducted. In the first, the MAPbI3 was heated to 85°C
in five degree steps starting from 25°C, with data collected for 5 minutes at each holding
temperature. The second experiment employed a continuous heating ramp at a rate of 1°/min
during which 30 measurements of 120 seconds were performed. Each measurement corresponds
to a temperature span of 2°C; the final temperature of each measurement was recorded in the
measurement file. Five empty sample holder measurements were conducted at room temperature
in order to establish the chamber background. First, the data were truncated to an angular range
of 4 to 60° in 2θ. Then the average of the 5 background measurements were subtracted from
each pattern in order to get the pure diffraction patterns without any chamber contributions.
Finally, all individual diffraction patterns of each experiment were collated into a single xty - file
13
(x = 2θ, t = temperature, y = intensity). DPlot43 was used to generate the figures displaying the
results from these experiments. The variation in lattice parameters with temperature was
extracted from a Pawley fit of the diffraction patterns and assuming a tetragonal cell with lattice
parameters close to those previous reported. The zero-error shift was refined in the data
collected at 25°C and fixed at that same value for all subsequent temperatures. The sample
displacement was refined in all data sets with T > 25°C but constrained to take a value less than
that obtained in the previous temperature measurement. This constraint was used because a prior
measurement with an Al2O3 standard showed the thermal expansion of the sample holder leads to
increasingly lower values of sample displacement.
Single crystal X-ray diffraction: A small fragment (approximately 0.1 mm × 0.1 mm × 0.1 mm)
was cleaved from one of the solution grown single crystals. Data were collected on a Bruker
Smart Apex II three-circle diffractometer at various temperatures between room temperature and
100 K using Mo Kα radiation with a graphite monochromator over the angular range 2.5 to 30.5°
2θ. The Saint module, deployed within Apex II, was used for reflection integration and
performing Lorentz polarisation and multiscan absorption corrections. A total of 17319
reflections with I>3σ(I) were collected and the structures refined using Jana 2006 44 utilising the
Superflip 45 structure-solution algorithm. Three dimensional difference Fourier maps were
visualised using the software VESTA.46
Transmission Electron Microscopy: Powdered samples deposited on holey carbon copper grids
were analysed using transmission electron microscopy (TEM) with a JEOL JEM 2100F
instrument equipped with a double-tilt holder. Field limiting apertures for selected area electron
14
diffraction (SAED) were 5, 20 and 60 μm in diameter. High-resolution images were collected
using a high-contrast objective aperture of 20 μm, corresponding to a nominal point-to-point
resolution of 0.17 nm. Simulation of kinetic and multi-beam electron diffraction patterns as a
function of crystal thickness and beam divergence was performed using JEMS.47 Electron
energy loss spectroscopy (EELS) was carried out by using the JEOL JEM 2100F microscope
operating at 200 kV. EELS spectra were recorded with an energy dispersion of 0.25 eV/ch, and
the background was subtracted by fitting a region before the ionisation edge with the power-law
model followed by extrapolation and removal of the background from under the edge.
3.3 Thermal Analysis
Thermogravimetric (TGA) analysis of was performed on a TGA Q500 V6.7 (TA Instruments) in
an interval from 34°C to 500°C at a ramp rate of 5°C/min under Ar gas and in air with a flow
rate of 40ml/min. Differential scanning calorimetry (DSC) was conducted on a Q10 V9.9 Build
303 calorimeter (TA Instruments) at a rate of 5°C/min over a temperature range from 25°C to
200°C under Nitrogen. Approximately 10mg of MAPbI3 was used in each experiment.
3.4 Diffuse UV-Visible Spectroscopy
The optical diffuse reflectance spectra of MAPbI3 perovskite powder were measured at room
temperature using a UV-VIS-NIR spectrophotometer (Shimadzu UV-3600) with integrating
sphere attachment (ISR-3100) operating in the 300-1500 nm region. Highly refined barium
sulfate powder (Wako, pure) was used as a reflectance standard.
15
3.5 Electronic Structure Calculations
Lattice constants and atomic coordinates derived from the present study were used to calculate
the electronic band structures and the densities of the states (DOS) for the polymorphs without
further optimisation. The calculations were based on density functional theory48 (DFT) where
the generalised gradient approximation (GGA) of Perdew-Burke-Ernzerhof (PBE)49 was used to
represent the exchange and correlation energy of the electrons with the CASTEP50 code. The
Brillouin zone summation was performed by using 4 × 4 × 4 k-point grids for sampling in the
Brillouin zone. In the cubic (Pm-3m) and tetragonal (I4/mcm) phases, the CH3NH3+ cation is
dynamically disordered.27 Takahashi51 performed the band structure calculation using fixed
CH3NH3+ for the same class of semiconducting perovskite halides MASnI3, however this reduced
the symmetry and made it difficult to determine accurate band structures.52 Based on the
previous studies,53-55 the electronic properties are strongly dependent on the inorganic
components, i.e. the [PbI6]-4 networks. Therefore CH3NH3
+ was ignored in our calculations and
a uniform background charge density was added to neutralise the charge, except for the
orthorhombic (Pnma) phase, from which the atomic positions of CH3NH3+ were determined by
single crystal XRD.
4. Results and Discussion
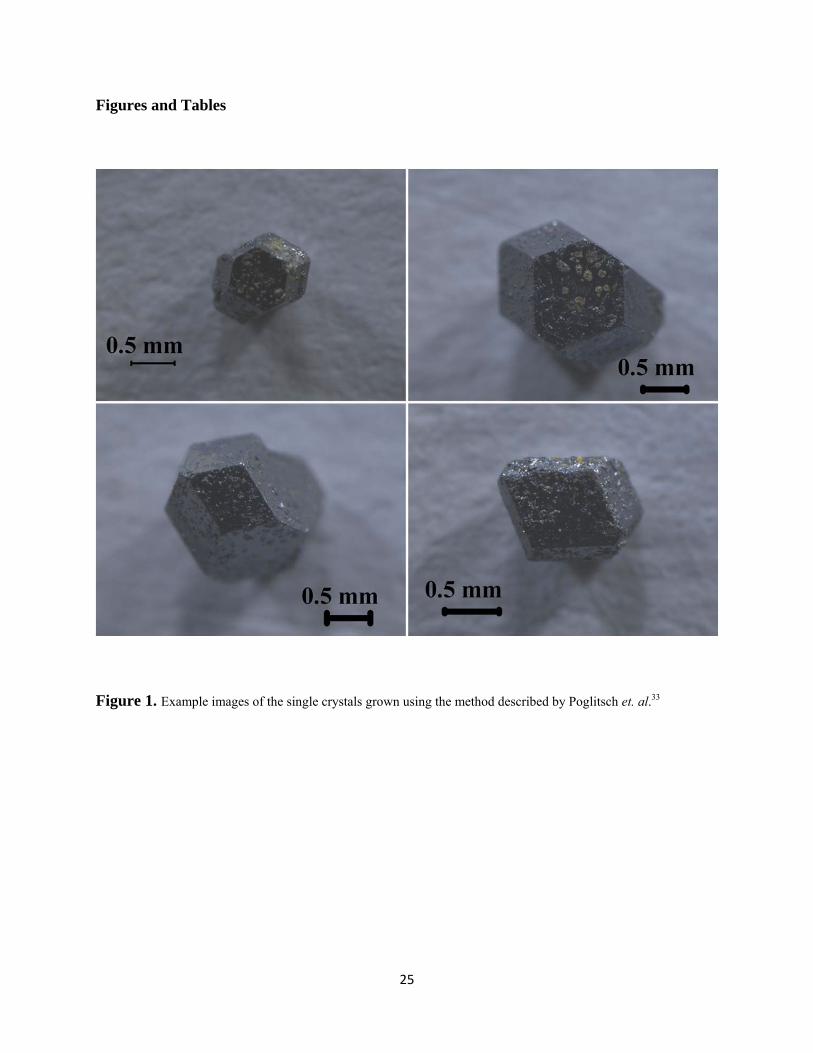
The methods used to synthesise MAPbI3 were successful in preparing high quality samples in
both poly- and single crystalline form (Figure 1). All samples were black, but slowly became
16
yellow, when exposed to a humid atmosphere, with conversion to the hydrated phase
MA4PbI6·2H2O (P21/n a = 10.421(3) Å, b = 11.334(2) Å, c = 10.668(2) Å, β = 91.73(2)°, Z = 2).
The single crystals of MAPbI3 generally formed as dodecahedra, with some examples exhibiting
faceting consistent with rhombo-hexagonal dodecahedra, which is a typical crystal habit of a
body centred tetragonal lattice, in agreement with the reported structure at room temperature
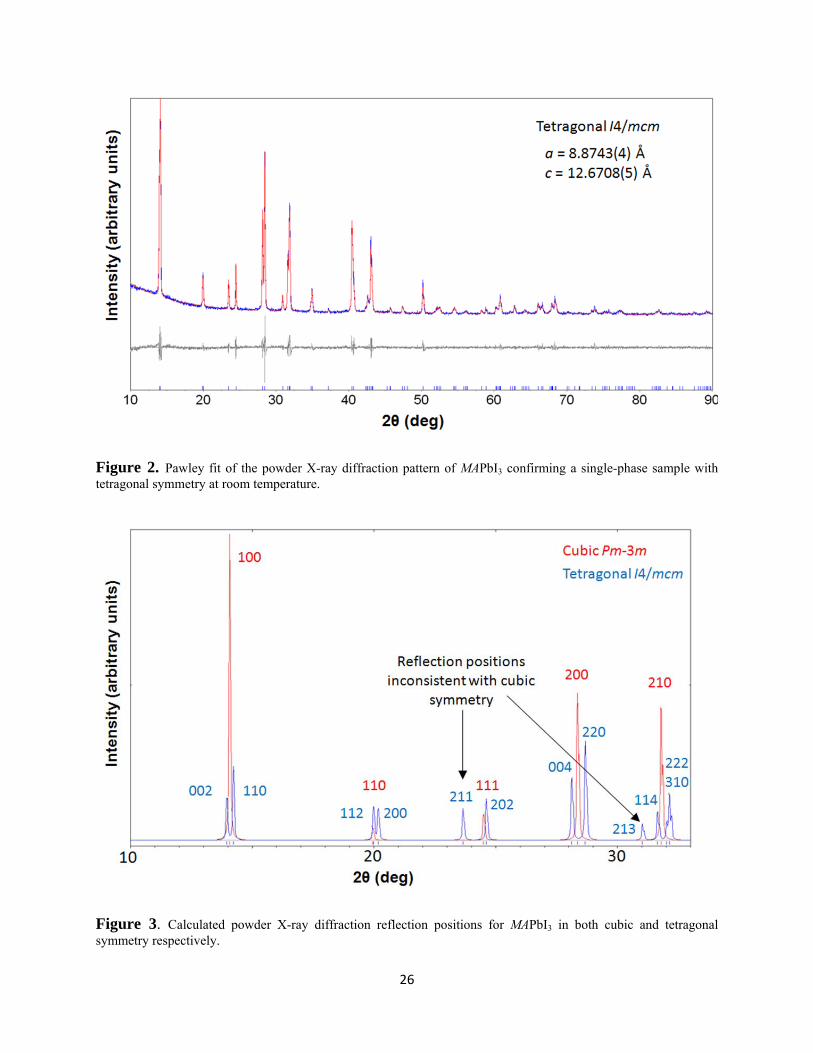
(space group I4/mcm). Using the lattice parameters and space group for the tetragonal structure*i
reported by Kawamura et al.36 a Pawley fit of the powder X-ray diffraction pattern showed the
desired phase had been successfully synthesised (Figure 2).
At higher temperatures (≈327 – 330K; ≈54 – 57°C) the tetragonal perovskite reportedly becomes
cubic. To investigate this transition in more detail we carried out variable temperature powder
X-ray diffraction on an Inel Equinox diffractometer that has a large detector and collects
intensity data over the entire 2θ range simultaneously, and so is ideal for monitoring phase
transitions or in-situ reactions. Comparison of the calculated powder X-ray diffraction patterns
for MAPbI3 in cubic (Pm-3m) and tetragonal (I4/mcm) symmetry (Figure 3), show that these
polymorphs are readily differentiated by monitoring the intensities of the {211} and {213}
reflections as they are sufficiently separated from Bragg reflections expected in cubic symmetry.
The {211} reflection has a higher calculated intensity so any change in symmetry would be
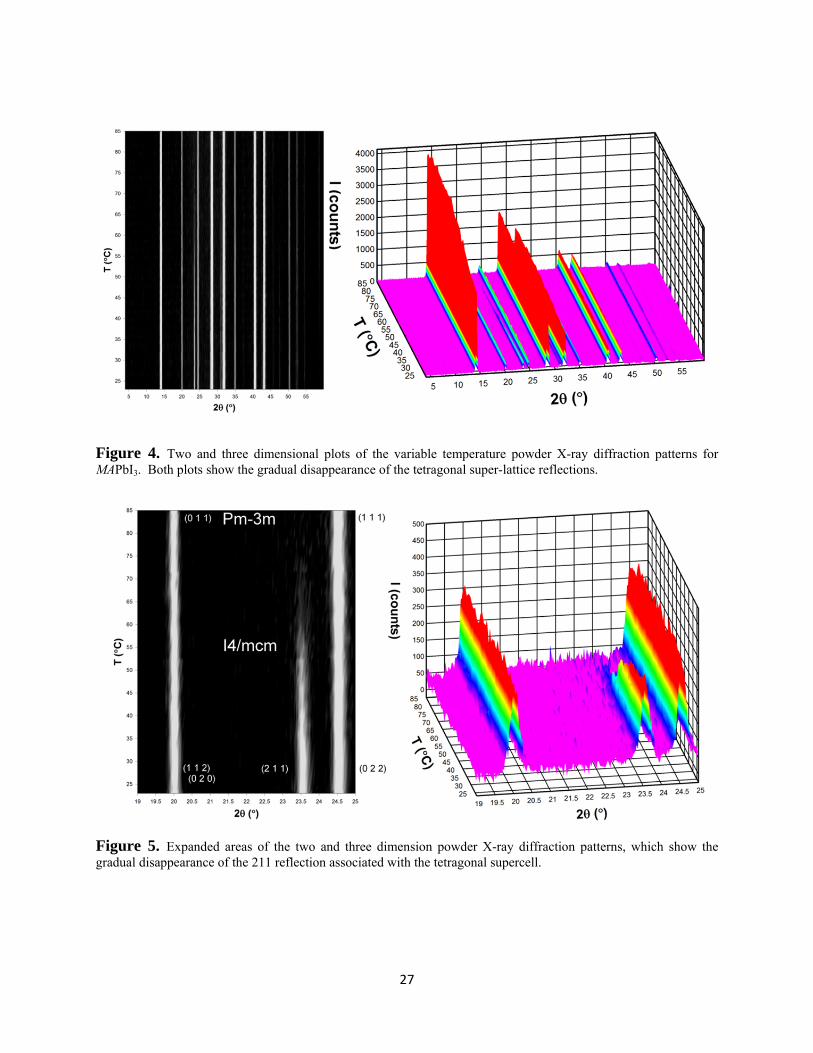
detected more easily by monitoring this reflection. The variable temperature XRD patterns
collected at 2°C intervals between 25 – 85°C show that close to 57°C there is a clear reduction in
{211} positioned at 23.5° 2θ, which gradually disappears towards higher temperature (Figures 4
and 5). Although there is a large change in diffraction intensity at 57°C weak scattering persists
i * Note the fractional coordinate of I(1) as reported is incorrect. The values should be x = 0.2039(8), y = ‐0.2961 (negative of published value) z = 0
17
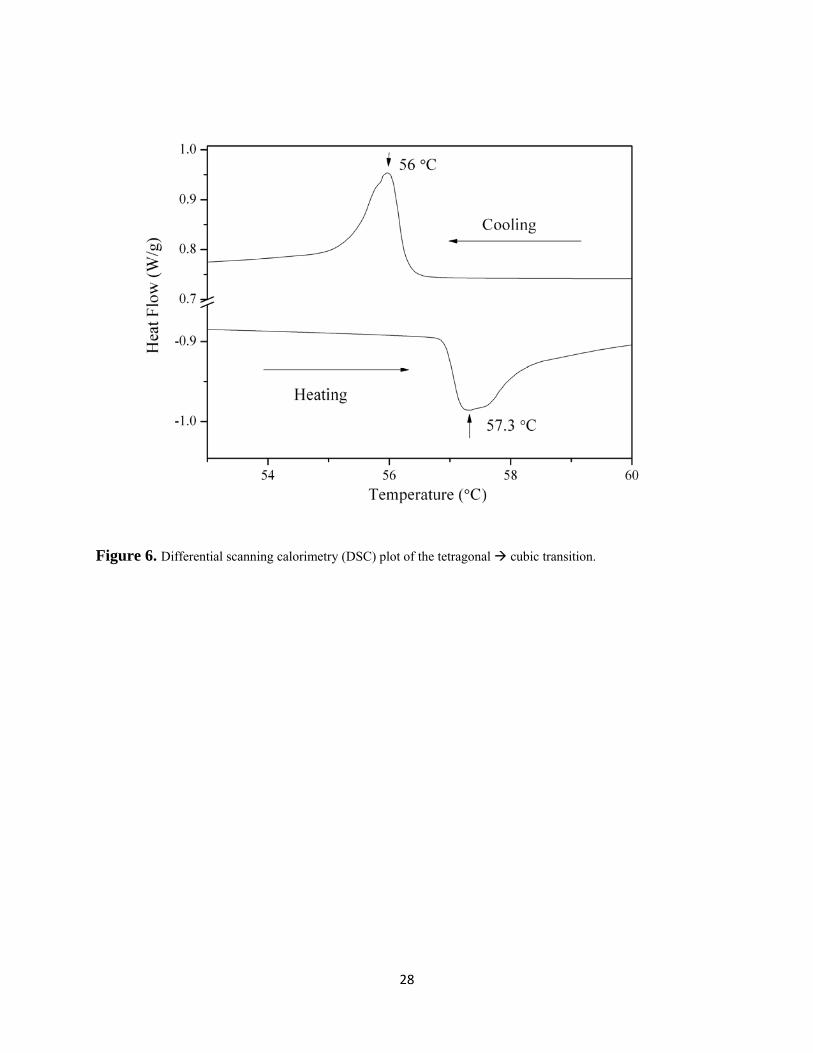
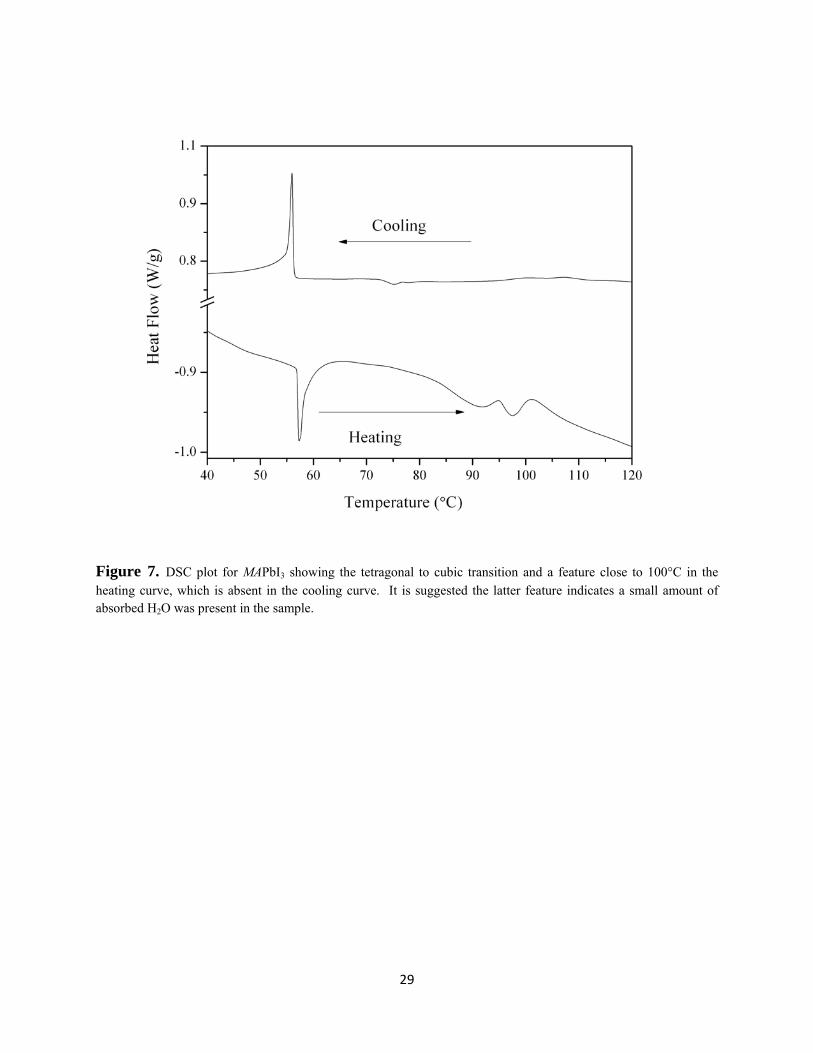
to 75°C. This change in intensity is an agreement with previously reported transition
temperatures and also with the DSC plot where heating and cooling curves, yield maxima at
57.3°C and 56.0°C respectively (Figures 6 and 7). The DSC peaks are asymmetric (Figure 6),
which may be indicative of a transient intermediate phase undetected by powder X-ray
diffraction. One possibility could be a Pm-3m to Im-3 transition analogous to that found in the
high pressure study of MAPbBr3,34 however further work is needed to verify this. The origin of
differences in the transition temperatures shown in the heating and cooling plots are unclear but
may arise from minor absorbed H2O incorporated at room temperature (Figure 7). This is
supported by a feature in the DSC plot close to 100°C in the heating curve, which is absent in the
cooling curve. There is an inflection in the cooling curve at approximately 75°C, absent in the
heating curve, that corresponds to the initial appearance of the {211} reflection in the variable
temperature powder XRD study. The presence of absorbed H2O is also agreement with a TGA
experiment carried out in air which showed a small mass loss at T > 80°C (c.a. 0.3% of the
original mass). Previous TGA experiments carried out in air showed that the perovskite phase is
stable up to ≈ 280°C, after which there is an abrupt and significant mass loss of 47.3%
suggestive of complete decomposition.1 The volatilisation (CH3NH3)I + ½ I2 would be an
approximate 46.1% weight loss, however as the TGA is conducted in air this is likely to proceed
with the co-formation of an lead-oxide-iodide such as Pb2OI2. The decomposition of PbI2 in air
is complex and the TGA study of Krämer and Post56 identified several lead-oxide-iodide phases
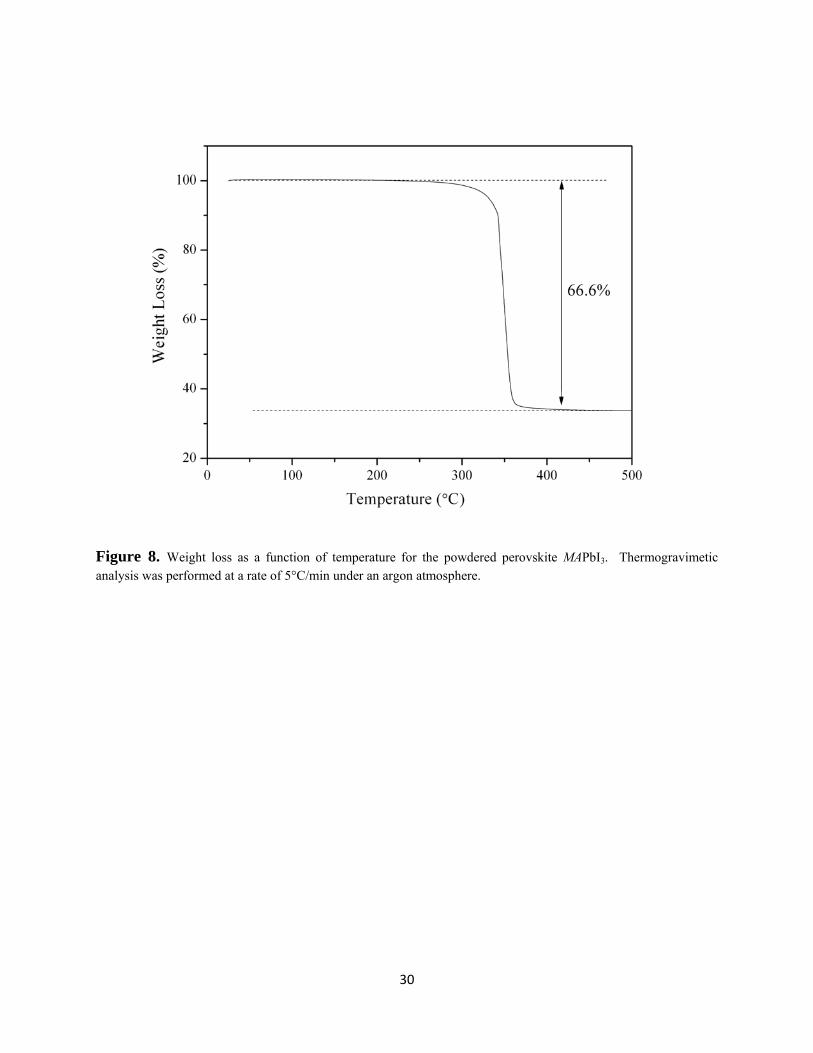
during conversion of PbI2 to PbO. For comparison, a TGA experiment under argon gas using
perovskite that had been stored in a dry-box and therefore free from absorbed water found the
sample to be stable up to ≈ 300°C, and the 66.6% weight loss at 360°C is consistent with the
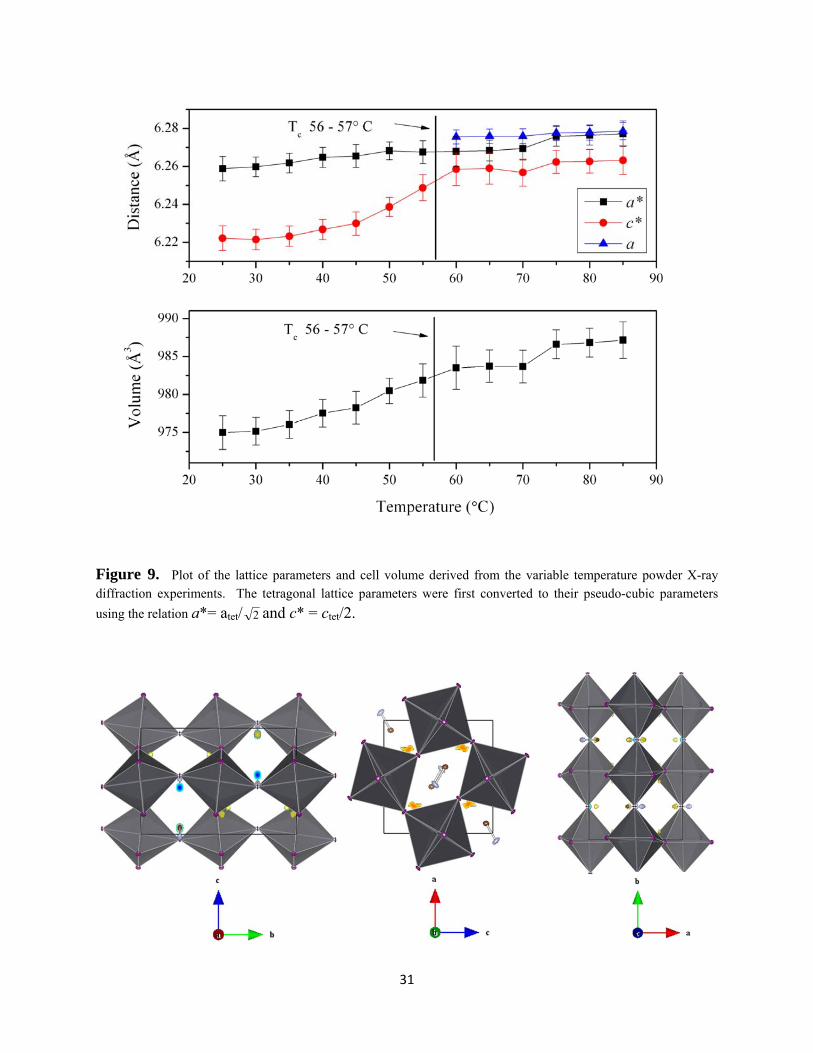
complete decomposition to Pb metal (Figure 8). The refined lattice parameters as a function of
18
temperature show much more variation in the crystallographic c axis as the temperature
approaches the transition temperature and discontinuity in cell volume (Figure 9 and Table 4).
Single crystal X-ray diffraction at room temperature gave the expected tetragonal cell but with
reflection conditions consistent with the space group I4/m and not the reported I4/mcm
symmetry. However, I4/m symmetry is not compatible with perovskite space group hierarchy,6
and refinement was unsuccessful; the anomaly may be a consequence of extensive disorder from
PbI6 tilting or antiphase boundaries. Treating the data in the expected I4/mcm symmetry allowed
the location of Pb and I, but as in previous work, the disordered (CH3NH3)+ units cannot be
modelled unambiguously.32, 36 Notably in the single crystal study of the tetragonal phase carried
out by Kawamura et al.36 only used reflections where Fo > 5σFo rather than the conventional 3σ
precision.
MAPbI3 undergoes a tetragonal to orthorhombic phase transition at approximately 161K
(≈ -112°C).33, 38 Poglitsch and Weber used Guinier-Simon photographs to determine the
orthorhombic polymorphs of both the bromide and iodide in the non-centrosymmetric space
group Pna21.33 However, Swainson et al.32 reclassified the bromide in the centrosymmetric
space group Pnma, as refinements and subsequent symmetry analyses in Pna21 was suggestive
of missing symmetry elements. This latter work also speculated the iodide analogue would
adopt the same symmetry. In addition, although the polar space group Pna21 was originally
assigned to the bromide and iodide, no ferroelectric properties have been reported so far.57
Swainson et al.32 highlighted that in the original work of Poglitsch and Weber,33 no structural
information was given and only the Guinier film was used to suggest Pna21.
19
In this study, single crystal X-ray diffraction at 100K yielded an orthorhombic, Pnma cell and a
structure solution using the Superflip algorithm,45 readily located the Pb and I positions, with the
C and N sites identified from the difference Fourier maps. The refinement proceeded smoothly
to yield the refinement residuals, atomic coordinates and atomic displacement parameters listed
in Tables 6 and 7. Refinements were also performed in the space group Pna21; however these
offered no real improvement in the refinement residuals and gave no indication for the absence
of an inversion centre. One feature that was present in refinements in both space groups were
some relatively strong regions of positive and negative electron density at distances unreasonably
close to the iodine positions (Figure 10). The I(1) apical position had disc shaped atomic
displacement ellipsoids with regions of negative and positive electron density close to the refined
positions (<1 Å). The I(2) equatorial site also has a strong region of positive electron density in
close location to their sites. Similar features in the difference Fourier maps were noted by
Mashiyama et al.10 in the high temperature single crystal X-ray diffraction study of the cubic
forms of MAPbX3 (X = Cl, Br, I). One explanation for these features could be that the motion of
the anion positions are better described using an anharmonic displacement model as successfully
applied to the cubic systems of CsPbX3 (X = Cl and Br).58 Single crystal neutron diffraction
experiments are now planned to investigate the latter possibility in more detail. Alternative
attempts have been made to quantify the disorder observed in a range of organic-inorganic
perovskites using X-ray pair distribution functions.59 This work found the local structures of
such materials showed angular distortions of the octahedra, such that the halides have a
significant displacement transverse the midpoint of the B-B distance to which they are
20
constrained in the ideal crystallographic description. These displacements are likely dynamic in
nature, due in part to the presence of soft transverse acoustic phonons in these structures.
As noted in the work by Swainson et al.32 in their structural analysis of MAPbBr3, there is no
group-subgroup relationship between I4/mcm and Pnma, so it is impossible to descend
continuously through this sequence. It is therefore likely that a transient intermediary phase for
both the bromide and iodide analogues exists, but this has yet to be experimentally observed.
Poglitsch and Weber suggested a second tetragonal phase for the bromide with P4/mmm
symmetry;33 however this is not one of the space groups that can be generated from pure tilt
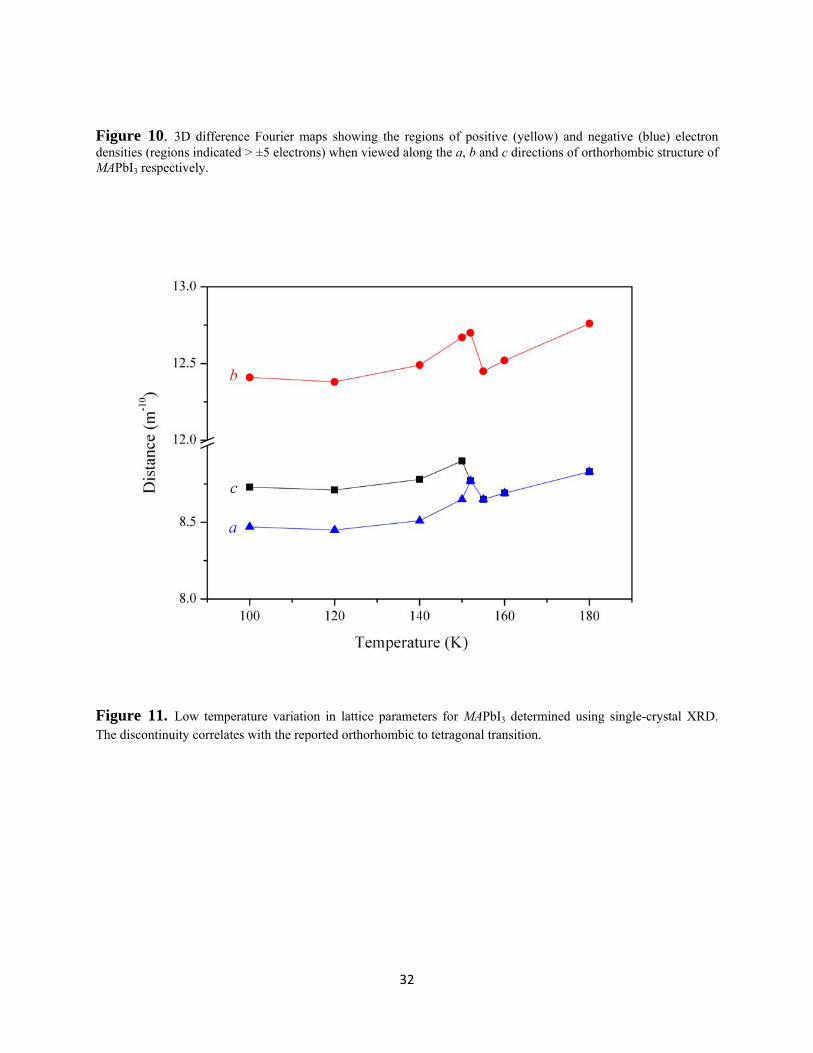
transitions.6 To further investigate this we monitored the variation in lattice parameters as a
function of temperature using single crystal X-ray diffraction (Figure 11 and Table 8). The
absolute temperatures shown in this study should be treated with caution as the temperature
recorded is the temperature at the sensor positioned on the nitrogen nozzle rather than the crystal
itself. Nevertheless, we observed a clear discontinuity and a change in lattice parameters
consistent with the reported orthorhombic to tetragonal phase transition close to 161K.33, 38 We
investigated the suggested space groups from indexing the diffraction data close to transition
region. The data collected at 152K suggested the space group Ibam, however this space group is
inconsistent with reported perovskite symmetries and further experiments will be required to
explain this feature.
Transmission electron microscopy revealed that the perovskite is remarkably stable under the
200 KeV electron beam. Samples containing heavy elements such as Pb and I are often found to
decompose during electron beam irradiation because of the energy deposited during electron
21
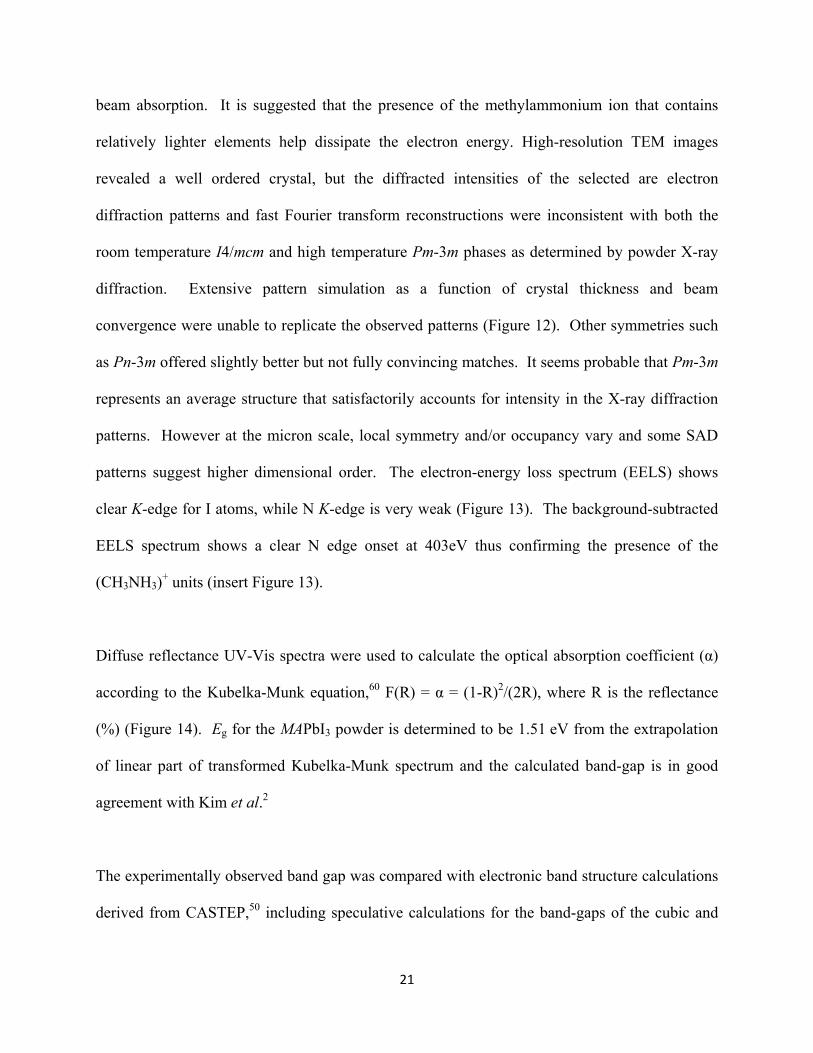
beam absorption. It is suggested that the presence of the methylammonium ion that contains
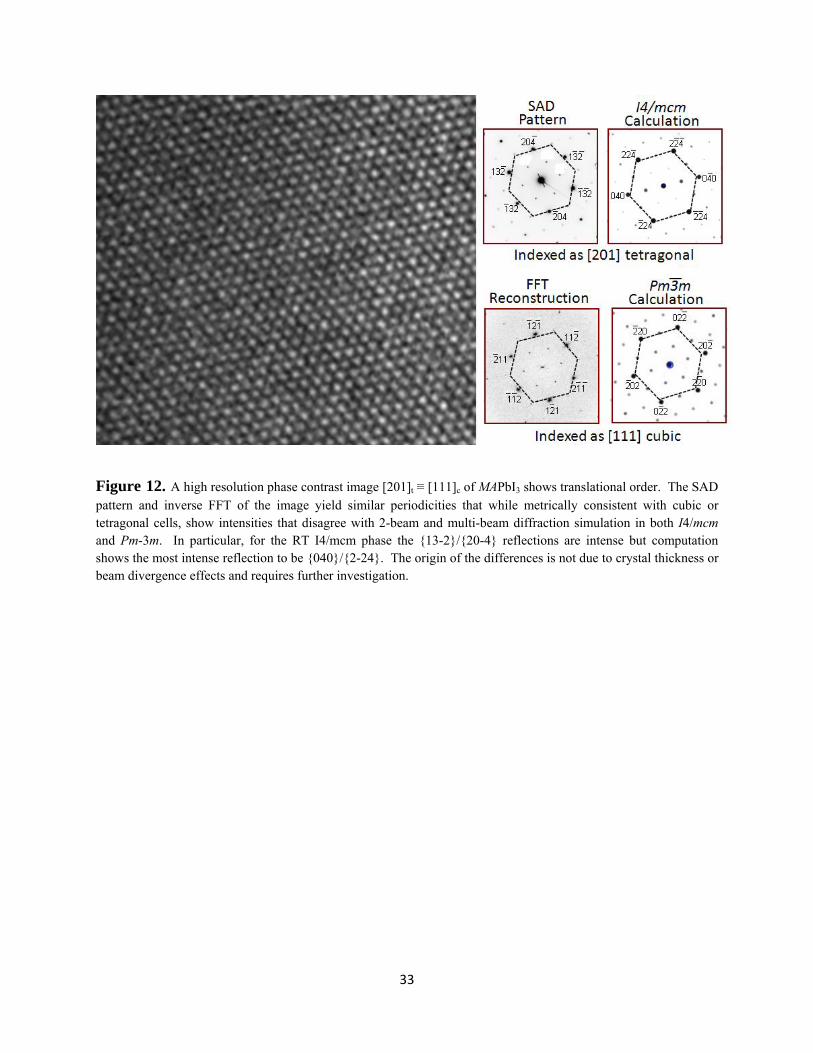
relatively lighter elements help dissipate the electron energy. High-resolution TEM images
revealed a well ordered crystal, but the diffracted intensities of the selected are electron
diffraction patterns and fast Fourier transform reconstructions were inconsistent with both the
room temperature I4/mcm and high temperature Pm-3m phases as determined by powder X-ray
diffraction. Extensive pattern simulation as a function of crystal thickness and beam
convergence were unable to replicate the observed patterns (Figure 12). Other symmetries such
as Pn-3m offered slightly better but not fully convincing matches. It seems probable that Pm-3m
represents an average structure that satisfactorily accounts for intensity in the X-ray diffraction
patterns. However at the micron scale, local symmetry and/or occupancy vary and some SAD
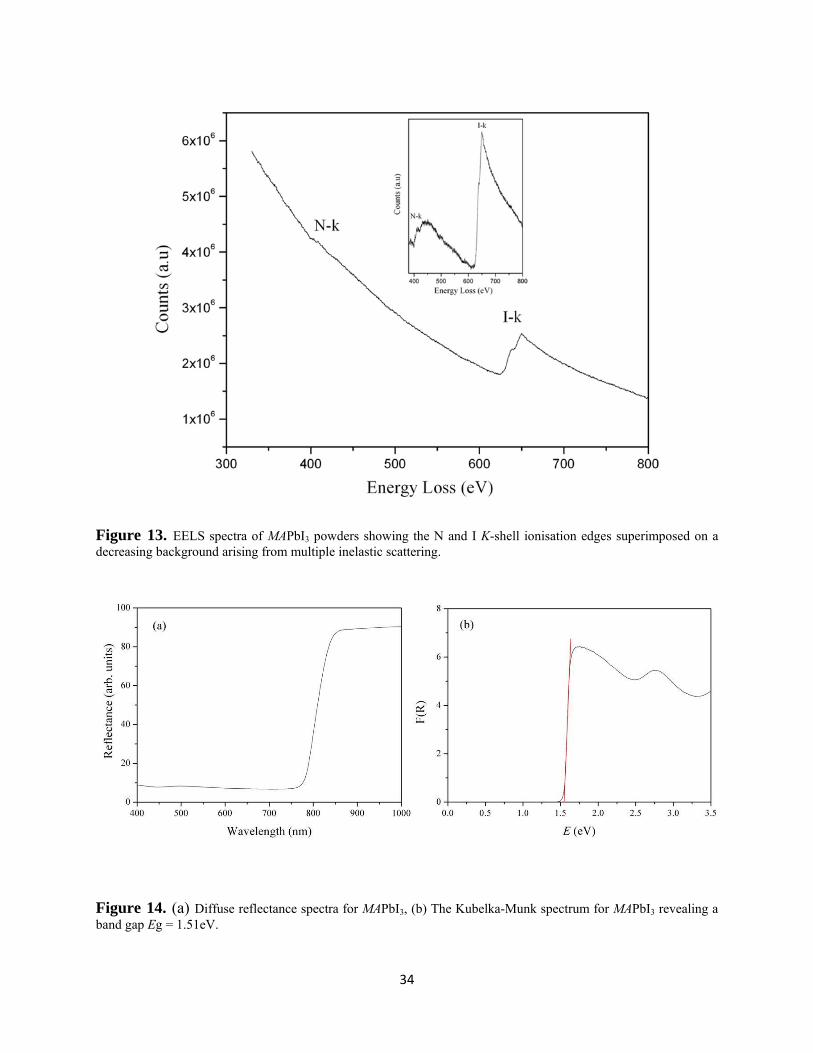
patterns suggest higher dimensional order. The electron-energy loss spectrum (EELS) shows
clear K-edge for I atoms, while N K-edge is very weak (Figure 13). The background-subtracted
EELS spectrum shows a clear N edge onset at 403eV thus confirming the presence of the
(CH3NH3)+ units (insert Figure 13).
Diffuse reflectance UV-Vis spectra were used to calculate the optical absorption coefficient (α)
according to the Kubelka-Munk equation,60 F(R) = α = (1-R)2/(2R), where R is the reflectance
(%) (Figure 14). Eg for the MAPbI3 powder is determined to be 1.51 eV from the extrapolation
of linear part of transformed Kubelka-Munk spectrum and the calculated band-gap is in good
agreement with Kim et al.2
The experimentally observed band gap was compared with electronic band structure calculations
derived from CASTEP,50 including speculative calculations for the band-gaps of the cubic and
22
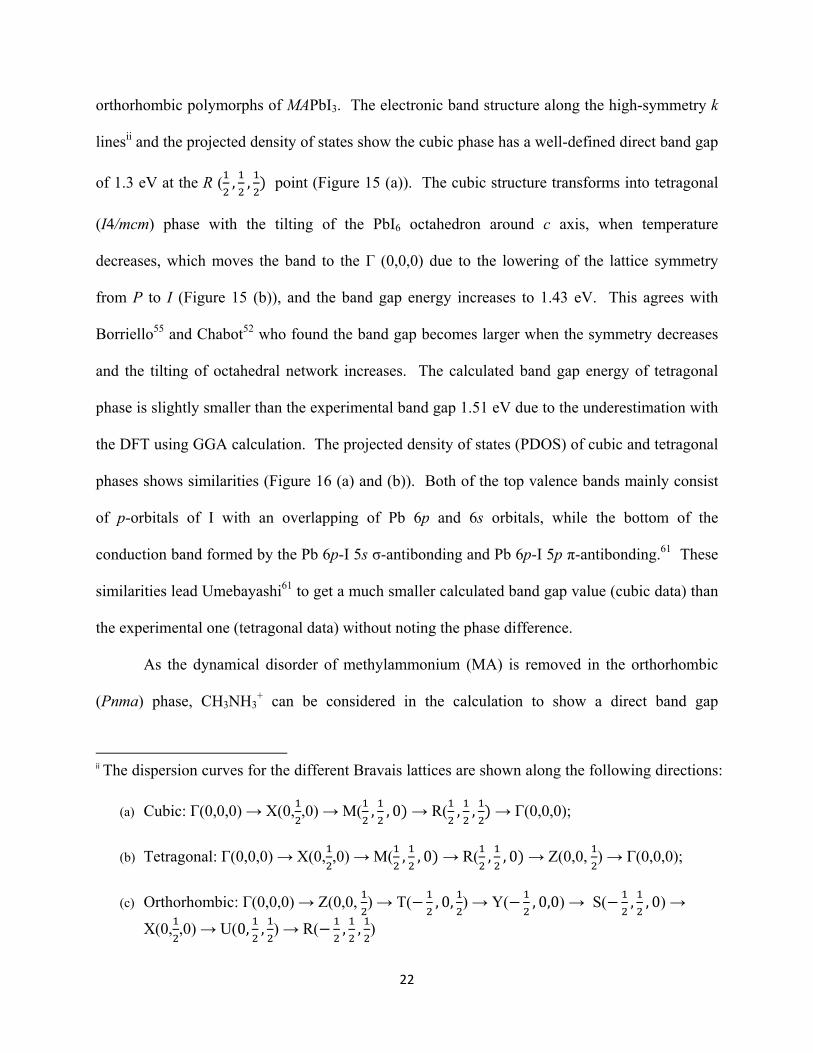
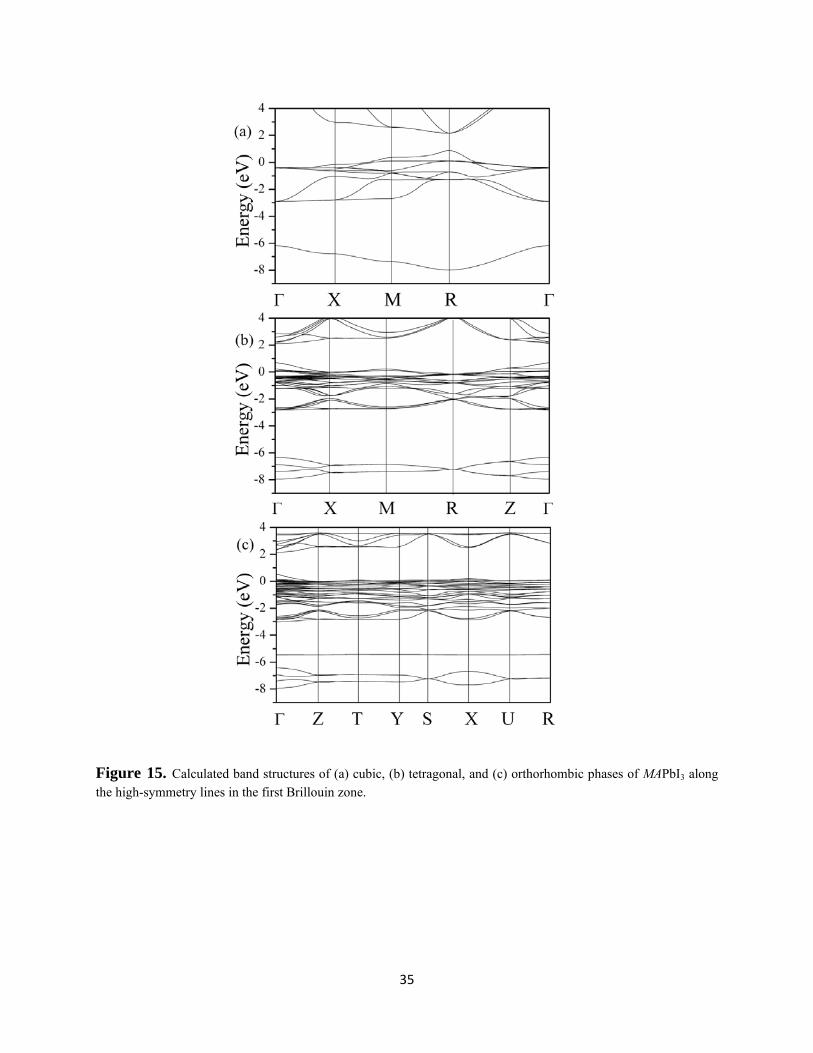
orthorhombic polymorphs of MAPbI3. The electronic band structure along the high-symmetry k
linesii and the projected density of states show the cubic phase has a well-defined direct band gap
of 1.3 eV at the R ( , , point (Figure 15 (a)). The cubic structure transforms into tetragonal
(I4/mcm) phase with the tilting of the PbI6 octahedron around c axis, when temperature
decreases, which moves the band to the Γ (0,0,0) due to the lowering of the lattice symmetry
from P to I (Figure 15 (b)), and the band gap energy increases to 1.43 eV. This agrees with
Borriello55 and Chabot52 who found the band gap becomes larger when the symmetry decreases
and the tilting of octahedral network increases. The calculated band gap energy of tetragonal
phase is slightly smaller than the experimental band gap 1.51 eV due to the underestimation with
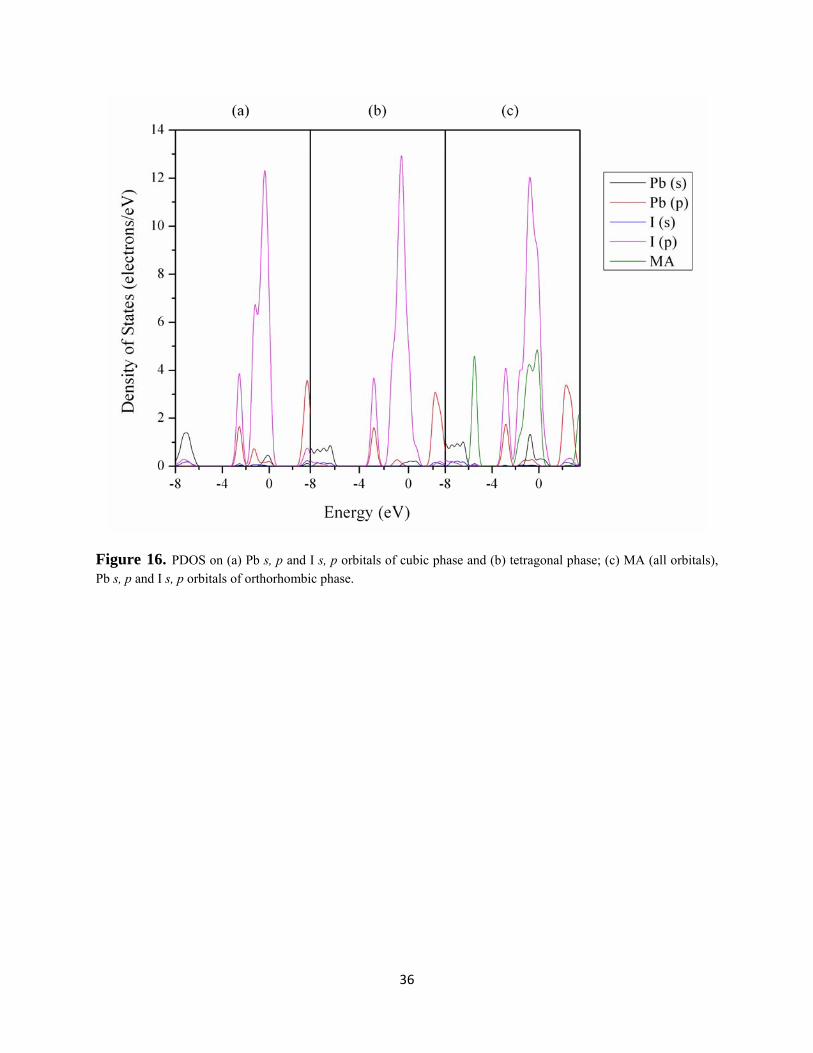
the DFT using GGA calculation. The projected density of states (PDOS) of cubic and tetragonal
phases shows similarities (Figure 16 (a) and (b)). Both of the top valence bands mainly consist
of p-orbitals of I with an overlapping of Pb 6p and 6s orbitals, while the bottom of the
conduction band formed by the Pb 6p-I 5s σ-antibonding and Pb 6p-I 5p π-antibonding.61 These
similarities lead Umebayashi61 to get a much smaller calculated band gap value (cubic data) than
the experimental one (tetragonal data) without noting the phase difference.
As the dynamical disorder of methylammonium (MA) is removed in the orthorhombic
(Pnma) phase, CH3NH3+ can be considered in the calculation to show a direct band gap
ii The dispersion curves for the different Bravais lattices are shown along the following directions:
(a) Cubic: Γ(0,0,0) → X(0, ,0) → M( , , 0 → R( , , → Γ(0,0,0);
(b) Tetragonal: Γ(0,0,0) → X(0, ,0) → M( , , 0 → R( , , 0 → Z(0,0, ) → Γ(0,0,0);
(c) Orthorhombic: Γ(0,0,0) → Z(0,0, ) → T( , 0, ) → Y( , 0,0) → S( , , 0) →
X(0, ,0) → U(0, , ) → R( , , )
23
(Eg = 1. 61 eV) at the Γ (0,0,0) (Figure 15 (c)). The band gap energy increases after the
transition to lower symmetry with further PbI6 octahedral tilting along the c axis (Figure. 15). To
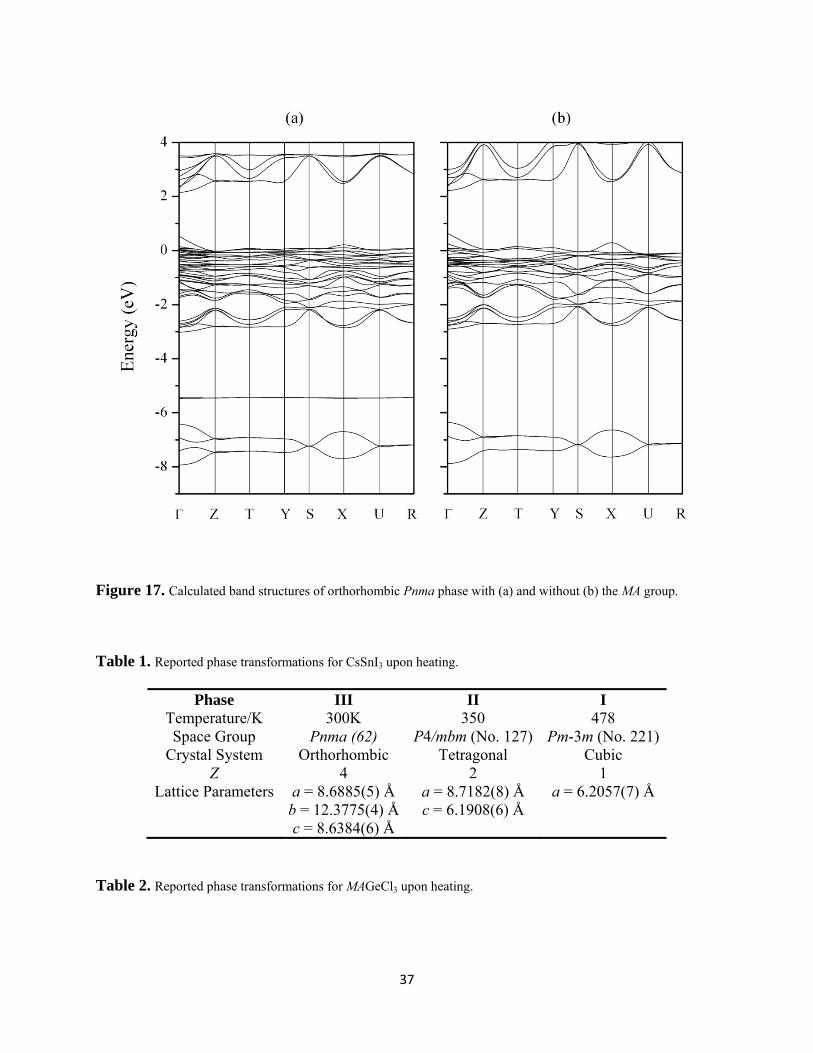
evaluate the calculation in the cubic and tetragonal phases without inclusion of the MA cation
radical, the same method was used for the orthorhombic structure with and without MA cation
(Figure 17). The differences between the two different calculations are small, with a slightly
lower band gap energy (1.57 eV) when MA is absent, perhaps due to smaller octahedral
deformation. The PDOS (Figure 16(c)) of the orthorhombic phase shows that the bands due to
the MA cation are situated in the middle of the valence band and lower energy region, and does
not affect the band gap region. Elsewhere ab initio investigations of the low temperature triclinic
phase of MASnI3 found the organic cation only contributes to bands that are far from the band-
gap.55 In summary, computation finds the organic part contributed exclusively to the electronic
properties of hybrid organic-inorganic perovskites, but the band-gap energy is dominated by the
inorganic component of these perovskite structures.
5. Conclusions
In this work, the perovskite MAPbI3 was successfully synthesised in both poly- and single
crystalline form. Powder X-ray diffraction and DSC have confirmed the cubic to tetragonal
phase transition at approximately 57°C, and TGA has shown that the material is stable up to
around 300°C in an argon atmosphere. The low temperature orthorhombic structure has been
solved for the first time in the space group Pnma and unusual features in the Fourier maps are
suggestive of anharmonic displacements of the anions that require further investigation.
Similarly, the mismatch in the calculated and observed intensities in the selected area electron
24
diffraction patterns are suggestive of localised symmetry differences in the room temperature
tetragonal I4/mcm phase. Analysis of the known perovskite space group symmetries has
revealed that there must be a transient phase between the tetragonal I4/mcm and orthorhombic
Pnma analogues but the apparent Ibam symmetry close the transition temperature is inconsistent
with the space group hierarchy, as is the observed I4/m for the tetragonal phase. It is evident that
a combination of temperature dependant neuron diffraction, synchrotron X-ray diffraction and
magic-angle spinning nuclear magnetic resonance (MASNMR) experiments are required to
resolve the anomalies found in the literature and the present investigation. UV-Visible
spectroscopy has revealed a band-gap of 1.51eV that is in good agreement with values obtained
from DFT calculations and additionally show the band-gap will get larger as the symmetry is
lowered. Furthermore, the band gap is relatively insensitive to the organic component of the
structure. Although we have gathered structural information from the MAPbI3 perovskite using a
range of different techniques, inconsistencies in symmetry, and the likely disorder present in this
and related materials must be understood to properly design and optimise devices.
6. Acknowledgements
Funding from the National Research Foundation (NRF), Singapore is gratefully acknowledged
(CPR Award No. NRF-CRP4-2008-03). MG acknowledges support of this work by the Swiss
National Science Foundation and the European Research Council under the Advanced Research
Grant MESOLIGHT.
25
Figures and Tables
Figure 1. Example images of the single crystals grown using the method described by Poglitsch et. al.33
26
Figure 2. Pawley fit of the powder X-ray diffraction pattern of MAPbI3 confirming a single-phase sample with tetragonal symmetry at room temperature.
Figure 3. Calculated powder X-ray diffraction reflection positions for MAPbI3 in both cubic and tetragonal symmetry respectively.
27
Figure 4. Two and three dimensional plots of the variable temperature powder X-ray diffraction patterns for MAPbI3. Both plots show the gradual disappearance of the tetragonal super-lattice reflections.
Figure 5. Expanded areas of the two and three dimension powder X-ray diffraction patterns, which show the gradual disappearance of the 211 reflection associated with the tetragonal supercell.
28
Figure 6. Differential scanning calorimetry (DSC) plot of the tetragonal cubic transition.
29
Figure 7. DSC plot for MAPbI3 showing the tetragonal to cubic transition and a feature close to 100°C in the heating curve, which is absent in the cooling curve. It is suggested the latter feature indicates a small amount of absorbed H2O was present in the sample.
30
Figure 8. Weight loss as a function of temperature for the powdered perovskite MAPbI3. Thermogravimetic analysis was performed at a rate of 5°C/min under an argon atmosphere.
31
Figure 9. Plot of the lattice parameters and cell volume derived from the variable temperature powder X-ray diffraction experiments. The tetragonal lattice parameters were first converted to their pseudo-cubic parameters
using the relation a*= atet/ 2 and c* = ctet/2.
32
Figure 10. 3D difference Fourier maps showing the regions of positive (yellow) and negative (blue) electron densities (regions indicated > ±5 electrons) when viewed along the a, b and c directions of orthorhombic structure of MAPbI3 respectively.
Figure 11. Low temperature variation in lattice parameters for MAPbI3 determined using single-crystal XRD. The discontinuity correlates with the reported orthorhombic to tetragonal transition.
33
Figure 12. A high resolution phase contrast image [201]t ≡ [111]c of MAPbI3 shows translational order. The SAD pattern and inverse FFT of the image yield similar periodicities that while metrically consistent with cubic or tetragonal cells, show intensities that disagree with 2-beam and multi-beam diffraction simulation in both I4/mcm and Pm-3m. In particular, for the RT I4/mcm phase the {13-2}/{20-4} reflections are intense but computation shows the most intense reflection to be {040}/{2-24}. The origin of the differences is not due to crystal thickness or beam divergence effects and requires further investigation.
34
Figure 13. EELS spectra of MAPbI3 powders showing the N and I K-shell ionisation edges superimposed on a decreasing background arising from multiple inelastic scattering.
Figure 14. (a) Diffuse reflectance spectra for MAPbI3, (b) The Kubelka-Munk spectrum for MAPbI3 revealing a band gap Eg = 1.51eV.
35
Figure 15. Calculated band structures of (a) cubic, (b) tetragonal, and (c) orthorhombic phases of MAPbI3 along the high-symmetry lines in the first Brillouin zone.
36
Figure 16. PDOS on (a) Pb s, p and I s, p orbitals of cubic phase and (b) tetragonal phase; (c) MA (all orbitals), Pb s, p and I s, p orbitals of orthorhombic phase.
37
Figure 17. Calculated band structures of orthorhombic Pnma phase with (a) and without (b) the MA group.
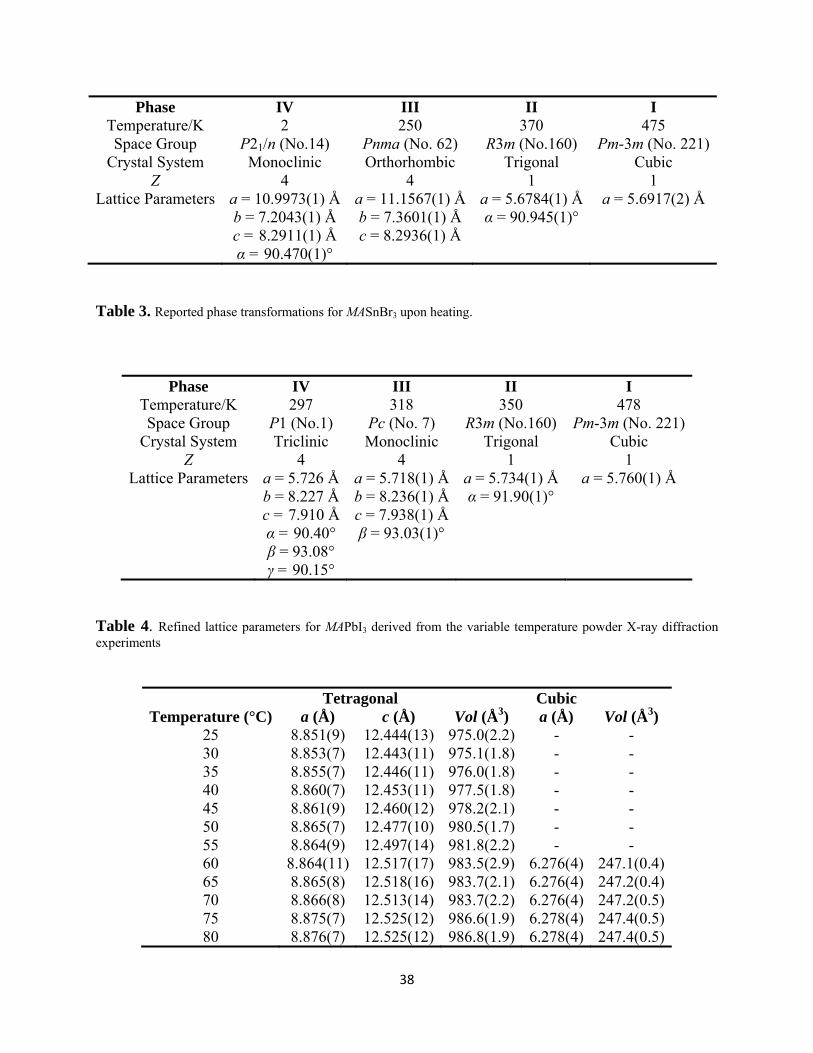
Table 1. Reported phase transformations for CsSnI3 upon heating.
Phase III II I Temperature/K 300K 350 478 Space Group Pnma (62) P4/mbm (No. 127) Pm-3m (No. 221)
Crystal System Orthorhombic Tetragonal Cubic Z 4 2 1
Lattice Parameters a = 8.6885(5) Å a = 8.7182(8) Å a = 6.2057(7) Å b = 12.3775(4) Å c = 6.1908(6) Å c = 8.6384(6) Å
Table 2. Reported phase transformations for MAGeCl3 upon heating.
38
Phase IV III II I Temperature/K 2 250 370 475 Space Group P21/n (No.14) Pnma (No. 62) R3m (No.160) Pm-3m (No. 221)
Crystal System Monoclinic Orthorhombic Trigonal Cubic Z 4 4 1 1
Lattice Parameters a = 10.9973(1) Å a = 11.1567(1) Å a = 5.6784(1) Å a = 5.6917(2) Å b = 7.2043(1) Å b = 7.3601(1) Å α = 90.945(1)° c = 8.2911(1) Å c = 8.2936(1) Å α = 90.470(1)°
Table 3. Reported phase transformations for MASnBr3 upon heating.
Phase IV III II I Temperature/K 297 318 350 478 Space Group P1 (No.1) Pc (No. 7) R3m (No.160) Pm-3m (No. 221)
Crystal System Triclinic Monoclinic Trigonal Cubic Z 4 4 1 1
Lattice Parameters a = 5.726 Å a = 5.718(1) Å a = 5.734(1) Å a = 5.760(1) Å b = 8.227 Å b = 8.236(1) Å α = 91.90(1)° c = 7.910 Å c = 7.938(1) Å α = 90.40° β = 93.03(1)° β = 93.08° γ = 90.15°
Table 4. Refined lattice parameters for MAPbI3 derived from the variable temperature powder X-ray diffraction experiments
Tetragonal Cubic Temperature (°C) a (Å) c (Å) Vol (Å3) a (Å) Vol (Å3)
25 8.851(9) 12.444(13) 975.0(2.2) - - 30 8.853(7) 12.443(11) 975.1(1.8) - - 35 8.855(7) 12.446(11) 976.0(1.8) - - 40 8.860(7) 12.453(11) 977.5(1.8) - - 45 8.861(9) 12.460(12) 978.2(2.1) - - 50 8.865(7) 12.477(10) 980.5(1.7) - - 55 8.864(9) 12.497(14) 981.8(2.2) - - 60 8.864(11) 12.517(17) 983.5(2.9) 6.276(4) 247.1(0.4)65 8.865(8) 12.518(16) 983.7(2.1) 6.276(4) 247.2(0.4)70 8.866(8) 12.513(14) 983.7(2.2) 6.276(4) 247.2(0.5)75 8.875(7) 12.525(12) 986.6(1.9) 6.278(4) 247.4(0.5)80 8.876(7) 12.525(12) 986.8(1.9) 6.278(4) 247.4(0.5)
39
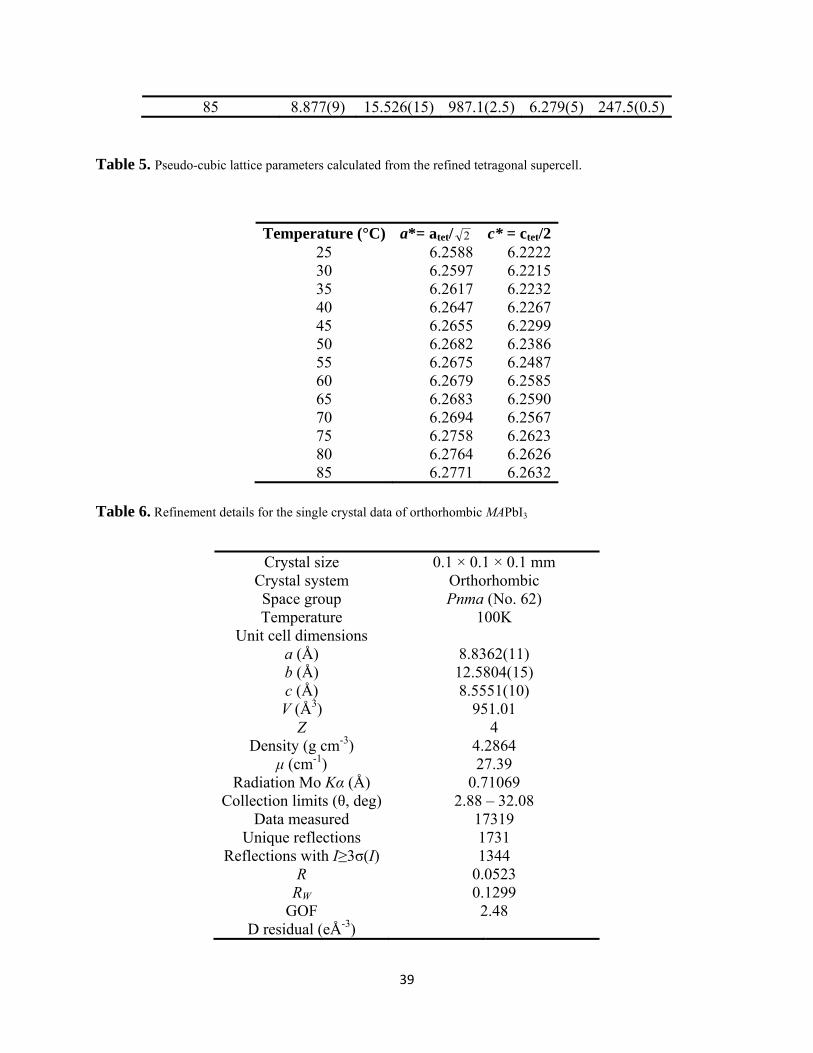
85 8.877(9) 15.526(15) 987.1(2.5) 6.279(5) 247.5(0.5)
Table 5. Pseudo-cubic lattice parameters calculated from the refined tetragonal supercell.
Temperature (°C) a*= atet/ 2 c* = ctet/225 6.2588 6.222230 6.2597 6.221535 6.2617 6.223240 6.2647 6.226745 6.2655 6.229950 6.2682 6.238655 6.2675 6.248760 6.2679 6.258565 6.2683 6.259070 6.2694 6.256775 6.2758 6.262380 6.2764 6.262685 6.2771 6.2632
Table 6. Refinement details for the single crystal data of orthorhombic MAPbI3
Crystal size 0.1 × 0.1 × 0.1 mm Crystal system Orthorhombic Space group Pnma (No. 62) Temperature 100K
Unit cell dimensions a (Å) 8.8362(11) b (Å) 12.5804(15) c (Å) 8.5551(10) V (Å3) 951.01
Z 4 Density (g cm-3) 4.2864
μ (cm-1) 27.39 Radiation Mo Kα (Å) 0.71069
Collection limits (θ, deg) 2.88 – 32.08 Data measured 17319
Unique reflections 1731 Reflections with I≥3σ(I) 1344
R 0.0523 RW 0.1299
GOF 2.48 D residual (eÅ-3)
40
+ 6.55 - -9.11
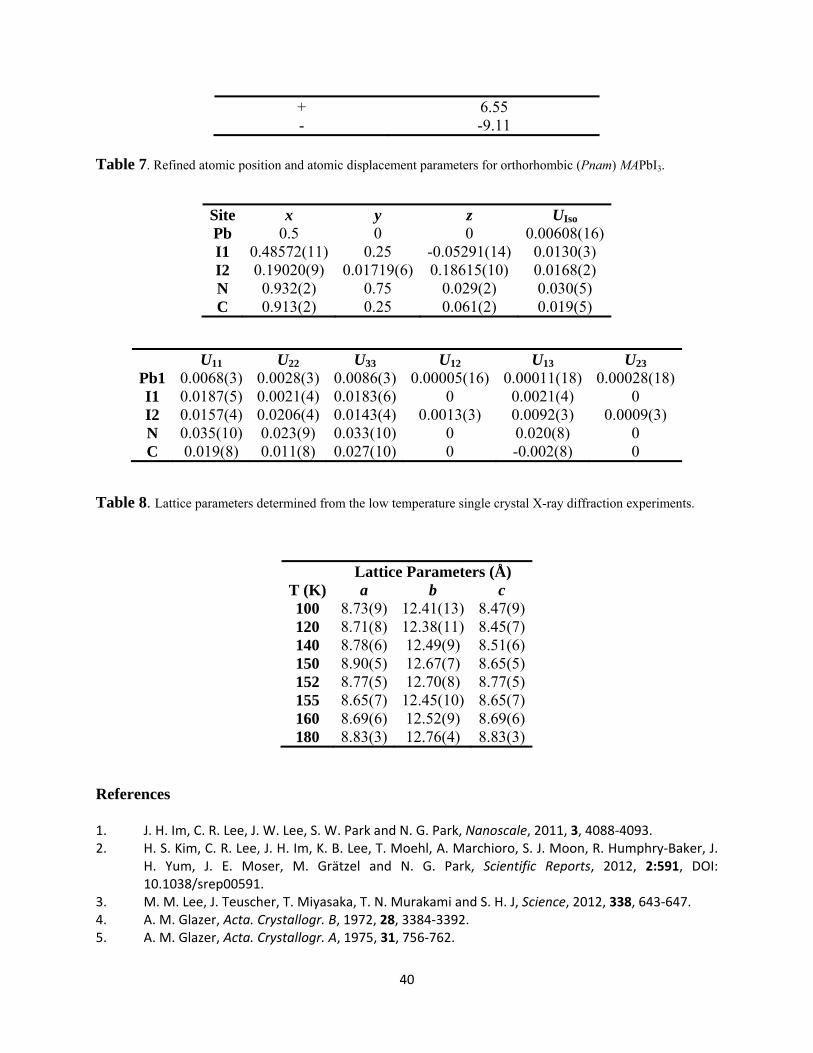
Table 7. Refined atomic position and atomic displacement parameters for orthorhombic (Pnam) MAPbI3.
Site x y z UIso
Pb 0.5 0 0 0.00608(16) I1 0.48572(11) 0.25 -0.05291(14) 0.0130(3) I2 0.19020(9) 0.01719(6) 0.18615(10) 0.0168(2) N 0.932(2) 0.75 0.029(2) 0.030(5) C 0.913(2) 0.25 0.061(2) 0.019(5)
U11 U22 U33 U12 U13 U23 Pb1 0.0068(3) 0.0028(3) 0.0086(3) 0.00005(16) 0.00011(18) 0.00028(18)I1 0.0187(5) 0.0021(4) 0.0183(6) 0 0.0021(4) 0 I2 0.0157(4) 0.0206(4) 0.0143(4) 0.0013(3) 0.0092(3) 0.0009(3) N 0.035(10) 0.023(9) 0.033(10) 0 0.020(8) 0 C 0.019(8) 0.011(8) 0.027(10) 0 -0.002(8) 0
Table 8. Lattice parameters determined from the low temperature single crystal X-ray diffraction experiments.
Lattice Parameters (Å) T (K) a b c100 8.73(9) 12.41(13) 8.47(9)120 8.71(8) 12.38(11) 8.45(7)140 8.78(6) 12.49(9) 8.51(6)150 8.90(5) 12.67(7) 8.65(5)152 8.77(5) 12.70(8) 8.77(5)155 8.65(7) 12.45(10) 8.65(7)160 8.69(6) 12.52(9) 8.69(6)180 8.83(3) 12.76(4) 8.83(3)
References
1. J. H. Im, C. R. Lee, J. W. Lee, S. W. Park and N. G. Park, Nanoscale, 2011, 3, 4088‐4093. 2. H. S. Kim, C. R. Lee, J. H. Im, K. B. Lee, T. Moehl, A. Marchioro, S. J. Moon, R. Humphry‐Baker, J.
H. Yum, J. E. Moser, M. Grätzel and N. G. Park, Scientific Reports, 2012, 2:591, DOI: 10.1038/srep00591.
3. M. M. Lee, J. Teuscher, T. Miyasaka, T. N. Murakami and S. H. J, Science, 2012, 338, 643‐647. 4. A. M. Glazer, Acta. Crystallogr. B, 1972, 28, 3384‐3392. 5. A. M. Glazer, Acta. Crystallogr. A, 1975, 31, 756‐762.
41
6. C. J. Howard and H. T. Stokes, Acta. Crystallogr. A, 1998, 54, 782‐789. 7. I. P. Swainson, Acta. Crystallogr. B, 2005, 61, 616‐626. 8. C. K. Møller, Nature, 1957, 180, 981‐982. 9. C. K. Møller, Nature, 1958, 182, 1436. 10. H. Mashiyama, Y. Kurihara and T. Azetzu, J. Kor. Phys. Soc, 1998, 32, S156‐S158. 11. Y. Kawamura and H. Mashiyama, J. Kor. Phys. Soc, 1999, 35, S1437‐S1440. 12. K. Fütterer, W. Depmeier and V. Petricek, Acta Cryst. , 1995, B51, 768‐779. 13. D. Weber, Z. Naturforsch, 1978, 33b, 1443‐1445. 14. D. B. Mitzi, S. Wang, C. A. Feild, C. A. Chess and A. M. Guloy, Science, 1995, 267, 1473‐1476. 15. D. B. Mitzi, J. Chem. Soc., Dalton Trans., 2001, 1‐12. 16. S. J. Clark, J. D. Donaldson and J. A. Harvey, J. Mater. Chem., 1995, 5, 1813‐1818. 17. I. Chung, J. H. Song, J. Im, J. Androulakis, C. D. Malliakas, H. Li, A. J. Freeman, J. T. Kenney and M.
G. Kanatzidis, J. Am. Chem. Soc., 2012, 134, 8579‐8587. 18. K. Yamada, S. Funabiki, H. Horimoto, T. Martsui, T. Okuda and S. Ichiba, Chem. Lett., 1991, 801‐
804. 19. I. Chung, B. Lee, J. He, R. P. H. Chang and M. G. Kanatzidis, Nature, 2012, 485, 486‐490. 20. A. N. Christensen and S. E. Rasmussen, Acta Chem. Scand., 1965, 19, 421‐428. 21. B. Winkler, V. Milman and M. H. Lee, J. Chem. Phys., 1998, 108, 5506‐5509. 22. W. Depmeier, A. Möller and K. H. Klaska, Acta. Crystallogr. B, 1980, 36, 803‐807. 23. K. Yamada, K. Isobe, E. Tsuyama, T. Okuda and Y. Furukawa, Solid State Ionics, 1995, 79, 152‐
157. 24. K. Yamada, K. Isobe, T. Okuda and Y. Furukawa, Z. Naturforsch. A, 1994, 49, 258‐266. 25. T. Okuda, S. Gotou, T. Takahashi, H. Terao and K. Yamada, Z. Naturforsch. , 1996, 51, 686‐692. 26. K. Yamada, K. Mikawa, T. Okuda and K. S. Knight, J. Chem. Soc., Dalton Trans., 2002, 2112‐2118. 27. K. Yamada, Y. Kuranaga, K. Ueda, S. Goto, T. Okuda and Y. Furukawa, Bull. Chem. Soc. Jpn., 1998,
71, 127‐134. 28. N. Onoda‐Yamamuro, O. Yamamuro, T. Matsuo, H. Suga, K. Oikawa, N. Tsuchiya, T. Kamiyama
and H. Asano, Physica B, 1995, 213‐214, 411‐413. 29. I. P. Swainson, L. Chi, J. H. Her, P. S. Cranswick, B. Winkler, D. J. Wilson and V. Milman, Acta.
Crystallogr. B, 2010, 66, 422‐429. 30. M. Mori and H. Saito, J. Phys. C: Solid State Phys., 1986, 19, 2391‐2401. 31. H. Mashiyama, Y. Kawamura, H. Kasano, T. Asahi, Y. Noda and H. Kimura, Ferroelectrics, 2007,
348, 182‐186. 32. I. P. Swainson, R. P. Hammond, C. Soulliére, O. Knop and W. Massa, J. Solid State Chem., 2003,
176, 97‐104. 33. A. Poglitsch and D. Weber, J. Chem. Phys., 1987, 87, 6373‐6378. 34. I. P. Swainson, M. G. Tucker, D. J. Wilson, B. Winkler and V. Milman, Chem. Mater., 2007, 19,
2401‐2405. 35. R. E. Wasylishen, O. Knop and J. B. Macdonald, Solid state Commun., 1985, 56, 581‐582. 36. Y. Kawamura, H. Mashiyama and K. Hasebe, J. Phys. Soc. Jpn., 2002, 71, 1694‐1697. 37. N. Onoda‐Yamamuro, T. Matsuo and H. Suga, J. Phys. Chem. Solids, 1990, 51, 1383‐1395. 38. N. Onoda‐Yamamuro, T. Matsuo and H. Suga, J. Phys. Chem. Solids, 1992, 53, 935‐939. 39. B. R. Vincent, K. N. Robertson, T. S. Cameron and K. Osvald, Can. J. Chem., 1987, 65, 1042‐1046. 40. Bruker, Topas Version 4.1, (2008) Bruker AXS Inc., Madison, Wisconsin, USA. 41. R. W. Cheary and A. Coelho, J. Appl. Crystallogr., 1992, 25, 109‐121. 42. R. W. Cheary and A. Coelho, J. Appl. Crystallogr., 1998, 31, 851‐861. 43. D. Hyde, Graph software for scientists and engineers (available at www.dplot.com), (2012).
42
44. V. Petriček, M. Dusek and L. Palatinus, Jana2006. The crystallographic computing system., (2006), Institute of Physics, Praha, Czech Republic.
45. L. Palatinus and G. Chapuis, J. Appl. Crystallogr., 2007, 40, 786‐790. 46. K. Momma and F. Izumi, J. Appl. Cryst., 2008, 41, 653‐658. 47. P. Stadelmann, JEMS, 12M‐EPFL, CH‐1015, (2003), Switzerland. 48. W. Kohn and L. J. Sham, Phys. Rev., 1965, 140, 1133. 49. J. P. Perdew, K. Burke and M. Ernzerhof, Phys. Rev. Lett., 1996, 77, 3865. 50. M. Segall, P. Linda, M. Probert, C. Pickard, P. Hasnip, S. Clark and M. Payne, Materials Studio
CASTEP Version 2.2, (2002). 51. Y. Takahashi, R. Obara, Z. Z. Lin, Y. Takahashi, T. Naito, T. Inabe, S. Ishibashi and K. Terakura,
Dalton Trans., 2011, 40, 5563‐5568. 52. J. Chabot, M. Côté and J. Bri'ere, American Physical Society, March Meeting, 2004. 53. D. B. Mitzi, C. A. Feild, W. T. A. Harrison and A. M. Guloy, Nature, 1994, 369, 467. 54. D. B. Mitzi, Prog. Inorg. Chem., 1999, 48, 1. 55. I. Borriello, G. Cantele and D. Ninno, Phys. Rev. B, 2008, 77, 235214. 56. V. Krämer and E. Post, Mat. Res. Bull., 1985, 20, 407‐412. 57. K. Gesi, Ferroelectrics, 1997, 203, 249. 58. M. Sakata, J. Harada, M. J. Cooper and K. D. Rouse, Acta Cryst. A, 1980, 36, 7‐15. 59. R. J. Worhatch, H. S. Kim, I. P. Swainson, A. L. Yonken and S. J. L. Billinge, Chem. Mater., 2008,
20, 1272‐1277. 60. J. Torrent and V. Barron, Encyclopedia of Surface and Colloid Science, Marcel Dekker, Inc, New
York, 2002. 61. T. Umebayashi and K. Asai, Phys. Rev. B, 2003, 67, 155405.