synchro studio 8 user guide
TRANSCRIPT

7/21/2019 Synchro Studio 8 User Guide
http://slidepdf.com/reader/full/synchro-studio-8-user-guide 1/559
Traffic Signal Software-User Guide
Synchro Studio 8 Synchro plus SimTraffic and 3D Viewer
7/21/2019 Synchro Studio 8 User Guide
http://slidepdf.com/reader/full/synchro-studio-8-user-guide 2/559
ii
Synchro Studio 8 User Guide
Copyright 1993 - 2011 Trafficware Ltd. All rights reserved.
All rights reserved. This manual, as well as the software described in it, is furnished under
license and may be used or copied only in accordance with the terms of such license. Except as
permitted by such license, no part of this publication may be reproduced, stored in a retrieval
system, or transmitted, in any form or by any means, electronic, mechanical, recording, or
otherwise, without the prior written permission of the publisher. This manual is designed to
provide authoritative information and guidance in regard to the subject matter covered. It is provided with the understanding that the publisher is not engaged in rendering traffic planning,
roadway design or transportation engineering services. If expert assistance is required, the
services of a competent professional should be sought.
International Standard Book Number: 0-9742903-3-5
Printed in the United States of America.
First Printing: June 2011.
Trademarks
Trafficware, Synchro and SimTraffic are registered trademarks or trademarks of Trafficware
Ltd. Microsoft and Windows are registered trademarks of Microsoft Corporation. HCS2000 and
TRANSYT-7F are trademarks of University of Florida. PASSER is a trademark of Texas
Transportation Institute (TTI).
Written By
Trafficware, Ltd.
Published By
Trafficware, Ltd.
PO Box 499
Sugar Land, TX 77487-0499
www.trafficware.com
(510) 526-5891

7/21/2019 Synchro Studio 8 User Guide
http://slidepdf.com/reader/full/synchro-studio-8-user-guide 3/559
iii
Keeping Up to DateTo keep this information up to date, Trafficware might issue new printings of this manual. New
printings reflect minor changes and technical corrections. You can keep this information up to
date by visiting and installing the latest revision of the Trafficware software since this User
Guide is replicated in the Help Menu of the program. To find out if you have the latest revision
or build of the software visit our website at www.trafficware.com.

7/21/2019 Synchro Studio 8 User Guide
http://slidepdf.com/reader/full/synchro-studio-8-user-guide 4/559
iv
Table of Contents
Chapter 1 – Introduction .......................................................................................................... 1-1 Introduction .......................................................................................................................... 1-1 Getting Started and What‟s New ......................................................................................... 1-3
Chapter 2 – Map View and Layout .......................................................................................... 2-1
Map View ............................................................................................................................ 2-1 Introduction to Links and Intersections................................................................................ 2-3 Mapping out Links and Intersections ................................................................................... 2-4 Background Images ........................................................................................................... 2-10
Using Bing™ to Add a Background Image ....................................................... 2-15 Zooming and Scrolling ...................................................................................................... 2-18 Select Intersection .............................................................................................................. 2-19
Intersection and Link Buttons ............................................................................................ 2-20 Show Information Buttons ................................................................................................. 2-21 MAP View Keyboard Commands ..................................................................................... 2-26 File Units ........................................................................................................................... 2-27 Drawing Features ............................................................................................................... 2-28 Map Settings, Color, and Sizes .......................................................................................... 2-31 Rotate, Scale and Move the Map's Coordinate System ...................................................... 2-32
Default Settings .................................................................................................. 2-33 Time Tracker in Synchro ................................................................................... 2-34
Chapter 3 – Data Entry Settings ............................................................................................... 3-1 Data Entry Setting Buttons .................................................................................................. 3-2 Full View Data Entry ........................................................................................................... 3-3 Side View Data Entry .......................................................................................................... 3-4 Lanes and Volumes Data Rows ........................................................................................... 3-6
Changing the Name of the Approach Direction ................................................................... 3-6 File Command Buttons ........................................................................................................ 3-8 Summary of Menu Commands ............................................................................................ 3-9
Chapter 4 – Node Settings ....................................................................................................... 4-1 Node Number ....................................................................................................................... 4-2 Zone ..................................................................................................................................... 4-2
Node Coordinates ................................................................................................................ 4-4
7/21/2019 Synchro Studio 8 User Guide
http://slidepdf.com/reader/full/synchro-studio-8-user-guide 5/559
v
Description .......................................................................................................................... 4-4
Control Type ........................................................................................................................ 4-4 Cycle Length ....................................................................................................................... 4-5 Lock Timings ....................................................................................................................... 4-6 Optimize Cycle Length ........................................................................................................ 4-7 Optimize Splits .................................................................................................................... 4-7 Actuated Cycle Length ........................................................................................................ 4-7 Actuated Cycles by Percentile ............................................................................................. 4-7
Natural Cycle Length ........................................................................................................... 4-8 Maximum v/c Ratio ............................................................................................................. 4-8 Intersection Delay ................................................................................................................ 4-9 Intersection Level of Service ............................................................................................... 4-9 Intersection Capacity Utilization ....................................................................................... 4-11 ICU Level of Service ......................................................................................................... 4-11 Offset Settings ................................................................................................................... 4-12 Mandatory Stop on Yellow ................................................................................................ 4-17
Chapter 5 – Lane Settings ........................................................................................................ 5-1 Lanes and Sharing ............................................................................................................... 5-2 Street Name ......................................................................................................................... 5-3 Link Distance ....................................................................................................................... 5-3 Link Speed ........................................................................................................................... 5-4 Set Arterial Name and Speed ............................................................................................... 5-4
Travel Time ......................................................................................................................... 5-4 Ideal Saturated Flow ............................................................................................................ 5-4 Lane Width .......................................................................................................................... 5-5 Grade ................................................................................................................................... 5-5 Area Type CBD ................................................................................................................... 5-6 Storage Length ..................................................................................................................... 5-6 Storage Lanes ...................................................................................................................... 5-6
Right Turn Channelized ....................................................................................................... 5-7
Curb Radius ......................................................................................................................... 5-7 Add Lanes ............................................................................................................................ 5-7 Lane Utilization Factor ........................................................................................................ 5-8 Right Turn Factors ............................................................................................................. 5-10 Left Turn Factors ............................................................................................................... 5-10 Saturated Flow Rates ......................................................................................................... 5-11 Right Ped Bike Factor ........................................................................................................ 5-12

7/21/2019 Synchro Studio 8 User Guide
http://slidepdf.com/reader/full/synchro-studio-8-user-guide 6/559
vi
Left Ped Factor ................................................................................................................... 5-13
Right Turn on Red (RTOR) ............................................................................................... 5-13 Saturation Flow Rate (RTOR) ........................................................................................... 5-15
Link is Hidden .................................................................................................... 5-19
Hide Street Name in Node Title ......................................................................... 5-19
Chapter 6 – Volume Settings ................................................................................................... 6-1 Traffic Volumes ................................................................................................................... 6-2
Conflicting Pedestrians ........................................................................................................ 6-2 Conflicting Bicycles............................................................................................................. 6-3 Peak Hour Factor ................................................................................................................. 6-3 Growth Factor ...................................................................................................................... 6-4 Heavy Vehicles .................................................................................................................... 6-5 Bus Blockages...................................................................................................................... 6-5 Adjacent Parking Lane, Parking Maneuvers ........................................................................ 6-6
Traffic from Mid-block ........................................................................................................ 6-7 Link Origin Destination (O-D) Volumes ............................................................................. 6-8 Adjusted Flow .................................................................................................................... 6-13 Traffic in Shared Lane ....................................................................................................... 6-13 Lane Group Flow ............................................................................................................... 6-14
Chapter 7 – Timing/Signing Settings ....................................................................................... 7-1 Timing Settings .................................................................................................................... 7-1
Layout .................................................................................................................................. 7-2 Signing Settings ................................................................................................................... 7-2 Phase Templates .................................................................................................................. 7-2 Turn Type ............................................................................................................................ 7-3 Protected and Permitted Phases ........................................................................................... 7-5 Detector Phase ..................................................................................................................... 7-7 Switch Phase ........................................................................................................................ 7-8
Leading Detector .................................................................................................................. 7-8 Trailing Detector .................................................................................................................. 7-9 Minimum Initial ................................................................................................................... 7-9 Minimum Split ..................................................................................................................... 7-9 Total Split .......................................................................................................................... 7-11 Yellow Time ...................................................................................................................... 7-12 All-Red Time ..................................................................................................................... 7-12 Lost Time Adjustment ....................................................................................................... 7-13

7/21/2019 Synchro Studio 8 User Guide
http://slidepdf.com/reader/full/synchro-studio-8-user-guide 7/559
vii
Lagging Phase? .................................................................................................................. 7-13
Allow Lead/Lag Optimize? ............................................................................................... 7-14 Recall Mode ....................................................................................................................... 7-15 Pedestrian and Hold Phases ............................................................................................... 7-18 Sign Control ....................................................................................................................... 7-18 Median Width and TWLTL Median .................................................................................. 7-19 Right Turn Channelized ..................................................................................................... 7-19 Critical Gap ....................................................................................................................... 7-20
Follow Up Time ................................................................................................................ 7-20 Roundabout Settings .......................................................................................................... 7-20 Measures of Effectiveness ................................................................................................. 7-21 Actuated Effective Green .................................................................................................. 7-21 Volume to Capacity Ratio ................................................................................................. 7-24 Control Delay .................................................................................................................... 7-25 Queue Delay ...................................................................................................................... 7-25 Total Delay ........................................................................................................................ 7-26 Level of Service ................................................................................................................. 7-26 Approach Delay ................................................................................................................. 7-27 Approach Level of Service ................................................................................................ 7-27 Queue Lengths ................................................................................................................... 7-27 Warning Indicators ............................................................................................................ 7-29 How to Code an Overlap ................................................................................................... 7-30 Timing Settings Quick Start .............................................................................................. 7-32
Chapter 8 – Phasing Settings ................................................................................................... 8-1 Layout .................................................................................................................................. 8-2 Percentile Scenarios ............................................................................................................. 8-2 Ring and Barrier Designer ................................................................................................... 8-2 Cluster Editor ....................................................................................................................... 8-5 Minimum Initial ................................................................................................................... 8-6 Minimum Split ..................................................................................................................... 8-6 Maximum Split .................................................................................................................... 8-7 Yellow Time ........................................................................................................................ 8-7 All-Red Time ....................................................................................................................... 8-8 Lagging Phase? .................................................................................................................... 8-8 Allow Lead/Lag Optimize? ................................................................................................. 8-8 Vehicle Extension ................................................................................................................ 8-9 Minimum Gap ..................................................................................................................... 8-9
7/21/2019 Synchro Studio 8 User Guide
http://slidepdf.com/reader/full/synchro-studio-8-user-guide 8/559
viii
Time Before Reduce ............................................................................................................ 8-9
Time To Reduce ................................................................................................................... 8-9 Recall Mode ......................................................................................................................... 8-9 Pedestrian Phase ................................................................................................................ 8-10 Walk Time ......................................................................................................................... 8-10 Flashing Don‟t Walk Time ................................................................................................ 8-11 Pedestrian Calls .................................................................................................................. 8-11 Dual Entry .......................................................................................................................... 8-12
Fixed Force Off? ................................................................................................................ 8-13 Percentile Green Times ...................................................................................................... 8-13 Modeling Occasional Pedestrians with Actuated Signals .................................................. 8-14
Chapter 9 – Simulation Settings............................................................................................... 9-1 Storage Length ..................................................................................................................... 9-2 Storage Lanes ....................................................................................................................... 9-2 Taper length ......................................................................................................................... 9-2
Lane Alignment ................................................................................................................... 9-2 Lane Width .......................................................................................................................... 9-4 Enter Blocked Intersection ................................................................................................... 9-4 Median Width ...................................................................................................................... 9-4 Link Offset ........................................................................................................................... 9-6 Crosswalk Width .................................................................................................................. 9-6 TWLTL Median ................................................................................................................... 9-7
Headway Factor ................................................................................................................... 9-8 Turning Speed ...................................................................................................................... 9-8 Lane Change Distances ........................................................................................................ 9-8
Chapter 10 – Detector Settings .............................................................................................. 10-1 Number of Detectors .......................................................................................................... 10-2 Detector Phase ................................................................................................................... 10-2 Switch Phase ...................................................................................................................... 10-2
Leading Detector, Trailing Detector .................................................................................. 10-2 Detector Template .............................................................................................................. 10-3 Add Template .................................................................................................................... 10-3 Detector n Position ............................................................................................................. 10-4 Detector n Size ................................................................................................................... 10-5 Detector n Type ................................................................................................................. 10-5 Detector n Channel ............................................................................................................ 10-5
Detector n Extend .............................................................................................................. 10-6
7/21/2019 Synchro Studio 8 User Guide
http://slidepdf.com/reader/full/synchro-studio-8-user-guide 9/559
ix
Detector 1 Queue ............................................................................................................... 10-6
Detector 1 Delay ................................................................................................................ 10-6
Chapter 11 – HCM 2010 Settings .......................................................................................... 11-1 Current Version Notes ....................................................................................................... 11-1 Automobile Mode .............................................................................................................. 11-2 Pedestrian Mode .............................................................................................................. 11-10 Bicycle Mode ................................................................................................................... 11-15 HCM 2010 Roundabout Mode ........................................................................................ 11-17
Chapter 12 – Network Settings .............................................................................................. 12-1 Network Settings ............................................................................................................... 12-1 Lane Settings ..................................................................................................................... 12-2 Volume Settings ................................................................................................................ 12-3 Timings Settings ................................................................................................................ 12-4 Phases Settings .................................................................................................................. 12-6 Simulation Settings ............................................................................................................ 12-8
Chapter 13 – Time-Space Diagram ....................................................................................... 13-1 Parts of a Time-Space Diagram ......................................................................................... 13-2 Time-Space Diagram Features .......................................................................................... 13-4 Time-Space Diagram Options ........................................................................................... 13-8 Interacting with the Time-Space Diagram ......................................................................... 13-9 Relating the Time-Space Display to Delays and Queues ................................................ 13-12
Chapter 14 – Optimization and Calculations ......................................................................... 14-1 Introduction ....................................................................................................................... 14-1 Optimizations .................................................................................................................... 14-1 Optimize-Intersection Splits .............................................................................................. 14-4 Optimize-Intersection Cycle Length .................................................................................. 14-7 Optimize-Network Cycle Lengths ................................................................................... 14-11 Optimize - Intersection Offsets ........................................................................................ 14-17
Optimize - Network Offsets............................................................................................. 14-18 Coordinatability Factor .................................................................................................... 14-22 Delay Calculations ........................................................................................................... 14-26 Intersection Capacity (ICU) Calculations ........................................................................ 14-41 Stopped Delay vs. Signal Delay ...................................................................................... 14-47 Comparison of Analysis Methods ................................................................................... 14-47 Queue Length Calculation ............................................................................................... 14-70
Stop Calculations ............................................................................................................. 14-75
7/21/2019 Synchro Studio 8 User Guide
http://slidepdf.com/reader/full/synchro-studio-8-user-guide 10/559
x
Fuel and Emissions Calculation ....................................................................................... 14-76
Unserved Vehicles Calculation ........................................................................................ 14-77 Dilemma Zone Vehicles and Safety ................................................................................. 14-78
Chapter 15 – File and Project Management ........................................................................... 15-1 File and Project Management Overview ............................................................................ 15-1 Save As .............................................................................................................................. 15-1 Merge Files ........................................................................................................................ 15-1 Save Part of a File .............................................................................................................. 15-3
Scenario Manager .............................................................................................................. 15-4 Using Synchro with HCS, SimTraffic and CORSIM ........................................................ 15-6 Save to HCS ....................................................................................................................... 15-6 File Extensions ................................................................................................................... 15-8
Chapter 16 – Reports and Printing ......................................................................................... 16-1 Printing Views ................................................................................................................... 16-1 Select Reports Dialog ........................................................................................................ 16-2 Viewing and Printing Reports ............................................................................................ 16-5 Intersection Reports ........................................................................................................... 16-6 Intersection Queue Report ................................................................................................. 16-9 Intersection Capacity (ICU) Report ................................................................................. 16-11 HCM 2000 Signals Report ............................................................................................... 16-16 HCM 2000 Unsignalized Report...................................................................................... 16-19 Arterial Level of Service Report ...................................................................................... 16-21
Network Measures of Effectiveness Reports ................................................................... 16-22 Multi-File Comparison Report ......................................................................................... 16-25 Timing Report - Sorted by Phase Number ....................................................................... 16-28 Actuated Green Times Summary ..................................................................................... 16-29 Actuated Start and Green Times Summary ...................................................................... 16-31 Actuated Phase Details .................................................................................................... 16-33 Permitted Left Turn Factors Report ................................................................................. 16-36
Coordinatability Analysis Report..................................................................................... 16-37 Time Tracker Report ........................................................................................................ 16-39
Chapter 17 – UTDF 2006 Edition .......................................................................................... 17-1 Data Format Support .......................................................................................................... 17-2 Planning a Network for UTDF........................................................................................... 17-3 Reading and Writing UTDF Data ...................................................................................... 17-5 Editing UTDF Data with Other Software .......................................................................... 17-6

7/21/2019 Synchro Studio 8 User Guide
http://slidepdf.com/reader/full/synchro-studio-8-user-guide 11/559
xi
Using TMC Files ............................................................................................................... 17-6
UTDF Specifications ......................................................................................................... 17-7 Minimum Data Necessary to build a Synchro file ........................................................... 17-20
Chapter 18 – Errors and Warnings ........................................................................................ 18-1 Coding Error Messages ..................................................................................................... 18-1 General Coding Errors ....................................................................................................... 18-1 Synchro Errors and Warnings ............................................................................................ 18-1 SimTraffic Errors and Warnings ....................................................................................... 18-9
Chapter 19 – CORSIM Analysis ........................................................................................... 19-1 Synchro with TRAF-NETSIM .......................................................................................... 19-4 Fixing Common CORSIM Errors ...................................................................................... 19-5
Notes on How Synchro Creates a CORSIM Data File ...................................................... 19-6
Chapter 20 – SimTraffic Introduction ................................................................................... 20-1 Introduction ....................................................................................................................... 20-1
SimTraffic Quick Start ...................................................................................................... 20-2
Chapter 21 – SimTraffic Operation ....................................................................................... 21-1 SimTraffic Operation ......................................................................................................... 21-1 Map Settings ...................................................................................................................... 21-5 Map Zooming and Scrolling .............................................................................................. 21-6 Signal status ....................................................................................................................... 21-8 Vehicle Status .................................................................................................................... 21-9
Create a Video in SimTraffic ........................................................................... 21-10 SimTraffic Keyboard Shortcuts ....................................................................................... 21-11
Chapter 22 – SimTraffic Input Data ...................................................................................... 22-1 Input Data .......................................................................................................................... 22-1 Map View Data .................................................................................................................. 22-1
Node Settings ..................................................................................................................... 22-2
Lane Settings Data ............................................................................................................. 22-4 Volume Settings Data ........................................................................................................ 22-7 Timing and Signing Settings Data ..................................................................................... 22-8 Phasing Settings Data ...................................................................................................... 22-10 Simulation Settings .......................................................................................................... 22-11 Detector Settings.............................................................................................................. 22-12 Bends ............................................................................................................................... 22-14 Coding Pedestrians .......................................................................................................... 22-14

7/21/2019 Synchro Studio 8 User Guide
http://slidepdf.com/reader/full/synchro-studio-8-user-guide 12/559
xii
Chapter 23 – SimTraffic Advanced Parameters ..................................................................... 23-1
Advanced Parameters......................................................................................................... 23-1 Intervals and Volume Adjustments .................................................................................... 23-1 Database Access ................................................................................................................ 23-6 Vehicle Parameters ............................................................................................................ 23-8 Driver Parameters ............................................................................................................ 23-10 Calibrating Speeds and Headways ................................................................................... 23-15 Fuel and Emissions Parameters ........................................................................................ 23-18
Controller Interface (CI) Options ..................................................................................... 23-19 Chapter 24 – SimTraffic Reports, Graphics and MOEs ......................................................... 24-1
Reports, Graphics, and MOEs............................................................................................ 24-1 Print Settings ...................................................................................................................... 24-4 Viewing and Printing Reports ............................................................................................ 24-4 Simulation Summary Report .............................................................................................. 24-5 Measures of Effectiveness ................................................................................................. 24-7
Queuing and Blocking Report.......................................................................................... 24-11 Actuated Signals, Observed Splits Report ....................................................................... 24-14 Static Graphics ................................................................................................................. 24-16
Chapter 25 – The SimTraffic Model ...................................................................................... 25-1 The SimTraffic Model ....................................................................................................... 25-1 Traffic Generation and Assignment ................................................................................... 25-1 Car Following and Speed Selection ................................................................................... 25-4
Lane Choice and Lane Changes ......................................................................................... 25-8 Lane Change Applications ............................................................................................... 25-14 Unsignalized Operation ................................................................................................... 25-26 Pre-Timed Signal Operation ............................................................................................ 25-29 Actuated Signal Operation ............................................................................................... 25-31 Delay, Fuel and Emissions Considerations ...................................................................... 25-39
Chapter 26 – 3D Viewer ........................................................................................................ 26-1 Getting Around 3D Viewer ................................................................................................ 26-1 Using 3D Viewer ............................................................................................................... 26-7
Chapter 27 – SimTraffic CI ................................................................................................... 27-1 Setup .................................................................................................................................. 27-1 I/O Mapping ....................................................................................................................... 27-3 Input Data .......................................................................................................................... 27-4
Operation ........................................................................................................................... 27-5

7/21/2019 Synchro Studio 8 User Guide
http://slidepdf.com/reader/full/synchro-studio-8-user-guide 13/559
xiii
Using Overlaps .................................................................................................................. 27-6
Modeling a Diamond Interchange ..................................................................................... 27-7 Index

7/21/2019 Synchro Studio 8 User Guide
http://slidepdf.com/reader/full/synchro-studio-8-user-guide 14/559
xiv
FiguresFIGURE 2-1 MAP VIEW............................................................................................................ 2-1 FIGURE 2-2 SWITCH TOOLBAR POSITION ...................................................................................... 2-2 FIGURE 2-3 LINK MENU OPTIONS ............................................................................................... 2-6 FIGURE 2-4 SELECT BACKGROUNDS SETTINGS ............................................................................. 2-11 FIGURE 2-5 SET BITMAP SCALE AND OFFSET SETTINGS ................................................................. 2-13 FIGURE 2-6 GET MAP DIALOG ................................................................................................. 2-16 FIGURE 2-7 SET SYNCHRO REFERENCE POINT DIALOG .................................................................. 2-17 FIGURE 2-8 SELECT INTERSECTION SETTINGS ............................................................................... 2-20 FIGURE 2-9 FREEWAY MERGE .................................................................................................. 2-29 FIGURE 2-10 FREEWAY DIVERGE ................................................................................................ 2-30 FIGURE 2-11 SYNCHRO MAP SETTINGS ....................................................................................... 2-31 FIGURE 2-12 BACKGROUND VISIBLE IN MAP SETTINGS ................................................................... 2-32 FIGURE 2-13 LOAD DEFAULTS DIALOG ........................................................................................ 2-34 FIGURE 2-14 TIME TRACKER DIALOG .......................................................................................... 2-34 FIGURE 3-1 DATA ENTRY SETTINGS ............................................................................................. 3-1 FIGURE 3-2 FULL VIEW DATA ENTRY, LANES SETTINGS ................................................................. 3-4 FIGURE 3-3 SIDE VIEW DATA ENTRY, LANES SETTINGS .................................................................. 3-5 FIGURE 3-4 WARNING SCREEN .................................................................................................. 3-7 FIGURE 3-5 APPROACH MOVEMENTS .......................................................................................... 3-7 FIGURE 4-1 NODE SETTINGS .................................................................................................... 4-1
FIGURE 4-2 OFFSET REFERENCE ............................................................................................... 4-13 FIGURE 4-3 SINGLE YIELD POINT .............................................................................................. 4-16 FIGURE 4-4 YIELD POINT BY PHASE ........................................................................................... 4-16 FIGURE 5-1 LANE SETTINGS, FULL VIEW ..................................................................................... 5-1 FIGURE 5-2 HIDE NAME IN NODE TITLE ..................................................................................... 5-19 FIGURE 6-1 VOLUME SETTINGS................................................................................................ 6-1 FIGURE 6-2 LINK ORIGIN-DESTINATION VOLUMES SETTINGS .................................................. 6-9
FIGURE 7-1 TIMING SETTINGS.................................................................................................. 7-1 FIGURE 7-2 PHASE TEMPLATE SETTINGS ................................................................................. 7-3 FIGURE 7-3 SPLITS AND PHASING DIAGRAM EXAMPLE .................................................................. 7-16 FIGURE 7-4 GROUP CONTROL EXAMPLE .................................................................................... 7-18 FIGURE 7-5 USE OF OVERLAPS AT A DIAMOND INTERCHANGE ........................................................ 7-30 FIGURE 7-6 CODING OVERLAPS IN SYNCHRO............................................................................... 7-31 FIGURE 7-7 PHASE TEMPLATE .................................................................................................. 7-32
FIGURE 8-1 PHASING SETTINGS ............................................................................................... 8-1

7/21/2019 Synchro Studio 8 User Guide
http://slidepdf.com/reader/full/synchro-studio-8-user-guide 15/559
xv
FIGURE 8-2 RING AND BARRIER DESIGNER ........................................................................... 8-3
FIGURE 8-3 DEFAULT PHASE ASSIGNMENTS IN RING AND BARRIER DESIGNER ..................................... 8-4 FIGURE 8-4 INTERSECTION DIAGRAM WITH RING STRUCTURE .......................................................... 8-4 FIGURE 8-5 CLUSTER EDITOR ................................................................................................ 8-5 FIGURE 8-6 EXAMPLE OF FIXED FORCE OFF ................................................................................ 8-13 FIGURE 9-1 SIMULATION OPTIONS SETTINGS ......................................................................... 9-1 FIGURE 9-2 LANE ALIGNMENT OPTIONS ...................................................................................... 9-3 FIGURE 9-3 LANE ALIGNMENT EXAMPLES .................................................................................... 9-4
FIGURE 9-4 MEDIAN WIDTH EXAMPLES ...................................................................................... 9-5 FIGURE 9-5 LINK OFFSET EXAMPLES ........................................................................................... 9-6 FIGURE 9-6 CROSS WALK WIDTH ............................................................................................... 9-7 FIGURE 10-1 DETECTOR SETTINGS ........................................................................................... 10-1 FIGURE 10-2 DETECTOR TEMPLATE SETTINGS ......................................................................... 10-4 FIGURE 10-3 DETECTOR POSITION ............................................................................................. 10-5 FIGURE 11-1 HCM 2010 AUTO MODE TAB ................................................................................ 11-2
FIGURE
11-2 HCM 2010
A
UTOM
ODEF
ULLS
CREEN .................................................................... 11-2 FIGURE 11-3 HCM 2010 PEDESTRIAN MODE TAB ..................................................................... 11-10
FIGURE 11-4 HCM 2010 PEDESTRIAN MODE FULL SCREEN ......................................................... 11-11 FIGURE 11-5 HCM 2010 PEDESTRIAN MODE CROSSING DIMENSIONS ........................................... 11-13 FIGURE 11-6 HCM 2010 BICYCLE MODE TAB ........................................................................... 11-15 FIGURE 11-7 HCM 2010 BICYCLE MODE FULL SCREEN ............................................................... 11-15 FIGURE 11-8 HCM 2010 ROUNDABOUT MODE FULL SCREEN ...................................................... 11-18 FIGURE 12-1 NETWORK SETTINGS ........................................................................................... 12-1 FIGURE 13-1 TIME-SPACE DIAGRAM ..................................................................................... 13-1 FIGURE 13-2 PARTS OF A TIME-SPACE DIAGRAM .................................................................... 13-2 FIGURE 13-3 TIME-SPACE DIAGRAM OPTIONS ........................................................................ 13-8 FIGURE 14-1 OPTIMIZATION STEPS ............................................................................................ 14-1 FIGURE 14-2 PARTITION NETWORK SETTINGS ....................................................................... 14-10 FIGURE 14-3 OPTIMIZE CYCLE LENGTHS SETTINGS ................................................................ 14-11 FIGURE 14-4 SELECT CYCLE LENGTHS SETTINGS .................................................................... 14-14 FIGURE 14-5 OPTIMIZE NETWORK OFFSETS SETTINGS .......................................................... 14-18 FIGURE 14-6 VEHICLES Q UEUED AT RED LIGHT ........................................................................... 14-30 FIGURE 14-7 DELAY VS. VOLUME ............................................................................................. 14-53 FIGURE 14-8 SPILLBACK ......................................................................................................... 14-54 FIGURE 14-9 STARVATION ...................................................................................................... 14-55 FIGURE 14-10 STARVATION IN TIME SPACE VIEW ...................................................................... 14-58 FIGURE 14-11 STARVATION CAPACITY REDUCTION .................................................................... 14-59

7/21/2019 Synchro Studio 8 User Guide
http://slidepdf.com/reader/full/synchro-studio-8-user-guide 16/559
xvi
FIGURE 14-12 REDUCED STARVATION CAPACITY ....................................................................... 14-60
FIGURE 14-13 SPILLBACK IN TIME SPACE VIEW ......................................................................... 14-61 FIGURE 14-14 STORAGE BLOCKING IN TIME SPACE VIEW (THROUGH TRAFFIC) ................................ 14-63 FIGURE 14-15 STORAGE BLOCKING IN TIME SPACE VIEW (LEFT TURN TRAFFIC) ............................... 14-63 FIGURE 14-16 STORAGE BLOCKING CAPACITY REDUCTION .......................................................... 14-65 FIGURE 14-17 TWO-WAY BANDWIDTH ................................................................................... 14-68 FIGURE 14-18 FLOW LINE DIAGRAM....................................................................................... 14-69 FIGURE 14-19 ARRIVAL DEPARTURE GRAPH ............................................................................. 14-70
FIGURE 14-20 ARRIVAL DEPARTURE GRAPH ............................................................................. 14-75 FIGURE 14-21 DILEMMA ZONE GAP-OUT SHADOW ................................................................... 14-80 FIGURE 15-1 MERGE OPTIONS SETTINGS ................................................................................. 15-2 FIGURE 15-2 SCENARIO MANAGER ....................................................................................... 15-4 FIGURE 16-1 PRINT WINDOW SETTINGS .................................................................................... 16-1 FIGURE 16-2 SELECT REPORTS DIALOG ................................................................................... 16-2 FIGURE 16-3 REPORT PREVIEW ZOOM CONTROL........................................................................... 16-6
FIGURE
16-4 INTERSECTION
REPORTS
......................................................................................... 16-7 FIGURE 16-5 Q UEUES ............................................................................................................ 16-10 FIGURE 16-6 SAMPLE ARTERIAL LEVEL OF SERVICE REPORT ........................................................... 16-22 FIGURE 16-7 NETWORK REPORT OPTIONS ................................................................................. 16-23 FIGURE 16-8 DETAILED MOE REPORT EXAMPLE ......................................................................... 16-25 FIGURE 16-9 DETAILED ALTERNATIVE COMPARISONS ................................................................... 16-27 FIGURE 16-10 DETAILED ALTERNATIVE COMPARISONS EXAMPLE .................................................. 16-27 FIGURE 16-11 SAMPLE TIMING REPORT, SORTED BY PHASE ........................................................ 16-29 FIGURE 16-12 SAMPLE ACTUATED GREEN TIMES REPORT ........................................................... 16-31 FIGURE 16-13 SAMPLE ACTUATED START AND GREEN TIMES REPORT ........................................... 16-33 FIGURE 16-14 SAMPLE ACTUATED PHASE DETAILS REPORT ......................................................... 16-35 FIGURE 16-15 SAMPLE SUPPLEMENTAL WORKSHEET FOR PERMITTED LEFT TURNS REPORT .............. 16-37 FIGURE 16-16 COORDINATABILITY FACTORS REPORT – SAMPLE ................................................... 16-38 FIGURE 16-17 TIME TRACKER REPORT – SAMPLE ...................................................................... 16-39 FIGURE 19-1 CORSIM ANALYSIS DIALOG .................................................................................... 19-3 FIGURE 21-1 SIMTRAFFIC MAP VIEW SETTINGS .......................................................................... 21-5 FIGURE 21-2 SIMTRAFFIC VIDEO RECORDING SETTINGS DIALOG .................................................... 21-10 FIGURE 22-1 MAP DATA .......................................................................................................... 22-2 FIGURE 22-2 TWO LANE EXIT CODING ...................................................................................... 22-10 FIGURE 22-3 PEDESTRIAN PHASE ASSOCIATED WITH THROUGH PHASE ............................................ 22-15 FIGURE 22-4 PEDESTRIAN PHASE ASSOCIATED WITH LEFT PHASE.................................................... 22-15 FIGURE 22-5 PEDESTRIAN PHASE AT A FIVE-LEG INTERSECTION ...................................................... 22-16

7/21/2019 Synchro Studio 8 User Guide
http://slidepdf.com/reader/full/synchro-studio-8-user-guide 17/559
xvii
FIGURE 22-6 PROTECTED PEDESTRIAN PHASE ............................................................................. 22-16
FIGURE 22-7 PEDESTRIAN PHASE WITH PERMITTED LEFT TURN PHASE ............................................ 22-17 FIGURE 22-8 PEDESTRIAN PHASES FOR ONE WAY STREETS ........................................................... 22-18 FIGURE 23-1 INTERVAL PARAMETERS PAGE ................................................................................. 23-2 FIGURE 23-2 DATA OPTIONS PAGE ............................................................................................ 23-7 FIGURE 23-3 VEHICLE OPTIONS PAGE ......................................................................................... 23-9 FIGURE 23-4 DRIVER PARAMETERS PAGE .................................................................................. 23-11 FIGURE 24-1 SIMTRAFFIC SELECT REPORTS DIALOG ................................................................... 24-1
FIGURE 24-2 SIMULATION SUMMARY REPORT.............................................................................. 24-5 FIGURE 24-3 PERFORMANCE REPORT ......................................................................................... 24-7 FIGURE 24-4 ARTERIAL TRAVEL REPORT MOVEMENTS ................................................................. 24-10 FIGURE 24-5 Q UEUE REPORT .................................................................................................. 24-11 FIGURE 24-6 ACTUATED SIGNAL REPORT ................................................................................... 24-14 FIGURE 25-1 VEHICLE TURNING RIGHT FROM LEFT LANE ................................................................ 25-9 FIGURE 25-2 VEHICLE TURNING RIGHT MAKING TWO LANE CHANGES ............................................ 25-10 FIGURE 25-3
VEHICLE MAKING TWO LANE CHANGES .................................................................. 25-11
FIGURE 25-4 FREEWAY OFF-RAMP LANE CHANGE DISTANCES ....................................................... 25-15 FIGURE 25-5 VEHICLE MAKING LATE LANE CHANGES ................................................................... 25-16 FIGURE 25-6 FREEWAY OFF-RAMP LANE CHANGE DISTANCES (THREE-LANE FREEWAY) ..................... 25-17 FIGURE 25-7 LANE DROP AFTER SIGNAL .................................................................................... 25-18 FIGURE 25-8 CONTROLLING LANE UTILIZATION ........................................................................... 25-19 FIGURE 25-9 LONG TURNING BAY EXAMPLE .............................................................................. 25-23 FIGURE 25-10 LANE CHANGE THROUGH MULTIPLE INTERSECTIONS .............................................. 25-24 FIGURE 25-11 LANE POSITIONING EXAMPLE ............................................................................ 25-25 FIGURE 25-12 CORNER POINTS ............................................................................................. 25-36 FIGURE 25-13 STOP BAR POINTS ........................................................................................... 25-37 FIGURE 25-14 RIGHT TURN ISLAND ........................................................................................ 25-38 FIGURE 25-15 ROUNDABOUT ................................................................................................ 25-39 FIGURE 27-1 CI OPTIONS DIALOG .............................................................................................. 27-2 FIGURE 27-2 MAP BUILDER DIALOG ........................................................................................... 27-4

7/21/2019 Synchro Studio 8 User Guide
http://slidepdf.com/reader/full/synchro-studio-8-user-guide 18/559
xviii
TablesTABLE 3-1 FILE COMMANDS ........................................................................................................ 3-9 TABLE 3-2 EDIT COMMANDS ....................................................................................................... 3-9 TABLE 3-3 TRANSFER COMMANDS .............................................................................................. 3-10 TABLE 3-4 OPTION COMMANDS ................................................................................................. 3-10 TABLE 3-5 OPTIMIZE COMMANDS ............................................................................................... 3-11 TABLE 3-6 HELP COMMANDS ..................................................................................................... 3-11 TABLE 4-1 SIGNALIZED INTERSECTION LEVEL OF SERVICE (2010 HCM).............................................. 4-10 TABLE 4-2 TWSC, AWSC AND ROUNDABOUT LEVEL OF SERVICE CRITERIA (2010 HCM) .................... 4-10 TABLE 4-3 LEVEL OF SERVICE CRITERIA FOR ICU ANALYSIS ............................................................... 4-12 TABLE 4-4 REFERENCE POINT WITH MULTIPLE REFERENCE PHASES .................................................... 4-14 TABLE 5-1 ADJUSTMENT FOR LANE WIDTH ..................................................................................... 5-5 TABLE 5-2 LANE UTILIZATION FACTORS .......................................................................................... 5-9 TABLE 5-3 SELECTING A RIGHT TURN TREATMENT .......................................................................... 5-14
TABLE 6-1 SUGGESTED PEAK HOUR VALUES ................................................................................... 6-4 TABLE 6-2 PARKING MANEUVER CODING EXAMPLES ........................................................................ 6-6 TABLE 8-1 PHASE TERMINATION CODES ....................................................................................... 8-14 TABLE 11-1 ROUNDABOUT INTERSECTION LEVEL OF SERVICE (2010 HCM) .................................... 11-20 TABLE 11-1 ROUNDABOUT LANE UTILIZATION (2010 HCM) ....................................................... 11-21 TABLE 11-3 ENTRY HV ADJUSTMENT FACTOR (2010 HCM) ....................................................... 11-22 TABLE 13-1 TIME-SPACE VEHICLES PER LINE ............................................................................... 13-5
TABLE 14-1 OPTIMIZATION COMMANDS .................................................................................... 14-3 TABLE 14-2 ACCEPTABLE CRITICAL PERCENTILE TRAFFIC FOR CYCLE LENGTH ..................................... 14-7 TABLE 14-3 OFFSET OPTIMIZATION OPTIONS ............................................................................ 14-12 TABLE 14-4 COMPARISON ANALYSIS METHOD SUMMARY ........................................................... 14-48 TABLE 14-5 DATA REQUIREMENT BY ANALYSIS METHOD............................................................. 14-48 TABLE 14-6 COMPOUNDING INACCURACIES IN ANALYSIS ............................................................. 14-50 TABLE 14-7 UNCERTAINTIES AFFECT ON ICU ............................................................................ 14-51
TABLE 14-8 UNCERTAINTIES AFFECT ON DELAY ......................................................................... 14-51 TABLE 14-9 UNCERTAINTIES SUMMARY ................................................................................... 14-52 TABLE 14-10 STOP ADJUSTMENT ............................................................................................. 14-76 TABLE 15-1 FEATURES OF THE MAJOR TRAFFIC MODELS ............................................................... 15-6 TABLE 16-1 HEADER/FOOTER OPTIONS ..................................................................................... 16-4 TABLE 16-2 SYNCHRO HCM VS. HCM & HCS DIFFERENCES ....................................................... 16-18 TABLE 16-3 ARTERIAL CLASS .................................................................................................. 16-21
TABLE 17-1 UTDF SUPPORTED FORMATS .................................................................................. 17-3

7/21/2019 Synchro Studio 8 User Guide
http://slidepdf.com/reader/full/synchro-studio-8-user-guide 19/559
xix
TABLE 18-1 SYNCHRO WARNINGS ............................................................................................ 18-1
TABLE 18-2 SYNCHRO ERRORS ................................................................................................. 18-5 TABLE 18-3 SIMTRAFFIC WARNINGS ....................................................................................... 18-10 TABLE 18-4 SIMTRAFFIC ERRORS............................................................................................ 18-10 TABLE 18-5 SIMTRAFFIC FATAL ERRORS .................................................................................. 18-12 TABLE 18-6 SIMTRAFFIC DATA ACCESS ERRORS ........................................................................ 18-12 TABLE 21-1 SIGNAL STATUS DESCRIPTION .................................................................................. 21-8 TABLE 21-2 VEHICLE STATUS DESCRIPTION ................................................................................ 21-9
TABLE 21-3 KEYBOARD SHORTCUTS ........................................................................................ 21-11 TABLE 23-1 Z FACTOR TABLE ................................................................................................... 23-4 TABLE 23-2 YELLOW DECEL RATES BY DRIVER TYPE ................................................................... 23-11 TABLE 23-3 YELLOW REACTION RATES BY DRIVER TYPE .............................................................. 23-12 TABLE 23-4 DEFAULT MANDATORY DISTANCE ADJUSTMENT FACTORS .......................................... 23-13 TABLE 23-5 DEFAULT POSITIONING DISTANCE ADJUSTMENT FACTORS ........................................... 23-14 TABLE 23-6 SATURATION FLOW AND HEADWAYS FOR GIVEN SPEEDS ............................................ 23-16 TABLE 23-7 FUEL AND EMISSIONS DATA FILENAMES .................................................................. 23-18 TABLE 24-1 HEADER AND FOOTER OPTIONS ............................................................................... 24-2 TABLE 25-1 DECEL RATE TABLE ................................................................................................ 25-4 TABLE 25-2 LANE CHANGE DISTANCES .................................................................................... 25-12 TABLE 25-3 DEFAULT LANE CHANGE DISTANCES ....................................................................... 25-12 TABLE 25-4 MAXIMUM TEST DECELERATION ............................................................................ 25-14 TABLE 25-5 CASE (A) DRIVER TYPE DISTANCES.......................................................................... 25-20 TABLE 25-6 CASE (B) DRIVER TYPE DISTANCES .......................................................................... 25-21 TABLE 25-7 CASE (C) DRIVER TYPE DISTANCES .......................................................................... 25-22 TABLE 25-8 REQUIRED GAP TIMES ......................................................................................... 25-29

7/21/2019 Synchro Studio 8 User Guide
http://slidepdf.com/reader/full/synchro-studio-8-user-guide 20/559

7/21/2019 Synchro Studio 8 User Guide
http://slidepdf.com/reader/full/synchro-studio-8-user-guide 21/559
1-1
Chapter 1 – IntroductionIntroduction
Synchro Plus is a complete software package for modeling, optimizing, managing and
simulating traffic systems.
Synchro Plus is a software suite that includes:
Synchro, a macroscopic analysis and optimization program;
SimTraffic, a powerful, easy-to-use traffic simulation software application;
3D Viewer, a three-dimensional view of SimTraffic simulations;
SimTraffic CI, an application that interacts with a controller interface (CI) device
connected to a controller to simulate the operation of the controller with simulated
traffic.
This User Guide includes instructions for using Synchro Plus and details of the internal traffic
models.
The following is a summary of the key features of Synchro Plus.
Capacity Analysis
Synchro implements the Intersection Capacity Utilization (ICU) 2003 method for determining
intersection capacity. This method compares the current volume to the intersections ultimate
capacity. The method is very straightforward to implement and can be determined with a single
page worksheet.
Synchro also implements the methods of the 2000 and newly released 2010 Highway Capacity
Manual. Synchro provides an easy-to-use solution for single intersection capacity analysis and
timing optimization.Synchro includes a term for queue interaction blocking delay. The Total Delay includes the
traditional control delay plus the queue delay. Delay calculations are an integral part of the
optimization objective in Synchro so this will be directly considered.
In addition to calculating capacity, Synchro can optimize cycle lengths, splits and offsets,
eliminating the need to try multiple timing plans in search of the optimum.

7/21/2019 Synchro Studio 8 User Guide
http://slidepdf.com/reader/full/synchro-studio-8-user-guide 22/559
1-2
All values are entered in easy-to-use forms. Calculations and intermediate results are shown on
the same forms.
Coordinate and Optimize
Synchro allows for quick generation of optimum timing plans. Synchro optimizes cycle length,
split times, offsets and phase sequence to minimize driver stops and delay.
Synchro is fully interactive. When input values are changed, the results are updated
automatically. Timing plans are shown on easy to comprehend timing diagrams.
Actuated Signals
Synchro provides detailed, automatic modeling of actuated signals. Synchro can model skipping
and gapping behavior and apply this information to delay modeling.
RoundaboutsSynchro 8 includes the 2010 Highway Capacity Manual (HCM) methods for roundabouts. This
will allow the modeling of 1 and 2 lane roundabouts.
Time-Space Diagram
Synchro has colorful, informative Time-Space Diagrams. Splits and offsets can be changed
directly on the diagram.
Synchro features two styles of Time-Space Diagrams. The bandwidth style shows how traffic
might be able to travel down an entire arterial without stopping. The traffic flow style shows
individual vehicles that stop, queue up, and then go. The traffic flow style gives a much clearer
picture of what the traffic flow actually looks like.
Time-Space Diagrams can be printed using any Settings compatible printer.
The Time-Space Diagrams also display queue interaction issues with color-coded bars near the
intersections.
SimTraffic Simulations
SimTraffic performs micro simulation and animation of vehicle traffic and pedestrians. With
SimTraffic, individual vehicles are modeled and displayed traversing a street network.
7/21/2019 Synchro Studio 8 User Guide
http://slidepdf.com/reader/full/synchro-studio-8-user-guide 23/559
1-3
SimTraffic models signalized and unsignalized intersections as well as freeway sections with
cars, trucks, pedestrians, and busses. Unlike a number of other modeling applications,SimTraffic animation is displayed while the simulation is performed. Data entry is intuitive and
efficient and the same data set created with Synchro can be used to run simulations within
SimTraffic.
3D Animations
SimTraffic can create a 3D file which can be viewed with the Trafficware 3D Viewer. The three
primary modes of the viewer for playback of SimTraffic data in a 3D environment include
scene, ride, and track. The ability to create scenery to enhance the default background is also
available in the 3D Viewer.
Controller Interface (CI)
SimTraffic CI simulates vehicles and detector operations. Detector calls are sent to the controller
via the controller interface (CI) device. The Controller operates as though it has real traffic.Current phase information is returned from the controller to SimTraffic CI through the CI
device.
Data is exchanged between SimTraffic CI and the CI device software 10 times per second.
CORSIM and HCS
Synchro features preprocessors to the CORSIM (TSIS) and HCS (Highway Capacity Software)models.
Synchro data sets can be exported to CORSIM (TSIS) and the HCS to compare measures-of-
effectiveness calculated by each model.
Getting Started and What’s New To get started using Synchro Studio, see the document Getting Started and What’s New in
Version 8. This PDF document can be found in the Trafficware directory where Synchro Studio
was installed (default is C:\Program Files\Trafficware).

7/21/2019 Synchro Studio 8 User Guide
http://slidepdf.com/reader/full/synchro-studio-8-user-guide 24/559

7/21/2019 Synchro Studio 8 User Guide
http://slidepdf.com/reader/full/synchro-studio-8-user-guide 25/559
2-1
Chapter 2 – Map View and LayoutMap View
The MAP view (see Figure 2-1), includes the drawing area and the map information buttons.
The purpose of the drawing area of the MAP view is to create the network of links and nodes.
To activate the MAP view, press the Map View button or the [F2] key from anywhere
in the program. By default, Synchro will show the MAP view when you start theapplication.
Figure 2-1 MAP View
On the right side of the MAP view are the map information buttons. These buttons include the
following:

7/21/2019 Synchro Studio 8 User Guide
http://slidepdf.com/reader/full/synchro-studio-8-user-guide 26/559
2-2
Intersection information (Node Number, Zone, Cycle Length, Delay and LOS),
Movement text (Volumes, Splits, Start of Green(s) or Yellow(s), Volume to CapacityRatio, or Movement Delay).
These are discussed in more detail in the topic Show Information Buttons on page 2-21.
The MAP view also includes map information buttons to show the following:
Intersection Capacity Utilization [ICU]
Show the link distance, speed and travel time on the map [DST]
Show unbalanced flow [VB]
Show the movement phase numbers [Ø]
Show the Level of Service [LOS].
Switch Toolbar Position to Left or RightTo position the toolbar left/right, right click on the toolbar choose the menu Move to Left or
Move to Right.
Figure 2-2 Switch Toolbar Position

7/21/2019 Synchro Studio 8 User Guide
http://slidepdf.com/reader/full/synchro-studio-8-user-guide 27/559
2-3
Introduction to Links and Intersections
Synchro models streets and intersections as links and nodes. These links and nodes are createdin the MAP view. Every intersection to be analyzed in the study area is represented by a node.
Synchro has the ability to create curved links. See the topic on How to Add a Link,
page 2-5.
There are two types of links: internal links and external links. Internal links represent a section
of street between two intersections. External links indicate an approach to an intersection that
does not connect to another signalized intersection.
Bend Nodes
A node with exactly two links is assumed to be a bend node. A bend node is a special case of an
unsignalized intersection. Volume and timing data is not entered for a bend node; however, lane
data can be entered. Synchro assumes the volumes and lanes from the downstream intersection.The number of lanes on a link approaching a bend node can be changed with the LANE settings
(see Chapter 5).
Creating bend nodes can be useful to create a taper (lane add or lane drop) within a link.
Bend nodes are not generally needed for roadway curvature. Synchro has the ability to create
curved links. Right click on the link and choose Add-Curvature (see page 2-6).
If you plan to use your Synchro network for simulation (SimTraffic or CORSIM),
minimize the number of bends that you create. Bend nodes increase the time for
calculations. Excessive bends and short links cause SimTraffic to model vehicles at
slower speeds.
Unsignalized Intersections
Synchro 8.0 models unsignalized intersections based the 2000 Highway Capacity Manuals androundabouts based on the 2010 HCM methods. Input requirements include turning movement
counts, intersection geometry and sign control type for each approach (stop, yield or free flow).
Synchro 8.0 currently models TWSC and AWSC intersections based on the year
2000 HCM and roundabouts based on the 2000 AND 2010 HCM versions. Version
8.1 will add the ability to model TWSC and AWSC with the 2010 HCM.

7/21/2019 Synchro Studio 8 User Guide
http://slidepdf.com/reader/full/synchro-studio-8-user-guide 28/559
2-4
If you are using Synchro to optimize a signal system network, it is not necessary to model
unsignalized intersections. Keep in mind that every intersection added to the network increasesthe computation time.
Unsignalized intersections can be used to model merging and diverging traffic flows from two
or more link segments. In addition, median areas and two-way left-turn lanes can be used to
approximate real world applications encountered in the field.
Unsignalized intersections created in Synchro can be simulated using SimTraffic and exported
to CORSIM (version 5) and the HCS (2000). The analysis of unsignalized intersections withSimTraffic is especially helpful for spotting blocking problems and for observing the interaction
of signalized intersections and unsignalized intersections (stop, yield and roundabout).
Mapping out Links and IntersectionsIt is often helpful to sketch a large network using a photocopy of a detailed map of the study
area. The sketch can be used to record intersection numbers, link distances and speeds and lane
configurations before coding these details in Synchro.
Another option is to import a base map in DXF, GIS, BMP or JPEG format) into Synchro as the
base layer. Links and nodes can then be created on top of the graphic layer. For details, see
Background Images, page 2-10. If you are using accurate basemaps, the distances and angles
can be traced on the basemap.
The steps to mapping out links and intersections are as follows:
1. Identify the intersections to be analyzed.
2. Identify the internal links and determine the length and direction of each link.
Synchro indicates direction by azimuths (North = 0°, East = 90°, South = 180°, etc.).
3. Identify the external links and determine their direction. If using Synchro only, the
length of the external link is not important. If you plan to export the study area to a
microscopic simulation model (SimTraffic or CORSIM), then the length of the
external link should be long enough to allow vehicles to make a downstream
maneuver. While highly dependent on the volume level, an external length of 2000
feet (610 m) typically works well. This should allow vehicles ample time to make
decisions regarding their downstream movement. Increase this length if vehicles
appear to have difficulties getting into their target lane.

7/21/2019 Synchro Studio 8 User Guide
http://slidepdf.com/reader/full/synchro-studio-8-user-guide 29/559
2-5
When drawing a link, the angle is shown in the lower left hand corner of the MAP view. North
is always up (zero degrees). Synchro allows up to eight links per node. Each link is assigned tothe closest compass point heading (North, North-west, North-east, etc.).
Chapter 3 explains how to manually change the approach directions assigned by Synchro when
links are added to the network. However, the user should refrain from changing the assigned
direction as much as possible.
It is not necessary to determine the exact length of the links. It is sufficient to
determine the distance to within 20 or 30 feet (6 to 8 meters). The primary use ofstreet lengths is to determine travel times. A car traveling at 30 mph (50 km/h) covers
20 feet (6 meters) in 0.5 seconds. Traveling time less then 1 second is not significant
for Synchro's offset calculations. To make a link a precise distance, move the node
to an exact coordinate location with the NODE settings (see Chapter 4).
Before changing the geometry of an existing network, back up your data files to a
different location or filename. Changes to network geometric may cause intersectiondata to become lost if an intersection is re-configured, for example.
How to Add a Link
To add a link to the map:
1. Select the Add Li nk button or press the [A] key.
2. Position the mouse cursor on the MAP view where you want the link to start, and
click the left mouse button. The status indicators, at the lower-right corner of the
settings, show the East and South coordinates in feet (meters). Note: To cancel adding
a link, press [Esc].
3. Release the mouse button and move the cursor to the position on the map where you
want the link to end. Click the left mouse button again. Refer to the status bar at the bottom of the settings to see the length and direction of the link.
Press and hold the [Shift] key while drawing to create a link centered on a 45 degree
compass point on the map.

7/21/2019 Synchro Studio 8 User Guide
http://slidepdf.com/reader/full/synchro-studio-8-user-guide 30/559
2-6
It is not necessary to have the exact distance when adding a link. The distance can be adjusted
via the LANE settings. However, new links added to the network should be within 50 feet ofactual link distances to insure accuracy during simulation.
It can sometimes be tricky to create short links because Synchro will snap to a
nearby node. To reduce the snap distance, reduce the Intersection Radius with the
Options MAP View command.
Link Menu OptionsTo access the Link Menu, right click on the link within the MAP View.
Right click on lin k toaccess the Link
Menu
Figure 2-3 Link Menu Options
The new options added in version 8 in the Link Menu include; Street Name Up, Move Street Name, Hide Street Name, Switch Diagram Position and Move Volume Diagram.
Street Name Up
Choose the Street Name Up command to set the street name over or under the current link. If
you move the street name over the link, the menu will read Street Name Down.
7/21/2019 Synchro Studio 8 User Guide
http://slidepdf.com/reader/full/synchro-studio-8-user-guide 31/559
2-7
Move Street Name
Choose the Move Street Name to move the street name along the street. The label or street
name becomes highlighted. When the mouse is placed over this label, it starts following the
motion of the mouse until the left mouse is clicked.
Hide/Show Street Name
Select the Hide Street Name or Show Street Name to hide/show the street name in Synchro
and SimTraffic. The LANE SETTINGS window has corresponding Link Is Hidden checkboxfor each link (street). If the checkbox is checked, the link is not visible.
Switch Diagram Position
Choose the Switch Diagram Position to move the diagram label over or below the current link.
Move Volume Diagram
Selecting the Move Volume Diagram option moves the diagram label along the street. The
label becomes highlighted. When the mouse gets over this label, it starts following the motion of
the mouse until the left mouse is clicked.
Add Curvature
Synchro allows users to add curvature to link segments using Bezier curves which are
commonly found in CAD and drawing packages. Bezier curves can be used to approximate any
curvature represented on the base drawing.
Simply right-click on a straight link segment and select Add-Curvature. Two squares (curve
points) will appear on the curved links which serve as control points. Select and drag a control
point to modify the shape of the curve. With a little practice, you can create smooth arcs and
curves that represent any geometry found in your street network.
Synchro will calculate the length of the curve. It should be possible to create a 270 degree loop
ramp using 2 links with one bend node. Most other alignments should be possible with a single
segment. The curvature can be removed by "right clicking" on the link and selecting Remove-
Curvature. If two links are joined because an intersection is removed, the links will lose their
curvature. The direction of traffic at the intersection (i.e., NB, EB, NE, …) is determined by the
7/21/2019 Synchro Studio 8 User Guide
http://slidepdf.com/reader/full/synchro-studio-8-user-guide 32/559
2-8
direction of the first control point, rather than the direction of the next node. This can be used to
increase the angle between diagonals at the intersection.
The curve points must be placed after any tangents from a right turn Island,
otherwise image distortion will occur.
How to Add an Intersection
There is no direct command to add an intersection to the map. Intersections are created
automatically when you insert a link that crosses an existing link in the network. Simply, insert
a new link over an existing link at the center of the intersection you wish to add to the network.
The existing link will be broken into two link segments at the intersection.
Intersections cannot be created from curved links. Therefore, create intersections from straight
link segments and then add curvature to the links using Bezier curves.
Press and hold the [Ctrl] key while drawing to create a link that is grade separated.
No intersection is created where the links cross.
How to Draw Closely Spaced Intersections
When adding a link, Synchro will attempt to connect the link to nearby existing points. Make the
nodes at least 100 feet (33m) apart and then move them closer together.
If you are using this file with SimTraffic, your nodes must be at least 70 ft apart. If
you are using this file with CORSIM, your nodes must be at least 50 ft apart.
How to Delete a Link
To remove a link from the map:
1. Select the link by clicking on it with the left mouse button. Half the link will becomehighlighted.
2. Select the Delete L ink button or press the [Delete] key.
3. Select [Yes] to the question, "Delete Link, are you sure?"

7/21/2019 Synchro Studio 8 User Guide
http://slidepdf.com/reader/full/synchro-studio-8-user-guide 33/559
2-9
The link will be removed from the screen. If the link was connected to an intersection with only
two links, that intersection will be removed as well.
How to Delete an Intersection
To remove an intersection from the map:
1. Select the intersection by clicking on it with the left mouse button. The node will
become highlighted.
2. Select the Delete Node button or press the [Delete] key.
3. Answer [Yes] to the question, "Delete Intersection, are you sure?"
Any through links going through this intersection will be joined together. Any other links going
to adjacent intersections will be shortened to preserve data at adjacent intersections. Any joined
links will be redrawn.
How to Move an Intersection or External Node
To move an intersection or external node on the map:
1. Select the Move Node button or press the [M] key.
2. Select an intersection, or the end of an external link, by clicking on it with the leftmouse button. Note: You can cancel a move operation by pressing [Esc], or by
clicking the original intersection location.
3. Drag the intersection, or node, to the new location and click the left mouse button.
If an external node is moved onto another external node, the two nodes will be combined as a
new intersection. However, existing intersections cannot be combined with other intersections
or external nodes.Synchro automatically assigns lane groups that agree with the layout of the network. Therefore,
it is possible that a realigned links forces Synchro to adjust the lane group assigned to the link.
For example, if the relative angle between two links is changed from 180º to 90º, there will no
longer be a through lane group for these links. Synchro preserves the lane group data. If a
movement changes from NBL to NBT, for example, the data for NBL will be transferred to
NBT.
7/21/2019 Synchro Studio 8 User Guide
http://slidepdf.com/reader/full/synchro-studio-8-user-guide 34/559
2-10
To move to exact coordinates, see the topic on Node Coordinates on page 4-4.
Background ImagesSynchro supports importing multiple images at the same time for the map background. The file
types supported include:
DXF, CAD vector file. In version 7 and later, the DXF file is referenced as an external
file and not embedded in the Synchro file (*.syn).
When a version 6 or earlier file with a DXF file is opened, you will be prompted to
save the DXF as an external file. When this DXF file is saved as an external file,
some irregularities in the saved DXF may appear. It is suggested to import the
original DXF file instead of saving out the DXF from the old Synchro file.
SHP, GIS shape files. The shape files come with supporting index files and must be
kept together in the same directory. The user will have the option to set the color of the
shape file.
SID, GIS bitmap files. Synchro uses MrSID Decode from www.lizardtech.com to
convert SID files from GIS to JPEG format (see next section).
JPG, JPEG, BMP, bitmap files.
The background image can be a combination of any of the listed file types.
JPEG is preferred to BMP due to compression. The JPEG format allows only part of
the file to be loaded when zoomed out.
Select Backgrounds settings
To add, remove, or adjust backgrounds; select FileSelect Background as shown in Figure
2-4.
If no files are attached, the user is prompted for a file or multiple file(s). The files can have the
extension JPG, JPEG, BMP, DXF, or SHP as defined above.
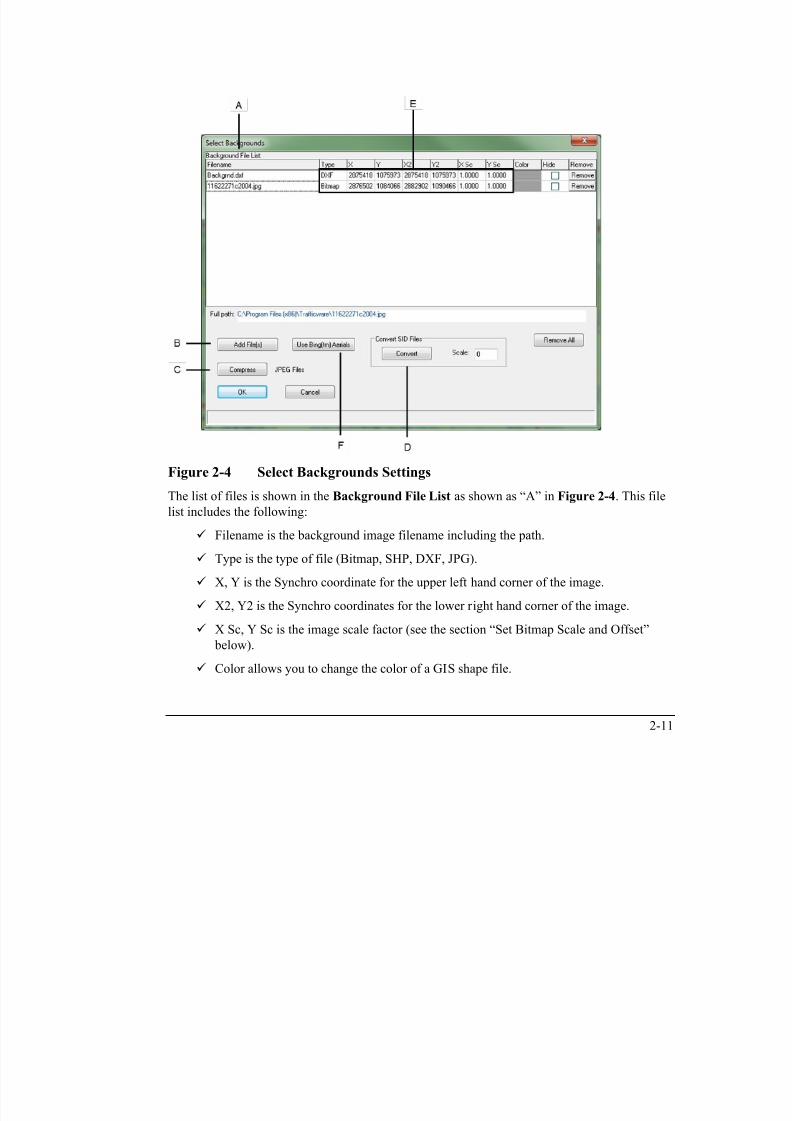
7/21/2019 Synchro Studio 8 User Guide
http://slidepdf.com/reader/full/synchro-studio-8-user-guide 35/559
2-11
Figure 2-4 Select Backgrounds Settings
The list of files is shown in the Background File List as shown as “A” in Figure 2-4. This file
list includes the following:
Filename is the background image filename including the path.
Type is the type of file (Bitmap, SHP, DXF, JPG).
X, Y is the Synchro coordinate for the upper left hand corner of the image.
X2, Y2 is the Synchro coordinates for the lower right hand corner of the image.
X Sc, Y Sc is the image scale factor (see the section “Set Bitmap Scale and Offset”
below).
Color allows you to change the color of a GIS shape file.

7/21/2019 Synchro Studio 8 User Guide
http://slidepdf.com/reader/full/synchro-studio-8-user-guide 36/559
2-12
Hide will hide the background image when checked.
Remove will remove the image from the background.
Use the [Add File(s)] button (“B” in Figure 2-4) to select one or more files. Read the topic on
Importance of Memory Footprint on page 2-14).
The [Compress] JPEG Files button (“C” in Figure 2-4) will prompt you for JPEG files. The
selected files will be loaded and resaved with higher compression, but less quality.
Warning
This function will alter your existing JPG files and reduce the image quality. Usethis feature to reduce the file size of background bitmaps. You cannot undo this
command.
The Convert SID files area (“D” in Figure 2-4) provides access to the MRSIDDECODE.EXE,
freeware utility. This is an unsupported DOS tool to help convert SID files into JPG. Select one
or more SID files, a jpg and jgw file will be created with the same base name as the SID file.
The jgw file is a text file that contains coordinate and scaling information. Synchro reads this to
automatically set the scale for converted SID files.
The Scale setting can be used to reduce the scale and size of the converted files; 0 full size, 1
half size, 2 quarter size, 3 1/8 size. Set this number before clicking convert. The resulting JPG
must be less than 50M. If the source file is large, use the following scales:
Size of SID File Use this scale
>200M 3>100M 2
>40M 1
<=40M 0
Use the [Remove all] button to remove all files from list.
Set Bitmap Scale and Offset
When loading a bitmap file (bmp or jpg) it is necessary to set the scale and base point. From the
Select Background settings, double click the scale settings (are outlined as “E” in Figure 2-4)
to set the bitmap scale and offset. The SET BITMAP SCALE AND OFFSET settings will
appear as shown in Figure 2-5.
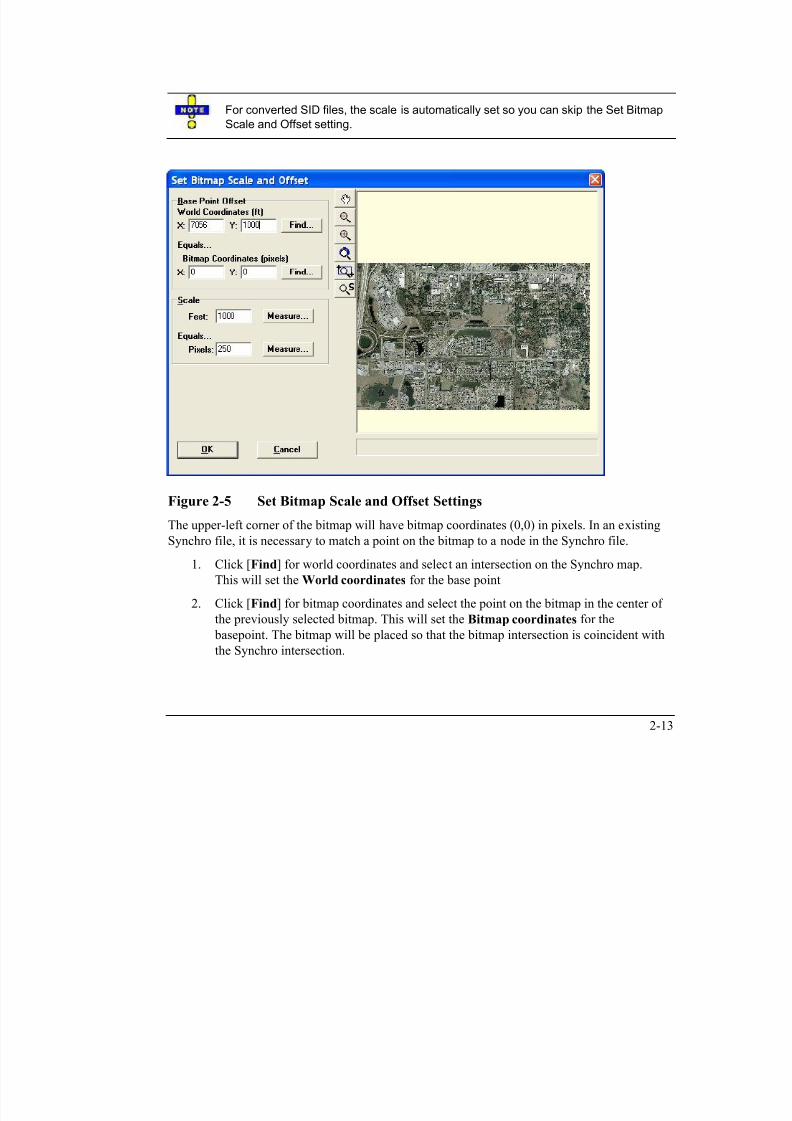
7/21/2019 Synchro Studio 8 User Guide
http://slidepdf.com/reader/full/synchro-studio-8-user-guide 37/559
2-13
For converted SID files, the scale is automatically set so you can skip the Set Bitmap
Scale and Offset setting.
Figure 2-5 Set Bitmap Scale and Offset Settings
The upper-left corner of the bitmap will have bitmap coordinates (0,0) in pixels. In an existing
Synchro file, it is necessary to match a point on the bitmap to a node in the Synchro file.
1. Click [Find] for world coordinates and select an intersection on the Synchro map.
This will set the World coordinates for the base point
2. Click [Find] for bitmap coordinates and select the point on the bitmap in the center of
the previously selected bitmap. This will set the Bitmap coordinates for the
basepoint. The bitmap will be placed so that the bitmap intersection is coincident with
the Synchro intersection.
7/21/2019 Synchro Studio 8 User Guide
http://slidepdf.com/reader/full/synchro-studio-8-user-guide 38/559
2-14
It is necessary to set the scale of the map. To help set the scale, Synchro allows you to measure
distances on the bitmap and in an existing Synchro map.1. Click [Measure] for Feet (or Meters) and select the first point on a link of known
length. Within a new file, simply type in the distance of a known street length.
2. Click on the second point of the Synchro point with known length. This will set N in
the formula, N feet per M pixels.
3. Click [Measure] for Pixels and select the starting point of the same link on the
bitmap.
4. Click on the second link point on the bitmap. This will set M in the formula N feet per
M pixels.
Importance of Memory Footprint
It is very important to keep the size of the files used as small as possible. All of the bitmaps andother files are loaded into RAM and accessed whenever the map view changes.
Keep the total size of backgrounds under 100M or 10% of computer‟s RAM. The limit in
Synchro is 200M; this is to prevent a lockup of your computer from overuse of memory.
Some tips to keeping the background file sizes small.
Use JPEG, not Bitmap, JPEG is compressed, and optimized for viewing when zoomed
out.
Use the scale factor when converting SID to JPEG.
Load files in a Picture editor such as Microsoft Photo Editor or Adobe Photo Shop,
resave with compression on high, and image quality low. Set off network areas to a
single color. For extremely large files, resize the image to ½ size or ¼ size.
Remove tiled bitmaps that are not part of the street network.

7/21/2019 Synchro Studio 8 User Guide
http://slidepdf.com/reader/full/synchro-studio-8-user-guide 39/559
2-15
Using Bing™ to Add a Background Image
Synchro 8 now allows you to import images dir ectly from Bing™. This feature will greatlyassist in importing internet based images and ensuring that the scaling is appropriate. It will also
be useful to create a mosaic of images that will properly align. You can hide/unhide images of
interest to help keep the PC memory footprint reasonable. To use this option, an internet
connection must be available during the import (not necessary after the image is captured).
In a new or existing Synchro file, use the command select FileSelect Background (see
Figure 2-4) and select the Use Bing ™ Aerials button (button “F” in Figure 2-4).
After selecting the Use Bing™ Aerials button, there is a new window Get Map dialog (see
Figure 2-6) that uses Bing™ (aka Virtual Earth) to:
navigate the world map,
set the reference between the map and the Synchro file by setting a pair of reference
points on the Bing™ map and the Synchro file,
choose area boundaries and save the image to a bitmap,
add the selected image as the Synchro background.
To navigate the map to find a desired location, you may use pan and zoom, type an address or
enter the name of a place of interest in the search input line and conduct the search.

7/21/2019 Synchro Studio 8 User Guide
http://slidepdf.com/reader/full/synchro-studio-8-user-guide 40/559
2-16
Get Map Dialog Options
Bing(tm) Pan andZoom controls
Enter streetaddress or place
of interest to zoomto location
A B C D E F
Figure 2-6 Get Map Dialog
Set Reference
After pressing Set Reference menu (“A” in Figure 2-6), click the mouse on the Bing™ map to
choose a reference point. You will see a pushpin on the selected point followed by a Set
Synchro Reference Point window. Select a corresponding point on the Synchro MAP View or to
manually enter a World Coordinate (see Figure 2-7). The Map and Synchro points will denote
the same geographic point to tie the world map to the Synchro coordinates.
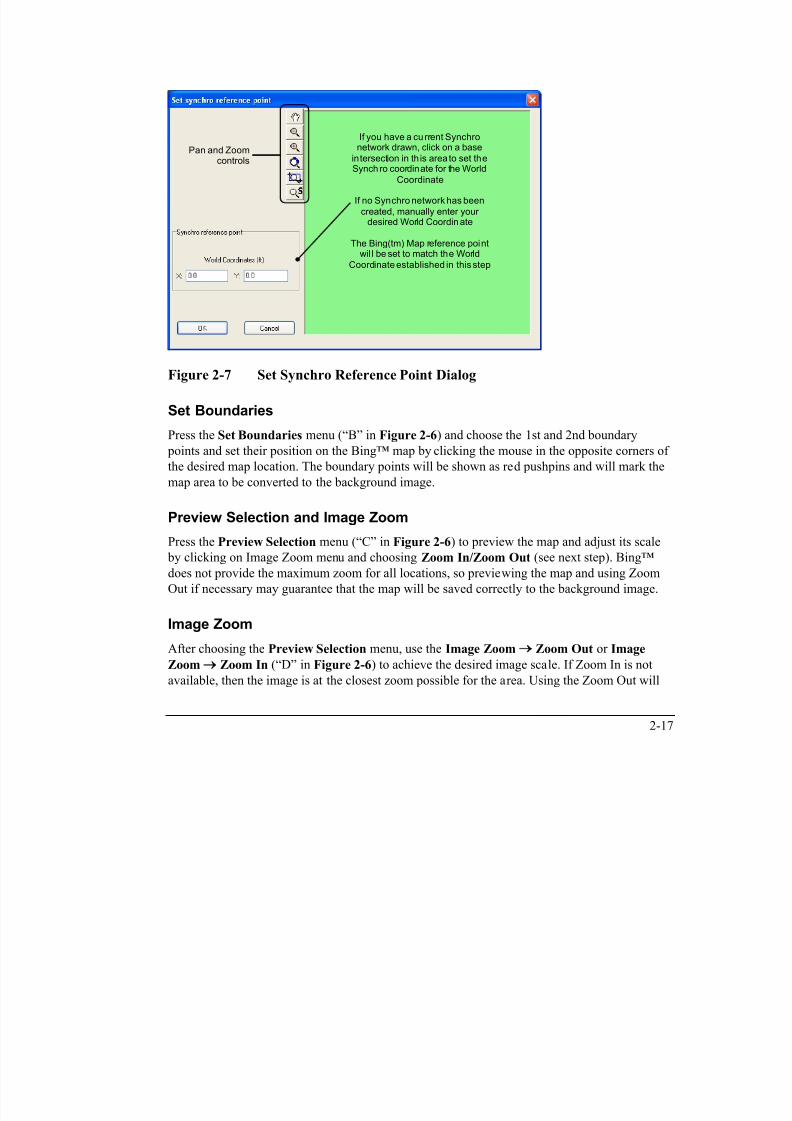
7/21/2019 Synchro Studio 8 User Guide
http://slidepdf.com/reader/full/synchro-studio-8-user-guide 41/559
2-17
Pan and Zoomcontrols
If you have a current Synchronetwork drawn, click on a base
intersection in th is area to set theSynchro coordinate for the World
Coordinate
If no Synchro network has been
created, manually enter yourdesired World Coordinate
The Bing(tm) Map reference pointwil l be set to match the World
Coordinate established in this step
Figure 2-7 Set Synchro Reference Point Dialog
Set Boundaries
Press the Set Boundaries menu (“B” in Figure 2-6) and choose the 1st and 2nd boundary
points and set their position on the Bing™ map by clicking the mouse in the opposite corners of
the desired map location. The boundary points will be shown as red pushpins and will mark themap area to be converted to the background image.
Preview Selection and Image Zoom
Press the Preview Selection menu (“C” in Figure 2-6) to preview the map and adjust its scale
by clicking on Image Zoom menu and choosing Zoom In/Zoom Out (see next step). Bing™
does not provide the maximum zoom for all locations, so previewing the map and using ZoomOut if necessary may guarantee that the map will be saved correctly to the background image.
Image Zoom
After choosing the Preview Selection menu, use the Image Zoom Zoom Out or Image
Zoom Zoom In (“D” in Figure 2-6) to achieve the desired image scale. If Zoom In is not
available, then the image is at the closest zoom possible for the area. Using the Zoom Out will

7/21/2019 Synchro Studio 8 User Guide
http://slidepdf.com/reader/full/synchro-studio-8-user-guide 42/559
2-18
give a lower resolution (quality) image, however the file size will be reduced. If you use the
highest quality (fully zoomed in) option, the file size of the image will be higher and it will take
longer to download the image(s).
Save Selection
Select the Save Selection menu (“E” in Figure 2-6) to save the selected map area to a single
JPG or multiple JPG files. There may be certain restrictions to the size of a single image file, so
saving to the multiple files allows one to create a background for a bigger map area. The
program automatically creates a folder with a set of the multiple image files to cover theselected background image.
Show Map
The Show Map menu (“F” in Figure 2-6) will return to the Bing™ world map to select a
different area to be converted to the background image.
Zooming and ScrollingTo scroll around the MAP view, choose the Pan button or press the [End] key. To
deactivate, select the button again or press [Esc]. In addition, holding the mouse
wheel button down will allow you to drag the map.
The Pan button replaces the option to scroll when the mouse is moved to the edge of
the Map in older versions of Synchro. Using the key pad arrows still scrolls the Map
view even if the Pan button is not selected.
To view more of the map, choose the Zoom Out button or press [Page Up]. The
mouse scroll wheel can also be used to change the map view scale. Scrolling up will
zoom out and scrolling down will zoom in.
To view the entire map, choose the Zoom All button or press [Home].
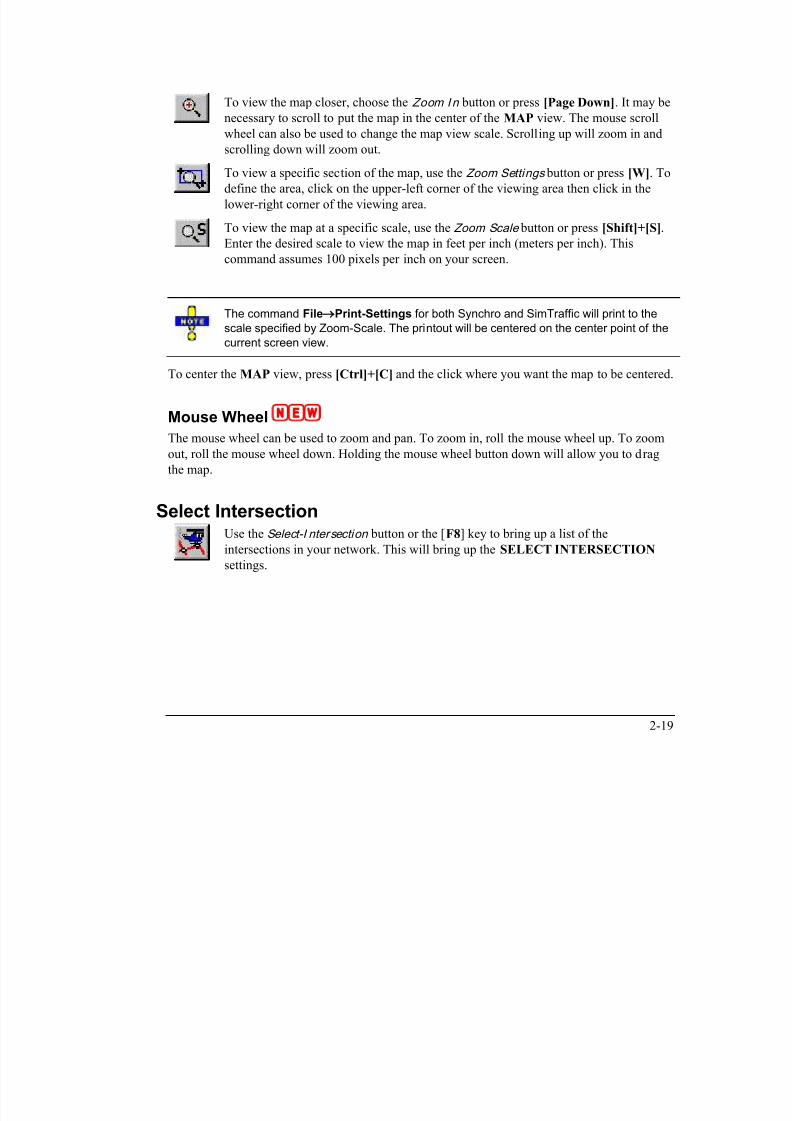
7/21/2019 Synchro Studio 8 User Guide
http://slidepdf.com/reader/full/synchro-studio-8-user-guide 43/559
2-19
To view the map closer, choose the Zoom In button or press [Page Down]. It may be
necessary to scroll to put the map in the center of the MAP view. The mouse scroll
wheel can also be used to change the map view scale. Scrolling up will zoom in and
scrolling down will zoom out.
To view a specific section of the map, use the Zoom Settings button or press [W]. To
define the area, click on the upper-left corner of the viewing area then click in the
lower-right corner of the viewing area.
To view the map at a specific scale, use the Zoom Scale button or press [Shift]+[S].
Enter the desired scale to view the map in feet per inch (meters per inch). This
command assumes 100 pixels per inch on your screen.
The command File
Print-Settings for both Synchro and SimTraffic will print to the
scale specified by Zoom-Scale. The printout will be centered on the center point of the
current screen view.
To center the MAP view, press [Ctrl]+[C] and the click where you want the map to be centered.
Mouse Wheel
The mouse wheel can be used to zoom and pan. To zoom in, roll the mouse wheel up. To zoom
out, roll the mouse wheel down. Holding the mouse wheel button down will allow you to drag
the map.
Select IntersectionUse the Select-I ntersection button or the [F8] key to bring up a list of the
intersections in your network. This will bring up the SELECT INTERSECTION
settings.

7/21/2019 Synchro Studio 8 User Guide
http://slidepdf.com/reader/full/synchro-studio-8-user-guide 44/559
2-20
Figure 2-8 Select Intersection Settings
Choosing an intersection from the list and pressing [OK] will switch the current settings to that
intersection. The MAP view will be centered on the selected intersection.
The SELECT INTERSECTION setting is used to select whether intersections or named
arterials are displayed. The intersections can be listed by name or node number. All nodes,
including bends and external nodes, can be listed by node number.
Selecting a named arterial will bring up a Time-Space diagram showing the arterial. The Named
Arterial view can show part of an arterial based on its name, zone, or route #. The Named
Arterial view can also show an arterial that turns corners. See the topic Arterial Route Naming
on page 5-7.
The Scope box can be used to view the list by a named zone or for the entire network.
Intersection and Link ButtonsThe buttons below the zooming and scrolling buttons are used to create, delete and move links
and nodes. There is alos a button used to transform the Map. The buttons available are listed
below.
7/21/2019 Synchro Studio 8 User Guide
http://slidepdf.com/reader/full/synchro-studio-8-user-guide 45/559
2-21
Select the Add L ink button or press [A] to create a link on the MAP view. Refer to
page 2-5 for additional details.
Select the Delete L ink button or press [Del] to delete the selected link. Refer to page
2-8 for additional details.
Select the Lane Settings button or press [Enter] to enter LANE settings for the
selected link. The side view data window will be displayed. Refer to page 3-4 and
page 5-2 for additional details.
Select the Move Node button or press [M] to move a node. Refer to page 2-9 foradditional details.
Select the Delete Node button or press [Del] to delete the node. Refer to page 2-9 for
additional details.
Select the Transform Map button to change the network node coordinate, rotate the
map or to enter a scaling factor. Refer to page 2-32 for additional details.
Show Information ButtonsThe buttons on the right side of the MAP view can be used to show information on the MAP
view. The information buttons available are listed below.
Show Intersection Delays
Select the Show I ntersection Delays button or press [Shift]+[D] to display theintersection delay for each intersection. This is the Intersection Delay shown in the
TIMING settings (see Chapter 7).
Show Levels of Service
Select the Show Levels of Service button or press the [O] key to display the
intersection LOS for each intersection. This is the Intersection Level of Service shown in the TIMING settings.
7/21/2019 Synchro Studio 8 User Guide
http://slidepdf.com/reader/full/synchro-studio-8-user-guide 46/559
2-22
Show Cycle Lengths
Select the Show Cycle Lengths button or press the [C] key to display the currentcycle length for each intersection. This is the Cycle Length shown in the TIMING
settings. Unsignalized intersections will be displayed with a „U‟.
Show Natural Cycle Lengths
Select the Show Natur al Cycle Lengths button or press the [N] key to display the
natural cycle length for each intersection. This is the Natural Cycle Length shown in
the TIMING settings. Unsignalized intersections will be displayed with a „U‟.
Show Intersection Capacity Utilization
Select the Show Intersection Capacity Uti li zation button to display the intersections‟
capacity utilization for each intersection. This is the Intersection Capacity
Utilization shown in the TIMING settings.
Show Coordinatability Factor
Select the Show Coordinatabil ty Factor button to display the coordinatability factor
for each link. For further details, see the topic on Coordinatabilty Factors on page
14-22.
Show Natural Coordinatabiltity FactorSelect the Show Natural Coordinatabil ty Factor button to display the
coordinatability factor for each link. For further details, see the topic on
Coordinatabilty Factors on page 14-22.
Show Node Numbers
To see the node numbers press the Show Node Numbers button or the [#] key. Nodenumbers can be changed with the NODE settings (see Chapter 4).
Show Locked Timings
Select the Show Locked Timings button to display the intersections with locked
timings. This is the Lock Timings field shown in the TIMING settings.

7/21/2019 Synchro Studio 8 User Guide
http://slidepdf.com/reader/full/synchro-studio-8-user-guide 47/559
2-23
Show Zones
To see the zone names press the Show I ntersection Zones button or the [Z] key.Zone names can be changed with the NODE settings. Zone names can include any
letter or number up to seven characters.
Show Volume Balancing
Select the Show Volume Balancing button to display the unbalance of traffic
volumes between intersections. The map can be printed (File Print-Settings) to
view the volume unbalance. This can be used in conjunction with volume diagrams
for quick editing adjustments. The information is directional, with the incoming
volume located on the right side of the link, closest to the downstream intersection.
Also, see coding errors 100, 101 and 206 (page 18-1).
Volume Diagrams
To show volumes on the map, select the Show Volumes on Map button to the left ofthe MAP view or press the [V] key.
Show Link Distance, Speed and Travel Time
Select the Show L ink Distance, Speed and Travel T ime button or press the [T] key
to show link distance, speed and travel time on the MAP view. Double clicking on
the diagram brings up side view settings. The diagrams will be included on bend and
external links.
Show Start of Greens, Start of Yellow
To see progression quality, press the Show Start of Greens button or press the [G]
key. This option shows the beginning of green time for each movement. The
intersection cycle length is also shown. This display shows progression numerically.
For permitted plus protected movements, the start of the protected green is shown.For actuated signals, the start is based on maximum green times. Double clicking on
the diagram opens the TIMING settings.

7/21/2019 Synchro Studio 8 User Guide
http://slidepdf.com/reader/full/synchro-studio-8-user-guide 48/559
2-24
The Show Start of Yel low Times button shows the beginning of yellow time for each
movement. The intersection cycle length is also shown. This display shows
progression numerically. For permitted plus protected movements, the end of the
protected green is shown. For actuated signals, the end is based on maximum green
times. Double clicking on the diagram opens the TIMING settings. and brings you to
the Total Split row.
Show Maximum Green Times
Select the Maximum Green Times button to show the maximum green time for each phase in seconds. The intersection cycle length is also shown. This display shows
green times in a map format. For permitted plus protected movements, only the
protected greens are shown. For actuated signals, the time shown is based on
maximum green times. Double clicking on the diagram opens the TIMING settings.
Show Volume to Capacity Ratios
Select the Show Volume to Capacity Ratios button to display the volume to capacity
ratios for each movement. The v/c ratios are based on average green times. The v/c
ratios DO NOT show problems with defacto turning lanes. This display can be used
to quickly identify capacity problems. Double clicking on the diagram opens the
TIMING settings.
For unsignalized intersections, this is the volume to capacity for the movement. Unlike signals,
the v/c ratio is the maximum for the movement, not lane group. See the Highway Capacity
Manual (HCM) Unsignalized report for more details about the capacity and delays by lane.
Show Movement Delays
Select the Show M ovement Delays button or press the [D] key to display the delay
for each movement. The delay shown will be the Control Delay (see page 7-25).
Double clicking on the diagram opens the TIMING settings.
For unsignalized intersections, the delay is shown for the movement. Unlike signals, the delay is
for the movement, not lane group. A value of 9999 indicates no capacity is available. See the
HCM Unsignalized report for more details about the capacity and delays by lane.
7/21/2019 Synchro Studio 8 User Guide
http://slidepdf.com/reader/full/synchro-studio-8-user-guide 49/559
2-25
Movement delays are not displayed for roundabouts using this method.
Show Phase Numbers
Select the Show Phase Numbers button or press the [P] key to show phase numbers
for each movement. Permitted phases are shown in parenthesis ( ). Clicking on the
diagram opens the TIMING settings and brings you to the Protected Phases row.
Show Lane Arrows on Map
Select the Show Lane Ar rows on Map button or press the [L] key to show the lanes
for each movement. Stick diagram arrows will be shown on the right side of the
approach.
Show Movement Level of Service
Select the Show M ovement L evel of Service button to display the movement LOS for
each intersection. This is the Movement Level of Service shown in the TIMING
settings.
Hide Information
To hide the information, select the No Map I nformation [space] or No Movement
Text buttons or press [Shift]+[space].
The displayed volumes are adjusted for growth factor (from the VOLUME settings but
not for peak hour factor).
Use the File Print-Settings command to print the MAP view with the lane and/or volume
diagram.
MAP Vi K b d C d

7/21/2019 Synchro Studio 8 User Guide
http://slidepdf.com/reader/full/synchro-studio-8-user-guide 50/559
2-26
MAP View Keyboard Commands
Change Map View CommandsZoom All [Home]
Zoom In [Page Down]
Zoom Out [Page Up]
Zoom Settings [W], [Shift]+[W], [Ctrl]+[W]
Zoom Scale [Shift]+[S]
Zoom Previous [Ctrl]+[BkSpace]
Zoom Center [Ctrl]+[C]
Scroll Map [] [] [] []
Page Map [Ctrl]+[] [] [] []
Link and Intersection Commands
Delete Intersection [Delete]
Delete Link [Delete]
Add Link [A]
Move Intersection [M]
Link Settings [Enter]
Cancel Add or Move
[Esc] or [Space]
Intersection Information Commands
No Intersection Information [Space]
Show Cycle Lengths [C] A indicates actuated signal, U indicates unsignalized
Show Natural Cycle Length [N]
Show Zones [Z] Show Intersection Delays [Shift]+[D]
Show Intersection Level of
Services [O]
Node Settings [Enter]
Show Node Numbers [#]
7/21/2019 Synchro Studio 8 User Guide
http://slidepdf.com/reader/full/synchro-studio-8-user-guide 51/559
2-27
Show Volume Diagram [V]
Movement Text Commands
Movement Volumes [V]
Show Link Distance, Speed and
Travel Time [T]
Movement and Intersection Delays [D]
Show Starts of Green
[G]
Show Starts of Yellow [Y]
Show Split Times [S]
Show Volume to Capacity [X]
Show Movement Phase Numbers [P]
Select Intersection CommandsSelect Next Intersection to SW [1]
Select Next Intersection to S [2]
Select next intersection to SE [3]
Select next intersection to W [4]
Select next intersection to E [6]
Select next intersection to NW [7] Select next intersection to N [8]
Select next intersection to NE [9]
File UnitsUse the Options Convert-to-Metric command or the Options Convert-to-Feet command
to change the units used for the current file.
Convert to English
Select Options Convert-to-Feet command to convert your file to use feet and miles per hour.
Convert to Metric

7/21/2019 Synchro Studio 8 User Guide
http://slidepdf.com/reader/full/synchro-studio-8-user-guide 52/559
2-28
Convert to Metric
Select Convert to Metric command to convert your file to use meters and kilometers per hour.
When changing file units, any map background is discarded. You will have to
convert your source DXF file to the new units and re-import it.
Map coordinates are scaled by 3.28 about the point (0,0).
Speeds, storage lengths, widths, and other values are similarly converted.
Each file has its own File Units setting. New files are created based on the units specified in the Regional and Language Options. To change the Regional Settings, go to the Control Panel and
select Regional and Language Options.
Drawing Features
Freeway LinksFreeways can be coded for simulation with SimTraffic using the same links and nodes as surface
streets and intersections. Each direction of the freeway can be coded with a one-way link or as a
single link with a wide median. For setting the median width, see the discussion on Median
Width on page 9-4.
Freeways typically have higher speeds and flow rates than signalized intersections. You can set
freeway link speeds and headway factors using the LANES and SIMULATION options(double click on the link to access these settings). When you set the default Saturation Flow
(see page 5-11) for the link, the Headway factor (see page 9-8) will be automatically calculated.
Freeway Merges
Figure 2-9 shows a freeway merge in SimTraffic. Here are the steps to creating a freeway
merge.
1. The merge point is a 3-legged unsignalized intersection.
2. Create a bend node 200 to 1000 ft downstream of the merge. The acceleration lane
will end here. The distance from the merge to the lane drop should represent the
acceleration lane distance or the distance to where the taper is less than 1/2 of a lane
width.
3 Select the LANE settings for the acceleration link Code the number of lanes equal to
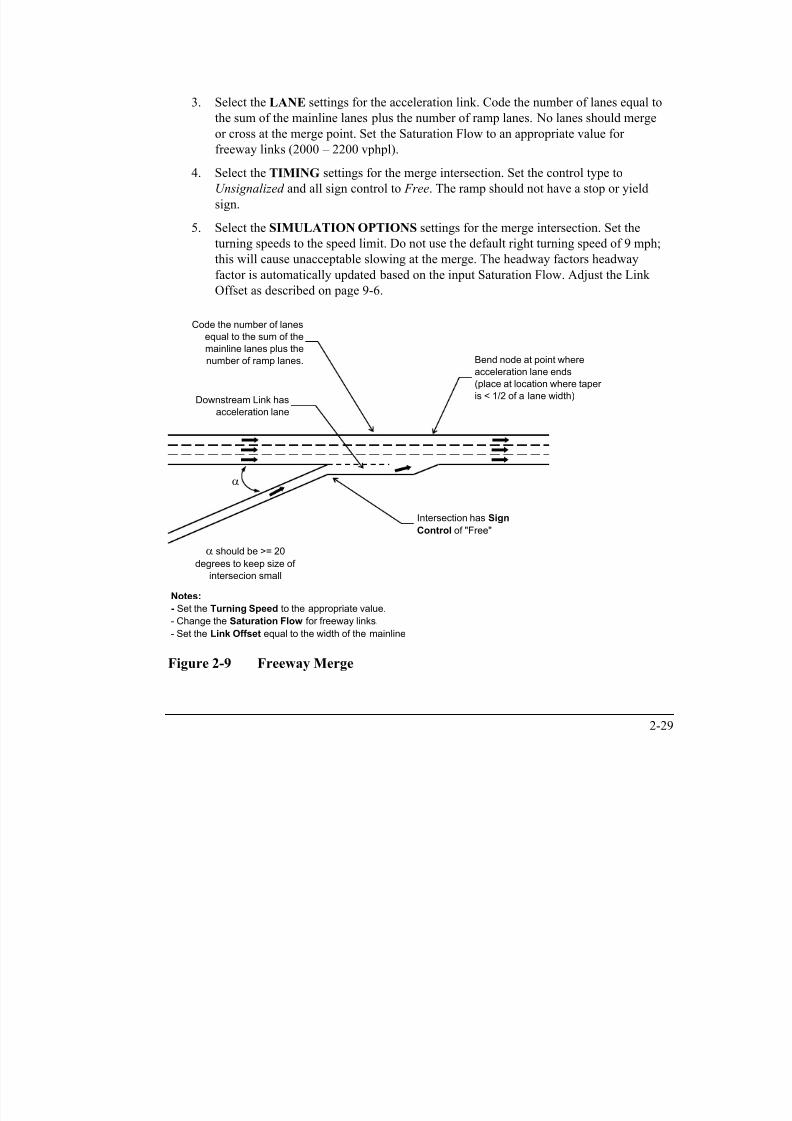
7/21/2019 Synchro Studio 8 User Guide
http://slidepdf.com/reader/full/synchro-studio-8-user-guide 53/559
2-29
3. Select the LANE settings for the acceleration link. Code the number of lanes equal to
the sum of the mainline lanes plus the number of ramp lanes. No lanes should merge
or cross at the merge point. Set the Saturation Flow to an appropriate value for
freeway links (2000 – 2200 vphpl).
4. Select the TIMING settings for the merge intersection. Set the control type to
Unsignalized and all sign control to Free. The ramp should not have a stop or yield
sign.
5. Select the SIMULATION OPTIONS settings for the merge intersection. Set the
turning speeds to the speed limit. Do not use the default right turning speed of 9 mph;this will cause unacceptable slowing at the merge. The headway factors headway
factor is automatically updated based on the input Saturation Flow. Adjust the Link
Offset as described on page 9-6.
Downstream Link has
acceleration lane
Intersection has Sign
Control of "Free"
Bend node at point where
acceleration lane ends
(place at location where taper
is < 1/2 of a lane width)
Code the number of lanes
equal to the sum of the
mainline lanes plus the
number of ramp lanes.
Notes:
- Set the Turning Speed to the appropriate value.
- Change the Saturation Flow for freeway links.
- Set the Link Offset equal to the width of the mainline
a
a should be >= 20
degrees to keep size of
intersecion small
Figure 2-9 Freeway Merge
Freeway Diverges

7/21/2019 Synchro Studio 8 User Guide
http://slidepdf.com/reader/full/synchro-studio-8-user-guide 54/559
2-30
Freeway Diverges
Figure 2-10 illustrates a freeway diverge. Diverges are coded with a single unsignalized
intersection. No deceleration lane is required, but one can be coded similar to the acceleration
lane for a two lane on ramp.
Here are the steps to creating a freeway diverge.
1. The diverge point is a 3 legged unsignalized intersection.
2. Select the TIMING settings for the diverge intersection. Set the control type to
Unsignalized and all sign control to Free .
3. Select the LANE settings and set the Saturation Flow to an appropriate value for
freeway links (2000 – 2200 vphpl).
4. Select the SIMULATION OPTIONS settings for the diverge intersection. Set the
turning speeds to the speed limit. Do not use the default right turning speed of 9 mph,
this will cause unacceptable slowing at the merge. The headway factors headway
factor is automatically updated based on the input Saturation Flow. Adjust the Link
Offset as described on page 9-6.
Diverge point is an
Unsignalized Intersection
with control type "Free"
a
a should be >= 20
degrees to keep size of
intersecion small
Notes:- Set the Turning Speed to the appropriate value.
- Change the Saturation Flow for freeway links.
- Set the Link Offset to the width of the mainline (use a negative value)
Figure 2-10 Freeway Diverge
Limit of One Link for Each of Eight Directions

7/21/2019 Synchro Studio 8 User Guide
http://slidepdf.com/reader/full/synchro-studio-8-user-guide 55/559
2-31
g
The maximum number of links that can meet at each intersection is eight. There can only be one
link for each of the eight major directions (North, South, East, West, North-East, North-West,
South-East and South-West). This limitation is due to the way that Synchro stores intersections
and links. This limitation should not be a problem for the vast majority of intersections, it might
be a problem when there are two or more diagonal streets that cross or join. It might be possible
to relabel headings to overcome this limitation (see the topic Changing the Name of the
Approach Direction on page 3-6).
Map Settings, Color, and SizesUse the Options Map-Settings command to change the appearance of the map. This
command can change the color and size of the map elements, as well as control the appearance
of street names.
Figure 2-11 Synchro Map Settings
To change a color, click on the Color button for the desired element and then select a color from

7/21/2019 Synchro Studio 8 User Guide
http://slidepdf.com/reader/full/synchro-studio-8-user-guide 56/559
2-32
g ,
the choices shown.
The sizes for street names, link widths, and intersection radii are in feet (meters). These
elements will be scaled when the map is zoomed in and out. The Street Name Height also affects
how often the street name is repeated. To have the street names repeat closer together, decrease
the height of the street names.
The [Defaults] button will return the settings to the default settings (see page 2-33).
Street Name and Volume Label Backgrounds
In Options Map-Settings, the dialog includes a visible checkbox. If it is checked, each street
names and volume labels will be drawn over a rectangle of the background color to be more
readable over a background bitmap. If not checked, the street names and volume labels will be
drawn without this rectangle (see Figure 2-12).
Background Visable Checked Background Visable Unchecked
Figure 2-12 Background Visible in Map Settings
Rotate, Scale and Move the Map's Coordinate System
Use the Transform Map button to move, scale, or rotate the entire map. If your map
was initially laid out with a different coordinate system, you can change it with this
command.
To translate the map, do the following steps:

7/21/2019 Synchro Studio 8 User Guide
http://slidepdf.com/reader/full/synchro-studio-8-user-guide 57/559
2-33
1. Select the Transform-Map button command.
2. Click on an intersection that has known coordinates in the new coordinate system.
3. The TRANSFORM MAP view will appear with the existing coordinates of the
selected intersection. Enter the new coordinates for this intersection and select [OK].
4. Enter a scale factor or rotation angle. The scale and rotation base point will be the
selected intersection.
5. The map will be translated. Any background image will be cleared.
6. To change a map between feet and metric units, use the Options Convert-to-
Metric or Options Convert-to-Feet command.
Default Settings
The following settings have a [Default] button available:
Network Settings (Synchro)
Report Settings (Synchro and SimTraffic)
Map Settings (Synchro and SimTraffic)
Detector Settings (Synchro)
Driver and Vehicle Parameters (SimTraffic)
Interval Parameters (SimTraffic)
Using the [Default] button loads in the defaults for the given dialog, window or view.
The defaults are read from a zero intersection file (defaults.syn) in the Trafficware directory.
When a user has a file with preferred defaults settings, it can be saved as the “defaults.syn” file
and placed in the Trafficware directory (or wherever Synchro is installed). If an organization
wants to have standard settings for everyone, they can deploy a defaults.syn to all users.
Some organizations may lock down the application directory. Therefore, the
administrator may need to change or deploy the defaults file.
From the Network Settings or Detector Settings, pressing the [Default] button opens the Load
D f lt di l (Fi 2 13)

7/21/2019 Synchro Studio 8 User Guide
http://slidepdf.com/reader/full/synchro-studio-8-user-guide 58/559
2-34
Defaults dialog (Figure 2-13)
Figure 2-13 Load Defaults Dialog
Check the options to include Network Defaults and/or Detector Templates. Then, choose oneoption to load the values from the Defaults File or from a previously created file.
Time Tracker in SynchroThe Time Tracker is used to count the time spent on a Synchro project.
When a new or existing project is opened, there is the Time Tracker dialog asking for the user
name input to start time counting. A user can input a new name or, clicking on the arrow at the
right side of name editor, to choose an existing name from the list of the users that already used
Time Tracker for this project. After input of the name, the time tracker starts counting the time.
Figure 2-14 Time Tracker Dialog
Time tracker is shown on the Synchro window as a button and three time display – current
session time the total time for the current user and the total time for all users spent on this

7/21/2019 Synchro Studio 8 User Guide
http://slidepdf.com/reader/full/synchro-studio-8-user-guide 59/559
2-35
session time, the total time for the current user, and the total time for all users spent on this
project.
Time tracker has three states as described below.
Counting state
In this state Time Tracker is counting the time. If you press the Time Tracker button, Time
Tracker will switch to the paused state and will not count the time.
Paused state
In this state Time Tracker is not counting the time. If you press the Time Tracker button, Time
Tracker will switch to the counting state and will start counting the time.
Disabled state
In this state Time Tracker does not count time and does not show the Time Tracker window
when the project is opened. To set Time Tracker in disabled state for a project, open the project
and, after the Time Tracker window appears, click “Disable” button or close the Time Tracker
window without typing any name. To exit the disabled state, click on the Time Tracker button
and, after the Time Tracker window appears, type your name or select an existing name from
the user list and press the OK button

7/21/2019 Synchro Studio 8 User Guide
http://slidepdf.com/reader/full/synchro-studio-8-user-guide 60/559
2-36
the user list, and press the OK button.
To see and print the Time Tracker statistics, choose “Create Report” from “File” menu andselect “Time Tracker” report.
Chapter 3 – Data Entry Settings

7/21/2019 Synchro Studio 8 User Guide
http://slidepdf.com/reader/full/synchro-studio-8-user-guide 61/559
3-1
Chapter 3 Data Entry Settings
Data can be input, edited and viewed with the data entry setting buttons after links and nodes
have been created in the MAP view. Refer to Chapter 2 for details on creating links and nodes.
In Synchro, a horizontal row of buttons is always in view. These buttons are used to switch
between the various data entry settings.
The data entry buttons are greyed out and not accessible until either a link or node is selected on
the map. Figure 3-1 shows the location of the data entry setting buttons in Synchro.
Data Entry Settings
Click on a node toactivate the Data EntrySettings
Figure 3-1 Data Entry Settings
Data Entry Setting Buttons

7/21/2019 Synchro Studio 8 User Guide
http://slidepdf.com/reader/full/synchro-studio-8-user-guide 62/559
3-2
The data entry setting buttons include the following:
This is the Lane Settings button. Use this button or the [F3] key to switch to
the LANE settings. Refer to Chapter 5 for details.
This is the Volume Settings button. Use this button or the [F4] key to activate
the VOLUME settings. Refer to Chapter 6 for details.
This is the Timing Settings button. Use this button or the [F5] key to activate
the TIMING settings. This button is not visible if a signalized intersection is
selected. Refer to Chapter 7 for details.
This is the Sign ing Settings button. Use this button or the [F5] key to activate
the SIGNING settings. This button is not visible if an unsignalized intersection
is selected. Refer to Chapter 7 for details.
This is the Phasing Settings button. Use this button or the [F6] key to activate
the PHASING settings. Refer to Chapter 8 for details.
This is the Simu lation Settings button. Use this button or the [F10] key to
activate the SIMULATION SETTINGS button. Refer to Chapter 9 for details.
This is the Detector Setti ngs button. Use this button or the [F11] key to activate
the DETECTOR settings. Refer to Chapter 10 for details.
This is the HCM 2010 Settings button. Use this button to activate the year 2010
Highway Capacity Manual settings. Included are the methods for the
Automobile Mode, Pedestrian Mode and Bicycle Mode. If the Control Type is
set to Roundabout, the settings will show the year 2010 HCM Roundaboutmethods.
This is the Time-Space Diagram button. Use this button or the [F7] key to
activate the TIME-SPACE DIAGRAM. An intersection or link must be
selected for this button to be active. Refer to Chapter 13 for details.
This is the Select-I ntersection button. Use this button or the [F8] key to bring

7/21/2019 Synchro Studio 8 User Guide
http://slidepdf.com/reader/full/synchro-studio-8-user-guide 63/559
3-3
up a list of the intersections in your network. Choosing an intersection and pressing [OK] will switch the current settings to that intersection. In addition,
the MAP View will be centered on the selected intersection. This button is
always active.
This is the SimTraffi c Animation button. Use this button or press [Ctrl]+[G]
to start SimTraffic and load the current file in SimTraffic. This button is always
active.
Clicking once on the button described above, or pressing the appropriate [F] key, will open to
the full view data entry screen. Clicking on the button again will change to a side view data
entry view. See the discussion below for details.
Full View Data Entry
Data entry in Synchro can be performed with a traditional full screen view or a MAP view side
entry. In full view data entry, the MAP view will disappear. To activate, highlight an
intersection from the MAP view and select the desired data entry button along the top of
Synchro. Figure 3-2 illustrates the full view data entry screen for the LANE settings. Details on
the settings are found in the upcoming chapters.

7/21/2019 Synchro Studio 8 User Guide
http://slidepdf.com/reader/full/synchro-studio-8-user-guide 64/559
3-4
Figure 3-2 Full View Data Entry, LANES Settings
When in the full view of the PHASING and TIMING settings, press the [F9] key to move
focus between blue (directional) and yellow (node) sections.
The full view data entry screens will show all available movement headings. The available
movement headings will depend on the layout of the links. For instance, a T-intersection willhave 6 columns visible and a 4-leg intersection will have twelve columns visible.
The direction headings are based on the angle of the link as drawn in the MAP view (north is
always up, or zero degrees).
Side View Data EntryIn addition to a full view data entry screen, data can also be entered with a side view screen.
This view displays the data entry rows on the left side of the MAP view allowing you to see the
data update as you enter. To activate the side view data entry, double click on a link
approaching an intersection. Figure 3-3 illustrates the side view data entry.

7/21/2019 Synchro Studio 8 User Guide
http://slidepdf.com/reader/full/synchro-studio-8-user-guide 65/559
3-5
Double click on a link toactivate the Side View
Data Entry Settings
Side View DataEntry view(LANES setttings)
Figure 3-3 Side View Data Entry, LANES Settings
The side view setting that will open is based on the last view edited. By default, the LANE
settings will appear. To choose a new view, click on the appropriate data entry settings button or
press an [F] key.
You can toggle between full screen and side view with the [F] keys. Press [F3] for lanes, [F4]
for volumes, [F5] for timing, [F6] for phasing, [F10] for simulation settings and [F11] for
detector settings.
The top of the side view settings contains a series of buttons.
The [X] button will close the side view settings. The second button will toggle between full
view and side view. The red circle will bring up the NODE settings and the arrows will switch
the approach.
When displaying the side view of the PHASING settings for a direction, it will show all phases
that serve that direction.

7/21/2019 Synchro Studio 8 User Guide
http://slidepdf.com/reader/full/synchro-studio-8-user-guide 66/559
3-6
Lanes and Volumes Data Rows
The first two rows of the LANE, VOLUME, TIMING, SIMULATION OPTIONS and
DETECTORS settings will show the Lanes and Sharing row followed by the Traffic Volume row. This will reduce the need to switch back and forth between settings.
Details on the Lanes and Sharing setting can be found on page 5-2 and for the Traffic Volume
setting on page 6-2.
Changing the Name of the Approach Direction
To change the name of an approach direction, right click on the column label of the LANE,VOLUME, TIMING, SIMULATION OPTIONS or DETECTORS settings. Double click on
the desired direction name to reassign the direction. To reset to the original map direction, select
"Free".
The column label appears in the side view when you double click on a link. The
column label displays a directional arrow and a heading name (for instance, NBL,
NBT, NBR, SBL, SBT, etc.)
The ability to change the approach heading is intended to reclassify diagonal approaches into
orthogonal approaches (NB, SB, EB, WB). This is not intended to rotate an entire intersection or
map. North must always be up on the MAP view.
Figure 3-4 Warning Screen

7/21/2019 Synchro Studio 8 User Guide
http://slidepdf.com/reader/full/synchro-studio-8-user-guide 67/559
3-7
To navigate between intersections, click on the column heading picture to move inthat direction. For instance, click on the EBT column heading arrow to move to the
intersection to the east. Clicking on the EBL column heading arrow will move to the
intersection to the north.
Approach Movements
Synchro will allow 6 movements per approach. This includes one through, one U-turn, two lefts
and two rights. The through is defined as the opposing direction. Consider Figure 3-5 of the six-
leg intersection. Traveling from nodes 1-2-5 is assigned the EBT direction, 1-2-4 is the EBL, 1-
2-3 is the EBL2 (hard left), 1-2-1 is the U-turn, 1-2-6 is the EBR and 1-2-7 is the EBR2 (hard
right).
Figure 3-5 Approach Movements
If you do not have two opposing directions that line up (i.e., EB and WB), then there would be
no through movement defined. If you want a through movement to be defined, the opposing link
must be labeled with the opposing direction. You could change the approach name (as defined
above) to create the through movement.
File Command Buttons
7/21/2019 Synchro Studio 8 User Guide
http://slidepdf.com/reader/full/synchro-studio-8-user-guide 68/559
3-8
Synchro includes buttons that allow the user to save, open a file, create a report, undo and redo.
There is also a new box on the Synchro toolbar that shows the node number of the selected
intersection that is helpful to see the node number when in a data screen.
This is the Open-File button. Use this button or the [Ctrl]+[O] keys to open a
file.
This is the File-Save button. Use this button or the [Ctrl]+[S] keys to save thefile.
This is the File-Save As button. Use this button to save the file with a different
name. After selecting this, the Scenario Manager will appear before the file is
saved.
This is the Create-Report button. Use this button or the [Ctrl]+[R] keys tocreate a report (opens the SELECT REPORTS window).
This is the Undo button. Use this to undo the last 100 commands.
This is the Redo button. Use this to redo the last 100 undone commands.
Summary of Menu Commands

7/21/2019 Synchro Studio 8 User Guide
http://slidepdf.com/reader/full/synchro-studio-8-user-guide 69/559
3-9
Synchro has a variety of commands that can be accessed with button clicks, left mouse-click
commands or menu commands. This section will summarize the available commands (listed in
order shown in the menu commands).
Table 3-1 File Commands
Menu Command Action Keystrokes
FileNew Start a new file [Ctrl]+[N]
FileOpen Open an existing file [Ctrl]+[O]
FileSave Save the file you are working on [Ctrl]+[S]
FileSave-As Save the file you are working on with a new name
or File Type
FileSave-Part Save the highlighted intersections to a new file
FileMerge Merge multiple files or parts of files together
FileSelect
Backgrounds
Import a Map Background image
FileCreate-Report Go to the Create Report dialog [Ctrl]+[R]
FilePrint-Window Creates a report of the active tab [Ctrl]+[P]
FilePrinter Setup Opens your default printer set-up window -
File'list of files' Shows the list of the last four files that wereopened
-
FileExit Exits the program -
Table 3-2 Edit Commands
Menu Command Action Keystrokes
EditUndo Use to undo multiple changes [Ctrl]+[Z]
EditRedo Use to redo multiple changes [Ctrl]+[Y]
Table 3-3 Transfer Commands
Menu Command Action Keystrokes

7/21/2019 Synchro Studio 8 User Guide
http://slidepdf.com/reader/full/synchro-studio-8-user-guide 70/559
3-10
Menu Command Action KeystrokesTransfer Data Access... Opens the UTDF Database Access
window to allow you to read/write
data to a database file
[Ctrl]+[D]
Transfer SimTraffic Simulation Launches the SimTraffic micro
simulation program
[Ctrl]+[G]
Transfer Warrants Evaluation Creates a Warrants compatible file [Ctrl]+[W]
Transfer CORSIM Analysis... Creates a CORSIM compatible file -
Transfer Save to HCS Creates a HCS compatible file -
Table 3-4 Option Commands
Menu Command Action
OptionsScenario Manager Open the Scenario Manager
OptionsMap Settings... Use to change the appearance of the map
OptionsNetwork Settings... Allows you to make changes that affect the entire
network
OptionsTime-Space Diagram Will open the time-space diagram
OptionsCoding Error Check To check data for coding errors
Options Convert to Metric/Feet Covert between Metric and Feet
OptionsPhase Templates
Intersection to East-West
Set the phase template to an east-west template
(phase 2/6 east and west)
OptionsPhase Templates
Intersection to North-South
Set the phase template to a north-south template
(phase 2/6 north and south)
OptionsDetector Templates Opens the Detector Template
OptionsPhase TemplatesEditTemplate Phases
Edit the phase templates
OptionsRing-and-Barrier-
Designer...
To modify the ring and barriers for phases within
Synchro
OptionsCluster Editor... To group multiple intersections on one controller
Table 3-5 Optimize Commands
Menu Command Action Keystrokes

7/21/2019 Synchro Studio 8 User Guide
http://slidepdf.com/reader/full/synchro-studio-8-user-guide 71/559
3-11
Menu Command Action KeystrokesOptimize Intersection Splits To optimize the splits of the selected
intersection
[Ctrl]+[T]
Optimize Intersection Cycle
Length
To optimize the cycle length of the
selected intersection
-
Optimize Intersection Offset To optimize the offset of the selected
intersection only
[Ctrl]+[I]
Optimize Partition Network To divide a network into multiple
systems (zones)
-
OptimizeNetwork Cycle
Length
To optimize the cycle length for your
entire file or selected zone(s)
-
OptimizeNetwork Offset To optimize the offsets for your entire
file or selected zone(s)
-
Table 3-6 Help Commands
Menu Command Action Keystrokes
HelpUser Guide Open the User Guide [F1]
HelpCheck for Updates Check to see if a newer build is
available
-
HelpSupport Connect to Trafficware support site to
log a question
-
HelpLicense Key Shows your Product Key and
Deactivation Button
-
Help About Synchro Shows the current version, build and
copyright
-

7/21/2019 Synchro Studio 8 User Guide
http://slidepdf.com/reader/full/synchro-studio-8-user-guide 72/559
Chapter 4 – Node Settings
T i h NODE i d bl li k i i l i i d

7/21/2019 Synchro Studio 8 User Guide
http://slidepdf.com/reader/full/synchro-studio-8-user-guide 73/559
4-1
To activate the NODE settings, double click on an intersection or select an intersection and
press [Enter]. Figure 4-1 illustrates the NODE settings.
Figure 4-1 NODE Settings
The NODE settings allow the following values to be edited:
Intersection ID or Node Number
Zone
Cycle Length, Control Type, Lock Timings and Optimize buttons
Coordinates (X, Y, Z)
D i ti N t b
7/21/2019 Synchro Studio 8 User Guide
http://slidepdf.com/reader/full/synchro-studio-8-user-guide 74/559
4-2
Description Note box
Signal Timing data (controller, offset, etc.)
The NODE settings also appear on the left panel of the TIMING and PHASING
settings.
Selecting Multiple Intersections
Multiple intersections can be selected by dragging a rectangle around the group of intersections.
1. Left-click on the map background being careful not to select a link or node.
2. While holding the button down, drag a rectangle to the opposite corner.
3. When the desired intersections are inside the rectangle, release the mouse button.
Bend nodes are automatically selected if an adjacent intersection is selected.
Additional intersections can be selected or deselected by clicking on them with the mouse while
holding down the [Ctrl] key down.
The NODE settings can be used with a group of intersections to set the zone, change the control
type or cycle length, or lock/unlock the timings.
Node NumberAll intersections and external nodes are assigned a unique node number. used to identify the
node in reports and data exported to CORSIM, HCS and UTDF files.
If you plan to use a file with CORSIM, keep all node numbers less than 7,000.
ZoneSynchro allows intersections to be assigned to zones (use up to 7 characters). Zones are useful
for analyzing a section of a network. Use zones to keep the timings for some intersections
constant while the timings for other intersections are changed.
Using zones allows part of a large network to be analyzed with other software (i.e., CORSIM).
The following features can be used on a per-zone basis:
Optimize Network-Cycle-Lengths (see page 14-11)
O i i N k Off ( 14 18)

7/21/2019 Synchro Studio 8 User Guide
http://slidepdf.com/reader/full/synchro-studio-8-user-guide 75/559
4-3
Optimize Network-Offsets (see page 14-18)
Reports (see page 16-1)
Universal Traffic Data Format (see page 17-1)
CORSIM preprocessors (see page 19-1)
Zones with Calculations and Optimizations
If adjacent intersections have the same (or half or double) cycle lengths, they will be modeled as
coordinated, even if they are in different zones.
A Time-Space diagram will show all intersections along an arterial even if the arterial crosses
several zones.
Offset optimization considers compatible cycle lengths of adjacent intersections even if they areassigned to different zones.
The feature Optimize Network-Cycle-Lengths allows the user to assign a cycle length for the
entire network or by zone.
The Optimize Partition-Network command reassigns zones to optimize cycle lengths within
each zone while attempting to preserve existing zone assignments as much as possible.
The user may designate an intersection in the zone as a master reference. This master will beused as the time reference for all intersections assigned to the same cycle length. However, if no
master is defined, then Synchro will use an arbitrary time reference for the cycle length.
Intersections are assigned to a master based on a common cycle length, not by zone.
Using Multiple Zones
Multiple zones may be selected in dialog boxes that request zones by separating the zonenumbers with a comma. For example, to select zones N and S under SELECT REPORTS,
enter "N, S" in teh dialog box.
Node CoordinatesThe NODE settings allow the X, Y and Z coordinates to be entered exactly. The coordinates of
the nodes are used in the layout of the map and the geometry of intersection approaches.
7/21/2019 Synchro Studio 8 User Guide
http://slidepdf.com/reader/full/synchro-studio-8-user-guide 76/559
4-4
The X, Y and Z coordinate settings provide a convenient method for moving intersections to
exact coordinates. The coordinates are for the center point of the intersection. For traffic
engineering purposes, it is good enough to have the coordinates to within 20 feet.
To create an overpass, assign a higher Z coordinate elevation to the nodes of the overpass link.
The Z elevation is only used for visual purposes.
DescriptionThe Description cell is a convenient location to type notes about the intersection. The
information will appear at the bottom of the Intersection Reports (see the chapter on Reports
and Printing on page 16-1).
Control Type
Timing Settings
Use the Control Type field to indicate what type of controller you are using. The choices are
Pretimed, Semi-Actuated-Uncoordinated, Actuated-Uncoordinated, Actuated-Coordinated,
Roundabout and Unsignalized. Here is a brief description of each signal control type.
Pretimed: A pretimed signal has no detector actuations and all phases are set to Maximum
recall. The signal is considered coordinated because the cycle length is fixed each cycle.
Semi-Actuated-Uncoordinated: A semi-actuated signal recalls the main street through phases
to their Maximum values. Other assigned phases may skip or gap-out based on vehicle
detection. This signal is not considered coordinated because the cycle length can vary each
cycle.
Actuated-Uncoordinated: All phases are fully actuated and no recalls are set. The cycle lengthis allowed to vary each cycle (based on detection), so the intersection is considered
uncoordinated.
Actuated-Coordinated: In this case, all phases other than the assigned coord phases are fully
actuated. The signal operates on a fixed cycle length and any unused time in the cycle is added
to the assigned coord phases.
Actuated-Coordinated and Semi-Actuated-Uncoordinated are not the same. With
coordinated operation, any unused time on minor phases is used by the main street.
With semi-actuated operation, any unused time on minor phases shortens the cyclel th

7/21/2019 Synchro Studio 8 User Guide
http://slidepdf.com/reader/full/synchro-studio-8-user-guide 77/559
4-5
length.
Signing Settings
When you select an unsignalized intersection, the TIMING settings button switches to the
SIGNING settings button. The symbol of the [F5] button also switches from the signal symbol
to a stop sign to indicate whether the selected intersection is signalized or unsignalized.
Unsignalized: Traffic movements at unsignalized intersections may be free-flow or controlled
by stop or yield signs.
Roundabouts: Synchro models single lane traffic circles or roundabouts using the HCM
methods (year 200 and 2010). The 2000 method only analyzes single lane roundabouts and the
only output is a range of v/c ratios. There is no attempt to produce delays or queues. The 2010
method (see the HCM 2010 Settings) models multi-lane roundabouts and does present delaysand queues.
Roundabouts are modeled in SimTraffic. The user can input the number of lanes in
the roundabout, the inside and outside radius, the speed, sign control to entering the
roundabout and the number of exit lanes; this information is ignored by Synchro.
Cycle LengthThe cycle length is the total time required to service all competing traffic movements at a
signalized or unsignalized intersection. Coordination fixes the cycle length at a constant value
and insures that all slack time not utilized by the actuated phases is used by the assigned coord
phases.
The user may specify the desired cycle length in seconds for each intersection.
To set a default for newly created intersections or to change all of the Cycle Lengths, use the
Options Network-Settings command. The minimum value allowed by Synchro is 3 seconds.
Coordinated cycle lengths are typically in the 30 - 180 second range depending on the number
of competing phases serviced. However, the Synchro range insures that the capability of any
traffic signal controller can be modeled.
Increase Cycle and Split Times
In previous versions of Synchro, the Cycle was limited to 900 seconds and the Maximum Split
to 840 seconds. In some instances, a long cycle can be useful to model dummy intersections that

7/21/2019 Synchro Studio 8 User Guide
http://slidepdf.com/reader/full/synchro-studio-8-user-guide 78/559
4-6
can stop traffic for an extended period of time. The Cycle Length and the Maximum Split may
now have values up to 3000 sec (50 min). The Cycle Length should not exceed 3000 seconds.
Two examples for using this would be a draw bridge and a rail crossing. At the location of the
stop, create a dummy intersection (create a T-intersection). Keep in mind that this dummy link
can be hidden (see page 5-19). Then you can enter a phase for the main street (say phase 1) and
then a Hold phase.
Lock TimingsThe Lock Timings field is used to prevent the timing from changing. To preserve the timing for
one or more intersections, click the check box in this field for each of the intersections. If you
optimize the network, these intersections' timing plans will not change, but the other
intersections will be optimized around them.
This field could be helpful if there are some intersections that are controlled by
another agency and you want to coordinate your signals with theirs. To do this, set up
the timing for the other agency signals and then lock these timing plans. Enter the
timing for your signals and leave them unlocked.
If you have two or more intersections that are close together and require a special type of timing,you can setup their timing manually, lock the intersections, and optimize the intersections
around them.
It is advisable that one of the locked intersections be the Master Intersection if the master
intersection option is used. Otherwise, the offsets for the locked intersections may be changed if
the timing for the master intersection changes.
An alternative to locking intersections is to divide the study area into zones, and perform
analysis on specific zones. Each zone can be locked after the optimization is complete for that
zone.
Optimize Cycle LengthThe Optimize Cycle Length button will optimize the selected intersection cycle length. Full
details on the intersection cycle length optimization can be found on page 14-7.

7/21/2019 Synchro Studio 8 User Guide
http://slidepdf.com/reader/full/synchro-studio-8-user-guide 79/559
4-7
Optimize SplitsThe Optimize Splits button will optimize the selected intersection splits. Full details on the
intersection split optimization can be found on page 14-4.
Actuated Cycle LengthThe Actuated Cycle Length (CL) is the average cycle length for an actuated signal.
C' = Actuated CL
C' = C for pretimed and coordinated signals.
Calculation
5' Ci
C
Ci = Percentile Scenario Cycle Length
C' may not equal the sum of the actuated splits due to skipped phases and dwell time.
HCM Report Calculation
C' = (g' + YAR)
g' = Actuated Green times
The percentile actuated cycle length is the sum of the actuated splits, subject to ring and barrier
rules.
Actuated Cycles by Percentile
The Actuated Cycles by Percentile are show in the NODE settings on the left side of
the PHASING settings. The Actuated Cycles will not appear in the NODE settings in
any other location.
To represent a range of volume levels, five percentile scenarios are modeled. They are called the
90th, 70th, 50th, 30th, and 10th percentiles. Traffic volumes for each approach are adjusted up
or down to model these percentile scenarios. By adjusting the traffic for different scenarios, theactuated signals can be modeled under a range of traffic conditions.

7/21/2019 Synchro Studio 8 User Guide
http://slidepdf.com/reader/full/synchro-studio-8-user-guide 80/559
4-8
g g
If traffic is observed for 100 cycles, the 90th percentile would be the 90th busiest, the 10th
percentile would be the 10th busiest, and the 50th percentile would represent average traffic.
For each of the percentile scenarios, this is the expected cycle length. This value is the sum of
the actuated splits for each phase.
Natural Cycle LengthThe Natural Cycle Length is the shortest cycle length that will give acceptable capacity. In
general, intersections have an optimum cycle length that provides the best level of service.
Using a shorter cycle length will not provide enough green time to clear all of the waiting
vehicles causing congestion. Using a longer cycle length increases delays by introducing unused
green time. For Natural Cycle Length, enter the shortest cycle length for this intersection only.
The Natural Cycle Length is the cycle length this intersection would operate at if it were to
operate independently of all other intersections. (For more information about using the Natural
Cycle Length, see Intersection Cycle Length Optimization on page 14-7)
At congested intersections, no cycle length gives acceptable capacity. In these cases, Synchro
uses the cycle length with the lowest combination of stops, delays, and unserved vehicles.
Maximum v/c Ratio
Timing Settings
The TIMING setting displays the Volume to Capacity Ratio (v/c) for each traffic movement or
lane group (see page 7-24). The Maximum v/c Ratio is the highest individual movement or
lane group v/c ratio.
In addition, Synchro provides an alternate method of evaluating intersection capacity called theICU (Intersection Capacity Utilization) method. In general, the ICU method is a more direct
measure of intersection capacity and easier to calculate. The ICU method also overcame several
shortcomings that were corrected in HCM 2000.
Intersection capacity values are summarized in the NODE SETTINGS for each node. The Max
v/c Ratio is the maximum lane group Volume to Capacity Ratio using the HCM method. The
ICU value is also shown with the associated ICU Level of Service (LOS).

7/21/2019 Synchro Studio 8 User Guide
http://slidepdf.com/reader/full/synchro-studio-8-user-guide 81/559
4-9
Signing Settings
Volume to Capacity Ratios are also provided for 2-way stop and yield sign control. V/c ratios
for 4-way stop control are undefined. These results are consistent with HCM 2000. In addition
v/c ratios are estimated for the through flows at roundabouts.
Intersection Delay
Timing Settings
The Intersection Delay field shows the average Total Delay for the signalized intersection and
it is calculated by taking a volume weighted average of all the Total Delays. The Total Delay
includes the Queue Delay (see page 7-25) plus the Control Delay (see page 7-25).
Signing Settings
The average intersection delay for unsignalized intersections is based on an average of each
movement‟s delays. The unsignalized intersection delay is strictly based on the methods in the
HCM. Therefore, the unsignalized delay does not include Queue Delay.
Intersection delay and level of service is not defined by the HCM for two-way stop
controlled intersections; therefore, it is not shown in the report. The analyst needs to
look at the delay and LOS for the individual movements.
Intersection Level of Service
Timing Settings
For signalized intersections, the Level of Service for the intersection is calculated by taking thetotal Intersection Delay and converting it to a level (A-F) using Table 4-1.
Table 4-1 Signalized Intersection Level of Service (2010 HCM)
Control Delay Per Vehicle (s) LOS by Volume to Capacity Ratio
1 >1

7/21/2019 Synchro Studio 8 User Guide
http://slidepdf.com/reader/full/synchro-studio-8-user-guide 82/559
4-10
10 A F
>10 and 20 B F
>20 and 35 C F
>35 and 55 D F
>55 and 80 E F
>80 F F
Signing Settings
For an unsignalized two-way stopped controlled (TWSC), all-way stop-controlled (AWSC) or a
roundabout intersection, the Level of Service for the intersection is calculated by taking the
Intersection Delay and converting it to a letter using Table 4-2.
Table 4-2 TWSC, AWSC and Roundabout Level of Service Criteria (2010
HCM)
Control Delay Per Vehicle (s) LOS by Volume to Capacity Ratio
1 >1
10 A F
>10 and 15 B F
>15 and 25 C F
>25 and 35 D F
>35 and 50 E F
>50 F F
The LOS criteria for TWSC, AWSC and roundabout intersections are different than that used
for a signalized intersection. The primary reason for this is that drivers expect different levels of
performance between signalized and unsignalized intersections.
Intersection Capacity UtilizationIntersection Capacity Utilization is the 2003 (ICU 2003) for the intersection. Full details of the
ICU 2003 can be found in the topic, Intersection Capacity (ICU) Report (see page 16-11). A fulldescription of ICU 2003 along with commentary and instructions is available in the reference

7/21/2019 Synchro Studio 8 User Guide
http://slidepdf.com/reader/full/synchro-studio-8-user-guide 83/559
4-11
p g y
book, Intersection Capacity Utilization 2003 available from Trafficware.
The ICU is shown for unsignalized intersections because it represents the potential capacity for
the intersection if it were to be signalized.
ICU Level of ServiceThe ICU Level of Service (LOS) gives insight into how an intersection is functioning and how
much extra capacity is available to handle traffic fluctuations and incidents. ICU is not a value
that can be measured with a stopwatch, but it does give a good reading on the conditions that
can be expected at the intersection. Full details of the ICU LOS can be found in the topic,
Intersection Capacity (ICU) Report.
Letters A to H are assigned to the intersection based on the Intersection Capacity Utilizationusing Table 4-3. Note that the ICU 2003 includes additional levels past F to further differentiate
congested operation.
Table 4-3 Level of Service Criteria for ICU Analysis
ICU Level of Service
0 to 55% A

7/21/2019 Synchro Studio 8 User Guide
http://slidepdf.com/reader/full/synchro-studio-8-user-guide 84/559
4-12
>55% to 64% B
>64% to 73% C
>73% to 82% D
>82% to 91% E
>91% to 100% F
>100% to 109% G
>109% H
Offset SettingsThe settings in the Offset settings box specify the phase the offset is reference to and the value
of the current offset. Each intersection is given one offset that can be referenced to the beginningof green, yellow or red of the phase. The offset value represents the number of seconds that the
reference phase lags the master reference (or arbitrary reference if no master is specified). The
master reference synchronizes the intersections sharing a common cycle length to provide a
coordinated system.
Please refer to your traffic signal controller manual for the specific settings required by your
hardware.
Coordination requires a fixed cycle length and a reference offset for each
controller in the system. Therefore, set Control Type to Actuated-coordinated
or Pretimed if the intersection is coordinated and specify Actuated-
uncoordinated for isolated signals without fixed cycle lengths.
Offset Referenced To
Select the point to which you wish to have offsets referenced. Some types of traffic signal
controllers allow the offset to be referenced from the beginning of the green time. Other types of
controllers require the offset to be referenced to the beginning of yellow, or the end of the
yellow plus red.
Some NEMA controllers reference offsets to the last of the coordinated phases to turn green.
NEMA TS2 controllers reference offsets to the first of the coordinated phases to turn green.
Synchro supports both styles of offset referencing.With two reference phases and offsets referenced to Begin of Green, offsets will be referenced
l h
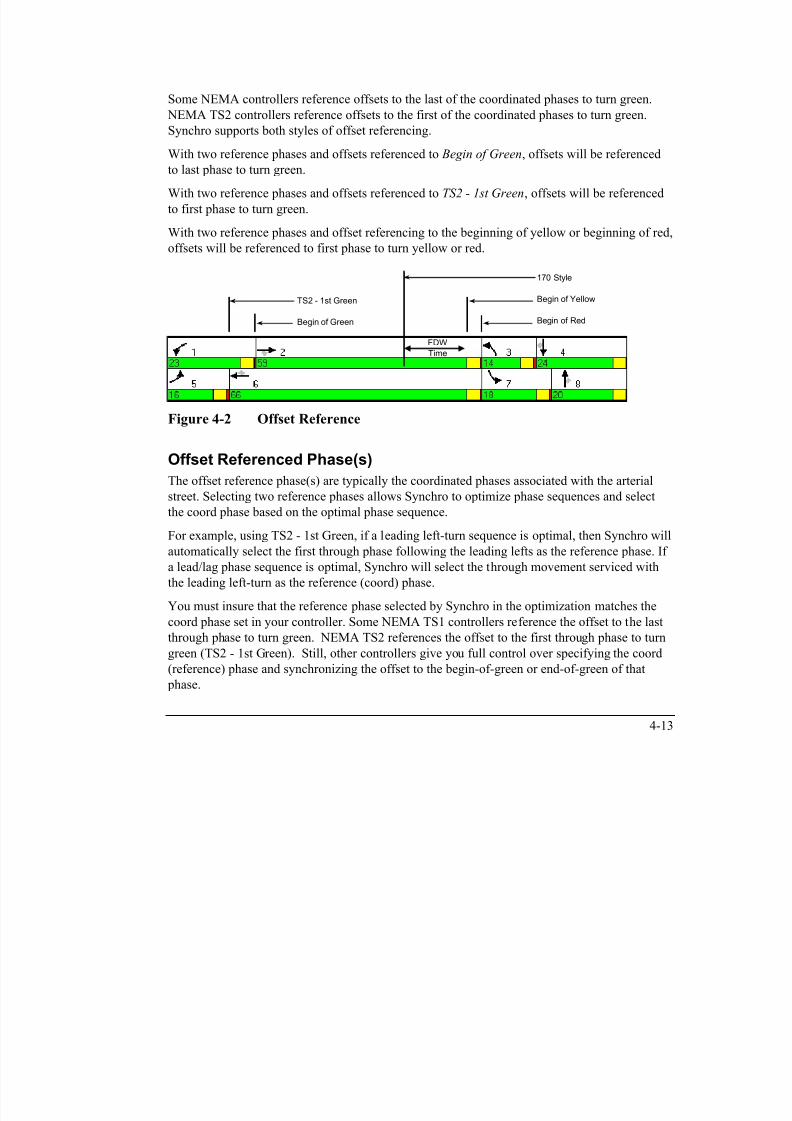
7/21/2019 Synchro Studio 8 User Guide
http://slidepdf.com/reader/full/synchro-studio-8-user-guide 85/559
4-13
to last phase to turn green.
With two reference phases and offsets referenced to TS2 - 1st Green, offsets will be referenced
to first phase to turn green.
With two reference phases and offset referencing to the beginning of yellow or beginning of red,
offsets will be referenced to first phase to turn yellow or red.
TS2 - 1st Green
Begin of Green
170 Style
Begin of Yellow
Begin of Red
FDW
Time
Figure 4-2 Offset Reference
Offset Referenced Phase(s)
The offset reference phase(s) are typically the coordinated phases associated with the arterialstreet. Selecting two reference phases allows Synchro to optimize phase sequences and select
the coord phase based on the optimal phase sequence.
For example, using TS2 - 1st Green, if a leading left-turn sequence is optimal, then Synchro will
automatically select the first through phase following the leading lefts as the reference phase. If
a lead/lag phase sequence is optimal, Synchro will select the through movement serviced with
the leading left-turn as the reference (coord) phase.
You must insure that the reference phase selected by Synchro in the optimization matches the
coord phase set in your controller. Some NEMA TS1 controllers reference the offset to the last
through phase to turn green. NEMA TS2 references the offset to the first through phase to turn
green (TS2 - 1st Green). Still, other controllers give you full control over specifying the coord
(reference) phase and synchronizing the offset to the begin-of-green or end-of-green of that
phase.
Table 4-4 Reference Point with Multiple Reference Phases
Referenced To Reference Point
Begin of Green Referenced to last of phases to turn green
B i f Y ll R f d t fi t f h t t Y ll

7/21/2019 Synchro Studio 8 User Guide
http://slidepdf.com/reader/full/synchro-studio-8-user-guide 86/559
4-14
Begin of Yellow Referenced to first of phases to turn Yellow
Begin of Red Referenced to first of phases to turn Red
TS2 - 1st Green Referenced to first of phases to turn green
170 Style Referenced to start of FDW or start of yellow (see
below)
The reference phases also control which phases are the coordinated phases for an actuated-coordinated signal.
To set a default for newly created intersections or change all of the reference phases, use the
Options Network Settings command.
The Reference Phase is used to determine the coordinated phase(s) for an actuated signal.
For a 170-type controller, the offset is referenced to the end of phase 2 or phase6 green. If either phase 1 or 5 is lagging, the offset is referenced to the first
phase of 2 and 6 to turn yellow. If the main street has rest-in-walk set, the offset
is referenced to the beginning of do not walk.
Current Offset
The intersection Offset is the number of seconds that the reference (coord) phase lags after themaster offset. The offset may be referenced to the begin-of-green or end-of-green of the
reference phase based on the Referenced To value selected.
The Offset begins at zero because the master cycle counter always begins counting at zero. The
maximum Offset is one second less than the Cycle length because the master cycle counter
always increments to that value, then resets to zero.
If the 170 Style reference is used, the reference point will depend on the Recall
Mode setting. If Coordinated-Max is used, the offset will be referenced to the start of
flashing don‟t walk. If Coordinated-Min is used, the offset will be referenced to the
start of yellow.
The optimum offset can be found by using the optimization commands explained in
Optimize Intersection Offset, or by using the time-space diagrams.
Master Intersection
7/21/2019 Synchro Studio 8 User Guide
http://slidepdf.com/reader/full/synchro-studio-8-user-guide 87/559
4-15
The Master Intersection typically has a zero offset value. Synchro allows you to designate an
intersection as the Master Intersection to reference offsets to the cycle counter at that
intersection. If a master intersection is not specified, then Synchro will choose an arbitrary
offset reference as the master reference.
A cycle length of half or double the Master Intersection cycle length is considered compatible.The offset at the half our double cycled intersection will be referenced to the Master
Intersection.
If you have a master assigned to your network, then make your cycle length change
at the master first, then change the cycle lengths at the other intersections you wish
to follow the master cycle reference. This will avoid creating a situation where two
or more masters provide the same cycle length. In those cases Synchro assigns the
master with the most traffic volume.
Be sure to check for the master intersection after the Cycle Length(s) have been changed, for
example using the Optimize Network Cycle Lengths command.
To see which intersection(s) is the master, go to the MAP view and choose the Show
Cycle Lengths button. The master intersection(s) is shown with a * next to the cycle
length in the MAP view.
Yield Points
The Yield Point determines when the Coordinated Phases will “yield” to side street phases.
This setting affects whether there is a single yield point for all phases, or multiple yield points.
Figure 4-3 illustrates how a single yield point works. The main street phases have a single
scheduled end time. If the next up phases have no calls, the other phases start at this point. If
there are no calls for any of the phases 3, 7, 4 and 8; then phases 1 and 5 can start early and the
signal will return to the main street phases sooner.

7/21/2019 Synchro Studio 8 User Guide
http://slidepdf.com/reader/full/synchro-studio-8-user-guide 88/559
4-16
Figure 4-3 Single Yield Point
Figure 4-4 illustrates how yield point by phases works. The main street phases stay on until the
scheduled start time of a conflicting phase. If phases 3 and 7 have no calls, the signal will notyield to phases 4 and 8 until their scheduled start times.
Figure 4-4 Yield Point by Phase
Flexible yield points allow the signal to yield any time between the single point and the phases‟
scheduled start time. Flexible yield points can be useful with low volume side streets; the sidestreets have a wider range of time to yield the signal.
Using a single yield point in conjunction with Fixed Force Off makes the most time available
for side street phases.Yield point by phase extends the green bands for the coordinated
movements rather than provide slack time at the beginning of the bands. Either method must be
provided as a feature by your controller manufacturer.
Keep in mind that the controller will yield as soon as there is a call on the yield phase.
Therefore, even if there is only one call on phase 3 or 7 in the Yield Point by Phase example
above, the controller will leave to service the call after the yield point.
If you wish to allow the non-coordinated phases to utilize slack time from preceding actuated
phases, then you should select Fixed Force Off. This will prevent SimTraffic from terminating
7/21/2019 Synchro Studio 8 User Guide
http://slidepdf.com/reader/full/synchro-studio-8-user-guide 89/559
4-17
phases, then you should select Fixed Force Off. This will prevent SimTraffic from terminating
the phase if the sum of the slack time and programmed split is greater than the max time.
Synchro does not explicitly model flexible yield point. Synchro will model flexible
yield points the same as single yield points. This will be equivalent except for when
the first up actuated phases have low volume. With by phase yield points, Synchro
models a single yield point for each barrier.
Mandatory Stop on YellowTraditionally, SimTraffic will allow at least two vehicles to proceed during a signal phase, even
if the Total Split is set to 3 seconds. In some instances, it is desirable to create a dummy
intersection to meter the traffic (ie, allow 1 vehicle to proceeds every X seconds). This could be
useful for modeling security gates, ramp meters, etc.
To do this, check the Mandatory Stop on Yellow at the bottom of the NODE SETTINGS. This
will allow only one simulated vehicle to pass through a short green signal. No sneaker vehicles
will be allowed during the yellow interval.

7/21/2019 Synchro Studio 8 User Guide
http://slidepdf.com/reader/full/synchro-studio-8-user-guide 90/559
Chapter 5 – Lane Settings
From the MAP view, click on the desired intersection with the Right mouse button and select
LANE settings.

7/21/2019 Synchro Studio 8 User Guide
http://slidepdf.com/reader/full/synchro-studio-8-user-guide 91/559
5-1
From anywhere in the program, press [F8] and select the desired intersection from the
list. Then push the Lane Settings button or the [F3] key.
The LANE settings display a grid in which you can enter lane and geometric information. See
Chapter 3 for details on navigating the data entry screens.
Figure 5-1 LANE Settings, Full View
Lanes and SharingSelect the number of lanes and lane configuration for each lane group by selecting the pull-
down list under each movement arrow. See Rules for Shared Lanes, below, for information onhow to enter lanes that serve more than one movement and how to classify lanes.
Select the Lanes and Sharing pull down list under each traffic movement arrow You can
7/21/2019 Synchro Studio 8 User Guide
http://slidepdf.com/reader/full/synchro-studio-8-user-guide 92/559
5-2
Select the Lanes and Sharing pull-down list under each traffic movement arrow. You can
specify the number of lanes and any shared turning movements from those lanes using the pull-
down list. You may also use a short-cut to select the number of lanes using the [0] - [8] keys.
You can also quickly vary the shared lane assignment by pressing [L] for a shared left-turn or
[R] for a shared right-turn in the lane group.
Rules for Shared Lanes
Use the following rules to determine which lanes belong to a lane group.
Shared lanes always count as through lanes.
Only exclusive turning lanes count as turning lanes.
At a „T‟ intersection the shared Right-Left lanes count as a left lane.
If there is no turning lane, Synchro will assign turning traffic to the through lane group (or the
left turn lane group, if there is no through lane group).
If an approach has a shared turning lane and an exclusive turning lane, the approach can be
modeled by Synchro. The exclusive lane is in the turning group, and the shared lane is in the
through group. Synchro dynamically assigns traffic between the two lane groups (refer to
Traffic in Shared Lane, page 6-13).
To create a new column for U-turns, type [Ctrl] + [U].
Refer to page 6-2 for details on the Traffic Volume setting.
Street Name Naming a street will cause its name to appear on the map. If a street has several segments, the
name will be placed on a segment long enough to fit the name, or on an external link. To changethe size of the street name, see Options Map-Settings.

7/21/2019 Synchro Studio 8 User Guide
http://slidepdf.com/reader/full/synchro-studio-8-user-guide 93/559
5-3
Arterial Route Naming
To create an Arterial Route with multiple street names or that turns corners, include a route
number in the street name with the # symbol. For example, the streets Main and 3rd Street are
part of the same route. Give these streets the names "Main Street #13" and "3rd Street #13".Synchro will be able to create reports and analysis on the arterial "#13" (see the topic Viewing
and Printing Reports on page 16-5 for details on how to create a report for a route that turns a
corner). You can also see a time-space diagram for route #13 (see the topic Time-Space
Diagram on page 13-1 for details on how to view a time-space diagram for a named arterial
view).
Link DistanceLink distances can be used to adjust the length of the link. Adding a link the exact distance with
a mouse can be tricky; this feature allows you to type in the exact distance. If you plan to use
this data with CORSIM or SimTraffic, the override distance should be within 20% to the map
distance. Otherwise, the simulation software will reject the data because map coordinates are
used to simulate runs in CORSIM and SimTraffic.
Changing the Link Distance in the LANE settings changes the internal link length.
This setting does not change the coordinates of the underlying intersections.
Synchro stores the link length independently from the coordinate distances.
The calculated link distance is shown in blue. Overridden distances appear as red. To revert to
the calculated distance, press [F12] when in the cell.
The link distances are the distance from intersection center point to center point. When
determining link distances for queuing analysis, Synchro will subtract 80 feet (24m) from the
distance to account for the space inside intersections.
Geodetic coordinates accurate within 20 feet are adequate for traffic modeling purposes.
Link SpeedThe Link Speed should be set to the legal safe speed that you expect along the arterial after the
traffic signals along the link are optimized. To set a default speed for newly created intersectionsor change all of the speeds, use the Options Network-Settings command.
E t th f fl d d t l ti D t t d d f

7/21/2019 Synchro Studio 8 User Guide
http://slidepdf.com/reader/full/synchro-studio-8-user-guide 94/559
5-4
Enter the free flow speeds and travel times. Do not enter measured speeds from
floating car data to account for congestion and delay unless the speed reduction
reduction cannot be improved by signal optimization.
Set Arterial Name and SpeedSelect a direction button to propagate the name and speed up and down the entire arterial in the
selected and opposing direction. For instance, choose the [EB] option will set the street name
and speed for the arterial in the eastbound and westbound directions.
Travel TimeTravel Time is recalculated when either the speed or distance fields are changed. The
calculated value will appear in blue type. However, you may override this field manually,
which will appear in red type. You can force the field to re-calculate based on the speed and
distance fields at any time by pressing [F12].
Ideal Saturated Flow
Enter the Ideal Saturated Flow Rate for a single lane in this field. The 2000 HCM
recommends using 1,900 vehicles per hour per lane. This is the default.
It is not necessary to enter a different Saturated Flow Rate for turning lanes. Synchro will adjust
the Saturated Flow Rate automatically with turning movement factors (Refer to Right Turn
Factor, page 5-10, and Left Turn Factor, page 5-10)
It is not necessary to adjust this rate to account for heavy vehicles, bus stops, parking
maneuvers, turning traffic, lane widths, grades, or area type. These are automatically adjusted by Synchro.
To set a default for newly created intersections or change all of the Ideal Saturated Flow Rates,
use the Options Network-Settings command, Lanes tab.
The Ideal Saturation Flow is a macroscopic model term used by Synchro. To account for
changes of this factor for simulation, the Headway Factor is used. For more details, refer to the
topic Headway Factor on page 9-8).
Lane Width

7/21/2019 Synchro Studio 8 User Guide
http://slidepdf.com/reader/full/synchro-studio-8-user-guide 95/559
5-5
The default Lane Width is 12 feet (3.6 meters). Saturated Flow Rate increases as Lane Width
increases. Consult the HCM for more information on Lane Width.
To set a default for newly created intersections or change all of the lane widths, use the
Options Network Settings command, Lanes tab.The lane width factor is determined based upon the following table (source: 2010 Highway
Capacity Manual).
Table 5-1 Adjustment for Lane Width
Average Lane Width (ft)Adjustment Factor
(fw)< 10.0 0.96
≥ 10.0 – 12.9 1.00
> 12.9 1.04
This Table is an update for the 2010 Highway Capacity Manual. In the 2000 HCM,there was a formula to determine the Adjustment Factor for Lane Width.
Grade
The percentage Grade is the slope of the roadway approaching the intersection (negative grades
are downhill). The default percentage Grade for each approach is zero percent. The Saturated
Flow Rate increases when traffic moves downhill (negative Grade).
The factor for grade is based on the following formula:
Fg = 1 -%G/200
Fg = Grade adjustment factor
%G = % grade on a lane group approach
Area Type CBD
Select this checkbox if the lane group is typical of Central Business District (or "downtown"
area) A CBD is characterized by high parking turnovers narrow short block roadways and

7/21/2019 Synchro Studio 8 User Guide
http://slidepdf.com/reader/full/synchro-studio-8-user-guide 96/559
5-6
area). A CBD is characterized by high parking turnovers, narrow short-block roadways and
high pedestrian activity. Selecting Area Type CBD lowers Saturated Flow Rate. See the HCM
for more information about CBD characteristics.
Storage Length
The Storage Length is the length of a turning bay in feet (meters). If an intersection has a left
turn storage bay of 150 feet (45 meters), enter "150" ("45") in this box. If the left or right turn
lane extends to the previous intersection, enter "0".
If two or more storage lanes are present, enter the average length of the lanes, not the sum.
Storage Length data is used for analyzing potential blocking problems, such as through traffic blocking left turn traffic, and left turn traffic blocking through traffic. If "0" is entered, no
blocking analysis is performed.
A storage bay can be coded for through lanes. It is also possible to mix full travel
lanes and storage lanes for the turning movement.
To code a flared right or right-turn only lane for unsignalized analysis, code 1 or more right turnlanes and code a turning bay for their lanes.
Storage Lanes
Code the number of Storage Lanes in the right and left storage bays. This value only appears
when the storage length is greater than 0. By default, the number of storage lanes is equal to the
number of turning lanes.
This field can be overridden so that some of the turning lanes are full travel lanes, or so that
some of the through lanes can be storage lanes.
A red value indicates an override, while a blue value indicates that the number of storage lanes
is calculated.
Right Turn ChannelizedThis field is active for the rightmost movement. The choices are None, Yield, Free, Stop and
Signal. If this value is changed, it will also be updated for unsignalized analysis.
Synchro does not explicitly model a channelized right turn. If you have coded a signal in
Synchro, it will be modeled as follows in the TIMING settings:

7/21/2019 Synchro Studio 8 User Guide
http://slidepdf.com/reader/full/synchro-studio-8-user-guide 97/559
5-7
None: No right turn channelization.
Yield: No phases are assigned, the saturation flow is that for the RTOR.
Stop: No phases are assigned, the saturation flow is that for the RTOR. Yield and Stopare handled in the same manner.
Free: The phase assigned is 'Free' (100% green time). The saturation flow used is the
permitted saturation flow.
Signal: The movement is controlled by the signal. Set the appropriate turn type and
phase in the TIMING settings.
For unsignalized 2-way or 4-way stop control, each traffic movement is analyzed using theguidelines in HCM 2000 and 2010.
Curb RadiusCurb Radius specifies the horizontal curvature of the street intersection and is measured in feet
from the back of curb to the center point of the radius.
Add Lanes
Add Lanes controls how a right-turn lane enters the intersection street. Setting Add Lanes to
zero (0) creates a yield or merge for drivers completing a right turn. Setting the value to one (1)
adds a continuation lane for the right-turn.
Setting a Storage Length greater than zero creates a right-turn "pocket" on the approach side ofthe intersection. Setting Add Lanes greater than zero extends the right-turn lane on the
departure side of the intersection.
If a channelized right connects to a curved link, the curve points must be placed after
any tangents from a right turn Island; otherwise image distortion will occur.
Slip Lanes for Roundabouts
To code a right turn slip lane at a roundabout for SimTraffic, set the Right Turn Channelized to
Stop, Yield, or Free. SimTraffic will add additional right turn lane(s) to the roundabout, outsideof the Outside Radius. The width of the slip lane is determined by the width of the incoming
right turn lane group.
Th i t fi ld b l h th f ll i ff t

7/21/2019 Synchro Studio 8 User Guide
http://slidepdf.com/reader/full/synchro-studio-8-user-guide 98/559
5-8
The input fields below have the following effect:
Right Turn Channelized = Yield or Stop: Vehicles in slip lane will yield at end of slip
lane if there is a merge.
Right Turn Channelized = Free: Vehicles in slip lane will merge at end of slip lane ifthere is a merge.
Right Turn Channelized = None: No slip lane
Lanes and Sharing: Controls number of lanes in right turn slip lane, and number of
lanes to enter main circle.
Curb Radius (in the SIGNING settings): Has no effect; slip lane controlled by Outside
Radius.
Add Lanes: Slip lane will be add lane(s), provided enough lanes exist downstream.
With a small circle or with tight angles between links, the slip lanes will directly connect to the
roundabout. With a larger circle or angle, the slip lanes will be additional lanes on the outside of
the roundabout with an additional radius.
Alternate MethodIt is also possible to create a slip lane by coding a multilane roundabout with a two lane exit (see
page 7-21). To get a direct slip lane it is necessary to code two lane exits at both the entry and
the exit links. This method works best for creating a slip lane in all directions.
Combining a slip lane with a two lane Exit may give a three-lane exit or other strange results. It
is usually best to use one or the other.
Lane Utilization FactorThe Lane Utilization Factor determines how the traffic volumes assigned to a lane group are
distributed across each lane. A value of one (1) indicates equal distribution across all lanes.
Values less than one lower the saturation flow rate because all lanes are not working at full
capacity. The Lane Utilization Factor is selected from the values in Table 5-2.
If there is an exclusive turning lane plus a shared turning lane, then all of the lanes
will be placed in the through lane group to calculate this factor.
Table 5-2 Lane Utilization Factors
Lane Group Movements # of Lanes Lane Utilization Factor

7/21/2019 Synchro Studio 8 User Guide
http://slidepdf.com/reader/full/synchro-studio-8-user-guide 99/559
5-9
Thru or shared 1 1.00
Thru or shared 2 0.95
Thru or shared 3 0.91
Thru or shared 4+ 0.86
Left 1 1.00
Left 2 0.97
Left 3+ 0.94
Right 1 1.00
Right 2 0.88
Right 3 0.76
This field can be overridden. If, for example, there is a busy shopping center entrance just after
this intersection on the right side, most of the vehicles will be using the right lane and cause a
lower lane utilization factor. If the actual per lane volumes are known, the lane utilization factor
can be calculated as follows:
f LU = Lane Utilization Factor
The f LU is a macroscopic adjustment and will only affect the saturation flow rates.
Changes to this value have no impact on the simulated results in SimTraffic. To
account for unbalanced flow in SimTraffic, be sure to code in the geometric condition
that is causing condition, such as a downstream lane taper.
Right Turn FactorsThe Right Turn Factor is used to reduce the Saturation Flow Rate based on the proportion of
right-turns in the lane group and the type of lane servicing the right-turn. The defaultcalculations from HCM 2000 can be overridden by the user.
Exclusive Lane: f RT = 0.85

7/21/2019 Synchro Studio 8 User Guide
http://slidepdf.com/reader/full/synchro-studio-8-user-guide 100/559
5-10
Shared Lane: f RT = 1.0 - (0.15) PRT
Single Lane: f RT = 1.0 - (0.135) PRT
PRT = Proportion of right turn traffic in lane groupThe permitted right turn factor is used during the through phase for this approach. The protected
right-turn factor is used if an exclusive right-turn lane is provided and a Protected Phase is
assigned from a concurrent left-turn (right-turn overlap signal).
Left Turn Factors
The Left Turn Factors are applied in the HCM Saturated Flow Rate calculation. The default
values are calculated from the formulas below, but these may be overridden by the user. The
Left Turn Factor for exclusive lanes is:
f LT = 0.95
The Left Turn Factor for shared lanes is:
f LT = 1 / (1.0 + 0.05 PLT):
PLT = Proportion of left turn traffic in lane group
For permitted left turns, the calculations are quite involved. Synchro has a complete
implementation of the 2000 HCM permitted left turn model. The permitted left turn factor is
based on actuated green times, the same as the HCM calculation.
The calculation steps are as follows:
Saturation Flows with maximum greens are used for the Ped Bike (see page 5-12) and
Permitted Lefts
Actuated green times calculated
Saturation Flows are recalculated with actuated greens used for Ped Bike and Permitted
Lefts factors
The permitted left turn factor is used for any permitted left turn phase, including the permitted portion of permitted plus protected left turn phasing. The protected left turn factor is used for
protected and split phasing, and for the protected portion of permitted plus protected left turn
phasing.

7/21/2019 Synchro Studio 8 User Guide
http://slidepdf.com/reader/full/synchro-studio-8-user-guide 101/559
5-11
Saturated Flow Rates
The Saturated Flow Rates are the actual maximum flow rate for this lane group after adjustingfor all of the interference factors. The Saturated Flow Rates represent the number of lanes
multiplied by the Ideal Saturated Flow Rate and interference factors due to heavy vehicles,
buses, parking maneuvers, lane widths, area type, grade, and turning movements.
The Saturated Flow Rates are used in capacity and delay calculations, and for optimization
calculations. The Saturated Flow Rates are not used for simulation modeling in SimTraffic or
CORSIM.
These fields are calculated but can be overridden.
The saturation flow rate is based on:
S = So * N * Fw * Fn * Fhv * Fg * Fp * Fbb * Fa * Flu * Flt * Frt * FLpb * FRpb
where:
S = saturation flow rate for the subject lane group, expressed as a total for all lanes in
the lane group, veh/h‟
So = base saturation flow rate per lane, pc/h/In,
N = number of lanes in the lane group,
Fw = adjustment factor for the lane width,
There is a permitted and a protected Saturated Flow Rate. For left and through lane
groups the permitted Saturated Flow Rate is used when left turns are permitted and
the protected Saturated Flow Rate is used when left turns are protected. For right
turn lane groups, the permitted flow rate is used with permitted and free right turn
phases. The protected flow rate is used with protected signal indication that overlap
with a non-conflicting protected left-turn phase.
Fhv = adjustment factor for heavy vehicles in the traffic stream,
Fg = adjustment factor for approach grade,
Fp = adjustment factor for the existence of a parking lane and parking activity adjacentto the lane group,
Fbb = adjustment factor for the blocking effect of local buses that stop within the
intersection area
7/21/2019 Synchro Studio 8 User Guide
http://slidepdf.com/reader/full/synchro-studio-8-user-guide 102/559
5-12
intersection area,
Fa = adjustment factor for area type,
Flu = adjustment factor for lane utilization,
Flt = adjustment factor for left turns in the lane group,
Frt = adjustment factor for right turns in the lane group,
FLpb = pedestrian adjustment factor for left-turn movements, and
FRpb = pedestrian/bicycle adjustment factor for right-turn movements.
Right Ped Bike FactorThis factor is calculated based on the number of pedestrians and bicycles that are crossing the
right turn movement. The factor takes into account the amount of green time for the pedestrians
and the bicycles as well as the number of downstream receiving lanes. For a complete
description of the FRpb calculation, see the HCM.
The Ped Bike factor used by Synchro has a slight variation from the HCM generated Ped Bike
factor for permitted plus protected movements. Synchro does not adjust for the proportion ofright turns using the protected phase (Prta) but calculates separate Saturated Flow Rates for
permitted and protected movements. The Ped Bike factor shown on the LANE settings and on
the Intersection reports is for permitted phases only and is only applied to the Permitted
Saturation Flow rate.
The Ped Bike factor shown in the HCM Signals report is calculated based on the manual‟s
methods and may vary for permitted plus protected movements. The HCM Ped Bike factor is
applied to both permitted and protected saturation flow rates.
For through and left lane groups with right turn traffic, the Ped Bike factor will be applied to all
phases. Synchro assumes right turns are always permitted not protected from a left or through
lane group. Always code through phases as protected, except at unusually aligned intersections.
Left Ped Factor
This factor is calculated based on the number of pedestrians and bicycles that are crossing the
permitted left turn movements. The factor takes into account the amount of green time for the
pedestrians and vehicles, the amount of oncoming traffic and the number of downstream
receiving lanes. For a complete description of the FLpb calculation, see the HCM 2000, Chapter
16, Appendix D.
7/21/2019 Synchro Studio 8 User Guide
http://slidepdf.com/reader/full/synchro-studio-8-user-guide 103/559
5-13
pp
The Ped factor used by Synchro has a slight variation from the HCM generated Ped factor for
permitted plus protected movements. Synchro does not adjust for the proportion of left turns
using the protected phase (Plta), but calculates separate Saturated Flow Rates for permitted and protected movements. The Ped factor shown on the LANE settings and on the Intersection
reports is for permitted phases only and is only applied to the Permitted Saturation Flow rate.
The Ped factor shown in the HCM Signals report is calculated based on the manual‟s methods,
and may vary for permitted plus protected movements. The HCM Ped factor is applied to both
permitted and protected saturation flow rates.
Right Turn on Red (RTOR)
This field is used to specify whether Right Turns on Red (RTOR) are allowed. This field can
also be used to allow Left Turns on Red from a one-way to a one-way.
Synchro fully models Right Turns on Red. Synchro automatically calculates a Saturated Flow
Rate for RTOR and applies this flow rate to movements when they are red. See Saturated Flow
Rate (RTOR), page 5-15 for details on its calculation.This field is also used when modeling in SimTraffic and CORSIM.
The following four options are provided to model right turns on red and free right turns.
1. For exclusive or shared right lanes, set Right Turns on Red to Yes in the LANE
settings. Synchro will calculate a RTOR Saturated Flow Rate and apply this flow rate
during all red times. Each vehicle must stop and wait for a gap, the maximum RTOR
saturation flow rate is about 1091 vphpl.
2. For exclusive right lanes (not shared lanes), set the Turn Type to Free in the TIMING
settings. Synchro will assume that right turns will move unimpeded at all times. Use
Free Rights only when the turns move into their own acceleration lane and there are
minimal pedestrians.
3. For exclusive right lanes (not shared lanes), set the Turn Type to Permited+Overlap in
the TIMING settings. Synchro will assume right turns move with a green ball and
receive an overlapping arrow during compatible left turn phases. Use Free Rights
only when the signal has a right turn arrow. Overlapped right turns can be used
together with Right Turn on Red.
4. Reduce the input volumes to account for Right Turns on Red. This is the method
prescribed by the HCM for modeling RTOR Reducing the input volumes will change
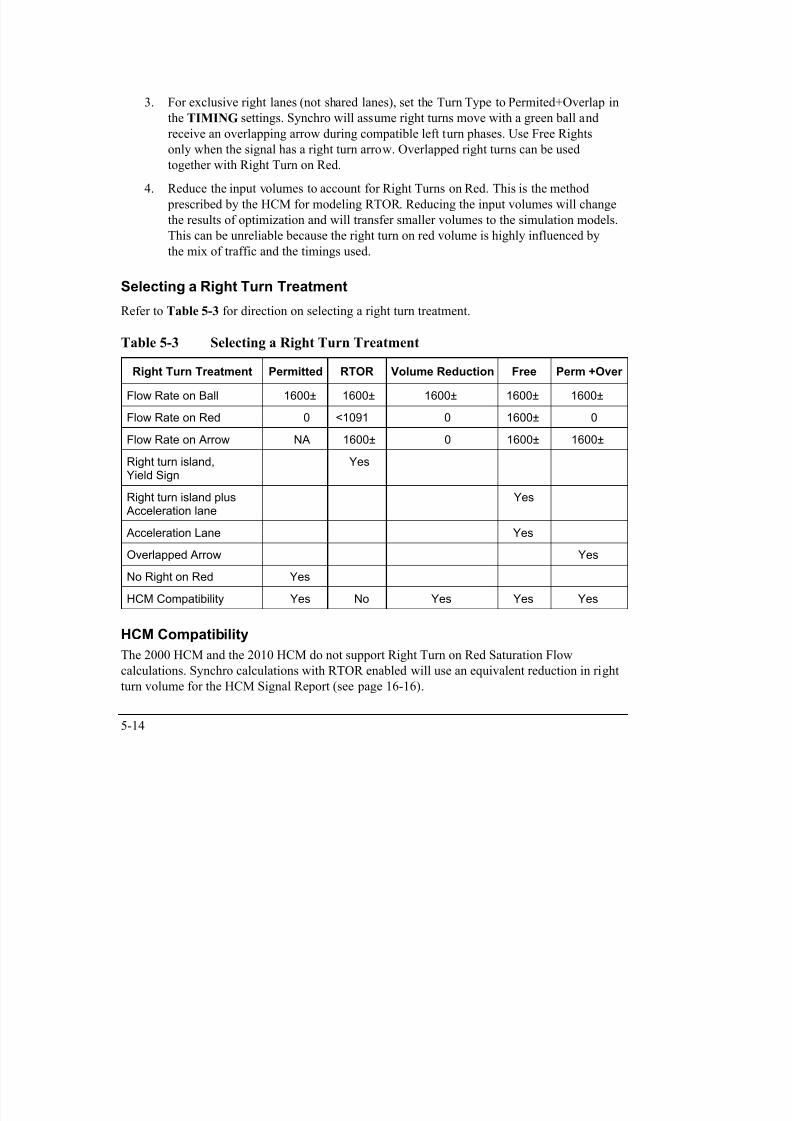
7/21/2019 Synchro Studio 8 User Guide
http://slidepdf.com/reader/full/synchro-studio-8-user-guide 104/559
5-14
prescribed by the HCM for modeling RTOR. Reducing the input volumes will change
the results of optimization and will transfer smaller volumes to the simulation models.
This can be unreliable because the right turn on red volume is highly influenced by
the mix of traffic and the timings used.
Selecting a Right Turn Treatment
Refer to Table 5-3 for direction on selecting a right turn treatment.
Table 5-3 Selecting a Right Turn Treatment
Right Turn Treatment Permitted RTOR Volume Reduction Free Perm +Over
Flow Rate on Ball 1600± 1600± 1600± 1600± 1600±
Flow Rate on Red 0 <1091 0 1600± 0
Flow Rate on Arrow NA 1600± 0 1600± 1600±
Right turn island,Yield Sign
Yes
Right turn island plus Acceleration lane
Yes
Acceleration Lane Yes
Overlapped Arrow Yes
No Right on Red Yes
HCM Compatibility Yes No Yes Yes Yes
HCM Compatibility
The 2000 HCM and the 2010 HCM do not support Right Turn on Red Saturation Flow
calculations. Synchro calculations with RTOR enabled will use an equivalent reduction in right
turn volume for the HCM Signal Report (see page 16-16).
The RTOR calculations are based on an internally developed model based on the HCM gap
acceptance formula for right turns. The RTOR saturation flow rates calculated by Synchro
provide similar results to the HCM method of reducing right-turn volumes to account for right
turns on red. This approach improves simulation results because traffic volumes are not
deducted from the model.
Saturation Flow Rate (RTOR)

7/21/2019 Synchro Studio 8 User Guide
http://slidepdf.com/reader/full/synchro-studio-8-user-guide 105/559
5-15
Saturation Flow Rate (RTOR)Synchro automatically calculates Saturation Flow rate for Right Turns on Red. This
Saturation Flow Rate is applied to a movement whenever the movement has a red signal. This
calculation is also made for Left Turns on Red crossing one-way streets.
The calculation of the RTOR Saturation Flow Rate is quite complex and is based on the signal
timing, the volumes of the subject approach, and the volumes of any merging approaches.
It is possible to override the RTOR Saturation Flow Rate to a measured value or hand calculated
value. Overriding RTOR Saturation Flow is not recommended because overridden values will
not be updated when the volumes or signal timings change. The RTOR Saturation Flow is very
sensitive to changes in volumes and timings.
sRTOR = Minimum(sRTOR1, sRTOR2) = RTOR Saturation Flow Rate
sRTOR1 = saturation flow rate based on gaps in merging traffic
sRTOR2 = limit to saturation flow rate based on through traffic blocking access to stop
bar
If the RTOR volume is measured in the field, it can be used to calculate the sRTOR for Synchro based on the following:
sRTOR = vRTOR * C/r
r = red time, s
C = Cycle Length
vRTOR = Field Measured RTOR
For example, say 100 vph is the field measure RTOR volume, the movement red time is 80
seconds and the cycle is 120 seconds. Then,
sRTOR = 100 * (120/80) = 150
Gap Acceptance Calculation
The Saturation Flow Rate is calculated for each timing interval while the subject movement is
red. Separate interval calculations are provided to account for merging through, merging leftturn and intervals with no conflicting movements.
)3600/3.3*(
)3600/2.6(
1 vxi
vx
e
evxi sRTORi
= saturation flow rate for each timing interval

7/21/2019 Synchro Studio 8 User Guide
http://slidepdf.com/reader/full/synchro-studio-8-user-guide 106/559
5-16
1 e
sRTORi = 1091, when vxi = 0
Ri = length of timing interval iC = cycle length
vxi = vx * sxi * C / (sxi*Ri) = merging volume during timing interval i
sxi = saturation flow rate for movement x during interval i
sRTOR1 = (sRTORi * Ri) / Sum(Ri)
The combined RTOR Saturation Flow Rate 1 (sRTOR1) is a time weighted average of each
sRTORi calculated for each red interval. The formula for sRTORi is taken from the HCM
Unsignalized chapter and assumes a gap time of 6.2 s and a follow-up time of 3.3 seconds. The
maximum flow rate with zero conflicting vehicles assumes one vehicle every 3.3 seconds or
1091 vph.
Conflicting pedestrian volumes are added into the merging vehicle volumes, vxi.
The conflicting volume rates (vxi) assume that conflicting flows will be divided proportionatelyamong the conflicting flows green times and saturation flow rates. For example, the conflicting
movement is a permitted plus protected left turn with the following values:
vL = left turn volume = 300 vph
R1 = permitted green = 20 s
sL1 = permitted saturation flow = 900 vph
R2 = protected green = 10 s
sL2 = protected saturation flow = 1800 vph
C = cycle length = 60 s
vL1 = permitted volume = 300 * 900 * 60 / (900 * 20 + 1800 * 10) = 450 vph
vL2 = protected volume = 300 * 1800 * 60 / (900 * 20 + 1800 * 10) = 900 vph
The conflicting through movement has the following:
vT = through volume = 1000 vph
R3 = permitted green = 20 s
vT3 = 1000 * 1000 * 60 / (1000 * 20) = 3000 vph
Th lti t t d fl l l ti f ll

7/21/2019 Synchro Studio 8 User Guide
http://slidepdf.com/reader/full/synchro-studio-8-user-guide 107/559
5-17
The resulting saturated flow calculations are as follows:
vx1 = NA, this is a green interval for subject movement
vx2 = vL2 = 900 vph
sRTORi2 = 900 * exp(-900 * 6.2 /3600) / [1 - exp(-900 * 3.3/3600] = 340
vx3 = vT3 = 3000 vph
sRTORi3 = 3000 * exp(-3000 * 6.2/3600) / [1 - exp(-3000 * 3.3/3600] = 18
sRTOR1 = [340 * 10 + 18 * 20] / (10+20) = 126 vph
Shared Lane Blocking Calculation
The RTOR Saturation Flow Rate is limited because through traffic may block right traffic from
reaching the stop bar. sRTOR2 is based on the average maximum number of right lane vehicles
served before through traffic is blocked. This calculation is performed for both shared lanes and
for exclusive right turn lanes in a storage bay.
sRTOR2 = vR/vTh * (storage +1) * 3600 / R = blocking limit to saturation flow ratevR = right turn volume
vTh = non-right volume in lane
storage = length of storage bay in vehicles (not multiplied by number of lanes)
R = length of entire red time
Exclusive Right Lane No Storage
For an exclusive right turn lane without storage restriction, the sRTOR2 calculation is not
performed.
Exclusive Right Lane with Storage
storage = length / vehicle length
For an exclusive right turn lane with storage, storage is equal to the number of vehicle lengths of
the storage bay. If the storage bay is 100 feet and it takes 5 through vehicles to block right turns,
storage will be 5.
The non-right volume is equal to the non-right volume in the rightmost through lane.
vTh = vTot / (lanes * laneUtFact) = non-right volume in lane
vTot = total volume in through lane group
7/21/2019 Synchro Studio 8 User Guide
http://slidepdf.com/reader/full/synchro-studio-8-user-guide 108/559
5-18
lanes = number of lanes in lane group
laneUtFact = lane utilization factor for through lane group
If the through lane group has volume of 1000 vph, 2 lanes, and laneUtFact = 0.95:
vTh = 1000 / (2 *0.95) = 526.
If vR = 200 and R = 60 s, the result sRTOR2 is
sRTOR2 = 200/526 * (5+1) * 3600 / 60 = 137 vph
Shared Through-Right Lane
In a shared lane, the storage is zero. If there is a flared right, or right turns can bypass 2 or 3 cars
in parking lane, consider coding a right turn lane with storage of 25 to 75 feet to approximate
actual conditions in the field.
vTh = (vTot) / (lanes * laneUtFact) - vR = non-right volume in lane
vTh must be greater then (vTot -vR) * 0.2. This insures that at least some through traffic isin the right lane.
For example:
vTot = 1200
vR = 400
lanes = 2laneUtFact = 0.95
R = 60 s
vTh = 1200 / (2 * 0.95) - 400 = 231
vTh (1200 - 400) * 0.2 = 160, check OK
sRTOR2 = 400/231 * 1 * 3600 / 60 = 104 vph
sRTOR2 must be less or equal to vR, otherwise non-right traffic will be moving during red.
Link is HiddenThe LANE SETTINGS screen has a Link Is Hidden checkbox for each link (street) If the
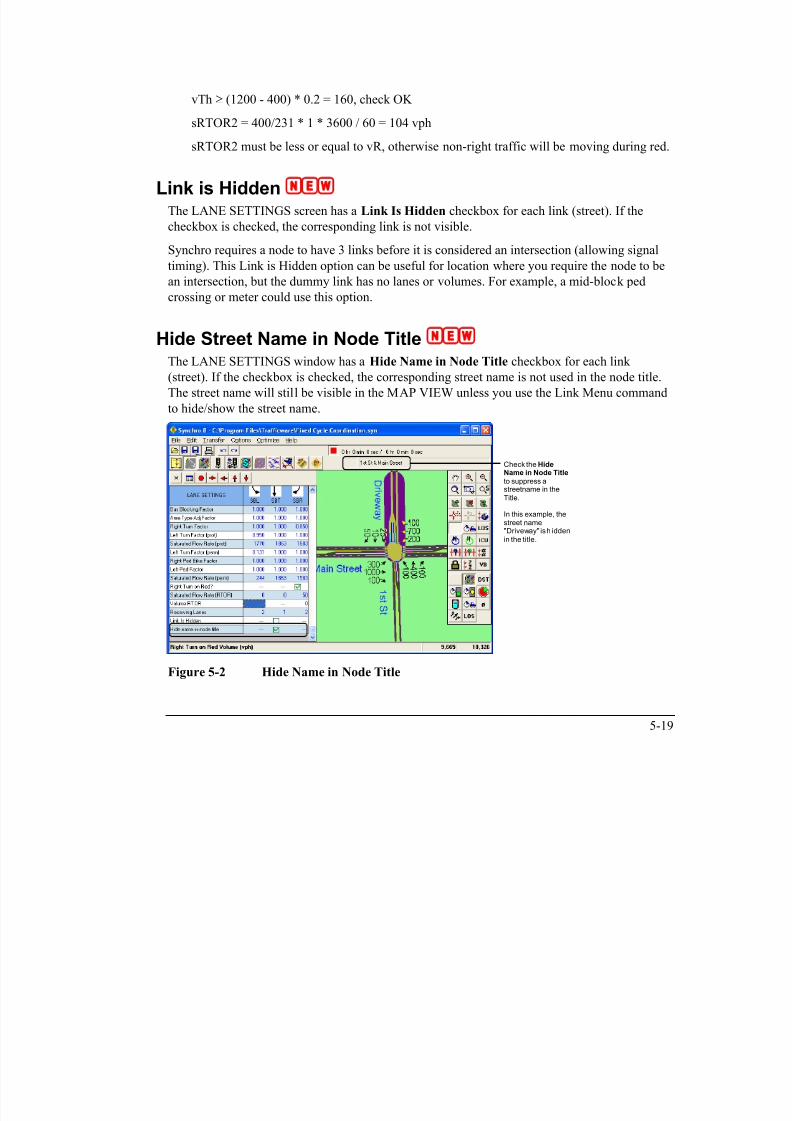
7/21/2019 Synchro Studio 8 User Guide
http://slidepdf.com/reader/full/synchro-studio-8-user-guide 109/559
5-19
The LANE SETTINGS screen has a Link Is Hidden checkbox for each link (street). If the
checkbox is checked, the corresponding link is not visible.
Synchro requires a node to have 3 links before it is considered an intersection (allowing signal
timing). This Link is Hidden option can be useful for location where you require the node to be
an intersection, but the dummy link has no lanes or volumes. For example, a mid-block ped
crossing or meter could use this option.
Hide Street Name in Node TitleThe LANE SETTINGS window has a Hide Name in Node Title checkbox for each link
(street). If the checkbox is checked, the corresponding street name is not used in the node title.
The street name will still be visible in the MAP VIEW unless you use the Link Menu command
to hide/show the street name.
Check the HideName in Node Title
to suppress astreetname in the
Title.
In this example, thestreet name"Driveway" is h idden
in the title.
Figure 5-2 Hide Name in Node Title

7/21/2019 Synchro Studio 8 User Guide
http://slidepdf.com/reader/full/synchro-studio-8-user-guide 110/559
Chapter 6 – Volume Settings
From the MAP view, click on the desired intersection with the Right mouse button and selectVOLUME Settings.
From anywhere in the program, press [F8] and select the desired intersection from the
list. Then push the Volume Settings button or the [F4] key.
The VOLUME settings display a grid in which you can enter volume information See Chapter

7/21/2019 Synchro Studio 8 User Guide
http://slidepdf.com/reader/full/synchro-studio-8-user-guide 111/559
6-1
The VOLUME settings display a grid in which you can enter volume information. See Chapter
3 for details on navigating the data entry screens.
Figure 6-1 VOLUME Settings
Refer to page 5-2 for details on the Lanes and Sharing setting.
Traffic Volumes
In the appropriate Traffic Volume cells, enter the traffic volumes for each movement in
vehicles per hour.Synchro models the hourly volumes provided for one design period. However, you may model
multiple design periods using the UTDF Volume table.
If you have volume counts in TMC format, it is possible to import them automatically into the
UTDF Volume table

7/21/2019 Synchro Studio 8 User Guide
http://slidepdf.com/reader/full/synchro-studio-8-user-guide 112/559
6-2
UTDF Volume table.
To create a new column for U-turns, type [Ctrl] + [U].
Conflicting PedestriansEnter the number of pedestrians, per hour, that conflict with permitted right turn movements.
This number affects the Right Ped Bike Factor (see page 5-12) and the Saturated Flow Rate (see
page 5-11) shown in the LANE settings for the permitted right turns. If right turns are protected
from pedestrians due to an island, or if no pedestrians are allowed during this approach's through
phase, then enter zero.
Do not confuse this field with the Pedestrians Calls setting in the PHASING settings.
Conflicting Pedestrians are the number of pedestrians that right turning traffic must
yield to. Pedestrian Calls are the number of pedestrians activating this phase. These
two values will be the same if there is only one pedestrian per ped call.
It is necessary to enter conflicting pedestrians for permitted left turns. These should
be the number of pedestrians crossing the destination link.
Conflicting Pedestrians affect the Ped-Bike Factor in the LANE settings. Increasing the number
of conflicting pedestrians and bicycles reduces the saturated flow rate of right turns and left
turns conflicting with these movements.
To set a default pedestrian value for newly created intersections, or to change all of the
pedestrians, use the Options Network Settings command.
Conflicting Bicycles
Enter the number of through bicycles that conflict with right turns. If bicycles cross the right
turn traffic ahead of the intersection, enter 0. This input will affect the Right Ped-Bike factor inthe LANE settings.
Conflicting Bicycles do not need to be entered for left turns. It is assumed that they will clear
during the queue clearance time for vehicles.

7/21/2019 Synchro Studio 8 User Guide
http://slidepdf.com/reader/full/synchro-studio-8-user-guide 113/559
6-3
Peak Hour Factor The traffic volumes are divided by the Peak Hour Factor (PHF) to determine the traffic flow
rate during the busiest 15-minute period during the hour. For example:
Hourly Flow Rate: 1000 vph
Peak Hour Factor: 0.9
Adjusted Peak Flow Rate: 1000 / 0.9 = 1111 vph
The HCM 2000 Chapter 10 recommends, "In the absence of field measurements of peak-hourfactor (PHF), approximations can be used. For congested conditions, 0.92 is a reasonable
approximation for PHF. For conditions in which there is fairly uniform flow throughout the peak
hour but a recognizable peak does occur, 0.88 is a reasonable estimate for PHF." If you have 15-
minute counts, you can use the highest counts and a PHF of one.
If the Analysis Period is set to a value of greater than 15 minutes, the PHF will be set to 1.0 and
cannot be changed. The Analysis Period can be modified using the Options Network-Settings
command.
The default PHF is 0.92 following the guidelines of HCM 2000. The user may change the
default or reset existing Peak Hour Factors in the current data set under Options Network-
Settings. The range of PHF in Synchro is 0.25 to 1.00.
Note that 15-minute traffic volumes read from a UTDF Volume file automatically recalculate
PHF for each volume period.
If traffic arrivals fit a Poisson distribution, probability suggests using the values in Table 6-1 for
the PHF. This assumes the highest 15-minute period is the 87.5 percentile based on average 15-
minute periods of the hour.
Table 6-1 Suggested Peak Hour Values
Total Approach Volume PHF
2000 vph 0.95
1000 0.93
500 0.92
200 0.87
100 0.83

7/21/2019 Synchro Studio 8 User Guide
http://slidepdf.com/reader/full/synchro-studio-8-user-guide 114/559
6-4
50 0.78
If the upstream intersection is at capacity for the entire peak hour, use a PHF of 1.0.
It is important to understand that the variance of traffic increases as the volume decreases.
Therefore, lower traffic volumes create greater fluctuations in 15-minute volume levels which
tends to increase PHF.
If a large factory or sports arena releases all of its vehicles at once, the traffic may have a large
spike and a lower PHF should be used.
Growth Factor The Growth Factor can be used to adjust traffic volumes using a range from 0.5 to 3.0. The raw
volume data is multiplied by the Growth Factor when calculating Adjusted Volumes and Lane
Group Volumes.
To calculate a Growth Factor (GF) based on a growth rate over several years, use the following
formula.
GF = (1+r)Y
r = growth rate
Y = number of years
For example, the growth factor for 3% growth over 10 years is:
GF = (1 + 0.03) 10 = 1.34
Heavy Vehicles
Heavy Vehicles (%) under the VOLUME settings represents the percentage of trucks and buses
for each traffic movement. Increasing this value decreases the Saturated Flow Rate shown inthe LANE settings. The default for this field is 2%.
Heavy Vehicle percentages are modeled explicitly in SimTraffic, but do not affect the turning
percentages when transferring to CORSIM.
To set a default for newly created intersections or change all of the Heavy Vehicle Factors, use
7/21/2019 Synchro Studio 8 User Guide
http://slidepdf.com/reader/full/synchro-studio-8-user-guide 115/559
6-5
the Options Network-Settings command.
The Heavy Vehicle Factor is:
Fhv = 100/[100 + % hv (Et – 1)]
where:
Fhv = heavy vehicle adjustment factor
% hv = % heavy vehicles for lane group volume
Et = 2.0 pc/hv
Bus Blockages
Enter the number of buses per hour that stop and actually block traffic. Increasing this factor
lowers the Saturated Flow Rate shown in the LANE settings. The default for this field is zero
buses per hour. Enter Bus Blockages for each lane group that is affected by the blockage.
The bus blockages factor is calculated by:
Fbb = [N-(14.4Nb/3600)]/N
where:
Fbb = bus blockage factor
N = number of lanes in lane group
Nb = number of buses stopping/h
Adjacent Parking Lane, Parking Maneuvers
If there is on street parking for this approach, check the box for Adjacent Parking Lane and the
number of maneuvers per hour for Parking Maneuvers. Increasing the number of parkingmaneuvers lowers the Saturated Flow Rate shown in the LANE settings. The default for this
field is "No" adjacent parking lane which does not reduce Saturated Flow Rate. Setting the field
to "Yes" reduces Saturated Flow Rate even if the number of parking maneuvers per hour is
coded to zero. Therefore, only code a "Yes" value if on-street parking actually impedes traffic
flow
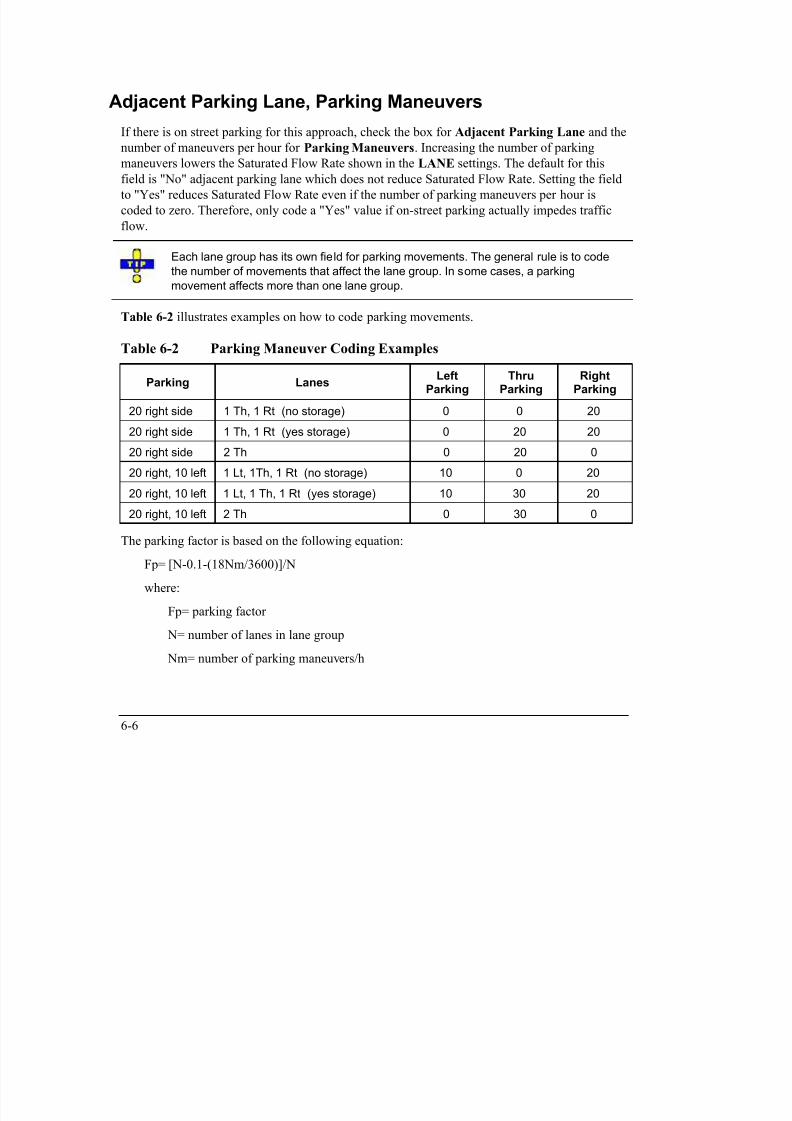
7/21/2019 Synchro Studio 8 User Guide
http://slidepdf.com/reader/full/synchro-studio-8-user-guide 116/559
6-6
flow.
Each lane group has its own field for parking movements. The general rule is to codethe number of movements that affect the lane group. In some cases, a parking
movement affects more than one lane group.
Table 6-2 illustrates examples on how to code parking movements.
Table 6-2 Parking Maneuver Coding Examples
Parking Lanes LeftParking
ThruParking
RightParking
20 right side 1 Th, 1 Rt (no storage) 0 0 20
20 right side 1 Th, 1 Rt (yes storage) 0 20 20
20 right side 2 Th 0 20 0
20 right, 10 left 1 Lt, 1Th, 1 Rt (no storage) 10 0 20
20 right, 10 left 1 Lt, 1 Th, 1 Rt (yes storage) 10 30 20
20 right, 10 left 2 Th 0 30 0
The parking factor is based on the following equation:
Fp= [N-0.1-(18Nm/3600)]/N
where:
Fp= parking factor
N= number of lanes in lane group
Nm= number of parking maneuvers/h
Traffic from Mid-block
The Traffic from mid-block field identifies vehicles originating from mid-block sources
between the current intersection and the last upstream intersection modeled in Synchro. A valueof 50 indicates that 50% of the traffic is from mid-block sources. A value of zero indicates that
0% of the traffic is from driveways and 100% of the traffic came from the upstream signal. This
information is used during optimization and when calculating delays. If volumes for a link
originate primarily from mid-block sources, the reduction in delay from signal optimization will
not will not be as great if the traffic originated from an upstream signal.

7/21/2019 Synchro Studio 8 User Guide
http://slidepdf.com/reader/full/synchro-studio-8-user-guide 117/559
6-7
Unbalanced Traffic Between IntersectionsMany times the sum of traffic volumes entering a link at an upstream intersection does not equal
the sum of traffic volumes at the downstream end of the link. This can occur when the volume
data was collected at different times, or due to a mid-block traffic source or sink. Growth Factor
and PHF values also affect the net volume balance between adjacent intersections.
To see the volume balance between intersections, click on the [VB] button on the MAP view.
Refer to page 2-23 for details.
The following procedure is used by SimTraffic to resolve any imbalances between the volumes
specified in the LANE settings and the mid-block volumes specified in the VOLUME settings.
VU = sum of flows entering upstream. For an eastbound link, they would be EBT, NBR,
plus SBL.
VD = sum of flows exiting downstream. For an eastbound link, they would be EBT, EBR,
plus EBL.MD = percentage of mid-block traffic entered in Volume settings
VM = max(VD * MD, VD - VU * 1.3 ) = Mid-block traffic entering
VX = max(0, VU - VD - VM) = Mid-block traffic exiting
If upstream traffic is less than non-user-entered mid-block traffic, the upstream traffic flows will
be scaled up to a maximum of 30%. Beyond 30% the traffic balance is assumed to come from
mid-block sources and the mid-block entries are scaled upwards.
If upstream traffic exceeds downstream plus mid-block traffic, a mid-block sink is assumed.
Any extra vehicles will be entering the sink.
For SimTraffic, upstream volumes cannot be scaled upward. Thus, any imbalance is assumed to
be mid-block entries.
CORSIM provides one mid-block source per link that either serves as a source or a sink. A
source or sink card is created whenever upstream and downstream volumes do not balance.
Here is an example:
VU = 100
VD = 200
7/21/2019 Synchro Studio 8 User Guide
http://slidepdf.com/reader/full/synchro-studio-8-user-guide 118/559
6-8
MD = 10%
MD = max(200 * 0.1, 200 - 100 * 1.3) = 70
VX = 0
S = (VD - MD)/VU = scaling factor
The flows from upstream are thus scaled upwards by 1.3.
The peak flow at the beginning of green upstream is 4000 vph. This flow would be scaled by 1.3
to 5200 vph downstream and cause a spike in queue and delay. Therefore, it is important that
volumes are scaled and mid-block flows are entered correctly. If mid-block traffic is entered as
60%, the upstream volumes would be scaled by 0.8 and the peak flow downstream would be a
more reasonable 3200 vph.
In the above example, SimTraffic and CORSIM would assume mid-block source of 100
vehicles per hour.
Link Origin Destination (O-D) Volumes
Purpose
Link Origin-Destination (O-D) Volumes allow detailed control over the origin and destination of
two adjacent intersections. Link O-D Volumes can be used to reduce or eliminate certain turn
combinations. The most common use is to specify the number of vehicles from an off rampcompleting a U-turn at a freeway interchange.
The LINK ORIGIN-DESTINATION VOLUMES settings display Movement Weighting
Factors that control how volume is allocated between input and output volumes.
To activate the LINK ORIGIN-DESTINATION VOLUMES settings, go to the VOLUME
settings for node that has an adjacent intersection and choose the appropriate button. For
external links, the button will not be available.

7/21/2019 Synchro Studio 8 User Guide
http://slidepdf.com/reader/full/synchro-studio-8-user-guide 119/559
6-9
Figure 6-2 LINK ORIGIN-DESTINATION VOLUMES Settings
When to Use
Use on short links, less than 300 ft (90m) long.
Multiple intersections controlled by a single controller (Group Control).
Between intersections of a freeway interchange.
In the median of a wide arterial.
Between nodes of a "dog-legged" intersection. (Two closely spaced „T‟ intersections.)
The Link Volume Balancer is also helpful to make sure upstream and downstream
volumes match and to make adjustments so that they do match.
When to Skip
External links.
Links over 1000 feet (300m) long. Most links over 300 feet (90m) long.
When origins and destinations have nearly equal "attractions".
For the majority of links, Link O-D Volumes are not needed. In most cases, Link O-D
Volumes make little difference to the timing plan optimization. Collecting Origin
Destination traffic data is labor intensive and cannot be automated.
By default, Synchro assumes origin-destination volumes are proportional to the origin and
destination volumes for each O-D pair multiplied together. This assumption matches actual

7/21/2019 Synchro Studio 8 User Guide
http://slidepdf.com/reader/full/synchro-studio-8-user-guide 120/559
6-10
p p g p
traffic in most cases.
To Activate
Link O-D Volumes are available for both directions on links that connect two intersections. The
Link O-D Volumes are available from the VOLUME settings. All approaches that connect to an
intersection have a button available in the Link O-D Volumes row. To activate
the LINK ORIGIN-DESTINATION VOLUMES settings, click on this button
or press the [space bar] if the Link O-D Volumes button is in focus.
The Link O-D Volumes buttons appear with a black caption when all Movement Weighting
Factors are 1. If one or more Movement Weighting factors have been changed, then Link O-D
Volumes button appears with a red caption.
Layout
There is one column for each destination turn on the link. There is also a column listing the sink
volume, or the traffic that turns off the network on this link.
There are two rows for each origin turning movement at the upstream intersection. There are
also two rows listing midblock traffic, or traffic entering the network on this link. The upper row
lists the traffic volumes for the origin-destination pair; the lower row lists the Movement
Weighting Factor for the origin destination pair; the volumes shown on these settings are
adjusted for growth, but not PHF. Volumes shown on the map and volume balance will also
show volumes adjusted for growth, but not PHF. This is done so that the volumes match what
the user entered unless growth is used, which is not very common.
Cells in the top row can be used to set the actual volumes at the downstream intersection. Cells
in the left column can be used to set the actual volumes at the upstream intersection.
The left cell in the From Mid-Block Volume row can be used to set the midblock traffic. This
value changes the percent mid-block setting found in the VOLUME settings. It is not possible
to set this value exactly; the resulting volume will be within 1% of the total link volume.
The sink traffic cannot be entered or overridden. It is calculated based on the upstream,
downstream and mid-block traffic volumes. Reading the sink and mid-block traffic volumes can
be used to determine if input volumes are balanced between upstream and downstream
intersections.
Entering the volume or the weighting factor can set traffic for individual origin-destination

7/21/2019 Synchro Studio 8 User Guide
http://slidepdf.com/reader/full/synchro-studio-8-user-guide 121/559
6-11
movements. The weighting factor is the value stored in the file, the movement volume is
calculated. Movement volumes are adjusted to balance volumes between origins anddestinations so it may not be possible to get the exact volume desired. It may take multiple
entries with movement volumes or weighting factors to get the desired results.
Differences in traffic volumes under 30 vph will have a negligible effect on optimization
results. Do not be overly concerned with getting the exact numbers.
Approximations are usually good enough. It is normally sufficient to set weighting
factors to 0.1 for movements to squelch and leave the other weighting factors at 1.
Do not be overly concerned about collecting origin-destination traffic data. In most
cases, common sense about the area's traffic patterns and land use will yield a good
guess at the origin-destination patterns. For example, traffic rarely exits a freeway and
enters in the opposite direction. Similarly, traffic from a residential collector to a
residential collector may be less common than traffic patterns in other areas.
Avoid setting weight factors to zero. It may appear no one makes two left turns in a row undernormal circumstances. However, with a road closure, the majority of traffic might be turning
around.
Do not set all the factors in a row (or a column) to zero. This will cause zero traffic from an
origin (or to a destination) to be generated.
BackgroundLink O-D volumes provide control over vehicle paths through multiple intersections. An
alternate method for specifying this type of data is to have a grid of origins and destinations for
all entrances and exits of two or more intersections. An O-D matrix is like the Link Volume
Balancer but contains all the entrances and exits for several intersections, rather than for a single
link.
O-D matrices are good for controlling traffic through a cluster of 3 or more closely spaced nodes
such as for a roundabout. O-D matrices are also good for specifying traffic demand without
specifying the actual route for applications involving dynamic traffic assignment. O-D matrices
are used extensively in large area planning models.
O-D matrices require the collection of a lot of traffic data. Vehicle paths must be observed
through two or more intersections. This type of data is impossible to collect automatically with
detectors or other devices.
Synchro uses the Link Volume weighting for individual links. The Weighting Factors allow O-
D l b l l d f i i i Thi ll i d ll i
7/21/2019 Synchro Studio 8 User Guide
http://slidepdf.com/reader/full/synchro-studio-8-user-guide 122/559
6-12
D volumes to be calculated from intersection turning counts. This allows easier data collection
and even data collection through automatic detectors. Turning movement data can be collectedfor many time periods and the O-D volumes are estimated based on the weighting factors.
Link O-D Volume Calculations
All volumes in this discussion are adjusted for growth and PHF. Traffic volume balancing is
subject to the following rules:
Vu = (Vi) = volume from upstream intersectionVi = volume from upstream movement i
Vd = (Vd) = volume to downstream intersection
Vj = volume to downstream movement j
Vm = max(Vd - Vu, Vd * %MB) = volume entering mid-block, can be calculated or
set with %MB
%MB = percent of traffic entering mid-block, input in VOLUME settings
Vt = Vd + Vm = total link volume
Vx = Vt - Vd = sink volume, always calculated
Wij = movement weight factor from origin i to destination j
Vij = volume from origin i to destination jVij = Wij * Vi * Vj / Vt = initial calculation, before adjustment to balance volumes
Mid-block Volume is a valid origin I. Sink Volume is a valid destination J.
Movement Volumes (Vij) are adjusted iteratively so that origin and destination volumes are
balanced for each IJ movement. Due to volume balancing, Movement Volumes will not usually
be proportionate to the Weight Factors. Volume balancing also limits the range of deviation for
each IJ movement from its normally weighted value.
By default, all Weight Factors (Wij) are 1 and traffic is allocated in proportion to origin and
destination traffic for each movement.
Adjusted Flow
The Adjusted Flow (vph) is the entered volume modified by the Peak Hour Factor and Growth
Factor

7/21/2019 Synchro Studio 8 User Guide
http://slidepdf.com/reader/full/synchro-studio-8-user-guide 123/559
6-13
Factor.
This field cannot be overridden.
Traffic in Shared LaneTraffic volumes assigned to exclusive and shared lane are proportioned to each lane as follows.
Vehicles are counted as passenger car equivalents (PCE) as follows
Throughs: 1
Rights: 1.18
Protected Lefts: 1.05
Permitted Lefts: 1 / [0.95 * (900 – vOp)/900], (max 6.67)
Permitted plus protected Lefts: 2/ [0.95 + 0.95 * (900 – vOp)/900], (max 1.82)
vOp = through volume opposed.
Traffic is assigned so that PCEs are balanced between lanes. The assignment of traffic to the
shared lane is between 10% and 90% of the turning traffic.
This simplified left turn factor removes the interdependence of lane assignments from the
permitted left turn factor (see page 5-10) calculation. As a practical matter, the need for a
permitted left-turn factor is somewhat nullified by this lane assignment procedure.
This value can be overridden to control lane assignment in Synchro. Changes to this setting will
not impact the simulation.
Lane Group Flow
The Lane Group Flow combines the Adjusted Flow and Traffic in Shared Lane (%) values to
assign net volumes to each lane group.
If there are no turning lanes, the turning volume is assigned to the through lane group. The
shared lanes are part of the through lane group and the exclusive lanes are part of those
movements' lane groups.
If an approach has a shared turning lane and an exclusive turning, the Adjusted Flow value in
the exclusive turn lane is reduced by the Traffic in Shared Lane (%) value for that lane. The
7/21/2019 Synchro Studio 8 User Guide
http://slidepdf.com/reader/full/synchro-studio-8-user-guide 124/559
6-14
through movement corresponding with the shared lane is increased by this same value. These
are calculated fields and cannot be overiden by the user.
Chapter 7 – Timing/Signing Settings
Timing Settings
From the MAP view, click on the desired intersection with the Right mouse button and sleclt the
Timing Settings.
From anywhere in the program, press [F8] and select the desired intersection from the
list. Then push the Timing Setting button or the [F5] key.

7/21/2019 Synchro Studio 8 User Guide
http://slidepdf.com/reader/full/synchro-studio-8-user-guide 125/559
7-1
The TIMING settings are displayed with information about the timing and phasing. SeeChapter 3 for details on navigating the data entry screens.
Figure 7-1 TIMING Settings
LayoutThe left side of the TIMING settings will display the NODE settings with alternate rows
displayed in yellow. Here you can update data such as the node number, zone name, intersection
coordinates, description notes and signal timing data. See Chapter 4 for full details on the
NODE settings.
On the right side are blue shaded rows and columns. There is a column for every vehicle
movement and every vehicle movement can have multiple phases. To enter multiple phases, see
the topic on Protected and Permitted Phases on page 7-5. There is also a column for a
pedestrian only phase and a Hold phase. To make a pedestrian only phase, assign a phase
7/21/2019 Synchro Studio 8 User Guide
http://slidepdf.com/reader/full/synchro-studio-8-user-guide 126/559
7-2
p y p p p y p , g p
number to this column. Details on the data entry items are found in subsequent sections of thischapter.
Near the bottom of the TIMING settings are a Splits and Phasing diagram. This is fully defined
on page 7-16.
Refer to page 5-2 for details on the Lanes and Sharing setting and to page 6-2 for
details on the Traffic Volume setting.
Signing SettingsThe TIMING settings become the SIGNING settings by selecting unsignalized or roundabout
from the Control Type (refer to page 4-4). The toolbar button becomes a stop sign when an
unsignalized intersection is active. [F5] opens the SIGNING settings or TIMING settings
depending on the intersection.
Phase TemplatesPhase templates allow phase numbers to be set automatically.
To set phases for an east-west arterial use the menu command Options Phase-
Templates Intersection-to-East-West .
To set phases for a north-south arterial use the menu command Options Phase-Templates Intersection-to-North-South. Phases 2 and 6 are normally used for the main
street. Thus, two templates are provided for each type of arterial.
To edit the phase templates use the menu command Options
Phase-Templates
Edit-
Template-Phases.
Enter phase numbers for each through and left movement. Local standards may have the phases
mirrored from Synchro's defaults. Synchro's defaults are shown in Figure 7-2.

7/21/2019 Synchro Studio 8 User Guide
http://slidepdf.com/reader/full/synchro-studio-8-user-guide 127/559
7-3
Figure 7-2 PHASE TEMPLATE Settings
Phase Templates are for dual ring controllers and cannot be used to set up single
ring timing or other advanced applications. To set up advanced applications use the
Ring-and-Barrier-Designer (see page 8-2).
Use default phase templates to set up phase numbers matching the agency‟s standard phasing
scheme.
The Phase Template is a global setting for all intersections within this file.
Turn TypeThe Turn Type sets the level of turn protection and assigns default phase and detector numbers
to the dedicated turn lane. These defaults can be changed at any time.
Before setting the turn types, set the phase numbers for the through movements using a phase
template.
Left Turn Type
The types of left turn treatment are:1. Permitted (Perm): Left turn movements are not protected and vehicles must yield to
oncoming traffic and pedestrians in the crosswalk.
2. Protected (Prot): Left turn movements are protected by a dedicated signal and turning
traffic can only move during the arrow indication of this signal.
3. Permitted + Protected (pm+pt): Left turn movements are protected during the
protected (arrow) signal indication and permitted during the green ball indication.
With permitted plus protected phasing, it is common to use four to five signal
displays for the turn indications.
4. Split: Left and through traffic share a single protected phase. This type of phasing is
commonly used if a lane is shared between left and through traffic. Split phasing
insures that shared left-turn lanes are protected and offer a greater level of protection
compared with permitted left-turns. If there is no through approach, such as at a T
intersection, then the left turn treatment should always be split.

7/21/2019 Synchro Studio 8 User Guide
http://slidepdf.com/reader/full/synchro-studio-8-user-guide 128/559
7-4
5. Dallas Permitted (D.Pm): A special type of phasing developed in the Dallas, Texasarea. The left turn lane has its own signal head. The left signal head is louvered to
make it invisible from adjacent lanes. The ball in the left lane displays the same phase
displayed to oncoming through traffic. This configuration eliminates the lagging left
turn trap problem.
6. Dallas Permitted plus Protected (D.P+P): A special type of phasing developed in the
Dallas, Texas area. The left turn lane has its own signal head. The left signal head is
louvered to make it invisible from adjacent lanes. The ball in the left lane displays thesame phase displayed to oncoming through traffic. This configuration eliminates the
lagging left turn trap problem.
7. NA: No phase selected. Left turns are prohibited.
8. Custom: A non-standard left turn phase combination is selected
Right Turn Type
If there is right turn traffic, there is an option for the right turn treatment. There are eight
choices.
Right turn traffic from a through or shared lane will only move during phases for those
movements. The right turn phasing only applies to exclusive right lanes.
1. Perm (perm): Permitted right turn movements are not protected and vehicles mustyield to pedestrians in the crosswalk.
2. Protected (Prot): Right turn movements are protected by a dedicated signal that
provides a right-turn arrow that does not conflict with pedestrian indications.
3. Overlap (Over): This turn type displays a right turn arrow with a protected left-turn
movement on the intersecting street.
Overlap should not be used as a substitute for Right Turn on Red. See Right Turn on
Red on page 5-13 for guidance on which type to use.
4. Permitted + Protected (pm+ov): This right turn overlap displays a right-turn arrow
with a compatible left-turn and a permitted (green ball) indication with the through
phase.
5. Protected + Overlap (pt+ov): This right-turn overlap displays a right-turn arrow with
the compatible left-turn and the through movement associated with the right-turn
7/21/2019 Synchro Studio 8 User Guide
http://slidepdf.com/reader/full/synchro-studio-8-user-guide 129/559
7-5
the compatible left turn and the through movement associated with the right turn.
6. Free: A free right turn movement yields to pedestrians and is not assigned a signal
phase. The permitted phase is automatically set to Free by the Free turn type.
Free should not be used as a substitute for Right Turn on Red. See Right Turn on
Red on page 5-13 for guidance on which type to use. Free should only be used if the
movement has an acceleration lane downstream.
7. NA: A right turn type set to NA (Not Applicable) is prohibited. The volume for the
right-turn movement must be coded to zero for this turn type.
8. Custom: Non-standard right turn phases are entered.
Protected and Permitted Phases
The Phase rows are used to assign one or more phases for each movement. During protected
phases, traffic can move without conflict. During permitted phases, left turning traffic must yield
to oncoming traffic and right turn traffic must yield to pedestrians. Conflicting phases have the
phase number shown in red. Permitted left turns do not conflict with movements bound for the
same link. Permitted through movements do not conflict with left turns bound for the same link.
In many cases, the phase numbers can be set automatically by using the Phase
Templates and the Turn Type controls.
Most signals in North America use dual ring controllers, which service a phase in each ring
concurrently.
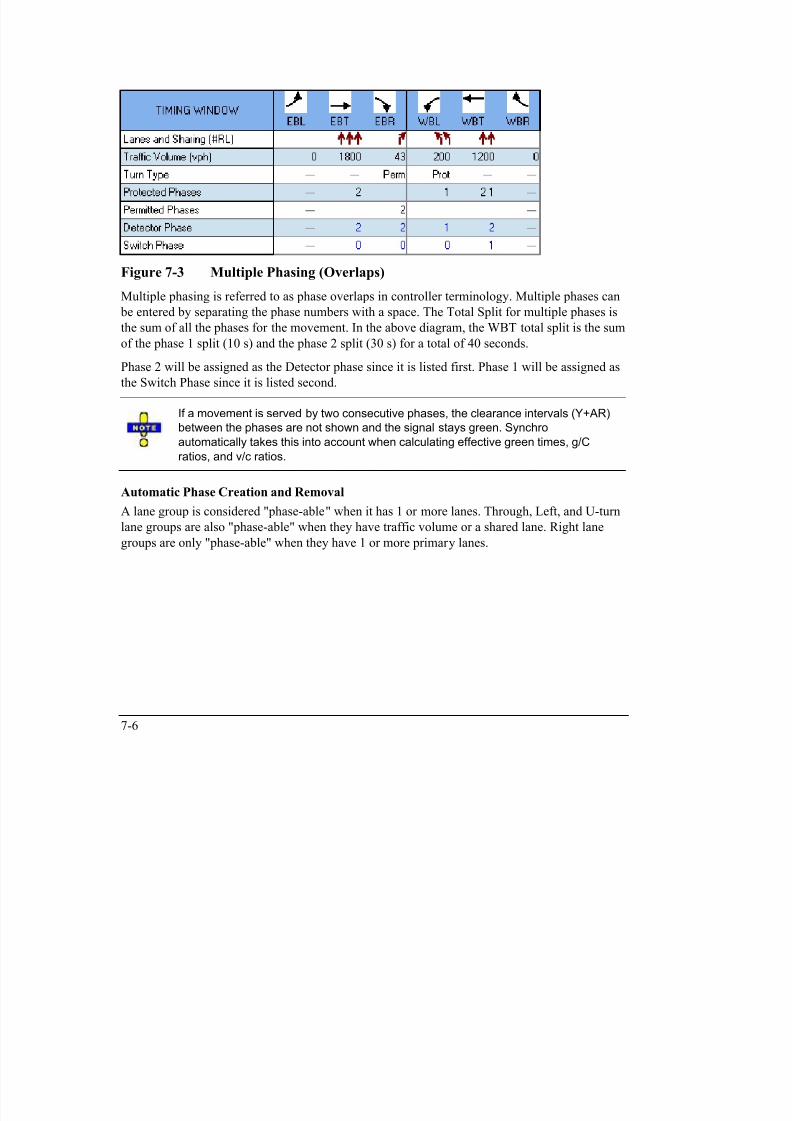
7/21/2019 Synchro Studio 8 User Guide
http://slidepdf.com/reader/full/synchro-studio-8-user-guide 130/559
7-6
Figure 7-3 Multiple Phasing (Overlaps)
Multiple phasing is referred to as phase overlaps in controller terminology. Multiple phases can
be entered by separating the phase numbers with a space. The Total Split for multiple phases is
the sum of all the phases for the movement. In the above diagram, the WBT total split is the sum
of the phase 1 split (10 s) and the phase 2 split (30 s) for a total of 40 seconds.
Phase 2 will be assigned as the Detector phase since it is listed first. Phase 1 will be assigned as
the Switch Phase since it is listed second.
If a movement is served by two consecutive phases, the clearance intervals (Y+AR)
between the phases are not shown and the signal stays green. Synchro
automatically takes this into account when calculating effective green times, g/C
ratios, and v/c ratios.
Automatic Phase Creation and Removal
A lane group is considered "phase-able" when it has 1 or more lanes. Through, Left, and U-turn
lane groups are also "phase-able" when they have traffic volume or a shared lane. Right lane
groups are only "phase-able" when they have 1 or more primary lanes.
Table 7-1 What Makes a Lane Group "Phase-able"
Lane Group
U-Turn Left 2 Left Through Right Right 2
Volume X X X X
Primary Lanes X X X X X X
Shared Lanes X X X X
Phase-able lane groups must always have at least one phase or be coded Free. Non-phase-able
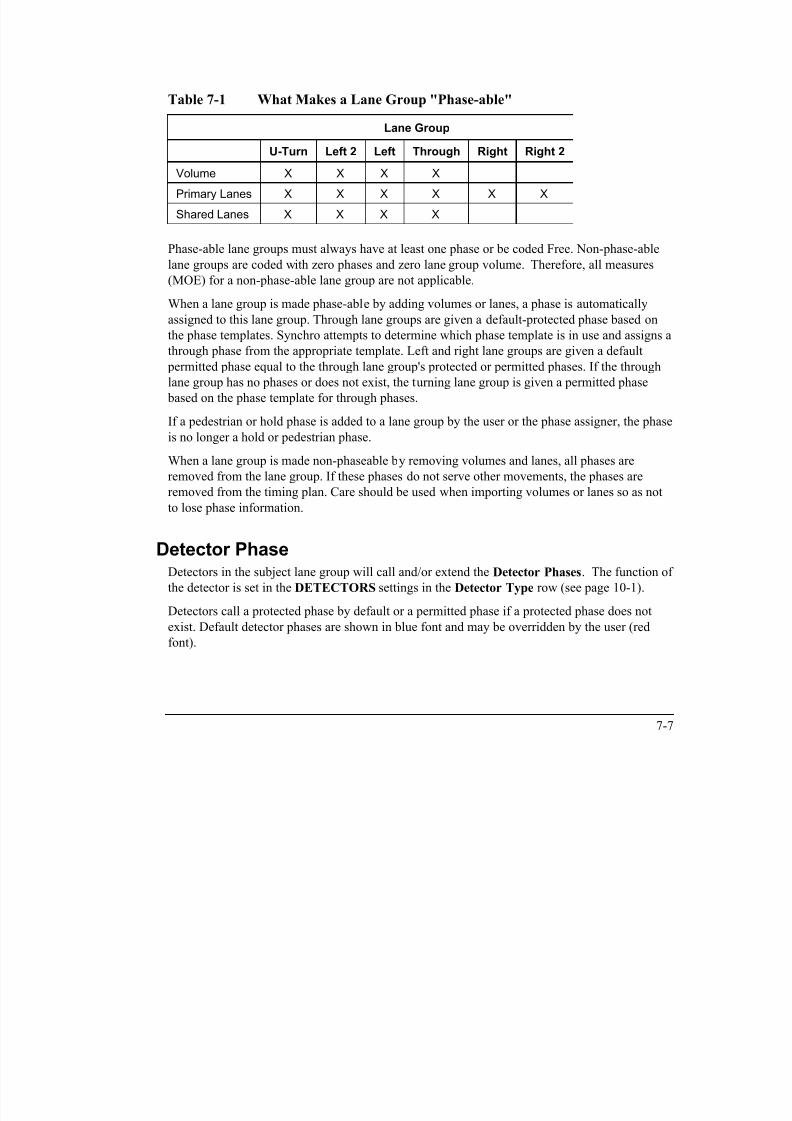
7/21/2019 Synchro Studio 8 User Guide
http://slidepdf.com/reader/full/synchro-studio-8-user-guide 131/559
7-7
lane groups are coded with zero phases and zero lane group volume. Therefore, all measures(MOE) for a non-phase-able lane group are not applicable.
When a lane group is made phase-able by adding volumes or lanes, a phase is automatically
assigned to this lane group. Through lane groups are given a default-protected phase based on
the phase templates. Synchro attempts to determine which phase template is in use and assigns a
through phase from the appropriate template. Left and right lane groups are given a default
permitted phase equal to the through lane group's protected or permitted phases. If the through
lane group has no phases or does not exist, the turning lane group is given a permitted phase
based on the phase template for through phases.
If a pedestrian or hold phase is added to a lane group by the user or the phase assigner, the phase
is no longer a hold or pedestrian phase.
When a lane group is made non-phaseable by removing volumes and lanes, all phases are
removed from the lane group. If these phases do not serve other movements, the phases are
removed from the timing plan. Care should be used when importing volumes or lanes so as notto lose phase information.
Detector PhaseDetectors in the subject lane group will call and/or extend the Detector Phases. The function of
the detector is set in the DETECTORS settings in the Detector Type row (see page 10-1).
Detectors call a protected phase by default or a permitted phase if a protected phase does not
exist. Default detector phases are shown in blue font and may be overridden by the user (red
font).
Avoid changing the Detector Phase and Switch Phase. To change the phase
associated with the lane group, use the Protected Phases or Permitted Phases
setting. If you override the Detector Phases, it will not be updated if the phase
numbers change later.
If there is no detector for this lane group, code a value of „0‟ in the setting for Detector Phase
and ensure that this is either the coordinated phase, is a pretimed signal, or 'maximum' is coded
for the Recall Mode.
Only one phase number can be entered for the Detector Phase.

7/21/2019 Synchro Studio 8 User Guide
http://slidepdf.com/reader/full/synchro-studio-8-user-guide 132/559
7-8
Switch PhaseThe Switch Phase is a secondary phase that extends the entered phase when it is green. This
setting does not place a call and does not call the primary Detector Phase when the entered
switch phase is green.
This setting can be used for the permitted phase of a permitted plus protected left turn. Do not
use with a lagging left turn because the protected left will not get called while the permitted phase is green. The default for permitted plus protected is to have the Detector Phase equal to
the Protected Phase and Switch Phase set to none.
Leading DetectorThis distance in feet (meter) is measured from the stop bar to the leading edge of the detector
farthest from the stop bar. Enter this value for each lane group.This information only needs to be entered if you are using the actuated signal analysis functions
of Synchro. This information does not need to be entered for the main street approaches of semi-
actuated and coordinated signals.
Do not set the Leading Detector to zero; the minimum value is 5 feet (1.5 m). If
there is no detector for this lane group, code a value of 0 in the setting for Detector
Phase and ensure that this is either the coordinated phase, is a pretimed signal, or'maximum' is coded for the Recall Mode.
Refer to Chapter 10 for full details on entering detector information.
Trailing DetectorThis is the distance from the trailing edge of the trailing detector to the stop bar in feet (meters).
Enter only extension detectors for each lane group. Do not count calling-only and type-3
detectors in this field. The detector information is used in conjunction with gap-out times and
thus only extension detectors are used. A negative value can be entered if the trailing detector
extends past the stop bar.
This information only needs to be entered if you are using the actuated signal analysis functions
of Synchro. This information does not need to be entered for the main street approaches of semi-
actuated and coordinated signals.

7/21/2019 Synchro Studio 8 User Guide
http://slidepdf.com/reader/full/synchro-studio-8-user-guide 133/559
7-9
The Leading and Trailing Detector settings are automatically updated if you enter
detector information in the DETECTORS settings.
Refer to Chapter 10 for full details on entering detector information.
Minimum InitialThe Minimum Initial time is the shortest green time that is guaranteed if a phase is serviced.
Synchro allows a range from 1 to 840 seconds. This value is called Min Green in actuated
controllers and holds the initial green long enough to insure that the phase is extended by
detection. The large range will allow for the modeling of unusual timing plans.
It is not necessary to enter data for values such as added initial and maximum initial.
Synchro assumes that the controller and detectors are set so that the signal will not
gap-out before the queued vehicles are cleared.
Do not confuse this field with the Minimum Split setting. Minimum Initial is used in
determining actuated behavior; Minimum Split is used to optimize splits.
Minimum Split
The Minimum Split is the shortest amount of time allowed for a phase.The Minimum Split must be long enough to accommodate the Minimum Initial interval plus the
yellow and all red time (typically 8-12 seconds). The minimum allowed in Synchro is 3 seconds
and the maximum value is 840 seconds. When Synchro automatically assigns splits, it will make
sure all splits are greater than or equal to their Minimum Splits. (This assumes the cycle length
is long enough to accommodate all splits.) See the section Optimize Intersection-Splits on
page 14-4 for information about how splits are calculated.
If the Minimum Split shown is red, it indicates a minimum error. The Minimum Split must be
greater or equal to the Minimum Initial plus clearance time (Y + AR). If this phase has a pedestrian phase, the Minimum Split should be greater or equal to the sum of the Walk Time,
the Flashing Don‟t Walk time, the Yellow Time and the All-Red Time. Minimum Splits that
violate pedestrian timings can be entered. This will prevent the splits from being reset to the
pedestrian timing requirements when optimizing splits or changing pedestrian times.
Enter the minimum split as the number of seconds. If there is a pedestrian movement with this
phase, the minimum split should include time for a minimum walk and flashing don‟t walk time.

7/21/2019 Synchro Studio 8 User Guide
http://slidepdf.com/reader/full/synchro-studio-8-user-guide 134/559
7-10
p p g
To set a default for newly created intersections or change all of the Minimum Splits, use the
Options Network-Settings command.
Do not confuse this field with the Minimum Initial setting. Minimum Initial is used to calculate
actuated green times. Minimum Split is used to optimize splits.
Split Minimum Rules
Here is a summary of the rules for Minimum and Maximum Splits. If any of the inequalities arefalse, a minimum error is generated.
MxS = Maximum Split
MnS = Minimum Split
Y = Yellow
AR = All Red
Mi = Minimum Initial Green
W = Walk Time
FDW = Flashing Don‟t Walk time
MxS MnS Mi + Y + AR
MxS MnS W + FDW + Y + AR (if the phase has a pedestrian phase)
If a split is too short for pedestrians, the actuated green time modeled can have strange results.
For coordinated and pretimed signals, actuated green times for side streets will be increased and
steal time from the coordinated phases. For uncoordinated actuated signals, actuated green times
will increase the cycle length.
Pay careful attention to all pedestrian errors.
Many pedestrian errors occur where there is no pedestrian phase. The pedestrian phase can be
turned off in the Pedestrian Phase setting (see page 8-10).
The Flash Don‟t Walk (FDW) time is in addition to Yellow Time. This may be the cause of
some minimum errors.
Some traffic signal controllers allow a pedestrian actuation to service ped times that violate the
Minimum Split time. In this case, the controller leaves coordination for a brief transition period
to service an infrequent ped call. The best way to model this condition is to un-check the
Pedestrian Phase in Synchro and ignore the walk and ped clearance timing.

7/21/2019 Synchro Studio 8 User Guide
http://slidepdf.com/reader/full/synchro-studio-8-user-guide 135/559
7-11
Total SplitThe Total Split time (in seconds) includes the green, yellow and all-red intervals assigned to a
phase. The Total Split time may overlap multiple phases and is the sum of the times allocated to
each phase. This number is given in seconds. The splits for the intersection can be calculated
automatically by selecting the Optimize Intersection-Splits, command from the menu. The
minimum Split Time is 3 seconds.
To adjust a split, type its new value in seconds. This phase will increase or decrease its time and
the following phase will decrease or increase by the same amount. The amount a phase can be
adjusted is limited by the green time of the following phase(s) and the green time of this phase
and any concurrent phase.
To adjust a split with the mouse, move the mouse to the right side of a yellow + all red band on
the current Splits and Phasing diagram shown at the bottom of the TIMING settings.
The cursor will change into the shape shown here. Hold down the left mouse button
and move the mouse right or left to adjust the split. When the button is released, all of
the other colored bands that are affected will automatically adjust their splits, and any
changed information will be shown on the numbers above.
It is not recommended that you adjust splits in this manner because Synchro will automatically
reassign splits if the cycle length changes, if the phasing changes, or if the intersection layout
changes. It is recommended that the Minimum Split reflects the phase times in the controller so
that the lowest feasible cycle length can be considered when the signal is optimized.
Refer to the Splits and Phasing diagram at the bottom of the TIMING settings for a graphical
representation of the current splits.
Synchro will automatically extend a phase to insure that the sum of the phases in each ring
equals the cycle length. This extended split is shown in gray on the Splits and Phasing diagram.
The cycle length will be increased if an increase in Total Split causes the sum of the splits in any
ring to exceed the cycle length. Adjusting splits graphically on the Splits and Phasing diagram preserves the cycle length.
Increase Cycle and Split Times
In previous versions of Synchro, the Cycle was limited to 900 seconds and the Maximum Split
to 840 seconds. In some instances, a long cycle can be useful to model dummy intersections that
t t ffi f t d d i d f ti Th C l L th d th M i S lit

7/21/2019 Synchro Studio 8 User Guide
http://slidepdf.com/reader/full/synchro-studio-8-user-guide 136/559
7-12
can stop traffic for an extended period of time. The Cycle Length and the Maximum Split maynow have values up to 3000 sec (50 min). The Cycle Length should not exceed 3000 seconds.
Two examples for using this would be a draw bridge and a rail crossing. At the location of the
stop, create a dummy intersection (create a T-intersection). Keep in mind that this dummy link
can be hidden (see page 5-19). Then you can enter a phase for the main street (say phase 1) and
then a Hold phase.
Yellow TimeYellow Time is the amount of time for the yellow interval. This value should be set between 3
and 5 seconds, depending on the approach speed, the cross street width, and local standards. The
minimum value allowed by Synchro is 2 seconds and the maximum is 10 seconds.
To set a default for newly created intersections or change all of the Yellow Times, use the
Options Network-Settings command.
All-Red TimeAll-Red Time is the amount of time for the all red interval that follows the yellow interval. The
all red time should be of sufficient duration to permit the intersection to clear before cross traffic
is released.
CORSIM (pretimed only) does not allow fractional seconds. If you plan to use this data withthis model, make sure Yellow Time plus All-Red Time equals a whole number in seconds.
To set a default for newly created intersections or change all of the All-Red Times, use the
Options Network-Settings command.
The minimum value allowed is 0 seconds and the maximum is 120 seconds. A large range is
used to allow the modeling of unusual timing plans, such as the example for Two Way Traffic
Control.
Lost Time Adjustment The Lost Time Adjustment replaces the Total Lost time in the LANE settings from previous
versions.
Total lost time is calculated as startup lost time plus yellow plus all red, as shown below.
tL = Yi + L1 – e = Total Lost Time
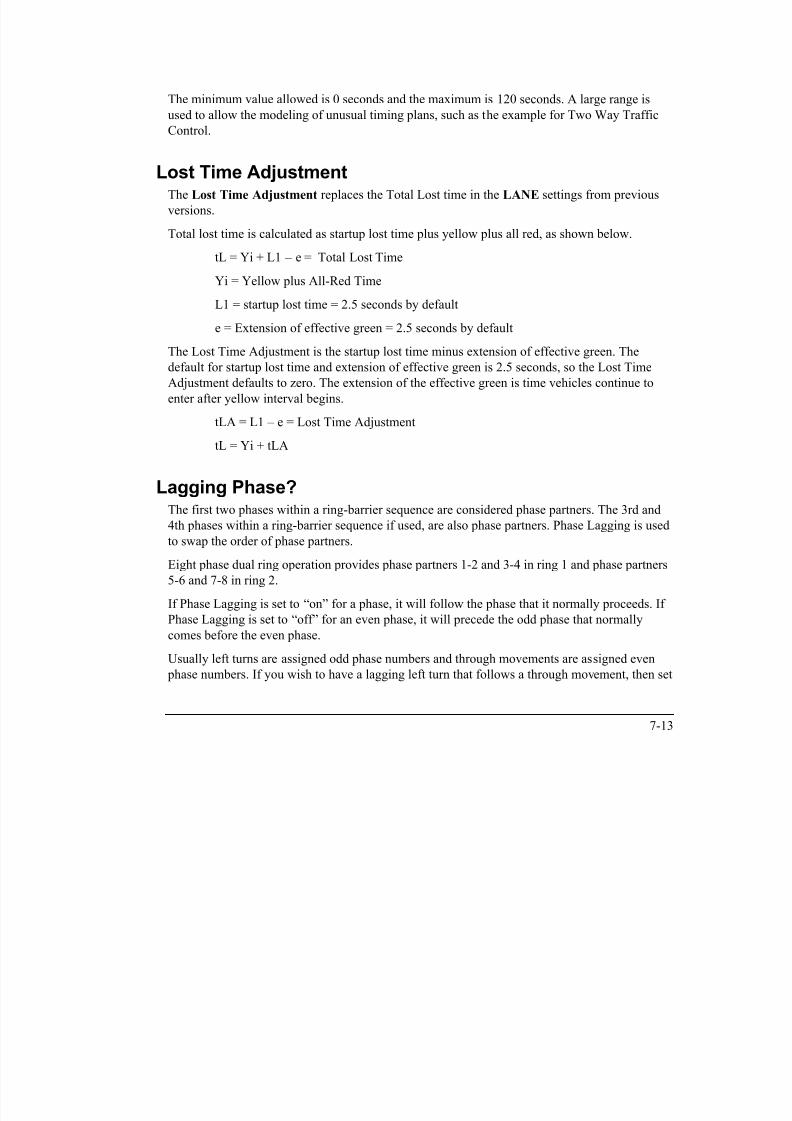
7/21/2019 Synchro Studio 8 User Guide
http://slidepdf.com/reader/full/synchro-studio-8-user-guide 137/559
7-13
Yi = Yellow plus All-Red Time
L1 = startup lost time = 2.5 seconds by default
e = Extension of effective green = 2.5 seconds by default
The Lost Time Adjustment is the startup lost time minus extension of effective green. The
default for startup lost time and extension of effective green is 2.5 seconds, so the Lost Time
Adjustment defaults to zero. The extension of the effective green is time vehicles continue toenter after yellow interval begins.
tLA = L1 – e = Lost Time Adjustment
tL = Yi + tLA
Lagging Phase?The first two phases within a ring-barrier sequence are considered phase partners. The 3rd and
4th phases within a ring-barrier sequence if used, are also phase partners. Phase Lagging is used
to swap the order of phase partners.
Eight phase dual ring operation provides phase partners 1-2 and 3-4 in ring 1 and phase partners
5-6 and 7-8 in ring 2.
If Phase Lagging is set to “on” for a phase, it will follow the phase that it normally proceeds. IfPhase Lagging is set to “off ” for an even phase, it will precede the odd phase that normally
comes before the even phase.
Usually left turns are assigned odd phase numbers and through movements are assigned even
phase numbers. If you wish to have a lagging left turn that follows a through movement, then set
Lagging Phase to “on” for this phase. The oncoming through phase will have its Lagging Phase
automatically set to “off.”
Lagging can be used with left turns and their oncoming through approaches. It can also be used
to reverse the order of sequential phases. Lead and lag phase partners must be in the same ringand barrier.
With non-standard rings and barriers, lag and lead may not be available.
Lead-lag phasing on the main street occurs when one coordinated phase leads and
the other lags. For example, phases 1 and 6 lead, 2 and 5 lag.
Coding C-Max recall for a lagging through movement also also forces the lagging

7/21/2019 Synchro Studio 8 User Guide
http://slidepdf.com/reader/full/synchro-studio-8-user-guide 138/559
7-14
Coding C-Max recall for a lagging through movement also also forces the laggingleft-turn to recall to max. This feature is called lag phase hold.
Coding C-Min recall for a lagging through movement allows the lagging through and
left-turn movement to gap out. This allows for more flexible lead-lag phasing.
Allow Lead/Lag Optimize?
One of the powerful features of Synchro is that it can optimize the order of phases. When
optimizing offsets, Synchro will check all combinations of leading and lagging phasing so as to
improve traffic flow. This is accomplished by looking at all combinations of the Lagging Phase
setting discussed in the previous section.
If it is okay for the phase to be either leading or lagging, set this field to “on” by checking the
box. If the phase must be lagging or must be leading, set this field to “off.”
Some jurisdictions require all left turn phases to be leading. If this is the case, set this field to
“off ” for all left turn movements. This will keep the optimizer from changing these phases to
lagging.
When using split or sequential phasing, set this field to “on.” This will allow the optimizer to
reverse the order of the phases to improve coordination. The exception to this rule is if the phase
order is hardwired into your signal controller.
Some jurisdictions are hesitant to use lagging left turn phasing because cars can
become "trapped" in the intersection. This phenomenon occurs when one approach
allows permitted left turns and the oncoming approach has a lagging left turn signal.

7/21/2019 Synchro Studio 8 User Guide
http://slidepdf.com/reader/full/synchro-studio-8-user-guide 139/559
Pedestrian Recall: The phase will always service a walk and ped clearance interval. The phase
can not be skipped or gap out until the walk and “do not walk ” intervals have passed.
Coordinated Maximum (C-Max): Used with coordinated signals only. This option is available
for phases selected as the reference phase in the Offset settings. The phase services itsmaximum time, starting at its scheduled start time.
Coordinated Minimum (C-Min): Used with coordinated signals only. This option is available for
phases selected as the reference phases in the Offset settings. The phase services its minimum
time, starting at its scheduled start time. Coordinated movements must have detection. The
Yield Point setting By Phase will not affect phases set with C-Min unless Lagging Phase is set.
For Fully-Actuated signals, the main street through phases will typically be set to Min recall andll h h ill b N ll

7/21/2019 Synchro Studio 8 User Guide
http://slidepdf.com/reader/full/synchro-studio-8-user-guide 140/559
7-16
For Fully Actuated signals, the main street through phases will typically be set to Min recall andall other phases will be set to No recall.
For Semi-Actuated signals, the main street phases have maximum recall. Side streets have No
recall.
For Actuated-Coordinated signals, the recall for main street phases (usually #2 and #6) is set to
Coordinated recall (maximum or minimum). The main street phases will receive all unused time
from the side streets, have no detection and always have maximum green. Side street phasesusually have No recall.
To change the coordinated phases set the reference phase. To change the signal to Pretimed or
non-coordinated, change the Control Type.
Splits and Phasing Diagram
Figure 7-3 Splits and Phasing Diagram Example
The Splits and Phasing diagram is shown at the bottom of the TIMING settings. It is agraphical representation of the current splits and phasing and can be used to adjust the splits. To
adjust the splits with the mouse, move the mouse to the right side of a yellow + all red band on
the current Splits and Phasing diagram.

7/21/2019 Synchro Studio 8 User Guide
http://slidepdf.com/reader/full/synchro-studio-8-user-guide 141/559
Figure 7-4 Group Control Example
On the Splits and Phasing diagram, each intersection has a color associated with it. In addition,
the top number identifies the node number preceded by a # symbol. In Figure 7-4, the two
intersections modeled are intersection #1 and intersection #2.
Cli ki h di i hi h S li d Ph i di ill j h

7/21/2019 Synchro Studio 8 User Guide
http://slidepdf.com/reader/full/synchro-studio-8-user-guide 142/559
7-18
Clicking on the movement diagram within the Splits and Phasing diagram will jump to the
intersection selected. For instance, if the TIMING settings for intersection #1 are active,
holding the cursor over any of the movement diagrams for intersection #2 will change the cursor
to a hand symbol . Clicking will now change the TIMING settings information to
intersection #2.
Pedestrian and Hold PhasesThe far right columns allow an entry of pedestrian only or phase hold. Set the PED phase to any
phase dedicated solely for pedestrians(often called an exclusive ped phase). This is a phase
where all vehicle movements are red and pedestrians can walk anywhere in the intersection. Set
the phase number to blank to remove the pedestrian phase.
Sign ControlIf Control Type (see page 4-4) is set to Unsig, this intersection becomes unsignalized and the
signing settings replace the signal settings.
There are three Sign Control settings in the third row of the signing settings window.
1. Free: Traffic goes through the intersection without stopping.
2. Yield: Traffic has a yield sign and slows down, stopping only if necessary.
3. Stop: All traffic stops, and waits until all conflicting traffic is clear.
Synchro will model unsignalized intersections based on the methods of the 2000 Highway
Capacity Manual, Chapter 17. When modeling platoons going through unsignalized
intersections, traffic on a free approach goes through. Traffic at stop and yield approaches are
spread out over the entire cycle.
Use Free at a freeway onramp, even if a yield sign exists in the field. A yield sign will cause
vehicles to stay and wait for a gap in the traffic.
Median Width and TWLTL MedianThis row appears in the SIGNING settings for unsignalized intersections. This field is the same
as the Median Width in the SIMULATION OPTIONS settings (see page 9-4). Changes to
this setting will immediately update on the MAP view.
The Median Width will be used for two-stage gap acceptance calculations in Synchro. If the

7/21/2019 Synchro Studio 8 User Guide
http://slidepdf.com/reader/full/synchro-studio-8-user-guide 143/559
7-19
g g p p y
Median Width on the main street is larger than the average vehicle length (set in the Network
Settings), then two-stage calculations will be performed. The median is assumed to be a raised
median unless the two-way left turn lane (TWLTL) option is checked.
The number of vehicles that can be stored in the median is equal to the Median Width divided
by the Vehicle Length. For a TWLTL median, 2 vehicles can be stored in the median. No partial
vehicles are assumed.
If a file created in a past version of Synchro is loaded into version 7/8, the median for the main
street is based on the setting for the side street of the older version. Saving a version 7/8 file
backwards will not set the unsignalized median parameters.
The Median Width field is used for HCM unsignalized analysis to perform
unsignalized analysis with two-stage gap acceptance. SimTraffic will increase the
median width visually; however, SimTraffic is not able to model two-stage gapacceptance.
Right Turn ChannelizedThis row appears in the SIGNING settings for unsignalized intersections.
This field is active for the rightmost movement. Enter Yield or Free if this movement has a
triangular island and yields or merges with oncoming left turn traffic. One or more right turnsmust be selected.
For two-way unsignalized analysis, the channelized right turn traffic will not be considered in
other movements conflicting volume following the rules for unsignalized analysis.
For all-way stop intersections and roundabouts, the traffic in channelized right turns will not be
considered in the analysis. Channelized right turns are not counted in the two lanes per leg per
approach limit. This extension is not part of the HCM analysis. To be fully HCM compatible, do
not code channelized right turns for all-way stops or roundabouts.
Critical Gap
This row appears in the SIGNING settings for unsignalized intersections.
The Critical Gap, tC , is defined as the minimum length of time interval in the major street
traffic stream that allows intersection entry for one minor street vehicle. The critical gap is
defined in Chapter 17 of the year 2000 HCM. The value in Synchro is the value that is definedby equation 17-1 from the HCM This value is adjusted for heavy vehicles grades and

7/21/2019 Synchro Studio 8 User Guide
http://slidepdf.com/reader/full/synchro-studio-8-user-guide 144/559
7-20
by equation 17 1 from the HCM. This value is adjusted for heavy vehicles, grades, and
geometry.
For two-stage gaps, this is the combined single stage tC. When using two-stage, each stage is 1
second less.
This value can be over-ridden.
Follow Up Time
This row appears in the SIGNING settings for unsignalized intersections.
The Follow Up Time is the time span between the departure of one vehicle from the minor
street and the departure of the next vehicle using the same major street gap, under a condition of
continuous queuing on the minor street. The follow up time is defined in Chapter 17 of the year
2000 HCM. The value in Synchro is the value defined by equation 17-2 after adjusting forheavy vehicles.
This value can be over-ridden.
Roundabout SettingsTo select a roundabout, set the Control Type (see page 4-4) to Roundabout.
The values in the Signing Settings are based on the year 2000 HCM. The 2000
methods provide limited modeling of roundabouts. The only measure of
effectiveness is a range of volume to capacity ratios. Switch to the HCM 2010 button
for full, year 2010 modeling of roundabouts.

7/21/2019 Synchro Studio 8 User Guide
http://slidepdf.com/reader/full/synchro-studio-8-user-guide 145/559
The actuated green time is an average of the five percentile green times, subject to the following
rules. The actuated effective green time includes yellow plus all-red timewith the total lost time
subtracted. The calculation rules for the HCM Report and Control Delay as shown in the
TIMING settings are slightly different.
tLCi
Ci
YAR gi g
25*' , (Percentile)
g' = Actuated Effective Green Time (s)
(use 0 instead of gi + YAR for skipped scenarios)
tLYARCi gi
g
*' (Webster)

7/21/2019 Synchro Studio 8 User Guide
http://slidepdf.com/reader/full/synchro-studio-8-user-guide 146/559
7-22
tLYARCi
g
25* , (Webster)
(g' is zero if less than 0.1 second)
gi = Percentile Green Time
Ci = Percentile Cycle Length
YAR = Yellow + All-Red time (s)
tL = Total Lost Time (s)
Control Delay Notes:
When calculating Ci, dwell time is subtracted from the cycle length for non-recall phases.
gi is equal to the minimum green time for skipped phases.The sum of actuated splits may exceed the actuated cycle length. Skipped phases are given the
minimum initial green time, but other phases will not have this time added to their cycle or
deducted from their green time.
Dwelled time is added to the green time of recall phases but not added to the red time or cycle
length of non-recall phases.
HCM Report Notes:
The HCM Report calculation differs slightly from the Synchro calculation. The HCM method
requires all lost time from other phases to be included in the red time and cycle length. The
percentile method discounts part of the lost time for other phases if they sometimes skip.
The green time for coordinated phases is calculated by subtracting actuated splits from non-
coordinated splits. The main effect is that yellow time for skipped phases is still subtracted from
the split of the coordinated phases.
The sum of HCM actuated phases will always equal the actuated cycle length.
Actuated Green to Cycle Ratio
This is the average actuated green time divided by the actuated cycle length. See Actuated
Effective Green Time (page 7-21) for notes on actuated green time calculation.
Calculation
)/( Cigi

7/21/2019 Synchro Studio 8 User Guide
http://slidepdf.com/reader/full/synchro-studio-8-user-guide 147/559
7-23
5
)/(/
Ci gi
C g
g = Effective Green Time (split minus total lost time)
C = Cycle Length
gi = Percentile Green Time
Ci = Percentile Scenario Cycle Length
HCM Report Calculation
g'/C = g' / C'
g'/C = Actuated Effective Green to Cycle Ratio
C' = (g' + YAR) = Actuated Cycle Length, equals sum of effective green times
g' = Actuated Effective Green Time (split less total lost time)
Ci = Percentile Scenario Cycle Length
For the HCM calculation, C' will always be the sum of the effective splits (taking into account
ring and barrier rules). With the Synchro calculation (Ci)/5 may be less than the sum of the
actuated splits. This is because total lost time is not counted for skipped phases when evaluatingother phases.
Volume to Capacity Ratio
Timing Settings
The Volume to Capacity Ratio (v/c Ratio) uses actuated green times and cycle lengths. The v/cratio indicates the amount of congestion for each lane group. Any v/c Ratio greater than or equal
to 1 indicates that the approach is operating at above capacity. This number is calculated by the
formula:
C g s
v X
/*
X = Volume to Capacity Ratio

7/21/2019 Synchro Studio 8 User Guide
http://slidepdf.com/reader/full/synchro-studio-8-user-guide 148/559
7-24
v = Adjusted Lane Group Volume (see VOLUME settings on page 6-1)
s = Saturated Flow Rate (see LANE settings on page 3-1)
g = Effective Green Time (split minus total lost time)
C = Cycle Length
If there are separate lane groups for right or left turn traffic, the v/c Ratios for these lane groups
are also shown. There is a separate lane group for left traffic, if there are left turn lanes and the
left turn type is not Split. There is a separate lane group for right traffic, if there are right turn
lanes. Shared lanes are in the through lane group.
For permitted plus protected movements, each Saturated Flow Rate is multiplied by its
respective actuated effective green time and added together.
Defacto Turning Lanes
A dl or dr in the v/c ratio field indicates a Defacto left or right turning lane. If there are two or
more through lanes and a heavy turning movement, it is possible to have a defacto turning lane.
Synchro will flag a defacto turning lane if the turning movement using a single lane would have
a v/c ratio greater than the group as a whole and its v/c ratio is 0.85 or more.
Defacto lanes should be taken seriously. It is possible that the v/c ratio for the entire group isacceptable, while the turning lane is not acceptable.
To correct a defacto turning lane, change the coding of a through lane into a turning lane. A
defacto left or right turn lane usually indicates the need for an additional exclusive turning lane.
Signing Settings
For unsignalized intersections, the volume to capacity ratio is reported for each movement.
Unlike signals, the v/c ratio is the maximum for the movement, not the lane group. See the
HCM Unsignalized report (page 16-19) for more details about the capacity and delays by lane.For roundabouts, the high capacity v/c ratio is shown for the approach. This is the high capacity
range of possible v/c ratios for the method. To see the low capacity ratios, see the HCM
Unsignalized report.
Control Delay
Timing Settings

7/21/2019 Synchro Studio 8 User Guide
http://slidepdf.com/reader/full/synchro-studio-8-user-guide 149/559
7-25
See the discussion of Delay Calculations (page 14-26) for a complete description of the
calculations.
Delays in Synchro are Signal Delay, also called Control Delay. These delays are equivalent to
the Stopped Delay times a constant of 1.3.
In Synchro, control delays are used for analyzing the effects of coordination, actuation, andcongestion. Control delay is the component of delay caused by the downstream control device
and does not include Queue Delay.
Signing Settings
For unsignalized intersections, the delay is shown for the movement. Unlike signals, the delay is
for the movement, not the lane group. A value of 9999 indicates no capacity is available. See the
HCM Unsignalized report (16-19) for more details about the capacity and delays by lane.
For roundabouts, the method does not define a delay, so none is shown.
Queue Delay
Timing Settings
Queue Delay is an analysis of the effects of queues and blocking on short links and short
turning bays. This delay includes the analysis of spillback, starvation, and storage blocking.
Additional details on queue delay and queue interactions can be found in the topic Queue
Interactions (page 14-54).
Signing SettingsThe unsignalized intersection delay is strictly based on the methods in Chapter 17 of the HCM,
which does not include a term for queue delay. Therefore, Queue Delay is not included in the
SIGNING settings.
Total Delay
Timing SettingsTotal Delay is the lane group Control Delay plus the Queue Delay Additional details on total

7/21/2019 Synchro Studio 8 User Guide
http://slidepdf.com/reader/full/synchro-studio-8-user-guide 150/559
7-26
Total Delay is the lane group Control Delay plus the Queue Delay. Additional details on total
delay, queue delay and queue interactions can be found in the topic Queue Interactions (page
14-54).
Signing Settings
The unsignalized intersection delay is strictly based on the methods in Chapter 17 of the HCMwhich does not include a term for queue delay. Therefore, Total Delay is not included in the
SIGNING settings, only Control Delay.
Level of Service
Timing Settings
The Level of Service (LOS) for the lane group is calculated by taking the signalized
Intersection Delay and converting it to a letter, between A and F, based on the length of the
delay. Refer to Table 4-1 on page 4-10.
The Level of Service is based on the Synchro Control Delay.
Signing Settings
This is based on the movement control delay for an unsignalized intersection. This is based on
Table 4-2 located on page 4-10.
Approach Delay
Timing Settings
This is the delay for the entire approach. The Approach Delay is a volume weighted average of
the Total Delays for each lane group.
Signing Settings
For unsignalized intersections, the delay is shown for the approach. Unlike signals, the delay is
for the movement, not lane group. A value of 9999 indicates no capacity is available. See the
HCM Unsignalized report for more details about the capacity and delays by lane.
For roundabouts, the method does not define a delay, so none is shown.

7/21/2019 Synchro Studio 8 User Guide
http://slidepdf.com/reader/full/synchro-studio-8-user-guide 151/559
7-27
y
The Approach Delay and LOS for main street approaches are not shown because they are not
defined for main street approaches. The analyst needs to examine the left turn LOS and delay to
rank the vehicles.
Approach Level of Service
Timing Settings
This is the Approach LOS based on the Total Delay.
Signing Settings
Based on the approach Control Delay.
Queue Lengths
Timing Settings
The Queue Length rows show the 50th percentile and 95th percentile maximum queue lengths.
The 50th percentile maximum queue is the maximum back of queue on a typical cycle and the
95th percentile queue is the maximum back of queue with 95th percentile traffic volumes (also
see Queue Length Calculation, page 14-70).
The queue length reported is the one for the lane with the highest queue (feet or
meters) in the lane group. The total queue length is divided by the number of lanes
and the lane utilization factor.
In many cases, the 95th
percentile queue will not be experienced due to upstream metering. If the
upstream intersection is at or near capacity, the 50th
percentile queue represents the maximum
queue experienced.
Similarly, if the upstream intersection has a v/c ratio over 0.8; the maximum queue is
approximately equal to the 50th percentile queue divided by the upstream v/c ratio. For example,
if the 50th percentile queue is 150ft, and the v/c ratio upstream is 0.90; the maximum possible
queue would therefore be 150 / 0.90 = 167ft.
D t t t i th 95th b l th th 50th If th

7/21/2019 Synchro Studio 8 User Guide
http://slidepdf.com/reader/full/synchro-studio-8-user-guide 152/559
7-28
Due to upstream metering, the 95th queue may be less than the 50th queue. If the
upstream intersection is operating with v/c>1, the metered arrival rate will be less
than the volume for this intersection. Since metering is only performed with the 95th
queue, this causes the 95th queue to be less than the 50th queue. This situation
may indicate a coding problem. Be sure that the Midblock traffic is coded correctly
and that the signal timing and volumes for both intersections are set correctly. This
reduced 95th queue does represent a valid queue because vehicles will not be able
to clear the upstream intersection to queue at this intersection.
The ~ and # footnote indicate that the volume modeled exceeds capacity. The ~ footnote
indicates that the approach is above capacity and the queue length could be much longer. The
queue length is theoretically infinite and blocking problems may occur. The value shown for the
50th percentile queue is sufficient to hold one cycle of traffic. This will prevent capacity
problems from being compounded by insufficient storage space.
The # footnote indicates that the volume for the 95th percentile cycle exceeds capacity. This
traffic was simulated for two complete cycles of 95th percentile traffic to account for the effects
of spillover between cycles. If the reported v/c <1 for this movement, the methods used
represent a valid method for estimating the 95th percentile queue. In practice, 95th percentile
queue shown will rarely be exceeded and the queues shown with the # footnote are acceptable
for the design of storage bays.
When the Analysis Period is set to greater than or equal to 30 minutes, the PHFx will be set to
1.0. See the Queue Length Calculation on page 14-71.
The m footnote indicates that volume for the 95th percentile queue is metered by an upstream
signal.
Signing Settings
For two-way stops, the 95th
percentile queue is shown. The queue is the highest for any lane in
the lane group.
A value of 9999 indicates no capacity is available. See the HCM Unsignalized report for more
details about the capacity and delays by lane.
For circles and all-way stops, the method does not define a queue, so none is
shown.
Warning IndicatorsThe lower right cells (below the Splits and Phasing diagram) of the TIMING and PHASING

7/21/2019 Synchro Studio 8 User Guide
http://slidepdf.com/reader/full/synchro-studio-8-user-guide 153/559
7-29
settings indicate potential intersection coding errors or timing problems when red.
Timing Settings
Green indicates no errors.
Conflict indicates a phase or coincident phase(s) serve conflicting movements. Look at the
Protected Phasing row for red phase numbers. No conflict checking is performed on permitted
phases.
v/c > 1 indicates that Volume exceeds capacity for one or more movements. It may also indicate
volume was coded without lanes or green time. Look at the v/c row for values greater than 1 or
for "No Cap" errors. For congested intersections, a v/c >1 error may be unavoidable.
Min Err indicates that one or more splits violate minimum timing requirements. Look at theTotal Split row for values in red. Also, compare the Maximum Split in the PHASING settings
to the Minimum split. A Min Err may also occur if timings are too short for pedestrian timings.
Signing Settings
Invalid Sign Control for Unsignalized Analysis: Oncoming approaches must both be free or
both be signed. The intersection is limited to two free approaches.
Too Many Legs for Unsignalized Analysis: The unsignalized analysis is limited to four leg
intersections. It is also possible to get this message if too many legs are on one side of the
intersection.

7/21/2019 Synchro Studio 8 User Guide
http://slidepdf.com/reader/full/synchro-studio-8-user-guide 154/559
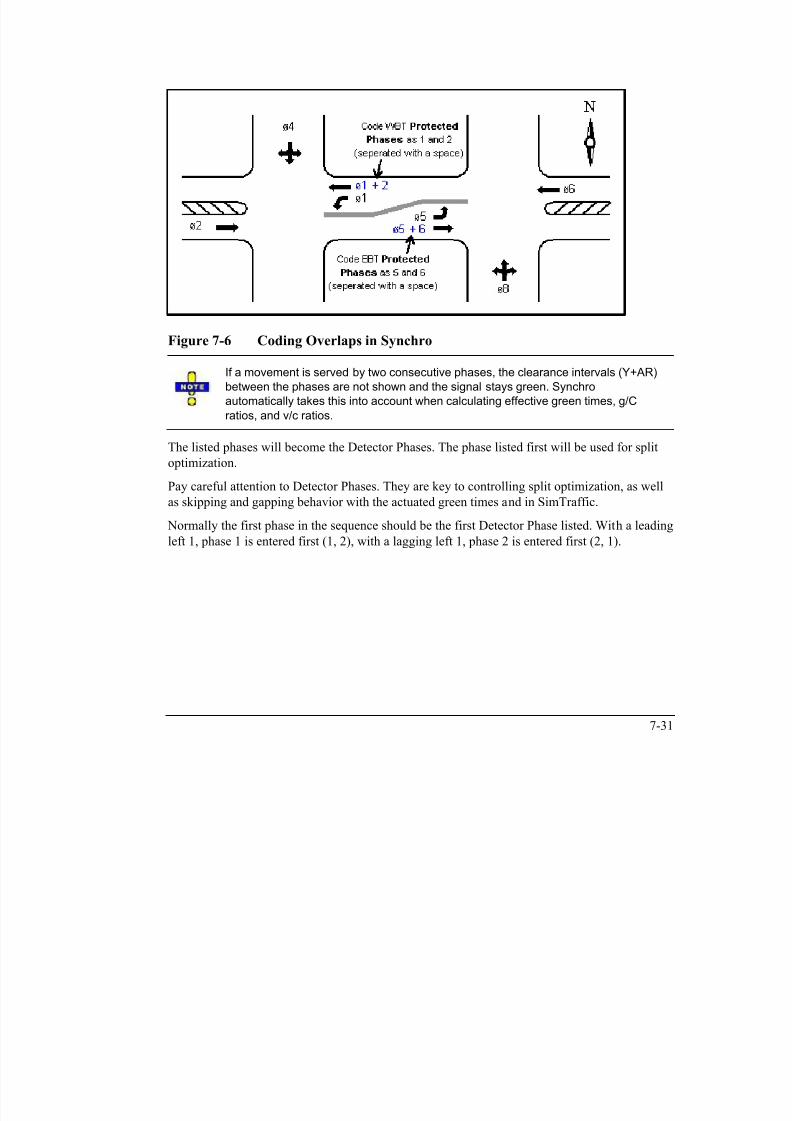
7/21/2019 Synchro Studio 8 User Guide
http://slidepdf.com/reader/full/synchro-studio-8-user-guide 155/559
Timing Settings Quick StartThere is a lot of information that can be entered into the TIMING settings that can be
intimidating for new users. The purpose of this section is to give the basic steps that are requiredto quickly get your data entered into the TIMING settings. For a basic intersection, the steps
would be as follows:
1. Enter your LANE and VOLUME settings data for your intersection (refer to Chapter
4 and Chapter 6).
2. Choose the appropriate Phase Template (refer to page 7-2) to match your numbering
convention. This step is necessary so Synchro can use the appropriate template whensetting up Turn Types and phase numbers. To set phases for an east west arterial (the
template shown on the left in Figure 7-7), choose Options Phase Templates

7/21/2019 Synchro Studio 8 User Guide
http://slidepdf.com/reader/full/synchro-studio-8-user-guide 156/559
7-32
Intersection to East-West. Select Options Phase Templates Intersection to
North-South to use the template on the right in Figure 7-7.
This step is not necessary if you want to use the Synchro default template (North/South
template) or if you are coding an unsignalized intersection.
Figure 7-7 Phase Template3. Choose your Control Type. For signalized intersections, this can be set to a pretimed,
semi-actuated uncoordinated, actuated-uncoordinated or actuated-coordinated. For
unsignalized intersections, this can be set to an unsignalized (stop or yield controlled)
or roundabout intersection.
4. Select the appropriate Turn Type for your left and right turns. This is the step where
you will define how your turning movements are phased (protected, permitted, free,
etc.). If you have defined the phase template in step 3, Synchro will automatically
assign phase numbers for your turn treatments based on the diagram shown in Figure
7-7.
If this is an unsignalized intersection, you would select the appropriate sign control
(stop, free or yield).
5. Enter the appropriate Cycle Length. If you are not performing an existing conditions
intersection analysis, you can determine the cycle length by performing an
intersection cycle length optimization or a network cycle length optimization.
6. Enter the PHASING settings (see the next chapter).
7 Adjust the phase splits with the Splits and Phasing diagram using your mouse Move
7/21/2019 Synchro Studio 8 User Guide
http://slidepdf.com/reader/full/synchro-studio-8-user-guide 157/559
7-33
7. Adjust the phase splits with the Splits and Phasing diagram using your mouse. Move
your mouse cursor to the end of the phase split and it will change to the shape
shown here (horizontal resize button). Hold down the left mouse button and
move the mouse right or left to adjust the split.

7/21/2019 Synchro Studio 8 User Guide
http://slidepdf.com/reader/full/synchro-studio-8-user-guide 158/559
Chapter 8 – Phasing Settings
From the MAP view, click on the desired intersection with the Right mouse button and select
Phasing Settings.
From anywhere in the program, press [F8] and select the desired intersection from the
list. Then push the Phasing Settings button or the [F6] key.
The PHASING settings, Figure 8-1, are displayed with information about the phase settings.
See Chapter 3 for details on navigating the data entry screens.

7/21/2019 Synchro Studio 8 User Guide
http://slidepdf.com/reader/full/synchro-studio-8-user-guide 159/559
8-1
Figure 8-1 PHASING Settings
LayoutThe left side of the PHASING settings will display the NODE settings. The rows will be
displayed in yellow. Here you can update data such as the node number, zone name, intersection
coordinates, description notes and signal timing data. See Chapter 4 for full details on theNODE settings.
On the right side are blue shaded rows and columns. There is a column for every phase that has
been set in the TIMING settings. Details on the data entry items are found in subsequent
sections of this chapter.
Percentile Scenarios The key to modeling actuated signals is to model traffic conditions using multiple traffic
scenarios. Synchro uses the Percentile Delay Method for determining delays and green times.

7/21/2019 Synchro Studio 8 User Guide
http://slidepdf.com/reader/full/synchro-studio-8-user-guide 160/559
8-2
There are five scenarios modeled; they are called the 90th, 70th, 50th, 30th, and 10th
percentiles. Traffic volumes for each approach are adjusted up or down to model these
percentile scenarios. By adjusting the traffic volumes for different scenarios, the actuated
signals can be modeled under a range of traffic conditions.
If traffic is observed for 100 cycles, the 90th percentile would be the 90th busiest, the 10th
percentile would be the 10th busiest, and the 50th percentile would represent average traffic.
The percentile scenarios are likely to occur during the hour for which volume data is provided.
These scenarios are not intended to represent traffic conditions for other times. To model the
signals under other traffic conditions, reanalyze the signals with appropriate traffic volume
counts.
Ring and Barrier Designer The Ring and Barrier Designer allows up to 32 phases to be entered in one of 64 fields. This
allows for the modeling of complex phasing strategies. Phase numbers are entered into the
appropriate barrier, ring and position (BRP) fields in the four rings and four barriers.
When to use the Ring and Barrier Designer:
Group Control (Multiple intersections on one controller)
5 or more legs
Two intersections on one controller

7/21/2019 Synchro Studio 8 User Guide
http://slidepdf.com/reader/full/synchro-studio-8-user-guide 161/559

7/21/2019 Synchro Studio 8 User Guide
http://slidepdf.com/reader/full/synchro-studio-8-user-guide 162/559
Cluster Editor The Cluster Editor allows multiple intersections to share one controller (Group Control). This
is used in conjunction with the Ring and Barrier Designer.
To activate, use the menu command Options Cluster Editor.

7/21/2019 Synchro Studio 8 User Guide
http://slidepdf.com/reader/full/synchro-studio-8-user-guide 163/559
8-5
Figure 8-5 CLUSTER EDITOR
Click on an intersection in the Cluster Editor to add or remove intersections from the group
(intersection shown on the right).
Each intersection has a color associated with it in the Splits and Phasing diagram. The color can
be changed by right clicking on the map.
Group Control
Possible Applications
Diamond Interchange
Diamond Interchange with frontage road(s)
Two or more closely spaced intersections
Arterial with wide median modeled as two nodes
Use the Cluster Editor to assign group control.
Each intersection has a color associated with it in the Splits and Phasing diagrams.
The controller number used for data exchange is the smallest node number in the
cluster. In Figure 8-5, the node number 19 is used to identify the two intersection
group for data exchange.
The controller number should match the hardware controller number used by Advanced Traffic
Management Systems (ATMS).
With group control, it is recommended that each intersection use phases in one ring
only. All phases for a node should be in a single ring or possibly two. Normally each
ring should contain phases from one node only (see Figure 8-4).
Minimum Initial The Minimum Initial is the minimum green time for a phase. This is the shortest time that the
h h A t i l l ld b 4 d Th i i l ll d i

7/21/2019 Synchro Studio 8 User Guide
http://slidepdf.com/reader/full/synchro-studio-8-user-guide 164/559
8-6
phase can show green. A typical value would be 4 seconds. The minimum value allowed in
Synchro is 1 second and the maximum value is 840 seconds. The large range will allow for the
modeling of unusual timing plans.
This value is also called minimum green by some controllers.
Synchro does not support added initial or maximum initial.
Do not confuse this field with the Minimum Split setting in the TIMING settings. Minimum
Initial is used in determining actuated behavior; Minimum Split is used to optimize splits.
Minimum Split The Minimum Split is the shortest amount of time allowed for this phase.
The Minimum Split must at least be long enough to accommodate the Minimum Initial interval
plus the Yellow and All-Red Time. This will usually be 8 seconds or more. The minimum
allowed in Synchro is 3 seconds and the maximum is 840 seconds. When Synchro automatically
assigns splits, it will make sure all splits are greater than or equal to their Minimum Splits. (Thisassumes the cycle length is long enough to accommodate all splits.) See the section on
Optimize-Intersection Splits for information about how splits are calculated.
For additional details, see the topic on Minimum Split in the TIMING settings, page 7-9.

7/21/2019 Synchro Studio 8 User Guide
http://slidepdf.com/reader/full/synchro-studio-8-user-guide 165/559
All-Red Time
All-Red Time is the amount of time for the all red interval that follows the yellow interval. The
all red time should be of sufficient duration to permit the intersection to clear before cross traffic
is released.
CORSIM (pretimed only) does not allow fractional seconds. If you plan to use this data with
this model, make sure Yellow plus All-Red equals a whole number in seconds.
To set a default for newly created intersections or change all of the All-Red Times, use the
Options Network-Settings command.
The minimum value allowed is 0 seconds and the maximum is 120 seconds. A large range is
used to allow the modeling of unusual timing plans, such as the example for Two Way Traffic
Control.

7/21/2019 Synchro Studio 8 User Guide
http://slidepdf.com/reader/full/synchro-studio-8-user-guide 166/559
8-8
Lagging Phase?
The first two phases within a ring-barrier sequence are considered phase partners. The 3rd and
4th phases within a ring-barrier sequence, if used, are also phase partners. Phase Lagging isused to swap the order of phase partners. Normally phase partners are 1 and 2, 3 and 4, 5 and 6,
7 and 8.
For additional details, see the topic on Lagging Phase in the TIMING settings, page 7-13.
Allow Lead/Lag Optimize?
One of the powerful features of Synchro is that it can optimize the order of Phases. If it is okay
for this phase to be either leading or lagging, set this field to "Yes". If this phase must be lagging
or must be leading, set this field to "Fixed".
When optimizing Offsets, Synchro will check all combinations of leading and lagging phasing
to improve traffic flow. This is done by changing the lagging parameter discussed in the
previous section.
For additional details, see the topic on Allow Lead/Lag Optimize in the TIMING settings,
page 7-14.
Vehicle Extension
This is the also the maximum gap. When a vehicle crosses a detector, it will extend the green
time by the Vehicle Extension time.
Vehicle Extension must be as long as the travel time from the trailing detector to the
stop bar.
Minimum Gap
This is the Minimum Gap time that the controller will use with volume-density operation. If
volume-density operation is not used, set this value to the same as the Vehicle Extension.
Minimum Gap should be as long as the travel time from the trailing detector to the
stop bar.

7/21/2019 Synchro Studio 8 User Guide
http://slidepdf.com/reader/full/synchro-studio-8-user-guide 167/559
8-9
Time Before ReduceWhen using volume-density operation, this is the amount of time before gap reduction begins.
Time To Reduce
When using volume-density operation, this is the amount of time to reduce the gap from Vehicle
Extension (or maximum gap) to Minimum Gap.
Recall Mode Each phase can have a recall of None, Minimum, Maximum, Coordinated (maximum or
minimum), or Ped.
No Recall: The phase can be skipped.
Minimum Recall: The phase will always come on to its minimum, the phase cannot be skipped.
Maximum Recall: The phase will always show its maximum and has no detection. The phasecannot skip or gap out, nor can it be extended.
Pedestrian Recall: The phase will always show a walk phase. The phase cannot be skipped or
gap out until the walk and do not walk intervals have passed.
Coordinated Maximum (C-Max): Used with coordinated signals only. This option is available
for phases selected as the reference phase in the Offset settings. Phase shows for its maximum
time starting at its scheduled start time.
Coordinated Minimum (C-Min): Used with coordinated signals only. This option is available for phases selected as the reference phase in the Offset settings. Phase shows for its minimum time
starting at its scheduled start time. Coordinated movements must have detectors. No affect with
By Phase yield points except with lead-lag phasing.
For Fully-Actuated signals, all phases will have No recall or Minimum recall.
For Semi-Actuated signals, the main street phases have Maximum recall. Side streets have No
recall.
For Actuated-Coordinated signals, the recall for main street phases (usually #2 and #6) is set to
Coordinated recall (maximum or minimum). The main street phases will receive all unused time
from the side streets, have no detection and always have maximum green. Side street phases

7/21/2019 Synchro Studio 8 User Guide
http://slidepdf.com/reader/full/synchro-studio-8-user-guide 168/559
8-10
usually have No recall.
To change the coordinated phases set the Reference Phase (refer to page 4-13). To change the
signal to pretimed or non-coordinated, change the Control Type (refer to page 4-4).
Pedestrian Phase
Set this field to yes (check the box) if there is a pedestrian phase for this movement.
Setting Pedestrian Phase to no (unchecked box) will disable the pedestrian phase and the input
fields for walk, do not walk, and pedestrian calls.
Walk Time
This is the amount of time for a pedestrian walk phase.
Pedestrian phases only come on when the phase has pedestrian calls, or if the phase has
pedestrian recall.
This value can be ignored if the phase is in maximum recall and the split is long enough to
accommodate pedestrians.

7/21/2019 Synchro Studio 8 User Guide
http://slidepdf.com/reader/full/synchro-studio-8-user-guide 169/559
day, set pedestrian calls to 0.
If the phase has pedestrian recall, this field can be ignored.
Dual Entry
Dual Entry can be set to “On” or “Off ” for the given phase.
Select “On” (check) to have this phase appear when a phase is showing in another ring and no
calls or recalls are present within this ring and barrier.
Normally, even phases are set to “On” and odd phases are set to “Off.” Recall has priority over
dual entry. Below are examples for a typical eight-phase, dual ring controller.
Examples:
Phases 1 2
Dual Entry No Yes

7/21/2019 Synchro Studio 8 User Guide
http://slidepdf.com/reader/full/synchro-studio-8-user-guide 170/559
8-12
Dual Entry No Yes
Recall None None
If there are no calls on phases 1 or 2, phase 2 will show when phases 5 or 6 are showing.
Phases 1 2
Dual Entry No Yes
Recall Min None
If there are no calls on phases 1 or 2, phase 1 will show when phases 5 or 6 are showing.
Phases 1 2
Dual Entry No No
Recall None None
If there are no calls on phases 1 or 2, no phase from this ring will show when phases 5 or 6 are
showing.
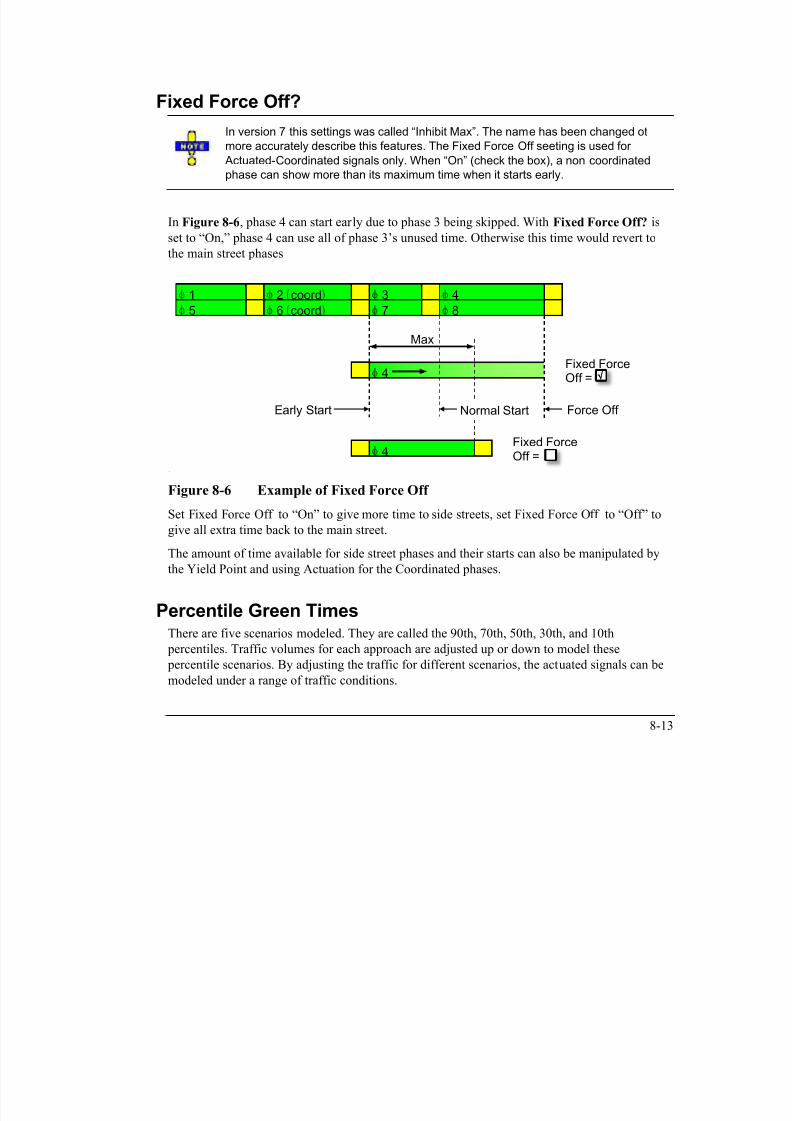
7/21/2019 Synchro Studio 8 User Guide
http://slidepdf.com/reader/full/synchro-studio-8-user-guide 171/559
If traffic is observed for 100 cycles, the 90th percentile would be the 90th busiest, the 10th
percentile would be the 10th busiest, and the 50th percentile would represent average traffic.
For each percentile scenario and phase, a green time is given. The range of green times for each
phase gives an indication of how often the phase will max-out, gap-out, or be skipped.
Next to each green time is a code indicating how the phase terminates. Here is a list of codes.
Table 8-1 Phase Termination Codes
Code Phase Termination
sk Phase is skipped
mn Phase shows for minimum time
gp Phase gaps-out
hd Phase held for other ring to cross barrier
Ph t
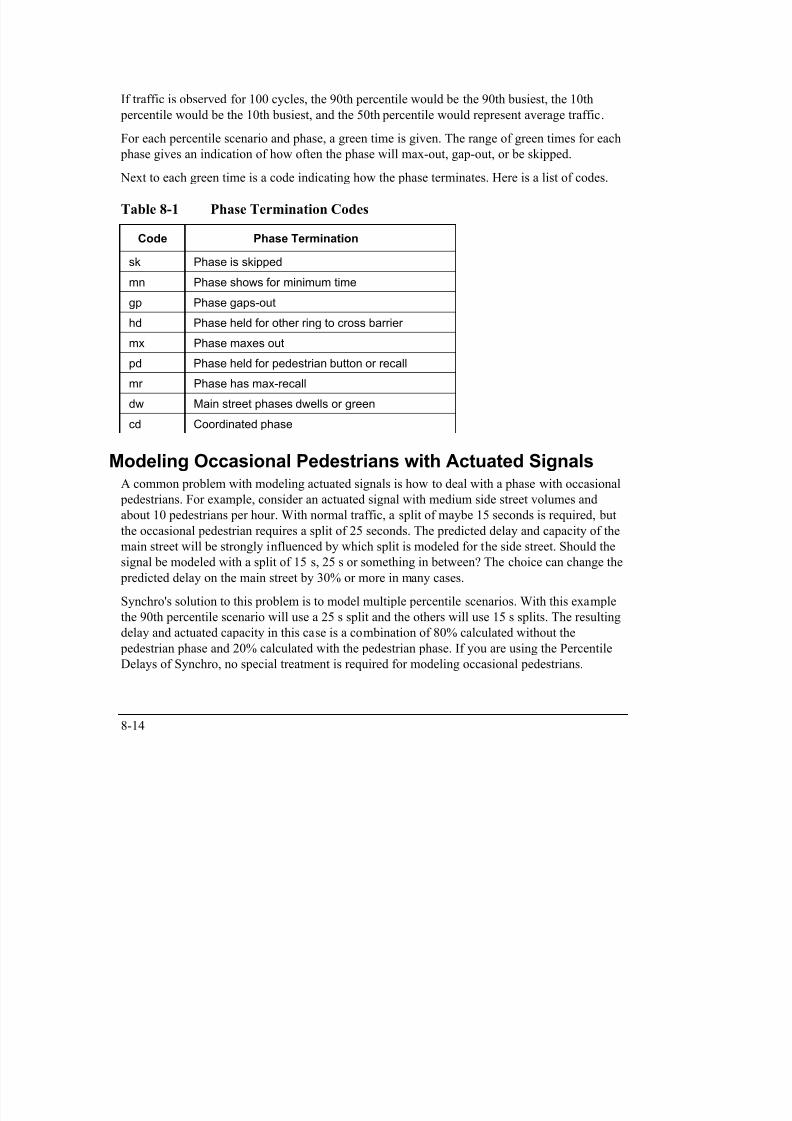
7/21/2019 Synchro Studio 8 User Guide
http://slidepdf.com/reader/full/synchro-studio-8-user-guide 172/559
8-14
mx Phase maxes out
pd Phase held for pedestrian button or recall
mr Phase has max-recalldw Main street phases dwells or green
cd Coordinated phase
Modeling Occasional Pedestrians with Actuated Signals
A common problem with modeling actuated signals is how to deal with a phase with occasional
pedestrians. For example, consider an actuated signal with medium side street volumes andabout 10 pedestrians per hour. With normal traffic, a split of maybe 15 seconds is required, but
the occasional pedestrian requires a split of 25 seconds. The predicted delay and capacity of the
main street will be strongly influenced by which split is modeled for the side street. Should the
signal be modeled with a split of 15 s, 25 s or something in between? The choice can change the
predicted delay on the main street by 30% or more in many cases.
Synchro's solution to this problem is to model multiple percentile scenarios. With this example
the 90th percentile scenario will use a 25 s split and the others will use 15 s splits. The resultingdelay and actuated capacity in this case is a combination of 80% calculated without the
pedestrian phase and 20% calculated with the pedestrian phase. If you are using the Percentile
Delays of Synchro, no special treatment is required for modeling occasional pedestrians.
Occasional Pedestrians with Other Models
Modeling the occasional pedestrian is more of a challenge with the traditional traffic models.
The HCM 2000 allows the user to enter actuated phase times. The manual does not state how to
handle pedestrian actuations, but a reasonable interpretation would be to average greens with
and without pedestrian times based on pedestrian frequency. The actuated green times calculated
by Synchro for use with HCM Signals Report and HCM input files are an average of the five
percentile green times. Some of these percentiles will include time for pedestrians and some will
not, depending on the number of Pedestrian Calls.
Some engineers recommend using short phases in conjunction with coordination only in areas
where there are less than 10 pedestrians per day.

7/21/2019 Synchro Studio 8 User Guide
http://slidepdf.com/reader/full/synchro-studio-8-user-guide 173/559
8-15

7/21/2019 Synchro Studio 8 User Guide
http://slidepdf.com/reader/full/synchro-studio-8-user-guide 174/559
Chapter 9 – Simulation SettingsFrom the MAP view, click on the desired intersection with the Right mouse button and select
Simulation Options.
From anywhere in the program, press [F8] and select the desired intersection from the
list. Then push the Simulatin Options Settings button or the [F10] key.
The SIMULATION OPTIONS setting displays a grid in which you can enter SimTraffic
simulation specific information. See Chapter 3 for details on navigating the data entry screens.
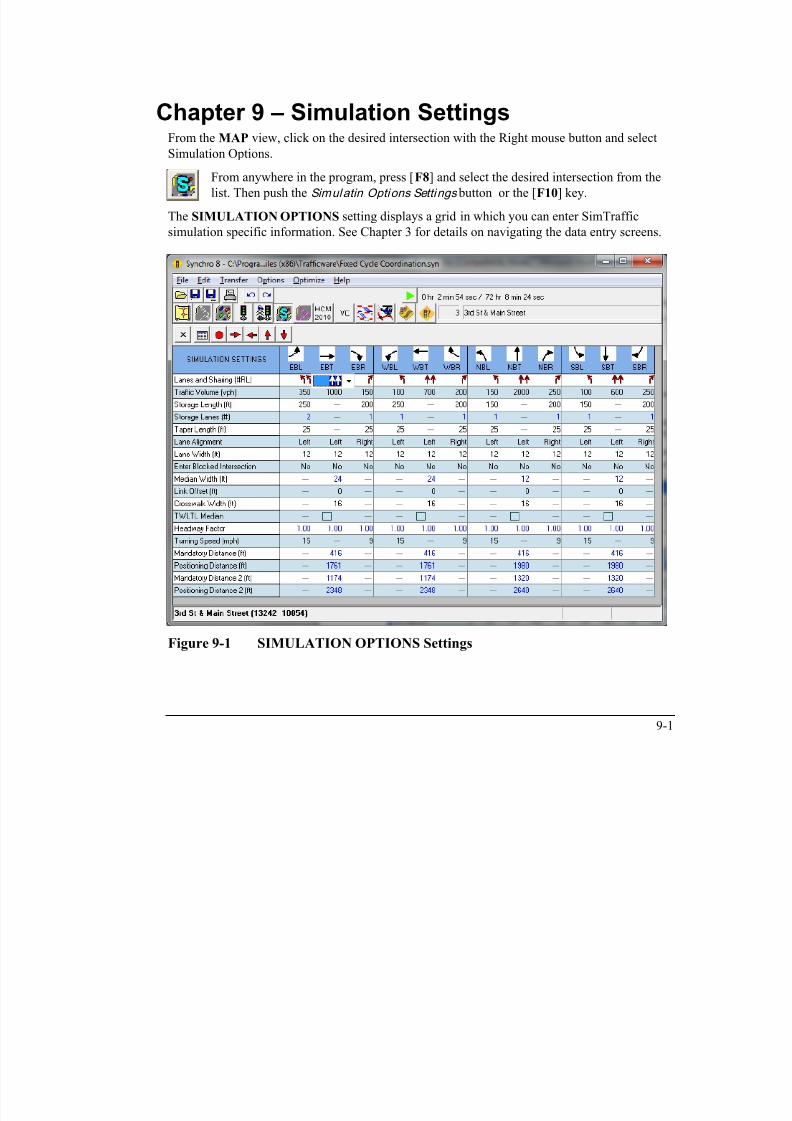
7/21/2019 Synchro Studio 8 User Guide
http://slidepdf.com/reader/full/synchro-studio-8-user-guide 175/559
9-1
Figure 9-1 SIMULATION OPTIONS Settings

7/21/2019 Synchro Studio 8 User Guide
http://slidepdf.com/reader/full/synchro-studio-8-user-guide 176/559
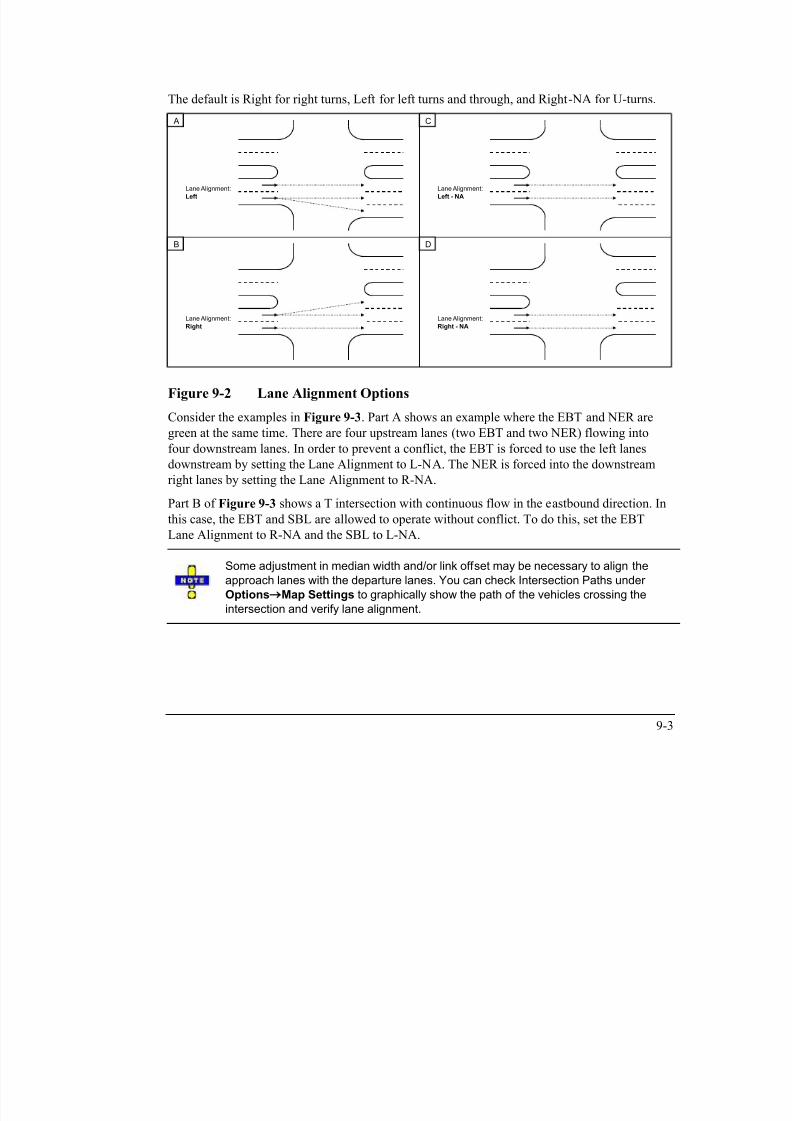
7/21/2019 Synchro Studio 8 User Guide
http://slidepdf.com/reader/full/synchro-studio-8-user-guide 177/559
Eastbound Through
Lane Alignment:
L-NA
Northeast Right
Lane Alignment:
R-NA
Eastbound Through
Lane Alignment:
Right - NA
A B Southbound Left
Lane Alignment:
Left - NA
Barrier
Figure 9-3 Lane Alignment Examples
Lane Width

7/21/2019 Synchro Studio 8 User Guide
http://slidepdf.com/reader/full/synchro-studio-8-user-guide 178/559
9-4
Lane Width is the width of a single lane in feet (meters). The default is 12 feet (3.7 meters).
Also see the topic on Lane Widths on page 5-5.
Enter Blocked IntersectionThe Enter Blocked Intersection setting controls simulation modeling gridlock avoidance. The
four options for modeling blocked intersections are "Yes", "No", "1" and "2". The default value
is "No", for intersections and "Yes", for bends and ramp junctions. We suggest that you set
Enter Blocked Intersection to "No", for high speed approaches and movements.A vehicle will slow for an intersection, if there are 4 other vehicles ahead of it, but behind the
stop bar.
A side street of an unsignalized intersection can be set to 1 or 2. This will allow 1 or 2 vehicles
to enter a blocked intersection from the side. This can help the capacity of driveways.
Median WidthThe Median Width is used to set the width of the median. Left turn lanes are considered to be
positioned in the median even if they are not defined as storage lanes.
This setting can be overridden. The default is calculated as follows:
Formula for a link:
1) sum of (width of left turn lanes + width of left storage lanes for reverse departing link)
2) reduced by minimum of (left storage, left storage for reverse departing link)
3) widen to match wider median on through approach
Median Width must be set for each direction independently. Each setting affects the median
width at each end.
Figure 9-4 illustrates some examples of median width. In A and C, the median width has been
set automatically. Parts B and D show a manual over-ride of the Median Width setting.
A
M e d i a n
W i d t h = 0 '
B
M e d i a n
W i d t h = 2 4
'
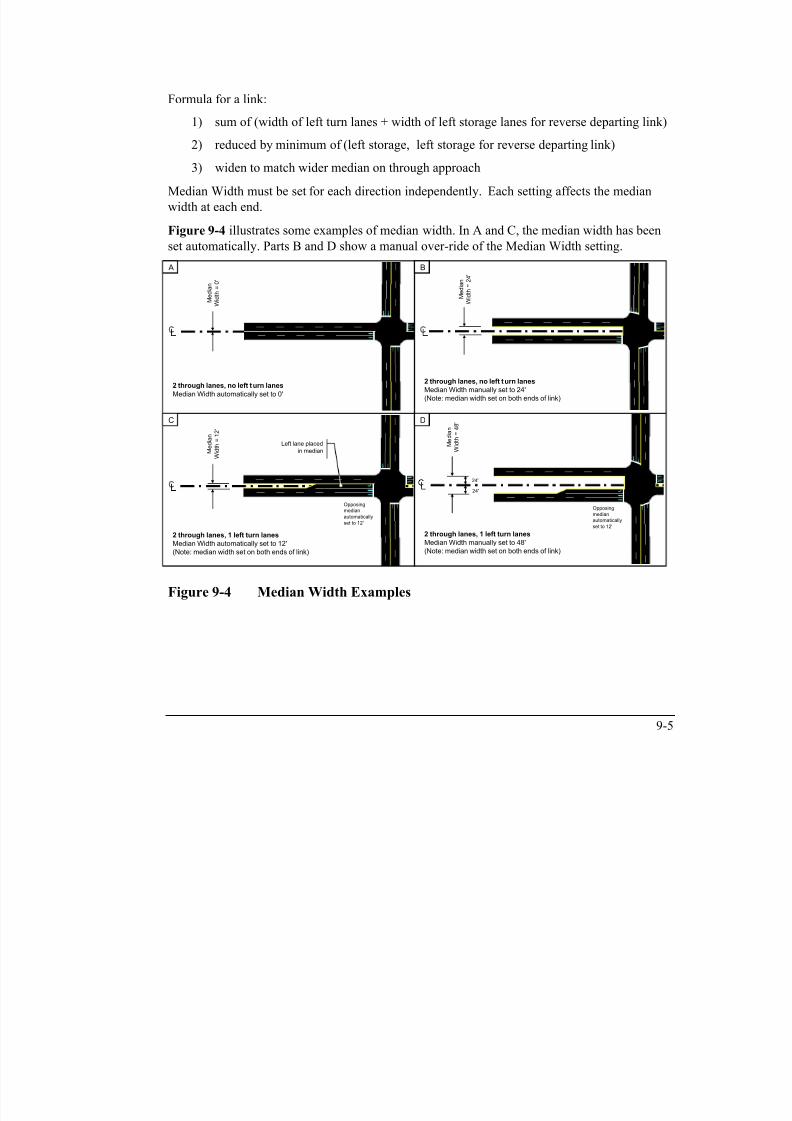
7/21/2019 Synchro Studio 8 User Guide
http://slidepdf.com/reader/full/synchro-studio-8-user-guide 179/559
9-5
2 through lanes, no left turn lanes
Median Width automatically set to 0'
2 through lanes, no left turn lanes
Median Width manually set to 24'(Note: median width set on both ends of link)
C D
M e d i a n
W i d t h = 1 2 '
2 through lanes, 1 left turn lanes
Median Width automatically set to 12'
(Note: median width set on both ends of link)
Left lane placed
in median
2 through lanes, 1 left turn lanes
Median Width manually set to 48'
(Note: median width set on both ends of link)
M e d i a n
W i d t h = 4 8 '
24'
24'
Opposing
median
automatically
set to 12'
Opposingmedian
automatically
set to 12'
Figure 9-4 Median Width Examples

7/21/2019 Synchro Studio 8 User Guide
http://slidepdf.com/reader/full/synchro-studio-8-user-guide 180/559
Corner Point
Corner Point
Width Left
Width Right
Cross
Walk
Width
Figure 9-6 Cross Walk Width
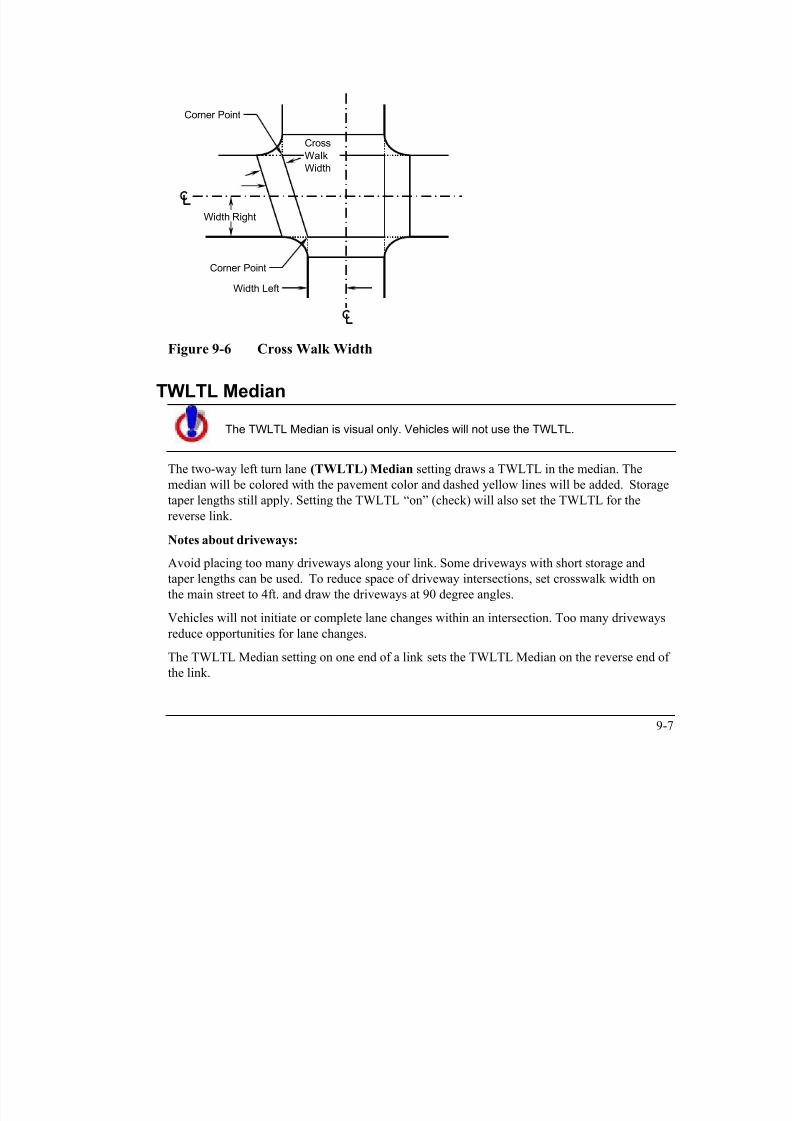
7/21/2019 Synchro Studio 8 User Guide
http://slidepdf.com/reader/full/synchro-studio-8-user-guide 181/559
9-7
TWLTL Median
The TWLTL Median is visual only. Vehicles will not use the TWLTL.
The two-way left turn lane (TWLTL) Median setting draws a TWLTL in the median. The
median will be colored with the pavement color and dashed yellow lines will be added. Storage
taper lengths still apply. Setting the TWLTL “on” (check) will also set the TWLTL for thereverse link.
Notes about driveways:
Avoid placing too many driveways along your link. Some driveways with short storage and
taper lengths can be used. To reduce space of driveway intersections, set crosswalk width on
the main street to 4ft. and draw the driveways at 90 degree angles.
Vehicles will not initiate or complete lane changes within an intersection. Too many drivewaysreduce opportunities for lane changes.
The TWLTL Median setting on one end of a link sets the TWLTL Median on the reverse end of
the link.

7/21/2019 Synchro Studio 8 User Guide
http://slidepdf.com/reader/full/synchro-studio-8-user-guide 182/559
Positioning Distance is the distance back from the Mandatory point where a vehicle
first attempts to change lanes.
Mandatory 2 Lane Distance is added to Mandatory Distance if a second lane change is
required during the simulation.
Positioning 2 Lane Distance is added to both Mandatory 2 Lane Distance and
Mandatory Distance to determine the beginning of the positioning zone for the first of
two lane changes.
All distances are measured from the stop bar. See the discussion on Lane Choice and Lane
Changes on page 25-8.

7/21/2019 Synchro Studio 8 User Guide
http://slidepdf.com/reader/full/synchro-studio-8-user-guide 183/559
9-9

7/21/2019 Synchro Studio 8 User Guide
http://slidepdf.com/reader/full/synchro-studio-8-user-guide 184/559
Chapter 10 – Detector SettingsFrom the MAP view, click on the desired intersection with the Right mouse button and select
Detector Options.
From anywhere in the program, press [F8] and select the desired intersection from the
list. Then push the Detectors Settings button or the [F11] key. Clicking on a map
detector also activates. The DETECTOR settings display a grid in which you can enter
detector information. See Chapter 3 for details on navigating the data entry screens.

7/21/2019 Synchro Studio 8 User Guide
http://slidepdf.com/reader/full/synchro-studio-8-user-guide 185/559
10-1
Figure 10-1 DETECTOR Settings

7/21/2019 Synchro Studio 8 User Guide
http://slidepdf.com/reader/full/synchro-studio-8-user-guide 186/559
Detector TemplateDetector Templates allow the user to define the number, position, type and size of each
detector. Default templates named Left, Thru, and Right are used to setup detectors for new
approaches. You can modify these templates, but you cannot remove them. It is recommended
that you setup templates for all of the standard detector layouts your agency uses. Give them
names such as “Thru 300” for through detectors located 300 feet in advance of the stop bar.
Add TemplateActivate the Detector Template Editor (Figure 10-2) by selecting Options Detector
Templates, or by double clicking on the left column of the DETECTOR settings. The Detector
Template Editor allows the user to define additional templates in separate columns. Data fieldsare identical with the DETECTOR settings.
The inputs on the Template are the same as those in the DETECTOR settings, except for the
detector phase and detector channel.
Select the [New] button to create an empty template and specify the template name.

7/21/2019 Synchro Studio 8 User Guide
http://slidepdf.com/reader/full/synchro-studio-8-user-guide 187/559
10-3
Select the [Copy] button to duplicate the active column. The copied column will be inserted to
the right. Data can be edited and template renamed.
The [Delete] button will remove the active column. The default Left, Thru and Right columns
cannot be removed.
Use the Update Lane Detectors to Template [This Template] button to update all lane groups
with that detector template name.
Use the Update Lane Detectors to Template [All Templates] button to update all lane groupswith any detector template name.
Detectors associated with a template are not automatically updated when the template is
modified. Therefore, apply the Update Lane Detectors to Template button after modifying a
template.
There is no cancel button. Use the undo command to rollback to the previous settings.

7/21/2019 Synchro Studio 8 User Guide
http://slidepdf.com/reader/full/synchro-studio-8-user-guide 188/559
10-4
Figure 10-2 DETECTOR TEMPLATE Settings
Detector n PositionThis is the distance from stop bar to the trailing edge (closet to stop bar) of detector n. This
setting is for all lanes in the lane group.
Refer to the example in Figure 10-3. In this example, detector 1 (D1) has a position of zero feet,
detector 2 (D2) has a position of d2, detector 3 (D3) has a position of d2 plus d3, and detector 4
(D4) has a position of d2 plus d3 plus d4.
D2D3
d3
Stop
Bar
d2
D4 D1
d4
D = Detector d = Distance
s = Size of Detector
s4 s3 s2 s1
D2D3D4 D1
Figure 10-3 Detector Position

7/21/2019 Synchro Studio 8 User Guide
http://slidepdf.com/reader/full/synchro-studio-8-user-guide 189/559
10-5
Detector n SizeThis is the size of the detector in the traveled direction. The default for detectors made from
Leading Distance is 6 ft (1.8m). This setting is for all lanes in the lane group.
Refer to Figure 10-3 for an example. In this example, detector 1 (D1) has a size of s1, detector
2 (D2) has a size of s2, detector 3 (D3) has a size of s3 and detector 4 (D4) has a size of s4.
Detector n TypeThe options are Calling, Extend, Cl+Ex; Calling places a call when the phase is yellow or red.
Extend places a call when the phase is green. Options for delay, queue, and extend detectors are
set by using a non-zero time for these options.
All detectors modeled in Synchro are presence detectors, not passage (or pulse) detectors.
Detector n ChannelEnter the detector number used by the controller. If there is a different detector channel for each
lane, enter each value separated by columns. Traditionally the detector number is the same as
the phase number, and one channel is used for all the detectors for a phase. Newer installations
may have a separate detector input for each lane to allow volume counts. If the detector
channels across three lanes (left to right) are 11,12, and 13; enter “11,12,13”.
The Detector Channel is not currently used by Synchro or SimTraffic, but can be
imported and exported in UTDF data access. In the future there may be a
conversion program to convert counts by detector number into counts by turning
movement for use by Synchro.
Detector n ExtendDetector Extend, or "carry over" is specified in tenths of a second. This value extends the call
for the specified value after the call drops.
One application is to have 3 seconds extend time on advance detectors, and 0 extend time at the
stop bar, in conjunction with a gap time of 0.5 seconds. This will allow the advance detectors to
hold the phase green, while the stop bar detectors will not.
Detector 1 Queue

7/21/2019 Synchro Studio 8 User Guide
http://slidepdf.com/reader/full/synchro-studio-8-user-guide 190/559
10-6
Enter the Queue time here to have the stop bar detector act as a queue detector, the old name is“Type 3 detector”. A queue detector will extend the phase during the first q seconds, then be
silent. Queue detection is useful for extending the phase during the queue clearance time, then
later allowing the advance detectors to extend the phase.
If the stop bar detector extends the phase for 3 seconds, this will create 3 seconds of green after
the last vehicle enters the intersection. This vehicle will be well beyond the intersection during
the clearance interval. This will create extra delay for the opposing movements.
Detector 1 DelayEnter the Delay time here to have the stop bar detector act as a Delay detector. A delay detector
will not place a call on red or yellow, until the vehicle has been there for at least d seconds. A
delay detector will extend normally on green. Delay detectors are useful for right turn lanes
with right turn on red allowed; If a vehicle is able to turn on red within, for example, 10
seconds, it is not necessary to bring up this phase.

7/21/2019 Synchro Studio 8 User Guide
http://slidepdf.com/reader/full/synchro-studio-8-user-guide 191/559

7/21/2019 Synchro Studio 8 User Guide
http://slidepdf.com/reader/full/synchro-studio-8-user-guide 192/559
7/21/2019 Synchro Studio 8 User Guide
http://slidepdf.com/reader/full/synchro-studio-8-user-guide 193/559
For additional details, see the topic on Minimum Initial in the PHASING settings, page 8-6.
Maximum Split
The Maximum Split is the current split time, given in seconds. It is the longest amount of split
time for actuated movements.
For additional details, see the topic on Maximum Split in the PHASING settings, page 8-7.
Yellow Time
Yellow Time is the amount of time for the yellow interval. Normally, this value should be set to
between 3 and 5 seconds, depending on the approach speed, the cross street width, and localstandards. The minimum value allowed by Synchro is 2 seconds and the maximum is 10
seconds.
For additional details, see the topic on Yellow Time in the PHASING settings, page 8-7.
All-Red Time

7/21/2019 Synchro Studio 8 User Guide
http://slidepdf.com/reader/full/synchro-studio-8-user-guide 194/559
11-4
All-Red Time is the amount of time for the all red interval that follows the yellow interval. Theall red time should be of sufficient duration to permit the intersection to clear before cross traffic
is released.
For additional details, see the topic on All-Red Time in the PHASING settings, page 8-8.
Maximum Green
The Maximum Green is a calculated value. This is equal to the Maximum Split minus theYellow Time and All-Red Time. To change this value, change the Maximum Green setting.
Walk Time
This is the amount of time for a pedestrian walk phase.
For additional details, see the topic on Walk Time in the PHASING settings, page 8-10.
Flash Don’t Walk
This is the amount of time for a pedestrian Flash Don’t Walk phase.
For additional details, see the topic on Flashing Don‟t Walk Timein the PHASING settings,
page 8-11.
Walk + Ped Clearance
The Walk + Ped Clearance is a calculated value and is the sum of the Walk Time and the
Flash Don’t Walk time.
Recall Mode
Each phase can have a recall of None, Minimum, Maximum, or Ped. The 2010 HCM Settings do
no currently have a option for coordinated recall.
For additional details, see the topic on Recall Mode in the PHASING settings, page 8-9.
Dual Entry
The entry mode is used in dual‐ring operation to specify whether a phase is to be activated
(green) even though it has not received a call for service. Two entry modes are possible: dual
entry and single entry This mode is input for each actuated signal phase
7/21/2019 Synchro Studio 8 User Guide
http://slidepdf.com/reader/full/synchro-studio-8-user-guide 195/559
11-5
entry and single entry. This mode is input for each actuated signal phase.
For additional details, see the topic on Dual Entry in the PHASING settings, page 8-12.
Right Turn on Red Volume
The HCM 2010 includes a RTOR reduction input. Synchro computes the saturation flow
increase for RTOR and therefore can calculate a RTOR volume reduction. The RTOR reduction
is calculated as follows:
vRTOR = minimum (sRTOR,v) * r/C = RTOR reduction to volume
sRTOR = RTOR saturation flow as calculated by Synchro
r = effective red time
v = adjusted lane group volume (before RTOR reduction)
C = cycle length
The vRTOR value cannot be over-ridden. However, the sRTOR can be changed in
the LANE settings. The sRTOR can be calculated with observed vRTOR using the
formula sRTOR = vRTOR * C/r.

7/21/2019 Synchro Studio 8 User Guide
http://slidepdf.com/reader/full/synchro-studio-8-user-guide 196/559
Extension of Effect. Green Time
The extension of the effective green is time vehicles continue to enter after yellow interval
begins.
HCM Platoon Ratio
The HCM Platoon Ratio describes the quality of progression associated with arrivals to a
phase. For left-turn movements with permitted phasing, the platoon ratio describes arrivels
during the Protected Phase. For right turn movements with a protected operation concurrent
with the complementary left, the platoon ratio descries arrivals during the permitted right-turn
operation.
Platoon Ratio is designated using a number from 0 to 2.5. The conditions associated with variosratios are described below:
Platoon Ratio Arrival Type Description
0.333 1 Very poor progression
0.667 2 Unfavorable progression

7/21/2019 Synchro Studio 8 User Guide
http://slidepdf.com/reader/full/synchro-studio-8-user-guide 197/559
11-7
1.000 3 Uncoordinated signals or random arrivals
1.333 4 Favorable progression
1.667 5 Highly favorable progression
2.000 6 Exceptional progression
Refer to the 2010 HCM for additional details.
HCM Upstream Filtering Factor
The upstream filtering adjustment factor I accounts for the effect of an upstream signal on
vehicle arrivals to the subject movement group. Specifically, this factor reflects the way an
upstream signal changes the variance in the number of arrivals per cycle. The variance decreases
with increasing volume‐to‐capacity ratio, which can reduce cycle failure frequency and resulting
delay.The filtering adjustment factor varies from 0.09 to 1.0. A value of 1.0 is appropriate for an
isolated intersection (i.e., one that is 0.6 mi or more from the nearest upstream signalized
intersection). A value of less than 1.0 is appropriate for nonisolated intersections.

7/21/2019 Synchro Studio 8 User Guide
http://slidepdf.com/reader/full/synchro-studio-8-user-guide 198/559
For additional details, see the 2010 HCM and the topic on Lane Width in the LANES settings,
page 5-5.
Receiving Lanes
The number of receiving lanes represents the count of lanes departing the intersection. This
number should be separately determined for each left‐turn and right‐turn movement. Experience
indicates that proper turning cannot be executed at some intersections because a receiving lane
is frequently blocked by double‐ parked vehicles. For this reason, the number of receiving lanes
should be determined from field observation when possible.
In Synchro, this value is determined based on the downstream lanes.
Turn Bay Length
For additional details, see the 2010 HCM and the topic on Storage Length in the LANES
settings, page 5-6.
Parking Present?

7/21/2019 Synchro Studio 8 User Guide
http://slidepdf.com/reader/full/synchro-studio-8-user-guide 199/559
11-9
For additional details, see the 2010 HCM and the topic on Adjacent Parking Lane, ParkingManeuvers in the VOLUME settings, page 6-6.
Parking Maneuvers
For additional details, see the 2010 HCM and the topic on Adjacent Parking Lane, Parking
Maneuvers in the VOLUME settings, page 6-6.
Bus Stopping Rate
For additional details, see the 2010 HCM and the topic on Bus Blockages in the VOLUME
settings, page 6-5.
Stop Line Detector Length
The stop‐line detector length represents the length of the detection zone used to extend the green
indication. This detection zone is typically located near the stop line and may have a length of
40 ft or more. However, it can be located some distance upstream of the stop line and may be as

7/21/2019 Synchro Studio 8 User Guide
http://slidepdf.com/reader/full/synchro-studio-8-user-guide 200/559
Figure 11-4 HCM 2010 Pedestrian Mode Full Screen

7/21/2019 Synchro Studio 8 User Guide
http://slidepdf.com/reader/full/synchro-studio-8-user-guide 201/559
11-11
Crosswalk Length
The crosswalk length (i.e., Lcand L
d ) is measured from outside edge to outside edge of road
pavement (or curb to curb, if present) along the marked pedestrian travel path.
Crosswalk Width
The crosswalk width (i.e., W cand W
d ) represents an effective width. Unless there is a known
width constraint, the crosswalk‟s effective width should be the same as its physical width. A
width constraint may be found when vehicles are observed to encroach regularly into the
crosswalk area or when an obstruction in the median (e.g., a signal pole or reduced‐width cut in
the median curb) narrows the walking space.
Total Number of Lanes Crossed
The street width represents the width of the cross street as measured along the outside through
vehicle lane on the subject approach between the extended curb line limits of the cross street. It
is measured for each intersection approach.
Number of Right Turn Islands
This is the number of right turn islands present on the approach.
Type of Control
This is the type of control on the approach. The options are none, actuated, pretimed, actuated
plus rest in walk, or no signal.
Corresponding Signal Phase
This is the signal phase associated with the pedestrian movement.
Effective Walk Time
Research indicates that, at intersections with pedestrian signal heads, pedestrians typically
continue to enter the intersection during the first few seconds of the pedestrian clear interval.
This behavior effectively increases the effective walk time available to pedestrians. A
conservative estimate of this additional walk time is 4.0 s. A nonzero value for this additional
time implies that some pedestrians are initiating their crossing during the flashing DON‟T WALK
i di i R f h 2010 HCM f d il
7/21/2019 Synchro Studio 8 User Guide
http://slidepdf.com/reader/full/synchro-studio-8-user-guide 202/559
11-12
indication. Refer to the 2010 HCM for details.
Right Corner Size A
The width of sidewalk A. Refer to Figure 11-5.
Right Corner Size B
The width of sidewalk B. Refer to Figure 11-5.
Right Corner Curb Radius
The corner radius of the corner curb in feet. Refer to Figure 11-5.
Right Corner Total AreaThe Total Area of the right corner.
Fi 11 5 HCM 2010 P d t i M d C i Di i
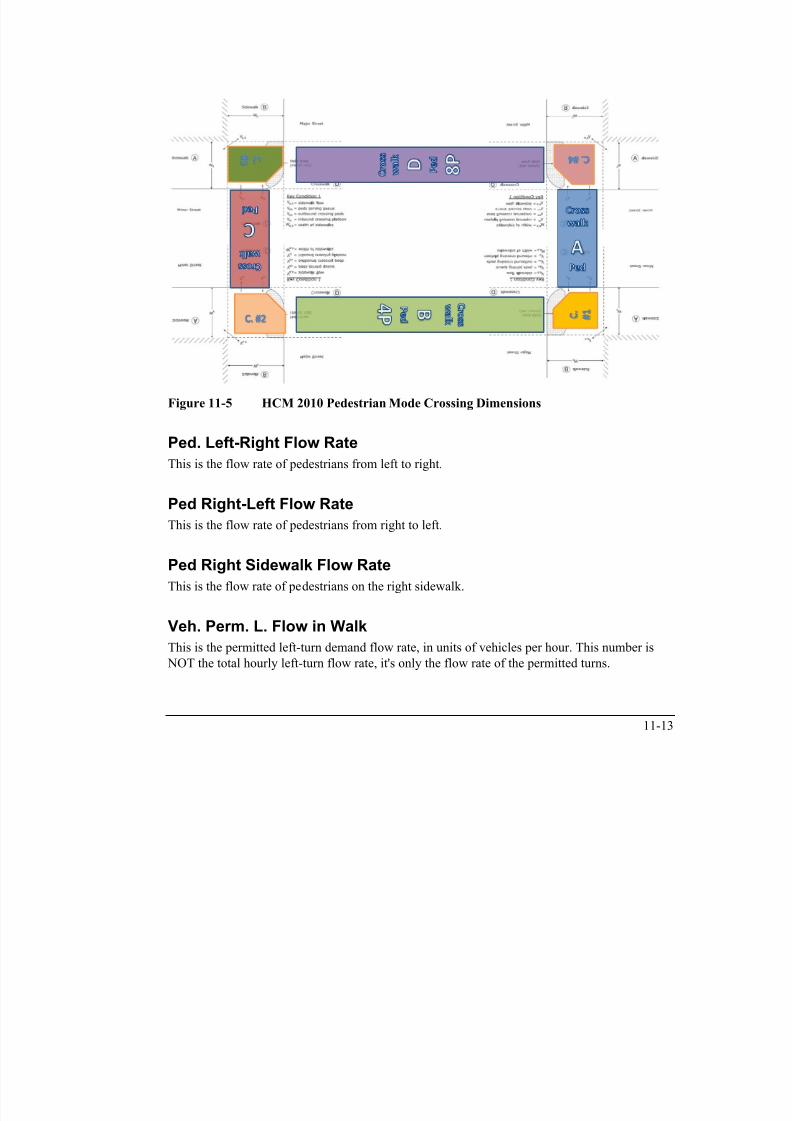
7/21/2019 Synchro Studio 8 User Guide
http://slidepdf.com/reader/full/synchro-studio-8-user-guide 203/559
11-13
Figure 11-5 HCM 2010 Pedestrian Mode Crossing Dimensions
Ped. Left-Right Flow Rate
This is the flow rate of pedestrians from left to right.
Ped Right-Left Flow RateThis is the flow rate of pedestrians from right to left.
Ped Right Sidewalk Flow Rate
This is the flow rate of pedestrians on the right sidewalk.
Veh. Perm. L. Flow in WalkThis is the permitted left-turn demand flow rate, in units of vehicles per hour. This number is
NOT the total hourly left-turn flow rate, it's only the flow rate of the permitted turns.
Veh. Perm. R Flow in Walk
This is the permitted right-turn demand flow rate, in units of vehicles per hour. This number is
assumed to be the TOTAL permitted right-turn flow rate, including RTOR's.
Veh. RTOR Flow in Walk
This is the right-turn on red flow rate, in units of vehicles per hour. This would be the RTOR
within the right-turning flow rate that could otherwise turn permissively into the crosswalk
while the crosswalk is being used by pedestrians.
85th percentile speed
This is the 85th percentile speed at a mid segment location on the major/minor street, in units of
miles per hour.
Right Corner Area per Ped
This is the right corner area per pedestrian in square feet per pedestrian.
Ri ht C Q lit f S i
7/21/2019 Synchro Studio 8 User Guide
http://slidepdf.com/reader/full/synchro-studio-8-user-guide 204/559
11-14
Right Corner Quality of Service
The pedestrian level of service for the subject crosswalk based on the score in HCM 2010
Exhibit 18-5 (from the HCM 2010).
Ped. Circulation Area
The Pedestrian Circulation Area is the subject crosswalk circulation area per pedestrian, in unitsof square-feet per pedestrian or ft^2/p
Crosswalk Circulation Code
Circulation Code using the qualitative descriptions of Exhibit 18-24 (from the HCM 2010), the
corner circulation area is provided a description of service.
Pedestrian Crosswalk Score
The pedestrian LOS score for the intersection Ip,int is calculated by using Equation 18‐72
through Equation 18‐7 of the 2010 HCM. Refer to the HCM for additional information.
Pedestrian Crosswalk LOS
Pedestrian delay represents the average time a pedestrian waits for a legal opportunity to cross
an intersection leg. The LOS score is an indication of the typical pedestrian‟s perception of the
overall crossing experience.
Bicycle ModeAfter selecting the HCM 2010 Settings button, choose the Bicycle Mode tab to enter the HCM
2010 Bicycle Mode Methods.
Figure 11-6 HCM 2010 Bicycle Mode Tab
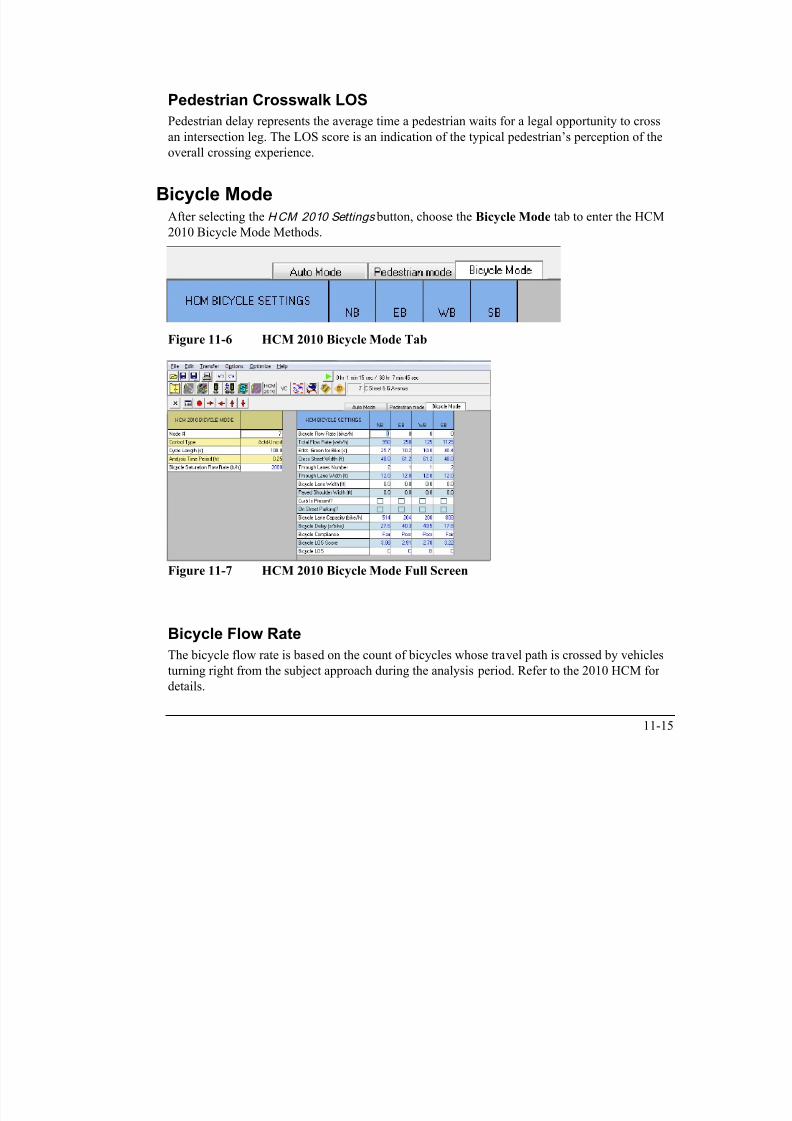
7/21/2019 Synchro Studio 8 User Guide
http://slidepdf.com/reader/full/synchro-studio-8-user-guide 205/559
11-15
Figure 11-7 HCM 2010 Bicycle Mode Full Screen
Bicycle Flow Rate
The bicycle flow rate is based on the count of bicycles whose travel path is crossed by vehicles
turning right from the subject approach during the analysis period. Refer to the 2010 HCM for
details.
Total Flow Rate
This is the sum of the Adjusted Lane Group flow rates for the given movement. Refer to the
2010 HCM for details.
Effect. Green for Bike
This is the actuated effective green time from the Timing Settings.
Cross Street Width
The street width represents the width of the cross street as measured along the outside through
vehicle lane on the subject approach between the extended curb line limits of the cross street.
Refer to the 2010 HCM for details.
Through Lanes Number
This is the number of through lanes for the given approach. Refer to the 2010 HCM for details.
Through Lanes Width
7/21/2019 Synchro Studio 8 User Guide
http://slidepdf.com/reader/full/synchro-studio-8-user-guide 206/559
11-16
Through Lanes WidthThis is the Lane Width for the through lanes. Refer to the 2010 HCM for details.
Bicycle Lane Width
This is the bicycle lane adjacent to the outside lane. Refer to the 2010 HCM for details.
Paved Shoulder WidthThis is the paved outside shoulder width adjacent to the bicycle lane. Refer to the 2010 HCM
for details.
Curb is Present?
Check box if curb is present, leave unchecked if no curb is present. Refer to the 2010 HCM for
details.

7/21/2019 Synchro Studio 8 User Guide
http://slidepdf.com/reader/full/synchro-studio-8-user-guide 207/559

7/21/2019 Synchro Studio 8 User Guide
http://slidepdf.com/reader/full/synchro-studio-8-user-guide 208/559
11-18
Figure 11-8 HCM 2010 Roundabout Mode Full Screen
Exit Lanes
This is the number of lanes exiting on the given approach.
Conflicting Circle Lanes
This is the internal conflicting cicular lanes to the approach.
Adjusted Approach Flow
This is the total adjusted flow on the approach, in vehicle per hour.
Demand Flow Rate
This is the equivalent adjusted flow converted to passenger car equivalent. See the 2010 HCM
for additional details.
Vehicles CirculatingThe circulating flow opposing a given entry is defined as the flow conflicting with the entry
flow (i.e., the flow passing in front of the splitter island next to the subject entry). All flows are
in passenger car equivalents. See the 2010 HCM for additional details.
Vehicles Exiting
The exiting flow rate for a given leg is used primarily in the calculation of conflicting flow for
right‐turn bypass lanes. If a bypass lane is present on the immediate upstream entry, the
right‐turning flow using the bypass lane is deducted from the exiting flow. All flows are in
passenger car equivalents. See the 2010 HCM for additional details.
Follow-Up Headway
When the conflicting flow rate approaches zero, the maximum entry flow is given by 3,600 s/hdivided by the follow up headway which is analogous to the saturation flow rate for a

7/21/2019 Synchro Studio 8 User Guide
http://slidepdf.com/reader/full/synchro-studio-8-user-guide 209/559
11-19
divided by the follow‐up headway, which is analogous to the saturation flow rate for a
movement receiving a green indication at a signalized intersection. At high levels of entering
and conflicting flow, limited priority (where circulating traffic adjusts its headways to allow
entering vehicles to enter), priority reversal (where entering traffic forces circulating traffic to
yield), and other behaviors may occur. In these cases, more complex analytical models or
regression models, such as those incorporated into some of the alternative tools discussed later
in this chapter, may give more realistic results.
Ped Vol. Crossing Leg
The number of pedestrians crossing the leg and is used to determine the pedestrian impedence
factor.
Ped Capacity AdjustmentPedestrian traffic can reduce the vehicular capacity of a roundabout entry if sufficient
pedestrians are present and they assert the right‐of ‐way typically granted pedestrians in most
jurisdictions. Under high vehicular conflicting flows, pedestrians typically pass between queued

7/21/2019 Synchro Studio 8 User Guide
http://slidepdf.com/reader/full/synchro-studio-8-user-guide 210/559
on the specific turning movement patterns being analyzed. See the 2010 HCM for additional
details.
Right Turn Channelized
In Synchro, this is the Right Turn Channelized setting, see page 5-7. I can be None, Free,Yield or Stop. If Stop is selected, the movement will be treated as Yeild control.
Lane Utilization
Table 11-2 Roundabout Lane Utilization (2010 HCM)
Lane Configuration % Traffic in Left Lane* % Traffic in Right Lane*
Left-through + through-right 0.47 0.53
Left-through-right + right 0.47 0.53
Left + left-through-right 0.53 0.47
*These values are generally consistent with observed values for through movements at
signalized intersections. These values should be applied with care, particularly under conditions
estimated to be near capacity.

7/21/2019 Synchro Studio 8 User Guide
http://slidepdf.com/reader/full/synchro-studio-8-user-guide 211/559
11-21
Entry Flow Rate
The per lane entry flow rate in passenger cars per hour.
Capacity, Entry
This is the per lane entry capacity as determined with the 2010 HCM methods in passenger cars per hour.
Entry HV Adjustment Factor
The flow rate for each movement may be adjusted to account for vehicle stream characteristics
using factors shown below.
Table 11-3 Entry HV Adjustment Factor (2010 HCM)
Vehicle Type Passenger Car Equivalent, Et
Passenger Car 1.0
Heavy Vehicle 2.0
Flow Rate, Entry
This is the entry flow rate, converted back to vehicles per hour.
Capacity, Entry
This is the lane capacity, converted back to vehicles per hour.
Volume to Capacity Ratio
For a given lane, the volume‐to‐capacity ratio x is calculated by dividing the lane‟s calculated
capacity into its demand flow rate.
Control DelayThe roundabout control delay is based on the following formula:
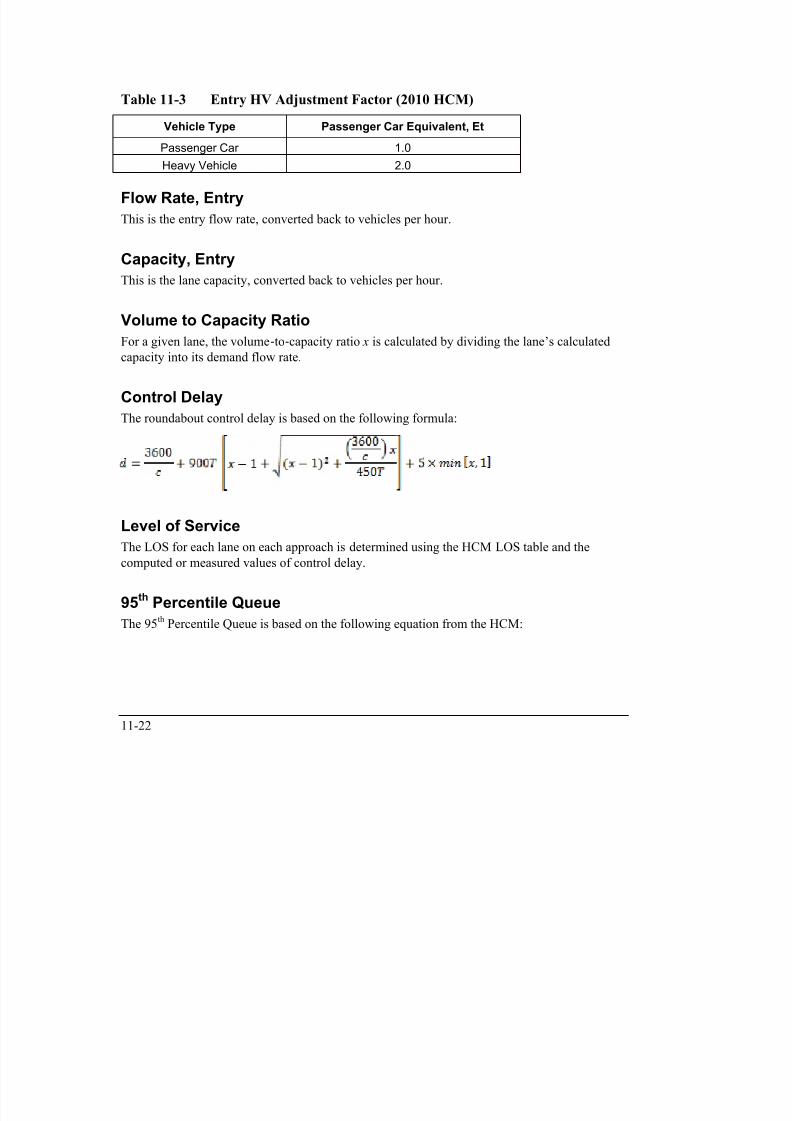
7/21/2019 Synchro Studio 8 User Guide
http://slidepdf.com/reader/full/synchro-studio-8-user-guide 212/559
11-22
The roundabout control delay is based on the following formula:
Level of Service
The LOS for each lane on each approach is determined using the HCM LOS table and the
computed or measured values of control delay.
95th Percentile Queue
The 95
th
Percentile Queue is based on the following equation from the HCM:

7/21/2019 Synchro Studio 8 User Guide
http://slidepdf.com/reader/full/synchro-studio-8-user-guide 213/559
11-23

7/21/2019 Synchro Studio 8 User Guide
http://slidepdf.com/reader/full/synchro-studio-8-user-guide 214/559
Chapter 12 – Network Settings
Network SettingsThe NETWORK SETTINGS allow you to make changes that impact the entire network. These
settings affect the default values for entries in the LANE, VOLUME, TIMING, PHASING
and SIMULATION OPTIONS settings.
To access the NETWORK settings, select the Options Network Settings command from
the menu.
To quickly access the NETWORK SETTINGS window, double click with the mouse
on the related row in any of the data entry settings.

7/21/2019 Synchro Studio 8 User Guide
http://slidepdf.com/reader/full/synchro-studio-8-user-guide 215/559
12-1
Figure 12-1 NETWORK Settings
Because these settings will influence newly created intersections, it is strongly recommended
that these settings be entered first.
Most values have a button next to it marked [Set All]. Pushing this button will set all of the
intersections in the network to that value. Use these buttons with extreme caution. Pressing
[Set All] for Cycle Lengths, for instance, will cause all of the intersections in the network orzone to take on the new Cycle Length. Any custom Split, Offset, or Cycle Length information
will be lost. One or more zones can also be changed by choosing the Scope prior to selecting
[Set All] which will only change the cycle length within the selected zone.
The Set All Scope can be used to apply the settings to the Entire Network or a particular Zone.
All of these values, except Vehicle Length, Maximum Cycle Length, Pedestrian Walking Speed,
Analysis Period, and ICU Reference Cycle Length are defaults can be changed locally at theintersection.
To switch between sections press [Ctrl]+[Tab] or [Ctrl]+[Shift]+[Tab].
The [Default] button restores default values for all items in the NETWORK SETTINGS. The
undo command can be used after selecting the [Default] button to switch back to the previous
settings (after closing the NETWORK SETTINGS).
Lane Settings
7/21/2019 Synchro Studio 8 User Guide
http://slidepdf.com/reader/full/synchro-studio-8-user-guide 216/559
12-2
g
Lane Width
Lane Width is the width of a single lane in feet (meters). The default is 12 feet (3.7 meters).
Also see the topic on Lane Widths on page 5-5.
Flow Rate
Flow Rate is the ideal Saturated Flow Rate per lane in the absence of any interference. The 2000
HCM recommends using 1,900 vphpl as the default. Also see the topic on Ideal Saturated
Flow Rate on page Ideal Saturated Flow.
Vehicle Length
Vehicle Length is the average length of vehicles, in ft (m), including the space between them
when stopped. This value is used to calculate queue lengths and for detecting blocking
problems. The default value is 25 ft (8 m).
The Vehicle Length is used in conjunction with the Storage Length and the length of links to
determine if there is adequate storage space for vehicles.
Allow Right Turn on Red
This field is used to specify whether Right Turns on Red (RTOR) are allowed by default.
Right Turn on Red is used to specify whether RTORs are allowed. Synchro automatically
calculates a Saturated Flow Rate (RTOR) if this option is selected. This field is also used for
modeling RTOR in SimTraffic and CORSIM.
Volume Settings
Peak Hour Factor
The PHF is the ratio of the flow rate for the entire hour, to the flow rate for the peak 15 minutes.
The default is 0.92. See the topic on Peak Hour Factor (page 6-3) for more information.
Growth Factor
The Growth Factor can be used to adjust all volumes by a set amount. This is commonly used toconvert current traffic counts into future projections. See the topic on Growth Factor (page 6-4)
for more information

7/21/2019 Synchro Studio 8 User Guide
http://slidepdf.com/reader/full/synchro-studio-8-user-guide 217/559
12-3
for more information.
Heavy Vehicles
Heavy Vehicles is the percentage of trucks and heavy vehicles in the traffic stream. The default
is 2%. If you are analyzing an area with many trucks, consider using a higher value. See the
topic on Heavy Vehicles (page 6-5) for more information.
Conflicting Pedestrians
Conflicting Pedestrians is the number of pedestrians per hour crossing a given approach. The
default is zero. If you are analyzing an area with many pedestrians, consider assigning a default
value. See the topic on Conflicting Pedestrians (page 6-2) for more information.
Do not confuse this value with pedestrian calls. Conflicting pedestrians is the number of
pedestrians that right turns must yield to. Pedestrian Calls is the number of pedestrians
activating the pedestrian push button. Normally they will be the same.
Travel Speed
Travel Speed is the speed limit or predominant speed given all green lights. The default is 30
mph (50 km/h). To set the speed for an individual link, go to the map and double-click on the
link.
Pedestrian Walking Speed
This setting is used for unsignalized intersection analysis. This setting also controls the
pedestrian speed in SimTraffic.
Analysis Period
This setting is used to modify the Analysis Period T that is used for delay calculations.Additional information on the Analysis Period can be found in Chapter 1, Optimizations and
Calculations.
Timings Settings
Cycle Length
This is the cycle length, in seconds. See the topic on Cycle Length (page 7-8) for more
information.

7/21/2019 Synchro Studio 8 User Guide
http://slidepdf.com/reader/full/synchro-studio-8-user-guide 218/559
12-4
Maximum Cycle Length
The Maximum Cycle Length is the longest cycle length, in seconds, that is evaluated when
optimizing the cycle length. When optimizing intersection and network cycle lengths, Synchro
will try a range of cycle lengths up to the Maximum Cycle length. The Cycle Length chosen willhave the lowest combination of stops, delays, and queue penalty.
Cycle lengths above 120s may offer incrementally more capacity, but they also have long
queues, and may increase frustration of motorists. It is difficult to maintain the saturation flow
rate with long green times.
Allow Lead/Lag Optimize?This is the default value for the Allow Lead/Lag Optimize? field in the TIMING SETTINGS
window. Check this box to allow lead-lag optimization by default.
Yellow Time
This is the amount of time for the Yellow Interval in seconds. See the topic on Yellow Time
(page 7-12) for more information.
All Red TimeThis is the amount of time for the all-red interval following the yellow interval. See the topic on
All-Red Time (page 7-12) for more information.
Lost Time Adjustment
The Lost Time Adjustment is the adjustment to the Total Lost time. The Total Lost Time used in
calculations is the Y+AR plus the Lost Time Adjustment. The default for both startup lost timeand extension of effective green is 2.5 seconds, so the Lost Time Adjustment defaults to zero.
See the topic on Lost Time Adjustment on page 7-13 for more information.
Reference Phase
This is the coordinated phase(s) to which offsets are referenced. Normally phases 2 and 6 are the
coordinated phase.
Off t R f St l
7/21/2019 Synchro Studio 8 User Guide
http://slidepdf.com/reader/full/synchro-studio-8-user-guide 219/559
12-5
Offset Reference Style
Offset Reference Phase is the part of the phase to which offsets are referenced. Beginning of
Green is the default for new intersections and when using [Set All].
The options for Offset Reference Style are:
Begin of Green: Offsets are referenced to the beginning of the last reference phase to turngreen. This is traditional NEMA referencing.
Begin of Yellow: Offsets are referenced to the beginning of the first reference phase to turn
yellow. This is 170 style referencing.
Begin of Red: Offsets are referenced to the beginning of the first reference phase to turn
red.
TS2 -1st Green: Offsets are referenced to the beginning of the first reference phase to turn
green. This is the referencing used with some NEMA TS2 controllers.
170 Style: Referenced to start of FDW or start of yellow.
Minimum Splits, Left and Through
The Minimum Splits are the shortest allowable split, in seconds. Newly created intersections
will have these values for their minimum splits. Minimum Splits are used when optimizing the
splits for an intersection.
Through phases will normally have a pedestrian phase associated with them, while
left turn phases will not. Therefore, the minimum required splits for through phases
are typically longer than for left turn phases.
See the topic on Minimum Splits (page 8-6) for more information.
Control TypeThis is the type of controller used. The options are Pretimed, Actuated-Uncoordinated, Semi
Actuated-Coordinated, Actuated-Coordinated, Unsignalized and Roundabout. Refer to the topic
on Control Type (page 4-4) for more information.
ICU Reference Cycle Length
This is the reference cycle length used by the ICU calculations (see page 14-41 for additionaldetails).
7/21/2019 Synchro Studio 8 User Guide
http://slidepdf.com/reader/full/synchro-studio-8-user-guide 220/559
12-6
Phases Settings
Minimum Initial
This is the minimum green time. This value is used for computing actuated green times (see
page 8-614-6 for additional details).
Vehicle Extension
This is the maximum gap time (see page 8-9 for additional details).
Minimum Gap
This is the minimum gap time, used with volume-density operation (see page 8-9 for additional
details).
Time Before Reduce
Time Before Reduce is used with volume-density operation (see page 8-9 for additional details).
Time To Reduce
Time To Reduce is used with volume-density operation (see page 8-9 for additional details).
Pedestrian Phase
This field controls whether through phases will have a pedestrian phase by default or after [Set
All].
Left phases do not normally have a pedestrian phase associated with them. Refer to page 8-10
for additional details.
Walk Time
Time for pedestrian walk interval in seconds (see page 8-10 for additional details).
Flash Don’t Walk TimeTime for pedestrian clearance interval in seconds (see page 8-11 for additional details).

7/21/2019 Synchro Studio 8 User Guide
http://slidepdf.com/reader/full/synchro-studio-8-user-guide 221/559
12-7
Pedestrian Calls
The number of pedestrian calls per hour at a push button (see page 8-11 for additional details).
Floating Force Off?
This option will control the Floating Force Off setting. Refer to page Error! Bookmark not
defined. for additional details.
Yield Point
This setting allows the Yield Point to be set for the network or zone. Refer to page 4-15 for
additional details.
Simulation Settings
Taper Length
This setting controls the taper length for storage lanes. See page 9-2 for full details.
Enter Blocked Intersection
The Enter Blocked Intersection setting controls simulation modeling gridlock avoidance.
Checking the box will set this value to Yes. An unchecked box is No. See the topic on page 9-4
for full details.
Crosswalk Width
This setting controls the width of the crosswalk. See page 9-6 for full details.
Simulation Turning Speed
This is the default turning speed for vehicles in miles/hour (km/h) while inside the intersection.
Synchro does not use this information. It is only used when modeling in SimTraffic or
CORSIM. Turning speed is adjusted by driver speed factor. See page 9-8 for full details.

7/21/2019 Synchro Studio 8 User Guide
http://slidepdf.com/reader/full/synchro-studio-8-user-guide 222/559
12-8
Chapter 13 – Time-Space Diagram
Time-Space Diagrams can be used to graphically see how traffic flows between
intersections. To view a Time-Space Diagram (TSD), first click on the desired
intersection or the desired link to select it, then press the Time-Space Diagram buttonor the [F7] key.

7/21/2019 Synchro Studio 8 User Guide
http://slidepdf.com/reader/full/synchro-studio-8-user-guide 223/559
13-1
Figure 13-1 TIME-SPACE DIAGRAM
Arterial view: Invoking a time-space diagram with a link selected will bring up a time-space
diagram showing that link's arterial TSD from one end to the other.
Intersection view: Invoking a time-space diagram with an intersection selected will bring up a
time-space diagram showing all the links connecting to that intersection and one intersection in
each direction.
Named Arterial view: Invoking a time-space diagram with a named arterial from the
SELECT INTERSECTION window (press the Select-Intersection button or the [F8]
key) will bring up a time-space diagram showing a named arterial. The Named Arterial
view can show part of an arterial based on its name, zone, or route #. The Named Arterial view
can also show an arterial that turns corners. See the section on Interacting with the Time-Space
Diagram on page 13-9 for details on creating a route number.
Parts of a Time-Space Diagram

7/21/2019 Synchro Studio 8 User Guide
http://slidepdf.com/reader/full/synchro-studio-8-user-guide 224/559
13-2
Figure 13-2 Parts of a TIME-SPACE DIAGRAM
Synchro's time-space diagrams display time along the horizontal axis and distance along the
vertical axis.
The following information summarizes each part of the time-space diagram in Figure 13-2.
Toolbar- These buttons change the views of the TIME-SPACE DIAGRAM. They are
explained in detail below.
Street Names and Offsets- These are the street names of the intersection shown. The top
name is the name of the street with the time-space diagram being shown. The bottom
name is the name of the cross street. Underneath the street names is the intersectionoffset. The offset is referenced to the reference phase even if it is not one of the
approaches in the diagram.
Direction Icon- These icons indicate the direction of the street in question. The top icon
shows the direction of traffic moving downward in the diagram, usually Southbound or
Westbound. The bottom icon shows the direction of traffic moving in the upward
direction in the diagram, usually Northbound or Eastbound. These directions also match
the direction of the average delays showed in delays options and the colored timing bands (F).
Street and Intersection Diagram- The vertical line represents the street with the time-
space diagrams. The horizontal lines are crossing streets. These lines identify which
links connect two intersections and which are external links. These lines also show
where the diagrams stop, when two or more streets are shown in Intersection View.
Clicking on or near a vertical line will display an Arterial View centered on that link.
Clicking on or near a horizontal line will display an Intersection View for thatintersection.
Traffic flow lines or Traffic Density Diagram- The diagonal and horizontal lines show

7/21/2019 Synchro Studio 8 User Guide
http://slidepdf.com/reader/full/synchro-studio-8-user-guide 225/559
13-3
Traffic flow lines or Traffic Density Diagram The diagonal and horizontal lines show
traffic flow. (See the Traffic Flow Diagram in this topic for a complete description.)
Timing Bands. The red, green, and yellow bands indicate the phase of the signal for each
part of the cycle. The different colors and hatching are as follows:
Green represents a green phase for through traffic in both the upwards anddownwards direction.
Red represents a red phase for both directions through and left movements.
Teal represents an unsignalized intersection or a bend.
Downward Hatching (\\\\) represents a green phase for downward through and
left traffic. Left turns, if any, are protected.
Upward Hatching (////) represents a green phase for upward through and left
traffic. Left turns, if any, are protected.
Cross Hatching (XXXX) represents a green phase for left turns in both
directions. Through traffic has a red phase.
Solid Yellow or Hatched Yellow represents a yellow phase for one or more
phases in the movement.
The green bands for an actuated signal may start or end early. The times shown are
actuated times and this represents the phases gapping out early. Select [Max] to showmaximum green times.
A scale on the top of the timing bands shows the time scale. The scale can be changed
with the Options Time-Space Diagram command. Refer to the icons in (C) to see
which direction the cycle bands represent.
If your time-space diagrams only show 2 or 3 intersections, it may be because youare displaying an intersection view. See the Switching Views section below for
information about arterial views.
Time-Space Diagram Features
Scrolling
To scroll or move the time space diagram vertically, use the arrow buttons, the arrow
keys, or by clicking and dragging on the diagram (away from the timing bands).

7/21/2019 Synchro Studio 8 User Guide
http://slidepdf.com/reader/full/synchro-studio-8-user-guide 226/559
13-4
Show Bands
The show bands (bandwidth option) shows arterial bandwidths. Bandwidth is the
part of the cycle that allows the vehicles to go through all intersections without stopping (intheory). Synchro shows both arterial bands and link bands.
Arterial bands are green bands that carry a vehicle along the entire corridor without stopping.
Link bands are green bands that carry a vehicle between two intersections without stopping.
The following default colors are used in bandwidth displays.
NB and WB Arterial Through Bands Red
SB and EB Arterial Through Bands Blue
NB and WB Link Bands and NB and WB Left Turn Bands Purple
SB and EB Link Bands and SB and EB Left Turn Bands Teal
Legend
The default colors can be changed with the time-space options. Clicking the
[Legend] button will display a legend of the colors.
Vehicle Flow Option
This diagram also shows the speed and position of the vehicles. Each line represents one or
more vehicles (see the table below). The slope of the line is proportional to the vehicles' speed.
Horizontal lines represent stopped cars. The best timing plans are the ones with the fewest and
shortest horizontal lines.
The triangles of horizontal lines represent stopped vehicles queued at a red light. The width of
the triangle is the longest waiting time. The height of the triangle represents the maximum
queue. A tall, skinny triangle represents a long queue making a short stop. A short, wide
trapezoid represents a few vehicles making a long stop.
The following default colors are used in flow displays.
NB and WB Through Traffic Red
SB and EB Through Traffic Blue
NB and WB Through Traffic and NB and WB Left Traffic Purple

7/21/2019 Synchro Studio 8 User Guide
http://slidepdf.com/reader/full/synchro-studio-8-user-guide 227/559
13-5
SB and EB Through Traffic and SB and EB Left Traffic Teal
Normally each line represents one vehicle. On high volume lane groups, a line could represent
two or more vehicles. Table 13-1 indicates how many vehicles each line represents.
Table 13-1 Time-Space Vehicles per Line
Adj Lane Group Volume Vehicles per line
0 to 899 vph 1
900 to 1899 2
1800 to 2699 3
2700 to 3599 4
Percentile Options
Traffic flow is not constant but varies, even over the course of an hour. Synchro models traffic
flow, actuated green times, and traffic flows with five different traffic scenarios. These
scenarios represent 90th, 70th, 50th, 30th, and 10th percentile cycles for the hour for which
volume data is given. If you looked at 100 cycles, the 90th percentile would have 90 cycles with
less volume (10 with the same or more). The 50th percentile represents average traffic
conditions.
The time-space diagrams allow you to see traffic flow for these scenarios. To see the varied
flow options, select the appropriate drop-down from the toolbar on the left.
Maximum Option
With Maximum, green bands show maximum green times, even for actuated signals.
Max can only be used with the Bandwidth option. This is because Synchro
calculates departures internally using actuated green times. Synchro does not
calculate departure patterns for actuated signals with maximum green settings. The
Flow option can only be used with the Percentile scenarios.
90th, 70th, 50th, 30th, and 10th Percentile viewsWith one of these options selected, the green bands show the actuated green
times and actuated start times.

7/21/2019 Synchro Studio 8 User Guide
http://slidepdf.com/reader/full/synchro-studio-8-user-guide 228/559
13-6
Traffic flows represent the flows from the percentile scenario.
The 90th percentile scenario will have heavier traffic; the 10th percentile
traffic will have lighter traffic.
Bandwidths in percentile scenarios are based on actuated green times. This
feature can actually allow greater bandwidths around intersections that have light side-street
traffic.
Early Return to Green
Viewing actuated signals in percentile view can highlight several potential problems with
coordination. If some phases are skipped or gap out, the main street green will start earlier than predicted with pretimed coordination. These vehicles will arrive at the next intersection early
and may have to stop a second time.
When coordinating side streets or left turn phases, it is possible for the signal to skip or gap-out
before the platoon arrives. This view can highlight these problems. This is especially a problem
with leading left turns.
When showing a Percentile flow, splits cannot be adjusted. Maximum splits must be
shown in order to adjust splits.
Show Delays
To show the total delay for each movement and the intersections overall, push in
the Show Delays button. Showing delays gives you feedback about how well a
timing plan works. Turning off the delays makes more space available for the diagrams, and
speeds up diagram generation.
Push [Delays] a second time to turn delay display off.
Total Delays - These values are the estimated total delay for all traffic moving in the given
direction. Total delay includes control delay and queue delay. The first three columns are the
total delay for traffic in the left, through, and right turn lane groups. The fourth column is the
total delay for the intersection, including traffic in all directions.
Show Super Saturated
Push the Show Super Saturated button to show lane groups operating above

7/21/2019 Synchro Studio 8 User Guide
http://slidepdf.com/reader/full/synchro-studio-8-user-guide 229/559
13-7
capacity. They are shown with their queues filled at the beginning of green. When
this option is off, the time-space diagram assumes that all queues are cleared at the end of green.
If you want to hand create a timing plan for super saturated conditions, turn on this option. If
you want a timing plan that works for unsaturated conditions, turn off this option. This option
only affects lane groups whose volume-to-capacity ratio is greater than 1.0 and who havecompatible cycle lengths.
If the intersections have incompatible cycle lengths, the diagram does not repeat and a queue
builds with each successive cycle.
Show Queue Interaction Problems
Push the Show Queue I nteractions button to show queue interaction problems.
Queue interaction problems will be shown as colored rectangles in the time-space
diagram at the stop bar. The color coding is as follows:
Red indicates blocking delay. A red rectangle at a stop bar indicates that the upstream
intersection queues are spilling back and blocking.
Yellow indicates starvation delay. Starvation delay is congestion caused by a short
upstream link in conjunction with poor/no coordination .
Brown shows storage delay.
Blocking for left turns is shown with two strips as red or brown. If the cycles are uncoordinated,
blocking time is shown as pink across the entire width. More details can be found in the topic on
Queue Interactions page 14-54.
Show Legend
Select the Legend button to display a color-coded legend. The legend shows thecolor for the flow lines and the through and left timing bands. If the [Queue]
button is selected, the legend will include queue interaction color-coding.
Time-Space Diagram OptionsSelect the [Options] button to:
change the scale of the diagrams
change the flow line colors
ff f h fl di i fl l f
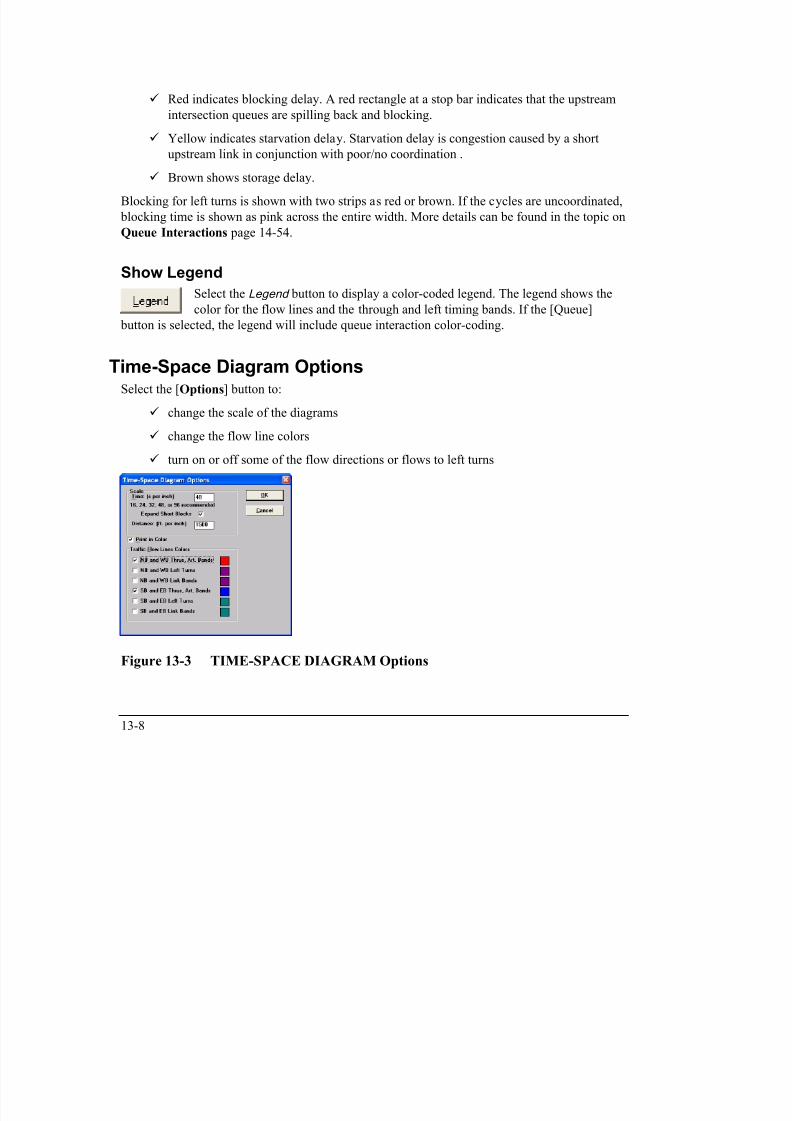
7/21/2019 Synchro Studio 8 User Guide
http://slidepdf.com/reader/full/synchro-studio-8-user-guide 230/559
13-8
turn on or off some of the flow directions or flows to left turns
Figure 13-3 TIME-SPACE DIAGRAM Options
Normally time-space diagrams print the green portion of the timing bands as white. This makes
the diagrams clearer on a black and white printer.
To print the timing bands as red and green on a color printer, check the following setting:
1. Choose [Options].
2. Check the box, Print in color.
The Time Space diagrams have an option "Expand Short Blocks". This allows space
for text or users can keep them small. The option is on the Time Space diagram
options settings and the Print Settings options.
Time and Distance ScaleFor the time scale, enter a number between 16 and 96. The higher the number, the smaller each
cycle is. Since there are 96 dots per inch on the screen, it is recommended that the time scale be
an even divisor of 96. Good numbers for the time scale are 16, 24, 32, 48, and 96. For the
distance scale enter a number between 100 and 3,000 feet per inch (30 to 1,000 meters per inch).
As the scale increases, the distance between intersections decreases.
Enabling Flow Lines and Changing ColorsViewing traffic flows for four movements simultaneously can be a bit overwhelming. There are
options to limit the movements shown simultaneously.

7/21/2019 Synchro Studio 8 User Guide
http://slidepdf.com/reader/full/synchro-studio-8-user-guide 231/559
13-9
For each movement, the color can be changed by clicking the color box to the right of the text.
The flow lines can be added/removed by checking/unchecking the appropriate box.
Interacting with the Time-Space Diagram
Switching views
To switch to a different Intersection View you can do any of the following,
Click on the Street and Intersection Diagram (D in Figure 13-1), on a horizontal line.
Go to the MAP view (press [F2]), click on a different intersection, then return to theTIME-SPACE DIAGRAM (press [F7]).
Press [F8] to get the intersection list and select an intersection.
To switch to a different Basic Arterial View you can do one of the following:
Click on the Street and Intersection Diagram, (D in Figure 13-1) on a vertical line (do
not click near any horizontal line).
Go to the MAP view (press [F2]), click on a different link, then return to the TIME-
SPACE DIAGRAM (press [F7]).
The Basic Arterial view shows an entire corridor of through streets regardless of name or zone.
When in basic arterial mode, the Intersection Name panel in the upper tool bar is blank.
To switch to a Named Arterial view, select the Helicopter button or press [F8] to
activate the SELECT INTERSECTION settings. 1) Select an arterial by name or
number. 2) To select part of an arterial by zone, choose the By Zone option.
The Named Arterial view can show an arterial with bends or for a specific zone. When in named
mode, the arterial name appears in the Intersection Name panel on the upper toolbar.
To set up a route with multiple street names or that turns corners, enter a route number as part of
the street name with a # sign. For example, a street name of "Ashby Ave, SR #13" can be
referred to as route #13.
To make an arterial bend from North to East for example, make sure that '#13' is in the northand east links and NOT in the south or west links.
To display an arterial that splits into a one way pair, include the route numbers "5th Street
#101N" and "4th Street #101S" in the name of the one way sections Include both route numbers

7/21/2019 Synchro Studio 8 User Guide
http://slidepdf.com/reader/full/synchro-studio-8-user-guide 232/559
13-10
#101N and 4th Street #101S in the name of the one way sections. Include both route numbers
in the name of the two way section separated by a space such as "Broadway #101N #101S".
Adjusting Splits and Offsets
To change an offset for any phase, click and drag on the timing bands away from any
phase boundaries (F in Figure 13-2). The cursor will change into a hand shape before
and during offset adjustment.
Offsets cannot be changed for actuated and semi-actuated signals because they
are not coordinated and thus do not use offsets.
To change a split for a phase, click and drag on the timing bands at a phase boundary.
The cursor will change into a splitter shape before and during split adjustment. This
feature changes the maximum splits.
Splits can only be changed when in MAX mode. When in a percentile mode, the
splits shown are actuated splits; this feature only works with maximum splits.
When adjusting splits and offsets, you should attempt to make the right end of traffic flow lines
hit the timing bands in the green section, or to the left of the green section. This represents
traffic arriving at the intersection when the signal is green or just before the signal turns green.
When manually adjusting the timing, be sure to look at the average delay values. When you
reduce the delay for one direction, you may be increasing it for another direction. Make sure
you consider the delay for all movements. It is probably easier to let Synchro determine the best
timing plans for you.
Swap PhasesHolding down the [CTRL] key can be used to swap the phase order. When the [CTRL] key is
held down and the mouse cursor is moved over a swappable phase, the cursor changes to
indicate that the phases can be swapped. Clicking the mouse changes the phase sequence. If the
cursor is over two phases, the phase with the closest center point is chosen. Locked timing plans
cannot be changed. Phases can be manually swapped even if marked 'No' for Lead/Lag
Optimize.
Printing the time space diagram
The time-space diagram can be printed using the File Print Window command.

7/21/2019 Synchro Studio 8 User Guide
http://slidepdf.com/reader/full/synchro-studio-8-user-guide 233/559
13-11
The red and green bands will print as gray and white with a black and white printer. The color
option can be changed with the Options
Time Space Diagram command.
Notes on Timing Bands
Actuated Splits
When a percentile option is shown, the displayed green times are actuated green times. The
green times may be more or less than the inputted Maximum Green times. It is possible that
some bands show 100% red or 100% green; this indicates that a phase has been skipped. Phase
skips are common with volumes less than 100 vph, and for the 10th and 30th scenarios.
It is also quite possible for the main street green to start early. This is caused when side street
phases gap-out or skip. This behavior is called "early return to green", and the Time-Space
diagram shows this when a percentile option is selected.
Splits cannot be adjusted when a percentile option is shown. This is because the timings shown
are the calculated actuated splits and not the maximum input splits. To edit splits in the Time-
Space diagram, choose the [Max] option.
Maximum Splits
When the [Max] option is selected, flow lines cannot be displayed. The vehicle flows are
calculated using an iterative process based on coordination and actuated green times. It would
make no sense to show vehicle flows with maximum green times because the flows do not exist
without actuated green times.
Uncoordinated Intersections
Uncoordinated Intersections do not have an Offset or a fixed cycle length. With uncoordinatedintersections, the first phase always starts at time 0, and offsets cannot be adjusted.
Relating the Time-Space Display to Delays and Queues
Delays
The width of the horizontal lines in the Flow diagrams represents the signal delay incurred by
each vehicle. The sum of the line widths divided by the vehicles per cycle is equal to theuniform delay for the percentile scenario shown.
The control delay shown with the Delay option is same stopped delay shown in the TIMING
window and in the Intersection reports The Percentile delays are volume weighted average of

7/21/2019 Synchro Studio 8 User Guide
http://slidepdf.com/reader/full/synchro-studio-8-user-guide 234/559
13-12
window and in the Intersection reports. The Percentile delays are volume weighted average of
the five percentile scenario delays with the incremental delay added.
To convert from the delays represented by the flow lines to Percentile Delays the following
steps are applied:
1. Uniform Delay for each percentile scenario is the sum of horizontal widths divided by
vehicles per cycle.
2. Take Volume weighted average of five scenarios
3. Add Incremental delay for congestion
One might ask why the delay option does not show the delay associated with the percentile
shown. The percentile scenario is an unstable event that does not exist for more than one cycle.
In real life, traffic will vary between the maximum and minimum scenario volumes each cycle.
One cycle could be 90th percentile traffic followed by a 30 th, a 50th, a 10th, and a 78th. To show
delays for a single scenario has no meaning because the scenarios all exist together in a 15 or 60
minute analysis period.
A follow-up question might be why the time space diagram does not show a mix of percentile
scenarios. This type of display would be too difficult to present in a clear and informative
method.
Queues
Each horizontal line represents one (or more) vehicles in queue. The height of the queue stack is
equivalent to the length of the queue. The height with the 50th Percentile Flows is roughly
equivalent to the 50th Percentile Maximum Queue. Each vehicle takes up the space of the
average vehicle length, which is 25ft (7.5m) by default. With 2 or more lanes, the space per
vehicle is divided by the number of lanes. A delay of 6 seconds or less represents a vehicleslowing but not stopping. The maximum queue will thus be at the top vehicle with a delay of 6 s
or more.
The 95th Percentile Maximum Queue is normally 10 to 20 percent longer than the height of
the 90th Percentile Flows' Queue Stack. A delay of 6 seconds or less represents a vehicle
slowing but not stopping. The maximum queue will thus be at the top vehicle with a delay of 6 s
or more.
In a coordinated system, it is possible to change the queue length and delay by changing the
offsets. Remember that the widths of the horizontal lines represent delay and the height of the
queue stack represents the maximum queue.

7/21/2019 Synchro Studio 8 User Guide
http://slidepdf.com/reader/full/synchro-studio-8-user-guide 235/559
13-13

7/21/2019 Synchro Studio 8 User Guide
http://slidepdf.com/reader/full/synchro-studio-8-user-guide 236/559
Chapter 14 – Optimization and Calculations
Introduction
This chapter will provide details on the optimization and calculations performed by Synchro.The section on optimization will define how to perform the various optimization commands,
along with the objectives of these optimizations. The calculations section will provide in-depth
details regarding the underlying calculations found within Synchro.
Optimizations
Overview of OptimizationsSynchro contains a number of optimization functions. It is important to understand what each
function does and use the optimizations in the correct order.

7/21/2019 Synchro Studio 8 User Guide
http://slidepdf.com/reader/full/synchro-studio-8-user-guide 237/559
14-1
Figure 14-1 Optimization Steps
Step 1: Set Up Intersection Timing Plans
The first step is to make timing plans for each individual intersection. This step includes:
Enter volume data (refer to Chapter 6)
Enter lane data (refer to Chapter 5)
Set up phase numbers for each movement along with phase parameters (refer to
Chapter 7 and Chapter 8)
Optimize cycle lengths and splits
Check capacity
Check for coding errors (see the topic on Coding Error Messages on page 18-1)
Step 2: Partition Network
The next step is to divide the network into subsystems. This step is optional.
The Partition Network command will divide the network into multiple zones. This function
assigns a zone name to each intersection. Each zone can be optimized as a separate system in the
cycle length optimization.
Step 3: Optimize Network Cycle Length
The next step is to determine a system cycle length. It is possible to create multiple zones and
assign a different cycle length to each zone

7/21/2019 Synchro Studio 8 User Guide
http://slidepdf.com/reader/full/synchro-studio-8-user-guide 238/559
14-2
assign a different cycle length to each zone.
The Optimize Network Cycle Length command will set up a timing plan for each cycle
length, and select the cycle length with the best performance based on Measures of
Effectiveness (MOE).
When optimizing cycle lengths, it is necessary to optimize offsets to see how well the cycle
length performs. In this step, a quick offset optimization is usually sufficient to determine how
the cycle length will perform. Once the cycle length is selected, a thorough offset optimization
can take place.
Step 4: Optimize Offsets, Lead/lag PhasingAfter determining a system cycle length (or several cycle lengths), the last step is to optimize
offsets. Use the Synchro command Optimize Network Offsets.
If you have set Allow Lead/Lag Optimize? to “yes”, this step will also optimize phase orders.
SimTraffic and CORSIM can be used afterwards to simulate the timing plans.
Table 14-1 shows the six types of optimizations and which parameters they optimize.
Table 14-1 Optimization Commands
Optimization Type Scope Values Optimized Values Needed for Input
Intersection Cycle
Length
Current
Intersection
Cycle Length, Splits Volumes, Lanes, Fixed
Timings
Intersection Splits Current
Intersection
Splits Volumes, Lanes, Left Turn
Type, Cycle Length, Fixed
TimingsPartition Network Network Zone Volumes, Lanes, Fixed
Timings
Network Cycle
Lengths
Network or
Zone
Cycle Lengths,
Splits, Offsets,
Lead/Lag Order
Volumes, Lanes, Fixed
Timings
Intersection Offsets Current
Intersection
Offsets, Lead/Lag
Order
Volumes, Lanes, Fixed
Timings, Cycle Lengths,Splits
Network Offsets Network or
Zone
Offsets, Lead/Lag
Order
Volumes, Lanes, Fixed
Timings, Cycle Lengths,
Splits

7/21/2019 Synchro Studio 8 User Guide
http://slidepdf.com/reader/full/synchro-studio-8-user-guide 239/559
14-3
Tips to Improve Optimizations
Be sure to set the Maximum Cycle Length using the Options
Network-Settings command.Congested intersections will be set to the Maximum Cycle Length in many situations.
If there are permitted left turn movements with a v/c of greater than 1, consider making a
protected left turn phase or prohibiting left turns at this intersection.
If you find that there are blocking problems between closely spaced intersections, consider using
alternative phase orders, such as lagging lefts, lead-lag phasing, or split phasing. If you set the
Allow Lead/Lag Optimize? field in the PHASING settings to "Yes" then Synchro will try both
leading and lagging for that phase. Synchro measures queue interaction delay, which will be
accounted for during the optimization process (see the section on Queue Interactions, page 14-
54).
When optimizing Offsets, optimizing the lead-lag phasing slows down the optimization process.
If you want a faster optimization, turn off Allow Lead/Lag Optimize?.
The Cycle Length Optimization can take quite a while. Consider limiting the number of cycles
evaluated and using the Quick offset option.
Optimize-Intersection SplitsThe Optimize
Intersection-Splits command will automatically set the splits for all the phases.
Time is divided based on each lane group's traffic volume divided by its adjusted Saturated Flow
Rate. The Split Optimizer will respect Minimum Split settings for each phase whenever
possible.
Optimizing Splits by Percentile
When optimizing splits, Synchro first attempts to provide enough green time to serve the 90th
percentile lane group flow. If there is not enough cycle time to meet this objective, Synchro
attempts to serve the 70th percentile traffic and then the 50th percentile traffic. Any extra time is
given to the main street phases.
By attempting to serve the 90th percentile, Synchro gives splits that will clear the queue 90% of
all cycles. Because low volume approaches have more variability in traffic than high volume
approaches, this method will tend to give lower v/c ratios for low lane group flow approaches.
Consider the following examples
Phase #1, Lane Group Flow = 120 vph, Cycle Length = 60, capacity is 1800 vph
50 h il L G Fl l i 2

7/21/2019 Synchro Studio 8 User Guide
http://slidepdf.com/reader/full/synchro-studio-8-user-guide 240/559
14-4
50th percentile Lane Group Flow per cycle is 2.
90th percentile Lane Group Flow per cycle is 3.8.
Green time assigned is 8 seconds
v/c is 0.44
Phase #2, Lane Group Flow = 1000 vph, Cycle Length = 60, capacity is 1800 vph
50th percentile Lane Group Flow per cycle is 17.
90th percentile Lane Group Flow per cycle is 22.
Green time assigned is 44 seconds
v/c is 0.74
In practice, percentile optimization gives short phases a few extra seconds to process an
occasional extra vehicle. Longer phases also get extra time, but their extra time is less as a
proportion of the total time.
If the volume exceeds capacity, Synchro will attempt to balance v/c ratios for each phase, while
still respecting all minimums.
Other Rules
If two or more lane groups move concurrently, the maximum volume to saturation flow rate is
used to set the split. For example, if there is a right turn lane and a through lane, the one with the
highest volume to saturation flow rate is used.
If two rings are used, the maximum sum of ratios is used for this barrier. For example, the time
requirement for NBT + SBL is compared to the time requirement for NBL + SBT. Themaximum is used for these phase pairs.
All phases are assigned a split greater than or equal to their Minimum Split. The Optimize Splits
algorithm calculates splits repeatedly to ensure all minimums are met. If the minimums exceed
the cycle length, then all splits are reduced proportionately and there is a Min Error at the
bottom of the TIMING settings. To use a split less than the ped timings, set the Minimum Split
less than Walk + FDW + Yellow + All Red.
If there are permitted left turns, the entire process above is done repeatedly; the first time
using protected left turn factors. Permitted left turn factors are then calculated based on these
splits. Next, splits are recalculated using the permitted left turn factors. Finally, the left turn
factors are recalculated using the new splits.

7/21/2019 Synchro Studio 8 User Guide
http://slidepdf.com/reader/full/synchro-studio-8-user-guide 241/559
14-5
If a lane group is served by two or more phases, its volume will be divided among the phases
that serve it. However, the lane group's volume will only be used to request time for the first
Detector Phase. Make sure that the first Detector Phase is set correctly for each movement.If there is a shared turning lane plus an exclusive turning lane, the calculations are repeated
even further. The traffic is assigned among the various lane groups based on volume-to-capacity
ratios. Lane group assignment affects permitted left turn factors and volume-to-saturation flow
ratios. These, in turn, change the optimum splits, which means that the traffic may need to be
reassigned further.
At low volume intersections, there may be extra time available even after accommodating the
90th percentile traffic. In these cases, extra time is divided evenly among phases at all
intersections.
New in Version 7/8
There was a problem with using the saturated flow rates of pass n-1 for use in calculating splits
for pass n. The permitted left turn factors (f lt) in some cases can be quite volatile and cause the
resulting splits to oscillate between two values without converging. As an example,
NBL, volume = 300Cycle = 120
Saturated Flow Rate Protected = 1800
f lt Permitted with a green of 45 seconds is 0.47
f lt Permitted with a green of 40 seconds is 0.42
Longer splits can have a higher f lt due do a longer unsaturated period with oncoming
traffic
Required green with f lt = 0.47; = v * C / (s * f lt) = 300 * 120/ (1800 * 0.47) = 40
Required green with f lt = 0.42; = v * C / (s * f lt) = 300 * 120/ (1800 * 0.47) = 45
With this example the green time for successive passes alternates between 40 and 45 seconds
without converging. A similar problem can also occur with permitted plus protected
movements. Each pass of traffic is alternating between the permitted phase and the protected
phase. Version 7 implemented a smoothing process to insure that splits converge, and improves
the split optimization.
Notes on Permitted Left Turn Factors
O 1 th itt d l ft t f t d i ti t i d d t f ti i l Thi

7/21/2019 Synchro Studio 8 User Guide
http://slidepdf.com/reader/full/synchro-studio-8-user-guide 242/559
14-6
On pass 1, the permitted left turn factor used is an estimate independent of a timing plan. This
is the same estimate used for calculating the percent traffic in a shared lane.
f lt Est = (900 - volOp)/900 * 0.95; (minimum of 0.15),volOp = opposing volume
On subsequent passes f lt is based on the previous passes timings. Pretimed maximum timings
are used for the calculation of Flt in split optimization. After split optimization, the final
calculated Flt is based on actuated green times.
For version 7/8, split optimization does consider RTOR saturation flow during red times. In
previous version, RTOR saturation flow was not considered.
Optimize-Intersection Cycle LengthThe Natural Cycle length is the lowest acceptable cycle length for an intersection operating
independently. The natural cycle length appears on the TIMING settings.
The Optimize Intersection Cycle Length command will set the intersection to the Natural
Cycle Length.
The Natural Cycle Length will be one of three possibilities.
1. Shortest Cycle Length that clears the critical percentile traffic.
2. Cycle Length with the lowest Performance Index, provided lowest PI cycle length is
shorter than cycle length found in (1). This option is used to give reasonable cycles
for intersections over capacity.
3. If no cycle is able to clear the critical percentile traffic, but a shorter cycle is able to
give satisfactory v/c ratios, the shorter cycle length will be used. This is a special case
to handle near capacity intersections with permitted left turns.
In some cases, a longer cycle length will give lower delays or other performance
benefits. The Cycle Length Optimization attempts to determine the shortest cycle
length with acceptable performance.
Synchro starts with a short cycle length and optimizes the splits for that cycle length. If the splits
for each phase are not able to clear the critical percentile traffic, Synchro will try a higher cycle
length until the critical percentile traffic is cleared. For cycle lengths above 90, the v/c ratios
simply need to be less than 1. If no acceptable cycle length is found, the cycle length is set to the
cycle length with the lowest PI To set the Maximum Cycle Length use the Options Network

7/21/2019 Synchro Studio 8 User Guide
http://slidepdf.com/reader/full/synchro-studio-8-user-guide 243/559
14-7
cycle length with the lowest PI. To set the Maximum Cycle Length, use the Options Network
Settings command.Table 14-2 shows the acceptable Critical Percentile Traffic for each range of
cycle lengths.
Table 14-2 Acceptable Critical Percentile Traffic for Cycle Length
Cycle Length Critical Percentile Traffic
40 - 60 90th
61 - 90 70th
91+ 50th (v/c 1)
Over-Capacity Cycle Length Optimization
With one or more movements at or over capacity, the standard optimization procedure is to try
successively longer and longer cycle lengths. Longer cycle lengths add additional capacity
because a lower proportion of the cycle is used by yellow and total lost time.
When cycle lengths exceed 120 seconds, however, further increases to cycle length start to haveless impact on intersection capacity, while incremental delay continues to increase. In one
example, changing the cycle length from 150 seconds to 160 seconds increases the capacity for
the intersection by 80 vehicles per hour, but adds 3 seconds of delay to all 5000 vehicles using
the intersection. At some point, the cost of the extra delay does not outweigh the extra capacity
due to increasing the cycle length.
The cycle length optimization will choose the cycle length with the lowest performance index.
The PI is calculated as follows.
PI = [(D * 1) + (St * 10)] / 3600
PI = Performance Index
D = Total Delay (s)
St = Vehicle Stops
The Percentile Signal Delay adds 450 seconds of delay for each unserved vehicle. This causesthe cycle length to stop increasing when adding capacity for one vehicle will increase delay to
other vehicles by 450s (7.5 minutes). In general, shorter cycle lengths have a shorter uniform
delay, and will be favored when comparing delays of various cycle lengths. The Signal Delay
calculation helps to favor longer cycle lengths in congested situations.

7/21/2019 Synchro Studio 8 User Guide
http://slidepdf.com/reader/full/synchro-studio-8-user-guide 244/559
14-8
In previous versions of Synchro, over capacity intersections were always set to the Network
Maximum cycle length. In many cases, these intersections can have a significantly shorter cycle
length with much less delay and only a slight drop in capacity.
Shorter cycle lengths may also have other operational benefits. Queue lengths are generally
shorter and storage bays can operate more efficiently.
Special Case for Permitted Left Turns
In some cases with permitted left turns, it is possible that capacity decreases as cycle length
increases. In some cases, a short cycle length will give acceptable capacity while longer cycle
lengths fail. In this case, Synchro may recommend a short cycle length that does not meet the
percentile criteria.
Why Optimize for Critical Percentile Traffic?
By optimizing to accommodate percentile flows, Synchro will not recommend short cycle
lengths unless there is extra capacity to accommodate traffic fluctuations. In previous versions
of Synchro, the cycle length optimization only attempted to find acceptable v/c ratios. In some
cases, Synchro 2 recommended cycle lengths that were considered too short. At a low volume
approach, the traffic can be quite variable and a low v/c ratio is needed. If 2 vehicles per cycleare expected, it is quite likely to have 4 vehicles in some cycles. To accommodate these extra
vehicles, 8 seconds of green is needed rather than 4 and a v/c ratio of 0.50. By looking at
percentile flows, Synchro can be more confident that all vehicles will be handled on busy cycles
when short cycle lengths are used.
Partition Network
This allows a network with multiple systems and cycle lengths, allowing timing plans to be
tailored to local conditions. Choose Optimize Partition Network to divide a network into
multiple systems. Each intersection is assigned a zone. Existing Zone assignments will be
changed. This command does not actually change timings, but it sets up the network to have
multiple cycle lengths when Optimizing Network Cycle Lengths.
Reasons to use multiple systems:
Large distances separate various parts of the network.
Various parts of the network have different traffic characteristics. For example, the
CBD may contain two phase signals with short cycle lengths, while the suburban areas
may contain eight phase signals with long cycle lengths.

7/21/2019 Synchro Studio 8 User Guide
http://slidepdf.com/reader/full/synchro-studio-8-user-guide 245/559
14-9
It is possible to use shorter cycle lengths in some areas and longer cycle lengths in the
more congested areas.
Reasons to use all one system:
Controller hardware will not support multiple systems.
All intersections are close together (less than 500 ft apart).
Even if all of the intersections are in the same zone, the Cycle Length Optimization may still
recommend individual intersections to be operated independently. This means that candidates
for independent operation can be included in the same zone.
Figure 14-2 PARTITION NETWORK Settings
The partition network optimization calculates Coordinatability Factors (CFs) for each pair of
adjacent intersections. Any intersections with a CF above the threshold value are put into the
same zone. See the description of the CF calculation later in this section (page 14-22).
The CF value will range between 0 and 100. When choosing a Partitioning strategy the number
in parenthesis is the threshold CF. If One System is selected all connected intersections will be
placed in the same zone.
After partitioning the network, the zones can be observed on the map by pressing the
Show I ntersection Zones button. You may wish to change the zone recommendations
based on personal experience with the network or to match the current network partitioning.
Even though there are multiple zones, the intersections can still be in the same system by
i i h h l l h

7/21/2019 Synchro Studio 8 User Guide
http://slidepdf.com/reader/full/synchro-studio-8-user-guide 246/559
14-10
assigning them the same cycle length.
Optimize-Network Cycle Lengths
Figure 14-3 OPTIMIZE CYCLE LENGTHS Settings
Choose the Optimize Network Cycle Lengths command to optimize cycle lengths for thenetwork.
Optimize Network Cycle Lengths Options
Minimum, Maximum, and Increment Cycle Length: Enter the minimum and maximum cycle

7/21/2019 Synchro Studio 8 User Guide
http://slidepdf.com/reader/full/synchro-studio-8-user-guide 247/559
14-11
, , y g y
lengths to evaluate. The optimizer will evaluate every cycle length between the minimum and
maximum at increment intervals. If the values are set to 60, 100, and 10; the optimizer will
evaluate cycle lengths of 60, 70, 80, 90, and 100 seconds.
If Allow Half Cycles is selected, only even numbered cycle lengths will be evaluated.
If min, max, and incr are set to 80, 120, and 5, and half cycles are allowed, the
optimizer will evaluate 80, 86, 90, 96, 100, 106, 110, 116, and 120.
Allow Uncoordinated: This option may recommend that some intersections be left
uncoordinated. The number in parentheses is the threshold Coordinatability Factor (CF).Intersections will be made independent and uncoordinated when either one of the following
apply:
1. CF with all neighbors is less than threshold CF and space required for one cycle of
traffic is less than 80% of the storage space.
2. The sum of Minimum Splits exceeds the Evaluation Cycle, the intersection will be set
to uncoordinated.
Allow Half Cycle Length: This option will test some intersections at half cycle length. Thisoption can give snappier operation and less delay at less congested intersections. Half Cycle
Intersections will be given a cycle length of 1/2 the evaluated cycle. Intersections will be half
cycled when they meet both of the following criteria:
1. Natural Cycle Evaluation Cycle / 2
2. Space required for one cycle of traffic is less than 120% of the link storage space.
Preserve Files: With this option a file is saved for each cycle length. These files can be loadedafterwards for evaluation or used for a multi-file comparison report. The files are given the name
"filename-050.syn" where filename is the name of the file and 50 is the cycle length evaluated.
Optimize Phase Sequence: If this box is checked, leading and lagging left turn combinations
will be tested. However, lead/lag combinations will not be checked if the Allow Lead/Lag
Optimize? setting in the Phasing window is unchecked (see page 8-8).
Offset Optimization: Choose Quick to evaluate many cycle lengths quickly. Choose Mediumor Extensive to analyze several cycle lengths in detail.
Table 14-3 Offset Optimization Options
Offset Option Optimizations Performed

7/21/2019 Synchro Studio 8 User Guide
http://slidepdf.com/reader/full/synchro-studio-8-user-guide 248/559
14-12
Quick Incremental Offsets and Phase Orders, step 4
Medium Incremental Offsets and Phase Orders, step 8
Cluster Offset Optimization, step 2
Incremental Offsets, step 2
Extensive Incremental Offsets and Phase Orders, step 2
Cluster Offset Optimization, step 2
Incremental Offsets, step 1
Automatic: The automatic option will automatically select the best cycle length based on the
cycle with the lowest Performance Index (PI). It is possible to have each zone assigned a
different cycle length.
Manual: The manual option will create a table of cycle lengths with MOEs listed. The user can
choose the best cycle length. Each zone can be assigned its own cycle length or all zones can be
assigned a single cycle length.
Printing Cycle Length Optimization Results
The network cycle length optimization creates a table of Measures of Effectiveness (MOEs) for
each cycle length evaluated. This table is not printable (other than a screen capture).
To view the cycle length comparison table, choose the [Manual] option. The [Automatic] option
bypasses this settings.
To print a report similar to this comparison:
1. Choose the option Preserve Files for Each Cycle Length.
2. After performing the optimization, select File→Create Reports from the main
settings.
3. Choose the report Summary Multifile Comparison.
4. Select all the files created by the cycle length optimization. These files have the name
filename-50 where 50 is the cycle length.
Performance Index
The best cycle length is found by calculating a performance index. Previous versions of Synchro
included a queuing penalty component within the PI. This is now directly accounted for with the

7/21/2019 Synchro Studio 8 User Guide
http://slidepdf.com/reader/full/synchro-studio-8-user-guide 249/559
14-13
Total Delay, which includes Queue Delay.
The PI is calculated as follows.
PI = [D * 1 + St * 10] / 3600
Where:
PI = Performance Index
D = Total Delay (s)
St = Vehicle Stops (vph)
The Total Delay above includes the Control Delay plus the Queue Delay. When multiple zones
are optimized, the MOEs assume that intersections in adjacent zones are not coordinated.
Using a longer analysis period tends to favor longer cycle lengths in the network cycle length
optimization. Unserved vehicles will be delayed on average for 1/2 of the analysis period.
(Individual vehicles are not delayed this long, but is the cumulative affect of added delays).
With a longer analysis period, serving as many vehicles as possible tends to dominate more than
reducing uniform delays by having shorter cycle lengths.
Congestion lasting for 1 hour or longer tends to favor longer cycle lengths than spot congestionfor 15 minutes. Changing to a longer analysis period (refer to page 12-4) may cause the cycle
length optimization to recommend longer cycle lengths.
Faster Optimizations
It can take several minutes to evaluate each cycle length depending on the number of
intersections and the speed of your computer. To get the best solutions quickly, a two-stepoptimization is recommended.
Pass 1: Evaluate a wide range of cycle lengths with a large increment (e.g., 60 to 150 at
increment 15). Use quick offset optimization and manual optimization.
Pass 2: From the first pass, it will become clear which range of cycle lengths work best. At this
point, focus the optimization on this range of cycle lengths (e.g., 80 to 100 at increment 5). Use
Medium or Extensive offset optimization.
Manually Selecting a Cycle

7/21/2019 Synchro Studio 8 User Guide
http://slidepdf.com/reader/full/synchro-studio-8-user-guide 250/559
14-14
Figure 14-4 SELECT CYCLE LENGTHS Settings

7/21/2019 Synchro Studio 8 User Guide
http://slidepdf.com/reader/full/synchro-studio-8-user-guide 251/559
Isolated Intersections
With some options, isolated and uncoordinated intersections are set to their natural cycle length
for all evaluated cycle lengths. To view the performance of a single intersection at each cycle
length, do one of the following:
Assign the intersection to its own zone.
Select “ Never ” for Allow Uncoordinated.
Multiple Zones
Network Cycle Length Optimization calculates a separate set of MOEs for each cycle length in
each zone.
Initially each zone is assigned a cycle length with the best set of MOEs for that zone.
Next, each set of adjacent zones is evaluated for a combined cycle length. If the zones have
lower MOEs due to inter-zone coordination, both zones are assigned the cycle length with the
lowest combined PI.
The automatic cycle length optimization attempts to combine zones at the same cycle length for
inter-zone coordination. This feature allows the user to set up many zones without fear of losing
coordination across zones, but will still allow for multiple cycle lengths when appropriate.Example:
Performance Indexes
80 s 90 s
Z 1 100 112

7/21/2019 Synchro Studio 8 User Guide
http://slidepdf.com/reader/full/synchro-studio-8-user-guide 252/559
14-16
Zone 1 100 112
Zone 2 310 300
Zone 1+2 (independent) 410 412
Zone 1+2 (coordinated), less than sum due to
coordination across zone
390 395
Best Independent Solution: Zone 1 @ 80 s + Zone 2 @ 90 s = 400
Best Coordinated Solution: Zone 1 +Zone 2 @ 80 s = 390
The performance indexes can be calculated assuming random and coordinated arrivals across
zones. In the above example, the best solution for independent zones uses different cycle
lengths. However, when the benefits of coordination across zones is considered, the best
solution is to use one cycle length.
Master Intersection
In Synchro, there is one or zero master intersections for each cycle length. Half cycledintersections share the master. When changing offsets it is possible to combine two masters into
the same cycle length and only one intersection will remain a master.
A common misconception is that there is one master per zone. This is not true, there is one
master per cycle length. Two zones with one cycle length can have only one master, even if they
are not physically connected.
Optimize - Intersection OffsetsTo change a single intersection's timing plan so that it works best with its neighbors, click on an
intersection to select it, then choose the Optimize
Intersection Offsets command. This
command tests all possible offsets and lead-lag combinations. This command chooses the timing
plan for this intersection that minimizes delays on links between this intersection and its
immediate neighbors.
Network Minimum delay score is a relative measure of delay, so that you can see how theoptimization is progressing. These scores are not convertible into an actual delay measure and
will vary by cycle length.
The scoring used for offset optimization uses the 50th and 90th percentile scenarios only, with
the 50th percentile being double weighted.

7/21/2019 Synchro Studio 8 User Guide
http://slidepdf.com/reader/full/synchro-studio-8-user-guide 253/559
14-17
This command only changes the selected intersection. It does not make any
changes to surrounding intersections. There may be better timing plans available by
changing the timings of surrounding intersections, but Optimize
Intersection
Offsets and Phasing will not find them. To find the best timing plans overall, use the
Optimize
Network-Offsets command discussed in the next section.
For each offset and lead-lag combination Synchro will re-evaluate the departure patterns at this
and surrounding intersections and recalculate delays. Synchro will also recalculate skipping and
gap-out behavior at actuated-coordinated intersections.
When optimizing offsets, Synchro will look at offsets every 16 seconds around the cycle.
Synchro will take those with the lowest delay score and look at offsets nearby every 4 seconds.
Synchro will then take those with the lowest delays and look at offsets nearly every 1 second.
Optimize - Network OffsetsThe final step in network optimization is to optimize offsets. This step should be performed after
the cycle length has been determined.
Choose the Optimize Network Offsets command.

7/21/2019 Synchro Studio 8 User Guide
http://slidepdf.com/reader/full/synchro-studio-8-user-guide 254/559
14-18
Figure 14-5 OPTIMIZE NETWORK OFFSETS Settings
The offset optimization function is used to evaluate the delays by varying the offset for every 8
seconds around the cycle. The optimizer then varies the offset by step size increments (1 or 4
seconds) around the 8 second choices with the lowest delays or close to the lowest delays. Thisfinds the offset with the lowest delays, even if there are multiple "valleys" with low delay. The
cluster optimization will vary groups of intersections so that local clusters can be synchronized
with other local clusters rather than with just each other.
7/21/2019 Synchro Studio 8 User Guide
http://slidepdf.com/reader/full/synchro-studio-8-user-guide 255/559
During passes 2 and 4, Synchro performs cluster optimization. With cluster optimization,
Synchro finds groups of intersections that are connected and treats them as a single group.
Synchro will adjust the offsets of the entire group together.
Consider an arterial of 4 intersections. With cluster optimization, the left two intersections will
have their offsets adjusted together while the right two intersections are held constant. Whenever
a group of two or more intersections is connected to the remainder of the network via a singlelink, they will be treated as a dangling cluster. Dangling cluster optimization works well with
linear arterial(s).
Another type of cluster is a CF cluster. If two or more intersections have Coordinatability
Factors between them of 90 (or 70) or more, they are considered a cluster and have their offsets
optimized together. CF Cluster optimization helps with situations when two or more
intersections that are very close have a lot of traffic between them. Without CF cluster
optimization, these intersections would tend to be optimized for the benefit of each other only
and not for the surrounding intersections.
Platoon Dispersion
Some traffic models such as TRANSYT-7F implement platoon dispersion. With platoon
dispersion it is assumed that some vehicles will go faster or slower than the defined speed and
platoons spread out over greater distances. One result of platoon dispersion is that coordinationhas less beneficial impact on longer links.
Synchro does not implement platoon dispersion. Synchro offers two other features that reduce
the weightings of far-apart intersections.
Entering mid-block traffic can be used to "soften" the platoons and provide an effect similar to
platoon dispersion

7/21/2019 Synchro Studio 8 User Guide
http://slidepdf.com/reader/full/synchro-studio-8-user-guide 256/559
14-20
platoon dispersion.
Synchro calculates a Coordinatability Factor that takes the travel time between intersections intoaccount. In many cases Synchro's optimizations will recommend not coordinating intersections
when the travel time between the intersections exceeds 30 seconds. Therefore, in places where
platoon dispersion might reduce the benefits of coordination, Synchro may recommend no
coordination at all.
To reduce the weighting of coordination on longer links, enter mid-block traffic (see page 6-7).
Also consider not coordinating intersections that are more than 30 s apart.
Check Phase Orders
In many cases, using alternate phase orders, such as lead-lag phasing, can significantly reduce
delays, stops, and queues. Many parts of North America only use leading left turns and never
consider alternate phase orders. When performing Network Offset Optimization and Automatic
Network Cycle Length Optimization, Synchro performs a check to see if using alternate phase
orders can reduce delays. The Check Phase Orders optimization does not change phase orders inthe final timing plan, it merely recommends changes that could reduce delays.
A phase pair is the 1st and 2nd phases or the 3rd and 4th phases of a ring-barrier sequence.
During Lead/Lag optimization, the optimizer will test timing plans by reversing the order of the
phase pairs. During improvement optimization, the optimizer will test all combinations of phase
reversals, including those marked "Fixed" for Allow Lead/Lag optimization. This may result in
some suggestions that the engineer had not previously considered.
When an improvement is found that reduces delay by at least 1800 vehicle seconds per hour, the
improvement is listed, like this example:
Consider changing the phase order at Node 3: E Pine ST & Freeman RD
Node #3 Phase:1 WBL, Change to a lagging phase.
Node #3 Phase:5 EBL, Change to a leading phase.
Total Delay is reduced by 10295 vehicle seconds per hour!
Node #3 Intersection delay is reduced by 8395 veh-s/hr! Node #3 NBR Delay is reduced from 28.2 to 20.3 seconds per vehicle!
Node #3 WBT Delay is reduced from 9.7 to 4.0 seconds per vehicle!
Node #15 EBL Delay is reduced from 28.1 to 25.7 seconds per vehicle!
To optimize phase orders:
Ch k th "O ti i L d/L Ph i " ti AND
7/21/2019 Synchro Studio 8 User Guide
http://slidepdf.com/reader/full/synchro-studio-8-user-guide 257/559
14-21
Check the "Optimize Lead/Lag Phasing" option AND
Set "Allow Lead/Lag Optimize" to YES in the Phasing settings. Performing a complete Lead/Lag optimize may find even greater timing
improvements.
Combining these suggestions may reduce total delay more or less than
the sum of the improvements.
WARNING, Permitted left turns should not be used with lagging left
turns.
All delays listed above are uniform delays only. The incremental
portion of delay is not affected by offset optimization.
In this example, changing some of the phase orders at node #3 would reduce network delay by
over 10,000 seconds per hour. This reduction may occur at node #3 and its neighboring
intersections. Intersection delay reductions are listed that exceed 1800 veh-s/hr and individual
movement reductions are listed that exceed 900 veh-s/hr or 50%.
To implement one or more of these suggestions, go to the PHASING settings and change the
Lead/Lag field of the recommended phases. When using lagging left turns, the oncoming leftturn treatment should be changed from Permitted-plus-Protected to Protected (see topic on Left
Turn Trapping, page 7-14).
Check Phase Orders cannot be disabled. The ratio of time saved by motorists to the time spent
analyzing these alternatives can exceed 10,000 to 1. Check Phase Orders is not performed if at
least 66% of phase pairs have Allow-Lead/Lag-Optimize set to “Yes”. Check Phase Orders is
not performed on any intersection that has Allow-Lead/Lag-Optimize set to “Yes” for all phase
pairs and the preceding optimization allowed for Lead/Lag optimize.
Coordinatability FactorThe Coordinatability Factor (CF) is a measure of the desirability of coordinating the
intersections. Several criteria are used in an attempt to determine whether coordination is
warranted. These criteria are used to determine a CF on a scale from 0 to 100 or more. Any
score above 80 indicates that the intersections must be coordinated to avoid blocking problems;any score below 20 indicates the intersections are too far apart, or coordination is otherwise not
desirable.
The CF is used with the Partition Network optimization. Intersections with CF values above the
threshold CF are placed in the same zone or signal system.
The CF is also used with cycle length optimization when uncoordinated intersections are

7/21/2019 Synchro Studio 8 User Guide
http://slidepdf.com/reader/full/synchro-studio-8-user-guide 258/559
14-22
The CF is also used with cycle length optimization when uncoordinated intersections are
allowed. Intersections with CF values below the threshold CF are allowed to be independent anduncoordinated.
The calculation of Coordinatability Factors is highly empirical. The
application of these factors should be used with caution. They are primarily
meant to call attention to the different criteria that make coordination
desirable or undesirable.
The following criteria are used to determine the Coordinatability factor and are discussed here.
CF = Max(CF1, CF2) + Ap + Av + Ac
Where:
CF = Coordinatability Factor
CF1 = Initial Coordinatability Factor from Travel Time
CF2 = Initial Coordinatability Factor from Volume per Distance
Ap = Platoon Adjustment
Av = Volume Adjustment
Ac = Cycle Length Adjustment
Travel Time Between Intersections: This is the single most important element. The travel time
affects the CF in the following ways. For links greater than 80 seconds apart, (5,300 ft. at 45
mph or 3,500 ft. at 30 mph), the intersections are assigned an initial CF of 0 because they are toofar apart. For links less then 4 seconds apart, the intersections are assigned an initial CF of 100.
These intersections are so close together, they could cause blocking problems. For links between
4 and 80 seconds, the initial CF is assigned using the formula CF1 = 100 - (time - 4) * 100 / 76.
Many agencies use the distance between intersections as the sole criteria for determining
coordinatability. Using travel time instead of distance takes into account the speed of the links.
High-speed expressways require coordination over longer distances than low-speed city streets.
Average Traffic Per Cycle Exceeds Link Distance: This criteria is similar to the previous
criteria in that it uses the distance between intersections. This test also considers the traffic
volume on the link and the cycle length of the intersection to see if the average traffic per cycle
length will exceed the storage space between the intersections. If the average volume per cycle
for either direction between the two intersections exceeds the available storage space, there is a
potential blocking problem. Synchro assumes there is a blocking problem when AverageTraffic
> 0 80 St S

7/21/2019 Synchro Studio 8 User Guide
http://slidepdf.com/reader/full/synchro-studio-8-user-guide 259/559
14-23
> 0.80 x StorageSpace.
vc = v * C / 3600 = volume per cycle
StorageSpace = n * LinkDist / VL
Where:
v = volume in lane group
C = Cycle Length of destination intersection (s)
n = lanes in through lane group
LinkDist = link distance minus 150 feet (45 m) for the space in intersection and extra
space.
VL = average vehicle length, entered in NETWORK settings
Similar checks are also made for the right and left turn lane groups as well. CF2 is the maximum
factor of the internal lane groups.
CF2 = 100 * AverageTraffic / StorageSpace
Platooning of Traffic During the Cycle: This criteria looks at how much of the traffic arriving
is compressed into the busiest 30% and 60% part of the cycle. If vehicle arrivals are spread out
over the entire cycle, due to traffic coming from the side streets or from mid-block, coordinating
this link will have less effect on reducing delays overall. If there is a short red time upstream, the
traffic will be spread out over most of the cycle and coordination will have less effect. A pulse
factor of 45 indicates that vehicles arrive uniformly across the cycle, coordination will provideno benefit. A pulse factor of 100 indicates that all of the traffic arrives in the busiest 30% of the
cycle and coordination is a good idea.
PulseFactor = (v30 + v60) / (2 * vc) * 100%
Where:
PulseFactor = proportion of upstream traffic in busiest part of cycle
v30 = volume of traffic arriving during the busiest 30% of the cycle
v60 = volume of traffic arriving during the busiest 60% of the cycle
vc = volume per cycle
The adjustment to the CF for platoons is calculated by the following formula:

7/21/2019 Synchro Studio 8 User Guide
http://slidepdf.com/reader/full/synchro-studio-8-user-guide 260/559
14-24
Ap = Platoon Adjustment = 10 - (100 - PulseFactor) * 30 / 55A Pulse Factor of 45 reduces the CF by 20 points. A Pulse Factor of 100 increases the CF by 10
points. For a two way link, the maximum Pulse Factor for the two directions is used.
Main Street Volume: This criteria looks at the volume of the main streets. The assumption is
that high volume arterials are more suitable for coordination than low volume streets. The
arterial volume is the total hourly volume on the link in both directions including turning
movements. The Volume Adjustment, Av is adjusted according to the following formula.
Av = (v2 - 700) / 50, when v2 < 1200
Av = (v2 - 200) / 100, when v2 < 2200
Av = 20, when v2 2200
Where:
Av = Volume Adjustment
v2 = sum of two way volume on link (vph)
The following summarizes how volumes affect Av.
v2 Av
200 -10
700 0
1200 10
1700 15
2200 20
Incompatible Cycle Lengths: This criteria looks at the natural cycle lengths of the adjacent
intersections, or groups of intersections, to see if they are compatible. The Natural Cycle Length
is the cycle length the intersections would have if they were operating as independent
intersections, and it is the shortest cycle length that gives an acceptable level of service. If the
two intersections have close to the same cycle length, they can be coordinated together without
increasing delays to uncoordinated movements. Conversely, if one intersection only needs ashort cycle length and the other needs a longer cycle length, both intersections would have to
operate at the longer cycle length. This increases delays at the intersection with the shorter
natural cycle length. The following test attempts to calculate, empirically, how much delay is
increased when the intersection(s) with the shorter cycle length is increased to the longer cycle
length:
Ac = Cycle Length Adjustment = ( IncreaseInCycle) / 2
7/21/2019 Synchro Studio 8 User Guide
http://slidepdf.com/reader/full/synchro-studio-8-user-guide 261/559
14-25
Ac = Cycle Length Adjustment = - ( IncreaseInCycle) / 2
Where:
Ac 0
IncreaseInCycle = amount to increase cycle length for coordination
If the shorter cycle of the two adjacent intersections can be half cycled, then IncreaseInCycle =
LongerCycle / 2 - ShorterCycle. For example Intersection 1 has a natural cycle length 100 and
intersection 2 has a natural cycle length of 40. Intersection 2 can be half cycled so its cyclelength is increased from 40 to 50 and IncreaseInCycle is 10.
If one or both intersections are operating actuated or semi-actuated with a floating cycle length,
the increase in cycle length is the difference between the longer natural cycle length and the
average actuated cycle length without dwell time. If both intersections are actuated, the
IncreaseInCycle for both intersections is used. For example, intersection 1 has a natural cycle of
70 seconds and an actuated cycle without dwell of 46 seconds. Intersection 2 has a natural cycle
of 100 and actuated cycle without dwell of 78. To coordinate these intersections, intersection 1
increases from 46 to 100 and intersection 2 increases from 78 to 100. The IncreaseInCycle is
thus (100-46) + (100-78) or 76.
This factor will avoid coordination when it significantly increases the cycle length of
intersections. This factor also avoids coordinating actuated signals when they can shorten their
cycle with skipped and gapped-out phases.
Summary of Coordinatability Factor
To see CFs select the Show Natural Coordinatabil ity Factors button or the Show Current
Coordinatabili ty Factors button. The CF for each link will appear on the map. To see a detailed
listing of the factors of the CF select the File Create Report command and include a report
for Coordinatabilities, or double-click on any link while the CFs are displayed.
Current versus Natural Coordinatability FactorThe Current Coordinatability Factor uses the current cycle length and timings to calculate the
CF. The Natural Coordinatability Factor uses the intersection's natural cycle lengths. The
Natural CF is used to initially determine which intersections should be coordinated. The Current
CF is used to analyze the current timing plan and justify whether or not to coordinate additional
intersections.
T th ti „ h th t i t ti di t d t th ?‟ l k t th i

7/21/2019 Synchro Studio 8 User Guide
http://slidepdf.com/reader/full/synchro-studio-8-user-guide 262/559
14-26
To answer the question, „why were these two intersections coordinated together ?‟, look at their
natural CF. To answer the question, „why are these two intersections not coordinated together ?‟,
look at their current CF.
Delay CalculationsSynchro‟s core delay calculation is called The Percentile Delay Method. The percentile delay
calculation looks at five levels of traffic arrivals so that actuated signals can be evaluated under
varying traffic loads. This allows the percentile delay method to capture and rationally model
the non-linear behavior of actuated signals.
The Percentile Delay calculations in Synchro are also interval based. Vehicle arrivals from
adjacent intersections are evaluated in intervals to determine the influence of coordination.
The calculations for The Percentile Delay Method can be quite complex, multiple intervals to be
evaluated with detailed information about arrival patterns from adjacent signals. The HCM
Delay equation (Webster's Formula), can be calculated by hand.
Choosing a Delay Formula
Synchro allows you to choose which delay method is used, the Synchro control delay or an
HCM Signals Report delay. The delay shown in the TIMING settings is the Synchro control
delay.
Use the HCM Signals Report When:
Compatibility with Highway Capacity Manual is desired
Use Synchro Delay When:
Evaluating actuated signal parameters
Optimizing offsets
Detailed modeling of coordination is needed
Detailed modeling of actuated signals is needed
The following sections explain the differences between the two methods' calculations in detail.
Webster's Formula (HCM Signals Report)
The current Webster's formula as it appears in the Transportation Research Board's, 2000 HCM
formula is defined as:

7/21/2019 Synchro Studio 8 User Guide
http://slidepdf.com/reader/full/synchro-studio-8-user-guide 263/559
14-27
D = D1 * PF + D2 + D3 = Webster's Delay (s)
)1,min(*)/(1
)/(1**5.0
2
1 X C g
C g C D
= Uniform Delay
PF = Progression Factor to account for coordination or controller type
T c
X I k x xT D*
***8)1()1(**900 22 = Incremental Delay
D3 = Residual Demand Delay, caused by existing queue at beginning of analysis, not
used in Synchro
C = Cycle Length (s)
T = duration of analysis in hours, default 0.25 (see Network Settings)
g = Effective green time (s)
X = Volume to Capacity Ratio (v/c)
c = Capacity (vph)
k = incremental delay factor, dependent on controller settings (0.5 for pretimed or near
saturation)
I = upstream filtering factor (1.0 for isolated intersections)
Webster's Formula is used when compatibility with the HCM is required. Webster's Formula
and the HCM methods are a nationally recognized standard for measuring intersection
performance. The formula provides a uniform set of rules for all design reports and planning
studies. For these types of applications, Webster's formula should still be used.
The Progression Factor (PF) is used by the HCM to account for the effects of coordination.
Synchro has already explicitly calculated the delay with coordination effects, so Synchro
actually can determine the true PF by the following formula:
PF = DelayCoord / DelayUnCoord
PF = Progression Factor
DelayCoord = uniform delay calculated by Synchro with coordination
DelayUnCoord = uniform delay calculated by Synchro assuming random arrivals

7/21/2019 Synchro Studio 8 User Guide
http://slidepdf.com/reader/full/synchro-studio-8-user-guide 264/559
14-28
The Uniform Delay shown in the Delays Report assumes random arrivals, to get the total delay,
multiply the Uniform Delay by the PF and add the Incremental Delay.
Analysis Period
The analysis period, T, in Synchro can be modified. To change this, go to the NETWORK
settings, Volume Settings tab.
The typical (and default) analysis period is 15 minutes (T = 0.25 hours). As the v/c ratios begin
to increase to about 0.90, the control delay is significantly effected by the length of the analysis
period. When the flows for each 15 minute interval remains relatively constant, consideration
should be taken to increase the analysis period. If v/c exceeds 1.0 during the analysis period,
then the length of the analysis period should be extended to cover the period of oversaturation in
the same fashion, as long as the average flow during that period is relatively constant.
If the Analysis Period is changed to 30 minutes or greater, the PHF is automatically set to 1.0
and is not editable. The PHF is only used in conjunction with a 15 minute analysis. The delay
equations (both Percentile and HCM) have provisions to accommodate traffic fluctuations thatwould occur for the peak 15 minute period during a 60 minute analysis.
How Analysis Period Affects Delay
The length of the analysis period will affect the control delay. Adjusted volumes and v/c ratios
will be lower due to not using a PHF adjust. Uniform delays will be lower at 60 minutes due to
lower volumes. Incremental delays will be lower at 60 minutes due to lower volumes, but higher
due to longer analysis period. Movements under and near capacity may see a reduction in delay.
Movements over capacity will likely see a big increase in delay. This reflects over capacity
movements having standing queues for 60 minutes rather than 15 minutes.
Use a 15 minute period when:
Most of the intersections in the study area are operating at less than capacity.
If the agency has a goal of LOS D or better for all intersections.
The study area has a short term spike in traffic, such as a shift change at a major
employer.
Traffic counts are available in 15 minute intervals
Use a 60 minute analysis period when:
Most of the intersections in the study area are operating near or over capacity for 30
7/21/2019 Synchro Studio 8 User Guide
http://slidepdf.com/reader/full/synchro-studio-8-user-guide 265/559
14-29
Most of the intersections in the study area are operating near or over capacity for 30
minutes to 2 hours.
The agency is forced to accept intersections over capacity and is looking at incremental
improvements.
Traffic counts are not available in 15 minute intervals.
Use a 120 minute analysis period when:
Most of the intersections in the study area are over capacity for 2 hours or longer.
The agency is forced to accept intersections over capacity and is looking at incremental
improvements.
The Percentile Delay Method
Basic Delay Calculation
Figure 14-6 Vehicles Queued at Red light
The average delay for a lane group at a pretimed signal is represented by the area in the trianglein Figure 14-6. The width of the triangle's base is equal to the effective red time of the phase.
The slope of the left side is the arrival rate of vehicles in vehicles per second. The slope of the
right side is the departure rate or Saturated Flow Rate in vehicles per second. The height of the
triangle is the maximum queue in vehicles. The maximum queue can thus be found with the
following formula.
v
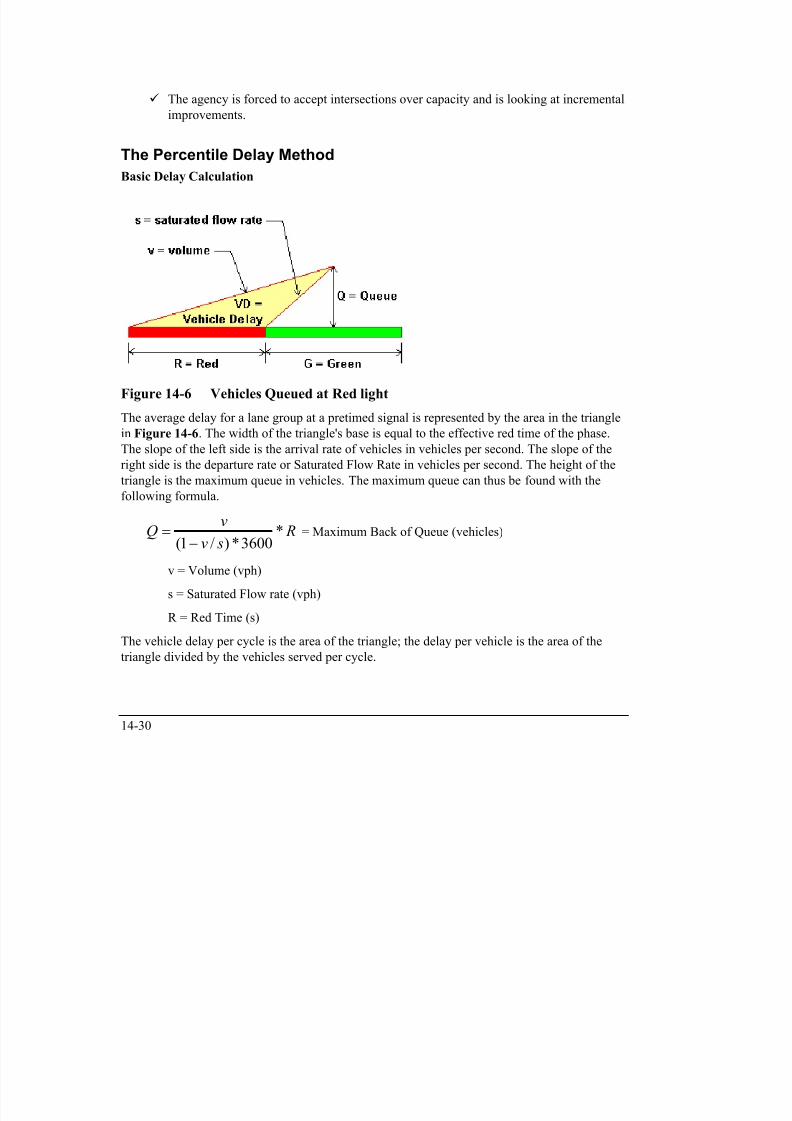
7/21/2019 Synchro Studio 8 User Guide
http://slidepdf.com/reader/full/synchro-studio-8-user-guide 266/559
14-30
R sv
Q *3600*)/1( = Maximum Back of Queue (vehicles)
v = Volume (vph)
s = Saturated Flow rate (vph)
R = Red Time (s)
The vehicle delay per cycle is the area of the triangle; the delay per vehicle is the area of thetriangle divided by the vehicles served per cycle.
2*
3600*)/1(
2 R
sv
vVD
= Vehicle Delay
3600*C
VD Dp = Uniform Delay per vehicle, for scenario p (s)
C = Cycle Length (s)
Thus this gives...
C
R R
sv Dp **
)/1(
5.0
Given that...
C g s
v X
/*
R / C = 1 - G / C
C g X
C g
C Dp /*1
)/(1
**5.0
2
This formula is identical to the definition for Webster's formula for D1. The primary differences
between the Percentile and Webster calculations lie in the determination of green time, and the
handling of nearly- and over-saturated conditions.
Percentile Scenarios

7/21/2019 Synchro Studio 8 User Guide
http://slidepdf.com/reader/full/synchro-studio-8-user-guide 267/559
14-31
Over the course on an hour or 15 minute period, traffic will not arrive at an intersectionuniformly. Some cycles will have more traffic and some cycles will have less. A Poisson
distribution can be used to predict how traffic arrives.
To account for variations in traffic, Synchro models traffic flow under five percentile scenarios,
the 90th, 70th, 50th, 30th, and 10th percentile scenarios. If 100 cycles are observed, the 90th
percentile cycle will be the 90th
busiest cycle. Each of these scenarios will represent 20% of the
cycles actually occurring.
The traffic volumes for each scenario are adjusted up or down according to the following
formulas.
The expected number of vehicles, , is the hourly flow rate divided by the number of cycles per
hour.
3600*
C v
v = Volume (vph)
C = Cycle Length (s)
The variance, or standard deviation, in traffic is the square root of the expected number of
vehicles for a Poisson arrival.
= Sqrt( ) = standard deviation in expected arrivals per cycle
The expected number of vehicles for a given percentile can be calculated using a Poissondistribution. A Normal Distribution can be used if the expected number of vehicles is greater
than 6. This gives the formula:
C z vP 3600
*)( = volume for percentile P
C = Cycle Length (s)
z is the number of standard deviations needed to reach a percentile from the mean. It can be
determined from this table.
Percentile Z
10 -1.28
30 -0.52
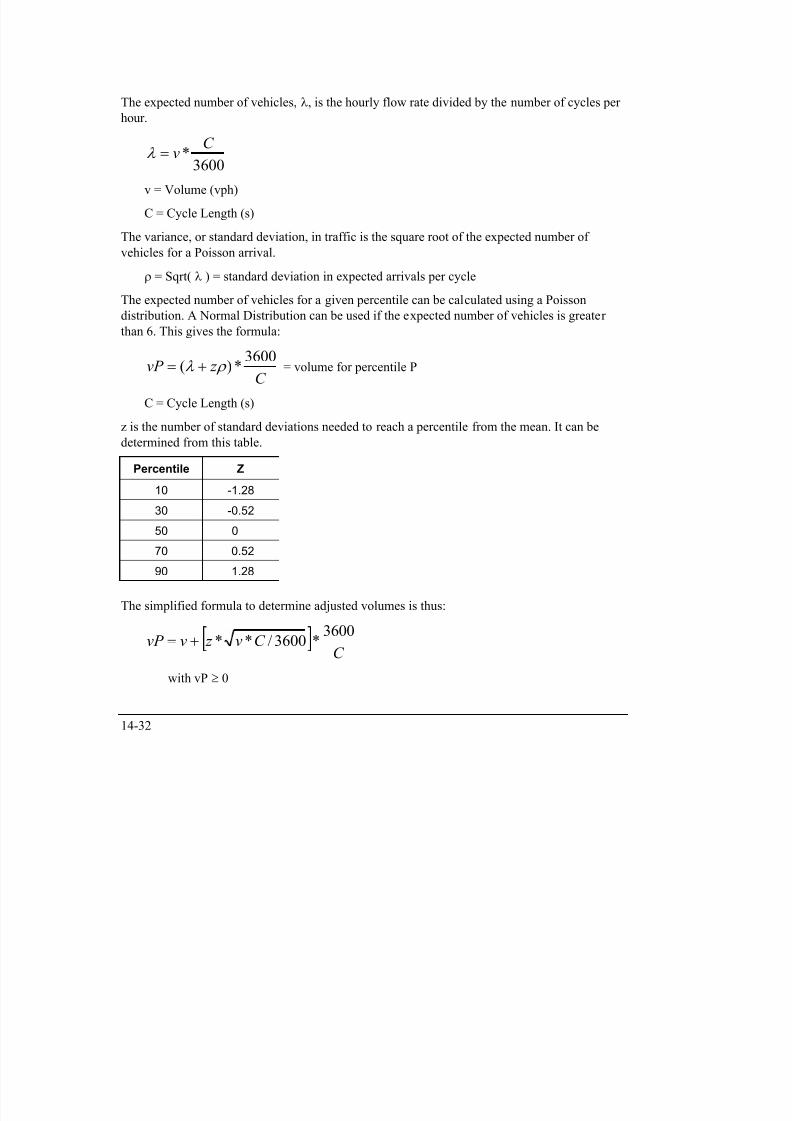
7/21/2019 Synchro Studio 8 User Guide
http://slidepdf.com/reader/full/synchro-studio-8-user-guide 268/559
14-32
50 0
70 0.52
90 1.28
The simplified formula to determine adjusted volumes is thus:
C C v z vvP
3600
*3600/**
with vP 0
Using five scenarios instead of one has several advantages. Even though an approach is below
capacity, it may be above capacity for the 90th percentile traffic. By modeling the 90th
percentile traffic, it is possible to better model nearly saturated intersections.
Using multiple scenarios allows actuated signals to be modeled under multiple loadings. The
complex operation of actuated signals will vary under the five scenarios and give a range of
expected green times over the course of an hour.
For example a phase serving a low volume movement may skip 40% of the time. With
percentile modeling this phase is skipped in two of five scenarios. The alternative used by HCM
is to assume a split or green time of 60% of the non skipped time. Similar non-linear behavior
occurs with pedestrian activated phases.
To get basic delays for pretimed, unsaturated signals with uniform arrivals, the formulas are:
3600/*)9070503010(
90705030101
C vvvvv
VDVDVDVDVD D
D1 = average percentile delay
VD10 = 10th percentile Vehicle-Delay per hour
3600**)/101(
10*5.010
2
C
R
sv
vVD
v10 = 10th percentile volume rate (vph), volume rate is adjusted using methods
described earlier
Vehicle-Delay values and Arrival rates for other percentiles are calculated similarly.
If volume exceeds capacity for a percentile scenario, the capacity, rather than the volume is used
i h if d l l l i F d il di i h f ll i l
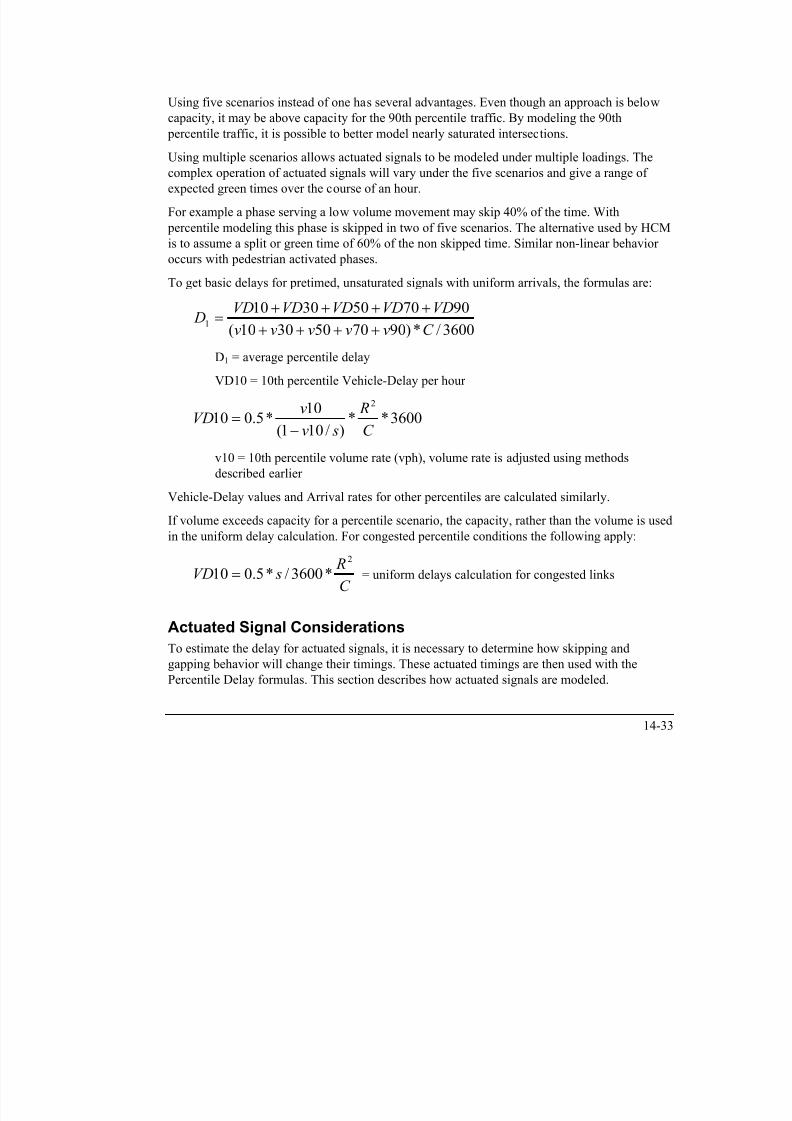
7/21/2019 Synchro Studio 8 User Guide
http://slidepdf.com/reader/full/synchro-studio-8-user-guide 269/559
14-33
in the uniform delay calculation. For congested percentile conditions the following apply:
C
R sVD
2
*3600/*5.010 = uniform delays calculation for congested links
Actuated Signal Considerations
To estimate the delay for actuated signals, it is necessary to determine how skipping andgapping behavior will change their timings. These actuated timings are then used with the
Percentile Delay formulas. This section describes how actuated signals are modeled.
The key to determining actuated behavior is to predict if each phase will be skipped and when
each phase will gap out. Once these behaviors are determined, the green and red times from the
actuated signals can be used to model delays.
Determin ing Skip Probabili ty
To determine the probability of a phase being skipped it is necessary to determine the expected
number of vehicles that arrive during red. Synchro assumes the phase will be skipped if there is
a greater than 50% chance that zero vehicles arrive during the red time. If the expected number
of vehicles is less than 0.69, there is a 50% chance that zero vehicles arrived.
The red time can be a tricky number to determine. The red time occurs at the beginning of the
unusable yellow time or about 2 to 3 seconds into the yellow time. The red time extends to the
end of the permissive period for this phase. The permissive period ends at the yield point of the
previous phase. If there are advanced detectors, this will allow more vehicles to be detected andextend the detection time for avoiding a gap.
R' = R + L2 + Tlead - Ymain = Red time for calculating skips (s)
R = Actual Red Time (s)
L2 = Clearance Lost Time (s) = 1 to 2 s.
Tlead = Travel time from first advanced detector to stop bar. (s)
Ymain = Yellow time for main street. Only subtract if main street has not yielded to
another phase. (s)
When determining the probability of a skip, traffic from all lane groups calling the phases are
added and pedestrian calls are added as well.
Any phases with recall will not be skipped.
If this signal is not in coordination, the actual cycle length may be less than the maximum cycle
l h d h ki i d i l l i b d i i l i h h l

7/21/2019 Synchro Studio 8 User Guide
http://slidepdf.com/reader/full/synchro-studio-8-user-guide 270/559
14-34
length and the skipping and gapping calculations must be done iteratively with shorter cycle
lengths.
If this signal is in coordination, the arrival flow will reflect the departures from the
upstream intersection. It is possible for a phase to be skipped if the platoon arrives
after the permissive period, this occurs most often with leading left turn phases. In
this case, Synchro will calculate delays by modeling two cycles. In the first cycle,
the phase is skipped. In the second cycle, all vehicles are served. Synchro will notskip phases if the v/c ratio is 0.9 or greater.
Synchro assumes that any phase with traffic of at least 1 vph will not be skipped during the 90th
percentile cycle. This insures that every phase gets at least some green time.
Determin ing Queue Clear Time
The queue clearance time is equal to the startup lost time plus the service time for any vehicles
that arrived during red plus vehicles arriving during the clearance time. Synchro has the startup
lost time set for 2.5 seconds. The service time is 3600 divided by the Saturated Flow Rate and
the number of lanes.
)12(*1 L R Lv s
v LTq
= queue clearance time (s)
L1 = 2.5 s = startup lost time (s)
v = arrival rate (vph)
s = Saturated Flow Rate (vph)
R = Actual Red Time (s)
L2 = Clearance Lost Time (s)
If the signal is in coordination, the arrival rate will not be constant.
If this phase serves two or more lane groups, the lane group with the highest Volume to
Saturation ratio is used.
If the lane group for this phase is also served by another phase such as a permitted + protected
left turn phase or a right turn phase with an overlap, the vehicles arriving on red will be reduced
by the vehicles served by the other phase.
Synchro does not actually model stop bar detectors or initial intervals. Synchro assumes that the
detectors and initial interval settings are set up in such a way that the phase will not gap out

7/21/2019 Synchro Studio 8 User Guide
http://slidepdf.com/reader/full/synchro-studio-8-user-guide 271/559
14-35
detectors and initial interval settings are set up in such a way that the phase will not gap out
before the queue is cleared.
An "overflow queue" calculation is used to prevent gap-out at lower percentiles for movements
near or over capacity. The unserved vehicles from the 90th percentile cycle are assumed to be in
the initial queue for the lower percentile cycles. The overflow queues are assigned as follows:
uI = (vI - cI)*C/3600 = unserved vehicles for percentile I.
vI = percentile volume for percentile I
cI = capacity for percentile I, based on maximum green times
o70 = u90/4 = 70th percentile initial overflow queue (vehicles / cycle)
o50 = u90/4 + u70/3 = 50th percentile initial overflow queue (vehicles /cycle)
o30 = u90/4 + u70/3 + u50/2 = 30th percentile initial overflow queue
o10 = u90/4 + u70/3 + u50/2 + u30 = 10th percentile initial overflow queue
C = cycle length, using maximum green times
The overflow queue calculations are based on maximum green times.
Determin ing Time to Gap-Out
The time-to-gap-out is the time from when the queue clears until there is a 50% chance of gap
out.
The effective gap time, GapEff, is the time required between two vehicles for the signal to gapout. A single vehicle can extend the phase from the time it hits the first detector until the time it
leaves the last extension detector plus the gap time. GapEff is thus equal to the controller's
actual gap time plus the travel time between the first and last extension detectors. Only
extension detectors are counted when determining the effective gap time.
GapEff = Gap + Tlead - Ttrail = Effective gap time (s)
Gap = Vehicle Extension time. (s)
Tlead = Travel time from leading detector to stop bar. (s)
Ttrail = Travel time from trailing extension detector to stop bar. (s)
The probability of an immediate gap-out is the probability of 0 vehicles in the first GapEff
seconds. If the expected vehicles are less than 0.69 in this time, there is more than 50% chance
of an immediate gap-out.
Th b bilit f t i b t d i th b bilit f hi l i th
7/21/2019 Synchro Studio 8 User Guide
http://slidepdf.com/reader/full/synchro-studio-8-user-guide 272/559
14-36
The probability of a gap-out in any subsequent second is the probability of no vehicles in the
new second and the probability of no vehicles in the trailing GapEff -1 seconds. The expected
number of vehicles in the trailing time is arrivals + 1 since we know there was at least one
vehicle in the trailing GapEff seconds.
Coordination
One of the best ways to reduce delays at signalized intersections is through coordination. Whena signal is in coordination its arrival flows from adjacent intersections will vary over the course
of a cycle. Under perfect coordination all traffic arrives on green, there are no stops or delays.
Synchro models coordination by varying the arrival rate at intersections based on the departures
at upstream intersections. This causes the arrival rate to vary across the cycle.
Determining Arri val Patterns
Synchro takes all traffic from upstream intersections moving toward the subject intersection,
both through and turning traffic. If the upstream green interval is not saturated, the traffic flow
leaving the upstream intersection will vary across the green band.
Normally traffic from the upstream intersection will be heavy during the upstream intersection's
queue clearance period and then the flow will decrease to the upstream intersection's arrival rate.
If a platoon arrives at the middle or end of the upstream intersection's green time, the platoon
will carry through to this intersection.
For a graphical representation of how vehicles leave the upstream intersection, look at the flows
in the time-space diagram (page 13-5).
If the upstream intersection is actuated-uncoordinated or if it has an incompatible cycle length,
the traffic is assumed to arrive uniformly. A compatible cycle length is the same cycle length,
double the cycle length, or half the cycle length.
If the upstream intersection has half the cycle length, traffic will be modeled over two of its
cycles. If the upstream intersection has double the cycle length, this intersection will be modeled
with two cycles.
Actuated-coordinated intersections always see traffic arriving uniformly.
If the upstream intersection is unsignalized or a bend, Synchro will look beyond the
unsignalized intersection for any signalized intersections. Any vehicles arriving at a free
approach to an unsignalized intersection are assumed to depart immediately.
Vehicles arriving at a stop or yield approach to an unsignalized intersection are assumed to
depart uniformly across the cycle. If mid-block traffic is coded, this traffic is represented as
7/21/2019 Synchro Studio 8 User Guide
http://slidepdf.com/reader/full/synchro-studio-8-user-guide 273/559
14-37
depart uniformly across the cycle. If mid block traffic is coded, this traffic is represented as
arriving uniformly.
Traffic volumes from upstream traffic are adjusted up or down to match the required traffic at
the subject intersection. Traffic adjusted downward can be used as an automatic traffic sink.
Traffic flows from upstream intersections will be adjusted upward by as much as 30%. Any
additional traffic is assumed to arrive uniformly.
The vehicle flows from upstream are time adjusted based on the travel time between theintersections. Synchro has no option for platoon dispersion.
It is possible that the departures of a distant intersection can affect the arrival pattern at this
intersection. For this reason, departure patterns are recalculated iteratively and this causes
Synchro to take a while to recalulate.
Modeling Over Capacity and Cycle Failures
Saturated Links
At links near or above capacity, the delay will have two parts:
D = D1 + D2 = total percentile delay
D1 = Uniform delay, weighted average of percentile scenarios (sec)
D2 = Incremental Delay (sec)
As volume approaches capacity, some or all vehicles will not be accommodated on the first
cycle. Both the Synchro Delay and HCM Signals Report include an incremental delay term (D 2)
to account for delays from vehicles waiting for extra cycles. The D2 in both models accounts for
delays due to near saturation and over saturation.
Incremental delay is now calculated using the HCM formula. Earlier versions of Synchro
performed a 100 cycle simulation to determine the incremental delay. Trafficware conducted
research that showed the HCM formula gives essentially the same results for a wide range of v/cratios, cycle lengths, and green times, provided the same definition of delay is used. Synchro 6
switched to using the HCM formula to give consistency with the other method, and to facilitate
fast D2 calculations to model queue interactions during optimization.
T c
X I k x xT D
*
***8)1()1(**900 2
2 = Incremental Delay
S h ll f l i i d th th 15 i t D ill b hi h h i l

7/21/2019 Synchro Studio 8 User Guide
http://slidepdf.com/reader/full/synchro-studio-8-user-guide 274/559
14-38
Synchro allows for analysis periods other than 15 minutes. D2 will be higher when using longer
analysis periods. However, with a 60 minute analysis period, there is no adjustment for PHF,
this will normally reduce the adjusted volume. The resulting delay could be higher in some cases
and lower in others than using a 15 minute analysis period.
Upstream Metering
The I term is determined by Exhibit 15-9 in the HCM 2000. If this is an isolated intersection orthere is no upstream intersection, I = 1.0 for random arrivals. Exhibit 15-9 of the HCM is as
follows:
Source: Year 2000 Highway Capacity Manual, Chapter 15
Percentile Delay Summary
The basic premise of the Percentile Delay Method is that traffic arrivals will vary according to a
Poisson distribution. The Percentile Delay Method calculates the vehicle delays for five
different scenarios and takes a volume weighted average of the scenarios. The five scenarios are
the 10th, 30th, 50th, 70th, and 90th percentiles. It is assumed that each of these scenarios will berepresentative of 20% of the possible cycles. For each scenario, traffic for each movement is
adjusted to that percentile.
If the signal is actuated or semi-actuated, the skipping and gap-out behavior for these traffic
conditions are used to determine the green times for each scenario. If the signal is in
coordination, an arrivals flow pattern is calculated to account for the affects of coordination.
Delays are calculated using the adjusted volumes and calculated green times.
Estimating actuated operation or coordination arrivals may require that the calculations be
performed iteratively. A D2 term is calculated to account for signals near or above saturation.
Percentile Delay and Webster's Formula Compared
In most situations, the delays calculated by the Synchro Percentile and HCM Signals Report
method are similar and will be within a few seconds of each other. The HCM 2000 has added
capabilities for calculating delays of actuated signals and for congested movements; these

7/21/2019 Synchro Studio 8 User Guide
http://slidepdf.com/reader/full/synchro-studio-8-user-guide 275/559
14-39
capab es o ca cu a g de ays o ac ua ed s g a s a d o co ges ed ove e s; ese
improvements allow the two delay methods to be similar in most cases.
Actuated Signals
Webster's formula calculates delay using a single set of green times. These green times are an
average of the actual green times encountered by the signal operating in actuated mode. The
percentile method uses five sets of green times, by using five levels of traffic. Delays arecalculated using each scenario and a weighted average is taken.
In most cases, the difference between using one and five scenarios will be less than a few
seconds. The biggest differences occur with the non-linear behavior associated with pedestrian
phases and skipped phases. If an intersection has pedestrian actuated phases with 1 to 50
pedestrians per hour or skipped phases and traffic under 100 vph; the delay to other phases will
be calculated more accurately using the Percentile method.
Coordination
Webster's formula calculates the affects of coordination by using a Progression Factor (PF). The
PF is calculated by estimating the percentage of vehicles arriving on green. The formula does
not discriminate between vehicles arriving at the beginning or end of red so the entire process is
an approximation.
The Percentile Method calculates the affects of coordination by looking at actual arrivals from
adjacent intersections. The queue length and delays are calculated by integrating the expected
arrival rate across the cycle length. The delays calculated this way explicitly account for
coordination and give the detail necessary for offset optimization.
Summary
Percentile Webster
Models Actuation Yes Yes
Models Skips Yes Approximate
Models Pedestrian Actuation Yes Approximate
Models Traffic Variance Yes Yes
Models Congestion Yes Yes
Models Coordination Yes Approximate
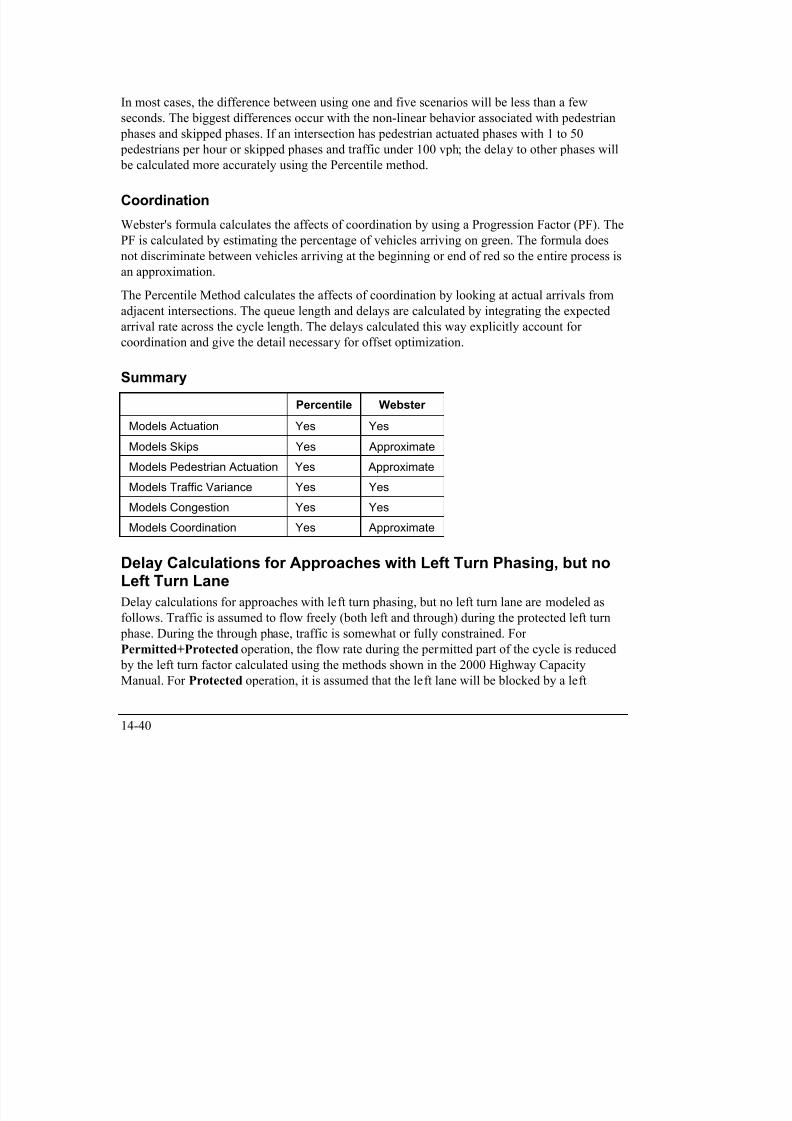
7/21/2019 Synchro Studio 8 User Guide
http://slidepdf.com/reader/full/synchro-studio-8-user-guide 276/559
14-40
Delay Calculations for Approaches with Left Turn Phasing, but noLeft Turn Lane
Delay calculations for approaches with left turn phasing, but no left turn lane are modeled as
follows. Traffic is assumed to flow freely (both left and through) during the protected left turn
phase. During the through phase, traffic is somewhat or fully constrained. For
Permitted+Protected operation, the flow rate during the permitted part of the cycle is reduced by the left turn factor calculated using the methods shown in the 2000 Highway Capacity
Manual. For Protected operation, it is assumed that the left lane will be blocked by a left
turning vehicle. The capacity is thus reduced by one lane, or the capacity is zero for a one lane
approach.
Intersection Capacity (ICU) CalculationsThe Intersection Capacity Utilization (ICU) method is a simple yet powerful tool for measuring
an intersection‟s capacity. The ICU can be calculated using a single page worksheet, that is both
easy to generate and easy to review. The ICU is the perfect tool for planning applications such
as roadway design and traffic impact studies.
The method sums the amount of time required to serve all movements at saturation for a given
cycle length and divides by that reference cycle length. This method is similar to taking a sum of
critical volume to saturation flow ratios (v/s), yet allows minimum timings to be considered. The
ICU can tell how much reserve capacity is available or how much the intersection isovercapacity. The ICU does not predict delay, but it can be used to predict how often an
intersection will experience congestion.
The ICU is timing plan independent, yet has rules to insure that minimum timing constraints are
taken into account. This removes the choice of timing plan from the capacity results. The ICU
can also be used on unsignalized intersections to determine the capacity utilization if the
intersection were to be signalized.
Additional Details can be found in the Intersection Capacity Utilization 2003 book. A
copy of this can be found in Adobe PDF format in your Trafficware installation
directory.
ICU 2003 includes new procedures for analyzing Diamond Interchanges and Single Point Urban
Interchanges. The Diamond method includes procedures recognizing the special timing needs of
a diamond interchange to prevent spillback.

7/21/2019 Synchro Studio 8 User Guide
http://slidepdf.com/reader/full/synchro-studio-8-user-guide 277/559
14-41
Level of Service
The ICU is the sum of time required to serve all movements at saturation given a reference cycle
length, divided by the reference cycle length.
ICU = sum (max (tMin, v/si) * CL + tLi) / CL = Intersection Capacity Utilization
CL = Reference Cycle LengthtLi = Lost time for critical movement i
v/si = volume to saturation flow rate, critical movement i
tMin = minimum green time, critical movement i
The ICU Level of Service should not be confused with delay-based levels of service
such as the HCM. Both are providing information about the performance of an
intersection while measuring a different objective function. The ICU LOS reports on
the amount of reserve capacity or capacity deficit. The delay based LOS reports on
the average delay experienced by motorists.
The ICU 2003 uses one-hour volume counts with no adjustment for Peak Hour Factor. Older
versions of the ICU used one-hour volume counts with a peak hour adjustment factor (with a
default of 0.90). The scale has been adjusted to reflect this change while still providing the same
LOS.
Old ICU New ICU Level of Service
0 to 60% 0 to 55% A
>60% to 70% >55% to 64% B
>70% to 80% >64% to 73% C
>80% to 90% >73% to 82% D
>90% to 100% >82% to 91% E
>100% to 110% >91% to 100% F>110% to 120% >100% to 109% G
>120% >109% H
A brief description of the conditions expected for each ICU level of service follows:
LOS A, ICU 0.55: The intersection has no congestion. A cycle length of 80 seconds or less
will move traffic efficiently. All traffic should be served on the first cycle. Traffic fluctuations,accidents, and lane closures can be handled with minimal congestion. This intersection can

7/21/2019 Synchro Studio 8 User Guide
http://slidepdf.com/reader/full/synchro-studio-8-user-guide 278/559
14-42
accidents, and lane closures can be handled with minimal congestion. This intersection can
accommodate up to 40% more traffic on all movements.
LOS B, 0.55 < ICU 0.64: The intersection has very little congestion. Almost all traffic will be
served on the first cycle. A cycle length of 90 seconds or less will move traffic efficiently.
Traffic fluctuations, accidents, and lane closures can be handled with minimal congestion. This
intersection can accommodate up to 30% more traffic on all movements
LOS C, 0.64 < ICU 0.73: The intersection has no major congestion. Most traffic should be
served on the first cycle. A cycle length of 100 seconds or less will move traffic efficiently.
Traffic fluctuations, accidents, and lane closures may cause some congestion. This intersection
can accommodate up to 20% more traffic on all movements.
LOS D, 0.73 < ICU 0.82: The intersection normally has no congestion. The majority of
traffic should be served on the first cycle. A cycle length of 110 seconds or less will move traffic
efficiently. Traffic fluctuations, accidents, and lane closures can cause significant congestion.
Sub optimal signal timings cause congestion. This intersection can accommodate up to 10%more traffic on all movements.
LOS E, 0.82 < ICU 0.91: The intersection is right on the verge of congested conditions.
Many vehicles are not served on the first cycle. A cycle length of 120 seconds is required to
move all traffic. Minor traffic fluctuations, accidents, and lane closures can cause significant
congestion. Sub optimal signal timings can cause significant congestion. This intersection has
less than 10% reserve capacity available.
LOS F, 0.91 < ICU 1.00: The intersection is over capacity and likely experiences congestion
periods of 15 to 60 minutes per day. Residual queues at the end of green are common. A cycle
length over 120 seconds is required to move all traffic. Minor traffic fluctuations, accidents, and
lane closures can cause increased congestion. Sub optimal signal timings can cause increased
congestion.
LOS G, 1.00 < ICU 1.09: The intersection is 10% to 20% over capacity and likely
experiences congestion periods of 60 to 120 minutes per day. Long queues are common. A cyclelength over 120 seconds is required to move all traffic. Motorists may be choosing alternate
routes, if they exist, or making fewer trips during the peak hour. Signal timings can be used to
"ration" capacity to the priority movements.
LOS H, 1.09 < ICU: The intersection is 20% over capacity and could experience congestion
periods of over 120 minutes per day. Long queues are common. A cycle length over 120
seconds is required to move all traffic. Motorists may be choosing alternate routes, if they exist,
or make fewer trips during the peak hour. Signal timings can be used to "ration" capacity to thepriority movements.

7/21/2019 Synchro Studio 8 User Guide
http://slidepdf.com/reader/full/synchro-studio-8-user-guide 279/559
14-43
priority movements.
The length of the congested period is heavily dependent on the source of traffic and the
availability of alternate routes. If traffic is generated by a single factory shift change, the
congested period may be shorter. However, a shopping mall could generate congested traffic for
several hours. If alternate routes exist, motorists may know to avoid the congested intersections
during the peak hour and this reduces congestion.
If intersections have LOS E to LOS G, queues between intersections can lead to blocking
problems. Signal timing plans should be analyzed with microscopic simulation to insure that
spillback is not causing additional problems.
ICU LOS and HCM Level of Service
The ICU 2003 is designed to be compatible with the HCM. The default Saturated Flow Rates
and volume adjustments are the same as those recommended by the HCM. The two methods are
closely interrelated. If the intersection has an ICU LOS of E or better, a timing plan exists that
will give LOS E or better with the HCM. With an ICU of F, the intersection will be over
capacity for the peak 15 minutes. It may possible to get an acceptable HCM LOS when the
intersection is over capacity by using a timing plan favoring the highest volume movements.
Overview of CalculationsThe primary calculation for ICU 2003 is to calculate an Adjusted Reference Time for each
movement. The Reference Time is the amount of time required for each movement at 100%
capacity. The reference time is volume times Reference Cycle Length divided by Saturated Flow
Rate.
tRef = vC/s * CL = reference time
vC = adjusted volume combined for lane group
s = saturation flow rate for lane group
CL = reference cycle length
The Reference Time must be greater than the Minimum Green time and is added to the Lost
Time to give the Adjusted Reference Time. The ICU is the sum of the critical Adjusted
Reference Times divided by the Reference Cycle Length. The Reference Cycle Length is a fixed
input value; the default is 120 seconds.
Adj ( R f Mi ) L dj d f i

7/21/2019 Synchro Studio 8 User Guide
http://slidepdf.com/reader/full/synchro-studio-8-user-guide 280/559
14-44
tAdj = max(tRef, tMin) + tL = adjusted reference time
tMin = minimum green time
tL = lost time
There are further adjustments to account for pedestrian time and pedestrian interference.
The reference times for the critical movements are added together to get the combined time
required.
Additional Details can be found in the Intersection Capacity Utilization 2003 book. A copy of
this can be found in Adobe PDF format in your Trafficware installation directory.
Permitted Lefts and Shared Lanes
The modeling of permitted left turns, particularly for shared lanes is problematic in the ICU
methodology. This is especially a problem for single lane approaches.
The ICU method requires a movement to be protected to determine its timing requirements
based of the v/s ratio (volume to saturated flow ratio). If there is no left turn lane, protected
phasing cannot be used. The two options available are to use Split phasing or to assume a de-
facto left turn lane. For modest left turn volumes, neither of these solutions is satisfactory
because a large proportion of the time there will be no left turn vehicles and the lanes will
function as though they were normal through lanes.
Permitted left turns will be able to go under three conditions:
1. A gap in oncoming traffic due to low oncoming traffic volumes
2. Sneakers at the end of green
3. A gap in oncoming traffic caused by a left turn from a single lane approach.
Trafficware conducted research using simulation to determine the average amount of green time
a left turner spends at the stop bar. The simulations were performed for a complete range of leftturn proportions for the subject approach and a complete range of left turn proportions for the
oncoming approach. If the oncoming approach has multiple lanes then the behavior is assumed
to be equivalent to zero oncoming left turns.
Comparison of ICU and HCM Delay Based Methods
Currently the most popular method for analyzing capacity is the HCM. The HCM method is
based on estimating delay for the intersection.
The ICU 2003 is designed to be compatible with the HCM and can be used in conjunction with

7/21/2019 Synchro Studio 8 User Guide
http://slidepdf.com/reader/full/synchro-studio-8-user-guide 281/559
14-45
The ICU 2003 is designed to be compatible with the HCM and can be used in conjunction with
the HCM and other methods. The default Saturated Flow Rates and volume adjustments are the
same as those recommended by the HCM. In most circumstances, the volume to Saturated Flow
Rates in ICU 2003 (v/s), will be the same as those in the HCM. When an agency requires an
acceptable HCM Level of Service, an acceptable ICU Level of Service will insure that the HCM
Level of Service is met.
An acceptable ICU Level of Service guarantees that a timing plan exists that will meet all of the
following:
Acceptable HCM level of service
All minimum timing requirements are met
All movements have acceptable v/c ratios
All movement volumes can have their volume increased by the reciprocal of the ICU
and be at or below saturation.
With an acceptable HCM level of service, the following is guaranteed:
Average delays are less than the amount for that Level of Service
The majority of traffic has acceptable v/c ratios or short red time
The ICU is inherently more precise because the delay equation is unstable near capacity. The
calculation of delay requires an estimate for the affects of coordination, which adds greatly to
the resulting uncertainty.
One consequence of the high range of uncertainties is that it makes the method easy to
manipulate. In some cases, it is possible to get a 20% reduction in delay or two Levels of
Service by increasing capacity 5% and reducing volume 5%.
If a real estate developer is attempting to get project approval with a minimum of mitigation
measures, it is not too difficult to adjust the input factors, platoon factors, and so forth to get a
significant reduction in delay. Some communities have regulations requiring developers tomaintain a certain LOS. There is unfairness to this method of regulation because all developers
up to the critical LOS pay nothing and the first developer to go over is saddled with high
mitigation costs. A more equitable approach is to assess all developers equally based on the
number of trips generated. Because of this unfairness, there is a huge incentive to manipulate the
numbers to get the desired LOS.
Diamond InterchangesThe ICU 2003 incl des a special proced re for e al ating diamond interchanges This method
7/21/2019 Synchro Studio 8 User Guide
http://slidepdf.com/reader/full/synchro-studio-8-user-guide 282/559
14-46
The ICU 2003 includes a special procedure for evaluating diamond interchanges. This method
considers the special timing requirements for a diamond interchange due to the limited storage
space and susceptibility for spillback. Refer to the Intersection Capacity Utilization 2003 book
for a complete description of the ICU for Diamond Interchanges.
Single Point Urban Interchanges
The ICU 2003 includes a special procedure for evaluating Single Point Urban Interchanges. This
method considers the special timing requirements for an Urban Interchange including the long
clearance times necessary due to the long turning paths. Refer to the ICU 2003 book for a
complete description of the ICU for Urban Interchanges.
Stopped Delay vs. Signal DelayPrevious versions of Synchro and the HCM used stopped delay. Stopped delay includes the time
vehicles are stopped while signal delay also includes the time lost due to slowing.
The delay used by Synchro (version 4 and later) and the 2000 HCM Chapter 16 is Signal Delay.
TRANSYT 7F also uses signal delay. When looking at delays calculated by Synchro Version3.2 and the 1994 HCM, you may need to multiply those delays by 1.3 to be equivalent to the
Signal Delays used in Synchro version 5.
Comparison of Analysis MethodsSynchro offers three independent methods to analyze signalized intersections: Synchro
Percentile Delays, HCM Signalized Method, and Intersection Capacity Utilization (ICU). The
table below summarizes some of the features of each method.
7/21/2019 Synchro Studio 8 User Guide
http://slidepdf.com/reader/full/synchro-studio-8-user-guide 283/559
14-47
Table 14-4 Comparison Analysis Method Summary
Synchro Delay HCM Method ICU
Measures of Effectiveness Delay Delay and v/c v/c
Target Applications Operations,
Signal Timing
Operations and
Planning
Planning,
Impact Studies,
Roadway DesignExpected Precision 10% to 27% 10% to 29% 3% to 10%
Other Sources For
Calculation
No HCM compatible
software
Spreadsheet and
Worksheet
Pedestrian Timing
Requirements
Yes No Yes
Detailed Modeling of
Coordination
Yes No* No
Detailed Actuated Signal
Modeling
Yes No* No
* The HCM Delay calculation within Synchro explicitly models coordination and actuated
signal timings.
For a complete discussion about accuracy, see the topic Precision in Traffic Analysis on page
14-50.
Choosing an Analysis Method
Table 14-5 helps to choose the appropriate analysis method for your project needs.
Table 14-5 Data Requirement by Analysis Method
Data Requirement Analysis Method
High Accuracy is required ICU or HCM v/c
True Measure of Capacity is required ICU
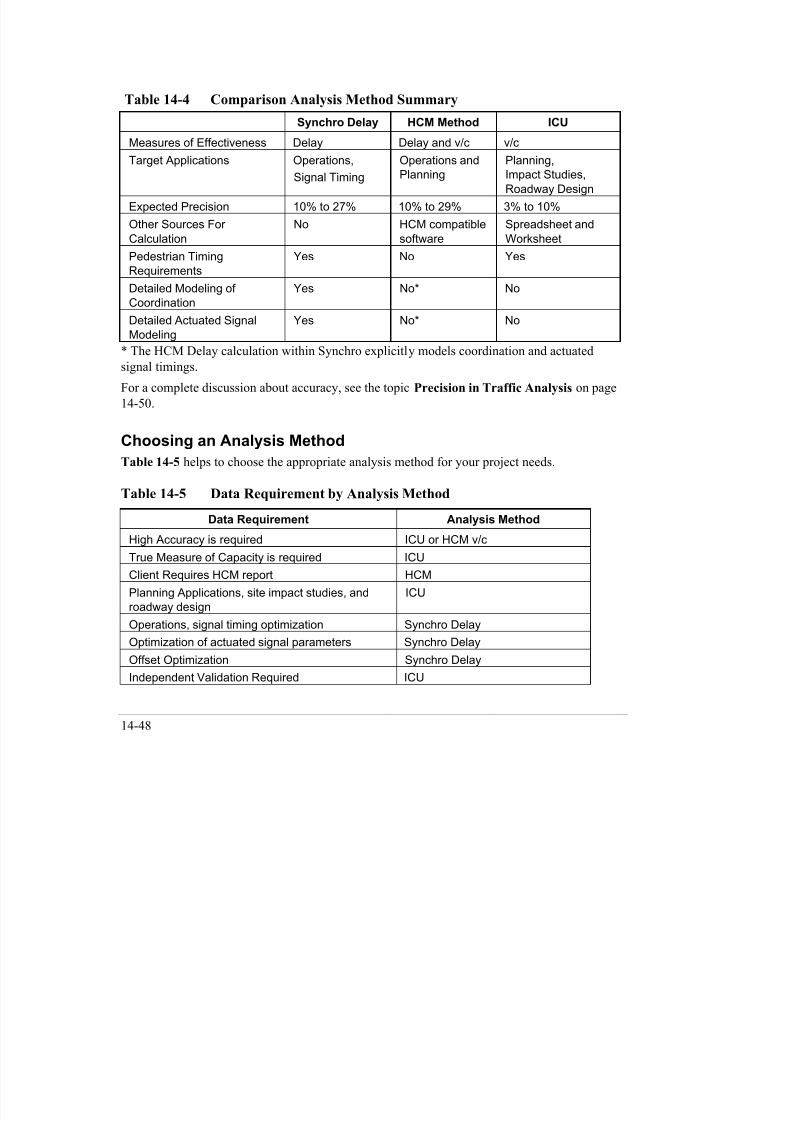
7/21/2019 Synchro Studio 8 User Guide
http://slidepdf.com/reader/full/synchro-studio-8-user-guide 284/559
14-48
p y q
Client Requires HCM report HCM
Planning Applications, site impact studies, and
roadway design
ICU
Operations, signal timing optimization Synchro Delay
Optimization of actuated signal parameters Synchro Delay
Offset Optimization Synchro Delay
Independent Validation Required ICU
Intersection Capacity Utilization
The ICU method is designed to be used for planning applications; its primary benefits are higher
accuracy, ease of use, and reproducibility. The theory of ICU is to add up the times required for
a phase to serve each movement at 100% saturation with a cycle length of 120 seconds. The sum
of critical phases is divided by the reference cycle length of 120 seconds. The result is similar to
adding the critical volume to saturation (v/s) ratios, but the sum of required phase times takes
into account lost times and minimum timing requirements.
The ICU method is completely documented with step-by-step instructions. The method is also
available as a Microsoft Excel spreadsheet and a single page worksheet that can be calculated
by hand. Because the method is less complex and well-defined, it is possible for results to be
reproduced by an independent analyst.
The ICU method is designed for high accuracy. Volume capacity ratios are inherently more
accurate than delay calculations. The ICU assumes that all left turns are protected so there is nouncertainty from permitted left turn factors. Coordination is not considered so there are no
inaccuracies introduced by coordination.
The ICU is designed to be a true measure of capacity. Unlike the HCM v/c calculation,
conflicting movements are not allowed to use the intersection at the same time so that capacity is
not double counted.
Synchro Delay Method
The Synchro delay calculations are designed for operations and signal timing optimization.
Synchro‟s method is called The Percentile Delay Method. The Percentile Delay Method is
designed to model coordination and actuated signals in detail.
Delay based methods including Synchro‟s are inherently less accurate than capacity based
methods. However, Synchro‟s delay method does explicitly account for actuation and
coordination thereby reducing those sources of inaccuracy.
Th l l ti t li t d t b f d b h d d ib d l t l
7/21/2019 Synchro Studio 8 User Guide
http://slidepdf.com/reader/full/synchro-studio-8-user-guide 285/559
14-49
The calculations are too complicated to be performed by hand or described completely on paper.
The Synchro results are therefore not reproducible by other software or by hand methods.
For optimizing signal timing for coordination, Synchro‟s delay method is the best choice
because it is explicitly calculating the affects or coordination. Similarly, for analyzing actuated
signal parameters, Synchro‟s delay method is also the best choice.
Precision in Traffic Analysis
This section contains a short discussion about accuracy and precision. The uncertainties of the
inputs are analyzed along with their affects on the resulting values. A simplified method is
presented to show how uncertainties in input values propagate to uncertainties in results.
Table 14-6 below lists the primary inputs for an ICU calculation, and an intersection delay
calculation along with typical uncertainties.
The general volume to capacity ratios can be calculated with more accuracy than delay. The
following illustrates how inaccuracies can compound in an ICU or delay analysis; the numbers
in parenthesis are the typical level of certainty.
Table 14-6 Compounding Inaccuracies in Analysis
Value Typical Uncertainty PercentVolume 500 50 10%
Saturated Flow 2000 100 5%
Lane Utilization 0.9 0.05 6%
Lost Time 4 0.5 13%
Permitted Left Factor 0.3 0.03 10%
Green Time 40 2 5%
Platoon Factor 1 0.3 30%
The Table below shows how these certainties combine to affect the overall uncertainty in the
resulting ICU. The ICU affect was calculated using a spreadsheet. The relevant input variable
was increased 1% and the resulting ICU for a typical intersection was compared to the baseline
ICU. A value of 0.88 indicates that a 1% increase in volume increases the ICU by 0.88%. Each
input value‟s percent uncertainty is multiplied by the affect factor and squared. The root of thesum of the squares is the combined uncertainty for all input uncertainties. For this example, the
ICU h t i t f 10 6%

7/21/2019 Synchro Studio 8 User Guide
http://slidepdf.com/reader/full/synchro-studio-8-user-guide 286/559
14-50
ICU has an uncertainty of 10.6%.
If the ICU had been calculated without permitted left turns, the resulting ICU uncertainty would
be 9%. Most ICU calculations do not use permitted left turns.
Table 14-7 Uncertainties Affect on ICU
Value ui mi (ICU) (ui * mi)2
Volume 7% 0.88 0.0036
Saturated Flow 5% -0.87 0.0019
Lane Utilization 6% -0.87 0.0023
Lost Time 13% 0.12 0.0002
Permitted Left Factor 10% -0.57 0.0032
Green Time 5% na
Platoon Factor 30% na
Sum 0.0113
Combined Uncertainty (CU) 10.6%
Table 14-8 examines the same uncertainties affect on delay. Two cases are considered, the first
has a v/c of 0.75 and the second has a v/c of 1.0. Note that uncertainty to volume and capacity
has a multiplying affect of over 3 at capacity, but only about 1 at lower v/c ratios.
If the intersection is assumed to be uncoordinated and uses protected lefts, the platoon factor and
permitted left turn factor contributions are removed and the resulting uncertainties are 13% and
41% for the 0.75 and 1.0 cases.
Table 14-8 Uncertainties Affect on Delay
Value ui mi (HCM
0.75) (ui * mi)2
mi (HCM1.00) (ui * mi)
2
Volume 7% 0.92 0.0039 3.33 0.0517
Saturated Flow 5% -1.04 0.0027 -3.60 0.0325
Lane Utilization 6% -1.04 0.0033 -3.60 0.0401
Lost Time 13% -0.16 0.0004 -0.40 0.0025

7/21/2019 Synchro Studio 8 User Guide
http://slidepdf.com/reader/full/synchro-studio-8-user-guide 287/559
14-51
Permitted Left Factor 10% -1.04 0.0108 -3.60 0.1299
Green Time 5% -1.59 0.0063 -3.87 0.0375
Platoon Factor 30% 0.82 0.0611 0.53 0.0257
Sum 0.0886 0.3199
Combined Uncertainty(Sum of Squares) 30% 57%

7/21/2019 Synchro Studio 8 User Guide
http://slidepdf.com/reader/full/synchro-studio-8-user-guide 288/559
Figure 14-7 illustrates how delay is related to volume. Note that delay increases significantly
once capacity is reached. This steepness of the graph illustrates how small changes to volume or
capacity can make a huge difference in delay. The v/c ratio increases linearly and also provides
information about when the delay slope will start to increase.
Delay vs. Volume
0
20
40
60
80
100
120
140
500 525 550 575 600 625 650 675 700 725 750 775 800
Volume
D e l a y
DelayCoordinated Delay
v/c * 100
Figure 14-7 Delay vs. Volume
Traffic volumes fluctuate as discussed in Chapter 4 of the ICU 2003 book. Volume will change
by day of week hour of the day by time of year and even within the peak hour Volume will

7/21/2019 Synchro Studio 8 User Guide
http://slidepdf.com/reader/full/synchro-studio-8-user-guide 289/559
14-53
by day of week, hour of the day, by time of year, and even within the peak hour. Volume will
also change due to special events, accidents, and bad weather.
Some days can experience 10% or higher volumes in the peak hour than the design volumes.
The delay for these days can be 30% higher and the LOS 2 levels worse. The ICU for these days
will only be 10% higher and 1 level worse. The ICU does a better job of predicting reservecapacity.
Queue InteractionsSynchro 6 introduced a new series of traffic analysis called Queue Interactions. Queue
Interactions looks at how queues can reduce capacity through spillback, starvation, and storage
blocking between lane groups.
Spillback
Spillback is caused when a queue from a downstream intersection uses up all the space on a link
and prevents vehicles from entering the upstream intersection on green. (See Figure 14-8)
Green Light Red Light
Queue causing
spillback
Figure 14-8 Spillback
StarvationStarvation occurs when a downstream signal is green, but the signal cannot service at full
capacity efficiency because the upstream signals is red see Figure 14-9
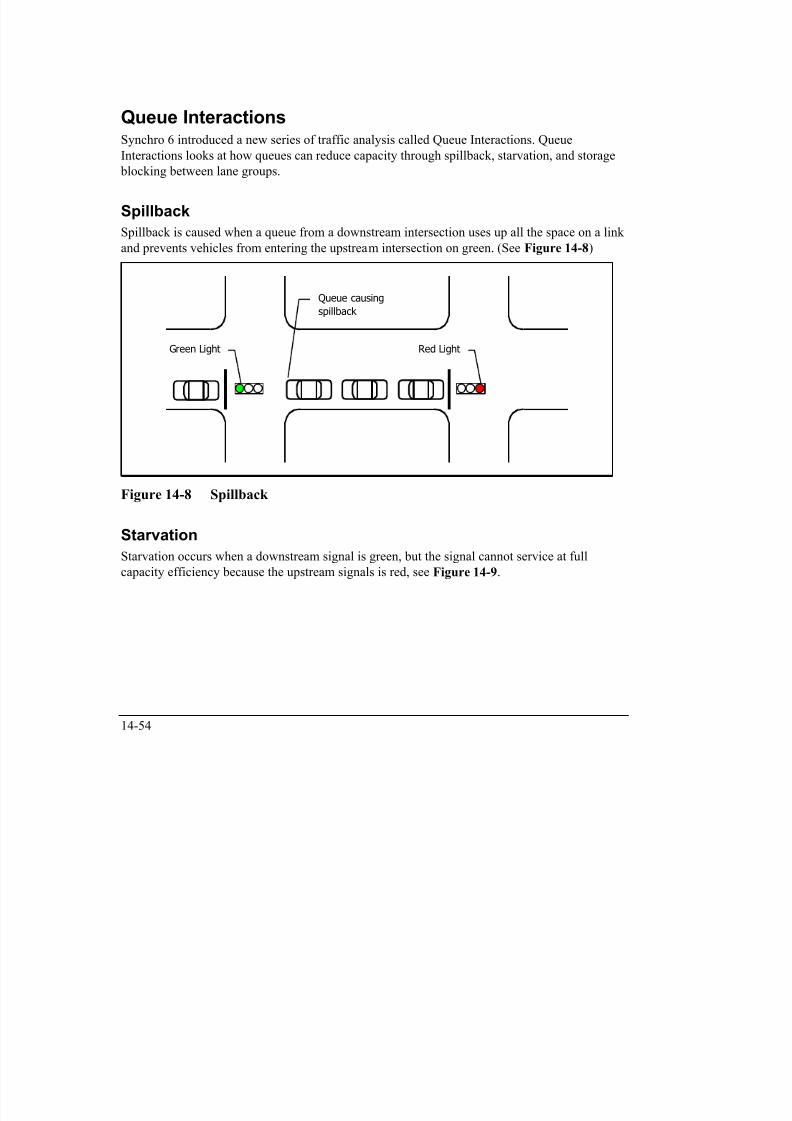
7/21/2019 Synchro Studio 8 User Guide
http://slidepdf.com/reader/full/synchro-studio-8-user-guide 290/559
14-54
capacity efficiency because the upstream signals is red, see Figure 14 9.
Green LightRed Light
Starvation
(wasted green) due
to upstream red
Figure 14-9 Starvation
Queue Interactions
Queue Interactions have the potential to not just increase delay, but also reduce capacity, even
on movements that normally are under capacity. With movements at or above capacity, queue
interactions become even more critical because they have the potential to reduce capacity evenfurther.
Historically Synchro has modeled how good coordination can reduce delay. With Queue
Interaction modeling, Synchro is modeling how bad coordination or no coordination can
exponentially increase delays and reduce capacity.
Queue Interactions look at queues on short links and short turning bays. Less storage space than
one full cycle of traffic causes higher delays along with a reduction in capacity. It is not just a
bad problem, it is a terrible problem. In addition to the problems previously noted, it is also a
safety problem. Vehicles holding at a green light can get rear-ended. Vehicles stuck within an
intersection can get into a right angle collision
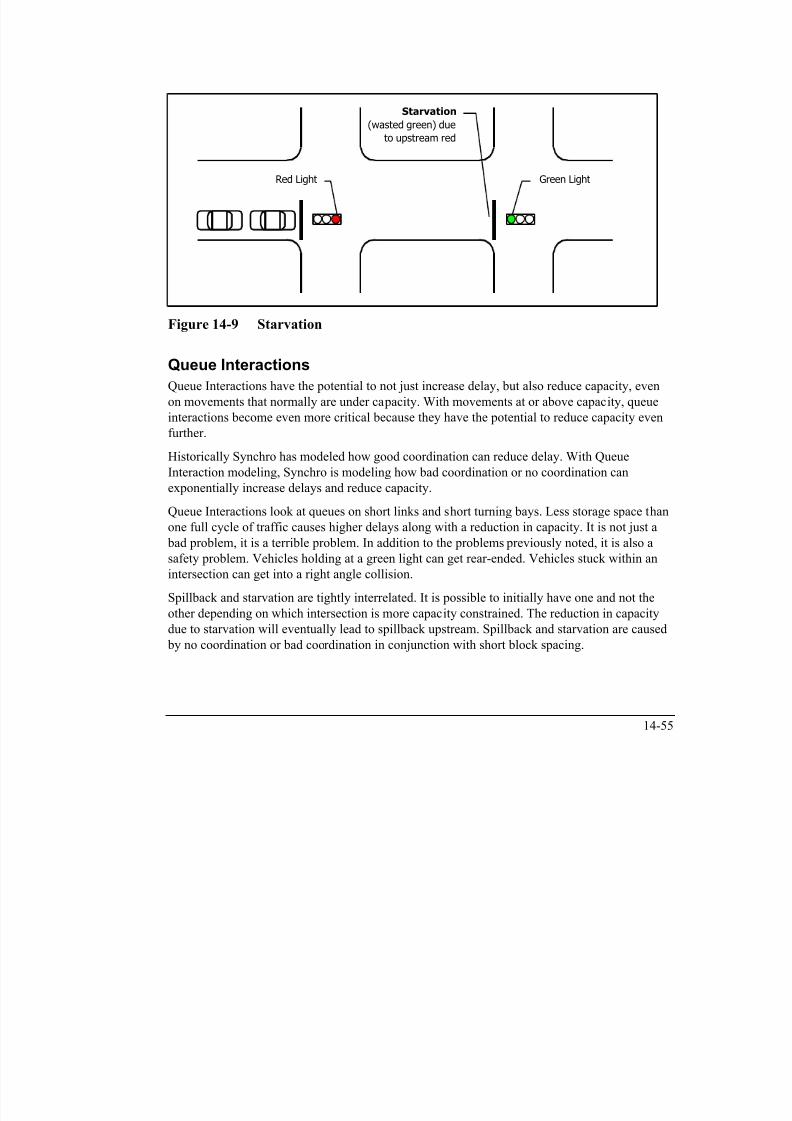
7/21/2019 Synchro Studio 8 User Guide
http://slidepdf.com/reader/full/synchro-studio-8-user-guide 291/559
14-55
intersection can get into a right angle collision.
Spillback and starvation are tightly interrelated. It is possible to initially have one and not the
other depending on which intersection is more capacity constrained. The reduction in capacity
due to starvation will eventually lead to spillback upstream. Spillback and starvation are caused
by no coordination or bad coordination in conjunction with short block spacing.
To reduce spillback and starvation; all major movements for a direction need to be green at the
same time. Using shorter cycle lengths and/or longer block distances can also reduce queue
interaction problems.
Changes to Synchro 6 and later
The Queue Interaction calculations are used throughout Synchro 6 and later, including thefollowing areas.
A new queue delay term is introduced. All displays and reports that show a percentile delay now
have an additional term called Queue Delay. This delay measures the additional delay incurred
by the capacity reduction of queues on short links.
Queue delay is part of the objective function used for optimizations. Optimized timing plans will
now take into account the affects of queue interactions. This will tend to favor timing plans thathold all movements green simultaneously on short links and shorter cycle lengths.
The Time-Space Diagrams can now show times where queue interactions occur. Starvation,
spillback, and storage blocking times are shown at the stop bar with colored rectangles.
The Coding Error Check feature now looks for queue interaction problems. Any significant
problems are reported in detail as a warning.
The Queue report now contains detailed information about the three types of queue interactions.The Queuing penalty is removed.
Calculations
The queue interactions calculations generally have 3 steps:
1. Determine if the volume per cycle to distance ratio is critical.
2. Determine the capacity reduction, due to the amount of time per cycle that the
movement is starved or blocked.

7/21/2019 Synchro Studio 8 User Guide
http://slidepdf.com/reader/full/synchro-studio-8-user-guide 292/559
14-56
3. Determine the additional delay incurred by this capacity reduction.
Compare Volume to Distance
The first step is to determine if the ratio of volume per cycle to distance is critical. QueueInteractions only cause a reduction in capacity when the storage space is less than one cycles
worth of traffic.
If a movement is over capacity, it will cause spillback at any distance; but system capacity will
not be reduced because there is enough storage space to accommodate an entire cycle of traffic.
A link is subject to spillback and starvation whenever:
Min(capDist, volDist) > Dist
capDist = L * [2 + C * c / (n * 3600)] = distance per lane used by one cycle of capacity
volDist = L * [2 + v90 * C / (n * 3600)] = distance per lane used by one cycle of 90th
percentile volume
Dist = Internal Link Distance
c = lane group capacity
n = number of lanes
v90 = 90th percentile volume
C = cycle length
L = average vehicle length
The addition of 2 vehicles is to accommodate a possible truck.
A storage bay is subject to storage blocking whenever:
Min(capDist, volDist) > Store
Store = Storage Bay Distance
This test must be true for both the blocking and the blocked movement. Both movements need
to have a queue extending past the storage bay opening for an interaction to occur.
These tests do not actually determine if queue interactions are occurring, only if they have the
potential to occur.
Determine Capacity Reduction

7/21/2019 Synchro Studio 8 User Guide
http://slidepdf.com/reader/full/synchro-studio-8-user-guide 293/559
14-57
Determine Capacity Reduction
The next step is to determine the time that the movement is blocked or starved. For storage
blocking and spillback, the capacity during this time will be zero. For starvation, the capacity
during this time will be reduced to the upstream saturation flow rate active at the time.
Starvation Capacity Reduction
The time-space diagram in Figure 14-10 illustrates a case of starvation.
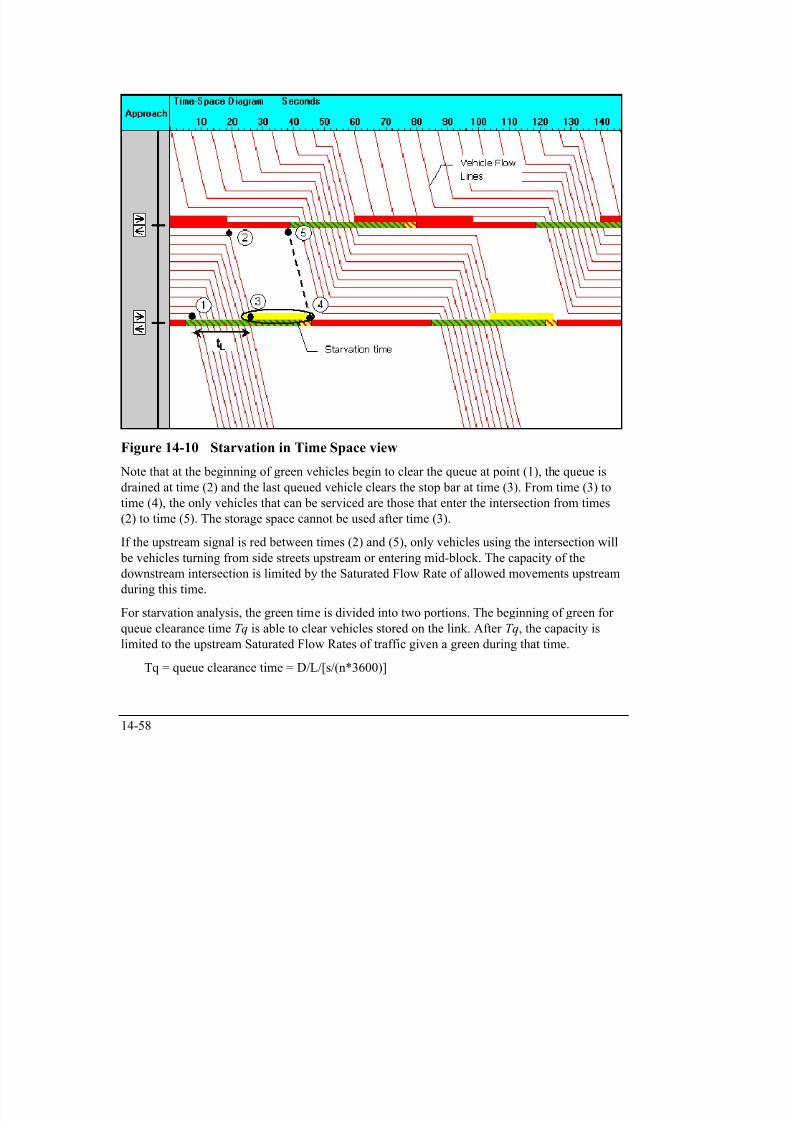
7/21/2019 Synchro Studio 8 User Guide
http://slidepdf.com/reader/full/synchro-studio-8-user-guide 294/559
D = link distance
L = average vehicle length
s = Saturated Flow Rate
n = number of lanes
Refer to Figure 14-11 for an example.
Red Green
C a p a c i t y
Queue
clearing
Possible
Starvation
time
tq
0
S
(a)
Red Green U p s t r e a m S a t u r a t i o n F l o w
0
SU
(b)
Red
Turning Traffic from
Side Street
C a p a c i t y S
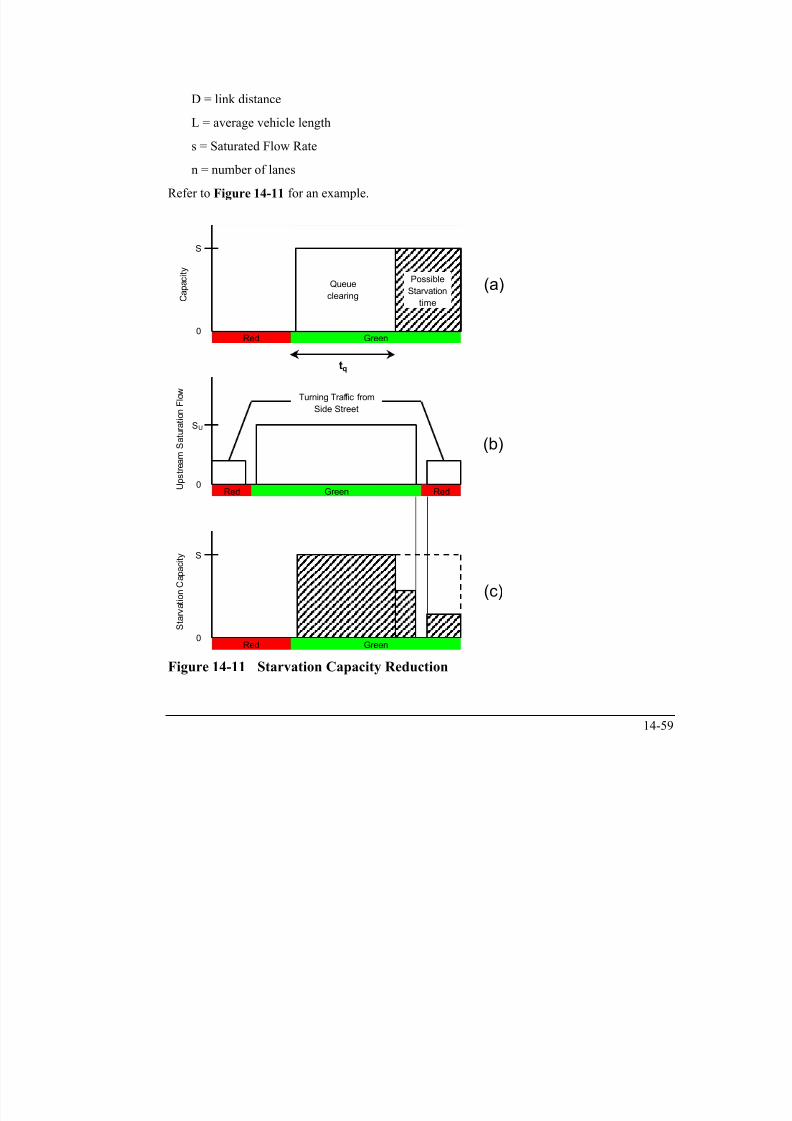
7/21/2019 Synchro Studio 8 User Guide
http://slidepdf.com/reader/full/synchro-studio-8-user-guide 295/559
14-59
S t a r v a t i o n C
Red Green0
(c)
Figure 14-11 Starvation Capacity Reduction
Figure 14-11(a) shows the basic capacity for the downstream intersection versus time for one
cycle. Figure 14-11( b) shows the upstream Saturated Flow Rates for vehicles bound to the
downstream intersection. The Saturated Flow Rates are adjusted to account for the proportion of
vehicles in that stream bound for this movement. Note that there is a big flow for the upstream
through movement, and smaller flow on red for vehicles turning from side streets upstream.
Figure 14-11( b) is time adjusted to account for the travel time between intersections.
Figure 14-11(c) shows the combination of the two flow profiles. The shaded area is the reduced
starvation capacity. The difference between Figure 14-11(a) and Figure 14-11(c) is the
reduction in capacity due to starvation.
In the case where the upstream intersection has a different cycle length, the average volume is
used for the capacity during the Starvation time.
Red Green0
S
v
Reduced
starvation
capacity
ta
Figure 14-12 Reduced Starvation Capacity
Note that at some cycles, the starvation time will be fully utilized and other cycles will be
starved.
The link clearance time for a 300 ft link with saturation flow rate of 2000 vphpl is:
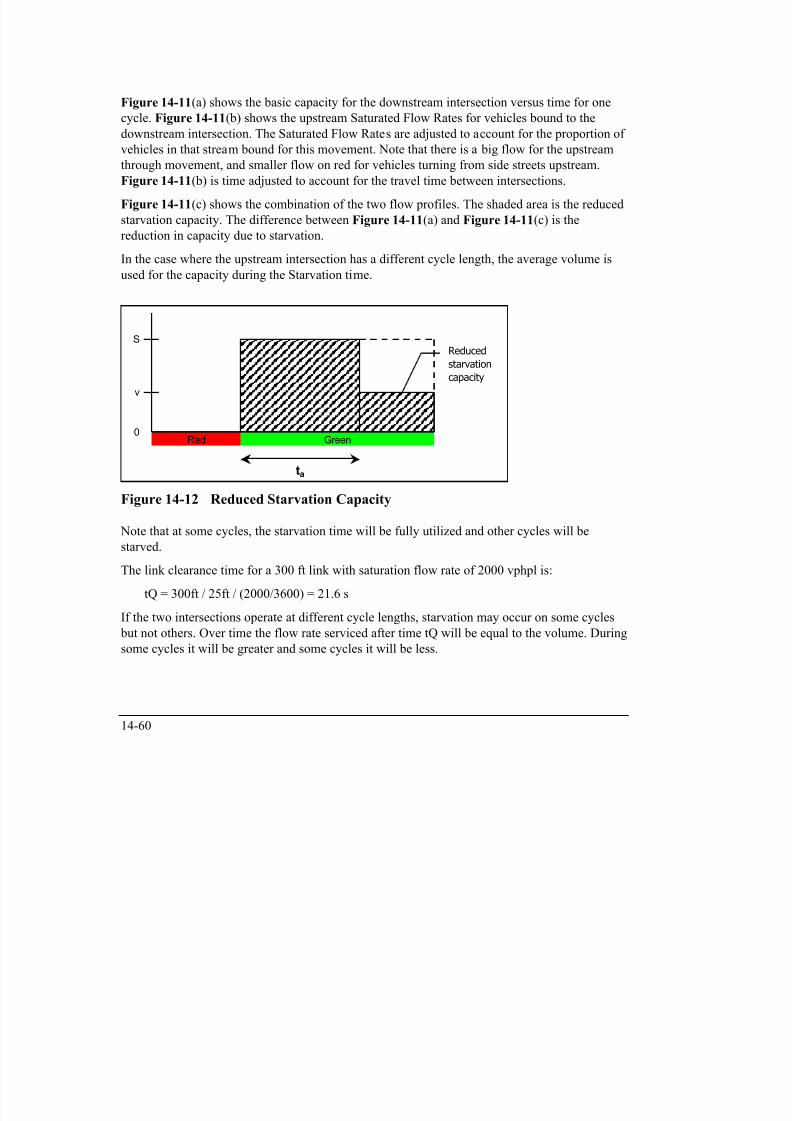
7/21/2019 Synchro Studio 8 User Guide
http://slidepdf.com/reader/full/synchro-studio-8-user-guide 296/559
14-60
tQ = 300ft / 25ft / (2000/3600) = 21.6 s
If the two intersections operate at different cycle lengths, starvation may occur on some cycles
but not others. Over time the flow rate serviced after time tQ will be equal to the volume. During
some cycles it will be greater and some cycles it will be less.
The capacity at the downstream intersection is reduced depending on the amount of vehicles that
can be serviced after tQ.
If starvation is a potential problem, it is essential to use good signal coordination and/or shorter
cycle lengths.
Spillback Capacity Reduction
For spillback analysis, the upstream capacity will be zero whenever the queue extends to the
upstream link.
Refer to Figure 14-13. The first step is to simulate the traffic flow of the downstream
movement. This will determine the queue time upstream. In Figure 14-13 this is from time (2)
to (4). The capacity of the upstream movement(s) are reduced to zero during this time.

7/21/2019 Synchro Studio 8 User Guide
http://slidepdf.com/reader/full/synchro-studio-8-user-guide 297/559
14-61
Figure 14-13 Spillback in Time Space view
Note that side street movements may also have their capacity reduced during the spillback time.
If a side street lane group has two lanes of Thru and Thru-Right, its capacity will be reduced by
½ during the time the right movement is blocked.
In the case where the two intersections have different or variable cycle lengths, the calculations
are performed multiple times. The upstream intersection‟s departure and capacity profiles are
rotated at 5 second increments over their entire cycle. At each 5 second increment, the profiles
are truncated or extended to match the downstream cycle length and the spillback analysis is
performed. The capacity reduction is averaged for all the 5 second offset rotations. This allows
all offset combinations to be evaluated and considered. It is likely the spillback affects will vary
greatly among offset rotations. It is necessary to test all offset rotations in order to determine
whether there are damaging spillbacks with incompatible cycle lengths.
For half cycling or double cycling, offset rotation is not used; the analysis is performed using a
double cycle.For queue delay calculations, the capacity reduction is calculated using both 50th percentile
traffic and 90th percentile traffic with the 50th percentile traffic counting for 2/3 of the total.
crSB = (crSB50 * 2 + crSB90)/3 = capacity reduction due to spillback
crSB50 = capacity reduction due to spillback using 50th percentile traffic
crSB90 = capacity reduction due to spillback using 90th percentile traffic
Storage Blocking Capacity Reduction
Storage blocking combines a spillback and a starvation analysis. The first step is to determine
the time that the entrance to the storage bay is blocked by the blocking movement.
Refer to Figure 14-14. In this example through traffic is simulated for a cycle to determine the
queue time at the top of the storage bay. In Figure 14-14 this is from time (1) to (2).

7/21/2019 Synchro Studio 8 User Guide
http://slidepdf.com/reader/full/synchro-studio-8-user-guide 298/559
14-62
Figure 14-14 Storage Blocking in Time Space view (Through Traffic)
Refer to Figure 14-15 , this shows left traffic on the same link.

7/21/2019 Synchro Studio 8 User Guide
http://slidepdf.com/reader/full/synchro-studio-8-user-guide 299/559
14-63
Figure 14-15 Storage Blocking in Time Space view (Left Turn Traffic)
Next the storage clearance time is determined:
tS = St/L/[s/(n*3600)] = storage clearance time
St = storage distance
L = average vehicle length
s = Saturated Flow Rate
n = number of lanes
The time from (3) to (5) is the storage clearance time. From time (5) to (6), the capacity will be
zero if the storage entrance is blocked.
Figure 14-16(a) shows the basic capacity for the blocked movement versus time for one cycle.
Figure 14-16( b) shows the time the entrance to the storage bay is blocked. Figure 14-16( b) is
time adjusted to account for travel time.
Figure 14-16(c) shows the combination of the two flow profiles. The capacity is reduced after t s
whenever the storage bay is blocked. The shaded area is the reduced storage blocking capacity.
The difference between Figure 14-16(a) and Figure 14-16(c) is the reduction in capacity due to
storage blocking.
Storage blocking is not considered with queue delay. Initial versions of Synchro 6 included this
feature, but it was found that this behavior is too complex to model macroscopically.
Some examples: For a two lane through movement, through vehicles can move around queued
left vehicles in the right lane. In many cases the capacity was not reduced as much as predicted.
Blocking through traffic prevented left traffic from entering and queueing, and vice versa. The
best way to model the interactions of queued traffic with storage bays is with simulation.
The storage blocking is still shown on the time space diagrams, but the queue delay is not
affected.
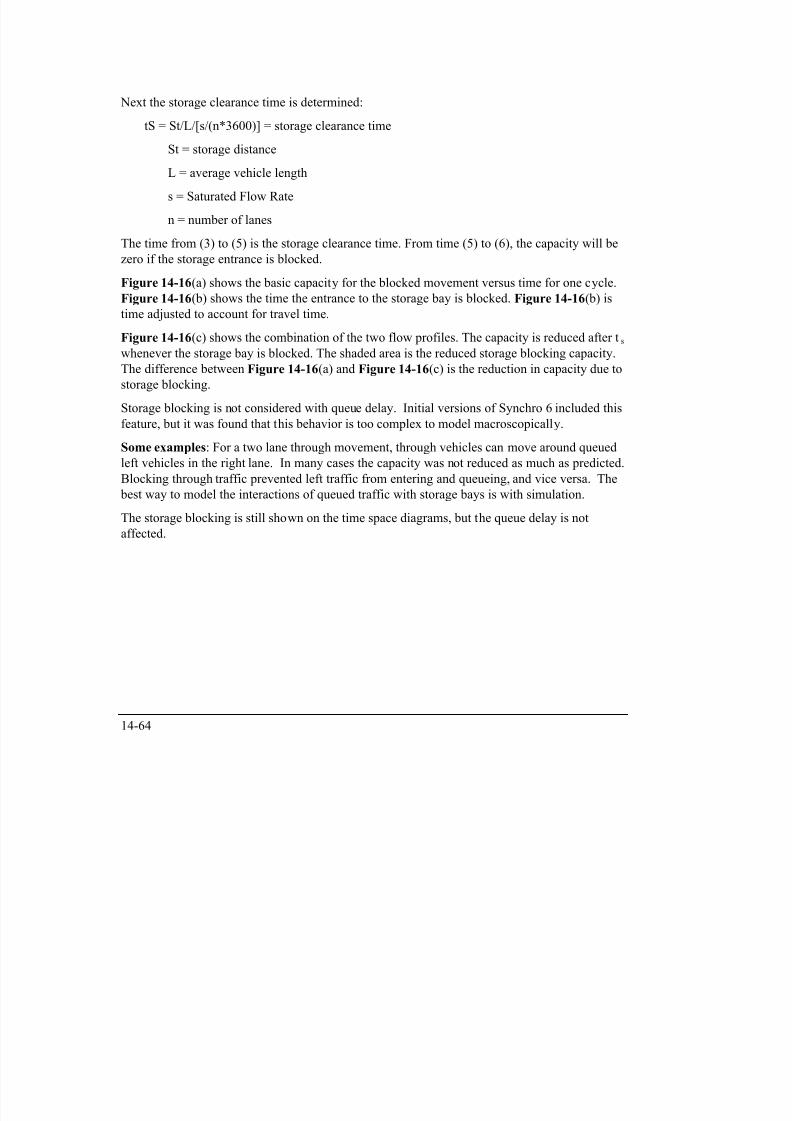
7/21/2019 Synchro Studio 8 User Guide
http://slidepdf.com/reader/full/synchro-studio-8-user-guide 300/559
14-64
Red Green
C a p a c i t y
Queue
clearing
Possible
Starvation
time
0
S
(a)
ts
Red Green S t o r a g e b a y b l o
c k t i m e
0
(b)
Blocked time
top of storage
Red Green
C a p a c i t y
0
S
(c)
ts
Storage blockingreduced capacity

7/21/2019 Synchro Studio 8 User Guide
http://slidepdf.com/reader/full/synchro-studio-8-user-guide 301/559
14-65
Figure 14-16 Storage Blocking Capacity Reduction
Determine Queue Delay
Queue delay is the additional delay associated with the capacity reduction of queue interactions.
It is calculated using the incremental delay formula with and without the capacity reduction.
The purpose is to penalize queue interactions that increase v/c above 1, but not penalize queue
interactions that keep v/c < 1. This delay also penalizes interactions in proportion to the amount
they increase delay by reducing capacity on the critical links.
T c
X I k x xT D
*
***8)1()1(**900 2
2 = Incremental Delay
T = duration of analysis period (hours)
X = v/c = volume to capacity ratio
c = capacity
k = incremental delay factor, 0.50 is used here because these movements are at
capacity
I = upstream filtering, 0.3 is used here, because these movements are metered
qd = queue delay = d2‟ – d2
d2‟ = incremental delay using c – cr instead of c
cr = capacity reduction due to queue interactions = max(crSB, crS)
crSB = capacity reduction due to spillbackcrS = capacity reduction due to starvation.
Here are some examples of how capacity reduction affects queue delay:
v c cr X X' qd
800 1000 100 0.80 0.89 2.3
900 1000 100 0.90 1.00 12.01000 1000 100 1.00 1.11 39.8
500 1000 300 0.50 0.71 1.4
1200 1000 50 1 20 1 26 28 0

7/21/2019 Synchro Studio 8 User Guide
http://slidepdf.com/reader/full/synchro-studio-8-user-guide 302/559
14-66
1200 1000 50 1.20 1.26 28.0
Note that qd is much larger when v/c is pushed over 1. In the 4th example, a 30% reduction in
capacity has minimal affect because excess capacity is available. In the last example, a 5%
reduction in capacity has a large affect because the movement is already over capacity.
The Uniform Delay is not part of the Queue Delay calculation. Synchro already calculates the
affect of coordination (good or bad) on Uniform Delay.
Implications
Queue Interactions can have very negative impacts on traffic flow. In addition to increasing
delays, they also can reduce available capacity and even create safety problems. The calculationof queue interactions is very complex and prior to Synchro 6 was only available through
microscopic simulation.
The queue delay quantifies the impact of queue interactions. Queue delay is used during
optimizations to find offsets, phase sequences and cycle lengths with minimal impact from
queue interactions. Queue Interactions can be seen visually on the time space diagram, and listed
in the Coding Error Check.
The best way to minimize queue interactions is to use good coordination. With short links, all
movements for a given direction need to be green at the same time. Using shorter cycle lengths
can also reduce the impacts.
If Storage Blocking is a problem, there are several options available. The simplest is to use lead-
lag or split phasing. Using longer storage bays, shorter cycle lengths, or better coordination can
also help reduce Storage blocking.
Sometimes bandwidth style timing plans can have bad queue interactions, especially on the linkwhere timing plans alternate. Figure 14-17 shows a bandwidth timing plan for a two way
arterial. Figure 14-18 shows the flow lines for the same timing plan.

7/21/2019 Synchro Studio 8 User Guide
http://slidepdf.com/reader/full/synchro-studio-8-user-guide 303/559
14-67
Figure 14-17 Two-Way Bandwidth

7/21/2019 Synchro Studio 8 User Guide
http://slidepdf.com/reader/full/synchro-studio-8-user-guide 304/559
14-68
Figure 14-18 Flow Line Diagram
Note that on the link between (1) and (2), all traffic is stopped nearly for the entire red period.
Note that these queues are causing spillback SB at (1) and NB at (2). The short block spacing is
also causing starvation SB at (2) and NB at(1). The conclusion is to watch out for queue
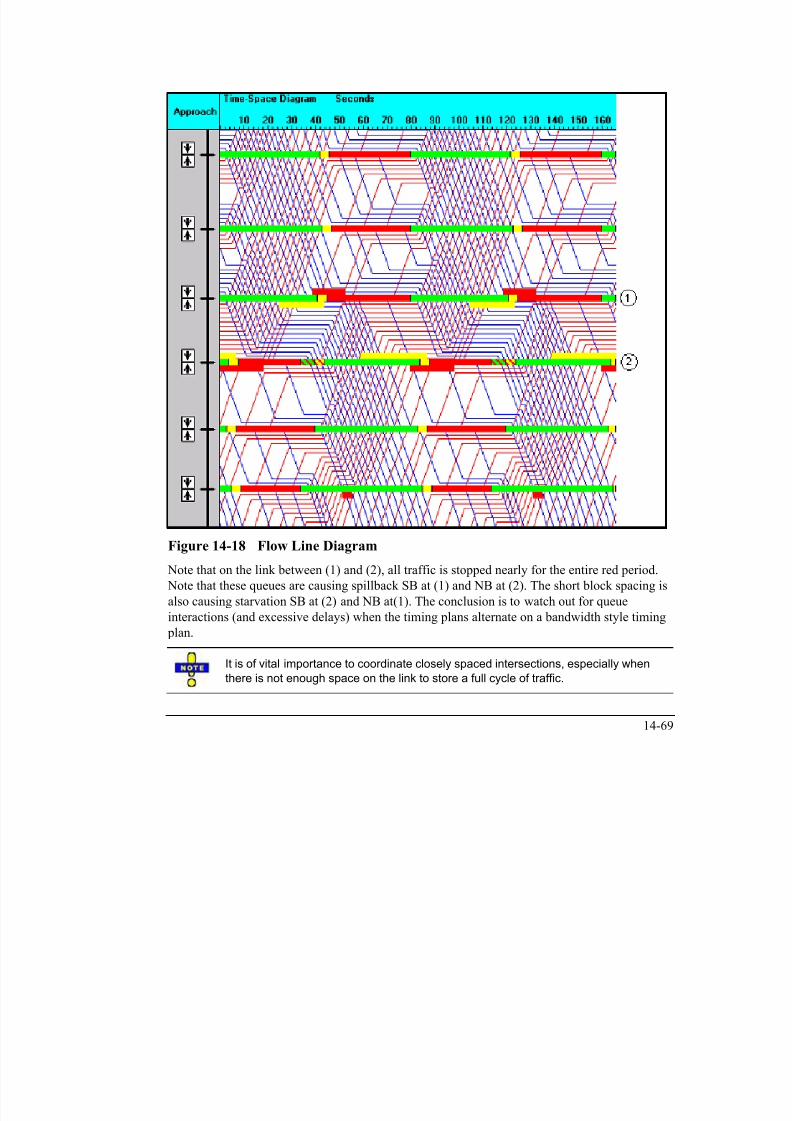
7/21/2019 Synchro Studio 8 User Guide
http://slidepdf.com/reader/full/synchro-studio-8-user-guide 305/559
14-69
also causing starvation SB at (2) and NB at(1). The conclusion is to watch out for queue
interactions (and excessive delays) when the timing plans alternate on a bandwidth style timing
plan.
It is of vital importance to coordinate closely spaced intersections, especially when
there is not enough space on the link to store a full cycle of traffic.
Uncoordinated intersections can cause spillback and starvation. Even when the signals are
controlled by different agencies; it is imperative to use coordination to keep the intersections
operating safely and at full capacity.
Queue Length Calculation
This section explains how queue lengths are calculated.
The queue reports show the 50th percentile and 95th percentile queue. This queue represents
maximum back distance where vehicles stop during a cycle.
The queue lengths shown are the queue for each lane. The total queue length is
divided by the number of lanes and the lane utilization factor.
Figure 14-19 Arrival Departure Graph
Consider the arrival departure diagram in Figure 14-19. The base of the triangle is the effective
red time, R.

7/21/2019 Synchro Studio 8 User Guide
http://slidepdf.com/reader/full/synchro-studio-8-user-guide 306/559
14-70
The slope of the left side is the arrival rate in vehicles per hour, v. In a coordinated system, the
arrival rate may vary across the cycle.
The slope of the right side is the Saturated Flow Rate in vehicles per hour, s.
The height of the triangle is the maximum back of queue in vehicles, Q. Vehicles delayed a
short time will only slow but not stop. For this reason, Synchro does not consider vehicles
delayed by less than 6 seconds to be part of the queue. The Queue is actually the height to the
point where the triangle is 6 seconds wide.
The value Q2 is the number of vehicles arriving on red. After the signal turns green, additional
vehicles may queue up in back while the front of the queue dissipates. Other queuing methods
such as the ITE and SIGNAL 94 queuing methods are based on the lower Q2 value.
Synchro's delay, capacity, and LOS outputs now take into account delays and
reduced capacity from queuing and blocking problems. Details on this can be found
in the topic Queue Interactions. In addition, you could use microscopic simulation,
such as SimTraffic, to determine the affects of queuing on traffic flow.
Calculation of Queues
Based on Figure 14-19, the formula for the queue is.
fLU n
L
v s R
vQ
**
1/
11*)6(*
3600
= Queue Length (ft)
R = Red time (s)
s = Saturation Flow Rate (vph)
v = Arrival Rate (vph)
L = Length of vehicles including space between (ft)
n = Number of Lanes
fLU = Lane Utilization Factor
If the volume to capacity ratio (v/c) exceeds 1, the queue length is theoretically infinite. Synchro
calculates the queue length as the maximum queue after two cycles. This will equal
Q' = (v * (C - 6) + (v - s*g/C)* C / 3600 = Queue Length for Saturated Links (ft)
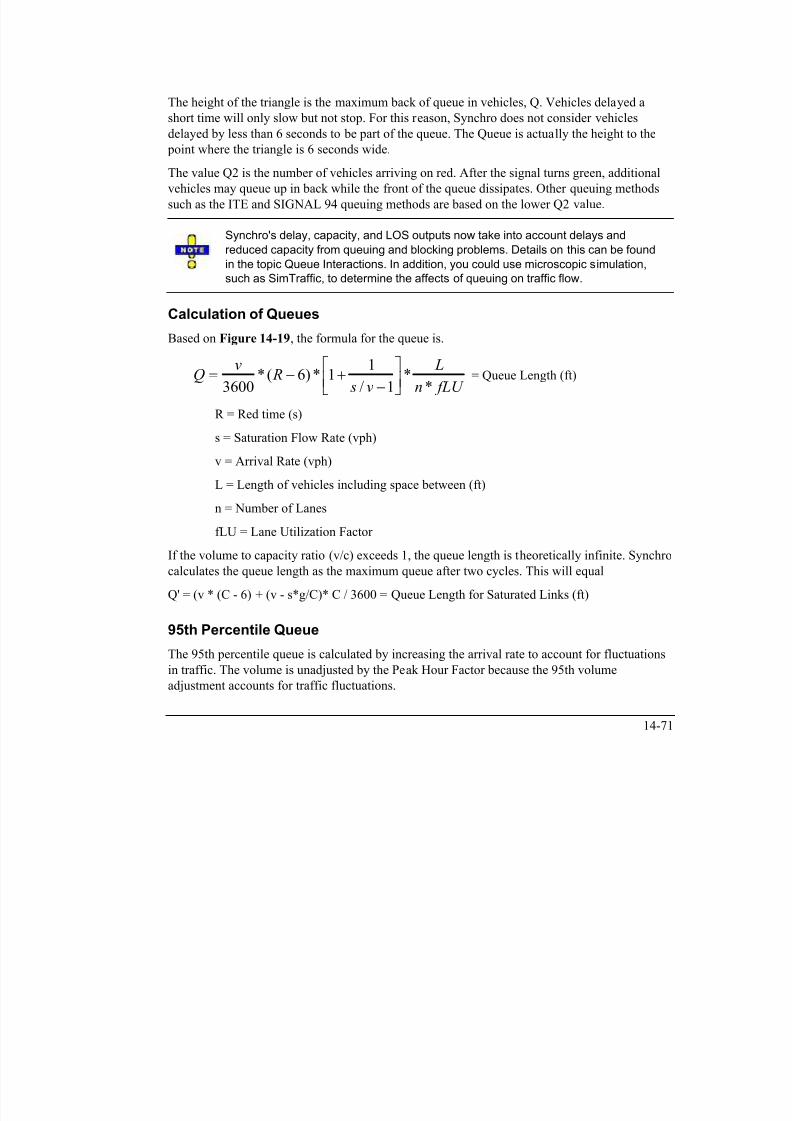
7/21/2019 Synchro Studio 8 User Guide
http://slidepdf.com/reader/full/synchro-studio-8-user-guide 307/559
14-71
95th Percentile Queue
The 95th percentile queue is calculated by increasing the arrival rate to account for fluctuationsin traffic. The volume is unadjusted by the Peak Hour Factor because the 95th volume
adjustment accounts for traffic fluctuations.
vc
vc PHFxvv *64.11**95 = 95
th Percentile Arrival Rate (vph)
vc = Vehicles per cycle = v * C / 3600
PHFx = minimum of PHF or 0.9
If the Analysis Period is set to 30 minutes or greater, PHFx is set to 1.0.
The 95th percentile queue will be calculated using v95 rather than v.
In many cases, the 95th percentile queue will not be experienced due to upstream metering. If the
upstream intersection is at or near capacity, the 50th percentile queue represents the maximum
queue experienced.
Similarly, if the upstream intersection has a v/c ratio over 0.8; the maximum queue is
approximately equal to the 50th percentile queue divided by the upstream v/c ratio. For example,
if the 50th percentile queue is 150ft, and the v/c ratio upstream is 0.90; the maximum possible
queue would therefore be 150 / 0.90 = 167ft.
Queue Length Sample CalculationHere is a complete step-by-step calculation of queue lengths. Note that the formulas presented
here are simplifications of the flow rate integration used internally by Synchro. These formulas
will not work with platooned arrivals or with complex phasing such as permitted plus protected
left turns.
Input Data
Adjusted Volume (v): 351 vph
Saturated Flow Rate (s): 1770 vph
Lanes (n): 1
Cycle Length (C): 90 s
7/21/2019 Synchro Studio 8 User Guide
http://slidepdf.com/reader/full/synchro-studio-8-user-guide 308/559
14-72
Cycle Length (C): 90 s
Effective Green Time (G): 23 s
Average Vehicle Length (L) : 25 ft
Peak Hour Factor : 0.9
Lane Utilization Factor (Fu): 1.0
Solution
Part 1, 50th Percentile Queue
50th percentile queue is average traffic, so no volume adjustment is needed.
First check v/c ratio:
v/c = v / (s * g/C) = 351 / (1770 * 23/90) = 0.78
v/c ratio is less than 1, proceed with normal method.
Q = v / 3600 * (R - 6) * (1 + 1 / (s/v-1) ) * L / (n * Fu) =
= 351 vph / (3600 s/hr) * (90s - 23s - 6s) * (1 + 1 / (1770 vph /351 vph - 1) ) * 25 ft /
(1 * 1.0) = 185 ft
Part 2, 95th Percentile Queue
First convert volume to 95th percentile volume
VC = Vehicles per cycle = v * C / 3600
VC = 351 * 90 / 3600 = 8.8
v95 = v * PHFx * ( 1 + 1.64 * SquareRoot( VC ) / VC ) = 351 * 0.9 * (1 + 1.64 *
SquareRoot(8.8) / 8.8 ) = 491 vph
Next check v/c ratio:
v/c = v / (s * g/C) = 491 / (1770 * 23/90) = 1.08
95th percentile v/c ratio exceeds 1, use alternate queue method.
Queue is unserved vehicles from first cycle, plus all arrivals on second cycle.
Q = [ (v95 - s * g/C) * C / 3600 + v95 * C / 3600 ] * L / n
= [(491 vph - 1770 vph * 23 s / 90 s ) * 90 s / (3600 s/hr) + 491 vph * 90 s / (3600 s/hr)] *
25 ft / 1
[1 0 h 12 2 h] * 25 f / 1

7/21/2019 Synchro Studio 8 User Guide
http://slidepdf.com/reader/full/synchro-studio-8-user-guide 309/559
14-73
= [1.0 veh + 12.2 veh] * 25 ft / 1
= 331 ft
Upstream Metering
The arrival volume for the 95th queue, but not the 50th queue, is adjusted to account for
metering at the upstream intersection.
If the upstream intersection has volume equal to capacity, v/c=1, the 95th queue will equal the
50th queue. If the upstream intersection has v/c=0.95, the volume for the 95th queue will be
limited to 105% of the 50th percentile traffic and the 95th queue will only be about 5% longer
than the 50th queue. The above cases assume no mid-block sources of traffic.
Upstream metering is not performed if the upstream intersection has a incompatible cycle
length, or if either intersection is actuated with different controllers. Upstream metering is not
performed at stop controlled unsignalized intersections, but is performed for signals beyond if
traffic flows freely through the unsignalized intersection.
Upstream metering is used to determine the rate only. The arrival profile is calculated without
metering and may be overly weighted towards metered movements. Metering is not used in the
calculation of arrival profiles and uniform delay calculations.
Synchro's delay, capacity, and LOS outputs now take into account delays and
reduced capacity from queuing and due to upstream metering, The 95th queue may
be less than the 50th Percentile queue. If the upstream intersection is operating with
v/c>1, the metered arrival rate will be less than the volume for this intersection.
Since metering is only performed with the 95th queue, this causes the 95th queue tobe less than the 50th queue. This situation may indicate a coding problem. Be sure
that the Midblock traffic is coded correctly and that the signal timing and volumes for
both intersections are set correctly. This reduced 95th queue does represent a valid
queue because vehicles will not be able to clear the upstream intersection to queue
at this intersection.
Example Calculation
Adjusted Volume: 1000 vph
PHFx = 0.90
C = 90s

7/21/2019 Synchro Studio 8 User Guide
http://slidepdf.com/reader/full/synchro-studio-8-user-guide 310/559
14-74
Volume from Midblock: 100 vph or 10%
Volume from upstream through: 700 vph or 70%Upstream Through v/c: 0.95
Volume from upstream left: 200 vph or 20%
Upstream Left v/c: 0.8
VC = Vehicles per cycle = v * C / 3600
VC = 1000 * 90 / 3600 = 25
v95 unmetered = v * PHFx * ( 1 + 1.64 * SquareRoot( VC ) / VC ) = 1000 * 0.9 * (1 + 1.64 *
SquareRoot(25) / 25 )
= 1195 vph
v95 metered = v * sum(PropI * min(1/(vi/ci), v95/v)
= 1000 * [0.1 * 1195/1000 + 0.70 * min(1/0.95, 1195/1000) + 0.2 * min(1/0.80,
1195/1000)]
= 1095 vph
In this example traffic from upstream through is not able to increase by more than 5% due to the
high v/c ratio. Traffic from midblock and from upstream left is able to fluctuate. The resulting
metered v95 is less than the unmetered v95 but is more than the 5% increase allowed from
upstream through.
Stop Calculations

7/21/2019 Synchro Studio 8 User Guide
http://slidepdf.com/reader/full/synchro-studio-8-user-guide 311/559
14-75
Figure 14-20 Arrival Departure Graph
Stops are calculated similarly to the calculation of delays. Consider the arrival departure graph
above. The total number of vehicles being delayed is equal to the number of vehicles queued or
Q in the diagram above. However, vehicles being delayed for less than 10 seconds do not make
a full stop. Synchro calculates the number of stopped vehicles by counting the number of
delayed vehicles for each delay time and adjusting these vehicles by the following table.
Table 14-10 Stop AdjustmentVehicle Delay(s) Percent of Stop
0 0%
1 20%
2 58%
3 67%
4 77%5 84%
6 91%
7 94%
8 97%
9 99%
This table is taken from the TRANSYT 7-F Users Manual and is the same adjustment made for
partial stops used by TRANSYT.
These stops are calculated for each percentile scenario and averaged for cycle failures and over
capacity vehicles. The stop calculations model 100 cycles similar to the delay calculations, to
calculate stops for congestion.
Fuel and Emissions Calculation
At the time of publication, Trafficware was investigating new fuel and emission
models. These models were not available for publication in the User Guide. Check
the on-line (Help
Contents) on this topic for the most up to date information.

7/21/2019 Synchro Studio 8 User Guide
http://slidepdf.com/reader/full/synchro-studio-8-user-guide 312/559
14-76
Fuel Consumption is calculated using the following formulas:
F = TotalTravel * k1 + TotalDelay * k2 + Stops * k3
k1 = .075283 - .0015892 * Speed + .000015066 * Speed ^ 2
k2 = .7329
k3 = .0000061411 * speed ^ 2
F = fuel consumed in gallons
Speed = cruise speed in mph.
TotalTravel = vehicle miles traveled
TotalDelay = total signal delay in hours
Stops = total stops in vehicles per hour
For metric users, the values are converted.
These are the same as the default formulas for fuel consumption used by TRANSYT 7-F.It may be useful to create this report with a before and after scenario to access the amount of
improvement gained by adding coordination.
Emissions Calculations
The emissions calculations are based only on fuel consumption. The somewhat simplified
calculation multiplies fuel consumption by the following factors to determine emission rates.
CO = F * 69.9 g/gal = Carbon Monoxide Emissions (g)
NOx = F * 13.6 g/gal = Nitrogen Oxides Emissions (g)
VOC = F * 16.2 g / gal = Volatile Oxygen Compounds Emissions (g)
F = Fuel Consumption (gal)
These simplified rates are based on an unpublished letter to the Federal Highway Administrationfrom Oak Ridge National Labs.
Unserved Vehicles CalculationTh U d V hi l l l i i i l h l i h i Th i i h

7/21/2019 Synchro Studio 8 User Guide
http://slidepdf.com/reader/full/synchro-studio-8-user-guide 313/559
14-77
The Unserved Vehicles calculation is simply the volume minus the capacity. The capacity is the
Saturated Flow Rates multiplied by the effective green time. For an actuated signal, the capacity
will be based on an average of the actuated green times from the five percentile scenarios.
u = v - c = Unserved Vehicles per hour
v = Adjusted Lane Group Volume
c = Actuated Capacity
The unserved vehicles are shown in the MOE reports and the Optimize Cycle Length table to
quickly show where and by how much capacity is exceeded.
When optimizing, it is desirable to minimize and keep at zero the number of Unserved Vehicles.
In some cases, it may be acceptable to accept some unserved vehicles. Many times a long cyclelength exceeding 100 seconds will be recommended to accommodate an extra 10% capacity.
Long cycle lengths can have negative operation aspects including long queues, inefficient use of
turning lanes, and blocking. Lower cycle lengths may be better because the reduced queues will
generally increase capacity and provide smoother operation.
If alternate routes exist, some unserved vehicles are acceptable because drivers will select
alternate routes when faced with congestion.
Dilemma Zone Vehicles and Safety
Discussion
Traditionally traffic engineers have used MOEs such as delays, stops, and bandwidth when
timing signals in order to move vehicles as efficiently as possible. However today many
engineers are being called on to implement traffic calming and improve safety. The traditional
MOEs do not provide a measure of safety, so new MOEs are needed. The Dilemma Zone MOE
is a new measurement that considers safety.
The Dilemma Zone Vehicles measures the number of vehicles arriving while the signal is
turning yellow. Vehicles in the Dilemma Zone are more likely to have accidents because they
must either:
Stop quickly and risk being hit from behind.
Continue through the intersection after the signal turns red and risk a pedestrian or
right angle accident.
Regular users of a coordinated system are likely to know that the signal will change
and thus exceed the speed limit to avoid the upcoming yellow signal. Sometimes
d ill i d t i i ht f d hibit th d b h i i
7/21/2019 Synchro Studio 8 User Guide
http://slidepdf.com/reader/full/synchro-studio-8-user-guide 314/559
14-78
speeders will ignore pedestrian right-of-way and exhibit other dangerous behaviors in
order to keep up with the coordination platoon.
It is therefore desired to have timing plans with minimal numbers of vehicles in the dilemma
zone. A timing plan that delays the platoon by 5 or 10 seconds will be safer than a timing plan
that "cuts off" the last 5 or 10 seconds of the platoon.
The original design goal of Synchro was to encourage the use of lead-lag phasing to improve
coordination. Many engineers are hesitant to use lead-lag phasing because they perceive it to be
a safety problem due to driver confusion and false starts. It is hoped that the Dilemma Vehicles
MOE can show that lead-lag phasing is actually safer in many cases because fewer vehicles arein the Dilemma Zone. Vehicles in the Dilemma Zone are a much bigger safety issue because
they are moving at full speed while false starts are starting from a stop.
Many times agencies have money available for safety improvements but not for signal
coordination. The Dilemma Zone MOE can be used to show that coordination is a safety
improvement and qualify signal timing for additional sources of funding.
Only lane groups with a speed 35mi/h ( 55 km/hr) are counted as dilemma
vehicles. Turning groups with turning speed less than 35 (55) are not counted as
dilemma.
Calculation
The dilemma zone is a summation of the vehicles expected in the dilemma zone. The zone starts
atDS = RS - L2 - 2 = Dilemma Start Time
DE = RS - L2 + 3 = Dilemma End Time
RS = Red start time (end of yellow)
L2 = Clearance Lost Time (Total Lost time less 2.5 s)
As an example:
Y+AR = Clearance Time = 4 s
tL = Total Lost time = 4 s
L2 = tL - 2.5 = 1.5 s
DS = RS 1 5 2 = RS 3 5

7/21/2019 Synchro Studio 8 User Guide
http://slidepdf.com/reader/full/synchro-studio-8-user-guide 315/559
14-79
DS = RS - 1.5 - 2 = RS - 3.5
DE = RE - 1.5 + 3 = RS + 1.5
In this example the dilemma time starts 3.5 seconds before the end of red or 0.5 seconds after
the start of yellow; and the dilemma time ends 1.5 seconds after the beginning of red.
For an uncoordinated phase, the Dilemma Vehicles will equal to:
dv = 5 * v / C = Dilemma Vehicles for uncoordinated movements
v = Adjusted volume
C = Cycle Length
For actuated signals, the dilemma zone vehicles may be reduced for phases that gap-out. If the
gap times and detectors locations are set up so that gap-out occurs when no vehicles are
expected to be in the dilemma zone.
If the phase gaps out for a given percentile scenario, the arrival profile will remove vehicles in
the "gap-out shadow".
Figure 14-21 Dilemma Zone Gap-out Shadow
To reduce vehicles in the dilemma zone, use a long distance from the leading detector. Using a

7/21/2019 Synchro Studio 8 User Guide
http://slidepdf.com/reader/full/synchro-studio-8-user-guide 316/559
14-80
gap time longer than the time between detectors will not remove vehicles from the dilemma
zone. Using a long gap time, without leading detectors will not remove vehicles from the
dilemma zone, because the signal will not detect late arriving vehicles until after the signal turns
yellow. If the phase has max recall, or maxes out; there will be no dilemma reduction for the
gap-out shadow.
Synchro does not consider Dilemma Vehicles when optimizing offsets. There is a loose
relationship between delay and Dilemma Vehicles, so Synchro optimized timing plans should be
safer than bandwidth style timing plans in most cases.

7/21/2019 Synchro Studio 8 User Guide
http://slidepdf.com/reader/full/synchro-studio-8-user-guide 317/559
14-81

7/21/2019 Synchro Studio 8 User Guide
http://slidepdf.com/reader/full/synchro-studio-8-user-guide 318/559
Chapter 15 – File and Project Management
File and Project Management OverviewSynchro has a variety of tools for use in file and project management. This includes the ability to
merge two files into one larger file and saving parts of larger files into a smaller file. In addition,
this chapter will discuss the Scenario Manager, transferring and using Synchro with other
software, and the purpose for the files that are created and used by Synchro and SimTraffic.
Save AsUse the File Save As command to save a file with a new name or to save a Synchro 7/8 file
to a version 6 or comma separated (CSV) format. The CSV format can be used with Synchro‟s
UTDF format (see page 17-1). When you peform a Save-As, the Scenario Manager dialog willappear.
Merge FilesUse the File Merge or the Transfer Data Access Merge Data command to combine
or merge two files (both commands get to the same place).
The Merge command can combine some data, such as volumes, from one file with other data,
such as lane geometry and timings, from another file.
File Merge works with data files in the CSV format (Combined, Lanes, Phasings). File Merge
will not add links or nodes, nor change geometry.
To Merge files, perform the following:
1. Open the file to be overwritten. If some intersections exist in both files, start with thefile that will be overwritten.
2. Select the File Merge command.
3. Locate and select the filename of the second file to merge (Synchro 6, 7 or CSV
formats).
7/21/2019 Synchro Studio 8 User Guide
http://slidepdf.com/reader/full/synchro-studio-8-user-guide 319/559
15-1
4. Select [Open].
5. The MERGE OPTIONS settings will appear (Synchro file only). Select options and
press [OK ].
Figure 15-1 MERGE OPTIONS Settings
The MERGE OPTIONS settings control how to combine data from intersections that exist in
both files.
Merge Options only appears for Synchro files. Data files are always merge by ID. To merge
selective data from a data file, edit the data file in Excel or Word and remove the sections you
don‟t want to merge,
Selecting Merge/Add Intersections by Location will cause intersections from the merged file
to be merged if they are at the same location as intersections in the overlaid file. Other
intersections in the merged file will be added to the merged file. Select this option when both
files have the same coordinate system and when combining different intersections.Selecting Merge Intersections by ID# will cause intersections from the merged file to be
merged when their node numbers match a node number in the overlaid file. Intersections in the
merged file without matching ID numbers will be ignored. Select this option to combine data
from files with different coordinate systems or when transferring partial intersection data
between two files.

7/21/2019 Synchro Studio 8 User Guide
http://slidepdf.com/reader/full/synchro-studio-8-user-guide 320/559
15-2
Select Merge Lane Geometry, Merge Volume Data, and Merge Timing Data to control how
intersections are merged. When the box is checked, the data is taken from the merged file;
otherwise, the data in the overlaid file is preserved. Lane Geometry includes all the data in the
LANE settings. Volume Data include all the data in the VOLUME settings. Timing data
includes all the data in the TIMING and PHASING settings.
The Update Scenario option can be used to combine the Scenario Manager information
between the two files. The Date and Time information will be taken from the merged file if the
Merge Volume option is selected. The Alternative will be taken from the merged file if the
Merge Lane Geometry option is selected. The Timing Plan ID will be taken from the merged
file if the Merge Timing option is selected.
Merge a Small File into a Bigger File
Open the large file first. Select File Merge and choose the smaller file. Check all of the merge
options on, and merge by ID.
The data from the smaller file will be merged into the larger file. Only the data from matching
IDs will be merged in. Non-matching IDs will be ignored.
Merge Two Files from Separate Areas
Open one file first. Use the Transform-Map button if necessary to adjust coordinates. Select
File
Merge and choose the other file. Check all of the merge options on, and merge by
location. This must be performed with two Synchro files, not CSV data files.
The two files will now be merged into one file. Links between the two separate areas may need
to be created to connect to them.
Change Coordinates of a File
This option allows you to correct the coordinates of a file to a file with correct coordinates.
Open the file with correct coordinates first. Select File Merge and choose the Synchro or data
file with incorrect coordinates. Check all of the merge options on, and merge by ID. Use the
File Save As to save the file with a new name.
Save Part of a FileThe File Save Part command can be used to split a file into sections or to save a part of a file

7/21/2019 Synchro Studio 8 User Guide
http://slidepdf.com/reader/full/synchro-studio-8-user-guide 321/559
15-3
The File Save Part command can be used to split a file into sections or to save a part of a file
into a separate file.
To use this command:
1. Select one or more intersections to include. See Selecting Multiple intersections, page
4-2, for more information.
2. Select the File Save Part command. Enter a filename for the new section. If you
choose an existing filename, its data will be overwritten.
Team Management
The File
Save Part command can be useful for allowing multiple people to work on the same
file. Parts of a large network can be saved as separate files (see Save Part of File above). Each
team person can work on each piece of the network. The pieces can be combined later using the
File
Merge command.
Scenario ManagerThe Scenario Manager (Options Scenario Manager) allows detailed descriptions of the
network to be recorded. These descriptions can appear on the top and bottom of report pages and
are also used in conjunction with data management. The Scenario Manager will also open each
time you use the Save-As command. This will ensure that the information is updated for a new
file.
Figure 15-2 SCENARIO MANAGER
In a typical traffic study, it is common to create multiple scenarios of the same network. It is
possible to have two or more current traffic counts Each of these counts may be scaled into 10

7/21/2019 Synchro Studio 8 User Guide
http://slidepdf.com/reader/full/synchro-studio-8-user-guide 322/559
15-4
possible to have two or more current traffic counts. Each of these counts may be scaled into 10
and 20 year projected traffic volumes. There may also be multiple time-of-day timing plans and
alternate lane geometry for different alternatives. With a large project, it can be difficult to track
all of the scenarios. The scenario manager provides a convenient method to track each alternate.
When working with multiple scenarios, it is suggested that each scenario have its own file.
Selected data can be transferred between files using the Merge File feature and the database
access feature. The Merge File can help to keep the Scenario information synchronized.
Data from multiple timing plans and volume counts can be stored in data files with the Data
Access feature (refer to Chapter 1). The Scenario Manager works with the Data Access to track
the Data date and time as well as the Timing Plan IDs.
The Description should be used to describe the location of the network. The description might
include the city name and the section of the city for a large city. Normally the description will be
the same for all time periods and alternates.
The Data Date and Data Time are the date and time of the data collection. For a future
projection they are the date and time of the traffic projection. If performing an AM and PM peak
study, the Time could be set to 7:00 AM and 5:00 PM for each scenario to indicate which time is
analyzed. The Analysis Date is the date the data was collected, not the date the study is performed.
The Data Date and Time track the volume data. The Data Date and Time should be updated
when reading and writing Volume data with the UTDF feature (see page 17-1). When Merging
data with Merge Volume data and Update Scenario selected, the Data Date and Time will be
taken from the merged file.
The Alternative is used to describe the alternative being studied. This could describe "Before
Improvements" and "After Improvements" or could be used for "Baseline Traffic" or "Traffic
with Mondo Mall".
The Alternative tracks the lane and geometry data. When Merging data with Merge Lane
Geometry and Update Scenario selected, the Alternative will be taken from the merged file.
The Timing Plan ID is the name of the timing plan used. The timing plan ID might be AMPeak
and PMPeak to indicate which time-of-day plan is used. The Timing Plan ID tracks the lane and
geometry data. The Timing Plan ID is used and updated when reading and writing Timing datawith the Data Access feature. When Merging data with Merge Timing Data and Update
Scenario selected, the Timing Plan ID will be taken from the merged file.
The Analyst is the name of the person or company performing the traffic analysis.

7/21/2019 Synchro Studio 8 User Guide
http://slidepdf.com/reader/full/synchro-studio-8-user-guide 323/559
15-5
Using Synchro with HCS, SimTraffic and CORSIMSynchro can build input files for CORSIM and the Highway Capacity Software (HCS). Enter
data once with Synchro, and then perform optimizations using Synchro. The timing plans can be
simulated using SimTraffic or CORSIM for analysis that is more detailed. You can also use the
reports generated by the HCS (version 3.1), SimTraffic and CORSIM (version 5).
The following table lists the features of each program and suggests how the programs can be
used to complement each other.
Table 15-1 Features of the Major Traffic Models
Program Primary Strengths
Synchro Easy Data Entry
Complete, Flexible Optimizations
Graphical Reports and Time-Space Diagrams
HCS HCM Capacity Analysis
Official HCS Reports
SimTraffic Microscopic Simulation
Animation
Simulate Roundabouts
CORSIM Microscopic Simulation
Animation
See the topics on CORSIM Analysis in Chapter 18 for more information on how to use Synchro
with this program. For instructions on how to use CORSIM (or for background information on
this programs), please refer to the respective manuals.
Save to HCSUse the command Transfer Save-to-HCS to create input files for the Highway Capacity
Software, Signal and Unsignalized modules.
1. Select one or more intersections. Multiple intersections can be selected by dragging a

7/21/2019 Synchro Studio 8 User Guide
http://slidepdf.com/reader/full/synchro-studio-8-user-guide 324/559
15-6
p y gg g
box around them.
2. Choose Transfer Save-to-HCS.
3. Select a filename to save the files as. The default filename is "filename #.hcs" where
filename is the Synchro filename and # is the node number.
The green times transferred to the HCS are Actuated green times. The actuated green times are
calculated by Synchro by averaging the Green times used by the five percentile scenarios. The
Actuated Effective Green times shown in the TIMING settings are the same Actuated timings
after adjusting for clearance and total lost time.
Synchro calculates delay based on actuated green times, not the maximum green
times. Files exported to the HCS will have the actuated green times not the
maximum green times. Entering maximum green times in Synchro to match HCS
green times will not give the same answer for actuated signals because Synchro will
calculate the actuated green times internally. In addition, if the Analysis Period is set
to 30 minutes or greater, the PHF transferred will be 1.0.
RTOR Volume Reduction
Synchro will export a RTOR reduction for the HCS export. The RTOR reduction is calculated as
follows:
vRTOR = minimum (sRTOR,v) * r/C
vRTOR = RTOR reduction to volume
sRTOR = RTOR saturation flow as calculated by Synchro
r = effective red time
v = adjusted lane group volume (before RTOR reduction)
C = cycle length
Percent Turns Using Shared LanesSynchro calculates the percentage of traffic in a shared lane when there is both an exclusive and
turning lane and transfers this information to the HCS file. The exclusive lane is in the turning
group, and the shared lane is in the through group. Details on how Synchro balances traffic in a
shared lane can be found in the topic Traffic in Shared Lane on page 6-13.

7/21/2019 Synchro Studio 8 User Guide
http://slidepdf.com/reader/full/synchro-studio-8-user-guide 325/559
15-7
HCS Release Notes
Synchro saves to the HCS2000 version 4.1c file format. This format will be read by HCS 2000
with some limitations.
Signals
Average Queue Spacing is not supported and must be input manually.
Available Queue Storage Length is not supported and must be input manually.
Receiving Lanes, Travel Distance, Cross walk width is not supported and must be input
manually for minimum green calculation.
Unsignalized, two way
Upstream Signals: There have been some recent changes to the method. Be sure you are usingthe latest release of the HCS.
Right turn channelized is not supported and must be input manually.
Roundabouts
HCS roundabout export not currently supported.
File ExtensionsThe following are the file extensions used by Synchro and SimTraffic:
Filename.SY6 Synchro data, version 4 and 5
Filename.ST6 SimTraffic configuration data v 4 and 5
Filename.SY7 Synchro data, version 6
Filename.ST7 SimTraffic configuration data version 6
Filename.SYN Synchro data, version 7/8
Filename.SIM SimTraffic configuration data version 7/8
i ffi hi fil ll i

7/21/2019 Synchro Studio 8 User Guide
http://slidepdf.com/reader/full/synchro-studio-8-user-guide 326/559
15-8
Filename.HST SimTraffic history file, all versions
Filename.S3D SimTraffic history files for 3D graphics, all versions
Version 7/8 will save to v7 format (syn) or v6 format (sy7).
When saving to version 6, data for all new features are lost, including map backgrounds,
detector information, detector templates, and new simulation parameters.
Version 7/8 will read sy6, sy7, and syn (versions 4, 5, 6, 7) files.
If you open an older version Synchro file with version 7/8 and simulate the old HST file will be
overwritten.The S3D file can be viewed with 3D Viewer. Refer to Chapter 26 for details on operation.
Synchro 7/8 can create a comma delimited (csv) file format. Refer to Chapter 1 for details.

7/21/2019 Synchro Studio 8 User Guide
http://slidepdf.com/reader/full/synchro-studio-8-user-guide 327/559
15-9

7/21/2019 Synchro Studio 8 User Guide
http://slidepdf.com/reader/full/synchro-studio-8-user-guide 328/559
Chapter 16 – Reports and Printing
Printing Views
To print the current Synchro view, type [Ctrl] + [P]. This will print the currently active MAP
view, or the TIME-SPACE DIAGRAM to the default printer. When you select the
File Print-Window command from the VOLUME, LANE, TIMING, SIGNING, PHASING, DETECTORS or SIMULATION OPTIONS settings, a report is created
containing information for those settings.
Printing the MAP and TIME-SPACE DIAGRAM (File Print-Window command) has an
options settings dialog. The user can set up headers and footers and select the font. The scale is
also adjustable and there are a number of options including fixed scale or print to fit.
Figure 16-1 PRINT Window Settings
When printing the MAP view with fixed scale, it will use the scale specified by Zoom-Scale.
The printout will be centered on the center point of the current MAP view.
To change the current printer, select the File Printer-Setup command.
Print Window Preview
A new button Preview button has been added to the Print Window dialog (File Print

7/21/2019 Synchro Studio 8 User Guide
http://slidepdf.com/reader/full/synchro-studio-8-user-guide 329/559
16-1
A new button Preview button has been added to the Print Window dialog (File Print-
Preview) in Synchro (including printing map and Time-Space diagram) and SimTraffic. By
pressing the Preview button, you can preview the print output before printing it. In the preview
window you can zoom the image, start printing or return back to the printing settings.
Select Reports Dialog
When choosing the File
Create-Report command, the SELECT REPORTS dialog appears
(Figure 16-2). From here, you can select the reports to include and the options for each report.
Figure 16-2 SELECT REPORTS Dialog
Select Reports
There are twenty-four (24) reports available. Many of these reports have additional options to
select in the right panel. A brief summary of each report follows. Detailed information isavailable for some of the reports below. The undocumented reports contain the same
information available in the data entry setting chapters 2 through 13.
There are seven (7) Intersection Reports. These reports provide information about individual
intersections. Refer to Intersection Reports on page 16-6 for details.
The ICU Report gives the Intersection Capacity Utilization report. Details can be found on

7/21/2019 Synchro Studio 8 User Guide
http://slidepdf.com/reader/full/synchro-studio-8-user-guide 330/559
16-2
page 16-11.
The HCM 2000 Signals and HCM 2000 Unsignalized Reports will give HCM style reports
based on the year 2000 HCM. These reports are described on page 16-16 and page 16-19,
respectively.
The HCM 2010 Signals and HCM 2010 Roundabouts provide reports that are based on the
year 2010 update to the HCM. The outputs and inputs are described in Chapter 11 and in the
year 2010 Highway Capacity Manual.
Arterial Level of Service is an arterial travel time report. This report is very similar to the
HCM 2000 Chapter 15 reports for Arterials.
The Network Measures of Effectiveness reports show the performance of intersections,
arterials and the entire zone or network. These reports can be customized with the panel on the
right.
The Multi-file Comparison Reports list Measures of Effectiveness (MOEs) from multiple files
side by side so that various alternatives can be compared. To use these reports it is necessary tohave multiple versions of the same network stored as different files.
The Phases: Timings Report contains all of the timing information sorted by phase number.
This report is useful for programming controllers.
The Actuated Green Bars Report shows the range of actuated green times for each phase in an
actuated signal. The Actuated Greens and Starts Report also shows the start times and is
useful for actuated-coordinated signals. The Actuated Details Report shows the green times aswell as the time to clear the queue and the time to gap out. The Details report is useful for
examining actuated signal behavior in detail.
The Permitted Left Turn Factors Report contains detailed information about the calculation
of Flt. This report is used for capacity analysis.
The Coordinatability Factors Report displays information about the calculation of CFs for
each pair of adjacent intersections. The CF is a measure of the need to coordinate a pair of
adjacent intersections.

7/21/2019 Synchro Studio 8 User Guide
http://slidepdf.com/reader/full/synchro-studio-8-user-guide 331/559
16-3
Header and Footer Options
In the Select Reports Windown, press the [Header] button to set the header, footer, report, and
page numbering options.
The report header and footer can have two lines each with information on the right and left
sides. The eight input boxes control which information appears in each line and each side. The
header and footer include macros to display dynamic information, these macros are as follows.
Table 16-1 Header/Footer Options
Macro Description Notes
%report_title% Title of Report Name of the report type being printed
%report_title2% Title of Report2 Secondary name of report, if applicable
%short_filename% Short Title Name of the report without the path
%filename% Filename Filename and path of file analyzed or
"Multiple"
%page% Page Number Starting page number can be changed
%date% Current Date Date report was created, not analysis
date
%description% Description Set in Options
Scenario Manager ,
location of analysis%alternative% Alternative Set in Options Scenario Manager ,
alternative being analyzed
%analyst% Name of Analyst Set in Options
Scenario Manager ,
person or firm performing study
%data_date% Date of Data Set in Options
Scenario Manager ,
date of volume counts or projection
%data_time% Time of Data Set in Options
Scenario Manager time
of volume counts or projection
%planid% Timing Plan ID Set in Options
Scenario Manager ,
name of timing plan
Part of the program key code prints under the footer. The key code identifies the name to which
7/21/2019 Synchro Studio 8 User Guide
http://slidepdf.com/reader/full/synchro-studio-8-user-guide 332/559
16-4
Synchro is registered. The key code will not appear if the analyst is shown and the registeredname appears within the analyst field of the Scenario Manager.
Graphic Options
Press the [Graphics] button to set the line colors, fonts and picture options.
Shade Rows, Horizontal Lines, Section Color, and Back Color control the look of the printed
report.
The Font buttons allow for editing of the fonts used in the reports. The default font is Arial
Narrow 10 for data and Arial 12 for titles. The narrow font of the data is better for separation of
the twelve data columns.
Set Pictures to Color for color pictures, B/W for pictures to print on a black and white printer,
or None to exclude the picture from the report.
Defaults
Press the [Defaults] button to change the settings back to the user defaults. Refer to page 2-33for additional details.
Scope
At the bottom of the Select Reports window, the Scope determines which intersections are
included in the report.
Choose Single Intersection and select an intersection to create reports for a single intersection.Choose Zone and enter a zone to create reports for a group of intersections. To select multiple
zones, separate the zones with a comma (i.e., “A, B, C” to print reports for zone A, B and C).
Choose Entire Network to report the entire network.
Viewing and Printing Reports
After selecting the desired report options, select [Preview] to view the report, or [Print] to print
the report.
Viewing Reports
Select [Preview] from the Report Options settings to view reports. To change pages use the
buttons [|<], [<<], [>>], and [>|]. You can also change pages using the [Page Up], [Page Down],
7/21/2019 Synchro Studio 8 User Guide
http://slidepdf.com/reader/full/synchro-studio-8-user-guide 333/559
16-5
mouse scroll wheel, [Home], and [End] keys. To move around the current page, click on it and
drag with the mouse. You can also move the page with the arrow keys. To return to the
SELECT REPORTS settings, use the [Back] button.
Zoom in the Report Preview
A Zoom control has been added to the Report Preview window to preview the report in a bigger
or smaller scale.
Figure 16-3 Report Preview Zoom Control
Printing Reports
To print the report, select the [Print] button from the Report Options or REPORT PREVIEW
settings. To change the printer, select File Print-Setup command or the [Print Setup] button.
Intersection Reports
There are seven (7) Intersection Reports (“A” in Figure 16-4). These reports provide
information about individual intersections. Each of these reports can be customized with the
Options panel on the right side of the SELECT REPORTS settings (“B” in Figure 16-4). The
Lanes, Volumes, Timings, Phasing and Simulation Options Reports contain the same
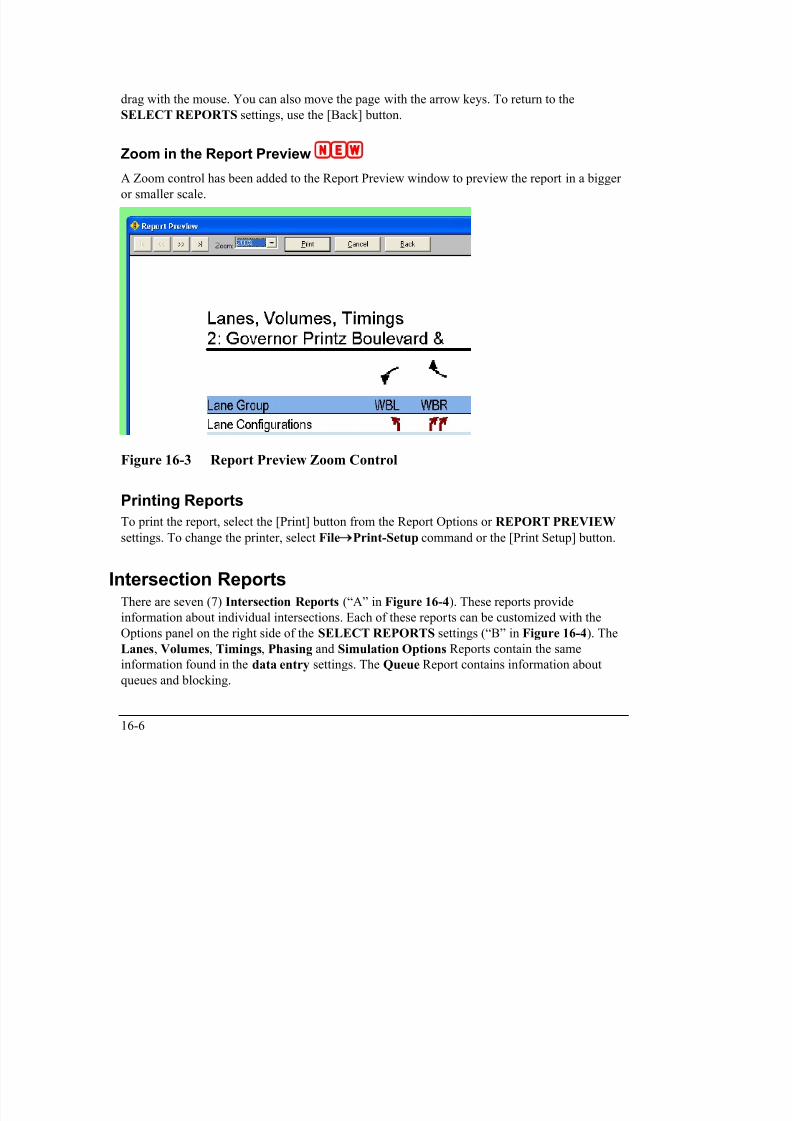
7/21/2019 Synchro Studio 8 User Guide
http://slidepdf.com/reader/full/synchro-studio-8-user-guide 334/559
16-6
information found in the data entry settings. The Queue Report contains information aboutqueues and blocking.
B
A
Figure 16-4 Intersection Reports
Intersection Report Options
When an Intersection Report is selected in the left panel (“A” in Figure 16-4), its options are
included in the right panel (“B” in Figure 16-4). It is possible to select any or all options for
each report. In some cases the same data appears in more than one option; the report generator
will only include this data once in a logical order.
Intersection reports have an option to skip unused rows. With this feature, rows for items such
as pedestrians, busses, growth factor, will not be included if they contain default or blank data.
This can be used to shorten the report if desired.
Lane Inputs, Lane Outputs, Volume Outputs, Simulation Settings, Detector Settings,
Timing Inputs, Actuated Inputs and Actuated Green Times mirror the data contained in the
input settings.The reports with the Lane Inputs option will include link speed and distance, plus travel time.
Level of Service Info contains a summary of information needed in a capacity analysis report
for the control delay calculation. v/c Ratios contain the output information in the TIMING
settings for each delay type.
The delay measures include the Control Delay, the Queue Delay and the Total Delay. The
C l D l i if d l l h i f di i d i l d l Q

7/21/2019 Synchro Studio 8 User Guide
http://slidepdf.com/reader/full/synchro-studio-8-user-guide 335/559
16-7
Control Delay is uniform delay plus the impacts of coordination and incremental delays. Queue
Delays are the additional delay caused by reduction in capacity due to spillback and starvation.Total Delay is the combination of the Control Delay and the Queue Delay.
Stops, Fuel, Emissions contain these MOEs in the report. The Queues option includes
information about maximum queue lengths and blocking times in the reports.
Most of the information contained in Intersection Reports mirrors the data shown on input
screens. Some notes about special cases are listed below.
The Stops, Fuel Consumption, and Emissions are calculated based on the methods shown in
the topic on Fuel and Emissions Calculation (see page 14-76).
Footnotes
There are number of footnotes possible on intersection reports. Below are the definitions of the
possible footnotes:
* User Entered Value: Indicates that the calculated value was changed with a user entered
value. This applies to adjusted volumes, lane utilization factors, Saturated Flow Rates,
turning factors, and delay factors.
~ Volume exceeds capacity, queue is theoretically infinite: This is used with Intersection
Queue Reports, see page 16-9.
# 95th percentile volume exceeds capacity: This is used with Intersection Queue Reports,
see page 16-9.
m Upstream metering is in effect: This is used with Intersection Queue Reports, see page
16-9.
dl Defacto Left Lane: Indicates the shared left lane has congestion exceeding the level of
other through lanes. Synchro does not model this situation correctly. Convert a shared-
through lane into an exclusive left lane to model correctly.
dr Defacto Right Lane: Indicates the shared right lane has congestion exceeding the level of
other through lanes. Synchro does not model this situation correctly. Convert a shared-
through lane into an exclusive right lane to model correctly.
! Phase conflict between lane groups: Indicates that two or more conflicting movements
may have concurrent phases.
@ Some critical lane groups may be at other intersections sharing controller: Used in
l t it t N t ll l li t d i thi t Th t ll t thi

7/21/2019 Synchro Studio 8 User Guide
http://slidepdf.com/reader/full/synchro-studio-8-user-guide 336/559
16-8
volume to capacity report. Not all lane groups are listed in this report. The controller at this
intersection serves other intersection and some of the critical lane groups may be at theother intersection.
Intersection Queue Report The Intersection Queue Report contains information about Maximum Queue Lengths and
Blocking Information (also see, Queue Length Calculation, page 14-70). In addition, the
Queue report contains information on the Control Delay, Queue Delay, v/c ratio, capacityreductions and more.
The queue length shown for a lane group is the queue for each lane. The total
queue length is divided by the number of lanes and the lane utilization factor. For
instance, if the lane group has 2 lanes, do not divide the queue reported by Synchro
by 2 since this has already been done by Synchro.
The Lane Group Flow is the adjusted lane group flow.
The Queue report shows the 50th Percentile and 95th Percentile Maximum Queue lengths. The
50th percentile maximum queue is the maximum back of queue on a typical cycle. The 95th
percentile queue is the maximum back of queue with 95th percentile traffic volumes. Synchro's
queues may be longer than those in other queue methods, because Synchro's queues include
traffic that arrives during the queue clearance stage. Vehicles delayed for less than 6 seconds are
not counted because these vehicles slow but do not stop.
The 95th percentile queue accounts for upstream metering. The 95th percentile volume is
unadjusted for peak hour factor.
The ~ and # footnote indicate that the volume modeled exceeds capacity.
The ~ footnote indicates that the approach is above capacity for the 50th percentile traffic and
the queue length could be much longer. The queue length is theoretically infinite and blocking
problems may occur. See the topic on Queue Length Calculations for more information (page14-70).
The # footnote indicates that the volume for the 95th percentile cycle exceeds capacity. This
traffic was simulated for two complete cycles of 95th percentile traffic to account for the affects
of spillover between cycles. If the reported v/c < 1 for this movement, the methods used
represent a valid method for estimating the 95th percentile queue. In practice, 95th percentile
queue shown will rarely be exceeded and the queues shown with the # footnote are acceptable
for the design of storage bays

7/21/2019 Synchro Studio 8 User Guide
http://slidepdf.com/reader/full/synchro-studio-8-user-guide 337/559
16-9
for the design of storage bays.
The m footnote indicates that volume for the 95th percentile queue is metered by an upstreamsignal.
Due to upstream metering, the 95th queue may be less than the 50th queue. If the
upstream intersection is operating with v/c > 1, the metered arrival rate will be less
than the volume for this intersection. Since metering is only performed with the 95th
queue, this causes the 95th queue to be less than the 50th queue. This situation
may indicate a coding problem. Be sure that the Midblock traffic is coded correctlyand that the signal timing and volumes for both intersections are set correctly. This
reduced 95th queue does represent a valid queue because vehicles will not be able
to clear the upstream intersection to queue at this intersection.
When designing the size of storage bays, it is normally sufficient to store a single cycle of
queues. The idea being that through and left traffic will move at different times during the cycle
and enough storage should be provided so the two movements do not block each other from
using their green time effectively.
The Link Length is the link distance minus 80ft (24m) to account for the space inside the
intersections. The link distance is entered center-point to center-point.
The Queue report lists "Internal Link Dist" to distinguish from Total Link Distance.
Fi 16 5 Q

7/21/2019 Synchro Studio 8 User Guide
http://slidepdf.com/reader/full/synchro-studio-8-user-guide 338/559
16-10
Figure 16-5 Queues
Queue Report Additional Measures of Effectiveness
The v/c Ratio is the volume to capacity ratio for the lane group.
The Control Delay is the delay caused by the downstream traffic control device for the lane
group.
Queue Delay is an analysis of the affects of queues and blocking on short links and short
turning bays.
Total Delay is the combination of the Control Delay and the Queue Delay.
Base Capacity is the capacity of the lane group if unimpeded. Capacity is the lane group
saturation flow multiplied by the lane group green to cycle ratio.
The Starvation Capacity Reduction is the reduction to the base capacity due to starvation.
Starvation is congestion caused by a short upstream link in conjunction with poor/no
coordination.Spillback Capacity Reduction is a reduction to the base capacity caused by a short
downstream link becoming filled up.
Storage Capacity Reduction is a reduction to the base capacity caused when turn pockets
cannot accommodate queue lengths.
Reduced v/c Ratio is the modified volume to capacity ratio with the adjustments to the base
capacity.
Intersection Capacity (ICU) Report The Intersection Capacity Utilization report provides a straightforward method to calculate an
intersection's level of service. The method simply takes a sum of the critical movement‟s
volume to saturation flow rates.
Line by Line Explanation
This section contains line by line description of the ICU report. Lines not described are self-
explanatory.
For a complete reference on the calculations, see the topic on Intersection Capacity (ICU)
Calculations, page 14-49.

7/21/2019 Synchro Studio 8 User Guide
http://slidepdf.com/reader/full/synchro-studio-8-user-guide 339/559
16-11
Additional Details can be found in the Intersection Capacity Utilization 2003 book. A
copy of this book can be obtained from Trafficware.
Pedestrian Timing Required: This is the walk plus Do not Walk time from the primary phase
associated with this direction. If no pedestrian timing is provided and pedestrians are present,
this value is 16 seconds.
Ideal Flow: This is the Ideal Saturated Flow and 1900 vphpl by default. If the intersection has
Area Type of CBD, the Ideal Flow is multiplied by 0.90.
Lost Time: This is the Total Lost time for the movement. By default it is 4 seconds.
Reference Cycle Length: This is set to 120 seconds.
Adjusted Volume: Volume adjusted for peak hour factor.
Volume Combined: This is the volume assigned to lane groups.
Volume Separate Left: The volume assigned to lane groups, assuming no shared left-through
lane. A shared lane is considered exclusive left or exclusive thr ough for each lane group‟s
analysis.
Lane Utilization Factor: This factor adjusts the Saturated Flow Rate when there are 2 or more
lanes. This adjustment accounts for the unequal use of lanes.
Turning Factor Adjustment: This factor adjusts for the number of right or left turners in the
lane group.
Saturated Flow Rate Combined: This is the adjusted Saturated Flow Rate adjusting for turning
factors, number of lanes, and lane utilization.
Saturated Flow Rate Separate: This is used with a shared left-through lane. This value will be
used for some capacity checks in the permitted and split options.
Minimum Green Time: This is the minimum time a signal can show green. This is the
Minimum Initial value for the phase or 4 seconds for unsignalized intersections.
Pedestrian Interference Time: This is the estimated time per cycle that right turn traffic will be
blocked by pedestrians.
Pedestrian Frequency (freq): This is the probability of a pedestrian activating the pedestrian
timings on any cycle. If there are no pedestrians it is 0. If there are no push buttons and there are
pedestrians it is 1

7/21/2019 Synchro Studio 8 User Guide
http://slidepdf.com/reader/full/synchro-studio-8-user-guide 340/559
16-12
pedestrians, it is 1.
Protected Option
Protected Option Allowed: The protected option is allowed only when both opposing
directions do not have a shared left-through lane. Otherwise, the intersection is only analyzed
with split or permitted phasing. In some cases, a shared left-through lane can be recoded as a left
only lane to give better performance with the protected option.
Reference Time: This is the time required to serve the adjusted volume at 100% saturation. It is
equal to the Adjusted Volume divided by the Saturation Flow Rate Combined multiplied by theReference Cycle Length and added to the Pedestrian Interference time.
Adjusted Reference Time: This is the reference time adjusted for minimums, pedestrians, and
lost time.
Permitted Option
This option calculates the ICU using a permitted left turn option. Traditionally the ICU methoddid not allow for permitted left turns because it is taking a sum of conflicting movements.
However using the protected option requires a dedicated left lane. Many intersections in urban
areas have shared left-through lanes that are analyzed too harshly with the protected or split
options.
The ICU 2003 contains two options for treating permitted left turns. Option “A” assumes that
there are relatively few left turners. These left turners will be accommodated as sneakers at the
end of a green or when there is a left turn on an oncoming single lane approach. Option “A”
should only be used when the left turn volume is less than 60 vph or the oncoming approach is
single lane with some left turn traffic.
Option “B” assumes that the oncoming traffic is relatively light and that oncoming traffic will
only block the left turns for the first 8 seconds of green. Option “B” is only available when the
oncoming traffic is less than 120 vph.
If the volume exceeds the requirements for both Options “A” and “B”, it is considered that theintersection would operate as efficiently using protected or split phasing. It may be necessary to
reclassify a left-through lane as a left only lane for the analysis.
Permitted Option Allowed: The permitted option is allowed for opposing approaches, when
either left traffic is less than 60 vph or the oncoming through traffic is less than 120 vph. This
condition must be met for both sets of conflicting movements for the opposing approaches for
permitted analysis to be allowed.

7/21/2019 Synchro Studio 8 User Guide
http://slidepdf.com/reader/full/synchro-studio-8-user-guide 341/559
16-13
Adjusted Saturation A: This is the saturation flow rate of the through and shared lanesadjusted for blocking by left turn traffic.
Reference Time A: This is the reference time for the through movement, when the shared lane
is blocked by less than 60 vph of left traffic. If vL is greater than 60, enter "NA".
Adjusted Saturation B: This is the Saturated Flow Rate of the through lanes without the shared
lane.
Reference Time B: This is the reference time assuming the lanes will be blocked for 8 seconds
by oncoming through traffic. If oncoming through traffic is greater than 120 vph, the B option is
not allowed.
Reference Time: The minimum of Reference Time A and Reference Time B is allowed.
Adjusted Reference Time: This is the reference time adjusted for minimums, pedestrians, and
lost time.
Split Option: The split option is always allowed, in some cases the split option is the only
option allowed. The split option analyzes the lanes combined and also checks the left and
through traffic independently.
Reference Time Combined: This value is for the combined lanes and volumes. This is the time
required to serve the adjusted volume at 100% saturation. It is equal to the Adjusted Volume
divided by the Saturation Flow Rate Combined multiplied by the Reference Cycle Length and
added to the Pedestrian Interference time.
Reference Time By Movement: This Reference Time calculates lefts and throughs and rights
separately. This adds an additional check against uneven lane distribution.
Reference Time: The maximum of Reference Time Combined and the Reference Times by
Movement.
Adjusted Reference Time: This is the reference time adjusted for minimums, pedestrians, and
lost time.
Summary
This section summarizes and combines the required times for left and through traffic by
approach pairs. The best solution is found for each approach pair and combined.
Protected Option: Maximum of the Sums of the opposing Adjusted Reference times.
Permitted Option: Maximum of the Permitted Adjusted Reference Times is allowed

7/21/2019 Synchro Studio 8 User Guide
http://slidepdf.com/reader/full/synchro-studio-8-user-guide 342/559
16-14
Permitted Option: Maximum of the Permitted Adjusted Reference Times is allowed.
Split Option: Sum of the opposing Adjusted Reference times.
Minimum: For each approach pair, take the minimum combined adjusted reference time.
Combined: The sum for all approaches.
Right Turns
Right turns from exclusive lanes are calculated by a separate calculation. This accounts for freerights, overlapping right turn phases, and right turns on red.
Adjusted Reference Time: The Adjusted Reference Times for right turns. For approaches with
0 exclusive right lanes, this value will be 0.
Cross Through Adjusted Reference Time: The minimum Adjusted Reference Times for the
cross through movement.
Oncoming Adjusted Left Reference Time: The minimum Adjusted Reference Times for thecross left movement. This does not include the permitted time for oncoming left. The split
reference time for left movements should be the same as for through movements.
Combined: The sum of the above lines. If this movement is a free right, it is simply the right
turn‟s Adjusted Reference time. For intersections with 5 or more legs, the cross through times
and oncoming left times may include multiple movements. There may be additional time added
if there are "interlocking" right times that are both critical.
Final Calculations
Intersection Capacity Utilization: The maximum of the Combined times for through and right
turn sections, divided by the Reference Cycle Length. This is the Intersection Capacity
Utilization. It is similar to, but not exactly the same as the intersection volume to capacity ratio.
A value less than 100% indicates that the intersection has extra capacity. A value greater than
100% indicates the intersection is over capacity.Level of Service: A letter A to H based on the table and the Intersection Capacity Utilization.
Note that the ICU 2003 includes additional levels past F to further differentiate congested
operation.

7/21/2019 Synchro Studio 8 User Guide
http://slidepdf.com/reader/full/synchro-studio-8-user-guide 343/559
16-15
HCM 2000 Signals Report This report provides a full implementation of the HCM 2000 Signalized Operations method.
This report will match other HCM 2000 (Chapter 16) implementations except for the items
listed below.
Report Items Line by Line
Unless noted here, the report line items are self-explanatory or match the same fields found onthe Synchro input settings.
Total Lost Time: This is the sum of the Startup lost time and the Clearance lost time. Do not
confuse this value with the Startup Lost time. Refer to page 7-13 for details on the Lost Time
adjustment.
Frpb, Flpb: Bike and Ped factors, these may vary slightly from the bike and ped factors shown
in other Synchro reports because these are calculated based on actuated green times for HCMcompatibility. These factors are applied to both the permitted and protected phases. The
bike/pedestrian factors in other Synchro reports are calculated based on maximum green times
for calculation efficiency and only apply to the permitted phases.
Flt Permitted: The permitted left turn factor may vary slightly from the left turn factor shown in
other Synchro reports because these are calculated based on actuated green times for HCM
compatibility. The permitted left turn factors in other Synchro reports are calculated based on
maximum green times for calculation efficiency.
RTOR Reduction: The HCM Signal Report includes a RTOR reduction calculation. The Lane
Group Flow is now equal to the Adjusted Lane Group flow minus the RTOR reduction. The
RTOR reduction is calculated as follows:
vRTOR = minimum (sRTOR,v) * r/C = RTOR reduction to volume
sRTOR = RTOR saturation flow as calculated by Synchro
r = effective red time
v = adjusted lane group volume (before RTOR reduction)
C = cycle length
The vRTOR value cannot be over-ridden. However, the sRTOR can be changed in
the LANE settings. The sRTOR can be calculated with observed vRTOR using the
formula sRTOR = vRTOR * C/r.

7/21/2019 Synchro Studio 8 User Guide
http://slidepdf.com/reader/full/synchro-studio-8-user-guide 344/559
16-16
Actuated Green: The green times used for the HCM signals report are actuated green timeswhich may be less than the maximum green times for actuated signals. When comparing to other
HCM compatible software, be sure to compare the same green times.
v/s Ratios: The volume to Saturated Flow Rate ratios for permitted and protected movements. A
"c" indicates that this is a critical movement. The HCM volume to capacity ratio is based on a
sum of the critical v/s ratios.
Progression Factor: The progression factor is calculated by dividing Synchro‟s control delaywith coordination by the control delay without coordination. This may vary from the
progression factor used in other HCM implementations.
The HCM Signals Reports will skip unused or default rows. With this feature, rows for items
such as pedestrians, busses, growth factor, will not be included if they contain default data.
Multiple options can be selected when printing reports. For example, the HCM
Signal Report can be printed with the Queue report. In the SELECT REPORT settings, choose the HCM Signal Report, hold the [Ctrl] key and select Int: Queues.
Discussion
In some cases, Synchro will give results different than the HCM and the HCS. Some of these
deviations are necessary to accommodate modeling of coordination and actuation. Other
differences can be attributed to varying input methods and rounding errors. The followingsection outlines the known deviations of Synchro from the HCM and recommended work
arounds.
The following table lists the reasons why the Synchro HCM report may deviate from the HCM
and HCS reports. Synchro version 5 and later have eliminated many of the differences found in
earlier versions of Synchro by using the HCM delay formulas instead of time-slice analysis. The
remaining differences are mostly due to limitations in the other software and Synchro‟s explicit
calculation of coordination.

7/21/2019 Synchro Studio 8 User Guide
http://slidepdf.com/reader/full/synchro-studio-8-user-guide 345/559
16-17
Table 16-2 Synchro HCM vs. HCM & HCS Differences
Issue Reason Work AroundCapacity
DifferenceDelay
Difference
Queue Delay is
not included in
the HCM and
HCS
New in Synchro 6 is an added
measure for queue interaction
delays. This measure is not included
in the HCM Signal Report or the
HCS.
Accept Synchro's
delay
No Yes
PF (Platoon
Factor)
Does not match
HCM
Affects of coordination are calculated
explicitly.
Synchro's PF is
based on
calculations versus
a ±25% estimate in
the HCM method.
No Yes
Input Data
different
User has entered data differently for
each model.
Export data from
Synchro or check
data carefully
Yes Yes
Rounding
Differences
Programs round numbers to different
precision.
Minor Minor
Effective Green
Times with
Permitted +
Protected LeftTurns
When both directions have a leading
Permitted plus Protected left turn of
the same length, the HCS assumes
(incorrectly in our opinion) that theinterval between the green arrow
and the green ball is part of the
permitted green time. This causes
the HCS to give higher effective
green times, lower v/c ratios and Flt
and lower delays.
Accept Synchro's
truer numbers or
use HCS
Yes
(Synchro
has lower
capacity)
Yes
(Synchro
has higher
delay)
Effective GreenTimes with
lagging
Permitted +
Protected Left
Turns
With lagging Permitted plusProtected left turn phasing, the HCS
assumes (incorrectly in our opinion)
that the interval between the green
ball and the green ball counts
towards the protected green time.
This causes the HCS to give higher
effective green times, lower v/c ratios
and lower delays.
Accept Synchro'sTruer numbers or
use HCS
Yes(Synchro
has lower
capacity)
Yes(Synchro
has higher
delay)

7/21/2019 Synchro Studio 8 User Guide
http://slidepdf.com/reader/full/synchro-studio-8-user-guide 346/559
16-18
HCM 2000 Unsignalized Report The HCM Unsignalized Report is based on the HCM 2000 Chapter 17. More information about
the calculations and the variables in the report are found in the HCM.
Two Way Report
Hourly Flow Rate: Movement volume divided by PHF.
tC, single: The critical gap time for single stage crossing.
tC, 2 stage: The critical gap time for each stage of a two stage crossing.
tF: The follow up time.
p0: The probability of a queue free state for this movement.
cM: The capacity for the movement. This value considers the impacts of two stage gap
acceptance and plattooned flows. However, this capacity does not consider the influence of
shared lanes or flared right turns.
Lane Section
The lower part of the unsignalized report has information on a per lane basis. One column
appears for each lane.
cSH: The capacity for each lane considering the affects of sharing and flared right turns. The
capacity of free movements is assumed to be 1700 vphpl.
Queue Length: This is the 50th percentile queue for each lane in feet or meters.
Synchro's unsignalized analysis does implement the upstream signals methodology for two-way
stops. In 2000, Trafficware discovered errors in the HCM methodology and has determined that
results calculated with the upstream signals methodology should not used. In June 2002 and
again in July of 2003, an errata to the HCM was released that addresses most of these errors.
Intersection wide delay and level of service is not defined by the HCM for two-way
stop controlled intersections, therefore, it is not shown in the report. The analyst
needs to look at the delay and LOS for the individual movements.
The LOS for main street approaches is not shown because it is not defined for main street
approaches. The analyst needs to examine the left turn LOS and delay to rank the vehicles.

7/21/2019 Synchro Studio 8 User Guide
http://slidepdf.com/reader/full/synchro-studio-8-user-guide 347/559
16-19
All Way ReportIf a right turn lane is marked channelized, it is not included in the headway calculations and its
volume does not affect the intersection calculations.
Hourly Flow Rate: Movement volume divided by PHF.
Hadj: Headway adjustments based on turning percentages and proportion of heavy vehicles.
Departure Headway: This is the value Hd, computed by multiple iterations of Worksheets 4aand 4b from the Highway Capacity Manual, Chapter 17. It is the average time each vehicle
requires at each lane. Hd takes into account the number of lanes, and occupancy of conflicting
lanes.
Degree Utilization, x: This is the volume divided by the departure headway. Note that x is not
the v/c ratio because increases to the volume on this approach will increase the headways and
occupancies for conflicting approaches and in turn increase the headways for this approach.
Capacity: This is the capacity for the lane. The method iteratively increases the volume for
each lane until x is 1. The volume to capacity ratio is based on the Capacity.
Roundabout Report (for HCM 2000 Methods)
Hourly Flow Rate: Movement volume divided by PHF.
Approach Volume: Sum of movement volumes for approach.Crossing Volume: Sum of movement volumes crossing this movement in front of the
roundabout. The method is only applicable for crossing volumes up to 1200 vph. If the crossing
volume exceeds 1200, the results are not valid.
High Capacity: High range of capacity. The method has a high and low range of possible
capacities. It is the analyst's responsibility to decide which is more applicable.
High v/c: The high capacity volume to capacity ratio.
Low Capacity: High range of capacity. The method has a high and low range of possible
capacities. It is the analyst's responsibility to decide which is more applicable.
Low v/c: The low capacity volume to capacity ratio.
The roundabout's method has not been very well developed. There are no delay or queue
outputs. The method is only applicable to single lane roundabouts with up to 1200 vph crossing
volume. The output is a range of v/c values; it is the analyst's responsibility to decide which v/cratio is most applicable.

7/21/2019 Synchro Studio 8 User Guide
http://slidepdf.com/reader/full/synchro-studio-8-user-guide 348/559
16-20
pp
Arterial Level of Service Report The Arterial Level of Service report contains information about the speed and travel time for an
arterial. This report mirrors the reports used in the Arterials section of the HCM 2000, Chapter
15. The Arterial report can also be compared with field travel time studies.
When creating an Arterial LOS report, select one or more arterials in the right panel of the
SELECT REPORTS settings. To create an arterial with multiple street names or that turns
corners, include a route number with the # symbol in the street names, such as "Ashby Ave#13".
A report is created for each direction of the arterial.
The Arterial Class is calculated automatically based on the distances between intersections and
the link speeds. The Speed is the total distance divided by the total travel time. The segment
distance is the total distance divided by the number of segments.
Table 16-3 Arterial Class
Speed (mph) Segment Distance Class
1 to 29 any IV
30 to 35 <2000 ft IV
30 to 35 ≥2000 ft III
36 to 45 any II
above 45 any I
The Flow Speed is the free flow speed or link speed input for each link.
For segments over 0.5 miles, the Running Time is the link distance divided by the flow speed.
For shorter links, the running time is based on the running times in the HCM 2000, Table 15-3.
This table is based on FHWA research that shows longer running times on networks with shortsegments. This will cause longer travel times and lower LOS than using the free flow speeds.
The Signal Delay is the Synchro Control delay for the through lane group. This will match the
Control Delay as shown in the TIMING view.
The Travel Time is equal to Running time plus Signal Delay. Arterial Speed is thus Distance
divided by Travel Time.
The Arterial LOS is based on the speed and the Arterial Class.

7/21/2019 Synchro Studio 8 User Guide
http://slidepdf.com/reader/full/synchro-studio-8-user-guide 349/559
16-21
Figure 16-6 Sample Arterial Level of Service Report
Network Measures of Effectiveness Reports
The Summary Network MOEs and Detailed Network MOEs reports display quantitative
information about the performance of intersections and the network.
The MOEs can include delays, stops, fuel consumption, queuing penalty, dilemma vehicles and
emissions.
The network reports can display information about each approach, each intersection, for an
arterial, and for the entire zone or network selected.
Measure Of Effectiveness (MOE) Report Options
The MOE Report options are available for the Network reports and the Multi-file reports (“A”
in Figure 16-7).
Select the MOEs to include in the report. Detailed information about each MOE is listed later in
this topic.

7/21/2019 Synchro Studio 8 User Guide
http://slidepdf.com/reader/full/synchro-studio-8-user-guide 350/559
16-22
Select the Level of Detail to include in each report (“B” in Figure 16-7). It is possible to listMOEs for each approach, for each intersection, for selected arterials, and for the entire network
or zone.
Select one of more Arterials to include in the report (“C” in Figure 16-7). The report will
summarize the MOEs along the arterial for arterial approaches only. Through and turning lane
groups are included.
B
C
A
Figure 16-7 Network Report Options
MOE Notes
The delays shown are Synchro‟s Control delay.
The volumes are not adjusted for PHF or Lane Utilization. Volumes are adjusted for growthfactors.
Delays per vehicle are the Synchro Control Delay, Queue Delay and Total Delay. The Total
Delay per vehicle would be the Control Delay per vehicle plus the Queue Delay per vehicle. The
Total Delay is the Total Delay per vehicle multiplied by the number of vehicles in the
network/zone in one hour.
Stops are calculated with the methods shown in the topic, Optimizations and Calculations (see page 14-75). Stops are the number of stops per hour.

7/21/2019 Synchro Studio 8 User Guide
http://slidepdf.com/reader/full/synchro-studio-8-user-guide 351/559
16-23
The Average Speed is the link distance divided by the travel time including delays. AverageSpeed includes the speed of vehicles in turning lanes and will not match the Average Speeds in
the Arterial Travel time report.
The Total Travel Time is an hourly summary of delays and travel time.
The Distance Traveled is the volume times the link distance. Bend distances are included at the
downstream intersection. Travel on exit links is not counted.
The Fuel Consumed is calculated using the methods outlined in the topic Fuel and EmissionsCalculation (see page 14-76). The fuel is based on the delays, stops, speed, distance traveled,
and travel time.
The Emissions are calculated based on the fuel consumption. The conversion rates are shown in
the topic Fuel and Emissions Calculation (see page 14-76).
The Unserved Vehicles is the Adjusted Volume less Actuated Capacity. A value of 10 indicates
that the volume exceeds capacity by 10 vehicles per hour.
The Vehicles in Dilemma Zone is a count of the vehicles arriving while the signal turns yellow
and soon thereafter. This is rough measure of the safety of the movement. It is undesirable to
create timing plans that turn yellow when a platoon is approaching the intersection.
The Performance Index is a combination of the delays and stops. When optimizing, Synchro
selects the cycle length with the lowest PI. See the topic on Optimize Network-Cycle-
Lengths on page 14-11 for more details.A sample Network MOE report is shown in Figure 16-8.

7/21/2019 Synchro Studio 8 User Guide
http://slidepdf.com/reader/full/synchro-studio-8-user-guide 352/559
16-24
Figure 16-8 Detailed MOE Report Example
Arterial Summaries
Select a street name or route number to generate an Arterial Summary (“C” in Figure 16-7).
The Arterial Summary summates the MOEs for approaches on the arterial including turning lane
groups. Side street approaches are not counted. The MOEs are summarized by direction and
totaled.
To create an Arterial Route with multiple street names or that turns corners, include a route
number in the street name with the # symbol. For example, the streets Ashby Avenue and
Tunnel Road are part of the same route. Give these streets the names "Ashby Ave SR #13" and
"Tunnel Road SR #13". Synchro will be able to create reports and analysis on the arterial "#13".
The values summarized by arterial are volume weighted and include turning lane groups. The
values will not match the average speeds and total travel times listed in the Arterial Report.
Multi-File Comparison Report The Multi-file Comparison Report is used to compare multiple alternatives side-by-side.
The report could be used to compare a before-and-after condition, or the report can be used to
compare MOEs for two or more different timing plans.

7/21/2019 Synchro Studio 8 User Guide
http://slidepdf.com/reader/full/synchro-studio-8-user-guide 353/559
16-25
When performing a cycle length optimization, select the Preserve File for Each Cycle Length option. These files can be used to create a Comparison Report.
The files used should contain mostly the same intersections with the same arterial names. Be
sure to correctly enter the Scenario Manager information so that each alternative can be
identified.
To create a Multi-File Comparison Report, use the following steps (files to compare must be in
the same directory): From the SELECT REPORTS dialog, choose Detailed or Summary Multi-File
Comparison
Select the options you would like to include
Select the [Print], [Save-Text] or [Preview] button to create your report
A dialog to select your files to compare will appear
Navigate to the directory with the files
To show all Synchro files in the directory, enter *.syn in the File Name and press
[Enter]
Choose the files you want to compare by holding the [Ctrl] key and clicking on the
files you want
Select [Open]
If your computer is configured to open files on a single click, hold the [Ctrl] key
down when selecting the first file. Then hold the [Shift] key to select the last file.
Clicking a file with the [Ctrl] key down can select or deselect a file. Multiple files can
also be selected by dragging a rectangle around their names. Start the rectangle to
the right of any filenames.
The first page of the comparison report lists each alternative with its scenario information and
basic statistics (Figure 16-9).
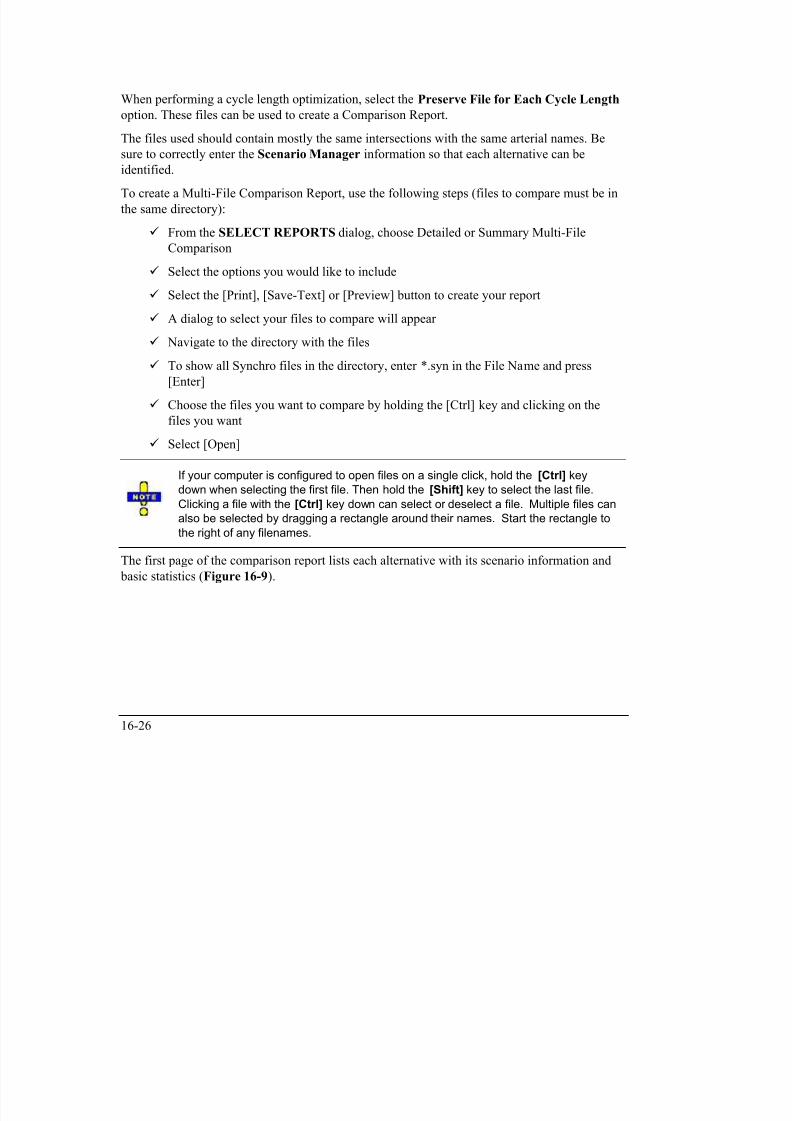
7/21/2019 Synchro Studio 8 User Guide
http://slidepdf.com/reader/full/synchro-studio-8-user-guide 354/559
16-26
Figure 16-9 Detailed Alternative Comparisons
Succeeding pages list the MOEs with one column for each alternative. The MOE information
follows all of the rules for the Network report listed above (Figure 16-10).
Figure 16-10 Detailed Alternative Comparisons Example

7/21/2019 Synchro Studio 8 User Guide
http://slidepdf.com/reader/full/synchro-studio-8-user-guide 355/559
16-27
Timing Report - Sorted by Phase Number Timing Report, Sorted by Phase Number option (Phases: Timings) provides information about
the signal timing parameters determined by Synchro. For each phase that is in use, the following
information is given:
Movement Time To Reduce (s)
Lead/Lag Walk Time (s)
Lead-Lag Optimize Flash Don‟t Walk (s)
Recall Mode Dual Entry
Maximum Split (s) Floating Force Off
Maximum Split (%) Start Time (s)
Minimum Split (s) End Time (s)
Yellow Time (s) Yield/Force Off (s)
All-Red Time (s) Yield/Force Off 170 (s)
Minimum Initial (s) Local Start Time (s)
Vehicle Extension (s) Local Yield (s)
Minimum Gap (s) Local Yield 170 (s)Time Before Reduce (s)
Most of these values are the same values shown in the TIMING settings or PHASING settings.
Movement is the lane group(s) served by this phase. For through movements, for example NBT
or EBT, the movement ends in T. For left turn phases the movement ends in L. For split
phasing, for example NBTL, the movement ends with TL, because the phase serves through andleft traffic. For a single phase serving two directions, the movement is NB-SB for northbound
and southbound.
The report includes a start time, an end time, a yield/force off and yield/force off 170. These
times are phase references to the beginning of the system clock. The 170 yield (to the
coordinated phase) is referenced to the beginning of the flashing don‟t walk .
The report also contains the Cycle Length, Natural Cycle Length, Control Type and OffsetInformation at the top, and a Splits and Phasing Diagram at the bottom.

7/21/2019 Synchro Studio 8 User Guide
http://slidepdf.com/reader/full/synchro-studio-8-user-guide 356/559
16-28
A sample Timing Report, Sorted By Phase is shown in Figure 16-11.
Figure 16-11 Sample Timing Report, Sorted By Phase
Actuated Green Times Summary
The Actuated Phase Start and Green summary report shows the green time for each phase. This
information is provided for each of the five percentile scenarios. This report is helpful for
looking at actuated signals to see the range of green times.
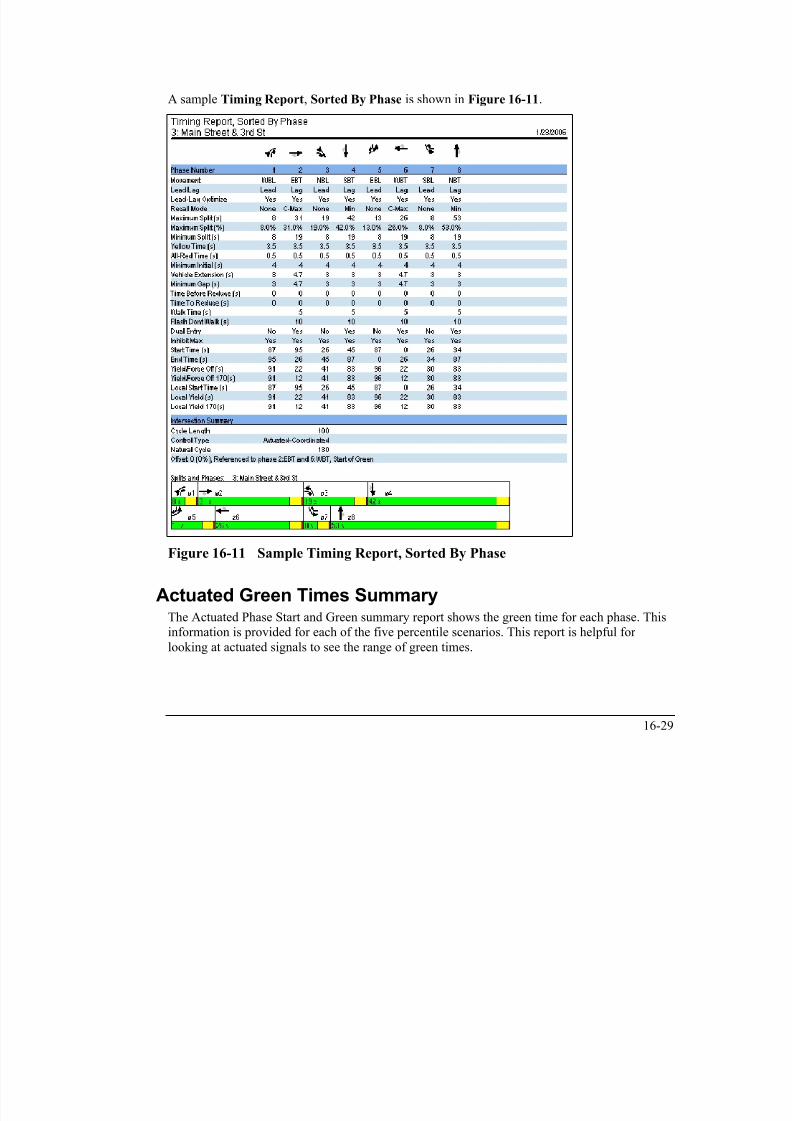
7/21/2019 Synchro Studio 8 User Guide
http://slidepdf.com/reader/full/synchro-studio-8-user-guide 357/559
16-29
For each phase and percentile scenario, the following information is listed:Phase
Percentile
Green
Termination
Detail Bar Graph
Phase : Each phase has its number and lane group listed here.
Percentile : This is the percentile scenario for this row. Synchro models traffic under five
percentile scenarios (see the topic on the Percentile Delay Method, page 14-30).
Green : This is the actual green time for this scenario. This value is normally equal to the sum of
the Queue and the Gap-out times. Many times the green time is constrained by the minimum or
maximum times or the phase is skipped altogether.
Termination : This code explains how the phase was terminated. The available options are as
follows:
Skip: Phase is skipped, no calls.
Min: Phase shows for minimum time.
GapOut: Phase gaps out
Hold: Phase held for phase in other ring. Lagging main street phases are also held.
Max Out: Phase shows for maximum time.
Ped: Phase extended for pedestrian phase due to ped button or ped recall.
Max Recall: Max Recall, phase is set for maximum recall.
Dwell: Signal rests or dwells on this phase, conflicting volume is very light.
Coordinated: This phase is the main street phase in coordination. Any extra time reverts to
this phase.
Detail Bar Graph : The bar graphs to the right show the green times graphically. Each graph
shows the green and yellow time as green and yellow.

7/21/2019 Synchro Studio 8 User Guide
http://slidepdf.com/reader/full/synchro-studio-8-user-guide 358/559
16-30
For non-coordinated actuated signals, the cycle length and the rest-in-red time are shown at the bottom. If all phases have no recall, the signal may rest with all phases red. The blue bars
represent the cycle length and the red bars represent rest-in-red time.
For pretimed and fixed-cycle signals, the cycle length is listed at the bottom.
A sample Actuated Green Times Report is shown in Figure 16-12.
Figure 16-12 Sample Actuated Green Times Report
Actuated Start and Green Times Summary
The Actuated Phase Start and Green summary report shows the green time for each phase along
with the phases' start time. This information is provided for each of the five percentile scenarios.
This report is helpful for looking at actuated signals in coordination, to see if phases may be
starting early.

7/21/2019 Synchro Studio 8 User Guide
http://slidepdf.com/reader/full/synchro-studio-8-user-guide 359/559
16-31
For each phase and percentile scenario, the following information is listed:Phase
Percentile
Green
Start
Termination
Detail Bar Graph
Phase : Each phase has its number and lane group listed here.
Percentile : This is the percentile scenario for this row. Synchro models traffic under five
percentile scenarios. Also see Percentile Scenarios (page 14-31) for more information.
Green : This is the actual green time for this scenario. This value is normally equal to the sum of
the Queue and the Gap-out times. Many times the green time is constrained by the minimum ormaximum times or the phase is skipped altogether.
Start : This is the start time for each phase. The start times are referenced to the system cycle
clock. These start times are the same as appear on the time space diagram. If this signal has
offset 0, referenced to the yield point of phase 2, phase 2 will yield at time 0.
Termination : This code explains how the phase was terminated. The available options are as
follows:
Skip: Phase is skipped, no calls.
Min: Phase shows for minimum time
GapOut: Phase gaps out
Hold: Phase held for phase in other ring. Lagging main street phases are also held
Max: Out Phase shows for maximum time.Ped: Phase extended for pedestrian phase due to ped button or ped recall.
Max Recall: Max Recall, phase is set for maximum recall.
Dwell: Signal rests or dwells on this phase, conflicting volume is very light.
Coordinated: This phase is the main street phase in coordination. Any extra time reverts to
this phase.

7/21/2019 Synchro Studio 8 User Guide
http://slidepdf.com/reader/full/synchro-studio-8-user-guide 360/559
16-32
Detail Bar Graph : The bar graphs to the right show the start and green times graphically. Eachgraph shows the green and yellow time as green and yellow.
For non-coordinated actuated signals, the cycle length and the rest-in-red time are shown at the
bottom. If all phases have no recall, the signal may rest with all phases red. The blue bars
represent the cycle length and the red bars represent rest-in-red time.
For pretimed and fixed-cycle signals, the cycle length is listed at the bottom.
A sample Actuated Start and Green Times Report is shown in Figure 16-13.
Figure 16-13 Sample Actuated Start and Green Times Report
Actuated Phase Details
The Actuated Phase Details report shows the green and yellow time for each phase alongside the
time to clear the queue and the time to gap out. This information is provided for each of the five
percentile scenarios. This report is helpful to observe in detail the operation of actuated phases.
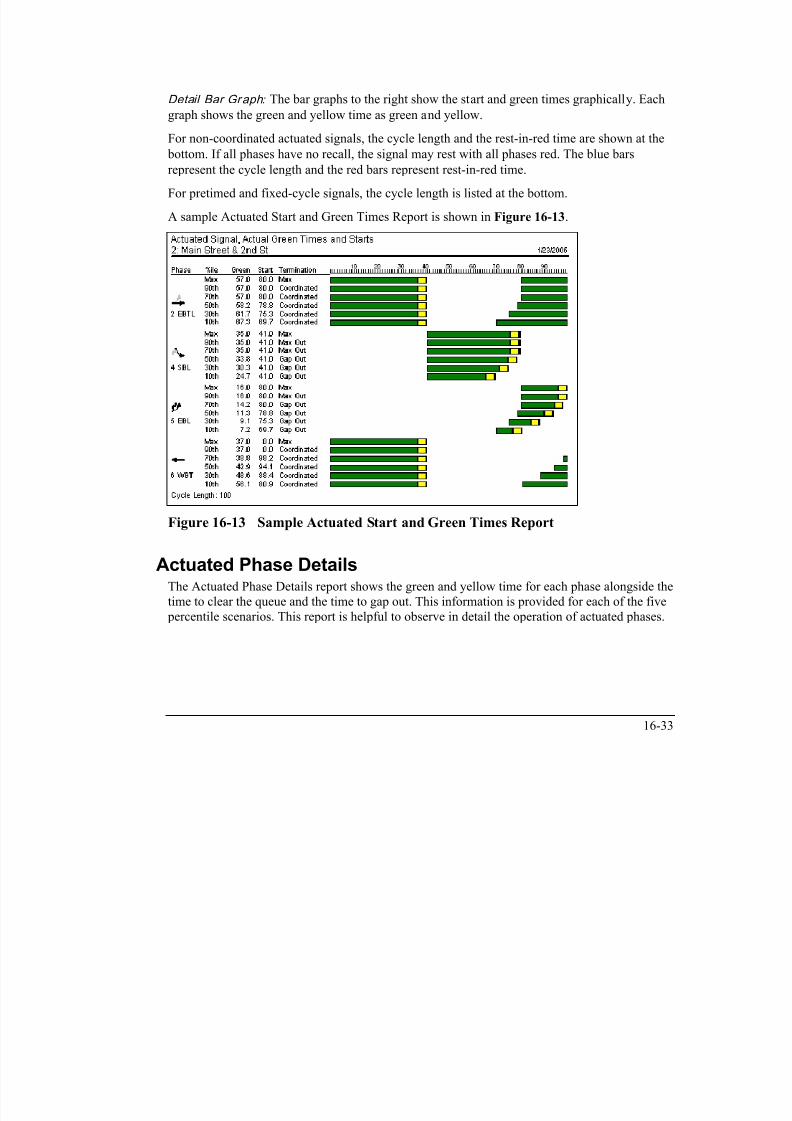
7/21/2019 Synchro Studio 8 User Guide
http://slidepdf.com/reader/full/synchro-studio-8-user-guide 361/559
16-33
For each phase and percentile scenario, the following information is listed:Phase
Percentile
Queue Clearance Time
Gap-Out Time
Green
Termination
Detail Bar Graph
Phase : Each phase has its number and lane group listed here.
Percentile : This is the percentile scenario for this row. Synchro models traffic under five
percentile scenarios. Also see Percentile Scenarios (page 14-31)for more information.
Queue Clearance Time : This is the time to clear the queue. This time includes the startup-losttime which is 2.5 seconds. This time includes the time for the vehicles arriving on red to clear as
well as any new vehicles arriving during the clearance time. A value of 50+ in the queue time or
gap-out field indicates 50 or more seconds.
Gap-Out Time : This is the time for the phase to gap-out. It is calculated as the time till there is a
50% chance of a gapout. This value also includes the unused green time.
Green : This is the actual green time for this scenario. This value is normally equal to the sum ofthe Queue and the Gap-Out times. Many times the green time is constrained by the minimum or
maximum times or the phase is skipped altogether.
Termination : This code explains how the phase was terminated. The available options are as
follows:
Skip: Phase is skipped, no calls.
Min: Phase shows for minimum time
GapOut: Phase gaps out
Hold: Phase held for phase in other ring. Lagging main street phases are also held
Max: Out Phase shows for maximum time.
Ped: Phase extended for pedestrian phase due to ped button or ped recall.
Max Recall: Max Recall, phase is set for maximum recall.

7/21/2019 Synchro Studio 8 User Guide
http://slidepdf.com/reader/full/synchro-studio-8-user-guide 362/559
16-34
Dwell: Signal rests or dwells on this phase, conflicting volume is very light.Coordinated: This phase is the main street phase in coordination. Any extra time reverts to
this phase.
Detail Bar Graph : The bar graphs to the right show these times graphically. The top half of
each graph shows the queue time and gap-out time as brown and cyan respectively. The lower
half of each graph shows the green and yellow time as green and yellow.
For non-coordinated actuated signals, the cycle length and the rest-in-red time are shown at the bottom. If all phases have no recall, the signal may rest with all phases red. The blue bars
represent the cycle length and the red bars represent rest-in-red time.
If a value is too big to fit in the bar graph, it has broken bars at the right of the scale.
For pretimed and fixed-cycle signals, the cycle length is listed at the bottom.
A sample Actuated Phase Details Report is shown in Figure 16-14.
Figure 16-14 Sample Actuated Phase Details Report

7/21/2019 Synchro Studio 8 User Guide
http://slidepdf.com/reader/full/synchro-studio-8-user-guide 363/559
16-35
16 36
Permitted Left Turn Factors Report The Permitted Left Turn Factors report provides information about the lanes and saturation flow
rates. It is roughly equivalent to the HCM's Supplemental Worksheet for Permitted Left Turns.
For details on all of these values, refer to the 2000 HCM, Chapter 16. The value f lt is the
permitted left turn factor that is seen in the LANE settings.
FLT is calculated based on maximum green times rather than actuated green times.
This may cause the Synchro FLT to vary slightly from the HCM calculations.
If there is an exclusive left turn lane plus a shared left turn lane, a separate F lt is calculated for
each lane. This is a feature not found in the HCM or the Highway Capacity Software. If an
approach is opposed by an exclusive turning lane and a shared lane, only the opposing shared
lane and through lanes are considered to be opposing.
This report is used both for approaches that are opposed by single lane and multilaneapproaches. The values Prop LT Opp., n, P THo, E L2 and Gdiff only apply to approaches that are
opposed by a single lane approach. Fm only applies for multiple shared lane approaches.
The value f min is the left turn factor assuming that the only left turns are "sneakers" (turners who
complete their turns during or after the yellow phase). If f min is greater than f m,, f min is used.
If either the subject or opposing approach has a protected phase, then the appropriate
adjustments are made to the g u
, g f
, and g q
.
A sample of a Supplemental Worksheet for Permitted Left Turns Report is shown in
Figure 16-15.

7/21/2019 Synchro Studio 8 User Guide
http://slidepdf.com/reader/full/synchro-studio-8-user-guide 364/559
16-36
16 37
Figure 16-15 Sample Supplemental Worksheet For Permitted Left Turns Report
Coordinatability Analysis Report The Coordinatability Analysis report gives information about Coordinatability factors and
elements used to calculate them. (See Coordinatability Factors for more information about
CFs and their calculation, page 14-22.)
Each element that affects the Coordinatability Factor (CF) is shown, along with the affect it has
on the CF. A CF ranges from 0 to 100 or more. Any value above 50 means that coordination is
recommended. The higher the CF, the more likely that this link will benefit from coordination.

7/21/2019 Synchro Studio 8 User Guide
http://slidepdf.com/reader/full/synchro-studio-8-user-guide 365/559
16-37
16 38
The six factors used to determine Coordinatability are as follows:Travel Time
Traffic to Storage Space
Proportion of Traffic in Platoon
Main Street Volume
Increase in Cycle Lengths needed for coordination
In the report, each of these values is listed along with how it affects the CF. There may be a
comment next to the factor explaining its effect on the CF.
A sample Coordinatability Factors report is shown in Figure 16-16.
To quickly view a CF Report for a single link:
1. In the MAP view, press the Show Coordinatability Factors button or the Show
Natural Coordinatability Factors button .
2. Double click on a link with the CF value shown.
Figure 16-16 Coordinatability Factors Report – Sample

7/21/2019 Synchro Studio 8 User Guide
http://slidepdf.com/reader/full/synchro-studio-8-user-guide 366/559
16-38
16-39
Time Tracker ReportThe Time Tracker report includes information for Name, Operation, Date/Time and Session
Work Length. See page 2-34 for full details on the Time Tracker.
Figure 16-17 Time Tracker Report – Sample

7/21/2019 Synchro Studio 8 User Guide
http://slidepdf.com/reader/full/synchro-studio-8-user-guide 367/559
16 39

7/21/2019 Synchro Studio 8 User Guide
http://slidepdf.com/reader/full/synchro-studio-8-user-guide 368/559
17-1
Chapter 17 – UTDF 2006 Edition
Universal Traffic Data Format (UTDF) is a standard specification for transferring data between
various software packages. UTDF can also be used to share data between software and traffic
signal controller hardware. UTDF is also useful for storing multiple volume counts and multiple
timing plans for the same intersection.
In past version of UTDF, data was stored in separate files for volumes, lanes, timings, phasing
and layouts. In 2006, UTDF was reformatted to contain all the data in one combined file. The
data is divided by sections in the comma delimited (CSV) format. The UTDF Combined file can
be accessed through the File Open, File Save-As, File Merge and File Save-Part
commands.
Below are some of the applications for UTDF.
Hardware Related:
Existing detectors can be refitted to provide traffic counts and can be stored in UTDF.
A library of timing plans can be stored in UTDF and uploaded to the controller on
demand.
A generation 1.5 traffic control system can be developed that automatically performs
the above steps in conjunction with the analysis software in real time.
Software Related:
UTDF allows data to be shared between otherwise incompatible software packages.
There are several traffic oriented developers vendors supporting UTDF. This allows
data to be easily shared among software from different vendors.
For planning purposes, it is possible for planning departments to store traffic counts for
various scenarios and use them for capacity analysis as well as other purposes. WithUTDF compatible software, it could be possible for planners to completely automate
traffic impact studies for future development and roadway improvements.
UTDF uses text files to store and share data in comma delimited (CSV) format. The comma-
delimited text files (CSV) can be easily viewed and edited by spreadsheets such or Microsoft
Excel.

7/21/2019 Synchro Studio 8 User Guide
http://slidepdf.com/reader/full/synchro-studio-8-user-guide 369/559
17-2
Text files are easy for end users to edit with any text editor such as Microsoft Notepad. Thecolumn-aligned TMC format is provided for compatibility with Turning Movement Count
(TMC) files and for easy editing with text editors. The TMC format is the only column aligned
format supported by Synchro 7/8.
Combined file format: a new format contains multiple sections so that a single file can
completely define a network. The combined format includes the data previously found in the
LAYOUT, LANES, and PHASING files. These individual file formats will be phased out in
the future. The combined file includes sections for Network, Nodes, Links, and Timing Planallowing a better mapping of data.
More items in Lanes section: The lanes section includes data for UP ID and DEST NODE.
This allows lane groups to be easily mapped to OD nodes for use with transfers to/from
planning software
All data items included: The combined file and its respective sections now include all data
available in Synchro.
Data Format SupportThe following table shows the file formats available, and the evolution of UTDF. Starting with
Synchro version 7, only CSV and TMC formats are supported.

7/21/2019 Synchro Studio 8 User Guide
http://slidepdf.com/reader/full/synchro-studio-8-user-guide 370/559
17-3
Table 17-1 UTDF Supported FormatsFile Format Version 6 Version 7/8 Future
Volumes.csv Yes Yes Yes
Volumes.dat Yes No No
Vdate.csv (all counts for one date) Yes Yes Yes
Vdate.dat (all counts for one date) Yes No No
TMC####.vol Yes Yes Yes
TMC####.csv (TMC in comma delimited) Yes No No
Layout.dat Yes No No
Layout.csv Yes Yes No
Lanes.dat Yes No No
Lanes.csv Yes Yes No
Timing.csv Yes Yes Yes
Timing.dat Yes No No
Phasing.csv Yes Yes No
Phasing.dat Yes No No
In the future, the LAYOUT, LANES, and PHASING formats will be discontinued in favor of
the combined format.Volumes and Timings data tables will remain to provide a repository for multiple counts and
multiple timing plans in addition to use with SimTraffic data access.
Some Synchro Version 6 UTDF formats are supported by Version 7/8. The supported formats
are listed in Table 17-1. To access Version 6 UTDF, use the command Transfer Data-
Access
Version 6 Data Access. Documentation on Version 6 UTDF is included in a separate
document available from Trafficware.
Planning a Network for UTDF
Before setting up a UTDF it is necessary to do some planning. The following data items must be
agreed upon and set up before using UTDF:
Intersection Node Numbers
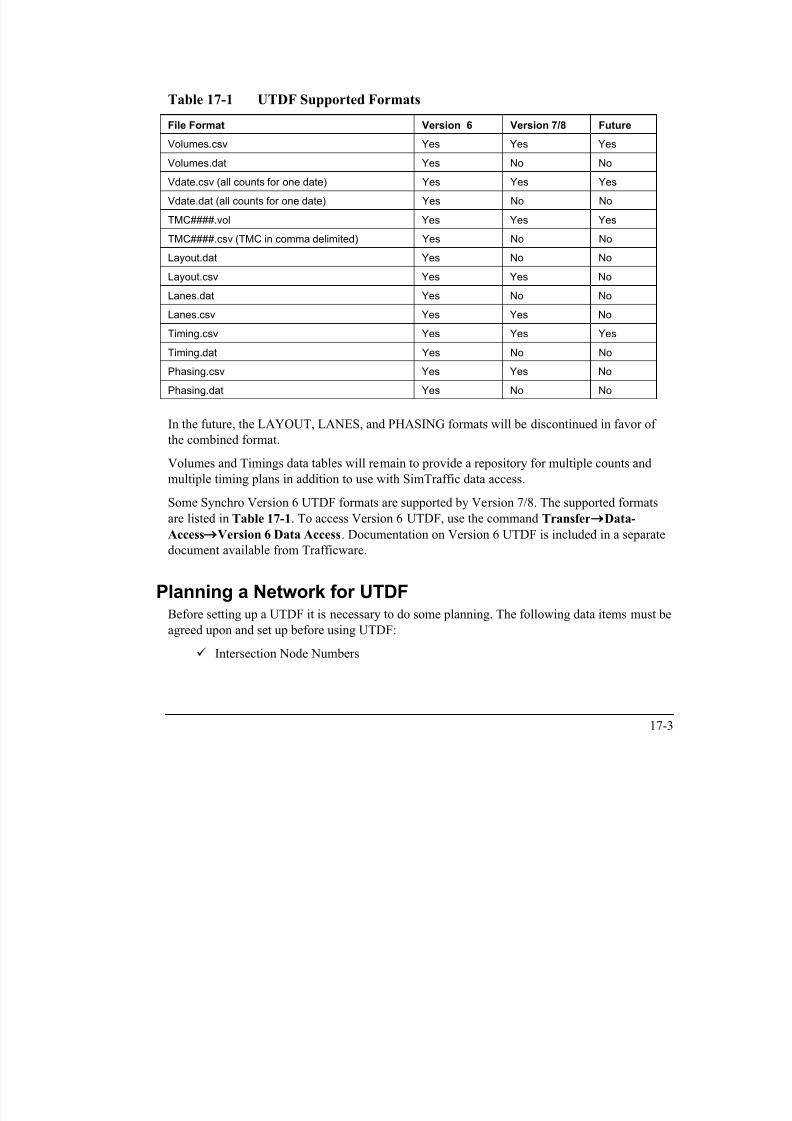
7/21/2019 Synchro Studio 8 User Guide
http://slidepdf.com/reader/full/synchro-studio-8-user-guide 371/559
17-4
Approach and Lane Group Designation: Especially at intersections where 5 or morelegs and diagonal legs exist, make sure lane group data in the UDTF file is consistent
with Synchro's view of the approaches. For instance, eastbound (EB) is defined for the
same movement(s) in Synchro and the UTDF file.
Phase Numbers: Make sure the phase numbers in Synchro match the phase numbers in
controllers and in the data files.
Node NumbersBefore starting, it is essential to carefully assign node numbers to each intersection.
If possible, these node numbers should match the controller's intersection numbers in any
centralized control system.
If multiple intersections have the same controller (Group Control), the Timing and Phasing data
will use the smallest node number of the intersections.
If there are multiple systems in your agency, it may be desirable to assign a range of node
numbers for each system. For example, the central system could use node numbers 1 to 99 and
the north system could use node numbers 100 to 199. This will allow systems to be combined
into one data file and will prevent mixing up data from different systems.
To see the node numbers used by Synchro, go to the MAP view and push the Show
Node Numbers button. The map with node numbers can be printed out for easy
reference. Node numbers can be changed by double clicking on the intersection when nodenumbers are showing.
Synchro node numbers can range from 1 to 9999.
Approaches and Lane Group Designations
Normally lane groups will have designations from the four cardinal directions, (north, south,east, and west) and the six turn movements (U-turn, left-2, left, through, and right, right-2).
At intersections with diagonal approaches or with more than four legs, the designations may be
ambiguous. Diagonal directions will be designated NE, NW, SE, or SW if the cardinal
directions are already taken.
7/21/2019 Synchro Studio 8 User Guide
http://slidepdf.com/reader/full/synchro-studio-8-user-guide 372/559
17-5
If there are any questions, write data from Synchro to a UTDF file to see which approaches are
assigned by looking at the Name records. Also be sure to look at which lane groups are actually
assigned; these will match the rules used by Synchro.
Data saved to a Volume or Lane section of the UTDF file will always include the
basic 12 lane groups, even if they are not used. This applies to T intersections and
to intersections with diagonal legs. This facilitates the development of external
utilities for accessing Synchro data. The first 12 columns for the basic lane groups
will always be present. Additional columns will be present when U-turns or diagonallegs are used.
Phase Numbers
Be sure that the phase numbers in Synchro match the phase numbers in the Phase and Timing
tables. Failure to use the same phase number could have disastrous results. These phase
numbers should also match the phase numbers in the hardware controllers.
It is probably best to make a list matching phase numbers to lane groups for each intersection.
The Phase records of the Lanes table can help with this, and can even be used to reassign
Synchro's phase numbers.
Reading and Writing UTDF DataData for UTDF 2006 is stored in one combined file. Data is separated into sections as detailed in
the following topics in the chapter. Often, users want a sample UTDF compatible format. The
best way to see this is to open an existing Synchro file and create (write) the data to UTDF.
To write out a UTDF file, do the following:
1. Open the Synchro file for which you want to write data out.
2. Select the menu command File Save-As.
3. Choose Comma Delimited from the ‘Save as Type’ dropdown
4. Enter a „File name‟ and press [Save].
5. The data from this Synchro file will now be in CSV file.
Synchro CSV data can be modified with a text editor or a spreadsheet. See the topic on Editing
UTDF Data with Other Software on page 17-6.
To read CSV data into an existing Synchro file, do the following:

7/21/2019 Synchro Studio 8 User Guide
http://slidepdf.com/reader/full/synchro-studio-8-user-guide 373/559
17-6
1. Backup your Synchro file.
2. Select the menu command File Merge.
3. Choose a CSV file from the list and press [Open].
The data from the selected CSV file will now be in the Synchro file. This process does not
create new links or nodes, and does not move or renumber nodes. It will merge in data from the
Data Settings screens for matching node numbers.
If there is data in the CSV file that you do not want to merge, delete from the CSV
file prior to merging.
To read CSV data into a new Synchro file, do the following:
1. Select the menu command File Open.
2. Choose Comma Delimited from the ‘Files of type’ dropdown
3. Choose a CSV file from the list and press [Open].
The data from the selected CSV file will now be in the Synchro file. This process imports all of
the CSV data into the Synchro file, including nodes and links. For the minimum data needed in
the CSV file, refer to page 17-20.
Editing UTDF Data with Other Software
The UTDF 2006 file is a comma delimited (CSV) file. To edit the CSV files simply open the
files with a spreadsheet such as Microsoft Excel. Be sure to save the file as comma-aligned
and not as Excel format. If you have created any formulas in your spreadsheet, be sure to first
save the file in spreadsheet format. Then, save the file to UTDF CSV format.
Using TMC Files
TMC files are text files that store timing data from a single intersection from multiple time
periods. The data is stored in a fixed length format with each line representing a single time
period. Some sample data from a TMC file is shown here:

7/21/2019 Synchro Studio 8 User Guide
http://slidepdf.com/reader/full/synchro-studio-8-user-guide 374/559
17-7
15 Minute Turning Movement CountReference #07 - 1st St at Main St: 05/14/03
=================================================================
TIME NBL NBT NBR SBL SBT SBR EBL EBT EBR WBL WBT WBR
=================================================================
0700 32 130 11 6 168 13 4 4 8 6 4 1
0715 38 174 31 11 204 10 5 3 10 12 4 6
0730 32 226 31 10 265 12 12 7 24 16 1 1
0745 47 261 36 19 347 29 21 8 14 21 1 80800 79 304 44 21 282 33 24 21 14 14 3 6
0815 34 226 36 14 226 19 9 5 22 21 2 13
The first line must say 15 MINUTE TURNING MOVEMENT COUNT. The second line lists
the column names. Subsequent lines list the start time and turning movement counts for each
direction.
Converting TMC Data to and from UTDF Data
Synchro can read and write TMC files directly. Use the command Transfer
Data-
Access Version 6 Data Access and choose the Read Volume tab. Be sure to set the file style
to "By Int, TMC Style (TMC###.VOL)".
The TMC files must have the filenames of TMC#.VOL where # is the node number. A TMC
file for node # 31 would have the name TMC31.VOL for example.
UTDF SpecificationsEach section is started by a line with the section title in square brackets. Between each section
is a blank line. The sections in the UTDF file are discussed below.
[Network]
Data common to the network goes in this section.
[Nodes]
Data for a node goes here, including data common to the network. This includes node type,
coordinates, etc.
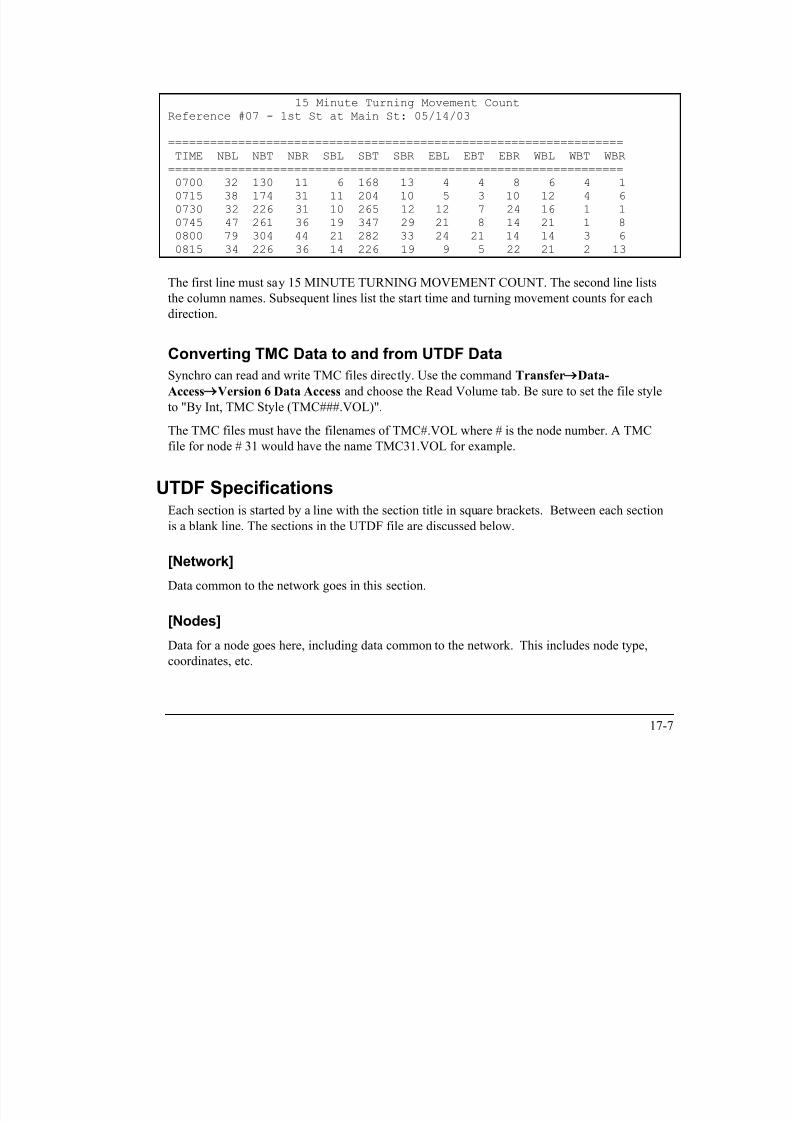
7/21/2019 Synchro Studio 8 User Guide
http://slidepdf.com/reader/full/synchro-studio-8-user-guide 375/559
17-8
[Links]
This section includes data for a link, name, speed, distance, curve points, etc.
[Lanes]
Data for a lane group or movement, includes volumes, lanes, and most data from these screens.
Phase numbers, detector data,
[Timeplans]
Data specific to a timing plan
[Phases]
Data specific to a phase
Network Section
The data found in the Network section includes some of the network wide settings as follows:
[Network]
Network Settings
RECORDNAME,DATA
Metric,0yellowTime,5.0
allRedTime,0.0
Walk,5.0
DontWalk,15.0
HV,0.02
PHF,0.90
DefWidth,12
DefFlow,1900vehLength,25
growth,1.00
PedSpeed,4.0
LostTimeAdjust,0.0

7/21/2019 Synchro Studio 8 User Guide
http://slidepdf.com/reader/full/synchro-studio-8-user-guide 376/559
17-9
Metric: 0 for feet, and 1 for meters. It is very important to include this value first so that the fileis setup with the correct units. All distances after will be feet (+-1 ft) or meters (+- 0.1m).
Speeds are mi/hr or km/hr unless noted.
The other values are default settings defined in the Network settings. Times are (+-0.1s).
vehLength: Network wide setting for the calculation of queue lengths
PedSpeed: Network wide setting for SimTraffic (ft/s or m/s).
Nodes Section
Node and Link sections replaces the Layout table of past version of UTDF. The settings are as
follows:
[Nodes]
Node Data
INTID, Type, X, Y, Z, Description, CBD1, 0, 1000, 1000, 0, “”, 0
Type: 0 for signalized intersection, 1 for external node, 2 for bend, 3 for unsignalized, 4 for
roundabout
X, Y, Z: Coordinates of node, Z is elevation.
Description: Textual description, enclosed in quotes. Replace new line/CR with “ÿ” (ANSI
character 255).
When reading a nodes section, existing nodes with the same number will be moved to this
location. Existing nodes at this location will not be renumbered. Do not attempt to use this data
to renumber nodes.
Links Section
Links records contain data to create a link and also information specific to a link.
Unlike the Lanes records, Link records are used for external nodes and bend nodes.
[Links]
Link Data
RECORDNAME,INTID,NB,SB,EB,WB,NW,SE
Up ID,241,4971,290,289,243,,
Lanes,241,3,1,2,4,,Name,241,Washington,Washington,Broad,Broad,,

7/21/2019 Synchro Studio 8 User Guide
http://slidepdf.com/reader/full/synchro-studio-8-user-guide 377/559
17-10
Distance,241,248,304,854,391,,
Speed,241,30,30,30,30,,
Time,241,5.6,6.9,19.4,8.9,,
Grade,241,0,0,0,0,,
Median,241,0,0,24,24,,
Offset,241,0,0,0,0,,
TWLTL,241,0,0,0,0,,
Crosswalk Width,241,16,16,16,16,,
Mandatory Distance,451,,,200,200,200,Mandatory Distance2,451,,,1320,1320,1320,
Positioning Distance,451,,,880,880,880,
Positioning Distance2,451,,,1760,1760,1760,
Curve Pt X,241,,,820,,,
Curve Pt Y,241,,,-22,,,
Curve Pt Z,241,,,767112,,,
Links are by direction, two links are needed to connect two nodes.
Link records are used for every node including externals and bends.
Link “Up ID” record is used to connect nodes upon reading; and also for setting the direction of
these nodes.
UPID: Upstream node number
Lanes: Number of lanes, for bend or external; calculated by Synchro unless marked with *
Distance: travel distance, calculated by Synchro unless marked with *
Time: Travel time; calculated by Synchro unless marked with *
Speed: Travel speed, mph or km/h
Grade: Grade in percent
Median: Median width, calculated by Synchro unless marked with *
Offset: Offset of link to right of center line, normally zero.
TWLTL: 1 indicates a TWLTL for link (Visual Only).
Crosswalk Width: Width of crosswalk at end of link. Also affects the radius of the curb and
right turns.
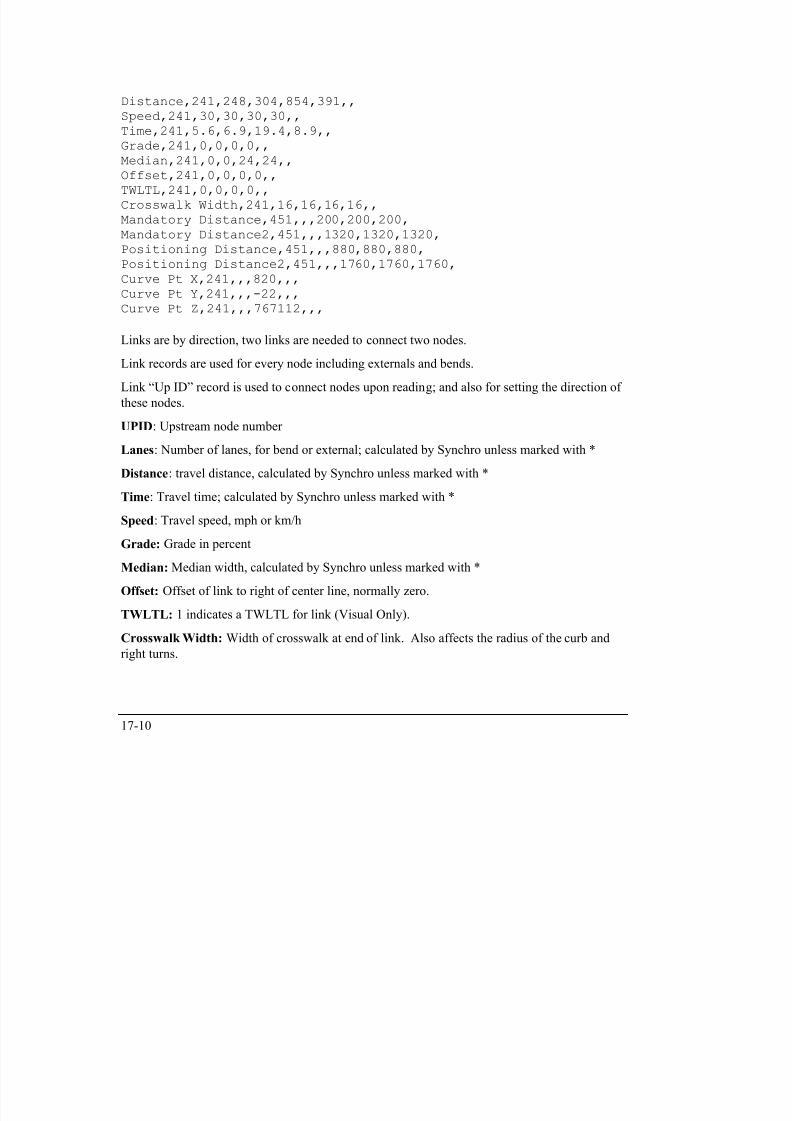
7/21/2019 Synchro Studio 8 User Guide
http://slidepdf.com/reader/full/synchro-studio-8-user-guide 378/559
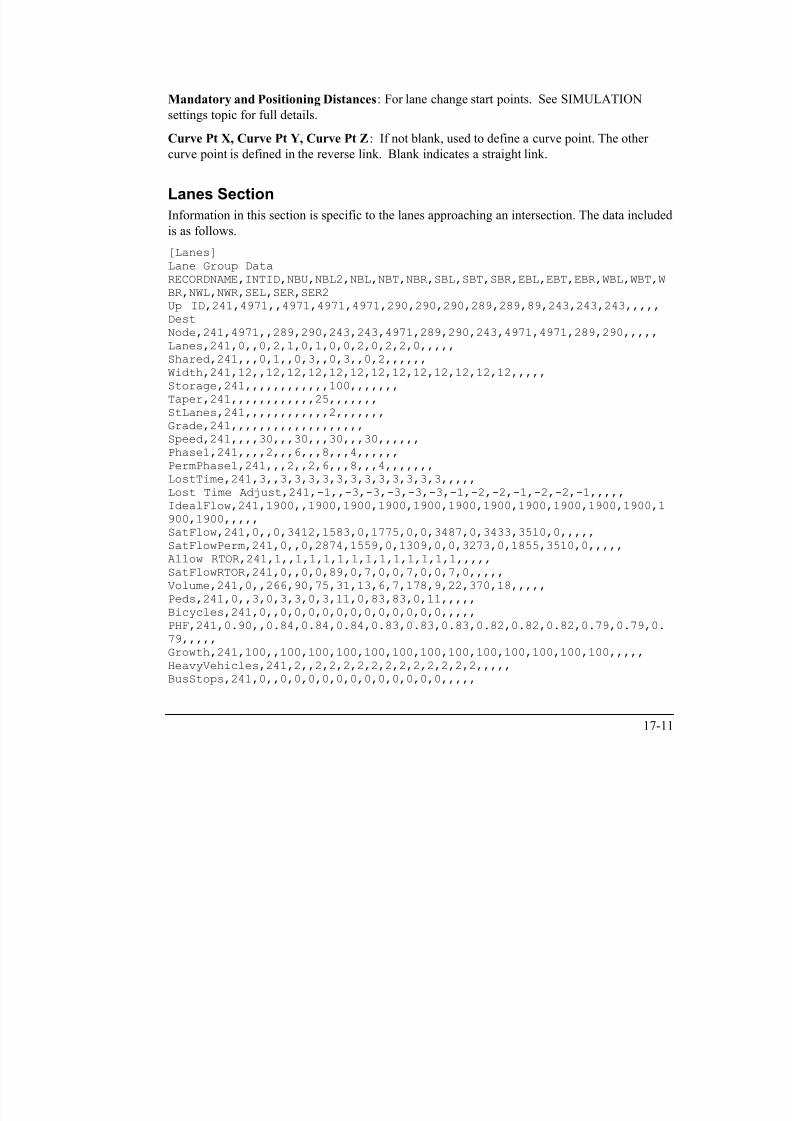
7/21/2019 Synchro Studio 8 User Guide
http://slidepdf.com/reader/full/synchro-studio-8-user-guide 379/559
17-12
Midblock,241,,,,0,,,0,,,0,,,0,,,,,,
Distance,241,,,,248,,,304,,,854,,,391,,,,,,
TravelTime,241,,,,5.6,,,6.9,,,19.4,,,8.9,,,,,,
Right Channeled,241,,,,,4,,,0,,,0,,,0,,,,,
Right Radius,241,,,,,50,,,,,,,,,,,,,,
Add Lanes,241,,,,,0,,,,,,,,,,,,,,
Alignment,241,3,,0,0,1,0,0,1,0,0,1,0,0,1,,,,,
Enter Blocked,241,0,,0,0,0,0,0,0,0,0,0,0,0,0,,,,,
HeadwayFact,241,1.00,,1.00,1.00,1.00,1.00,1.00,1.00,1.00,1.00,1.00,1.00
,1.00,1.00,,,,,Turning Speed,241,9,,15,35,9,15,35,9,15,35,9,15,35,9,,,,,
FirstDetect,241,,,50,100,20,50,100,,50,70,,20,100,,,,,,
LastDetect,241,,,0,0,0,0,0,,0,0,,0,0,,,,,,
DetectPhase1,241,,,2,2,2,6,6,,8,8,,4,4,,,,,,
DetectPhase2,241,,,0,0,0,0,0,,0,0,,0,0,,,,,,
ExtendPhase,241,,,2,2,2,6,6,,8,8,,4,4,,,,,,
SwitchPhase,241,,,0,0,0,0,0,,0,0,,0,0,,,,,,
numDetects,241,,,1,2,1,1,2,,1,2,,1,2,,,,,,
DetectPos1,241,,,0,0,0,0,0,,0,0,,0,0,,,,,,
DetectSize1,241,,,50,6,20,50,6,,50,6,,20,6,,,,,,
DetectType1,241,,,3,3,3,3,3,,3,3,,3,3,,,,,,
DetectExtend1,241,,,0,0,0,0,0,,0,0,,0,0,,,,,,
DetectQueue1,241,,,0,0,0,0,0,,0,0,,0,0,,,,,,
DetectDelay1,241,,,0,0,0,0,0,,0,0,,0,0,,,,,,
DetectPos2,241,,,,94,,,94,,,64,,,94,,,,,,
DetectSize2,241,,,,6,,,6,,,6,,,6,,,,,,
DetectType2,241,,,,3,,,3,,,3,,,3,,,,,,DetectExtend2,241,,,,0,,,0,,,0,,,0,,,,,,
The Lanes section is similar to Lanes table in UTDF 2 (Synchro version 6 format). These notes
apply to both the table and the section of UTDF 2006.
Up ID: Upstream node number, write only. Used for assistance in converting data for use with
planning software. Planning software sees a lane group as an origin and destination node, rather
than NBL.
Dest Node: Destination node number for this movement, write only. For assistance in
converting data for use with planning software.
Lanes: For each lane group, enter the number of lanes. Shared lanes count as through lanes,
unless there is no through movement, in which case LR lanes count as left lanes,

7/21/2019 Synchro Studio 8 User Guide
http://slidepdf.com/reader/full/synchro-studio-8-user-guide 380/559
17-13
Shared: Enter code for sharing of this lane with adjacent movements. This field specifies which
movements the through lanes are shared with. Enter 0, 1, 2, 3 for No-sharing, Shared-with-Left,
Shared-with-right, Shared-with-both. This field is normally 0 for turning lane groups. If a left
lane shares with left2 or u-turns, the sharing is coded as a '1'.
Width: Enter the average lane width for the group in feet or meters. Decimal meters permitted.
Storage: Enter the length of a turning bay if applicable. Leave this field blank for through lane
groups or if the turning lane goes all the way back to the previous intersection.
Taper: The value of the storage taper length.
StLanes: Enter the number of lanes in the storage bay. This can be more or less than the number
of turning lanes, but must be at least 1.
Grade: Write only, use the new Links section.
Speed: Write only, use the new Links section.
Phase1, Phase2, Phase3, Phase4: Each lane group can have four primary phases associated
with them. Enter phases that give a green to this movement in these fields. Enter -1 for an
uncontrolled movement.
PermPhase1, PermPhase2, PermPhase3, PermPhase4: Each lane group can have four
permitted phases associated with them. With permitted phases, left turns must yield to oncoming
traffic, right turns must yield to pedestrians.
LostTime: Write only, use Lost Time Adjust.
Lost Time Adjust: Combination of Startup Lost time minus Extension of Effective Green.
Total Lost Time = Yellow + All Red + Lost Time Adjust
IdealFlow: Ideal Saturated Flow Rate per lane. 1900 by default.
SatFlow: Saturated flow rate for protected movements. Normally calculated, * indicates
overridden value.
SatFlowPerm: Saturated flow rate for permitted movements. Normally calculated, * indicates
overridden value.
SatFlowRTOR : Saturated flow rate for RTOR movements. Normally calculated, * indicates
overridden value.
Allow RTOR : 1 = RTOR allowed, 0 = no

7/21/2019 Synchro Studio 8 User Guide
http://slidepdf.com/reader/full/synchro-studio-8-user-guide 381/559
17-14
Volume: The volume table is the preferred method for storing volumes. This entry is provided
to allow convenient transferring of all data.
Peds: Number of pedestrians conflicting with the right turn movement
Bicycles: Number of bicycles conflicting with the right turn movement
PHF: The volume table is the preferred method for storing volumes. Synchro automatically
calculates the PHF when reading 15 minute count data from volume tables. This entry is
provided to allow convenient transferring of all data.
Growth: The percent growth rate applied to volumes. 100 by default.
HeavyVehicles: The percent of trucks, busses, and RVs for each movement.
BusStops: The number of bus stops per hour blocking traffic.
Midblock : Percent of traffic originating from mid-block driveways.
Distance: Write only, use the new Links section.
TravelTime: Write only, use the new Links section.
Right Channeled: If R and R2 movements exist; listed for R2 movement. Values are
0 no
1 yield
2 free
3 stop
4 signal;
Right Radius: If right turn channeled, curb radius of right turn
Add Lanes: Number of add lanes after right turn channel
Alignment: Controls how add lanes align thru an intersection;
0 align left, 1 align to right, 2 align left no adds, 3 align right no adds
Enter Blocked: 0 vehicles wait if no space in node, 1 vehicles do not make check
HeadwayFact: Headway factor. Adjusts headways in simulation
Turning Speed: The simulation turning speed.
7/21/2019 Synchro Studio 8 User Guide
http://slidepdf.com/reader/full/synchro-studio-8-user-guide 382/559
17-15
FirstDetect: Distance from the leading extension detector to stop bar in feet or meters. Leave
blank if no detectors for lane group. Supplemented by actual detector information.
LastDetect: Same definition as ver 6, supplemented by actual detector information
DetectPhase1, 2, 3, 4: is being discontinued in favor of Extend Phase and Switch Phase
DetectPhase1: Write only for compatibility, use extend phase
DetectPhase2: Write only for compatibility, use switch phase
ExtendPhase: Detector calls go to this phase
SwitchPhase: Will set switch phase. Be very careful with switch phase, because extend phase
will not get called when switch phase is green, per NTCIP specs.
numDetects: Number of detector rows
DetectPos1… DetectPos5: Distance from detector to stop bar. Detector 1 is closest to stop bar
DetectSize1… DetectSize5: Size of detector longitudinally
DetectType1… DetectType5: Detector type, sum of these flags, only 1 and 2 are currently
implemented in Synchro.
1 = call
2 = extend
4 = queue detector (set non-zero value for queue time)
8= count volume
16 = count occupancy
32 = yellow lock
64 = red lock
128 = passage detector, Synchro currently assumes all detectors are presence
256 = added initial
DetectExtend1… DetectExtend5: Extend time for detector
DetectQueue1: Queue time for detector, detector 1 only
DetectDelay1: Delay time, detector 1 only

7/21/2019 Synchro Studio 8 User Guide
http://slidepdf.com/reader/full/synchro-studio-8-user-guide 383/559
17-16
Any input data item appearing in the following screens is included:
Settings Notes
Lanes all inputs expect: name, distance, travel time, speed, grade
Volumes all inputs, including link OD volumes
Timings phase mappings, others in Phase section
Signing sign control, median to be redone, right turn channelized
Phasings none, in phase section
Simulate all except those appearing in Link sectionDetectors all
Also included, origin node and destination node, WRITE ONLY, for assistance when
transferring to and from planning models.
Time Plan Section
This section contains data common to a timing plan, but not for a phase. The combined file usesTimeplan data in conjunction with Phases data.
[Timeplan]
Timing Plan Settings
RECORDNAME,INTID,DATA
Control Type,241,3
Cycle Length,241,100.0
Lock Timings,241,0Referenced To,241,0
Reference Phase,241,206
Offset,241,16.0
Master,241,0
Yield,241,0
Node 0,241,241
Node 1,241,0
Control Type: 0 pretimed, 1 actd uncoord, 2 semiact uncoord, 3 actd coordinated
Cycle Length: Cycle length; write only; cycle length on read is sum of phase split times
Lock Timings: 0 unlocked, 1 locked; timings will still be read from Time Plan and Phasings
section when locked
Referenced To: The part of phase to which offsets are referenced.
0: refGreen, the last of the phases to turn green (TS1 style)

7/21/2019 Synchro Studio 8 User Guide
http://slidepdf.com/reader/full/synchro-studio-8-user-guide 384/559
17-17
1: refYellow, the first phase to turn yellow (170 style without rest in walk)
2: refRed, the first phase to turn red (not used often)
3: refFirstGreen, the first referenced phase to turn green (TS2 style)
4: ref170, the beginning of flashing don‟t walk (170 style with rest in walk)
Reference Phase: phase number(s) offsets are referenced to. If two phases are referenced, the
phase for ring A is multiplied by 100, phases 2 and 6 are written 206.
Offset: offset in seconds; Offset is referenced as specified by Referenced to and Referenced
Phase. On reading, the Start Times in Phasings section read after will override the offsets here.
To read offsets, include a second TimePlan section with offset records only, after the Phasings
section.
Some NEMA TS-2 controllers reference offsets to the first coordinated phase to turn green. Use
TS2 referencing by adding a '+' character, a refphase of 26+ indicates that offsets are referenced
to the first of phase 2 or 6 to turn green.
With negative refPhase, the offset is referenced to the controllers yield point. A value of 26-
indicates that offsets are referenced to the first of phases 2 or 6 to turn yellow. A value of 0
indicates that offsets are referenced to the beginning of the first phase.
Master: 0 normal; 1 master controller, master controller will keep offset at zero, only one
master allowed per cycle length
Yield: 0 single, 1 flexible, 2 by phase. Defines yield points for non-coordinated phases.
Node 0, Node 1, …, Node 7: Used to assign multiple nodes to one controller. If nodes 101 and
102 use the same controller; the timing plan and phasing data will only be included for INTID
101. The node records for INTID 101 will be:
Node 0,101,101
Node 1,101,102
Node 2,101,0A zero value indicates no more nodes. There will be no time plan and phasing records for node
102, they are defined by node 101.

7/21/2019 Synchro Studio 8 User Guide
http://slidepdf.com/reader/full/synchro-studio-8-user-guide 385/559
17-18
Phasing Section
This section contains phasing data. The combined file uses Phases data in conjunction with
Timeplan data.
[Phases]
Phasing Data
RECORDNAME,INTID,D1,D2,D3,D4,D5,D6,D7,D8
BRP,241,111,112,211,212,121,122,221,222MinGreen,241,,6,,7,,6,,7
MaxGreen,241,,44,,45,,44,,45
VehExt,241,,2,,2,,2,,2
TimeBeforeReduce,241,,0,,0,,0,,0
TimeToReduce,241,,0,,0,,0,,0
MinGap,241,,2,,2,,2,,2
Yellow,241,,5,,4,,5,,4
AllRed,241,,1,,1,,1,,1Recall,241,,0,,3,,0,,3
Walk,241,,7,,7,,7,,7
DontWalk,241,,18,,15,,18,,15
PedCalls,241,,0,,0,,0,,0
MinSplit,241,,32,,27,,32,,27
DualEntry,241,,1,,0,,1,,0
InhibitMax,241,,1,,1,,1,,1
Start,241,,16,,66,,16,,66
End,241,,66,,16,,66,,16
Yield,241,,60,,11,,60,,11
Yield170,241,,42,,96,,42,,96
LocalStart,241,,0,,50,,0,,50
LocalYield,241,,44,,95,,44,,95
LocalYield170,241,,26,,80,,26,,80
ActGreen,32.1
Used for data specific to a phase. One entry for each input row on the phasings settings.
BRP:Eentry is for rings and barriers.
MinGreen: Minimum green time (tenths of seconds)
MaxGreen: This is the maximum time the phase is green.

7/21/2019 Synchro Studio 8 User Guide
http://slidepdf.com/reader/full/synchro-studio-8-user-guide 386/559
17-19
VehExt: This is the time the signal is held green by each actuation. It is also the maximum gap
when using a volume density controller (hundredths of seconds).
TimeBeforeReduce: This is the time before gap reduction starts on volume density controllers
(seconds).
TimeToReduce: This is the amount of time to reduce the gap from VehExt to MinGap.
MinGap: This is the minimum gap to achieve (hundredths of seconds).
Yellow: This is the time each phase displays yellow (tenths of seconds). AllRed + Yellow mustequal a whole number of seconds.
AllRed: This is the time each phase displays all-red clearance before the next phase (tenths of
seconds). AllRed + Yellow no longer need to equal a whole number of seconds for Synchro.
Recall: This field can have the following values, 0 = no recall, 1 = minimum recall, 2 =
pedestrian recall, 3 = maximum recall, 4 = rest in walk. If recall is not zero, the phase will be
serviced on every cycle for the miminum green time, walk+don' walk time, or maximum greentime respectively.
If only one (or two simultaneous phases) are set to recall, the signal will rest on those phases. If
these phases are set to RestInWalk, the signal will rest on walk in these phases. Note that with
some 170 controllers, if Rest in walk is used, the offsets are referenced to the beginning of Dont
Walk.
Walk: This is the time for the Walk indication or 0 for no pedestrian phase (seconds).DontWalk: This is the time for the Flashing Don't Walk interval (seconds). Note that Flashing
dont walk ends at the start of yellow time.
PedCalls: This is the number of pedestrian calls per hour received by this phase. Set this field to
blank for no pedestrian phase. Set this field to zero or other number to activate a pedestrian
phase. If PedCalls is not used, a 0 or blank in DontWalk can be used to turn off the pedestrian
phase.
MinSplit: Minimum Split is used by Synchro during split optimization. This value does map to
a value found in traffic signal controllers.
DualEntry: Can be set to Yes or No (1=Yes, 0=No). Select Yes to have this phase appear
when a phase is showing in another ring and no calls or recalls are present within this ring and
barrier.

7/21/2019 Synchro Studio 8 User Guide
http://slidepdf.com/reader/full/synchro-studio-8-user-guide 387/559
17-20
InhibitMax: Can be set to Yes or No (1=Yes, 0=No). Inhibit maximum termination is used to
disable the maximum termination functions of all phases in the selected timing ring. In Synchro,
this is the Fixed Force Off setting.
Start: Is the begin time referenced to the system clock
End: Is the end time of the phase referenced to the system clock.
Yield170: Is the phase yield or force-off time, referenced to the system clock, beginning of
yellow. It is referenced to the beginning of FDW if recall is set to CoordMax. LocalStart, LocalYield, LocalYield170: These are the same values as above except they are
referenced to the local offset point.
Start Time is read and used to set offsets.
ActGreen is the actuated green time and is the average of the five percentiles used for HCM
analysis. To get the Actuated Split, add the Yellow and All Red time (from this section). This
record is write only, Synchro will not read it.
Minimum Data Necessary to build a Synchro fileIf you want to build a Synchro file from scratch, these data items are needed.
[Network]
First record is Metric. Always include Metric record first so that speeds and distances are
interpreted correctly. Use “0” for feet and mph and “1” for m and km/h
The other records can be blank for defaults
[Node]
Coordinate and node number information is needed, along with node type.You need to build external nodes for links that do not connect to another signal.
[Link]
Build two links for all connected nodes.
Up and down node numbers for all links.
7/21/2019 Synchro Studio 8 User Guide
http://slidepdf.com/reader/full/synchro-studio-8-user-guide 388/559
17-21
Street Name and speed.
Distance and travel time can be calculated by Synchro and left blank.
Other fields can be left blank.
[Lane]
Required Records:
LanesShared
StLanes
Storage
Phase1
PermPhase1
Volume
Peds
DetectPhase1The remaining records can be skipped to use defaults.
[Timeplan]
Required Records:
Control Type
Cycle Length
Referenced To
Reference Phase
Offset
The remaining records can be skipped to use defaults.
[Phasing]
Required Records:MinGreen
MaxGreen
VehExt
Yellow
AllRed
Recall
Walk
DontWalk

7/21/2019 Synchro Studio 8 User Guide
http://slidepdf.com/reader/full/synchro-studio-8-user-guide 389/559
17-22
The remaining records can be skipped to use defaults.

7/21/2019 Synchro Studio 8 User Guide
http://slidepdf.com/reader/full/synchro-studio-8-user-guide 390/559
18-1
Chapter 18 – Errors and Warnings
Coding Error MessagesSynchro and SimTraffic includes a feature that will check data files for coding errors. This topic
lists the possible errors along with suggestions for correcting them.
General Coding ErrorsTo check for general coding errors in Synchro, simply choose the Options Coding Error
Check . To check for errors in SimTraffic, launch SimTraffic from Synchro.
Synchro Errors and Warnings
Warnings indicate likely problems, but they may be acceptable in certain circumstances. Errorsindicate serious problems that require fixing.
Next to each error number, letters appear indicating to which checks the error applies.
Code Applies To
S General Synchro Error
C CORSIM related error
H HCS related error
Table 18-1 Synchro Warnings
Error # Code Cause & Resolution
100 SC Volume received at intersection, less than 70% sent. This is a problem with
balancing volumes. Less volume is put onto a link upstream than volume
exists downstream. This problem may occur due to volume counts collected
at different times. It is possible to have a mid-block traffic source. In thiscase, specify mid-block traffic or add an unsignalized intersection and route
traffic onto the link.
101 SC Volume received at intersection, more than 200% sent. This is a problem
with balancing volumes. More volume is put onto a link upstream than
volume exists downstream. This problem may occur due to volume counts
collected at different times. It is possible to have a mid-block traffic sink. In
this case, add an unsignalized intersection and route traffic off the link.

7/21/2019 Synchro Studio 8 User Guide
http://slidepdf.com/reader/full/synchro-studio-8-user-guide 391/559
18-2
Error # Code Cause & Resolution102 SCH Turning Volume entered with no turning or shared lane. A turning lane was
not explicitly coded. Synchro will assume that a through lane is shared. This
warning may indicate a problem with volume inputs at a one-way street.
108 S Volume exceeds capacity. The lane group listed has volume exceeding
capacity. This could be a fatal error or everyday operation depending on the
area studied. Check the data to make sure this intersection was coded
correctly. 109 SCH Defacto Left Turn Lane, delays and v/c values not correct. Defacto lanes
should be taken seriously. It is possible that the v/c ratio for the entire group
is acceptable, while the v/c ratio for the turning lane is not acceptable. To
correct a defacto turning lane, recode one of the through lanes as a turning
lane and turn sharing off for that turn. A defacto left or right turn lane usually
indicates the need for an additional exclusive turning lane.
110 SCH Defacto Right Turn Lane, delays and v/c values not correct. Defacto lanesshould be taken seriously. It is possible that the v/c ratio for the entire group
is acceptable, while the v/c ratio for the turning lane is not acceptable. To
correct a defacto turning lane, recode one of the through lanes as a turning
lane and turn sharing off for that turn. A defacto left or right turn lane usually
indicates the need for an additional exclusive turning lane.
111 S Detector Phase is not a phase for the lane group. Normally a movement's
detectors should call one or more of the phases serving that movement.
112 S Detector Phase is blank, but movement does not have maximum recall. If a
movement has no detection, be sure to set its phases to maximum recall. It
is okay to code a detector phase when no detection exists, but be sure to
set the phase's recall to maximum.
122 SH Protected left without left lane is inefficient. This is a protected left phase
with no left turn lane. Left traffic will block through traffic during the through
phase. The v/c, delay, and LOS results for this approach may be suspect. If
you are using this left phase as a pedestrian only phase at a „T‟ intersection, ignore this error.
123 SCH Possible trapping, lagging left turn with oncoming permitted lefts. This
warning points out a potentially hazardous situation of trapped cars. If a car
is trying to make a permitted left turn and sees a yellow light, the driver may
think the oncoming traffic also has a yellow light. In reality, oncoming traffic
continues due to the lagging left turn.
124 CH Phases must be changed for conversion to single ring timing. Both HCS

7/21/2019 Synchro Studio 8 User Guide
http://slidepdf.com/reader/full/synchro-studio-8-user-guide 392/559
18-3
Error # Code Cause & Resolution
and CORSIM (pretimed) model signals as a single ring. This intersection's
timing cannot be modeled as a single ring without modification. This
phenomenon occurs when one phase turns yellow while a phase in another
ring is in the middle of a yellow. For example, phase 1 turns yellow at time
20 and phase 5 turns yellow at time 22, and they both have a yellow time of
4 seconds.
126 SC Minimum Gap is greater than Vehicle Extension. When using volume
density controllers, the gap is reduced from Vehicle Extension to Minimum
Gap. It is an error if Minimum gap is larger than vehicle extension. CORSIM
will give a fatal error with this input.
127 C Actuated coordinated single ring, CORSIM may trouble when phase 6 not
used. CORSIM seems to have trouble modeling actuated signals in
coordination unless both phases 2 and 6 are used. The work
around is to use both phases 2 and 6 or to use phase 1.
This problem appears to be fixed in CORSIM version 4.32. 128 SCH All Red less than 0.5. Check the PHASING settings.
129 S Volume Density operation not recommended with long detection zone. The
travel time across the detection zone will effectively be added to both the
Minimum and Maximum gap times, making the operation less effective.
Check the Time to Reduce, Time before reduce, and Minimum Gap
settings.
130 C A coordinated phase is leading, CORSIM may have problems. The FHWA
has stated that CORSIM does not support phases 1 or 5 as lagging in an
actuated-coordinated signal. It is recommended to model these signals
using phase 2 and 6 as the lagging phases even if this means assigning a 2
or 6 to an actuated left turn phase. Another alternative is to model this
intersection as pretimed.
This problem appears to be fixed in CORSIM version 4.32.
131 C Left, Thru and Diagonal together for pretimed. CORSIM does not have
pretimed phase codes to fully control traffic with all these movements.
Some phase codes may be incorrect. If all movements share the same
phases, this configuration will work.
132 C U-turns cannot be modeled in CORSIM. The U-turn traffic was coded on
this link will not be transferred to CORSIM.

7/21/2019 Synchro Studio 8 User Guide
http://slidepdf.com/reader/full/synchro-studio-8-user-guide 393/559
18-4
Error # Code Cause & Resolution
133 C Too many lane groups, this lane group is dropped. CORSIM is limited to 4
lane groups, Left, Through, Right, and Diagonal. Synchro can model five
plus U-turns. In some cases not all Synchro lane groups can be translated
into CORSIM lane groups.
134 C Storage bays for through or diagonal lanes not allowed in CORSIM.
140 S Lane group did not transfer.
141 S NBT imported as NBR, check Lane Assignments. If there was a TL lane, it
will become a R only lane because right lanes cannot share with left. Either
realign the links so the movement is through or change the lane codings. In
Synchro version 5, approaches will not be considered diagonal unless they
are more than 35 degrees away from an orthogonal direction or the
orthogonal direction is used by another approach.
142 S SBT imported as SBL, check data. You may wish to realign the links to
preserve the lane groups from Synchro version 3.2. In version 5,approaches will not be considered diagonal unless they are more than 35
degrees away from an orthogonal direction or the orthogonal direction is
used by another approach.
160 H Grade exceeds X%. The grade was changed when creating an HCS file.
The range for grades is +10% to -6% for SIGNAL and +4% to -4% for
UNSIGNAL.
170 S Poor coordination downstream is causing spillback. Node #X (direction)capacity is reduced along and the v/c ratio is increased.
171 S Lack of coordination downstream is causing spillback. Node #X capacity
will be reduced and the delay and v/c ratio will increase.
172 S Poor coordination upstream is causing starvation. Node #X capacity will be
reduced and the delay and v/c ratio will increase.
173 S Lack of coordination upstream is causing starvation. Node #X capacity will
be reduced and the delay and v/c ratio will increase.
174 S Storage blocking is occurring. Left or right turn pocket is getting blocked by
the through movement. Node #X capacity will be reduced and the delay
and v/c ratio will increase.
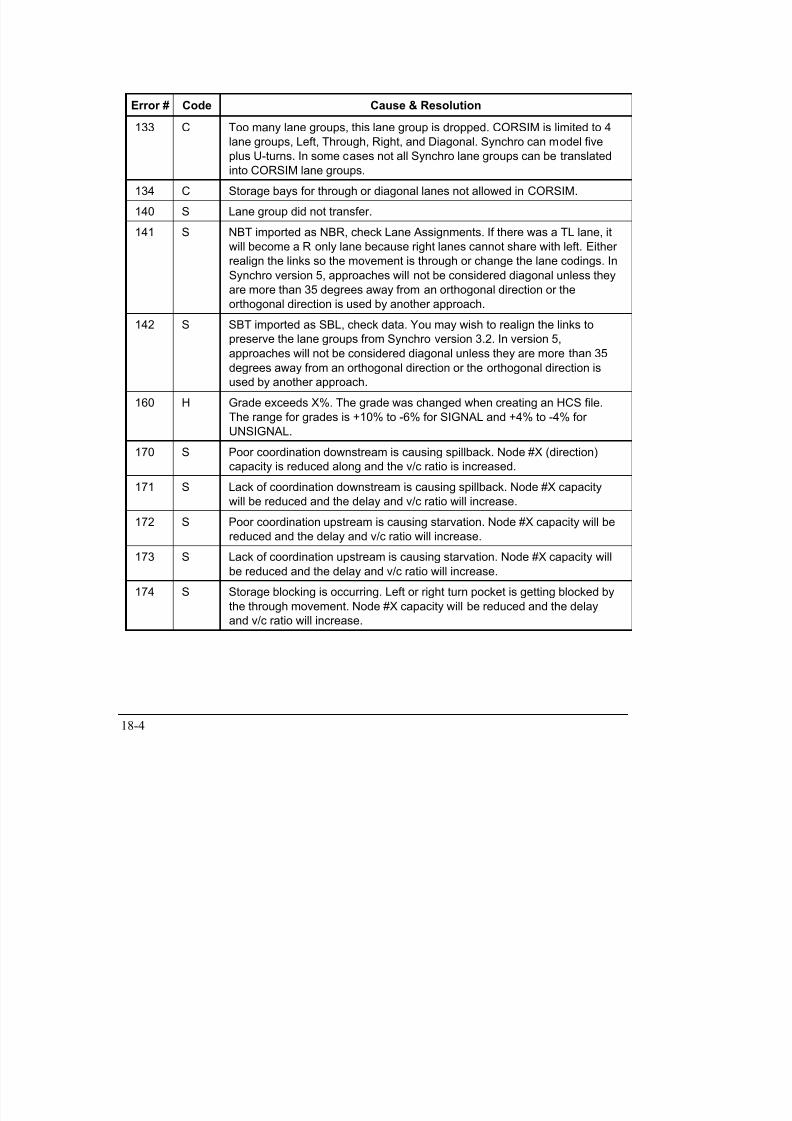
7/21/2019 Synchro Studio 8 User Guide
http://slidepdf.com/reader/full/synchro-studio-8-user-guide 394/559
18-5
Table 18-2 Synchro Errors
Error # Code Cause & Resolution
201 C Node number for CORSIM exceeds 1000. CORSIM requires all node
numbers to be 1000 or less. To perform a CORSIM analysis, change the
node number to less than 1001.
It is not necessary to code the entry nodes 8000 to 8999 within
Synchro. Synchro creates the 8000 series node automatically in the
trf file.
202 C Link Distance is less than 50 feet. CORSIM requires link distances to be
between 50 and 4000 feet. Change the distance to be at least 50 feet or
combine the 2 intersections. If necessary, the speed can be adjusted to
compensate for the change in travel time.
203 C Link Distance exceeds 4000 feet. CORSIM requires link distances to be
between 50 and 4000 feet. Change the distance to be less than 4000 feet
or disconnect the 2 intersections. If necessary, the speed can be adjusted
to compensate for the change in travel time. To disconnect the
intersections, first create two bends in the link connecting the intersections,
then delete the middle segment.
Prior versions of CORSIM required the distance between coor-
dinates to be within 20% of coordinate distance. CORSIM version
4.32 no longer requires coordinate and input distances to match.
205 C Too many turning lanes, maximum for CORSIM is 3. CORSIM has a limit of
up to 3 left or right turn lanes. Reduce the number of lanes or consider
coding a through-shared lane.
205 SCT Volume sent to intersection, not received. This is a problem with balancing
volumes. Volume is put onto a link upstream and no volume exists
downstream. This problem may occur due to an uncompleted network. If
this is the case, try putting the completed intersections into a zone and
perform the analysis on the completed intersections only. CORSIM will givefatal errors if this problem is not corrected. It is possible to have a mid-block
traffic sink, in this case add an unsignalized intersection and route all traffic
off the link.
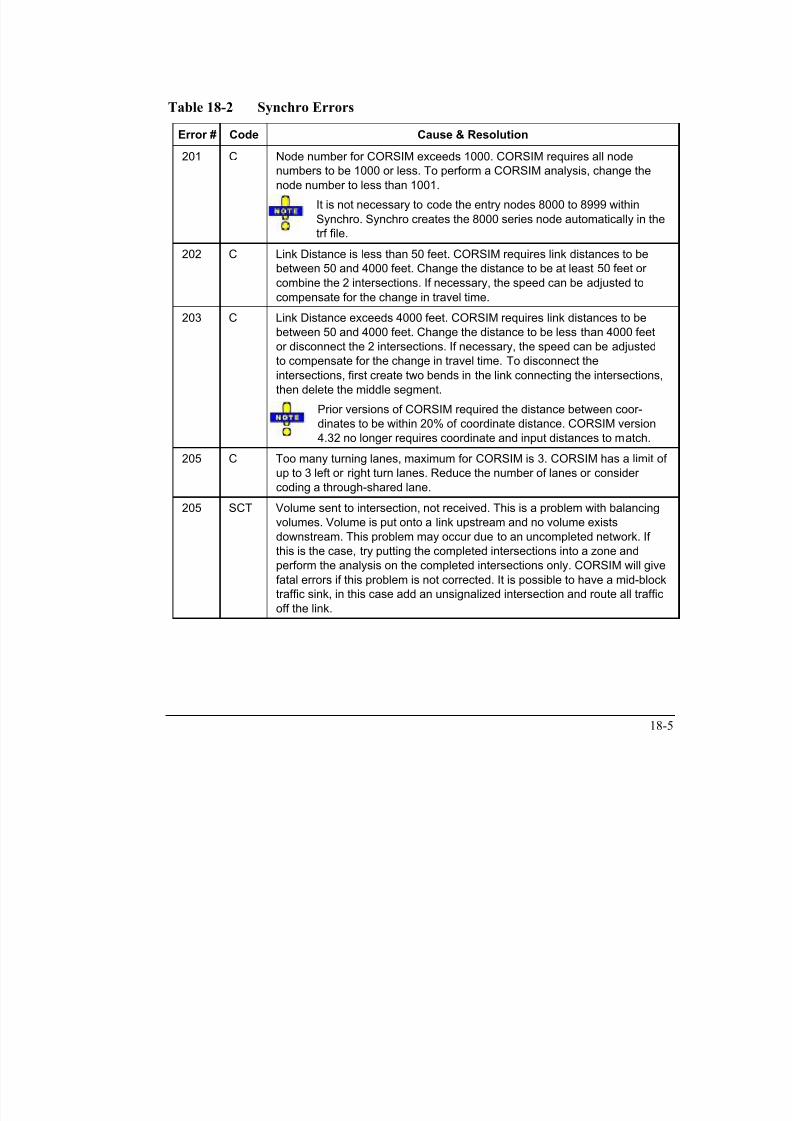
7/21/2019 Synchro Studio 8 User Guide
http://slidepdf.com/reader/full/synchro-studio-8-user-guide 395/559
18-6
Error # Code Cause & Resolution
206 SC Volume received at intersection, not sent. This is a problem with balancing
volumes. Volume is not put onto a link upstream and volume exists
downstream. This problem may occur due to an uncompleted network. If
this is the case, try putting the completed intersections into a zone and
perform the analysis on the completed intersections only. CORSIM will give
fatal errors if this problem is not corrected. It is possible to have a mid-block
traffic source, in this case add an unsignalized intersection and route traffic
onto the link.
207 SC Storage length exceeds link length. The length of the turning bay must be
less than the link distance.
208 SC Leading Detector setting exceeds storage. The detectors for a turning
movement must fit within the turning bay.
209 C CORSIM is limited to 2 lanes in the storage bay. More than 2 storage lanes
were coded in Synchro. Card 11 will be coded with 2 pocket lanes, the
other lanes will be coded as full travel lanes.
212 SC No lanes WITHOUT storage are specified. Add a through lane for this
approach or set the storage to zero for one of the turning groups.
220 SC Leading Detector is less than Trailing Detector. Leading detector must be
greater or equal to the trailing detector. Remember that leading detector is
the detector farthest from the stop bar. Trailing detector is the extension
detector closest to the stop bar.
221 SC Leading Detector exceeds link distance. The detectors must fit within the
link distance.
230 SCH Volume with no green time. The phase indicated has volume and lanes but
no green time. Check the TIMING settings. For a right turn movement,
check the right turn treatment and also make sure there is an overlapping
left phase, if applicable.
231 SCH Volume with no capacity. There is no lane set up to handle this movement.Check lanes and sharings. Remember that turning traffic can use a through
lane, but through traffic cannot use a turning lane. Any lane used by two or
more movements counts as a through lane. If there is no through
movement, shared lanes are left lanes.
232 SCH Lanes with no green time. There is a lane for this group but no green time.
Synchro does not create a phase unless there is actually volume. CORSIM
may report errors if there is a link without green time.

7/21/2019 Synchro Studio 8 User Guide
http://slidepdf.com/reader/full/synchro-studio-8-user-guide 396/559
18-7
Error # Code Cause & Resolution
240 SCH Split less than Minimum Split. Check the TIMING settings. The current split
should always be greater or equal to the Minimum Split.
241 SCH Split less than Minimum Initial + Yellow + All Red. Check the TIMING
settings and the PHASING settings. The current split should always be
greater or equal to the Minimum Initial time plus Yellow and All Red time.
Remember that the split includes the initial interval and yellow plus all red
time.
243 SCH Split less than Yellow + All Red + 3. Check the TIMING settings and the
PHASING settings. The green time should always be at least 3 seconds.
244 SCH Yellow + All Red less than 3. Check the PHASING settings. Yellow + All
Red time should always be at least 3 seconds.
245 SCH Total Lost time less than 3. Check the LANE settings. Total Lost time
should always be at least 3 seconds, unless there is a study to justify less.
Remember that total lost time includes startup lost time and clearance losttime.
246 SCH Ped timing + Yellow + All Red exceeds Maximum Split. The Walk plus Do
not Walk time is greater than the maximum green. Synchro requires the
green time to accommodate pedestrian timings, except when actuated
uncoordinated.
248 SCH Ped timing exceeds minimum split. The Walk plus Do not Walk time plus
Yellow and All Red is greater than the Minimum Split. Synchro alwaysrequires the green time to accommodate pedestrian timings.
250 SCH Reference phase not assigned. The offset reference phase must be
assigned to one or two used phase numbers. Check the offset section of
the TIMING settings. This error only applies to coordinated signals.
251 SCH Reference phase not in use. The offset reference phase must be assigned
to one or two used phase numbers. Check the offset section of the TIMING
settings. This error only applies to coordinated signals.252 SCH Reference phase assigned to conflicting phases. If the offset reference
phase is assigned to two phases, they must appear in the same barrier.
Sequential phases appear one at a time. Check the offset section of the
TIMING settings. This error only applies to coordinated signals.
253 S Detector Phase is not in use. One of the phases coded for the detector
phase is not active.
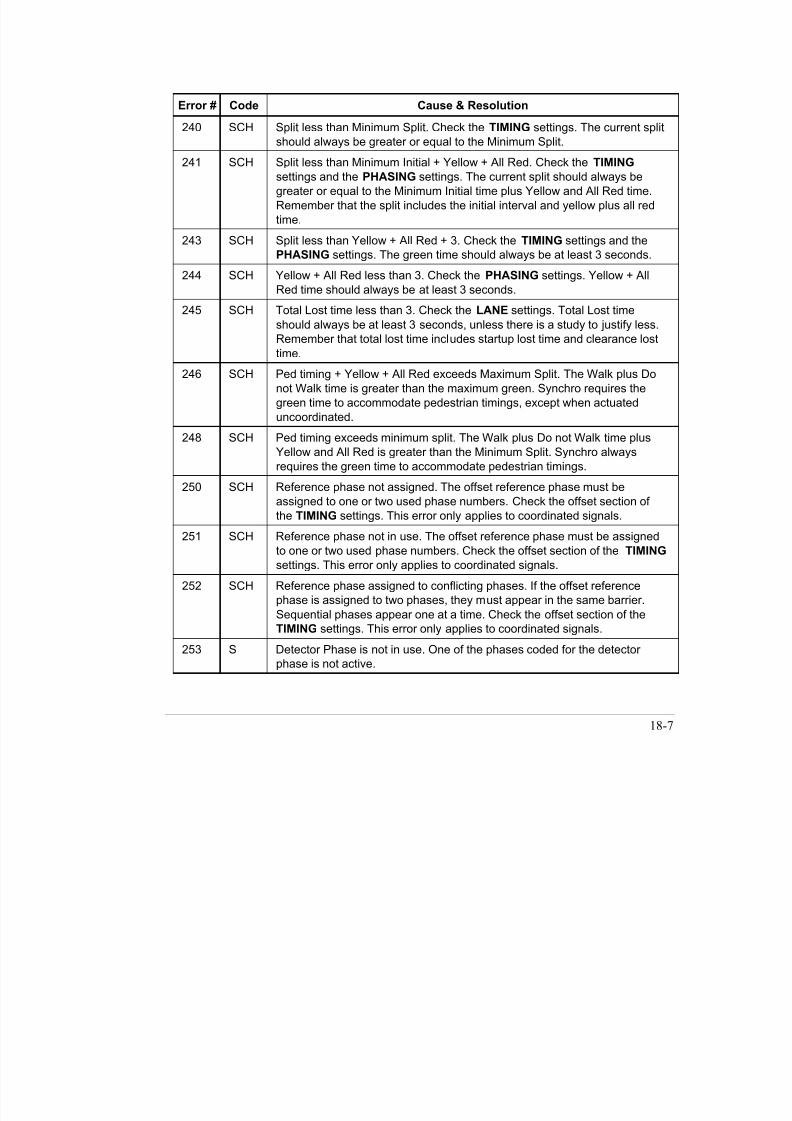
7/21/2019 Synchro Studio 8 User Guide
http://slidepdf.com/reader/full/synchro-studio-8-user-guide 397/559
18-8
Error # Code Cause & Resolution
260 C More than 2 phases per ring-barrier, modeled as pretimed. CORSIM'
actuated signals are limited to 8 phases, 2 barriers, 2 rings, and 2 phases
per ring-barrier.
262 C X Links are in this network, CORSIM is limited to 1000. This file is too large
for CORSIM. Try dividing it into zones and analyzing pieces of it with
CORSIM. Remember that external nodes need links also. On average,
about 8 links are required for every intersection.
263 C X Nodes are in this network, CORSIM is limited to 500. This file is too large
for CORSIM. Try dividing it into zones and analyzing pieces of it with
CORSIM. Remember that external nodes count as nodes also. On average,
about 3 nodes are required for every intersection.
264 C Coordinated phase is not 2 or 6 as CORSIM requires. Actuated signals in
CORSIM require phases 2 and 6 to be the coordinated phase. To correctly
analyze this intersection with CORSIM, change the main street phase
numbers and the reference phase to 2 and 6.
265 C CORSIM is limited to 3 turning lanes with storage. Recode the lanes with 0
storage length.
266 C CORSIM does not currently support metric units. Convert the file to feet and
miles. TRAF-NETSIM still supports metrics.
267 C Group Control (Multiple Intersection 1 Controller) will be modeled as
pretimed. Synchro does not generate actuated signal cards in this case.CORSIM actuated signals are designed for a single node, although it is
theoretically possible to trick CORSIM into operating two signals identically
with detectors at both nodes.
268 C More than 2 barriers used, will be modeled as pretimed. CORSIM's
actuated signals are limited to 8 phases, 2 barriers, 2 rings, and 2 phases
per ring-barrier.
269 C More than 2 rings used, will be modeled as pretimed. CORSIM's actuatedsignals are limited to 8 phases, 2 barriers, 2 rings, and 2 phases per ring-
barrier.
285 C Phase intervals must be less than 120 second.
286 C Too many turning lanes, maximum for CORSIM is 3. CORSIM has a limit of
up to 3 left or right turn lanes. Reduce the number of lanes or consider
coding a through-shared lane.
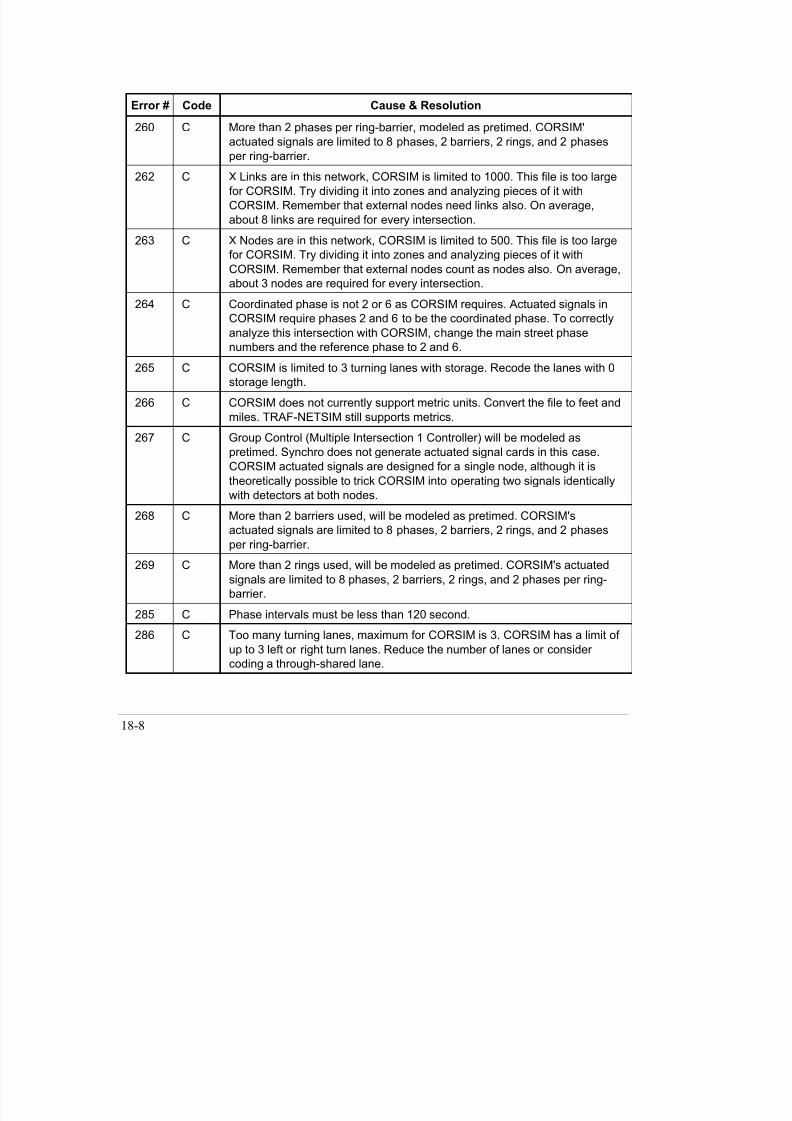
7/21/2019 Synchro Studio 8 User Guide
http://slidepdf.com/reader/full/synchro-studio-8-user-guide 398/559
18-9
Error # Code Cause & Resolution
290 H This intersection has approaches that will not fit into HCS. HCS is limited to
four legged intersections. This message could also appear with multiple
diagonal legs.
291 H NS Phases conflict with EW Phases for HCS. Phases for North and South
Streets cannot be concurrent with phases for East and West streets, except
for right turns.
292 H Too many East-West phase intervals for HCS. HCS is limited to 4 stagesper side; this timing plan is too complex for HCS.
301 HC Conflicting approaches have no sign control. This message applies to
unsignalized intersections. It could occur at an intersection if both NB and
EB approaches had sign control of „free‟. If this intersection is actually a
merge of some sort, ignore this message.
302 HC NB has sign control but SB does not. This message applies to unsignalized
intersections. It can apply to 3 way stops. HCS and CORSIM are not goodat analyzing 3 way stop signs.
The prior version of CORSIM did not model 4-way stops. The latest
release of TSIS, does model all way stops.
304 H All way stops cannot have more than 2 lanes per leg in HCS.
305 H Two way stops cannot have more than 3 lanes per leg in HCS.
SimTraffic Errors and Warnings
When opening a file, SimTraffic performs a coding error check on the Synchro (*.syn) file. This
list describes each error and warning along with suggestions for correcting them.
Warnings indicate likely problems, but they may be acceptable in certain circumstances.
Errors indicate serious problems that require fixing. However, in many cases the simulation maywork correctly in spite of the error.
Fatal Errors indicate a serious coding problem. SimTraffic is unable to generate lanes and
geometrics until the error is corrected.
The error list will only appear when the input file has been changed or needs recording. If a
valid history (*.hst) exists for the current file with no changed data; the error list is not shown.

7/21/2019 Synchro Studio 8 User Guide
http://slidepdf.com/reader/full/synchro-studio-8-user-guide 399/559
18-10
Table 18-3 SimTraffic Warnings
Code# Description
126 Minimum Gap is greater than Vehicle Extension. When using volume density controllers, the gap
is reduced from Vehicle Extension to Minimum Gap. It is an error if Minimum gap is larger than
vehicle extension. CORSIM will give a fatal error with this input.
127 Vehicle extension for phase p should exceed 111% of travel time from trailing detector.
Extension detectors should keep phase active while the vehicle travels from the last extension
detector to the stop bar.
The minimum value for gap time is:
Dtrail / (speed * 1.47 * 0.90), when speed is mph
Dtrail / (speed / 3.6 * 0.90), when speed is km/h
128 Minimum Gap of phase p should exceed 111% of travel time from trailing detector. Extension
detectors should keep phase active while the vehicle travels from the last extension detector to
the stop bar.
129 Volume Density operation not recommended with long detection zone. The travel time across thedetection zone will effectively be added to both the Minimum and Maximum gap times, making
the operation less effective. Check the Time to Reduce, Time before reduce, and Minimum Gap
settings.
130 Short Links under 100 feet (30 meters) may have problems. This is not necessarily an error. Pay
careful attention to short links because SimTraffic may have modeling problems including stuck
vehicles, only 1 or 2 vehicles approved at a time. Short links reduce the opportunities for lane
changes.
131 Angle between d1 and d2 approaches less than 25 degrees. Avoid using acute angles betweenapproaches, this causes the interior space of the intersection to be quite large and gives
performance problems. If necessary use a bend node before the intersection to give a larger
angle between movements.
Table 18-4 SimTraffic Errors
Code# Description
200 2 input lanes on: Node #X EBT, But only 1 receiving lanes on link: Node #Y EB. There are less
lanes downstream than input upstream. This geometry could cause mid-intersection collisions.
Try coding a lane drop downstream using a bend node.
207 Storage length exceeds link length. The length of the turning bay must be less than the link
distance.
208 Storage length less than right radius.
209 Link distance less than Right Radius plus 80 feet (24 m). The length of the Curb Radius as

7/21/2019 Synchro Studio 8 User Guide
http://slidepdf.com/reader/full/synchro-studio-8-user-guide 400/559
18-11
Code# Description
shown in the LANE settings must be less than the link distance minus 80 feet (24 m).
210 Circle Maximum Lanes is 3; Synchro will not allow entry > 3.
211 Circle Inside Radius must be less than Outside Radius.
212 Link distance is too short for lane changes with upstream channelized right. If there is an
upstream right turn channel with 1 add lane on a 3-lane link. The vehicles from the right may
need to make two lane changes on this link. If the distance is less than 80ft plus curb radius plus
the distance for lane changes. The distance for lane changes is 60ft for a single lane change or
180ft per lane change when two or more changes are required. 220 Leading Detector is less than Trailing Detector. Leading detector must be greater or equal to the
Trailing detector. Remember that Leading detector is the detector farthest from the stop bar.
Trailing detector is the extension detector closest to the stop bar.
222 Leading Detector is too far forward. Leading Detector is the leading detector. If Leading detector
is set to 0, vehicles will not reach the detector to place a call. Do not set the Leading Detector to zero; the minimum value is 5 feet (1.5 m). If there is
no detector for this lane group, code a value of 'None' in the setting for DetectorPhases and ensure that this is either the coordinated phase, is a pre-timed signal, or
'maximum' is coded for the Recall Mode.
240 Split less than minimum split. Check the TIMING settings. The current split should always be
greater or equal to the minimum split.
241 Split less than minimum initial + Y + AR. Check the TIMING settings and the PHASING
settings. The current split should always be greater or equal to the minimum initial time plus
yellow time plus all-red time. Remember that the split includes the initial interval, yellow time, and
all-red time.
243 Split less than Y + AR + 3. Check the TIMING settings and the PHASING settings. The green
time should always be at least 3 seconds.
244 Y + AR less than 3. Check the TIMING settings. Yellow time plus All-Red time should always be
at least 3 seconds.
246 Ped timing + Y + AR exceeds max split. The walk plus do not walk time plus clearance is greater
than the maximum split. Synchro requires the split time to accommodate pedestrian timings. If
this signal is coordinated, pedestrians may cause strange results.
250 Reference phase not assigned. The offset reference phase must be assigned to one or two used
phase numbers. Check the offset section of the TIMING settings. This error only applies to
coordinated signals.
251 Reference phase assigned to unused phase. The offset reference phase must be assigned to
one or two used phase numbers. Check the offset section of the TIMING settings. This error
only applies to coordinated signals.

7/21/2019 Synchro Studio 8 User Guide
http://slidepdf.com/reader/full/synchro-studio-8-user-guide 401/559
18-12
Code# Description
252 Reference phase assigned to conflicting phases. If the offset reference phase is assigned to two
phases, they must appear in separate rings within the same barrier. Check the offset section of
the TIMING settings. This error only applies to coordinated signals.
Table 18-5 SimTraffic Fatal Errors
Code# Description
401 X input lanes on: Node #Y EBL but no receiving lanes on link: Node #Z NB. No receiving lanes.Traffic is sent to a link with no lanes. Check upstream traffic volumes and lane assignments. .
402 More than 7 lanes specified. SimTraffic is limited to 7 lanes per link including storage lanes.
405 Distance must be within 30% of coordinate distance. SimTraffic requires the coordinate distance
to be close to the overridden link distance, otherwise geometrics cannot be drawn correctly.
406 No lanes WITHOUT storage are specified. Reduce the number of Storage Lanes or set the
Storage Length to zero for one side of the approach.
407 Volume with no capacity. Add a lane for this movement or an adjacent lane with sharing. 408 0 travel lanes on bend, but receiving lanes downstream. Caused by setting travel lanes on an
end to 0, when lanes are coded downstream.
Data Access Errors
These errors occur when reading data from data file during simulation. These errors are caused
by bad or unexpected data in the external data files.
Table 18-6 SimTraffic Data Access Errors
Code# Description
500 Volume for movement but no lanes. This error is caused if volume exists for a movement but
there are no lanes available. In some cases SimTraffic will assume a shared lane for turning
traffic, but not if there is zero volume in the initial timing period. SimTraffic will assume a LTR
lane is a LR lane if there is no through traffic. Code at least 1 vph of through volume in any LTRlane to insure that SimTraffic creates a through lane.
501 Non-zero split in data file for unused phase. The timing data feature of SimTraffic can not be
used to turn phases on and off. Timing data can only be used to change splits, offsets, and
phase sequences.
502 Zero split in data file for active phase. The timing data feature of SimTraffic cannot be used to
turn phases on and off. Timing data can only be used to change splits, offsets, and phase
sequences.

7/21/2019 Synchro Studio 8 User Guide
http://slidepdf.com/reader/full/synchro-studio-8-user-guide 402/559
19-1
Chapter 19 – CORSIM AnalysisCORSIM is produced by the Federal Highway Administration and their contractors. CORSIM is
the successor to the TRAF-NETSIM product. CORSIM is in Settings and has the freeway
modeling of FRESIM integrated with the surface modeling of NETSIM.
Before Starting CORSIM Analysis
Before starting a CORSIM analysis, it is important to be aware of all the steps involved.
Performing a CORSIM analysis, even with a preprocessor like Synchro can be quite time
consuming. Be sure to allow plenty of extra time when performing a CORSIM analysis to allow
for unexpected problems. Do not wait until the last minute to perform a CORSIM analysis.
Tasks involved with a CORSIM analysis include:
Learning CORSIM: Even though Synchro generates the necessary CORSIM cards, it may still
be necessary to edit the cards for special purposes or to correct errors. It should be noted thatlearning about all the CORSIM card types can take days or even weeks.
Data Collection: If your data is already entered into Synchro this is not an issue. If you are
starting a new project from scratch, this may take a large amount of time.
Coding TRF Card File: Synchro will create all the cards automatically, so this should not be an
issue. If your project involves advanced features such as multiple time periods or transit
vehicles, there may be some card coding required.Correcting CORSIM Errors: Although Synchro attempts to produce error free card files,
CORSIM is very particular about its input. CORSIM is very likely to report errors in the input
file. Correcting these errors may take a long time.
Modifying Input data and Rerunning CORSIM: It is very rare to have an entire network
coded correctly the first time. Watching the network in simulation may bring up problems with
the original coding. Be sure to leave time to make corrections and redo the analysis.
Quality Assurance: Be sure to leave time for checking your work and rerunning the simulation
if necessary.
Creating Reports and Summaries: Documenting the findings can also take significant time.
7/21/2019 Synchro Studio 8 User Guide
http://slidepdf.com/reader/full/synchro-studio-8-user-guide 403/559
19-2
Create a CORSIM File
To use the transfer to CORSIM feature, it is necessary to first create a datafile in Synchro.
CORSIM requires that all signal timing information be determined before performing an
analysis. It is necessary to optimize splits, cycle lengths, and offsets using Synchro or another
software package before using CORSIM. All of the items in the following list should be
determined before performing a CORSIM analysis.
Data required for CORSIM:
Volumes
Lanes
Storage Lengths
Left Turn Type
Street Names
Phase Order (lead or lag)
Cycle Length
Splits
Offsets
Data calculated by CORSIM:
Delay and Fuel Consumption Data
Data for Simulations
Setting Options
To perform a CORSIM analysis, choose the Transfer CORSIM Analysis command from
Synchro. Figure 19-1 illustrates the CORSIM Analysis dialog.

7/21/2019 Synchro Studio 8 User Guide
http://slidepdf.com/reader/full/synchro-studio-8-user-guide 404/559
19-3
Figure 19-1 CORSIM Analysis Dialog
In TSIS a project is a file that keeps track of all the files in the directory. Before selecting a Data
File path, start TSIS and create a project. This project directory can be used to hold the TRF
files created by Syncrho.
TSIS Program Location
Enter the location of the TSIS program. Normally this is:
C:\Program Files\TSIS\Tsis.exe
Data file path
The Data file path is the name of the input file that will be used. By default, it is in the C:\TSIS
PROJECTS\ sub-directory and has the same name as the SYN file, but with a TRF extension.
CORSIM Options
Scope
Select Entire Network or specify a zone to simulate. Dividing a Synchro file into zones allows
a portion of the file to be analyzed with CORSIM. This can be useful for bypassing CORSIM's
limit of 60 intersections.
If you have any bends in your network, be sure to include them in the zone of the adjacent
intersections.
Simulation Time: Enter the number of minutes to perform a simulation. The default is 15
minutes. Synchro will round decimal minutes to the nearest minute (e.g., 15.5 rounded to 15).
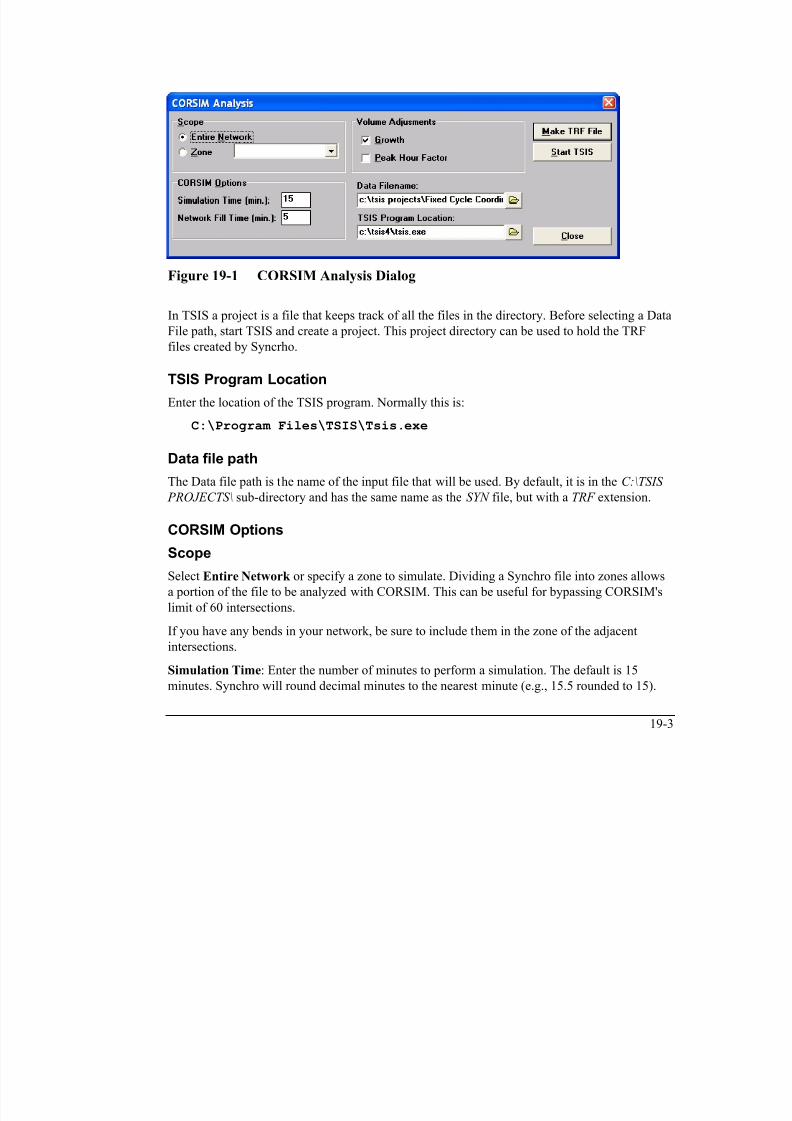
7/21/2019 Synchro Studio 8 User Guide
http://slidepdf.com/reader/full/synchro-studio-8-user-guide 405/559
19-4
Network Fill Time: Enter the maximum number of minutes to fill the network before
simulation actually begins. CORSIM will start simulating when equilibrium is achieved or thistime has elapsed, which ever comes first. The default is 15 minutes.
Set Simulation Time and Network Fill time to 2 minutes initially. This will
significantly reduce the execution time of CORSIM. After you have determined that
the network is operating correctly, then set the simulation time back to 15.
Volume Adjustments
Synchro gives the option of adjusting volumes by Growth factors and/or PHF factors. To get
similar v/c ratios with Synchro, use both adjustments.
If the Peak Hour Factor adjustment option is selected, the volumes are adjusted for
the PHF even if they are invisible. The PHF is considered to be invisible (set to 1.0
with a hidden value of something else) if the analysis period is set to 30 minutes or
greater. To see the actual PHF that is used, set the analysis period (See the NETWORK SETTINGS) to 15 minutes.
Synchro with TRAF-NETSIM
Synchro requires CORSIM. If you have not yet upgraded to CORSIM from TRAF-NETSIM,
contact the McTrans center for upgrade information.
Synchro is not compatible with NETSIM. It may be possible to modify some of the cards to
provide a TRAF-NETSIM compatible file. However, Trafficware is not able to provide
technical support for this operation.
As an alternative, you can perform animations with SimTraffic, Trafficware's simulation model.
SimTraffic contains most of CORSIM's functionality and is much easier to use.
Run CORSIMAfter setting appropriate options described in the previous section, select [Make TRF File] and
a CORSIM input file is generated.
Select [Start TSIS] to execute TSIS.EXE. TSIS can be used to view and edit the TRF files.
TSIS can also be used to start CORSIM and TRAFVU. When starting TSIS, open or create a
project in the directory with your TRF files.

7/21/2019 Synchro Studio 8 User Guide
http://slidepdf.com/reader/full/synchro-studio-8-user-guide 406/559
19-5
Fixing Common CORSIM Errors
Many CORSIM coding errors are found by Synchro when creating the TRF file. Refer to the
section on Errors and Warnings (page 18-1) for a list of errors and their explanations.
Link distances must be between 50 and 4000 feet. If there are any links greater than 4000 feet
break them up. If any nodes are closer than 50 feet, move them apart.
The storage bay length must be between 50 feet and the length of the link. Make sure that all
turning bays are less than the link distance.
Only links that actually have traffic or lanes are included. Turning receiving nodes on card 11
must be valid links. If traffic is sent to a receiving node and this link has no lanes an error will
be created. Do not try to send traffic or lanes to links that have no lanes.
Detector distances must be less than the link length or turning bay link. Make sure that the
leading detector entry is less than the link distance or the storage length.
Node Numbers
To see the node numbers used by Synchro and CORSIM, go to the MAP view and push the
Show Node Numbers button. The map with node numbers can be printed out for easy reference.
Node numbers can be changed by double clicking on the intersection when node numbers are
showing.
Lane Groups Normally Through, Right, and Left movements are coded as the corresponding lane groups in
CORSIM. There are some exceptions.
If a diagonal movement has phases within the same barrier, or if a through movement does not
exist, the diagonal movement is coded as a CORSIM Through movement. The Through
movement, if any, is counted as a Diagonal, Left, or Right movement.
If there are Through, Left and Left 2 movements in Synchro, the Left movement will be coded
as Diagonal and Left 2 coded as Left.
If there are Through, Right and Right 2 movements in Synchro, the Right movement will be
coded as Diagonal and Right 2 coded as Right.
If there are Through, Left, Left 2, Right and Right 2 movements in Synchro, the Right 2
movement will not be coded.
7/21/2019 Synchro Studio 8 User Guide
http://slidepdf.com/reader/full/synchro-studio-8-user-guide 407/559
19-6
U-turn information is not transferred to CORSIM.
Actuated Signal Limitations
Synchro will generate CORSIM cards for actuated signals, except for some complex situations.
If any of the following exists, Synchro will generate pretimed cards for the intersection:
Intersection is coded Pretimed. Group Control (Multiple Intersections with One Controller)
More than 2 barriers used
More than 2 rings used
More then 2 phases in a ring-barrier
More than 8 phases used
Synchro phase numbers may be changed to meet CORSIM's phase numbering standard. Only
phase numbers 1 to 8 can be used. CORSIM does not support sequential phases, so exclusive
phases 4 and 8 would be changed to phases 3 and 4.
CORSIM requires phases 2 and 6 to be coordinated for actuated-coordinated operation. Synchro
will not change phase numbers to accommodate coordination. Code the coordinated phases as 2
and 6 in Synchro if you plan to use CORSIM.
Notes on How Synchro Creates a CORSIM Data File
This section explains which cards Synchro creates for CORSIM's data files and what
information goes into each card. It is not necessary to know this information to perform an
analysis (unless CORSIM returns error messages). However, if you are interested in how
Synchro works with CORSIM or if you want to edit the CORSIM input file, this information
can be useful. Please refer to the TRAF User Reference Guide for detailed description of the
input files and specifications for each card 's requirements.
CORSIM is very particular about having the right inputs, and error messages are quite common.
If you receive error messages, refer to the message description in the OUT file or the CORSIM
Users Guide. The following sections can be helpful in correcting the CORSIM errors. Do not be
alarmed if CORSIM gives errors, it is quite common. Take some time to research what is
causing them and make adjustments to your Synchro file or your TRF file.
7/21/2019 Synchro Studio 8 User Guide
http://slidepdf.com/reader/full/synchro-studio-8-user-guide 408/559
19-7
The following cards are all entered into the TRF file.
CARD 0 - Run Title
Set to say: "Synchro File: filename Date:Apr 11, 2003 00"
CARD 1 - Run Identification
The user name is set to the analyst set in the Scenario Manager.
The date is set to the current date.
The run number is left black
If the Synchro file has a description, the description is included on a comment card after card 1.
The file description is set in the SCENARIO MANAGER settings.
CARD 2 - Run Control
Entry 1: 1 (One or more Simulation Models)
Entry 2: Blank, FRESIM input and not used for NETSIM
Entry 3: Fill time, user definable, see previous section
Entry 4: 7981, default vehicle entry headway random number seed
Entry 5: 01, in form XY (see CORSIM User Guide)
Entry 6: Blank, FRESIM input and not used for NETSIM
Entry 7: 0, all emission headways are set equal to the uniform headway
Entry 8: Blank, since entry 7 is set equal to 0
Entry 9 to 13: Blank, used for RT-TRACS
Entry 15: 1200 simulations begin at 12:00
Entry 14: 3, to indicate CORSIM
Entry 16: Blank, transitions not used
Entry 17: 7781, default random number for CORSIM
Entry 18: 7581, default random number for CORSIM

7/21/2019 Synchro Studio 8 User Guide
http://slidepdf.com/reader/full/synchro-studio-8-user-guide 409/559
19-8
CARD 3 - Time Period Specifications
Entry 1: Time period specified by user
Entries 2 to 19: Blank, only one time period used
CARD 4 - Time Intervals
Entry 1: Blank, not used
Entry 2: 60, time interval duration
CARD 5 - Reports and Graphics
Entry 1: Blank, one report
Entries 2 to 10: Blank, reporting periods not used
Entry 11: 1, Turn movement data is requested
Entry 12: First six characters of input file excluding the extension
CARD 10 - Link Name Table
For every link that has a street name, an entry is generated.
If a street only has traffic in one or zero directions, only one or zero links are
generated for that link.
CARD 11 - Link Description
A card 11 is generated for every link with lanes. See the TRAF User Reference Guide for what
constitutes a link. Only one link per segment is generated for one way streets.
Node numbers are the internal node numbers used by Synchro. For external nodes there is an
entry node with a number of 8000 plus the regular node number. There is also a dummy nodewith the regular node number.
Link Length is the distance between intersections as shown in Synchro.
There are turning pockets if there is one or more turning lanes and the storage length is not
zero. Otherwise the turning lanes are counted as travel lanes. The turning pocket length is the
storage length and the number of pocket lanes is the number of turning Storage lanes. Diagonal
and Through lanes cannot be in the pocket and CORSIM only allows two pocket lanes.

7/21/2019 Synchro Studio 8 User Guide
http://slidepdf.com/reader/full/synchro-studio-8-user-guide 410/559
19-9
The Grade is taken from Synchro's data.
Queue Discharge Characteristics is blank for default.
Channelization Codes are coded as zero with the following exceptions:
Turning lanes with no pocket are channelized as Right '4' or Left '1'. If there is no through
movement and the left lane is shared with the right lane then the movement has a shared code of
'9'
Exclusive through lanes are marked 'T', Through-Right lanes are marked '7', Through-Left lanesare marked '8', Right-Through-Left lanes are marked '9'.
Downstream nodes are the node numbers of the appropriate links. These values are only
entered if there really is traffic on that link. See Lane Groups section above for information
about how Synchro lane groups are coded as CORSIM lane groups
Start-up Lost Time is blank for default
Queue Discharge Headway is blank for default
Free Flow Speed is the speed entered for the link in Synchro
Right Turn on Red is 0 for allowed, and 1 for prohibited
Pedestrian Code is taken from the pedestrians entered in Synchro on the VOLUME settings.
Note that in Synchro you enter the pedestrians conflicting with turns. These are translated to the
appropriate link.
Lane alignment: If there is a right turn lane with no pocket and a through lane, the lane
alignment is r+1, 1 (r is the number of exclusive right turn lanes). Otherwise, this entry is blank.
If you have a turning lane with storage length 0, then it will be modeled as a full travel
lane. Make sure you enter the storage lengths for all turning lanes if appropriate. Also,
make sure that the storage length is less than 90% of the link length.
CARD 21 - Turning Movements
A card 21 is entered for every link.
For entry and exit links, all traffic goes through.
For links at intersections, the turning movements are based on the turning movement counts
provided, entered in vph.
7/21/2019 Synchro Studio 8 User Guide
http://slidepdf.com/reader/full/synchro-studio-8-user-guide 411/559
19-10
If volumes for a link are zero, all valid turns will be assigned 10 vph.
Volumes may be adjusted for PHF and Growth Factors depending on Input Settings.
Turn prohibitions are left blank.
See Lane Groups section above for information about how Synchro lane groups are coded as
CORSIM lane groups.
CARD 22 - Conditional Turn Movements
Conditional turn movements are entered based on the values in the LINK O-D VOLUMES
settings.
Values are entered in vph, not percentages.
CARD 35 - Pretimed Signal Control
For Pretimed, Signalized Intersections:
The offset is the beginning time of Phase #1 (or the first used phase).
The upstream nodes are for any approach links with lanes. Note that there is a limit of 5.
The intervals are the times for each phase after converting it to single ring control. Note that if
there are concurrent phases that terminate within y seconds of each other (y is yellow + all-red
time) they are treated as terminating at the same time and their splits are averaged.
For Dummy Entry/Exit Nodes:
The upstream nodes are 8000 plus this node and the adjoining intersection.
The remainder of the card is blank.
For Unsignalized Intersections:
The upstream nodes are for any approach links with lanes. Note that there is a limit of 5.
The remainder of the card is blank.
CARD 36- Pretimed Signal Control Codes
For Pretimed, Signalized Intersections:

7/21/2019 Synchro Studio 8 User Guide
http://slidepdf.com/reader/full/synchro-studio-8-user-guide 412/559
19-11
The Control Codes are entered as appropriate as follows:
1 - Green ball. Used when Through and either Left or Diaganol is Green. Also used if
Left and Diagonal is green and through is not used.
2 - Red
0 - Yellow ball, yellow left arrow, or yellow right arrow
3 - Right only is green.
4 - Left only is green.
6 - Diagonal only is green.
7 - Through only is green.
8 - Left and Right are green.
9 - Trough and right are green.
If a link contains Left, Through, and Diagonal movements; it is not possible to
display phases for each group independently. This is a limitation of CORSIM. In
some cases, right turns will be displayed red when diagonal is green. This is a
limitation of CORSIM.
For Dummy Entry/Exit Nodes:
The Control Code is 1 for each approach (green ball).
For Unsigalized Intersections:
The Control Codes are entered as appropriate as follows:
0 - Yield sign.
1 - Uncontrolled
5 - Stop Sign
CARD 43 - Approaches for Actuated Controller
For Actuated Intersections:
For each approach to this intersection with volumes, an entry is made. The upstream node is the
adjacent intersection.

7/21/2019 Synchro Studio 8 User Guide
http://slidepdf.com/reader/full/synchro-studio-8-user-guide 413/559
19-12
The downstream node is always this node.
The record sequence is always 0.
The micronode code is always left blank so this is not modeled as a micronode.
CARD 44 - Coordination for Actuated Controller
For Actuated Intersections with Fixed Cycle:
Cycle Length is Current Cycle Length in Synchro.Offset is the offset referenced to the end of main street green. This may not be the same offset
used within Synchro. If phase 1 or 5 is lagging, the offset is referenced to the first phase (2 or 6)
to yield.
Permissive Periods are assigned, as needed to the following phases. Lagging main street phases
1 and/or 5. Leading Cross street phases, usually 3 and 7. Lagging Cross Street phases, usually 4
and 8. Leading main street phases 1 and 5. The start time for the permissive periods is equal to
the amount of time from the offset to the time the permissive phase begins, less the main street
yellow. Permissive period 1 starts at time 0. The end of the permissive period is the same as the
start time plus 1. This means that each phase is given a one second permissive period to begin at
the time it would begin if it were pretimed.
A Permissive Period Code of 1 is only given to phases for their own permissive period. If there
are not enough permissive periods for all of the phases, the phase is allowed to start in an earlier
permissive period.Force Offs are assigned as the the time between the offset to the end of yellow for each phase. In
practice the force offs will not be used because the force off times are based on maximum
greens and thus the phases will always max out before, or at the same time, as the Force Off
time.
Example of permissive periods and Force Offs.
Phase 2: coordinated phase, offset is 20 referenced to begin of yellow, yellow is 5 s.
Phase 3: max green is 20, yellow is 4
Phase 4: max green is 30, yellow is 3
This will be coded as follows:
Offset = 20
7/21/2019 Synchro Studio 8 User Guide
http://slidepdf.com/reader/full/synchro-studio-8-user-guide 414/559

7/21/2019 Synchro Studio 8 User Guide
http://slidepdf.com/reader/full/synchro-studio-8-user-guide 415/559
19-14
8: all non-pocket lanes
9: all lanes
Detector Group is always 1. All detectors are extension and count detectors. If your approach
has calling-only or type-3 detectors at the stop bar, this will be simulated by having no detectors
at the stop bar in conjunction with locking calls and extended initial intervals.
Three detectors are used if the distance from the leading to the trailing detector is 200 feet (60
m) or more. Two detectors are used if the distance from the leading to the trailing detector is
100 feet (30 m) or more. Otherwise, only one detector is used.
The leading detector has a leading edge equal to the Leading Detector entry in Synchro. The last
detectors trailing edge is equal to the trailing detection setting in Synchro. If three detectors are
used the middle detector is placed half way between the first and last detector.
The detector length is 10 feet if two or more detectors are used. Otherwise, the detector is equal
to the distance between the first and last detector.
If the distance between detectors is greater than 100 ft (30m), a carryover time of 0.1 s is addedfor every 5 ft (1.5m) over 100 ft (30m).
If the last detector is within 50 ft (15 m) of the stopbar it is a presence detector; otherwise, it is a
passage detector. Upstream detectors are passage.
CARD 47 - Phase Operations for Actuated Controller
For Actuated Intersections:
A card 47 is created for every phase used by the actuated controller.
Maximum Green is set to the Maximum Green setting in Synchro. If this is an actuated
coordinated controller, then the maximum green is equal to the cycle length minus 10 seconds.
This will allow the controller to reach the Force-Off point without early max-out.
Minimum Green is set to the Minimum Green setting in Synchro. (Maximum Split - Yellow -
All-Red)
Vehicle Extension is set to the Vehicle Extension setting in Synchro.
Initial intervals are handled in one of two ways. If there is an extension detector within 50 ft
(15m) of the stopbar, no initial interval calculation is needed.
With a stop bar detector, initial interval code is 0 or extensible. The Maximum Initial Interval is
the same as the minimum green. Yellow and red lock are not set.

7/21/2019 Synchro Studio 8 User Guide
http://slidepdf.com/reader/full/synchro-studio-8-user-guide 416/559
19-15
With no stop bar detector, initial interval code is 0 or extensible. Yellow lock is set. The time
added per actuation is 2.2s and the Maximum Initial Interval is calculated as:max initial = 2.5 + 2.2 * vehStored
vehStored = LastExt / VehLength
MaxInitial maxGreen
MaxInitial minGreen
Gap Reduction Code is set to 2, time to reduce to minimum. Minimum Gap is set to the Synchrosetting. Maximum Gap is set to Vehicle Extension setting in Synchro. Time to Reduce is set to
the sum of Time-to-Reduce plus Time-Before-Reduce in settings in Synchro.
Double Entry is always permitted.
Last Vehicle Passage feature is always 0 or off.
Minimum Recall is set if the phase has Minimum or Pedestrian Recall in Synchro.
Maximum Recall is set if the phase has Maximum Recall set in Synchro.
Rest in Red is set if the phase has No Recall set in Synchro.
Lag Code is set to 0 if this phase is leading, 1 if this phase is lagging. If the phase's lead-lag
partner is not used, the lag code is 1 for even phases, 0 for odd phases.
Overlap codes are not used.
Red revert time is 2.0 seconds.
Lag Phase Hold is set if there is one lagging phase on the main street and the controller is in
coordination. Our tests show that this feature does not work correctly in CORSIM version 4.2.
Simultaneous Gap is always set off.
Dual Service is not used.
Minimum Conditional Service Time is not used.
CARD 48 - Pedestrian Operations for Actuated Controller
For Actuated Intersections:
A card 48 is created for any actuated phase that has a pedestrian phase with pedestrian calls. No
card 48 is generated if there are 0 pedestrian calls.

7/21/2019 Synchro Studio 8 User Guide
http://slidepdf.com/reader/full/synchro-studio-8-user-guide 417/559
19-16
Walk Time is the same as the Synchro setting.
Dont Walk Time is the same as the Synchro setting.
Pedestrian Intensity for stochastic arrivals is taken from the Pedestrian Calls setting in Synchro's
PHASING settings. Deterministic arrivals are not used.
Pedestrian Recall is set on if this phase has pedestrian or maximum recall, and the signal is
coordinated.
Pedestrian Rest is set on if this phase has pedestrian or maximum recall, and the signal is
uncoordinated.
CARD 50 - Entry Link Volumes
A 50 Card entry is created for every entry node with traffic. The volume is the sum of the
arrivals at the intersection. The node number is in the range 8000 to 8999.
Volumes may be adjusted for PHF and Growth Factors depending on Input Settings.
The Percent Trucks is equal to the percent heavy vehicles input on the VOLUME settings.
The Percent Carpools is zero.
CARD 51 - Source/Sink Volumes
A 51 Card entry is created for every link where the traffic entering does not match the traffic
leaving downstream. There can be quite a lot of 51 cards because the volume counts entered intoSynchro typically do not match exactly. This could be due to different times the counts were
taken or cars entering/leaving midblock. There is no card 51s for entry and exit links.
The Centriod numbers are in the range 2000 to 2999.
The entry exit volume is the difference between volume arriving at the downstream intersection
less the traffic arriving from the upstream intersection.
CARD 56 - Parking Activity
A card 56 is generated when parking movements are specified in the VOLUME settings.
The downstream distance is equal to the storage bay distance, if applicable, or zero.
The upstream distance is equal to the link distance minus 80ft (24 m) minus any storage
distance.

7/21/2019 Synchro Studio 8 User Guide
http://slidepdf.com/reader/full/synchro-studio-8-user-guide 418/559
19-17
The number of movements is the total number of parking movements in all lane groups.
For a one way street, distances are also specified on the left side.
No Card 56 is generated for links approaching bends, or exit links.
CARD 140 Turning Speeds
The default turning speeds are 15 mph for left turns and 9 mph for right turns. If the values in
the NETWORK settings are changed, Synchro will generate a Card 140.
The speeds on the card are those in the NETWORK settings. All other values on Card 140 are
left blank.
CORSIM has no option to set turning speeds for individual intersections.
CARD 170 Sub-network Delimiter
Indicates end of CORSIM section, a zero is coded for entry 1.
CARD 195 Node Coordinates
For each intersection and each entry/exit node, a card 195 is generated with the appropriate
coordinates. The coordinates are expressed in feet. If there are any coordinates less than 0 or
greater than 9999999, all the coordinates will be adjusted to be in this range.
CARD 210 Final Card in Time PeriodIndicates end of time period
Entry 1 is 1 to indicate the last time period.
All other entries are blank.
7/21/2019 Synchro Studio 8 User Guide
http://slidepdf.com/reader/full/synchro-studio-8-user-guide 419/559

7/21/2019 Synchro Studio 8 User Guide
http://slidepdf.com/reader/full/synchro-studio-8-user-guide 420/559
20-1
Chapter 20 – SimTraffic IntroductionIntroduction
SimTraffic is designed to model networks of signalized and unsignalized intersections, including
roundabouts. The primary purpose of SimTraffic is to check and fine tune traffic signal
operations. SimTraffic is especially useful for analyzing complex situations that are not easily
modeled macroscopically including:
Closely spaced intersections with blocking problems
Closely spaced intersections with lane change problems
The affects of signals on nearby unsignalized intersections and driveways
The operation of intersections under heavy congestion
SimTraffic Features: Pre-timed Signals
Actuated Signals
2-way Stop Intersections
All-way Stop Intersections
Roundabouts
Freeways
Roadway Bends
Lane Additions and Lane Drops
Cars, Trucks, Buses
Pedestrians
Right Turn Islands
Curved Links
SimTraffic Measures of Effectiveness (MOEs):
Slowing Delay

7/21/2019 Synchro Studio 8 User Guide
http://slidepdf.com/reader/full/synchro-studio-8-user-guide 421/559
20-2
Stopped Delay
Stops
Queue Lengths
Speeds
Travel Time and Distance
Fuel Consumption and Efficiency
Exhaust Emissions
Observed Actuated Green Times
At present SimTraffic will not model ramp metering, bus stops, bus routes, bus and carpool
lanes, light rail, on-street parking, and short-term events. Many of these features may be added
into future versions of SimTraffic.
SimTraffic Quick StartTo use SimTraffic follow these steps:
To start SimTraffic, simply choose the SimTraffic icon from the
Programs Trafficware group of the Start Bar.
Select the File-Open button or the File Open command to load a file. SimTraffic uses
Synchro style SYN files. Choose one of the sample files that come with SimTraffic and press [Open].
SimTraffic seeds the network with traffic; this will take 10 to 40 seconds or more depending on
the size of the network and the speed of your PC.
After the network is seeded, you can begin animating by pressing the Simulate-While-
Playing button. Vehicles will begin to move through the network.
Further information about using SimTraffic is available later in this Users Guide.
Demo Version
The Demo version can be used to record and playback simulations for the example files located
in the Trafficware directory. The Demo version cannot be used to record animations on other
files.
7/21/2019 Synchro Studio 8 User Guide
http://slidepdf.com/reader/full/synchro-studio-8-user-guide 422/559
20-3
The Demo version can also be used to playback prerecorded history files. This allows unlicensed
users to view animation files. If you would like to share a SimTraffic animation with a client orcolleague who does not own a SimTraffic license, they can view the animations and reports but
not make changes using the demo version of SimTraffic. Be sure that the client receives all of
the following:
1. The Synchro Data file (SYN)
2. The SimTraffic Parameters file (STN)
3. The History file (HST)
4. Timing or volume data files, if data access is used.
5. The Synchro/SimTraffic installation CD or download file (setup.exe).
Changes to the Synchro file or SimTraffic parameters may mark a history file as „dirty‟ or out of
date. To test that the history file reflects the current data settings:
1. Close both SimTraffic and Synchro
2. Re-open SimTraffic
3. Make sure the network doesn‟t re-seed and the animation plays without simulating
(green triangle with blue film clip)
4. Do not make any further changes to the Synchro file
Make sure that the same version and build of SimTraffic is used for both playback andrecording.
SimTraffic can playback history files marked read-only. This allows for playing history files
stored on a CD-ROM, and allows the user to protect history files from accidental rerecording.

7/21/2019 Synchro Studio 8 User Guide
http://slidepdf.com/reader/full/synchro-studio-8-user-guide 423/559

7/21/2019 Synchro Studio 8 User Guide
http://slidepdf.com/reader/full/synchro-studio-8-user-guide 424/559
21-1
Chapter 21 – SimTraffic OperationSimTraffic Operation
This chapter explains the overall operation of SimTraffic including loading files, recording
simulations and playing simulations.
Loading FilesSelect the File-Open button or the File Open menu command to load a file. SimTraffic uses
Synchro style SYN files for data inputs.
If you are working with a file in Synchro, you can start SimTraffic by pressing the
SimTraffic-Animation button or pressing [Ctrl]+[G].
Recording and PlaybackSeeding Network
After a file is loaded, the network is seeded. Network seeding
fills a network with vehicles, so that there will be vehicles in
the network when simulation begins. The length of seed time
can be changed with Options
Intervals and Volumes
command.
Simulation Recording
Simulations can be recorded and subsequently played back.
Alternatively, simulations can be created while animating.
The Record-Simulation button or [Ctrl]+[E] will perform simulation and record
information for animation, reports, and static graphics. The length of time recorded can be changed with the Options Intervals and Volumes command.
The Simulate-While-Playing button ([F5]) will simulate traffic while animating
(SimPlay). The SimPlay option is useful for quickly viewing traffic. Simulations
created with SimPlay cannot be used for reports and static graphics.
In many cases, it is possible to change traffic volumes or signal timings and simulate while
playing without re-seeding the network. This makes it possible to simulate many similar timing

7/21/2019 Synchro Studio 8 User Guide
http://slidepdf.com/reader/full/synchro-studio-8-user-guide 425/559
21-2
plans quickly. To change data without reseeding, it is necessary to start SimTraffic from
Synchro.
Playback
The Speed-Control box shows the current speed and allows the user to change the speed
quickly. Click on the center red bar to stop playback or SimPlay. Pressing [F2] will also pause
playback or SimPlay.
The Play button [1] will play the animation back at 1 time speed. This would be similarto changing the speed with the Speed-Control box.
The Stop Simulation button [0] or [F2] will stop the simulation playback.
Clicking on the right bars will play or SimPlay at 1/2x, 1x, 2x, 4x, and 8x speed. If
simulation data is recorded, it will be played back, otherwise new simulation data will be
SimPlayed. The simulation may not actually play at the full speed with a large network or on a
slow computer. To speed animations, consider animating a small part of the network.Clicking on the left bars will play in reverse at 8x, 4x, 2x, 1x, and 1/2x speed.
The Go-Back-in-Time-to-Beginning-of-Recorded-History button or [<] key returns to
the start of recorded history.
The Frame-Reverse button or [-] key takes the animation back 0.5 seconds. SimTraffic
simulates traffic at 0.1 s increments but only records traffic data at 0.5 increments. A
frame is therefore 0.5 s.
The Frame-Advance button or [+] key takes the animation forward 0.5 seconds.
SimTraffic simulates traffic at 0.1 s increments but only records traffic data at 0.5
increments. A frame is therefore 0.5 s.
The Skip-to-the-End-of-Recorded-History button or [>] key sets the animation at the
end of recorded history.
The Playback-Time box shows the starting and ending times of recorded history on the left andright sides. The center number indicates the current animation time. The needle in the playback
time box can be dragged to quickly go to a specific time.

7/21/2019 Synchro Studio 8 User Guide
http://slidepdf.com/reader/full/synchro-studio-8-user-guide 426/559
21-3
3D Simulations
SimTraffic can create a 3D format file for viewing with Trafficware‟s 3D Viewer program. Tocreate the 3D file, use the command Animate Create 3D Graphics File. A file with an S3D
extension will be created in your project directory.
Use the 3D Viewer button to launch the 3D Viewer application. Refer to Chapter 26 for
full details on using 3D Viewer.
Create SSAM ExportIn SimTraffic, there is a new Animate Create SSAM Export. If this option is checked,
SimTraffic creates a *.tra file during the simulation recording. This file describes the position of
the vehicles throughout the simulation. It is a binary file compatible with FHWA‟s Surrogate
Safety Assessment Model (SSAM). SSAM can be used to analyze the frequency of narrowly
averted vehicle-to-vehicle collisions.
There are several points that may be discussed and adjusted:1. Vehicle speed is in km/h or mph depending if the system is metric or not.
2. Time period is 0.5 sec
Multiple Simulation Runs
The Record-Multiple Runs button or [Ctrl]+[M] will perform and record a simulation
on multiple runs. A dialog will appear allowing the user to select the number of runs tosimulate and record and the starting random number seed. The random number seed
will be incrementally increased by one for the simulated runs. For instance, 1, 2, 3, 4 and 5 if
starting from 1 with 5 runs.
The Run Number of Recorded History will allow the user to load a recorded
history file if multiple runs have been performed. Choose the number of the run
you would like to animate with the drop down list. The number will be the
random seed number that was used. It is possible to have a blank value in the
drop-down list. This indicates a simulation run without a run number extension.
In the reports, the user is allowed to have the report generator average the results for some of all
of the runs performed.
7/21/2019 Synchro Studio 8 User Guide
http://slidepdf.com/reader/full/synchro-studio-8-user-guide 427/559
21-4
The run numbers are used on the same input data and time intervals to get a
statistical average of varied random seeds. See page 23-5 for information on randomseeds and page 24-3 for creating reports with multiple runs.
History Files
SimTraffic records the animation data into a history file. Normally this file has the same name as
the SYN file but has the extension HST. If you have recorded multiple runs (see above), the
HST file will be formatted as filename-#.HST. The '#' will indicate the random seed number thatwas used during the recording. To print the average result of the history files, see the section on
Reports, Graphics and MOEs on page 24-3.
This file(s) is preserved so that animations can be displayed later and reports can be created
without re-seeding and re-recording.
Sometimes the HST file may need to be destroyed or may require re-recording. The following
actions can render a HST file invalid.
Changing data in the SYN file. Zoom settings are exempt.
Changing any simulation options or parameters in SimTraffic. MAP View and zoom
positions are exempt.
Changing the data files if volume or timing data is used.
Use the SimTraffic-Animation button in Synchro to change data without re-seeding.
Making Presentations with Prerecorded Data
If you are planning to make a presentation, it is helpful to have a HST file with the animations
pre-recorded. To insure that the HST file is valid and does not require re-seeding, close
SimTraffic and restart SimTraffic to verify that the history file can be loaded without re-seeding.
When copying files between computers or directories, be sure to copy the SYN, SIM, and HST
files so that all data is transferred. The demo version can play but not record history (HST) files.
Analyzing Part of a Network or a Single Intersection with SimTraffic
SimTraffic analyzes all intersections in a file or network. There is no provision for modeling
part of a network or zone within a file.
To analyze part of a network, do the following:

7/21/2019 Synchro Studio 8 User Guide
http://slidepdf.com/reader/full/synchro-studio-8-user-guide 428/559
21-5
1. In Synchro, select the desired intersection(s) on the map. Multiple intersections can be
selected by dragging a rectangle around them.2. Choose the File Save Part command.
3. Start SimTraffic from the Settings start bar and Open the sub-network file.
Starting More than One Instance of SimTraffic
It is possible to load multiple copies of SimTraffic to display multiple versions of a network at
the same time.
Choosing the SimTraffic-Animation button from Synchro will not start a second instance of
SimTraffic; it simply loads the current file into the already started instance of SimTraffic.
Multiple instances of SimTraffic can be started by choosing the SimTraffic icon on the Settings
Start bar.
Map Settings
Use the command Options Map Settings to change the appearance of the map (see Figure
21-1). This command can change the color and size of the map elements for the Layout, the
vehicle appearance and for static graphics.
Figure 21-1 SimTraffic MAP VIEW Settings
To change a color, click on the Color box for the desired element (Screen Color or Printer
Color) and then select a color from the choices shown. To cancel the selection, use the [Esc]
key.

7/21/2019 Synchro Studio 8 User Guide
http://slidepdf.com/reader/full/synchro-studio-8-user-guide 429/559
21-6
Layout Tab. The sizes for curb lines, center lines, stop bars, street names, and node numbers are
in feet (meters). These elements will be scaled when the map is zoomed in and out. The Street Name Height also affects how often the street name is repeated. To have the street names repeat
farther apart or closer together, decrease the height of the street names.
For best printing performance, set the printer background color and the printer
traveled way color to white.
The checkbox can be selected or de-selected. A check will indicate to show the element andunchecked will make the element transparent.
Use the 'DXF or Bitmap' checkbox to turn off/on the background image. You can import a
bitmap or jpeg image into your Synchro file to use as a Map background. In SimTraffic, the
network will animate on the background image (DXF or Bitmapped). See the topic on
Background Images (page 2-10) for details on importing the background image.
Vehicles Tab. The Vehicles tab is used to adjust how vehicles are displayed on the map, with
one color, color coded by turn type, color-coded by vehicle type, color coded by driver type or
hidden. The Hide Vehicles option is useful for making a printout of the geometrics only. This
tab also includes the option to change the pedestrian color.
Static Graphics. The Static Graphics tab is used to change the colors that are used for the Static
Graphics display.
Map Zooming and ScrollingTo scroll around the map, choose the Pan button or press the [End] key. To
deactivate, select the button again or press [Esc]. In addition, holding the mouse
wheel button down will allow you to drag the map.
The Pan button replaces the option to scroll when the mouse is moved to the edge ofthe Map in older versions of SimTraffic. Using the key pad arrows still scrolls the map.
To view the map closer, choose the Zoom-In button or press [Page Down]. It may be
necessary to scroll to put the map in the center of the MAP view first.

7/21/2019 Synchro Studio 8 User Guide
http://slidepdf.com/reader/full/synchro-studio-8-user-guide 430/559
21-7
To view more of the map, choose the Zoom-Out button or press [Page Up].
To view the entire map, choose the Zoom-All button or press [Home].
To view a specific section of the map, use the Zoom-Window button or press
[Ctrl]+[W]. Then click on the upper-left corner of the viewing area. Then click on the
lower-right corner of the viewing area.
To view the map at a specific scale, use the Zoom-Scale button. Then enter the
desired scale to view the map in feet per inch (meters per inch). This command
assumes 100 pixels per inch on your screen.
To return to the previous view, press [Ctrl]+[Bksp].
The command File Print-Settings for both Synchro and SimTraffic will print to the
scale specified by Zoom-Scale. The printout will be centered on the center point of thecurrent screen view. For further details, see Print Settings on page 24-3.
To center the view on an intersection, select the Zoom to Intersection button or press [F8] and
select the intersection from the list.
To center the view, press [Ctrl]+[C] and click on the map feature to center it.

7/21/2019 Synchro Studio 8 User Guide
http://slidepdf.com/reader/full/synchro-studio-8-user-guide 431/559
21-8
Signal status
Click with the mouse in the middle of the intersection todisplay the status of an actuated or pre-timed signal.
A sample of the signal status appears above. Here is a brief explanation of the signal status.
Table 21-1 Signal Status Description
Int:3 This displays the intersection node number.
Main Street & 3rd St This displays the street names of the intersection.
CL:110 This is the cycle length for pre-timed and coordinated intersections.
Clk:40.0 This is the cycle counter for pre-timed and coordinated intersections. The cycle
counter will be greater or equal to 0 and less than the cycle length. If the offset is 5,
the reference phase will be started or yield when the cycle clock is 5.
Ph 4 These are the currently active phase number(s).
Dir SBTL These are the direction(s) serviced by the currently active phases.
Time 31.0 This is the amount of time elapsed for the currently active phase.
Mn 4 The minimum initial green time for this phase
FO 73 The force off or yield time for this phase. Coordinated and pre-timed only. The phase
will yield to yellow or be forced off to yellow when the cycle clock reaches the force off
time.
Mx 20 For actuated-uncoordinated only. This is the phase's maximum green time.Rcl Crd The recall for the phase if any. This will be Crd for coordinated, Max for Max recall,
Ped for Pedestrian recall, and Min for minimum recall.
Gap 3.0 This is gap counter. It is set to the vehicle extension time when a vehicle is on a
detector. The gap counter is reduced whenever there are no vehicles on the
detectors. When the phase gaps out, the gap counter shows X. The gap counter is
blank for pre-timed signals.
Calls:__4__78 This indicates which phases have a vehicle call. Phases with recall always place a
call. This information is blank for pre-timed signals.
Ped Calls:_4__ This indicates which phases have a ped call. Phases with ped recall always place a
pedestrian call.
To hide the Signal status, press the [Delete] button while it is in focus. To move to a different
status pane press [Ctrl] + [Up] or [Ctrl] + [Down].

7/21/2019 Synchro Studio 8 User Guide
http://slidepdf.com/reader/full/synchro-studio-8-user-guide 432/559
21-9
Vehicle Status
Click with the mouse on a vehicle to display the status of a vehicle. Vehicle status can be used tohelp explain vehicle behaviors.
A sample of the vehicle status appears above. Here is a
brief explanation of the vehicle status.
Table 21-2 Vehicle Status Description
Vehicle ID#: 4 This is a number that uniquely identifies each vehicle. ID numbers are reusedwhen a vehicle leaves the network.
Vehicle Type: Car2 This identifies what type of vehicle is shown. The Options Vehicle-Parameters
shows the characteristics for each vehicle type.
Driver Type: 9 This identifies what type of driver is shown. The Options Driver-Parameters
shows the characteristics for each vehicle type. There are 10 driver types from 1 to
10. The smaller numbered drivers are more conservative and courteous. The
higher numbered drivers are more aggressive.
Node: 8 This is the node number the vehicle is approaching. While in an intersection, this is
the node number of the next intersection.
Upstream Node: 7 This is the upstream node number.
Dist to Sbar (ft): 27 This is the distance from the front of the vehicle to the stop bar.
Next Turn: Thru This is the next turn the vehicle will make. This field will be Left, Thru, Right, Exit,
or Sink. Exit indicates the vehicle is exiting the network. Sink indicates the vehicle
is exiting through a mid-block sink.
2nd Turn: Exit This is the second turn the vehicle will make.
Speed(ft/s): 36.2 This is the current speed of the vehicle in ft/s (m/s).
Accel (ft/s2): -4.0 This is the current acceleration of the vehicle in feet per second squared. (m/s
2).
Current Lane: 2 The current lane. Lanes are numbered sequentially starting at one for the leftmost
lane.
Dest Lane: 2 If a lane change is in progress, this is the destination lane the vehicle is moving
into. Otherwise, the Destination Lane will be the Current Lane.
To hide the Signal status, press the [Delete] button while it is in focus. To move to a different
status pane press [Ctrl] + [Up] or [Ctrl] + [Down].
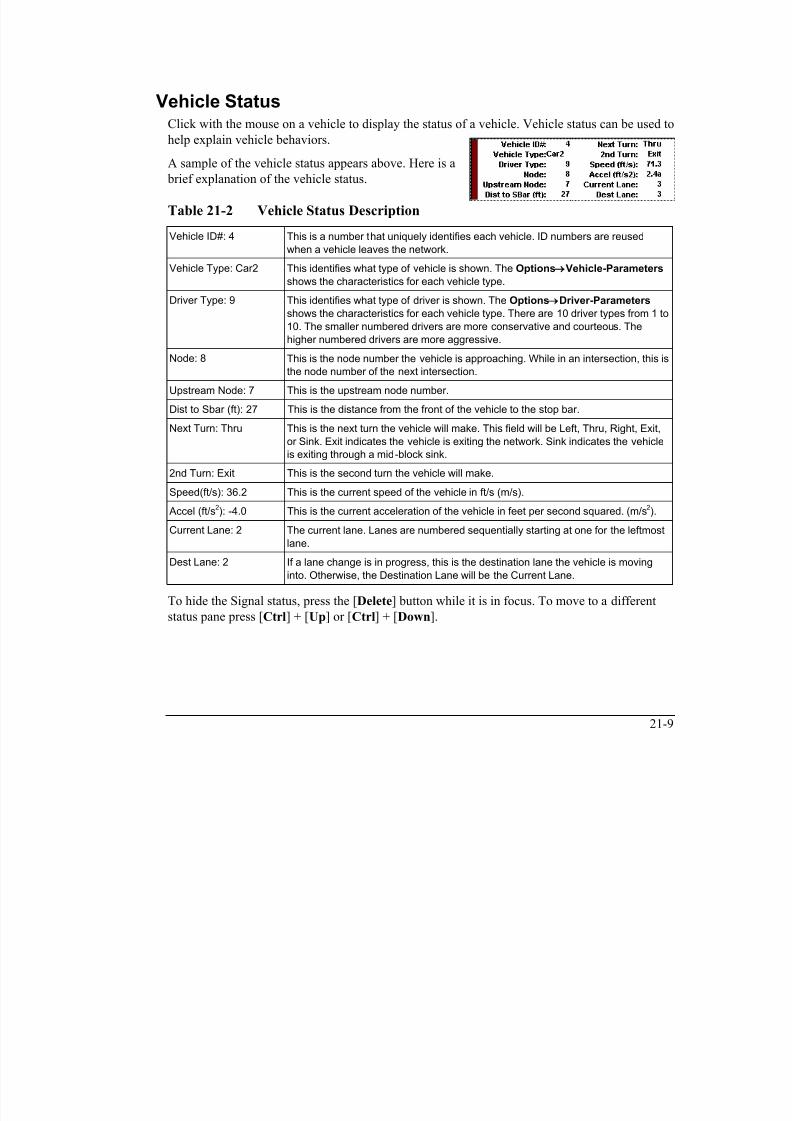
7/21/2019 Synchro Studio 8 User Guide
http://slidepdf.com/reader/full/synchro-studio-8-user-guide 433/559
21-10
Create a Video in SimTraffic
A new feature to record the SimTraffic animation is now included. To create a video, choose theRecord Video button on the upper-ride side of the SimTraffic toolbar.
After selecting the Record Video button, the Video Recorder Settings dialog will appear. The
upper left of the dialog include Predefined Settings. You can select one of the three options for
a larger or smaller file. The larger file will be larger in size, but will have a better video quality.
The actual size of the video depends on the length of the recording. It is suggested that you try
smaller formats first and move up to improve quality as needed.
The three options will use predetermined settings for Screen Size, Frames per second, choice
of video (for local machine or web) and Video Quality. These values can be modified to meetthe desired needs.
Once the settings are determined, use the [Select] button to browse to a directory and enter a
filename. The format will be a Window Media Video (WMV) file. Finally, choose the
[Generate] button to create your video.
Figure 21-2 SimTraffic Video Recording Settings Dialog
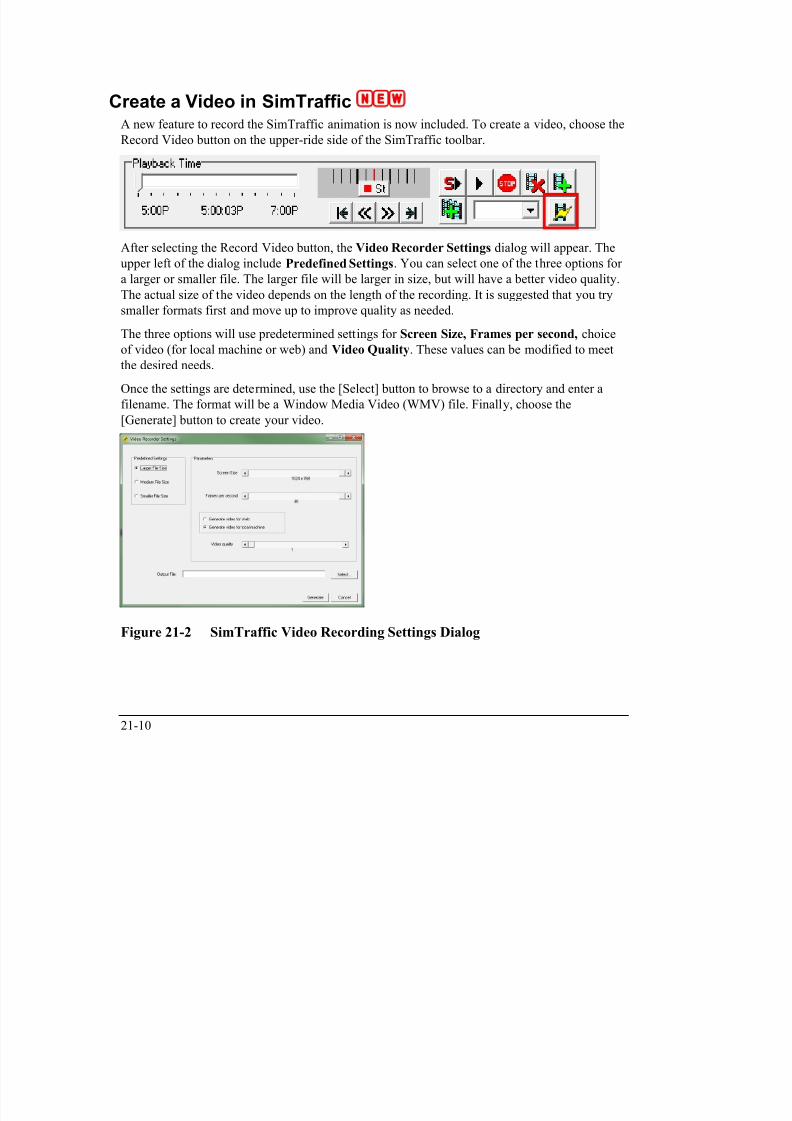
7/21/2019 Synchro Studio 8 User Guide
http://slidepdf.com/reader/full/synchro-studio-8-user-guide 434/559
21-11
SimTraffic Keyboard Shortcuts
Table 21-3 Keyboard Shortcuts
ZOOM ALL [HOME]
ZOOM IN [PAGE DOWN]
ZOOM OUT [PAGE UP]
ZOOM SETTINGS [W], [CTRL]+ [W] or [SHIFT]+[W]
ZOOM PREVIOUS [CTRL]+[BKSPACE]ZOOM SCALE [S]
ZOOM CENTER [CTRL]+[C]
SCROLL MAP [] [] [] []
PAGE MAP [CTRL]+[] [] [] []
SIMPLAY [F5]
PAUSE [F2] OR [0] OR [`]PLAY, SIMPLAY [1] [2] [4] [8]
REVERSE PLAY [SHIFT] + [1] [2] [4] [8]
START OF HISTORY [<] OR [,]
END OF HISTORY [>] OR [.]
FRAME ADVANCE [=] OR [+]
FRAME REVERSE [-]FILE OPEN [CTRL]+[O]
PRINT SETTINGS [CTRL]+[P]
CREATE REPORT [CTRL]+[R]
REMOVE STATUS PANE [DELETE]
UP/DOWN STATUS PANE [SHIFT]+[] []

7/21/2019 Synchro Studio 8 User Guide
http://slidepdf.com/reader/full/synchro-studio-8-user-guide 435/559

7/21/2019 Synchro Studio 8 User Guide
http://slidepdf.com/reader/full/synchro-studio-8-user-guide 436/559
22-1
Chapter 22 – SimTraffic Input DataInput Data
This chapter supplements the topics earlier in this User Guide and places an emphasis on items
specific to SimTraffic. Synchro is required for data input for SimTraffic. SimTraffic uses the
Synchro files as input.
Map View DataIt is necessary to have the links and nodes laid out on an accurate map. You create your analysis
network on the MAP view in Synchro. For further information, see the topic on Mapping Out
Links and Intersections on page 2-4.
The coordinates of the nodes are used in the layout of the map and the geometry of intersection
approaches.
It is possible to override link distances with the LANE settings in Synchro. Link distances
should match map coordinate distances within 20%.
The minimum distance between nodes for SimTraffic is 70ft (20m) for the model to function
correctly. Shorter links may have problems drawing paths through intersections, lack space for
crosswalks, and prevent lane changes. Consider consolidating several driveways into one for the
purpose of simulation.
When feasible, entry links should be long enough to store a complete cycle of traffic.
Entry (external) links should be about 300 feet long (90 m) to 600 feet (180 m). Very long entry
links will increase seed time and the number of vehicles in the network. For high volume roads
with long cycle lengths, make entry links approximately 600 feet (180 m). As noted in the Tip
above, the entry link should be long enough to store one cycle of traffic when possible. Figure22-1 illustrates an internal link, an external link, an intersection node and a bend node.
7/21/2019 Synchro Studio 8 User Guide
http://slidepdf.com/reader/full/synchro-studio-8-user-guide 437/559
22-2
External Link [should
be 300 feet (90 m) to
600 feet (180 m) or long
enough to hold one
cycle of traffic]
Internal Link
[minimum of 70 feet
(20 m), link distance
should be within 30%
of coordinate
calculated distance]
Bend Node (minimize
the use of bends, see
the topic on Bends)
Node or intersection
Figure 22-1 Map Data
Roundabouts
SimTraffic can model roundabouts. In the MAP view, create the roundabout location as anyother intersection. When you select a 'Roundabout' as the Controller Type in the SIGNING
settings, options will become available for the roundabout.
Node Settings
The NODE settings show editing for the following:
Intersection ID or Node Number
Zone, not used by SimTraffic
Cycle Length, Control Type, Lock Timings and Optimize buttons
Coordinates (X, Y, Z)
Description Note box

7/21/2019 Synchro Studio 8 User Guide
http://slidepdf.com/reader/full/synchro-studio-8-user-guide 438/559
22-3
To activate the NODE settings in Synchro, double click on an intersection. Or select a group of
intersections and pressing [Enter] can activate the NODE settings when one or more
intersections are selected.
To create an overpass, assign a higher Z coordinate elevation to the nodes of the overpass link.
Control Type determines if the intersection is unsignalized (traditional or roundabout), pre-
timed, actuated-uncoordinated, or actuated in coordination.
Cycle Length is used to set the background cycle length.
Offset settings determine the offset used for pre-timed and coordinated signals.
Reference Phase is used to determine the coordinated phase for pre-timed and actuated-
coordinated signals. During timing transitions, only pre-timed signals will rest on the reference
phase during the transition.
The Yield Point affects when the Coordinated Phases will “yield” to side street phases. This
setting affects whether there is a single yield point for all phases or multiple yield points. See
page 4-15 for a more thorough discussion.
Flexible Yield Points allow the signal to yield any time between the single point and the phases
scheduled start time. Flexible Yield Points can be useful with low volume side streets; the side
streets have a wider range of time to yield to the signal.
Using a Single Point in conjunction with Fixed Force Off makes the most time available for side
street phases. By Phase can be helpful when providing coordination to side street phases. It is
sometimes possible for the phase to be skipped because its yield time occurs before the platooned traffic arrives.
With low volumes of traffic, using a Flexible Yield Point can appear to look similar to a fully
actuated signal. This is especially true when using Coordinated Minimum Recall for the main
street phases.
Sign Control is used by unsignalized intersections to determine the sign control. With
SimTraffic, it is possible to model two-way, three-way, and all-way stop or yield control
intersections.

7/21/2019 Synchro Studio 8 User Guide
http://slidepdf.com/reader/full/synchro-studio-8-user-guide 439/559
22-4
Lane Settings Data For detailed information, see the chapter on the LANE settings on page 5-13-1.
Lanes and Sharing determines the number of lanes and the channelization of each lane. The
diagrams in Synchro illustrate the use. Remember that shared lanes always count as through
lanes (or left lanes at a T).
To code a LR lane at a street transitioning from two-way to one-way, code the lane as LTR with
no through traffic. SimTraffic will assume a LR lane.Street Names can be used to identify streets on the map.
Link Distance can be used to override the link distance taken from the map. The link distance is
the distance from center point to center point. Link distances must match map coordinate
distances within 20%. The minimum distance between nodes for SimTraffic is 70ft (20m).
Otherwise, there is insufficient distance between intersections for the model to function
correctly.
The link's internal distance is calculated by SimTraffic based on the number of lanes on the
cross street, the angle between streets, and the setback distance for the pedestrian crosswalk.
Link Speed is used to control the driver speed on the link. The link speed is the 50th percentile
speed for free flowing vehicles. Vehicles may not be able to attain the link speed due to traffic
control devices, vehicles ahead, or to slow for turns. The actual speeds will be a range of speeds
based on the driver type. The Driver Options of SimTraffic contains a speed factor for each
driver type. The speed factors range from 0.75 to 1.27 and are multiplied by the link speed todetermine each vehicle‟s maximum speed.
Travel Time is not used by SimTraffic. It is only used by Synchro.
Ideal Saturated Flow will affect the Headway Factor which will influence headways and
Saturated Flow Rates.
Lane Width is used for drawing lanes. It will also change the Headway Factor which will
influence headways and simulated flow rates.
Grade will affect the Headway Factor which will influence headways and Saturated Flow
Rates.
Area Type will affect the Headway Factor which will influence the headways and Saturated
Flow Rates.

7/21/2019 Synchro Studio 8 User Guide
http://slidepdf.com/reader/full/synchro-studio-8-user-guide 440/559
22-5
Storage Length is used to determine whether a storage bay exists and its length. A zero value
indicates no bay and the turning lanes are considered travel lanes. Make sure that there is one or
more non-storage travel lanes.
Any number of lanes can be in the storage bay including Through lanes. It is also possible to
have both storage and travel turning lanes.
Code storage bays to reduce lane changes.
Storage Lanes are the number of lanes in the right or left storage bay. This value only appears
when the storage length is greater than 0. By default the number of storage lanes is equal to the
number of turning lanes.
This field can be overridden so that some of the turning lanes are full travel lanes, or so that
some of the through lanes can be storage lanes.
The Lane Utilization Factor, Right and Left Turn Factors, and Saturated Flows are not used by SimTraffic. These are Synchro only calculations.
Right Turn on Red determines if right turn on red is allowed. Right turns may also be allowed
for overlapping or free style right turns.
Saturated Flow Rate (RTOR) is not used by SimTraffic.
Channelized Right TurnsRight Turn Channelized is active for the rightmost movement. The choices are None, Yield,
Free, Stop and Signal. If this value is changed, it will also be updated for unsignalized analysis.
Curb Radius controls the graphics and layout in SimTraffic. It is measured from center point to
curb.
Add Lanes controls how many add lanes are for the right turn movement. Set to zero (0) for a
yield or merge. Set to the number of turning lanes for add lanes.
Right turn islands can be used in conjunction with shared right/through lanes, with exclusive
lanes or with right turn storage bays. For most situations, a right-turn lane with a storage bay
works better than a shared lane. This creates a bigger right island and also gives more space for
right turns to bypass stopped through vehicles.

7/21/2019 Synchro Studio 8 User Guide
http://slidepdf.com/reader/full/synchro-studio-8-user-guide 441/559
22-6
If right channelization is not used, SimTraffic will automatically create add lanes for right turns;
if:
There are enough downstream lanes, and
There is enough distance for required lane changes.
Slip Lanes for Roundabouts
To code a right turn slip lane at a roundabout for SimTraffic, set the Right Turn Channelized
to Stop, Yield, or Free. SimTraffic will add additional right turn lane(s) to the roundabout,outside of the Outside Radius. The width of the slip lane is determined by the width of the
incoming right turn lane group.
The below Input Fields have the following affect:
Right Turn Channelized = Yield or Stop: Vehicles in slip lane will yield at end of
slip lane if there is a merge.
Right Turn Channelized = Free: Vehicles in slip lane will merge at end of slip lane
if there is a merge.
Right Turn Channelized = None: No slip lane
Lanes and Sharing: Controls number of lanes in right turn slip lane, and number of
lanes to enter main circle.
Curb Radius (in the SIGNING settings): Has no affect; slip lane controlled by
Outside Radius.
Add Lanes: Slip lane will add lane(s), provided enough lanes exist downstream.
With a small circle or tight angle between links, the slip lanes will directly connect. With a
larger circle or angle, the slip lanes will be additional lanes on the outside of the roundabout
with additional radius.
Alternate Method
It is also possible to create a slip lane by coding a multilane roundabout with a Two-Lane Exit
(see Roundabout Analysis, page 22-9). To get a direct slip lane it is necessary to code two lane
exits at both the entry and the exit links. This method works best for creating a slip lane in all
directions.

7/21/2019 Synchro Studio 8 User Guide
http://slidepdf.com/reader/full/synchro-studio-8-user-guide 442/559
22-7
Combining a slip lane with a Two Lane Exit may give a three-lane exit or other strange results.
It is usually best to use one or the other.
Volume Settings Data
For detailed information, see the chapter on the VOLUME settings on page 6-1.
Traffic volume is used to determine the vehicles entering at external links, the proportion of
vehicles turning and also for traffic sinks and sources.
The actual volumes modeled may be adjusted for Peak Hour factor, Growth factor, and/or percentile scaling. The volume adjustments can be set with Options Intervals and Volumes
command in SimTraffic.
If traffic between intersections is not balanced, SimTraffic will assume a traffic source or sink.
Traffic will appear mid-block or exit mid-block for a source or sink respectively.
It is also possible to use volume data from a data file (see the topic on Database Access, page
23-6). In this case the traffic volume in the Synchro (*.syn) file may be ignored.
Conflicting Pedestrians are used to determine the number of pedestrians crossing the roadway.
Peds conflicting with a right turn will appear on the link to the right. Peds conflicting with a left
turn at a T-intersection will appear on the link to the left. If pedestrian calls are coded for the
signal phase, the number of pedestrians will be the maximum of the coded values. See the topic
on Coding Pedestrians, page 22-14.
Peak Hour Factor (PHF) can be used to adjust volume data. By default, volumes are notadjusted by PHF. This is set with the volume adjustments in the Options Intervals-and-
Volumes command.
Growth Factor can be used to adjust volume data. By default, volumes are adjusted by growth.
This is set with the volume adjustments in the Options
Intervals-and-Volumes command.
Heavy Vehicles data is used by SimTraffic. The heavy vehicle fleet volume for each movement
is equal to the volume multiplied by the Heavy Vehicle percentage. The light vehicle fleet
volume is equal to the remaining volume. Heavy Vehicle fleet traffic will be assigned one of the
4 truck types or a bus type. The Light Vehicle fleet traffic will be assigned to a car or carpool
vehicle type. The composition of each vehicle fleet can be adjusted with the Options Vehicle-
Parameters command. If your network has a mixture of different Heavy Vehicle percentages,
SimTraffic may create additional sources or sinks to balance traffic for each vehicle fleet.

7/21/2019 Synchro Studio 8 User Guide
http://slidepdf.com/reader/full/synchro-studio-8-user-guide 443/559
22-8
Bus Blockages will affect the Headway Factor, which will influence the headways and
Saturated Flow Rates. Busses are not explicitly modeled by SimTraffic.
Adjacent Parking Lane and Parking Maneuvers will affect the Headway Factor, which will
influence the headways and Saturated Flow Rates.
Traffic From Mid-Block can be used to create a traffic source from mid-block. SimTraffic will
also assume a mid-block traffic source if necessary to balance traffic flows. The mid-block
traffic can be used to create a source larger than needed for balancing and in some cases create a
sink as well.
Link OD Volumes allows detailed control over the origin and destination of two adjacent
intersections. Volume Balancing can be used to reduce or eliminate certain turn combinations.
The most common use is to prevent vehicles from turning left twice at a freeway or wide median
arterial.
The LINK ORIGIN-DESTINATION VOLUMES setting displays Movement Weighting
Factors that control how volume is allocated between input and output volumes.
The Adjusted Flow, Traffic in Shared Lane and Lane Group Flow settings are not used by
SimTraffic, only Synchro.
Timing and Signing Settings Data
For detailed information, see the chapter on TIMING settings on page 7-1.
Phase Templates (Options Phase Templates) allow phase numbers to be set automatically.
Turn Type is used to set the treatment for the left and right turn movements.
Protected and Permitted Phases are used to determine which movements are allowed during
each phase.
Detector and Switch Phases determine which phases each lane group‟s detectors are connected
to. Calls are placed to the Detector Phases by detectors in the lane group, regardless of the
currently active phases. The Switch Phase is a secondary phase that extends the set phase whenit is green but does not place a call.
Leading Detector is the distance from the leading edge of the first detector to the stop bar. This
value can be ignored for pre-timed intersections and unsignalized intersections.
Trailing Detector is the distance from the trailing edge of the last extension detector to the stop
bar.

7/21/2019 Synchro Studio 8 User Guide
http://slidepdf.com/reader/full/synchro-studio-8-user-guide 444/559
22-9
The Leading and Trailing Detector will be set automatically based on the settings in the
DETECTOR settings (see page 10-1).
Total Split is used to determine the maximum green time.
It is also possible to load split, cycle length, and lagging information from a data file. Refer to
Database Access for more information (page 23-6).
Lost Time Adjustment is not used by SimTraffic. The Total Lost Time in SimTraffic is
dependant on driver reaction time, length of yellow time, yellow deceleration rates, intersection
width, and approach speeds.
Signing Settings Data
For unsignalized intersections, Median Width, TWLTL Median and Right Turn
Channelized are only used in Synchro to perform the HCM unsignalized two-stage gap
analysis. SimTraffic does not model two-stage gap acceptance at this time. The Median Width
will be shown in SimTraffic.
Roundabout Analysis
SimTraffic will now model modern roundabouts. The inputs are set in Synchro. The following
settings are used.
Control Type should be set to Roundabout.
Inside Radius, Outside Radius controls the size of the roundabout. 900' (100m) is themaximum.
# of Lanes is where to set the number of internal lanes within the roundabout, up to 4 lanes.
Speed Limit is the internal speed of vehicles within the roundabout.
Inside Color allows the user to change the inside color of the circle.
Two-Lane Exit controls how many of the internal lanes exit for the subject approach. If youhave a multi-lane roundabout and this is set to Yes, two outer-most lanes in the circle will exit as
illustrated in Figure 22-2. Note the differences in the intersection paths in this two lane
roundabout.
If you have a roundabout with a slip ramp, see the topic Slip Lanes for Roundabouts (page 5-7).

7/21/2019 Synchro Studio 8 User Guide
http://slidepdf.com/reader/full/synchro-studio-8-user-guide 445/559
22-10
Two Lane Exit (All Directions) = No Two Lane Exit (all directions) = Yes
Two Lane Setting
for EB Approach
Figure 22-2 Two Lane Exit Coding
Phasing Settings Data For detailed information, see the chapter on the PHASING settings on page 8-1.
The Ring and Barrier Designer allows up to 32 phases to be entered in one of 64 fields. This
allows for the modeling of complex phasing strategies. Phase numbers are entered into the
appropriate barrier, ring and position (BRP) fields in the four rings and four barriers.
Minimum Initial is used with actuated intersections to determine the minimum initial green
time. This is used as the minimum green time.
Minimum Split is not used by SimTraffic.
Maximum Split is used to determine the maximum green time.
Yellow and All Red are used to determine the yellow and all-red times.
Lead/Lag is used to determine the phase order.
Allow Lead/Lag Optimize? is not used by SimTraffic.
Vehicle Extension is used with actuated phases. A vehicle passing over a detector will extend
the gap counter by the amount of time specified by the Vehicle Extension time.
Minimum Gap is used with actuated phases for volume-density operation. After Time Before
Reduce the gap time is reduced from Vehicle Extension to the Minimum gap. After Time Before
Reduce and Time To Reduce, the Minimum Gap time is used as the gap time.
i f d i d i h d h f l d i

7/21/2019 Synchro Studio 8 User Guide
http://slidepdf.com/reader/full/synchro-studio-8-user-guide 446/559
22-11
Time Before Reduce and Time To Reduce are used with actuated phases for volume-density
operation. Set these values to 0 to disable volume-density operation. The Time Before Reduce
and Time To Reduce start counting at the beginning of green.
Recall Mode determines the operation of each phase. With Max Recall, the phase will always
show for its maximum time. With Max Recall, detector information and pedestrian calls are
ignored; pedestrian phases will always be serviced. With Minimum Recall, the phase will
always appear for its Minimum initial time, even with no calls. With Pedestrian Recall, the
phase will always show a walk and flashing don‟t walk sequence, even with no pedestrian calls.
With No Recall, the phase may be skipped if there are no calls.C-Max termination is used with coordinated signals only. This option is available for phases
selected as the reference phase in the Offset Settings. Phase shows for its maximum time starting
at its scheduled start time.
C-Min termination is used with coordinated signals only. This option is available for phases
selected as the reference phase in the Offset Settings. Phase shows for its minimum time starting
at its scheduled start time.
Pedestrian Phase determines if the phase has a pedestrian phase. This field is used for both pre-
timed and actuated intersections.
Walk Time and Flash Don’t Walk determine the length of each pedestrian interval. Flash
Don‟t Walk is not concurrent with yellow time.
Pedestrian Calls determines how many calls each phase receives. Conflicting pedestrians coded
in the VOLUME settings will also call an actuated phase. The number of pedestrians is themaximum of conflicting pedestrians and pedestrian calls. Also see the topic on Coding
Pedestrians, page 22-14.
For an actuated controller, Dual Entry affects which, if any, phase shows when there is no call
or recall for a ring-barrier sequence.
Fixed Force Off is used for Actuated-Coordinated signals only. When set to Yes, a non
coordinated phase can show more than its maximum time when it starts early. When set to No,
actuated phases will not extend past their maximum times.
Simulation SettingsFor detailed information, see the chapter on the SIMULATION settings on page 9-1.
Taper Length is used to define the length of the taper at the end of the Storage Lane.
Lane Alignment is used to align the approach lanes with the downstream receiving lanes See

7/21/2019 Synchro Studio 8 User Guide
http://slidepdf.com/reader/full/synchro-studio-8-user-guide 447/559
22-12
Lane Alignment is used to align the approach lanes with the downstream receiving lanes. See
page 9-2 for details.
Enter Blocked Intersection setting controls simulation modeling gridlock avoidance. Checking
the box will set this value to Yes. An unchecked box is No. See the topic on page 9-4 for details.
Median Width is the width of the median in simulation. Vehicles will not stop in the median
during simulation, regardless of the median width.
Link Offset allows the link to be offset to the right or left of the center line.
Crosswalk Width controls the width of the crosswalk. See page 9-6 for details.
TWLTL Median is a visual setting. Vehicles will not use the TWLTL. Checking this box will
show a TWLTL in the median.
Headway Factor is an adjustment to headways on a per movement basis. The Headway Factor
can be used to calibrate the Saturated Flow Rates.
Turning Speed determines the speed limit while turning. This is adjusted by driver speed
factor. The defaults are 15mph (25 k/h) for left turns and 9 mph (15 k/h) for right turns. Forlarge intersections, these speeds can be increased for improved operation.
Mandatory Distance, Positioning Distance, Mandatory 2 Lane Distance and Positioning 2
Lane Distance controls the distance where vehicles make lane changes. See the discussion on
Lane Choice and Lane Changes on page 25-8.
Detector SettingsFor detailed information, see the chapter on the DETECTOR settings on page 10-1.
Number of Detectors is the number of longitudinal detector sets, not the number across the
lanes. Detectors are numbered from the stop bar back; detector 1 is at the stop bar. You can
enter up to 5 detectors.
Detector Phase is the primary phase for this detector. This is the same as the Detector Phase
setting in the TIMING settings.
Switch Phase is a secondary phase that extends the phase when it is green. This setting does not
call the listed phase, and does not call the Primary Detector phase when Switch phase is green.
Leading Detector and Trailing Detector are the same settings as in the TIMING settings
(refer to page 7-8).
Detector Templates are predefined detector layouts Number position size type and times are

7/21/2019 Synchro Studio 8 User Guide
http://slidepdf.com/reader/full/synchro-studio-8-user-guide 448/559
22-13
Detector Templates are predefined detector layouts. Number, position, size, type and times are
included.
Add Template is activated by choosing Options Detector-Templates, or by double clicking
on the DETECTORS settings. The template allows the user to setup detector templates. There
is one column for each detector.
Detector n Position is the distance from the stop bar to the trailing edge (closet to stop bar) of
detector n.
Detector n Size is the size of the detector in the traveled direction.
Detector n Type can be Calling, Extend or Cl+Ex. Calling places a call when the phase is
yellow or red. Extend places a call when the phase is green. Options for delay, queue, and
extend detectors are set by using a non-zero time for these options.
All detectors are presence detectors, not passage.
Detector n Channel is not currently used by Synchro or SimTraffic, but can be imported and
exported in UTDF data access. In the future there may be a conversion program to convertcounts by detector number into counts by turning movement for use by Synchro.
Detector n Extend is the detector Extend time (e) for detector n. This is sometimes called
“carry time”. Entering a non-zero value will extend calls from this detector e seconds after the
vehicle moves on.
Detector 1 Queue is where to enter the Queue time to have the stop bar detector act as a queue
detector (the old name is “Type 3 detector”). A queue detector will extend the phase during the
first q seconds, and then be disabled. Queue detection is useful for extending the phase during
the queue clearance time, then later allowing the advance detectors to extend the phase.
Detector 1 Delay is the setting to have the stop bar detector act as a Delay detector. A delay
detector will not place a call on red or yellow, until the vehicle has been there for at least d
seconds.
7/21/2019 Synchro Studio 8 User Guide
http://slidepdf.com/reader/full/synchro-studio-8-user-guide 449/559
22-14
Bends
Avoid using excessive bends in your street network. Bend nodes can cause performance
problems, especially with SimTraffic and CORSIM. Short links can also cause reduced speeds
and capacities within SimTraffic. It is not necessary to follow the exact alignment of the street
along the centerline. Use curved links instead of bends where possible.
Coding Pedestrians
Pedestrians can be coded by setting Conflicting Pedestrians in the VOLUME settings or
setting Pedestrian Calls in the PHASING settings.
Each link can have pedestrians crossing its end at an intersection. At a signalized intersection,
each link has one or zero Pedestrian Phases associated with it. A single phase can be associated
with pedestrians on more than one link. Pedestrians waiting to cross a link place calls to the
Pedestrian phase. Pedestrian calls are allocated among all links having a phase as their
Pedestrian Phase.
The number of pedestrians crossing the link is the maximum of the conflicting pedestrians and
the pedestrian calls for the associated Pedestrian Phase. If the Pedestrian Phase serves more than
one pedestrian movement, these pedestrian calls are divided among the links.
SimTraffic has smart logic to assign phases to links. This logic takes into account the use of
Pedestrian-Only phases, and pedestrians at a T intersection.
Normally links are associated with the phase serving the through movement on the next link tothe left, (see Figure 22-3). A link may also be associated with a turning movement, (see Figure
22-4). To have a phase be used as a Pedestrian Phase, set Pedestrian Phase to Yes in the
PHASING settings. At a 5-leg intersection, SimTraffic will attempt to use a phase from the next
left link, before using others (see Figure 22-5).
7/21/2019 Synchro Studio 8 User Guide
http://slidepdf.com/reader/full/synchro-studio-8-user-guide 450/559
22-15
Crosswalk has
pedestrian ø2ø2
5 6 7 8
431 2
Shaded arrow represents a permitted
movement (yields to peds)
Dashed line represents pedestrian
movement.
Figure 22-3 Pedestrian Phase Associated with Through Phase
Crosswalk has
pedestrian ø4ø4
1 2 3 4
875 6
Shaded arrow represents a permitted
movement (yields to peds)
Dashed line represents pedestrian
movement.
Figure 22-4 Pedestrian Phase Associated with Left Phase

7/21/2019 Synchro Studio 8 User Guide
http://slidepdf.com/reader/full/synchro-studio-8-user-guide 451/559
22-16
Crosswalk uses ped ø4
because it serves next
link to the left
ø4
1 2 3 4
875 6
Shaded arrow represents a permitted
movement (yields to peds)
Dashed line represents pedestrian
movement.
Figure 22-5 Pedestrian Phase at a Five-Leg IntersectionIf a phase serves a conflicting, protected right turn movement, the link will try to use another
phase. Set the right phase to Permitted to have pedestrians using that phase (see Figure 22-6).
Set the right phase to protected to use an alternate phase. Similarly, set the left phase for
permitted to have pedestrians move with a crossing left movement (see Figure 22-7).
Crosswalk has
pedestrian ø3
because ø4 is
protectedø4
1 2 3 4
875 6
Shaded arrow represents a permitted
movement (yields to peds)
Dashed line represents pedes trian
movement.
Figure 22-6 Protected Pedestrian Phase

7/21/2019 Synchro Studio 8 User Guide
http://slidepdf.com/reader/full/synchro-studio-8-user-guide 452/559
22-17
Crosswalk uses
ø4 because ø4
is permittedø4
1 2 3 4
875 6
Shaded arrow represents a permitted
movement (yields to peds)
Dashed line represents pedestrian
movement.
Figure 22-7 Pedestrian Phase with Permitted Left Turn Phase
A pedestrian only phase will be assigned to all links not served by another phase. Setting
permitted and protected turning movements can determine which links are assigned to the
pedestrian phase. See Figure 22-8 for use of pedestrian phase with crossing one-way streets.

7/21/2019 Synchro Studio 8 User Guide
http://slidepdf.com/reader/full/synchro-studio-8-user-guide 453/559
22-18
Crosswalkuses ø1, no
conflicts
ø1
31 2
Shaded arrow represents a permitted
movement (yields to peds)
Dashed line represents pedestrian
movement.
ø2
Crosswalk
uses ø2, no
conflictsCrosswalk uses ø3,
ø1 and ø2 have
protected movments
conflicting
Crosswalk uses ø2
because ø2 left is
permissive
Figure 22-8 Pedestrian Phases for One Way Streets
Chapter 23 – SimTraffic Advanced Parameters

7/21/2019 Synchro Studio 8 User Guide
http://slidepdf.com/reader/full/synchro-studio-8-user-guide 454/559
23-1
Chapter 23 – SimTraffic Advanced Parameters
Advanced Parameters
This chapter describes the SimTraffic parameter pages. These parameters are used to allow
access to the advanced features of SimTraffic. For many simulations, these parameters can be
left at the defaults.
The Intervals page can be used to control the seeding time and recording time. The Intervals
page can also control the adjustments to volumes and can be used to setup multiple intervals
with changing volumes and timing plans.
The Data Options page is used to activate the data access feature. Data Access is used to
simulate multiple timing plans or changing traffic volumes.
The Vehicle Parameters page can be used to view and change the vehicle characteristics.
Normally the default parameters are acceptable. This page can be used to change the percentage
of cars, trucks, and busses in the fleet. This page can also change the length and width ofvehicles, the acceleration rate, and the maximum speed of the vehicle.
The Driver Parameters page can be used to view and change the driver characteristics.
Normally the default parameters are acceptable. This page can be used to change the driver's
reaction rates or to make the driver population more or less aggressive.
All of the parameters and SimTraffic settings are stored in a file with the same name as the
Synchro (*.syn) file, but with the extension *.sim. It is possible to copy parameters from one fileto another by copying the SIM file. The SIM file is a text file so it is possible to copy some of
the parameters using a text editor with cut and paste between two SIM files.
Intervals and Volume Adjustments
The Intervals page controls the length of time recorded, the length of seed time, and volume
adjustments. If data files are used, the intervals page is also used to control the timing plan andvolume used for each time period. The Interval Parameters page is shown in Figure 23-1.
7/21/2019 Synchro Studio 8 User Guide
http://slidepdf.com/reader/full/synchro-studio-8-user-guide 455/559
23-2
Figure 23-1 Interval Parameters Page
Choose the Options Intervals-and-Volumes command to activate the Intervals page.
Intervals
Each column represents an interval. Normally a simulation has a "seed" interval followed by one
or more recorded intervals.
The purpose of the Seed Interval is to fill the network with traffic. The seed interval should be
long enough for a vehicle to traverse the entire network with stop time included.
The Recorded Interval(s) follow the seed interval and these intervals are recorded for
animation, reports, and static graphics.
For some applications, it may be necessary to have more than one recorded interval. It is possible to have a congested peak interval of, for example, 15 minutes, followed by an off-peak
interval to see how quickly the network recovers from congestion.
Multiple intervals can also be used to simulate multiple timing plans and the transition between
timing plans.
Each interval has a Duration in minutes.
Each duration has a Start Time expressed in the format hh:mm. All time periods must be
contiguous
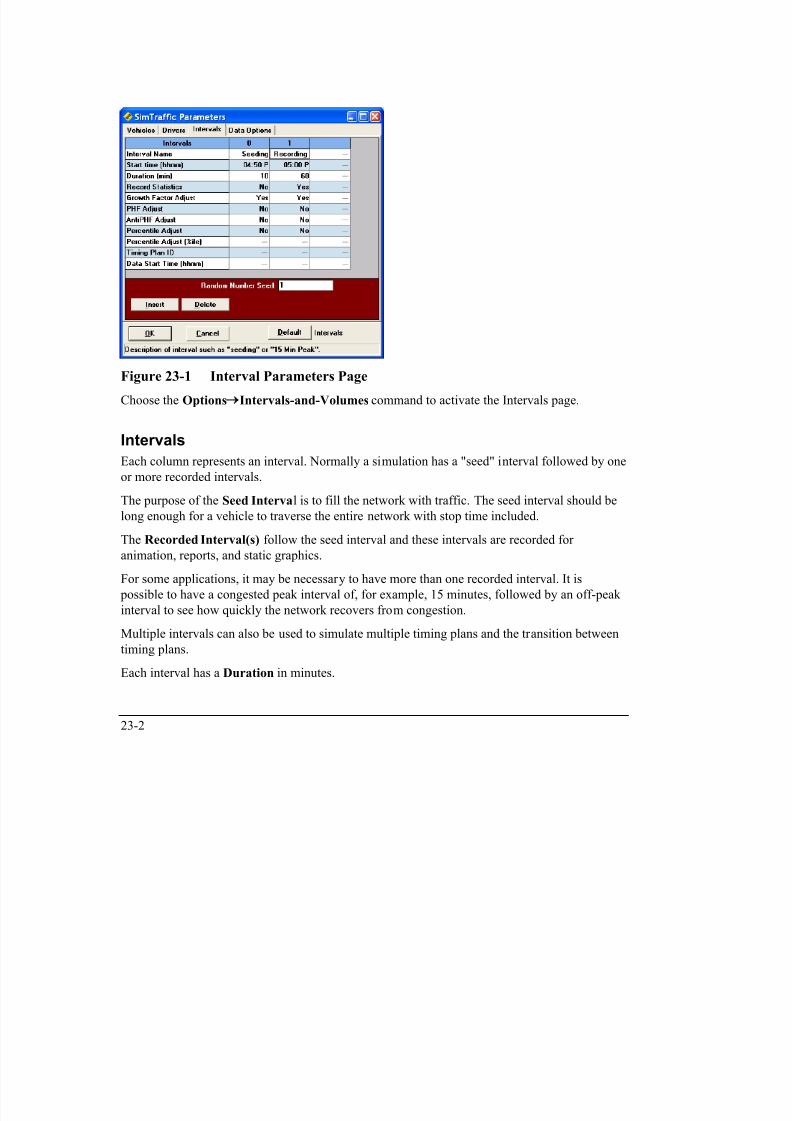
7/21/2019 Synchro Studio 8 User Guide
http://slidepdf.com/reader/full/synchro-studio-8-user-guide 456/559
23-3
contiguous.
Record Statistics indicates whether statistics and vehicle paths are recorded for each interval.
Set this field yes for all intervals after the seeding interval(s). Once recording starts, it remains
on for the rest of the simulation.
Setting the Seed Time
The seeding time should be long enough for a vehicle to traverse the entire network between the
two most distant points including all stops. The seeding time should also be longer than themaximum cycle length used in the network. After the seeding time, the number of vehicles
entering the network per minute should be about the same as the number of vehicles exiting the
network per minute. Look at the Vehicle Counts in the Recording Status settings during seeding
and recording to see how many vehicles are entering and exiting the network.
If one or more movements are above capacity, the number of entering vehicles will always
exceed the number of exiting vehicles, and equilibrium will not be achieved. In this case, the
seed time should be long enough so that the number of exiting vehicles per minute stabilizes at a
fixed value.
Volume Adjustments
The volumes simulated come from the traffic volumes in the SYN file or from an external data
file (refer to page 23-6). These volumes can be adjusted by a number of factors as detailed
below.
Set Growth Factor Adjust to adjust for growth factors. The growth factors are input in
Synchro's Volume settings and are 100% by default.
Set PHF Adjust to adjust for peak hour factors. Volumes are divided by the PHF. The PHF are
input in Synchro's Volume settings and are 0.92 by default. The PHF is the ratio a volume for
the entire hour divided by the peak 15 minute period times 4. A common use of PHF Adjust is to
model 15 minutes of peaking traffic followed by an interval of off peak traffic.
Set Anti-PHF Adjust to unadjust for peak hour factors. The PHF increases the hourly count
for the peak 15 minute period. The volume for the remaining 45 minutes will thus be decreased
from the hourly rate. Volumes are adjusted by the following formula:
v' = v * (1 - (1/PHF- 1)/3)) = volume adjusted for anti phf
dj t d l
7/21/2019 Synchro Studio 8 User Guide
http://slidepdf.com/reader/full/synchro-studio-8-user-guide 457/559
23-4
v = unadjusted volume
PHF = peak hour factor
Set Percentile Adjust to create a pulse of traffic based on Poisson arrivals. The percentile adjust
can be used to model a 95th percentile queue or to see how a network fares with peaking traffic
conditions.
SD = SquareRoot(v / 60 * d) * 60 / d = standard deviation in volume
v = unadjusted volume
d = interval duration in minutes
v' = v + SD * Z = adjusted volume
Z = Z Factor dependant on percentile, some samples are shown below
Table 23-1 Z Factor Table
Percentile Z
10 -1.28
30 -0.52
50 0
70 0.52
90 1.28
95 1.64
99 2.33
For example, a 5-minute interval has a 95th percentile adjustment and a volume of 300 vph. The
percentile adjusted volume will become 384 vph.
SD = Sqrt(300 / 60 * 5) * 60 / 5 = 60 vph
v' = 300 + 60 * 1.64 = 384 vph
The percentile adjustment in SimTraffic is intended to be used for a short period of time. The
95th adjusted volume would not be observed for the entire hour or even 15 minutes, but maybe
for 2 or 3 minutes. It is a quick way to get a high traffic loading without performing a 60-minute
simulation. If you want to use the percentile adjustments, the following intervals are
recommended:
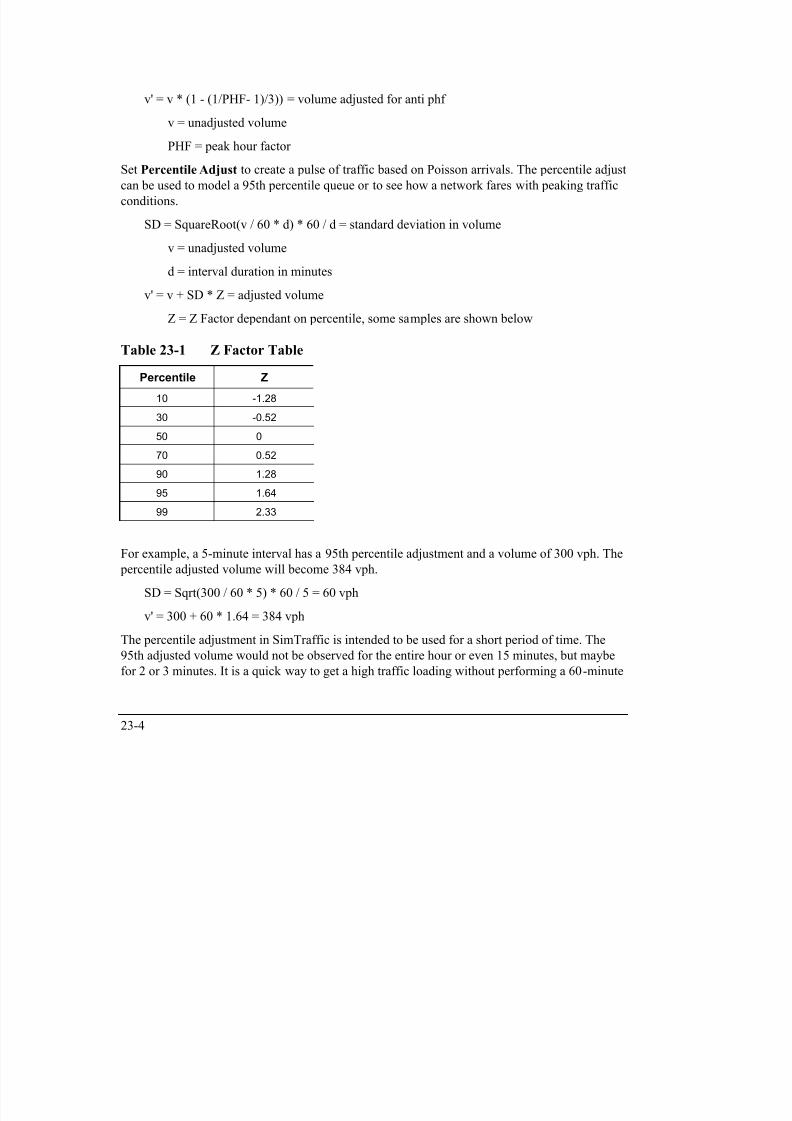
7/21/2019 Synchro Studio 8 User Guide
http://slidepdf.com/reader/full/synchro-studio-8-user-guide 458/559
23-5
recommended:
Interval 0, Seeding: Duration long enough for vehicle to traverse from one side of the network
to another, including stops.
Interval 1, Recording: Duration is closest to cycle length, volume is percentile adjusted 95th.
Interval 2, Recording and Recovery: Duration 15 minutes, no volume adjustment.
Database ParametersThe last two rows of the Intervals page are used in conjunction with external data files.
SimTraffic can read a Timing.csv and Volume.csv file.
Timing Plan ID is used to specify a timing plan from a timing data file. The timing data file
may contain more than one set of timing plans and the timing plan ID specifies which one to
use. It is possible to simulate multiple timing plans by using a different Timing Plan ID for each
interval. The signals will transition between timing plans at the beginning of an interval with a
new timing plan.
Data Start Time is used to identify which volume counts to load from a volume data file. A
volume data file may contain multiple volume counts, each marked with a different set of dates,
times, and intersection ID numbers. It is possible to load a different set of volume counts for
each interval by specifying the data time of the volume count. This time does not need to match
the start time listed above.
For details on setting up the database access files, see the topic on Database Access on page 23-6
Random Number Seed
SimTraffic uses random numbers to determine when new vehicles and pedestrians enter the
network and to choose vehicle paths through the network. The random number seed can be used
to generate the same sequence of vehicle entries or to create a new sequence each time.
If Random Number Seed is zero (0), SimTraffic will choose a random number seed at random.
All simulations with random number seed 0 should be unique from each other.
If the random number seed is non-zero, SimTraffic will use this number as a seed. All
simulations with the same file and the same seed will produce the same simulation sequence. By
default the seed is set to one (1). The non-zero seed is useful so that simulation results are
repeatable.
7/21/2019 Synchro Studio 8 User Guide
http://slidepdf.com/reader/full/synchro-studio-8-user-guide 459/559
23-6
p
Using a common non-zero seed cannot be used to generate identical traffic streams for two
similar files with different signal timing. The vehicle paths are randomly determined as vehicles
traverse the network. If the travel time of vehicles is changed between files, the application of
random numbers is changed and the vehicle generation sequence will be changed.
Multiple Runs
For serious simulation applications, it is recommended that multiple runs be performed withdifferent random number seeds. The Record-Multiple Runs button or [Ctrl]+[M] will perform
and record a simulation on multiple runs. A dialog will appear allowing the user to select the
number of runs to simulate and record and the starting random number seed. The random
number seed will be incrementally increased by one for the simulated runs. For instance, 1, 2, 3,
4 and 5 if you are starting from 1 with 5 runs.
SimTraffic will combine MOEs from multiple simulation runs. It is also possible to save the
reports in text format and import the text reports into a spreadsheet program.
Database Access
The database access feature allows volume counts and timing plans to be read from an external
data file. The database feature is useful to model multiple intervals with more than one timing
plan or volume count.
The data files are Volume and Timing style comma separated files (CSV). Refer to Chapter 1.
The Data Options page (Figure 23-2) can be accessed with the Options Database-Access
command.

7/21/2019 Synchro Studio 8 User Guide
http://slidepdf.com/reader/full/synchro-studio-8-user-guide 460/559
23-7
Figure 23-2 Data Options Page
Volume Data Options
To read volume counts from a data file, check the Read Volumes from UTDF Data File box.
This feature is most useful when two or more counts will be simulated in two or more intervals. Next, select a Volume File Style. This option specifies whether the data format. Volume data
can be stored in a single file (Volume.CSV), multiple files (TMC###.VOL) one file per date
(Vyymmdd.CSV).
Next, select a Filename or File Directory depending on the file style using the [Select] button.
If the data file(s) contain counts from multiple dates, select the Data Date. On the interval page,
select a Data Start Time for each count.
The volume counts can either be 15 minute or 60 minute counts. The top of the volume file
should identify the duration of the counts. If not specified, SimTraffic will assume 15 minute
counts.
It is possible to read TMC style Volume count files. The filename should be in the format
TMC###.VOL, where ### is the intersections' node numbers.
Timing Data Options
To read timing plans from a data file, check the Read Timings from UTDF Data File box. This

7/21/2019 Synchro Studio 8 User Guide
http://slidepdf.com/reader/full/synchro-studio-8-user-guide 461/559
23-8
g p g
feature is most useful when two or more timing plans will be simulated in two or more intervals.
This feature can be used to model transitions between timing plans.
Next select a data filename for the timing plans using the [Select] button. All the timing plans
must be in the same data file.
Select a Default Timing Plan Name. This plan name is used when a Timing Plan ID (on the
Intervals tab) is not specified for one or more intervals.
The timing data file should contain one or more complete timing plans for all intersections. Each
row contains a single timing plan for a single intersection. An intersection ID or node number,
and a PLANID identify each timing plan.
The timing data file contains splits, cycle lengths, offsets, and lagging information. These timing
inputs are considered variable and can be changed with time-of-day timing plans. All other
timing information is considered fixed and cannot vary between intervals.
Vehicle Parameters
The Vehicle Parameters page can be accessed with the Options Vehicle-Parameters
command.
The Vehicle Parameters page can be used to view and change the vehicle characteristics.
Normally the default parameters are acceptable. This page can be used to change the percentage
of cars, trucks, and busses in the fleet. This page can also change the length and width ofvehicles, the acceleration rate, and the maximum speed of the vehicle.
The Vehicle Options page is illustrated in Figure 23-3.
7/21/2019 Synchro Studio 8 User Guide
http://slidepdf.com/reader/full/synchro-studio-8-user-guide 462/559
23-9
Figure 23-3 Vehicle Options Page
Vehicle Name is used to identify the vehicle type.
Vehicle Occurrence defines what percentage of the vehicle fleet is made up of this vehicle type.
When vehicles are created, they are randomly assigned a vehicle type based on the Vehicle
Occurrence of each type. This value can be used to change the percentage of trucks, busses, high
performance cars, or low performance cars.
New vehicles are randomly assigned a vehicle type based on each vehicles occurrence. New carsare assigned a Car or Carpool vehicle. New heavy vehicles are assigned a Truck or Bus vehicle.
The sum of car types will add up to 1.0. The sum of the heavy vehicle types will also add to 1.0.
The Heavy Vehicles percentage setting in Synchro determines the proportion of
Heavy Vehicles for each link. The Vehicle Occurrence setting adjusts the proportion of
vehicles within the Non-Heavy fleets (cars and Car-pools) and the Heavy fleets (trucks
and busses).
Acceleration is used to determine the acceleration available at a given speed. The Acceleration
is listed in an accels.csv file in the program installation directory. For Version 7/8, these
acceleraltion rates were taken from TSIS version 5, based on FHWA research. This table
contains the maximum acceleration in ft/s2. Each row is a speed in ft/s.

7/21/2019 Synchro Studio 8 User Guide
http://slidepdf.com/reader/full/synchro-studio-8-user-guide 463/559

7/21/2019 Synchro Studio 8 User Guide
http://slidepdf.com/reader/full/synchro-studio-8-user-guide 464/559
23-11
Figure 23-4 Driver Parameters Page
Yellow Decel is the maximum deceleration rate a driver is willing to use when faced with a
yellow light. If the driver is unable to stop using the Yellow Deceleration Rate, they will
continue, even if it means entering the intersection on red. By default the Yellow Deceleration
Rate varies between 12 ft/s2
and 7 ft/s2
(3.6m/s2
to 2.1m/s2
). To make the drivers' less prone torunning red lights, increase the yellow deceleration. The Yellow Decel rates by driver type are
listed in Table 23-2.
Table 23-2 Yellow Decel Rates by Driver Type
Driver Type 1 2 3 4 5 6 7 8 9 10
Yellow Decel (ft/s2) 12 12 12 12 12 11 19 9 8 7
Yellow Decel (m/s2) 3.6 3.6 3.6 3.6 3.6 3.3 3.0 2.7 2.4 2.1
The Speed Factor is multiplied by the link speed to determine the maximum speed for this
driver. If the link speed is 50ft/s and the speed factor is 1.1, this driver will attempt to maintain a
speed of 55ft/s. By default the Speed Factors vary between 0.85 and 1.15. These numbers can be
increased or reduced to change the range of speeds. The speed factor range in version 6 and
earlier was 0.75 to 1.27.

7/21/2019 Synchro Studio 8 User Guide
http://slidepdf.com/reader/full/synchro-studio-8-user-guide 465/559
23-12
Courtesy Decel rate (CDR) is the amount of deceleration a vehicle will accept in order to allow
an ahead vehicle in an adjacent lane to make a mandatory lane change. A driver with a CDR of
11 ft/s2 is much more likely to stop or slow to let in a vehicle than one with a CDR of 4 ft/s2.
Yellow React is the amount of time it takes the driver to respond to a signal changing to yellow.
More aggressive drivers will have a longer reaction time to yellow lights. By default, this value
ranges from 0.7 to 1.7 s. The Yellow React times by driver type are shown in Table 23-3.
Table 23-3 Yellow Reaction Rates by Driver Type
Driver Type 1 2 3 4 5 6 7 8 9 10
Yellow React (s) 0.7 0.7 1.0 1.0 1.2 1.3 1.3 1.4 1.4 1.7
The yellow deceleration rates and reaction times are based on a research study "Evaluation of
Driver Behavior at Signalized Intersections", Wortman and Matthias, Transportation Research
Record 904. This study measured driver behaviors at locations in Arizona. This study founddeceleration rates ranging from 5 to 24 ft/s
2. The maximum deceleration allowed in SimTraffic's
car following model is 12 ft/s2. This study found reaction times ranging from 0.5 seconds to 3
seconds. The SimTraffic reaction times do not use this full range because the longer reaction
times are not necessarily the same drivers as the lower deceleration rates.
Older versions of SimTraffic used lower deceleration rates and shorter reaction times as noted
above. The higher deceleration parameters will tend to reduce red light running for higher speed
approaches and for vehicles slowing into a turn. However, the longer reaction times may
increase red light running at low speed approaches. These changes are consistent with research
that shows vehicles accept higher rates of deceleration on high-speed approaches.
Users are encouraged to perform studies of local conditions to determine the behavior of local
drivers. An active red light enforcement program may lower the yellow reaction times and
increase the yellow deceleration rate. Of most interest is driver type 10, the most aggressive,
because they will be most likely to run lights and cause startup delays to the next movement. Inthe field, these drivers are the most likely to cause accidents.
Green React is the amount of time it takes the driver to respond to a signal changing to green.
More aggressive drivers will have a shorter reaction time to green lights. By default, this value
ranges from 0.8 to 0.2 s.
Headways are the amount of time between vehicles drivers try to maintain. When traveling at
30 ft/s a vehicle with a 1-second headway will try to maintain 30ft between it and the leading
vehicle SimTraffic accepts headway values for headways at 0 mph 30 mph 50 mph and 80

7/21/2019 Synchro Studio 8 User Guide
http://slidepdf.com/reader/full/synchro-studio-8-user-guide 466/559
23-13
vehicle. SimTraffic accepts headway values for headways at 0 mph, 30 mph, 50 mph and 80mph (0, 50, 80, and 130 km/h). Interpolation is used to determine headways at other speeds. See
Calibrating Speeds and Headways on page 23-15 for further details. Note that headways can
be adjusted for individual movements using the headway factor in the SIMULATION settings
of Synchro.
Gap Acceptance Factor is an adjustment to the approach gap times. This is the gap vehicles
will accept at unsignalized intersections, for permitted left turns, and for right turns on red. By
default, these values range from 1.15 to 0.85. The higher values represent more conservative
drivers.
Drivers will make Positioning Lane changes to be in the correct lane for future turns. A driver
will defer making a Positioning Lane change when there is Positioning Advantage more
vehicles ahead in the target lane than the current lane. Higher Values are associated with more
conservative drivers and cause drivers to line up in the correct lane. Lower Values are associated
with aggressive drivers and cause drivers to avoid lining up in the correct lane until reaching the
mandatory lane change point. The range of values is 0.5 to 20 vehicles. If all vehicles ahead are
moving, they count as a fraction of a vehicle depending on the speed of the slowest vehicle
ahead.
Drivers will make desired lane changes to get in a lane with fewer vehicles ahead. A driver will
make a desired lane change when there is Optional Advantage less vehicles ahead in the target
lane than the current lane. Higher values are associated with more conservative drivers and
cause drivers to have unbalanced lane use. Lower Values are associated with aggressive driversand cause drivers to use lanes evenly. The range of values is 0.5 to 20 vehicles. If all vehicles
ahead are moving, they count as a fraction of a vehicle depending on the speed of the slowest
vehicle ahead.
Mandatory Distance Adjustment is the factor by which the mandatory lane change distances
are multiplied. The default values are shown in Table 23-4
Table 23-4 Default Mandatory Distance Adjustment Factors
Driver Type 1 2 3 4 5 6 7 8 9 10
MLCD Factor (%) 200 170 150 135 110 90 80 70 60 50
The Positioning Distance Adjustment is used to multiple the Positioning Distance (see page
9-8) values for each driver type. The default values are listed in Table 23-5
Table 23-5 Default Positioning Distance Adjustment Factors
Driver Type 1 2 3 4 5 6 7 8 9 10
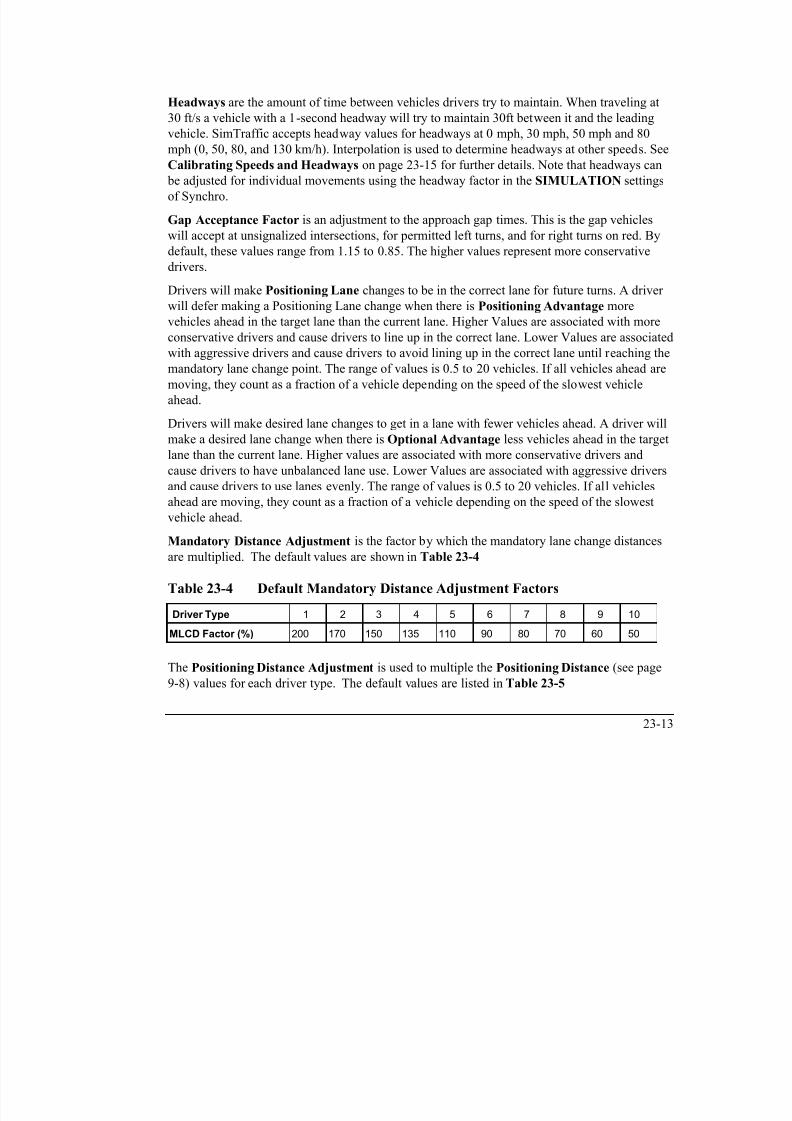
7/21/2019 Synchro Studio 8 User Guide
http://slidepdf.com/reader/full/synchro-studio-8-user-guide 467/559
23-14
PDA Factor (%) 150 140 130 120 110 95 90 80 70 60
For additional details, see the discussion in the topic Lane Choice and Lane Changes (page 25-
8).
The Default button will reload the default parameters for all the drivers. Defaults are loaded
from the file defaults.sim. If you want to setup standard parameters for your agency, save thefile with your default settings to DEFAULTS.SIM. Save this in the same directory as
SIMTRAFFIC.EXE.
Vehicles Entering Intersection at the Beginning of the Red Interval
Some vehicles will enter the intersection into the yellow interval and even the red interval.
When the signal turns yellow, each vehicle decides to stop based on their yellow reaction time
and the deceleration required to make a stop. In some cases, a vehicle may enter the intersection
up to 7 seconds after the beginning of yellow depending on their speed and position.
If you observe a vehicle running a red light, click on the vehicle and note its driver type. Red
light running by driver types 8, 9, and 10 is sometimes normal behavior.
If this is an issue, you may want to consider using longer yellow times, especially on links with
speeds above 35 mph. Also, consider increasing the Yellow Decel rate in the driver parameters.
Some red light running may be considered normal. In actual practice, a minority of drivers will
not stop, when encountering a yellow light in the dilemma zone.
Consider increasing the turning speed for left and right turns. If a vehicle is slowing for a turn,
this can increase the time to enter the intersection and the time to clear the intersection. Use
Synchro's SIMULATION settings to adjust the turning speeds (see page 9-8). The default
turning speeds may be too low for many large intersections.
Calibrating Speeds and Headways
In order to realistically model traffic it is important to have realistic Saturated Flow Rates,
headways and speeds In some cases it may be necessary to change the default parameters to

7/21/2019 Synchro Studio 8 User Guide
http://slidepdf.com/reader/full/synchro-studio-8-user-guide 468/559
23-15
headways, and speeds. In some cases it may be necessary to change the default parameters to
match local driver parameters. This section gives some guidance on how these parameters
interact and suggestions for calibration and field studies.
Consider the following relationship:
s = 3600 / TV
s = Saturated Flow Rate (vph)TV = HW + L/spd = Time per vehicle
HW = headway between vehicles
L = Length of vehicles including stopped distance between
spd = vehicle speed (ft/s)
L = 19.45ft using default vehicle parameters
By default the average headway for all driver types are as follows:
HW0 = 0.5 s = Headway at 0 mph
HW20 = 1.3 s = Headway at 20 mph
HW50 = 1.6 s = Headway at 50 mph
HW80 = 1.6 s = Headway at 80 mph
Using the above values, the headways can be calculated with interpolation. These values are
shown in Table 23-6
Table 23-6 Saturation Flow and Headways for Given Speeds
Speed (mph) Headway (s) Saturated Flow Rate (vph)

7/21/2019 Synchro Studio 8 User Guide
http://slidepdf.com/reader/full/synchro-studio-8-user-guide 469/559
23-16
0 0.50 NA
9 0.86 1545
10 0.90 1619
15 1.03 1883
25 1.35 1916
30 1.40 195540 1.50 1966
50 1.60 1931
60 1.60 1977
80 1.6 2039
From the above table several features are of interest.The ideal Saturated Flow Rate of the HCM (Highway Capacity Manual) is 1900vph. The default
headways are chosen to give a Saturated Flow Rate similar to the HCM for cruising speeds from
25 mph to 50 mph.
The HCM Saturated Flow Rate for protected right turns is 1900 * 0.85 or 1615vph. The default
right turn speed in SimTraffic is 9 mph and the Saturated Flow Rate for 9mph is 1545 vph.
The HCM Saturated Flow Rate for protected left turns is 1900 * 0.95 or 1805vph. The defaultleft turn speed in SimTraffic is 15 mph and the Saturated Flow Rate for 15 mph is 1883 vph.
At low speeds, the Saturated Flow Rate is highly sensitive to small changes in speed. When the
speed increases between 9 mph and 10 mph (11% increase) the Saturated Flow Rate increases
from 1545 to 1619 vph (5% increase). It is therefore critical that the turning speeds in
SimTraffic be entered as realistically as possible. The default speeds of 9 mph and 15 mph for
right and left turns are based on small radius urban intersections. With larger sized suburban
intersections, the speeds may be significantly higher.
Be sure to set the link turning speeds as accurately as possible.
Field Studies
To calibrate the model for local conditions, the following data can be collected.
Speeds within intersections

7/21/2019 Synchro Studio 8 User Guide
http://slidepdf.com/reader/full/synchro-studio-8-user-guide 470/559
23-17
Speeds within intersections
Headways between intersections
Reaction time to green light
The speed data should be collected as the tail of the vehicle crosses the stop bar. Do not count
the first few vehicles in queue because they will still be accelerating. The average speed can be
used to set the link speed and turning speeds. The range of speeds can be used to set the speedfactors in the Driver Parameters page. Note that vehicles following closely may be traveling at
less than their desired speed because they may be following a slower vehicle. If there are many
closely spaced vehicles, the speeds and the speed factors may need to be skewed upwards to
account for the dominance of "slow leaders".
Headway data can be collected with a stopwatch. The headway is the time starting when the tail
of the lead vehicle crosses the stop bar until the front of the following car crosses the stop bar.
Headways should be grouped by speed if possible since headways are dependent on speed. Any
headway over 2 seconds should be discarded since the following vehicle is not in following
mode. The headways can be graphed against speed to determine the range of headways for the
input speeds of 0, 20, 50, and 80 mph (if applicable).
Reaction time can be measured with a stopwatch. This is the time between when the signal turns
green and when the first vehicle starts to move. You may also be measuring the reaction time of
the observer, hopefully, the observer will have a similar reaction time to observing the greenlight and observing the vehicle and they will cancel out. If the vehicles are waiting for a
straggling cross vehicle or pedestrian, disregard this observation. The range of green reaction
times can be used to set the Green Reaction times.
Calibrating Yellow Deceleration Rates
Calibrating yellow deceleration rates is also important, especially for the most aggressive
drivers. Vehicles remaining in the intersection after the end of yellow increase the startup timefor other movements. In many cases, the yellow and all-red times are too short to clear vehicles
at the prevailing speeds.
Many communities have begun stepped up enforcement of red-light runners. It is unclear how
effective these programs are at increasing the acceptable yellow deceleration among the most
aggressive drivers.
Here is a simple formula for calculating the yellow deceleration rate for the most aggressive
drivers. In the field, you are only observing the most aggressive drivers who do not stop for
yellow lights. The data collected is their speed before yellow and the amount of time after thebeginning of yellow before they enter the intersection The times can be collected at the stop bar
7/21/2019 Synchro Studio 8 User Guide
http://slidepdf.com/reader/full/synchro-studio-8-user-guide 471/559
23-18
beginning of yellow before they enter the intersection. The times can be collected at the stop bar
by simply noting the times of the worst red light runners. Only count the worst offenders, the
others may have been beyond the dilemma zone or may be more conservative. Measure the
speeds of the fastest drivers, 200 to 400 ft upstream for speed data.
YD10 = spd90/(2 * (T - 0.5)) = deceleration rate drivers did not accept for yellow light.
spd90 = 90th percentile speed
T = time from beginning of yellow till vehicle enters intersection. The Subtracting of
0.5 seconds is for driver reaction time.
YD10 can be used for the deceleration rate for driver type 10. The other drivers will have higher
yellow deceleration rates.
Fuel and Emissions ParametersThe fuel and emission parameters control the rate at which vehicles consume fuel or emit
exhaust. Fuel and emission parameters are used for calculating the MOEs used in the reports
and in static graphics.
Fuel and Emission rates are calculated using tables with entries for a range of speed and
acceleration rates. These tables are in comma delimited format and stored in the same directory
as the SimTraffic program. The filenames are shown in Table 23-7.
Table 23-7 Fuel and Emissions Data Filenames
Filename Description
fuel_data.csv Fuel table for all vehicles
hc_data.csv HC Emission table for all vehicles
co_data.csv CO Emission table for all vehiclesnox_data.csv NOx Emission table for all vehicles
There are 7 vehicle types in the first column. There are 70 data rows for each vehicle type
representing speeds from 0 to 70 ft/s. There are 21 data columns representing acceleration rates
-10 to +10 ft/s2. The fuel data is in gallons per second times 10
5. The emissions data is in mg
per second. The data must be entered using imperial units, no metric option is available.
The fuel and emission data was taken from the CORSIM simulation software.
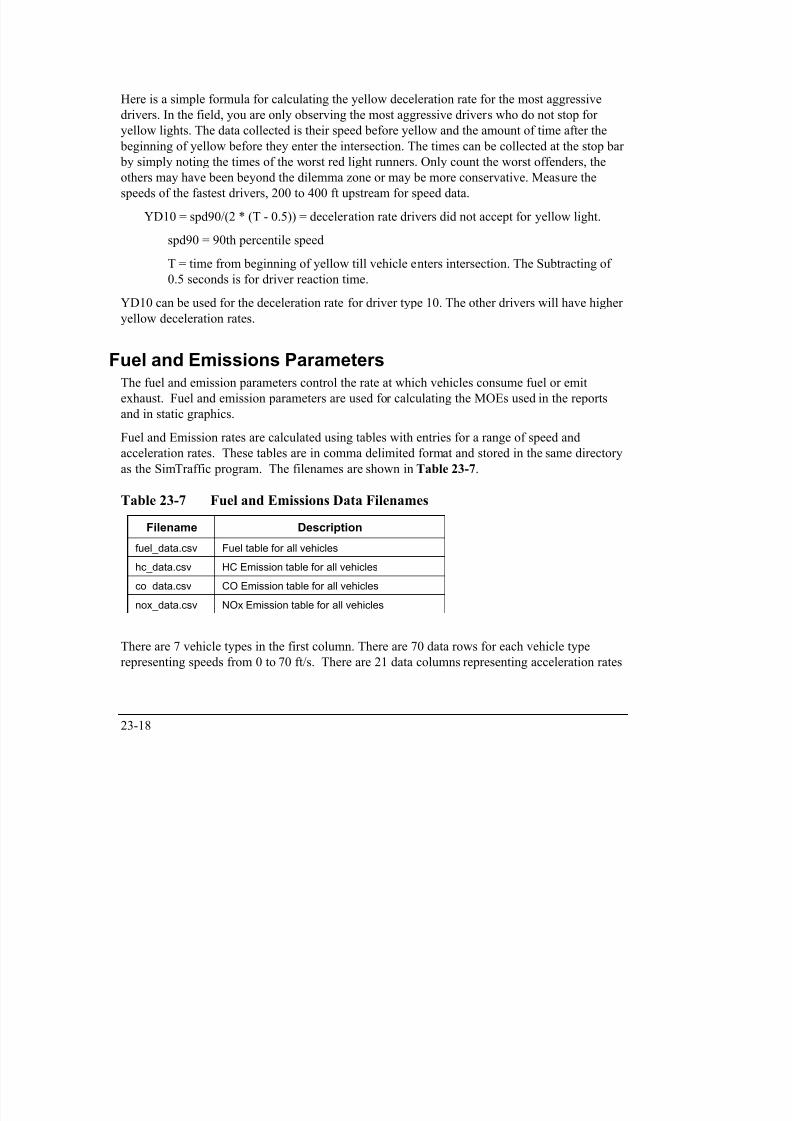
7/21/2019 Synchro Studio 8 User Guide
http://slidepdf.com/reader/full/synchro-studio-8-user-guide 472/559
23-19
The fuel and emissions data can be edited with a spreadsheet such as Microsoft Excel. The data
needs to be stored in CSV format and the row and column structure must be preserved.
Notes
Most of the fuel consumption and vehicle emissions associated with a stop occurs during vehicle
acceleration. A large part of the acceleration occurs after the front of the vehicle crosses the stop
bar and the vehicle becomes associated with the next link. Much of the fuel consumption and
emissions will be reported on exit links and intersections links downstream from where stopping
occurs.
In some cases network improvements will actually increase fuel consumption and air emissions
because vehicles consume more fuel when they are moving than when they are stopped.
Increasing the throughput of a network will increase fuel consumption because more vehiclesare moving. A signal may increase consumption over a two way stop because some main street
vehicles will have to stop at a signal while at a two-way stop no main street vehicles stop or
slow.
Controller Interface (CI) OptionsThe command Options CI-Options will open the Controller Interface options. SimTraffic CI
and these options are fully documented in Chapter 27.

7/21/2019 Synchro Studio 8 User Guide
http://slidepdf.com/reader/full/synchro-studio-8-user-guide 473/559
Chapter 24 – SimTraffic Reports, Graphics
and MOEs

7/21/2019 Synchro Studio 8 User Guide
http://slidepdf.com/reader/full/synchro-studio-8-user-guide 474/559
24-1
Reports, Graphics, and MOEs
To create a report in SimTraffic, select the File Create Report command and the SELECT
REPORTS dialog will appear. Select the reports desired. The following sections describe the
reports available.
Figure 24-1 SimTraffic SELECT REPORTS dialog
There are four reports available in SimTraffic: Simulation Summary Report, Queuing
Information, Actuated Timings, and Performance Report Measures of Effectiveness. All
intervals must be recorded to create reports. SimPlay recordings will not work because thestatistics are not recorded (see page 21-1). It is not possible to record statistics with SimPlay

7/21/2019 Synchro Studio 8 User Guide
http://slidepdf.com/reader/full/synchro-studio-8-user-guide 475/559
24-2
( p g ) p y
because it is possible to go back in time and re-record sections.
If any parameters were changed, the network must be re-seeded. All intervals including seed
intervals must be recorded with the current parameters.
The data can be summarized with the groupings listed in the Section, Columns option settings in
the Select Report Window.
Header and Footer Options
The Header tab controls the report header and footer. Each can have two lines with information
on the right and left sides. The eight input boxes control which information appears in each line
and each side. The header and footer include macros to display dynamic information. These
macros are shown in Table 24-1.
Table 24-1 Header and Footer Options
Macro Description Notes
%report_title% Title of Report Name of the report type being printed
%filename% Filename Filename and path of file analyzed or "Multiple"
%page% Page Number Starting page number can be changed
%date% Current Date Date report was created, not analysis date
%description% Description Set in Options Scenario Manager , location of analysis
%alternative% Alternative Set in Options Scenario Manager , alternative being
analyzed
%analyst% Name of Analyst Set in Options Scenario Manager , person or firm
performing study
%data_date% Date of Data Set in Options Scenario Manager , date of volume countsor projection
%data_time% Time of Data Set in Options Scenario Manager , time of volume counts
or projection
%planid% Timing Plan ID Set in Options Scenario Manager , name of timing plan
The report footer may contain part of the registration key code. This is normal behavior to help
Trafficware track the use of product key codes.
Graphics Option
7/21/2019 Synchro Studio 8 User Guide
http://slidepdf.com/reader/full/synchro-studio-8-user-guide 476/559
24-3
Graphics Option
Use the Graphics tab to set the line colors, fonts and picture options.
Shade Rows, Horizontal Lines, Section Color, and Back Color control the look of the printed
report.
The Font buttons allow for editing of the fonts used in the reports. The default font is Arial
Narrow 10 for data and Arial 12 for titles. The narrow font of the data is better for separation of
the data columns.
Defaults
Press the [Defaults] to change the settings back to the user defaults. Refer to page 2-33 for
additional details.
Scope
The Scope determines which intersections are included in the report.
Choose Single Intersection and select an intersection to create reports for a single intersection.
Choose Zone and enter a zone to create reports for a group of intersections. To select multiple
zones, separate the zones with a comma (i.e., “A, B, C” to print reports for zone A, B and C).
Choose Entire Network to report the entire network.
Multiple Runs
Multiple runs can be performed from the SELECT REPORTS settings by checking the
'Multiple Runs' box and selecting the [Record Now] button. A dialog box will appear prompting
for the number of runs and starting seed number. More details on recording can be found in thetopic, SimTraffic Operation (page 21-1).
SimTraffic will generate a report that averages the results of multiple runs. Check the 'Multiple
Runs' box prior to selecting the [Print], [Preview], or [Save-Text] buttons. A dialog box will
appear showing the History (HST) files for each simulation run recorded. The format of the
history file will be 'filename-#.hst' where # indicates the random seed number. Select the runs
you want to average by holding the [Ctrl] key and clicking on the desired filenames. The
resulting report will be the average of the files you have selected. To see the results for the
individual history files, create a report that selects only the desired history file.

7/21/2019 Synchro Studio 8 User Guide
http://slidepdf.com/reader/full/synchro-studio-8-user-guide 477/559
24-4
If your computer is configured to open files on a single click, hold the [Ctrl] key down
when selecting the first file. Then hold the [Shift] key to select the last file. Clicking a
file with the [Ctrl] key down can select or deselect a file. Multiple files can also be
selected by dragging a rectangle around their names. Start the rectangle to the right
of any filenames.
Print Settings
Select the File Print-Window command to print the current settings. Printing the Map has an
options settings. The user can setup header and footers and select the font. The scale is also
adjustable and there are a number of options including fixed scale or print to fit.
When printing the MAP view, this will print to the scale specified by Zoom-Scale. The printout
will be centered on the center point of the current screen view.If static graphics are shown, the static graphics will be printed.
When choosing colors in the MAP view settings, there are two sets of colors for each object
type. The Printer colors are used in conjunction with printing. Normally a white background is
used with printing. A black roadway is used with screen drawing to match real-world colors.
Viewing and Printing Reports After selecting the desired report options, select [Preview] to view the report, or [Print] to print
the report.
Viewing Reports
Select [Preview] from the Report Options settings to view reports. To change pages use the
buttons [|<], [<<], [>>], and [>|]. You can also change pages using the [Page Up], [Page Down],[Home], and [End] keys. To move around the current page, click on it and drag with the mouse.
You can also move the page with the arrow keys. To return to the SELECT REPORTS dialog,
use the [Back] button.
Printing Reports
To print the report, select the [Print] button from the Report Options or REPORT PREVIEW
settings. To change the printer, select FilePrint-Setup command.
7/21/2019 Synchro Studio 8 User Guide
http://slidepdf.com/reader/full/synchro-studio-8-user-guide 478/559
24-5
Simulation Summary Report The Simulation Summary report (Figure 24-2) lists the intervals and their properties, and some
overall statistics about the number of vehicles serviced.
The summary report can be used to keep track of the intervals simulated, the volume
adjustments made, and the timing plan(s) used.
Figure 24-2 Simulation Summary Report
Entire Run Statistics
The first section of the report covers the entire run including all intervals.
The start time, end time, total time, and total time recorded are listed. Total time includes seed
intervals; total time recorded includes the recorded intervals only.

7/21/2019 Synchro Studio 8 User Guide
http://slidepdf.com/reader/full/synchro-studio-8-user-guide 479/559
24-6
intervals; total time recorded includes the recorded intervals only.
Data includes the vehicles entered and exited, total distance, total time, total delay, total stops,
and total fuel, track statistics for the recorded intervals of the simulation. Details of the
calculations are available under the SimTraffic Performance Report.
Denied Entry vehicles are vehicles that are unable to enter a link due to congestion. These
vehicles are waiting to enter the link. These vehicles can either be from an external link or froma mid-block source.
Seeding Intervals
Limited information is available for seeding intervals because statistics are not recorded. The
primary purpose of seed intervals is to fill the network with traffic.
The start time, end time, and interval duration are listed.
Any volume adjustments will be listed. If volumes or timings are read from an external file, this
information will be listed as well.
Recorded Intervals
The start time, end time, and interval duration are listed.
Any volume adjustments will be listed. If volumes or timings are read from an external file, this
information will be listed as well.
The vehicles entered and exited, distance, time, delays, stops, and fuel, track statistics for this
interval of the simulation will be listed. Details of the calculations are available under MOEs.
Measures of Effectiveness
The Performance report (Figure 24-3) details the measures listed in the MOEs to Include box.

7/21/2019 Synchro Studio 8 User Guide
http://slidepdf.com/reader/full/synchro-studio-8-user-guide 480/559
24-7
Figure 24-3 Performance Report
Total Delay is equal to the total travel time minus the travel time for the vehicle with no other
vehicles or traffic control devices. For each time slice of animation, the incremental delay is
determined with the following formula.
TD = dT * (spdmax - spd) / spdmax = Total Delay for time slice
dT = time slice = 0.1s
spdmax = maximum speed of vehicle
spd = actual speed
The maximum speed may be less than the link speed if a vehicle is within a turn, approaching a
turn, or accelerating out of a turn. Total delay also includes all time spent by denied entry
vehicles while they are waiting to enter the network.
Delay per Vehicle is calculated by dividing the total delay by the Number of Vehicles.
The Number of Vehicles is not a fixed number because some vehicles in the area are analyzed
before the interval begins and some after the interval ends. Part of these vehicles delay is
counted in prior and subsequent intervals and thus it is not fair to count these vehicles in thevehicle count for this interval. The Number of Vehicles is thus equal to:
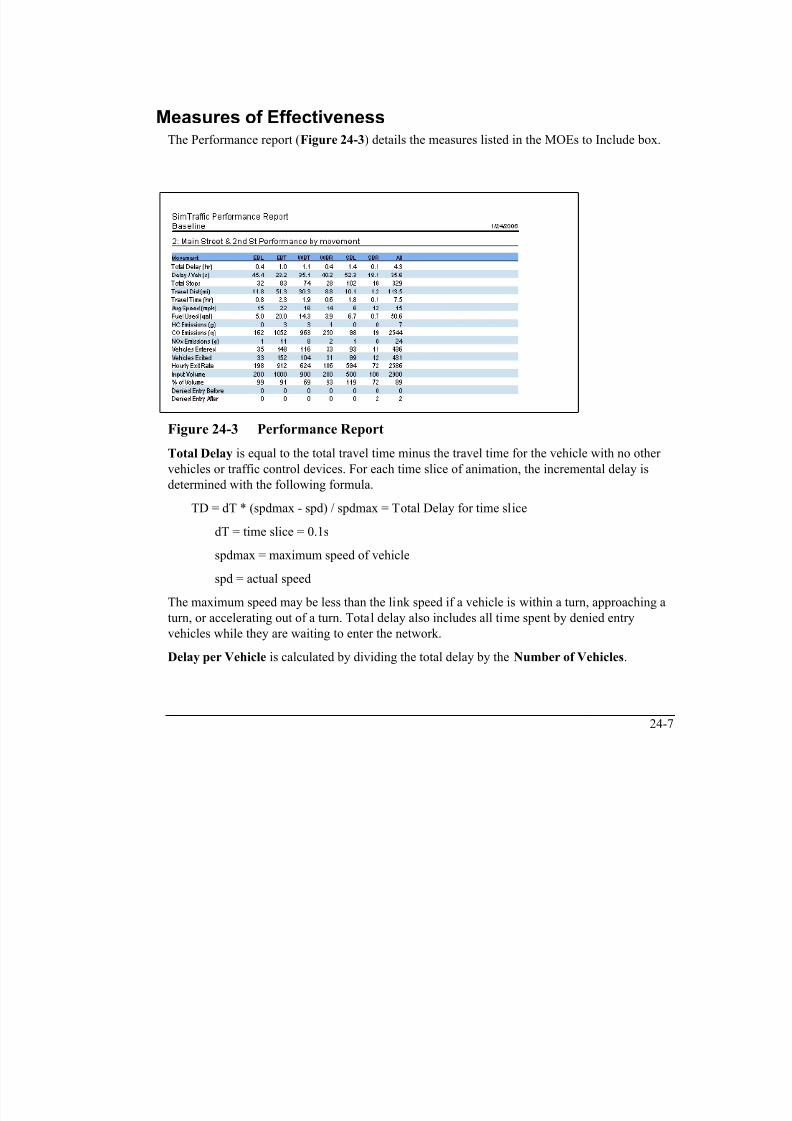
7/21/2019 Synchro Studio 8 User Guide
http://slidepdf.com/reader/full/synchro-studio-8-user-guide 481/559
24-8
nVeh = nX - 0.5* nS + 0.5 * nE = Number of Vehicles
nX = Vehicles Exited this interval
nS = Vehicles in area at start of interval
nE = Vehicles in area at end of interval
Per vehicle values for a network or arterial will be higher than their intersection components. If
all vehicles are delayed at 3 intersections for 5 seconds each, the network delay per vehicle will
be 15s.
Per vehicle statistics are not shown in by-lane columns. Because a single vehicle may spend
part time in multiple lanes.
The Stopped Delay is the sum of all time slices where the vehicles are stopped or traveling atless than 10 ft/s (3 m/s). Normally the Stopped Delay will be less than the total delay. Stopped
delay also includes all time spent by denied entry vehicles while they are waiting to enter the
network.
Stop Delay/Vehicle is calculated by dividing Stop Delay by the Number of Vehicles.
The Total Stops is a count of vehicle stops. Whenever a vehicle's speed drops below 10 ft/s (3
m/s) a stop is added. A vehicle is considered going again when its speed reaches 15 ft/s (4.5
m/s).
Stops /Vehicle is calculated by dividing the number of Stops by the Number of Vehicles.
The Travel Distance is simply a summation of the vehicle distance traveled. This distance
includes the curve distance within intersections.
The Travel Time is a total of the time each vehicle was present in this area. The travel time
includes time spent by vehicles Denied Entry.The Average Speed is calculated by dividing Total Distance by Total Time. Average Speed is
weighted by volume, and includes stopped time and denied entry time. The time use in
calculation for Average Speed does not include time spent by denied entry vehicles while they
are waiting to enter the network. Average speed may thus be higher than Total Time divided by
Total Distance.
Fuel Used is calculated with the fuel consumption parameters. These parameters are located in a
text file that is in the Trafficware directory. The fuel used in each time slice is determined by the
vehicle's fleet (car, truck, or bus), speed, and acceleration.The Fuel Efficiency is calculated by dividing the Total Distance by the Fuel Used.

7/21/2019 Synchro Studio 8 User Guide
http://slidepdf.com/reader/full/synchro-studio-8-user-guide 482/559
24-9
Emissions data are calculated with the vehicle emission parameters. The vehicle's speed and
acceleration determine the emissions created in each time slice. There are no emission tables
available for trucks and busses. SimTraffic assumes trucks and busses emit exhaust at three
times the rate of cars.
Vehicles Entered and Vehicles Exited is a count of how many vehicles enter and exit the linkor area during the interval(s). If this is a network or arterial summary, the Vehicles Entered and
Vehicles Exited do not count a vehicle moving from one intersection to the next within the
arterial or network. The Entered and Exited counts for a network or arterial will thus be less than
the sum of the counts from each intersection.
The Hourly Exit Rate is the Vehicles exited at an hourly rate. If the intersection is above
capacity and the input volume is not constrained upstream, this value might be used as the
capacity for this movement
Denied Entry is a count of vehicles that are unable to enter a link due to congestion. Denied
Entry includes external links and mid-block vehicle sources. The report lists the number of
vehicles denied entry at the start and end of the period. This is useful to see if congestion is
getting worse or better. Denied Entry can also be used to determine the Network Throughput. In
a congested network lower values of Denied Entry indicate increased throughput.
Density is the average distance per vehicle over the simulation period. It is only available by-lane, and by-approach but not by-movement; multiple movements can share a lane.
Ocupancy is the average number of vehicles in a lane or approach over the simulation period.
SimTraffic Arterial Reports
The Arterial Report uses origin destination data to only count vehicles that came from the
arterial on the next upstream link. This is almost, but not exactly the same as taking the traveltime of only those vehicles that travel the entire corridor. This allows the arterial report to be
compared with car travel time studies.
Refer to Figure 24-4. For a travel time study, the travel time on link 1T is wanted only for those
vehicles that started on link 4T. The combined delay for approach (1T) includes vehicles from
2T, 2R, and 2L. The arterial delay only considers the delay and travel time of vehicles from 2T.
The signal at node 2 acts as a bit of a mixing and filtering mechanism. The departure profile of
vehicle from 2T is nearly the same whether these vehicles came from 4T, 4R, 4L, 3R, or 3L.
Note that the arterial delay at 2T will only consider arrivals from 3T.

7/21/2019 Synchro Studio 8 User Guide
http://slidepdf.com/reader/full/synchro-studio-8-user-guide 483/559
24-10
3 2 1
3L
3T
3R
2L
2T
2R
1T
4
4L
4T
4R
Figure 24-4 Arterial Travel Report Movements
This discussion begs the question: „why not track only those vehicles that travel the entire
corridor ?‟ The data collection for such a process would be difficult. For many corridors,
especially with 5 or more intersections, less than 5% of all vehicles drive through the entirecorridor. Many valid data points would be thrown away from vehicles that traverse part of the
corridor. The SimTraffic vehicles only know 5 turns ahead where they will be going; they do not
know in advance whether they will be traversing the entire arterial or not.
Network Totals
The totals section includes MOEs for all vehicles in the network including exit links and bendlinks. This causes the network totals to be higher than the sum of the intersection links.
To see the average result of multiple runs, see the topic on Multiple Runs (page 24-
3).
Queuing and Blocking Report
The Queuing and Blocking report (Figure 24-5) gives information about the maximum queuelength for each lane and the percentage of time critical points are blocked.

7/21/2019 Synchro Studio 8 User Guide
http://slidepdf.com/reader/full/synchro-studio-8-user-guide 484/559
24-11
Figure 24-5 Queue Report
Each column represents one lane from left to right.
Queues are reported individually for each lane, no summing or averaging is performed between
lanes. A vehicle is considered queued whenever it is traveling at less than 10 ft/s (3 m/s). A
vehicle will only become "queued" when it is either at the stop bar or behind another queued
vehicle.
The Maximum Queue is the maximum back of queue observed for the entire analysis interval.
This is a simple maximum, no averaging is performed. The maximum queue is calculatedindependently for each lane. The queue reported is the maximum queue for each individual lane,
NOT the sum of all lane queues.
SimTraffic records the maximum back of queue observed for every two minute period. The
Average Queue is average of all the 2 minute maximum queues.
A standard deviation is also calculated using the sum of squares for each 2 minute interval. The
95th Queue is equal to the Average Queue plus 1.65 standard deviations. The 95th Queue is not
necessarily ever observed, it is simply based on statistical calculations.Vehicles can stop when queued and when waiting for a mandatory lane change. SimTraffic tries
to determine whether the stopping is due to queuing or lane changes In some cases stopping for

7/21/2019 Synchro Studio 8 User Guide
http://slidepdf.com/reader/full/synchro-studio-8-user-guide 485/559
24-12
to determine whether the stopping is due to queuing or lane changes. In some cases stopping for
lane changes will be counted as queuing. Sometimes in SimTraffic and real life, the lane
changes and queuing behavior are closely interconnected.
The Link Distance is the internal distance of the link from Stop-bar to stop-bar. This value will
be less than the link distance defined in Synchro because it is the internal distance after
subtracting the widths of the intersections.
Upstream Block Time is the proportion of time that the upstream end of the lane is blocked.
There is a hot spot 20ft (6 m) long placed at the top of the lane. Every time slice that this hot-
spot is occupied by a queued vehicle counts towards the block time.
The Queuing Penalty is a rough measure of how many vehicles are affected by the blocking.
The Queuing Penalty is equal to the estimated volume of the lane times the percent of time the
lane is blocked. The Queuing Penalty for a storage bay blockage is based on the volume of theadjacent lane. If a through lane is blocking a storage bay, the penalty is based on the volume of
turning traffic. The Queuing Penalty is a quick way to quantify the affects of queuing. It can be
used to show that Timing Plan A has less blocking problems than Timing Plan B. Queuing
Penalty is not calculated for external links.
To see the hot-spots graphically, display Static Graphics with the % of Time Blocked option.
Storage Bay Distance is the length of a turning bay.
Storage Block Time is the proportion of time that a lane is queued at the top of the storage.
There is a hot spot 20ft (6 m) long placed at the top of the storage bay. Through lanes adjacent to
storage bays are also tracked. Queuing in the through lane can block access to the storage bay.
Every time slice that this hot-spot is occupied by a queued vehicle counts towards the block
time.
B## is a column that is not always present and is used for reports on the queue for a bend link.If an approach link has a bend upstream, the queue for the bend link is recorded separately. The
queue is reported with the downstream intersection because the queue is caused by that
intersection. The queue for bend links is recorded separately because the number of lanes can
change at the bend.
The Bend queues are normal behavior, although they can be confusing to interpret. To eliminate
the reporting of bend queues, remove bends from your networks or move them further upstream.
Many bends are unnecessary (see the topic on Bends, page 2-3). If the roadway bends slightly, itmay be easier to adjust for the bend by overriding the link distance.

7/21/2019 Synchro Studio 8 User Guide
http://slidepdf.com/reader/full/synchro-studio-8-user-guide 486/559
24-13
Comparing Queues to Other Models
The maximum queues reported in SimTraffic may vary significantly from the queues reported in
Synchro and other models. Here are some reasons why the queues are different and how to get
comparable values.
The average vehicle length in SimTraffic (and CORSIM) including distance between is 19.5 ft
(6 m). Synchro and other macroscopic models typically use a vehicle length of 25ft (7.5m) in
conjunction with queues. When comparing queue lengths to those in other models such as
Synchro, keep in mind that these queues in SimTraffic will be 25% less with everything else
being equal.
The 50th percentile queues in Synchro are based on traffic adjusted for PHF, adjust SimTraffictraffic for PHF when comparing percentile delays.
The 95th percentile queues in Synchro are based on traffic adjusted for 95th percentile traffic but
not for PHF. To get SimTraffic queues comparable to Synchro, create a 3 minute interval with
95th percentile traffic adjustments and no PHF, this interval can be followed by an interval
without percentile adjustments. The queues for approaches in the middle of the network may not
experience 95th percentile traffic because the surge in traffic dissipates before reaching the
center of the network.
An alternate method of observing the 95th percentile queue in SimTraffic is to simulate traffic
for an entire hour without adjustments. SimTraffic's volumes will vary over the course of an
hour and at some point the traffic will most likely surge to the 95th percentile flow rate.
Queues in SimTraffic may also be higher than Synchro due to conditions that are not reflected in
a macroscopic model. Reasons include spillback between intersections, spillback beyond turning
bays, forced lane changes, unbalanced lane use for downstream turns, and other subtle trafficflow interactions.
Actuated Signals, Observed Splits Report
The actuated signal report (Figure 24-6) displays information about the actual times observed inactuated signals. This report can be used to show how an actuated signal will perform with
detailed modeling. This report can be helpful to compare the affects of adjusting gap settings,

7/21/2019 Synchro Studio 8 User Guide
http://slidepdf.com/reader/full/synchro-studio-8-user-guide 487/559
24-14
detector layouts, recalls and so on.
Figure 24-6 Actuated Signal Report
Each column represents one signal phase.
Movement(s) Served is the lane group(s) served by this phase.
Maximum Green is the maximum green time before this phase will max out. For a coordinated
signal this is the maximum time before the signal will yield or be forced off.
Minimum Green is the minimum green time. In Synchro this is called the minimum initial
time.
Recall is the recall for the phase. This will be Coord for coordinated, Max for Max recall, Pedfor Pedestrian recall, Min for minimum recall, or None for no recall.
Avg Green is the average of all green times Skipped phases do not count Green periods that
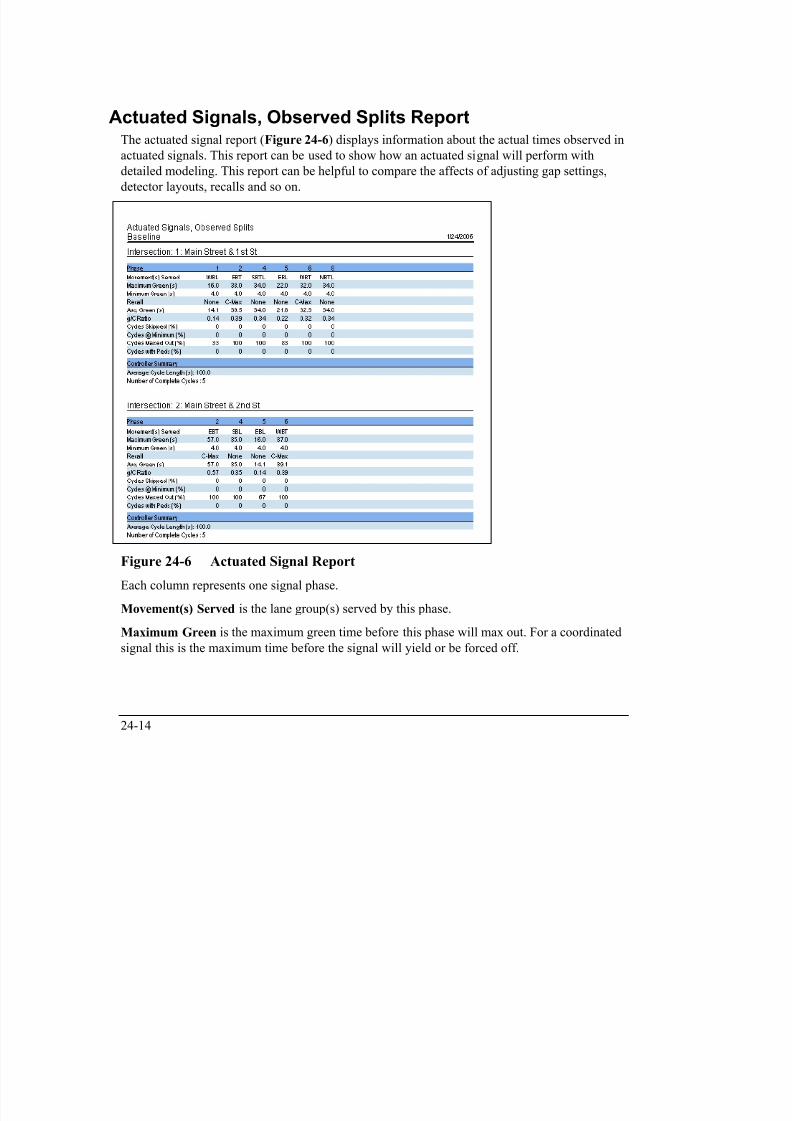
7/21/2019 Synchro Studio 8 User Guide
http://slidepdf.com/reader/full/synchro-studio-8-user-guide 488/559
24-15
Avg. Green is the average of all green times. Skipped phases do not count. Green periods that
begin or end in another interval do not count.
g/C Ratio is the observed green time to cycle length ratio. Since there may be green time
measured from cycles that fall partially outside this interval, an adjustment is used. The formula
for g/C is as follows:
g/C = TotalGreen / TotalCycles * NumCycles / (NumGreens+NumSkips)
Cycles Skipped (%) is the percentage of cycles skipped by this phase. Green periods or
permissive periods that begin or end in another interval do not count.
Cycles @ Minimum (%) is the percentage of cycles that show for their minimum time.
Normally these phases have gapped out. Green periods that begin or end in another interval do
not count.
Cycles Maxed Out (%) is the percentage of cycles that max out. This value also includes all
cycles for coordinated phases and phases with Max Recall. Green periods that begin or end in
another interval do not count.
Cycles with Peds (%) is the percentage of cycles with a pedestrian call. If this phase has
Pedestrian Recall all phases will have pedestrians. Green periods that begin or end in another
interval do not count.
Average Cycle Length(s) is an average of the cycle lengths modeled. For a coordinated signal,
this is the actual cycle length.
Number of Complete Cycles(s) is a count of the number of complete cycles modeled. Partial
cycles do not count, although phases from partial cycles may count for individual phase
statistics.
Static Graphics
To display static graphics, choose the Graphics Show Static Graphics command. Select thedisplay desired. The following sections describe the graphics displays available.
All intervals must be recorded to show static graphics. SimPlay recordings will not work

7/21/2019 Synchro Studio 8 User Guide
http://slidepdf.com/reader/full/synchro-studio-8-user-guide 489/559
24-16
g p y g
because the statistics are not recorded. It is not possible to record statistics with SimPlay because
it is possible to go back in time and rerecord sections.
If any parameters were changed, the network must be re-seeded as well. All intervals including
seed intervals must be recorded with the current parameters.
Color Legend
A legend appears in the lower right corner of the display showing the colors used. By default,
the brighter colors indicate higher congestion on the screen and darker colors indicate higher
congestion on the printouts.
The colors can be changed with the Options Map Settings command.
Intervals
If more than one interval is recorded, the static graphics can be created for one interval or the
entire simulation. Static graphics cannot be created for seed intervals.
Static DisplaysDelay per Vehicle shows the Total Delay per vehicle for each lane group. If a lane is shared
between movements, it will be split with a section for each turn. The Total Delay is measures the
amount vehicles are delayed by traffic control and other vehicles. See Measures of
Effectiveness (page 24-7) for the calculation formula. This delay includes time spent by denied
entry vehicles.
Stopped Delay per Vehicle shows the Stopped Delay per vehicle for each lane group. TheStopped Delay is the amount of time each vehicle's speed is less than 10 ft/s (3 m/s). This delay
includes time spent by denied entry vehicles.
Stops per Vehicle shows the number of stops per vehicle. A vehicle is considered stopped when
its speed is less than 10 ft/s (3 m/s). The vehicle is no longer stopped when its speed exceeds 15
ft/s (4.5 m/s).
Average Speed shows the average speed for each movement. The speed is calculated by
dividing the total travel time by the total travel distance for vehicles on this link. This speed does
not include time spend by denied entry vehicles.Fuel Efficiency shows the fuel efficiency for each movement. The fuel consumption calculation
is described in Measures of Effectiveness. The fuel efficiency is distance traveled divided by
f l d

7/21/2019 Synchro Studio 8 User Guide
http://slidepdf.com/reader/full/synchro-studio-8-user-guide 490/559
24-17
fuel consumed.
% of Time Blocked shows queuing and blocking at the "hot-spots". A hot-spot is located at the
top of every link and a hot-spot is located at the top of storage bays and in the lane adjacent to
storage bays at the top. The hot-spots are 20 ft (6 m) long. The blockage counts the number of
time steps with a vehicle traveling less than 10 ft/s (3 m/s) over the hot spots. It is also possible
that blockage is counted when a large vehicle is waiting on the other side of the upstream
intersection to prevent gridlock.
Vehicles Denied Entry shows the number of vehicles that are denied entry at the upstream end
of each entry link and mid-block for each source. The number shown is the number of vehicles
at the end of the interval or the entire simulation. Vehicles are denied entry when there is
insufficient capacity, when blocking prevents vehicles from entering the network, or when thereare no gaps for vehicles to enter mid-block.
Queues shows the Maximum, Average, and 95th Percentile Queue Lengths. Queues are reported
individually for each lane, no summing or averaging is performed between lanes. The queues
reported are the maximum back of queue during the analysis period. A vehicle is considered to
be "queued" when its speed is less than 10 ft/s (3 m/s). A vehicle will only become "queued"
when it is either at the stop bar or behind another queued vehicle. The Maximum Queue is the
maximum back of queue observed for the entire analysis interval. This is a simple maximum; noaveraging is performed. SimTraffic records the maximum back of queue observed for every two
minute period. The Average Queue is average of all the 2 minute maximum queues. A Standard
Deviation is also calculated using the sum of squares for each 2 minute interval. The 95th
Queue is equal to the Average Queue plus 1.65 standard deviations. The 95th Queue is not
necessarily ever observed, it is simply based on statistical calculations.
7/21/2019 Synchro Studio 8 User Guide
http://slidepdf.com/reader/full/synchro-studio-8-user-guide 491/559
Chapter 25 – The SimTraffic Model
The SimTraffic Model This chapter explains the assumptions and formulas used by SimTraffic. This information is not

7/21/2019 Synchro Studio 8 User Guide
http://slidepdf.com/reader/full/synchro-studio-8-user-guide 492/559
25-1
needed for coding files or using SimTraffic, but it is provided to explain SimTraffic's behavior.
Traffic Generation and Assignment Trip generation and route assignment are based on traffic volumes. These volumes may be
adjusted for growth factors, PHF, or percentile adjustments. The volumes may also change
between intervals. See Intervals and Volume Adjustments for more information. The adjusted
volume is shown on the Performance Report Input Volume.
Trip Generation
Trips are added to entry points based on the volume counts at the downstream intersection.
Trips are also added mid-block if mid-block traffic is specified or a volume source is needed to
balance traffic. If balancing and a mid-block source exist, the mid-block entry will be the
maximum of the two.
For each 0.1 s slice a vehicle is created when R36000 < vl
vl = hourly traffic volume of link or mid-block source.
R36000 = a random number between 0 and 35999
For example, a link's volume is 500. Over an hour there are 36000 chances to add vehicles (once
per tenth of a second). About 500 of the random numbers will be less than 500 and about 500
vehicles will be created. The actual volume generated is shown on the Performance Report
Hourly Exit Rate.
For any given time period more or less vehicles will appear. Looking at many time periods, the
vehicles will exhibit a Poisson arrival distribution.
Link Volumes are calculated independently for cars and for heavy vehicles. The heavy vehicle
volume is equal to the adjusted volume times the Heavy Vehicle percentage. The car volume is
equal to the remaining adjusted volume. Entering Heavy Vehicles are assigned to a Truck or Bus
vehicle type based on their percentage of the total Heavy Vehicle Fleet. Entering Cars are
assigned to a Car or Carpool vehicle type based on each type's percentage of the total Car Fleet.
Denied Entry
Once a vehicle is created it is placed in the network if it is OK To Enter. To test if a lane is
l T t D l ti i d t i d b t th t d hi l d hi l h d d

7/21/2019 Synchro Studio 8 User Guide
http://slidepdf.com/reader/full/synchro-studio-8-user-guide 493/559
25-2
clear, a Test Deceleration is determined between the created vehicle and vehicles ahead and
behind using car following formulas. The test decelerations must be less than the normal
deceleration (decelNormal).
The trip generator will attempt to place the vehicle in any allowed lane at either full speed, halfspeed, or stopped.
In some cases it will not be possible for the vehicle to enter due to vehicles on the link. These
existing vehicles may be stopped in a queue or simply moving too fast to let the new vehicle in.
If it is not possible to place the vehicle, the created vehicle will be placed in denied entry status.
Vehicles in denied entry status will be attempted to be placed in later time slices. On a congested
link, there may be a back log of denied entry vehicles. This usually indicates a capacity
problem or other operational problem.
Route Assignment
When a vehicle is created it is assigned a turn at the end of its link and the next eight links. The
turns are random based on the turning counts for each direction.
vT = sum of approach traffic
Rv = random number between 0 and vT -1
If Rv < vLeft then
Vehicle turns left
Else If Rv < (vLeft + vThru) then
Vehicle proceeds straight
else
Vehicle turns right
A vehicle may also be assigned to a mid-block sink using similar logic.
vSink = vUp - vT + vMidBlock = sink volume
vUp = volume from upstream intersection
vMidblock = volume entering mid-block, either specified or from balancing.
A vehicle always knows its next ten turns. Whenever a vehicle enters a new link, the tenth turn
is assigned.
If Link O-D Volumes are specified, the probability for each turn is determined by the upstream
7/21/2019 Synchro Studio 8 User Guide
http://slidepdf.com/reader/full/synchro-studio-8-user-guide 494/559
25-3
turn of the vehicle. Link O-D Volumes can be used to suppress certain movements such as
making two left turns in a row.
Turning Volumes are calculated independently for cars and for heavy vehicles in the same way
as link volumes. Cars are assigned turns based on car volumes. Trucks and Busses are assignedturns based on heavy vehicle volumes.
Pedestrian Generation
Pedestrians are generated using logic similar to vehicle generation.
The number of pedestrians is the maximum of either the Conflicting Pedestrians for right turns
on the link to the right or the Pedestrian Calls for the through phase on the link to the left (seeCoding Pedestrians).
For a „T‟ intersection, the number of pedestrians on the link to the left of the „T‟ is the maximum
of either the conflicting pedestrians with the left turn of the „T‟, or the pedestrian calls of the left
turn phase for the link itself.
When pedestrians are generated, they wait at either end of the crosswalk until it is safe to cross.
While crossing, pedestrians walk at the network walking speed (4ft/s or 1.2 m/s by default).Pedestrians begin crossing when there are no conflicting vehicles in the intersection and there is
a walk signal for signalized intersections.
For each link-end there can be up to two pedestrians walking in each direction and a third
pedestrian in each direction waiting to start. When the third pedestrian starts, he will replace the
second (middle) pedestrian. Because of this simplified model, SimTraffic always assumes there
could be additional pedestrians between the two shown pedestrians.
Car Following and Speed Selection
Cruise SpeedWithout any impediments, a vehicle will travel at its cruise speed. The cruise speed is equal to
the link's speed multiplied by the speed factor for the driver type. By default the speed factors
range from 0.85 to 1.15.

7/21/2019 Synchro Studio 8 User Guide
http://slidepdf.com/reader/full/synchro-studio-8-user-guide 495/559
25-4
Acceleration Rates
Each vehicle type has a maximum acceleration rate. The acceleration rates vary by speed. The
acceleration rates ar stored in the files accels.csv. These rates are taken from TSIS version 5 inft/s2.
Deceleration Rates
There are a number of deceleration rates used depending on the situation involved.
The maximum possible deceleration rate is 12 ft/s2 (3.6 m/s2). This is normally reserved for
crisis situations. This is decelMax.
When the signal turns yellow, drivers decide whether to stop based on a comfortable level of
deceleration for their driver type. The deceleration rates for a yellow light vary between 12 ft/s2
and 7 ft/s2 (3.6 m/s2 to 2.1 m/s2), and is editable in driver parameters.
To slow for an upcoming turn, vehicles will decelerate at 4 ft/s2 (1.2 m/s2). This is
decelNormal.
The values in the deceleration rate table will be discussed with car following and lane changes.
Table 25-1 Decel Rate Table
Name Amount Metric Amount
decelNormal 4 ft/s2 1.2 m/s
2
decelPlus 6 ft/s2 1.8 m/s
2
decelHard 8 ft/s2 2.4 m/s
2
decelMax 12 ft/s2 3.6 m/s
2
accelMin 2 ft/s2 0.6 m/s
2
Speed Model
Vehicles will slow or stop for one or more of the following events
Exceeding Speed Limit
Turn Ahead
Vehicle Ahead

7/21/2019 Synchro Studio 8 User Guide
http://slidepdf.com/reader/full/synchro-studio-8-user-guide 496/559
25-5
Vehicle Ahead
Slow to Start Mandatory Lane Change Start
Slow to Finish Mandatory Lane Change
Slow to enter turning pocket
Slow to allow merging vehicle into lane
Slow to merge with vehicles in destination lane
Red or Yellow Signal Ahead
Stop or Yield sign
Yield to pedestrians or traffic in intersection
No Space beyond Intersection
Any of the above on the next link
Vehicles within Roundabout
Lane changes, intersection right-of-ways, sign control and signal control will be discussed laterin this Chapter.
Car Following
Fast following is used when the leading vehicle is above 2 ft/s (0.6 m/s). Slow following is used
to track a slow or stopped vehicle or to stop at a fixed point such as the stop-bar or mandatory
lane change start point.
The distance between vehicles, or distance to the stopping point is as follows.
DBv = Xu - Lu - DB - Xv = distance between vehicles
Xu = position of lead vehicle (or stopping point)
Xv = position of subject vehicle
Lu = length of lead vehicle (0 for stopping point)
DB = Distance Between = 5 ft (1.5 m)
Stopped vehicles will not start until the leading vehicle has moved at least 5 ft (1.5m). This has
the effect of creating a startup reaction time of about 1 second per vehicle. The 10th vehicle in
line will not start to move until about 10 seconds after the first vehicle has moved.
7/21/2019 Synchro Studio 8 User Guide
http://slidepdf.com/reader/full/synchro-studio-8-user-guide 497/559
25-6
Fast Following
SimTraffic's car following model will attempt to have the trailing car following the leading car
with 1 second of headway between vehicles. Fast following is used when the leading vehicle istraveling faster than 2 ft/s (0.6 m/s). The following formulas are used for fast following:
DSafe = DBv + min(spdU2 - spdV2, 0) / 2*decelNormal - spdV*HW
spdU = speed of leading vehicle
spdV = speed of trailing vehicle
DBv = distance between vehiclesHW = desired headway = dependant on driver parameters and Link Headway Factor
DSafe is the distance between vehicles, adjusting for speed differential and reduced by the
trailing vehicle's desired headway (units are feet). Dsafe is distance above or below desired
distance
SF = safety factor = DSafe / (spdV * HW)
SF is unit less. SF has the following characteristics:
SF = 0 vehicle is at correct distance
SF = -1 vehicle is 1 headway too close, unsafe following and maximum deceleration
SF = 1 vehicle is 1 headway too far, accelerate
dV = recommended acceleration (deceleration)
When SF >= -0.3
dV = DecelHard * SF / 1.5
When -0.3 > SF >= -1.0
dV = decelHard * [-0.2 + (SF+0.3)*8/7]
-When 1.0 > SF
dV = -decelHard
The acceleration must be greater or equal to -decelMax and less than or equal to the vehicle'smaximum acceleration capabilities.
The fast car following model assumes 0.1 second time slices. At 0.5 or 1 second time slices the
vehicles are not able to react quickly enough
7/21/2019 Synchro Studio 8 User Guide
http://slidepdf.com/reader/full/synchro-studio-8-user-guide 498/559
25-7
vehicles are not able to react quickly enough.
Slow Following
For slow following, the following methods are used.
DB2 = DBv - 2 * spdU / 10 - 1; new distance after 0.1 second and fudge factor
dv2 = (spdV + 2 * accelMin / 10)2 / (2 * DB2) = deceleration required after accelerating at
2*accelMin
dv4 = (spdV + 4 * accelMin / 10)2 / (2 * DB2) = deceleration required after accelerating at
4*accelMindv6 = (spdV + 6 * accelMin / 10)2 / (2 * DB2) = deceleration required after accelerating at
6*accelMin
If dv2, dv4, or dv6 are greater than negative decelNormal then the vehicle will accelerate by
2*accelMin, 4*accelMin, or 6*accelMin respectively subject to the vehicle's maximum
acceleration capabilities.
If dv2 < -decelNormal then
dV = -spdV2/ (2*DB2)
If DB2 < 0 then
dV = -decelMax
The acceleration must be greater or equal to -decelMax and less than or equal to the vehicle's
maximum acceleration capabilities.
Lane Choice and Lane Changes
There are different types of lane changes in SimTraffic. The lane change values are set in the
Synchro SIMULATION Settings (see page 9-8). The sections that follow describe the settings.
Single Lane Changes
Refer to Figure 25-1

7/21/2019 Synchro Studio 8 User Guide
http://slidepdf.com/reader/full/synchro-studio-8-user-guide 499/559
25-8
Refer to Figure 25 1.
The Mandatory Distance is the distance back from the stop bar where a lane change must
commence. If a vehicle is not able to commence its lane change before this point, it will stop and
wait for an opening. Vehicles in the next lane will cooperate to allow this vehicle to merge in.
The Mandatory Distance is adjusted by the Mandatory Distance Adjustment for each driver
type. The actual mandatory distance could be 50% to 200% of the distance depending on driver
type.
The Positioning Distance is the distance back from the Mandatory point where a vehicle first
attempts to change lanes. The positioning distance is added to the Mandatory distance. Beyond
the positioning distance, vehicles are unaware about upcoming lane change requirements.The Positioning Distance is adjusted by the Positioning Distance Adjustment for each driver
type. The actual mandatory distance could be 50% to 200% of the distance depending on driver
type.
Positioning Distance
2/3 Positioning Distance1/3 Positioning
Distance
Mandatory
Distance

7/21/2019 Synchro Studio 8 User Guide
http://slidepdf.com/reader/full/synchro-studio-8-user-guide 500/559
25-9
Vehicle attempts
positioning lane change
Vehicle attempts
mandatory lane change
Vehicle waits here to start
lane change
Vehicle not allowed here
Figure 25-1 Vehicle Turning Right from Left Lane
For the first 2/3 of the distance between the positioning point and the mandatory point, vehicles
will attempt a positioning lane change. Aggressive drivers will ignore positioning lane changesand even move the other way to avoid a queue. Some driver types will not cooperate with
positioning lane changers.
After the 2/3 point, vehicles will attempt a mandatory lane change. All vehicles are forced to
cooperate with mandatory lane changers. In the mandatory zone, vehicles will match the speed
of the target lane and merge as soon as conditions are available.
These lane change distances carry through intersections upstream. A vehicle may need to startgetting in the appropriate lane several blocks ahead.
Lane change distances can even go around corners through intersections when there are multiple
turning lanes. If there are two left-turn lanes and then another turn shortly downstream, vehicles
may choose their left-turn lane based on the lane alignments through the intersections.
Two or More Lane Changes
Refer to Figure 25-2.
Positioning 2 Distance
2/3 (P2LD)
1/3 (P2LD)
M d t
Mandatory 2

7/21/2019 Synchro Studio 8 User Guide
http://slidepdf.com/reader/full/synchro-studio-8-user-guide 501/559
25-10
2/3 (P2LD) Mandatory
Distance
Vehicle attempts
positioning lane change
Vehicle attempts
mandatory lane change
Vehicle waits here to start
lane change
Vehicle not allowed here
Distance
Figure 25-2 Vehicle Turning Right Making Two Lane Changes
Mandatory 2 Lane Distance and Positioning 2 Lane Distance are used when a vehicle needs
to make 2 or more lane changes on a link with three lanes or more. Mandatory 2 Lane
Distance is added to Mandatory Distance to determine the Mandatory Point for commencing
the first of two lane changes. Positioning 2 Lane Distance is added to both Mandatory 2 Lane
Distance and Mandatory Distance to determine the beginning of the positioning zone for the
first of two lane changes.
The space between Positioning 2 Lane Distance and Mandatory 2 Lane Distance is divided into
zones, where the first 2/3 is the positioning zone, and the remaining 1/3 is the mandatory zone,
similar to the single lane change.
When a vehicle needs to make two lane changes, it is critical that the first lane change is
completed early. Especially on high speed facilities. If the vehicle changes late, it can block two
or even three lanes of the link. Figure 25-3 shows a vehicle exiting a 3 lane freeway and waiting
to make the first of two lane changes. This vehicle is blocking the left lane and will require a
cooperating vehicle to stop in the middle lane. Then this vehicle will require another cooperating
vehicle to stop in the right lane. By changing late, this vehicle has caused all three lanes to stop.
Two lane change distances should be significantly higher than single lane change distances.

7/21/2019 Synchro Studio 8 User Guide
http://slidepdf.com/reader/full/synchro-studio-8-user-guide 502/559
25-11
Vehicle needs to make 2lane changes and will
block all 3 lanes
Figure 25-3 Vehicle Making Two Lane Changes
If three or more lane changes are needed. The distances are determined by adding in additional
Mandatory 2 Lane Distances. Table 25-2 outlines the distances for one, two, three, or four
lane changes.
Table 25-2 Lane Change Distances
Number of Lane
Changes
Positioning Point, distance from
Stop Bar
Mandatory Point, distance
from Stop Bar1 PD + MD MD
2 P2D + M2d + MD M2D + MD
3 P2D + 2 * M2D + MD 2 * M2D + MD

7/21/2019 Synchro Studio 8 User Guide
http://slidepdf.com/reader/full/synchro-studio-8-user-guide 503/559
25-12
4 P2D + 3 * M2D + MD 3 * M2D + MD
Default Lane Change DistancesHere are the default lane change values used by Synchro. Note that these distances are based
on casual observations and there is no formal research backing up these parameters. These
values may need to be adjusted to meet local conditions.
Table 25-3 Default Lane Change Distances
Value Default Value, ft Default Value, m
Mandatory Distance, Intersections max (200 ft, C/6 * L) max (60 m, C/6 * L)
Mandatory Distance, Bends 100 ft 30 m
Positioning Distance max (300 ft, v * 30s) max (90 m, v * 30s)
Mandatory 2 Lane Distance max (200 ft, v * 20s) max (60 m, v * 20s)
Positioning 2 Lane Distance max (300 ft, v * 40s) max (90 m, v * 40s)
C = Cycle Length (s)
L = Vehicle Length (ft)
v = Link Speed (ft/s)
The Mandatory Distance for signals is based on Cycle Length so that vehicles will normally get
into the correct lane behind the back of queue.
The Mandatory Distance for bend nodes is shorter so that merging for lane drops will occur late.
The positioning and 2 lane distances are adjusted by speed so that lane changes can occur earlier
at full speed.
Optional Lane Changes
Optional Lane changes are made to choose a lane with less congestion. Optional lane changes
are not made when a mandatory lane change is needed. A lane change is attempted when anadjacent lane has less vehicles ahead and the adjacent lane also feeds the destination link(s) of
this vehicle. An optional lane selection is based on the number of vehicles ahead and the speed
of the vehicles ahead. Lanes with slow vehicles ahead are avoided. Aggressive driver types are
more likely to make optional lane changes. Vehicles will attempt an Optional Lane change if
h i d i hi dj l

7/21/2019 Synchro Studio 8 User Guide
http://slidepdf.com/reader/full/synchro-studio-8-user-guide 504/559
25-13
there is an advantage to switching to an adjacent lane.
The lane desirability is determined by Advantage, calculated as follows:
Advantage = nC * (1 – spdCmin/ spdLimit) – nT * (1 – spdTMin/spdLimit) = Desirability
of Lane Change
nC = number of vehicles ahead in current lane
nT = number of vehicles ahead in target lane
spdCMin = slowest vehicle ahead in current lane
spdTMin = slowest vehicle ahead in target lane
spdLimit = link speed limit
Vehicles are counted if they lie within 5 seconds at spdLimit. If one or more vehicles are
stopped, all vehicles ahead count as a full point. If the ahead vehicles are slowed but not stopped
they count for fractional points. Driver type 6 will make an optional lane change for a 1 stopped
vehicle advantage. Driver 6 will ignore a positioning lane change if there is a 2 stopped vehicle
advantage to staying in the current lane.
A lane change takes at least 1.5 seconds to complete. If a vehicle is traveling slower than the
Lane Change Speed, 6 ft/s (1.8 m/s), a vehicle will take longer to complete a lane change. This
prevents a vehicle from moving sideways with no forward speed and insures that a mandatory
lane change can be completed in the allotted space.
A vehicle can start and complete a lane change from a standing queue.
Ok to Enter
A vehicle will start a lane change if the adjacent lane is clear of traffic. To test if a lane is clear,
a Test Deceleration is determined between the changing vehicle and vehicles ahead and behind
using car following formulas. Depending on the type of lane change, the maximum test
deceleration must not exceed the following.
Table 25-4 Maximum Test Deceleration
Lane Change Type Maximum test deceleration
Mandatory Lane Changes decelHard (8ft/s2 or 2.4m/s2)
Anticipatory Lane Changes decelPlus (6ft/s2 or 1.8m/s
2)
Optional Lane Changes decelNormal (4ft/s2 or 1.2m/s
2)

7/21/2019 Synchro Studio 8 User Guide
http://slidepdf.com/reader/full/synchro-studio-8-user-guide 505/559
25-14
Yielding to Lane Changers
Vehicles making a lane change will find a “lead” vehicle based on relative speed and position.
The vehicle that would reach a matched speed-position first is considered a leader. The changing
vehicle will adjust its speed to tr ail the “lead” vehicle.
Vehicles in a lane also look for merging vehicles to “trail” based on relative speed and position.
If the vehicle is a “trail” vehicle, it will adjust its speed to follow the merging vehicle.
The lane change logic above is a change from version 1. This logic allows for high speed
merging and weaving in freeway operations. In general the above logic yields higher speeds and
flow rates and less disruptive lane changing.
Coding Tips
Mandatory lane changes are inefficient and can block two or more lanes for extended time
periods. Code storage bays to reduce lane changes.
Lane Change ApplicationsFor the majority of situations the default lane change distances should work fine. Here are some
special situations that may require adjusting the lane change distances.
Signal
Normally vehicles need to be in the correct lane for turning before the back of queue. Thedrivers won‟t necessarily know where the back of queue is for any given time, but regular
drivers will have a general knowledge of the maximum queue lengths and will be able to see the
queues in real time.
The default mandatory distance is set for one vehicle for every 6 seconds of cycle length. This
value will somewhat approximate the maximum queue for nearly saturated movements.
To allow vehicles to shift into the correct lane earlier, use a higher Mandatory Distance. To
allow vehicles to shift into their lane at the last possible moment, use a lower Mandatory
Distance. Generally, large cities tend to have more aggressive drivers who will wait to get in
the correct lane if there is a shorter line up, while smaller towns tend to have more courteousdrivers implying longer mandatory distances.
Use mandatory distances equal to the maximum back of queue to get most vehicles
into the correct lane before queue.

7/21/2019 Synchro Studio 8 User Guide
http://slidepdf.com/reader/full/synchro-studio-8-user-guide 506/559
25-15
Freeway Off-RampThe positioning and mandatory distances can be used to control the point when drivers first
become aware of the need to be in the correct lane and the point at which they must be in the
correct lane. Figure 25-4 shows how the mandatory and positioning distances might be related
to exit signing.
Use long mandatory and positioning distances at high speeds to get vehicles into the
correct lane early and avoid “last chance” stopping.
EXIT
1/2
MILE
EXIT
2600'
Positioning Distance
300'
Mandatory
Distance
Figure 25-4 Freeway Off-Ramp Lane Change Distances
Three Lane Freeway Off-Ramp
With a three lane freeway, it is critical to get exiting vehicles into the right lane early. Making
lane changes at the last moment can cause all three lanes to stop, see Figure 25-5.
Changing late causes all
three lanes to stop
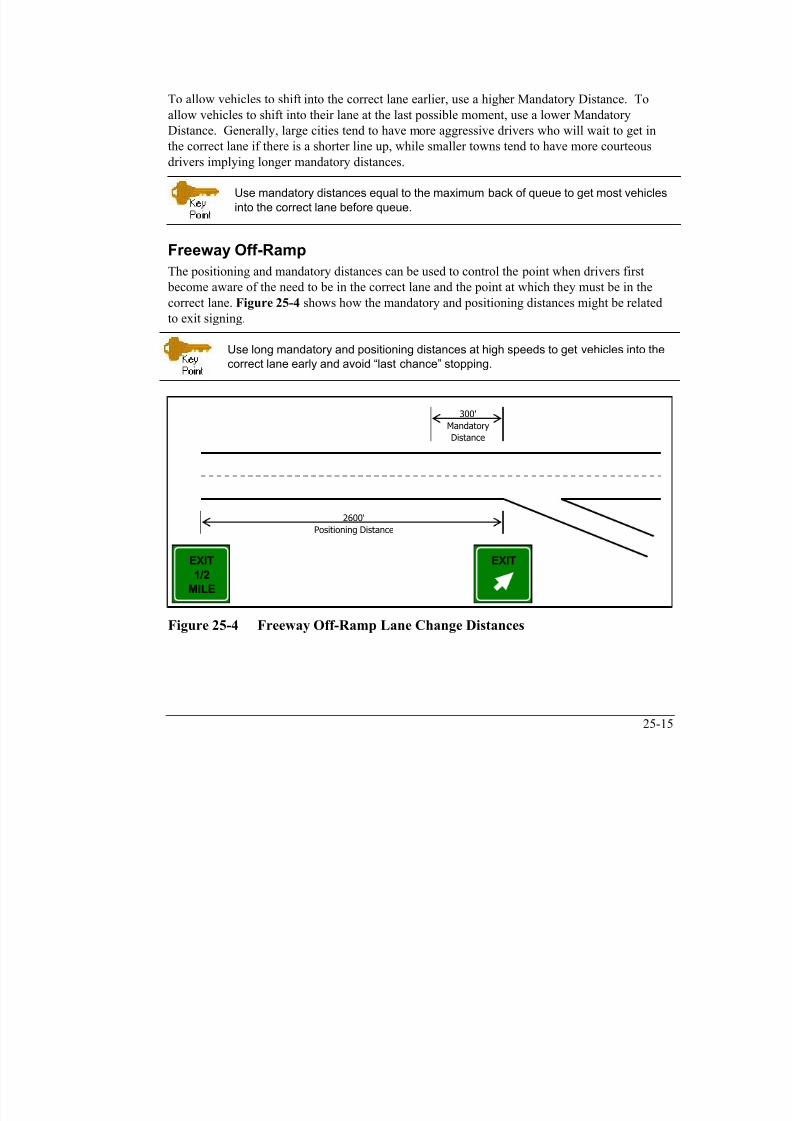
7/21/2019 Synchro Studio 8 User Guide
http://slidepdf.com/reader/full/synchro-studio-8-user-guide 507/559
25-16
Figure 25-5 Vehicle Making Late Lane Changes
Use long two lane mandatory and two lane positioning distances at high speeds to
get vehicles into the correct lane early and avoid “last chance” stopping and
blocking of multiple lanes.
Figure 25-6 shows how the mandatory 2 and positioning 2 distances are related to exit signing.
Higher values can be used if there is more advanced signing.
2600'
Positioning 2 Distance
300'
Mandatory
Di t
2300'
Mandatory 2 Distance
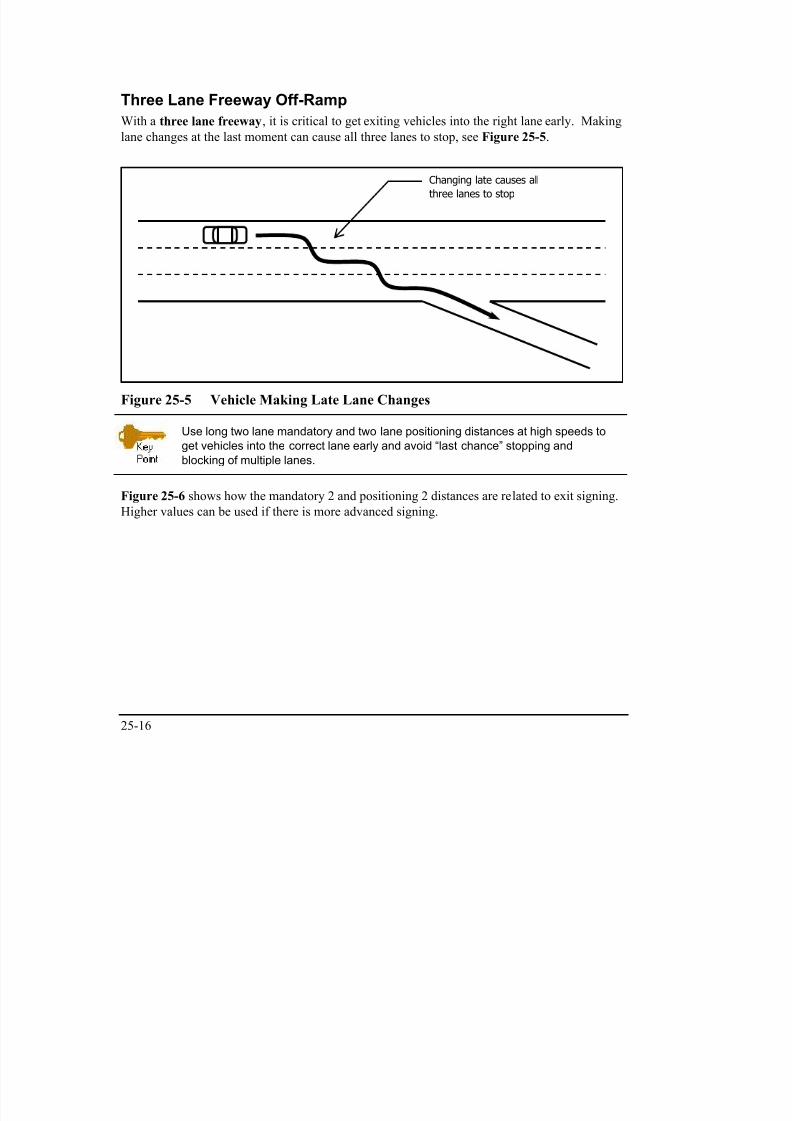
7/21/2019 Synchro Studio 8 User Guide
http://slidepdf.com/reader/full/synchro-studio-8-user-guide 508/559
25-17
EXIT
1
MILE
EXIT
Distance
EXIT
1/2
MILE
Figure 25-6 Freeway Off-Ramp Lane Change Distances (Three-Lane Freeway)
Lane Drop after Signal
If there is a lane drop after the signal it is sometimes desired to have vehicles use the dropping
lane though the signal. This may be encouraged with lane use signing. The default positioningdistance for 35 mph is 1540 ft. This distance will cause drivers to avoid the drop lane at the
signal when the acceleration lane is less than 1500 ft. Lowering the mandatory and positioning
distances can get drivers to use all lanes.
Refer to Figure 25-7. There is a 300 ft auxiliary lane after the signal. Using a mandatory
distance of 100ft and a positioning distance of 200 ft will cause 50% of the drivers (driver types
6 to 10) to ignore the lane drop until after the signal.
Adjust the mandatory and positioning distances to the length of an auxiliary lane to
get balanced lane use before an auxiliary lane drop.

7/21/2019 Synchro Studio 8 User Guide
http://slidepdf.com/reader/full/synchro-studio-8-user-guide 509/559
25-18
100'
Mandatory
Distance
200'
Positioning Distance
Lane Control
Sign
Figure 25-7 Lane Drop after Signal
Controlling Lane Utilization
The Lane Change distances can also be used to influence lane utilization. Figure 25-8 shows
an intersection with a lane drop 500 ft after the intersection.
Adjusted Mandatory Distance is the distance from the downstream stop bar where a vehicle
must start its lane change. The vehicle will stop and wait for an opening if the lane change has
not started. The mandatory distance is multiplied by the driver‟s Mandatory Distance Adjust.
The Start of Mandatory Zone is the distance from the downstream stop bar where a vehicle
begins attempting a mandatory lane change. The Start of Positioning Zone is the distance
from the downstream stop bar where a vehicle begins attempting a positioning lane change. The
calculations are in the following formulas.
AMD = MD * MDA = Adjusted Mandatory Distance
SMZ = MD * MDA + PD *PDA / 3 = Start of Mandatory Zone Distance
PZ = MD * MDA + PD *PDA = Start of Positioning Zone Distance
MD = Mandatory Distance
MDA = Mandatory Distance Adjustment for driver
PD = Positioning Distance
PDA = Positioning Distance Adjustment for driver

7/21/2019 Synchro Studio 8 User Guide
http://slidepdf.com/reader/full/synchro-studio-8-user-guide 510/559
25-19
500'
Bend
(a)Mand. Dist.
500'
Post. Dist.
700'
Mand. Dist.
200'
Post. Dist.
300'
Mand. Dist.
1000'
Post. Dist.
1000'
(b)
(c)
50% Lane
Utilization
Figure 25-8 Controlling Lane Utilization
In case (a) in the above figure, the mandatory distance is set to 500ft and the positioning
distance is set to 700‟. Table 25-5 illustrates how each driver type is affected by these
distances. These distances are all measured from the end of the lane drop.
Table 25-5 Case (a) Driver Type Distances
Driver
Type
Mand.
Adj.
Positioning
Adj.
Mand.
Dist.
Start of
Mand.
Positioning
Distance1 2 1.5 1000 1350 2050
2 1.7 1.4 850 1177 1830
3 1.5 1.3 750 1053 1660
4 1.35 1.2 675 955 1515
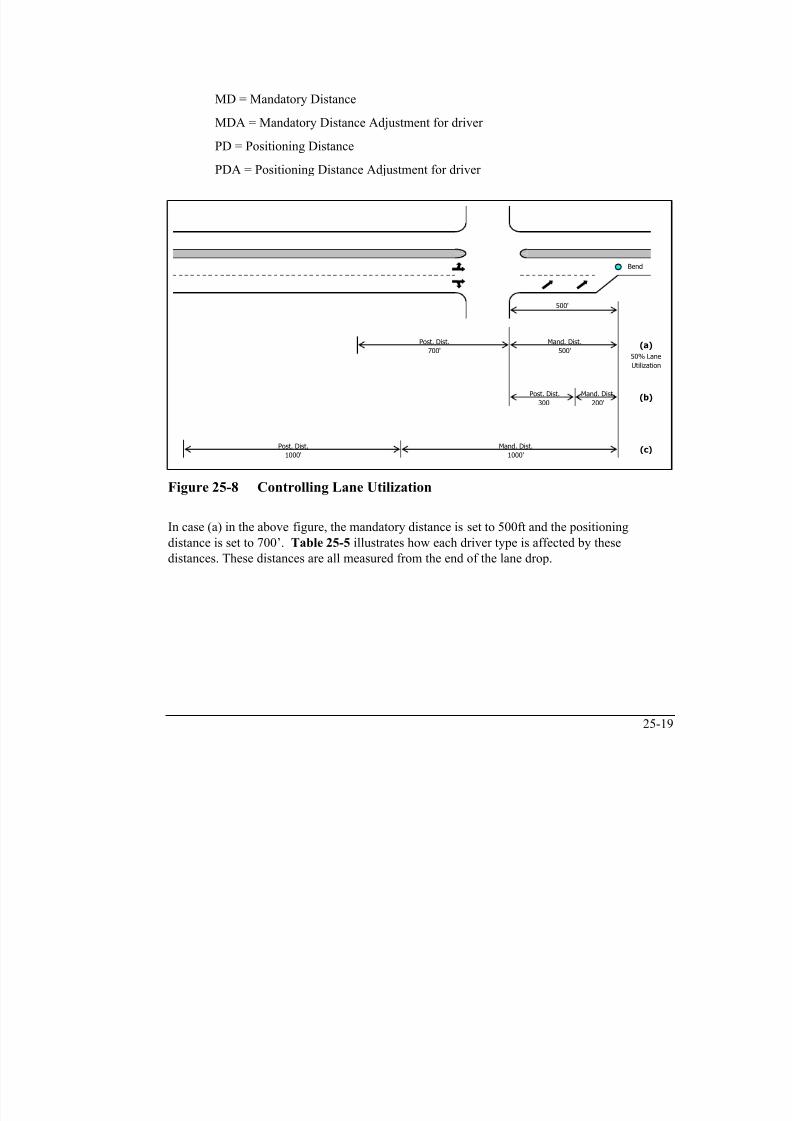
7/21/2019 Synchro Studio 8 User Guide
http://slidepdf.com/reader/full/synchro-studio-8-user-guide 511/559
25-20
5 1.1 1.1 550 807 1320
6 0.9 0.95 450 672 11157 0.8 0.9 400 610 1030
8 0.7 0.8 350 537 910
9 0.6 0.7 300 463 790
10 0.5 0.6 250 390 670
Note that the mandatory distance for a driver type 1 to 5 exceeds 500 feet; all of these driverswill be out of the right lane before the upstream intersection. Fifty percent of all drivers will not
use the right lane at the upstream signal.
The start of the mandatory zone for a driver type 6 to 8 exceeds 500 feet. These drivers will be
very aggressive about making a lane change before the signal, but they will not stop for the lane
change until after the signal.
Driver types 9 and 10 have positioning distances exceeding 500 feet. These drivers will attemptto use the left lane if the queue is not significantly longer and they do not need to slow for a lane
change. They are not aware of the need to be in the left lane until 790‟ and 670‟, respectively.
In case (a) 50% of the drivers are excluded from the right lane, and an additional 30% of the
drivers will aggressively avoid the right lane.
In case (b), mandatory is set to 200ft and positioning distance is set to 300‟. Table 25-6
illustrates how each driver type is affected by these distances. These distances are all measured
from the end of the lane drop.
Table 25-6 Case (b) Driver Type Distances
DriverType
Mand.Adj.
PositioningAdj.
Mand.Dist.
Start ofMand.
PositioningDistance
1 2 1.5 400 550 850
2 1.7 1.4 340 480 760
3 1.5 1.3 300 430 690
4 1.35 1.2 270 390 630
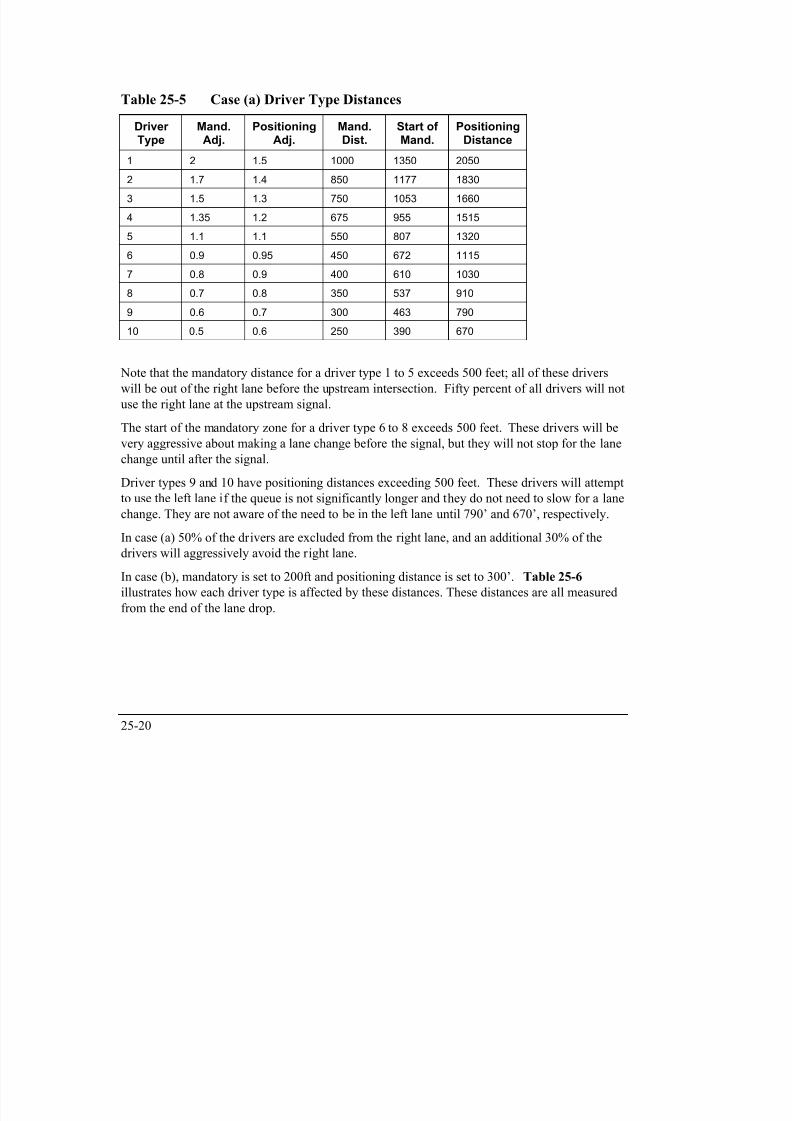
7/21/2019 Synchro Studio 8 User Guide
http://slidepdf.com/reader/full/synchro-studio-8-user-guide 512/559
25-21
5 1.1 1.1 220 330 550
6 0.9 0.95 180 275 4657 0.8 0.9 160 250 430
8 0.7 0.8 140 220 380
9 0.6 0.7 120 190 330
10 0.5 0.6 100 160 280
In this case no Adjusted Mandatory Distance exceeds 500ft. No drivers are forced to use theleft lane.
The start of the mandatory zone for driver type 1 exceeds 500 feet. These drivers will be very
aggressive about making a lane change before the signal, but they will not stop for the lane
change until after the signal.
Driver types 1 to 5 have positioning distances exceeding 500 feet. These drivers will attempt to
use the left lane if the queue is not significantly longer and they do not need to slow for a lanechange.
In case (b), no drivers are excluded from the right lane. 10% will aggressively avoid the right
lane, and an additional 40% of drivers will passively avoid the right lane.
In case (c), mandatory is set to 1000ft and positioning distance is set to 1000 ft. Table 25-7
illustrates how each driver type is affected by these distances. These distances are all measured
from the end of the lane drop.
Table 25-7 Case (c) Driver Type Distances
DriverType
Mand.Adj.
PositioningAdj.
Mand.Dist.
Start ofMand.
PositioningDistance
1 2 1.5 2000 2500 3500
2 1.7 1.4 1700 2167 3100
3 1.5 1.3 1500 1933 2800
4 1.35 1.2 1350 1750 2550

7/21/2019 Synchro Studio 8 User Guide
http://slidepdf.com/reader/full/synchro-studio-8-user-guide 513/559
25-22
5 1.1 1.1 1100 1467 2200
6 0.9 0.95 900 1217 18507 0.8 0.9 800 1100 1700
8 0.7 0.8 700 967 1500
9 0.6 0.7 600 833 1300
10 0.5 0.6 500 700 1100
Note that the mandatory distance for a driver types 1 to 10 exceeds 500 feet; all of these driverswill be out of the right lane before the upstream intersection. No drivers will use the right lane
at the upstream signal.
Long Turning Bay
Refer to Figure 25-9. There is a long turning bay for right turns and dual right lanes at the
signal. The right turn movement has a lot of volume. The goal is to allow some right turningvehicles to use the left lane and merge right after the start of the storage bay.
In this case the storage bay is 1000 ft. Setting Mandatory Distance less than the storage distance
will allow some vehicles to use the left lane and make a late lane change.
Set mandatory distance less than the turning bay length to allow lane changes after
the start of the turning bay.
Mand. Dist.
600'
Post. Dist.
600'

7/21/2019 Synchro Studio 8 User Guide
http://slidepdf.com/reader/full/synchro-studio-8-user-guide 514/559
25-23
1000'
Right Turn
Vehicle
Paths
Figure 25-9 Long Turning Bay Example
Lane Selection through Multiple Intersections
Sometimes it is necessary to control lane use through multiple intersections. In Figure 25-10, a
lane control sign tells motorists to use both lanes before the first signal. There is only 400 ft
between the intersections for left turning vehicles to get into the correct lane. The vehicle in thethrough curb lane must change lanes into the through/left lane after passing through intersection
1. Using lower values for mandatory and positioning can cause the left turning vehicles to use
both lanes at the first signal. With default settings, more vehicles would favor the leftmost
through lane at intersection 1.
FREEWAY

7/21/2019 Synchro Studio 8 User Guide
http://slidepdf.com/reader/full/synchro-studio-8-user-guide 515/559
25-24
400'
F R E E W A Y
250'
Positioning
Distance
100'
Mandatory
Distance
FREEWAY
USEBOTH
LANES
Figure 25-10 Lane Change through Multiple Intersections
Figure 25-11 illustrates a different case. In this case, advanced signing informs motorists to use
only one of two left turn lanes for an upcoming freeway on ramp. For this example use the
default high values for positioning and mandatory distances. This will cause freeway entering
vehicles to use only the single allowed turn lane.
Set mandatory distance low to allow lane changes on a short link. Use higher
mandatory distances to force vehicles into the correct lane earlier.
FREEWAY
2 0 0 '

7/21/2019 Synchro Studio 8 User Guide
http://slidepdf.com/reader/full/synchro-studio-8-user-guide 516/559
25-25
F W
Figure 25-11 Lane Positioning Example
Unsignalized Operation
Collision AvoidanceAll intersections, both signalized and unsignalized have collision avoidance logic. This logic
prevents vehicles and pedestrians from entering an intersection when a conflicting vehicle or
pedestrian is present.
Vehicles are given approval to enter the intersection depending on when they are approved by
signal or sign control and there are no conflicts. Once approved, other vehicles seeking approval

7/21/2019 Synchro Studio 8 User Guide
http://slidepdf.com/reader/full/synchro-studio-8-user-guide 517/559
25-26
must not conflict or must wait for the approved vehicles to clear. A vehicle can be approved
when its travel time is within the Maximum Gap time, which is 7.0 s.
Vehicles can be approved if conflicting vehicles have been approved but their travel time to the
intersection is greater than the appropriate gap time. Vehicles can also be approved if conflicting
vehicles have completed traversing part of the intersection. The amount of traversal depends on
the turn of the subject vehicle and the target vehicle.
For example, the subject vehicle is going through and the target vehicle is from the left going
straight, the subject must wait for the target vehicle to clear 80% of the intersection beforeentering.
If the target was coming from the right and going straight, the subject must wait for the target
vehicle to clear only 40% of the intersection before entering.
If a conflicting vehicle is destined to the same link, merge analysis is performed. If target lanes
do not cross, there is no conflict. U-turns are not eligible for merge analysis.
Right turn movements will only conflict with merging or crossing streams. If a right turn has itsown lane, no collision avoidance is performed and this is a free right. A through movement may
also be considered a free movement if there are no links to the right and the through movement
has an exclusive target lane.
Pedestrian Vehicle Interactions
Pedestrians cross the street at the Network Walk Speed (4 ft/s or 1.2 m/s by default). Theinternal logic calculates a time until entering and clearing each lane. These times have an extra
buffer of 1 s or 4 ft.
For approved vehicles, times to enter and to clear both the near and far crosswalks are calculated
based on their current speed, turning speed, distance through intersection, and vehicle length.
The arrival time is underestimated and the departure time is overestimated to allow a factor of
safety.
A pedestrian can be approved to start if no currently approved vehicles are scheduled to be ineach crosswalk lane when the pedestrian will be in that lane.
A vehicle can be approved to start if no approved pedestrian will be in the near or far crosswalk
lane when that vehicle is projected to cross.
If a pedestrian is ready to start, vehicles will not be approved unless they can clear the
intersection before the pedestrian would reach their lane. At a signal, waiting pedestrians are

7/21/2019 Synchro Studio 8 User Guide
http://slidepdf.com/reader/full/synchro-studio-8-user-guide 518/559
25-27
p g , g p
only ready when they have a walk indication.
Vehicles in a roundabout will also stop for pedestrians when exiting the roundabout.
Gridlock Avoidance
Vehicles will not be approved if there is not room for them on the next link. Gridlock avoidance
is controlled by the Enter Blocked Intersection setting in the SIMULATION settings. Refer to
page 9-4.
Unsignalized Approvals
Vehicles are only approved when there are no conflicting pedestrians or vehicles already
approved. At an unsignalized intersection, vehicles are approved in the following order:
1. Through and right vehicles on free approaches.
2. Left vehicles on through approaches.
3. Pedestrians on any approach.
4. Vehicles on next-up signed approach.
5. If any vehicle has been approved, vehicles on non next-up signed approaches.
Entering vehicles will not be approved if they conflict with a pending pedestrian.
Vehicles at stop or yield signs will not be approved if they conflict with a pending main street
left turn.
The unsignalized intersection manager tracks the next-up signed approach. When vehicle(s) at
the stop bar of the next-up signed approach are served, the next-up approach rotates clockwise to
the next signed approach. This ensures that each signed approach has its fair turn at the
intersection. Vehicles that are waiting for a stop sign cannot go until their approach is next-up or
until a compatible vehicle moves from another higher priority movement. This scheme allows
two-way, three-way, and four-way stops to be modeled in a round-robin type fashion.
Stop versus Yield
Stop sign and yield sign operation are very similar. For both control types, the vehicle will come
to a stop if necessary and wait until the intersection is clear. The key difference between a stop
and a yield is the distance at which vehicles can be approved.
A hi l hi t i t b d h it i ithi 3 ft (0 9 ) f th t
7/21/2019 Synchro Studio 8 User Guide
http://slidepdf.com/reader/full/synchro-studio-8-user-guide 519/559
25-28
A vehicle approaching a stop sign cannot be approved when it is within 3 ft (0.9 m) of the stop
bar. The stopping vehicle will be prepared to stop, and at 5 ft (1.5 m) may be traveling at 6 ft/s(1.8 m/s). SimTraffic assumes “Hollywood” type stops. A vehicle will slow to 6 ft/s (4mph) but
not stop when there is no conflicting traffic. When there is conflicting traffic, both stopping and
yielding vehicles will stop and wait.
Gap Times
When approving vehicles, the conflict manager will also look at approved vehicles approachingthe intersection. The estimated travel time until entering the intersection is calculated for these
vehicles. If the Approach Gap Time is less than these vehicles‟ travel time to the intersection,
they will not be in conflict.
The approach gap time is not quite the same as the gap times seen in Chapter 10 of the HCM.
The gap time in the HCM is the time between vehicles. In SimTraffic, the approach gap time is
the currently estimated time it will take approaching vehicles to enter the intersection. The
approach gap time in SimTraffic is generally less than the HCM style gap time becauseSimTraffic‟s gap time does not include the time it takes for the conflicting vehicles to clear the
intersection.
The approach gap times were determined experimentally to match the saturation flow rates
found in Chapter 10 of the HCM. In some cases, the gap times are so low that main street
vehicles need to almost stop to avoid collision. Even with these low approach gap settings, the
resulting Saturated Flow Rates are about 50 to 150 vph less than those predicted by the HCM.
The HCM is most likely calibrated based on observations of congested intersections. At theseintersections, the cross traffic may be willing to accept tight gaps because they have been
waiting a long time. It is also possible that the loss in capacity due to impedance is understated
in the HCM formulas. Thus, the resulting approach gaps in SimTraffic are a trade off, giving
less than acceptable gap times and lower than predicted capacity.
The required gap times for each movement are summarized in Table 25-8. In general, the gap
time is equal to the time it will take a vehicle to enter and clear the intersection. The conflicting
vehicles may be slowing to make a turn and this will increase their estimated travel time.
Table 25-8 Required Gap Times
Movement Approach Gap Nominal Time (s)
Main Through or Right 3.0 s NA
Main Left 3.6 s 3.6 s

7/21/2019 Synchro Studio 8 User Guide
http://slidepdf.com/reader/full/synchro-studio-8-user-guide 520/559
25-29
Cross Left 3.9 s 3.6 s
Cross Thru 3.4 s 1.9 s
Cross Right 2.9 s 4.6 s
When determining a gap time, the travel time though the intersection is calculated using the
curve distance and the curve or link speed. If the travel time is longer than the nominal travel
time, the gap is increased by the difference.
GapX = Gap + max(0, (Dist + L)/CurveSpeed – NomTime) = adjusted gap timeGap = Approach Gap Time
Dist = distance of path through intersection
L = Vehicle Length
NomTime = nominal time
CurveSpeed = speed limit for turn or link
This distance adjustment results in longer gaps for large intersections or slow turns.
Pre-Timed Signal Operation
The operation of pre-timed signals is mostly straightforward. Each phase operates in sequence as
defined in Synchro. During animation, the current state of the signal can be viewed by clicking
with the mouse in the middle of the intersection.
Vehicle Approvals
These rules determine when vehicles are approved, both for actuated and pre-timed signals.
The signalized intersection manager can approve the first unapproved vehicle in each lane. For
each 0.1-second time-slice, vehicles and pedestrians are approved in the following order:
1. Permitted left turns beginning their sneak at the beginning of red.
2. Pedestrians with walk phase.
3. Vehicles with green light moving through and right.
4. Vehicles turning left with a green ball or a green arrow.
5. Right turn vehicles on red, if RTOR is allowed.

7/21/2019 Synchro Studio 8 User Guide
http://slidepdf.com/reader/full/synchro-studio-8-user-guide 521/559
25-30
In addition:
No vehicles or pedestrians are approved if conflicting vehicles or pedestrians are
already approved.
New vehicles will not start if a pedestrian is waiting and has a walk light.
RTOR vehicles will not start if a vehicle is waiting with a green light.
When a signal turns green, the driver does not react until after their Green Reaction
time.
When a signal turns yellow, approved vehicles may be unapproved if they can stop at
their Yellow Deceleration Rate. The Yellow Deceleration Rate is dependent upon the
driver type.
Left Turn Sneakers
When the signal is yellow it is possible for permitted left turn vehicles to complete their left turn
movement by sneaking. If the vehicle‟s distance to the stop bar at the beginning of the yellow is
less than the Yield Approve Distance (30 ft or 10 m), it will be marked for sneaking. This
normally allows two vehicles per cycle to sneak on each permitted left turn movement.
The sneaking vehicles are allowed to enter the intersection during yellow and the beginning of
red, if the intersection becomes clear. Normally oncoming through traffic will clear the
intersection during yellow and the sneaking vehicles will be approved. It is possible that anoncoming through vehicle will “run” the yellow light and the sneakers will not be able to start
until the signal turns red. If you observe vehicles sneaking during red, this may indicate that
longer yellow and/or all-red intervals are needed, or that the yellow deceleration rate is too low.
Pre-Timed Signal Transitions
If multiple timing plans are used in conjunction with data files and multiple intervals, it is
possible to have the signal transition between timing plans. Pre-timed signals will transition
with the following steps:
1. Transition begins
2. Signal reaches the sync point. The sync point is the first point where all coordinated
phases are green.
3. New timing plan is loaded.

7/21/2019 Synchro Studio 8 User Guide
http://slidepdf.com/reader/full/synchro-studio-8-user-guide 522/559
25-31
4. Signal rests on coordinated phases until sync point in new timing plan is reached.Transition is now complete.
Signal transitions with pre-timed signals can be quite disruptive. It may take nearly an entire
cycle to reach the sync point, then the signal may rest on the main street phases for up to a full
cycle in addition to the normal main street green time. This operation is intended to mimic the
operation of electromechanical pre-timed signals. To get more efficient transitions, use
coordinated signals.
Actuated Signal Operation
The operation of actuated signals is quite complex compared to pre-timed signals. Actuated
signals have detectors and gap counters, and can skip phases. The current state of the signal can
be viewed during animation by clicking with the mouse in the middle of the intersection.
Detectors
Detectors are placed per the settings in the DETECTOR settings. Full details can be found in
Chapter 10.
If a phase has a pedestrian signal and does not have max or ped recall, a pedestrian button is
assumed. Whenever a pedestrian is generated, a ped call is generated.
Gap Counters
Each actuated phase has a gap counter. The current state of the gap counter can be seen in the
signal state settings. Every time a vehicle is over a detector, the gap counter is reset to Vehicle
Extension, or to a calculated gap for volume density operation. Once the gap counter reaches
zero, the phase has gapped out and the counter remains at zero.
The signal will not gap-out during the minimum initial interval.
At a fully actuated or semi-actuated signal, the gap counter will not start counting until there are
calls on conflicting phases. If a detector has extension time (e), it will place a call for e seconds
after actuation.
Phase Sequences
Phase sequences are served in the order determined by the Ring and Barrier Designer in
Synchro. Normally each phase is serviced in order as expected for a dual ring controller.

7/21/2019 Synchro Studio 8 User Guide
http://slidepdf.com/reader/full/synchro-studio-8-user-guide 523/559
25-32
With lagging operation, the even phase will appear before its odd phase partner. For example, phase 2 will show before phase 1.
SimTraffic assumes dual service. If phase 1 has calls, but no calls are present on phase 3 or 4,
phase 4 will still appear so that a phase in each ring will show. It is always the even phase that
shows for dual service in the absence of calls.
If the leading phase of a phase partner gaps out and there is no call to the lagging phase, the
leading phase will remain on. For example:
Phases 1 and 5 are showing.
Phase 1 gaps out and phase 5 still has time left and there are no calls for phase 2.
Phase 2 will be skipped and will not reappear until all other phases have had a chance
to display.
Coordinated Phase SequencesIn an actuated-coordinated signal, each phase has a start time and an end time. The end time is
the force-off point for actuated phases and the yield point for coordinated phases.
When the coordinated phases reach their first yield point, the phases enter the Ready to Yield
state. While in the Ready to Yield state, the signal can yield to any actuated phase when its start
time appears.
Once all the coordinated phases yield, the signal enters Yielded State. In Yielded State, allactuated phases are serviced in turn until the actuated phases reappear. SimTraffic can operate
with “Fixed Force Off ” operation. Any unused time from actuated phases can be used later by
other actuated phases. Each actuated phase is terminated when it gaps out, or at its yield point,
whichever comes first. An Actuated phase can also be terminated at its max time if Fixed Force
Off is not used (i.e., the force off can float).
When both coordinated phases come back, the signal enters Display Main State. The signal
remains in Display Main State until the first yield point. No actuated phases can be displayed
during this state.
Signal Transitions
If multiple timing plans are used in conjunction with data files and multiple intervals, it is
possible to have the signal transition between timing plans.
If the new timing plan is fully actuated or uncoordinated, the transition occurs immediately.

7/21/2019 Synchro Studio 8 User Guide
http://slidepdf.com/reader/full/synchro-studio-8-user-guide 524/559
25-33
If the new timing plan is coordinated, the transition will occur with the following steps:1. New timing plan is loaded and cycle clock is set based on time from midnight.
2. Cycle Clock for current state is calculated based on current phase durations and their
start times.
3. The calculated cycle clock is compared to the target cycle clock. If the calculated
cycle clock state is ahead by less than half a cycle, the controller will attempt to
regain coordination by using shortened phases. Otherwise, the controller will attemptto regain coordination by using longer phase times.
4. The transition maxtimes are calculated by increasing or decreasing the phase max
green times by 17%. No green times will be shortened below the pedestrian walk plus
flashing-do not-walk times or the minimum initial time. If shortening is unable to
reduce the cycle length by at least 10%, the transition will occur using longer green
times.
5. The signal will continue to time using the shortened or extended phase times. No
force off or yield points are used.
6. At the beginning of each barrier transition, the calculated cycle clock is compared to
the actual cycle clock. When the calculated cycle clock is a little bit behind, the
transition is complete and the signal will begin operating coordinated with the new
timing plan.
The transition is complete when the calculated cycle clock is less than this amount behind:
Long Way, Coordinated Barrier 30%
Long Way, Non-Coordinated Barrier 20%
Short Way, Coordinated Barrier 50%
Short Way, Non-Coordinated Barrier 30%
When a phase order switches from leading to lagging, it is possible that a phase may be shown
twice within the barrier, or skipped. SimTraffic contains special logic to prevent a phase from
being skipped or shown twice. Note that actual controllers may not contain this logic and it is possible that real-world controllers will skip phases or service phases twice during a timing plan
transition.
Consider the following example:
Old Order: 1 – 2 | 4
New Order: 2 1 | 4

7/21/2019 Synchro Studio 8 User Guide
http://slidepdf.com/reader/full/synchro-studio-8-user-guide 525/559
25-34
New Order: 2 – 1 | 4
Case 1
State at transition start: ph 1 green
Normal order 4 | 1 | 4
Adjusted order 4 | 1 – 2 | 4
Case 2
State at transition start: ph 1 yellow, committed to phase 2
Normal order 4 | 1 – 2 – 1 | 4
Adjusted order 4 | 1 – 2 | 4
Case 3
State at transition start: ph 2
Normal order 4 | 1 – 2 – 1 | 4
Adjusted order 4 | 1 – 2 | 4
Case 4
State at transition start: ph 4 yellow, committed to phase 1
Normal order 4 | 1 – 2 – 1 | 4
Adjusted order 4 | 1 – 2 | 4
Case 5
State at transition start: ph 4 yellow, not committed to new phase
Normal order 4 | 2 – 1 | 4
Adjusted order: No adjustment necessary
In order to display overlaps, the new phase may be committed during yellow time, if it is part ofan overlap.
Corner Points and Curb Radii
The center line for each link is offset to the left and right based on the median widths and widths
of the lanes. The lane widths are the widths of through and right lanes. Left lanes are part of the
median which is calculated as described above
7/21/2019 Synchro Studio 8 User Guide
http://slidepdf.com/reader/full/synchro-studio-8-user-guide 526/559
25-35
median which is calculated as described above.
The Right Width, wR , is equal to 1/2 the median width plus the widths of through and right
lanes.
The Left Width, wL, is equal to 1/2 the median width plus the number of departure lanes. The
departure lanes include all lanes except for storage lanes.
The offset lines for adjacent links are crossed to create corner points (ptL and ptR). These corner
points are used to determine the location of crosswalks, stop-bars, and curb line curves.Refer to Figure 25-12. Each link is given two points ptL and ptR where the link intersects at the
intersection. When the angle is obtuse ( 90 degrees), these points are set where the curb lines
intersect. See ptRB and prLC in the diagram.
When the angle is acute (< 90 degrees), these points are set based on the minimum curb radius
(w). See ptRA and prLB in the diagram. If there is a right turn island or no right turn path, the
points are set the same as an obtuse intersection
At a „T‟ intersection, these points are based on the location of the points across the street, ptRC
is across from ptLC and ptLA is across from ptRA.
wR
wL
"C"
ww
w
w
"A"
ptLA ptRC
ptLCptRB
ptLC
ptRA
wL
wR
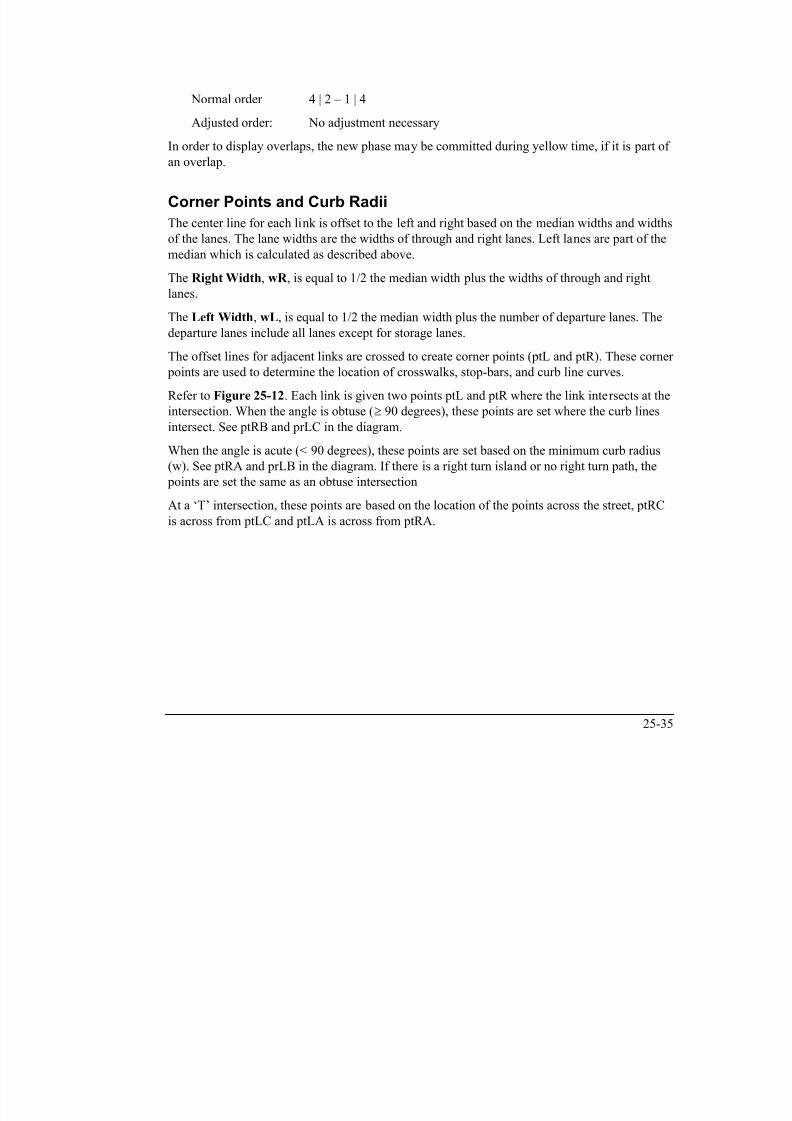
7/21/2019 Synchro Studio 8 User Guide
http://slidepdf.com/reader/full/synchro-studio-8-user-guide 527/559
25-36
wL
wR
"B"
Figure 25-12 Corner Points
Once the corner points are located the stop bar points can be found. Refer to Figure 25-13. Each
link connects its ptR and ptL and this line is offset by the crosswalk width, 16 ft or 2.4 m. The
crosswalk width is the same as the minimum curve radius. This offset line represents the stop
bar, the edge of the crosswalk and the boundary of the intersection. Stop bar points ptSBR and
ptSBL are located at the intersection of the curb line and the stop bar line. These points also
represent the beginning of the Curb Corner Curves. These curves are created by fitting Bezier
curves to these points. The Curb Corner curves always start at the stop bar and crosswalk; with
the exception of right turn islands.
The Pedestrian Path is located 1/3 the crosswalk width beyond the stop bar. The path starts and
ends 4 ft outside the extended curb lines so that the path will be outside of the curb corner curve.
w
ptLSBptRSB
w

7/21/2019 Synchro Studio 8 User Guide
http://slidepdf.com/reader/full/synchro-studio-8-user-guide 528/559
25-37
ptLSB
ptRSBptLSB
ptRSB w
Figure 25-13 Stop Bar Points
Right Turn Islands
Figure 25-14 shows how a right turn island is laid out. With a right turn island there can be
two right widths (wR and wR‟) and two left widths (wL and wL‟). The widths wR and wL
include the full width with all lanes, while wR‟ and wL‟ do not count lanes dropped for the
island and lanes added by the island.
The outside curb lines are offset by the curve radius to find a center point ptC. Also the points of
curvature and tangency (PC and PT) are found along the outside curb lines. The inside curb
lines are crossed to find the corner points (ptL, ptR, and ptIX). The inside radius of the right turn
curve is intersected with the inside curb lines to find the corners of the island (points I1 and I2).The Stop Bar points are based on the inside curb lines and are found in the same manner, as
illustrated in Figure 25-12. The stop bar and crosswalk extend to the island only.
wR'
wR
"A"
w
w
ptIX, ptRA, ptLBI1
ptLSBA

7/21/2019 Synchro Studio 8 User Guide
http://slidepdf.com/reader/full/synchro-studio-8-user-guide 529/559
25-38
wL'
wL
r
"B"
ptC
PC
PT I2
ptLSBB
Figure 25-14 Right Turn Island
Roundabouts
Figure 25-15 shows how corner points and stop bar points are located for a roundabout.
Normally the corner points (ptL and ptR) are set where the curb line crosses the outer radius of
the circle (point A in diagram). When two links have curb lines crossing outside the circle the
corner point is set at the curb line intersection (point B in diagram).
The stop bar points are found by offsetting the corner points by the crosswalk width (w = 16 ftor 2.4 m).
The point where the Corner Curb Radius meets the circle is found by rotating around the circle
by the crosswalk width. Point C in the diagram is found by rotating the crosswalk width from
point A. The entry and exit curves for vehicles are found in a similar manner.
A
C
w
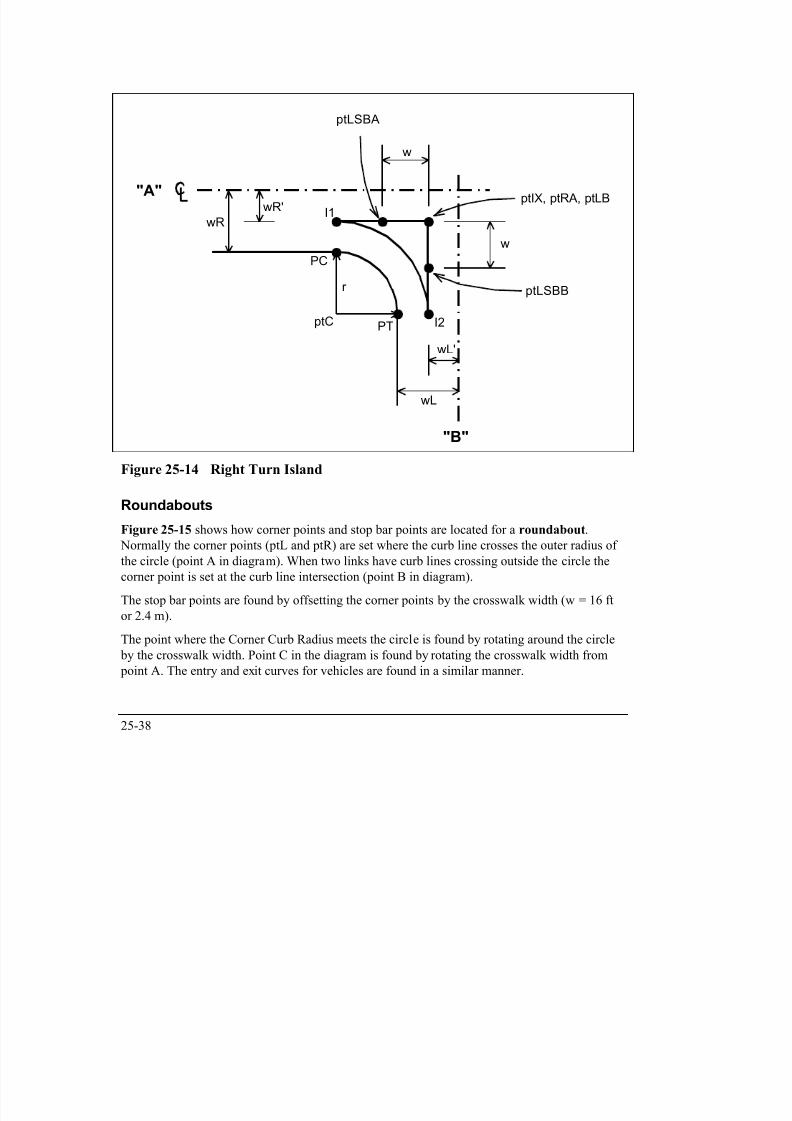
7/21/2019 Synchro Studio 8 User Guide
http://slidepdf.com/reader/full/synchro-studio-8-user-guide 530/559
25-39
Bw
w
Figure 25-15 Roundabout
Delay, Fuel and Emissions Considerations
SimTraffic reports two delays, total delay and stopped delay.
Stopped delay is the sum of time that the vehicle is stopped or moving slower than 10 ft/s.
Total delay is the difference between the actual travel time and the time it would have taken to
clear the network without any signals, signs or other vehicles.
Total delay is comparable to the signal delay in Synchro and the delay reported in TRANSYT
and HCS.
If one or more links are congested, SimTraffic delays can get quite large. The longer the analysis
period, the larger the delays will grow. Each model makes different assumptions about what
happens during congestion. This makes it difficult to compare delays for congested movements.
Stopped Vehicles and Fuel and Emissions Calculations
In some cases fuel and emissions in SimTraffic can increase while stops and delays decrease.
This seems counterintuitive since fuel and emissions should be proportional to stops and delays.
In a congested network, many of the vehicles may be stopped and are not reaching their
destinations. Stopped vehicles emit and consume less per second than moving vehicles. It is
possible that by improving traffic flow, more cars are moving and emissions increase.
To check the results look at the miles per gallon and divide the emissions by miles traveled.
Most fuel is consumed when accelerating from a stop to full speed. The fuel and emissions may
be reported on the exit link since the majority of acceleration occurs after crossing the stop bar.

7/21/2019 Synchro Studio 8 User Guide
http://slidepdf.com/reader/full/synchro-studio-8-user-guide 531/559
25-40
Chapter 26 – 3D Viewer3D Viewer is a simple, easy-to-use tool for three-dimensional modeling of SimTraffic
simulations. Users can create rich visualizations by adding buildings and scenery, then producea digital video for presentations using fly-thru and drive-thru animation.
3D Viewer uses a SimTraffic simulation to create a Scene. A Scene is a three-dimensional
rendering of a SimTraffic network. A scene is generated when the user creates a 3D graphics
file using SimTraffic. See page 21-3 for recording a 3D graphics file.
G tti A d 3D Vi
7/21/2019 Synchro Studio 8 User Guide
http://slidepdf.com/reader/full/synchro-studio-8-user-guide 532/559
26-1
Getting Around 3D Viewer
The User Interface
Navagation Tool PlaybackTool
Tour Tool
Model Tool
Navigation Tool Allows the user to move through the scene.
Playback Tool Controls the animation of the scene.
Tour Tool Enables creation of virtual scene tours and digital video.
Model Tool Enables the user to customize the scene with buildings, trees, signs, etc.
Navigation Tools
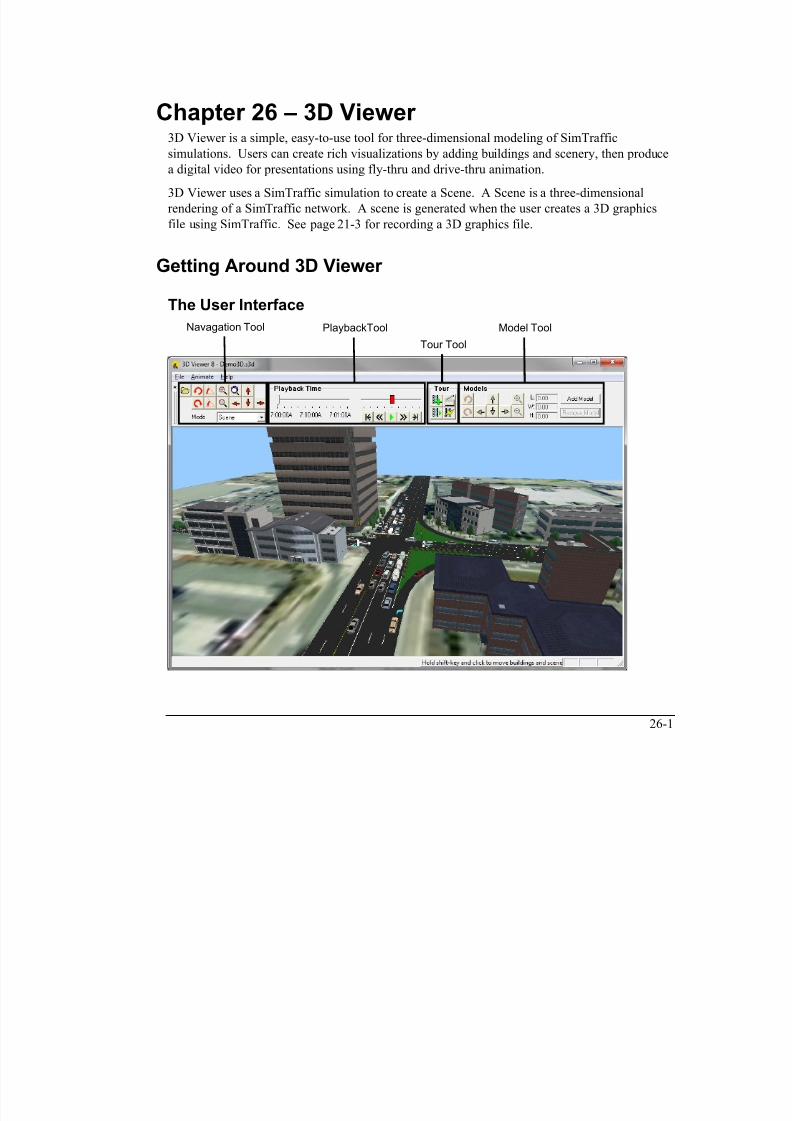
7/21/2019 Synchro Studio 8 User Guide
http://slidepdf.com/reader/full/synchro-studio-8-user-guide 533/559
26-2
Navigation Tools3D Viewer provides navigation tools for moving through a scene. The navigation tools are
located on the upper left of the toolbar. The keyboard can also be used for screen navigation.
Pan
Pan control moves the scene left, right, forward, and backward.
The [Left], [Right], [Up], and [Down] keys can be used to do the same. Holding down the
[CTRL] key while pressing the arrow keys will increase the pan speed. Increasing the pan
speed is useful for moving across large areas of the scene quickly.
The user may also move through the scene using the mouse. By left-clicking on the scene, theuser can move the scene left, right, backwards, and forwards by moving the mouse left, right,
up, and down respectively. Similarly, holding down the [CTRL] key while moving the mouse
will increase the rate at which the scene moves.
Rotate
The user can click the rotate buttons to pivot the scene clockwise or counterclockwise about the
center of the scene window. To rotate the scene, click and hold down the button to rotate
counterclockwise, or the button to rotate clockwise. The user may also press the [Insert]
key to rotate counterclockwise, or press the [Delete] key to rotate clockwise.
The user may also rotate the scene using the mouse. By right-clicking on the scene, the user can
move the scene counterclockwise, clockwise, tilted up, or tilted down by moving the mouse left,
right, up, and down respectively.

7/21/2019 Synchro Studio 8 User Guide
http://slidepdf.com/reader/full/synchro-studio-8-user-guide 534/559
26-3
Tilt
The user can click the tilt buttons to adjust the “camera” angle up or down. The button
will raise the camera angle. The button will lower the camera angle. The user may also
press the [Home] and [End] keys to respectively raise and lower the viewing angle.
Zoom
The user can click the zoom buttons to enlarge or reduce the screen size. The button
zooms into the scene. The button zooms out of the scene. Likewise, the [Page Up] and the
[Page Down] keys can be used to zoom in and zoom out.
The user can also zoom the scene such that the entire simulation fits within the window by
clicking the button.
Mode
3D Viewer has 3 different modes for moving through the scene.
The first mode, Scene mode, enables the user to navigate through the scene using the above
mentioned navigation tools. Selecting Scene in the Mode combo box or pressing [S] will put
the application in scene mode.
The second mode, Ride mode, enables the user to select a vehicle and move through the scene
from the driver‟s point-of-view. To put the application in Ride mode, click on a vehicle, then
choose Ride in the Mode combo box or press [R].
The third mode, Track mode, enables the user to select a vehicle and move through the scene asan observer over the vehicle, following its movement throughout the scene. To put the
application in Track mode, click on a vehicle, then choose Track mode in the Mode combo
box or press [T] button.
Home Position
The user can set “home” position of the scene. The home position is a saved location andi i l T t th h iti i t t th d i d l ti d i t ti i th
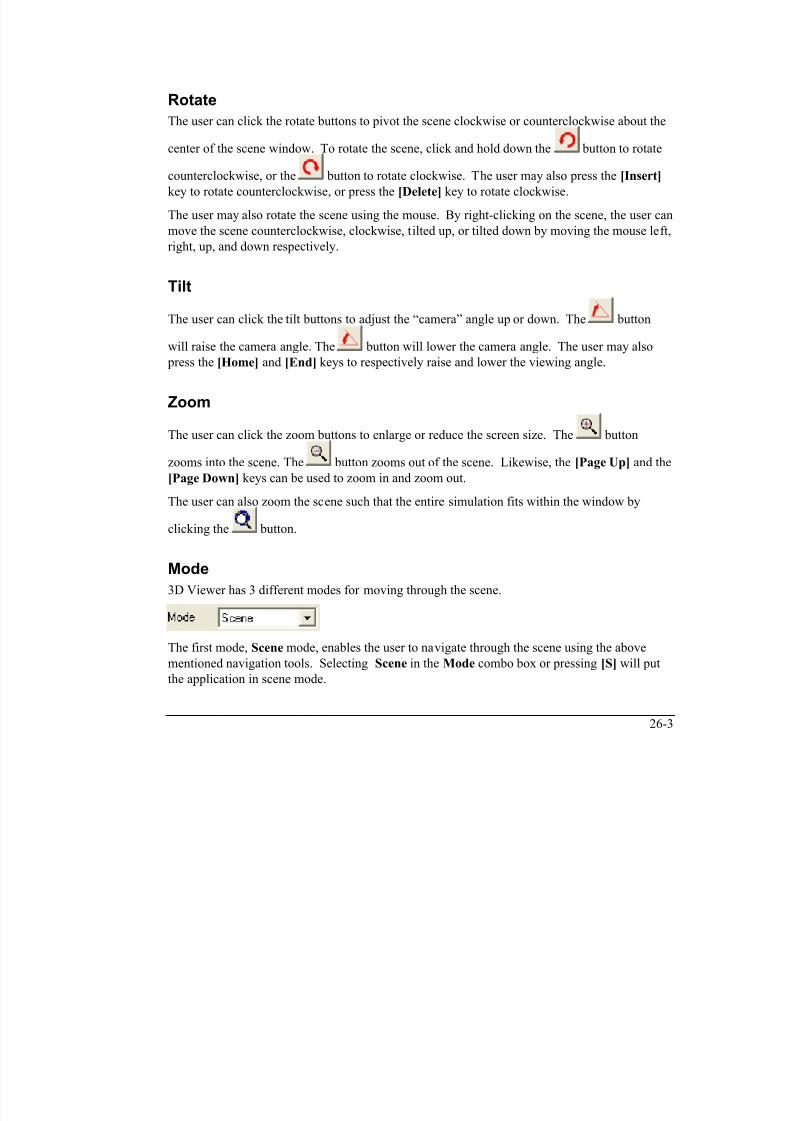
7/21/2019 Synchro Studio 8 User Guide
http://slidepdf.com/reader/full/synchro-studio-8-user-guide 535/559
26-4
The user can set home position of the scene. The home position is a saved location andviewing angle. To set the home position, navigate to the desired location and orientation in the
scene. Next, press [CTRL][7/HOME] (the [7/HOME] key on the numeric keypad). To return
to the home position, press the [7/HOME] key on the numeric keypad at any time.
Playback Tool
3D Viewer animation tools playback the vehicle and signal activity according to the simulation
generated in SimTraffic.
TimelineThe timeline control enables the user to move to any point within the simulation time window.
The timeline control displays the total time contained in the simulation. The current time
marker shows the relative position within the simulation timeline and displays the current timeoffset in the middle of the control.
The user can step through the scene in extremely slow motion by using the keyboard in
conjunction with the timeline control. First, left-click on the position indicator on the timeline
control, then hold down either the left or right arrow keys to step through the scene.
Playback
The playback control manipulates the animation rate and direction.
The user can animate the scene at 1 to 8 times real-time speed by clicking and dragging the
playback control to the left or right. When the playback control moves to the right, the
application animates the scene forward in time. When the playback control moves to the left,
the application animates the scene backward in time.
Frame Skip and Playback

7/21/2019 Synchro Studio 8 User Guide
http://slidepdf.com/reader/full/synchro-studio-8-user-guide 536/559
26-5
Frame Skip and Playback
The Frame Skip buttons advance the timeline to the end or return the timeline to the beginning.
Returns the timeline to the beginning.
Moves backwards in time one half second.
orPlay back at 1x speed or pause.
Moves forward in time one half second.
Advances the timeline to the end.
Tour Tool
The Tour Tool enables the user to create virtual tours of the simulation environment for later
playback or digital video creation.
Create a new tour.
orSelect an existing tour for playback or stop playback.
Generate digital video from one or more existing tours.
or
Pause a tour or restart the tour.
Model Tool

7/21/2019 Synchro Studio 8 User Guide
http://slidepdf.com/reader/full/synchro-studio-8-user-guide 537/559
26-6
Model Tool
The Model Tool enables the user to add buildings and other scenery to the scene.
Model List
The model list contains the inventory of available buildings, signs, trees, shrubs and other items.
The combo box at the top lists the model categories. The combo box on bottom lists the models
contained within each category. To add a model, select the category, then select the model
within the category. Then click to add the model to the scene. To remove a
model, shift-click to select a building, tree, or other item from the scene and click .
Model Position ToolThe model position tool helps the user place the model exactly in the desired location.
Models may be moved left, right, forward, and backward. Models may also be rotated
clockwise and counterclockwise. To position a model, shift-click to select a building, sign, tree,
or shrub from the scene. Next, click the model position buttons to place and orient the model as
desired. Additionally, the user may use the [Up], [Down], [Right], and [Left] keys to
manipulate a model once it is selected.
The user can also position a model by using the mouse. To move a model with the mouse shift
+ left-click on the model then move the mouse left, right, up, or down. This will move the

7/21/2019 Synchro Studio 8 User Guide
http://slidepdf.com/reader/full/synchro-studio-8-user-guide 538/559
26-7
model left, right, backward, or forward. The user can increase the speed at which the model
moves in the scene by holding down the [CTRL] key while moving the mouse.
To rotate a model using the mouse, right-click on the model and move the mouse left or right.
After adding, removing, or changing model placement, be sure to select the File menu and
choose Save.
Using 3D Viewer
Create a New Scene
Once the user creates a 3D graphics file from within SimTraffic, the user can then launch 3D
Viewer directly from SimTraffic by clicking on the 3D toolbar button.
Ride in a Vehicle
Users can navigate through a scene from the perspective of a driver in a vehicle. To “ride” in a
vehicle, click on a vehicle in the scene, then choose Ride in the Mode combo box on the toolbar
or press [R].
While “riding” in a vehicle, users can click on other vehicles to jump to another driver‟s
perspective.
To “get out” of a vehicle, choose Scene in the Mode combo box or press [S].
While 3D Viewer is in Ride mode, the scene navigation functions rotate, tilt, zoom, and pan are
disabled.
Track a Vehicle
Users can follow a vehicle through a scene as an observer. To follow, or “track” a vehicle, click
on a vehicle in the scene, then choose Track in the Mode combo box on the toolbar or press
[T].
While “tracking” a vehicle, the user can click on other vehicles to follow their movement
through the scene.
To discontinue tracking a vehicle, choose Scene in the Model combo box or press [S].
While 3D Viewer is in Track mode, the use can tilt and zoom the scene, but the rotate and pan
functions are disabled.
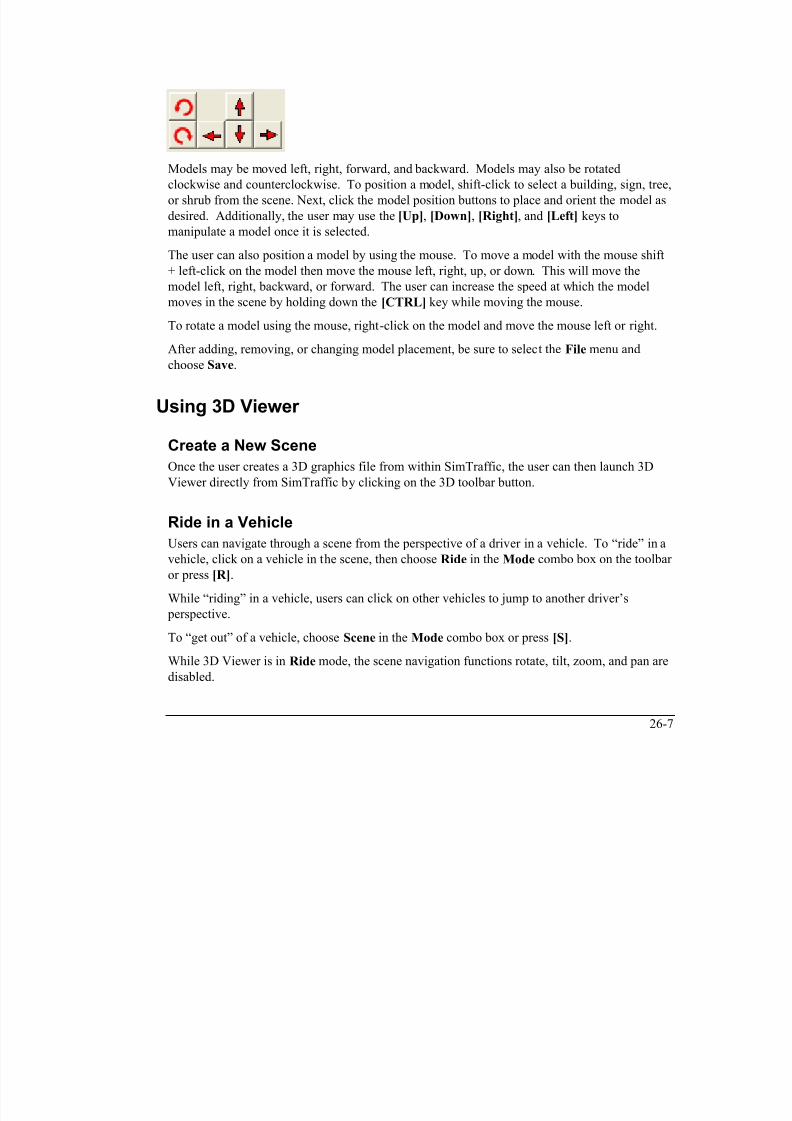
7/21/2019 Synchro Studio 8 User Guide
http://slidepdf.com/reader/full/synchro-studio-8-user-guide 539/559
26-8
Create Digital Video
3D Viewer can be used to create digital video in .AVI format. Digital video can then be copied
to other computers for playback, even if 3D Viewer is not installed.
3D Viewer generates digital video are based on “Tours”. Tours can then be used as input to the
video generation process.
To create a tour, navigate to the point in the scene where you would like the tour to begin, then
click the button. 3D Viewer will present the Tour Save dialog:
The file name defaults to the current scene name with the extension “.s3t”. If you desire, you
may type a different name. Click the [Save] button. The application is now in “Tour” mode.
3D Viewer is now recording the camera angle in time. You may navigate through the scene and
change the scene mode if as you like to create the tour through the simulation environment. To
end the tour, click the button.
To playback a saved tour, click the button. 3D Viewer will present the Open Tour dialog:
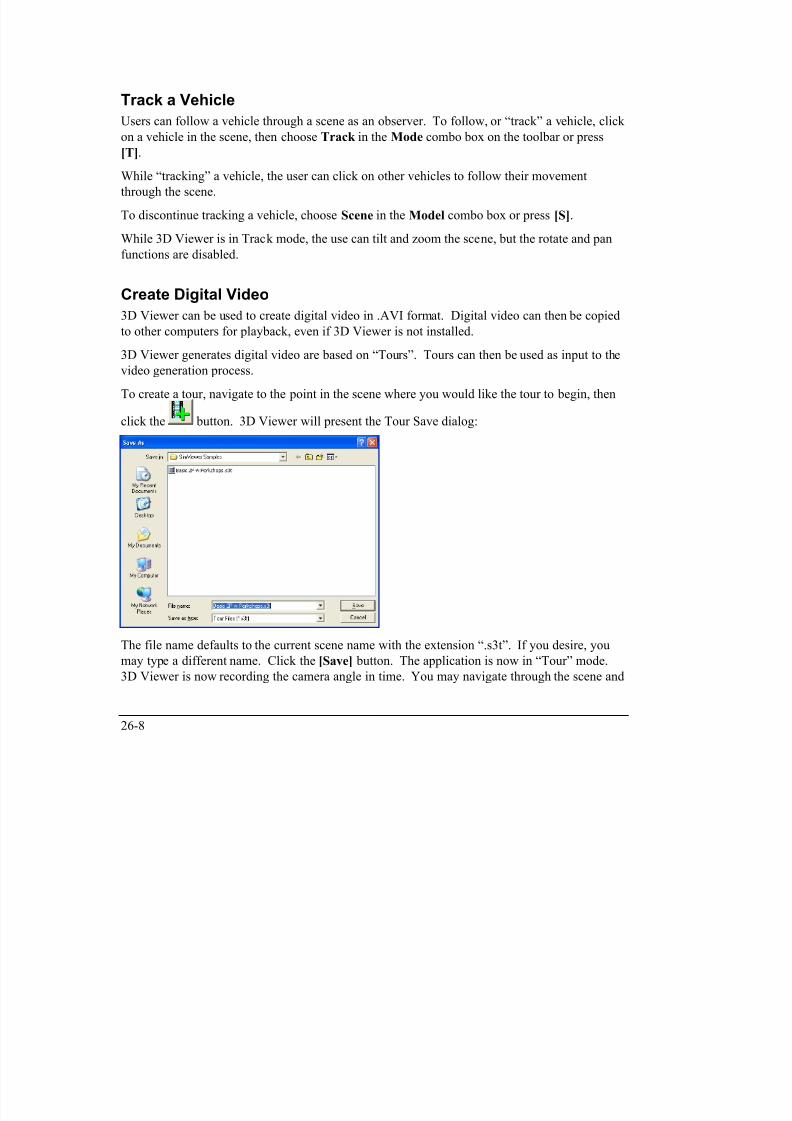
7/21/2019 Synchro Studio 8 User Guide
http://slidepdf.com/reader/full/synchro-studio-8-user-guide 540/559
26-9
Select a tour file and click “Open”. 3D Viewer will automatically start playing the tour. To end
tour playback, click the button.
Finally, to generate digital video from a tour file, click the button. 3D Viewer will present
the Generate Digital Video dialog:

7/21/2019 Synchro Studio 8 User Guide
http://slidepdf.com/reader/full/synchro-studio-8-user-guide 541/559
26-10
3D Viewer can generate digital video from one or more tour files. To select a tour file, click the
[Add…] button and choose a tour file. You may add as many tour files as you wish. 3D
Viewer will generate the digital video from the tour files in the order that they appear in thelistbox. Click the [Up] or [Down] buttons to move tour files up or down in the listbox.
Predefined settings
A user can choose from three predefined settings “Larger file size”, “Medium file size” and
“Smaller file size”.
Parameters
It allows a user to choose the screen size of the video, frames per second and video quality.
Add Buildings and Scenery
Users can add buildings and scenery to 3D Viewer scenes to create realistic simulations. To add
a building, tree or other model, navigate to the location in the scene near the point where themodel is to be placed. Select the model from the model list. Choose the model category then
select a model from the list below. Next, click . The model will be placed at the
location near the center of the window.
To adjust the model location and orientation, left-click on the model in the scene, the user can
then use the keyboard, mouse, or toolbar to move the model. To use the mouse, left-click on the
mouse and hold down the button, then move the mouse. Right-clicking will rotate the model.
To use the keyboard, use the arrow keys to move the model. Holding down the [CTRL] keywhile pressing the arrow keys will move the model more quickly. Holding down the [Insert]
and [Delete] keys will rotate the model.
To remove a model, click on the model in the scene then click .
Changing the Size of a Model
To change the size of a selected model object, hold “Shift” key and rotate the mouse wheel. The
d l bj t ill b ti ll i d di i i h d T k th i h l

7/21/2019 Synchro Studio 8 User Guide
http://slidepdf.com/reader/full/synchro-studio-8-user-guide 542/559
26-11
model object will be proportionally increased or diminished. To make the size change slower,
hold “Ctrl” key.
Also, you can change length, width and height of a selected object using Models pane by editing
L, W and H values.
Adding a Model Object to the Scene
Press “Add Model” button. A new “Models Preview” window appears showing the available
model categories such as “Office Buildings”, “Residential”, “Roadway Items” and so on.
Choose a category and scroll the list of the model using the scroll control or press the left mouse
button and pan the list to right or left. Select a model by clicking on it with the left or rightmouse button. If you hold the right mouse button and move the mouse up/down or right/left, the
selected model will rotate around the vertical or horizontal axis to allow see it from all sides.
To add the selected model to the scene, press the “Add” button, or click twice with the left
mouse on the model.
Adding a Custom Model in 3ds Format
In the “Models Preview” window, there is a button “Import Models”. You can browse for anexisting .3ds file to include in the list of the “Custom Models” category.
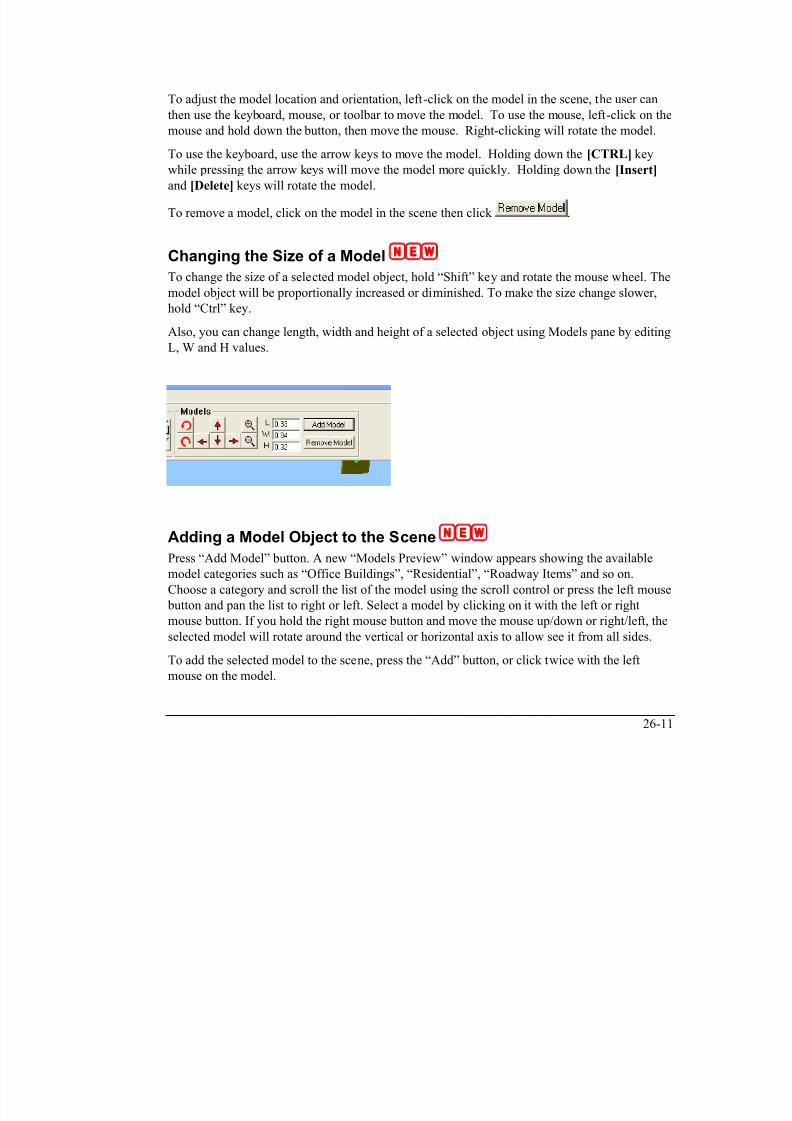
7/21/2019 Synchro Studio 8 User Guide
http://slidepdf.com/reader/full/synchro-studio-8-user-guide 543/559
26-12
g g y
Chapter 27 – SimTraffic CIThis chapter provides instructions for using SimTraffic CI. SimTraffic CI interacts with a
controller interface (CI) device connected to a controller to simulate the operation of thecontroller with simulated traffic.
SetupBefore using SimTraffic CI, connect the controller interface (CI) device (sold separately),
controller, and PC as shown in the following diagram.

7/21/2019 Synchro Studio 8 User Guide
http://slidepdf.com/reader/full/synchro-studio-8-user-guide 544/559
27-1
Before proceeding, confirm the port used for the CI testbox for your PC. From your PC‟s
Control Panel , choose System. From the System Properties , select the Device Manager.
Expand the Ports option and confirm the port used for the CI device.
Turn on all of the devices after connecting the cables. Open SimTraffic after initializing the CI
device.
After opening SimTraffic CI, choose the command Options CI-Options. Figure 27-1
illustrates the CI Options dialog for SimTraffic CI setup.
Select the port which is connected to the CI device. In the Settings for Selected Port, choose
the intersection which will run through the CI device. In Controller Type, choose the type of
controller that is being used. Check on the CI Active. Close the CI options window. Create your
simulation (see 21-1 for details on creating a recording a simulation).
Controller Interface
(CI) Device

7/21/2019 Synchro Studio 8 User Guide
http://slidepdf.com/reader/full/synchro-studio-8-user-guide 545/559
27-2
Figure 27-1 CI Options Dialog
When opening or recording a file, SimTraffic CI scans the system for an active controller
connection. Click on the intersection to see status. If the CI device and SimTraffic CI are
configured correctly, a CI signal status box will appear as shown below.
If the intersection is not connected to the CI or not configured properly, the standard SimTraffic
signal status box will appear as shown below.
I/O MappingThe purpose of the controller interface (CI) device is to emulate cabinet functionality. In the
TS2 standard, the functionality of the BIU pins are defined; however, in ATC/2070 applications,
the functionality of the FIO pins is variable. Therefore, the IO Map Builder utility is provided
for defining the functionality of the IO Pins in a 2070/ATC FIO.
In order for SimTraffic CI to operate properly it must know the correct pin to apply the detector

7/21/2019 Synchro Studio 8 User Guide
http://slidepdf.com/reader/full/synchro-studio-8-user-guide 546/559
27-3
In order for SimTraffic CI to operate properly, it must know the correct pin to apply the detector
call on. The IO Map Builder allows the user to assign a physical pin to a functional signal. For
example, controller application „A‟ may use FIO input 1-1 as Detector #1, while controller
application „B‟ may use FIO input 4-1 as Detector #1 input. The user can create an IO Map for
each controller application. This will allow multiple controller applications to run in the same
system.
Map Builder
To launch, select the M ap Builder button from the CI Options dialog. The Map Builder dialog
is llustrated in Figure 27-2. The IO Map Builder also provides default FIO maps based upon the
2070 TEES specification. The default map can not be modified.
The map builder allows you to define 20 maps beyond the default maps (10 2070-8 maps, and10 2070-2A maps).
To define a new map, you first select the FIO Map Type for which the map will be defined.
Your choices are either a 2070-2A for 170 style cabinets, or a 2070-8 for NEMA style cabinets.
You next choose a Map Number of each map you wish to edit. It is this instance number, 1
through 10, that will be identified in the INI file to tell the CID which map it will be using. The
Description field can also be modified for each map, as a reminder of the controller application
to which it applies. Once the map type and number are selected, you can then assign functionality to the input and
output pins. To add a function to a pin, you highlight the pin number and the function you wish
to assign to it, and press the [Assign] button. You may reassign a pin‟s function without
removing the current function. To remove functionality from a pin, you highlight the pin and
press the [Remove] button.
Once you are satisfied with the changes, you may press the save button. If you wish to exit,
press the exit button. If you have not saved, then upon exiting it will give you the option tokeep or discard your current changes.
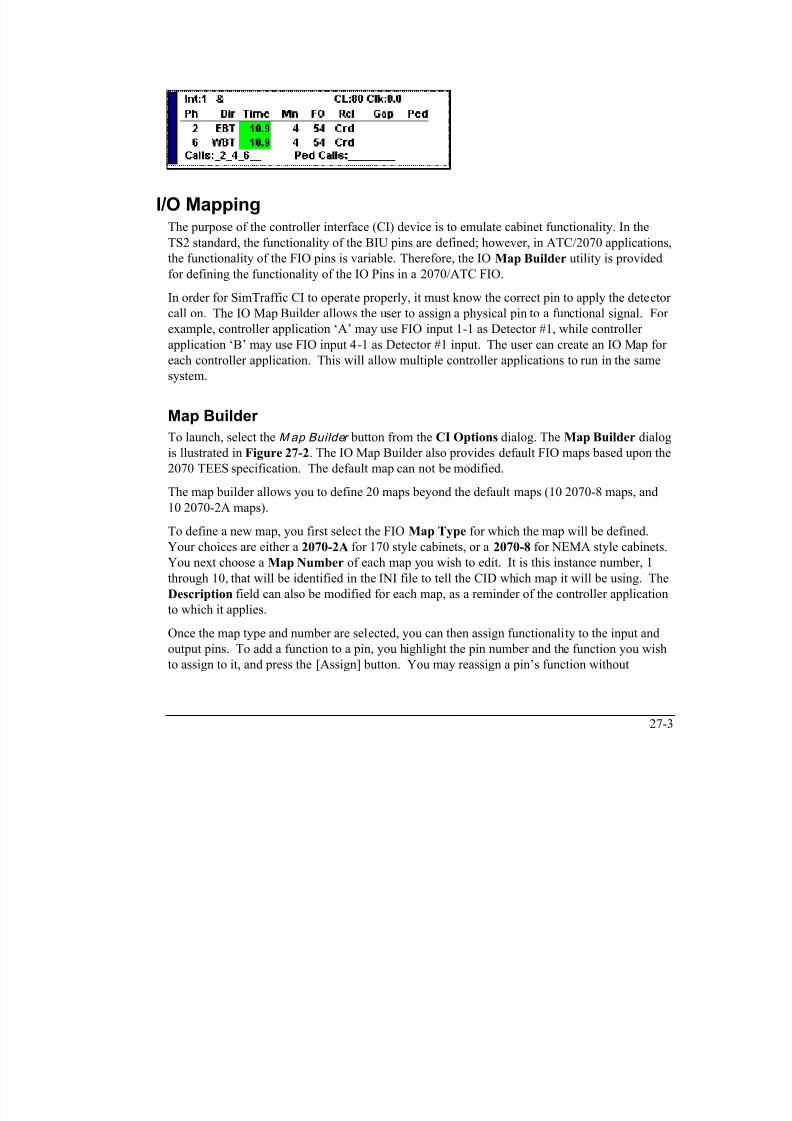
7/21/2019 Synchro Studio 8 User Guide
http://slidepdf.com/reader/full/synchro-studio-8-user-guide 547/559
27-4
Figure 27-2 Map Builder Dialog
Input DataInput data requirements for SimTraffic CI are the same as regular SimTraffic, except as noted in
the following sections.
Timing Data
SimTraffic CI does not use the timing and phasing data from Synchro. The external controller
determines signal timing.
However, it is necessary to code Phase Numbers (page 7-5), Left Turn Type (page 7-3), and
Right Turn Treatment (page 7-4).
Code Pedestrian Calls (page 8-11) or Conflicting Pedestrians (page 6-2), to have CI place
pedestrian calls to the controller.
The CI device software uses phases 13 to 16 as pedestrian phases for phases 2, 4, 6, and 8.
These phases are not available for vehicle use.
Detector Data
If modeling actuated control, detector information is necessary. SimTraffic CI will use the
detector information listed in the DETECTOR settings (refer to page 10-1).

7/21/2019 Synchro Studio 8 User Guide
http://slidepdf.com/reader/full/synchro-studio-8-user-guide 548/559
27-5
Interval Parameters
Interval Parameters work the same as in regular SimTraffic CI.
Loading timing plans for a UTDF data file has no effect on the test box signals since they are
controlled externally.
OperationData is exchanged between SimTraffic CI and the CI device software 10 times per second.
SimTraffic CI simulates vehicles and simulates detector operation. These detector calls are sent
to the CI device and the Hardware Controller. The Controller operates as though it has real
traffic. The current phase information is returned to SimTraffic CI through the CI device.
Record and Simulation Speed
SimTraffic CI can only simulate or record traffic at real time speed. The hardware controller is
not capable of operating at an accelerated rate.
Stopping and restarting the simulation can give strange results. A hardware controller can not
be "paused" or sent back in time. Resuming simulation will start with the controller at its newcurrent state. It is possible that "approved" vehicles will now find a red signal but continue
through. It may take 10 seconds or more to return to normal operation.
To record MOEs, it is necessary to perform a complete simulation in real time including the
seed time. To perform a 15-minute simulation, it takes 15 minutes to record.
To reduce analysis time, try simulating first with regular SimTraffic to insure that traffic and
geometric data is coded correctly.
Signal StatusClick on the center of an intersection to obtain signal status.
If the CI device (or CI Test) is operating correctly with a controller matching this intersection
ID, a CI status box will appear.

7/21/2019 Synchro Studio 8 User Guide
http://slidepdf.com/reader/full/synchro-studio-8-user-guide 549/559
27-6
If no CI device is attached for this intersection, SimTraffic CI will create a virtual controller, the
standard SimTraffic signal status will appear.
If the CI device software is loaded after SimTraffic CI, or a problem is corrected, re-Open the
SimTraffic file. SimTraffic CI will search for the connected CI device when opening the data
file.
Using OverlapsOperating SimTraffic CI with overlaps can be a bit tricky. An overlap is a movement served by
two phases, often used for right turn phases.
Example: NBR is served by phases 2 and 3. The controller has this programmed as Overlap A
and uses output channel 9.
In Synchro code the following for the NBR:
Protected Phase: 9
Detector Phases: 2
Switch Phase: 3
It may be necessary to add phase 9 to the ring and barrier sequence. This file can not be used
for analysis in Synchro and can not be used in SimTraffic, except with the Controller Interface.
Remember to code the Permitted and Protected phases to match the output channel and codeDetector phases to match the phase number used. If Protected Phase is coded as 2 plus 3, the
simulation will display yellow between phases 2 and 3, using output channel 9, will maintain a
continuos green.
Modeling a Diamond Interchange
SimTraffic models multiple intersections using one controller and it is possible to useSimTraffic CI in conjunction with a controller setup for a diamond interchange.
The file Diamond For CI syn is setup with a basic diamond interchange for SimTraffic CI and

7/21/2019 Synchro Studio 8 User Guide
http://slidepdf.com/reader/full/synchro-studio-8-user-guide 550/559
27-7
The file Diamond For CI.syn is setup with a basic diamond interchange for SimTraffic CI and
a Naztec controller set to 4 phase diamond mode.
First, set the controller into 4 phase diamond mode. Refer to the controller manual for details.
This mode uses phases 4 + 12, and 8 + 16 for the offramp movements. These overlaps are setup
to use output channels 4 and 8 so no special phase coding is needed. Notice the phase codingwithin Synchro. The interior through movements use phases 1+2, and 5+6. These are setup as
overlaps A and B, using output channels 9 and 10. Notice that the protected phase numbers for
these movements is set to 8 and 9.
The controller number is equal to the lowest node number of the intersections, 1 in this case.

7/21/2019 Synchro Studio 8 User Guide
http://slidepdf.com/reader/full/synchro-studio-8-user-guide 551/559
Index
#
# Footnote ..................................7-28, 16-9
~
~ Footnote ..................................7-28, 16-9
3
3D View
navigation tools .............................. 26-2
playback ......................................... 26-4
3D Viewer 26 1
Approach Headings
Changing the Label .......................... 3-6 Approach Level of Service ....................7-27
Approach Movements ........................... 3-7
Arterial Level of Service Report 16-21, 16-22
Arterial Reports .................................. 24-9
Arterial Route
Naming ...................................5-3, 16-25
Average Queue ...15-8, 24-11, 24-12, 24-17
AVI format ......................................... 26-8
B

7/21/2019 Synchro Studio 8 User Guide
http://slidepdf.com/reader/full/synchro-studio-8-user-guide 552/559
3D Viewer .......................................... 26-1
Create Digital Video....................... 26-8
A
Acceleration Rates .............................. 25-4
Actuated Cycle Length ............................4-7 Actuated Effective Green Time ............7-21
Actuated Green Times Summary ........16-29
Actuated Green to Cycle Ratio ..............7-23
Actuated Phase Details ............ 16-33, 16-35
Actuated Signal Operation ................ 25-31
Actuated Signals Report ................... 24-14
Actuated Start and Green Times Summary .......................................................16-31
add buildings and scenery ................. 26-10
Adjusted Flow ......................................6-13
Advance Frame ................................... 21-2
Advanced Parameters ......................... 23-1
All Red Time ....................... 7-12, 8-8, 11-4
Allow Uncoordinated ............... 14-11, 14-16 Analysis Period ........................................12-4
Analyzing Part of a Network .............. 21-4
Animation Button ............. 21-1, 21-4, 21-5
Anti-PHF Adjustment ...................... 23-3
B## ................................................... 24-12
Background Color ............................... 21-6
Bends .........2-3, 20-1, 22-14, 24-13, 25-12
Bitmap ................................2-12, 2-13, 21-6
Bus Blockages ........................................ 6-5
C
Calculations ..........................................14-1
Calibrating ................23-13, 23-15, 23-17
Car Following ..................................... 25-4
Changing the Name of the Approach
Direction ........................................... 3-6Channelized Right Turn .................5-7, 7-19
Channelized Right Turns .................... 22-5
Coding
Pedestrians...... 22-7, 22-11, 22-14, 25-3
Coding Error Messages ................14-2, 18-1
Collision Avoidance ......................... 25-26
Combine Files .......................................15-1 Comparison of Analysis Methods .......14-47
Conflicting Bicycles................................ 6-3
Control Delay .......................................7-25
Controller Type ..................................... 4-4
Coordinatability Analysis Report .........16-37
Coordinated Maximum .... 7-16, 8-10, 22-11
Coordinated Minimum ..... 7-16, 8-10, 22-11
Coordinated Phase Sequences ........... 25-32
Coordinates ........................ 4-4, 22-1, 22-2Coordination .......................................14-36
Corner Points ......................... 25-35, 25-36
CORSIM Analysis ................................ 19-1
CORSIM Options ................................ 19-3
Cover to Metric or Feet ................2-27, 2-33
Create a Scene ..................................... 26-1
Critical Gap .......................................... 7-20 Cruise Speed ....................................... 25-4
Curb Radii ......................................... 25-35
Freeways .......................................... 2-30
Dreate Digital Video ........................... 26-8
Driver Parameters ........ 23-1, 23-10, 23-17
Dual Entry ........................................... 8-12
DXF ........................................... 2-28, 21-6
E
Editing UTDF Data with Other Software17-
6
Emissions Calculation .....14-76, 16-8, 16-24
Error List ............................................. 18-9
Error Messages ............................14-2, 18-1 Errors
Fixing in CORSIM ........................... 19-5

7/21/2019 Synchro Studio 8 User Guide
http://slidepdf.com/reader/full/synchro-studio-8-user-guide 553/559
Curved Links ................................ 2-7, 20-1
Cycle Length22-2, 22-3, 23-3, 24-15, 25-12
Actuated ............................................ 4-7
Natural .............................................. 4-8
D
Data Access Errors ............................ 18-12
Database Access.................17-1, 22-7, 23-6
Database Parameters ........................... 23-5
Deceleration Rates ................... 23-17, 25-4
Delay
Intersection ....................................... 4-9
Delay per Vehicle .................... 24-7, 24-16
Deleting
Intersection or Node ......................... 2-9
Link ................................................... 2-8
Demo Version ..................................... 20-2
Denied Entry 24-6, 24-8, 24-9, 24-17, 25-2
Detector .................................... 18-11, 22-8
Trailing .............................................. 7-9 Detector Phases ..................................... 7-7
Diamond 4 Button ................................. 8-3
Dilemma Zone Calculation .................14-78
Diverge
F
Fast Following .................................... 25-6
Federal Highway Administration ........ 14-77
FHWA .......................................16-21, 18-3 Field Studies ..................................... 23-17
File Management .................................. 15-1
File Units .....................................2-27, 2-33
Flashing Don’t Walk ................... 8-11, 11-4
Follow Up Time ................................... 7-20
Footer .................................................. 16-4
Footer Options ........................... 16-4, 24-2
Footnotes............................................. 16-8
Freeway Links
Creating for SimTraffic .................... 2-28
Fuel .................................................... 16-24
Fuel Calculation ..............14-76, 16-8, 16-24
G
Gap Acceptance ...............................23-13
Gap Counters .................................... 25-31
Gap Time............................................... 8-9
Gap Times .............................. 25-28, 25-29
Go to Beginning of Animation ............ 21-2
Go to End of Animation ..................... 21-2
Graphic Options ......................... 16-5, 24-3
Green Reaction ........... 23-12, 23-17, 25-30
Gridlock Avoidance .......................... 25-27
Group Control ......................................7-17 Growth Factor .....................6-4, 22-7, 23-3
H
HCM Signal Report ............................16-16
HCM Unsignal Report ........................16-19
HCS
Transfer ..........................................15-6 Header ..................................................16-4
Header Options .......................... 16-4, 24-2
Intersection Level of Service .................. 4-9
Intersection Properties .. 2-26, 4-2, 4-4, 22-2
Intersection Queue Report ....................16-9
Interval Parameters .................... 23-1, 23-2
Intervals and Volume Adjustments .... 23-1,25-1
Introduction .......................................... 1-1
Introduction to Links and Intersections . 2-3
IO Mapping ........................................ 27-3
K
Keyboard Shortcuts .......................... 21-11
L
7/21/2019 Synchro Studio 8 User Guide
http://slidepdf.com/reader/full/synchro-studio-8-user-guide 554/559
Headway Factor9-8, 22-4, 22-8, 22-12, 25-6
Heavy Vehicles .... 22-7, 23-9, 23-10, 25-1
Helicopter Button .................................2-19
History File ......................................... 21-4
Hold Phase ...........................................7-18 How to Add a Link .................................2-5
How to Code an Overlap .................... 7-30
HST File ............................................. 21-4
I
ICU
Calculations ......................... 14-41, 16-11
ICU Level of Service .............................4-11
Ideal Saturated Flow Rate .......................5-4
Inhibit Max ...........................................8-13
Inside Radius ........................................7-21
Interacting with the Time-Space Diagram13-
9
Intersection
Deleting .............................................2-9 Moving ...............................................2-9
Intersection Capacity Utilization ...........4-11
Report ...................................4-11, 16-11
Intersection Delay ...................................4-9
Lag Phase ............................ 7-13, 8-8, 11-3
Lane Change
Default Distances ......................... 25-12
Lane Changes ....... 9-9, 22-12, 23-14, 25-8
Lane Choice .......... 9-9, 22-12, 23-14, 25-8Lane Group Flow .................................6-14
Lane Window ........................................ 5-1
Lane Window Data ............................. 22-4
Lanes
Coding .............................................. 5-2
Launch 3D .......................................... 26-7
Lead/Lag Phase ................... 7-13, 8-8, 11-3
Left Ped Factor ............................5-12, 5-13
Left Turn Sneakers ........................... 25-30
Length of Vehicle .12-2, 12-3, 14-72, 23-10,
25-12, 25-29
Lengths of Links .................................... 5-3
Level of Service
ICU ..................................................4-11
Intersections ...................................... 4-9 Limit of Links .......................................2-31
Link
Deleting ............................................ 2-8
Distances ........................................... 5-3
Lengths ........................................... 22-1
O-D Volumes 6-8, 6-10, 6-11, 22-8, 25-3
Link O-D Volumes ................................ 6-7
Link O-D Window ................................. 6-8
Loading Files ...................................... 21-1Lock Timings ......................................... 4-6
M
Making Presentations .......................... 21-4
Mandatory 2 Lane Distance .. 22-12, 25-10,
25-11, 25-12
Mandatory Distance22-12, 25-8, 25-10, 25-12
Map Builder .......................................27-3
M D t 22 1 22 2
Reporting ........................................ 24-3
N
Naming
Links ................................................. 5-3 Natural Cycle Length ............................. 4-8
NEMA .........................................4-13, 12-5
Network Measures of Effectiveness Report ...................................................... 16-22
Network MOEs ................................. 24-10
Network Settings.................................. 12-1
Node Number...............................4-2, 22-2
O
O i l P d i 8 14

7/21/2019 Synchro Studio 8 User Guide
http://slidepdf.com/reader/full/synchro-studio-8-user-guide 555/559
Map Data ................................... 22-1, 22-2
Map Settings ......2-6, 2-31, 21-4, 21-5, 24-4
Map Window ......................................... 2-1
Map Window Keyboard Commands .... 2-26
Maximum Gap ....................................... 8-9 Maximum Queue ..7-27, 13-13, 16-9, 24-11,
24-17
Maximum v/c Ratio ............................... 4-8
Measures of Effectiveness 7-21, 14-2, 14-13,
14-48, 16-3, 16-11, 24-2, 24-7, 24-16, 24-
17
Median Width ...................................... 7-19
Merge
Freeways .......................................... 2-28
Merging Files ....................................... 15-1
Mid-Block Traffic .................................. 6-7
Minimum Initial ..................................... 8-6
Minimum Split ................................ 7-9, 8-6
Moving
Intersection ....................................... 2-9 Multi-File Comparison Report .16-25, 16-26
Multiple Phases ...................................... 7-6
Multiple Runs
Recording .............................. 21-3, 23-6
Occasional Pedestrians ......................... 8-14
O-D Volumes ........................................ 6-7
Open ........................................... 20-2, 21-1
Optimizations ...................................... 14-1
With Multiple Zones ...................... 14-16 Optimize-Intersection Cycle Length ..... 14-7
Optimize-Intersection Offsets ............ 14-17
Optimize-Intersection Splits ................. 14-4
Optimize-Network Cycle Lengths ...... 14-11
Optimize-Network Offsets ................ 14-18
Optional Lane Changes .......... 25-13, 25-14
Outside Radius ..................................... 7-21
Over Capacity Modeling ..................... 14-38
Over-Capacity Cycle Length Optimization ........................................................ 14-8
Overlap
How to Code ................................... 7-30
P
Parking Adjustment ............................ 6-6 Partition Network ........................14-2, 14-9
Peak Hour Factor .................6-3, 11-6, 22-7
Pedestrian
Generation ...................................... 25-3
Walking Speed ..................................12-4
Pedestrian Calls .....................................8-11
Pedestrian Phase
Exclusive ..........................................7-18
Pedestrian Timing Requirements .........14-48 Pedestrians 6-2, 8-11, 8-15, 12-3, 20-1, 22-7,
22-11, 22-14, 25-3, 25-26, 25-27, 25-30
Penalty for Queuing .......................... 24-12
Percentile Adjust................................. 23-4
Percentile Delay
Compared to Webster’s Delay ........14-39
Percentile Delay Summary ..................14-39 Percentile Green Times .........................8-13
Percentile Scenarios ................................8-2
P f I d 14 7
Project Management .............................15-1
Properties
Intersection ....................................... 4-1
Protected and Permitted Phases 7-2, 7-5, 22-
8Protected Phases
Coding .............................................. 7-5
Q
Queue Delay ..............................7-25, 16-11
Queue Interactions .............................14-54
Queue Length Calculation .....................................14-70
Sample Calculation .........................14-72
Q L th 7 27

7/21/2019 Synchro Studio 8 User Guide
http://slidepdf.com/reader/full/synchro-studio-8-user-guide 556/559
Performance Index ...............................14-7
Permitted Left Turn Factors Report ....16-36
Permitted Phases
Coding ...............................................7-5
Phase Sequences ............................... 25-32Phase Templates .....................................7-2
Phases
Coding Multiple..................................7-6
Phasing Window .....................................8-1
Phasing Window Data ...................... 22-10
PHF ............................................. 6-3, 11-6
Planning a network for UTDF ..............17-3
Playback ............................................. 21-1
Playback-Time Box ........................... 21-2
Positioning Distance .... 22-12, 23-13, 25-8,
25-12
Precision in Traffic Analysis ..... 14-48, 14-50
Presentations ....................................... 21-4
Pretimed Signal Control ......................19-10
Pre-Timed Signal Operation ............. 25-29Print Window .................... 13-9, 21-7, 24-4
Printing Cycle Length Optimization Results .......................................................14-13
Printing Reports ...................................16-1
Queue Lengths .....................................7-27
Queues
Compared ..................................... 24-13
Quick Start ...........................................20-2
Timing Window ............................. 7-32R
Radius
For Roundabouts .............................7-21
Random Number Seed ........................ 23-5
Recall Mode ......................... 7-15, 8-9, 11-5
Recorded Interval ....................23-2, 24-6
Recording ........................................... 21-1
Relating the Time-Space Display to Delays
and Queues ....................................13-12
Reports ...................................... 16-1, 24-1
Printing ........ 5-3, 16-5, 16-6, 24-4, 24-5
Reverse Frame .................................... 21-2
Ride 3D Viewer .................................. 26-7
Right Ped Bike Factor ..................5-12, 5-13 Right Turn Channelized .................5-7, 7-19
Right Turn on Red .......................5-13, 12-3
Right Turns
Channelized .................................... 22-5
Ring and Barrier Designer ..... 22-10, 25-32
Roundabout 4-5, 15-6, 15-8, 20-1, 22-2, 25-
38
Roundabout Analysis .................. 7-21, 22-9
Roundabout Report ............................16-20 Route Assignment ............................... 25-2
RTOR ..........................................5-13, 12-3
HCM Compatibility ......................... 5-14
Saturation Flow Rate ....................... 5-15
Rules for Shared Lanes ........................... 5-2
Run Statistics ...................................... 24-6
S
Saturated Flow Rate ............................. 5-11
Saturated Link Modeling 14 38
Signal Transitions .................. 25-31, 25-33
SimPlay .....................................20-2, 21-1
SimTraffic
Modeling Defined ........................... 25-1
Multiple Windows Open ................ 21-5SimTraffic CI ...................................... 27-1
Operation ........................................ 27-5
Simulation Summary Report ...... 24-2, 24-5
Single Point Urban Interchange 14-41, 14-47
Slow Following ................................... 25-7
Sneakers ............................................ 25-30
Speed Link ................................................... 5-4
Turning ....................... 9-8, 19-17, 22-12
Speed Model 25 5

7/21/2019 Synchro Studio 8 User Guide
http://slidepdf.com/reader/full/synchro-studio-8-user-guide 557/559
Saturated Link Modeling .....................14-38
Saturation Flow
For Given Speeds .............23-16, 23-18
Saturation Flow Rate
RTOR ............................................. 5-15 Save-Part ............................................. 21-4
Save-Part of File ................................... 15-3
Scenario Manager ................................. 15-4
Scrolling .......................................2-18, 13-4
Seed Interval ....................................... 23-2
Seed Time
Setting ............................................. 23-3
Seeding ............................ 21-1, 23-5, 24-6
Select Report Windows ......16-2, 24-1, 24-4
Selecting Multiple Intersections .............. 4-2
Select-Intersection Button .................... 2-19
Settings
Map ................................................. 2-31
Setup SimTraffic CI ............................ 27-1
Shared Lane Rules .................................. 5-2 Shortcut Keys ...................................... 2-26
Show
Information on Map Window .......... 2-21
Signal Status Box ..............................21-8
Speed Model ....................................... 25-5
Speed Selection ................................... 25-4
Speed-Control ....................................21-2
Spillback ............................................ 14-54
Split Minimum .................................... 7-9, 8-6
Splits and Phasing Diagram .................. 7-16
Starvation ........................................... 14-54
Static Graphics .... 21-5, 21-6, 24-12, 24-16
Stop Calculations ............................... 14-75
Stopped Delay7-25, 14-47, 20-2, 24-8, 24-16
Stop-Simulation .................................21-2
Storage
Lanes ................................... 18-12, 22-5
Length .................................. 18-12, 22-5
Storage Lanes .................................. 5-6, 9-2
Storage Length ................................ 5-6, 9-2
Street Name ........................................... 5-3
Sub-network ........................................ 21-5
Summary of Optimization Commands . 14-3 SY7 File18-9, 20-2, 20-3, 21-1, 21-4, 22-7,
23-1, 23-3
Synchro

7/21/2019 Synchro Studio 8 User Guide
http://slidepdf.com/reader/full/synchro-studio-8-user-guide 558/559
Zone .................................................... 22-2
Zones
Using Multiple .................................. 4-3
Zones with Calculations and Optimizations .......................................................... 4-3
Zooming .............................................. 21-6
Zooming and Scrolling ......................... 2-18

7/21/2019 Synchro Studio 8 User Guide
http://slidepdf.com/reader/full/synchro-studio-8-user-guide 559/559