syddansk universitet fast-slow continuum and...
TRANSCRIPT
Syddansk Universitet
Fast-slow continuum and reproductive strategies structure plant life-history variationworldwide
Salguero-Gómez, Roberto; Jones, Owen; Jongejans, Eelke; Blomberg, Simon P; Hodgson,David J; Mbeau-Ache, Cyril; Zuidema, Pieter A; de Kroon, Hans; Buckley, Yvonne MPublished in:National Academy of Sciences. Proceedings
DOI:10.1073/pnas.1506215112
Publication date:2016
Document versionPeer reviewed version
Citation for pulished version (APA):Salguero-Gómez, R., Jones, O. R., Jongejans, E., Blomberg, S. P., Hodgson, D. J., Mbeau-Ache, C., ... Buckley,Y. M. (2016). Fast-slow continuum and reproductive strategies structure plant life-history variation worldwide.National Academy of Sciences. Proceedings, 113(1), 230-235. DOI: 10.1073/pnas.1506215112
General rightsCopyright and moral rights for the publications made accessible in the public portal are retained by the authors and/or other copyright ownersand it is a condition of accessing publications that users recognise and abide by the legal requirements associated with these rights.
• Users may download and print one copy of any publication from the public portal for the purpose of private study or research. • You may not further distribute the material or use it for any profit-making activity or commercial gain • You may freely distribute the URL identifying the publication in the public portal ?
Take down policyIf you believe that this document breaches copyright please contact us providing details, and we will remove access to the work immediatelyand investigate your claim.
Download date: 06. jun.. 2018
Fast–slow continuum and reproductive strategiesstructure plant life-history variation worldwideRoberto Salguero-Gómeza,b,1, Owen R. Jonesc,d, Eelke Jongejanse, Simon P. Blomberga, David J. Hodgsonf,Cyril Mbeau-Acheg, Pieter A. Zuidemah, Hans de Krooni,2, and Yvonne M. Buckleya,j,k,2
aSchool of Biological Sciences, Centre for Biodiversity and Conservation Science, The University of Queensland, St. Lucia QLD 4072, Australia; bEvolutionaryDemography Laboratory, Max Planck Institute for Demographic Research, Rostock 18057, Germany; cMax Planck Odense Center on the Biodemography ofAging, University of Southern Denmark, Odense M 5230, Denmark; dDepartment of Biology, University of Southern Denmark, Odense M 5230, Denmark;eDepartment of Animal Ecology and Physiology, Institute for Water andWetland Research, Radboud University, Nijmegen 6500 GL, The Netherlands; fCentre forEcology and Conservation, University of Exeter, Tremough TR10 9EZ, United Kingdom; gSchool of Biological Sciences, Plymouth University, Plymouth PL4 8AA,United Kingdom; hForest Ecology and Forest Management Group, Wageningen University, Wageningen 6700 AA, The Netherlands; iDepartment ofExperimental Plant Ecology, Institute for Water and Wetland Research, Radboud University, Nijmegen 6500 GL, The Netherlands; jSchool of Natural SciencesTrinity College Dublin, University of Dublin, Dublin 2, Ireland; and kTrinity Centre for Biodiversity Research, Zoology, Trinity College Dublin, University of Dublin,Dublin 2, Ireland
Edited by Tim Coulson, University of Oxford, Oxford, United Kingdom, and accepted by the Editorial Board November 8, 2015 (received for reviewMarch 29, 2015)
The identification of patterns in life-history strategies across thetree of life is essential to our prediction of population persistence,extinction, and diversification. Plants exhibit a wide range of patternsof longevity, growth, and reproduction, but the general determinantsof this enormous variation in life history are poorly understood. Weuse demographic data from 418 plant species in the wild, from annualherbs to supercentennial trees, to examine how growth form, habitat,and phylogenetic relationships structure plant life histories and todevelop a framework to predict population performance. We showthat 55% of the variation in plant life-history strategies is ade-quately characterized using two independent axes: the fast–slowcontinuum, including fast-growing, short-lived plant species at oneend and slow-growing, long-lived species at the other, and a repro-ductive strategy axis, with highly reproductive, iteroparous speciesat one extreme and poorly reproductive, semelparous plants withfrequent shrinkage at the other. Our findings remain consistentacross major habitats and are minimally affected by plant growthform and phylogenetic ancestry, suggesting that the relative inde-pendence of the fast–slow and reproduction strategy axes is generalin the plant kingdom. Our findings have similarities with how life-history strategies are structured in mammals, birds, and reptiles. Theposition of plant species populations in the 2D space produced byboth axes predicts their rate of recovery from disturbances andpopulation growth rate. This life-history framework may comple-ment trait-based frameworks on leaf and wood economics; to-gether these frameworks may allow prediction of responses ofplants to anthropogenic disturbances and changing environments.
life history strategy | iteroparity | generation time |matrix population model | phylogenetic signal
Demographic schedules of survival, growth, and reproduction,which comprise life-history strategies, are fundamental to
our understanding of a range of ecological and evolutionaryprocesses, such as invasions and local extinctions (1–3), com-munity structure (4, 5), and species diversification (6, 7). Con-sequently, the development and careful testing of theory on howorganisms allocate resources to survival, growth, and reproductionare important goals for evolutionary biology, ecology, and conser-vation biology (8). Indeed, calls for the development of a “periodictable” to classify species based on their life-history strategies and topredict population dynamics and community composition go backto the early development of evolutionary biology as a discipline (9).A main axiom of life-history theory is that trade-offs (i.e., bud-
getary compromises) between different aspects of an organism’sdemographic schedules, such as survival, growth, and/or re-production, constrain and optimize the range of possible life-history strategies that can evolve across the tree of life (10, 11).However, the plant kingdom encompasses a vast amount of life-
history variation; plant longevity, for instance, ranges from weeksto millennia (12). Many plant species’ life cycles include crypticlife stages such as seedbanks (13) or dormant adults (similar toanimal hibernation) (14). Reproduction also can be highly vari-able among plants, with seed mass and per-capita seed pro-duction ranging across six orders of magnitude (15). Previousclassifications of plant life-history strategies have been limited ingeographic (16, 17), taxonomic, and phylogenetic scales (17) andin the ability to differentiate life-history trade-offs (17–19).Here we propose an approach analogous to that developed
decades ago for vertebrates (20) to study the drivers behind plantlife-history variation. We combine demographic, phylogenetic, andecological data from natural populations of 418 plant speciesworldwide (Fig. 1) to address the following questions: (i) What arethe main axes of variation of plant life-history strategies? (ii) Towhat extent do phylogenetic ancestry, habitat, growth form, andsize constrain plant life-history variation? We then test whetherthe position of a species on these axes predicts two importantmetrics of population performance: population growth rate andspeed of recovery from disturbances. If clear patterns emerge, theymay form the basis for a satisfactory classification and predictive
Significance
Schedules of survival, growth, and reproduction define life-history strategies across species. Understanding how life-historystrategies are structured is fundamental to our understandingof the evolution, abundance, and distribution of species. Wefound that life-history strategies of 418 plant species worldwideare explained by an axis representing the pace of life and anotherrepresenting the wide range of reproductive strategies. Thisframework predicts responses to perturbations and long-termpopulation performance, showing great promise as a predictivetool for plant population responses to environmental change.
Author contributions: R.S.-G., E.J., H.d.K., and Y.M.B. designed research; R.S.-G. performedresearch; R.S.-G., O.R.J., S.P.B., D.J.H., C.M.-A., and P.A.Z. contributed new reagents/analytictools; R.S.-G. analyzed data; R.S.-G. digitized and supervised digitalization of data; andR.S.-G. wrote the paper.
The authors declare no conflict of interest.
This article is a PNAS Direct Submission. T.C. is a guest editor invited by the EditorialBoard.
Freely available online through the PNAS open access option.
Data deposition: The data reported in this paper have been deposited in the COMPADREPlant Matrix Database, www.compadre-db.org (accession no. 3.0.0).1To whom correspondence should be addressed. Email: [email protected]. and Y.M.B. contributed equally to this work.
This article contains supporting information online at www.pnas.org/lookup/suppl/doi:10.1073/pnas.1506215112/-/DCSupplemental.
230–235 | PNAS | January 5, 2016 | vol. 113 | no. 1 www.pnas.org/cgi/doi/10.1073/pnas.1506215112
framework of plant responses to the changing environment and forcross-taxonomic comparisons.We use the COMPADRE Plant Matrix Database (21) to ad-
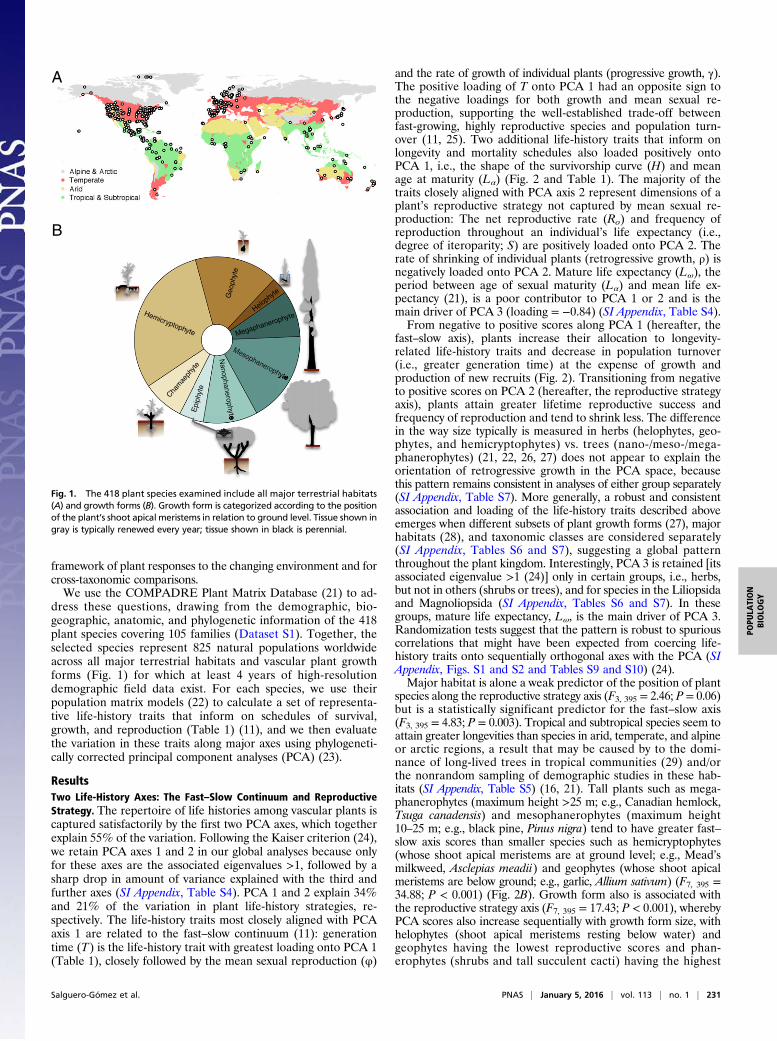
dress these questions, drawing from the demographic, bio-geographic, anatomic, and phylogenetic information of the 418plant species covering 105 families (Dataset S1). Together, theselected species represent 825 natural populations worldwideacross all major terrestrial habitats and vascular plant growthforms (Fig. 1) for which at least 4 years of high-resolutiondemographic field data exist. For each species, we use theirpopulation matrix models (22) to calculate a set of representa-tive life-history traits that inform on schedules of survival,growth, and reproduction (Table 1) (11), and we then evaluatethe variation in these traits along major axes using phylogeneti-cally corrected principal component analyses (PCA) (23).
ResultsTwo Life-History Axes: The Fast–Slow Continuum and ReproductiveStrategy. The repertoire of life histories among vascular plants iscaptured satisfactorily by the first two PCA axes, which togetherexplain 55% of the variation. Following the Kaiser criterion (24),we retain PCA axes 1 and 2 in our global analyses because onlyfor these axes are the associated eigenvalues >1, followed by asharp drop in amount of variance explained with the third andfurther axes (SI Appendix, Table S4). PCA 1 and 2 explain 34%and 21% of the variation in plant life-history strategies, re-spectively. The life-history traits most closely aligned with PCAaxis 1 are related to the fast–slow continuum (11): generationtime (T) is the life-history trait with greatest loading onto PCA 1(Table 1), closely followed by the mean sexual reproduction (φ)
and the rate of growth of individual plants (progressive growth, γ).The positive loading of T onto PCA 1 had an opposite sign tothe negative loadings for both growth and mean sexual re-production, supporting the well-established trade-off betweenfast-growing, highly reproductive species and population turn-over (11, 25). Two additional life-history traits that inform onlongevity and mortality schedules also loaded positively ontoPCA 1, i.e., the shape of the survivorship curve (H) and meanage at maturity (Lα) (Fig. 2 and Table 1). The majority of thetraits closely aligned with PCA axis 2 represent dimensions of aplant’s reproductive strategy not captured by mean sexual re-production: The net reproductive rate (Ro) and frequency ofreproduction throughout an individual’s life expectancy (i.e.,degree of iteroparity; S) are positively loaded onto PCA 2. Therate of shrinking of individual plants (retrogressive growth, ρ) isnegatively loaded onto PCA 2. Mature life expectancy (Lω), theperiod between age of sexual maturity (Lα) and mean life ex-pectancy (21), is a poor contributor to PCA 1 or 2 and is themain driver of PCA 3 (loading = −0.84) (SI Appendix, Table S4).From negative to positive scores along PCA 1 (hereafter, the
fast–slow axis), plants increase their allocation to longevity-related life-history traits and decrease in population turnover(i.e., greater generation time) at the expense of growth andproduction of new recruits (Fig. 2). Transitioning from negativeto positive scores on PCA 2 (hereafter, the reproductive strategyaxis), plants attain greater lifetime reproductive success andfrequency of reproduction and tend to shrink less. The differencein the way size typically is measured in herbs (helophytes, geo-phytes, and hemicryptophytes) vs. trees (nano-/meso-/mega-phanerophytes) (21, 22, 26, 27) does not appear to explain theorientation of retrogressive growth in the PCA space, becausethis pattern remains consistent in analyses of either group separately(SI Appendix, Table S7). More generally, a robust and consistentassociation and loading of the life-history traits described aboveemerges when different subsets of plant growth forms (27), majorhabitats (28), and taxonomic classes are considered separately(SI Appendix, Tables S6 and S7), suggesting a global patternthroughout the plant kingdom. Interestingly, PCA 3 is retained [itsassociated eigenvalue >1 (24)] only in certain groups, i.e., herbs,but not in others (shrubs or trees), and for species in the Liliopsidaand Magnoliopsida (SI Appendix, Tables S6 and S7). In thesegroups, mature life expectancy, Lω, is the main driver of PCA 3.Randomization tests suggest that the pattern is robust to spuriouscorrelations that might have been expected from coercing life-history traits onto sequentially orthogonal axes with the PCA (SIAppendix, Figs. S1 and S2 and Tables S9 and S10) (24).Major habitat is alone a weak predictor of the position of plant
species along the reproductive strategy axis (F3, 395 = 2.46; P = 0.06)but is a statistically significant predictor for the fast–slow axis(F3, 395 = 4.83; P = 0.003). Tropical and subtropical species seem toattain greater longevities than species in arid, temperate, and alpineor arctic regions, a result that may be caused by to the domi-nance of long-lived trees in tropical communities (29) and/orthe nonrandom sampling of demographic studies in these hab-itats (SI Appendix, Table S5) (16, 21). Tall plants such as mega-phanerophytes (maximum height >25 m; e.g., Canadian hemlock,Tsuga canadensis) and mesophanerophytes (maximum height10–25 m; e.g., black pine, Pinus nigra) tend to have greater fast–slow axis scores than smaller species such as hemicryptophytes(whose shoot apical meristems are at ground level; e.g., Mead’smilkweed, Asclepias meadii) and geophytes (whose shoot apicalmeristems are below ground; e.g., garlic, Allium sativum) (F7, 395 =34.88; P < 0.001) (Fig. 2B). Growth form also is associated withthe reproductive strategy axis (F7, 395 = 17.43; P < 0.001), wherebyPCA scores also increase sequentially with growth form size, withhelophytes (shoot apical meristems resting below water) andgeophytes having the lowest reproductive scores and phan-erophytes (shrubs and tall succulent cacti) having the highest
A
B
Fig. 1. The 418 plant species examined include all major terrestrial habitats(A) and growth forms (B). Growth form is categorized according to the positionof the plant’s shoot apical meristems in relation to ground level. Tissue shown ingray is typically renewed every year; tissue shown in black is perennial.
Salguero-Gómez et al. PNAS | January 5, 2016 | vol. 113 | no. 1 | 231
POPU
LATION
BIOLO
GY
reproduction scores (Fig. 2B). Epiphytes (species growing uponother plants; e.g., forest babyboot orchid, Lepanthes rubripetala)do not differ from the other herbs in their reproductive strategyaxis scores.Phylogenetic relationships play a rather weak role in explaining
the repertoire of life-history strategies. In our analysis, Pagel’s λ, ascaling parameter for the correlation in traits between speciesranging from 0 (no correlation) to 1 (the correlation expectedunder Brownian motion) (30) is 0.20 ± 0.09 (95% confidenceinterval), suggesting a rather minor role of overall phylogeneticancestry in our analyses. However, some exceptions exist: Speciesin the Magnoliopsida have lower fast–slow scores (shorter lives,higher growth) than Cycadophyta and Pinopsida. The phyloge-netic signal of species within the same taxonomic class (Liliop-sida: 0.18 ± 0.02, Magnoliopsida: 0.20 ± 0.04) is greater thanthose grouped by growth forms (herbs: 0.03, shrubs: 0.00, or trees:0.00) (SI Appendix, Table S8), implying some infra-class struc-turing of life-history strategies.
Life-History Strategies May Overlap Regardless of Plant Growth Formand Size. Although Raunkiær’s growth forms (27) take somewhatdifferent positions along the fast–slow axis and reproductivestrategy axis, the overlap is considerable, so that species with dif-ferent growth forms may occupy the same life-history space. Sim-ilar survival, growth, and reproduction schedules can be realizedthrough different anatomic structures. For example, shorter-livedtrees and shrubs (such as Cecropia obtusifolia and Acer saccharum)(Fig. 2B) occupy a life-history space on the fast–slow axis thatoverlaps with herbaceous perennials (particularly helophytes, geo-phytes, and epiphytes) (Fig. 2B). The life-history strategies of herbsrange from short-lived ephemerals to the tree-like lifestyles of thecushion pink (Silene acaulis) or thyme (Thymus vulgaris).The amount of variation shown on the reproductive strategy
axis for herbs and trees is similar. Both groups display a similarrange of life histories in the timing and frequency of reproduction
(iteroparity) and lifetime reproductive potential, regardless of theirposition on the fast–slow axis (Fig. 2). For example, the reproductivestrategy axis values of short-lived herbs, such as goldenrod (Solidagomollis) or scarlet monkeyflower (Mimulus cardinalis) are similar tothose of woody species such as black pine, scotch broom (Cytisusscoparius), or hoop pine (Araucaria cunninghamii).In contrast to comparative animal demography (11, 25), a uni-
form measure of “body size” does not exist for plants across theplant kingdom. Therefore we have presented the results (Fig. 2and Table 1) without allometric scaling. However, Raunkiærgrowth forms clearly differ in size, among other crucial functionalattributes. By using Raunkiær growth form height thresholds, wehave attempted to include size more explicitly in the analyses (SIAppendix, Fig. S4 and Tables S1, S12, and S13). When life-historytraits are rescaled by plant height, the results do not changequalitatively. The amount of variation explained by PCA 1(32.99%) and PCA 2 (19.73%), which also corresponds to thefast–slow continuum and to reproductive strategies, respectively,adds ca. 53%. This result suggests either that plant size does nothave a strong effect in the structuring of plant life histories or thatusing Raunkiær growth form height thresholds as our proxy ofplant size is not accurate enough. Compared with the results withno allometric scaling (Fig. 2 and Table 1), the phylogenetic signalis completely lost (Pagel’s λ = 0.00), likely because Raunkiær’sgrowth forms are phylogenetically conserved in our data (λ = 0.96 ±0.02, P < 0.001).
Two Orthogonal Axes to Predict Population Performance. The fast–slow/reproductive strategy framework predicts population per-formance, including both short-term response to perturbation andlong-term asymptotic dynamics (Fig. 3). Although many metrics ofshort-term (transient) dynamics are available (31, 32), we use thedamping ratio here to illustrate the predictive capacity of our life-history framework. The damping ratio can be thought of as the rateat which transient responses to disturbance fade away or as the rate
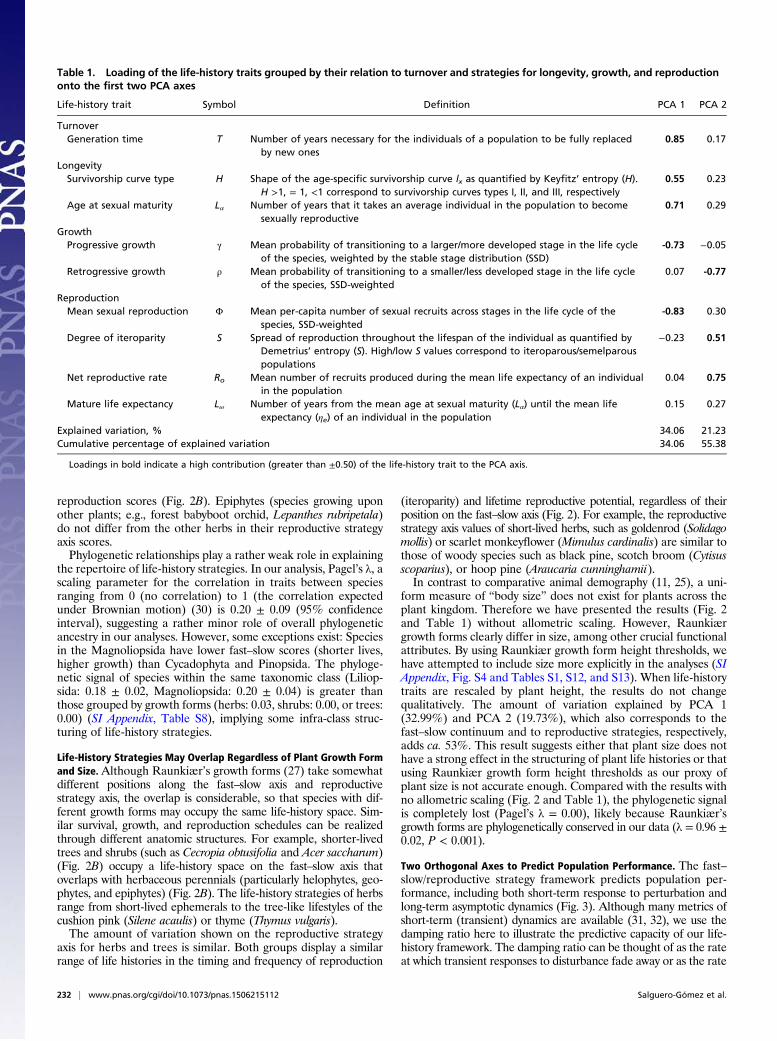
Table 1. Loading of the life-history traits grouped by their relation to turnover and strategies for longevity, growth, and reproductiononto the first two PCA axes
Life-history trait Symbol Definition PCA 1 PCA 2
TurnoverGeneration time T Number of years necessary for the individuals of a population to be fully replaced
by new ones0.85 0.17
LongevitySurvivorship curve type H Shape of the age-specific survivorship curve lx as quantified by Keyfitz’ entropy (H).
H >1, = 1, <1 correspond to survivorship curves types I, II, and III, respectively0.55 0.23
Age at sexual maturity Lα Number of years that it takes an average individual in the population to becomesexually reproductive
0.71 0.29
GrowthProgressive growth γ Mean probability of transitioning to a larger/more developed stage in the life cycle
of the species, weighted by the stable stage distribution (SSD)-0.73 −0.05
Retrogressive growth ρ Mean probability of transitioning to a smaller/less developed stage in the life cycleof the species, SSD-weighted
0.07 -0.77
ReproductionMean sexual reproduction Φ Mean per-capita number of sexual recruits across stages in the life cycle of the
species, SSD-weighted-0.83 0.30
Degree of iteroparity S Spread of reproduction throughout the lifespan of the individual as quantified byDemetrius’ entropy (S). High/low S values correspond to iteroparous/semelparouspopulations
−0.23 0.51
Net reproductive rate Ro Mean number of recruits produced during the mean life expectancy of an individualin the population
0.04 0.75
Mature life expectancy Lω Number of years from the mean age at sexual maturity (Lα) until the mean lifeexpectancy (ηe) of an individual in the population
0.15 0.27
Explained variation, % 34.06 21.23Cumulative percentage of explained variation 34.06 55.38
Loadings in bold indicate a high contribution (greater than ±0.50) of the life-history trait to the PCA axis.
232 | www.pnas.org/cgi/doi/10.1073/pnas.1506215112 Salguero-Gómez et al.

of recovery from asymptotic dynamics (22). A species’ rate of re-covery is associated with its scores on the fast–slow (F1, 384 = 96.99,P < 0.001) and the reproductive strategy axis (F1, 384 = 53.3, P <0.001). Natural populations with faster recovery are found at theupper left and bottom of Fig. 3A, suggesting that rapid recoverycan be attained via a strategy of fast growth, high reproduction, andshort generation time or, alternatively via a strategy of low re-production and frequent shrinkage (33). Asymptotic populationgrowth rates [r = log(λ)] are strongly differentiated along both axes(fast–slow axis: F1, 374 = 145.79, P < 0.001; reproductive strategyaxis: F1, 374 = 177.80, P < 0.001), with high population growth ratesfor fast-growing (γ), iteroparous, highly reproductive species (Φ,R0) (Fig. 3B). Lower population growth rates are typical of speciesthat delay maturity (Lα), have low senescence rates as described bytheir survivorship curve (H), and/or undergo frequent shrinkage (ρ).
DiscussionQuantifying Life-History Strategies. The diversity of growth forms,functions, and ecological roles of species have long puzzled bi-ologists. A key question has been whether there are key combi-nations of survival, growth, and reproduction strategies that canexist only in certain habitats but not in others (9) or whethernature is a random assemblage of traits (34). To address thesequestions, several frameworks have been developed that aim toclassify and predict species’ responses to biotic and abiotic agents(9). Perhaps the most widely acknowledged framework in thisrespect is the fast–slow continuum (11), which states that, be-cause trade-offs between reproduction and survival are perva-sive, the repertoire of life-history strategies are constrained andthus can be described accurately along a single axis with highallocation to reproduction on one end and high allocation tosurvival on the other. Although the fast–slow continuum hasreceived substantial empirical support, explaining 60–80% of thevariation among mammals (25, 35, 36), birds (37), and reptiles(38), analyses going back over 30 years also have pointed out theexistence of a secondary axis related to reproductive strategies.For instance, Stearns (20) found that although 68–75% of thecovariation in life-history traits of 162 mammals is explained bythe first axis, corresponding to the fast–slow continuum, an im-portant second axis describing a continuum from altricial toprecocial species explains an additional 12–20%. Gaillard et al.(39) found for 80 mammals and 114 birds that 74–85% of vari-ation is explained by the fast–slow axis but that a second impor-tant axis related to iteroparity absorbs 5–15% of the variation.The results of our global analysis of more than 400 plant
species are qualitatively similar to these studies in vertebrates(20, 35–40) albeit suggesting a greater relative importance ofthe reproductive strategy axis. We find two independent axes oflife-history variation in plants, one corresponding to the fast–slow continuum and another to characteristics of reproductivestrategy not captured by mean sexual reproduction. When weaccount for the potential allometric effects of size in these re-lationships, the percentage of variation explained decreased onlyminimally (1.1% for PCA 1, and 1.6% for PCA 2), and the phylo-genetic signal remained low. In contrast to analogous comparativeapproaches for animals (20, 39, 40), we find very little phyloge-netic signal in our results, nor do we find indications that adultsize has a structurally important role.Typically around 80% of the variation in animal life-history
strategies can be captured with two axes, but here we captured justover 50% of the observed variation. The reason for this differencemight be that plants typically are characterized by more complexlife cycles than vertebrates. For instance, plants often have dormantstages (14) and long-term seedbanks (13); animals usually do not.Furthermore, in contrast to many of the species considered in theseanimal-based studies, all plants are indeterminate growers (41) inwhich cellular fate is not determined early in life, so the allo-cation of meristems to survival (e.g., wood), growth (leaf), or
A
B
Fig. 2. Life-history variation in vascular plants is characterized by life-historytraits associated with the fast–slow continuum and reproductive strategies.Shown are phylogenetically corrected PCA of life-history traits in Table 1 withpopulation turnover (black arrows) and traits related to longevity (gray),growth (dark blue), and reproduction (red). Arrow length indicates the load-ing of each life-history trait onto PCA axes. Points represent the position ofspecies along the PCA 1 and 2 and are color-coded per major habitat (A) andRaunkiær’s growth form (B). Box-and-whisker plots on the top and right ofeach panel represent median (thick bar), upper and lower quartiles (edgesof rectangle), and maximum and minimum (outer bars) excluding outliers(empty circles; >2/3 of the absolute value of the quartile) of PCAs 1 and 2.The differences between groups marked with different letters display statisti-cally significant differences.
Salguero-Gómez et al. PNAS | January 5, 2016 | vol. 113 | no. 1 | 233
POPU
LATION
BIOLO
GY

reproduction (flower), as well as overall plant size, can be adjustedcontinuously. This totipotency has resulted in strategies such asresource-dependent sex-switching (42) and the rejuvenatingabilities of some trees (43, 44). Furthermore, all vascular plantsare modular constructions based on the repetition of basic units(45–47), enabling some plants to shrink in adverse conditions (33,47) or to reproduce clonally (48). We find that retrogressivegrowth (shrinkage) correlates negatively with reproductive traits,in agreement with the frequent increase in reproductive outputwith plant size (41). However, these complex life-history traitsare not exclusive to the plant kingdom; many animals experiencedormancy [i.e., hibernation (49), diapause (50), estivation (51),or brumation (52)], clonal reproduction (53), organ/tissue re-generation (54), or modular growth forms [e.g., corals (55)].Demographic comparative analyses including complex life-his-tory traits across both plant and animal kingdoms will help de-termine whether, and for which taxa, multiple axes are needed tocapture interspecific patterns of life-history variation.
Life-History Analyses and Population Performance. The life-historytraits analyzed here are derived from natural populations ex-amined in the field, and these studies therefore capture pop-ulation performance as a product of life-history strategy and theparticular a/biotic conditions experienced by that populationover the course of the study. Clearly, no species can persist in-definitely with populations operating at a population growth ratelog(λ) <0. Furthermore, some areas of life-history space remainunfilled; in the 418 plant species of our dataset there are nospecies with low scores on both the fast–slow axis and the re-productive strategy axis (Fig. 3B, Lower Left), or with high fast–slow scores but low reproductive strategy scores (Fig. 3B, LowerRight), suggesting that such combinations of life-history traitsare unviable. Interestingly, we have found species with highscores on both axes (Fig. 3B, Upper Right). Rather than defyingbasic life-history trade-offs, these species likely represent verysuccessful cases of expanding populations. Several of these spe-cies correspond to invasive plants such as black pine in NewZealand (56) and scotch broom in Australia (57). The re-productive strategy axis includes populations of invasive speciesat the top, where the population growth rate log(λ) >>0 (Fig.3B), and endangered species such as the fragrant prickly apple(Harrisia fragrans) or Mead’s milkweed (Asclepias meadii) at thelow end (Fig. 2B). Given the restricted spatial replication ofplant demographic studies (21), we are unable to discern howmuch the values on the reproductive strategy axis and low pop-ulation growth rates are driven by habitat quality or other con-ditions favoring population growth, and this question remains a
promising avenue of research. Also, future steps in the applica-bility of this framework need to focus on the classification ofendangered and invasive species along this axis and to take ad-vantage of open access resources (15, 58) to discern the role ofpropagule quantity vs. quality [e.g., seed mass (59)] in structuringthe reproduction strategy axis.Population responses to future environmental change and an-
thropogenic disturbances depend on the species-specific life-historystrategy (60, 61). Our analyses reveal that populations from evendistantly related plant taxa worldwide can have similar combina-tions of life-history traits, with a modest influence of habitat andgrowth form. Therefore, the framework of life histories presentedhere is a necessary addition to current plant trait-based conceptssuch as the leaf (62) and wood (63) economics spectra, becausetraits can be considered truly functional only if they affect thecritical fitness components of reproduction and survival (64). Thisframework, based on the fast–slow continuum and reproductivestrategies, presents strong empirical support for the expansion ofclassical quantification and classifications of life-history strategiesof animals well into the plant kingdom. Furthermore, it provides asound basis for future work untangling the associations in plant andanimal functional traits with demographic processes and amongphysiological and life-history trade-offs.
Materials and MethodsCOMPADRE. We used the COMPADRE Plant Matrix Database (21) to obtaindemographic, biogeographic, and growth form data from an initial list ofmore than 1,000 plant species. The demographic data therein are compiledas state-structured population models that incorporate accurate informationon the rates of survival, growth, and reproduction from natural populationsin which individuals are typically classified by stage and/or size (22). We onlyconsidered whole individual (genetic) demography and omitted studies thattreated different parts of the genetic individual as independent units (ra-mets). Nonnatural vegetation types such as forestry plantations and cropfields were not included. We chose only size-based matrices or ontogeny-based models in which higher stages of development also would correspondto larger sizes. With these and other strict selection criteria used to allowcomparative analyses (SI Appendix, section 1.1 and Table S1), we narrowedour initial list to 418 plant species. For each of these species, we calculatedthe arithmetic element-by-element mean of all available matrices undernonmanipulated conditions, resulting in a single matrix that summarizes thepopulation dynamics of that species under natural conditions.
Phylogeny.We constructed a species-level phylogenetic tree [www.onezoom.org/FWifhj38wjf/Salguero-Gomez_et_al_2014.htm (65)] with branch length trans-formations to account for phylogenetic signal, estimated by Pagel’s λ (30).See SI Appendix, section 2 for details.
Analysis. From each species’ matrix population model, we derived nine life-history traits commonly used in comparative analyses grouped a prioriaccording to their quantification of the timing and magnitude of turnover,longevity, growth, and reproduction (11, 16, 22, 35–40, 67). We calculatedthese with methods described in detail elsewhere (22) and in SI Appendix,section 2, Table S2. The life-history traits broadly correspond to overallpopulation turnover (T), longevity (H and Lα), growth (γ and ρ), and re-production (φ, S, Ro, Lω) (Table 1). Life-history traits were log-transformed tofulfill normality assumptions in posterior analyses. Life-history traits werescaled to mean = 0 and SD = 1 for PCA (24). We then carried out a phylo-genetically informed PCA (23, 66) on these life-history traits to determine theprimary axes of demographic variation while simultaneously assessing non-independence of lineages. We used the Kaiser criterion (23) after optimiza-tion through varimax rotations to determine the number of axes necessary toexplain a substantial amount of variation. To explore the role and possibleinteractions of growth form, matrix dimension (68), and habitat, we used athree-way ANOVA followed by post hoc Tukey’s honestly significant differ-ence tests on the phylogenetically informed PCA scores of the species. Themajor habitat classification (28) informs on the abiotic conditions to whichpopulations are exposed, and the growth form information describes po-tential anatomical constraints. We used Raunkiær’s growth form classification(27), indicating the distance of the plant’s shoot apical meristems from theground. Matrix dimension was positively correlated with PCA 1 (t417 = 85.51,P < 0.001, R2 = 16.85%) and PCA 2 (t417 = 17.72, P < 0.001, R2 = 3.85%).
A B
Fig. 3. A species’ score on the fast–slow continuum and its reproductionstrategy predict population performance including damping ratio (i.e., therate at which a population returns to equilibrium after disturbance) (A) andthe population growth rate (r = log(λ) (i.e., the rate of population sizechange through time) (B). Redder tones indicate a higher value of thesemetrics. Bluer colors of r reflect population decline. The damping ratio wasquantified for 389 species.
234 | www.pnas.org/cgi/doi/10.1073/pnas.1506215112 Salguero-Gómez et al.
However, this effect was driven by the fact that long-lived trees achievelarger sizes (29) and thus require larger matrices to accommodate theirdynamics: the ordered ranks of Raunkiær growth forms successfully pre-dicted PCA scores on both PCA 1 (F7, 410 = 34.40, P < 0.001, R2 = 35.93%) andPCA 2 (F7, 410 = 12.13, P < 0.001, R2 = 15.74%) (SI Appendix, Table S5). Wechecked the consistency of our results by rerunning the analyses on subsetsof the data: by plant type (herbaceous perennials, shrubs, and trees),major habitat (temperate, tropical, and subtropical), and taxonomic class(Pinopsida, Liliopsida, Magnoliopsida); other subsets and levels were nottested because of the large data requirements for model convergence. Wealso tested the robustness of the results to spurious correlations using
randomization tests. Finally, to test the usefulness of the suggestedframework for plant species classification, we derived the damping ratio[the rate at which populations recover from disturbance (22, 31)] and therate of change of the population (22) [r = log(λ)] via two-way ANOVAs withPCA 1 and 2 scores as explanatory variables.
ACKNOWLEDGMENTS. M. Franco provided the phylogenetic tree. We thankH. Possingham, D. Koons, and F. Colchero for feedback and the COMPADREPlant Matrix Database team for data digitalization and error-checking. Thiswork was supported by the Max Planck Institute for Demographic Research,Australian Research Council Grant DE140100505 (to R.S.-G.), and a Marie-CurieCareer Integration Grant (to Y.M.B.).
1. Morris WF, Doak DF (2002) Quantitative Conservation Biology: Theory and Practice ofPopulation Viability Analysis (Sinauer Associates, Sunderland, MA).
2. Silvertown J, Miguel F, Menges E (1996) Interpretation of elasticity matrices as an aid tothe management of plant populations for conservation. Conserv Biol 10(2):591–597.
3. Jongejans E, de Vere N, de Kroon H (2008) Demographic vulnerability of the clonaland endangered meadow thistle. Plant Ecol 198(2):225–240.
4. Svenning JC, Kinner DA, Stallard RF, Engelbrecht BMJ, Wright SJ (2004) Ecologicaldeterminism in plant community structure across a tropical forest landscape. Ecology85(9):2526–2538.
5. West GB, Enquist BJ, Brown JH (2009) A general quantitative theory of forest struc-ture and dynamics. Proc Natl Acad Sci USA 106(17):7040–7045.
6. Chesson P (2000) Mechanisms of maintenance of species diversity. Annu Rev Ecol Syst31(1):343–366.
7. Blair C, Heckman KL, Russell AL, Yoder AD (2014) Multilocus coalescent analyses revealthe demographic history and speciation patterns of mouse lemur sister species. BMCEvol Biol 14(1):57.
8. Metcalf CJE, Pavard S (2007) Why evolutionary biologists should be demographers.Trends Ecol Evol 22(4):205–212.
9. Southwood TRE (1988) Tactics, strategies and templets. Oikos 52(1):3–18.10. Lande R (1982) A quantitative genetic theory of life history evolution. Ecology 63(3):
607–615.11. Stearns SC (1999) The Evolution of Life Histories (Oxford Univ Press, New York), p 249.12. Peñuelas J, Munné-Bosch S (2010) Potentially immortal? New Phytol 187(3):564–567.13. Baskin CC, Baskin JM (2001) Seeds. Ecology, Biogeography, and Evolution of Dormancy
and Germination (Academic, San Diego, CA), p 667.14. Shefferson RP (2009) The evolutionary ecology of vegetative dormancy in mature
herbaceous perennial plants. J Ecol 97(5):1000–1009.15. Kattge J, et al. (2011) TRY - a global database of plant traits. Glob Change Biol 17(9):
2905–2935.16. Franco M, Silvertown J (1990) Plant demography: What do we know. Evolutionary
Trends in Plants 4(2):74–76.17. Franco M, Silvertown J (1997) Life History Variation in Plants: An Exploration of
the Fast-Slow Continuum Hypothesis (Cambridge Univ Press, Cambridge, UK), pp210–227.
18. Shea K, Rees M, Simon NW (1994) Trade-offs, elasticities and the comparativemethod. J Ecol 82(4):951–957.
19. Franco M, Silvertown J (1994) On trade-offs, elasticities and the comparative method:A reply to Shea, Rees and Wood. J Ecol 82(4):958.
20. Stearns SC (1983) The influence of size and phylogeny on paterns of covariationamong life-history traits in the mammals. Oikos 41(2):173–187.
21. Salguero-Gómez R, et al. (2015) The COMPADRE Plant Matrix Database: An openonline repository for plant demography. J Ecol 103(1):202–208.
22. Caswell H (2001) Matrix Population Models: Construction, Analysis, and Interpretation(Sinauer Associates, Inc.) 2nd Ed.
23. Revell LJ (2013) R package phytools Available at blog.phytools.org. AccessedMarch 1, 2015.24. Legendre P, Legendre L (2012) Numerical Ecology (Elsevier, London), 3rd Ed, p 1006.25. Gaillard JM, et al. (2005) Generation time: A reliable metric to measure life-history
variation among mammalian populations. Am Nat 166(1):119–123, discussion 124–128.26. Crone EE, et al. (2011) How do plant ecologists use matrix population models? Ecol
Lett 14(1):1119–1126.27. Raunkiær C (1934) The Life Forms of Plants and Statistical Plant Geography (Clar-
endon, Oxford, UK).28. Olson DM, et al. (2001) Terrestrial ecoregions of the worlds: A new map of life on
Earth. Bioscience 51(11):933–938.29. Moles AT, et al. (2009) Global patterns in plant height. J Ecol 97(5):923–932.30. Freckleton RP, Harvey PH, Pagel M (2002) Phylogenetic analysis and comparative data:
A test and review of evidence. Am Nat 160(6):712–726.31. Stott I, Franco M, Carslake D, Townley S, Hodgson D (2010) Boom or burst? A com-
parative analysis of transient population dynamics in plants. J Ecol 98(2):302–311.32. Gamelon M, et al. (2014) Influence of life-history tactics on transient dynamics: A
comparative analysis across mammalian populations. Am Nat 184(5):673–683.33. Salguero-Gómez R, Casper BB (2010) Keeping plant shrinkage in the demographic
loop. J Ecol 98(2):312–323.34. Hubbell SP (2001) The Unified Neutral Theory of Biodiversity and Biogeography
(Princeton Univ Press, Princeton, NJ).35. Oli MK (2004) The fast-slow continuum and mammalian life-history patterns: An
empirical evaluation. Basic Appl Ecol 5(5):449–463.
36. Bielby J, et al. (2007) The fast-slow continuum in mammalian life history: An empiricalreevaluation. Am Nat 169(6):748–757.
37. Sæther BE (1987) The influence of body weight on the covariation between re-productive traits in European birds. Oikos 48(1):79–88.
38. Bauwens D, Diaz-Uriarte R (1997) Covariation of life-history traits in lacertid lizards: Acomparative study. Am Nat 149(1):91–111.
39. Gaillard JM, et al. (1989) An analysis of demographic tactics in birds and mammals.Oikos 56(1):59–76.
40. Western D (1979) Size, life history and ecology in mammals. Afr J Ecol 17(4):185–204.41. Harper JL, White J (1974) The demography of plants. Annu Rev Ecol Syst 5:419–463.42. Bierzychudek P (1982) The demography of Jack-in-the-pulpit, a forest perennial that
changes sex. Ecol Monogr 52(4):335–351.43. Del Tredici P (1999) Aging and rejuvenation in trees. Arnoldia (Winter):11–16.44. Chen YT, et al. (2013) Small RNAs of Sequoia sempervirens during rejuvenation and
phase change. Plant Biol (Stuttg) 15(1):27–36.45. Watkinson AR, White J (1986) Some life-history consequences of modular construc-
tion in plants. Philos Trans R Soc Lond B Biol Sci 313(1159):31–51.46. Espino S, Schenk HJ (2009) Hydraulically integrated or modular? Comparing whole-
plant-level hydraulic systems between two desert shrub species with different growthforms. New Phytol 183(1):142–152.
47. Salguero-Gómez R, Casper BB (2011) A hydraulic explanation for size-specific plantshrinkage: Developmental hydraulic sectoriality. New Phytol 189(1):229–240.
48. de Kroon H, van Groenendael J (1997) The Ecology and Evolution of Clonal Growth inPlants (Backhuys Publishers, Leiden, The Netherlands).
49. Tøien Ø, et al. (2011) Hibernation in black bears: Independence of metabolic sup-pression from body temperature. Science 331(6019):906–909.
50. Sandrelli F, et al. (2007) A molecular basis for natural selection at the timeless locus inDrosophila melanogaster. Science 316(5833):1898–1900.
51. Besansky NJ (2014) Malaria: How vector mosquitoes beat the heat. Nature 516(7531):334–336.
52. Brasfield SM, Talent LG, Janz DM (2008) Reproductive and thyroid hormone profilesin captive Western fence lizards (Sceloporus occidentalis) after a period of brumation.Zoo Biol 27(1):36–48.
53. Matsuura K, et al. (2009) Queen succession through asexual reproduction in termites.Science 323(5922):1687.
54. Sánchez Alvarado A (2009) Developmental biology: A cellular view of regeneration.Nature 460(7251):39–40.
55. Hall VR, Hughes TP (1996) Reproductive strategies of modular organisms: Compara-tive studies of reef-building corals. Ecology 77(3):950–963.
56. Buckley YM, et al. (2005) Slowing down a pine invasion despite uncertainty in de-mography and dispersal. J Appl Ecol 42(6):1020–1030.
57. Neubert MG, Parker IM (2004) Projecting rates of spread for invasive species. Risk Anal24(4):817–831.
58. Moles AT, Westoby M (2004) Seed survival and seed size: A synthesis of the literature.J Ecol 92:372–383.
59. Rees M (1993) Trade-offs among dispersal strategies in British plants. Nature 366(6451):150–152.
60. Morris WF, et al. (2008) Longevity can buffer plant and animal populations againstchanging climatic variability. Ecology 89(1):19–25.
61. Doak DF, Morris WF (2010) Demographic compensation and tipping points in climate-induced range shifts. Nature 467(7318):959–962.
62. Wright IJ, et al. (2004) The worldwide leaf economics spectrum. Nature 428(6985):821–827.
63. Chave J, et al. (2009) Towards a worldwide wood economics spectrum. Ecol Lett 12(4):351–366.
64. Adler PB, et al. (2014) Functional traits explain variation in plant life history strategies.Proc Natl Acad Sci USA 111(2):740–745.
65. Rosindell J, Harmon LJ (2012) OneZoom: A fractal explorer for the tree of life. PLoSBiol 10(10):e1001406.
66. Revell LJ (2009) Size-correction and principal components for interspecific compara-tive studies. Evolution 63(12):3258–3268.
67. Dunham AE, Miles DB (1985) Patterns of covariation in life history traits of squamatereptiles: The effects of size and phylogeny reconsidered. Am Nat 126:231–257.
68. Salguero-Gómez R, Plotkin JB (2010) Matrix dimensions bias demographic inferences:Implications for comparative plant demography. Am Nat 176(6):710–722.
Salguero-Gómez et al. PNAS | January 5, 2016 | vol. 113 | no. 1 | 235
POPU
LATION
BIOLO
GY