swire pacific limited announces 2015 annual results · swire pacific limited announces 2015 annual...
TRANSCRIPT

For immediate release 10th March 2016
Swire Pacific Limited Announces 2015 Annual Results Our consolidated profit attributable to shareholders for 2015 was HK$13,429 million, HK$2,360 million higher than in 2014. Underlying profit attributable to shareholders, which principally adjusts for changes in the valuation of investment properties, increased by HK$153 million or 2% to HK$9,892 million. There were higher underlying profits from the Cathay Pacific group and the Beverages Division. There were lower underlying profits from the HAECO group and the Trading & Industrial Division. The Marine Services Division made an underlying loss. The underlying profits of the Property Division were little changed. Underlying profits were also recorded on the sale of eight units at OPUS HONG KONG, a property owned directly by Swire Pacific. Below is a summary of the 2015 annual results: 2015 Annual Results Summary
2015HK$M
2014 HK$M
Change%
Revenue 60,885 61,301 -1%Profit attributable to the Company’s shareholders 13,429 11,069 +21%Underlying profit attributable to the Company’s
shareholders 9,892 9,739 +2%
HK$ HK$ Change %
Earnings per share ‘A’ share 8.93 7.36
+21% ‘B’ share 1.79 1.47 Underlying earnings per share ‘A’ share 6.58 6.47
+2% ‘B’ share 1.32 1.29
HK$ HK$ Change %
Full year dividends per share ‘A’ share 3.90 3.90
- ‘B’ share 0.78 0.78
… / Page 2

/ …2 Divisional Highlights: Property Division
Underlying attributable profit was HK$5,791 million, a decrease of 1% compared with 2014.
Excluding a loss on the sale of four hotels in the UK, underlying profit increased by 2%.
Profits from property investment benefited from firm demand for office space in Hong Kong and for retail space in Mainland China.
There were higher profits from property trading, principally reflecting completion of the sales of the majority of the units at the AREZZO development in Hong Kong.
The hotel results were affected by the loss on disposal of four hotels in the UK and pre-opening costs at new hotels in Mainland China and the USA.
Aviation Division
Attributable profit from the Aviation Division was HK$3,017 million in 2015, compared with an attributable profit of HK$1,822 million in 2014.
The Cathay Pacific group’s attributable profit was HK$2,700 million, compared with an attributable profit of HK$1,418 million in 2014.
Cathay Pacific’s results benefited from generally firm passenger demand and lower fuel prices. The contribution from Air China rose significantly. Cargo demand was weak.
The HAECO group’s attributable profit was HK$349 million, 19% lower than in 2014. HAECO Hong Kong’s results benefited from higher demand for airframe services
work and better line services results. HAECO Americas and HAECO Xiamen did less airframe services work.
HAESL and SAESL’s profits fell as they overhauled fewer Rolls-Royce engines. TEXL overhauled more GE90 engines, but its profits fell because of absence of tax losses.
Beverages Division The Beverages Division recorded an attributable profit of HK$976 million in 2015, an
increase of 14% over 2014. This increase reflected better results in Hong Kong, Taiwan and the USA. Profits
were slightly down in Mainland China. Overall sales volume increased by 4% to 1,083 million unit cases. Sales volume grew strongly in the USA, reflecting the inclusion of sales for a full
year from territories in Colorado assumed in 2014. Volume increased slightly in Mainland China.
In September 2015, Swire Beverages Holdings Limited acquired additional interests in three of its subsidiaries in Mainland China for HK$1.5 billion.
… / Page 3
/ …3
Conditional agreements were entered into in 2015 to assume additional franchise territory in Arizona, USA and to acquire production assets in Colorado and Arizona, USA.
Marine Services Division
Swire Pacific Offshore (“SPO”) recorded a loss of HK$1,285 million compared with a profit of HK$1,041 million in 2014.
SPO’s results were adversely affected by the difficult market conditions caused by the significant decline in the oil price. This put pressure on charter hire rates and utilisation.
SPO also recorded impairment charges in relation to vessels of HK$743 million and in relation to the cancellation of shipbuilding contracts in Brazil of HK$485 million.
SPO’s fleet utilisation decreased by 11.7 percentage points to 74.9% and its average daily charter hire rates decreased by 10% to USD27,100.
Trading & Industrial Division
The attributable profit of the Trading & Industrial Division was HK$155 million, a 63% decrease when compared to 2014.
The decrease principally reflected the termination of Volkswagen and Škoda importerships in Taiwan at Taikoo Motors at the end of 2014.
There were also weaker results from Akzo Nobel Swire Paints, costs associated with developing the Swire Pacific Cold Storage business and losses from Swire Environmental Services.
This was partly offset by higher profits from Swire Retail and Swire Foods, the latter principally reflecting a full year of results from the 65% interest in Chongqing New Qinyuan Bakery Co. Ltd.
- End -
For further information, please contact: Lydia Tsui, Manager Group Public Affairs, Swire Pacific Limited Tel : (852) 2840 8003 / (852) 9679 0169 Email : [email protected]
Visit Swire Pacific’s website at www.swirepacific.com

Hong Kong Exchanges and Clearing Limited and The Stock Exchange of Hong Kong Limited take no
responsibility for the contents of this announcement, make no representation as to its accuracy or
completeness and expressly disclaim any liability whatsoever for any loss howsoever arising from or in
reliance upon the whole or any part of the contents of this announcement.
- 0 -
SWIRE PACIFIC LIMITED
(Incorporated in Hong Kong with limited liability)
(Stock Codes: 00019 and 00087)
2015 Final Results

2015 FINAL RESULTS
- 1 -
2015 Final Results
Note 2015 2014 Change
HK$M HK$M %
Revenue 60,885 61,301 -1%
Operating profit 16,461 13,697 +20%
Profit attributable to the Company’s shareholders 13,429 11,069 +21%
Cash generated from operations 14,362 16,250 -12%
Net cash inflow/(outflow) before financing 6,824 (215) N/A
Total equity (including non-controlling interests) 263,986 262,130 +1%
Net debt 59,584 58,624 +2%
HK$ HK$
Earnings per share (a)
‘A’ share 8.93 7.36 +21%
‘B’ share 1.79 1.47
Dividends per share
‘A’ share 3.90 3.90 -
‘B’ share 0.78 0.78
Equity attributable to the Company’s shareholders
per share (a)
‘A’ share 145.22 145.40 -0%
‘B’ share 29.04 29.08
Underlying Profit Change
HK$M HK$M %
Underlying profit attributable to the Company’s
shareholders (b) 9,892 9,739 +2%
HK$ HK$
Underlying earnings per share (a)
‘A’ share 6.58 6.47 +2%
‘B’ share 1.32 1.29
Notes:
(a) Refer to note 8 in the financial statements for the weighted average number of shares.
(b) Refer to note 6 in the financial statements for a reconciliation between the reported and underlying profit attributable
to the Company's shareholders.
2015 FINAL RESULTS
- 2 -
Chairman’s Statement
Year in review
The global economy in 2015 was affected by uncertainty over the timing of the rise in interest rates in the
USA and slower economic growth in Mainland China. Economic growth in the USA remained robust and
economies in the Eurozone showed some improvement. Financial markets were volatile, in particular in
Mainland China. The Renminbi weakened unexpectedly in August. Consumer spending was weak in Hong
Kong. Currency movements had an adverse impact on tourism. Consumer spending was relatively robust in
major Chinese cities. Oil prices were low throughout the year.
Results summary
The 2015 results of the Group were affected by the global economic factors described above. Consolidated
profit attributable to shareholders for 2015 was HK$13,429 million, HK$2,360 million higher than in 2014.
Underlying profit attributable to shareholders, which principally adjusts for changes in the valuation of
investment properties, increased by HK$153 million or 2% to HK$9,892 million.
The Property Division was the largest contributor to underlying profits. The profits of Swire Properties fell,
principally on account of a loss on the disposal of four hotels in the UK. Excluding this loss, the profits of
Swire Properties rose compared to those of 2014. The business benefited from strong sales of luxury
residential properties in Hong Kong for much of the year. Rental income in Hong Kong benefited from strong
demand for office space. Retail properties in Mainland China performed well. Significant underlying profits
were recorded on the sale of eight units in OPUS HONG KONG, a property owned directly by Swire Pacific.
The results of the Aviation Division improved, principally as a result of higher profits from the airlines and
higher attributable profits from Cathay Pacific’s associate, Air China. Cathay Pacific’s own results improved
but were affected by pressure on passenger yield, weak cargo demand and higher fuel hedging losses.
HAECO’s results were affected by higher losses from its business in the USA.
Swire Beverages’ results were mixed. The business in Mainland China was affected by slowing economic
growth. Other territories, in particular in the USA, produced good results. The Marine Services Division
performed poorly in a weak market. Swire Pacific Offshore (“SPO”) recorded significant impairment charges
in relation to older vessels in the fleet and the cancellation of shipbuilding contracts in Brazil. The Trading &
Industrial Division’s profits were lower.
Implementing our strategy The Group’s aim is to generate sustainable long-term growth in shareholder value. This can be measured by
capital appreciation and a rising dividend. Over the last ten years, the Group has seen equity attributable to
shareholders and dividends (excluding special distributions) increase by compound average rates of 6% and
4% per year respectively.
In order to achieve our stated aim, we deploy capital (and people) where we see opportunities to generate
long-term value. We make such deployments in our businesses with a view to maximising the returns on our
capital over the long term.
The largest recipient of capital is Swire Properties. This reflects its size and the identified opportunities in the
property sector. In Hong Kong, we are reinforcing our successful Quarry Bay development by redeveloping
older buildings into prime office space. In Mainland China, we intend to undertake a retail and residential
development in Dalian and a second (retail) development in Shanghai. Our mixed-use project in Miami is
nearing completion and will open in phases this year.
The Aviation Division is a significant investment for the Group. We are supportive of the long term
investment plans of the Cathay Pacific group, which include investments in new aircraft and in maintaining a
significant ownership interest in Air China. Cathay Pacific finances its investments itself.

2015 FINAL RESULTS
- 3 -
Chairman’s Statement (continued)
In 2014 HAECO invested in an aircraft maintenance business in the USA. This extended HAECO’s
capabilities and geographical coverage. The acquired business underperformed in 2015 due to the termination
of some major airframe maintenance contracts. We are concentrating on integrating the acquired business
within the HAECO group.
The Beverages Division earns an attractive return on investment. In 2015 we acquired the minority interests
held by the CITIC group in our beverages companies in Mainland China. We also agreed to acquire
additional distribution rights in Arizona and additional production assets in Arizona and Colorado. The
former acquisition is expected to be completed later this year, the latter no later than 2018.
In the Marine Services Division, SPO has, since 2011, made major investments in new offshore support
vessels. Weak market conditions make further significant commitments to purchase new vessels unlikely in
the short term.
The Trading & Industrial Division has been a large recipient of capital relative to its size. In 2013, we started
to expand our motor dealership business and the number of brands of vehicles which we represent. In 2014
we acquired a majority interest in a bakery business in southwest China. Swire Pacific Cold Storage has been
investing in cold stores in Mainland China. Five are operating and two are due to open in 2016.
Our strategy of allocating surplus capital to a diversified range of businesses continues. New investments in
businesses other than property have increased in recent years. This reflects our belief that attractive returns
are available over the long term in these businesses and the scarcity of opportunities for investment in
property on sufficiently favourable terms. Current allocations of capital reflect our belief that this state of
affairs is likely to continue in the medium term.
Outlook
In the Property Division, rental income in Hong Kong is expected to benefit from continued high occupancy.
Demand for retail space, however, is expected to weaken. Investment property results in Mainland China are
expected to be better as retail sales continue to grow. Overall profits from the investment property business are
expected to grow slowly until new properties are completed and opened in 2017 and 2018. Property trading
profits are expected to be recognised on sales of units in the USA.
In the Aviation Division, the Cathay Pacific group is expected to continue to face pressure on passenger yield
and weak cargo demand. Fuel prices are expected to remain low. This is expected to continue to provide a
benefit to Cathay Pacific and its associated companies, Air China and Air China Cargo.
The HAECO group is expected to benefit from a significant one-off gain resulting from the restructuring of its
interests in Rolls Royce engine overhaul facilities in Hong Kong and Singapore. The prospects for the
HAECO group’s different businesses in 2016 are mixed.
The Beverages Division expects overall sales volume growth in 2016 as a result of new territories assumed in
the USA and modest growth in existing markets. Results will also benefit from the acquisition of minority
interests in Mainland China completed during 2015. Raw material costs are expected to remain favourable.
The oil price is expected to remain low in 2016. This will adversely affect the results of the Marine Services
Division. It is difficult to know when oil prices will recover. Until they do, exploration and production activity
will remain at low levels. In order to address weak demand, SPO has adjusted its fleet size by stacking older
vessels. This will reduce operating costs and preserve cash flow. SPO is well positioned to take advantage of
market opportunities when conditions improve.
The Trading & Industrial Division will continue to develop its portfolio of businesses. The results of the
division as a whole will be affected by the cost of new business development, in particular start-up costs
relating to the Swire Pacific Cold Storage business.

2015 FINAL RESULTS
- 4 -
Chairman’s Statement (continued)
Dividends The Directors have declared second interim dividends of HKȼ278.0 per ‘A’ share and HKȼ55.6 per ‘B’ share
which, together with the first interim dividends paid in October 2015, amount to full year dividends of
HKȼ390.0 per ‘A’ share and HKȼ78.0 per ‘B’ share.
Dividends paid in respect of 2015 are unchanged from those paid in respect of 2014. The Group’s policy is to
pay out approximately half of underlying profits attributable to shareholders over the economic cycle.
_____________________________________________________________________________________
The commitment and hard work of employees of the Group and its joint venture and associated companies are
central to our continuing success. I take this opportunity to thank them.
By Order of the Board
SWIRE PACIFIC LIMITED
John Slosar
Chairman
Hong Kong, 10th March 2016

2015 FINAL RESULTS
- 5 -
REVIEW OF OPERATIONS
PROPERTY DIVISION
OVERVIEW OF THE BUSINESS
Swire Properties is a leading developer, owner and operator of mixed-use, principally
commercial properties in Hong Kong and Mainland China, with a record of creating
long-term value by transforming urban areas. Swire Properties’ business comprises
three main areas:
Property Investment:
Swire Properties’ property investment portfolio in Hong Kong comprises office and
retail premises, serviced apartments and other luxury residential accommodation in
prime locations. The completed portfolio in Hong Kong totals 13.4 million square feet
of gross floor area with an additional 1.9 million square feet under development. In
Mainland China, Swire Properties owns and operates major commercial mixed-use
developments in Beijing, Shanghai, Guangzhou and Chengdu, in joint venture in
certain cases, which will total 8.9 million square feet on completion. Of this, 7.1 million
square feet has already been completed. In the USA, Swire Properties is the primary
developer undertaking a mixed-use commercial development at Brickell City Centre
in Miami, Florida that will comprise 2.5 million square feet after two phases of
development have been completed.
Hotel Investment:
Swire Properties wholly-owns and manages, through Swire Hotels, two hotels in Hong
Kong, The Upper House at Pacific Place and EAST, Hong Kong at Taikoo Shing. Swire
Properties has a 20% interest in each of the JW Marriott, Conrad Hong Kong and
Island Shangri-La hotels at Pacific Place and in the Novotel Citygate in Tung Chung.
In Mainland China, Swire Hotels manages three hotels. The Opposite House at Taikoo
Li Sanlitun in Beijing is wholly-owned by Swire Properties; 50% interests are owned in
EAST at INDIGO in Beijing and in The Temple House at Sino-Ocean Taikoo Li Chengdu.
At TaiKoo Hui in Guangzhou, Swire Properties owns a 97% interest in the Mandarin
Oriental. In the USA, the company owns a 75% interest in the Mandarin Oriental in
Miami.
Property Trading:
Swire Properties’ trading portfolio comprises a luxury residential project under
development (ALASSIO) on Hong Kong Island, two residential towers under
development (Reach and Rise) at Brickell City Centre in Miami, the remaining portion
of the office property (Pinnacle One) at Sino-Ocean Taikoo Li Chengdu and the
remaining units at other completed developments. The completed developments
available for sale are the WHITESANDS, AREZZO and MOUNT PARKER RESIDENCES
developments in Hong Kong. There are also land banks in Miami and Fort Lauderdale
in Florida in the USA.
Swire Properties is listed on The Stock Exchange of Hong Kong Limited.

2015 FINAL RESULTS
- 6 -
Principal Property Investment Portfolio – Gross floor area (‘000 Square Feet)
At 31st
Under December 2014
Location Office Retail Hotels Residential Planning Total Total
Completed
Pacific Place 2,186 711 496 443 - 3,836 3,836
Taikoo Place 5,451 * 12 - 63 - 5,526 5,526
Cityplaza 1,633 1,105 200 - - 2,938 2,938
Others 410 608 47 41 - 1,106 1,152
- Hong Kong 9,680 2,436 743 547 - 13,406 13,452
Taikoo Li Sanlitun - 1,296 169 - - 1,465 1,465
TaiKoo Hui 1,732 1,473 584 52 - 3,841 3,841
INDIGO 298 470 179 - - 947 947
Sino-Ocean Taikoo Li
Chengdu - 624 114 64 - 802 613
Others - 91 - - - 91 91
- Mainland China 2,030 3,954 1,046 116 - 7,146 6,957
- USA - - 259 - - 259 259
- UK - - - - - - 208
Total completed 11,710 6,390 2,048 663 - 20,811 20,876
- Hong Kong 1,766 - - - 96 1,862 1,858
- Mainland China 918 548 194 74 - 1,734 1,896
- USA 260 490 218 109 1,444 2,521 2,377
Total 14,654 7,428 2,460 846 1,540 26,928 27,007
Under and pending
development
At 31st December 2015
Gross floor area represents 100% of space owned by Group companies and the division’s
attributable share of space owned by joint venture and associated companies.
* Includes 894,000 square feet at two techno-centres (Warwick House and Cornwall House).
STRATEGY:
The strategic objective of Swire Properties (as a listed company in its own right) is
sustainable growth in shareholder value over the long-term as a leading developer,
owner and operator of principally mixed-use commercial properties in Hong Kong
and Mainland China. The strategies employed in order to achieve this objective are
these:
The creation of long-term value through conceiving, designing, developing,
owning and managing transformational mixed-use and other projects in urban
areas.
Maximisation of the earnings and value of its completed properties through active
asset management, including reinforcing its assets through enhancement,
redevelopment and new additions.
Continuing its luxury residential property activities.
Remaining focused principally on Hong Kong and Mainland China.
Conservative management of its capital base.
2015 FINAL RESULTS
- 7 -
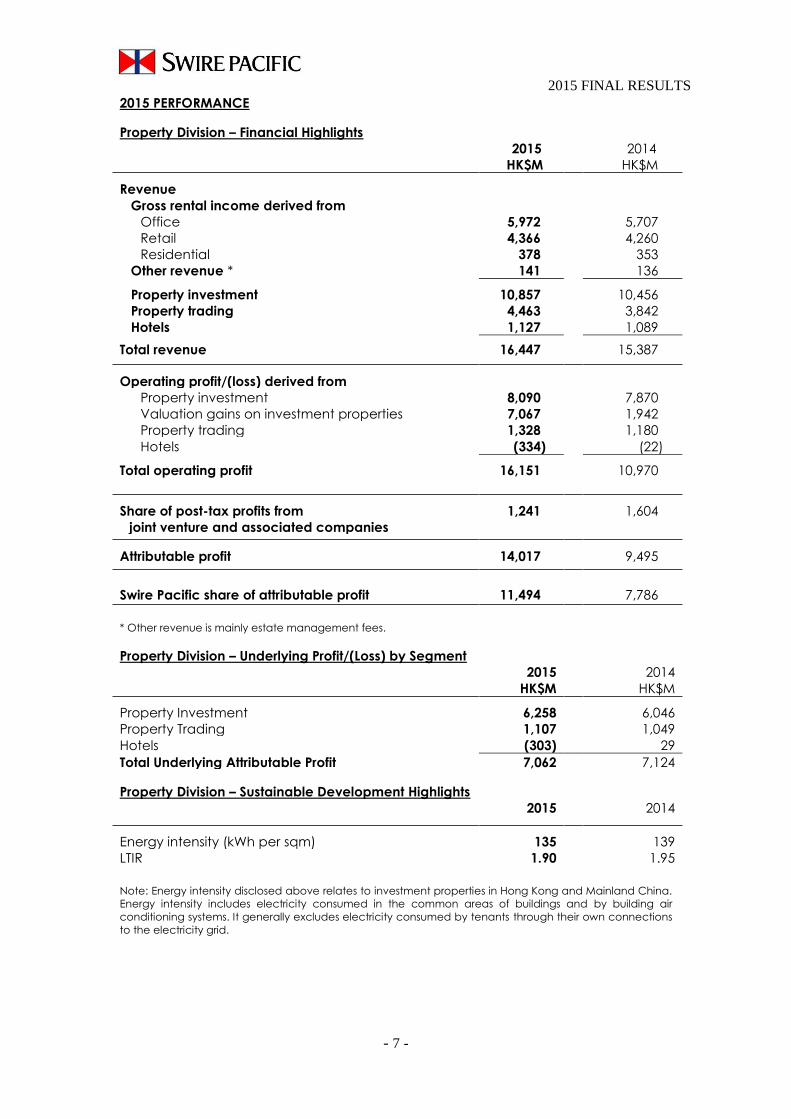
2015 PERFORMANCE
Property Division – Financial Highlights
2015 2014
HK$M HK$M
Revenue
Gross rental income derived from
Office 5,972 5,707
Retail 4,366 4,260
Residential 378 353
Other revenue * 141 136
Property investment 10,857 10,456
Property trading 4,463 3,842
Hotels 1,127 1,089
Total revenue 16,447 15,387
Operating profit/(loss) derived from
Property investment 8,090 7,870
Valuation gains on investment properties 7,067 1,942
Property trading 1,328 1,180
Hotels (334) (22)
Total operating profit 16,151 10,970
Share of post-tax profits from
joint venture and associated companies
1,241 1,604
Attributable profit 14,017 9,495
Swire Pacific share of attributable profit
11,494
7,786
* Other revenue is mainly estate management fees.
Property Division – Underlying Profit/(Loss) by Segment 2015
HK$M
2014
HK$M
Property Investment 6,258 6,046
Property Trading 1,107 1,049
Hotels (303) 29
Total Underlying Attributable Profit 7,062 7,124
Property Division – Sustainable Development Highlights 2015 2014
Energy intensity (kWh per sqm) 135 139
LTIR 1.90 1.95
Note: Energy intensity disclosed above relates to investment properties in Hong Kong and Mainland China.
Energy intensity includes electricity consumed in the common areas of buildings and by building air
conditioning systems. It generally excludes electricity consumed by tenants through their own connections
to the electricity grid.

2015 FINAL RESULTS
- 8 -
Property Division – Reconciliation of Attributable to Underlying Profit
Additional information is provided below to reconcile reported and underlying profit
attributable to shareholders. These reconciling items principally adjust for net revaluation
movements on investment properties and the associated deferred tax in Mainland China
and the USA, and for other deferred tax provisions in relation to investment properties.
2015 2014
Note HK$M HK$M
Reported attributable profit 14,017 9,495
Adjustments in respect of investment properties:
Revaluation of investment properties (a) (8,137) (3,134)
Deferred tax on investment properties (b) 1,090 710
Realised profit on sale of investment properties (c) 28 29
Depreciation of investment properties occupied by
the Group
(d) 23 23
Non-controlling interests’ share of revaluation
movements less deferred tax
41 1
Underlying attributable profit 7,062 7,124
Swire Pacific share of underlying attributable profit 5,791 5,841
Notes:
(a) This represents the Group’s net revaluation movements and the Group’s share of net
revaluation movements of joint venture companies.
(b) This represents deferred tax movements on the Group’s investment properties and the
Group’s share of deferred tax movements on investment properties held by joint venture
companies. These comprise deferred tax on revaluation movements on investment
properties in Mainland China and the USA, and deferred tax provisions made in respect of
investment properties held for the long-term where it is considered that the liability will not
reverse for some considerable time.
(c) Prior to the implementation of HKAS 40, changes in the fair value of investment properties
were recorded in the revaluation reserve rather than the statement of profit or loss. On sale,
the revaluation gains were transferred from the revaluation reserve to the statement of
profit or loss.
(d) Prior to the implementation of HKAS 40, no depreciation was charged on investment
properties occupied by the Group.
2015 FINAL RESULTS
- 9 -
PROPERTY INDUSTRY BACKGROUND
Office and Retail:
Hong Kong:
Office
Demand for office space improved in
2015, though there was a slowdown in
demand from Mainland Chinese
entities in Central towards the end of
the year. Occupancy levels were high.
Retail
Retail sales in Hong Kong were
adversely affected by reduced
spending by tourists.
Mainland China:
Retail
In Mainland China, retail sales of luxury
goods were weak but those of non-
luxury goods were satisfactory.
Demand for retail space was generally
firm in 2015.
Office
In Guangzhou, despite substantial new
supply, rents were stable in 2015 as a
result of high occupancy. In Beijing,
office rents were weak against a
background of reduced demand and
increased supply.
Property Sales Markets:
In Hong Kong, demand for residential
properties for sale was strong in the first
nine months of the year but buyers
became more cautious in the light of
expected interest rate increases and
general economic uncertainties.
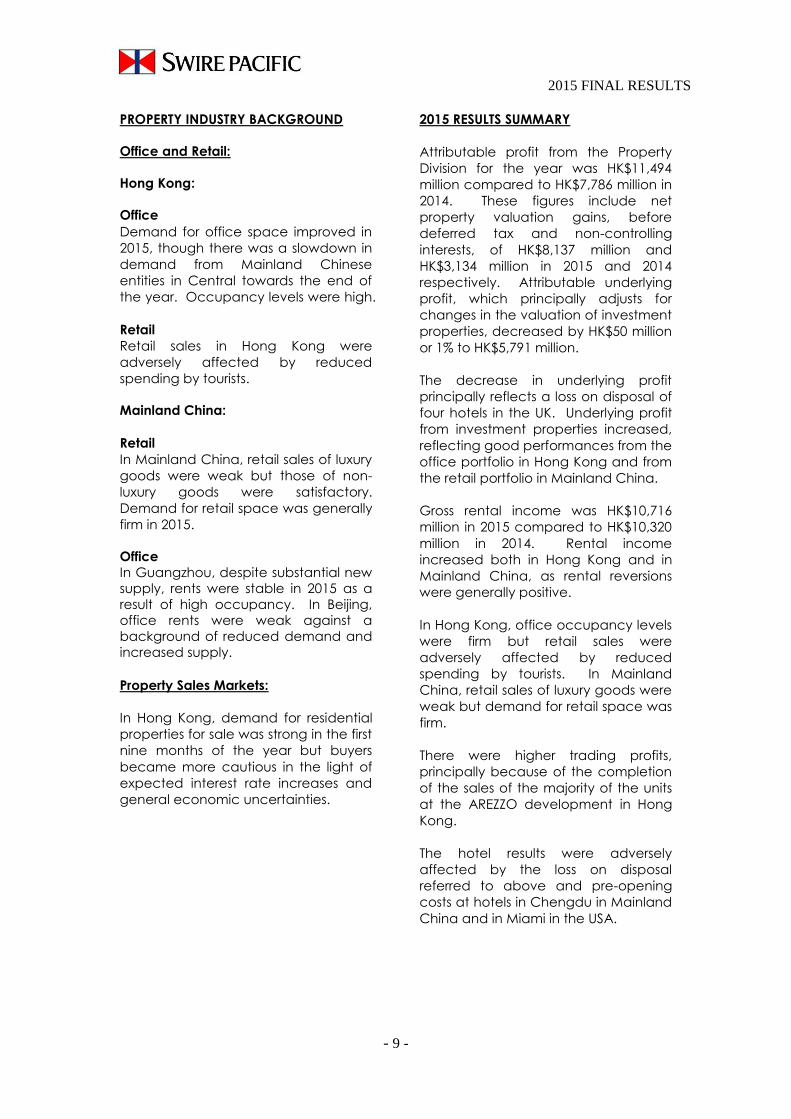
2015 RESULTS SUMMARY
Attributable profit from the Property
Division for the year was HK$11,494
million compared to HK$7,786 million in
2014. These figures include net
property valuation gains, before
deferred tax and non-controlling
interests, of HK$8,137 million and
HK$3,134 million in 2015 and 2014
respectively. Attributable underlying
profit, which principally adjusts for
changes in the valuation of investment
properties, decreased by HK$50 million
or 1% to HK$5,791 million.
The decrease in underlying profit
principally reflects a loss on disposal of
four hotels in the UK. Underlying profit
from investment properties increased,
reflecting good performances from the
office portfolio in Hong Kong and from
the retail portfolio in Mainland China.
Gross rental income was HK$10,716
million in 2015 compared to HK$10,320
million in 2014. Rental income
increased both in Hong Kong and in
Mainland China, as rental reversions
were generally positive.
In Hong Kong, office occupancy levels
were firm but retail sales were
adversely affected by reduced
spending by tourists. In Mainland
China, retail sales of luxury goods were
weak but demand for retail space was
firm.
There were higher trading profits,
principally because of the completion
of the sales of the majority of the units
at the AREZZO development in Hong
Kong.
The hotel results were adversely
affected by the loss on disposal
referred to above and pre-opening
costs at hotels in Chengdu in Mainland
China and in Miami in the USA.

2015 FINAL RESULTS
- 10 -
KEY CHANGES TO THE PROPERTY PORTFOLIO
In April 2015, Swire Properties, Bal Harbour Shops and Simon Property Group agreed to develop the retail component of Brickell City Centre in Miami, USA. Under the agreement, Swire Properties will remain the primary developer of Brickell City Centre. In May 2015, Swire Properties entered into a joint venture with China Motor Bus Company, Limited (“CMB”). The joint venture was formed to acquire, subject to conditions (including the agreement of a land premium with the Hong Kong Government), a plot of land in Chai Wan, Hong Kong. The land, together with some adjoining land, is intended to be redeveloped as a residential development. The proposed development is expected to have an aggregate gross floor area of approximately 692,000 square feet. The joint venture is 80% held by Swire Properties and 20% held by CMB. In July 2015, a framework agreement was entered into with a subsidiary of Shanghai Lujiazui Finance & Trade Zone Development Co., Ltd. signifying the parties’ intention to develop a retail project with an aggregate gross floor area of approximately 1,330,000 square feet in Qiantan, Pudong New District in Shanghai. Entry into the proposed joint venture and undertaking the project are subject to certain conditions precedent. If the joint venture is formed, it is expected that Swire Properties will have a 50% interest in the project. INVESTMENT PROPERTIES
Hong Kong
Office
Gross rental income from the Group’s Hong Kong office portfolio increased by 4% to HK$5,587 million in 2015. This principally reflected positive rental reversions at Taikoo Place and Cityplaza. Occupancy levels were higher. At 31st December 2015, the office portfolio was 99% let.
Pacific Place
The offices at One, Two and Three Pacific Place performed well in 2015. The occupancy rate was 100% at 31st December 2015. Cityplaza Demand for space in the three office towers (Cityplaza One, Three and Four) was strong in 2015. They were almost fully let at 31st December 2015. Taikoo Place The office portfolio in Taikoo Place recorded positive rental reversions during the year. The occupancy rate was 99% at 31st December 2015. Retail The Hong Kong retail portfolio’s gross rental income increased marginally, to HK$2,725 million in 2015. This reflected positive rental reversions. The Group’s malls were almost fully let throughout the year. Retail sales at The Mall, Pacific Place and at Citygate Outlets decreased by 12% and 10% respectively in 2015, reflecting reduced spending by tourists. Retail sales at Cityplaza were stable following completion of an enhancement project at the mall in 2014. Residential
Average occupancy at Pacific Place Apartments improved in 2015. Taikoo Place Apartments, comprising 111 serviced apartments in Quarry Bay, opened in August 2015. Occupancy built up gradually. The remaining eight units at OPUS HONG KONG were sold during the year. The net proceeds from the sale of units (including amounts receivable) were HK$3,187 million. OPUS HONG KONG is accounted for as an investment property and sales proceeds are recorded in the consolidated statement of cash flows under proceeds from disposals of investment properties.
2015 FINAL RESULTS
- 11 -
Investment Properties under Development
The commercial site (Tung Chung
Town Lot No. 11) adjacent to Citygate
Outlets is being developed into a
commercial building with an
aggregate retail and hotel gross floor
area of approximately 477,700 square
feet. Excavation and foundation works
are proceeding. The development is
expected to be completed in 2017.
Swire Properties has a 20% interest in
the development.
The commercial site (New Kowloon
Inland Lot No. 6312) at the junction of
Wang Chiu Road and Lam Lee Street
in Kowloon Bay is being developed
into an office building with an
aggregate gross floor area of
approximately 555,000 square feet.
Substructure and superstructure works
are proceeding. The development is
expected to be completed in 2017.
Somerset House in Taikoo Place is
being redeveloped into a 50-storey
office building with an aggregate
gross floor area of approximately
1,020,000 square feet. Excavation and
foundation works are proceeding. The
redevelopment is expected to be
completed in 2018. The second phase
of the Taikoo Place redevelopment
(the redevelopment of Cornwall House
and Warwick House into an office
building) is being planned.
The commercial site at 8-10 Wong
Chuk Hang Road is being developed
into an office building with an
aggregate gross floor area of
approximately 382,500 square feet.
Excavation and foundation works are
proceeding. The development is
expected to be completed in 2018.
Swire Properties has a 50% interest in
the development.
Mainland China
Retail
The Mainland China retail portfolio’s
gross rental income for 2015 increased
by 6% compared with 2014, to
HK$1,641 million.
The occupancy rate was 94% at Taikoo
Li Sanlitun at 31st December 2015.
Retail sales grew by 3% in 2015.
Demand for retail space in Taikoo Li
Sanlitun is solid as it reinforces its
position as a fashionable retail
destination.
The occupancy rate at TaiKoo Hui was
99% at 31st December 2015. Retail
sales at the mall increased by 16% in
2015.
The occupancy rate at the mall at
INDIGO was 97% at 31st December
2015 and 94% of the shops were open.
Retail sales increased by 30% in 2015.
Sino-Ocean Taikoo Li Chengdu was
officially opened in April 2015. At 31st
December 2015, tenants had
committed (including by way of letters
of intent) to take 88% of the retail
space and 83% of the space was open
for business.
Office
The Mainland China office portfolio’s
gross rental income for 2015 increased
by 9% compared with 2014, to HK$360
million.
At 31st December 2015, the
occupancy rates at the office towers
at TaiKoo Hui and at ONE INDIGO were
100% and 92% respectively.
2015 FINAL RESULTS
- 12 -
Investment Properties under
Development
Structural work at HKRI Taikoo Hui
(formerly known as the Dazhongli
project) in Shanghai has been
substantially completed. Interior
decoration and mechanical and
electrical installation works for the two
office towers and the shopping mall
are proceeding. The development is
expected to open in phases from 2016.
USA
Phase I of the Brickell City Centre
development consists of a shopping
centre, two office buildings (Two
Brickell City Centre and Three Brickell
City Centre), EAST Miami hotel and
serviced apartments and two
residential towers (Reach and Rise).
The residential towers are being
developed for sale. A light rail system
station within the site is being
renovated as part of the development.
Construction work on Phase I
commenced in 2012, with completion
expected this year.
Swire Properties has entered into
agreements with Bal Harbour Shops
and Simon Property Group to develop
the retail component of Brickell City
Centre. Swire Properties will remain the
primary developer of the Brickell City
Centre project.
At 31st December 2015, Swire
Properties owned 100% of the office,
hotel and residential portions and
61.5% of the retail portion of Phase I of
the project. The remaining interest in
the retail portion was held by Simon
Property Group (25%) and Bal Harbour
Shops (13.5%). Bal Harbour Shops has
an option, exercisable from the
second anniversary of the grand
opening of the retail component, to
sell its interest to Swire Properties.
Phase II of the Brickell City Centre
project is planned to be a mixed-use
development comprising retail, office,
hotel and residential space and
including an 80-storey tower to be
called One Brickell City Centre. Phase
II will incorporate the site at 700 Brickell
Avenue acquired by Swire Properties in
July 2013. Development of this site will
connect the Brickell City Centre
development with Brickell Avenue.
Swire Properties owns 100% of Phase II.
VALUATION OF INVESTMENT PROPERTIES
The portfolio of investment properties
was valued at 31st December 2015
(93% by value were valued by DTZ
Debenham Tie Leung, an independent
valuer, and 96% by value in total were
valued by independent valuers) on the
basis of open market value. The
amount of this valuation was
HK$227,109 million compared to
HK$220,634 million at 31st December
2014 and HK$225,591 million at 30th
June 2015.
The increase in the valuation of the
investment property portfolio is mainly
due to an increase in the valuation of
the offices in Hong Kong outside the
Central district.
Under HKAS 40, hotel properties are not
accounted for as investment
properties but are included within
property, plant and equipment at cost
less accumulated depreciation and
any provision for impairment.
2015 FINAL RESULTS
- 13 -
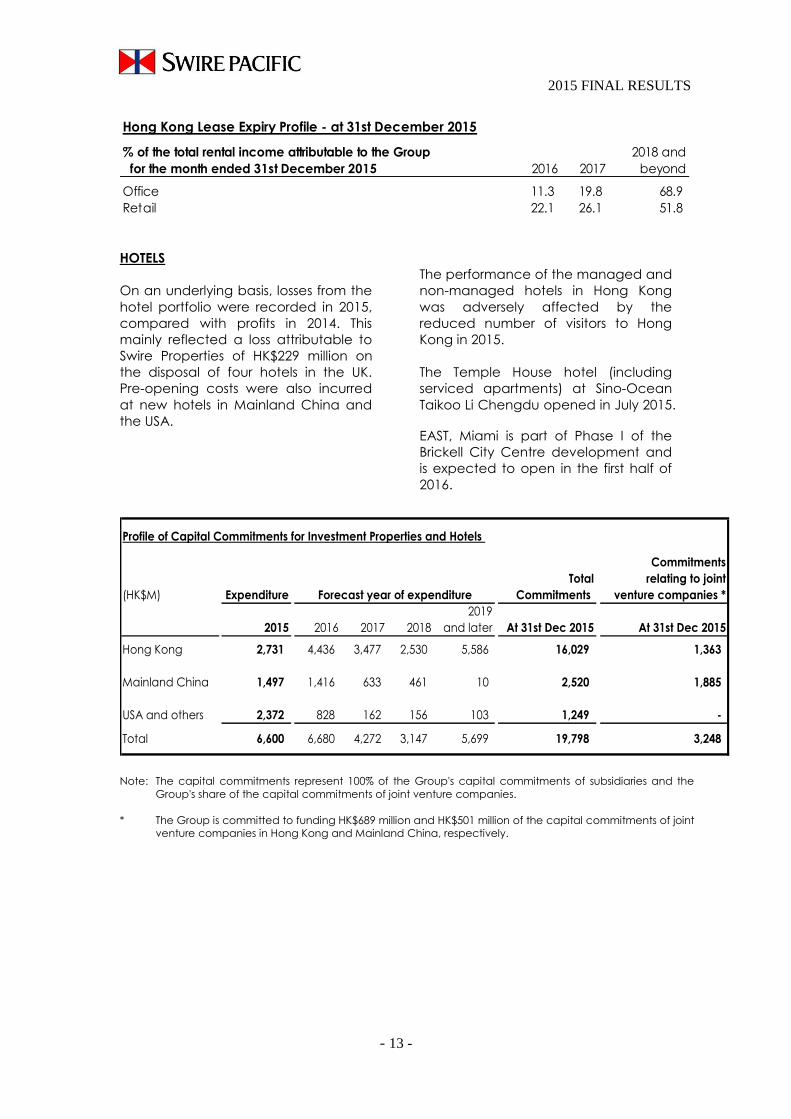
Hong Kong Lease Expiry Profile - at 31st December 2015
% of the total rental income attributable to the Group 2018 and
for the month ended 31st December 2015 2016 2017 beyond
Office 11.3 19.8 68.9
Retail 22.1 26.1 51.8
HOTELS
On an underlying basis, losses from the
hotel portfolio were recorded in 2015,
compared with profits in 2014. This
mainly reflected a loss attributable to
Swire Properties of HK$229 million on
the disposal of four hotels in the UK.
Pre-opening costs were also incurred
at new hotels in Mainland China and
the USA.
The performance of the managed and
non-managed hotels in Hong Kong
was adversely affected by the
reduced number of visitors to Hong
Kong in 2015.
The Temple House hotel (including
serviced apartments) at Sino-Ocean
Taikoo Li Chengdu opened in July 2015.
EAST, Miami is part of Phase I of the
Brickell City Centre development and
is expected to open in the first half of
2016.
Commitments
Total relating to joint
(HK$M) Expenditure Commitments venture companies *
2019
2015 2016 2017 2018 and later At 31st Dec 2015 At 31st Dec 2015
Hong Kong 2,731 4,436 3,477 2,530 5,586 16,029 1,363
Mainland China 1,497 1,416 633 461 10 2,520 1,885
USA and others 2,372 828 162 156 103 1,249 -
Total 6,600 6,680 4,272 3,147 5,699 19,798 3,248
Forecast year of expenditure
Profile of Capital Commitments for Investment Properties and Hotels
Note: The capital commitments represent 100% of the Group's capital commitments of subsidiaries and the
Group's share of the capital commitments of joint venture companies.
* The Group is committed to funding HK$689 million and HK$501 million of the capital commitments of joint
venture companies in Hong Kong and Mainland China, respectively.

2015 FINAL RESULTS
- 14 -
Sustainable Development
Energy intensity decreased by 3% in
2015. This principally reflects the use of
more energy efficient air-conditioning
and lighting.
Lost time injury rates decreased by 3%
in 2015 despite a larger workforce.
PROPERTY TRADING
Hong Kong
The profit from the sale of 17 units at
the AZURA, ARGENTA, DUNBAR PLACE
and MOUNT PARKER RESIDENCES
developments was recognised during
the year. All the units at these
developments (except one at MOUNT
PARKER RESIDENCES) had been sold at
31st December 2015.
AREZZO, the residential development
at 33 Seymour Road, was completed
in January 2015. 112 of the 127 units
had been sold at 8th March 2016. The
profit from the sales of 112 units was
recognised in 2015. The property is
wholly-owned by Swire Properties.
Superstructure work is in progress at
ALASSIO (formerly known as 100 Caine
Road) and the development is
expected to be completed in 2016
and available for handover to
purchasers in 2017. The development
consists of a 50-storey tower of 197
residential units. The development is
wholly-owned by Swire Properties.
The WHITESANDS development consists
of 28 detached houses at Cheung Sha,
on Lantau Island. The development
was completed and sales began in
September 2015. One of the 28 houses
had been sold at 8th March 2016, with
the profit recognised in 2015.
WHITESANDS is wholly-owned by Swire
Properties.
Mainland China
Construction of the Grade A office
tower at Sino-Ocean Taikoo Li
Chengdu, Pinnacle One, was
completed in December 2014.
89% of the office’s total gross floor area
(approximately 1.15 million square feet)
and 350 car park spaces were presold
in August 2013. In 2015, the profit from
the sale of approximately 52% of the
presold gross floor area was
recognised. The sale of the remaining
presold gross floor area and 350 car
park spaces is being cancelled as part
of the consideration has not been
received according to schedule.
USA
The residential portion of Phase I of the
Brickell City Centre development is
being developed for trading purposes.
There will be 780 units in two towers
(Reach and Rise).
Swire Properties started to sell units in
Reach in June 2014 and units in Rise in
November 2014. In 2015, a total of 150
units were sold in Reach and Rise. 335
units in Reach and 160 units in Rise had
been sold at 8th March 2016. The
development is almost completed and
will be available for handover to
purchasers in the first half of 2016.
OUTLOOK
Office and Retail:
Hong Kong:
Office
In 2016, high occupancy and limited
supply will put upward pressure on
rents in Central despite a slowdown in
demand for office space by Mainland
Chinese entities. High occupancy is
expected to result in rents in Taikoo
Place and Cityplaza being reasonably
resilient despite increased supply in
Kowloon East and other districts.

2015 FINAL RESULTS
- 15 -
Retail
Demand for retail space in Hong Kong
is expected generally to weaken in
2016. But there is growth in demand
for quality space from tenants
engaged in successful businesses.
Mainland China:
Retail
Overall retail sales are expected to
grow modestly in Guangzhou and
Beijing and steadily in Chengdu.
Office
In Guangzhou, office rents are
expected to be stable in 2016 despite
a substantial supply of new office
space. In Beijing, office rents are
expected to weaken in 2016 as
substantial amounts of new office
space become available and
demand falls.
Hotels:
Trading conditions at hotels in Hong
Kong and in Mainland China are
expected to be challenging in 2016.
The hotel market in Miami is expected
to remain strong despite an increase in
the supply of hotel rooms in 2016.
Property Trading:
In Hong Kong, buyers of property have
become more cautious in the light of
expected interest rate increases and
general economic uncertainties.
Trading profits are expected to be
recognised in 2016 from sales of the
remaining units at the WHITESANDS,
AREZZO and MOUNT PARKER
RESIDENCES developments.
In the USA, the residential property
market in urban Miami has
experienced a marked increase in
supply since late 2014. In addition, the
strengthening of the US dollar in 2015
has made Miami properties more
expensive in local currency terms for
buyers from outside the USA. Sales
momentum has slowed.
Profits from property trading in Miami
are expected to be recognised in 2016
upon handover of the presold units
and on further sales of units at the
Reach and Rise developments.
Guy Bradley

2015 FINAL RESULTS
- 16 -
REVIEW OF OPERATIONS
AVIATION DIVISION
OVERVIEW OF THE BUSINESS
The Aviation Division comprises significant investments in the Cathay Pacific group and the
HAECO group.
The Cathay Pacific group:
The Cathay Pacific group includes Cathay Pacific, its wholly-owned subsidiary Dragonair, its
60%-owned subsidiary AHK Air Hong Kong Limited ("Air Hong Kong"), an associate interest in Air
China and an interest in Air China Cargo Co., Ltd. (“Air China Cargo”). Cathay Pacific has
interests in companies providing flight catering and ramp and cargo handling services, and
owns and operates a cargo terminal at Hong Kong International Airport. It is listed on The
Stock Exchange of Hong Kong Limited.
Cathay Pacific offers scheduled passenger and cargo services to 179 destinations in 43
countries and territories. At 31st December 2015, it operated 146 aircraft and had 70 new
aircraft due for delivery up to 2024.
Dragonair is a regional airline registered and based in Hong Kong. It operates 42 aircraft on
scheduled services to 53 destinations in Mainland China and elsewhere in Asia.
Cathay Pacific owns 20.13% of Air China, the national flag carrier and a leading provider of
passenger, cargo and other airline-related services in Mainland China. At 31st December
2015, Air China operated 245 domestic and 115 international, including regional, routes.
Cathay Pacific has a cargo joint venture with Air China (Air China Cargo), which operated 15
freighters at 31st December 2015 and carries cargo in the bellies of Air China’s passenger
aircraft.
Air Hong Kong, a 60%-owned subsidiary of Cathay Pacific, operates express cargo services for
DHL Express, the remaining 40% shareholder, to 12 Asian cities. At 31st December 2015, Air
Hong Kong operated 13 freighters.
Cathay Pacific and its subsidiaries employ more than 33,600 people worldwide (around 25,800
of them in Hong Kong).
The HAECO group:
The HAECO group provides aviation maintenance and repair services. Its primary activities
are aircraft maintenance and modification work in Hong Kong (by HAECO Hong Kong), in
Xiamen (by HAECO Xiamen) and in the USA (by HAECO Americas).
Engine overhaul work is performed by HAECO's joint venture company Hong Kong Aero
Engine Services Limited ("HAESL"), by HAESL's joint venture company Singapore Aero Engine
Services Pte. Limited ("SAESL"), by HAECO’s subsidiary Taikoo Engine Services (Xiamen)
Company Limited (“TEXL”) and by HAECO Americas. The HAECO group has other subsidiaries
and joint venture companies in Mainland China, which offer a range of aircraft engineering
services and has a 70% interest in HAECO ITM Limited (“HAECO ITM”), an inventory technical
management joint venture with Cathay Pacific in Hong Kong.
HAECO is listed on The Stock Exchange of Hong Kong Limited.

2015 FINAL RESULTS
- 17 -
STRATEGY:
The strategic objective of Cathay Pacific and HAECO (as listed companies in their own
right) is sustainable growth in shareholder value over the long-term. The strategies
employed in order to achieve this objective are these:
The development and strengthening of Hong Kong as a centre for aviation services,
including passenger, cargo and aircraft engineering services.
The development and strengthening of the airline (Cathay Pacific and Dragonair) and
aircraft engineering (HAECO) brands.
Developing the fleets of Cathay Pacific and Dragonair (by investing in modern fuel
efficient aircraft) with a view to their becoming two of the youngest, most fuel efficient
fleets in the world.
Maintaining and enhancing high standards of service to passenger, cargo and aircraft
engineering customers.
Strengthening the airlines’ passenger and cargo networks and improving what they do
on the ground and in the air.
Continuing to build the strategic relationship with Air China.
Increasing the range and depth of aircraft engineering services offered by HAECO.
Endeavouring to minimise the impact of the airlines and of HAECO on the
environment.

2015 FINAL RESULTS
- 18 -
Aviation Division – Financial Highlights
2015 2014
HK$M HK$M
HAECO group
Revenue 12,095 11,927
Operating profit 415 509
Attributable profit 349 430
Cathay Pacific group
Share of post-tax profits from associated companies 2,700 1,418
Attributable profit 3,017 1,822
Accounting for the Aviation Division
The Group accounts for its associate interest in the Cathay Pacific group using the equity method of accounting. The Group
recognises its share of net profit or loss as a single line-item in the consolidated statement of profit or loss.
Cathay Pacific and Dragonair – 2015 Performance
2015 2014 Change
Available tonne kilometres ("ATK") Million 30,048 28,440 +5.7%
Available seat kilometres ("ASK") Million 142,680 134,711 +5.9%
Passenger revenue HK$M 73,047 75,734 -3.5%
Revenue passenger kilometres ("RPK") Million 122,330 112,257 +9.0%
Revenue passengers carried '000 34,065 31,570 +7.9%
Passenger load factor % 85.7 83.3 +2.4%pt
Passenger yield HK¢ 59.6 67.3 -11.4%
Cargo revenue – group HK$M 23,122 25,400 -9.0%
Cargo revenue – Cathay Pacific and
Dragonair
HK$M 20,079
22,035
-8.9%
Cargo and mail carried Tonnes '000 1,798 1,723 +4.4%
Cargo and mail load factor % 64.2 64.3 -0.1%pt
Cargo and mail yield HK$ 1.90 2.19 -13.2%
Cost per ATK (with fuel) HK$ 3.14 3.50 -10.3%
Cost per ATK (without fuel) HK$ 2.06 2.12 -2.8%
Aircraft utilisation Hours per day 12.2 12.2 -
On-time performance % 64.7 70.1 -5.4%pt
Average age of fleet Years 9.1 9.1 -
Number of destinations at year end Destinations 193 210 -17
Fuel consumption – group Barrels (million) 43.5 41.7 +4.3%
Cathay Pacific group – Sustainable Development Highlights
2015 2014
GHG emissions per ATK (Grammes of CO2e) 569 576
LTIR 2.77 3.67
Note: Greenhouse gas emissions disclosed above are from jet fuel combustion only.

2015 FINAL RESULTS
- 19 -
Cathay Pacific group
AIRLINE INDUSTRY BACKGROUND
The operating environment in 2015 was
better than in 2014. The airline industry
benefited from low fuel prices, but yields
were under pressure. Air cargo demand,
which came under pressure during the
second quarter of the year, remained
weak in the second half.
2015 RESULTS SUMMARY
The Cathay Pacific group’s attributable
profit on a 100% basis was HK$6,000
million in 2015, compared with a profit of
HK$3,150 million in 2014. The airline profit
after tax was HK$3,572 million (2014:
HK$1,846 million), and the share of profits
from subsidiaries and associates was
HK$2,428 million (2014: HK$1,304 million).
Passenger Services
Passenger revenue in 2015 was
HK$73,047 million, a decrease of 4%
compared with 2014. 34.1 million
passengers were carried, an increase of
8% compared to the previous year.
Capacity increased by 6%, reflecting the
introduction of new routes (to Boston,
Düsseldorf, Hiroshima and Zurich) and
increased frequency on some other
routes.
The passenger load factor increased by
2.4 percentage points. Economy class
demand was strong. Premium class
demand improved on regional routes,
but was not as strong as expected on
some long-haul routes.
Strong competition, a significant reduction
in fuel surcharges, unfavourable foreign
currency movements and the fact that a
higher proportion of passengers were
connecting through Hong Kong put
downward pressure on yield, which
decreased by 11%, to HK59.6 cents.
Cargo Services
Cathay Pacific and Dragonair
Cathay Pacific and Dragonair’s cargo
revenue in 2015 was HK$20,079 million, a
decrease of 9% compared to 2014. This
principally reflected a reduction in fuel
surcharges consequent upon low fuel
prices. The tonnage carried in 2015
increased by 4% to 1.8 million tonnes
compared to 2014.
The cargo capacity of Cathay Pacific and
Dragonair increased by 5%.
The cargo load factor decreased by 0.1
percentage point to 64.2%. Cargo
demand was strong in the first quarter of
2015, assisted by industrial action at ports
on the west coast of the USA. Overall
demand was weak for the rest of the year,
particularly on European routes. Freighter
capacity was reduced on some routes in
line with reduced demand.
Strong competition, overcapacity,
unfavourable foreign currency movements
and the reduction in fuel surcharges put
pressure on yield, which decreased by
13%, to HK$1.90. A higher proportion (57%)
of total cargo shipments was carried in the
bellies of passenger aircraft in 2015.

2015 FINAL RESULTS
- 20 -
Air Hong Kong
Air Hong Kong achieved an increase in
profit for 2015 compared with 2014.
Capacity in terms of available tonne
kilometres increased by 1% to 776 million.
The load factor increased by 0.4
percentage points to 66.5%.
Operating Costs
Total fuel costs for the Cathay Pacific
group (before the effect of fuel hedging)
decreased by HK$14,894 million (or 38%)
compared to 2014, despite increases in
capacity. A 40% decrease in average
fuel prices was partially offset by a 4%
increase in consumption. Fuel is still the
Cathay Pacific group’s most significant
cost, accounting for 34% of total
operating costs in 2015 (compared with
39% in 2014).
Cathay Pacific hedges some of its fuel
costs in an effort to manage the risk
associated with changing fuel prices. In
2015, a loss of HK$8,474 million was
recognised in Cathay Pacific’s profit and
loss account from fuel hedging activities.
This partially offset the benefit of lower
fuel costs. After taking hedging losses
into account, net fuel costs decreased
by HK$7,331 million (or 18%) compared
to 2014.
The continued decline in fuel prices
gave rise to additional unrealised
hedging losses of HK$5,417 million for
Cathay Pacific. Swire Pacific’s share of
these losses (amounting to HK$2,438
million) is reflected in Swire Pacific’s
consolidated statement of financial
position at 31st December 2015 under
associated companies.
Non-fuel costs increased by 2% in 2015
compared to 2014.
Cathay Pacific remains the subject of
antitrust proceedings in various jurisdictions.
The outcomes are subject to uncertainties.
Cathay Pacific is not in a position to assess
the full potential liabilities but makes
provisions based on relevant facts and
circumstances.
In December 2015, the General Court
annulled the European Commission’s
finding against Cathay Pacific in
November 2010. The fine of €57 million
previously imposed on Cathay Pacific was
refunded in February 2016. The refund has
been recognised in Cathay Pacific’s 2015
results.
Fleet Profile
At 31st December 2015, the total number
of aircraft in the Cathay Pacific and
Dragonair fleets was 188, the same number
as at 31st December 2014.
In 2015, Cathay Pacific took delivery of six
Boeing 777-300ER aircraft and three Airbus
A330-300 aircraft. The Boeing 777-300ER
aircraft delivered in late September 2015
was the 53rd and final aircraft of this type
to join the fleet.
Four Boeing 747-400 passenger aircraft and
four Airbus A340 aircraft were retired in
2015. The retirement of the remaining
three Boeing 747-400 passenger aircraft
has been brought forward from 2017 to
2016. In 2013, Cathay Pacific agreed to
sell six Boeing 747-400F freighters to The
Boeing Company. Two of these aircraft
have been delivered. The other four will be
delivered by the end of 2016.
At 31st December 2015, the Cathay Pacific
group had 70 new aircraft on order for
delivery up to 2024. Cathay Pacific’s first
Airbus A350-900 aircraft is scheduled to be
delivered in May 2016. 12 of these aircraft
are scheduled to be delivered in 2016.
2015 FINAL RESULTS
- 21 -
Fleet profile*
Aircraft
type
Number at
31st December 2015
Firm orders
Expiry of operating leases
Options
Leased
Owned
Finance
Operating
Total
‘16
‘17
‘18 and
beyond
Total
‘16
‘17
‘18
‘19
‘20
‘21 and
beyond
Aircraft operated by Cathay Pacific:
A330-300 23 13 6 42 3 1 2
A340-300 5 2 7(a)
A350-900 12(b) 10 22
A350-1000 26 26
747-400 3 3
747-400F 4 4(c)
747-400BCF 1(d) 1 1
747-400ERF 6 6
747-8F 2 11 13 1(c) 1
777-200 5 5
777-200F 5(e)
777-300 11 1 12
777-300ER 19 11 23 53 2 2 19
777-9X 21(c) 21
Total 72 44 30 146 13 10 47 70 2 6 1 2 19 5
Aircraft operated by Dragonair:
A320-200 5 10 15 2 1 1 6
A321-200 2 6 8 1 5
A330-300 10 9(f) 19 3 4 2
Total 17 25 42 3 4 2 3 2 11
Aircraft operated by Air Hong Kong:
A300-600F 2 6 2 10 2
747-400BCF 3(f) 3 1 2
Total 2 6 5 13 1 2 2
Grand total 91 50 60(f) 201 13 10 47 70 4 8 10 4 4 30 5
* Includes parked aircraft. The table does not reflect aircraft movements after 31st December 2015.
(a) One A340-300 was sold in February 2016.
(b) Including two aircraft on 12-year operating leases.
(c) In December 2013, Cathay Pacific agreed with The Boeing Company to purchase 21 new Boeing 777-9X aircraft
(for delivery after 2020), three new Boeing 777-300ER aircraft and one new Boeing 747-8F freighter and to sell six
existing Boeing 747-400F freighters. Three Boeing 777-300ER aircraft have been delivered to Cathay Pacific, one in
April 2015, one in July 2015 and the third in September 2015. Two of the Boeing 747-400F freighters have been
delivered to The Boeing Company, one in November 2014, the other in July 2015. Of the remaining four, one was
parked in January 2014.
(d) The aircraft was parked in August 2013 and returned to service in September 2015.
(e) Purchase options in respect of five Boeing 777-200F freighters.
(f) Of the total 60 operating lease aircraft, 55 are leased from external parties and five are under leasing
arrangement within the group (three Boeing 747-400BCFs and two Airbus A330-300s).

2015 FINAL RESULTS
- 22 -
Sustainable Development
Greenhouse gas emissions per unit of
capacity (measured in available tonne
kilometres) decreased by 1% in 2015.
The reduction reflects the introduction of
more fuel efficient aircraft and the
retirement of less fuel efficient aircraft.
The lost time injury rate fell by 25% in 2015,
principally due to a reduction in the
number of injuries to cabin crew.
Other Operations
Air China
The Cathay Pacific group’s share of Air
China’s results is based on its financial
statements drawn up three months in
arrear. Consequently, the 2015 results
include Air China’s results for the 12
months ended 30th September 2015,
adjusted for any significant events or
transactions for the period from 1st
October 2015 to 31st December 2015.
In the year ended 30th September 2015,
Air China’s results improved, principally
as a result of low fuel prices and strong
passenger demand, which more than
offset the effect of foreign exchange
losses caused by the depreciation of the
Renminbi. The Group recorded a
significantly higher profit from Air China
in 2015.
Air China Cargo
Air China Cargo’s 2015 financial results
were in line with those of 2014. The
adverse effects of exchange losses on
retranslation of US dollar loans and lower
yield in the highly competitive air cargo
market were offset by savings from low fuel
prices.
Outlook
The operating environment was better in
2015 than in 2014, but some significant
challenges were faced, which are
expected to continue in 2016. Strong
competition from other airlines in the
region, foreign currency movements and
weak premium class passenger demand
will put pressure on passenger yield. Cargo
demand will be adversely affected by
industry overcapacity. Overall passenger
demand remains strong and the airlines
expect to continue to benefit from low fuel
prices. Cathay Pacific’s subsidiaries and
associates are expected to perform well.
The Cathay Pacific group is confident of
longer term success, and will continue to
help passengers to travel well. Dragonair is
being rebranded as Cathay Dragon, as
part of an effort to create a more
consistent travel experience between the
two airlines. Investments will continue in
aircraft, in products and in the
development of the network. The financial
position is strong. Supported by its world-
class team, Cathay Pacific remains deeply
committed to strengthening the aviation
hub in Hong Kong, the home city of
Cathay Pacific for the past 70 years.
Ivan Chu
2015 FINAL RESULTS
- 23 -
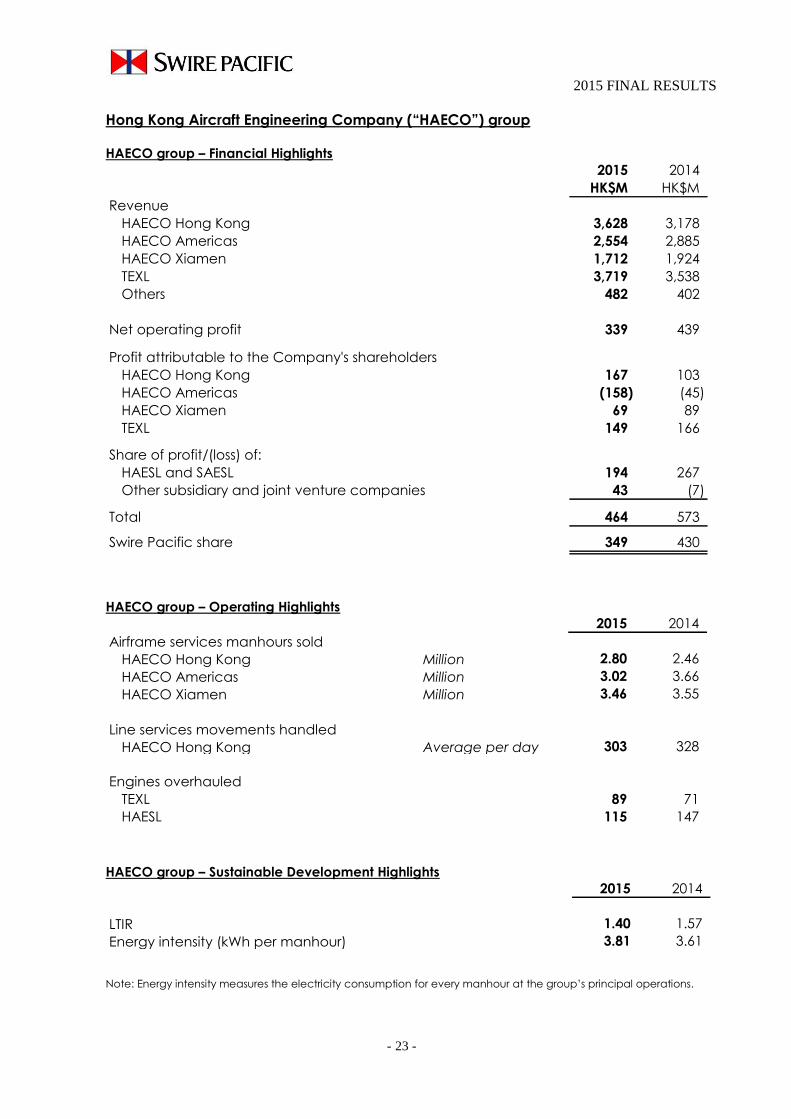
Hong Kong Aircraft Engineering Company (“HAECO”) group
HAECO group – Financial Highlights
2015 2014
HK$M HK$M
Revenue
HAECO Hong Kong 3,628 3,178
HAECO Americas 2,554 2,885
HAECO Xiamen 1,712 1,924
TEXL 3,719 3,538
Others 482 402
Net operating profit 339 439
Profit attributable to the Company's shareholders
HAECO Hong Kong 167 103
HAECO Americas (158) (45)
HAECO Xiamen 69 89
TEXL 149 166
Share of profit/(loss) of:
HAESL and SAESL 194 267
Other subsidiary and joint venture companies 43 (7)
Total 464 573
Swire Pacific share 349 430
HAECO group – Operating Highlights
2015 2014
Airframe services manhours sold
HAECO Hong Kong Million 2.80 2.46
HAECO Americas Million 3.02 3.66
HAECO Xiamen Million 3.46 3.55
Line services movements handled
HAECO Hong Kong Average per day 303 328
Engines overhauled
TEXL 89 71
HAESL 115 147
HAECO group – Sustainable Development Highlights
2015 2014
LTIR 1.40 1.57
Energy intensity (kWh per manhour) 3.81 3.61
Note: Energy intensity measures the electricity consumption for every manhour at the group’s principal operations.

2015 FINAL RESULTS
- 24 -
AVIATION MAINTENANCE AND REPAIR
INDUSTRY BACKGROUND
Orders for new aircraft are firm. Aircraft
manufacturers have record order books
and are increasing production. More
aircraft means in principle more demand
for their maintenance, repair and
overhaul (“MRO”). But new aircraft need
less MRO than older aircraft. On balance,
MRO demand is still expected to grow in
the medium and longer term.
2015 RESULTS SUMMARY
The HAECO group’s profit attributable to
shareholders in 2015 on a 100% basis was
HK$464 million, a decrease of 19%
compared to the corresponding figure in
2014 of HK$573 million. The decrease
principally reflects weaker results at
HAECO Americas, HAECO Xiamen, HAESL
and SAESL, partially offset by better results
from HAECO Hong Kong and HAECO ITM.
A total of 9.28 million airframe services
manhours were sold by HAECO Hong
Kong, HAECO Americas and HAECO
Xiamen in 2015, 4% fewer than in 2014.
The most significant decline, which had a
consequential adverse impact on the
results of the group, was at HAECO
Americas.
HAECO Hong Kong
HAECO Hong Kong recorded a 62%
increase in attributable profit in 2015 to
HK$167 million.
Manhours sold for airframe services
increased from 2.46 million in 2014 to 2.80
million in 2015. This reflected strong
demand and an increase in staff numbers.
The average number of aircraft
movements handled decreased in 2015
by 8% to 303 per day. But line services
manhours sold increased because more
work was done per movement.
Manhours sold in 2015 for component and
avionics work (together with those sold by
HAECO Component Overhaul (Xiamen))
were 0.20 million, a decrease of 12%
compared to 2014. The decrease
reflected the retirement of Boeing 747-400
aircraft.
HAECO Americas
HAECO Americas recorded a loss of
HK$158 million in 2015 compared to a loss
of HK$45 million for the 11 month post-
acquisition period in 2014. The increased
loss principally reflected a decline in
airframe services manhours sold.
Demand for HAECO Americas’ airframe
services fell to 3.02 million manhours in
2015 from 3.66 million in the post-
acquisition period in 2014. The decrease
principally reflected completion of large,
high work scope contracts and their
replacement with lower work scope
contracts.
In 2015, HAECO Americas worked on 40
cabin integration programmes compared
with 44 in the post-acquisition period in
2014, but this was partly compensated for
by more Panasonic global
communication suite kit work. HAECO
Americas shipped approximately 4,200
premium economy and economy class
seats compared with 8,600 in the post-
acquisition period in 2014. Demand for
HAECO Americas’ old seats declined and
its new seats were not in commercial
production.
HAECO Xiamen
HAECO Xiamen recorded a 22%
decrease in attributable profit in 2015 to
HK$69 million. There was less demand for
airframe services, particularly for heavy
maintenance work. Fewer airframe
services manhours were sold in 2015 (3.46
million compared with 3.55 million in 2014)
and there was very little private jet work.

2015 FINAL RESULTS
- 25 -
TEXL
In 2015, TEXL completed 59 quick turn
repairs on GE90 aircraft engines (56 of
them being heavy or medium repairs)
and 30 performance restorations on such
engines, compared to 34 quick turn
repairs and 37 performance restorations in
2014. Its after tax profit fell as it no longer
had tax losses to utilise.
HAESL and SAESL
HAESL recorded a 26% decrease in profit
in 2015. Fewer engines were overhauled.
This reflected the retirement of aircraft
operating Trent 500 engines and a
reduction in the frequency of scheduled
maintenance of Trent 700 engines.
Engine output was 115 in 2015 compared
with 147 in 2014.
SAESL recorded a 32% decrease in profit
in 2015.
In November 2015, conditional
agreements were entered into for the
restructuring of shareholdings in HAESL
and SAESL. As part of the restructuring
(and subject to satisfaction of the
conditions to which the agreements are
subject), HAESL will sell its 20%
shareholding in SAESL. This sale is
expected to result in a gain to HAESL. The
amount of the gain will depend on (inter
alia) when the agreements are
completed. For illustrative purposes only,
if (which is not certain) the agreements
are completed by the end of April 2016,
the gain to HAESL is expected to be
approximately US$229 million). 45% of the
gain to HAESL (equivalent to
approximately HK$804 million if the
agreements are completed by the end of
April 2016) is expected to be reported as
a profit by HAECO. As part of the
restructuring, HAECO agreed to increase
its shareholding in HAESL from 45% to 50%.
On completion of the restructuring, HAESL
will be owned 50% by HAECO and 50% by
Rolls-Royce and HAESL will no longer be
interested in SAESL.
Other Principal Subsidiary and Joint
Venture Companies
HAECO ITM provided inventory technical
management services for 259 aircraft in
2015, compared with 257 in 2014. Profits
increased in 2015. This reflected a higher
utilisation of rotable parts as operations
increased.
The losses of HAECO Landing Gear
Services were slightly less than in 2014. It
did more work in 2015 than in 2014, but
better operating results were largely offset
by unrealised foreign exchange losses on
loans.
Sustainable Development
The HAECO group’s lost time injury rate
decreased by 11% between 2014 and
2015, reflecting improvements in most
group companies.
The group’s energy intensity increased by
6% between 2014 and 2015 mainly as a
result of more electricity consumption in
Hong Kong and Mainland China.
Outlook
The prospects for the HAECO group’s
different businesses in 2016 are mixed.
HAECO Hong Kong’s airframe and line
services capacity are expected to grow
in 2016, with more staff being hired.
Training them will increase costs in the
short term. Further growth in capacity will
be constrained by lack of hangar space.
Demand for line services in Hong Kong in
2016 is expected to remain strong.
Demand for HAECO Americas’ airframe
services is expected to be similar to that in
2015. Results are expected to benefit
from more efficient performance of
contracts entered into in 2015. HAECO
Americas will start to deliver its new
Vector seats this year. The cabin
integration order book is strong.

2015 FINAL RESULTS
- 26 -
HAECO Xiamen expects to do less
airframe services work in 2016 than in 2015.
Demand for TEXL’s overhaul services is
expected to remain firm in 2016.
HAESL is expected to do less work per
engine in 2016.
The municipal government of Xiamen has
announced that the proposed new
airport at Xiang’an will commence
operations in 2020. This is subject to the
National Development and Reform
Commission’s approval. Management
maintains regular communications with
the local authorities about the new airport
and its opening, which will be material to
the operations of the HAECO group in
Xiamen.
Augustus Tang
2015 FINAL RESULTS
- 27 -
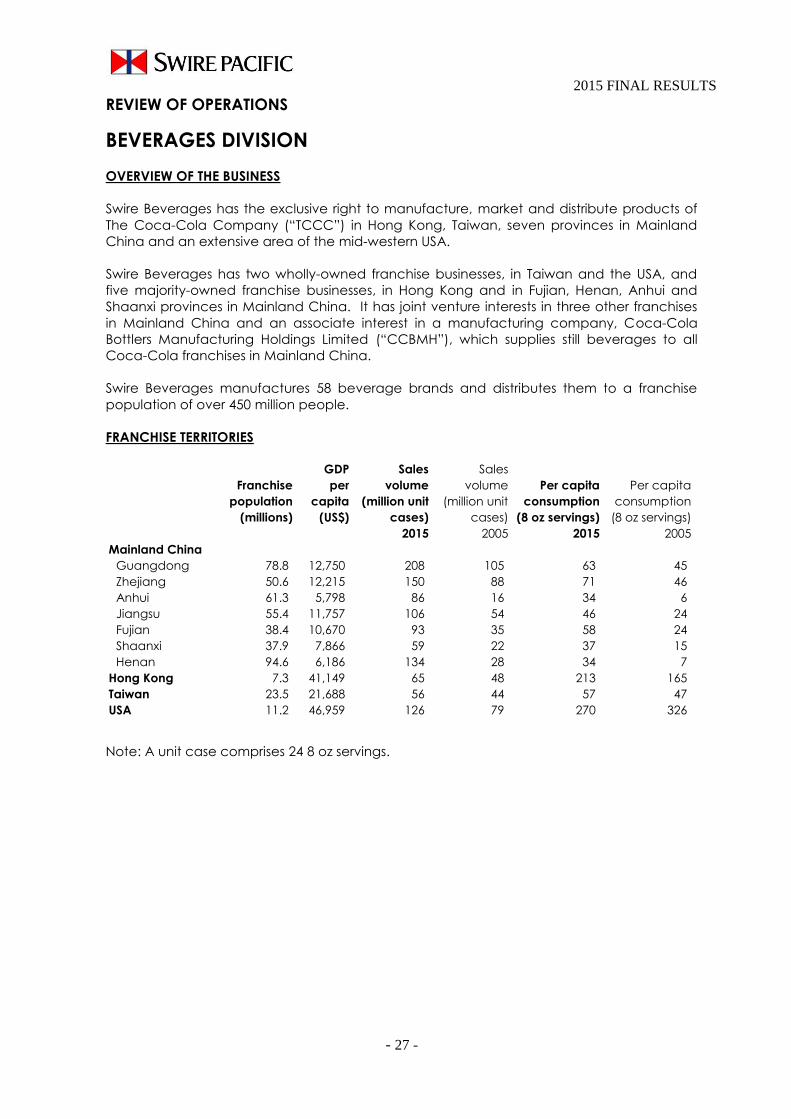
REVIEW OF OPERATIONS
BEVERAGES DIVISION
OVERVIEW OF THE BUSINESS
Swire Beverages has the exclusive right to manufacture, market and distribute products of
The Coca-Cola Company (“TCCC”) in Hong Kong, Taiwan, seven provinces in Mainland
China and an extensive area of the mid-western USA.
Swire Beverages has two wholly-owned franchise businesses, in Taiwan and the USA, and
five majority-owned franchise businesses, in Hong Kong and in Fujian, Henan, Anhui and
Shaanxi provinces in Mainland China. It has joint venture interests in three other franchises
in Mainland China and an associate interest in a manufacturing company, Coca-Cola
Bottlers Manufacturing Holdings Limited (“CCBMH”), which supplies still beverages to all
Coca-Cola franchises in Mainland China.
Swire Beverages manufactures 58 beverage brands and distributes them to a franchise
population of over 450 million people.
FRANCHISE TERRITORIES
GDP Sales Sales
Franchise per volume volume Per capita Per capita
population capita (million unit (million unit consumption consumption
(millions) (US$) cases) cases) (8 oz servings) (8 oz servings)
2015 2005 2015 2005
Mainland China
Guangdong 78.8 12,750 208 105 63 45
Zhejiang 50.6 12,215 150 88 71 46
Anhui 61.3 5,798 86 16 34 6
Jiangsu 55.4 11,757 106 54 46 24
Fujian 38.4 10,670 93 35 58 24
Shaanxi 37.9 7,866 59 22 37 15
Henan 94.6 6,186 134 28 34 7
Hong Kong 7.3 41,149 65 48 213 165
Taiwan 23.5 21,688 56 44 57 47
USA 11.2 46,959 126 79 270 326
Note: A unit case comprises 24 8 oz servings.
2015 FINAL RESULTS
- 28 -
STRATEGY:
The strategic objective of Swire Beverages is to build a world-class bottling system which is
recognised as a first class employer, a first class entity with which to do business and a first class
corporate citizen in all territories where it does business. The strategies employed in order to
achieve this objective are:
An uncompromising commitment to safety and quality.
A commitment to work with TCCC to improve our understanding of our customers’
businesses, and to use that understanding to create value for our customers and
consumers.
A focus on market execution in sales outlets, recognising that our business depends
critically on selling to millions of consumers through such outlets in our franchise territories.
Effective revenue management, through volume growth and optimisation of pricing and
product mix, and product innovation.
Effective management of costs, through improvements in productivity and efficiency in
our supply chain and in sales and distribution.
A commitment to sustainability, by seeking to reduce the environmental impact of our
operations, with a particular focus on water conservation, and by engaging with the
communities in which we operate.
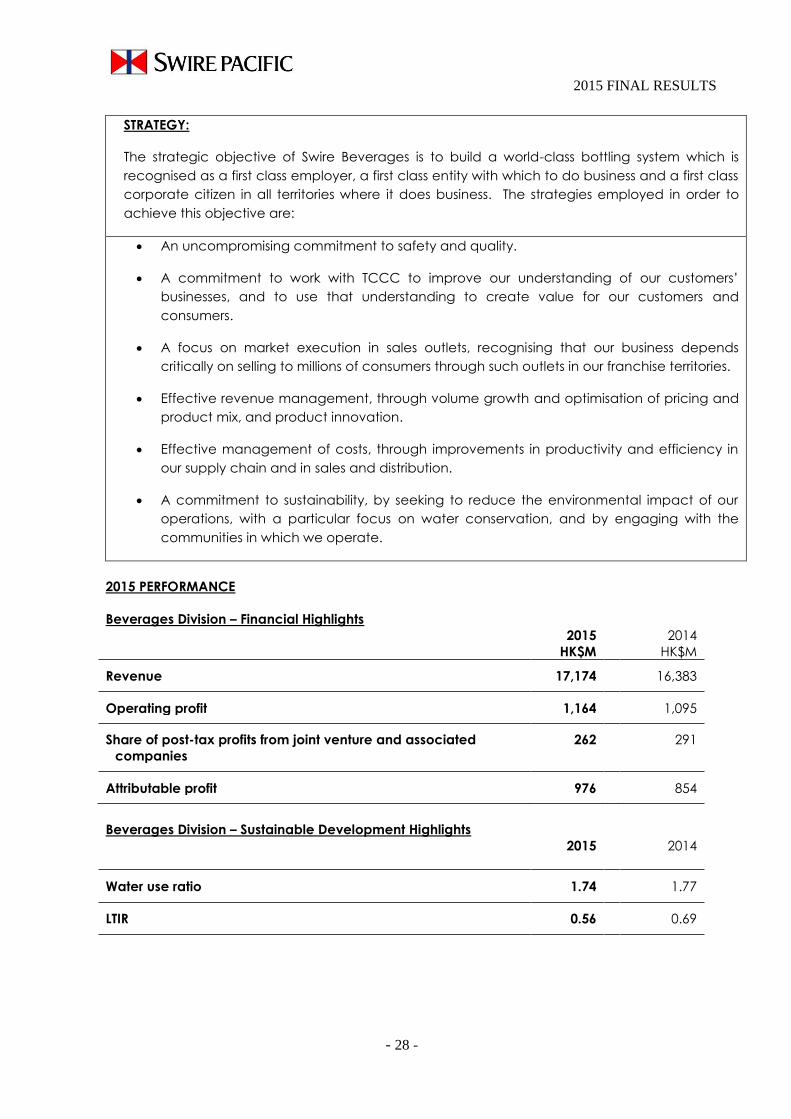
2015 PERFORMANCE
Beverages Division – Financial Highlights
2015 2014
HK$M HK$M
Revenue 17,174 16,383
Operating profit 1,164 1,095
Share of post-tax profits from joint venture and associated
companies
262 291
Attributable profit 976 854
Beverages Division – Sustainable Development Highlights
2015 2014
Water use ratio 1.74 1.77
LTIR 0.56 0.69

2015 FINAL RESULTS
- 29 -
Beverages Division – Segment Financial Highlights
2015 2014 2015 2014
HK$M HK$M HK$M HK$M
Mainland China 7,617 7,856 391 395
Hong Kong 2,200 2,164 204 185
Taiwan 1,392 1,415 34 23
USA 5,965 4,948 273 208
Central costs - - 74 43
17,174 16,383 976 854
Revenue Attributable Profit
Accounting for the Beverages Division
The seven wholly-owned and majority-owned franchise businesses (in Hong Kong, Taiwan and the USA and in Fujian, Henan, Anhui
and Shaanxi provinces in Mainland China) are accounted for as subsidiaries in the financial statements of Swire Pacific. Revenue
and operating profit shown above, therefore, are attributable to these franchise businesses only. The division’s joint venture
interests in three other franchises in Mainland China and its associate interest in CCBMH are accounted for using the equity method
of accounting. Swire Pacific recognises its share of net profit or loss from each of these interests as a single line-item in the
consolidated statement of profit or loss.
For reference, the total revenue and operating profit from the joint venture interests in three franchises in Mainland China was
HK$8,930 million and HK$469 million, respectively, in 2015 (2014: HK$9,187 million and HK$512 million, respectively). The revenue of
CCBMH, excluding sales to the seven Mainland China franchises, was HK$4,324 million in 2015 (2014: HK$5,073 million).
The sales volume for Mainland China represents sales in the seven franchises, including products supplied by CCBMH.
Central costs are arrived at after crediting gains on disposal of available-for-sale investments of HK$103 million (2014: HK$78 million).
Beverages Division – Segment Performance
Mainland Swire
China** Hong Kong Taiwan USA Beverages
Quality Production Quality Index -1.4% 2.2% 0.1% -0.2% n/a
Customers Active Outlets 4.8% -1.8% -9.8% -1.6% 3.5%
Revenue Sales Volume 2.4% 0.1% 1.5% 17.3% 3.8%
Management Revenue * -4.4% 2.3% 2.5% 4.2% -1.7%
Cost Gross Margin * 0.6% 7.6% 8.2% 3.7% 2.6%
Management Operating Profit -10.2% 13.6% 44.6% 30.4% 0.7%
Water Use Ratio -1.0% 1.0% -10.0% -5.0% -2.0%
Energy Use Ratio 0.0% 2.0% -8.0% -11.0% -3.0%
Safety LTIR -14.0% -44.0% -61.0% 7.0% -19.0%
Sustainability
Percentage Change
* Per unit case
** Segment Performance for Mainland China represents performance in the seven franchises.
2015 FINAL RESULTS
- 30 -
2015 BEVERAGE INDUSTRY REVIEW
In Mainland China, the total volume of
non-alcoholic ready-to-drink beverages
sold grew by 4% in 2015. The volume of
sparkling beverages sold grew by 2%, that
of water by 8% and that of other still
beverages by 1%. Within other still
beverages, the sales volume of juice
declined by 7%.
In Hong Kong, the total volume of non-
alcoholic ready-to-drink beverages sold
grew by 1% in 2015. Still beverages
volume grew by 2%. Sparkling beverages
volume declined (by 1%). Ready-to-drink
coffee, tea and water were the strongest
growing categories.
In Taiwan, the total volume of non-
alcoholic ready-to-drink beverages sold
grew by 2% in 2015. The volume of water
and sparkling beverages sold grew by
13% and 2% respectively. The volume of
tea and juice sold declined by 4% and 2%
respectively.
In the USA, the total volume of sparkling
beverages sold declined by 3% in 2015.
The volume of energy drinks and water
sold increased by 11% and 13%
respectively.
2015 RESULTS SUMMARY
Swire Beverages made an attributable
profit of HK$976 million in 2015, a 14%
increase from 2014. Excluding non-
recurring gains on disposal of available-
for-sale investments in 2014 and 2015
(accounted for as a credit to central
costs), attributable profit increased by
13% to HK$873 million in 2015.
The increase in attributable profit
principally reflected higher profits in Hong
Kong, Taiwan and the USA.
Overall sales volume increased by 4% to
1,083 million unit cases, compared with an
increase of 3% in 2014. Volume grew in
Mainland China, Taiwan and the USA and
was unchanged in Hong Kong. Growth
was particularly strong in the USA,
reflecting the inclusion of sales for a full
year from territories assumed in 2014.
Mainland China
Attributable profit from Mainland China
was HK$391 million, a 1% decrease from
2014.
Total sales volume increased modestly (by
2%) compared with 2014. Sparkling sales
volume grew by 4%. Water sales volume
grew by 12%. Juice sales volume
declined by 12%. Changes in the sales
mix and promotional pricing resulted in a
4% decline in revenue per unit case.
Gross margins per unit case improved by
1%. This was due to lower raw material
costs (mainly resin and aluminium). The
increase in gross margins was more than
offset by an increase in operating costs, in
particular staff costs and depreciation.
In September 2015, Swire Beverages
Holdings Limited completed the
acquisition of additional interests in three
of its subsidiaries in Mainland China. The
acquisition (which was accounted for
from July 2015, when the agreement was
signed) resulted in attributable profits
being higher by HK$21 million than they
would otherwise have been.
A decline in the share of profit from an
associated company, CCBMH, was
recorded in 2015. This reflected weak
juice sales.
Hong Kong
Attributable profit from Hong Kong in 2015
was HK$204 million, a 10% increase from
2014.
Total sales volume was unchanged in
2015. Sparkling sales volume decreased
by 1%. Still sales volume increased by 1%.
Tea and coffee sales volume increased
by 7% and 6% respectively. These
increases were offset in part by declines in
juice sales volume.
Revenue per unit case increased by 2%,
due to price increases. A 3% decrease in
raw material costs contributed to an
increase in gross margin of 8% per unit
case.
2015 FINAL RESULTS
- 31 -
Taiwan
Attributable profit from Taiwan was HK$34
million, a 48% increase from 2014.
Sales volume in 2015 increased by 2%.
Sparkling sales volume increased by 1%.
Still sales volume increased by 2%. Tea
sales increased by 4%. This principally
reflected the introduction of new
products. Existing tea products also did
well. Juice sales were weak.
Revenue per unit case in local currency
increased by 3%, due to a favourable
sales mix. A 2% decrease in raw material
costs per case (in particular of resin)
contributed to an increase in gross
margins. Higher selling and marketing
costs partly offset the beneficial effect of
the increase in gross margins.
USA
Attributable profit from the USA was
HK$273 million, a 31% increase from 2014.
Sales volume in the USA increased by 17%
in 2015. This principally reflected a full
year’s contribution from the new franchise
territories in Denver and Colorado Springs
(these territories having been assumed in
May 2014). Attributable profit from the
new territories for 2015 was HK$56 million.
Sparkling sales volume increased by 11%.
Still sales volume increased by 33%,
principally due to increases in sales of
energy and water drinks of 59% and 20%
respectively.
Revenue per unit case increased by 4%,
due to price increases. Cost of goods per
unit case increased by 5%. Gross margins
benefited from higher selling prices and
higher sales volume. These were partially
offset by higher operating costs in the
newly assumed territories.
In September 2015, Swire Beverages
conditionally agreed to acquire certain
distribution assets from TCCC in Arizona
and the right to distribute the beverage
products of TCCC in Arizona (including
the Phoenix and Tucson markets). In
December 2015, Swire Beverages
conditionally agreed to acquire from
TCCC certain production assets in
Phoenix, Arizona and Denver, Colorado.
Completion of the acquisitions is
conditional upon, among other things, all
necessary approvals being obtained.
Completion of the acquisition of the
distribution assets is expected to take
place in 2016. Completion of the
acquisition of the production assets is
expected to take place no later than
2018.
In February 2016, a letter of intent was
signed with TCCC in relation to the grant
of additional territory rights to Swire Coca-
Cola USA in the states of Washington,
Oregon and Idaho and including the
cities of Seattle and Spokane in
Washington and the city of Portland in
Oregon. The letter also contemplates the
acquisition of production facilities near
Seattle and Portland and distribution
facilities.
Sustainable Development
The water use ratio (which measures the
amount of water used to produce each
unit of production) improved by 2%
compared with 2014. The improvement is
mainly due to replacing and repairing
pipes, using water more efficiently in
cleaning and reusing treated waste
water.
2015 FINAL RESULTS
- 32 -
OUTLOOK
Sales volume in the Swire Beverages
franchise territories in Mainland China is
expected to grow modestly in 2016.
Revenue is expected to grow at a faster
rate, reflecting a better sales mix, strong
sales for immediate consumption, the
introduction of new products and strong
marketing support for existing products.
Increases in costs, in particular staff and
compliance costs, will put pressure on
margins.
In Hong Kong, moderate growth in sales
volume and revenue is expected,
reflecting the introduction of new
products and effective marketing. Raw
material costs are expected to remain
favourable. Lack of capacity and labour
shortages are problems.
The retail background in Taiwan is
expected to be difficult. However, sales
of sparkling beverages and tea are
expected to benefit from the introduction
of new products.
In the USA, the beverages market is
expected to grow moderately in 2016.
Sales of energy drinks and water are
expected to continue to grow, assisted by
the introduction of additional flavours.
The business is expected to benefit from
additional profits derived from the bottling
territories acquired in Colorado and
Arizona.
Patrick Healy

2015 FINAL RESULTS
- 33 -
REVIEW OF OPERATIONS
MARINE SERVICES DIVISION
OVERVIEW OF THE BUSINESS
The Marine Services Division, through SPO, operates offshore support vessels servicing the
energy industry in every major offshore production and exploration region outside the USA.
SPO has a windfarm installation business, a subsea inspection, maintenance and repair
(“IMR”) business and a logistics business working in the oil and gas industry.
SPO can support drilling, production, exploration, pipe-laying, subsea construction and
floating production, storage and offloading operations. SPO and its subsidiaries can carry
out seismic survey support, marine salvage, oil spill preparedness and response, offshore
wind farm construction and servicing, oil rig decommissioning, subsea remotely operated
vehicle support and supply base logistics.
The division has joint venture interests in engineering and harbour towage services in Hong
Kong through the Hongkong United Dockyards (“HUD”) group.
STRATEGY:
The principal strategic objective of the Marine Services Division is to maintain and
strengthen SPO’s position as a leader in the offshore energy supply industry. The strategies
employed in order to achieve this objective are these:
A commitment to operational excellence, to maintaining and enhancing high
standards of service to clients and to placing major emphasis on safety and training.
Selective investment in the provision of complementary marine services with a view to
increasing the range of services offered to clients and the opportunities to utilise assets
and resources.
Operating commercial joint ventures with local partners where necessary or
appropriate.
SPO:
SPO’s Fleet:
At 31st December 2015, SPO had 92 offshore support vessels. The fleet consists of anchor
handling tug supply vessels (“AHTSs”), platform supply vessels (“PSVs”) and construction and
specialist vessels (“CSVs”). The CSVs consist of inspection, maintenance and repair vessels,
seismic survey vessels, wind farm installation vessels (“WIVs”) and accommodation barges.
Except for those committed to long-term charters, SPO’s vessels can be relocated from one
operating region to another to take advantage of attractive employment opportunities.
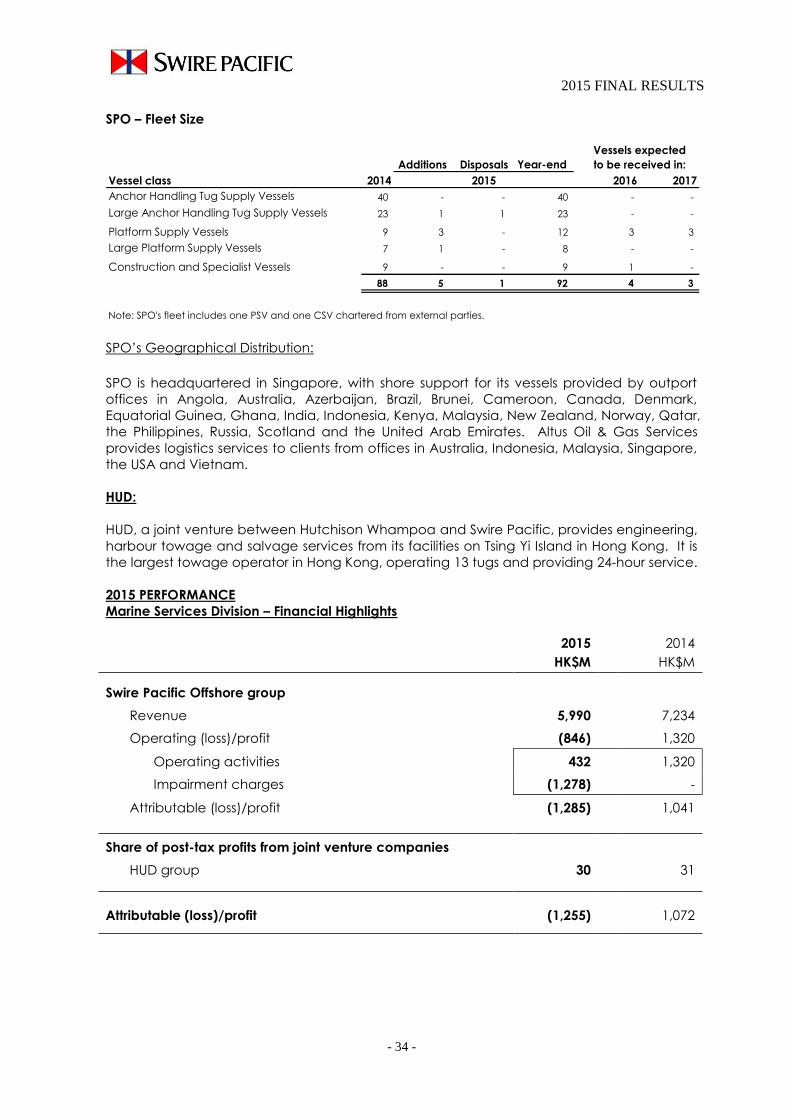
2015 FINAL RESULTS
- 34 -
SPO – Fleet Size
Additions Disposals Year-end
Vessel class 2014 2016 2017
Anchor Handling Tug Supply Vessels 40 - - 40 - -
Large Anchor Handling Tug Supply Vessels 23 1 1 23 - -
Platform Supply Vessels 9 3 - 12 3 3
Large Platform Supply Vessels 7 1 - 8 - -
Construction and Specialist Vessels 9 - - 9 1 -
88 5 1 92 4 3
Note: SPO's fleet includes one PSV and one CSV chartered from external parties.
2015
Vessels expected
to be received in:
SPO’s Geographical Distribution:
SPO is headquartered in Singapore, with shore support for its vessels provided by outport
offices in Angola, Australia, Azerbaijan, Brazil, Brunei, Cameroon, Canada, Denmark,
Equatorial Guinea, Ghana, India, Indonesia, Kenya, Malaysia, New Zealand, Norway, Qatar,
the Philippines, Russia, Scotland and the United Arab Emirates. Altus Oil & Gas Services
provides logistics services to clients from offices in Australia, Indonesia, Malaysia, Singapore,
the USA and Vietnam.
HUD:
HUD, a joint venture between Hutchison Whampoa and Swire Pacific, provides engineering,
harbour towage and salvage services from its facilities on Tsing Yi Island in Hong Kong. It is
the largest towage operator in Hong Kong, operating 13 tugs and providing 24-hour service.
2015 PERFORMANCE
Marine Services Division – Financial Highlights
2015 2014
HK$M HK$M
Swire Pacific Offshore group
Revenue 5,990 7,234
Operating (loss)/profit (846) 1,320
Operating activities 432 1,320
Impairment charges (1,278) -
Attributable (loss)/profit (1,285) 1,041
Share of post-tax profits from joint venture companies
HUD group 30 31
Attributable (loss)/profit (1,255) 1,072

2015 FINAL RESULTS
- 35 -
Marine Services Division – Sustainable Development Highlights
2015 2014
Swire Pacific Offshore group
LTIR 0.13 0.14
HUD group
LTIR 1.47 1.86
Marine Services Division – Fleet Size
2015 2014
Fleet size (number of vessels)
Swire Pacific Offshore group 92 88
HUD group 19 19
Total 111 107
Swire Pacific Offshore group
OFFSHORE EXPLORATION AND
PRODUCTION INDUSTRY BACKGROUND
Oil prices have declined significantly since
2014, adversely affecting the offshore
exploration market. Oil majors have
reduced spending on exploration and
production. Too many offshore support
vessels are chasing too little work.
Utilisation and day rates have declined
accordingly.
2015 RESULTS SUMMARY
SPO reported an attributable loss of
HK$1,285 million in 2015, compared to a
profit of HK$1,041 million in 2014.
Following a review of the business and
having regard in particular to the outlook
for the offshore oil services industry
assuming that oil prices will not recover for
some time, it was concluded that the
book value of SPO’s fleet would be
subject to significant impairment charges.
The results for the year include impairment
charges of HK$793 million accordingly, of
which HK$743 million relates to vessels
and equipment and HK$50 million relates
to goodwill and intangible assets.
The results for the year also include an
impairment charge of HK$485 million
arising from the cancellation of contracts
with a Brazilian shipyard for the
construction of four large PSVs. The
contracts were cancelled by SPO due to
the shipyard’s failure to deliver the vessels
in accordance with the contractually
agreed schedule. The matter is the
subject of arbitration proceedings in Brazil.
Excluding the impairment charges of
HK$1,278 million, SPO reported an
attributable loss of HK$7 million in 2015.
These results reflect the difficult conditions
in the offshore industry.
SPO continued to generate net cash from
operating activities (in an amount of
HK$1,692 million) in 2015.
Charter Hire
Charter hire revenue decreased by 17%
to HK$5,161 million in 2015.
SPO had a fleet utilisation rate of 74.9% in
2015, a decline of 11.7 percentage points
from 2014. Average charter hire rates
declined by 10% to USD27,100 per day.
The oversupply of tonnage in the market
has put pressure on charter hire rates and
utilisation.
2015 FINAL RESULTS
- 36 -
Core Fleet
The utilisation rate of SPO’s AHTSs and
PSVs decreased by 12.1 percentage
points to 75.2%. Charter hire rates for the
core fleet decreased by 13% to USD20,000
per day. This reflected the decline in
offshore oil and gas exploration activity.
Specialist Fleet
The utilisation rate of SPO’s CSVs
decreased by 8.6 percentage points to
72.0% and charter hire rates for the CSVs
decreased by 3% to USD94,200 per day.
During the first half of 2015, upgrades to
the jacking systems of the two wind farm
installation vessels were completed. This
resulted in off-hire periods. Both vessels
were subsequently on charter installing
wind farm foundations and turbines in the
North Sea for most of the rest of 2015. One
of the vessels also completed a
decommissioning contract in the North
Sea. The utilisation rate of seismic survey
and IMR vessels fell. Two of the three IMR
vessels are now on long-term charters.
Non-charter Hire
Non-charter hire income was HK$829
million, a decline of 20% compared to
2014. This mainly reflected lower revenue
from Altus Oil & Gas Services.
Operating Costs
Total operating costs in 2015 decreased
by HK$373 million (or 6%) to HK$5,413
million. SPO reduced operating costs by
stacking eight vessels (one seismic survey
vessel, four AHTSs and three large AHTSs).
The vessels will be returned to service
(when opportunities for their employment
arise and deferred maintenance is
completed) or sold.
Foreign exchange losses of HK$167 million
were recognised during the year, mainly
due to the revaluation of cash held in
Brazilian Reais and of claims made arising
out of the termination of shipbuilding
contracts denominated in the same
currency. The cash was held in order to
meet payments which, but for the
cancellation, would have been due in
respect of the terminated contracts.
Sustainable Development
Lost time injury rates decreased by 7% to
0.13 in 2015. SPO is committed to
operating vessels in a safe and
sustainable manner. SPO invests in training
facilities with a view to ensuring high levels
of technical and safety awareness.
FLEET
Total capital expenditure on new vessels
and other fixed assets in 2015 was
HK$1,490 million, compared to HK$3,286
million in 2014.
The delivery of one PSV which was due in
2015 has been delayed until 2016, when
two additional PSVs are also expected to
be delivered. During 2015, SPO
committed to purchase a high-speed
catamaran crew boat, which is expected
to be delivered in 2016. SPO is expecting
to dispose of its older vessels in the
coming years when opportunities arise.
At 31st December 2015, SPO had total
capital expenditure commitments of
HK$2,670 million (31st December 2014:
HK$5,177 million).
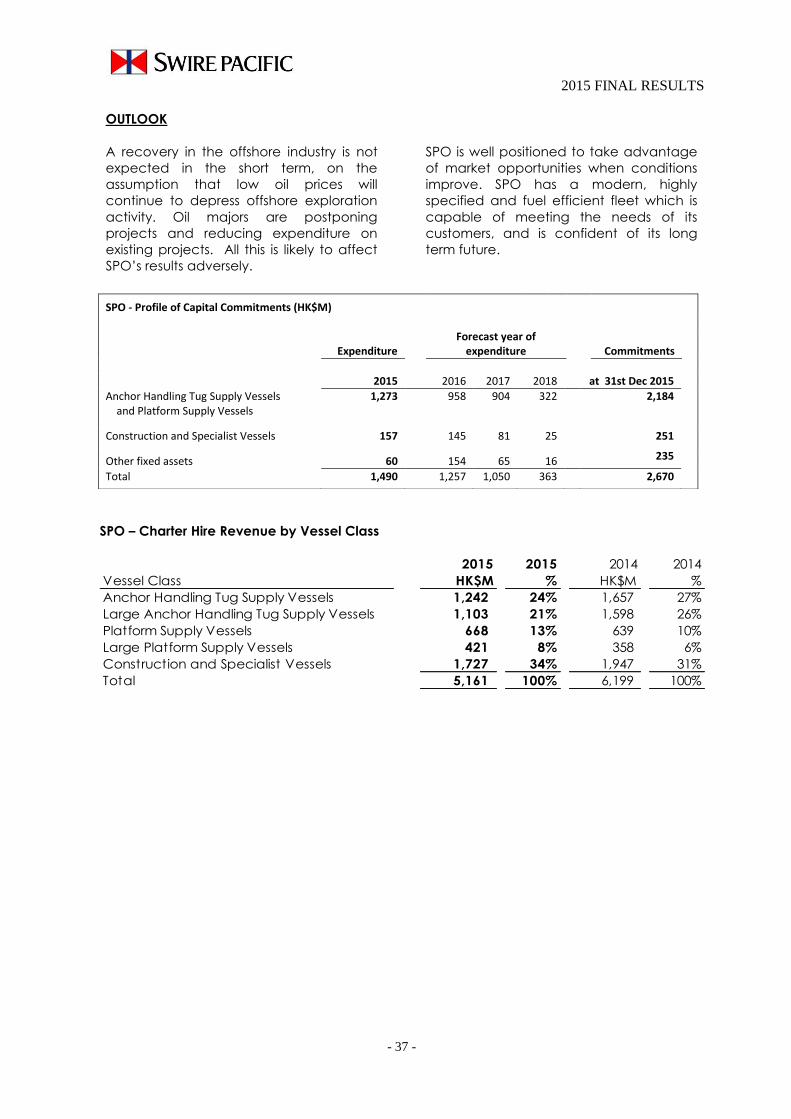
2015 FINAL RESULTS
- 37 -
OUTLOOK
A recovery in the offshore industry is not
expected in the short term, on the
assumption that low oil prices will
continue to depress offshore exploration
activity. Oil majors are postponing
projects and reducing expenditure on
existing projects. All this is likely to affect
SPO’s results adversely.
SPO is well positioned to take advantage
of market opportunities when conditions
improve. SPO has a modern, highly
specified and fuel efficient fleet which is
capable of meeting the needs of its
customers, and is confident of its long
term future.
SPO – Charter Hire Revenue by Vessel Class
2015 2015 2014 2014
Vessel Class HK$M % HK$M %
Anchor Handling Tug Supply Vessels 1,242 24% 1,657 27%
Large Anchor Handling Tug Supply Vessels 1,103 21% 1,598 26%
Platform Supply Vessels 668 13% 639 10%
Large Platform Supply Vessels 421 8% 358 6%
Construction and Specialist Vessels 1,727 34% 1,947 31%
Total 5,161 100% 6,199 100%
SPO - Profile of Capital Commitments (HK$M)
Expenditure
Forecast year of expenditure
Commitments
2015 2016 2017 2018 at 31st Dec 2015
Anchor Handling Tug Supply Vessels and Platform Supply Vessels
1,273 958 904 322 2,184
Construction and Specialist Vessels 157 145 81 25 251
Other fixed assets 60 154 65 16 235
Total 1,490 1,257 1,050 363 2,670

2015 FINAL RESULTS
- 38 -
Hongkong United Dockyards group
INDUSTRY BACKGROUND
The shipping industry was weaker than
expected in 2015. Freight rates remained
under pressure. Shipping lines cut costs
and are expected to continue to do so.
Demand for engineering services for port
equipment maintenance, infrastructure
projects and logistics support was firm.
2015 RESULTS SUMMARY
The attributable profit of the HUD group
for 2015 was HK$30 million, similar to 2014.
The salvage and towage division’s profit
(before tax and interest and on a 100%
basis) was HK$138 million in 2015,
compared with HK$152 million in 2014. The
2014 profit included a profit on disposal of
a tug of HK$16 million. Fewer container
ship movements meant fewer tug moves,
but the effect of this was offset in part by
more sea-going work and lower fuel costs.
The engineering division recorded a loss
(before tax and interest and on a 100%
basis) for 2015 of HK$58 million, compared
with a loss of HK$70 million in 2014. More
engineering contracts were obtained,
both marine and non-marine. But
revenues were affected by delays in
starting work on contracts and labour
shortages. Higher labour costs affected
profitability.
Hong Kong Salvage & Towage (“HKST”)
has 19 vessels in its fleet, including six
container vessels.
The lost time injury rate in 2015 was 21%
lower than last year.
OUTLOOK
Demand for marine engineering work is
expected to remain under pressure in
2016. However, the engineering division
has been awarded a significant non-
marine contract by the Drainage Services
Department of the Hong Kong
government. The contract is for three
years and commenced in February 2016.
HKST will aim to maintain its position as a
leading tug operator in Hong Kong, both
in the harbour and on the ocean, and will
seek additional types of work in Hong
Kong.
J B Rae-Smith

2015 FINAL RESULTS
- 39 -
REVIEW OF OPERATIONS
TRADING & INDUSTRIAL DIVISION
OVERVIEW OF THE BUSINESS
The Trading & Industrial Division has interests in the following companies:
Swire Retail group:
(i) Swire Resources group:
Swire Resources retails and distributes footwear, apparel and related accessories. At 31st
December 2015, it operated 188 retail outlets in Hong Kong and Macau and 25 retail
outlets in Mainland China.
(ii) Swire Brands group:
Swire Brands holds investments in brand-owning companies. It has an interest in an
associated company with Columbia, which distributes and retails Columbia products in
Mainland China, and a 9.4% minority interest in Rebecca Minkoff, which sells apparel,
handbags and accessories.
Taikoo Motors group:
Taikoo Motors sells passenger cars, commercial vehicles, motorcycles and scooters.
Taikoo Motors’ largest business is in Taiwan, where it sells Volkswagen, Škoda, Mercedes
Benz and Audi cars, Volkswagen light commercial vehicles, Volvo trucks and buses,
Harley-Davidson motorcycles and Vespa scooters. Taikoo Motors also distributes cars,
motorcycles and commercial vehicles in Hong Kong, Macau, Mainland China and
Malaysia.
Swire Foods group:
(i) Chongqing New Qinyuan Bakery Co. Ltd (“Qinyuan Bakery”):
Swire Foods holds a 65% interest in Qinyuan Bakery, a leading bakery chain in
southwest China, with over 500 stores in Chongqing, Guiyang and Chengdu.
(ii) Swire Foods (including Taikoo Sugar):
Swire Foods distributes food products in Mainland China. Taikoo Sugar packages and
sells sugar in Hong Kong and Mainland China under the Taikoo Sugar brand.
(iii) Campbell Swire:
Campbell Swire is a joint venture with The Campbell Soup Company which distributes
soup and broth products in Mainland China under the Campbell’s and Swanson
brands. Swire Foods has a 40% interest in the venture.

2015 FINAL RESULTS
- 40 -
Swire Pacific Cold Storage group:
Swire Pacific Cold Storage wholly owns cold storage facilities in Shanghai, Hebei, Nanjing
and Ningbo and owns a 60% equity interest in a cold storage facility in Guangzhou. It
owns land in Chengdu and (with a 35% joint venture partner) Xiamen, on which cold
storage facilities are being built.
Akzo Nobel Swire Paints:
Akzo Nobel Swire Paints is a joint venture with Akzo Nobel which manufactures and
distributes decorative paints, primarily under the Dulux brand, in Mainland China and
Hong Kong. The joint venture has manufacturing plants in Guangzhou, Shanghai and
Hebei. It has a plant under construction in Chengdu.
Swire Environmental Services group:
(i) Swire Waste Management:
Swire Waste Management is a 50:50 joint venture with a subsidiary of Waste
Management Inc. The joint venture seeks waste management contracts in Hong
Kong. It has a contract to provide waste management services to seven outlying
islands.
(ii) Swire sustainability fund:
The Swire sustainability fund has an associate interest in Green Biologics and minority
equity interests in NanoSpun Technologies and Avantium. Green Biologics is a
biotechnology company which is developing renewable chemical and biofuel
technology. NanoSpun Technologies is a company which is developing a water
treatment process using nanotechnology. Avantium is a biotechnology company
that develops and commercialises bioplastics and chemicals.

2015 FINAL RESULTS
- 41 -
STRATEGY:
The strategic objective of the Trading & Industrial Division is to expand the trading and
industrial businesses which it operates and to seek new business opportunities in related
fields where advantage can be taken of existing skills, assets or relationships. The strategies
employed in order to achieve this objective are these:
Strengthening the capability of Swire Resources in branded footwear, apparel and
related accessories by expanding the range and quality of those branded goods and by
increasing the number of retail outlets and sales channels (including online channels)
through which products are sold.
Strengthening the capability of Taikoo Motors in the import and distribution of motor
vehicles, including by selective additions to brands represented.
Using Taikoo Motors’ existing capability in order to expand into other motor-related
businesses.
Broadening the range of products sold by Swire Foods.
Increasing the range of products sold by the Qinyuan Bakery.
Expanding the network of the cold storage business in Mainland China in order to
improve operating efficiency and customer service and thereby to acquire new
customers.
Expanding and strengthening the distribution network and sales channels of Akzo Nobel
Swire Paints in Mainland China.
Increasing the number of waste management contracts awarded to Swire Waste
Management.

2015 FINAL RESULTS
- 42 -
2015 PERFORMANCE
Trading & Industrial Division - Financial Highlights
2015 2014
HK$M HK$M
Revenue
Swire Retail group 3,208 3,020
Taikoo Motors group 4,498 6,706
Swire Foods group 1,589 795
Swire Pacific Cold Storage group 34 3
9,329 10,524
Operating profits/(losses)
Swire Retail group 53 58
Taikoo Motors group 38 270
Swire Foods group 105 24
Swire Pacific Cold Storage group (94) (79)
Swire Environmental Services group (1) 1
Other subsidiary companies and central costs (33) (25)
68 249
Attributable profits/(losses)
Swire Retail group 93 82
Taikoo Motors group 3 213
Swire Foods group 41 1
Swire Pacific Cold Storage group (102) (73)
Swire Environmental Services group (44) (5)
Akzo Nobel Swire Paints 197 230
Other subsidiary companies and central costs (33) (25)
Attributable profit
155 423
2,135 Trading & Industrial Division – Sustainable Development Highlights
2015 2014
Staff turnover 45% 43%
LTIR 1.61 1.35

2015 FINAL RESULTS
- 43 -
INDUSTRY BACKGROUND
Retailing in Hong Kong and Mainland
China – Hong Kong retail sales declined
in 2015. The growth in retail sales in
Mainland China slowed in 2015.
Car sales in Taiwan – Car registrations in
Taiwan decreased by 1% to 415,855 units
in 2015.
Food sales in Mainland China – The
packaged food market in Mainland
China is estimated to have grown by 8%
in 2015.
Cold storage demand in Mainland China
– Demand for frozen food and concerns
for food safety are increasing. These
factors are increasing demand for high
standard cold storage facilities.
Paint sales in Mainland China – Total
sales of decorative paints in Mainland
China increased by 4% to 2,906 million
litres in 2015.
2015 RESULTS SUMMARY
Attributable profit from the Trading &
Industrial Division in 2015 decreased by
63% to HK$155 million. The decrease
principally reflects poor results from
Taikoo Motors, weaker results from Akzo
Nobel Swire Paints, costs associated with
developing the businesses of Swire
Pacific Cold Storage and losses from
Swire Environmental Services. The profits
of Swire Foods and Swire Retail
increased.
Swire Retail group
Attributable profit increased by 13% in
2015 to HK$93 million. The increase
mainly reflected reduced losses from
Mainland China following the closure of
certain loss-making businesses.
Revenue in Hong Kong and Macau was
6% higher than in 2014. The gross margin
rate declined due to more discounting.
Operating costs, in particular
occupancy and staff costs, rose. The
group managed 188 retail outlets in
Hong Kong and Macau at the end of
2015, four more than at the end of 2014.
Revenue in Mainland China was similar
to that of 2014. The gross margin rate
declined due to more discounting.
Operating costs were lower (because 25
Rockport and 12 Chevignon stores were
closed). The number of retail outlets
operated in Mainland China decreased
by 40 to 25 at the end of 2015.
The attributable profit of the Columbia
China associated company in 2015 was
HK$42 million, 17% higher than in 2014.
Taikoo Motors group
Attributable profit in 2015 was HK$3
million, compared with a profit of HK$213
million in 2014. The decrease principally
reflected the termination of the
Volkswagen and Škoda importerships in
Taiwan at the end of 2014.
Profits for the year included non-
recurring income relating to the
termination of the above importerships
of HK$80 million (compared with HK$126
million in 2014) and were reduced by
losses of HK$61 million relating to the
restructuring of certain loss-making
businesses in Mainland China.
In total, 17,495 cars, commercial vehicles
and motorcycles were sold in 2015, 32%
less than in 2014. 89% of these units were
sold by businesses in Taiwan. Sales of
Volkswagen cars were adversely
affected by the Volkswagen emissions
issue.
The gross margin rate improved due to
favourable foreign exchange rates for
the commercial vehicle business in Hong
Kong. Operating costs were lower. This
mainly reflected the termination of the
Volkswagen and Škoda importerships in
Taiwan.
Swire Foods group
Swire Foods reported an attributable
profit of HK$41 million in 2015, compared
with a profit of HK$1 million in 2014. The
increase principally reflected the
inclusion of full year attributable results of
Qinyuan Bakery in 2015.
2015 FINAL RESULTS
- 44 -
A 65% equity interest in Qinyuan Bakery
was acquired in December 2014.
Qinyuan Bakery operated 501 stores in
southwest China at the end of 2015, a
net increase of 36 stores since 31st
December 2014. The performance of
the business was satisfactory.
Swire Foods has agreed to acquire the
remaining 35% interest in Qinyuan Bakery
in 2016 if certain conditions are met.
Volumes of sugar sold in Hong Kong and
Mainland China in 2015 rose by 22% and
35% respectively.
Campbell Swire’s attributable loss in 2015
was HK$3 million, compared with a loss
of HK$14 million in 2014. The volume of
soup and broth products sold increased
by 4% in the year.
Swire Pacific Cold Storage group
Swire Pacific Cold Storage recorded an
attributable loss of HK$102 million in 2015
compared with a loss of HK$73 million in
2014. The loss principally reflected
operating losses at the Shanghai, Hebei
and Ningbo cold stores, and the cost of
developing new cold stores in Nanjing
and Chengdu. These costs were partly
offset by an attributable profit of HK$6
million from Guangdong Swire Cold
Chain Logistics Co. Ltd.
The Ningbo facility started operating in
July 2015. The businesses in Shanghai,
Hebei and Ningbo are growing.
Occupancy rates at these facilities at
the end of 2015 were 40%, 36% and 31%
respectively.
The Nanjing facility started operating in
January 2016. A 65% equity interest in a
joint venture building a cold storage
facility in Xiamen was acquired in
December 2015. The Xiamen and
Chengdu facilities are expected to be
completed in 2016.
The capital commitments of the Swire
Pacific Cold Storage group at 31st
December 2015 were HK$1,508 million.
Swire Environmental Services group
Swire Environmental Services reported
an attributable loss of HK$44 million in
2015, compared with a loss of HK$5
million in 2014.
Swire Waste Management recorded a
breakeven result in 2015, compared with
a profit of HK$2 million in 2014. The
operating profit from a waste
management contract was offset by
administrative costs and tender costs for
new projects.
The Swire sustainability fund’s
attributable loss for 2015 was HK$43
million. This reflected an attributable loss
from Green Biologics, which became an
associated company in 2014. The fund’s
other investments are accounted for at
cost.
Akzo Nobel Swire Paints
The attributable profit for 2015 was
HK$197 million, compared with a profit of
HK$230 million in 2014.
Sales volume in Mainland China
increased by 1% from 2014. Gross
margins decreased as a result of an
unfavourable sales mix. Akzo Nobel
Swire Paints distributed paint in
approximately 574 cities in Mainland
China at the end of 2015.
Sustainable Development
Staff turnover rates in 2015 increased by
2 percentage points to 45% compared
with 2014. This principally reflected
higher staff turnover at Swire Pacific
Cold Storage.
Lost time injury rates increased by 19% to
1.61 in 2015. This reflected an increase in
the number of minor injuries, in particular
at Swire Resources.

2015 FINAL RESULTS
- 45 -
OUTLOOK
The retail market in Hong Kong is
expected to remain relatively weak.
Increased staff and occupancy costs
are expected to put pressure on profit
margins.
Taikoo Motors expects its business to be
adversely affected by the Volkswagen
emissions issue. However, it will continue
to open new dealerships and workshops
on a selective basis.
Swire Foods’ business is expected to
grow as a result of growth at the
Qinyuan Bakery business. A new factory
in Chongqing is expected to be
operational in 2016.
Taikoo Sugar expects moderate sales
growth in 2016. A 34% owned sugar
refinery in Guangdong is expected to
start operating in 2016.
Swire Pacific Cold Storage expects to
acquire land for a new cold store facility
in Wuhan in 2016.
Akzo Nobel Swire Paints expects to
continue to expand and strengthen its
distribution network and sales channels
in Mainland China. A fourth plant (in
Chengdu) is expected to start operating
in 2016.
The overall profits of the Trading &
Industrial Division are expected to
increase but to continue to be affected
by the cost of new business
development.
J B Rae-Smith
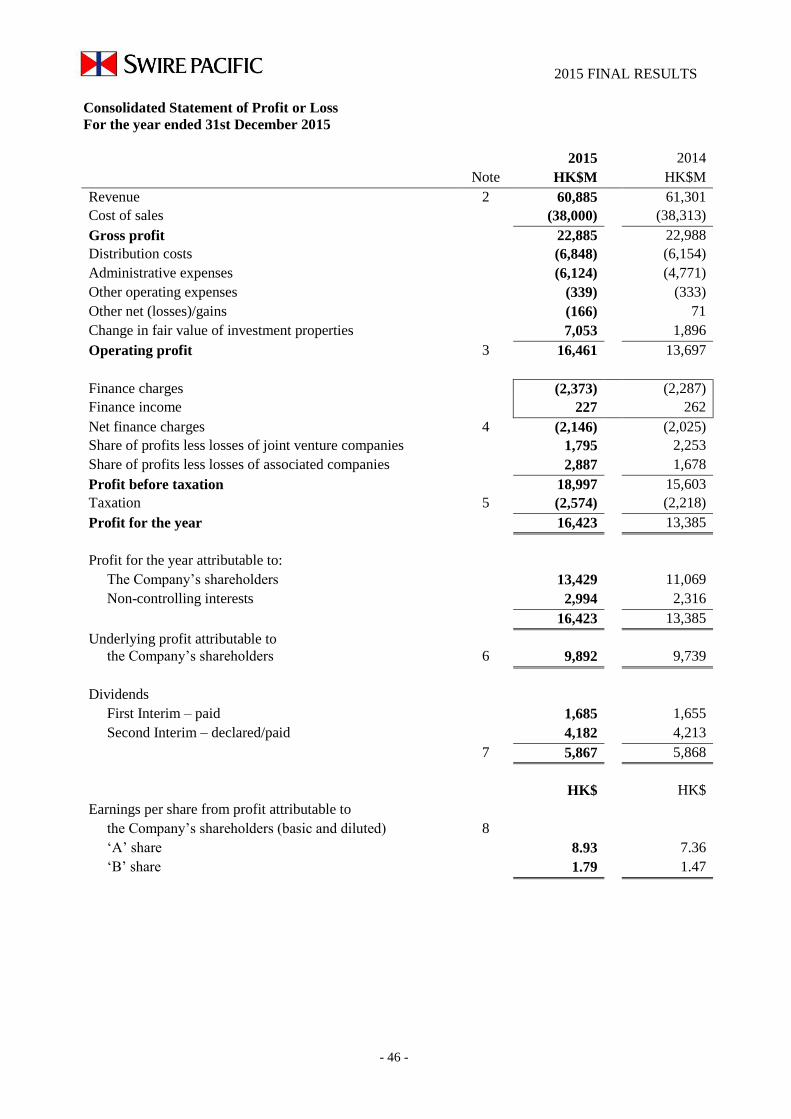
2015 FINAL RESULTS
- 5 -
Consolidated Statement of Profit or Loss
For the year ended 31st December 2015
2015 2014
Note HK$M HK$M
Revenue 2 60,885 61,301
Cost of sales (38,000) (38,313)
Gross profit 22,885 22,988
Distribution costs (6,848) (6,154)
Administrative expenses (6,124) (4,771)
Other operating expenses (339) (333)
Other net (losses)/gains (166) 71
Change in fair value of investment properties 7,053 1,896
Operating profit 3 16,461 13,697
Finance charges (2,373) (2,287)
Finance income 227 262
Net finance charges 4 (2,146) (2,025)
Share of profits less losses of joint venture companies 1,795 2,253
Share of profits less losses of associated companies 2,887 1,678
Profit before taxation 18,997 15,603
Taxation 5 (2,574) (2,218)
Profit for the year 16,423 13,385
Profit for the year attributable to:
The Company’s shareholders 13,429 11,069
Non-controlling interests 2,994 2,316
16,423 13,385
Underlying profit attributable to
the Company’s shareholders 6 9,892 9,739
Dividends
First Interim – paid 1,685 1,655
Second Interim – declared/paid 4,182 4,213
7 5,867 5,868
HK$ HK$
Earnings per share from profit attributable to
the Company’s shareholders (basic and diluted) 8
‘A’ share 8.93 7.36
‘B’ share 1.79 1.47
- 46 -

2015 FINAL RESULTS
- 6 -
Consolidated Statement of Other Comprehensive Income
For the year ended 31st December 2015
2015 2014
HK$M HK$M
Profit for the year 16,423 13,385
Other comprehensive income
Items that will not be reclassified to profit or loss
Revaluation of property previously occupied by the Group
gains recognised during the year 30 8
deferred tax (3) (2)
Defined benefit plans
remeasurement losses recognised during the year (411) (499)
deferred tax 69 109
Share of other comprehensive income of joint venture and
associated companies (130) (146)
(445) (530)
Items that can be reclassified subsequently to profit or loss
Cash flow hedges
(losses)/gains recognised during the year (430) 48
transferred to net finance charges (93) (95)
transferred to operating profit 52 9
transferred to initial cost of non-financial assets - 93
deferred tax 60 6
Net fair value changes on available-for-sale assets
losses recognised during the year (74) (53)
transferred to profit or loss on disposal (99) (91)
Share of other comprehensive income of joint venture
and associated companies (3,978) (6,016)
Net translation differences on foreign operations
losses recognised during the year (1,589) (782)
reclassified to profit or loss on disposal 142 -
(6,009) (6,881)
Other comprehensive income for the year, net of tax (6,454) (7,411)
Total comprehensive income for the year 9,969 5,974
Total comprehensive income attributable to:
The Company’s shareholders 7,445 3,888
Non-controlling interests 2,524 2,086
9,969 5,974
- 47 -
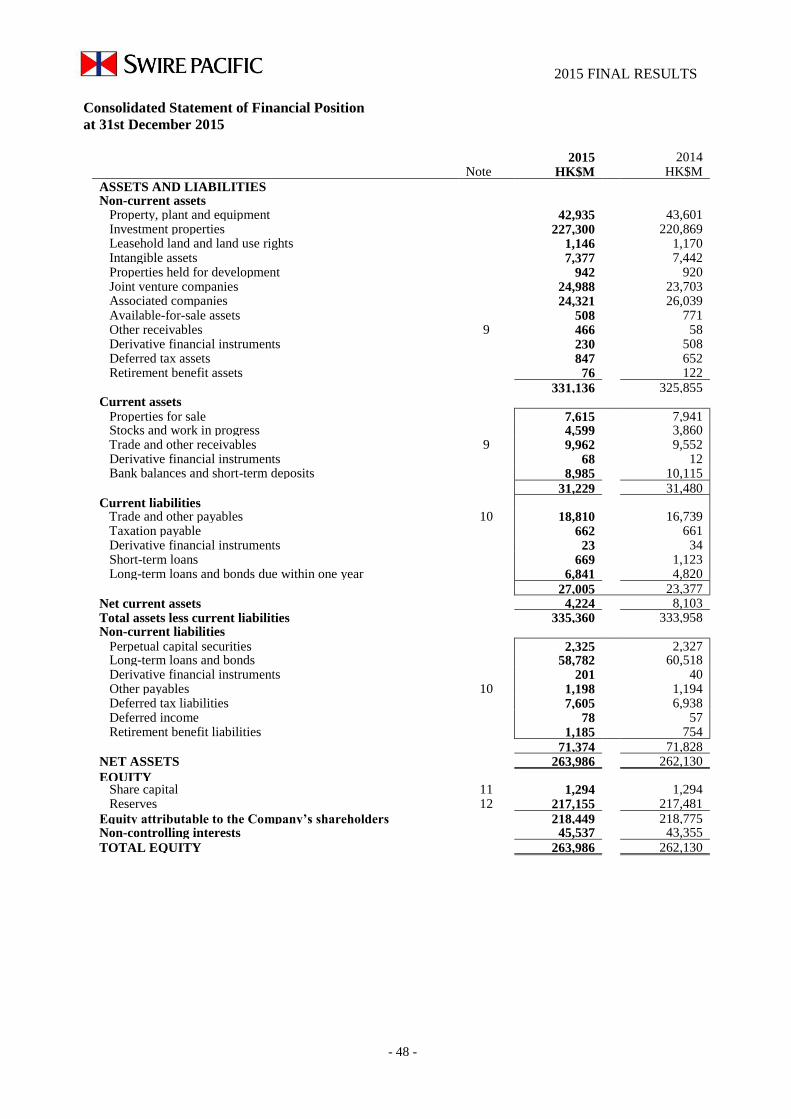
2015 FINAL RESULTS
- 7 -
Consolidated Statement of Financial Position
at 31st December 2015
2015 2014 Note HK$M HK$M
ASSETS AND LIABILITIES Non-current assets Property, plant and equipment 42,935 43,601 Investment properties 227,300 220,869 Leasehold land and land use rights 1,146 1,170 Intangible assets 7,377 7,442 Properties held for development 942 920 Joint venture companies 24,988 23,703 Associated companies 24,321 26,039 Available-for-sale assets 508 771 Other receivables 9 466 58 Derivative financial instruments 230 508 Deferred tax assets 847 652 Retirement benefit assets 76 122 331,136 325,855 Current assets Properties for sale 7,615 7,941 Stocks and work in progress 4,599 3,860 Trade and other receivables 9 9,962 9,552 Derivative financial instruments 68 12 Bank balances and short-term deposits 8,985 10,115 31,229 31,480 Current liabilities Trade and other payables 10 18,810 16,739 Taxation payable 662 661 Derivative financial instruments 23 34 Short-term loans 669 1,123 Long-term loans and bonds due within one year 6,841 4,820 27,005 23,377 Net current assets 4,224 8,103 Total assets less current liabilities 335,360 333,958 Non-current liabilities Perpetual capital securities 2,325 2,327 Long-term loans and bonds 58,782 60,518 Derivative financial instruments 201 40 Other payables 10 1,198 1,194 Deferred tax liabilities 7,605 6,938 Deferred income 78 57 Retirement benefit liabilities 1,185 754 71,374 71,828 NET ASSETS 263,986 262,130
EQUITY Share capital 11 1,294 1,294 Reserves 12 217,155 217,481
Equity attributable to the Company’s shareholders 218,449 218,775 Non-controlling interests 45,537 43,355
TOTAL EQUITY 263,986 262,130
- 48 -

2015 FINAL RESULTS
- 8 -
Consolidated Statement of Cash Flows
For the year ended 31st December 2015
2015 2014
HK$M HK$M
Operating activities
Cash generated from operations 14,362 16,250
Interest paid (2,526) (2,582)
Interest received 229 266
Tax paid (1,909) (1,358)
10,156 12,576
Dividends received from joint venture and associated companies
and available-for-sale assets 1,807 1,898
Net cash generated from operating activities 11,963 14,474
Investing activities
Purchase of property, plant and equipment (4,245) (6,181)
Additions of investment properties (3,624) (4,362)
Purchase of intangible assets (54) (41)
Proceeds from disposals of property, plant and equipment 275 242
Proceeds from disposals of investment properties 2,543 834
Proceeds from disposals of subsidiary companies 373 -
Proceeds from disposals of joint venture companies - 32
Proceeds from disposals of available-for-sale assets 209 82
Purchase of shares in new subsidiary companies (116) (3,530)
Purchase of shares in joint venture companies (114) (43)
Purchase of shares in associated companies (39) (208)
Purchase of new businesses - (117)
Purchase of available-for-sale assets (4) (245)
Loans to joint venture companies (909) (2,063)
Repayment of loans by joint venture companies 471 716
Net loans from associated companies 113 25
Decrease in deposits maturing after more than three months 52 235
Initial leasing costs incurred (70) (65)
Net cash used in investing activities (5,139) (14,689)
Net cash inflow/(outflow) before financing 6,824 (215)
Financing activities
Loans drawn and refinancing 12,993 19,714
Repayment of loans and bonds (12,979) (12,697)
14 7,017
Capital contributions from non-controlling interests 767 4
Repurchase of the Company’s shares (35) -
Proceeds from disposal of shares in an existing subsidiary company - 79
Purchase of shares in existing subsidiary companies (1,541) (1,256)
Dividends paid to the Company’s shareholders (5,898) (5,416)
Dividends paid to non-controlling interests (1,026) (1,009)
Net cash used in financing activities (7,719) (581)
Decrease in cash and cash equivalents (895) (796)
Cash and cash equivalents at 1st January 10,013 10,950
Currency adjustment (182) (141)
Cash and cash equivalents at 31st December 8,936 10,013
Represented by:
Bank balances and short-term deposits maturing within three months 8,936 10,013
- 49 -
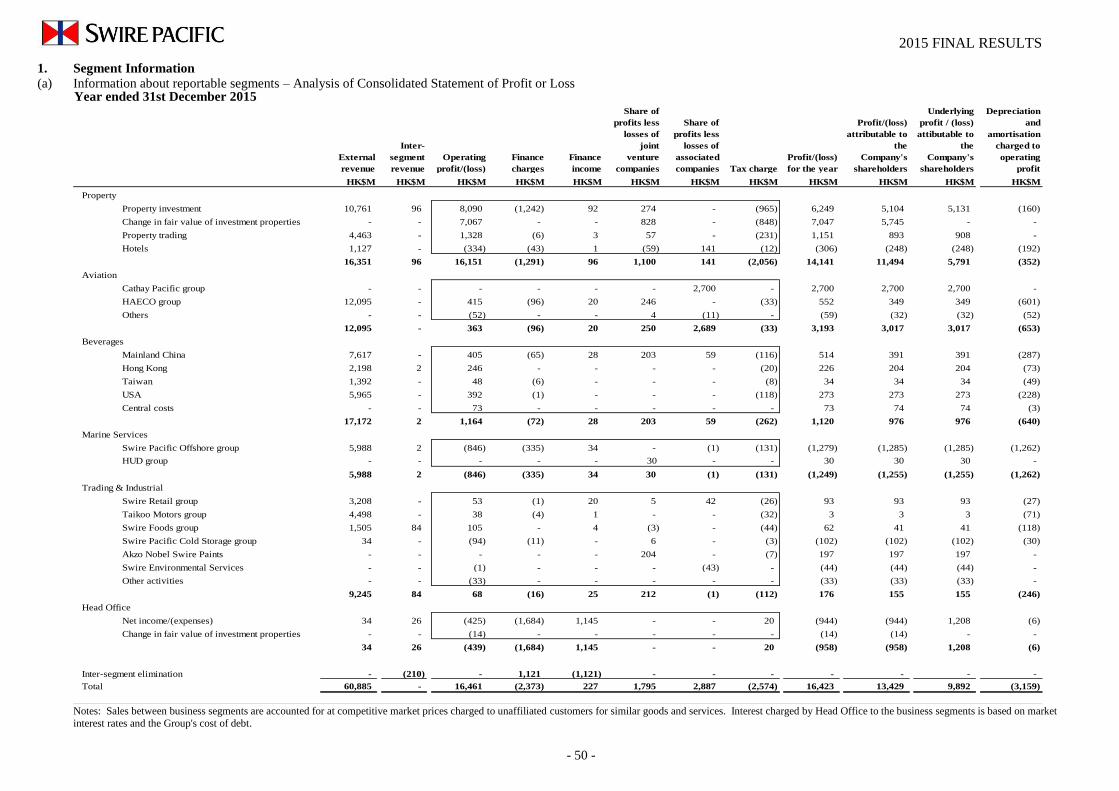
2015 FINAL RESULTS
- 50 -
Year ended 31st December 2015
1. Segment Information (a) Information about reportable segments – Analysis of Consolidated Statement of Profit or Loss
External
revenue
Inter-
segment
revenue
Operating
profit/(loss)
Finance
charges
Finance
income
Share of
profits less
losses of
joint
venture
companies
Share of
profits less
losses of
associated
companies Tax charge
Profit/(loss)
for the year
Profit/(loss)
attributable to
the
Company's
shareholders
Underlying
profit / (loss)
attibutable to
the
Company's
shareholders
Depreciation
and
amortisation
charged to
operating
profit
HK$M HK$M HK$M HK$M HK$M HK$M HK$M HK$M HK$M HK$M HK$M HK$M
Property
Property investment 10,761 96 8,090 (1,242) 92 274 - (965) 6,249 5,104 5,131 (160)
Change in fair value of investment properties - - 7,067 - - 828 - (848) 7,047 5,745 - -
Property trading 4,463 - 1,328 (6) 3 57 - (231) 1,151 893 908 -
Hotels 1,127 - (334) (43) 1 (59) 141 (12) (306) (248) (248) (192)
16,351 96 16,151 (1,291) 96 1,100 141 (2,056) 14,141 11,494 5,791 (352)
Aviation
Cathay Pacific group - - - - - - 2,700 - 2,700 2,700 2,700 -
HAECO group 12,095 - 415 (96) 20 246 - (33) 552 349 349 (601)
Others - - (52) - - 4 (11) - (59) (32) (32) (52)
12,095 - 363 (96) 20 250 2,689 (33) 3,193 3,017 3,017 (653)
Beverages
Mainland China 7,617 - 405 (65) 28 203 59 (116) 514 391 391 (287)
Hong Kong 2,198 2 246 - - - - (20) 226 204 204 (73)
Taiwan 1,392 - 48 (6) - - - (8) 34 34 34 (49)
USA 5,965 - 392 (1) - - - (118) 273 273 273 (228)
Central costs - - 73 - - - - - 73 74 74 (3)
17,172 2 1,164 (72) 28 203 59 (262) 1,120 976 976 (640)
Marine Services
Swire Pacific Offshore group 5,988 2 (846) (335) 34 - (1) (131) (1,279) (1,285) (1,285) (1,262)
HUD group - - - - - 30 - - 30 30 30 -
5,988 2 (846) (335) 34 30 (1) (131) (1,249) (1,255) (1,255) (1,262)
Trading & Industrial
Swire Retail group 3,208 - 53 (1) 20 5 42 (26) 93 93 93 (27)
Taikoo Motors group 4,498 - 38 (4) 1 - - (32) 3 3 3 (71)
Swire Foods group 1,505 84 105 - 4 (3) - (44) 62 41 41 (118)
Swire Pacific Cold Storage group 34 - (94) (11) - 6 - (3) (102) (102) (102) (30)
Akzo Nobel Swire Paints - - - - - 204 - (7) 197 197 197 -
Swire Environmental Services - - (1) - - - (43) - (44) (44) (44) -
Other activities - - (33) - - - - - (33) (33) (33) -
9,245 84 68 (16) 25 212 (1) (112) 176 155 155 (246)
Head Office
Net income/(expenses) 34 26 (425) (1,684) 1,145 - - 20 (944) (944) 1,208 (6)
Change in fair value of investment properties - - (14) - - - - - (14) (14) - -
34 26 (439) (1,684) 1,145 - - 20 (958) (958) 1,208 (6)
Inter-segment elimination - (210) - 1,121 (1,121) - - - - - - -
Total 60,885 - 16,461 (2,373) 227 1,795 2,887 (2,574) 16,423 13,429 9,892 (3,159)
Notes: Sales between business segments are accounted for at competitive market prices charged to unaffiliated customers for similar goods and services. Interest charged by Head Office to the business segments is based on market
interest rates and the Group's cost of debt.

2015 FINAL RESULTS
- 51 -
Year ended 31st December 2014
1. Segment Information (continued) (a) Information about reportable segments – Analysis of Consolidated Statement of Profit or Loss (continued)
External
revenue
Inter-
segment
revenue
Operating
profit/(loss)
Finance
charges
Finance
income
Share of
profits less
losses of
joint venture
companies
Share of
profits less
losses of
associated
companies Tax charge
Profit/(loss)
for the year
Profit/(loss)
attributable to
the Company's
shareholders
Underlying
profit / (loss)
attributable to
the Company's
shareholders
Depreciation
and
amortisation
charged to
operating
profit
HK$M HK$M HK$M HK$M HK$M HK$M HK$M HK$M HK$M HK$M HK$M HK$M
Property
Property investment 10,366 90 7,870 (1,278) 92 308 - (944) 6,048 4,938 4,956 (172)
Change in fair value of investment properties - - 1,942 - - 956 - (474) 2,424 1,987 - -
Property trading 3,842 - 1,180 - 5 226 - (211) 1,200 836 860 (7)
Hotels 1,089 - (22) (46) - (46) 160 (16) 30 25 25 (189)
15,297 90 10,970 (1,324) 97 1,444 160 (1,645) 9,702 7,786 5,841 (368)
Aviation
Cathay Pacific group - - - - - - 1,418 - 1,418 1,418 1,418 -
HAECO group 11,927 - 509 (100) 30 314 - (94) 659 430 430 (615)
Others - - (52) - - 6 (6) - (52) (26) (26) (52)
11,927 - 457 (100) 30 320 1,412 (94) 2,025 1,822 1,822 (667)
Beverages
Mainland China 7,856 - 470 (56) 35 214 77 (181) 559 395 395 (290)
Hong Kong 2,163 1 220 - - - - (16) 204 185 185 (75)
Taiwan 1,415 - 35 (6) - - - (6) 23 23 23 (52)
USA 4,948 - 327 (10) - - - (109) 208 208 208 (187)
Central costs - - 43 - - - - - 43 43 43 -
16,382 1 1,095 (72) 35 214 77 (312) 1,037 854 854 (604)
Marine Services
Swire Pacific Offshore group 7,234 - 1,320 (284) 57 - 1 (42) 1,052 1,041 1,041 (1,078)
HUD group - - - - - 31 - - 31 31 31 -
7,234 - 1,320 (284) 57 31 1 (42) 1,083 1,072 1,072 (1,078)
Trading & Industrial
Swire Retail group 3,020 - 58 (1) 23 5 36 (39) 82 82 82 (30)
Taikoo Motors group 6,706 - 270 (3) 2 - - (56) 213 213 213 (55)
Swire Foods group 701 94 24 - 2 (14) - (8) 4 1 1 (5)
Swire Pacific Cold Storage group 3 - (79) (4) 1 10 - (1) (73) (73) (73) (14)
Akzo Nobel Swire Paints - - - - - 241 - (11) 230 230 230 -
Swire Environmental Services - - 1 - - 2 (8) - (5) (5) (5) -
Other activities - - (25) 1 (1) - - - (25) (25) (25) -
10,430 94 249 (7) 27 244 28 (115) 426 423 423 (104)
Head Office
Net income/(expenses) 31 25 (348) (1,645) 1,161 - - (10) (842) (842) (273) (3)
Change in fair value of investment properties - - (46) - - - - - (46) (46) - -
31 25 (394) (1,645) 1,161 - - (10) (888) (888) (273) (3)
Inter-segment elimination - (210) - 1,145 (1,145) - - - - - - -
Total 61,301 - 13,697 (2,287) 262 2,253 1,678 (2,218) 13,385 11,069 9,739 (2,824)
Notes: Sales between business segments are accounted for at competitive market prices charged to unaffiliated customers for similar goods and services. Interest charged by Head Office to the business segments is based on market interest rates and the Group's cost of debt.

2015 FINAL RESULTS
- 52 -
1. Segment Information (continued) (a) Information about reportable segments (continued)
Analysis of total assets of the Group At 31st December 2015 Joint Bank deposits Additions to
Segment venture Associated and Total non-current
assets companies companies securities assets assets (note)
HK$M HK$M HK$M HK$M HK$M HK$M
Property
Property investment 232,503 17,307 - 3,901 253,711 4,677
Property trading and development 9,093 815 - 401 10,309 42
Hotels 6,333 1,270 534 84 8,221 490
247,929 19,392 534 4,386 272,241 5,209
Aviation
Cathay Pacific group - - 22,048 - 22,048 -
HAECO group 11,958 1,262 - 1,427 14,647 737
Others 4,571 2,816 - - 7,387 -
16,529 4,078 22,048 1,427 44,082 737
Beverages
Swire Beverages 9,037 725 1,366 940 12,068 835
Marine Services
Swire Pacific Offshore group 23,503 - 6 497 24,006 1,513
HUD group - (78) - - (78) -
23,503 (78) 6 497 23,928 1,513
Trading & Industrial
Swire Retail group 932 31 140 169 1,272 25
Taikoo Motors group 1,949 - - 279 2,228 190
Swire Foods group 1,205 48 - 428 1,681 165
Swire Pacific Cold Storage group 1,472 254 - 68 1,794 401
Akzo Nobel Swire Paints - 519 - - 519 -
Swire Environmental Services 121 19 227 - 367 -
Other activities 222 - - 1 223 -
5,901 871 367 945 8,084 781
Head Office 1,124 - - 838 1,962 51
304,023 24,988 24,321 9,033 362,365 9,126
At 31st December 2014 Joint Bank deposits Additions to
Segment venture Associated and Total non-current
assets companies companies securities assets assets (note)
HK$M HK$M HK$M HK$M HK$M HK$M
Property
Property investment 222,590 16,046 28 2,092 240,756 4,452
Property trading and development 9,417 891 - 612 10,920 176
Hotels 6,301 1,270 507 170 8,248 554
238,308 18,207 535 2,874 259,924 5,182
Aviation
Cathay Pacific group - - 23,774 - 23,774 -
HAECO group 11,460 1,240 - 2,331 15,031 678
Others 4,624 2,818 (7) - 7,435 -
16,084 4,058 23,767 2,331 46,240 678
Beverages
Swire Beverages 9,072 615 1,407 949 12,043 914
Marine Services
Swire Pacific Offshore group 24,928 - 6 1,152 26,086 3,184
HUD group - (54) - - (54) -
24,928 (54) 6 1,152 26,032 3,184
Trading & Industrial
Swire Retail group 855 27 98 312 1,292 23
Taikoo Motors group 1,634 - - 1,218 2,852 206
Swire Foods group 994 17 - 353 1,364 5
Swire Pacific Cold Storage group 1,161 264 - 105 1,530 660
Akzo Nobel Swire Paints - 550 - - 550 -
Swire Environmental Services 121 - 226 - 347 -
Other activities 211 19 - - 230 -
4,976 877 324 1,988 8,165 894
Head Office 4,061 - - 870 4,931 22
297,429 23,703 26,039 10,164 357,335 10,874
Note:
In this analysis, additions to non-current assets during the year exclude joint venture and associated companies, financial
instruments, deferred tax assets and retirement benefit assets and non-current assets acquired in business combinations.
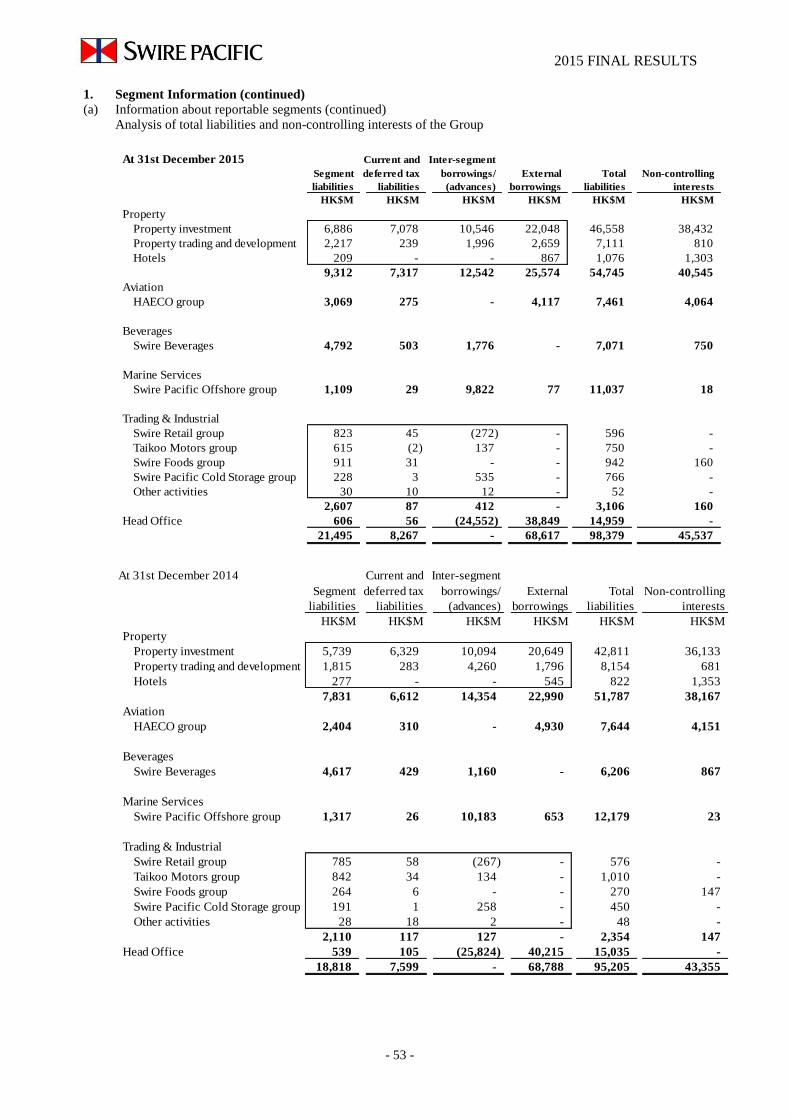
2015 FINAL RESULTS
- 53 -
1. Segment Information (continued)
(a) Information about reportable segments (continued)
Analysis of total liabilities and non-controlling interests of the Group
At 31st December 2015 Current and Inter-segment
Segment deferred tax borrowings/ External Total Non-controlling
liabilities liabilities (advances) borrowings liabilities interests
HK$M HK$M HK$M HK$M HK$M HK$M
Property
Property investment 6,886 7,078 10,546 22,048 46,558 38,432
Property trading and development 2,217 239 1,996 2,659 7,111 810
Hotels 209 - - 867 1,076 1,303
9,312 7,317 12,542 25,574 54,745 40,545
Aviation
HAECO group 3,069 275 - 4,117 7,461 4,064
Beverages
Swire Beverages 4,792 503 1,776 - 7,071 750
Marine Services
Swire Pacific Offshore group 1,109 29 9,822 77 11,037 18
Trading & Industrial
Swire Retail group 823 45 (272) - 596 -
Taikoo Motors group 615 (2) 137 - 750 -
Swire Foods group 911 31 - - 942 160
Swire Pacific Cold Storage group 228 3 535 - 766 -
Other activities 30 10 12 - 52 -
2,607 87 412 - 3,106 160
Head Office 606 56 (24,552) 38,849 14,959 -
21,495 8,267 - 68,617 98,379 45,537
At 31st December 2014 Current and Inter-segment
Segment deferred tax borrowings/ External Total Non-controlling
liabilities liabilities (advances) borrowings liabilities interests
HK$M HK$M HK$M HK$M HK$M HK$M
Property
Property investment 5,739 6,329 10,094 20,649 42,811 36,133
Property trading and development 1,815 283 4,260 1,796 8,154 681
Hotels 277 - - 545 822 1,353
7,831 6,612 14,354 22,990 51,787 38,167
Aviation
HAECO group 2,404 310 - 4,930 7,644 4,151
Beverages
Swire Beverages 4,617 429 1,160 - 6,206 867
Marine Services
Swire Pacific Offshore group 1,317 26 10,183 653 12,179 23
Trading & Industrial
Swire Retail group 785 58 (267) - 576 -
Taikoo Motors group 842 34 134 - 1,010 -
Swire Foods group 264 6 - - 270 147
Swire Pacific Cold Storage group 191 1 258 - 450 -
Other activities 28 18 2 - 48 -
2,110 117 127 - 2,354 147
Head Office 539 105 (25,824) 40,215 15,035 -
18,818 7,599 - 68,788 95,205 43,355

2015 FINAL RESULTS
- 54 -
1. Segment Information (continued)
(a) Information about reportable segments (continued)
The Group is organised on a divisional basis: Property, Aviation, Beverages, Marine Services and
Trading & Industrial.
The reportable segments within each of the five divisions are classified according to the nature of the
business. The Head Office is also considered to be a reportable segment as discrete financial
information is available for the Head Office activities and regularly provided to the executive directors
of the Board.
The Beverages Division is considered to be a single reportable segment as the nature of its operations in
different geographical locations is similar. The analysis of the consolidated statement of profit or loss
presents the results of the Beverages Division by geographical location in order to provide further
information to the user of this analysis.
(b) The activities of the Group are principally based in Hong Kong. Ship owning and operating activities
are carried out internationally and cannot be attributed to specific geographical areas.
An analysis of revenue and non-current assets of the Group by principal markets is outlined below:
Revenue Non-current assets (Note)
2015 2014 2015 2014
HK$M HK$M HK$M HK$M
Hong Kong 23,715 21,928 209,501 204,917
Asia (excluding Hong Kong) 23,026 24,713 37,606 36,957
United States of America 8,049 7,648 10,944 8,531
Others 531 465 1 530
Ship owning and operating activities 5,564 6,547 21,648 23,125
60,885 61,301 279,700 274,060
Note:
In this analysis, the total of non-current assets excludes joint venture and associated companies, financial
instruments, deferred tax assets and retirement benefit assets.
2. Revenue
Revenue represents sales by the Company and its subsidiary companies to external customers and
comprises revenue from:
2015 2014
HK$M HK$M
Gross rental income from investment properties 10,654 10,256
Property trading 4,463 3,842
Hotels 1,127 1,089
Aircraft and engine maintenance services 10,815 10,733
Sales of goods 27,083 27,541
Charter hire 5,161 6,199
Rendering of other services 1,582 1,641
Total 60,885 61,301

2015 FINAL RESULTS
- 55 -
3. Operating Profit
2015 2014
HK$M HK$M
Operating profit has been arrived at after charging:
Depreciation of property, plant and equipment 2,833 2,566
Amortisation of leasehold land and land use rights 34 33
Amortisation of intangible assets 138 136
Amortisation of initial leasing costs 67 89
Loss on sale of investment properties 135 39
Loss on sale of property, plant and equipment - 19
Loss on disposal of four hotels in the UK 229 -
Impairment losses recognised on property, plant and equipment 1,302 27
And after crediting:
Dividend income on available-for-sale assets 11 5
Profit on sale of available-for-sale assets 105 78
4. Net Finance Charges
2015 2014
HK$M HK$M
Interest charged:
Bank loans and overdrafts 642 753
Other loans, bonds and perpetual capital securities 1,988 1,889
Fair value gains on derivative instruments:
Interest rate swaps: cash flow hedges, transferred
from other comprehensive income (93) (95)
Interest rate swaps not qualifying as hedges (30) -
Amortised loan fees - loans at amortised cost 106 107
2,613 2,654
Fair value loss on put options over non-controlling interests
in subsidiary companies 18 29
Other financing costs 136 117
Capitalised on:
Investment properties (199) (185)
Properties for sale (150) (221)
Hotel and other properties (16) (7)
Vessels (29) (100)
2,373 2,287
Less interest income:
Short-term deposits and bank balances 107 149
Fair value gain on put options over non-controlling interests
in subsidiary companies - 1
Other loans 120 112
227 262
Net finance charges 2,146 2,025

2015 FINAL RESULTS
- 56 -
5. Taxation
Hong Kong profits tax is calculated at 16.5% (2014: 16.5%) on the estimated assessable profits for the
year. Overseas tax is calculated at tax rates applicable in jurisdictions in which the Group is assessable
for tax.
6. Underlying Profit Attributable to the Company’s Shareholders
Reported and underlying profit attributable to the Company’s shareholders is reconciled as follows:
2015 2014
Note HK$M HK$M
Profit attributable to the Company’s shareholders per financial
statements
13,429
11,069
Adjustments in respect of investment properties:
Revaluation of investment properties (a) (8,123) (3,088)
Deferred tax on investment properties (b) 1,090 710
Realised profit on sale of investment properties (c) 2,180 598
Depreciation of investment properties occupied by the Group (d) 23 23
Non-controlling interests’ share of adjustments 1,293 427
Underlying profit attributable to the Company’s shareholders 9,892 9,739
Notes:
(a) This represents the Group’s net revaluation movements as shown in the consolidated statement of profit or loss plus the
Group's share of net revaluation movements of joint venture companies.
(b) This represents deferred tax movements on the Group’s investment properties and the Group’s share of deferred tax
movements on investment properties held by joint venture companies. These comprise deferred tax on revaluation
movements on investment properties in Mainland China and the USA, and deferred tax provisions made in respect of
investment properties held for the long-term where it is considered that the liability will not reverse for some considerable
time.
(c) Prior to the implementation of HKAS 40, changes in the fair value of investment properties were recorded in the revaluation
reserve rather than the statement of profit or loss. On sale, the revaluation gains were transferred from the revaluation reserve
to the statement of profit or loss.
(d) Prior to the implementation of HKAS 40, no depreciation was charged on investment properties occupied by the Group.
7. Dividends
2015 2014
HK$M HK$M
First interim dividend paid on 6th October 2015 of HKȼ112.0 per ‘A’ share
and HKȼ22.4 per ‘B’ share (2014: HKȼ110.0 and HKȼ22.0) 1,685 1,655
Second interim dividend declared on 10th March 2016 of
HKȼ278.0 per ‘A’ share and HKȼ55.6 per ‘B’ share
(2014 actual dividend paid: HKȼ280.0 and HKȼ56.0) 4,182 4,213
5,867 5,868
2015 2014
HK$M HK$M
Current taxation:
Hong Kong profits tax 1,190 1,020
Overseas taxation 741 530
(Over)/under-provisions in prior years (14) 13
1,917 1,563
Deferred taxation:
Changes in fair value of investment properties 592 265
Origination and reversal of temporary differences 65 390
657 655
2,574 2,218

2015 FINAL RESULTS
- 57 -
7. Dividends (continued)
The second interim dividend is not accounted for in 2015 because it had not been declared at the year end
date. The actual amount payable in respect of 2015 will be accounted for as an appropriation of the
revenue reserve in the year ending 31st December 2016.
The Directors have declared second interim dividends of HK¢278.0 per ‘A’ share and HK¢55.6 per ‘B’
share which, together with the first interim dividends of HK¢112.0 per ‘A’ share and HK¢22.4 per ‘B’
share paid in October 2015, amount to full year dividends of HK¢390.0 per ‘A’ share and HK¢78.0 per
‘B’ share in respect of 2015, the same as those paid in respect of 2014. The second interim dividends
will be paid on 6th May 2016 to shareholders registered at the close of business on the record date, being
Friday, 15th April 2016. Shares of the Company will be traded ex-dividend from Wednesday, 13th April
2016.
The register of members will be closed on Friday, 15th April 2016, during which day no transfer of
shares will be effected. In order to qualify for entitlement to the second interim dividends, all transfer
forms, accompanied by the relevant share certificates, must be lodged with the Company’s share
registrars, Computershare Hong Kong Investor Services Limited, 17th Floor, Hopewell Centre, 183
Queen’s Road East, Hong Kong, for registration not later than 4:30 p.m. on Thursday, 14th April 2016.
To facilitate the processing of proxy voting for the annual general meeting to be held on 12th May 2016,
the register of members will be closed from 9th May 2016 to 12th May 2016, both days inclusive, during
which period no transfer of shares will be effected. In order to be entitled to attend and vote at the annual
general meeting, all transfer forms accompanied by the relevant share certificates must be lodged with
the Company’s share registrars, Computershare Hong Kong Investor Services Limited, 17th Floor,
Hopewell Centre, 183 Queen’s Road East, Hong Kong, for registration not later than 4:30 p.m. on
Friday, 6th May 2016.
8. Earnings Per Share (Basic and Diluted)
Earnings per share is calculated by dividing the profit attributable to the Company’s shareholders of
HK$13,429 million (2014: HK$11,069 million) by the weighted average number of 905,397,863 ‘A’
shares and 2,995,220,000 ‘B’ shares in issue during the year, (2014: 905,578,500 ‘A’ shares and
2,995,220,000 ‘B’ shares) in the proportion five to one.
9. Trade and Other Receivables
2015 2014
HK$M HK$M
Trade debtors 3,529 3,719
Amounts due from immediate holding company 2 2
Amounts due from joint venture companies 160 142
Amounts due from associated companies 610 457
Interest-bearing advance to an associated company 117 123
Prepayments and accrued income 2,578 2,314
Other receivables 3,432 2,853
10,428 9,610
Amounts due after one year included under non-current assets (466) (58)
9,962 9,552

2015 FINAL RESULTS
- 58 -
9. Trade and Other Receivables (continued)
The analysis of the age of trade debtors at year-end (based on the invoice date) is as follows:
2015 2014
HK$M HK$M
Up to three months 3,318 3,523
Between three and six months 115 132
Over six months 96 64
3,529 3,719
The various Group companies have different credit policies, depending on the requirements of their
markets and the businesses in which they operate. Analyses of the age of debtors are prepared and
closely monitored with a view to minimising credit risk associated with receivables.
10. Trade and Other Payables
2015 2014
HK$M HK$M
Trade creditors 3,645 3,812
Amounts due to immediate holding company 168 191
Amounts due to joint venture companies 207 179
Amounts due to associated companies 101 238
Interest-bearing advances from joint venture companies 343 402
Interest-bearing advances from an associated company 296 128
Advances from non-controlling interests 159 125
Rental deposits from tenants 2,389 2,303
Put option over non-controlling interest in
Brickell City Centre 509 470
Put option over non-controlling interest in
subsidiary companies 74 127
Contingent consideration 932 388
Accrued capital expenditure 1,454 734
Other accruals 5,229 5,117
Other payables 4,502 3,719
20,008 17,933
Amounts due after one year included under
non-current liabilities (1,198) (1,194)
18,810 16,739
The analysis of the age of trade creditors at the year-end is as follows:
2015 2014
HK$M HK$M
Up to three months 3,470 3,606
Between three and six months 123 139
Over six months 52 67
3,645 3,812

2015 FINAL RESULTS
- 59 -
11. Share Capital
‘A’ shares ‘B’ shares Total
HK$M
Issued and fully paid:
At 1st January 2015 905,578,500 2,995,220,000 1,294
Repurchased during the year (372,500) - -
At 31st December 2015 905,206,000 2,995,220,000 1,294
At 1st January 2014 905,578,500 2,995,220,000 903
Transition to no-par value regime on 3rd March 2014 - - 391
At 31st December 2014 905,578,500 2,995,220,000 1,294
The transition to the no-par value regime under the Hong Kong Companies Ordinance occurred
automatically on 3rd March 2014. On that date, the share premium account and the capital redemption
reserve became part of share capital in accordance with section 37 of Schedule 11 to the Ordinance.
These changes did not affect the number of shares in issue or the relative entitlements of any of the
members. Since that date, all changes in share capital have been made in accordance with the
requirements of Parts 4 and 5 of the Ordinance.
In July 2015, the company repurchased 372,500 ‘A’ shares on The Stock Exchange of Hong Kong
Limited for a total aggregate price paid of HK$35 million. The highest and lowest price paid per ‘A’
share was HK$92.86. The repurchase was governed by section 257 of the Hong Kong Companies
Ordinance. The total amount paid for the repurchased ‘A’ shares was paid wholly out of the
distributable profits included in revenue reserve.
Except for voting rights, which are equal, the entitlements of ‘A’ and ‘B’ shareholders are in
proportion five to one.

2015 FINAL RESULTS
- 60 -
12. Reserves
Cash
Property Investment flow
Revenue revaluation revaluation hedge Translation
reserve reserve reserve reserve reserve Total
HK$M HK$M HK$M HK$M HK$M HK$M
At 1st January 2015 214,880 1,972 772 (4,094) 3,951 217,481
Profit for the year 13,429 - - - - 13,429
Other comprehensive income
Defined benefit plans
- remeasurement gains recognised
during the year (332) - - - - (332)
- deferred tax 57 - - - - 57
Cash flow hedges
- losses recognised during the year - - - (410) - (410)
- transferred to net finance charges - - - (94) - (94)
- transferred to operating profit - - - 49 - 49
- deferred tax - - - 57 - 57
Net fair value changes on
available-for-sale assets
- losses recognised during the year - - (74) - - (74)
- transferred to profit or loss on disposal - - (99) - - (99)
Revaluation of property previously
occupied by the Group
- gains recognised during the year - 25 - - - 25
- deferred tax - (3) - - - (3)
Share of other comprehensive income of
joint venture and associated companies (125) - (156) (2,806) (920) (4,007)
Net translation differences on
foreign operations
- losses recognised during the year - - - - (1,269) (1,269)
- reclassified to profit or loss on disposal - - - - 116 116
13,029 22 (329) (3,204) (2,073) 7,445
Total comprehensive income for the year
Acquisition of additional interests in
subsidiary companies (1,310) - - - - (1,310)
Change in composition of the Group 13 - - - - 13
Repurchase of the Company’s
shares (note 11) (35) - - - - (35)
Recognition of contingent consideration (541) - - - - (541)
2014 second interim dividend (note 7) (4,213) - - - - (4,213)
2015 first interim dividend (note 7) (1,685) - - - - (1,685)
At 31st December 2015 220,138 1,994 443 (7,298) 1,878 217,155

2015 FINAL RESULTS
- 61 -
12. Reserves (continued)
Capital Property Investment Cash flow
Revenue Share redemption revaluation revaluation hedge Translation
reserve premium reserve reserve reserve reserve reserve Total
HK$M HK$M HK$M HK$M HK$M HK$M HK$M HK$M
At 1st January 2014 209,682 342 49 1,967 884 1,517 4,953 219,394
Profit for the year 11,069 - - - - - - 11,069
Other comprehensive income
Defined benefit plans
- remeasurement gains recognised
during the year (417) - - - - - - (417)
- deferred tax 96 - - - - - - 96
Cash flow hedges
- gains recognised during the year - - - - - 35 - 35
- transferred to net finance charges - - - - - (95) - (95)
- transferred to operating profit - - - - - 6 - 6
- transferred to initial cost of
non-financial assets - - - - - 93 - 93
- deferred tax - - - - - 9 - 9
Net fair value changes on
available-for-sale assets
- losses recognised during the year - - - - (53) - - (53)
- transferred to profit or loss on disposal - - - - (91) - - (91)
Revaluation of property previously
occupied by the Group
- gains recognised during the year - - - 7 - - - 7
- deferred tax - - - (2) - - - (2)
Share of other comprehensive income of
joint venture and associated companies (140) - - - 32 (5,659) (367) (6,134)
Net translation differences on
foreign operations - - - - - - (635) (635)
10,608 - - 5 (112) (5,611) (1,002) 3,888
Total comprehensive income for the year
Change in composition of the Group 6 - - - - - - 6
Transition to no-par value regime on
3rd March 2014 (note 11) - (342) (49) - - - - (391)
2013 second interim dividend (3,761) - - - - - - (3,761)
2014 first interim dividend (note 7) (1,655) - - - - - - (1,655)
At 31st December 2014 214,880 - - 1,972 772 (4,094) 3,951 217,481

2015 FINAL RESULTS
- 62 -
13. Changes in Accounting Policies and Disclosures
i. The following amendments to standards were required to be adopted by the Group effective from 1st
January 2015:
HKFRSs (Amendment) Annual Improvements to HKFRSs 2010-2012 Cycle
Annual Improvements to HKFRSs 2011-2013 Cycle
HKAS 19 (Amendment) Defined Benefit Plans – Employee Contributions
The adoption of these amendments has had no significant impact on the Group’s financial statements.
ii. Hong Kong Companies Ordinance (Cap. 622)
The requirements of Part 9 “Accounts and Audit” of the Hong Kong Companies Ordinance (Cap. 622)
started to apply in respect of the financial year. As a result, there are changes to presentation and
disclosures of certain information in the consolidated financial statements.
iii. The Group has not early adopted the following relevant new and revised standards that have been issued
but are not yet effective:
HKFRSs (Amendment) Annual Improvements to HKFRSs 2012-2014 Cycle1
HKAS 16 and HKAS 38 Clarification of Acceptable Methods of Depreciation and
(Amendments) Amortisation1
HKAS 1 (Amendment) Disclosure Initiative1
HKFRS 11 (Amendment) Accounting for Acquisitions of Interests in Joint Operations1
HKFRS 15 Revenue from Contracts with Customers2
HKFRS 9 Financial Instruments2
HKFRS 10 and HKAS 28 Sales or Contribution of Assets between an Investor and its
(Amendments) Associate or Joint Venture3
1 To be applied by the Group from 1st January 2016 2 To be applied by the Group from 1st January 2018 3 The mandatory effective date has been postponed indefinitely
14. Requirement in connection with publication of “non-statutory accounts” under Section 436 of the
Hong Kong Companies Ordinance Cap.622
The non-statutory accounts (within the meaning of section 436 of the Companies Ordinance (Cap. 622)
(the “Ordinance”) in this document are not specified financial statements (within such meaning). The
specified financial statements for the year ended 31st December 2015 have not been but will be delivered
to the Registrar of Companies in Hong Kong in accordance with section 664 of the Ordinance. An
auditor’s report has been prepared on those specified financial statements. That report was not qualified
or otherwise modified, did not refer to any matter to which the auditor drew attention by way of
emphasis without qualifying the report and did not contain a statement under section 406(2) or 407(2) or
(3) of the Ordinance.
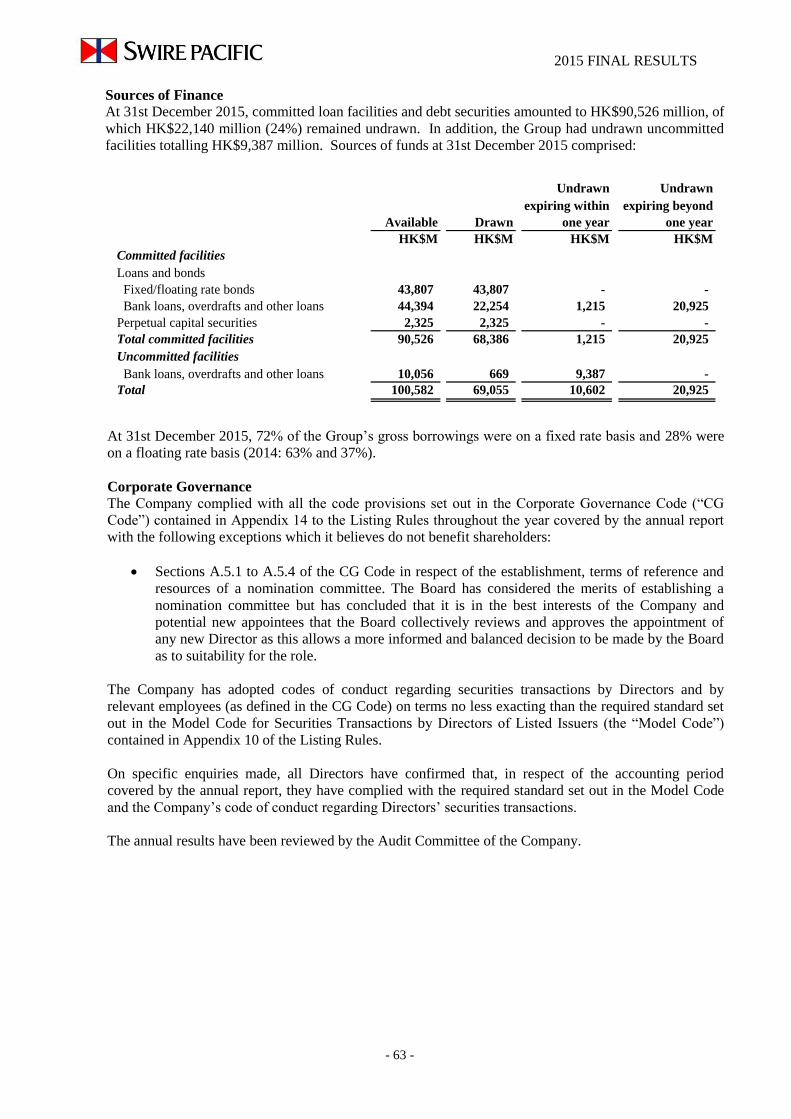
2015 FINAL RESULTS
- 63 -
Sources of Finance
At 31st December 2015, committed loan facilities and debt securities amounted to HK$90,526 million, of
which HK$22,140 million (24%) remained undrawn. In addition, the Group had undrawn uncommitted
facilities totalling HK$9,387 million. Sources of funds at 31st December 2015 comprised:
Undrawn Undrawn
expiring within expiring beyond
Available Drawn one year one year
HK$M HK$M HK$M HK$M
Committed facilities
Loans and bonds
Fixed/floating rate bonds 43,807 43,807 - -
Bank loans, overdrafts and other loans 44,394 22,254 1,215 20,925
Perpetual capital securities 2,325 2,325 - -
Total committed facilities 90,526 68,386 1,215 20,925
Uncommitted facilities
Bank loans, overdrafts and other loans 10,056 669 9,387 -
Total 100,582 69,055 10,602 20,925
At 31st December 2015, 72% of the Group’s gross borrowings were on a fixed rate basis and 28% were
on a floating rate basis (2014: 63% and 37%).
Corporate Governance
The Company complied with all the code provisions set out in the Corporate Governance Code (“CG
Code”) contained in Appendix 14 to the Listing Rules throughout the year covered by the annual report
with the following exceptions which it believes do not benefit shareholders:
Sections A.5.1 to A.5.4 of the CG Code in respect of the establishment, terms of reference and
resources of a nomination committee. The Board has considered the merits of establishing a
nomination committee but has concluded that it is in the best interests of the Company and
potential new appointees that the Board collectively reviews and approves the appointment of
any new Director as this allows a more informed and balanced decision to be made by the Board
as to suitability for the role.
The Company has adopted codes of conduct regarding securities transactions by Directors and by
relevant employees (as defined in the CG Code) on terms no less exacting than the required standard set
out in the Model Code for Securities Transactions by Directors of Listed Issuers (the “Model Code”)
contained in Appendix 10 of the Listing Rules.
On specific enquiries made, all Directors have confirmed that, in respect of the accounting period
covered by the annual report, they have complied with the required standard set out in the Model Code
and the Company’s code of conduct regarding Directors’ securities transactions.
The annual results have been reviewed by the Audit Committee of the Company.

2015 FINAL RESULTS
- 64 -
Annual Report
The 2015 Annual Report containing all the information required by the Listing Rules will be published
on the Stock Exchange website and the Group website www.swirepacific.com. Printed copies will be
available to shareholders on 7th April 2016.
List of Directors
At the date of this announcement, the Directors of the Company are:
Executive Directors: J R Slosar (Chairman), G M C Bradley, I K L Chu, M Cubbon, J B Rae-Smith, I S
C Shiu, A K W Tang
Non-Executive Directors: P A Johansen, M B Swire, S C Swire
Independent Non-Executive Directors: T G Freshwater, C Lee, R W M Lee, G R H Orr, M C C Sze,
M M T Yang