swing & trend trending - cmt association · swing & trend trending two tools for your shed...
TRANSCRIPT

Presented by: David Cox, CFA, CMT, FCSI, FMA, BMath Portfolio Manager May 23, 2012 Market Technician’s Association
Swing & Trend Trending Two Tools for Your Shed

2
Which Would You Prefer?
$-
$200,000
$400,000
$600,000
$800,000
$1,000,000
$1,200,000
$1,400,000
Sep
-82
Mar
-83
Sep
-83
Mar
-84
Sep
-84
Mar
-85
Sep
-85
Mar
-86
Sep
-86
Mar
-87
Sep
-87
Mar
-88
Sep
-88
Mar
-89
Sep
-89
Mar
-90
Sep
-90
Mar
-91
Sep
-91
Mar
-92
Sep
-92
Mar
-93
Sep
-93
Mar
-94
Sep
-94
Mar
-95
Sep
-95
Mar
-96
Sep
-96
Mar
-97
Sep
-97
Mar
-98
Sep
-98
Mar
-99
Sep
-99
Mar
-00
S&P 500 During Easy Times (1982-2000)
Buy & Hold 13/34 Week Tactical
A
B

3
What About Now?
$-
$200,000
$400,000
$600,000
$800,000
$1,000,000
$1,200,000
$1,400,000
$1,600,000
$1,800,000
Sep
-00
Jan-
01M
ay-0
1Sep
-01
Jan-
02M
ay-0
2Sep
-02
Jan-
03M
ay-0
3Sep
-03
Jan-
04M
ay-0
4Sep
-04
Jan-
05M
ay-0
5Sep
-05
Jan-
06M
ay-0
6Sep
-06
Jan-
07M
ay-0
7Sep
-07
Jan-
08M
ay-0
8Sep
-08
Jan-
09M
ay-0
9Sep
-09
Jan-
10M
ay-1
0Sep
-10
Jan-
11M
ay-1
1Sep
-11
Jan-
12
S&P 500 During Tougher Times (2000-2012)
Buy & Hold 13/34 Week Tactical
B
A
4
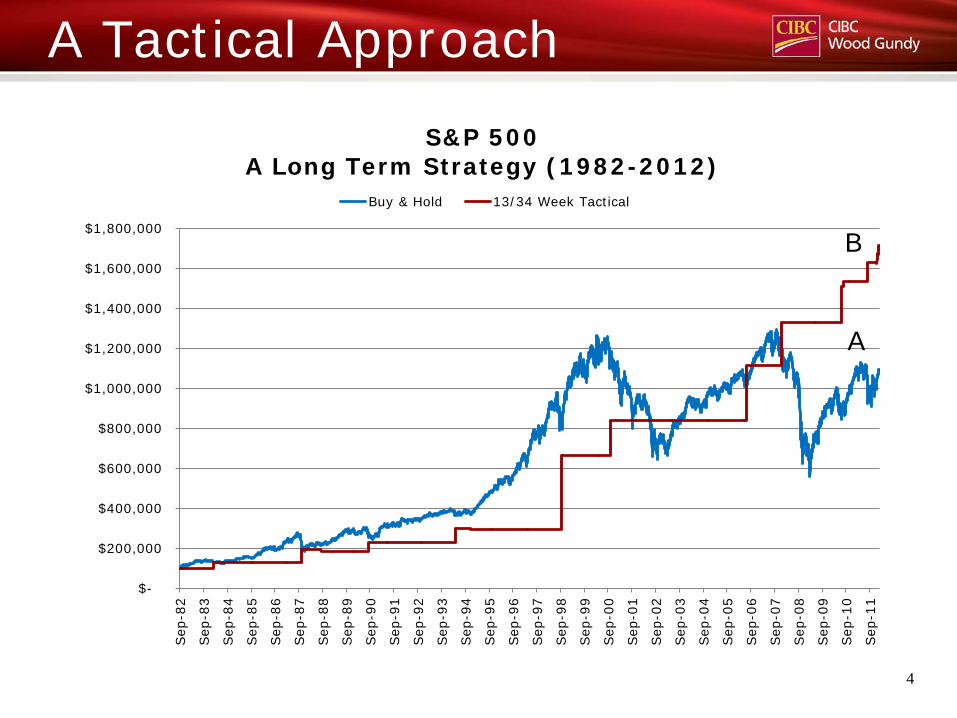
A Tactical Approach
$-
$200,000
$400,000
$600,000
$800,000
$1,000,000
$1,200,000
$1,400,000
$1,600,000
$1,800,000
Sep
-82
Sep
-83
Sep
-84
Sep
-85
Sep
-86
Sep
-87
Sep
-88
Sep
-89
Sep
-90
Sep
-91
Sep
-92
Sep
-93
Sep
-94
Sep
-95
Sep
-96
Sep
-97
Sep
-98
Sep
-99
Sep
-00
Sep
-01
Sep
-02
Sep
-03
Sep
-04
Sep
-05
Sep
-06
Sep
-07
Sep
-08
Sep
-09
Sep
-10
Sep
-11
S&P 500 A Long Term Strategy (1982-2012)
Buy & Hold 13/34 Week Tactical
B
A

5
The Main Trend
Source: Metastock

6
Checklist Trend: Up vs. down vs. sideways?
What is your strategy?
What are your objectives?
What is your time horizon?

7
Swing Trading Beliefs Most of the gain is made in first several days of a bounce Stocks spend most of their time consolidating and/or declining Money can be made in both rising and falling markets Better to make a quick profit -> then head for the sidelines Stocks cycle from optimism to pessimism and vice versa

8
Plan vs. Expectations Focus on extracting regular profits Time horizon typically lasting from 3 days to 3 weeks High turnover Buy oversold and sell overbought
9
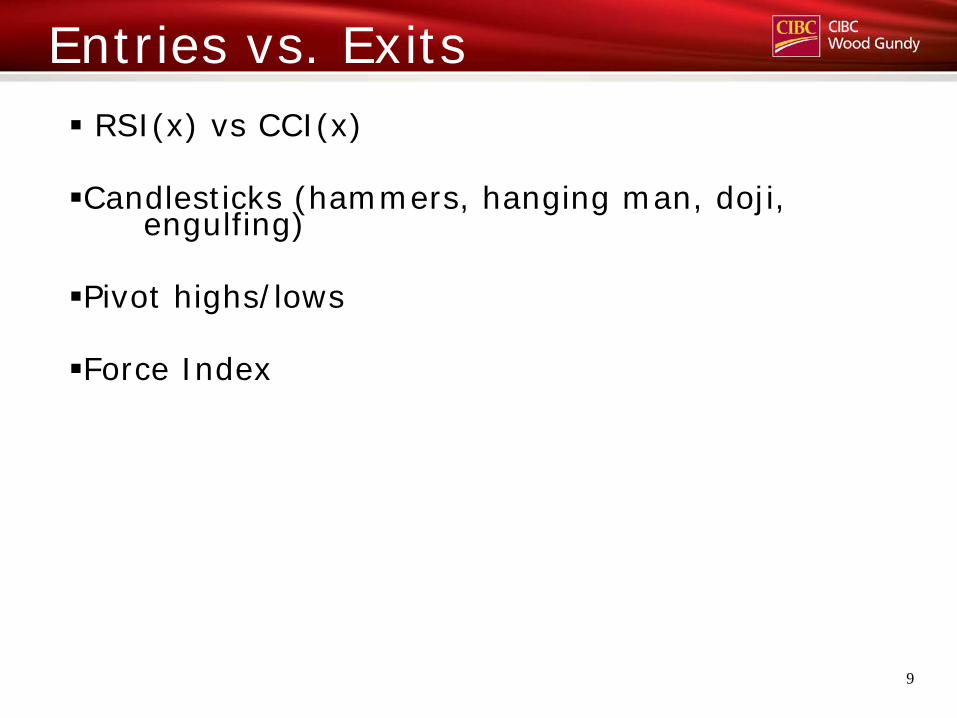
Entries vs. Exits RSI(x) vs CCI(x) Candlesticks (hammers, hanging man, doji, engulfing) Pivot highs/lows Force Index

10
Swing Trading (In Pictures)
Source: Reuters, Metastock
Source: Reuters, Metastock

11
Swing Trading (In Pictures)
Source: Reuters, Metastock

12
Portfolio Comparison
$-
$50,000
$100,000
$150,000
$200,000
$250,000
$100,000 $95,385
$219,178
May 13, 2010 March 31, 2012
Teck Resources (TCK'B-T) TCK'B Common David Cox TCK'B Trading

13
Equity Curve Comparison
$219,178
$95,385
$-
$50,000
$100,000
$150,000
$200,000
$250,000
$300,000M
ay-1
0
Jun-
10
Jul-
10
Aug
-10
Sep
-10
Oct
-10
Nov
-10
Dec
-10
Jan-
11
Feb-
11
Mar
-11
Apr
-11
May
-11
Jun-
11
Jul-
11
Aug
-11
Sep
-11
Oct
-11
Nov
-11
Dec
-11
Jan-
12
Feb-
12
Mar
-12
Por
tfol
io V
alu
e
BUY & HOLD vs. ACTIVE Management Teck Resources (TCK'B)
TCK'B Common David Cox TCK'B Trading

14
TCK’B Trading Results May 13, 2010 to March 31, 2012 49 total round trip trades (in/out) (LONG ONLY)
48% winners, 52% losers Average # Days/Trade = 5 Average winning gain = +7.2% Average loss = -3.1% Win/Loss Ratio = 2.3x % Days Invested = 34.7% MAX Consecutive Losses = 4 (-12%) MAX Consecutive Gains = 4 (+54.8%, +18.1%)

15
Trend Trading What Is The Trend?
Moving Averages (crossovers, slope) Higher Highs/Lows vs. Lower Lows/Highs Volatile vs. Calm Up/Down vs. Sideways/Choppy

16
Uptrend: In Pictures

17
Downtrend: In Pictures

18
Trend Trading Strategy If the Trend is UP/(DOWN):
Own stocks long/(short) Use volatility stops to protect against adverse price moves Be patient, sit tight and let the trend run How high/low can a stock go?

19
My Favourite View
Source: Metastock
20
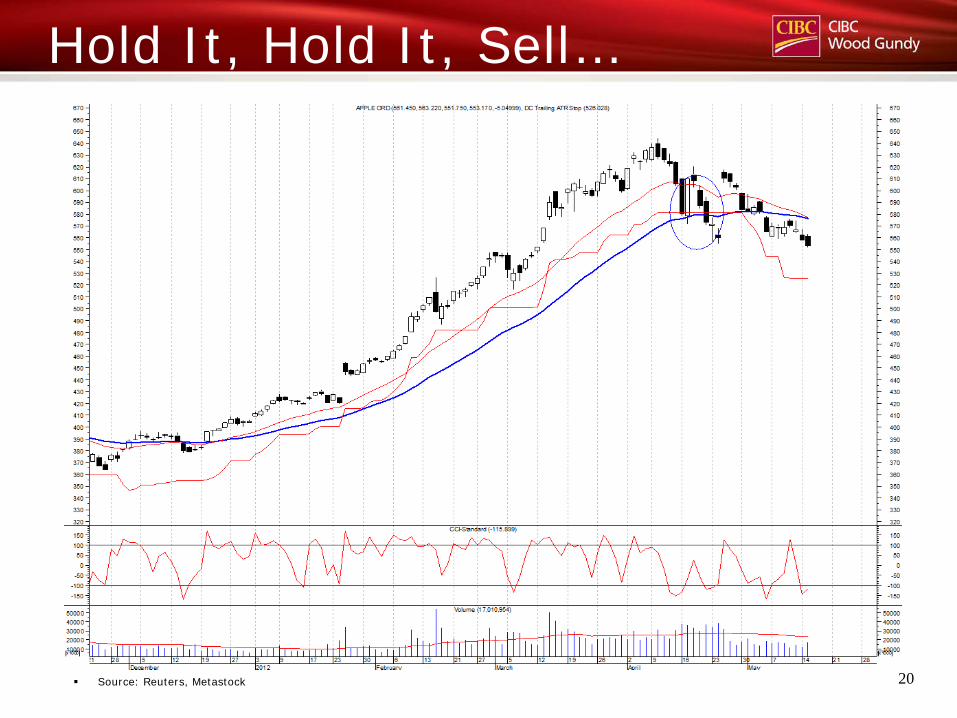
Hold It, Hold It, Sell…
Source: Reuters, Metastock

21
Useful Resources Van Tharp Oliver Velez Dr. Alexander Elder www.davidcox.ca: webinars/seminars posted #DavidCoxWG – check me out on Twitter! “Monthly Market Chit Chat” – monthly publication that looks at the risks and opportunities facing investors. Email me at [email protected] to subscribe

22
Questions & Answers

23
RSI vs CCI

Thank You
CIBC Wood Gundy is a division of CIBC World Markets Inc., a subsidiary of CIBC and a Member of the Canadian Investor Protection Fund and Investment Industry Regulatory Organization of Canada.
If you are currently a CIBC Wood Gundy client, please contact your Investment Advisor.
This information, including any opinion, is based on various sources believed to be reliable, but its accuracy cannot be guaranteed and is subject to change. CIBC and CIBC World Markets Inc., their affiliates, directors, officers and employees may buy, sell, or hold a position in securities of a company mentioned herein, its affiliates or subsidiaries, and may also perform financial advisory services, investment banking or other services for, or have lending or other credit relationships with the same. CIBC World Markets Inc. and its representatives will receive sales commissions and/or a spread between bid and ask prices if you purchase, sell or hold the securities referred to above. © CIBC World Markets Inc. 2012
42 Wyndham St. N, Suite 201 | Guelph | Ontario | N1H 4E6
(519) 823-4411 | 1 855-246-4076