sustaining the infrastructure industry
TRANSCRIPT

I
Sustaining the infrastructure industryChallenges, solutions and case studies
Response to Infrastructure Australia’s Australian Infrastructure Audit 2019
September 2020
Prepared by BIS Oxford Economics

1
Foreword from ACAThe Australian Constructors Association (ACA) represents the Nation’s leading building, infrastructure and construction services companies and is dedicated to promoting a more sustainable construction industry for all Australians.
The Nation’s third-largest industry, construction contributes $137bn to the economy annually, representing 7.2% of Australia’s total economic activity. Our sector employs 1.17 million people or 9.6% of the total workforce and accounts for approximately one-third of all registered businesses.
The importance of the construction sector to the Australian economy cannot be understated.
Through the design, development and delivery of essential infrastructure, we are vital to long-term economic growth of the Nation with every $1 spent on infrastructure boosting economic activity by nearly $3, through the beneficial flow on to the sector’s supply chain and associated industries.
Last year, Infrastructure Australia released their 2019 Infrastructure Audit. The audit investigated the major challenges for infrastructure in Australia over the next 15 years but specifically did not identify any solutions to these challenges and instead called on industry to make submissions containing recommendations as to how this could be achieved.
This report is our considered response to Infrastructure Australia’s request for submissions. It highlights the most pressing problems facing the industry being called upon to lead Australia out of a COVID 19 induced recession. More importantly, this report also includes ‘best practice’ case studies aligned to a number of recommendations, that if adopted, will support the three pillars of a sustainable construction industry:
• Positive Industry Culture
• Sufficient Capability, Capacity and Skills
• Equitable and Aligned Commercial Frameworks
On behalf of the Australian Constructors Association, our Board of Directors and members, we hope that this document can be used to inform positive debate and collaboration between all stakeholders that ultimately results in real and long overdue reform to the way infrastructure is constructed in Australia.
Jon Davies Craig LaslettChief Executive Officer Executive Chairman

2
Table of contents
Foreword from ACA . . . . . . . . . . . . . . . . . . . . . . . . . . . . . . . . . . . . . . . . . . . . . . . . . . . . 1
1. Executive Summary. . . . . . . . . . . . . . . . . . . . . . . . . . . . . . . . . . . . . . . . . . . . . . . . . . 3
2. Challenges and Solutions . . . . . . . . . . . . . . . . . . . . . . . . . . . . . . . . . . . . . . . . . . . 10
2.1 Purpose of this Report . . . . . . . . . . . . . . . . . . . . . . . . . . . . . . . . . . . . . . . . . . . 10
2.2 Infrastructure Industry is Facing a Crisis. . . . . . . . . . . . . . . . . . . . . . . . . . . 11
2.3 Meeting the Sustainability Challenge. . . . . . . . . . . . . . . . . . . . . . . . . . . . . 16
2.4 Problems and Solutions . . . . . . . . . . . . . . . . . . . . . . . . . . . . . . . . . . . . . . . . . .17
2.5 Changing Behaviours and Culture. . . . . . . . . . . . . . . . . . . . . . . . . . . . . . . . .31
3. Summary and Recommendations. . . . . . . . . . . . . . . . . . . . . . . . . . . . . . . . . . . 34
3.1 Actions for a Sustainable Infrastructure Industry. . . . . . . . . . . . . . . . . . 34
A. Appendix: Outlook for Infrastructure. . . . . . . . . . . . . . . . . . . . . . . . . . . . . . . . 42
a. Economic Outlook . . . . . . . . . . . . . . . . . . . . . . . . . . . . . . . . . . . . . . . . . . . . . . . 42
b. Construction Outlook . . . . . . . . . . . . . . . . . . . . . . . . . . . . . . . . . . . . . . . . . . . . 45
c. The Rising Role of Industry in Delivering Infrastructure . . . . . . . . . . . . 50
B. Appendix: Productivity and Sustainability Challenges . . . . . . . . . . . . . . . . 52
a. Recent Productivity Trends . . . . . . . . . . . . . . . . . . . . . . . . . . . . . . . . . . . . . . . 53
b. Other Sustainability Challenges . . . . . . . . . . . . . . . . . . . . . . . . . . . . . . . . . . . 55
C. Appendix: Case Studies . . . . . . . . . . . . . . . . . . . . . . . . . . . . . . . . . . . . . . . . . . . . . 61
NSW Bushfire Clean-up & Make Safe Program. . . . . . . . . . . . . . . . . . . . . . . 62
Newcastle Light Rail . . . . . . . . . . . . . . . . . . . . . . . . . . . . . . . . . . . . . . . . . . . . . . . . 65
The New Genoa Bridge . . . . . . . . . . . . . . . . . . . . . . . . . . . . . . . . . . . . . . . . . . . . . 69
Northern Connector Project South Australia. . . . . . . . . . . . . . . . . . . . . . . . . 73
Pacific Highway Upgrade Woolgoolga to Ballina . . . . . . . . . . . . . . . . . . . . . 77
Bridge over the Clarence River Bulk Earthworks . . . . . . . . . . . . . . . . . . . . . 79
Level Crossing Removal Project . . . . . . . . . . . . . . . . . . . . . . . . . . . . . . . . . . . . . 81
South Eastern Program Alliance (Level Crossing Removal Program) . . . . . 85
Mordialloc Freeway Upgrade . . . . . . . . . . . . . . . . . . . . . . . . . . . . . . . . . . . . . . . 87
Pacific Highway Upgrade Warrell Creek to Nambucca Heads NSW . . . 89
Crossrail C300/C410 Western Running Tunnels . . . . . . . . . . . . . . . . . . . . . . 91

3
In 2019, Infrastructure Australia released its 2019 Infrastructure Audit, outlining critical challenges in meeting Australia’s future infrastructure needs. This report is the Australian Constructor’s Association (ACA) response to the Audit, developed in conjunction with BIS Oxford Economics.
While a response to the Audit, this report also forms the foundation of a broader platform to sustain industry well into the future by revolutionising the way we work together.
Industry is facing a crisis
Change is necessary and required urgently. The infrastructure industry is facing a crisis. The way infrastructure is currently procured and delivered is not sustainable. Projects have changed. They are substantially bigger, more complex, and riskier but our procurement processes have not changed. It is driving productivity down. It is raising the cost of infrastructure. It is leading to massive financial losses on major projects. It is making industry a less attractive destination for labour and capital. Government’s response to this – transferring even more risk to the private sector – is making the situation worse.
The efficient provision of quality, long lived infrastructure requires a well-functioning infrastructure industry that can help plan and deliver the assets required.
Over the next five years, Australia is expected to deliver a record $435 billion worth of economic and social infrastructure (in work done terms), much of which will be put in place by the private sector1. Much of this investment is at risk if a sustainable industry is not in place to help plan and deliver it.
Measures such as productivity, profitability, hours worked and diversity2 show that industry is becoming less, not more, sustainable over time. The coming upwards cycle in work will be a substantial challenge, but long-term infrastructure demands are likely to be even higher. And while a global pandemic was not known at the time Infrastructure Australia released its Audit, COVID-19 and related policy responses are likely to amplify the investment cycle further, creating further challenges for capacity and capability to deliver.
The three-legged stool
Ultimately, the challenge facing the infrastructure industry is a joint problem for all stakeholders, and it requires a joint solution.
The ACA has long been committed to structural reforms in the infrastructure industry given its importance to the broader economy, the number of people it directly employs and the wide range of benefits from achieving stronger sustainability and productivity outcomes.
It was this concern which prompted the ACA and the Governments of New South Wales and Victoria to come together to form the Construction Industry Leadership Forum (CILF) in 2017.
1. Executive Summary
1 These figures are supplied by BIS Oxford Economics. A detailed outlook for infrastructure investment and the role of industry in delivering infrastructure projects is provided in Appendix A of this report.
2 Detailed in Appendix B of this report.

4
Through this joint endeavour, the CILF established a framework for examining the problems and driving solutions, with three primary work groups established to consider:
• Commercial Frameworks: risk allocation, procurement models, harmonisation and the time and cost of tendering.
• Capacity, Capability and Skills: understanding capability and capacity gaps, developing a coordinated approach to addressing skills gaps, breaking down barriers to skills transferability and mobility and promoting improved culture, diversity, and inclusiveness.
• Culture: addressing the adversarial behaviours and male dominated culture that affects the overall sustainability and attractiveness of the industry
This framework has become known as a ‘three-legged stool’ as it is increasingly clear that not one part of the challenge can be solved in isolation – the challenges can only be solved by addressing them all. For instance, the choice of commercial frameworks can have a huge impact on the profitability of the whole industry supply chain from Contractor to designer to subcontractors and suppliers. This, in turn, can impact industry culture through the promotion of adversarial relationships which then leads to increased levels of employee stress and anxiety.
The 2019 Infrastructure Audit by Infrastructure Australia highlights some challenges but does not provide solutions
The 2019 Infrastructure Audit highlighted the importance of industry efficiency, capability and capacity in meeting growing and changing infrastructure demands. But it is also vital that this industry is sustainable over time.
In researching and delivering the 2019 Infrastructure Audit, Infrastructure Australia rightly points out that industry is facing commercial challenges which are in part due to poor procurement practices – for instance, inefficient risk allocation and, in particular, excessive risk transfer from the public sector3:
Large financial losses on some construction projects and a strong pipeline of work have caused the market to push back on a range of risks. In some cases, poor allocation of some risks has also created distinct issues. For example, the transfer of regulatory risks and responsibility for negotiating with other government agencies, such as utilities, are key risks transferred to the private sector, which potentially could have been more efficiently managed by government.
Furthermore, Infrastructure Australia is also right to point out that the consequences of these risks being realised – inability to reach financial close on projects, increased litigation, lower quality builds and increased infrastructure costs – are ultimately borne by taxpayers and infrastructure users. Therefore, there is a strong imperative for both industry and government to work together to solve these problems.
The 2019 Infrastructure Audit couches problems such as poor risk allocation in terms of its impact on industry efficiency, capacity and capability (Chapter 4 of the Audit). There is certainly a direct link. This response (in Chapter 2) details why efficiency, capacity and capability are negatively impacted by existing procurement practices – and why industry as whole continues to participate in these practices despite making large financial losses on some projects.
However, while the Audit provides the link between capacity, capability and commercial arrangements (which ACA agree with), it does not address the change in culture required and the necessary solutions to get there.
In the context of the ‘three-legged stool’ analogy, the Audit only focuses on the first two legs and not the third, which is equally important.
Consequently, the Audit provides a vision of long-term infrastructure goals but lacks behavioural and cultural change mechanisms to ensure that we get there.
This report addresses that gap.3 Infrastructure Australia (2019) An Assessment of Australia’s Future
Infrastructure Needs: The Australian Infrastructure Audit 2019, p233.

5
Restoring productivity growth is a key objective
This response argues that, ultimately, challenges to industry sustainability are linked to suboptimal value for money for infrastructure procurers and can be traced back to poor productivity outcomes in infrastructure delivery over several decades. Multifactor productivity in the construction industry has fallen 17% over the past five years and is now back to levels seen in the late 1990s.
Poor productivity performance is a key driver of rising infrastructure costs. At its heart is the adversarial culture across the industry – including project owners, contractors and their supply chains – where each agent’s efforts have been concentrated on minimising their own exposure to costs and risks rather than targeting higher productivity and lower costs across the sector as a whole. No one part of the sector is to blame for this situation. But all agents pursing their own self-interest is resulting in suboptimal aggregate industry outcomes where infrastructure is costing more than it should, industry is being stretched to deliver, and innovation – the critical driver of productivity – is being constrained.
Achieving stronger productivity outcomes requires a revolution in the way industry, public sector project owners, supply chains and the community work together to make the best possible use of resources.
Rather than existing, costly adversarial approaches, a more collaborative approach is required that seeks to align the interests of all involved. While many of the solutions are known – and there have been positive practical examples in recent years – sustaining a shift towards collaborative approaches will take time and will involve changing entrenched cultures.
ACA hopes to accelerate the change process by highlighting the positive steps taken so far and maintaining the reform momentum by advocating the recommendations in this report. In so doing, we note that both industry and government have roles to play in changing the way they operate and achieving stronger productivity outcomes.
A range of solutions are already known
Achieving sustainability for the infrastructure industry also solves the ‘value for money’ problem for clients because both are inextricably linked through poor productivity practices.
At its core it is necessary to achieve meaningful progress in the following areas:
• Changing behaviours from infrastructure clients which have raised overall costs in infrastructure planning, procurement, delivery and operations.
• Recognising that industry should continue to improve its own performance in developing more sustainable behaviours.
• Understanding that both industry and governments need to change behaviours that have become culturally institutionalised
Client actions include:
• Better planning and identification of risks before procurement,
• Adoption of procurement processes that minimise project costs for all parties, and
• Choosing the most appropriate procurement model for each project given its specific risk profile and complexity
Industry actions include:
• Being a trustworthy partner to all infrastructure stakeholders
• Being a model employer to attract and retain skills
• Supporting broader sustainability initiatives
The existing working culture across the whole of the infrastructure industry and its stakeholders needs to change if productivity growth is to be restored, in turn providing sustainability for industry and value for money for project owners (including taxpayers). For individual agents, this can be very difficult to achieve in practice, particularly if the behaviours of other stakeholders remain entrenched to the ‘usual’ ways of doing things.
Ultimately, all stakeholders need to have ‘skin in the game’ and work together if change is to be achieved. Industry needs to work better with all its stakeholders and governments need to follow through on the principles espoused in NSW Government’s 10 Point Commitment to the Construction Industry5.
5 NSW Government (2018) NSW Government Action Plan: A 10 Point Commitment to the Construction Sector, June 2018.
6
Delivering reforms
Collaborative solutions are available in infrastructure engagement and procurement, but change will be difficult. While there have been green shoots of change in recent years – and this response provides several positive case studies6 – maintaining reforms over the investment cycle has proven elusive over the past two decades.
The onus should not be on one part of the industry moving, on its own, to the collaborative outcome, but rather that the industry moves together.
This, in turn requires a coordinated, rather than piecemeal approach, with both industry and clients jointly committing to actions.
Consequently, this response recommends 10 key actions grouped into the following streams:
• Re-energising and expanding the collaborative effort (Actions 1-3)
• Clients to operationalise its own chartered behaviours (4-6)
• Industry to release its own collaborative charter of behaviours (7-9)
• Reform oversight to be provided by an independent agency such as Infrastructure Australia (10)
Recommendation 1Government and industry to collaborate
Governments and industry across Australia should work together to drive constructive change and improvement through implementing collaborative initiatives like the Construction Industry Leadership Forum (CILF) developed between the ACA and the Governments of New South Wales and Victoria.
Recommendation 2Improve project initiation and delivery processes
Through CILF-related structures, industry and government should work together to identify improved project initiation and delivery processes that maintain the sustainability of industry and deliver value for money infrastructure for Australia’s communities.
Recommended actions
6 See Appendix C for a discussion of these case studies

7
Recommendation 3Collect, maintain and report performance outcome measures
To better identify successful approaches to project development and delivery, industry and clients should together collect, maintain and report performance outcome measures on all infrastructure projects.
Recommendation 4Commit to adopt collaborative principles
All Australian Governments should, in a manner similar to the NSW Government’s 10 Point Commitment to the Construction Sector, commit to adopt collaborative principles with industry to achieve successful infrastructure projects and maximise community benefits from those projects.
Recommendation 5Report progress on adoption of collaborative principles
Infrastructure client agencies in all Australian jurisdictions should undertake regular reviews of their infrastructure pipeline projects and report as to their success in meeting collaborative principles as contained in their commitments to the construction sector.
8
Recommendation 6Incentivise improved outcomes
Infrastructure client agencies should target success in infrastructure project delivery by aligning staff incentives with achievement of stronger productivity, cost and sustainability outcomes.
Recommendation 7Industry charter
Similar to the NSW Government’s 10 Point Commitment to the Construction Sector, industry should establish and publish its own charter of principles to assist government to be a more informed client, the industry’s supply chain to be supported and industry’s workforce to be enhanced and skilled to deliver infrastructure projects on time and within budget.
Recommendation 8Monitor and report progress against industry charter
Similar to Action 5, each principle in industry’s charter should be quantifiable and assessed for performance pursuant to a standardised data collection template with annual reviews of efforts in abiding by the principles of the charter with results published to identify opportunities for improvement.

9
Recommendation 9Commit to a change in industry culture
Industry should embrace and commit to a change in culture that promotes the safety, health and wellbeing and diversity of its workforce as well as increased collaboration between stakeholders to achieve project success.
Recommendation 10Independent Federal Government agency to support change
An independent Federal Government Agency should oversee and coordinate this process nationally. This involves achieving an industry-wide consensus on an overarching framework for sustainability and establishing a taskforce to assist and report on progress by each jurisdiction in achieving collaborative structures and reforms to infrastructure delivery that boost productivity, industry sustainability and long term value for money.
Action on all these measures is required now. As this report is delivered, industry is facing critical, existential risks. With over $400 billion in social and economic infrastructure to be delivered over the next five years, it is imperative to reform productivity-destroying behaviours and culture in infrastructure planning and delivery immediately.
COVID-19 must be a catalyst for change
As highlighted in the 2019 Infrastructure Audit, Australia faces an unprecedented period of uncertainty. While a global pandemic was not a known factor at the time of researching and delivering the Audit 2019, the impacts of COVID-19 and the policy response are adding to existing uncertainty and risk and amplifying existing industry sustainability concerns.
Given this, and the rising longer-term requirement for infrastructure, COVID-19 is providing a unique opportunity to learn from international best practice in order to fundamentally reform best value infrastructure planning, procurement and delivery approaches and implement actions that will restore growth in productivity, industry sustainability, and ‘value for money’ planning, procurement and delivery long into the future. In this sense COVID-19 could be a catalyst for an ‘infrastructure revolution’. As one revolutionary famously said:
‘There are decades where nothing happens; and there are weeks where decades happen.’
While last two decades represent a lost opportunity for sustained infrastructure reforms, there is now a strong potential for industry and governments to work together and reach a consensus.
It is time to change!

10
2. Challenges and Solutions
In 2019, Infrastructure Australia released its 2019 Infrastructure Audit7, outlining critical challenges in meeting Australia’s future infrastructure needs in a world of increasing uncertainty. As highlighted in the Audit8:
Infrastructure is only as good as the services it delivers to users. When it comes to infrastructure, the community has told us what matters most – access, quality and cost.
In a world of limited means and potentially unlimited wants it is vital that infrastructure is planned, procured, and delivered as productively as possible.
Failure to do so means that these fundamental pillars – access, quality and cost – will be compromised. But they are also highly interrelated. Poor planning can result in poor infrastructure project choices which can reduce long run productivity and financially burden the community for decades with infrastructure that is unnecessary and expensive to maintain. Inefficient procurement and delivery can impact both the quantity and quality of the infrastructure we develop, as well as raising infrastructure costs which must be borne by users or infrastructure funders (including taxpayers, for publicly funded infrastructure).
2.1 PURPOSE OF THIS REPORT
This report is the Australian Constructor’s Association (ACA) response to the Audit. The ACA represents the largest infrastructure companies operating in Australia. Including subcontractor businesses engaged in ACA-member projects, these companies account for the employment of over 200,000 people in the infrastructure industry. In developing this response, ACA has partnered with BIS Oxford Economics, a respected industry analyst, forecaster and thought leader for the infrastructure industry. Through a combination of research, analysis and direct industry consultation and contribution, this report highlights the most pressing problems facing the infrastructure industry, but also provides a raft of solutions and ‘best practice’ case studies.
While a response to the Audit, this report also forms the foundation of a broader policy platform to sustain industry well into the future by revolutionising the way all infrastructure stakeholders work together.
7 Infrastructure Australia (2019) An Assessment of Australia’s Future Infrastructure Needs: The Australian Infrastructure Audit 2019.
8 Ibid, p4.

11
2.2 INFRASTRUCTURE INDUSTRY IS FACING A CRISIS
Change is urgently required because the industry tasked with delivering infrastructure in Australia is facing an immediate sustainability crisis.
Worsening productivity outcomes
This crisis is being driven by very poor industry financial outcomes which, combined with imperfect contractual interactions between clients and industry, is driving down industry productivity9. In turn, falling productivity re-impacts on the very viability of the infrastructure industry.
This low profitability / low productivity spiral not just further impacts on industry profitability but also impacts non-financial sustainability goals, including a sustainable work/life balance for employees, better mental health outcomes, adequate levels of training and upskilling, and appropriate innovation and investment in productivity-enhancing new technologies and processes, which by its nature is inherently risky.
It also means that infrastructure has become more costly to plan and deliver, threatening sustainable, value for money solutions from a project owner perspective, and translating to poorer outcomes for communities in terms of their expectations regarding infrastructure access, quality and cost of use.
Poor productivity outcomes are not the fault of one party. Rather, it is the result of poor interactions between parties. It is driven by the clumsiness of current contractual relationships in an environment which has become much bigger, more complex, and riskier. In turn the unproductive outcomes set up an adversarial culture, makes it hard to attract people, and result in a further downward spiral in outcomes and sustainability.
Bursts of productivity growth (such as during the resources boom) have been difficult to sustain. Productivity in the construction industry today is no greater than it was in 1998.
The sobering reality is that if productivity in the construction industry had at least matched selected “other industries” performance, multifactor productivity would have improved a further 25% over the last 30 years on top of the meagre 6% growth registered.
Another way of thinking about this is saying that for every four similarly costed infrastructure projects built today, we could have built a fifth at no further cost.
9 A more detailed discussion of poor productivity outcomes, causes and solutions in contained in Appendix B.

12
Multifactor productivity data in Figure 111 shows that the construction industry lags well behind all other sectors since 1990, with productivity growing at just 0.2% per annum compared to 1.0% per annum for other industries (excluding manufacturing) and 0.5% per annum for manufacturing.
For governments and other project owners, this would have meant much better value for money infrastructure delivery, for industry the ability to deliver more infrastructure on a more sustainable basis; for communities, better infrastructure access, quality and cost of use and, for the economy, even broader productivity benefits from infrastructure use.
Worsening financial outcomes
Worsening industry productivity has moved hand in hand with weaker industry financial sustainability.
As shown in Figure 2, construction industry gross profits as a share of sales12 (profit before deduction of company overhead) collapsed between 2014 to 2018 before staging a semi-recovery in 2019. However recent gains are receding once again, and overall the measure remains well below industry returns prior to and during the resources boom. Other industry profits data13 show that the engineering construction segment (primarily responsible for economic infrastructure delivery, including transport and utilities construction) has the lowest profitability overall within the construction sector, around half the profit margin of building and roughly one third the margin of construction services.
Fig. 1: Multifactor Productivity Indexes by Industry, 1990-2019, FY1990=100
11 ABS (2019), Estimates of Industry Multifactor Productivity, 2018-19, Cat. No, 5260.0.55.002
12 ABS (2020) Business Indicators, Australia, Cat. No. 5676.0, March 2020, Australia.
13 ABS (2019) Australian Industry 2018-19, Cat. No. 8155.0, May 2020, Australia
80
90
100
110
120
130
140
150
199
0
199
1
199
2
199
3
199
4
199
5
199
6
199
7
199
8
199
9
200
0
200
1
200
2
200
3
200
4
200
5
200
6
200
7
200
8
200
9
2010
2011
2012
2013
2014
2015
2016
2017
2018
2019
Construction Selected Industries Transport Manufacturing
Source: ABS DataSource: ABS Data

13
Considering mega projects in isolation, the picture is even worse, with a recent report identifying that Australian contractors incurred losses of $6 billion on mega projects completed between 2000 and 2015, representing an average project loss of 16%. The report predicted if no action was taken there was the potential of $11 billion of losses for projects undertaken between 2015 and 202014. This is likely to be an underestimate given the recent spate of high-profile project issues.
Unsustainable financial outcomes for the infrastructure industry create broader industry sustainability challenges in terms of greater workplace stress, longer hours and less ability to support training and innovation initiatives – in turn, making the industry a less attractive destination for employment and investment15.
The increasing importance of the private sector in delivering infrastructure means that it has a vital role to play in working productively with infrastructure project owners and other stakeholders including the supply chain and the broader community to ensure assets are provided as efficiently as possible and hence meet community expectations regarding access, quality and cost.
In other words, the sustainability of industry is a vital precondition to achieving the vision and goals outlined in the 2019 Infrastructure Audit.
Fig. 2: Construction Industry Gross Operating Profit to Sales Ratio: 2002-2019
Source: BIS Oxford Economics, ABS
14 Ryan, P. and C. Duffield (2017) Contractor Performance on Mega Projects – Avoiding the Pitfalls, Engineering Project Organization Society. Fallen Leaf Lake, CA USA.
15 More discussions and statistics highlighting industry sustainability outcomes are included in Appendix B.
5%
6%
7%
8%
9%
10%
11%
2002 2004 2006 2008 2010 2012 2014 2016 2018 2020
Quarterly Moving Annual Average
Source: BIS Oxford Economics, ABS
Gross Operating Profit to Sales Ratio - Construction Industry

14
In FY2019, the private sector delivered 83% of all transport and utilities infrastructure work in Australia, up from 44% in the mid-1980s. It is now responsible for delivering nearly all social building infrastructure across Australia and, combined with strong growth in total infrastructure demand and activity, industry now delivers more than five times the level of economic infrastructure than it did in the 1980s in real terms. While changing technologies, behaviours and economic drivers will drive differences in the kind of infrastructure Australia will need in future – and the way we deliver it – the overall task in delivering infrastructure is likely to continue to grow over time. In turn, each addition to the nation’s capital stock of infrastructure entails a growing need for sustaining capital and maintenance works which, too, is increasingly being delivered by industry.
Highly cyclical and increasingly large and complex investments also threaten industry sustainability
The boom/bust cyclicality of investment adds to sustainability pressures felt by the private sector in delivering infrastructure projects. While ‘smoothing the pipeline’ has been long established as important to relieving capacity and capability concerns and improving efficiency16, industry work done data shows the sector remains in thrall to large investment cycles, as shown in Figures 4 and 5 below.
16 As noted in many capacity and capability reviews such as, for example, BIS Oxford Economics (2018) for Infrastructure NSW.
Fig. 3: Transport and Utilities Engineering Construction by Performer Sector, Australia, Constant FY2018 Prices
Fig. 4: Construction Work Done by Segment, Australia, Constant FY2018 Prices
0
10
20
30
40
50
60
70
80
0
10
20
30
40
50
60
70
80
2009 2011 2013 2015 2017 2019 2021 2023 2025 2027 2029 2031 2033
Year ended June
Total Private Total Public
Source: BIS Oxford Economics, ABS
$ Billion $ Billion
Average2030-2034
Average2025-2029
0
50
100
150
200
250
300
0
50
100
150
200
250
300
2009 2011 2013 2015 2017 2019 2021 2023 2025 2027 2029 2031 2033
Year ended June
EC NRB Res
Source: BIS Oxford Economics, ABS
$ Billion $ Billion
Average2030-2034
Average2025-2029

15
The last decade has seen a very large cycle play out across engineering construction and building segments of the construction sector.
The dominant component of the cycle was in the engineering construction segment which hit a record level of activity in FY2013 off the back of record investment in iron ore, coal, and oil & gas extraction and supporting infrastructure during the resources boom. The resources cycle also coincided with rising levels of public investment in economic infrastructure which also boosted engineering construction work.
While concern over debt and budget deficits (at the State and Commonwealth level) saw public investment retreat over the first half of the 2010s, another substantial wave of investment, focused in major transport projects, saw publicly funded engineering construction rise again between FY2015
to FY2019. An even bigger cycle is forecast for the coming decade based on the rollout plans for existing transport projects and COVID-19 economic stimulus measures.
Furthermore, an increasing proportion of economic infrastructure investment (engineering construction) is being concentrated in high value ‘mega-projects’, as shown in Figure 5. This is particularly true for transport investment. While BIS Oxford Economics is forecasting transport engineering construction to rise from $30 billion in work done in FY2020 to $44 billion in FY2024, the value of work done in the ‘mega’ transport project space is expected to nearly double during the period. These projects are not only very costly, but more complex, reflecting predominantly overbuilds rather than greenfield developments, substantial underground works, tunnelling and multiple interfaces. All this brings substantial additional risks to industry.
Fig. 5: Major Transport Projects (over $2bn), Australia, Constant FY2018 Prices
0
2
4
6
8
10
12
14
16
18
20
2010 2013 2016 2019 2022 2025 2028
SA North-South CorridorWA MetronetWA Hancock Roy Hill (Pilbara)WA Fortescue Metal Group (Pilbara)WA BHP Billiton (Pilbara)WA Rio Tinto (Pilbara)VIC Suburban Rail LoopVIC Geelong Fast RailVIC Melbourne Airport LinkVIC Inland Rail (VIC component)VIC Melbourne Metro RailVIC Level Crossing Removal Program (Rail)VIC Regional Rail LinkVIC North East LinkVIC Suburban Roads UpgradeVIC Level Crossing Removal Program (Road)VIC West Gate TunnelQLD Gold Coast Light RailQLD Cross River RailQLD Inland Rail (QLD component)QLD Logan MotorwayQLD Warrego HighwayQLD Gateway MotorwayQLD Pacific Motorway (QLD Component)QLD Bruce Highway UpgradeQLD TransApexQLD Ipswich MotorwayNSW Inland Rail (NSW component)NSW Sydney Metro WestNSW Sydney Metro Western Sydney AirportNSW Sydney Metro City & SouthwestNSW Sydney Metro NorthwestNSW Parramatta Light RailNSW CBD and South East Light RailNSW Great Western Highway DuplicationNSW F6 ExtensionNSW Western Harbour Tunnel & Beaches LinkNSW Pacific Motorway (NSW Component)NSW Western Sydney Infrastructure PlanNSW NorthConnexNSW WestConnexNSW Pacific Highway Upgrade
Notes: This chart is based on projects with over $2 billion in total value. Solid areas are road projects, dotted areas are rail projects.
$ Billion (in FY18 constant prices) Forecast
Year ended June Source: BIS Oxford Economics

16
COVID-19 adding to risk and sustainability concerns
Industry sustainability challenges are expected to become more severe in the near term as COVID-19 and policy responses to curb the spread of the virus create further uncertainties.
These uncertainties include:
• The extent of the cycle in construction activity, with a sharp slowdown in some segments anticipated during 2020 possibly followed by an upswing later supported by fiscal stimulus.
• The impact on the industry supply chains, particularly for subcontracted skilled labour and equipment, as businesses battle to remain solvent and retain staff, but also for bespoke imported materials and equipment that rely on well-functioning global supply chains.
• Consequent additional uncertainty regarding the outlook for prices of classes of skilled labour and materials which in turn make it more difficult to price complex, risky projects and hence deliver conforming bids under current contracting arrangements.
Efforts to “flatten the curve” in terms of minimising the transmission of COVID-19 in Australia is likely to amplify the cycle in construction activity, presenting further industry risks. While residential building and parts of the non-residential building market are likely to see a setback in activity in the short term, they may recover quickly later on once the health crisis is controlled and stronger economic conditions return. Construction-related stimulus measures combined with the substantial wave of public infrastructure transport ‘mega-projects’ as shown in Figure 5 could add to this volatility.
While a global pandemic was not a known factor at the time of researching and delivering Infrastructure Australia’s Audit, the impacts of COVID-19 and the policy response is adding to existing uncertainty and risk and amplifying existing industry sustainability concerns.
Given this, and the rising longer-term requirement for infrastructure, COVID-19 is providing a unique opportunity to fundamentally reassess progress on reforming best value infrastructure planning, procurement and delivery approaches and implementing actions that will ensure industry sustainability – and hence capacity and capability – long into the future.
2.3 MEETING THE SUSTAINABILITY CHALLENGE
In approaching the issue of infrastructure industry sustainability, BIS Oxford Economics has coupled independent research with an extensive sounding of major construction contractors, capturing a significant slice of the market. This has provided insights into successes and failures during previous and current investment and construction cycles and their learnings from this.
It should be noted that in these soundings, industry had both positive and negative feedback regarding the state of the market, the outlook and opportunities for activity, and the way in which infrastructure programs across Australia are being managed, planned, procured and delivered. While much of the material in this response tends to focus on the areas needing improvement so that industry sustainability risks are appropriately highlighted, this should not distract from the fact that many industry participants also expressed positive sentiments regarding improvements in practices and provided examples of projects that were seen as successful in achieving more sustainable outcomes. We have provided a selection of positive case studies which can be used as a model for future project engagement in Appendix C of this report.
Industry is ready
Overall, Australian contractors expressed confidence that a greater partnership approach between all stakeholders – governments, infrastructure procurement agencies, industry and the community – will result in lower costs for infrastructure delivery, higher productivity outcomes, and stronger industry capacity and capability to deliver over the long run. While there will be risks and challenges along the way, many of the problems are now well known, as are the appropriate solutions.
From a client perspective, the main challenge is to ensure that principles of collaborative behaviour already accepted and espoused by some jurisdictions – such as those embodied in the NSW Government’s 10 Point Commitment – not only become entrenched in practice on the ground but extend harmoniously across other jurisdictions. This opens a role for the Australian Government, collective jurisdictional bodies such as the National Cabinet, and various national and state infrastructure agencies, including Infrastructure Australia to help drive reforms consistently across Australia.

17
Industry also recognises the need to lift its own performance to ensure sustainability right across the sector, from small businesses, professional services consultants, materials and equipment suppliers, and contractors both large and small.
This includes building trust and collaborative relationships with all its stakeholders including clients, workforces, the community, the supply chain and project partners; committing to sustainable levels of training; ensuring the mental and physical well-being of staff; seeking greater diversity and innovation, building environmental sustainability into the projects it delivers; reducing its own carbon footprint to minimise the risk of dangerous climate change and targeting long term value for money in infrastructure delivery and operations.
Critically, meeting this challenge – for both industry and clients – means changing existing behaviours and cultures, which in many cases have become set over time to the point of being institutionalised.
2.4 PROBLEMS AND SOLUTIONS
Ultimately, solving the ‘value for money’ problem for clients and achieving sustainability for the infrastructure industry is inextricably linked.
At its core is achieving meaningful progress on the following actions:
• Championing changes to client behaviours which reduce overall costs in infrastructure planning, procurement, delivery and operations
• Recognising that industry also should strive to improve its own performance in developing more sustainable behaviours.
• Understanding that both industry and clients need to change behaviours that have become culturally institutionalised
Need for a paradigm shift
In the absence of a stronger productivity performance, the relationship between industry and clients has generally become more adversarial over time, focused on who bears the costs rather than achieving solutions together. No party is to blame for this, but changing this poor culture is key.
Encouragingly, there has been some green shoots of change in recent years and examples of very successful approaches to infrastructure projects – including Victoria’s Regional Rail Link, the Level Crossing Removal Program (LXRP), Newcastle Light Rail and, in the United Kingdom, the very large Crossrail development18 — but, in Australia, these examples remain more the exception than the rule. Importantly, at the executive level in both government and industry there is a recognition of the importance of a more collaborative, partnership approach and achieving productivity-focused solutions.
This recognition was crystallised in the formation of the Construction Industry Leadership Forum (CILF) – a partnership between the NSW and Victorian State Governments and the Australian Constructors Association (ACA) – and in the NSW Government’s 10 Point Commitment to the Construction Sector. More needs to be done to extend these principles harmoniously to all Australian jurisdictions and ensure they become part of general practice at the operational level.
Asset Owners and industry both have a strong role to play in fostering a more sustainable infrastructure sector. Critically, project owners and clients can target productivity-enhancing improvements to the way they plan and procure increasingly complex infrastructure projects. Industry, in turn, can improve its own culture and practices and build more trusting, stronger relationships with other infrastructure stakeholders including governments, their employees, supply chains and the broader community of infrastructure users.
Well targeted measures, as outlined below, have the potential to encourage innovative engineering solutions to complex infrastructure challenges, greater training and upskilling, reduce the risk of project failures and expensive re-working, and lower costs through all phases of infrastructure delivery from planning, procurement, construction and ongoing operations and maintenance. Not only will this boost industry sustainability but, by targeting greater productivity outcomes, will also lead to lower long run infrastructure costs.
18 A more detailed discussion of these and other projects, and what drove their success, is in Appendix C.

18
Importantly, these measures do not seek a loss of accountability or lower value for project owners (including taxpayers in the case of government clients). Rather, they re-affirm that the ultimate goal for owners of long-lived infrastructure is to maximise the value of infrastructure delivery over the long term through:
• Better planning and identifying risks before procurement,
• Procurement processes that minimise project costs for all parties, and
• Choosing the best procurement model for each project given its specific risk profile and complexity
In turn, this requires changing current culture and behavioural norms in client agencies, particularly for staff in the ‘front line’ of infrastructure procurement and delivery through resetting current incentive structures, outsourcing some responsibilities (such as the development and enforcement of a harmonised suite of contracts) to broader owner agencies where the broader benefits can be best aligned to costs, and providing greater support to the most affected decision-makers in client organisations.
2.4.1 BETTER PLANNING AND RISK IDENTIFICATION
The Infrastructure Audit (2019: p8) is correct in highlighting the unprecedented uncertainty facing economies from environmental, geopolitical, and technological factors. Since the release of the Audit, the emergence of the coronavirus pandemic has added an extra layer of uncertainty. This is not just via its direct impacts on the economy (including economically restrictive policy responses to contain the virus, but also stimulatory policies and recovery efforts later on), but also how the virus will affect future behaviours well after it has run its course, how we use existing infrastructure, what new infrastructure will be required in future and how we will fund and deliver it.
As the Audit makes clear, this increasing uncertainty requires better planning for infrastructure so that it is built not just to meet existing demands but can accommodate a range of potential futures.
Unfortunately, current evidence suggests that planning for infrastructure is, in too many cases, inadequate – whether it be at a broader macro or network level19 or planning for discrete projects. As noted by one major infrastructure contractor in recent industry soundings for this report:
‘One of the problems is planning. Productivity means nothing if you’re constantly going through change and I think some of these projects launch into delivery earlier than they should, before the level of definition is complete enough… And I think that probably causes much of the delays.’
In recent soundings, industry noted that the quality of planning for individual projects is deteriorating over time as agencies struggle with insufficient in-house technical capability given high and rising infrastructure demands. While client agencies in the public sector have been rebuilding capability (in most cases, directly from the private sector) in recent years to deal with increasing infrastructure planning and delivery requirements, there is still a likely significant net loss of ‘institutional memory’ and engineering and technical know-how in many agencies from wide-scale public sector downsizing and rationalisation during the 1990s and 2000s20. This situation is worsened when there is pressure to roll out infrastructure quickly, such as for stimulus measures to counter weak economic conditions, or to meet political timetables.
‘There were times where a project would be planned to the nth degree, the site fully investigated and then the client would be ready to bring it to market… Whereas now, I’m not sure that the effort is going into the planning phase to fully appreciate the challenges of a project, which in turn is breeding a contract model which really covers up the gaps, covers up the cracks, covers up the inadequacies in their technical capability.’
‘That’s where success stems from: where we have a well-developed, planned delivery methodology. The projects that have been unsuccessful are the ones where there hasn’t been thorough enough investigations at the start. The planning is being rushed.’
19 As noted by the Productivity Commission (2017) Shifting the Dial: 5 Year Productivity Review, this may include for example planning road networks through appropriate levels of reinvestment and maintenance and also to accommodate funding and investment decisions based on technological shifts such as automated and electric vehicles and Mobility as a Service (MaaS) developments.
20 Yates. A (2000) Government as an informed buyer: Recognising technical expertise as a crucial factor in the success of engineering contracts, The Institution of Engineers, Australia, Canberra, p5.

19
Getting planning right is fundamental to the success of infrastructure projects, and hence the sustainability of industry to deliver them.
Problems arising from poor planning can cascade through the rest of the infrastructure delivery process, with poorly defined scopes requiring more work and cost by industry at the tendering stage (multiplied by the number of tenderers) to identify risks and develop engineering solutions. Inadequate definition of risk by the client, meanwhile, is more likely to encourage risk-shifting models of procurement, where contractors are effectively held responsible for identifying and managing risk despite not being in the best position to do so. Consequently, projects are more likely to be won by contractors who are prepared to take on the most risk, rather than who offers the best value solution for all parties. Both issues – higher than necessary tendering costs and inefficient risk allocation – create large costs in delivering infrastructure and impact on industry sustainability and are discussed further below.
Solutions – project planning and risk identification
Guidance on infrastructure planning and delivery has been published by Infrastructure Australia in its Better Infrastructure Decision Making Guidelines and is updated on a regular basis21. This outlines Australia’s key decision-making processes for national infrastructure, but there are key planning principles which are relevant to reducing infrastructure costs and supporting a more sustainable infrastructure industry.
These principles include:
• Focusing on projects that have demonstrated positive net benefits and are informed through Infrastructure Australia’s Decision-Making Principles. Projects that have been identified from departmental strategies, informed by solid feasibility studies, risk assessed contextually for the region and have strong stakeholder engagement in their development have proven successful. Thorough planning is more likely to deliver a successful project.
• Considering earlier partnering with industry and utilities in the planning process to better identify risk and engineering solutions. This will reduce subsequent tendering costs through reducing the need for technical information, or making adjustments to the requirements mid-tender, and could be done through an early works package in some cases, or other forms of early contractor involvement.
• Collecting and retaining data on projects to improve planning over time. Project planning and delivery informed by applying lessons learnt, continuous improvement and benchmarking against other projects and industries is more likely to result in improved planning approaches and improved and more accurate identification of risks.
2.4.2 BETTER TENDERING PROCESSES
Industry sustainability can also be improved through more streamlined procurement processes that reduce tendering costs. The cost of tendering – which not only includes the preparation of the bid itself, but also the cost of intellectual property, dealing with administration and ‘red tape’ and, increasingly, legal review costs regarding the contract itself – is often raised by industry as a barrier to participation. Unreimbursed industry costs in preparing tenders inevitably will need to be recouped in prices for future projects. While particular jurisdictions have introduced policies to reimburse some bid costs, the often onerous bid requirements, the time it takes to arrive at a preferred tenderer status and the use of non-standardised contracts is still adding substantially to the cost of the tendering process and absorbing much of industry’s capability.
As noted by contractors in recent industry interviews for this response:
‘The cost to participate has been prohibitive in a number of situations … we’re starting to see the 50% reimbursement on tenders coming through as per the 10 Point Plan, but it’s only come through late last year. But even still the amount of deliverables, the amount of work it takes, the amount of investigation that you need to do to get to a winning position costs a lot of money. And therefore we haven’t been able to participate on projects sometimes that we would have liked to have.’
21 Infrastructure Australia (2018) Infrastructure Decision-making Principles, July 2018. Viewed 6th June 2020 at: https://www.infrastructureaustralia.gov.au/publications/infrastructure-decision-making-principles

20
Large, long tendering times can be a waste of resources…
Bid teams can be large (100+ people) for very large project tenders – including engineers, designers, estimators, schedulers, human resources, lawyers, health and safety officers, quantity surveyors and more – and can cost tens of millions of dollars. Lack of access to key stakeholders during the tender process frequently means that a valuable opportunity to refine the design is lost.
Tender cost typically may equate to 1.0-1.25% of project value and can take up to 40% of entire project process in terms of time.23
This suggests that (i) simpler, lower cost processes are required to get to a short list quicker and (ii) that more work needs to be undertaken in planning phases (as already discussed above) so that both risks and potential engineering solutions are better understood prior to tender, sharply reducing tendering requirements. In optimal cases, this might be best managed through an early works package or other form of early contractor involvement so that risks can be best identified.
Top industry bidding teams are a highly skilled, finite resource that can quickly become stretched when several large projects are out to tender.
Long bidding processes keep these teams locked in place until the bid is resolved, which is itself costly, especially if the tender process is amended, duplicated or extended. Where several large tenders are released simultaneously, contractors and consultants need to make a call on whether to bid. Each firm typically has a limited/set bid budget and will reject participating in bids where they feel the costs of tendering (including the potential costs from ‘unpriceable’ risk if they win) relative to the size of the project and other opportunities is too large. In turn, a lack of participation at the tender phase can result in a lack of competitive tension, impacting negatively on the client’s own ‘value for money’ criterion.
… while short tendering times may mis-estimate risks and costs
Conversely, for some large projects, the time available to submit a bid can be too short (3-6 months). This may not give contractors enough time to properly understand and price risks associated with the project and come up with best value engineering solutions. As one contractor noted in recent soundings:
‘From a contractor’s perspective, we get a very short period of time to tender a project and to assess risks. We have to make assumptions in a very short period of time on how we move forward. When governments develop projects, that development period happens over a number of years, whereas we have 12 weeks.’
Utilities risks, particularly, remain a key concern of industry and have, if anything, become more difficult to manage and price in conforming tenders. In industry soundings for this response (held in April 2020), contractors noted that they cannot even approach utilities on probity grounds until they are the preferred tenderer, meaning that risks are unlikely to be effectively identified and priced at the tender stage:
‘The preference is that you cannot talk to that utility asset owner until you’re the preferred contractor or the contracts are awarded. They fly under this banner that it’s competitive. No one wants anyone to be disadvantaged by indirect conversations or discussions. To be fair and equitable, utility asset owners aren’t interested in talking to three bidders during the tender phase.’
Addressing these sorts of issues may best be handled by choosing a procurement model which best fits the risk / complexity profile of the project and not only considers who is best placed to manage the risk but who should be financially liable for it. For example, a contractor may be best able to manage the risk of unsuitable ground conditions but it may not be reasonably possible to price that risk and so it would be inequitable to expect the Contractor to do so. This may involve collaborating early with industry if there is a lack of capability to assess risk within the procuring agency. This could then avoid duplicating expensive, imperfect risk assessments from multiple bidders at the tendering stage.
23 BIS Oxford Economics (2018) NSW Construction Delivery Assessment: Capacity and Capability, Expert Report for Infrastructure NSW, Sydney. Viewed 6th June 2020 at: https://insw-sis.visualise.today/documents/about/NSW_Construction_Delivery_Assessment_Capability_and_Capacity.pdf

21
Lack of contract standardisation is still a major cost impost on industry
As a general principle, the use of standard contracts reduces the need for costly legal review or negotiations and gives industry, clients and other stakeholders comfort in knowing that risk and reward is allocated fairly24.
While many public sector clients that procure infrastructure recognise the need for the use of standard procurement contracts (and is enshrined as one of the NSW Government’s 10 Point Commitment to the Construction Sector) recent industry soundings for this response indicate that, if anything, contracts are becoming less standardised than before, and the costs of checking new contracts and clauses (particularly legal costs), and complying with increasingly onerous contractual terms and conditions are increasing significantly.
‘It’s not that we didn’t have them. We did have standard contracts, NPWC and then we moved to GC21, but now we’ve moved to something else, who knows what it is. Everything’s different. So we’ve actually gone from a situation where we had standard contracts to a situation where we don’t have any standard contracts.’
To some extent, the increasing use of bespoke contracts, conditions and terms is a recognition that every infrastructure project is different in terms of its complexity, risks and scope. However, it is possible to create a standard suite of contracts covering all risk profiles and related optimal procurement models. In recent soundings, industry noted that the move away from standard contracts is also the consequence of a culture which is more focused on minimising risk to the client (“protecting taxpayer money”, in the case of government clients) than reducing overall costs of infrastructure provision and sustainability of the industry. As a result, contracts become more complex over time as any “contractual cracks” which provided relief to a contractor in one situation are papered over in subsequent iterations.
‘Governments work together with their own lawyers to develop their own contracts. The lawyers are talking to each other as we do in different states and … they go back to government and say, look, this happened over there. So put in this protection. So it may be the contracts today are even harder that they were three years ago.’
Increasingly, contractual variations are occurring through the attachment of bespoke special conditions or inserting contractual terms in technical specifications which accompany the other conditions. In response, industry needs to increase its own spending on legal teams to read through all parts of the contract – including the technical specifications – along with the estimators, engineers and other consultancy staff.
‘Why it’s becoming more and more difficult is that in the good old days you had a general conditions of contract, a special conditions of contract and you had a technical specification. These days the technical specification reads like a contract. So you’ve got this problem now where a lot of the stuff that we are getting caught up on site is not in the general conditions or the special conditions – it’s buried in the technical specification and our estimators and engineers aren’t always properly trained or properly skilled to pick that up at the time of tender… A lot if it only comes to visibility while you are delivering the project – that you are getting hung on something that was written in a technical specification. The technical specifications read like they have been written by lawyers these days… not engineers.’
Ultimately, attempts to minimise client risks in this way are counterproductive to achieving true value for money in infrastructure provision as they increase costs and risks for industry. Even if risks (and costs) are successfully transferred to industry in this way, eventually these costs will need to be reimbursed through higher prices in future tenders or, in severe cases, by firms exiting the industry as they can no longer absorb or insure against the risk.
In the meantime, the main winner from this approach is the legal profession.
24 Ibid, p17.
22
The challenge for clients is two-fold: firstly, recognising that using standard contracts is a fundamental solution to bringing down the costs of procuring and delivering infrastructure. But secondly, and just as importantly, is being incentivised, collectively, to act on a solution. This may be because the cost of developing a suite of standard contracts may be prohibitive for a particular client agency (particularly in an environment where procurement is highly decentralised), while the benefits to the client of retaining the status quo (where client risks are minimised for their project and the resultant rise in industry costs is diffused over a portfolio of future tenders) are very high. As noted by one contractor:
‘We were in a meeting with [a client] and… asked about standard contracts and the response was “Well, the problem with that is I have to put my best people on to it for a long period of time in order to develop these contracts.” The government doesn’t seem to think it’s a big issue or understand how it feeds into absolutely everything else, whether it be bid costs or risk apportionment … But it’s the central thing that’s causing us problems and they don’t see it as a priority. Whereas in the past it was something that was driven by government.’
The upshot is that industry can’t always afford the bid process as it is currently configured – with some notable exceptions – and it is reacting by either lessening its participation (effectively curtailing industry capacity and capability and long term sustainability) or raising its own prices in response (lessening value for money in infrastructure procurement and provision).
Solutions – the tendering process
Consequently, key actions for consideration in terms of achieving better procurement processes include:
• Consider earlier partnering with industry in the planning process to better identify risk and engineering solutions. This will reduce subsequent tendering costs.
• Minimise requirements of industry in reaching the preferred tenderer phase. Bidders still need to submit a large volume of tender documents just to get on the short list of tenderers, and clients tend to ask for the same information repeatedly. A simpler system is required to get to the short list, including asking for less detailed information prior to the preferred tenderer stage and implementing ‘one stop’ registration and approvals systems so contractors are not repeating administrative tasks.
• Publish tender criteria. While there are improvements in some jurisdictions, industry can still be left in the dark about the relative weighting of price and nonprice factors when bidding. Agencies could be fully required to publish criteria for bid evaluation.
• Get to a preferred tenderer shortlist stage as quickly as possible. This will allow bid teams from non-preferred tenderers to focus on other opportunities and reduce overall industry costs in responding to a given tender (which will need to be recovered in future prices). Where the largest risk to a project is not necessarily cost but capability to deliver, identify and target capable contractors early. Clients should consider establishing (or tapping into existing) panels to minimise duplication and reduce the potential number of suitors to arrive at a short list.
• Establish a national “whole of government” agency committed to develop and mandate the use of a standard suite of contracts covering different procurement models from Design and Construct to more collaborative models, instead of leaving contract development to individual agencies under a decentralised procurement system. Given that industry deals with different contracts across jurisdictions, supporting the development of a national, harmonised approach will require coordination of State and Federal Governments.
• Set realistic targets for industry bid costs associated with infrastructure projects and use actual bid cost data to reward procurement agencies that meet or beat these cost targets. With some jurisdictions and agencies already moving to partially compensate bidders for costs incurred (e.g. to foster competitive bids), it is important that these costs are seen to be efficient and foster competitive outcomes. They may also provide the basis for an incentive mechanism for agencies to reduce overall industry costs incurred in the bid phase.
23
2.4.3 BETTER RISK ALLOCATION
In recent soundings for this response, industry noted that the single biggest threat to sustainable infrastructure delivery was inefficient risk allocation on projects. Increasingly, clients are transferring greater risk to industry based on its bargaining position rather than the principle of who is best able to manage (or pay for) that risk. Contracts can be a ‘take it or leave it’ proposition for individual firms forcing contractors to compete on their willingness to price and accept unquantifiable risk rather than compete on positive differentiators such as productivity, innovation and social responsibility.
As one contractor noted:
‘Risk allocation – I think it’s probably the biggest issue.’
‘There’s a natural cap on how much money you can make with a really good job, but there’s no cap on how much you can lose.’
And others:
‘Contracts need to reflect a reasonable risk profile that is well understood. The problem is clients across the board are defaulting to: “we want no risk”. They are defaulting to contracts where all the risks are passed down and at present contractors are saying, “yep, we can manage that risk school” or thereabouts. And that’s why we have train wrecks.’
‘We have accepted [risk]. We thought we could manage it. But the size, scale and complexity is too much to manage.’
‘I think the problem we have is that revenue is sometimes confused with profit and margin. Yes, revenues are extremely high but so are costs. So don’t believe your razor thin margin or profit that you can actually make on a project. It doesn’t take a lot of things to go wrong to completely erase that profit.’
‘Cost is an issue, but I think it’s mostly about understanding and managing risk… and being asked to manage risks that we can’t manage. We’re being asked to take risks that we don’t understand under a competitive process or risk that we can’t manage under a competitive process. We’re being pushed into it and we’re damned if we do and damned if we don’t in taking those risks.’
‘Information is provided by the client after spending millions of dollars on the planning phase and investigations and they hand over documentation to a contractor. But you can’t rely on the information provided. That’s where a lot of the risks stem from… any contractual discussion or dispute stems from this.’
Here, the issue is broader than just one of profitability, however, with the way risk is transferred in the procurement process also having significant negative impacts on industry participation (impacting competitiveness and value for money) and future productivity. Said one contractor:
‘The commercial terms and the risks have been very difficult and we’ve had to walk away a number of times when we had the capability, had the people but just can’t accept the terms.’
And another:
‘[Risk] makes it challenging to achieve the type of margins you need to be sustainable. Because of that, because of that type of challenge, I think training and upskilling of the industry in general is suffering. So you go in with tight margins paying people but actually not training the next generation of tradesmen, supervisors, engineers, et cetera.’
The potential for weaker training and upskilling is not the only broader sustainability challenge arising from poor risk allocation. With an increased focus on risk, there is less time to develop innovative design solutions which also, by their nature, could be riskier than tried and true approaches, but may offer significant productivity benefits, particularly if the solution can be repeated and honed in subsequent projects. Instead, firms are more likely to utilise existing (possibly over-engineered) solutions that will inevitably be higher cost to deliver or offer fewer legacy benefits.
‘Offloading risk through hard contracts does not manage the risk. It simply transfers the risk to another party.’
If that party is not in a strong position to manage (or pay for managing) that risk, it is more likely that failures will occur with the project, with rising infrastructure costs the result.

24
By contrast, in the case of particularly risky, complex projects, more collaborative procurement processes can be used to bring overall infrastructure costs down. A good example of which is the current procurement process for the Sydney Metro West project where the participants in the process are being asked to actively and collaboratively review project risks, risk mitigation strategies and the most appropriate owner for residual risk.
As another example, under alliances risks and the consequences of failure and success are shared. Rather than each party trying to pass risk, there is a greater focus on trying to better identify where the risks lie, develop solutions to manage that risk more effectively, and work together to resolve disputes when failures occur rather than recourse to costly litigation.
In 2015, the then Department of Infrastructure and Regional Development’s National Alliance Contracting Guidelines25 considered an alliance a suitable project delivery method when the relevant project has one or more of the following characteristics:
• The project has risks that cannot be adequately defined or dimensioned in the Business Case nor during subsequent work prior to tendering;
• The cost of transferring risks is prohibitive in the prevailing market conditions;
• The project needs to start as early as possible before the risks can be fully identified and/or project scope can be finalised, and the Owner is prepared to take the commercial risk of a suboptimal price outcome;
• The Owner has superior knowledge, skills, preference and capacity to influence or participate in the development and delivery of the project (including for example, in the development of the design solution and construction method); and/or
• A collective approach to assessing and managing risk will produce a better outcome, e.g., where the preservation of safety to the public/project is best served through the collaborative process of an alliance.
This is not to say that all projects are best managed for risk through alliance models, but rather that is should be properly considered as part of a full suite of procurement models. As one industry representative noted in soundings for this response:
‘There’s not one silver bullet... You just need mature clients that have had a proper discussion around risk allocation depending on the project, where it’s at, what’s to be delivered. And at the moment we’re not seeing that.’
And another:
‘I do not want to say that the only way of delivering projects is alliances because that’s not right. Alliances are a very good delivery model for projects where there is a brownfield environment, a big component of unknowns that is very difficult to pre-assess. But there should be delivery models where we can price, dissipate risk, and design our way out of trouble. And so I think that we need to be open to all kinds of contract models.’
Furthermore, the Productivity Commission’s 2014 inquiry into the costs of delivering public infrastructure noted that26:
‘Alliances may work well in some circumstances, but recent practice has been increasingly wary of the model due to uncertainty about the overall cost of construction and potential to put off rather than deal with risk issues early. Alliances may nevertheless still have their place. In particular, they may offer value in specific circumstances where projects must proceed out of necessity, but where substantial risk cannot be clearly allocated to one party. For example, because risks are difficult to identify and quantify or there is disagreement over the price. These examples should be rare in an effectively-planned infrastructure environment.’
Figure 6 shows a range of delivery models that can be used for infrastructure projects27. Each are different in the way they can allocate or share risk and weight price and non-price factors in the tender phase.
Advantages of ‘traditional’ procurement approaches that focus on price factors are that it provides lowest upfront cost to infrastructure funders (including taxpayers, for publicly funded projects), it is measurable, and can be used to provide clarity in terms of ranking bids. However, non-price factors can better capture longer term net benefits – including community benefits as well as higher quality and lower lifetime costs of infrastructure – and can be used to help encourage innovation and other productivity drivers (e.g. training targets).
26 Productivity Commission (2014) Public Infrastructure, Inquiry Report No. 71, p122
27 This is by no means an exhaustive list. As highlighted by the Construction Leadership Group (2018), while Construct Only, Design and Construct (D&C), Design, Construction and Maintain (DCM) and Cost Plus are traditional approaches, more collaborative approaches include Managing Contractor, Early Contractor Involvement (ECI), Framework Agreements, Incentivised Cost Targets and Alliances. PPP models can include a range of Design, Build, Own, Operate, Maintain or Transfer models including BOOT, DBFO, DBFM, DBOM as well as market-led proposals.

25
While complex infrastructure projects with large ‘unknowns’ may be better suited to more collaborative models in terms of efficient risk allocation (with the Level Crossing Removal Program in Victoria a positive example) such delivery models are currently rarely used in the Australian
infrastructure market. Instead, most infrastructure, regardless of the risk profile, tend to be procured through hard dollar ‘lump sum’ contracts, with upfront capital costs (price) being the primary determinant of who wins the work.
Fig. 6: Types of Delivery Models
Source: BIS Oxford Economics
Delivery models General description Risk allocation
Construct only
• Most commonly used delivery model, especially for ‘minor works’ and straightforward ‘major works’ projects
• Project owner prepares the design
• Contractor engaged to construct the works based on supplied design
• Design risks: project owner
• Construction costs risks: majority borne by the contractor
• Quality risks: contractor
• Maintenance risks: project owner
Design and construct
• Project owner provides project brief
• Contractor engaged to both design and construct the project works based off the project brief
• Contractor uses in-house resources or external designers for the design component
• Best used when there is a high need for cost certainty
• Design risks: contractor
• Construction costs risks: majority borne by the contractor
• Quality risks: contractor
• Maintenance risks: project owner
PPP
• Used when there is a complex risk profile and an opportunity for risk transfer
• The project owner selects a private sector partner to finance, design, construct and operate the project’s works
• Public sector regulates price and quality of service
• Design risks: private sector
• Construction costs risks: majority borne by the private sector
• Quality risks: private sector
• Maintenance risks: private sector
Managing contractor
• Typically used in large complex buildings where the scope is uncertain
• Via a competitive tender process, a contractor is selected for the project management role
• Contractor’s role is to manage the design, enter into contracts to develop construction and manage the delivery of the works on behalf of the project owner
• Design risks: managing contractor
• Construction costs risks: managing contractor
• Quality risks: managing contractor
• Maintenance risks: project owners
Alliance
• Project owner and one or more non-owner participants collaborate to work and deliver the project
• Shares project’s risks and rewards
• Often used for highly complex projects where the scope and risk profiles are highly uncertain
• Design risks: shared
• Construction costs risks: shared
• Quality risks: shared
• Maintenance risks: project owner

26
This is a major issue not just because infrastructure projects have become more complex – and hence riskier – in recent decades, but because infrastructure clients continue to use procurement models that don’t properly manage the new (higher) risk profile. Projects are becoming larger, they are more likely to involve major brownfield works rather than greenfield, where ‘below ground’ risks need to be identified and properly managed, and they are also more likely to involve multiple interfaces where risks of disputes between different parts of the project (and/or different stakeholders) are likely to be greater and, if left to themselves, more costly to resolve.
Furthermore, stimulus policy reactions to COVID-19 are likely to involve accelerating infrastructure projects where possible and hence reduce the time available to identify and allocate risk effectively.
As noted by industry in recent soundings for this study:
‘It’s not about establishing infrastructure. It’s about creating new infrastructure for a bigger city. You are building over old infrastructure, so it’s a completely different risk profile and we’re using essentially the same models that was used to establish it in the first place… You’ve got to use different models because now you’re overbuilding, you’re interfacing more with utilities, you’re interfacing more with stakeholders.’
Solutions – better risk allocation
The increasing complexity and risk embedded in modern infrastructure projects, combined with potential constraints on the capability and expertise of client to evaluate and manage these risks, requires clients to adopt a more agnostic approach to their choice of procurement model. While traditional, price-focused models are still best suited to project were risks and engineering solutions are well known, there needs to be a more collaborative approach for larger, complex projects from the very beginning.
This may include engaging a contractor and a design consultant upfront (i.e. an ECI approach) to identify risks and challenges of project together and
approaching utilities together during the planning phase. A model could also be used where the preferred contractor is chosen at the start based on their capability and their skill set to respond to the challenges of the project. The engineering solutions, and price, can then be developed together.
Reticence by clients to move towards collaborative procurement models for complex projects where risk is typically blamed on:
• The relative bargaining power of the client vis-à-vis industry
• A mismatch between client incentives (often targeting short term ‘best value’ metrics such as agreed construction cost) over long term value.
• Uncertainty over eventual construction costs and perceived cost failures on previous alliances.
While past experience using collaborative models such as alliances is mixed29, there is no definitive evidence that the construction costs on complex, risky projects will be higher under a collaborative model – especially when evaluated upon project completion where all risks have played out and given recent advances in the sophistication and administration of collaborative contracts.
In practice, it is difficult to measure directly how short run and long run costs for specific projects will differ under collaborative or competitive tendering models. However, where construction costs are perceived to be higher under a well-designed and implemented collaborative approach, it is likely to be because risk has been better identified and priced (rather than being a costly surprise later on) or because the collaborative solution includes a range of non-price benefits such as quicker construction, better build quality, innovative engineering, materials or process solutions that can be rolled out again in future projects, or commitments to training and upskilling – all of which can boost industry productivity.
Ultimately, ensuring that the best procurement model is used for each project, requires an alignment of incentives.
29 Ross (2009), Alliance Contracting: Lessons from the Australian Experience, article prepared by PCI Alliance Services for VDI-Bau, the Association of German Engineers, p9-10. Ross cites evidence from the Alliance Association of Australia that 80% of alliances met or beat time and cost targets, comparing favourably with similarly complex projects undertaken under more traditional contract forms. Similar positive findings were made by Walker D., Harley J. and A. Mills (2015), Performance of Project Alliancing in Australasia: a Digest of Infrastructure Development from 2008 to 2013, Construction Economics and Building, 15(1), 1-18. DOI: http://dx.doi.org/10.5130/ajceb.v15i1.4186. The take-up of alliance-style contracting was substantial in the 2000s – with over $32 billion in work commissioned across roads, rail and water projects in the five years to 2009 according to the Victorian Department of Treasury of Finance. However, by 2014 Australian governments were becoming more wary in the use of alliances, with poor drafting of alliance terms, inexperienced project owner management and unclear performance measures and in some cases inadequate management of performance leading to higher than expected delivery costs and perceived loss of value for taxpayers.

27
Industry noted in recent soundings that client incentives, particularly, are heavily influenced by risk averse infrastructure financiers, both from the private sector and public sector (i.e. Treasury). Here, protecting the interests of financial stakeholders (including taxpayers) by reducing their exposure to an uncertain infrastructure cost profile is the paramount concern. In public infrastructure, the situation is made more challenging by the political cycle, where any short run increases in upfront infrastructure costs are viewed negatively (even if they produce long term net benefits outside of the current electoral cycle).
Changing client culture towards more collaborative contracting approaches for complex, risky projects means changing these incentives and improving understanding of how the construction industry operates. To a large degree this means focusing less on ‘headline’ estimated construction cost numbers as the key performance measure (which as Terrill (2016) notes is likely to be grossly underestimated in any case, and hence a key driver of perceived cost blowouts on transport projects30) and instead focus on and reward performance to procurement teams for achieving broader, non-price, long term performance goals. These can include (and have been included on current and previous projects):
• Achieving increased training and upskilling on projects which provide a legacy benefit for future projects)
• Achieving project employment and diversity targets
• Maximizing local content and engagement of social and indigenous enterprise.
• Meeting agreed timeframes for delivery
• Meeting minimised long term operating and maintenance costs once project is completed
• Other non-price benefits
This is particularly important as governments seek to leverage the economic and social benefits of infrastructure spend in a post COVID19 world.
Industry has a large role to play here by working with project owners to ensure that risk-sharing models of procurement are successful for all stakeholders. This means ensuring that all project partners are represented by managers with strong experience in establishing and running collaborative projects, and that benefits and costs from the project are shared equally.
2.4.4 IMPROVING INDUSTRY PARTNERSHIPS
Achieving industry sustainability goals also requires industry to do its best to improve its own performance and productivity-enhancing behaviours.
This includes:
• Being a trustworthy partner to infrastructure stakeholders
• Being a model employer
• Supporting broader sustainability initiatives
Being a trustworthy partner
Solving infrastructure industry sustainability challenges ultimately means changing behaviours. Where more collaborative and partnering behaviours are required, this means that building trust between industry and its key stakeholders – clients/project owners, supply chain, its staff and the broader community – is critical.
In this regard, research by Khalfan et al (2007)31 found that the three most important factors in developing trust are:
• Honest communication defined where all parties are open, honest, and willing to share important information.
• Reliance as defined where people feel they can rely on the information they have been given and rely on the other to communicate effectively, and
• Delivery of outcomes as defined when the outcomes meet and/or exceed expectations.
These are important in building trustworthy relationships along each link of the supply chain. Indeed, the major breakdowns in trust were found when there were difficulties in one of these three aspects.
Poor or unreliable communication, unreliable information or people, and sub-optimal outcomes all contribute to a lack of trust in the workplace.
30 Terrill, M. (2016) Cost Overruns in Transport Infrastructure, Report No. 2016-13, Grattan Institute.
31 Khalfan, M., P. McDermott and W. Swan (2007) Building trust in construction projects, Supply Chain Management: An International Journal, Vol. 12, No. 6, pp385-391.
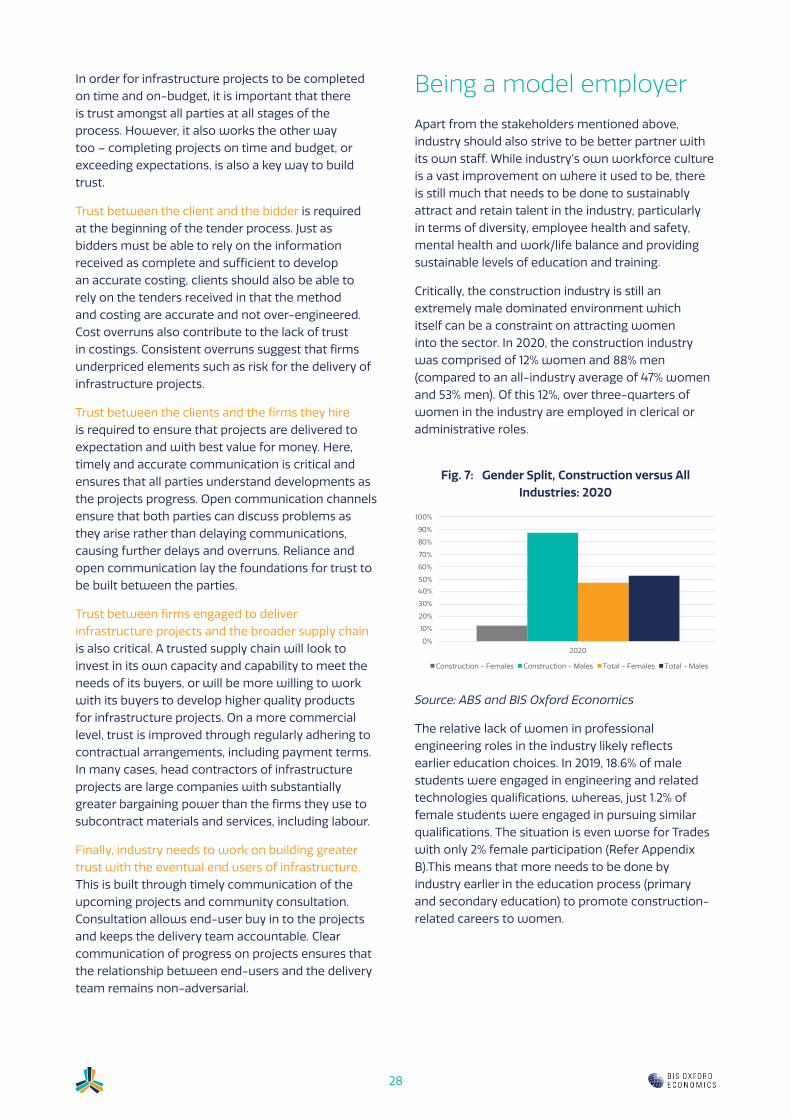
28
In order for infrastructure projects to be completed on time and on-budget, it is important that there is trust amongst all parties at all stages of the process. However, it also works the other way too – completing projects on time and budget, or exceeding expectations, is also a key way to build trust.
Trust between the client and the bidder is required at the beginning of the tender process. Just as bidders must be able to rely on the information received as complete and sufficient to develop an accurate costing, clients should also be able to rely on the tenders received in that the method and costing are accurate and not over-engineered. Cost overruns also contribute to the lack of trust in costings. Consistent overruns suggest that firms underpriced elements such as risk for the delivery of infrastructure projects.
Trust between the clients and the firms they hire is required to ensure that projects are delivered to expectation and with best value for money. Here, timely and accurate communication is critical and ensures that all parties understand developments as the projects progress. Open communication channels ensure that both parties can discuss problems as they arise rather than delaying communications, causing further delays and overruns. Reliance and open communication lay the foundations for trust to be built between the parties.
Trust between firms engaged to deliver infrastructure projects and the broader supply chain is also critical. A trusted supply chain will look to invest in its own capacity and capability to meet the needs of its buyers, or will be more willing to work with its buyers to develop higher quality products for infrastructure projects. On a more commercial level, trust is improved through regularly adhering to contractual arrangements, including payment terms. In many cases, head contractors of infrastructure projects are large companies with substantially greater bargaining power than the firms they use to subcontract materials and services, including labour.
Finally, industry needs to work on building greater trust with the eventual end users of infrastructure. This is built through timely communication of the upcoming projects and community consultation. Consultation allows end-user buy in to the projects and keeps the delivery team accountable. Clear communication of progress on projects ensures that the relationship between end-users and the delivery team remains non-adversarial.
Being a model employer
Apart from the stakeholders mentioned above, industry should also strive to be better partner with its own staff. While industry’s own workforce culture is a vast improvement on where it used to be, there is still much that needs to be done to sustainably attract and retain talent in the industry, particularly in terms of diversity, employee health and safety, mental health and work/life balance and providing sustainable levels of education and training.
Critically, the construction industry is still an extremely male dominated environment which itself can be a constraint on attracting women into the sector. In 2020, the construction industry was comprised of 12% women and 88% men (compared to an all-industry average of 47% women and 53% men). Of this 12%, over three-quarters of women in the industry are employed in clerical or administrative roles.
Fig. 7: Gender Split, Construction versus All Industries: 2020
Source: ABS and BIS Oxford Economics
The relative lack of women in professional engineering roles in the industry likely reflects earlier education choices. In 2019, 18.6% of male students were engaged in engineering and related technologies qualifications, whereas, just 1.2% of female students were engaged in pursuing similar qualifications. The situation is even worse for Trades with only 2% female participation (Refer Appendix B).This means that more needs to be done by industry earlier in the education process (primary and secondary education) to promote construction-related careers to women.
0%
10%
20%
30%
40%
50%
60%
70%
80%
90%
100%
2020
Construction - Females Construction - Males Total - Females Total - Males

29
The construction industry has been able to close the gap in many areas of diversity and have made commitments to achieving a diverse workforce. The Australian Building and Construction Commission amongst other industry bodies and firms in the industry have made a public commitment to increasing the diversity in their workplace32. The Construction Industry Culture Taskforce (CICT) has identified improvements in diversity as a key ingredient for addressing industry culture. However, there exist issues at the base level of attracting people into the industry. Perception of industry culture may go some way towards explaining this trend.
Health and safety is another area where industry needs to ensure it is doing its best to be attractive to current and future workers. Statistically speaking, the industry is still one of the most dangerous industries in which to work. While there have been significant improvements over many years, the construction industry still has the fifth highest fatality count of all industries in Australia. In 2018, there were 24 fatalities in the construction industry. Between 2014 and 2018, there were a total of 156 workplace related fatalities, an average of 31 fatalities per year. Generally higher physical safety risks in the construction industry are also reflected in the number of claims made for serious injury.
Mental health also remains a key industry challenge, with Australian construction workers six times more likely to die from suicide than a work-related accident33.
In soundings undertaken for this report, industry noted that there had been significant improvements in the way industry was responding to mental health issues and promoting practices and processes to improve employee well-being. However, there was also a sense that meeting tight deadlines for delivery and the sheer volume of major project work was taking priority over employee mental health and work-life balance. As one contractor noted:
‘The ACA is doing good work around the importance of mental health issues and work life balance. As a body it’s taken very seriously. Unfortunately, a lot of that good work isn’t flowing through down to ground level right now because we’re just in an environment where everyone’s focused on delivering the work that’s in hand. So we might see the benefits of what’s being put in place in a few years’ time. But, right now, if there are benefits, I’m not seeing them.’
And another:
‘I think there’s been a lot of good things done, certainly in the last 10 years around work life balance and mental impacts. The work environment these days is very different to what it was 15, 20 years ago. But when you’re on a troubled project or a problematic project, your state of mental health and work life balance diminishes quite a bit. When you have a lot of problematic projects on, as we do at the moment… you tend to work longer hours, you end up with more work and more pressure and a lot more is expected of you.’
In a very real way, financial sustainability (or lack thereof) can impact on broader industry sustainability.
When projects become problematic on a financial basis, it is very likely they will start taking a toll on employee health and work-life balance which presents staff satisfaction and retention challenges.
Even in normal times, the average hours worked in the construction industry is typically higher than that of the industry average across Australia, as shown in Figure 8. Over the past year, there has been a decline in the number of hours worked across the construction industry, likely related to the falling value of work done (and, particularly, the downturn in the residential building market). However, this compares against a steadier decline in average hours worked per week per person across all industries for the past 20 years.
32 Australian Building and Construction Commission (2020) Workplace diversity and inclusion, viewed 6th June 2020 at https://www.abcc.gov.au/about/careers/why-work-us/workplace-diversity-and-inclusion
33 Brown, R. (2015) “Construction workers six times more likely to die by suicide than in workplace accidents”, The World Today, ABC News. Viewed 6th June 2020 at https://www.abc.net.au/news/2015-11-20/construction-workers-more-likely-to-die-by-suicide-than-accident/6958768
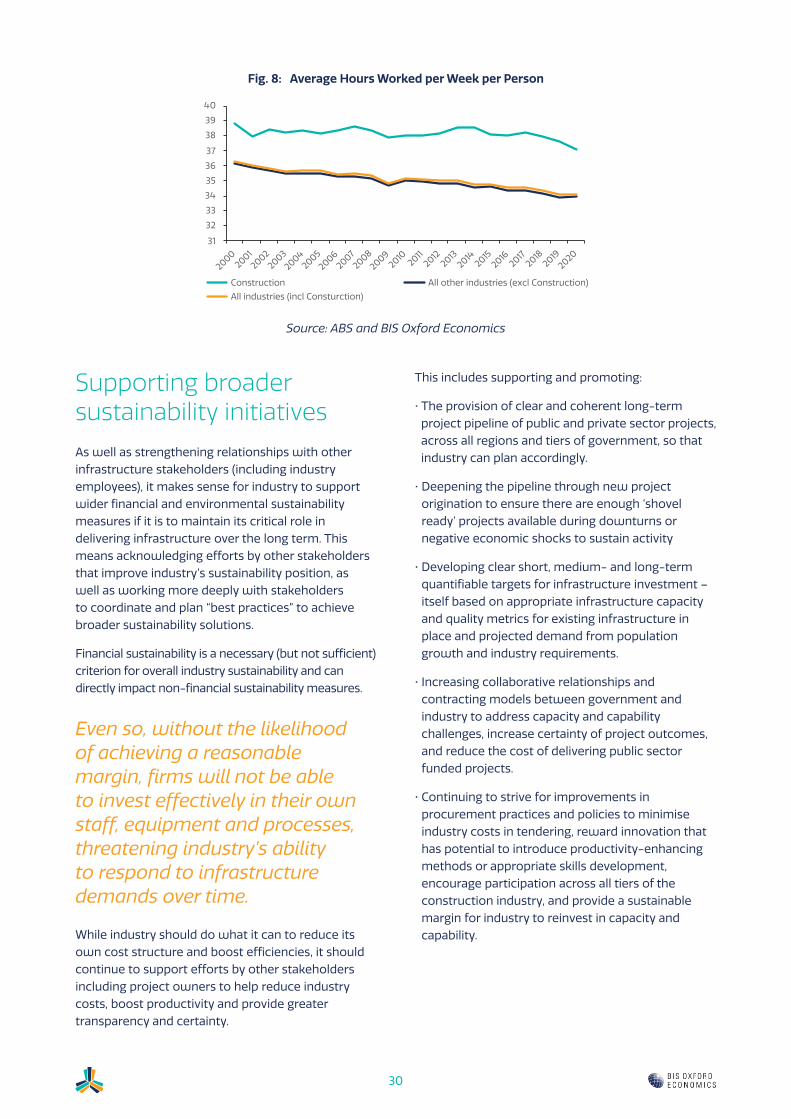
30
Supporting broader sustainability initiatives
As well as strengthening relationships with other infrastructure stakeholders (including industry employees), it makes sense for industry to support wider financial and environmental sustainability measures if it is to maintain its critical role in delivering infrastructure over the long term. This means acknowledging efforts by other stakeholders that improve industry’s sustainability position, as well as working more deeply with stakeholders to coordinate and plan “best practices” to achieve broader sustainability solutions.
Financial sustainability is a necessary (but not sufficient) criterion for overall industry sustainability and can directly impact non-financial sustainability measures.
Even so, without the likelihood of achieving a reasonable margin, firms will not be able to invest effectively in their own staff, equipment and processes, threatening industry’s ability to respond to infrastructure demands over time.
While industry should do what it can to reduce its own cost structure and boost efficiencies, it should continue to support efforts by other stakeholders including project owners to help reduce industry costs, boost productivity and provide greater transparency and certainty.
This includes supporting and promoting:
• The provision of clear and coherent long-term project pipeline of public and private sector projects, across all regions and tiers of government, so that industry can plan accordingly.
• Deepening the pipeline through new project origination to ensure there are enough ‘shovel ready’ projects available during downturns or negative economic shocks to sustain activity
• Developing clear short, medium- and long-term quantifiable targets for infrastructure investment – itself based on appropriate infrastructure capacity and quality metrics for existing infrastructure in place and projected demand from population growth and industry requirements.
• Increasing collaborative relationships and contracting models between government and industry to address capacity and capability challenges, increase certainty of project outcomes, and reduce the cost of delivering public sector funded projects.
• Continuing to strive for improvements in procurement practices and policies to minimise industry costs in tendering, reward innovation that has potential to introduce productivity-enhancing methods or appropriate skills development, encourage participation across all tiers of the construction industry, and provide a sustainable margin for industry to reinvest in capacity and capability.
Fig. 8: Average Hours Worked per Week per Person
Source: ABS and BIS Oxford Economics
31
32
33
34
35
36
37
38
39
40
2000 2001
2002
2003
2004 2005
2006 2007
2008
2009 2010
2011 2012
2013 2014
2015 2016
2017 2018
2019 2020
Construction All other industries (excl Construction)
All industries (incl Consturction)

31
Finally, climate change is another key sustainability challenge for industry, as highlighted recently by the recent disastrous bushfires across eastern Australia. For the infrastructure industry, this means taking positive actions including:
• Acknowledging infrastructure risks and opportunities from anthropogenic (human-induced) climate change
• Ensuring infrastructure is resilient to dangerous climate change impacts
• Taking steps, as an industry, to address root causes of climate change and minimising the carbon footprint of the construction industry.
2.5 CHANGING BEHAVIOURS AND CULTURE
Ultimately, putting reforms into practice require changes in behaviours and culture.
While changing organisational cultures and behaviours may be slow and difficult, history shows that change is possible and has occurred in the past, either through pressing necessity (e.g. meeting sharp capability and capacity challenges during the resources investment boom in the 2000s and early 2010s) or as part of a longer term deliberate and strategic re-orientation of goals (e.g. transitioning government agencies to be more customer focused).
In economics, behaviours can change by changing incentives. In the case of the resources boom, incentives changed suddenly through strong increases in prices for commodities which drove a need for faster delivery of new mines, processing facilities and associated infrastructure. New behaviours quickly followed as clients and industry worked more collaboratively and adopted innovative practices and solutions This also coincided with – or likely drove – a strong, albeit temporary, phase of growth in construction industry productivity and improvements in safety.
Government also have recent experience in changing culture to deliver better services for stakeholders –
particularly infrastructure users. This is evidenced in the way governments are re-orienting and reforming their transport agencies to offer more holistic transport solutions in line with new technologies (for example, electric and automated vehicles) and in line with ‘Mobility as a Service’ philosophies. This is resulting in more integrated transport agencies (rather than separate agencies for each transport mode) who have a greater focus on network outcomes, asset management and operations – and what it means for user experience – rather than focusing on civil engineering solutions.
Meanwhile, as demonstrated by the successful development and implementation of Service NSW, culture can also change by having a clear strategic plan, having leadership that recognises the problems and solutions, and providing support to staff impacted by the changes below the leadership level34. Here, measuring success through better-aligned Key Performance Indicators (KPIs) and through regular and consistent customer feedback was also vital, as was increasing the diversity of voices within organisations.
In the construction industry, too, increasing diversity is considered to have led to a cultural shift over time. As one contractor noted during recent soundings:
‘The construction sites are a less blokey place... whoever yelled the loudest got their way type of industry 20 years ago and that’s obviously not good… Little things like not making it mandatory to work on Saturday mornings – that makes a huge impact on the types of people you’re able to attract and retain…. It’s all about increasing the diversity of the types of people who want to and can work on our projects.’
While the industry still has a significant way to go in achieving some diversity goals – particularly in regard to gender balance – it is generally accepted by industry that increasing diversity is important for cultural change.
Diversity can also increase industry attractiveness and retention and is fundamental to achieving longer term sustainability outcomes.
34 Atterby, M. (2017) “How Service NSW led the way to customer-centric government”, CX Focus Magazine. Viewed 6th June 2020 at: https://www.cxfocus.com.au/features/how-service-nsw-led-the-way-to-customer-centric-government/

32
Collaboration is required to achieve effective cultural change
Ultimately, the existing working culture across the whole of the infrastructure industry and its stakeholders needs to change if it is to become more sustainable. For individual agents, this can be very difficult to achieve in practice, particularly if the behaviours of other stakeholders remain entrenched to the ‘usual’ ways of doing things. Ultimately, all stakeholders need to have ‘skin in the game’.
However, work by the ACA as well as other stakeholder representatives show a positive way forward.
In 2017, the opportunity to improve current practices prompted the ACA and the NSW and Victorian Governments to come together to form the Construction Industry Leadership Forum (CILF).
The CILF as a vehicle of change has the potential to break through cultural, financial and policy constraints that threaten to hold back the behavioural changes required to boost productivity in infrastructure delivery.
In August of that year, the CILF parties entered into a communique identifying key issues for resolution and a course for action. This was supported and enhanced by the NSW Government through its Construction Leadership Group (CLG) when it issues its NSW Government Action Plan: A 10 Point Commitment to the Construction Sector. The Action Plan covered all Government-procured construction and put as policy many of the client-based solutions highlighted in this report. The Victorian Government is also considering an Action Plan of its own.
The ACA and its industry members are acutely aware, however, that change is not a one-way street, and is developing its own Action Plan.
This includes making firm commitments on:
• Improving industry culture
• Collaboration to improve project outcomes
• Support for the supply chain
• Social license
• Improving industrial relations
• Reducing impact on the environment
• Innovation and productivity
• Openness and transparency
• Capability, capacity and skills, and
• Health and wellbeing
More recently, the ACA has also been involved in establishing the Construction Industry Culture Taskforce (CICT), which brings together representatives from the public sector, private sectors and academia to develop a new cultural standard for industry that will help it achieve its reform agenda.
Need for new standards, assessment metrics and review
Across the broader infrastructure industry, new behaviours are unlikely to be entrenched unless they are supported at the leadership level and appropriately incentivised at the operational level.
While there has been much progress on the former – convincing leaders of industry, agencies and other stakeholders of the right solutions – there has, arguably, been less success so far on the latter.

33
Achieving operational success is vital.
This requires currently used standards and performance measures to be adjusted to incentivise behaviours. In the case of an infrastructure project, for example, it may mean assessing costs at project completion (following variations, unplanned scope changes) against a target instead of the tender price (or earlier)35. Furthermore, infrastructure projects themselves should be assessed across a broader range of criteria – jobs created, number of new traineeships and apprentices, diversity targets, health and safety outcomes and client satisfaction – as well as dollar cost metrics, and these should be tracked and reviewed project by project to see if progress is being made.
For very large, complex projects, it is important to maintain a range of key performance indicators (KPIs), for both private industry and clients, that reward good performance. For industry, data should be collected and reviewed regularly across a range of fields – for example, dollar cost, timeliness, hours worked per employee, diversity, research and development, in time payments to subcontractors and suppliers, number of people trained or upskilled etc.
Infrastructure clients should collect and regularly review data on all projects regarding their own performance in terms of reducing industry bid costs, meeting targeted project outturn costs and timelines amongst other goals.
KPIs can be used to lower procurement and delivery costs. Where work is repeatable and these metrics are achieved, one form of reward could be to grant further scope without the need for costly retendering. Such approaches have been shown to work on the Level Crossing Removal Program, for example, as discussed further in Appendix C of this report. Alternatively, there could be rewards set for achieving some performance goals even when performance in other areas has not been as satisfactory so that positive behaviours are maintained.
Finally, there needs to be full and frank review after the completion of each project so that progress on meeting performance goals can be properly recorded and tracked.
Currently, while government and industry do collect performance data, it is not done consistently for all infrastructure projects and it is not published for fear of professional or political criticism. However, publishing KPIs and having specific KPIs tied to time and budget have been shown to encourage more collaborative behaviours, resulting in better project outcomes. Furthermore, it is critical from a reform perspective that performance results on these metrics are published for each infrastructure project so that private industry and clients can learn from initiatives and practices that worked well, and that progress to achieving better productivity outcomes is better tracked over time using consistent, reliable data rather than from sporadic, and often anecdotal, evidence. This task would be best performed by an independent Federal Government Agency such as Infrastructure Australia.
35 Terrill (2016) Cost Overruns in Transport Infrastructure, Grattan Institute Report No. 2016-13, specifically notes that biggest reason why cost overruns occur is because of premature announcement of costs before a proper business case or feasibility study is undertaken. Ultimately, however, the public judges performance of cost by considering completed value against these early announcements even though they are a poor measure. Here, the solution is to simply not announce costs of infrastructure projects before they have been properly assessed.

34
The efficient provision of quality, long lived infrastructure requires a well-functioning infrastructure industry that can help plan and deliver the assets required. While Infrastructure Australia’s 2019 Infrastructure Audit highlighted the importance of industry efficiency, capability and capacity in meeting growing and changing infrastructure demands, it is vital that this industry is sustainable over time. This requires changes in behaviours and cultures – the vital ‘third leg’ of a successful framework to achieve greater productivity and value for money in infrastructure planning and delivery.
As highlighted in this report, industry outcomes are no longer sustainable and this crisis is now being exacerbated by COVID-19 and policy responses to the pandemic. However, COVID-19 is also providing a unique opportunity to fundamentally reassess progress on reforming best value infrastructure planning, procurement and delivery approaches and implementing actions that will ensure industry sustainability long into the future.
Sustaining the infrastructure industry
The research and industry consultation undertaken for this response indicate that key risks to industry sustainability – and value for money for infrastructure procurers – are linked in that they have been driven primarily by poor productivity outcomes in infrastructure delivery over several decades.
This, in turn has led to an adversarial culture across the industry – including project owners, contractors and their supply chains – where each agent’s efforts have been concentrated on minimising their own exposure to costs and risks rather than targeting higher productivity and lower costs across industry as a whole. This poor culture, in turn, becomes a negative feedback loop, as time, cost and energy
spent on creating and enforcing increasingly complex contracts (“risk protection”) distract all agents from their core functions and responsibilities.
No one part of the industry is to blame for this situation. But all agents pursing their own self-interest is resulting in suboptimal aggregate industry outcomes where infrastructure is costing more than it should, industry is being stretched to deliver, and innovation – the critical driver of productivity – is being constrained.
In a way, this situation is highly like the classic ‘Prisoners Dilemma’ from game theory in economics and behavioural psychology. In that example, two completely rational participants are incentivised to protect themselves at the expense of the other participant, despite a collaborative solution yielding a better result for both. What prevented the better outcome was the incentive structure (which entailed strong negative consequences if one participant tried to collaborate and the other did not) and a lack of trust between the participants that prevented them to both seek the collaborative solution.
3.1 ACTIONS FOR A SUSTAINABLE INFRASTRUCTURE INDUSTRY
As in the case of the Prisoners Dilemma, a more collaborative solution is available for the challenges affecting the infrastructure industry. The onus should not be on one part of the industry moving, on its own, to the collaborative outcome, but rather that the industry moves together. This, in turn requires a coordinated, rather than piecemeal approach, with both industry and clients jointly committing to productivity-boosting actions. And this requires trust.
3. Summary and Recommendations

35
Consequently, the recommendations for actions are grouped into the following work streams:
• Re-energising and expanding the collaborative effort
• Clients to operationalise its own chartered behaviours
• Industry to release its own collaborative charter of behaviours
• Reform oversight to be managed by an independent agency such as Infrastructure Australia
3.1.1 RE-ENERGISING AND EXPANDING THE COLLABORATIVE EFFORT
While the last two decades have been a failure in terms of achieving strong and sustained productivity growth in the infrastructure industry, there have been considerable successes in terms of better understanding the nature of the problem, experimenting with more collaborative contractual forms, and developing greater partnerships between industry and government.
The ACA has played an important role in establishing the Construction Industry Leadership Forum (CILF) with industry and the NSW and Victorian Governments, and this partnership continues today with key working groups established to improve commercial outcomes, building capacity and capability and improving culture across the industry. Together with work done by other organisations with a stakeholding in the infrastructure space, as well as actions taken by government departments at the Federal and State level, this has resulted in collaborative actions which have the potential to boost industry innovation, capacity and capability and, ultimately productivity.
This includes:
• Increasing awareness of the need to publish pipelines so industry can plan with greater certainty
• Establishing skills and training academies to bolster capability, such as the Australian Major Projects Leadership Academy and the Tunnelling Centre in Victoria, Centres of Excellence in NSW, as well as various Skills Exchange programs on specific infrastructure projects providing on-site training opportunities.
• Providing partial compensation for bidding costs
• Targeting diversity and training goals in procuring major infrastructure projects.
One high point of this collaborative effort so far has been the release of the NSW Government Action Plan: A 10 Point Commitment to the Construction Sector, which lists a menu of principles and best practices that will guide public sector agencies in planning and procuring infrastructure work from industry. This plan, released in mid-2018, takes on board much of the solutions in this response.
However, there is still substantial work to do to ensure that the principles espoused in the Plan are actually delivered in practice, and that these principles are adopted more broadly and consistently by clients across Australia. This, in turn requires a coordinating role at a Federal Government level as well as by nationally focused infrastructure agencies such as Infrastructure Australia, particularly as some of the constraints identified in this report (for example, contract standardisation and harmonisation) are not limited to state boundaries.
Action must take place now. There is a pressing need to accelerate and broaden the collaborative effort. Now is not the time for complacency. This report notes that there is approximately $435 billion in social and economic infrastructure to be delivered over the next five years, and this may be accelerated or expanded upon as part of a COVID-19 stimulus response. Maximising productivity growth will be vital to ensure ‘bang for the buck’ in infrastructure delivery and industry capacity and capability to deliver during this time. But holding onto these reforms will be vital for long term industry sustainability and value for money.

36
Recommendation 1Government and industry to collaborate
The development of CILF is a positive example of how industry and government can work together in breaking through cultural barriers and drive constructive change. This model should be adopted by other State Governments, the Federal Government, as well as other industry associations, stakeholder agencies and representatives.
Recommendation 3Collect, maintain and report performance outcome measures
Industry should seek to broaden the adoption of identified, successful productivity-enhancing policies consistently across all Australian jurisdictions, such as those developed by CILF.
Recommendation 2Improve project initiation and delivery processes
Measuring productivity and sustainability outcomes under existing policy frameworks, as well as developing new policy, requires consistent, reliable data not anecdotal evidence. While this report highlights case studies which have delivered better outcomes, there is a lack of consistent data on the success or failure of the full spectrum of infrastructure projects across a range of measures. Industry and clients should collect, maintain and regularly report performance outcome measures on all infrastructure projects. This will better identify approaches that work or do not work and also track changes in performance over time.

37
3.1.2 OPERATIONALISING AND RECOGNISING COLLABORATIVE CLIENT BEHAVIOURS
Infrastructure clients should regularly and independently assess their own performance in meeting stated collaborative principles. While the NSW Government Action Plan represents a relatively recent and concise framework to assess, it is noted that not all Australian jurisdictions have ‘signed up’ to this framework.
Critically, soundings undertaken for this study indicate that while government and agency leaders are committed to the principles embedded in the Action Plan, there has only been partial success ‘on the ground’ in making these actions work in practice. In general, industry reports that progress in adhering to principles espoused in the Action Plan has been slow or inconsistently applied in NSW and Victoria but better progress has been achieved in South Australia. More work needs to be undertaken to confirm this.
Where behaviours are found to be not responding at the operational level, current incentive structures and KPIs will need to be examined or other support to ‘front line’ workers introduced to align behaviors with the identified best-case principles.
These measures may be specific to particular agencies, depending on need, but the case studies highlighted in Appendix C of this report provide many examples of approaches that have worked to deliver better value for money outcomes and industry sustainability. In particular, publishing KPIs and having specific KPIs tied to time and budget have been shown to encourage more collaborative behaviours, resulting in better project outcomes.
Improving infrastructure leadership and capability across the public sector by exposing major project staff to primary research and case studies that have been proven to deliver significant positive impact is vital. Here, an outstanding example worth highlighting is the establishment of the Australian Major Projects Leadership Academy in Victoria. This is based on a similar academy established in the United Kingdom as a collaboration between government, the University of Oxford’s Saïd Business School and Ernst & Young (EY). Given the success of the UK program, and the unprecedented level of major project investment in Victoria, the Victorian Government asked the University of Oxford and EY to establish an academy in Australia in 2019. Originally named the Victorian Major Projects Leadership Academy, it now accepts public sector participants from all over Australia. Further extending entry to industry participants would provide a consistent source of learning for project managers across government and industry as well as developing positive relationships between participants.
38
Recommendation 4Commit to adopt collaborative principles
Infrastructure client agencies across all Australian jurisdictions commit to abide by collaborative principles. The NSW Government Action Plan represents a good starting point for consideration.
Recommendation 5Report progress on adoption of collaborative principles
Infrastructure client agencies across all Australian jurisdictions commit to undertaking regular, independent regular, independent review of meeting collaborative principles such as those illustrated by the NSW Government Action Plan. As with industry reviews, this should be undertaken externally, regularly (every six months or annually) with performance results published for transparency.
Recommendation 6Incentivise improved outcomes
Where operational performance has not been met, infrastructure client agencies should target changes that will better align staff incentives with stronger productivity, cost and sustainability outcomes. this may require additional training, adjusting or developing new Key Performance Indicators (KPIs) for procurement teams — such as publishing tender weightings, tracking and achieving lower industry bid costs for specific projects, achieving timely tender outcomes and achieving cost targets upon project completion — and greater transparency from clients as to how bids will be assessed.

39
3.1.3 INDUSTRY TO RELEASE ITS OWN COLLABORATIVE CHARTER
While collaboration should be a joint effort, the NSW Government Action Plan currently stands alone as a policy response. However, industry can also do more to achieve better productivity outcomes. In soundings conducted for this report, industry noted that it agreed with government’s value for money principles and sought collaborative solutions where it would bring productivity benefits and reduce overall infrastructure costs. Yet past experience makes government clients wary of adopting more collaborative approaches to infrastructure procurement and delivery. Industry needs to be pro-active in establishing greater trust with its clients and supply chains.
If industry needs clients and suppliers that are willing to work collaboratively, then it needs to encourage that response by publishing and living by its own charter of collaborative principles.
This should be done as a matter of priority to help establish trust not just with clients, but the broader supply chain, their own workforces and the wider
community who will be using the infrastructure once it is completed.
The ACA, in representing the largest contractors responsible for delivering social and economic infrastructure in Australia, is well placed to work with industry in developing such a charter and, in line with the solutions identified in this report, should include a range of measures that address:
• Being a trustworthy partner to infrastructure stakeholders
• Being a model employer, and
• Supporting broader sustainability initiatives
Critically, these measures should be accompanied by statistics and quantifiable performance measures so that performance can be regularly tracked and evaluated. Where performance does not measure up, corrective actions should be identified. As per client agencies, this means that data will need to be collected for each project across a range of fields – for example, dollar cost, timeliness, hours worked per employee, diversity, research and development, in time payments to subcontractors and suppliers, number of people trained or upskilled, energy used and so forth – which can then be tracked over time.
Recent soundings for this report indicated that some (but not all) measures are tracked by major contractors. There may be a need to develop a standardised system of quantifiable measures that will test whether industry can meet its own charter. Honest, independent appraisal of success against these measures over time is likely to help build trust with clients and other infrastructure stakeholders.

40
Recommendation 7Industry charter
In a manner similar to the NSW Government’s 10 Point Commitment, industry should establish and publish its own charter of collaborative principles which it will abide by in delivering infrastructure projects.
Recommendation 8Monitor and report progress against industry charter
Related to above, each principle in industry’s charter should be quantifiable and assessed for performance. Industry should develop a standardised data template which can be completed by industry consistently on each project, matching each commitment in its own charter.
Recommendation 9Commit to a change in industry culture
Industry should commit to undertake a regular review of efforts in abiding by its own charter using the data collected. Given the nature of the review, and potentially handling of sensitive or confidential data, this review should ideally be undertaken by an independent body. This review should be taken regularly (e.g. every six months or annually) with results published for transparency.

41
3.1.4 MANAGING AND SUSTAINING THE REFORM PROCESS
While the infrastructure industry (through the ACA) and clients have opportunity to instigate and deliver key reforms as outlined above, there is the need for a broader independent agency to manage and sustain this reform process so that progress is achieved and current reform momentum is not lost. It should not simply fall back on industry or particular state governments or their agencies to be responsible for driving this collaborative effort.
As mentioned in this report, there are also circumstances where reforms need a broader, ideally national, champion to be effectively delivered – for example the development of a standardised suite of contracts (mirroring international efforts such as Project 13 and NEC Contracts) which are simply too costly or time consuming for a single agency or even a single jurisdiction to undertake.
In this respect, more CILF-like collaborative bodies could play a greater role in developing the tools and assessment procedures necessary to meet current reform goals as well as driving future reforms.
Alternatively (or as a partnership) it may make sense for Infrastructure Australia itself to have a greater involvement in ensuring productivity-enhancing reforms are undertaken at the procurement and delivery stage of infrastructure projects and their performance assessed.
While Infrastructure Australia has a responsibility to “rigorously and independently identify infrastructure needs and opportunities to ensure that our infrastructure funds are spent where they are needed most”, it also has an interest in “working closely and collaboratively with stakeholders across government and the infrastructure sector to raise the quality of infrastructure planning and delivery throughout Australia”36.
Given the evidenced lack of productivity in delivering infrastructure in Australia, it makes sense for Infrastructure Australia to be involved in managing and sustaining reforms in this area.
36 Infrastructure Australia (2020), What we do. Viewed 6th June 2020 at https://www.infrastructureaustralia.gov.au/what-we-do
Recommendation 10Independent Federal Government agency to support change
An independent Federal Government agency should oversee and coordinate a national reform process. This involves achieving a consensus on an overarching framework for construction industry sustainability and establishing a taskforce to assist and report on progress by each jurisdiction in achieving collaborative structures and reforms to infrastructure delivery that boost productivity, industry sustainability and long-term value for money. Given the size of the pipeline for infrastructure investment, a timetable for the successful delivery of reforms should be developed immediately.
42
Shifts in investment have a striking impact on economies, both in the short and long run. Since the turn of this century, Australia has experienced large swings in infrastructure investment which in turn have helped drive cycles of economic growth whilst also adding to long run productive capacity and productivity. While the private sector played a significant role in driving investment through successive resources and housing booms, emerging capacity constraints and bottlenecks in public infrastructure (coupled with new funding streams and financing models) have also driven a strong increase in public infrastructure investment. The sheer scale of the increase in investment created capacity and capability challenges which, in turn, led to transformational solutions as to how infrastructure could be better planned, procured, delivered and operated. Unfortunately, the productivity growth momentum established during the investment boom has not been sustained.
Infrastructure investment has eased over the past year and, due to COVID-19, now faces an even more volatile future. This section maps out BIS Oxford Economics’ economic and infrastructure construction outlook for Australia. While an unprecedented collapse in economic growth is taking place now, it is likely to be followed by a significant recovery in 2021 and 2022, with infrastructure investment playing a critical role. In turn, a forecast strong cycle in infrastructure investment – accompanied by a broader recovery in total construction sector work – will again provide challenges for industry sustainability, capacity and capability.
A. Economic Outlook
Short-term and COVID-19 impact
Growth in Australia’s economy was tepid over 2019. Employment growth remained healthy, and household income growth started to improve over the second half of 2019, aided by looser policy settings. But on the whole, households remained cautious in late 2019 and early 2020, opting to save income while discretionary spending remains soft. Further, consumer confidence has been battered by underwhelming economic news, the torrid bushfire season and most recently the COVID-19 outbreak.
Virus pandemic is driving economy into recession
The implementation of stricter social distancing measures in response to COVID-19 has led to the partial or complete shutdown of some sectors and will sharply curtail economic activity in 2020. We expect the prevailing lockdown conditions will remain in place through most of the Dec quarter. But there is significant uncertainty around this assumption, and lockdowns may be extended. Moreover, when restrictions are eventually relaxed, it will be done so gradually to ensure community safety, which will slow the speed of the recovery. Overall, BIS Oxford Economics is forecasting the Australian economy will contract over 7% in 2020, before entering a “U-shaped” recovery in subsequent years. Even with stronger than usual growth in 2021 and 2022, this will be coming off a decimated base. While the overall recovery path is still highly uncertain, it is likely the economy will not regain pre-COVID-19 levels of activity until 2022 at the
A. Appendix: Outlook for Infrastructure

43
earliest. Some industries and regions will be slower than others to recover, and some industries may not recover at all.
The short-term investment outlook is mixed
Investment is being negatively impacted by COVID-19, with repercussions for the construction industry (described in more detail in Section 2.2 below). Along with a sharp contraction in consumer demand, falling investment is a key driver of weaker economic outcomes through 2020. But a different picture is emerging sector by sector:
• Residential investment is likely to fall more sharply than expected through 2020. The coronavirus disruption will stall the recovery in property prices. Buyer demand is expected to fall sharply (in line with heavily reduced net overseas migration), while vendors are likely to pull their properties from the market where they can. Sales that are taking place are likely to be due to budget constrained vendors; prices are expected to fall sharply in the near term. Turnover will also likely fall dramatically, which has implications for retail sales, transfer costs and state budget revenues. Residential construction is still expected to be a drag on growth in 2020, but the size of the headwind will be small relative to the other shocks faced by the economy. Some supply bottlenecks are emerging, which will stall the flow of completions in the near term.
• Business investment is facing a severe crunch. Momentum in business investment was already very subdued entering 2020. Mining investment has been less impacted, supported predominantly by large iron ore sustaining capital projects, greater maintenance activity and small greenfield projects in other commodity segments. However this is being offset by falling oil and gas related investment, which is expected to continue its 6-year decline given sharp falls in oil prices. Non-mining business investment also faces a crunch; there remains a solid pipeline on non-residential construction work, but new projects appear to be held back by volatile conditions, while some sectors directly impacted by COVID-19 (education, retail and hotels) have paused expenditure on existing projects.
The heightened uncertainty around the economic outlook will put a further drag on capital expenditure. The Federal government’s stimulus packages have aimed to assist businesses with cash flow and have made borrowing conditions significantly cheaper. Moreover, business investment has been incentivised through increased asset deductions. These measures will aid the speed of the eventual recovery. However, investment will be a low priority for most firms in the near term, and we expect business investment will fall by 13% in CY20.
• Increasing role for public infrastructure investment. Meanwhile, underlying government spending remains supportive; transport infrastructure projects are continuing, while the NDIS rollout and greater education and health spending are boosting government consumption. Additionally, the Federal Government has announced an aggressive series of stimulus packages valued at around 11% of GDP. However, the announcements to date have centred around transfers to businesses, and there has been little change to the outlook for public demand, notwithstanding some increases in employment for the provision of public services. Future stimulus aimed at kickstarting the economy as restrictions begin to ease (which are mainly expected to be felt in the September quarter of 2020 onwards) may present upside for public investment.
Huge disruption to the labour market
Labour demand will fall dramatically over 2020. Unemployment is expected to increase by over 1 million people, sending the unemployment rate well into double digit territory by mid-year. The increase in unemployment will be mitigated by the government’s JobKeeper program, which will provide wage subsidies to firms for full- and part-time workers, as well as casual employees with a tenure greater than 12 months. Payments are roughly equal to minimum wage and must go to the employees in full. This policy will have the effect of keeping firms and workers attached through the crisis, again aiding the speed of the eventual recovery, and maintaining employment levels despite the fall in output. This will prevent the unemployment rate from going even higher and take pressure off the social security system.

44
Wage growth and inflation to slow
The sharp increase in unemployment coupled with many firms struggling to generate near-term cashflow will result in the nascent improvement in wage growth being snuffed out; we expect wage growth of just 1.4% in 2020 and 0.6% in 2021, and there is significant downside risk to this projection. Weakness in wage growth will put further downward pressure on headline inflation. Further, the sharp fall in oil prices and weaker consumer demand will also weigh on prices. Against this, supply disruptions and the very low level of the Australian dollar with provide some impetus to inflation. But overall, inflation will remain below the RBA’s target range for some time
Recovery in 2021 and 2022 but from a decimated base
As Australia emerges on the other side of the pandemic, the easing of lockdowns will be the key catalyst for improved economic activity. A possible COVID-19 vaccine (if able to be developed) will also boost confidence and ability to open up more of the economy to international movements of people.
Current forecasts by BIS Oxford Economics anticipate that growth rate profile will look somewhat “V” shaped as growth rebuilds from a decimated base. Growth could exceed 7% in calendar 2021 (and could be as high as 9-10%), but will be coming off a potential 7-8% decline through calendar 2020. In level terms, these growth forecasts mean that the recovery in activity will be more “U”- shaped as shown in Figure 1. Eventually, activity is forecast
to revert to pre-COVID-19 levels, although this will likely be a slow process, occurring in 2022 at the earliest. While the timeline of the recovery is heavily dependent on Federal and State lockdown policy, domestic responses to the easing of social distancing and trading restrictions, whether or not Australia has a ‘second wave’ of infections, as well as international conditions (tourism, trade, and migration flows), the shape of recovery is likely to be consistent.
Medium and longer-term outlook
Over the medium term, Australia’s trend growth rate is expected to slow to a little over 2.5%. The fall in trend growth is primarily due to a smaller contribution from labour force growth compared to recent history, with the Baby Boomer generation now transitioning into retirement. Capital accumulation is expected to make a steady contribution to trend growth. In recent years, additions to the capital stock were skewed toward the mining industry. But large-scale additions in this sector have now been completed.
Going forward, investment growth is expected to come from the non-mining business sector and infrastructure projects. Business investment has been subdued while resources were diverted to other parts of the economy. In the near- and medium-term, we expect there will be some catch up growth. Notwithstanding a structural decline in firms’ investment rates, the composition of investment has been shifting toward intellectual property product investment (which includes research & development). Whether these investments are labour-augmenting or labour-saving, they are expected to contribute to improved labour productivity growth in the medium term.
400
420
440
460
480
500
520
540
560
2018
Q1
2018
Q2
2018
Q3
2018
Q4
2019
Q1
2019
Q2
2019
Q3
2019
Q4
2020
Q1
2020
Q2
2020
Q3
2020
Q4
2021
Q1
2021
Q2
2021
Q3
2021
Q4
2022
Q1
2022
Q2
2022
Q3
2022
Q4
2023
Q1
2023
Q2
2023
Q3
2023
Q4
2024
Q1
2024
Q2
2024
Q3
2024
Q4
2025
Q1
2025
Q2
2025
Q3
2025
Q4
Series1 Series2
Fig. 9: Australian GDP, Baseline Forecast vs Downside ‘Second Wave’ Scenario

45
B. Construction Outlook
Just prior to the COVID-19 pandemic, Australia was estimated to be in the middle of a trough in total construction activity, finally hitting the bottom of a long slide from the resources boom and on the cusp of the next growth phase led by new investments in mining, transport and building infrastructure.
COVID-19 and the construction outlook
However, in the immediate term, the outbreak of COVID-19 will have a considerable impact on building sectors (both residential and non-residential) and place some strain on privately funded engineering construction.
COVID-19 has disrupted the supply of materials and labour to the construction sector. Demand side issues are also present in the building segments, with restrictions on auctions reducing demand for new dwellings while the uncertainty of returns reduces the scope for commercial project investments. The brunt of this shock will be felt in June quarter 2020. This is despite construction work being classified as an essential service.
Total engineering construction on the other hand is not expected to dramatically slump over the short
run. Work on major construction projects have continued during the domestic lockdown, albeit with some social distancing measures. However, we are beginning to see delays to major privately funded projects, particularly in the oil and gas sector. Additionally, some roads and utilities activity is likely to ease in line with falling subdivision development, while supply chain issues may expect to arise for other sectors. Publicly funded engineering construction work, with the exception of the NBN project (which is now winding down towards completion) is expected to grow given a substantial pipeline of large transport projects and potential increases in spending later in 2020 and in 2021 as part of a broader stimulus effort to kick-start the economy.
While more “normal” economic and social distancing conditions may return from late 2020, it may take much longer into 2021 to see a meaningful recovery in building activity. But when it does recover, it will likely be joining a more heated public infrastructure market, presenting potential challenges for construction industry capacity and capability, particularly if labour (contractors, subcontractors, professionals and trades), as well as materials and equipment suppliers, have been dislocated during the COVID-19 economic shutdown. By the mid-2020s the construction market could be running hot as recovering building activity and a wave of public infrastructure investment is joined by delayed oil and gas and other mining projects, as shown in Figure 10.
Fig. 10: Construction Work Done by Segment, Australia, Constant FY2018 Prices
0
50
100
150
200
250
300
0
50
100
150
200
250
300
2009 2011 2013 2015 2017 2019 2021 2023 2025 2027 2029 2031 2033
Year ended June
EC NRB Res
Source: BIS Oxford Economics, ABS
$ Billion $ Billion
Average2030-2034
Average2025-2029

46
Overall, COVID-19 is likely to amplify an existing cycle that as already taking place in construction activity, with a sharper decline in activity in 2020 than previously anticipated and a delayed (though potentially stronger) upswing emerging later from a weaker base.
Even so, there is higher than usual levels of uncertainty attached to forecasts of construction activity at this time. The environment remains dynamic, with risk heavily weighted to the downside. Major project timings remain variable and a there remain risks that a proportion of projects across building and civil infrastructure may not go ahead if economic conditions do not improve as anticipated or if funding becomes difficult. The negative risks on total construction work done could be worse if a ‘second wave’ of COVID-19 were to eventuate requiring an extension of lockdown measures, or more restrictive measures, to be implemented.
Recent history
The last decade has seen a very large cycle play out across engineering construction and residential building segments of the construction sector.
The dominant component of the cycle was in the engineering construction segment which, as shown in Figure 3 below, hit a record level of activity in FY2013 off the back of record investment in iron ore, coal, and oil & gas extraction and supporting infrastructure during the resources boom. This explosion in work done was heavily concentrated in Queensland and Western Australia, with New South Wales, the Northern Territory and South Australia also seeing significantly elevated levels of resources-related work. However, over the last 6 years resource-related construction has fallen nearly every year37, with the most dramatic factor being the completion of LNG related activity. The sheer scale of this boom and bust has driven the profile of not only engineering construction activity, but construction overall.
Fig. 11: Engineering Construction by Broad Sector Groups, Australia, Constant FY2018 Prices
37 With the exception of FY2018 which was heavily distorted by the arrival of the Prelude offshore LNG platform. The vast majority of the floating LNG production facility was manufactured and assembled internationally and as such does not much actual work done domestically.
0
30
60
90
120
150
0
30
60
90
120
150
2009 2011 2013 2015 2017 2019 2021 2023 2025 2027 2029 2031 2033
Year ended June
M&HI
Transport
Utilities
Other
Source: BIS Oxford Economics, ABS
$ Billion $ Billion
Average2030-2034
Average2025-2029

47
The resources cycle also coincided with rising levels of public investment in economic infrastructure which also boosted engineering construction work. By the early 2000s, a long phase of underinvestment in economic infrastructure relative to growth in demand revealed emerging capacity constraints.
Sustained economic growth (supported by earlier microeconomic reforms) coupled with rising taxation revenues gave governments the financial wherewithal to kickstart new major public infrastructure investment programs, such as AusLink in 2004. Combined with policy responses to support the economy after the global financial crisis (notably the Building the Education Revolution (BER) scheme), public investment surged through the late 2000s, peaking in the early 2010s. Concern over debt and budget deficits (at the State and Commonwealth level) saw public investment retreat over the first half of the 2010s, but another substantial wave of investment, focused in major transport projects, saw publicly funded engineering construction rise again between FY2015 to FY2019, as shown in Figure 4. An even bigger cycle is forecast for the coming decade based on the rollout plans for existing projects.
As the resources boom retreated, residential building saw its own period of sustained growth. Dwelling work done grew consistently from FY2013, averaging 6.2% per annum over the six years to FY2018 inclusive. Here, New South Wales did most of the heavy lifting, growing an average of 13% per annum
across the entire period. However, other states also pitched in at different stages. The resource states (Western Australia, Queensland, and the Northern Territory) saw strong performance following the height of the resource boom, before growth tapered and work done declined around FY2017. Victoria was somewhat slower to take off given previous strong residential investment, but activity accelerated quickly from FY2015 onwards. In FY2019 nearly all states saw a turn in residential building work done as constrained credit availability, price declines, building quality concerns, low turnover volumes and weak land sales baked in a significant downturn for dwelling activity.
During much of this period, non-residential building remained flat and a relatively small component of total construction. However, in FY2018 non-residential building work done rose 12%. The vast bulk of this lift was concentrated in the service sectors focused in Sydney and Melbourne. Office building has been a strong performer given a lack of investment in Sydney and Melbourne during the resources boom, with a dozen projects valued at or above $250 million commencing construction over these two years. Education was another big contributor, with a surge in tertiary and school building in both New South Wales and Victoria coming through, driven by strong population growth and growing export services (international students). Other social & institutional building also expanded strongly, with a bump in major prison and defence projects driving a solid lift in work.
Fig. 12: Major Transport Projects (over $2bn) by State, Constant FY2018 Prices
0
2
4
6
8
10
12
14
16
18
20
2010 2013 2016 2019 2022 2025 2028
SA North-South CorridorWA MetronetWA Hancock Roy Hill (Pilbara)WA Fortescue Metal Group (Pilbara)WA BHP Billiton (Pilbara)WA Rio Tinto (Pilbara)VIC Suburban Rail LoopVIC Geelong Fast RailVIC Melbourne Airport LinkVIC Inland Rail (VIC component)VIC Melbourne Metro RailVIC Level Crossing Removal Program (Rail)VIC Regional Rail LinkVIC North East LinkVIC Suburban Roads UpgradeVIC Level Crossing Removal Program (Road)VIC West Gate TunnelQLD Gold Coast Light RailQLD Cross River RailQLD Inland Rail (QLD component)QLD Logan MotorwayQLD Warrego HighwayQLD Gateway MotorwayQLD Pacific Motorway (QLD Component)QLD Bruce Highway UpgradeQLD TransApexQLD Ipswich MotorwayNSW Inland Rail (NSW component)NSW Sydney Metro WestNSW Sydney Metro Western Sydney AirportNSW Sydney Metro City & SouthwestNSW Sydney Metro NorthwestNSW Parramatta Light RailNSW CBD and South East Light RailNSW Great Western Highway DuplicationNSW F6 ExtensionNSW Western Harbour Tunnel & Beaches LinkNSW Pacific Motorway (NSW Component)NSW Western Sydney Infrastructure PlanNSW NorthConnexNSW WestConnexNSW Pacific Highway Upgrade
Notes: This chart is based on projects with over $2 billion in total value. Solid areas are road projects, dotted areas are rail projects.
$ Billion (in FY18 constant prices) Forecast
Year ended June Source: BIS Oxford Economics
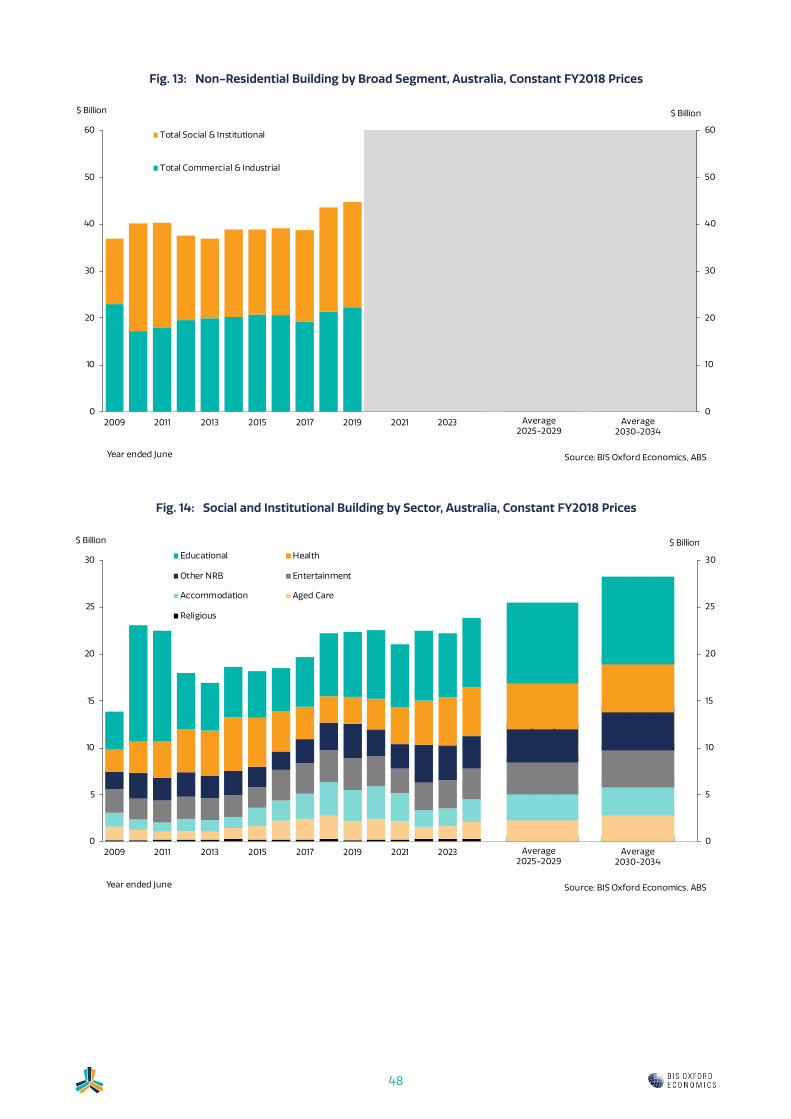
48
Fig. 13: Non-Residential Building by Broad Segment, Australia, Constant FY2018 Prices
Fig. 14: Social and Institutional Building by Sector, Australia, Constant FY2018 Prices
0
10
20
30
40
50
60
0
10
20
30
40
50
60
2009 2011 2013 2015 2017 2019 2021 2023 2025 2027 2029 2031 2033
Year ended June
Total Social & Institutional
Total Commercial & Industrial
Source: BIS Oxford Economics, ABS
$ Billion $ Billion
Average2030-2034
Average2025-2029
0
5
10
15
20
25
30
0
5
10
15
20
25
30
2009 2011 2013 2015 2017 2019 2021 2023 2025 2027 2029 2031 2033
Year ended June
Educational Health
Other NRB Entertainment
Accommodation Aged Care
Religious
Source: BIS Oxford Economics, ABS
$ Billion $ Billion
Average2030-2034
Average2025-2029

49
Short run outlook
Total construction is forecast to continue to decline in FY2020 and hit the bottom of the trough in FY2021. While engineering construction is set to recover in FY2021, residential and non-residential will experience a setback. Just as the outlook was starting to look more favourable for residential construction, the COVID-19 pandemic will now prolong the downturn. Restrictions on auctions and open houses serve as a barrier to the demand for new dwellings, while material and labour supply issues slow the construction cycle. Dwelling construction is forecast to recede nearly 22% in total over the next 2 years, with substantial declines in every state in FY2020
While strong underlying drivers have propelled non-residential building work done to a record level, the COVID-19 pandemic is expected to cause a downtick in national non-residential work done in FY2020, accelerating in FY2021. All facets of private investment are to be negatively impacted, with accommodation, retail, offices and aged care incurring the biggest downgrades. Social & institutional building is expected to fall 3% in FY2020 as an improvement in health counters a decline in other social & institutional building. However, in FY2021 work done is forecast to fall by over $6bn (14%). Both commercial and industrial (C&I) and social and institutional (S&I) activity are contributing to the decline. Only health and transport work done are expected to post positive growth.
Engineering construction, on the other hand, is likely to prevent a more spectacular collapse of construction. FY2020 is expected to see activity trough with some private sector funded works (especially oil & gas) under pressure. Strength is set to return to engineering construction from FY2021 as transport “mega projects” ramp up (as shown in Figure 4) and a mild recovery of mining investment (mostly iron ore) finally overcome tumbling activity in electricity and telecommunications. It is also likely that Federal and state governments will prioritise the delivery of a range of smaller “shovel-ready” projects as a stimulus measure. This will most likely be seen across the roads and recreation sectors.
By FY2021 total construction is forecast to bottom out at under $195bn, the lowest level in a decade.
Medium run outlook
COVID-19 is likely to amplify the next cycle in construction work which has significant implications for the infrastructure industry. By delaying near term investment in building and large oil and gas projects, while looking to accelerate large public infrastructure projects, the scene is set for a volatile, more synchronised, cycle in construction work over the next five years which will test infrastructure planning and procurement, as well as capacity and capability in delivery and ongoing operations and maintenance. Getting productivity-enhanced systems in place now – across planning, procurement and delivery – to handle the coming cycle will be vital for industry sustainability.
Dwelling construction is set pick up from FY2022, although the exact timing of recovery will depend critically on demand (population growth), and particularly when migration restrictions are lifted. While stimulus measures can help spur the recovery, it will be rising pent-up demand in the market that ultimately sustains it.
Non-residential building is forecast to see more consistent growth from FY2022 but also peaking in FY2024. All states will likely contribute to this growth as total activity grows by around one third from FY2021 to FY2024. While low borrowing costs are expected to spur private investment, public investment will also remain strong, particularly boosting both transport and health building. Potential health and employment stimulus measures present an upside to this outlook. Retail, education and other social and institutional will also contribute heavily to the upswing as market conditions improve.
Meanwhile, further growth in engineering construction is expected in FY2022, with total activity peaking in the mid-2020s at just under $110bn. Very large public investment in roads and rail are a key driver. Accompanying this transport boom is a stabilisation and recovery in utilities work, as well as continued support from resources-related construction, particularly very large oil and gas projects which were put on hold in 2020 when oil prices collapsed.
By the mid-2020s, total construction is forecast to be reaching levels not seen since the peak of the resources boom. Unlike the resources boom, however, much more of this work will be undertaken domestically (rather than utilising overseas fabrication as in the case for the LNG-inspired peak in FY2013). Such a scenario will place significant pressure on industry and its supply chains.

50
Longer run outlook
Over the second half of the 2020s, a gradual cyclical easing as major projects are completed is expected to see activity soften. However, work done will likely remain very high in a historical context. Average levels of activity over FY2025-29 and FY2030-34 are expected to be progressively higher than the average over the next five years driven by population growth, the need to replace or augment existing assets and investment in new productive technologies and industries. In turn, this will require the infrastructure industry to continue to grow capacity, capability and flexibility to handle the rising infrastructure task.
The engineering construction segment is expected to see support from the final stages of transport related works, a strong and stable floor of utilities work, a period of strong activity in mining (oil and gas in particular) and the capital replacement required to service the growing asset base. Meanwhile, a slight softening in total building is projected later next decade as higher interest rates are projected to start cutting into residential demand, stalling the upturn for dwelling commencements. Non-residential building is also expected to weaken as excess capacity starts to impact new commercial developments in some sub-sectors. Over this period, growth is anticipated to be relatively stronger in social and institutional non-residential building segments such as health and aged care.
C. The Rising Role of Industry in Delivering Infrastructure
Over the past 30 years the private sector has played an increasingly significant role in delivering infrastructure in Australia.
Data from the Australian Bureau of Statistic’s Engineering Construction Survey38 shows that 83% of all transport and utilities infrastructure work in FY2019 was delivered by private contractors, up from 44% in FY1986 (the first full year of ABS data from the survey) and an estimated 32% in FY1974 (according to estimates from BIS Oxford Economics)39. Combined with strong growth in total infrastructure activity overall, transport and utilities work done by the private sector was worth $49.4 billion in FY2019, up from $9.1 billion in FY1986 (both figures expressed in FY2018 constant prices), a more than five-fold increase in real terms.
As shown in Figure 15 below, this figure is expected to grow to over $60 billion per annum in the next fifteen years, but this could be higher if recent trends towards outsourcing the delivery task to private industry continue.
Fig. 15: Transport and Utilities Engineering Construction by Performer Sector, Australia, Constant FY2018 Prices
38 ABS (2020), Engineering Construction Survey, Cat. No. 8762.0.
39 BIS Oxford Economics (2020) Engineering Construction in Australia, Sydney.
0
10
20
30
40
50
60
70
80
0
10
20
30
40
50
60
70
80
2009 2011 2013 2015 2017 2019 2021 2023 2025 2027 2029 2031 2033
Year ended June
Total Private Total Public
Source: BIS Oxford Economics, ABS
$ Billion $ Billion
Average2030-2034
Average2025-2029
51
The increasing share of work done by the private sector has been driven by a wide range of factors including:
• Competitive reforms within public agencies aimed at achieving greater efficiencies in delivery,
• The corporatisation and privatisation of public assets over several decades including roads, ports, airports, telecommunications (Telstra) and electricity assets,
• The increasing propensity of the private sector to propose, fund and deliver ‘traditional’ infrastructure itself through public private partnerships (PPPs) or unsolicited offers,
• Generally higher private investment across a range of industries from mining, to transport, health, education, entertainment and recreation. This includes the massive wave of privately financed and built infrastructure (e.g. roads, ports, railways and pipelines) to service resource-related mining and export regions during the 2000s and early 2010s which has also left a substantial legacy of ongoing sustaining capital works.
In meeting the strong growth in demand for infrastructure, local contractors have been joined by international operators. This has fostered stronger competition for work, with international contractors able to bring their own unique learnings, experiences, and perspectives to the Australian infrastructure market.
The private sector will likely remain the dominant deliverer of works in the foreseeable future, with market share expected to sit at around 80% over the forecast period. It is critical that industry is sustainable to allow for contractors to remain in the market and infrastructure to be delivered over the long run.

52
Productive infrastructure defines our quality of life. It raises standards of living for all Australians, whether by improving access to important services such as health and education, making travel both safer and quicker, improving work/life balance by reducing the time spent on the daily commute, and by improving the quality of the natural environment through harnessing new technologies across water, energy and telecommunications.
The economic benefits of timely and adequate infrastructure provision are often noted by economists and politicians.
Efficient provision of infrastructure, including public infrastructure, is the hallmark of a well-functioning economy – Productivity Commission, 201440
Productive, sustainable infrastructure is essential if we are to drive economic growth, increase employment and enhance the quality of life of all Australians – Infrastructure Australia, 201541
Infrastructure is an indispensable input in an economy’s production, one that is highly complementary to other, more conventional inputs such as labour and non-infrastructure capital. Indeed, it is hard to imagine any production process in any sector of the economy that does not rely on infrastructure – IMF 201442
Planning and delivery of infrastructure provides a welcome boost to employment and economic activity in the short term through its positive impact on the construction sector, its supply chain and project owners. There is a broader, multiplier impact in the short run as actors in these sectors then draw on resources throughout the broader economy. More importantly, well-chosen infrastructure also
a powerful determinant of long run productivity and productive capacity, increasing the Australian economy’s potential “speed limit” into the future.
In a world where construction labour and capital inputs are limited, and where demand for construction output is rising, productivity improvements offer the critical link to minimising capacity and capability risks, enhancing industry sustainability and lowering infrastructure costs. The Australian construction industry has generally lagged other industries in terms of productivity growth, but considerable “step changes” can be observed over time.
The challenge for industry and government is to look at ways in which productivity can be improved, such as through higher quality supervision and project management, harnessing new technologies and processes, and adopting a more innovation friendly culture.
For governments, this may involve giving contractors more room to innovate in the procurement phase and encouraging the development and adoption of new materials and construction processes. Large, complex construction projects are likely to offer the greatest scope for innovation that may deliver both short- and long-term benefits to the construction industry.
As noted by the Productivity Commission in its 2014 inquiry into public infrastructure43:
Improved productivity (when this also encompasses quality improvements) is the key method for reducing the costs of output to customers, improving business returns in the shorter run, and providing more infrastructure for a given spend.
B. Appendix: Productivity and Sustainability Challenges
40 Productivity Commission (2014), Public Infrastructure, Inquiry Report No. 71, Overview, p3. Canberra
41 Infrastructure Australia (2015), Australian Infrastructure Audit: Our Infrastructure Challenges, Executive Summary, p1.
42 International Monetary Fund (2014) World Economic Outlook, Chapter 3, “Is It Time for an Infrastructure Push? The Macroeconomic Effects of Public Investment”, p78.
43 Productivity Commission (2014) p417.

53
While productivity can be difficult to measure in the construction sector, data suggests that the construction industry in Australia, like its overseas counterparts, has had a checkered history in achieving sustainable, strong growth in productivity over time. Relatively slower growth in productivity, compared to the rest of the economy, means that greater pressure is placed on boosting the quantity of labour and capital inputs to achieve higher levels of output, rather than improving the way they are used together. Where labour and/or capital is scarce, this itself can lead to increased demand pressure on resources, increasing construction costs.
Even so, emerging technologies and construction processes can make a difference to productivity performance, reducing the construction industry’s reliance on key skills and materials. Embracing these opportunities, however, requires a culture across both the private and public sector which demands and rewards innovation.
A. Recent Productivity Trends
Productivity can be defined as the ratio of a volume of output to the volume of inputs; that is output per unit of input. Output, in the current context, is usually referenced as the “gross value added” by
the construction industry over a period. Growth in productivity implies that output has grown by more than the growth in inputs. For the construction industry, it is useful to consider both labour productivity as well as multi-factor productivity (MFP). The former considers how output changes with a given change in labour inputs, while the latter represents changes in output driven by changes in the combined value of inputs, which effectively means “doing things better than in the past”. The link between the two measures is capital deepening, which refers to increasing the share of capital used in production which allows the (lower) share of labour to be more productive.
Since the peak of the resource boom, MFP has been declining in the construction sector, as shown in Figure 8. Since its peak in 2014, the construction industry’s MFP index has declined 17.2%. Not only is this a more significant drop than felt by other industries since the end of the resource boom, it also takes the construction industry back to its late 1990s productivity performance. Multi factor productivity in the construction industry has grown an average of 0.2% per annum since 1990, well below transport (1.0% per annum), selected industries44 (0.9% per annum) and manufacturing (0.5% per annum).
44 Selected Industries includes the following: Agriculture; Forestry and Fishing; Mining; Manufacturing; Electricity; Gas; Water and Waste Services; Construction; Wholesale Trade; Retail Trade; Accommodation and Food Services; Transport, Postal and Warehousing; Information, Media and Telecommunications; Financial and Insurance Services; Arts and Recreation Services.
Fig. 16: Multifactor Productivity Indexes by Industry: 1990-2019
Source: ABS Data
80
90
100
110
120
130
140
150
199
0
199
1
199
2
199
3
199
4
199
5
199
6
199
7
199
8
199
9
200
0
200
1
200
2
200
3
200
4
200
5
200
6
200
7
200
8
200
9
2010
2011
2012
2013
2014
2015
2016
2017
2018
2019
Construction Selected Industries Transport Manufacturing
Source: ABS Data

54
There are some caveats to interpreting construction productivity data. Firstly, it focuses exclusively on the construction industry itself, and so does not include labour working in construction-related roles in other sectors such as Professional, Scientific and Technical services (e.g. engineers and designers), Manufacturing (materials supply) as well as Public Administration and Safety (infrastructure-related agency staff). Secondly, construction output is not a tradeable good and, as such quality improvements in construction output over time (such as improved safety outcomes which increases labour hours) may not be adequately reflected in productivity statistics.
National ABS productivity data shows that construction industry productivity growth – both multifactor and labour – has tended to lag that of the broader “selected industries” measure. Over time, productivity in the construction industry tends to stall for several years before experiencing a step change (such as in the late 1990s, and again in the early 2010s). While there is some uncertainty regarding the causes of these step changes, one possible explanation is rising capital intensity, which could have boosted both productivity measures. In the early 2010s a likely candidate for rising capital intensity may be the start of the phase of oil and gas construction in Australia which, apart from the sheer scale of construction, also brought with it highly capital-intensive methods of construction, such as prefabrication and modularisation on a massive scale. Overall, however, labour productivity in the construction industry has grown at just 1.2 per cent per annum on average since 1989/90, compared to 2.4 per cent per annum for selected industries.
Recent research by BIS Oxford Economics and consultation with industry groups confirms that infrastructure projects undertaken during the last five years have become larger and more complex.
Increasing complexity and size of infrastructure projects does not necessarily correlate to higher productivity. Results from previous research and inquiries have highlighted several challenges that have stifled productivity growth. Through this and previous research, BIS Oxford Economics found that the key challenges to productivity are:
• Low rewards for innovation, which is time intensive and costly
• Tender constraints and the freedom to innovate
• “Silos” between procurement agencies (for publicly funded projects)
• Buying power and inefficient procurement processes
Solutions to the identified problems can contribute to not only the productivity in the construction industry but to the outcomes delivered.
Impact of COVID-19 on productivity
COVID-19 also has implications for industry productivity. The pandemic is having an immediate, severe contractionary effect on the Australian economy, unprecedented in speed and magnitude. Construction has been classified as an essential service. This has allowed for “business as usual” in the industry, certainly compared to most other industry sectors. However, this comes with its own challenges of how to manage social distancing measures on site and in the administrative portion of the projects. As one contractor recently noted in soundings for this report:
The issue is purely humans, humans on site when they should or shouldn’t be there and how they work and how productive they can work. That’s the current issue. More so than the supply chain…
In the short run, there may be a decline in the numbers of private building and civil infrastructure projects that commence. This may prove an incentive for construction firms to narrow profit margins even further to compete over price. Additionally, social distancing measures may be impacting on the labour productivity on-site. The requirement to work further apart is proving inefficient in terms of working despite being an efficient solution to keep workers safe. As one contractor noted in recent soundings:
No project is unimpacted. So even the most open simple job where we can separate people, there’s probably a 5% impact minimum from, for various reasons. But for some of the taller high-rise projects, just the logistics around vertical transportation would probably saying productivity impacted by 30% plus in some circumstances.
To some degree, these productivity losses may be partially offset by greater ‘off-site’ productivity outcomes. In particular, transport and logistics for materials and equipment (including disposal of waste or spoil), social distancing and ‘working from home’ initiatives have likely reduced congestion on transport networks and improved transport-related efficiencies in the construction industry.

55
B. Other Sustainability Challenges
Apart from weak productivity, industry faces a number of other challenges which present an immediate risk to sustainability.
These factors include:
• Profitability
• Diversity
• Health and safety
• Mental health
Profitability
Industry financial outcomes have worsened considerably over the past decade. As shown in Figure 17, construction industry gross profits as a share of sales45 collapsed between 2014 to 2018 before staging a semi-recovery in 2019. However recent gains are receding once again, and overall, the measure remains well below industry returns prior to and during the resources boom. Other industry profits data in Figure 18 show that the engineering construction segment (primarily responsible for economic infrastructure delivery, including transport and utilities construction) has the lowest profitability overall within the construction sector, around half the profit margin of building and roughly one third the margin of construction services.
45 ABS (2020) Business Indicators, Australia, Cat. No. 5676.0, March 2020, Australia.
Fig. 17: Construction Industry Gross Operating Profit to Sales Ratio: 2002-2020
Fig. 18: Construction Industry Profit Margins by Segment: 2008-2019
5%
6%
7%
8%
9%
10%
11%
2002 2004 2006 2008 2010 2012 2014 2016 2018 2020
Quarterly Moving Annual Average
Source: BIS Oxford Economics, ABS
Gross Operating Profit to Sales Ratio - Construction Industry
-2
0
2
4
6
8
10
12
14
16
2008–09
2009–10
2010–11
2011–12
2012–13
2013–14
2014–15
2015–16
2016–17
2017–18
2018–19
Building Construction Engineering Construction
Construction Services Total Construction
Source: BIS Oxford Economics, ABS
Source: BIS Oxford Economics, ABS

56
Diversity
Unsustainable financial outcomes for the infrastructure industry create broader industry sustainability challenges in terms of greater workplace stress, longer hours and less ability to support training and innovation initiatives – in turn, making the industry a less attractive destination for employment and investment.
Critically, the construction industry is still an extremely male dominated environment which itself can be a constraint on attracting women into the sector. The construction industry has significantly higher proportion of men relative to the average across all industries. In 2020, the Construction industry was comprised of 12% women and 88% men, whereas the industry average is 47% women and 53% men.
Fig. 19: Gender Split, Construction versus All Industries: 2020
Source: ABS and BIS Oxford Economics
Analysing the gender split at the occupational level reveals that the construction industry also diverges from the industry average in terms of
the occupations in which men and women are employed.
Women and men both see a more even distribution across occupational categories across the labour market. In the construction industry, women are primarily concentrated in Clerical and Administrative roles. In 2020, 81% of the Clerical and Administrative employees were women while 19% were men. The remain occupations are primarily staffed by men.
This may be partially driven by the low numbers of women entering and completing construction specific qualifications.
In 2019, 18.6% of male students were engaged in Engineering and related technologies qualifications, whereas just 1.2% of female students were engaged in similar qualifications.
This suggests that a fundamental problem driving the lack of gender diversity in the industry is attracting women into construction-oriented education and training at a tertiary level. This means that more needs to be done earlier in the education process (primary and secondary education) to promote construction-related skills (and broader STEM skills) to women.
The construction industry has been able to close the gap in many areas of diversity and have made commitments to achieving a diverse workforce. The Australian Building and Construction Commission amongst other industry bodies and firms in the industry have made a public commitment to increasing the diversity in their workplace46. However, there exist issues at the base level of attracting people into the industry. Perception of industry culture may go some way towards explaining this trend.
46 Australian Building and Construction Commission (2020) Workplace diversity and inclusion, viewed 6th June 2020 at https://www.abcc.gov.au/about/careers/why-work-us/workplace-diversity-and-inclusion
Fig. 20: Occupational Split by Gender, Construction versus All Industries: 2020
Source: ABS and BIS Oxford Economics
OccupationConstruction All industries
Women Men Women Men
Clerical and Administrative Workers 81% 19% 72% 28%
Community and Personal Service Workers 0% 100% 70% 30%
Labourers 4% 96% 33% 67%
Machinery Operators and Drivers 1% 99% 10% 90%
Managers 10% 90% 38% 62%
Professionals 21% 79% 56% 44%
Sales Workers 42% 58% 61% 39%
Technicians and Trades Workers 2% 98% 16% 84%
0%
10%
20%
30%
40%
50%
60%
70%
80%
90%
100%
2020
Construction - Females Construction - Males Total - Females Total - Males

57
0.0
0.1
0.1
0.2
0.2
0.3
0.3
Natura
l and p
hysica
l scie
nces
Info
rmatio
n tech
nology
Engineerin
g and relate
d tech
nologies
Archite
cture
and build
ing
Agricultu
re, e
nvironm
ental a
nd relate
d studies
Health
Educatio
n
Managem
ent and co
mm
erce
Society
and cultu
re
Creativ
e arts
Food, hosp
italit
y and p
ersonal s
ervice
s
Males Females
Health
Health and safety (including mental health) is another area where industry needs to ensure it is doing its best to be attractive to current and future workers. Statistically speaking, the industry is still one of the most dangerous industries in which to work. While there have been improvements over many years, the construction industry still has the fifth highest fatality count of all industries in Australia. In 2018, there were 24 fatalities in the construction industry. Between 2014 and 2018, there were a total of 156 workplace related fatalities, an average of 31 fatalities per year.
This is an average of 2.9 deaths per 1000 employees in the industry, which is the fifth highest number of average deaths of the 19 industries and 1.8 deaths per 1000 higher than the national average.
Generally higher physical safety risks in the construction industry are also reflected in the number of claims made for serious injury. In 2015, the construction industry had the third highest number of serious injury claims made against them in the 2015 financial year, behind manufacturing and health care and social assistance. There were 12,575 claims made in the industry for serious injuries. The average across all industries was 5,638 in the same year.
Fig. 21: Current Students by Gender and Field of Study: 2019
Source: ABS

58
Fig. 22: Number of Fatalities by Industry: 2018
Source: Safe Work Australia
0% 5% 10% 15% 20% 25% 30%
Agriculture, forestry & fishing
Transport, postal & warehousing
Construction
Manufacturing
Mining
Arts & recreation services
Administrative & support services
Public administration & safety
Other services
Wholesale trade
Electricity, gas, water & waste services
Retail trade
Accommodation & food services
Health care & social assistance
Financial & insurance services
Information media & telecommunications
Rental, hiring & real estate services
Education & training
Professional, scientific & technical services
5yr average 2018
Fig. 23: Fatalities per 1000 People by Industry: 2018
Source: Safe Work Australia
0.0 2.0 4.0 6.0 8.0 10.0 12.0 14.0 16.0
Agriculture, forestry & fishing
Transport, postal & warehousing
Mining
Electricity, gas, water & waste services
Construction
Arts & recreation services
Administrative & support services
ManufacturingOther Services
Wholesale trade
Rental, hiring & real estate services
Public administration & safety
Accommodation & food services
Information media & telecommunications
Health care & social assistance
Retail trade
Education & training
Financial & insurance servicesProfessional, scientific & technical services
Fatality rate:5yr average
Fatality rate:2018

59
Fig. 24: Number of Serious Injury Claims: FY2015
Source: Safe Work Australia
0
2,000
4,000
6,000
8,000
10,000
12,000
14,000
16,000
18,000
20,000
Health ca
re and so
cial a
ssist
ance
Constru
ctio
n
Manufa
cturin
g
Retail t
rade
Transp
ort, p
ostal a
nd ware
housing
Public adm
inist
ratio
n and safe
ty
Educatio
n and train
ing
Accom
modatio
n and food se
rvice
s
Admin
istra
tive and su
pport se
rvice
s
Wholesa
le trade
Road transp
ort
Agricultu
re, f
orest
ry and fi
shin
g
Other s
ervice
s
Agricultu
re
Arts and re
creatio
n serv
ices
Min
ing
Profe
ssio
nal, scie
ntific a
nd tech
nical s
ervice
s
Electric
ity, g
as, w
ater a
nd wast
e serv
ices
Rental, h
iring and re
al est
ate se
rvice
s
Info
rmatio
n media and te
lecom
munica
tions
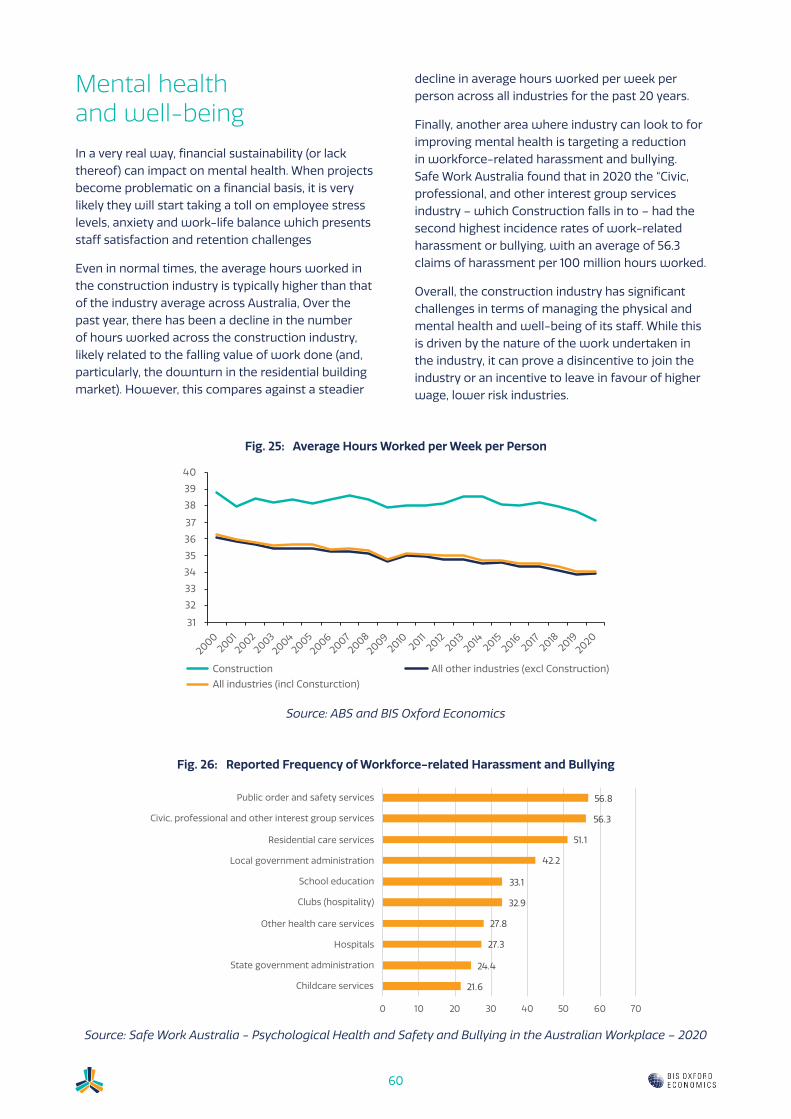
60
Mental health and well-being
In a very real way, financial sustainability (or lack thereof) can impact on mental health. When projects become problematic on a financial basis, it is very likely they will start taking a toll on employee stress levels, anxiety and work-life balance which presents staff satisfaction and retention challenges
Even in normal times, the average hours worked in the construction industry is typically higher than that of the industry average across Australia, Over the past year, there has been a decline in the number of hours worked across the construction industry, likely related to the falling value of work done (and, particularly, the downturn in the residential building market). However, this compares against a steadier
decline in average hours worked per week per person across all industries for the past 20 years.
Finally, another area where industry can look to for improving mental health is targeting a reduction in workforce-related harassment and bullying. Safe Work Australia found that in 2020 the “Civic, professional, and other interest group services industry – which Construction falls in to – had the second highest incidence rates of work-related harassment or bullying, with an average of 56.3 claims of harassment per 100 million hours worked.
Overall, the construction industry has significant challenges in terms of managing the physical and mental health and well-being of its staff. While this is driven by the nature of the work undertaken in the industry, it can prove a disincentive to join the industry or an incentive to leave in favour of higher wage, lower risk industries.
Fig. 25: Average Hours Worked per Week per Person
Fig. 26: Reported Frequency of Workforce-related Harassment and Bullying
Source: ABS and BIS Oxford Economics
Source: Safe Work Australia - Psychological Health and Safety and Bullying in the Australian Workplace – 2020
31
32
33
34
35
36
37
38
39
40
2000 2001
2002
2003
2004 2005
2006 2007
2008
2009 2010
2011 2012
2013 2014
2015 2016
2017 2018
2019 2020
Construction All other industries (excl Construction)
All industries (incl Consturction)
21.6
24.4
27.3
27.8
32.9
33.1
42.2
51.1
56.3
56.8
0 10 20 30 40 50 60 70
Childcare services
State government administration
Hospitals
Other health care services
Clubs (hospitality)
School education
Local government administration
Residential care services
Civic, professional and other interest group services
Public order and safety services

61
C. Appendix: Case Studies
We have brought together examples of how project outcomes and performance have been improved through a collaborative approach to contract procurement and delivery which has yielded exceptional outcomes for clients, contractors and end users. Drawn from across Australia and overseas, the case studies showcase the benefits of a partnership approach.
NSW Bushfire Clean-up & Make Safe Program . . . . . . . . . . . . . . . . . . . . . . . . . . . . . . . . .62
Newcastle Light Rail . . . . . . . . . . . . . . . . . . . . . . . . . . . . . . . . . . . . . . . . . . . . . . . . . . . . . . . . . .65
The New Genoa Bridge . . . . . . . . . . . . . . . . . . . . . . . . . . . . . . . . . . . . . . . . . . . . . . . . . . . . . . 69
Northern Connector Project South Australia . . . . . . . . . . . . . . . . . . . . . . . . . . . . . . . . . . .73
Pacific Highway Upgrade Woolgoolga to Ballina . . . . . . . . . . . . . . . . . . . . . . . . . . . . . . . 77
Bridge over the Clarence River Bulk Earthworks . . . . . . . . . . . . . . . . . . . . . . . . . . . . . . .79
Level Crossing Removal Project . . . . . . . . . . . . . . . . . . . . . . . . . . . . . . . . . . . . . . . . . . . . . . . 81
South Eastern Program Alliance (Level Crossing Removal Program). . . . . . . . . . . . .85
Mordialloc Freeway Upgrade . . . . . . . . . . . . . . . . . . . . . . . . . . . . . . . . . . . . . . . . . . . . . . . . .87
Pacific Highway Upgrade Warrell Creek to Nambucca Heads NSW . . . . . . . . . . . . 89
Crossrail C300/C410 Western Running Tunnels. . . . . . . . . . . . . . . . . . . . . . . . . . . . . . . . . 91

62
Procurement process
The procurement process of the NSW Bushfire Clean-up & Make Safe Program was rapid, collaborative and reflected the intention of all parties to respond to a natural disaster event across the State. The procurement process was accelerated, with a contract awarded within a week following an EOI and RFT.
With the full scope of the works unknown, with thousands of properties to be inspected and determined for eligibility, the partnership approach developed through the procurement process and embedded within the contract was an effective way to share risk appropriately between Public Works Advisory and the contractor, allowing parties to focus on mobilisation and delivery of the works as efficiently and effectively as possible.
NSW Bushfire Clean-up & Make Safe Program
Project detail
DURATION
January 30, 2020 – Demobilisation from July 27, 2020
PROJECT PARTNERS/STAKEHOLDERS
Lead agency:Public Works Advisory (PWA)
Main contractor:Laing O’Rourke Australia
CONTRACT VALUE
$AUD NOT DISCLOSED
CONTRACT TYPE
Partnership
DESCRIPTION
The NSW Government Public Works Advisory (PWA) appointed Laing O’Rourke Australia to lead the clean-up of damaged and destroyed eligible properties impacted by bushfires since 1 July 2019.
This included:
• A review and analysis of more than 8,000 pieces of data to determine the project scale.
• The clean-up of more than 3,500 properties across NSW.
• The management of more than 90 local subcontractors to deliver works across approx.
• 450 localities

63
Project delivery
The NSW Bushfire Clean-up & Make Safe Program was delivered as a collaborative partnership between Public Works Advisory and Laing O’Rourke Australia. The partnership approach was maintained throughout the project, which allowed the contractor the freedom to develop more innovative solutions to define the scope or works, procure a locally centric supply chain, and complete the works quickly and safely.
The program also enabled the contractor to propose and develop a series of powerful analytical tools and data dashboards that helped Public Works Advisory understand and remain engaged with key data sets reflecting project progress on the ground. The data dashboard, enabled by an integrated digital delivery platform, helped the client understand and report on key metrics for internal Government stakeholders.
The partnership between Public Works Advisory and Laing O’Rourke Australia was maintained through a regular series of meetings with clearly defined roles and governance to manage issues quickly and in the interests of the project. A weekly Project Coordination Meeting (PCG) was held at a regional and project level with delivery leads, and a Steering Committee to ensure alignment with the overall objectives of the project. The uncertainty of the final number of properties to be cleared as part of the program created a significant level of risk and uncertainty that was affectively managed through a partnership model. The financing model developed for this project provided the contractor with the security to forward-fund the project with resources to deliver the unknown scope of works. At the same time, the integrated digital delivery platform developed by Laing O’Rourke provided Public Works Advisory with effective and transparent reporting on progress delivered in return for its investment.

64
Outcomes and achievements
The NSW Bushfire Clean-up & Make Safe project delivery partner model was very effective to deliver a rapid program of works quickly in partnership with Government in a way that supported the economic recovery of the regions impacted by this event.
As a delivery partner, Laing O’Rourke, working with Public Works Advisory, in just over 200 days was able to:
• Review, plan, inspect, and document damage to thousands of individual properties
• Clear more than 3,500 properties across NSW
• Rapidly hire and deploy more than 230 employees to oversee project delivery
• Support more than 1,500 regional jobs across the State
• Redevelop a new digital procurement process, awarding more than 90 contracts, with 99% going to local or regional businesses, 99% to small and medium sized businesses and with 11 per cent of contracts awarded to Indigenous subcontractors
• Exceeding all Indigenous business targets reaching 25% of the total project spend, with 31 Indigenous businesses being used in the supply chain directly and indirectly, and 182 Aboriginal and/or Torres Strait Islander peoples working across the project (13% of the total workforce)
• Develop a payment process to enable weekly payment for suppliers, helping to get money into the local economy faster
‘From a local contractor perspective, they are doing some great stuff...it is being used as an example across Government as an ideal strategy, it works really well for this project and we are keen as a Government to see how it can work across other projects as well’
Drew Varnum Executive Director – Public Works Advisory

65
Newcastle Light Rail
Project detail
DURATION
The project began in August 2016 and was handed over for commercial operations in February 2019
PROJECT PARTNERS/STAKEHOLDERS
Lead agency:Downer EDI Works Pty Ltd
Main contractors:• WSP | Parsons Brinckerhoff & Aurecon Joint Venture • Robson Civil Projects Pty Limited• Rhomberg Rail Australia• Daracon Group• 4Tel
CONTRACT VALUE
$252M AUD
CONTRACT TYPE
Managing contractor
DESCRIPTION
The Newcastle Light Rail (NLR) project is one of the most innovative and complex transport projects within Australia, and the first full catenary-free (wire-free) system in the southern hemisphere. The NLR has quickly gained world-wide attention for its revolutionary onboard energy storage system and rapid charge systems located at each of its six stations.
Downer EDI Works (Downer) completed the track, maintenance depot, tram stops and electrical infrastructure, recording one million-man hours from commencement in August 2016, to completion in February 2019 meeting the tight 30month timeframe.
Another impressive achievement, considering the scope of the project, was completing the works, testing and commissioning and operational handover within the $252 million budget and with no recorded lost-time injuries or fatalities.
The project has received an “Excellent” ISCA rating for both design and construction.

66
Key project features
• 2.7km in length, running from Newcastle Interchange at Wickham to Newcastle Beach.
• Light rail follows the old rail corridor for approximately one third of the route before moving onto Hunter and Scott Streets.
• Removal of the existing rail infrastructure (track, overhead wiring, and structures) and full site remediation of the former rail corridor.
• Stops are located at Newcastle Interchange, Honeysuckle (near Hunter Street TAFE), Civic, Crown Street, Queens Wharf and Newcastle Beach.
• Extensive utility works involving investigation, space-proofing, integration with design, negotiation and relocation works.
• Road upgrades which included reconfiguration of key intersections and footpaths, upgrades to surrounding roads, and changes to inner city bus and parking arrangements to allow traffic to continue to move efficiently on the completion of light rail.
The contract between Downer EDI Works and the client (TfNSW) was a collaborative contract with a shared risk profile. A design and construct open book contract and collaborative spirit with the client facilitated quick decision making by jointly working through problems, with a lower emphasis on contract letter writing and protecting positions. This transparent cooperative relationship was key to the success of the project.
Procurement process
Almost all clients and contractors now speak of collaborative behaviours and “best for project” outcomes. It is uncommon for staff to truly engage in this manner unless their behaviour is driven by an appropriate contract model. The contract model is what sets the tone of engagement and is the license that allows staff to truly engage in collaborative behaviours and best for project thinking.
The 18-week Target Cost development phase required both parties to fully understand and align on a cost and risk profile of all aspects of the project. The collaborative framework allowed both parties to be “open book” in all aspects of price development. The iterative nature of the Target Cost development required numerous workshops, working meetings, governance meetings, team building events, etc. which served to strengthen individual relationships and build organisational trust.
At the beginning of the procurement phase, it is fair to say that the teams were enthusiastic but somewhat guarded. Once interpersonal relationships started to form, and the teams began working closely, barriers started to fall, and the teams started to work very well together towards a common goal.

67
Project delivery
The team agreed early to co-locate which was a significant contributing factor to the project’s success. The client and contractor project managers and SMEs interacted daily on key issues and gained an understanding of each other’s drivers and constraints.
The project initiated a multi-layered approach to governance. The site teams met weekly to resolve issues. Anything that could not be resolved within that forum, was escalated to the monthly Project Controls Group meeting which was attended by a senior manager of Downer and TfNSW. The senior managers worked closely to resolve the more difficult issues to keep the project team focused on project delivery. The structured approach to engagement and decision making meant that decisions were made quickly and that neither party became entrenched.
The team combated project issues through early decision making and ensuring ‘the right people were in the room at the right time,’ including subcontractors. By focusing on the solution rather than whose problem it was, we created a culture where brave decision making was encouraged, even if the decision didn’t always work out as planned. This underpinned the mindset of the team’s ‘dare to fail’ motto.
The challenges faced throughout the project were pre-empted through our robust risk assessment process, which began by identifying over 175 potential risks prior to construction, in areas of community, environment, operations, safety, rail
safety, site establishment and the wider road network. Because of the variety of skills and experience the team brought to the project, it was proved there was no problem identified that the team couldn’t find a solution to.
It was found by increasing resources in the Downer team and subcontractor teams when a new issue appeared, the arising problems were quickly dealt with, without distracting the existing team. As an example, the new footpaths were proving more complex than first perceived, so the team increased internal and subcontractor resources to create a dedicated day and nighttime footpath team.
The quantum of some risks were underestimated, such as the extensive contamination and coal tar found throughout the light rail environment. Through detailed monthly reviews of risks and opportunities, which also encompassed looking at the range of possible impacts to the financial outcome, the team were able to mitigate many of the risks identified as well as capitalizing on many opportunities.
One of the highest-rated and most likely risks was the community, with the potential for complaints, protests, negative press, business income loss and pedestrians unlawfully accessing the site. These risks were combated by engaging closely with the community and having a plan B in place to quickly implement another solution should something not go as planned. By having a large proactive communications team of six Downer and five TfNSW team members, the team facilitated an extensive range of community campaigns, programs, safety and engagement.
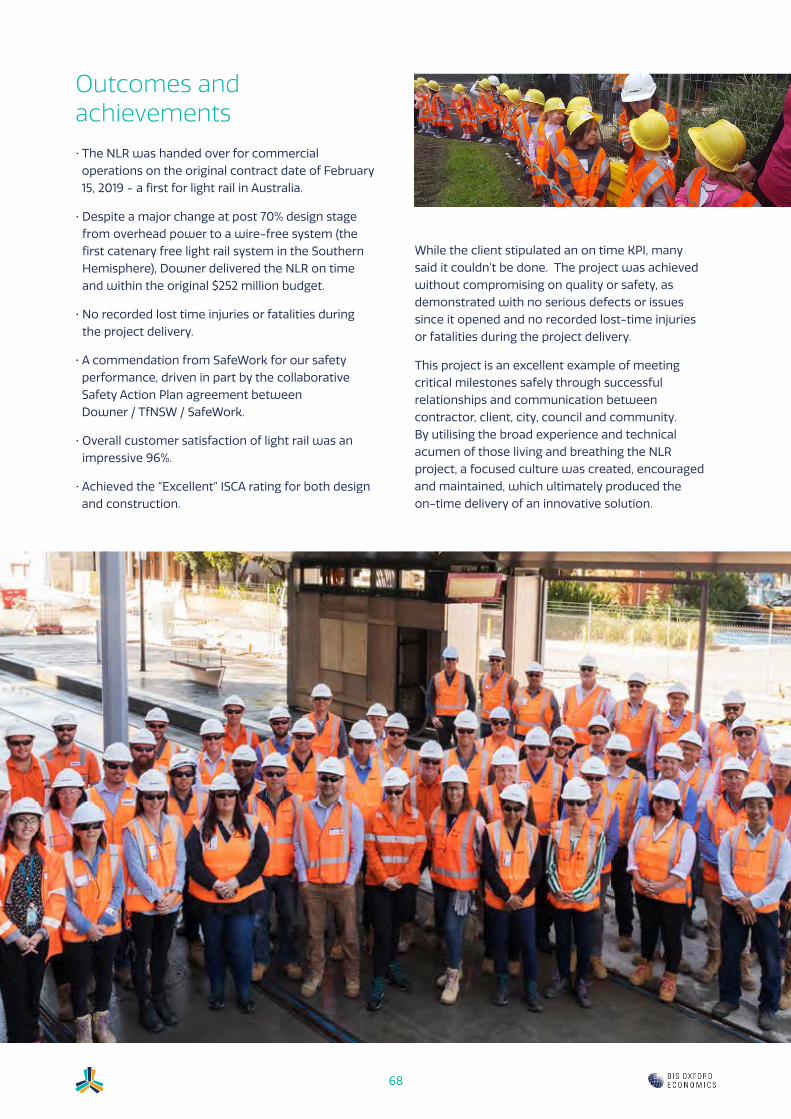
68
Outcomes and achievements
• The NLR was handed over for commercial operations on the original contract date of February 15, 2019 - a first for light rail in Australia.
• Despite a major change at post 70% design stage from overhead power to a wire-free system (the first catenary free light rail system in the Southern Hemisphere), Downer delivered the NLR on time and within the original $252 million budget.
• No recorded lost time injuries or fatalities during the project delivery.
• A commendation from SafeWork for our safety performance, driven in part by the collaborative Safety Action Plan agreement between Downer / TfNSW / SafeWork.
• Overall customer satisfaction of light rail was an impressive 96%.
• Achieved the “Excellent” ISCA rating for both design and construction.
While the client stipulated an on time KPI, many said it couldn’t be done. The project was achieved without compromising on quality or safety, as demonstrated with no serious defects or issues since it opened and no recorded lost-time injuries or fatalities during the project delivery.
This project is an excellent example of meeting critical milestones safely through successful relationships and communication between contractor, client, city, council and community. By utilising the broad experience and technical acumen of those living and breathing the NLR project, a focused culture was created, encouraged and maintained, which ultimately produced the on-time delivery of an innovative solution.

69
The New Genoa Bridge
Project detail
DURATION
15 months from the beginning of the construction (execution of the first pole for the pile number 6, April 2019) to the inauguration (August 3rd, 2020)
PROJECT PARTNERS/STAKEHOLDERS
Lead agency:Struttura Commisariale per la Riscostruzione del viadotto Polcevera dell’autostrada A10
Main contractor:Webuild – Fincantieri JV: PerGenova
CONTRACT VALUE
€202M (AUD $332M)
CONTRACT TYPE
Design and build
DESCRIPTION
Background
Built in the ‘60s, the Polcevera Bridge (also called the Morandi Bridge by its designer) was considered both a modern monument to the city of Genoa and a symbol of Italian engineering. It was one of the most crucial hubs of the country’s highway network.
The abrupt collapse of the bridge in the summer of 2018 caused widespread community dismay and resulted in a rift between the western and the eastern parts of Genoa with enormous disruption to traffic. Rebuilding the bridge in the shortest time possible became a national challenge and imperative.
The legal framework
The so-called ‘Genoa Model’ (Modello Genova) has become a synonymous in Italy for a quick procedural model for contract management and realization of complex infrastructural projects. Far from being an extraordinary procedure, it arose due to an Italian law which refers to the EU directive (2014/24/EU) and constitutional principles.
The resulting process that was followed to both award and carry out the work in the shortest possible time ensured quality and respect for the principles of protection of pre-eminent mandatory public interest.
Figures
• 18 piers and 2 abutments for the main structure
• 80,000 m3 of excavations
• 67,000 m3 of concrete
• 9,000 tons of steel reinforcement
• 17,000 tons of steel metal work
• 10,000 m of piles

70
Procurement process
The client’s primary objective was to complete the work in the shortest possible timeframe, while complying with applicable rules and laws.
Site planning was developed during the execution of the works, which required immediate investigations and approvals to allow fast execution. For this reason, the authorisation process to allow suppliers and subcontractors to enter the jobsite had to be rapid.
Customer and Works Management were organised with a performance focused technical structure and an extremely streamlined chain of command.
This made it possible to contain project approval times and supply and execute contracts in extremely short timeframes (approximately 1/3 of what is considered normal).
The procurement phase continued in parallel with Project development, including extremely short lead times and work cycles running 24 hours a day.
Delivery process
A nationwide imperative has been a key factor in rebuilding the Polcevera bridge, particularly regarding the extremely short timeframe for its construction.
The project was widely backed by all the main political parties and, more importantly, by public opinion. Reconstructing a safe bridge, in the least possible time became a matter of national pride. Media coverage has been unprecedented for infrastructure works.
This had the consequence of an extraordinary push for delivering the bridge, and the CJV was enabled (by means of the special ‘Genoa Decree’) to swiftly proceed through design and construction phases.
Operational meetings were scheduled frequently to ensure adequate communication and decision-making opportunities and maintain the rapid pace of delivery.
The extremely well-defined chain of command and frequent communication opportunities enabled the resolution of issues prior to these having an impact on execution times.

71
Outcomes and achievements
The pace of work was quick and demanding. A month after the tender was awarded in December 2018, the contract was signed (even before the technical designs were completed). The necessary permits were given without delay – a rarity in Italy.
Construction work was coordinated and performed with high efficiency a key priority. Workers began driving piles into the dry Polcevera riverbed while demolishers were still removing the wreck of the Morandi Bridge. Once the first piers were erected, they started installing the steel spans for the deck while the remaining piers were still being completed.
The construction site hummed with activity 24 hours a day, seven days a week - save for Christmas and a few days of bad weather. It did not even close
for COVID-19. By declaring the project of national importance, the government allowed work to progress after extra health and safety measures were put in place to minimise as much as possible the risk of infection among the workers.
From the laying of the first pier to the delivery of the completed structure, it took 420 days and more than 10,100 hours of work. At the peak of construction activity, more than 1,000 people specialised in 40 trades were working on the site, often times at 20 stations contemporaneously.
There was high engagement with Italian companies to support the delivery of this project, with a considerable number of these being small and medium sized. Nearly 330 small to medium sized companies from across Italy provided more than €160 million in supplies and services, equivalent to almost 80% of the value of the project.

72
‘The Genova Bridge teaches us is an important lesson. It came at the cost of people’s lives, at the cost of a city remaining disconnected for two years. We overcame this situation by rebuilding the bridge. In addition to my pride as a builder and the pride of those who did it with their very hands, there is sense of pride among Italians in seeing that we are capable of rebuilding in record time a piece of infrastructure.
‘We put a lot of skill and passion into this project. We worked day and night with a sense of civic duty. We were proud to collaborate with 330 small companies from all over Italy, every one of them representing the excellence of our ‘Made in Italy’. It was an example of team spirit, the same that inspires our Progetto Italia: practicality, extraordinary competence and passion. Today we deliver the keys to the bridge that belongs to all Italians. We show the world that we are able to create public works that are innovative and safe, because the lives of those who work and use bridges, roads, trains and metros every day remain an absolute priority. We unfurl this flag of commitment and success to recover so many lost years and opportunities, working to help the country take a new turn so that we can leave an inheritance to the next generation.’
PIETRO SALINI, CEO Webuild
‘Today Genoa is starting again. Our country can face and overcome difficulties and can go back to racing.’
GIUSEPPE CONTE, Italian Prime Minister
Genoa’s mayor, MARCO BUCCI, called the new bridge ‘a message of trust and competence for the future.’
‘We are suspended between grief and pride. The country showed its best side, competence, energy, resilience.’
RENZO PIANO, the new bridge’s architect and a native of Genoa
‘It takes at least a couple of months of negotiation to get a contract for important infrastructure like a bridge. But when the extraordinary commissioner came here, he said: “Let’s be clear that we only leave this room after we have reached an agreement.” That was a Monday. On Friday, January 18, 2019, we signed the contract.’
ARTURO COLLINASSI, Head of Contract Department Domestic Operations, Webuild
‘There was this desire to do the job, a collaborative spirit felt by everybody involved. This should be the norm on a construction site.’
STEFANO MOSCONI, Construction Site Director, Pergenova

73
Northern Connector Project South Australia
Project detail
DURATION
• Pre-construction early works and service relocation design commenced November 2015
• Construction commenced December 2016
• Motorway operational March 2020
PROJECT PARTNERS/STAKEHOLDERS
Lead agency:Department for Infrastructure and Transport
Main contractor:Lendlease Engineering Pty Ltd
Industry partners:• LR&M Constructions Pty Ltd• Civil & Allied Technical Construction (CATCON)• RAW Recruitment (formerly known as ART Services)• McMahon Services• SEM Civil (Salisbury Earthmovers)
CONTRACT VALUE
$705,566,962 AUD
TOTAL PROJECT BUDGET
$867M AUD
CONTRACT TYPE
Design and construct contract
DESCRIPTION
A key part of the 78 kilometre North-South Corridor, the Northern Connector is a six-lane (three lanes in each direction), 15.5 km concrete motorway, providing a vital freight and commuter link between the Northern Expressway, South Road Superway and Port River Expressway. The Northern Connector was designed to support the significant increase in population growth, road and rail freight tasks and economic expansion in the northern Adelaide region, while balancing social and environmental impacts on the broader community.
The project also includes:
• South Australia’s first major concrete road.
• Construction of four interchanges with dedicated ramps providing direct access to and from the new motorway.
• Construction of a shared-use pedestrian and bike path extending the full length of the new motorway (approximately 16 km), connecting with the Northern Expressway’s Stuart O’Grady Bikeway, and extending (approximately 4km) to Port Adelaide. The completed shared use path from Gawler to Port Adelaide will be a distance of approximately 43km.
• Delivering economic benefits to the local South Australian community, including creating 480 full-time equivalent jobs each year during construction
• Upgrade and improvement to road drainage and stormwater management
• Implementing Intelligent Transport Systems
• Service protection(s) and relocation
• Modifications to the Barker Inlet Wetlands
• Creation of NorthHub, an employment, skills and on-the-job training centre to assist northern jobseekers secure positions on the Northern Connector Project

74
Procurement process
The Northern Connector Project was announced to the public in 2015 for $985 million. During the initial planning stages for the project, multiple cost savings were identified and as a result, the agreed funding figure was $885 million for the project. Further cost savings were identified and when the project was handed over for delivery, the project’s budget was set at $867 million.
A procurement strategy was developed based upon the Department’s Procurement Management Policies and Procedures, tailored and captured in the Project Management Plan. The delegation levels for the authorisation of executing contracts were confirmed, being aligned with the Project Governance Plan with the standardise procurements documents utilised. The tender documentation was established based upon the General Conditions of Contract (GC21) and went out to market as a Design and Construct Contract.
After undertaking an exhaustive, comparative tender evaluation, the contract was awarded to Lendlease Engineering Pty Ltd (Lendlease). The contract management of the project was undertaken as per the Contract Management Plan with the final expenditure within the revised budget. This was an amazing result considering all the risks and the unknowns achieved through application of sound project management skills and knowledge.
The South Australian Government set the following targets for the project:
• At least 50% of all jobs to be filled by northern suburbs residents.
• At least 90% of on-site labour hours to be undertaken by South Australians.
• At least 20% of all on-site labour hours to be undertaken by ex-automotive industry workers, Aboriginal people, people facing barriers to employment and trainees and apprentices.
The tailored industry participation plan focused on employment and sub-contracting opportunities specific to the project, implementation of a steel policy and workforce participation commitments. The benefits management approach enabled the decision-making processes with the procurement to expand even broader with consideration of the
longer-term benefit realisation. These two tailored approaches to the evaluation expanded upon the price and non-price evaluation criteria incorporating the benefits realisation in the evaluation criteria to identify alternative solutions. This approach was evidenced in the selection of a previously cost-prohibitive pavement treatment. The preliminary evaluation score favoured the asphalt option, however, with the benefits management and industry participation being applied in the evaluation, the final scores resulted in the concrete option being selected. The project delivered significant immediate and ongoing benefits to the local industry as the concrete was made on site using 100% South Australian cement and quarry materials. During peak production, the plant produced 1500 cubic metres (m3) of concrete per day to produce 13km of pavement for the 15.5km Northern Connector.
Early planning to meet the social benefits targets was critical to the success of the project and began with sending a firm message to the contractors at tender stage about the importance of meeting these requirements. It was identified the project must make a difference regarding its social economic obligations; therefore tenderers were challenged as to what innovative practices could be implemented also supporting the Northern Economic Plan. It was important to acknowledge that tenderers were not to be penalised for their social economic solutions, but rather ensure they were focused on offering solutions that would ensure the State’s objectives to create jobs was met, hence the tender evaluation criteria was set at 50% price, 50% non-price assessment,
The Northern Connector Jobs Taskforce also assisted with establishing relationships with northern suburbs MPs, local government, job networks and other stakeholders to further improve employment opportunities for this major infrastructure investment.
The winning contractor created NorthHub, an employment, skills and on-the-job training centre to assist northern jobseekers secure positions on the Northern Connector Project. This was key to the success in providing Indigenous employment and onsite labour (from the target group areas) for the project. NorthHub is the heart of the site office and is managed by several staff to provide recruitment training, mental and wellbeing support.

75
Project delivery
There were a few barriers to the success of the project due to the planning involved. Initially there was some resistance from contractors, which required educating people at ground level to do something unique to ensure local workers were best placed to gain employment throughout the life of this major construction project. The adoption of a collaborative workplace became contagious throughout the project with teams working together as one. The project was able to integrate new staff from disadvantaged industries that had transferrable skills (i.e. former Holden’s employees), however it was acknowledged that a pipeline of work for the continued sustainability of work on projects was required to ensure the continued introduction of new labour to the civil construction industry. The process of setting up these initiatives on projects could be better streamlined, particularly communication between the different arms of Government and the individual projects about what is happening in this space.
Further to the above, Lendlease strategically aligned itself with several local subcontractors (based in northern Adelaide) to perform the role of Industry Partners. This local engagement further ensured the utilisation of local labour, growth and education of these organisations that included CATCON, LR&M Constructions, McMahon Services, SEM Civil (Salisbury Earthmovers) and Aboriginal owned business RAW Recruitment. The Industry Partners were allocated work packages to manage, demonstrating a new standard in leveraging local industry and providing significant employment benefits.
The Northern Connector Project delivered a Plain Concrete Pavement (PCP) solution, and is South Australia’s first major concrete road. PCP is widely used in the eastern states and offers increased durability, greater costs efficiencies for maintenance, and provided increased local job creation.
Key benefits of the PCP solution for South Australia include:
Social return
• 100% of the materials were sourced from South Australia, with cement and quarry products supplied by Adelaide Brighton Limited.
• The construction of the concrete pavement supported more than 40 extra jobs and contributed an additional $11 million in economic benefit to the state.
Not only has the delivery of the PCP solution delivered a low maintenance, value for money solution for South Australia, it will also leave a legacy of local business investment and employee upskilling long after the project completion. The majority of the concrete paving crew was comprised of a local workforce, being trained by experienced staff from the east coast.
Risk management
The early identification of risk allowed a mitigation strategy to be implemented and minimised the impact of risks during the project delivery.
The project was supported by the Project Management Office (PMO) with respect to governance and best risk management practices.
A key project risk was the interface with multiple services and the management of protections and relocations that also required stakeholder management. The approach was based upon multiple lessons learned and engagement with service authorities at the earliest point in time and was incorporated into the Department’s Project Management framework. Working with the service authorities in an engaging and meaningful way, undertaking service location, protections and retaining a design buffer around the existing services were all strategies that were employed on the project.
Some additional risk mitigations the project undertook include:
• Equipping the project team with the expertise to oversee the concrete pavement works.
• Engaging independent construction verification consultants to:
– Oversee the design and construction on behalf of the Department;
– Undertake audits on a regular basis throughout the construction period;
– Provide independent advice to the Department to ensure the constructed works are in accordance with the design.

76
The project has had a very strong focus on creating employment outcomes for South Australia.
• A total of 2 900 000 on-site hours have been worked on the project (as at 31 March 2020)
• With approximately 323 individuals contributing to the total on-site hours during the month of March 2020.
• Approximately 97% of all on-site labour hours has been undertaken by South Australians.
• Approximately 52% of all jobs have been filled by northern suburbs residents.
• To date, around 91% of the project spend has been on South Australian businesses and labour.
• Approximately 10-12% of all on-site labour hours has been undertaken by Aboriginal and Torres Strait Islander community, which is significantly higher than the required target of 2%.
• Approximately $15 million spent with Aboriginal owned businesses.
• Women were employed at almost twice the national rate on the project, which set a new standards for recruitment and local participation. More than 21% of positions across a range of roles
– such as civil engineering, plant operation, safety, environment and administration were filled by women compared to the national average of 11.7% for the construction industry. Five women are among 11 engineers recruited in the project’s first graduate intake for 2017.
The project pioneered the implementing of Aboriginal economic, workplace and heritage engagement and management in South Australia, particularly achieving 12% Aboriginal workforce participation for the life of the project, first of its kind in South Australia to reach such highest in percentages.
Raw Recruitment
The Northern Connector project, from a Council perspective is an example of what high quality collaboration should be. In State Government managed projects in the past there was a sense that the local community should be considered in word only. However, the Department’s Project Manager and the delivery team have been excellent in consultation, bringing Council in right from the start as a partner rather than a stakeholder.
Salisbury Council
Planned Actual Variance
Project Cost $985m $867m -$118m
Project Schedule Sep 2015 – Dec 2019 Sep 2015 – Mar 2020 +3 months
Duration 51 months 54 months +5.88%
Workforce Participation Rate
(Contract 20%)
(Stretch target 30%)
30% 33% +3%
Aboriginal and Torres Strait Islander people Employment
2% 11% +9%
Jobs filled by northern Adelaide residents 50% 52% +2%
Jobs filled by South Australians 90% 97% +7%
Industry Participation Rate 90% 91% +1%
Whyalla Steel Used 6,500t 6,760t +4%
Outcomes and achievements

77
Pacific Highway Upgrade Woolgoolga to Ballina
Project detail
DURATION
Contract award April 2015 Open to Traffic 2020
PROJECT PARTNERS/STAKEHOLDERS
Lead agency:Pacific Complete is a JV between Laing O’Rourke and WSP (formerly Parsons Brinkerhoff)
CONTRACT VALUE
$5.3B AUD
CONTRACT TYPE
Delivery partner
DESCRIPTION
W2B is Australia’s largest regional infrastructure project and involves the duplication of approximately 155km of road to a four-lane divided road on the Pacific Highway. The upgrade began 6km north of Woolgoolga (north of Coffs Harbour) and ends approximately 6km south of Ballina.
• 12 grade separated interchanges
• 155 bridges including major crossings of the Clarence and Richmond rivers
• 932 hectares of clearing and 15 million m3 of earthworks
• Major works through 30km of flood plains
• 100 crossings for threatened fauna such as koalas and emus
• 850,000 m2 of rigid concrete pavements
• 930 of precast elements
• Peak workforce of 3500 people
• Sustained monthly turnover averaging $100m per month during peak construction in CY 2018 & 2019

78
Procurement process
Transport for NSW (TfNSW) and the Delivery Partner, Pacific Complete, worked as an integrated team to fast track the procurement process to manage the critical path whilst working to maximise indigenous and local industry participation.
Work packages were structured to best suit market capability and the program’s strategic outcomes. More than 170 work packages have been awarded ranging from <$100k to >$500m. By mid-2020 with the program at 90% complete, $64m has been spent with aboriginal businesses, exceeding the 1.5% government target.
Local industry participation was maximised on the NSW North Coast by awarding contracts to 9 local quarries along the alignment, which had an added benefit of reducing time spent in transit on the local road network.
The program-wide approach to procurement ensured consistency in delivery. A great example of this was utilising the Laing O’Rourke Next Gear Safety System, which included inducting >12,500 site personnel. From a delivery perspective, 155 bridge designs were standardised to influence a program-wide precast and logistics strategy, which included supply contracts in regional locations such as Coffs Harbour, Macksville and Dubbo.
Project delivery
Some key highlights include:
• Open to Traffic in 2020 is on-track despite flooding, bush fires and COVID-19 risks
• Safety Next Gear Principles have been included by contractors in their corporate safety policy
• Annual cash-flow targets for 3 years have been >2% of the commitment
• Successful resolution of sensitive environmental and heritage issues
• Installation works for 278 properties was completed prior to open to traffic, and operational compliance testing.
• Use of technology enabled timely decision making such as releasing hold point for soft soil settlement areas and the management of interfaces between contractors
Outcomes and achievements
Some highlights include:
• Reduced travel times and incidents on the highway
• Exceeded aboriginal participation targets
• Independent staff engagement score exceeding ‘high performing team’ threshold
‘Having been involved over the last 40 years in most of the Pacific Highway projects between Newcastle and the Queensland border I would just like to say that I believe that this approx. 35km section is one of the best if not the best section of Highway Upgrade opened ... the project as a whole is a real credit to all those involved. This sections outcome is a great example of the positives that the Delivery Partner concept has brought to the upgrade.’
Mike Bulmer Pacific Highway Design Manager (Retired)
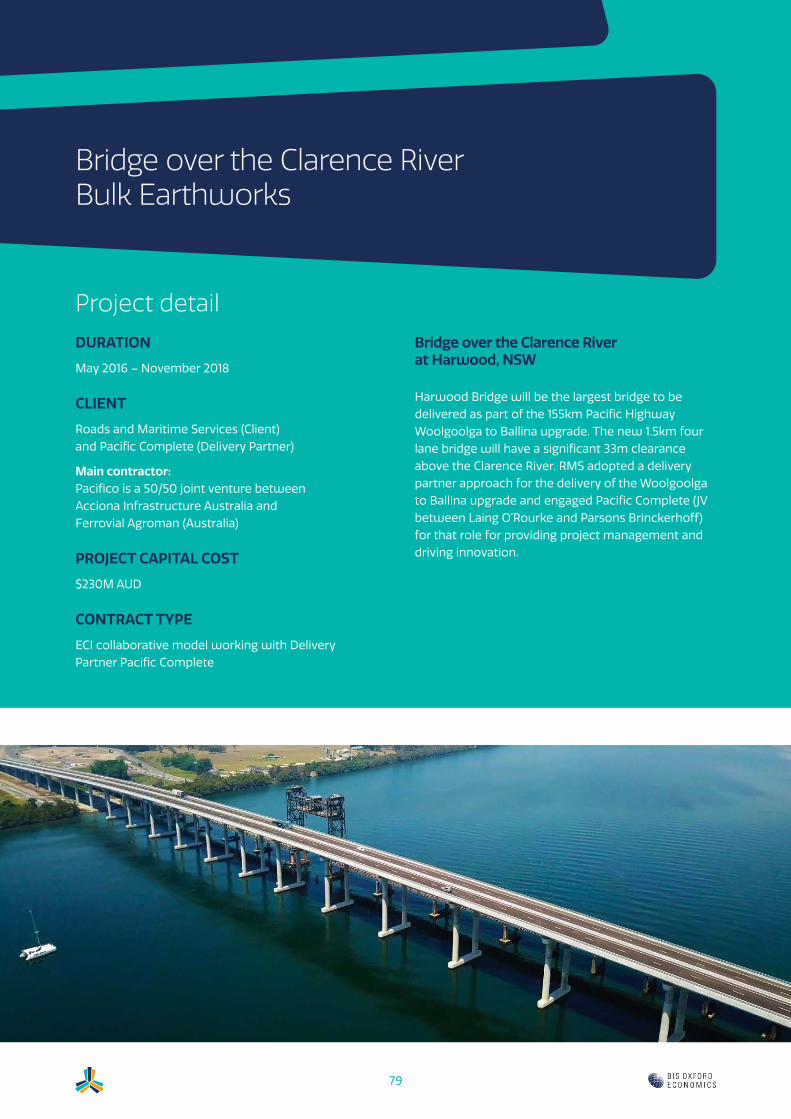
79
Bridge over the Clarence River Bulk Earthworks
Project detail
DURATION
May 2016 – November 2018
CLIENT
Roads and Maritime Services (Client) and Pacific Complete (Delivery Partner)
Main contractor:Pacifico is a 50/50 joint venture between Acciona Infrastructure Australia and Ferrovial Agroman (Australia)
PROJECT CAPITAL COST
$230M AUD
CONTRACT TYPE
ECI collaborative model working with Delivery Partner Pacific Complete
Bridge over the Clarence River at Harwood, NSW
Harwood Bridge will be the largest bridge to be delivered as part of the 155km Pacific Highway Woolgoolga to Ballina upgrade. The new 1.5km four lane bridge will have a significant 33m clearance above the Clarence River. RMS adopted a delivery partner approach for the delivery of the Woolgoolga to Ballina upgrade and engaged Pacific Complete (JV between Laing O’Rourke and Parsons Brinckerhoff) for that role for providing project management and driving innovation.
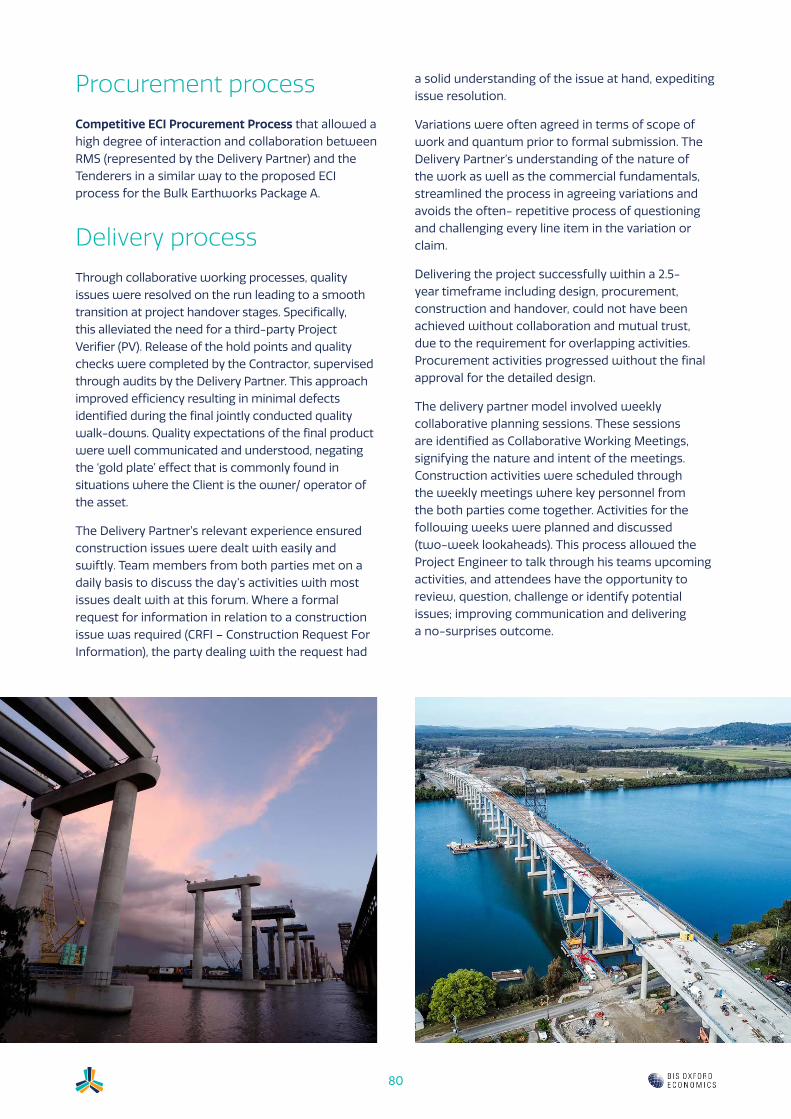
80
Procurement process
Competitive ECI Procurement Process that allowed a high degree of interaction and collaboration between RMS (represented by the Delivery Partner) and the Tenderers in a similar way to the proposed ECI process for the Bulk Earthworks Package A.
Delivery process
Through collaborative working processes, quality issues were resolved on the run leading to a smooth transition at project handover stages. Specifically, this alleviated the need for a third-party Project Verifier (PV). Release of the hold points and quality checks were completed by the Contractor, supervised through audits by the Delivery Partner. This approach improved efficiency resulting in minimal defects identified during the final jointly conducted quality walk-downs. Quality expectations of the final product were well communicated and understood, negating the ‘gold plate’ effect that is commonly found in situations where the Client is the owner/ operator of the asset.
The Delivery Partner’s relevant experience ensured construction issues were dealt with easily and swiftly. Team members from both parties met on a daily basis to discuss the day’s activities with most issues dealt with at this forum. Where a formal request for information in relation to a construction issue was required (CRFI – Construction Request For Information), the party dealing with the request had
a solid understanding of the issue at hand, expediting issue resolution.
Variations were often agreed in terms of scope of work and quantum prior to formal submission. The Delivery Partner’s understanding of the nature of the work as well as the commercial fundamentals, streamlined the process in agreeing variations and avoids the often- repetitive process of questioning and challenging every line item in the variation or claim.
Delivering the project successfully within a 2.5-year timeframe including design, procurement, construction and handover, could not have been achieved without collaboration and mutual trust, due to the requirement for overlapping activities. Procurement activities progressed without the final approval for the detailed design.
The delivery partner model involved weekly collaborative planning sessions. These sessions are identified as Collaborative Working Meetings, signifying the nature and intent of the meetings. Construction activities were scheduled through the weekly meetings where key personnel from the both parties come together. Activities for the following weeks were planned and discussed (two-week lookaheads). This process allowed the Project Engineer to talk through his teams upcoming activities, and attendees have the opportunity to review, question, challenge or identify potential issues; improving communication and delivering a no-surprises outcome.

81
Level Crossing Removal Project
Project detail
DURATION
LXRP was established in 2015. LXRP has removed 38 level crossings to date and is forecast to remove all 75 committed level crossings by 2025
PROJECT PARTNERS/STAKEHOLDERS
Lead agency:Major Transport Infrastructure Authority
Main contractors:• South Eastern Program Alliance (Laing O’Rourke,
Jacobs & Metro Trains Melbourne (•MTM))• Metropolitan Roads Program Alliance
(Fulton Hogan & MTM)• North Western Program Alliance (John Holland,
Kellogg Brown and Root & MTM)• Western Program Alliance (McConnell Dowell,
Arup & MTM)• Southern Program Alliance (Lendlease Engineering,
Acciona Coleman, WSP Australia & MTM)
CONTRACT VALUE
$13.4B AUD (level crossing removals)
$5.5B AUD (other projects)
CONTRACT TYPE
Primarily Program Alliances
DESCRIPTION
LXRP was established by the Victorian Government to oversee one of the largest rail infrastructure projects in the state’s history. Central to the project is the elimination of 75 level crossings across metropolitan Melbourne. LXRP is also delivering other rail network upgrades such as new train stations, track duplication and train stabling yards. A workforce of over 5000 people is engaged in the delivery of the LXRP.
LXRP’s Program Alliance framework is the primary delivery mechanism for its portfolio of works. This framework provides for the development and delivery of multiple work packages, on a fully allocated and staged basis, across five Program Alliances.
The ‘program’ approach has driven a longer-term manufacturing or production mindset to development and delivery, rather than a bespoke approach to single-site projects.
The certainty created through the full allocation of work packages to the Program Alliances enables them to attract and retain large-scale, high-performing teams; driving continuous improvement.
It also enables the Program Alliances to make greater investment in skills development, plant, longer term supply chain agreements, workplace conditions and solution standardisation and reuse. Importantly, up-front investment is offset by efficiencies realised across subsequent packages and between Program Alliances.

82
Procurement process
The Program Alliance model allows LXRP to break mega-projects into smaller more manageable packages, enabling more time and effort to be applied in front-end engineering, planning and development. This is augmented by an integrated collaborative approach to project planning and development, with a single-team comprising LXRP, the private-sector and network owner/operators which:
• reduces the client’s tendering costs (estimated to be half that of traditional models)
• virtually eliminates duplication of effort by not having two or more teams doing essentially the same work
• avoids unsuccessful bidder costs
• achieves submission of binding proposals and boots-on-the-ground for delivery much earlier (estimated to be half that of traditional models).
Project delivery
The extensive front-end planning and development provides orders of magnitude more engineering and delivery certainty at the time of contract award for a work package. As a result, LXRP’s Program Alliances have reliably delivered projects on time and often ahead of committed timeframes.
The Program Alliances have also achieved strong value-for-money outcomes, backed by a robust benchmarking database with standardised work breakdown structures; generating clearer visibility around costs and why there may be variances (both up and down) to the benchmark rates. Notably, LXRP has seen a progressive reduction in typical risk allowances, indirect costs, design costs and variability between the actual outturn cost and target outturn cost because of early clear scope definition, risk mitigation and design re-use and standardisation.
The Program Alliances have also demonstrated exceptional performance across other metrics such as continuous improvement and innovation, safety, community engagement/sentiment, sustainability, diversity and social procurement. This has been supported by the Program Alliance commercial and governance frameworks which incentivise performance in these key areas. Examples include:
• sharing of knowledge between the Program Alliances and strong standardisation across the broader program (e.g. development and adoption of
a standardised ‘u-trough’ rail viaduct design across all Program Alliances), driving efficiency gains in design and delivery
• creation and support of industry wide capability and inclusion initiatives such as the Victorian Governments Rail Industry Capability Project, Engineering Pathway Program and Women in Transport Program
• outperforming Total Recordable Injury Frequency Rate targets and program-wide sharing of safety and wellbeing initiatives
• use of new materials and products (eg.. utilising recycled glass fine aggregate in concrete and recycled plastic sleepers)
• program-wide identification and communication of best practice benchmarks regarding community consultation.
A key feature of the Program Alliance framework is the promotion of a “no-blame” culture in relation to disputes. This has enabled each Alliance Leadership Team, comprising representatives from the relevant Alliance’s participants, to work promptly and collaboratively to resolve any potential disputes prior to them being escalated. As result, there have been no program disruptions arising from disputes.
Outcomes and achievements
LXRP’s Program Alliances have achieved excellent performance in the delivery of a complex portfolio of works, by adopting a longer-term manufacturing or production mindset, rather than a bespoke approach to single-site projects. To date, the Program Alliances have demonstrated industry-leading cost and time outcomes; in a heated transport infrastructure market. Key outcomes of the program approach include:
• procurement efficiency
• realising lower overall risk profiles in proposal pricing
• delivering optimal scope and quality outcomes
• a culture of innovation and continuous improvement; with the application of lessons learnt from package to package and investment in solution standardisation and reuse
• optimal time and value-for-money outcomes
• minimising claims and disputes.
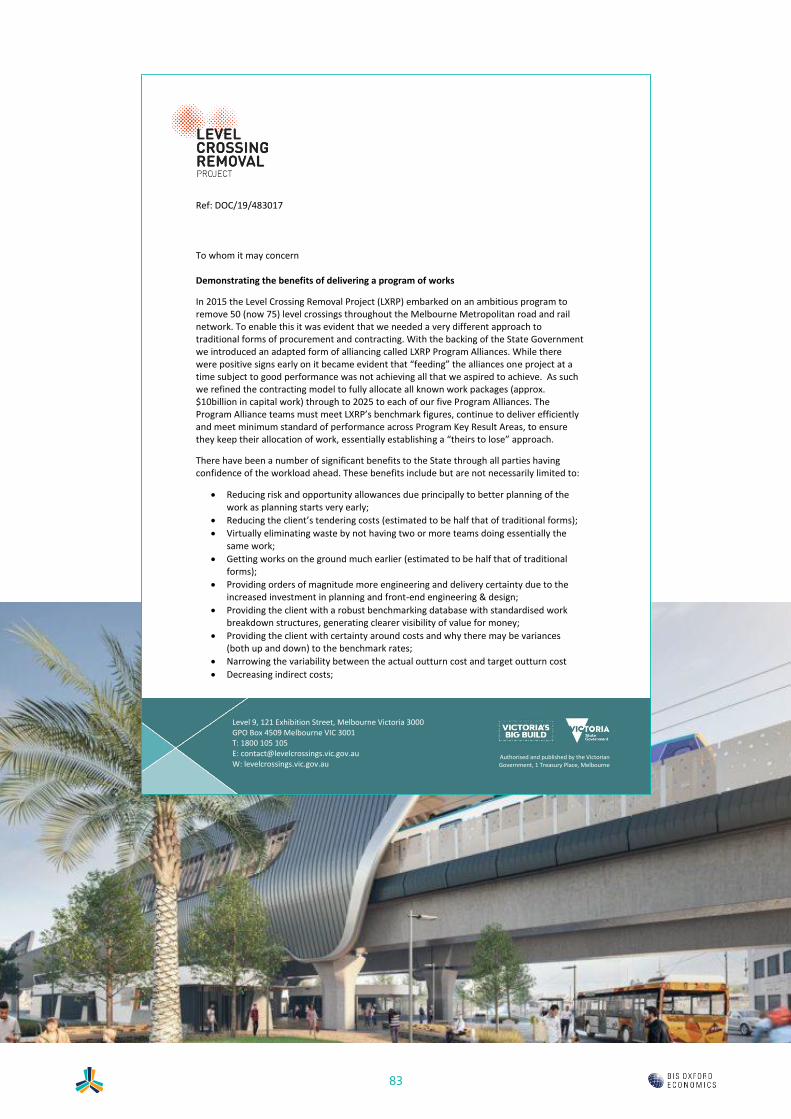
83
single-site projects. To date, the Program Alliances have demonstrated industry-leading cost and time
outcomes; in a heated transport infrastructure market. Key outcomes of the program approach include:
• procurement efficiency
• realising lower overall risk profiles in proposal pricing
• delivering optimal scope and quality outcomes
• a culture of innovation and continuous improvement; with the application of lessons learnt from package to
package and investment in solution standardisation and reuse
• optimal time and value-for-money outcomes
• minimising claims and disputes.
STATEMENT OF SUCCESS
Refer to attached letter from Kevin Devlin, CEO, LXRP
PROJECT IMAGERY
Level 9, 121 Exhibition Street, Melbourne Victoria 3000 GPO Box 4509 Melbourne VIC 3001 T: 1800 105 105 E: [email protected] W: levelcrossings.vic.gov.au
Authorised and published by the Victorian Government, 1 Treasury Place, Melbourne
Ref: DOC/19/483017
To whom it may concern
Demonstrating the benefits of delivering a program of works
In 2015 the Level Crossing Removal Project (LXRP) embarked on an ambitious program to remove 50 (now 75) level crossings throughout the Melbourne Metropolitan road and rail network. To enable this it was evident that we needed a very different approach to traditional forms of procurement and contracting. With the backing of the State Government we introduced an adapted form of alliancing called LXRP Program Alliances. While there were positive signs early on it became evident that “feeding” the alliances one project at a time subject to good performance was not achieving all that we aspired to achieve. As such we refined the contracting model to fully allocate all known work packages (approx. $10billion in capital work) through to 2025 to each of our five Program Alliances. The Program Alliance teams must meet LXRP’s benchmark figures, continue to deliver efficiently and meet minimum standard of performance across Program Key Result Areas, to ensure they keep their allocation of work, essentially establishing a “theirs to lose” approach.
There have been a number of significant benefits to the State through all parties having confidence of the workload ahead. These benefits include but are not necessarily limited to:
• Reducing risk and opportunity allowances due principally to better planning of thework as planning starts very early;
• Reducing the client’s tendering costs (estimated to be half that of traditional forms);• Virtually eliminating waste by not having two or more teams doing essentially the
same work;• Getting works on the ground much earlier (estimated to be half that of traditional
forms);• Providing orders of magnitude more engineering and delivery certainty due to the
increased investment in planning and front-end engineering & design;• Providing the client with a robust benchmarking database with standardised work
breakdown structures, generating clearer visibility of value for money;• Providing the client with certainty around costs and why there may be variances
(both up and down) to the benchmark rates;• Narrowing the variability between the actual outturn cost and target outturn cost• Decreasing indirect costs;

84
• Decreasing design costs with a focus on design re-use and standardisation; • Offsetting increasing direct costs with superior value engineering; • Enabling the alliance teams to focus on other policy outcomes such as social
procurement, diversity and recycling; • Increased efficiency as teams stay together, repeating similar projects which enables
effective transfer of learnings and avoids redevelopment of delivery systems and processes;
• Sharing knowledge across the alliances teams and being rewarded for adopting good ideas from other alliance teams resulting in greater efficiencies across the broader program;
• Supporting the teams to make greater investments in skills development, plant, longer term supply chain agreements, and workplace conditions, and contributing to making the industry more attractive to all involved;
• Reducing turnover as employees see a longer-term pipeline of work and career path; • Reducing adverse events as projects have been undertaken many times, are so well
planned and all parties are aware of the risks and opportunities. • Supporting strong standardisation across the network.
I am confident we will continue to build on the benefits of the Program Alliance approach as all parties continue to further focus on whole of program efficiencies, design standardisation, adopting new technologies and using real time data to drive improved decision making.
My team and I would be happy to share our experiences with anyone who is looking to contribute to making our industry a better place to work.
Yours sincerely
Kevin Devlin Chief Executive Officer
27 / 08 / 2020
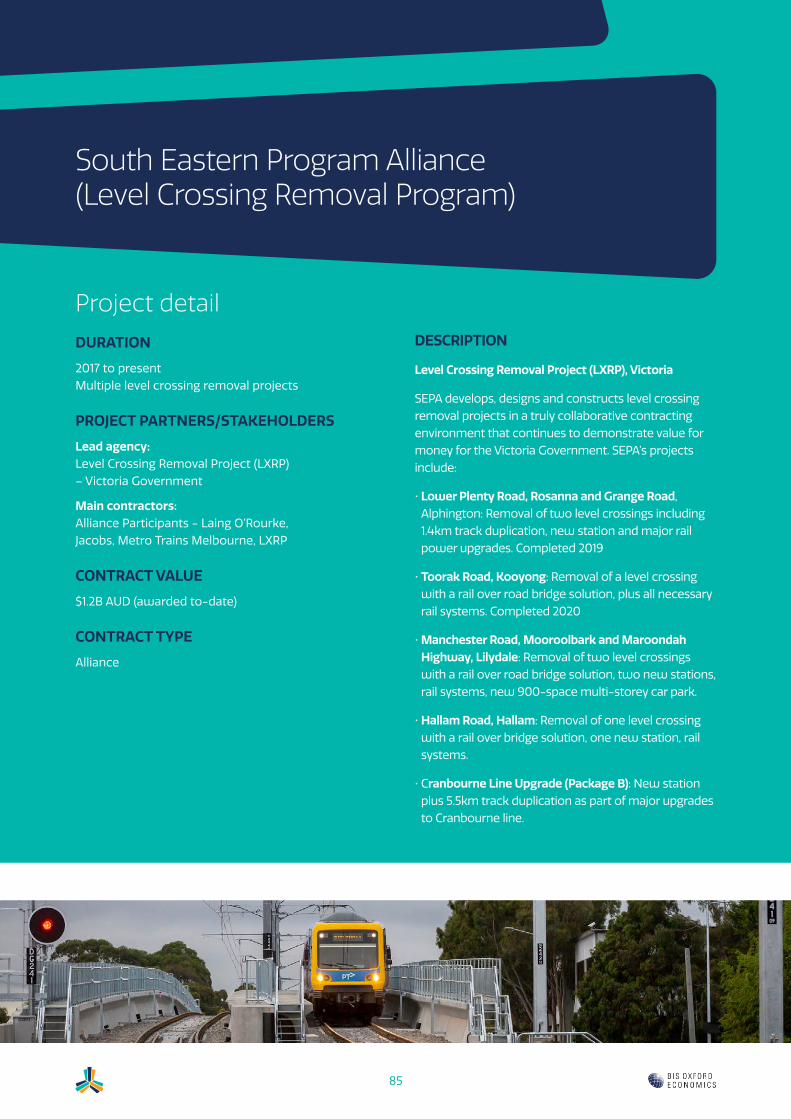
85
South Eastern Program Alliance (Level Crossing Removal Program)
Project detail
DURATION
2017 to present Multiple level crossing removal projects
PROJECT PARTNERS/STAKEHOLDERS
Lead agency:Level Crossing Removal Project (LXRP) – Victoria Government
Main contractors:Alliance Participants - Laing O’Rourke, Jacobs, Metro Trains Melbourne, LXRP
CONTRACT VALUE
$1.2B AUD (awarded to-date)
CONTRACT TYPE
Alliance
DESCRIPTION
Level Crossing Removal Project (LXRP), Victoria
SEPA develops, designs and constructs level crossing removal projects in a truly collaborative contracting environment that continues to demonstrate value for money for the Victoria Government. SEPA’s projects include:
• Lower Plenty Road, Rosanna and Grange Road, Alphington: Removal of two level crossings including 1.4km track duplication, new station and major rail power upgrades. Completed 2019
• Toorak Road, Kooyong: Removal of a level crossing with a rail over road bridge solution, plus all necessary rail systems. Completed 2020
• Manchester Road, Mooroolbark and Maroondah Highway, Lilydale: Removal of two level crossings with a rail over road bridge solution, two new stations, rail systems, new 900-space multi-storey car park.
• Hallam Road, Hallam: Removal of one level crossing with a rail over bridge solution, one new station, rail systems.
• Cranbourne Line Upgrade (Package B): New station plus 5.5km track duplication as part of major upgrades to Cranbourne line.

86
Procurement process
All of SEPA’s projects have been secured after a collaborative development phase (single Target Outturn Cost (TOC) process). The critical behaviours exhibited by the alliance include honesty, tenacity, creativity and accountability. These, together with a competitive mindset, give the client full comfort that the end solution is optimum and represents maximum value for money. The client is part of the alliance and witnesses first-hand the efforts made to arrive at a robust, certain and low risk scope and TOC.
The client’s behaviours in the procurement phase include transparency, accessibility and support. LXRP is available and open for conversations, workshops and meetings about the top risks and opportunities, and will take actions wherever possible to mitigate or realize them. LXRP regularly support the alliance to resolve issues with stakeholders
Delivery process
SEPA recently completed the Toorak Road, Kooyong project, ahead of program and for less than the TOC. Further, the alliance recorded positive KRA outcomes for the project. There were no major surprises in delivery, which is proof that the solution developed collaboratively with LXRP was robust. Risks were proactively addressed between the alliance and client during the development phase, for example collaboration with council and Telstra avoided a major communication service relocation, which saved 6+ months on program and $1m+ cost
Outcomes and achievements
The Toorak Road, Kooyong project achieved or bettered all target outcomes. In addition to being delivered early and for less than TOC, the project was a success from a social procurement perspective. Twenty social enterprises and aboriginal businesses played an integral role in the project. It is expected that the project will report over 3% aboriginal participation, around 13% for the Major Projects Skills Guarantee and circa 3.5% for social enterprise spend. These results all exceed KRA targets and were achieved in part due to strong support from the client.
SEPA is consistently developing and delivering level crossing removal projects with a high degree of certainty of cost, program and quality. This is due to the collaborative form of contract, which enables the alliance and client to proactively mitigate risks and realize opportunities, plus continuously improve and innovate for better project outcomes.

87
Procurement process
The client was interested in solutions and how they could assist the contractor in driving efficiencies.
The early activities deed was a key document allowing the contractor to de-risk the design elements and focus on driving design efficiency during this period.
Project delivery experience
Mordialloc Freeway Upgrade
Project detail
DURATION
Design and offsite activities commenced with an Early Activities deed, allowing immediate start of the works and works are on target for the planned completion date.
Early Activities Deed: March 2019 to August 2019
Works: September 2019 to December 2021
PROJECT PARTNERS/STAKEHOLDERS
Lead agency:Main Roads Projects Victoria
Main contractors:McConnell Dowell Constructors (Aust) Pty Ltd and Decmil Joint Venture
CONTRACT VALUE
$420M AUD
CONTRACT TYPE
Design and construct
DESCRIPTION
New connection link between Mornington Peninsula freeway at Springvale Road and Dingley
This includes:
• 9km of new two lane, dual carriageway road
• At least three elevated structures over existing roads and waterways
• Piled roadway over tip section
• Diamond interchange at Springvale RD/Frankston Freeway
• Significant ground improvement works
• Flood relief structures
• Several major signalised intersections
Key features of the infrastructure project
The procurement model involved an early activities phase to progress design, approvals and off-site preparations ahead of the formal execution of the contract upon approvals being secured.

88
Delivery process
Generally, the early activities process achieved its intent of de-risking design. It provided the contractor time to focus on minimising design growth and driving design efficiencies and allowed these works to be undertaken in parallel with approvals and prior to commencement on site.
The early activities deed also allowed for management plans and associated documentation to be progressed in parallel, further ensuring an efficient and productive commencement of onsite works.
The early activities phase also assisted the client in its approvals process and engagement with key stakeholders.
Learnings were achieved on this project surrounding certain issues that arose that, had there been ability to access the site during the early activities phase, maters could have been raised and resolved earlier. Notwithstanding this, the use of the early activities deed allowed the parties to build relationships during a relatively benign period. This meant when an issue did arise, the parties were prepared to work together to:
• Mitigate the impacts of the issue
• Identify potential opportunities to drive a better overall outcome
• Engage proactively at project level
• Work to ensure issue resolution was generally managed at project level, and
• Provide a risk-based management approach to the issue
Outcomes and achievements
Design and approvals were completed in tandem. The complete focus on design and input into the approvals process assisted in ensuring the project was set up for success. This is evidenced by works commencing immediately upon execution of the final D&C contract.
Design issues or ambiguity were addressed early, and design opportunities were identified and progressed in a timely manner to allow efficiencies to be gained in elements of the works.
Effective relationships were developed during the early activities phase when there was less pressure, assisting the efficient delivery of the project.
The outcomes were met in respect of the activities allowed under the early activities deed. Additional improved outcomes could have been achieved by allowing further investigation works to be undertaken during this early phase.
The use of an early activities deed to allow early progression of design and interaction with the approvals process allowed the design to be substantially completed with design growth challenged ahead of commencement.
This provided the constructor with certainty in planning the works and being ready to immediately commence work when the full D&C contract came into effect.

89
Pacific Highway Upgrade Warrell Creek to Nambucca Heads NSW
Project detail
DURATION
February 2015 – July 2018
CLIENT
Roads and Maritime Services
CONTRACTOR
Pacifico (a 50/50 joint venture between Acciona Infrastructure Australia and Ferrovial Agroman Australia)
PROJECT CAPITAL COST
$550M AUD
VALUE OF WORKS
Ferrovial Agroman - $225M AUD
DESCRIPTION
The project consists of the detailed design and construction of 19.6km new four lane divided road on the Pacific Highway, including two grade-separated interchanges, multiple longitudinal bridges and overbridges, an underpass of the rail line, local roads, drainage, fauna crossing structures and associated infrastructure.

90
Procurement process
Competitive ECI Procurement Model: RMS adopted a competitive ECI procurement model to select the Recommended Tenderer. This allowed RMS participation in the Tenderers’ tendering activities, delivering value for money through alternative solutions for specific project areas, including: main structures and associated floodplains; resolving a flying fox colony issue; and innovation in program. The ECI procurement model brought high quality construction and design expertise into the delivery process at a formative phase of the procurement process, and realised time related efficiencies and mitigation of potential risks at an earlier stage of the project.
During the ECI Concept Design phase, which had a duration of 10 weeks, RMS staff participated with each Tenderer for one or two days per week for up to 8-16 hours per week. During the ECI Tender phase, which has a duration of 4 weeks, RMS staff participated as required for up one day per week for a total of 8 hours per week with each Tenderer. RMS staff involvement was limited to scope and technical issues. RMS staff was not involved in the Tenderers’ estimating and pricing activities.
Delivery process
Co-locating the project team led to relevant and sustainable design solutions being developed and tested at concept stage, prior to pricing and before progressing to the detailed engineering design. These innovative solutions include:
• A reduction of deck elements – resulting in a reduction in bridge maintenance with the introduction of a new precast girder section which allows for a greater span with less beams than the standard super T.
• A reduction in risk and erection time during construction as a result of the use of full width precast transfloors in the bridges.
• Alternative alignments from those considered during the development of the project reference. These alternatives facilitated improvements in environmental, community relations, land use and traffic impacts.
• The development of an urban design that aligned with RMS’ vision. Collaboration throughout the
The ECI process enabled a better understanding of RMS’ philosophy and led to the development of an integrated solution with other sections of the road.
Throughout the different project stages, from the ECI process to project completion, the relationship between client and contractor has been highly scored in Cooperative Relationships in the Contractor Performance Reports produced by RMS. Some key points from these reports include:
• Commitment by staff to develop and maintain cohesive working relationships with RMS personnel, with reports stating: “the Contractor pro-actively supports the principles of partnering involving all of its team and has facilitated and participated in sessions and workshops to explore opportunities and options”.
• Successful management of issues in a “non-adversarial manner at the earliest practicable date with the Contractor often developing solutions to issues”.
• Ongoing progression of the detailed design in collaboration with the RMS team. Reports noted: “proposed design refinements have been raised with the RMS team in a timely manner and additional data has been provided when requested. The Contractor has also progressed a number of design options which have been investigated and discussed with RMS”.

91
Crossrail C300/C410 Western Running Tunnels
Project detail
DURATION
2011 – 2015
PROJECT PARTNERS/STAKEHOLDERS
Lead agency:Crossrail Ltd (UK)
Main contractors:Ferrovial Construction, BAM International, Kier
CONTRACT VALUE
~$800M AUD
CONTRACT TYPE
NEC3 – Option C: Target Cost
DESCRIPTION
The C300 and C410 Western Running Tunnels are part of Crossrail, the largest rail engineering project in Europe. C300 comprises two 7.1m diameter, 6.2km tunnel drives between portals at Royal Oak and Farringdon Underground Stations. The tunnels were driven using two purpose-built Earth Pressure Balance (EPB) tunnelling machines and lined with precast concrete fibre reinforced segments, manufactured in a purpose-built factory at Westbourne Park. C410 included the construction of the station platform tunnels and associated passages and escalator tunnels at Bond Street and Tottenham Court Road, as well as the Fisher Street Shaft and the crossover tunnels.
The twin bore tunnels threaded through some of the world’s most complex territory, between existing underground lines, sewers, utility tunnels and building foundations from station to station at depths of up to 40m. Extensive utility diversions were undertaken, including National Grid Gas Mains, Thames Water supply mains and cable networks in Soho Square.
Procurement process
The key driver of the procurement of the Crossrail program of works was a clear focus on successful project delivery.
Utilising the collaborative framework (NEC3 – Target Cost) allowed all parties to approach problems with an aim for solving them, not relying on positioning or protecting themselves. When the project succeeds, everyone involved succeeds.
92
Delivery process
Management and Control of Ground Movements and Groundwater: Engineers in the 24/7 Control Room analysed settlement on a real-time basis, providing confidence that if any incident occurred it could be mitigated with immediate effect, protecting people and third-party assets. Specialist mitigation measures were developed, such as the piled solution installed beneath the 100-year-old Lord Hill’s Bridge, which supports the Royal Oak London Underground (LU) Station.
When the TBMs passed underneath, movements remained stable and settlement recorded on the tracks was almost zero. The data obtained from the Crossrail project was provided to Ferrovial’s collaborative research initiative within Massachusetts Institute of Technology (MIT) on the Assessment of Land Movement from Tunnelling, which will enable more accurate prediction of ground movements associated with future underground construction.
Project Gains through Works Integration: Ferrovial collaborated with Crossrail to merge the two separate Western Running Tunnels (C300) and station caverns (C410) contracts, resulting in significant cost and risk reductions. Merging the contracts facilitated the adoption of a different construction methodology, with the TBMs being driven through the new station tunnels. The station tunnels were then enlarged by breaking out from the running tunnel using the tunnel as the pilot. An additional crossover tunnel was constructed in advance of the tunnelling, with the spoil from the station tunnel excavation removed using the TBM conveyors to the portal where the spoil was transported by rail. This approach reduced the overall settlement of the station tunnel excavation.
Working collaboratively with rail transport operators and other work packages: On-time completion was achieved as a direct result of Ferrovial’s robust
interface management and cooperative approach to working with other contractors. A pragmatic approach to underground site boundary management, identified program interfaces and a phased handover to other works contractors all contributed to the early project completion, and demonstrates Ferrovial’s ability to effectively manage complex interfaces for improved project outcomes.
Effective collaboration with other Package Contractors enhanced safety and reduced risk. For example, while the TBMs passed through the Bond Street and Tottenham Court Road ticket halls, emergency access was gained via contractor sites working above at ground level. We collaborated closely on designing emergency procedures and staging full‐scale rehearsals. At Farringdon, at the heart of one of our five worksites, a LU signalling room for the area was located close to one of our grouting shafts. A protected route to this room – a walkway that provided LU personnel with safe passage at any time to support rapid response to an emergency such as a signal failure – was maintained. When personnel arrive, all work on the site was ceased immediately, allowing them to reach the room unimpeded and with no distractions such as noise or dust. Banksmen along the route ensured that no traffic crossed in their path.
In Crossrail, a re-sequence of the construction program was conducted to allow another contractor’s TBM break into the eastern end of our Farringdon, Whitechapel and Finsbury Circus sites. Our ability to undertake this change demonstrated flexibility in our planning and resourcing and our ability to support the Project overall. We adopted a phased handover to other Package Contractors of the platforms at Bond Street, Tottenham Court Road, Whitechapel and Finsbury Circus, enabling earlier final completion via a pragmatic approach to Interface/underground site boundary management. We collaborated closely with other contractors and Crossrail to ensure all program interfaces were accommodated
93
Outcomes and achievements
Key Project Outcomes:
• A phased handover to contractors of the platforms at Bond Street and Tottenham Court Road enabled earlier final completion through a pragmatic approach to interface/underground site boundary management. Close collaboration with other contractors and Crossrail Limited accommodated all program interfaces. Our dedicated Community Liaison Manager activated a high quality and consistent approach to stakeholder management.
• At peak production, the TBMs each advanced up to 40m per day, excavating more than 3,000t and installing 575t of concrete tunnel lining rings.
• $32.4 million was saved through our Optimised Contractor Involvement (OCI) proposals, including a recommendation to merge the C300 and C410 contracts. Additional proposals during the works have saved a further $27.2 million.
• Time efficiencies were achieved through concurrent compensation grouting/monitoring arrangements which resulted in fewer temporary shafts and tunnels. In addition, the manufacture of tunnel segments at Westbourne Park enabled precast segments to be manufactured to the construction program.
• Employing almost a third of all Crossrail apprentices built a lasting legacy. Together with the Tunnelling and Underground Construction Academy, we developed skills and resources for future projects in and beyond London.
With over 40 sites running concurrently across the Crossrail program, the collaborative contract model facilitated an environment where everyone worked flexibly alongside many contractors and stakeholders ensuring best-for-project outcomes; phased handover to other contractors enabled earlier final completion via a pragmatic approach to interface/underground site boundary management; collaborated closely with other contractors and Crossrail Limited to accommodate all program interfaces; and, Consents Manager acquired approvals and permissions in a timely manner.

94
This report was developed in partnership with BIS Oxford Economics, the leader in forecasting,
modelling and quantitative analysis within Australia and across the globe.
www.bisoxfordeconomics.com.au
1300 540 133
Level 3 • 51 Walker StreetNorth Sydney NSW 2060
constructors.com.au