sustaining rural water supplies in uganda through improved ... · in uganda through improved water...
TRANSCRIPT

1
Sustaining rural water supplies in Uganda through improved
water catchment protection
Dr Callist Tindimugaya and
Grace Katuramu

Introduction
• Water resources are under heavy pressure due to: high population growth rates, unsustainable land use practices, uncontrolled waste disposal, catchment degradation etc.
• Degradation of quality and quantity of water resources on the increase and expected to increase as the pressures on natural resources increase.
• Degraded water catchments mean that societies that depend on them have either limited access to a sustainable source of water or consume contaminated water.
• Providers of drinking water often resort to expensive water abstraction technologies or treatment processes to render the water safe but come at great cost to the societies and consumers of the water.
• Catchment protection can save money through lower costs for medication for water borne diseases and less sickness in the population.
2

Domestic water supply sources in good and poor environments in Uganda
3
How sustainable is rural water supply in these two environments?

Source: Nkhuwa 2006
Contamination sources not separate from water supply
Lusaka
How to supply potable water
here?

Lake
Catchment Boundary
Irrigation
Navigation
A Typical catchment…
…there is a need for integrated catchment
management in order to sustain the various activities
Industry
Urban WSS
Precipitation
Agriculture Department
Irrigation Department
Rural Water Supply Department
Urban Water Supply Department
Power Department
Livestock Department
Industry Department
Environment Department
Fisheries Department
Transport Department
Tourism Department
Groundwater Department
Surface Water Department
Reservoir
Recreation
Hydropower
Forest Department
Ocean Development/CZM Department
Fishing
Rainfed Agr
Livestock
Forest
Rural WSS
Irrigation
Groundwater
Infiltration / Recharge
Base Flow / Pumping
Groundwater Inflow
Groundwater Outflow
Runoff
Return Flow
Community Use
Wetlands / Environment
Trans-boundary Water Institutions
Why Catchment Management? In a catchment or basin: • Water uses are generally not independent • Their needs must be met from a common
resource – the SW and GW that occurs within the catchment from season to season
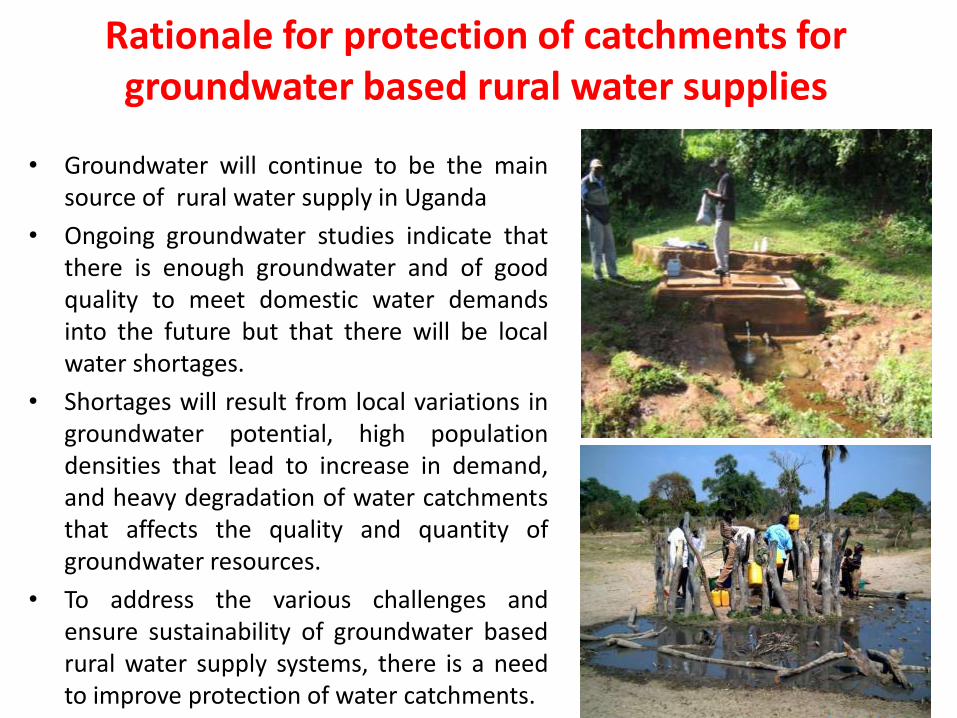
Rationale for protection of catchments for groundwater based rural water supplies
• Groundwater will continue to be the main source of rural water supply in Uganda
• Ongoing groundwater studies indicate that there is enough groundwater and of good quality to meet domestic water demands into the future but that there will be local water shortages.
• Shortages will result from local variations in groundwater potential, high population densities that lead to increase in demand, and heavy degradation of water catchments that affects the quality and quantity of groundwater resources.
• To address the various challenges and ensure sustainability of groundwater based rural water supply systems, there is a need to improve protection of water catchments.
6

Protection of catchments for groundwater based rural
water supplies
7
• Improved catchment protection should be based on a proper understanding of the availability and spatial distribution of groundwater in terms of quantity and quality
• This is achieved through undertaking groundwater mapping and assessment activities.
• This information is the basis of developing water catchment protection guidelines for protecting groundwater based rural water supply systems so that they can continue delivering adequate and good quality water to the communities.

Mapping of groundwater resources
Produces tools in form of maps and reports to guide planning and implementation of groundwater development activities at both the national and district levels.
6 different types of maps are produced:
(i) water supply coverage map (ii) hydrogeological characteristics map (iii) hydrochemical characteristics map (iv) water quality map (v) groundwater development technology
options map (vi) groundwater potential map
8

Groundwater maps
%[
AYAVU
BAITO
OLALI
OKOLLO
ENYIO
OMUA
ONYOMU
AJIBU
ODOI
OLEVU
KWILI
ANIPI
ALIBA
ARARA
ADRAA
OCEA
ORIBU
PAJURU
GBULUKUATUNI
LAZEBU
KATIYI
LUBA
OCHEBU
AYAYIA
EWA
ELIBU
ROGA
PANDUKU
BANDILI
CHIABA
PAMVARA
NYIRIVU
LAURA
OMOO
ANYAVU
MANAGO
AUPI
ANIPI
PARABOK
AYAA
OKAVU
ODUBU
EWANGA
AWIKA
MITE
LAZEBU
NYIO
OZOO
ALIVU
OMBACHI
AWUVU
JIKI
YABIAVOKO
OLIBA
OPIA
AYAVU
OMBOKORO
ULUPI
AJONO
YIVU
KATI
ANZU
OMBAVU
NYIOVURA
LUFE
TILEVU
ROBU
ETORI
KUBO
RINGILI
ERUBA
OLEVU
MBARAKA
LUVU
OMBACI
BURA
MICHU
ERAMVA
OCHOKO
OREKU
WANDI
TURUURUGBO
EZUKU
ODRAVU
ANYARA
ANZUU
POKEA
ELEKU
EWADRI
ALIVU
ALIBA
NYIO
ARIVU
ODRAVU
KULUVA
OMBACI
DRIWALA
ALIVU
KAMULE
ADALAFU
YAPI
ONZIVU
MVARA
AMBEKO
KOMITE
BUNYU
ODULUBA
OMBOKORO
NYARACU
ARIWARA
OMBOKORO
AWINDIRI
TANGANYIKA
KENYAPANGISA
BAZAAR
OGOKO
AJIA
OKOLLO
RIGBO
OFFAKA
LOGIRI
ARIVU
RHINO CAMP
ULEPPI
ADUMI
VURRA
OLUKOPAJULU
AROI
MANIBE
DADAMU
ARUA HILL
OLI RIVER
250000
250000
260000
260000
270000
270000
280000
280000
290000
290000
300000
300000
310000
310000
320000
320000
330000
330000
340000
340000
28
000
0
28
000
0
29
000
0
29
000
0
30
000
0
30
000
0
31
000
0
31
000
0
32
000
0
32
000
0
33
000
0
33
000
0
34
000
0
34
000
0
35
000
0
35
000
0
36
000
0
36
000
0
±
DATA SOURCES
COPYRIGHT: Government of Uganda ,2009
First Edition: August, 2009.
PUBLISHER
Compiled and published by the Directorateof Water Resources Management. Funded by the Government of Ugandaand DANIDA.
NOTE
For any comment or error, please contactDirectorate of Water Resources Management:P.O. Box 19, Entebbe.Tel: (+256) 0414 321342, 320914Fax: (+256) 0414 321368Email: [email protected]
Grid : UTM, Zone 36Projection : Transverse Mercator
Spheroid : Clark 1880 (modified)Meridian of Origin : 33 deg. East of GreenwichLatitude of Origin : Equator
Scale Factor at Origin : 0.9996False Eastings : 500,000False Northing :10,000,000
Datum : New Arc (1960)Unit : Metre
DISCLAIMER
Although great care was taken in the preparation of these maps, the authorscannot be held responsible for any loss or damage emanating from their use
Inferred Water Supply Technology options: Based on analysis of water source data from
Arua DWO, National Groundwater Database and District groundwater developers
Administrative boundary, infrastructure and land cover : Provided by the National Forestry
Authority (NFA).
Minor permanent river
LEGEND
"J District administrative town
Rivers
Major permanent river
1:188,1490 3 6 9 12 151.5
Kilometers
Directorate of Water Resources ManagementMinistry of Water and Environment
NEBBI
AMURU
ADJUMANI
MOYO
YUMBE
NYADRI
DE
MO
CR
AT
IC R
EP
UB
LIC
OF
CO
NG
O
This map is meant to act as a guide to planners in local government for the planning of
groundwater programmes and is, due to scale, not suitable for siting boreholes. The latter
should be based on much more detailed and site specific information.
This map should be used together with the District report.
NOTE
Location of Arua District
0 90 180 270 36045Kilometers
1:5,500,000
Administrative Boundaries
International boundary
District boundary
County boundary
Subcounty boundary
Parish boundary
Railway
Infrastructure
All weather tarmac road
All weather murram road
Dry weather murram road
Motorable track
Water Resources
Open water
Permanent wetlands (papyrus) in main valleys
Seasonal wetlands in secondary valleys
%[ $$$$$
$$$
$$
$$$
$$$$$$$$ $$$
$$
$$ $$$$$$
$$$
$
$
$$$
$
$$$$ $
$
$
$$
$$
$$
$
$
$
$ $
$$$ $
$
$
$
$
$
$$
$$
$$
$$$
$
$
$$$
$
$
$$$ $ $
$
$
$
$
$$
$$
$
$ $
$
$
$
$$
$
$$
$
$
$
$
$
$$
$$
$
$
$
$
$
$
$
$
$
$
$
$
$
$
$
$
$
$
$
$
$$$$ $$
$
$
$
$$
$$
$
$
$$$$
$
$
$
$
$
$
$
$$
$
$
$
$
$
$$
$
$
$
$
$
$
$
$
$
$
$
$
$
$
$
$
$
$
$
$
$
$$
$
$
$$
$
$
$
$
$
$
$
$$ $
$
$
$$
$
$
$
$
$
$
$
$
$$
$
$
$
$
$
$
$
$
$
$
$
$
$$
$$
$$
$
$ $
$
$$$
$
$
$
$
$
$
$
$
$
$
$
$
Data Density
0 10 20 30 405Kilometers
1:750,000
0-15m, Shallow well
15-30m, Shallow well
> 30m, deep bore hole
Spring zone
Water Supply Technology Options MapARUA DISTRICT
%[
ALWI
BARO
RAGEM
RAMOGI
MUTIR
VURR
OSSI
POKWERO
OLAGO
ANGOL
ABAJI
MUKALE
MBARO
ANYOLA
KITUNA
PALEY
OTHEKO
ABIRA
KOCH PAKIA
NYAKAGEI
PATEK
ABAR
ATIAK
KALOWANG
GANDA
OWARO
ABEJU
PAMINYA
PAYERA
PAKIA
PASAI
ANGAR
OLIRI
AYAKA
GAMBA
PACEGO
PACAKA
OGUSI
PADUBA
LENDU
PAGEI
OMUA
JUPADINDO
PAMORA
CHANA
RERO
PAKWINYO
PAROKETO
JULOKA
JUPAMATHO
AMOR
OMOYO
PADEL
PAJUR
OYEYO
JUPANGIRA-PAWONG
PAPOGA
PADOLO
KASATU
OWEKOKAYA
PAMITU
PAKADHA
ABANGA
MURUSI
ABONGO
PULUM
PAMACH
PARWO
THANGA
POVUNGU
PANGERE
NYACARA
PARWO
JUKIA
OMUA
NAMRWODHO
DWONGA
LENDU FR
OTURGANG
FOREST ZONE
PAGWATA
CENTRAL
PAGWATA
CENTRAL
PAGWATA
PAGWATA
ANYOLA
KITUNA
THIS MAP MUST NOT BE CONSIDERED AN AUTHORITY ON DELIMITATION OF INTERNATIONAL AND OTHER BOUNDARIES
First Edition: April, 2009.
COPYRIGHT: Government of Uganda, 2009
%[
ALWI
BARO
RAGEM
RAMOGI
MUTIR
VURR
OSSI
POKWERO
OLAGO
ANGOL
ABAJI
MUKALE
MBARO
ANYOLA
KITUNA
PALEY
OTHEKO
ABIRA
KOCHPAKIA
NYAKAGEI
PATEK
ABAR
ATIAK
KALOWANG
GANDA
OWARO
ABEJU
PAMINYA
PAYERA
PAKIA
PASAI
ANGAR
OLIRI
AYAKA
GAMBA
PACEGO
PACAKA
OGUSI
PADUBA
LENDU
PAGEI
OMUA
JUPADINDO
PAMORA
CHANA
RERO
PAKWINYO
PAROKETO
JULOKA
JUPAMATHO
AMOR
OMOYO
PADEL
PAJUR
OYEYO
JUPANGIRA-PAWONG
PAPOGA
PADOLO
KASATU
OWEKOKAYA
PAMITU
PAKADHA
ABANGA
MURUSI
ABONGO
PULUM
PAMACH
PARWO
THANGA
POVUNGU
PANGERE
PARWO
NAMRWODHO
DWONGA
NYACARAJUKIA
LENDU FR
OMUA
OTURGANG
FOREST ZONE
PAGWATA
CENTRAL
PAGWATA
CENTRAL
PAGWATA
PAGWATA
ANYOLA
KITUNA
%[
ALWI
BARO
RAGEM
RAMOGI
MUTIR
VURR
OSSI
POKWERO
OLAGO
ANGOL
ABAJI
MUKALE
MBARO
ANYOLA
KITUNA
PALEY
OTHEKO
ABIRA
KOCH PAKIA
NYAKAGEI
PATEK
ABAR
ATIAK
KALOWANG
GANDA
OWARO
ABEJU
PAMINYA
PAYERA
PAKIA
PASAI
ANGAR
OLIRI
AYAKA
GAMBA
PACEGO
PACAKA
OGUSI
PADUBA
LENDU
PAGEI
OMUA
JUPADINDO
PAMORA
CHANA
RERO
PAKWINYO
PAROKETO
JULOKA
JUPAMATHO
AMOR
OMOYO
PADEL
PAJUR
OYEYO
JUPANGIRA-PAWONG
PAPOGA
PADOLO
KASATU
OWEKOKAYA
PAMITU
PAKADHA
ABANGA
MURUSI
ABONGO
PULUM
PAMACH
PARWO
THANGA
POVUNGU
PANGERE
NYACARA
PARWO
JUKIA
OMUA
NAMRWODHO
DWONGA
LENDU FR
OTURGANG
FOREST ZONE
PAGWATA
CENTRAL
PAGWATA
CENTRAL
PAGWATA
PAGWATA
ANYOLA
KITUNA
Inferred Overburden ThicknessInferred Static Water Level
Inferred Main Water StrikeInferred First Water StrikeLocation of Nebbi District
LEGEND
Although great care was taken in the preparation
of these maps, the authors cannot be held
responsible for any loss or damage emanating
from their use.
DISCLAIMERPUBLISHER
Compiled and published by the Directorate of Water Resources Management.
Funded by the Government of Ugandaand DANIDA.
Grid : UTM, Zone 36Projection : Transverse Mercator
Spheroid : Clark 1880 (modified)Meridian of Origin : 33 deg. East of GreenwichLatitude of Origin : Equator
Scale Factor at Origin : 0.9996False Eastings : 500,000
False Northing : 10,000,000Datum : New Arc (1960)Unit : Metre
$
$
$
$
$
$
$
$$$
$
$
$$$$$$$$$$$$$$$$
$
$$$$$
$
$$
$
$
$$
$
$$$$$$$$$$$
$$
$
$
$
$
$$
$$
$
$
$$
$$
$$
$$$$$$
$$$$$
$
$$$
$
$$$$$$
$
$
$$$$$$$$$$$$
$$
$$
$
$$
$
$$$
$
$$$$
$
$$
$
$$
$
$$
$
$$
$
$
$
$$
$
$
$
$
$$
$$
$
$
$$
$$
$
$
$
$$
$
$
$
$
$$
$
$
$
$
$$
$
$$
$
$$
$$
$$
$
$
$
$$
$
$
$
$
$
$
$$
$
$
$$
$$$$
$
$
$$
$
$
$
$
$$
$
$
$
$$
$$
$
$
$
$
$
$
$
$
$
$
$
$
$$$
$$
$$
$
$
$
$
$
$
$
$
$
$
$
$
$$
$
$
$
$
$
$
$
$
$
$
$
$$
$
$
$
$
$
$
$$
$$
$
$
$
$
$
$$
$
$
$
$
$
$
$
$
$
$
$$
$
$
$$
$
$$
$
$$
$
$
$
$
$
$
$
$
$
$$
$
$
$$
$
$
$
$
$$
$
$
$
$
$
$
$
$
$
$
$
$$
$$
$
$
$
$
$
$
$
$$
$
$$
$
$
$
$$
$$$
$$$
%[
ALWI
BARO
RAGEM
RAMOGI
MUTIR
VURR
OSSI
POKWERO
OLAGO
ANGOL
ABAJI
MUKALE
MBARO
ANYOLA
KITUNA
PALEY
OTHEKO
ABIRA
KOCH PAKIA
NYAKAGEI
PATEK
ABAR
ATIAK
KALOWANG
GANDA
OWARO
ABEJU
PAMINYA
PAYERA
PAKIA
PASAI
ANGAR
OLIRI
AYAKA
GAMBA
PACEGO
PACAKA
OGUSI
PADUBA
LENDU
PAGEI
OMUA
JUPADINDO
PAMORA
CHANA
RERO
PAKWINYO
PAROKETO
JULOKA
JUPAMATHO
AMOR
OMOYO
PADEL
PAJUR
OYEYO
JUPANGIRA-PAWONG
PAPOGA
PADOLO
KASATU
OWEKOKAYA
PAMITU
PAKADHA
ABANGA
MURUSI
ABONGO
PULUM
PAMACH
PARWO
THANGA
POVUNGU
PANGERE
NYACARA
PARWO
OMUA
NAMRWODHO
DWONGA
JUKIALENDU FR
OTURGANG
FOREST ZONE
PAGWATA
CENTRAL
PAGWATA
CENTRAL
PAGWATA
PAGWATA
ANYOLA
KITUNA Data Density
100 0 10050 Kilometers
1:3,000,000
± ±
± ±
±
# Data point
Water Resources
Wetlands
Open water
Permanent wetlands (papyrus) in main valleys
Seasonal wetlands in secondary valleys
Rivers
Major permanent river
Minor permanent river
Directorate of Water Resources Management Ministry of Water and Environment
First Water Strike: The depths at which the borehole encounters water ('Water Strike') were noted during the drilling process. The shallowest
depth at which water was encountered is designated the First Water Strike.
Main Water Strike : The depth at which the principal inflow into the borehole was noted is designated the Main Water Strike.This determines
the most suitable technological option for groundwater development in an area
The Static Water Level at a particular locality is the level at which the groundwater surface stabilizes under the influence
of natural hydrostatic pressure. The Static water level map helps to estimate the level at which to install a pump.Static Water Level :
The overburden thickness map gives an indication of the depth of weathering and hence thickness of the regolith aquifer.
The map helps to estimate the amount of casing.Overburden Thickness :
NOTE
For any comment or error, please contactDirectorate of Water Resources Management:P.O. Box 19, Entebbe.Tel: (+256) 0414 321342, 320914Fax: (+256) 0414 321368Email: [email protected]
NOTE
The maps are meant to act as a guide to planners
in local government for the planning of groundwater
programmes and are , due to scale, not suitable for
siting boreholes. The latter should be based on much
more detailed and site specific investigations carried
out by groundwater specialists.
The maps are based on regional interpretation
and therefore the local conditions may vary from locality
to locality. The maps focus on rural areas only and do
not address urban gazetted areas.
Due to size limitations, the scales of the various maps
may differ.
The data density (inset map) indicates the data points
used in the preparation of the hydrogeological
characteristics map. The map is more accurate
where data density is higher.
This map should be used together with the District report.
District Headquarters
"J
Adminstrative Boundaries
International bounderies
District boundary
County boundary
Subcounty boundary
Parish boundary
Infrastructure
All weather tarmac road
All weather murram road
Dry weather murram road
Motorable track
Railway
NEBBI DISTRICTHydrogeological Characteristics Map
DATA SOURCES
Hydrogeological characteristics: Based on analysis
of water source data from Nebbi District Water
Office, National Groundwater
Database and District groundwater developers
Administrative boundary, Infrastructure and land
cover : Provided by the National forestry Authority
(NFA).
$
$$
$
$
$
$
$
$$$
$
$
$$$$$$$$$$$$$$$$
$
$$$$$
$
$$
$
$
$$
$
$$$$$$$$$$$
$$
$
$
$
$
$$
$$
$
$
$$
$$
$$
$$$$$$
$$$$$
$
$$$
$
$$$$$$
$
$
$$$$$$$$$$$$
$$
$$
$
$$
$
$$$
$
$$$$
$
$$
$
$$
$
$
$$
$
$$
$
$
$
$
$$
$
$
$
$
$
$
$
$$
$
$$
$$
$$
$
$
$
$$
$
$
$
$
$$
$
$
$
$
$$
$
$$
$
$
$$
$$
$
$$
$
$
$
$
$
$
$
$
$
$
$
$
$$
$
$
$$
$$$$
$
$
$$
$
$
$
$
$$
$
$
$
$$
$$
$
$
$
$
$
$
$
$
$
$
$
$
$$$
$$
$$
$
$
$
$
$
$
$
$
$
$
$
$
$$
$
$
$
$
$
$
$
$
$
$
$
$$
$
$
$
$
$
$
$$
$$
$
$
$
$
$
$$
$
$
$
$
$
$$
$
$
$
$
$$
$
$
$$
$
$$
$
$$
$
$
$
$
$
$
$
$
$
$
$$
$
$
$$
$
$
$
$
$
$$
$
$
$
$
$
$
$
$
$
$$
$
$
$$
$$
$
$
$
$$
$
$
$$
$$
$
$
$
$$
$$$
$$$
# Data point
Data Density
$
$$
$
$
$
$
$$
$
$$$
$
$
$$$$$$$$$$$$$$$$
$
$$$$$$
$
$$
$
$
$$
$
$$$$$$$$$$$$
$$
$
$
$
$
$$$
$$
$
$
$$
$$
$$
$$$$$$
$$$$$
$
$$$$
$
$$$$$$$
$
$
$$$$$$$$$$$$
$$
$$$
$
$$
$
$$$
$
$$$$
$
$$
$
$$
$
$
$$
$
$$
$
$
$$
$
$$
$
$
$
$
$
$
$
$
$
$$
$$$
$
$
$
$
$
$
$
$
$$
$
$
$
$$
$
$
$
$
$$
$
$$
$
$
$$
$$
$
$
$$
$
$
$
$
$
$
$
$
$
$
$
$
$$
$
$
$$
$$$$$
$
$$
$
$
$
$
$
$
$
$$
$
$
$
$
$$
$$
$
$
$
$
$
$$
$
$
$
$
$
$
$
$$
$$$
$$
$$
$
$
$$
$
$
$
$
$
$
$
$
$
$$
$
$
$
$
$
$
$
$
$
$
$
$
$
$
$$
$
$
$
$
$$
$
$
$$
$$
$
$
$
$$
$
$$
$
$
$
$
$
$$
$
$
$
$
$
$
$
$
$
$$
$
$$
$
$$
$
$
$
$
$
$
$
$
$
$
$
$$$
$
$
$$
$
$
$
$
$
$
$$
$$
$
$
$
$
$$$
$$$
$
$
$$
$$
$
$$$
$$
$
$
$$
$
$
$
$$
$$
$
$
$
$
$$
$
$
$
$
$
$
$
$
$
$$
$
$$$
$
$
$
$$
$
$
$$$
$$
$
$
$$$$$$$$$
$
Data Density
# Data point
$
$$
$
$
$
$ $
$
$
$$
$
$
$
$
$
$
$
$
$$
$
$
$
$
$
$$
$ $
$
$$
$
$
$
$
$
$$
$
$$$
$
$
$
$
$
$
$
$
$
$
$
$$
$
$
$
$$
$
$$
$
$
$
$$$
$$$
$
$$
$
$
$
$
$
$
$$
$$
$
$
$
$
$$
$
$
$$
$
$$
$
$
$$
$
$
$$
$
$
$$$
$
$$$$$$$$$
Data Density
# Data point
DEMOCRATIC REPUBLIC OF CONGO
ARUA
MASINDI
AMURU
DEMOCRATIC REPUBLIC OF CONGO
ARUAAMURU
MASINDI
AMURU
MASINDI
DEMOCRATIC REPUBLIC OF CONGO
ARUA
ARUA
DEMOCRATIC REPUBLIC OF CONGO
MASINDI
AMURU
Inferred First Water Level (mbgl)
1-15
15-25
25-30
30-40
>40
Spring Area
Inferred Overburden Thickness (mbgl)
1-15
15-25
25-30
30-40
>40
Spring Area
Inferred Static Water Level (mbgl)
1-10
10-15
15-25
25-30
>30
Spring Area 0 10 20 30 405Kilometers
1:275,000
0 10 20 30 405Kilometers
1:275,0000 10 20 30 405
Kilometers
1:275,000
0 10 20 30 405Kilometers
1:275,000
%[
ALWI
BARO
RAGEM
RAMOGI
MUTIR
VURR
OSSI
POKWERO
OLAGO
ANGOL
ABAJI
MUKALE
MBARO
ANYOLA
KITUNA
PALEY
OTHEKO
ABIRA
KOCH PAKIA
NYAKAGEI
PATEK
ABAR
ATIAK
KALOWANG
GANDA
OWARO
ABEJU
PAMINYA
PAYERA
PAKIA
PASAI
ANGAR
OLIRI
AYAKA
GAMBA
PACEGO
PACAKA
OGUSI
PADUBA
LENDU
PAGEI
OMUA
JUPADINDO
PAMORA
CHANA
RERO
PAKWINYO
PAROKETO
JULOKA
JUPAMATHO
AMOR
OMOYO
PADEL
PAJUR
OYEYO
JUPANGIRA-PAWONG
PAPOGA
PADOLO
KASATU
OWEKOKAYA
PAMITU
PAKADHA
ABANGA
MURUSI
ABONGO
PULUM
PAMACH
PARWO
THANGA
POVUNGU
PANGERE
NYACARA
PARWO
JUKIA
OMUA
NAMRWODHO
DWONGA
LENDU FR
OTURGANG
FOREST ZONE
PAGWATA
CENTRAL
PAGWATA
CENTRAL
PAGWATA
PAGWATA
ANYOLA
KITUNA
Inferred Main Water Strike (mbgl)
1-15
15-25
25-30
30-40
>40
Spring Area
Groundwater maps are guiding district officials in selection of the most feasible water supply technology options and areas with low groundwater
potential , which require attention.
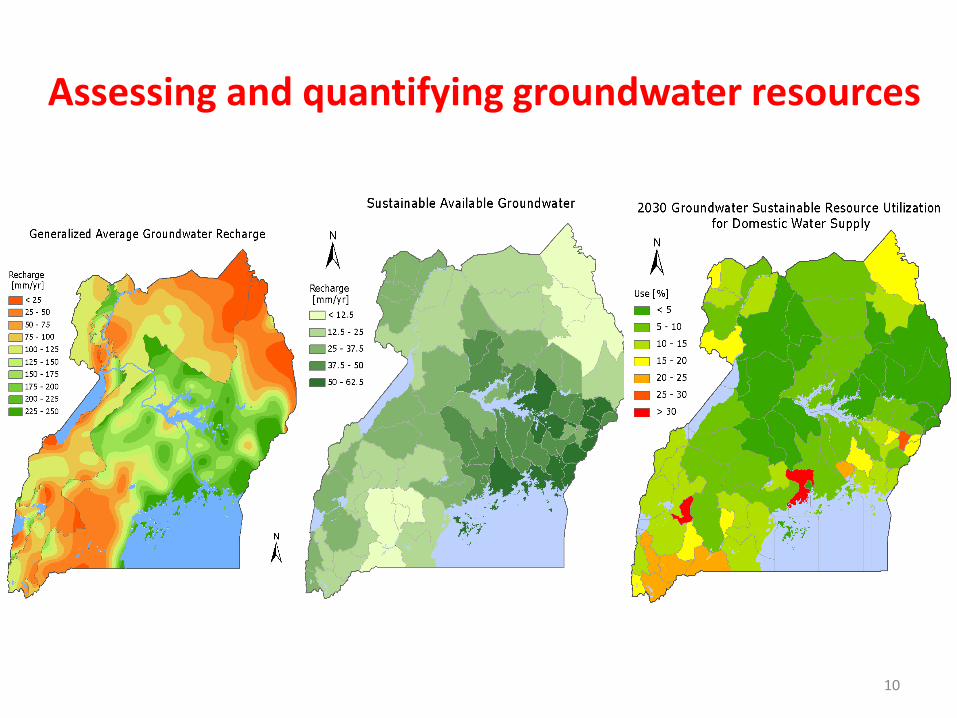
Assessing and quantifying groundwater resources
10

Assessing and quantifying groundwater resources
• Recently estimated renewable groundwater resources to far exceed projected water demand for domestic water supply of 326 mcm/yr in the year 2030.
• Sustainable groundwater utilization rate for domestic water supply is less than 15% of the available groundwater resources in most of the most districts in Uganda.
• Study concluded that there is enough groundwater to meet domestic water demands into the future.
• Water shortages may however arise at local scales as a result of local variations in groundwater potential, high population densities that lead to increase in demand and heavy degradation of water catchments that affects the quality and quantity of groundwater resources.
• Shortages may also occur as a result of poor water quality due to pollution from various sources in the catchment.

Need for water catchment protection guidelines
• Uganda has embarked on preparation of water catchment protection guidelines
• Process involves development of an overall framework for water catchment protection to provide guidance on how water resources should be protected for various purposes.
• Framework will define the need for specific guidelines depending on the source and use of water or whether more general guidelines should be developed.
• Specific catchment protection guidelines will be developed based on an overall framework.
• For domestic water supplies, guidelines with build on the current environmental template included in the District Implementation Manual
• The main outputs of the process include:
- Analysis of existing catchment protection approaches
- recommendation for a policy/ law related to catchment protection
- framework for catchment protection in Uganda
- overarching guideline (including checklists)
- generic protection guidelines (for about five specific water resources and use patterns)
- strategy for implementation of catchment protection approach

National
Regional
District
Local Government
Community
Households
Co
nti
nu
um
of
Pu
bli
c R
esp
on
se
Supporters
Observers
Opposers
13

Funding water catchment protection
• Substantial resources are needed for maintaining water resources and the general catchments and possible ways of obtaining these resources need to be explored
• Payment for Watershed Services approach (PWS) is one possible option
• PWS is an economic approach to improve management of environmental resources including water resources management within the context of Integrated Water Resources Management.
• PWS approach is based on resources which could have an economic value, such as the price of water or on ecosystem services that are provided by these environmental resources for human activities such as flood protection or water purification through wetlands.
• The economic approach uses the mechanisms of exchange between supplier of goods or services (“sellers”) and buyers of goods or services in order to achieve a certain target level of impact.
• This approach is being explored as part of the development and implementation of water catchment protection guidelines in Uganda.

Services = eg. sustainable
Landuse
Payment or compensation in kind
Seller of Services, eg. farmers planting forests
Buyer of environmental services, eg. hydro power company
positive impact on water related issue
Private user of common goods, eg. abstraction of water
Government
Classic approach: Payment of fee forabstraction
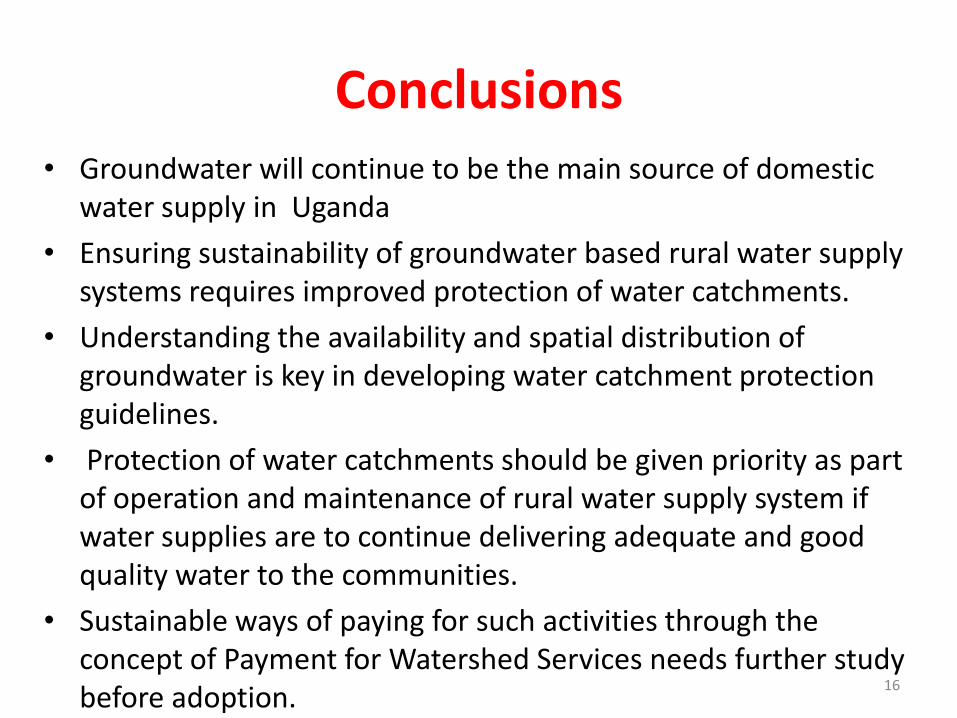
Conclusions • Groundwater will continue to be the main source of domestic
water supply in Uganda
• Ensuring sustainability of groundwater based rural water supply systems requires improved protection of water catchments.
• Understanding the availability and spatial distribution of groundwater is key in developing water catchment protection guidelines.
• Protection of water catchments should be given priority as part of operation and maintenance of rural water supply system if water supplies are to continue delivering adequate and good quality water to the communities.
• Sustainable ways of paying for such activities through the concept of Payment for Watershed Services needs further study before adoption.
16