sustainable water management under future uncertainty … · now pursuing massive new...
TRANSCRIPT

NATURE CLIMATE CHANGE | ADVANCE ONLINE PUBLICATION | www.nature.com/natureclimatechange 1
Securing the supply and equitable allocation of fresh water to support human well-being while sustaining healthy, functioning ecosystems is one of the grand environmental challenges of the twenty-first century, particularly in light of accelerating stressors from climate change, population growth and economic develop-ment. Rehabilitation of ageing infrastructure and construction of new infrastructure are now widely viewed as engineering solutions to mitigate future climatic uncertainty in the hydrologic cycle1. Indeed, the construction of tens of thousands of dams in the twen-tieth century helped secure water supplies and fuel economic devel-opment in industrialized countries, and developing economies are now pursuing massive new infrastructure projects with thousands of new dams proposed for hydropower production and water sup-ply security2.
Despite the economic stimulus provided by many dams histori-cally, the global experience with dam building warns that traditional approaches to water infrastructure development in a rapidly chang-ing world carry severe risks of economic and environmental failure. First, large water projects are very capital-intensive and long-lived, costing billions of dollars to plan, build and maintain. Yet, they are vulnerable to biased economic analyses3, cost overruns and construction delays, and changing environmental, economic and social conditions that can diminish projected benefits4,5. Under a variable and changing climate, large water infrastructure may even risk becoming stranded assets6. Second, the principles of economic efficiency inherent in cost-benefit analysis dominate project design and performance assessment, making integration of social and environmental benefits and costs into a comprehensive economic
Sustainable water management under future uncertainty with eco-engineering decision scalingN. LeRoy Poff1*, Casey M. Brown2, Theodore E. Grantham3, John H. Matthews4, Margaret A. Palmer5, Caitlin M. Spence2, Robert L. Wilby6, Marjolijn Haasnoot7,8, Guillermo F. Mendoza9, Kathleen C. Dominique10 and Andres Baeza11
Managing freshwater resources sustainably under future climatic and hydrological uncertainty poses novel challenges. Rehabilitation of ageing infrastructure and construction of new dams are widely viewed as solutions to diminish climate risk, but attaining the broad goal of freshwater sustainability will require expansion of the prevailing water resources management paradigm beyond narrow economic criteria to include socially valued ecosystem functions and services. We introduce a new decision framework, eco-engineering decision scaling (EEDS), that explicitly and quantitatively explores trade-offs in stake-holder-defined engineering and ecological performance metrics across a range of possible management actions under unknown future hydrological and climate states. We illustrate its potential application through a hypothetical case study of the Iowa River, USA. EEDS holds promise as a powerful framework for operationalizing freshwater sustainability under future hydrologi-cal uncertainty by fostering collaboration across historically conflicting perspectives of water resource engineering and river conservation ecology to design and operate water infrastructure for social and environmental benefits.
evaluation a significant challenge7,8. These costs can be substantial, as evidenced by human displacement5,9, local species extinctions10 and the loss of ecosystem services such as floodplain fisheries and other amenities11,12.
As unanticipated economic, social and environmental costs accumulate with ageing water infrastructure, society is investing in restoration projects to partially undo longstanding environmen-tal degradation, including modifying flow releases from dams13,14 and, in some cases, dam removal15. As global-scale impairment of aquatic ecosystem function becomes increasingly documented and articulated16,17, there is urgent need for a broader conception of sustainable water resource management that formulates environ-mental health as a necessary ingredient for water security and the social well-being it supports18–20. Notably, new national directives are emerging to develop and manage river ecosystems in more envi-ronmentally sustainable ways that retain social benefits, including in the USA21, Europe22,23 and Australia24.
Towards a sustainable water management paradigmHere, we ask if a more sustainable water management philosophy can be forged to guide investment in, and design of, water infra-structure while avoiding adverse (and sometimes irreversible) social and environmental consequences. We consider ‘sustainable water management systems’ to be those that meet the needs of society over the lifetime of the infrastructure while also maintaining key ecological functions that support the long-term provision of eco-system goods, services and values, including biodiversity mainte-nance. These systems would embrace the principle of resilience, that
1Department of Biology and Graduate Degree Program in Ecology, Campus Mail 1878, Colorado State University, Fort Collins, Colorado 80523, USA. 2Civil and Environmental Engineering, University of Massachusetts, 12B Marston Hall, 130 Natural Resources Road, Amherst, Massachusetts 01003, USA. 3US Geological Survey, Fort Collins Science Center, 2150 Centre Avenue, Building C, Fort Collins, Colorado 80526, USA. 4Alliance for Global Water Adaptation, 7640 NW Hoodview Circle, Corvallis, Orlando 97330, USA. 5National Socio-Environmental Synthesis Center, University of Maryland, 1 Park Place, Annapolis, Maryland 21401, USA. 6Department of Geography, Loughborough University, Leicestershire, LE11 3TU, UK. 7Deltares, Department of Scenarios and Policy Analysis, PO Box 177, 2600 MH, Delft, The Netherlands. 8Delft University of Technology, Faculty of Technology, Policy & Management, PO Box 5015, 2600 GA, Delft, The Netherlands. 9US Army Corps of Engineers, Institute for Water Resources, 7701 Telegraph Road, Alexandria, Virginia 22315,USA. 10Organisation for Economic Co-operation and Development (OECD), 2 rue André-Pascal, 75775 Paris, France. 11National Socio-Environmental Synthesis Center, 1 Park Place, Annapolis, Maryland 21401,USA. *e-mail: [email protected]
PERSPECTIVEPUBLISHED ONLINE: 14 SEPTEMBER 2015 | DOI: 10.1038/NCLIMATE2765
© 2015 Macmillan Publishers Limited. All rights reserved
2 NATURE CLIMATE CHANGE | ADVANCE ONLINE PUBLICATION | www.nature.com/natureclimatechange
is, the capacity to persist with functional integrity under changing social and environmental conditions25. Indications of this emerging perspective are reflected in calls for greater focus on demand-side management, rather than supply-side solutions26, as well as ‘green’ infrastructure approaches, such as ‘soft-path’ solutions27 and man-aged natural systems28. Deep uncertainty about future climate raises significant concerns about how to achieve long-term economic benefits and performance reliability of major water projects29,30. This unprecedented uncertainty renders traditional approaches to the design of long-lived infrastructure inadequate, requiring new decision-making approaches31. In the context of a changing (non-stationary) hydrologic cycle, incorporation of alternative design and management principles can be viewed as reducing risk in infra-structure investment by enhancing ‘robustness’ (satisfactory per-formance under a wide range of uncertain futures) and ‘adaptive capacity’ (the ability to be modified rapidly and economically in response to changing, unforeseen conditions)32,33.
Planning for resilient, robust and adaptive water infrastructure to achieve social, economic and environmental objectives under a highly uncertain future presents novel challenges. First, contrast-ing paradigms in water resource engineering and in conservation ecology have dominated the broader societal debate about infra-structure design and operation over the past several decades34,35, and these perspectives have typically been antagonistic. However, the fields of water resource engineering and conservation ecol-ogy are now independently re-examining long-held, foundational assumptions, in no small part because of concerns about climate change and other forms of non-stationarity (Box 1). These philo-sophical shifts are subsequently creating the possibility of revisiting ingrained presumptions about barriers to collaboratively attaining more sustainable water resource management. Second, methods for integrating ecological principles into water infrastructure design and operation to satisfy multiple objectives have been proposed8 but are not well established in practice36,37. The key question emerges of how to operationalize sustainable water management to couple engineering design principles with ecosystem requirements in the context of non-stationary stressors (for example, changes in climate, water use, population growth and land-use change).
A new analytical framework to climate adaptation planning has emerged that aims to facilitate the sustainability dialogue between water resource engineers and conservation ecologists. This approach, called decision scaling38,39, was developed as an alter-native to prevailing top-down climate risk assessment methods
in the water resources community that rely on projecting climate conditions several decades into the future to assess risk, primarily through the use of global circulation models (GCMs). GCM pro-jections, however, have large, irreducible uncertainties40 and poor capability of representing climatic variability (for example, storm intensity-duration-frequencies) that water resource engineers require to design water infrastructure41,42. Thus, GCMs are often of limited use to water resource planners and decision makers attempt-ing to understand and mitigate climate risks in the immediate to mid-term management future43,44.
Decision scaling, by contrast, is a bottom-up risk assessment approach that engages decision makers by starting with stakeholder-determined metrics that define acceptable system performance. System vulnerability is then assessed by evaluating the sensitivity of metrics (for example, ability to meet a water delivery target) to a variety of non-stationary threats, such as climate change, demo-graphic change and economic trends that occur over management-relevant timescales. The decision scaling approach has been applied to evaluate climate risks to water management systems focused on engineering performance indicators, such as water supply reliabil-ity38, flood risk estimation45 and cost-benefit analysis46, as well as climate-sensitive hydrologic indicators47.
As in the water resources arena, ecosystem management is increasingly focused on reducing the vulnerability of sensitive species, ecological processes and natural resource production to a variety of non-stationary stressors through risk analysis48 and stakeholder-driven processes49. For example, in regulated rivers, environmental flows to sustain desired ecological processes or con-ditions downstream of dams are often defined through vulnerability assessments involving scientists, government agencies and water users50. Similarly, ‘smart licenses’ are being devised to protect the stakeholder-defined needs of both the environment and water users under anticipated climate variability and change51. More broadly, formal decision frameworks, such as structured decision making52, are being adopted by natural resource agencies to identify critical ecological thresholds and guide adaptive management to achieve sustainable outcomes. Thus, decision scaling is consistent, in terms of process and scope, with bottom-up approaches that ecosystem managers are familiar with and often rely on for decision making.
Eco-engineering decision scalingExpansion of the existing decision scaling framework to consider both engineering and ecological performance affords a powerful
Rapid climate change, population growth and economic trends are generating unprecedented uncertainty about how to achieve sustainability targets for water management and ecosystem con-servation, as well as simultaneous opportunities to find common ground. First, traditional water resource engineering is strug-gling with climate non-stationarity (unknowable uncertainty about future hydrologic conditions) and seeking new approaches to guide infrastructure planning and avenues for secure eco-nomic investment under a wide range of climate scenarios77. Second, climate variability and change plus the pervasive effects of human activities on ecosystems are broadly challenging con-servation and restoration ecology, which have traditionally defined ecosystem management targets by reference to historical (‘natural’) conditions and focused on habitat reserve strategies78. Emerging perspectives in aquatic ecology now place biological conservation in the context of highly altered and non-stationary hydrosystems that require active management within human-dominated landscapes to sustain critical ecosystem functions79–81.
These perspectives align with a broader conservation approach of “managing for resilience”82, which focuses on maintaining key processes and relationships in social-ecological systems so that they are robust against a wide range and variety of pertur-bation from climate or other stressors. This paradigm repre-sents a departure from traditional conservation biology in that it emphasizes the endurance of system-wide properties (rather than a sole focus on individual species) and promotes reconcilia-tion of conservation objectives with the alteration of natural sys-tems by human influences81,83. Together, emerging paradigms in ecology and engineering are giving rise to potential new levels of cooperation and communication across these (traditionally conflicting) disciplines. For example, ecologists are now devel-oping socially contextualized conservation tools to inform water infrastructure management (‘environmental flows’50,84,85) and water resource engineers are actively exploring how to incorpo-rate these into infrastructure operations86,87 with implications for multiple objective evaluation approaches8,88.
Box 1 | Shifting paradigms in water resource engineering and conservation ecology.
PERSPECTIVE NATURE CLIMATE CHANGE DOI: 10.1038/NCLIMATE2765
© 2015 Macmillan Publishers Limited. All rights reserved
NATURE CLIMATE CHANGE | ADVANCE ONLINE PUBLICATION | www.nature.com/natureclimatechange 3
new analytical approach to operationalize sustainable water resource management in the face of future hydrologic uncertainty. We refer to the integrated analysis of these complementary domains as eco-engineering decision scaling (EEDS), and it builds from the multi-ple-objective decision scaling approach used for policy evaluation in the International Upper Great Lakes Study53,54. The conceptual significance of EEDS is that it allows explicit evaluation of trade-offs between engineering design features and socially valued ecological performance associated with water resource development. More specifically, this trade-off analysis occurs in the initial stages of pro-ject development, so that economic, engineering and ecological vul-nerabilities can be simultaneously compared. Such early evaluation of ecosystem vulnerability is necessary to reveal a range of poten-tial design and management options in complex social-ecological systems55. This new approach is closely aligned with planning principles that engineers often follow, such as the Principles and Guidelines used by the US Army Corps of Engineers (USACE)56, and similar guidance documents in Europe57.
The EEDS framework significantly contrasts with approaches typically used to assess the environmental impacts of water infra-structure projects, and it can be summarized as a five-step pro-cess shown visually in Fig. 1 and described in detail in Box 2. Traditionally, initial project conception and design are driven by economic assessment of expected direct costs (for example, financ-ing, construction and maintenance) and benefits (for example, rev-enue from hydropower production and water supply or avoided damages). Typically, several competing economically viable alter-natives are developed in engineering designs before environmental
impacts are considered. In the EEDS approach, however, both engineering and environmental performances are quantified and simultaneously compared across management alternatives under the range of future uncertainty. Ecological performance indicators must be clearly defined and quantitative, but significantly, they need not be monetized (which is often challenging or infeasible58) to allow comparison with traditional economic indicators. Furthermore, the EEDS approach can accommodate multiple performance met-rics representing a diverse suite of economic, social and ecological objectives (for example, ref. 8). For the sake of simplicity, we present only two metrics in our conceptual framework (Fig. 1) and three metrics in our case study below. Ultimately, stakeholders assess viable decision pathways based on the aggregate performance of all metrics and implement management options according to values and preferences.
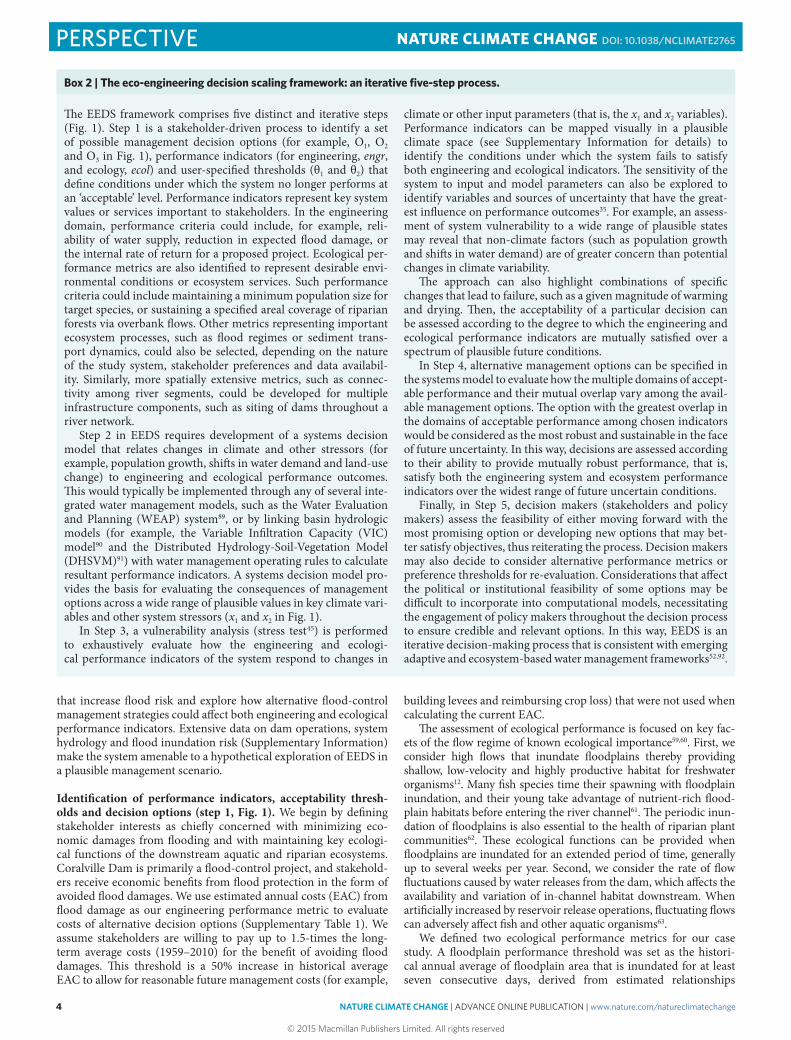
Iowa River case studyWe illustrate the EEDS framework through a hypothetical exam-ple of a water resource decision problem for an existing flood man-agement project. Coralville Dam was constructed in 1958 by the USACE on the Iowa River to protect Iowa City and downstream farmlands from flooding (Fig. 2). Iowa City also has a series of floodplain levees in place to reduce flood risk. Since 1990, several severe runoff events have resulted in unscheduled water releases from the dam spillway, raising concerns that extreme floods are becoming more frequent and that current management operations are inadequate for controlling flood risk. We apply EEDS to evaluate the potential economic costs associated with altered climate regimes
Step 1: Define system performance criteria Step 2: Build systems model
Systems model
Climate Land use
Hydrologic model
Water use
Water infrastructure model
engr & ecol performance
x1, x2
engr > θ1 is unacceptableecol > θ2 is unacceptable
Consider managements options:O1, O2 and O3
Step 3: Conduct vulnerability analysis
Step 5: Identify preferred decision and, if necessary,re-evaluate management options and/or criteria
Step 4: Evaluate options to inform decision(s)
x2
x2
x2
O1
O2
O3
x1
x1
x1
engr
ecol
+
–
Performance
Acceptable
Unacceptable
x2
x1
x1
x1
x2
x2
>θ2
>θ2
>θ1
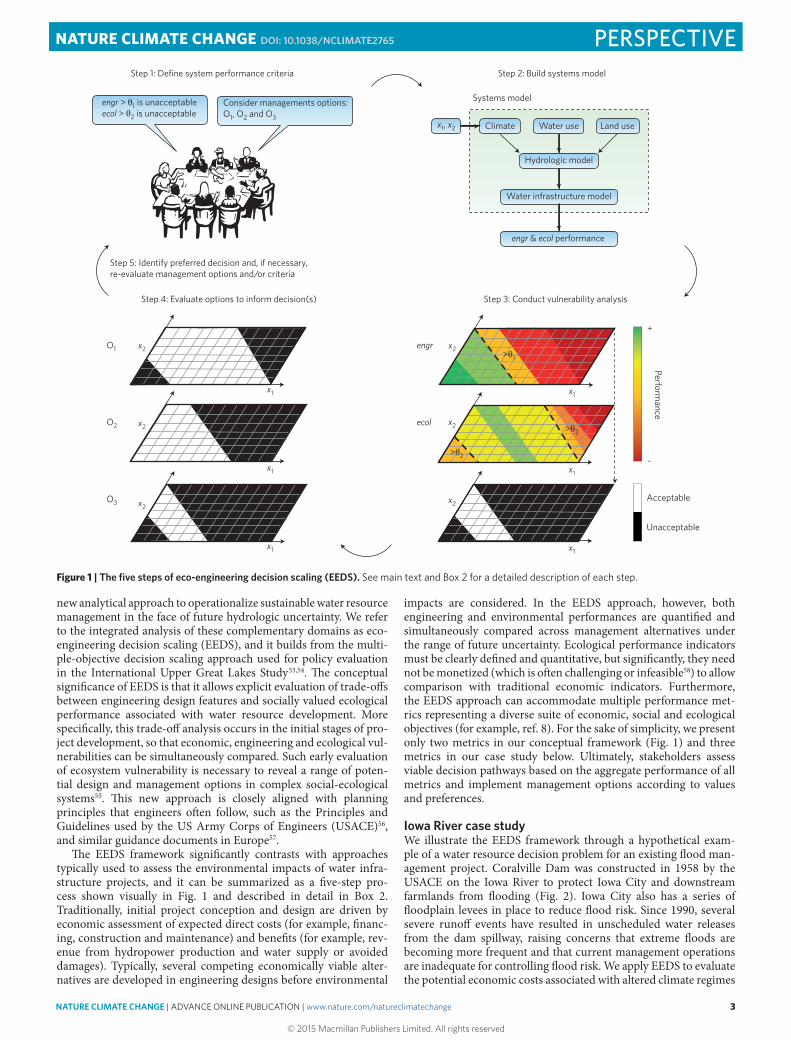
Figure 1 | The five steps of eco-engineering decision scaling (EEDS). See main text and Box 2 for a detailed description of each step.
PERSPECTIVENATURE CLIMATE CHANGE DOI: 10.1038/NCLIMATE2765
© 2015 Macmillan Publishers Limited. All rights reserved
4 NATURE CLIMATE CHANGE | ADVANCE ONLINE PUBLICATION | www.nature.com/natureclimatechange
that increase flood risk and explore how alternative flood-control management strategies could affect both engineering and ecological performance indicators. Extensive data on dam operations, system hydrology and flood inundation risk (Supplementary Information) make the system amenable to a hypothetical exploration of EEDS in a plausible management scenario.
Identification of performance indicators, acceptability thresh-olds and decision options (step 1, Fig. 1). We begin by defining stakeholder interests as chiefly concerned with minimizing eco-nomic damages from flooding and with maintaining key ecologi-cal functions of the downstream aquatic and riparian ecosystems. Coralville Dam is primarily a flood-control project, and stakehold-ers receive economic benefits from flood protection in the form of avoided flood damages. We use estimated annual costs (EAC) from flood damage as our engineering performance metric to evaluate costs of alternative decision options (Supplementary Table 1). We assume stakeholders are willing to pay up to 1.5-times the long-term average costs (1959–2010) for the benefit of avoiding flood damages. This threshold is a 50% increase in historical average EAC to allow for reasonable future management costs (for example,
building levees and reimbursing crop loss) that were not used when calculating the current EAC.
The assessment of ecological performance is focused on key fac-ets of the flow regime of known ecological importance59,60. First, we consider high flows that inundate floodplains thereby providing shallow, low-velocity and highly productive habitat for freshwater organisms12. Many fish species time their spawning with floodplain inundation, and their young take advantage of nutrient-rich flood-plain habitats before entering the river channel61. The periodic inun-dation of floodplains is also essential to the health of riparian plant communities62. These ecological functions can be provided when floodplains are inundated for an extended period of time, generally up to several weeks per year. Second, we consider the rate of flow fluctuations caused by water releases from the dam, which affects the availability and variation of in-channel habitat downstream. When artificially increased by reservoir release operations, fluctuating flows can adversely affect fish and other aquatic organisms63.
We defined two ecological performance metrics for our case study. A floodplain performance threshold was set as the histori-cal annual average of floodplain area that is inundated for at least seven consecutive days, derived from estimated relationships
The EEDS framework comprises five distinct and iterative steps (Fig. 1). Step 1 is a stakeholder-driven process to identify a set of possible management decision options (for example, O1, O2 and O3 in Fig. 1), performance indicators (for engineering, engr, and ecology, ecol) and user-specified thresholds (θ1 and θ2) that define conditions under which the system no longer performs at an ‘acceptable’ level. Performance indicators represent key system values or services important to stakeholders. In the engineering domain, performance criteria could include, for example, reli-ability of water supply, reduction in expected flood damage, or the internal rate of return for a proposed project. Ecological per-formance metrics are also identified to represent desirable envi-ronmental conditions or ecosystem services. Such performance criteria could include maintaining a minimum population size for target species, or sustaining a specified areal coverage of riparian forests via overbank flows. Other metrics representing important ecosystem processes, such as flood regimes or sediment trans-port dynamics, could also be selected, depending on the nature of the study system, stakeholder preferences and data availabil-ity. Similarly, more spatially extensive metrics, such as connec-tivity among river segments, could be developed for multiple infrastructure components, such as siting of dams throughout a river network.
Step 2 in EEDS requires development of a systems decision model that relates changes in climate and other stressors (for example, population growth, shifts in water demand and land-use change) to engineering and ecological performance outcomes. This would typically be implemented through any of several inte-grated water management models, such as the Water Evaluation and Planning (WEAP) system89, or by linking basin hydrologic models (for example, the Variable Infiltration Capacity (VIC) model90 and the Distributed Hydrology-Soil-Vegetation Model (DHSVM)91) with water management operating rules to calculate resultant performance indicators. A systems decision model pro-vides the basis for evaluating the consequences of management options across a wide range of plausible values in key climate vari-ables and other system stressors (x1 and x2 in Fig. 1).
In Step 3, a vulnerability analysis (stress test45) is performed to exhaustively evaluate how the engineering and ecologi-cal performance indicators of the system respond to changes in
climate or other input parameters (that is, the x1 and x2 variables). Performance indicators can be mapped visually in a plausible climate space (see Supplementary Information for details) to identify the conditions under which the system fails to satisfy both engineering and ecological indicators. The sensitivity of the system to input and model parameters can also be explored to identify variables and sources of uncertainty that have the great-est influence on performance outcomes35. For example, an assess-ment of system vulnerability to a wide range of plausible states may reveal that non-climate factors (such as population growth and shifts in water demand) are of greater concern than potential changes in climate variability.
The approach can also highlight combinations of specific changes that lead to failure, such as a given magnitude of warming and drying. Then, the acceptability of a particular decision can be assessed according to the degree to which the engineering and ecological performance indicators are mutually satisfied over a spectrum of plausible future conditions.
In Step 4, alternative management options can be specified in the systems model to evaluate how the multiple domains of accept-able performance and their mutual overlap vary among the avail-able management options. The option with the greatest overlap in the domains of acceptable performance among chosen indicators would be considered as the most robust and sustainable in the face of future uncertainty. In this way, decisions are assessed according to their ability to provide mutually robust performance, that is, satisfy both the engineering system and ecosystem performance indicators over the widest range of future uncertain conditions.
Finally, in Step 5, decision makers (stakeholders and policy makers) assess the feasibility of either moving forward with the most promising option or developing new options that may bet-ter satisfy objectives, thus reiterating the process. Decision makers may also decide to consider alternative performance metrics or preference thresholds for re-evaluation. Considerations that affect the political or institutional feasibility of some options may be difficult to incorporate into computational models, necessitating the engagement of policy makers throughout the decision process to ensure credible and relevant options. In this way, EEDS is an iterative decision-making process that is consistent with emerging adaptive and ecosystem-based water management frameworks52,92.
Box 2 | The eco-engineering decision scaling framework: an iterative five-step process.
PERSPECTIVE NATURE CLIMATE CHANGE DOI: 10.1038/NCLIMATE2765
© 2015 Macmillan Publishers Limited. All rights reserved
NATURE CLIMATE CHANGE | ADVANCE ONLINE PUBLICATION | www.nature.com/natureclimatechange 5
between discharge and floodplain area from Coralville Dam to river mile 46 of the Iowa River (Supplementary Fig. 2). This threshold is an intentionally simplified measure of floodplain function (that is, timing of floods is not considered), and it is based on an assumed stakeholder preference for avoiding the loss of future floodplain functions relative to historical conditions. A second metric was defined by the magnitude of daily changes in outflows from the reservoir during periods when flows are being released rapidly in response to upstream inflows. We calculated a flow recession rate (difference between consecutive daily flow magnitudes) and set a threshold of +30% of the natural daily recession rate, that is, rela-tive to the recession rates of unregulated inflows into the reservoir (see Supplementary Information for details). For both metrics, we make the simplifying assumption that biological communities and ecosystem functions will persist under future climate conditions if flood inundation patterns are maintained and excessive flow reces-sion rates are avoided.
Our hypothesis is that re-engineering of the current flood risk management system could provide the opportunity both to reduce the system’s vulnerability to flood risk associated with rapid cli-mate change and to satisfy ecological objectives for sustaining more resilient downstream aquatic and riparian ecosystems. By quanti-fying the trade-off space between the economic costs of engineer-ing design and maintenance and the environmental benefits under alternative flood-risk management strategies, we aim to identify a robust option that meets both objectives under a wide range of hydrological conditions in an uncertain future. To examine these trade-offs, we modelled engineering and ecological performance metrics over a range of future climates, subject to four hypotheti-cal management options: (1) maintain status quo (SQ), that is, cur-rent levee height and reservoir operating rules; (2) re-operate the reservoir (RR) by modifying existing reservoir operation rules to allow for increased emergency flow releases during the growing sea-son, which would increase reservoir capacity for capturing storm runoff; (3) raise existing levees (RL) to increase flood protection around Iowa City; and (4) jointly re-operate the reservoir and raise levees (RR+RL).
Developing the decision systems model (step 2, Fig. 1). We used publicly available hydro-climatic data along with reservoir opera-tions and hydraulic mapping data from the USACE (Supplementary Information) to develop a water management systems model of the Iowa River basin. We used this model to evaluate how the engi-neering performance indicator (EAC) and the ecological indicators (floodplain inundation area and flow recession rate) independently respond to climate variability (Supplementary Fig. 1). A rainfall-runoff model of the basin was calibrated with historical climate and discharge data to predict daily inflows to Coralville Reservoir. Inflows were then fed into a reservoir operations model to estimate outflows to the Iowa River below the dam. Next, a river hydraulics model was used to estimate the daily downstream inundation area as a function of river discharge to allow estimation of annual costs (US$), floodplain inundation and flow recession rates. The systems model was modified for each of the four management strategies by specifying higher levees and/or alternative reservoir operation rules.
Vulnerability analysis (steps 3 and 4, Fig. 1). We generated a large stochastic input series of climate data64 with altered mean tempera-ture, mean precipitation and daily precipitation coefficient of vari-ation (Supplementary Information). Simulated data were then fed into the decision systems model (Supplementary Fig. 1) to evaluate performance outcomes under specified management options and climate futures. Results of the vulnerability analysis were plotted across the range of climate variables relevant to flood risk manage-ment. As our primary demonstration of the EEDS framework, we evaluated how thresholds in performance indicators responded
to deviation in predicted mean annual discharge and daily precipitation coefficient of variation (CV), two hydro-climatic vari-ables of relevance in flood forecasting. As an alternative analysis, we explored vulnerability in a future climate space directly compara-ble to GCM climate projections, in which system performance was evaluated over a range of predicted mean annual temperature and mean annual precipitation values (Supplementary Information).
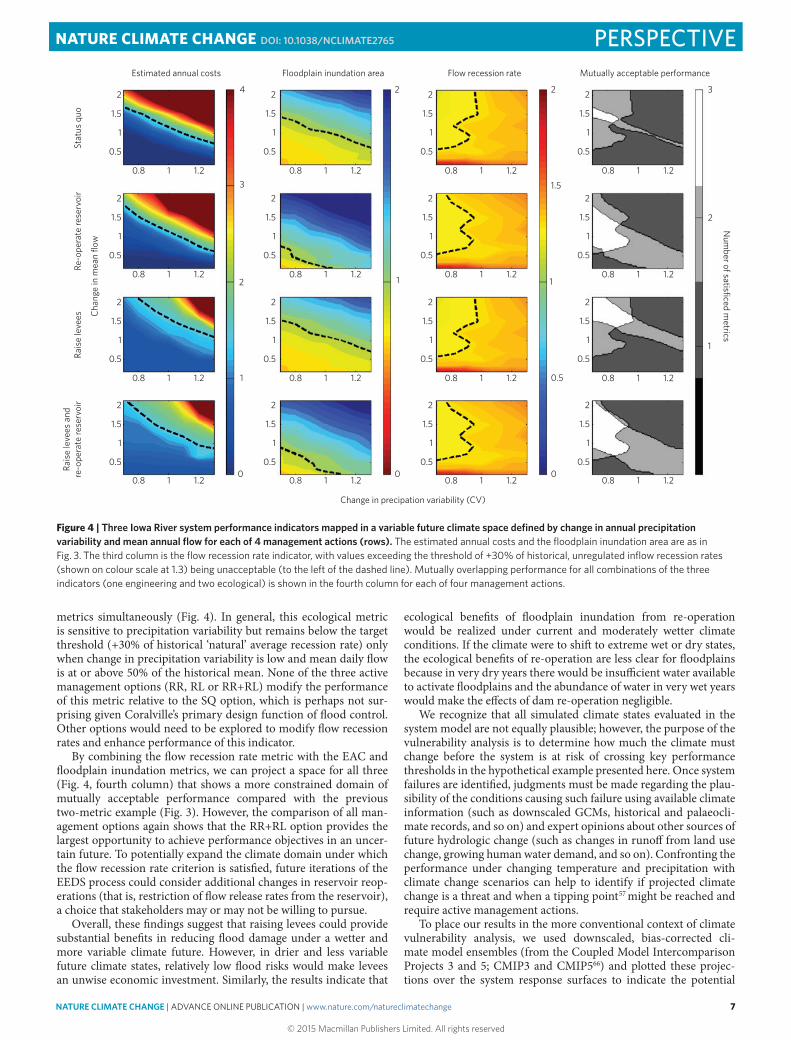
Our results (Fig. 3) show how changes to the two hydro-climatic variables (displayed as orthogonal axes) affect system performance and potentially cross stakeholder-defined vulnerability thresholds. Each pixel represents a climate state simulated through the systems model. The engineering indicator (EAC, first column of Fig. 3) and the ecological indicator (floodplain inundation, second column) are plotted in a future climate state space defined by change in aver-age annual daily flow and the variability of the daily precipitation series for each of the four management options. The indicators are expressed as the magnitude of change relative to mean histori-cal conditions. The third column in Fig. 3 displays the domain of ‘mutually acceptable performance’, delineated by the white area that satisfies both the acceptable EAC and floodplain inundation perfor-mance criteria. In Fig. 4, the flow recession metric (third column) is included with the EAC and floodplain metrics to evaluate multiple-metric responses to the four management options. The shaded plots in the fourth column of Fig. 4 show the mutually acceptable perfor-mance for all three indicators. The mutually acceptable space can be quantified and, if desired, probabilities assigned65. Here, visual inspection is sufficient.
Iowa RiverCoralville Lake2008 floodIowa City
0 2 4 8 12 16Miles
N
Figure 2 | Iowa River study area near Iowa City, Iowa, USA. This map shows Coralville Dam with flooding spillways and the extent of the 2008 flood that breached some levees in Iowa City (urban footprint shown in grey) and extensively inundated downstream floodplain farmland and riparian habitats (dark blue).
PERSPECTIVENATURE CLIMATE CHANGE DOI: 10.1038/NCLIMATE2765
© 2015 Macmillan Publishers Limited. All rights reserved

6 NATURE CLIMATE CHANGE | ADVANCE ONLINE PUBLICATION | www.nature.com/natureclimatechange
Evaluation of trade-off space with alternative decision options (steps 4 and 5, Fig. 1). We evaluate the premise that the system can be managed to meet both engineering and ecological objectives by examining the independent and joint responses of performance metrics to the different management options in Figs 3 and 4.
Figure 3 shows that for all four management options, the EAC metric is more likely to exceed the acceptable threshold level (dashed line) as precipitation CV increases (more frequent, large floods) and as average annual flow increases (wetter conditions). The floodplain performance indicator shows the reverse pattern, with wetter, more variable precipitation leading to greater flood-plain inundation. Superimposing the EAC and floodplain inun-dation response surfaces reveals a domain of mutually acceptable performance (white space in the third column of Fig. 3). The SQ management strategy affords little overlap in mutually acceptable climate space. Similarly, the RR strategy has virtually no effect on the system’s engineering performance relative to SQ. There is, however, a slight contraction in the climate space associated with catastrophic flood damages, that is, those that are most expensive (for example, ≥4 times the historical EAC).
In contrast, the ecological floodplain performance indicator is significantly enhanced under the RR strategy, with floodplain inundation areas greater than mean historical conditions for all but the driest and least variable of simulated climate futures. The RL management action greatly reduces the vulnerability to unaccepta-ble flood damage relative to SQ, yet it has no detectable effect on floodplain inundation. Only under wetter, more variable climates would floodplain inundation exceed the performance threshold under the RL action. When levees are raised in combination with reservoir re-operation (RR+RL), slightly higher costs are projected for EAC compared to the RL option (due to crop-damage costs incurred by controlled flood releases); however, floodplain inunda-tion is achieved fully as in the RR option, so that the overall domain of mutually acceptable performance is larger than all other options (white space in Fig. 3). Thus, the RR+RL action would provide the most robust management strategy for an uncertain future, that is, it would satisfy economic (EAC) and ecological (floodplain inunda-tion) goals over the broadest range of hydro-climate states.
Inclusion of the flow recession rate metric allows evaluation of prospects for achieving sustainable management for more than two
Figure 3 | Two Iowa River system performance indicators mapped in a variable future climate space defined by change in annual precipitation variability and mean annual flow for each of 4 management actions (rows). The first column shows estimated annual costs (engineering performance indicator), expressed as values relative to the historical long-term (1959–2010) mean, with values exceeding the threshold (dashed line) of 1.5-times the historical level (shown by colour scale) being unacceptable. The second column indicates the floodplain inundation area (ecological performance indicator), with values falling below the threshold (dashed line) value of the historical mean (shown on colur scale at 1.0) deemed unacceptable for floodplain inundation. The overlapping domain of mutually acceptable performance for the two indicators is shown as white space in column 3.
Estimated annual costs Floodplain inundation area Mutually acceptable performance
2
1.5
1
0.5
2
1.5
1
0.5
2
1.5
1
0.5
2
1.5
1
0.5
2
1.5
1
0.5
2
1.5
1
1 1
1
0 0 0
0.5
2
1.5
1
0.5
2
1.5
1
0.5
2
1.5
1
0.5
2
1.5
1
0.5
2
1.5
1
0.5
2
1.5
1
0.5
22
2
4
3
Cha
nge
in m
ean
flow
Stat
us q
uoRe
-ope
rate
rese
rvoi
rRa
ise
leve
esRa
ise
leve
es a
ndre
-ope
rate
rese
rvoi
r
Change in precipation variability (CV)
0.8 1 1.2
0.8 1 1.2
0.8 1 1.2
0.8 1 1.2 0.8 1 1.2
0.8 1 1.2
0.8 1 1.2
0.8 1 1.2
0.8 1 1.2
0.8 1 1.2
0.8 1 1.2
0.8 1 1.2
Num
ber of satisficed metrics
PERSPECTIVE NATURE CLIMATE CHANGE DOI: 10.1038/NCLIMATE2765
© 2015 Macmillan Publishers Limited. All rights reserved
NATURE CLIMATE CHANGE | ADVANCE ONLINE PUBLICATION | www.nature.com/natureclimatechange 7
metrics simultaneously (Fig. 4). In general, this ecological metric is sensitive to precipitation variability but remains below the target threshold (+30% of historical ‘natural’ average recession rate) only when change in precipitation variability is low and mean daily flow is at or above 50% of the historical mean. None of the three active management options (RR, RL or RR+RL) modify the performance of this metric relative to the SQ option, which is perhaps not sur-prising given Coralville’s primary design function of flood control. Other options would need to be explored to modify flow recession rates and enhance performance of this indicator.
By combining the flow recession rate metric with the EAC and floodplain inundation metrics, we can project a space for all three (Fig. 4, fourth column) that shows a more constrained domain of mutually acceptable performance compared with the previous two-metric example (Fig. 3). However, the comparison of all man-agement options again shows that the RR+RL option provides the largest opportunity to achieve performance objectives in an uncer-tain future. To potentially expand the climate domain under which the flow recession rate criterion is satisfied, future iterations of the EEDS process could consider additional changes in reservoir reop-erations (that is, restriction of flow release rates from the reservoir), a choice that stakeholders may or may not be willing to pursue.
Overall, these findings suggest that raising levees could provide substantial benefits in reducing flood damage under a wetter and more variable climate future. However, in drier and less variable future climate states, relatively low flood risks would make levees an unwise economic investment. Similarly, the results indicate that
ecological benefits of floodplain inundation from re-operation would be realized under current and moderately wetter climate conditions. If the climate were to shift to extreme wet or dry states, the ecological benefits of re-operation are less clear for floodplains because in very dry years there would be insufficient water available to activate floodplains and the abundance of water in very wet years would make the effects of dam re-operation negligible.
We recognize that all simulated climate states evaluated in the system model are not equally plausible; however, the purpose of the vulnerability analysis is to determine how much the climate must change before the system is at risk of crossing key performance thresholds in the hypothetical example presented here. Once system failures are identified, judgments must be made regarding the plau-sibility of the conditions causing such failure using available climate information (such as downscaled GCMs, historical and palaeocli-mate records, and so on) and expert opinions about other sources of future hydrologic change (such as changes in runoff from land use change, growing human water demand, and so on). Confronting the performance under changing temperature and precipitation with climate change scenarios can help to identify if projected climate change is a threat and when a tipping point57 might be reached and require active management actions.
To place our results in the more conventional context of climate vulnerability analysis, we used downscaled, bias-corrected cli-mate model ensembles (from the Coupled Model Intercomparison Projects 3 and 5; CMIP3 and CMIP566) and plotted these projec-tions over the system response surfaces to indicate the potential
Cha
nge
in m
ean
flow
Stat
us q
uoRe
-ope
rate
rese
rvoi
rRa
ise
leve
esRa
ise
leve
es a
ndre
-ope
rate
rese
rvoi
rEstimated annual costs Floodplain inundation area Mutually acceptable performanceFlow recession rate
Change in precipation variability (CV)
Num
ber of satisficed metrics
2
1.5
1
0.5
0.8 1 1.2 0.8 1 1.2 0.8 1 1.2 0.8 1 1.2
0.8 1 1.2
0.8 1 1.2
0.8 1 1.20.8 1 1.20.8 1 1.20.8 1 1.2
0.8 1 1.20.8 1 1.20.8 1 1.2
0.8 1 1.20.8 1 1.20.8 1 1.2
2
1.5
1
0.5
2
1.5
1
0.5
2
1.5
1
0.5
2
2
3
324 2
2
1.5
1
0.5
2
1.5
1
1
1 1
1.5
1
0.5
2
1.5
1
0.5
0.5
000
2
1.5
1
0.5
2
1.5
1
0.5
2
1.5
1
0.5
2
1.5
1
0.5
2
1.5
1
0.5
2
1.5
1
0.5
2
1.5
1
0.5
2
1.5
1
0.5
2
1.5
1
0.5
Figure 4 | Three Iowa River system performance indicators mapped in a variable future climate space defined by change in annual precipitation variability and mean annual flow for each of 4 management actions (rows). The estimated annual costs and the floodplain inundation area are as in Fig. 3. The third column is the flow recession rate indicator, with values exceeding the threshold of +30% of historical, unregulated inflow recession rates (shown on colour scale at 1.3) being unacceptable (to the left of the dashed line). Mutually overlapping performance for all combinations of the three indicators (one engineering and two ecological) is shown in the fourth column for each of four management actions.
PERSPECTIVENATURE CLIMATE CHANGE DOI: 10.1038/NCLIMATE2765
© 2015 Macmillan Publishers Limited. All rights reserved

8 NATURE CLIMATE CHANGE | ADVANCE ONLINE PUBLICATION | www.nature.com/natureclimatechange
range of plausible future climate changes experienced in the Iowa River system by 2050 (Supplementary Fig. 3). These GCM projec-tions suggest that the system is vulnerable to climate change and that the RR+RL action is favoured for reducing economic and ecological risks to projected climate changes over the next several decades.
Ultimately, decision makers in this system would have to assess the costs, benefits and political will to implement new flood con-trol alternatives. In our example, it seems that raising the levees and changing operations confers the greatest robustness to climate change uncertainty. Timing of decisions and rates of change of cli-mate are issues of detail that must be addressed by policy makers and stakeholders as they implement EEDS (or any form of adaptive management) in real-world applications, similar to the climate-risk planning effort undertaken in the Great Lakes32. For example, the resources required to implement reservoir reoperations are likely to be less than constructing new levees, as well as being reversible, suggesting that a staged implementation approach may be appropri-ate. This could be potentially triggered by evidence of worsening cli-mate conditions, as has been described by the ‘adaptation pathways’ approach, an emerging policy-analysis tool67,68.
EEDS as a foundation for sustainable managementDeep uncertainty about future hydrology undermines traditional approaches for the design and operation of water infrastructure to achieve ‘reliable’ performance29,30 and poses an unprecedented chal-lenge for sustaining healthy, resilient freshwater ecosystems. On a global scale, current infrastructure (dams and irrigation works) is extensive and a significant driver of freshwater ecosystem deg-radation16,60,69–71. Historical evidence clearly indicates that human decisions on the design, location and operation (or reoperation) of water infrastructure such as dams will have both immediate and long-term effects on the health and resilience of freshwater ecosys-tem function and biodiversity72,73. Given the inevitability of much new and redesigned water infrastructure, a new spirit of coopera-tion and collaboration among water resource engineers and con-servation ecologists is needed to improve design and operate water infrastructure efficiently to meet both human and ecosystem needs in a socially acceptable and sustainable way.
EEDS is a framework that can provide a transparent process for operationalizing sustainable water management through inte-gration of socio-environmental objectives in a decision-oriented vulnerability assessment framework. This approach has several strengths. First, it is designed to manage risk of uncertainty and provide guidance to managers and decision makers by focusing on the vulnerability of engineering and ecological indicators to a range of hydrologic futures. It does not rely solely on downscaled GCM projections to assess climate risks but can include a wide range of sources of hydrologic non-stationarity, including historical and pal-aeoclimate records and modelled land-use change information and changing water allocations.
Second, EEDS represents only a relatively small adjustment to the existing water management decision-making processes. The key change is in assessing ecosystem vulnerabilities equally and early in the design process, so that trade-offs can be identified and addressed accurately in the beginning of the planning process and thus help inform social choices55. While engineering objectives of a project may sometimes be perceived as irreconcilable with ecologi-cal performance targets, it is possible that strategies for satisfying even modest ecological objectives may improve economic perfor-mance of water infrastructure systems, as has been shown with the restoration of coastal wetlands for wave-surge protection74 and the incorporation of floodplains and wetlands in flood design61. Other non-hydrological applications of EEDS are possible, such as design-ing and operating dams to minimize harmful distortions in water temperature and sediment regimes that have quantifiable down-stream ecological impacts. EEDS might also be used to identify
when proposed water management designs are not compatible with socially valued ecological features. Similarly, EEDS could con-ceivably be applied to a range of non-aquatic engineering design questions where engineering and ecological trade-offs are signifi-cant. Regardless of the specific project context, a full exploration of decision consequences on multiple performance indicators in a for-mal analytical framework can promote informed and transparent decision-making by enabling discussion about mutually satisfying solutions in water management planning and infrastructure design.
Third, the EEDS framework can help inform a wide variety of management decisions that need to balance ecosystem sustain-ability with desired economic objectives. Ecological performance objectives can be construed broadly; for example, from economi-cally valuable fisheries to a highly desirable environmental amenity that has significant non-market value for stakeholders. As such, the decision framework is structured in a way that is relevant to those who are affected by planning and decisions. The EEDS framework is also well suited to ‘scale up’ to whole-basin planning to evaluate how planned infrastructure projects could meet both economic per-formance and ecosystem services under changing climate and water development in large rivers in the developing world72.
Finally, the EEDS framework can inform decisions regarding existing water infrastructure systems, such as reoperation of down-stream discharge releases from dams (as illustrated in our Iowa River case study), or decommissioning of projects. In developed countries such as the United States, thousands of dams built in the early to mid twentieth century no longer provide their intended benefits due to infrastructure decay, the loss of storage capacity from sedi-ment accumulation and increased hazard risk owing to downstream development63. The convergence of ageing infrastructure with grow-ing concern over trends of environmental degradation is providing unprecedented opportunities for ecosystem restoration64. However, climate change and uncertainty about ecosystem responses to infrastructure modification or removal make it difficult to identify economically and environmentally acceptable strategies. Similarly, there is growing interest in the re-operation of functioning water infrastructure as a mechanism to buffer aquatic and riparian ecosys-tems against climate change in regulated rivers14. EEDS analysis can provide an operational framework for evaluating the consequences of different management options by explicitly quantifying trade-offs among engineering design options and environmental objectives under plausible ranges of hydrologic non-stationarity.
ConclusionIntegrated water resources management for both human economic needs and ecosystem health is increasingly recognized as essential to societal well-being20,75. However, progress towards more sustain-able forms of water management is hampered by conflicting inter-ests, existing economic policies, inflexible infrastructure design and a lack of quantitative, transparent tools to facilitate critical decision-making. Debates around the construction of water infrastructure are long-standing4,35 and will no doubt continue in the face of exten-sive proposed dam building globally2. Our aim here is not to advo-cate for or against the necessity of water infrastructure, but rather to argue that, in those situations where water infrastructure will be constructed or re-operated, a new paradigm of sustainable water management is needed, one that can be more effectively achieved when conservation ecologists collaboratively engage with water resources engineers to incorporate ecosystem performance goals in the decision-making process.
A key continuing challenge for rational water resource manage-ment is to provide a practical approach to assist planners and deci-sion makers in navigating complex problems and diverse interest groups who are confronted by uncertain and changing conditions. As effective adaptive decision-making is most likely to succeed where stakeholders are fully engaged, we believe the EEDS offers the
PERSPECTIVE NATURE CLIMATE CHANGE DOI: 10.1038/NCLIMATE2765
© 2015 Macmillan Publishers Limited. All rights reserved

NATURE CLIMATE CHANGE | ADVANCE ONLINE PUBLICATION | www.nature.com/natureclimatechange 9
potential to serve as the foundation of a new management platform that advances freshwater sustainability while meeting human needs for water. Further refinement could include how to accommodate future changes in societal cost functions (for example, due to popu-lation growth) and shifts in ecological requirements under transient climate and socio-economic conditions, as well as how to sequence management actions in a fashion that promotes long-term success. One promising future possibility is to link EEDS with emerging techniques that help to identify when adaptation actions should be taken, such as the adaptation tipping point approach57, as well as with techniques that help to identify alternative adaptation routes, such as dynamic adaptation pathways approaches68,76. Managing the future will necessarily occur in an adaptive context; therefore, equally robust monitoring and evaluation plans will be needed to ensure that decisions are drawing upon the best available infor-mation when evaluating the consequences of alternative decision options and management strategies.
Received 25 February 2015; accepted 21 July 2015; published online 14 September 2015
References1. International Commission on Large Dams (2014); http://www.icold-cigb.org2. Zarfl, C., Lumsdon, A., Berlekamp, J., Tydecks, L. & Tockner, K. A global boom
in hydropower dam construction. Aquat. Sci. 77, 161–170 (2014).3. Stakhiv, E. Z. Pragmatic approaches for water management under climate
change uncertainty. J. Am. Water Resour. Assoc. 47, 1183–1196 (2011).4. Ansar, A., Flyvbjerg, B., Budzier, A. & Lunn, D. Should we build more large
dams? The actual costs of hydropower megaproject development. Energy Policy 69, 43–56 (2014).
5. World Commission on Dams Dams and Development: A New Framework for Decision-Making (Earthscan, 2000).
6. Water and Climate Change Adaptation: Policies to Navigate Uncharted Waters (OECD, 2013).
7. Pearce, D., Atkinson, G. & Mourato, S. Cost-Benefit Analysis and the Environment: Recent Developments (OECD, 2006).
8. Brown, P. H., Tullos, D., Tilt, B., Magee, D. & Wolf, A. T. Modeling the costs and benefits of dam construction from a multidisciplinary perspective. J. Environ. Manage. 90, S303–S311 (2009).
9. Richter, B. D. et al. Lost in development’s shadow: The downstream human consequences of dams. Water Alternat. 3, 14–42 (2010).
10. Liermann, C. R., Nilsson, C., Robertson, J. & Ng, R. Y. Implications of dam obstruction for global freshwater fish diversity. BioScience 62, 539–548 (2012).
11. Auerbach, D. A., Deisenroth, D. B., McShane, R. R., McCluney, K. E. & Poff, N. L. Beyond the concrete: Accounting for ecosystem services from free-flowing rivers. Ecosyst. Serv. 10, 1–5 (2014).
12. Tockner, K. & Stanford, J. A. Riverine flood plains: present state and future trends. Environ. Conserv. 29, 308–330 (2002).
13. Olden, J. D. et al. Are large-scale flow experiments informing the science and management of freshwater ecosystems? Front. Ecol. Environ. 12, 176–185 (2014).
14. Watts, R. J., Richter, B. D., Opperman, J. J. & Bowmer, K. H. Dam reoperation in an era of climate change. Mar. Freshwater Res. 62, 321–327 (2011).
15. Lovett, R. A. Dam removals: Rivers on the run. Nature 511, 521–523 (2014).16. Vörösmarty, C. J. et al. Global threats to human water security and river
biodiversity. Nature 467, 555–561 (2010).17. Lehner, B. et al. High-resolution mapping of the world’s reservoirs and dams
for sustainable river-flow management. Front. Ecol. Environ. 9, 494–502 (2011).18. Millennium Ecosystem Assessment Ecosystems and Human Well-Being: Wetlands
and Water Synthesis (World Resources Institute, 2005).19. Griggs, D. et al. Policy: Sustainable development goals for people and planet.
Nature 495, 305–307 (2013).20. Rockström, J. et al. The unfolding water drama in the Anthropocene: Towards
a resilience-based perspective on water for global sustainability. Ecohydrology 7, 1249–1261 (2014).
21. National Action Plan: Priorities for Managing Freshwater Resources in a Changing Climate (Interagency Climate Change Adaptation Task Force, 2011).
22. Directive 2000/60/EC of the European Parliament and of the Council of 23 October 2000 Establishing a Framework for Community Action in the Field of Water Policy (European Commission, 2000).
23. Ecological Flows in the Implementation of the Water Framework Directive (European Commission, 2015).
24. National Water Initiative (Australian National Water Commission, 2005).
25. Folke, C. et al. Resilience thinking: Integrating resilience, adaptability and transformability. Ecology and Society 15, 20 (2010).
26. Pittock, J. & Lankford, B. A. Environmental water requirements: Demand managment in an era of water scarcity. J. Integr. Environ. Sci. 7, 75–93 (2010).
27. Gleick, P. H. Global freshwater resources: Soft-path solutions for the 21st century. Science 302, 1524–1528 (2003).
28. Tzoulas, K. et al. Promoting ecosystem and human health in urban areas using Green Infrastructure: A literature review. Landscape Urban Plan. 81, 167–178 (2007).
29. Milly, P. C. D. et al. Stationarity is dead: Whither water management? Science 319, 573–574 (2008).
30. Brown, C. The end of reliability. J. Water Resour. Plan. Manage. 136, 143–145 (2010).
31. Hallegatte, S. Strategies to adapt to an uncertain climate change. Glob. Environ. Change 19, 240–247 (2009).
32. Haasnoot, M., Middelkoop, H., Van Beek, E. & Van Deursen, W. A method to develop sustainable water management strategies for an uncertain future. Sustain. Dev. 19, 369–381 (2011).
33. Walker, W. E., Haasnoot, M. & Kwakkel, J. H. Adapt or perish: A review of planning approaches for adaptation under deep uncertainty. Sustainability 5, 955–979 (2013).
34. Reuss, M. Ecology, planning, and river management in the United States: Some historical reflections. Ecol. Soc. 10, 34 (2005).
35. Muller, M. The ‘nexus’ as a step back towards a more coherent water resource management paradigm. Water Alternat. 8, 675–694 (2015).
36. La Quesne, T., Kendy, E. & Weston, D. The Implementation Challenge: Taking Stock of Government Policies to Protect and Restore Environmental Flows (World Wildlife Fund, 2010).
37. Pahl-Wostl, C. et al. Environmental flows and water governance: Managing sustainable water uses. Curr. Op. Environ. Sustain. 5, 341–351(2013).
38. Brown, C., Ghile, Y., Laverty, M. & Li, K. Decision scaling: Linking bottom-up vulnerability analysis with climate projections in the water sector. Water Resour. Res. 48, W09537 (2012).
39. Brown, C., Werick, W., Leger, W. & Fay, D. A decision-analytic approach to managing climate risks: application to the upper Great Lakes. J. Am. Water Resour. Assoc. 47, 524–534 (2011).
40. Stainforth, D. A., Allen, M. R., Tredger, E. R. & Smith, L. A. Confidence, uncertainty and decision-support relevance in climate predictions. Phil. Trans. R. Soc. A 365, 2145–2161 (2007).
41. Rocheta, E., Sugiyanto, M., Johnson, F., Evans, J. & Sharma, A. How well do general circulation models represent low-frequency rainfall variability? Water Resour. Res. 50, 2108–2123 (2014).
42. Sun, Y., Solomon, S., Dai, A. & Portmann, R. W. How often does it rain? J. Clim. 19, 916–934 (2006).
43. Wilby, R. L. & Dessai, S. Robust adaptation to climate change. Weather 65, 180–185 (2010).
44. Weaver, C. P. et al. Improving the contribution of climate model information to decision making: The value and demands of robust decision frameworks. WIREs Clim. Change 4, 39–60 (2013).
45. Steinschneider, S., Wi, S. & Brown, C. The integrated effects of climate and hydrologic uncertainty on future flood risk assessments. Hydrol. Process. 29, 2823–2839 (2014).
46. Ghile, Y., Taner, M., Brown, C., Grijsen, J. & Talbi, A. Bottom-up climate risk assessment of infrastructure investment in the Niger River Basin. Climatic Change 122, 97–110 (2014).
47. Singh, R., Wagener, T., Crane, R., Mann, M. & Ning, L. A vulnerability driven approach to identify adverse climate and land use change combinations for critical hydrologic indicator thresholds: Application to a watershed in Pennsylvania, USA. Water Resour. Res. 50, 3409–3427 (2014).
48. Aquatic Ecosystems, Water Quality, and Global Change: Challenges of Conducting Multi-Stressor Vulnerability Assessments (US Environmental Protection Agency, 2011).
49. Reed, M. S. Stakeholder participation for environmental management: A literature review. Biol. Conserv. 141, 2417–2431 (2008).
50. Poff, N. L. et al. The ecological limits of hydrologic alteration (ELOHA): A new framework for developing regional environmental flow standards. Freshwater Biol. 55, 147–170 (2010).
51. Wilby, R. L., Fenn, C. R., Wood, P. J., Timlett, R. & LeQuesne, T. Smart licensing and environmental flows: Modeling framework and sensitivity testing. Water Resour. Res. 47, W12524 (2011).
52. Gregory, R. et al. Structured Decision Making: A Practical Guide to Environmental Management Choices (John Wiley & Sons, 2012).
53. Moody, P. & Brown, C. Modeling stakeholder-defined climate risk on the Upper Great Lakes. Water Resour. Res. 48, W10525 (2012).
54. Moody, P. & Brown, C. Robustness indicators for evaluation under climate change: Application to the upper Great Lakes. Water Resour. Res. 49, 3576–3588 (2013).
PERSPECTIVENATURE CLIMATE CHANGE DOI: 10.1038/NCLIMATE2765
© 2015 Macmillan Publishers Limited. All rights reserved

10 NATURE CLIMATE CHANGE | ADVANCE ONLINE PUBLICATION | www.nature.com/natureclimatechange
55. Kareiva, P. M. Dam choices: Analyses for multiple needs. Proc. Natl Acad. Sci. USA 109, 5553–5554 (2012).
56. Armah, J. et al. Principles and Guidelines for Evaluating Federal Water Projects: US Army Corps of Engineers Planning and the Use of Benefit Cost Analysis (Report for the Congressional Research Service, 2009).
57. Kwadijk, J. C. et al. Using adaptation tipping points to prepare for climate change and sea level rise: a case study in the Netherlands. Wiley Interdisc. Rev. Climate Change 1, 729–740 (2010).
58. Millennium Ecosystem Assessment. Ecosystems and Human Well-Being: General Synthesis (World Resources Institute, 2005).
59. Poff, N. L. et al. The natural flow regime. BioScience 47, 769–784 (1997).60. Bunn, S. E. & Arthington, A. H. Basic principles and ecological consequences
of altered flow regimes for aquatic biodiversity. Environ. Manage. 30, 492–507 (2002).
61. Opperman, J. J., Luster, R., McKenney, B. A., Roberts, M. & Meadows, A. W. Ecologically functional floodplains: connectivity, flow regime, and scale. J. Am. Water Resour. Assoc. 46, 211–226 (2010).
62. Nilsson, C. & Svedmark, M. Basic principles and ecological consequences of changing water regimes: Riparian plant communities. Environ. Manage. 30, 468–480 (2002).
63. Cushman, R. M. Review of ecological effects of rapidly varying flows downstream from hydroelectric facilities. N. Am. J. Fish. Manage. 5, 330–339 (1985).
64. Steinschneider, S. & Brown, C. A semiparametric multivariate, multisite weather generator with low-frequency variability for use in climate risk assessments. Water Resour. Res. 49, 7205–7220 (2013).
65. Whateley, S., Steinschneider, S. & Brown, C. A climate change range-based method for estimating robustness for water resources supply. Water Resour. Res. 50, 8944–8961 (2014).
66. Maurer, E., Wood, A., Adam, J., Lettenmaier, D. & Nijssen, B. A long-term hydrologically based dataset of land surface fluxes and states for the conterminous United States. J. Climate 15, 3237–3251 (2002).
67. Haasnoot, M., Middelkoop, H., Offermans, A., Van Beek, E. & Van Deursen, W. Exploring pathways for sustainable water management in river deltas in a changing environment. Climatic Change 115, 795–819 (2012).
68. Ranger, N., Reeder, T. & Lowe, J. Addressing ‘deep’ uncertainty over long-term climate in major infrastructure projects: Four innovations of the Thames Estuary 2100 Project. EURO J. Decis. Process. 1, 233–262 (2013).
69. Grill, G. et al. An index-based framework for assessing patterns and trends in river fragmentation and flow regulation by global dams at multiple scales. Environ. Res. Lett. 10, 015001 (2015).
70. Dudgeon, D. et al. Freshwater biodiversity: Importance, threats, status and conservation challenges. Biol. Rev. 81, 163–182 (2006).
71. Poff, N. L., Olden, J. D., Merritt, D. M. & Pepin, D. M. Homogenization of regional river dynamics by dams and global biodiversity implications. Proc. Natl Acad. Sci. USA 104, 5732–5737 (2007).
72. Jager, H. I., Efroymson, R. A., Opperman, J. J. & Kelly, M. R. Spatial design principles for sustainable hydropower development in river basins. Renew. Sust. Energ. Rev. 45, 808–816 (2015).
73. Poff, N. L. Rivers of the Anthropocene? Front. Ecol. Environ. 12, 427–427 (2014).74. Gedan, K., Kirwan, M., Wolanski, E., Barbier, E. & Silliman, B. The present and
future role of coastal wetland vegetation in protecting shorelines: Answering recent challenges to the paradigm. Climatic Change 106, 7–29 (2011).
75. The Brisbane Declaration: Environmental Flows are Essential for Freshwater Ecosystem Health and Human Well-being (10th Int. River Symp., 2007); http://go.nature.com/MgROdG
76. Haasnoot, M., Kwakkel, J. H., Walker, W. E. & ter Maat, J. Dynamic adaptive policy pathways: A method for crafting robust decisions for a deeply uncertain world. Glob. Environ. Change 23, 485–498 (2013).
77. Hallegatte, S., Shah, A., Lempert, R., Brown, C. & Gill, S. Investment Decision Making Under Deep Uncertainty: Application to Climate Change (World Bank Group, 2012).
78. Wiens, J. A. & Hobbs, R. J. Integrating conservation and restoration in a changing world. BioScience 65, 302–312 (2015).
79. Humphries, P. & Winemiller, K. O. Historical impacts on river fauna, shifting baselines, and challenges for restoration. BioScience 59, 673–684 (2009).
80. Acreman, M. et al. Environmental flows for natural, hybrid, and novel riverine ecosystems in a changing world. Front. Ecol. Environ. 12, 466–473 (2014).
81. Moyle, P. B. Novel aquatic ecosystems: The new reality for streams in California and other mediterranean climate regions. River Res. Appl. 30, 1335–1344 (2013).
82. Allen, C. R., Cumming, G. S., Garmestani, A. S., Taylor, P. D. & Walker, B. H. Managing for resilience. Wildlife Biol. 17, 337–349 (2011).
83. Hobbs, R. J., Higgs, E. & Harris, J. A. Novel ecosystems: implications for conservation and restoration. Trends Ecol. Evol. 24, 599–605 (2009).
84. Richter, B. D., Mathews, R., Harrison, D. L. & Wigington, R. Ecologically sustainable water management: Managing river flows for ecological integrity. Ecol. Appl. 13, 206–224 (2003).
85. Arthington, A. H. Environmental Flows: Saving Rivers in the Third Millennium (Univ. California Press, 2012).
86. Suen, J-P. & Eheart, J. W. Reservoir management to balance ecosystem and human needs: Incorporating the paradigm of the ecological flow regime. Water Resour. Res. 42, W03417 (2006).
87. Yin, X-A., Yang, Z-F. & Petts, G. E. Reservoir operating rules to sustain environmental flows in regulated rivers. Water Resour. Res. 47, W08509 (2011).
88. Hermoso, V. et al. Systematic planning for river rehabilitation: integrating multiple ecological and economic objectives in complex decisions. Freshwater Biol. 57, 1–9 (2012).
89. Water Evaluation and Planning (WEAP) System (Stockholm Environment Institute, accessed 21 April 2014); http://www.weap21.org
90. Liang, X., Lettenmaier, D. P., Wood, E. F. & Burges, S. J. A simple hydrologically based model of land surface water and energy fluxes for GSMs, J. Geophys. Res. 99(D7), 14415–14428 (1994).
91. Cuo, L., Lettenmaier, D. P., Mattheussen, B. V., Storck, P. & Wiley, M. Hydrologic prediction for urban watersheds with the Distributed Hydrology-Soil-Vegetation Model. Hydrol. Process. 22, 4205–4213 (2008).
92. Schoeman, J., Allan, C. & Finlayson, C. M. A new paradigm for water? A comparative review of integrated, adaptive and ecosystem-based water management in the Anthropocene. Int. J. Water Resour. Dev. 30, 377–390 (2014).
AcknowledgementsWe acknowledge S. Steinschneider for developing the stochastic weather generator for the Iowa River Basin; S. Wi for the VIC hydrologic model development; D. LeFever for support in developing the reservoir systems model; and R. Olsen for his help in providing hydraulic modelling tools and economic information for the Coralville Lake flood control system. Special thanks to P. Clark for artwork in Fig. 1. Additional support for C.M.B. and C.M.S was provided by the NSF CAREER Award (CBET-1054762). The views in this article are those of the authors and do not necessarily represent the views of the OECD or its member countries. This article has been peer reviewed and approved for publication consistent with USGS Fundamental Science Practices (http://pubs.usgs.gov/circ/1367/) and we thank J. Friedman of the USGS for his constructive comments. Any use of trade, firm, or product names is for descriptive purposes only and does not imply endorsement by the U.S. Government. This paper resulted from a synthesis project funded by the National Socio-Environmental Synthesis Center (SESYNC) under National Science Foundation Award #DBI-1052875.
Author contributionsN.L.P. and J.H.M. conceived the original project. N.L.P., T.E.G. and C.M.B. led the drafting of the text. C.M.S., C.M.B., T.E.G. and N.L.P. led the case study analysis. N.L.P, C.M.B., T.E.G., J.H.M, M.A.P., C.M.S., R.L.W., M.H., G.F.M., K.C.D. and A.B. contributed to the intellectual content through workshop participation and writing.
Additional informationSupplementary information is available in the online version of the paper. Reprints and permissions information is available online at www.nature.com/reprints. Correspondence should be addressed to N.L.P.
Competing financial interestsThe authors declare no competing financial interests.
PERSPECTIVE NATURE CLIMATE CHANGE DOI: 10.1038/NCLIMATE2765
© 2015 Macmillan Publishers Limited. All rights reserved

1
Sustainable water management under future uncertainty with eco-‐engineering decision scaling
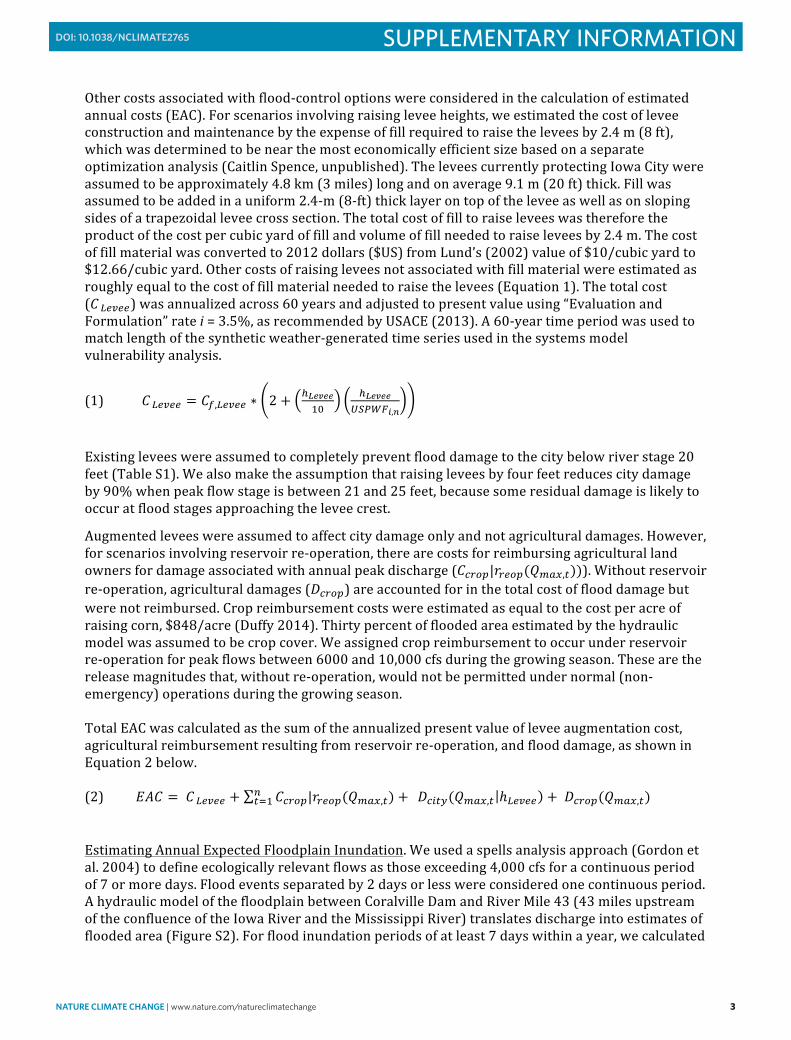
Decision Systems Model. The Eco-‐Engineering Decision Scaling (EEDS) analysis was conducted using a water management systems model (Figure S1) of the Iowa River basin, Coralville Reservoir, and the downstream flood protection system for Iowa City and the surrounding towns and agricultural areas (Figure S2). A comprehensive description of the systems model is provided by Steinschneider et al. (2014). Briefly, climate inputs were translated to basin runoff using the Variable Infiltration Capacity (VIC) hydrologic model (Liang et al., 1994; Gao et al, 2010), calibrated to the study area using 62 years (1959-‐2010) of 1/8 degree resolution gridded daily precipitation and temperature data (Maurer et al. 2002) and USGS flow records at gage 05453100 at Marengo, Iowa (upstream of Coralville Reservoir). A reservoir operations model for Coralville Reservoir was then developed in MATLAB ® to simulate daily releases based on storage, previous day’s inflow, time of year, and operational rules specified in the Reservoir System Simulation (HEC-‐ResSim) model (Klipsch and Hurst 2007), provided by partners in the Army Corps of Engineers (USACE). Predicted outflows from the reservoir were then fed into HEC-‐RAS River Analysis System (Brunner 2001), a 1-‐D hydrodynamic model, to empirically characterize the relationship between discharge in the Iowa River and inundated area.
Estimated annual costs. The relationships between discharge, stage, and estimated annual damages was provided by the USACE (Table S1) to predict the monetary cost of flood damage. This table was also used to estimate damage to the city caused by flooding as well as the cost of reimbursing downstream agricultural losses associated with reservoir re-‐operation. In both cases, linear interpolation was used to map discharge to stage (water level) of a peak flood event to city and agricultural damages caused by that event. In cases in which peak flow was higher than the highest table entry, damage and stage corresponding to that flow were estimated by extrapolating from the slope between the highest two table entries.
Supplementary Figure S1. Decision systems model schematic
Sustainable water management under future uncertainty with eco-engineering decision scaling
SUPPLEMENTARY INFORMATIONDOI: 10.1038/NCLIMATE2765
NATURE CLIMATE CHANGE | www.nature.com/natureclimatechange 1
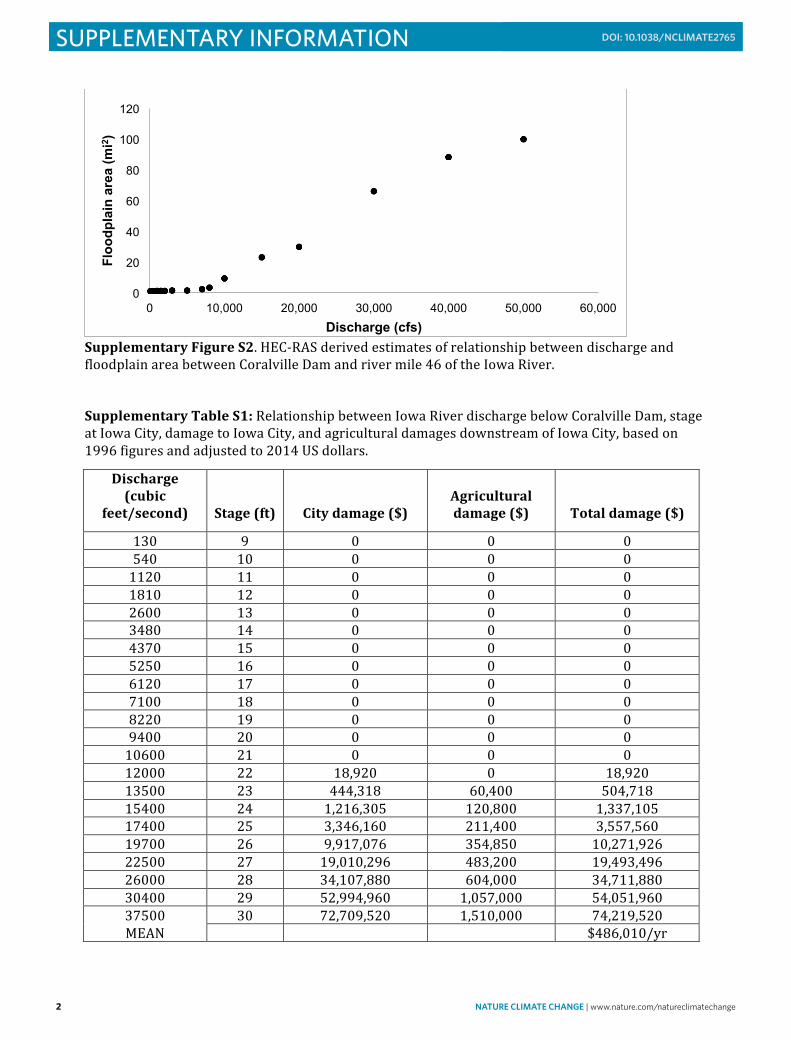
2
Supplementary Figure S2. HEC-‐RAS derived estimates of relationship between discharge and floodplain area between Coralville Dam and river mile 46 of the Iowa River. Supplementary Table S1: Relationship between Iowa River discharge below Coralville Dam, stage at Iowa City, damage to Iowa City, and agricultural damages downstream of Iowa City, based on 1996 figures and adjusted to 2014 US dollars.
Discharge (cubic
feet/second) Stage (ft) City damage ($) Agricultural damage ($) Total damage ($)
130 9 0 0 0 540 10 0 0 0 1120 11 0 0 0 1810 12 0 0 0 2600 13 0 0 0 3480 14 0 0 0 4370 15 0 0 0 5250 16 0 0 0 6120 17 0 0 0 7100 18 0 0 0 8220 19 0 0 0 9400 20 0 0 0 10600 21 0 0 0 12000 22 18,920 0 18,920 13500 23 444,318 60,400 504,718 15400 24 1,216,305 120,800 1,337,105 17400 25 3,346,160 211,400 3,557,560 19700 26 9,917,076 354,850 10,271,926 22500 27 19,010,296 483,200 19,493,496 26000 28 34,107,880 604,000 34,711,880 30400 29 52,994,960 1,057,000 54,051,960 37500 30 72,709,520 1,510,000 74,219,520 MEAN $486,010/yr
0
20
40
60
80
100
120
0 10,000 20,000 30,000 40,000 50,000 60,000
Floo
dpla
in a
rea
(mi2 )
Discharge (cfs)
3
Other costs associated with flood-‐control options were considered in the calculation of estimated annual costs (EAC). For scenarios involving raising levee heights, we estimated the cost of levee construction and maintenance by the expense of fill required to raise the levees by 2.4 m (8 ft), which was determined to be near the most economically efficient size based on a separate optimization analysis (Caitlin Spence, unpublished). The levees currently protecting Iowa City were assumed to be approximately 4.8 km (3 miles) long and on average 9.1 m (20 ft) thick. Fill was assumed to be added in a uniform 2.4-‐m (8-‐ft) thick layer on top of the levee as well as on sloping sides of a trapezoidal levee cross section. The total cost of fill to raise levees was therefore the product of the cost per cubic yard of fill and volume of fill needed to raise levees by 2.4 m. The cost of fill material was converted to 2012 dollars ($US) from Lund’s (2002) value of $10/cubic yard to $12.66/cubic yard. Other costs of raising levees not associated with fill material were estimated as roughly equal to the cost of fill material needed to raise the levees (Equation 1). The total cost (𝐶𝐶 !!"!!) was annualized across 60 years and adjusted to present value using “Evaluation and Formulation” rate i = 3.5%, as recommended by USACE (2013). A 60-‐year time period was used to match length of the synthetic weather-‐generated time series used in the systems model vulnerability analysis.
(1) 𝐶𝐶 !"#"" = 𝐶𝐶!,!"#"" ∗ 2 + !!"#""!"
!!"#""!"#$%!,!
Existing levees were assumed to completely prevent flood damage to the city below river stage 20 feet (Table S1). We also make the assumption that raising levees by four feet reduces city damage by 90% when peak flow stage is between 21 and 25 feet, because some residual damage is likely to occur at flood stages approaching the levee crest.
Augmented levees were assumed to affect city damage only and not agricultural damages. However, for scenarios involving reservoir re-‐operation, there are costs for reimbursing agricultural land owners for damage associated with annual peak discharge (𝐶𝐶!"#$|𝑟𝑟!"#$(𝑄𝑄!"#,!))). Without reservoir re-‐operation, agricultural damages (𝐷𝐷!"#$) are accounted for in the total cost of flood damage but were not reimbursed. Crop reimbursement costs were estimated as equal to the cost per acre of raising corn, $848/acre (Duffy 2014). Thirty percent of flooded area estimated by the hydraulic model was assumed to be crop cover. We assigned crop reimbursement to occur under reservoir re-‐operation for peak flows between 6000 and 10,000 cfs during the growing season. These are the release magnitudes that, without re-‐operation, would not be permitted under normal (non-‐emergency) operations during the growing season.
Total EAC was calculated as the sum of the annualized present value of levee augmentation cost, agricultural reimbursement resulting from reservoir re-‐operation, and flood damage, as shown in Equation 2 below.
(2) 𝐸𝐸𝐸𝐸𝐸𝐸 = 𝐶𝐶 !"#"" + 𝐶𝐶!"#$|𝑟𝑟!"#$(𝑄𝑄!"#,!) + !
!!! 𝐷𝐷!"#$(𝑄𝑄!"#,! ℎ!"#"" + 𝐷𝐷!"#$(𝑄𝑄!"#,!)
Estimating Annual Expected Floodplain Inundation. We used a spells analysis approach (Gordon et al. 2004) to define ecologically relevant flows as those exceeding 4,000 cfs for a continuous period of 7 or more days. Flood events separated by 2 days or less were considered one continuous period. A hydraulic model of the floodplain between Coralville Dam and River Mile 43 (43 miles upstream of the confluence of the Iowa River and the Mississippi River) translates discharge into estimates of flooded area (Figure S2). For flood inundation periods of at least 7 days within a year, we calculated
2 NATURE CLIMATE CHANGE | www.nature.com/natureclimatechange
SUPPLEMENTARY INFORMATION DOI: 10.1038/NCLIMATE2765
2
Supplementary Figure S2. HEC-‐RAS derived estimates of relationship between discharge and floodplain area between Coralville Dam and river mile 46 of the Iowa River. Supplementary Table S1: Relationship between Iowa River discharge below Coralville Dam, stage at Iowa City, damage to Iowa City, and agricultural damages downstream of Iowa City, based on 1996 figures and adjusted to 2014 US dollars.
Discharge (cubic
feet/second) Stage (ft) City damage ($) Agricultural damage ($) Total damage ($)
130 9 0 0 0 540 10 0 0 0 1120 11 0 0 0 1810 12 0 0 0 2600 13 0 0 0 3480 14 0 0 0 4370 15 0 0 0 5250 16 0 0 0 6120 17 0 0 0 7100 18 0 0 0 8220 19 0 0 0 9400 20 0 0 0 10600 21 0 0 0 12000 22 18,920 0 18,920 13500 23 444,318 60,400 504,718 15400 24 1,216,305 120,800 1,337,105 17400 25 3,346,160 211,400 3,557,560 19700 26 9,917,076 354,850 10,271,926 22500 27 19,010,296 483,200 19,493,496 26000 28 34,107,880 604,000 34,711,880 30400 29 52,994,960 1,057,000 54,051,960 37500 30 72,709,520 1,510,000 74,219,520 MEAN $486,010/yr
0
20
40
60
80
100
120
0 10,000 20,000 30,000 40,000 50,000 60,000
Floo
dpla
in a
rea
(mi2 )
Discharge (cfs)
3
Other costs associated with flood-‐control options were considered in the calculation of estimated annual costs (EAC). For scenarios involving raising levee heights, we estimated the cost of levee construction and maintenance by the expense of fill required to raise the levees by 2.4 m (8 ft), which was determined to be near the most economically efficient size based on a separate optimization analysis (Caitlin Spence, unpublished). The levees currently protecting Iowa City were assumed to be approximately 4.8 km (3 miles) long and on average 9.1 m (20 ft) thick. Fill was assumed to be added in a uniform 2.4-‐m (8-‐ft) thick layer on top of the levee as well as on sloping sides of a trapezoidal levee cross section. The total cost of fill to raise levees was therefore the product of the cost per cubic yard of fill and volume of fill needed to raise levees by 2.4 m. The cost of fill material was converted to 2012 dollars ($US) from Lund’s (2002) value of $10/cubic yard to $12.66/cubic yard. Other costs of raising levees not associated with fill material were estimated as roughly equal to the cost of fill material needed to raise the levees (Equation 1). The total cost (𝐶𝐶 !!"!!) was annualized across 60 years and adjusted to present value using “Evaluation and Formulation” rate i = 3.5%, as recommended by USACE (2013). A 60-‐year time period was used to match length of the synthetic weather-‐generated time series used in the systems model vulnerability analysis.
(1) 𝐶𝐶 !"#"" = 𝐶𝐶!,!"#"" ∗ 2 + !!"#""!"
!!"#""!"#$%!,!
Existing levees were assumed to completely prevent flood damage to the city below river stage 20 feet (Table S1). We also make the assumption that raising levees by four feet reduces city damage by 90% when peak flow stage is between 21 and 25 feet, because some residual damage is likely to occur at flood stages approaching the levee crest.
Augmented levees were assumed to affect city damage only and not agricultural damages. However, for scenarios involving reservoir re-‐operation, there are costs for reimbursing agricultural land owners for damage associated with annual peak discharge (𝐶𝐶!"#$|𝑟𝑟!"#$(𝑄𝑄!"#,!))). Without reservoir re-‐operation, agricultural damages (𝐷𝐷!"#$) are accounted for in the total cost of flood damage but were not reimbursed. Crop reimbursement costs were estimated as equal to the cost per acre of raising corn, $848/acre (Duffy 2014). Thirty percent of flooded area estimated by the hydraulic model was assumed to be crop cover. We assigned crop reimbursement to occur under reservoir re-‐operation for peak flows between 6000 and 10,000 cfs during the growing season. These are the release magnitudes that, without re-‐operation, would not be permitted under normal (non-‐emergency) operations during the growing season.
Total EAC was calculated as the sum of the annualized present value of levee augmentation cost, agricultural reimbursement resulting from reservoir re-‐operation, and flood damage, as shown in Equation 2 below.
(2) 𝐸𝐸𝐸𝐸𝐸𝐸 = 𝐶𝐶 !"#"" + 𝐶𝐶!"#$|𝑟𝑟!"#$(𝑄𝑄!"#,!) + !
!!! 𝐷𝐷!"#$(𝑄𝑄!"#,! ℎ!"#"" + 𝐷𝐷!"#$(𝑄𝑄!"#,!)
Estimating Annual Expected Floodplain Inundation. We used a spells analysis approach (Gordon et al. 2004) to define ecologically relevant flows as those exceeding 4,000 cfs for a continuous period of 7 or more days. Flood events separated by 2 days or less were considered one continuous period. A hydraulic model of the floodplain between Coralville Dam and River Mile 43 (43 miles upstream of the confluence of the Iowa River and the Mississippi River) translates discharge into estimates of flooded area (Figure S2). For flood inundation periods of at least 7 days within a year, we calculated
NATURE CLIMATE CHANGE | www.nature.com/natureclimatechange 3
SUPPLEMENTARY INFORMATIONDOI: 10.1038/NCLIMATE2765

4
the average inundation area (km2 or mi2) as the annual expected floodplain inundation value. The hydraulic effects of levees on downstream floodplains were not modeled, but levees are known to increase the velocity of water flowing in contact with their confines, potentially reducing floodplain spread downstream (Mays 2011). For the purpose of this hypothetical example, augmented levees were assumed to reduce downstream flooded area by 10% at discharges and flow stages in which the river is in contact with any newly constructed levee height.
Estimating the Flood Recession Rate. We use flow recession rate or “fall rate” downstream of the reservoir as a second ecological performance indicator. Fall rate is one of the widely used Indicators of Hydrologic Alteration (IHA), developed by Richter et al. (1996). We calculated fall rate 𝑅𝑅! by taking the mean of all negative daily flow changes, which number n, relative to previous day’s daily flow. Over a time series of discharge with days t in a total of T days, each day’s discharge 𝑄𝑄! is subtracted from the previous day’s flow 𝑄𝑄!!! and the difference was compared to 𝑄𝑄!!! when the previous day’s flow was above a certain threshold 𝑄𝑄! (Equation 3). We filtered using the threshold discharge 𝑄𝑄! and using a rate of change that was above a minimum threshold 𝑅𝑅!,!"# to avoid negligible fluctuations at low flows.
(3) 𝑅𝑅! = !!
!!!!! !!!!!!
,𝑄𝑄!!! > 𝑄𝑄!!!!! , 𝑄𝑄!!! > 𝑄𝑄!,
!!!!! !!!!!!
> 𝑅𝑅!,!"#
In the Iowa River case study, we used 150 cfs as 𝑄𝑄! and a minimum fall rate of 5%. In the gaged record of reservoir inflows, 150 cfs was exceeded in 97% of days. We compared the fall rate of reservoir releases simulated under each management plan and climate change scenario to the fall rate of inflows observed over 1959-‐2010. Performance was deemed acceptable if the simulated releases’ fall rate is within 30% of the inflows’ historically observed fall rate.
Vulnerability Analysis (Stress Test). We used a semi-‐parametric, multi-‐site stochastic weather generator (Steinschneider and Brown 2013) to generate synthetic daily temperature and precipitation that deviate from historical climate observations from 62 years of record at 1/8 degree resolution (Maurer et al., 2002). A total of 343 simulated climate time series were generated to represent deviation from historical climate patterns by incremental changes in mean temperature (-‐1-‐5 °C), mean precipitation (0.7 – 1.3 times historic mean), and precipitation coefficient of variation (0.7-‐1.3 times historic mean). These data were used as input to the decision systems model to quantify the effects of climate deviation on performance indicators.
System performance in relation to climate change projections. To visualize system performance in relation to climate change projections, economic and ecological performance metrics can also be plotted against changes in mean temperature and precipitation (Figure S3). Downscaled GCM-‐climate change projections for 2041-‐2070, CMIP3 and CMIP5 (Maurer et al. 2007), for the region indicate that precipitation could deviate from historical conditions by ±20% and that mean temperatures may increase by as much as 4 °C. For all decision options, economic and ecological performance metrics were more sensitive to changes in precipitation than temperature. Because annual precipitation and discharge are highly correlated, system responses to the two variables are similar. For projections with the greatest increase in precipitation, EAC more than doubles (relative to historical mean annual EAC) under the status quo and reservoir re-‐operation management options. When levees are raised, EAC remained below 150% of mean historical levels, even under the wettest future climate states. Greater annual precipitation increased the area of inundated
5
floodplains relative to historical conditions, with greater ecological benefits observed under options that include reservoir re-‐operations.
Supplementary Figure S3. Iowa River system performance indicators mapped in a variable future climate space defined by change in mean annual temperate (increase in degrees C relative to historical mean) and mean annual precipitation (proportional change relative to historical mean) for each of 4 management actions (rows). The first column of Panel a shows estimated annual costs (EAC; engineering performance indicator), expressed as values relative to the historical long-‐term (1959-‐2010) mean, with values exceeding the 1.5 times historical levels (above the dashed line) being unacceptable. The second column indicates the floodplain inundation area (ecological performance indicator), with values falling below the historical mean (below the dashed line) deemed unacceptable for floodplain inundation. The overlapping domain of mutually acceptable performance for the two indicators is shown as white space in column 3. Panel b shows the second ecological performance indicator (flow recession rate), with values deviating by more than 30% from historical, unregulated inflow recession rates (to the right of the dashed lines) being unacceptable. Mutually overlapping performance for all combinations of the 3 indicators (1 engineering and 2 ecological) is shown in second column for each of four management actions. Climate model projections from CMIP3 (yellow dots) and CMIP5 (red dots) are plotted to illustrate the likelihood of crossing performance thresholds within the projected domain of possible climate states.
References
Brunner, G. W. 2001. HEC-‐RAS River Analysis System: User's Manual: US Army Corps of Engineers, Institute for Water Resources, Hydrologic Engineering Center.
4 NATURE CLIMATE CHANGE | www.nature.com/natureclimatechange
SUPPLEMENTARY INFORMATION DOI: 10.1038/NCLIMATE2765
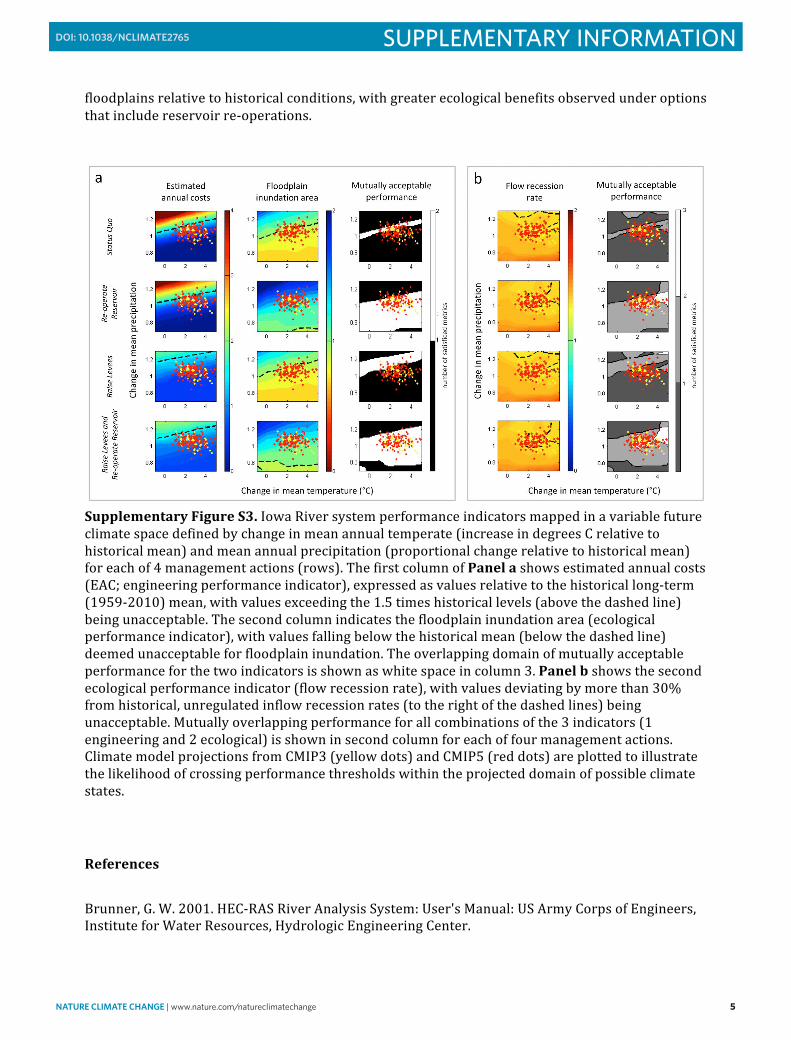
4
the average inundation area (km2 or mi2) as the annual expected floodplain inundation value. The hydraulic effects of levees on downstream floodplains were not modeled, but levees are known to increase the velocity of water flowing in contact with their confines, potentially reducing floodplain spread downstream (Mays 2011). For the purpose of this hypothetical example, augmented levees were assumed to reduce downstream flooded area by 10% at discharges and flow stages in which the river is in contact with any newly constructed levee height.
Estimating the Flood Recession Rate. We use flow recession rate or “fall rate” downstream of the reservoir as a second ecological performance indicator. Fall rate is one of the widely used Indicators of Hydrologic Alteration (IHA), developed by Richter et al. (1996). We calculated fall rate 𝑅𝑅! by taking the mean of all negative daily flow changes, which number n, relative to previous day’s daily flow. Over a time series of discharge with days t in a total of T days, each day’s discharge 𝑄𝑄! is subtracted from the previous day’s flow 𝑄𝑄!!! and the difference was compared to 𝑄𝑄!!! when the previous day’s flow was above a certain threshold 𝑄𝑄! (Equation 3). We filtered using the threshold discharge 𝑄𝑄! and using a rate of change that was above a minimum threshold 𝑅𝑅!,!"# to avoid negligible fluctuations at low flows.
(3) 𝑅𝑅! = !!
!!!!! !!!!!!
,𝑄𝑄!!! > 𝑄𝑄!!!!! , 𝑄𝑄!!! > 𝑄𝑄!,
!!!!! !!!!!!
> 𝑅𝑅!,!"#
In the Iowa River case study, we used 150 cfs as 𝑄𝑄! and a minimum fall rate of 5%. In the gaged record of reservoir inflows, 150 cfs was exceeded in 97% of days. We compared the fall rate of reservoir releases simulated under each management plan and climate change scenario to the fall rate of inflows observed over 1959-‐2010. Performance was deemed acceptable if the simulated releases’ fall rate is within 30% of the inflows’ historically observed fall rate.
Vulnerability Analysis (Stress Test). We used a semi-‐parametric, multi-‐site stochastic weather generator (Steinschneider and Brown 2013) to generate synthetic daily temperature and precipitation that deviate from historical climate observations from 62 years of record at 1/8 degree resolution (Maurer et al., 2002). A total of 343 simulated climate time series were generated to represent deviation from historical climate patterns by incremental changes in mean temperature (-‐1-‐5 °C), mean precipitation (0.7 – 1.3 times historic mean), and precipitation coefficient of variation (0.7-‐1.3 times historic mean). These data were used as input to the decision systems model to quantify the effects of climate deviation on performance indicators.
System performance in relation to climate change projections. To visualize system performance in relation to climate change projections, economic and ecological performance metrics can also be plotted against changes in mean temperature and precipitation (Figure S3). Downscaled GCM-‐climate change projections for 2041-‐2070, CMIP3 and CMIP5 (Maurer et al. 2007), for the region indicate that precipitation could deviate from historical conditions by ±20% and that mean temperatures may increase by as much as 4 °C. For all decision options, economic and ecological performance metrics were more sensitive to changes in precipitation than temperature. Because annual precipitation and discharge are highly correlated, system responses to the two variables are similar. For projections with the greatest increase in precipitation, EAC more than doubles (relative to historical mean annual EAC) under the status quo and reservoir re-‐operation management options. When levees are raised, EAC remained below 150% of mean historical levels, even under the wettest future climate states. Greater annual precipitation increased the area of inundated
5
floodplains relative to historical conditions, with greater ecological benefits observed under options that include reservoir re-‐operations.
Supplementary Figure S3. Iowa River system performance indicators mapped in a variable future climate space defined by change in mean annual temperate (increase in degrees C relative to historical mean) and mean annual precipitation (proportional change relative to historical mean) for each of 4 management actions (rows). The first column of Panel a shows estimated annual costs (EAC; engineering performance indicator), expressed as values relative to the historical long-‐term (1959-‐2010) mean, with values exceeding the 1.5 times historical levels (above the dashed line) being unacceptable. The second column indicates the floodplain inundation area (ecological performance indicator), with values falling below the historical mean (below the dashed line) deemed unacceptable for floodplain inundation. The overlapping domain of mutually acceptable performance for the two indicators is shown as white space in column 3. Panel b shows the second ecological performance indicator (flow recession rate), with values deviating by more than 30% from historical, unregulated inflow recession rates (to the right of the dashed lines) being unacceptable. Mutually overlapping performance for all combinations of the 3 indicators (1 engineering and 2 ecological) is shown in second column for each of four management actions. Climate model projections from CMIP3 (yellow dots) and CMIP5 (red dots) are plotted to illustrate the likelihood of crossing performance thresholds within the projected domain of possible climate states.
References
Brunner, G. W. 2001. HEC-‐RAS River Analysis System: User's Manual: US Army Corps of Engineers, Institute for Water Resources, Hydrologic Engineering Center.
NATURE CLIMATE CHANGE | www.nature.com/natureclimatechange 5
SUPPLEMENTARY INFORMATIONDOI: 10.1038/NCLIMATE2765

6
Duffy, M. 2014. Estimated costs of crop production in Iowa-‐ 2014. Agricultural Decision Maker File A1-‐20. U.S. Department of Agriculture. Gao, H., Q. Tang, X. Shi, C. Zhu, T. Bohn, F. Su, J. Sheffield, M. Pan, D. Lettenmaier, and E. F. Wood. 2010. Water budget record from Variable Infiltration Capacity (VIC) model. Algorithm Theoretical Basis Document for Terrestrial Water Cycle Data Records. Gordon, N. D., T. A. McMahon, B. L. Finlayson, C. J. Gippel, and R. J. Nathan. 2004. Stream hydrology: an introduction for ecologists. John Wiley & Sons. Klipsch, J. and M. Hurst. 2007. HEC-‐ResSim Reservoir System Simulation User’s Manual Version 3.0. USACE, Davis, CA: 512. Liang, X., D. P. Lettenmaier, E. F. Wood, and S. J. Burgess. 1994. A simple hydrologically based model of land surface water and energy fluxes for general circulation models. Journal of Geophysical Research: Atmospheres 99: 14415-‐14428. Lund, J. R. 2002. Floodplain planning with Risk-‐Based Optimization. Journal of Water Resources Planning and Management Vol. 128(3): 202-‐207. Maurer, E., A. Wood, J. Adam, D. Lettenmaier, and B. Nijssen. 2002. A Long-‐Term Hydrologically Based Dataset of Land Surface Fluxes and States for the Conterminous United States. Journal of Climate 15:3237-‐3251. Maurer, E., L. Brekke, T. Pruitt, and P. B. Duffy. 2007. Fine-‐resolution climate projections enhance regional climate change impact studies. Eos, Transactions American Geophysical Union 88:504-‐504. Mays, L. W. 2011. Water Resources Engineering. Chapter 14: Flood Control. 2nd Edition, John Wiley and Sons, Inc. Richter, B. D., J. V. Baumgartner, J. Powell, and D. P. Braun. 1996. A method for assessing hydrologic alteration within ecosystems. Conservation Biology 10: 1163-‐1174. Steinschneider, S. and C. Brown. 2013. A semiparametric multivariate, multisite weather generator with low-‐frequency variability for use in climate risk assessments. Water Resources Research 49:7205-‐7220. Steinschneider, S., S. Wi, and C. Brown. 2014. The integrated effects of climate and hydrologic uncertainty on future flood risk assessments. Hydrological Processes. Online. (USACE) U.S. Army Core of Engineers. 2010. HEC-‐RAS River Analysis System, version 4.1. Institute for Water Resources, Hydrologic Engineering Center, Davis, CA. (USACE) U.S. Army Corps of Engineers. 2013. Federal Interest Rates for Corps of Engineers Projects for Fiscal Year 2014, Economic Guidance Memo. 14-‐01. Department of the Army, Washington, D. C.
6 NATURE CLIMATE CHANGE | www.nature.com/natureclimatechange
SUPPLEMENTARY INFORMATION DOI: 10.1038/NCLIMATE2765