sustainable use of earth’s natural resources
TRANSCRIPT

Sustainable use ofEarth’s natural resources
Financial Statements Review2015
CEO Pertti Korhonen
© Outotec – All rights reserved
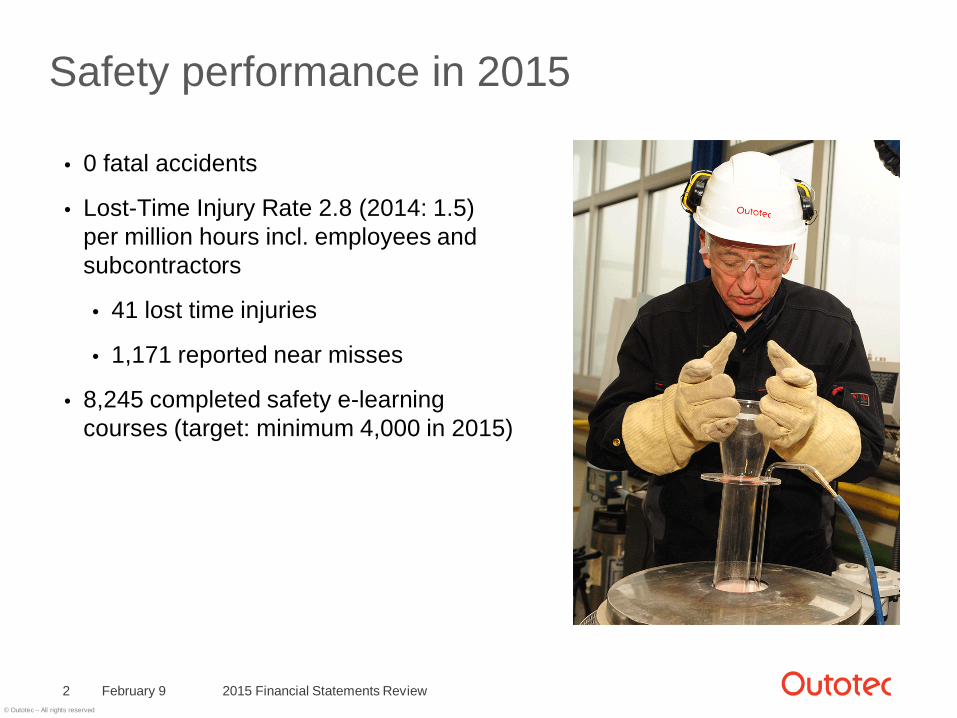
Safety performance in 2015
2015 Financial Statements Review2
• 0 fatal accidents
• Lost-Time Injury Rate 2.8 (2014: 1.5)per million hours incl. employees and subcontractors
• 41 lost time injuries
• 1,171 reported near misses
• 8,245 completed safety e-learning courses (target: minimum 4,000 in 2015)
February 9
© Outotec – All rights reserved
Performance in 2015 – negatives and positives
February 9 2015 Financial Statements Review3
• Accelerated weakening of mining & metals market in the second half of 2015
• Service orders and salesweakened towards year-end
• Many customers in financialdistress
• Negative net profit due to significant one-time costsmainly from restructuring
• Strong energy ordersbalancing weaker mining and metals orders
• Spare part sales grew YoY• Improved Capex margins• Positive cash flow from
operations
© Outotec – All rights reserved
2015 was challenging in mining and metals industry, energy business a bright spot
• Uncertainty of China’s growth outlook increased• Metals growth slowed down, prices weakened on
average 30% to 2009 levels• Producers cut production and postponed
investments• Markets in Europe and the Middle East were
somewhat more active• Waste-to-energy market more active• Customers are more demanding and spend less • Competition continued intense, but margins retained
February 9 2015 Financial Statements Review4

© Outotec – All rights reserved
Commodities index sank below the 2009 financial crisis level – very weak second half of 2015 had a direct impact on industry capex and opex levels
February 9 2015 Financial Statements Review5
Source: Thomson Reuters Datastream

© Outotec – All rights reserved
Iron ore pelletizingtechnology for B-MISCO, Iran< EUR 10 million in Q2 (80-100 million in total)
Aluminum smelter technologyfor EMAL, UAE> EUR 10 million in Q1
Alumina calcination plants for EGA, UAE> EUR 80 million
Zinc direct leaching for Boliden, NorwayNot published, Q1 (typicallyEUR 10-20 million)
Tailings treatment plant for Yara, Finland> EUR 40 million in Q3
Iron ore beneficiation plant, IIEC, IranEUR 45 million (10 in Q3)
Seven waste-to-energy/renewable energy plants, UK and CanadaEUR 163 million in 2015
Metals, Energy & Water orders grew 19%Minerals Processing orders contracted 17%
February 9 2015 Financial Statements Review6
APAC 18 (23)%EMEA 56 (40)%Americas 26 (37)% Zinc plant technology and services for Met-MexPeñoles, Mexico~ EUR 60 million
Aluminum rodshoptechnology for ChipingXinyuan Aluminium, China> EUR 12 million
Modular copper SX technology and services, South America~ EUR 30 million in Q1
Minerals Processing orders: EUR 496 million, -17%1)
Metals, Energy & Water orders: EUR 694 million, 19%2)
1) in comparable currencies, -16%2) in comparable currencies, 12%
623 693
555 497
0
200
400
600
800
1000
1200
Q1-Q4/2014 Q1-Q4/2015
Serviceorders
Capexorders
EUR million
Ferrochrome plant for MintalChina> EUR 25 million in Q4

© Outotec – All rights reserved
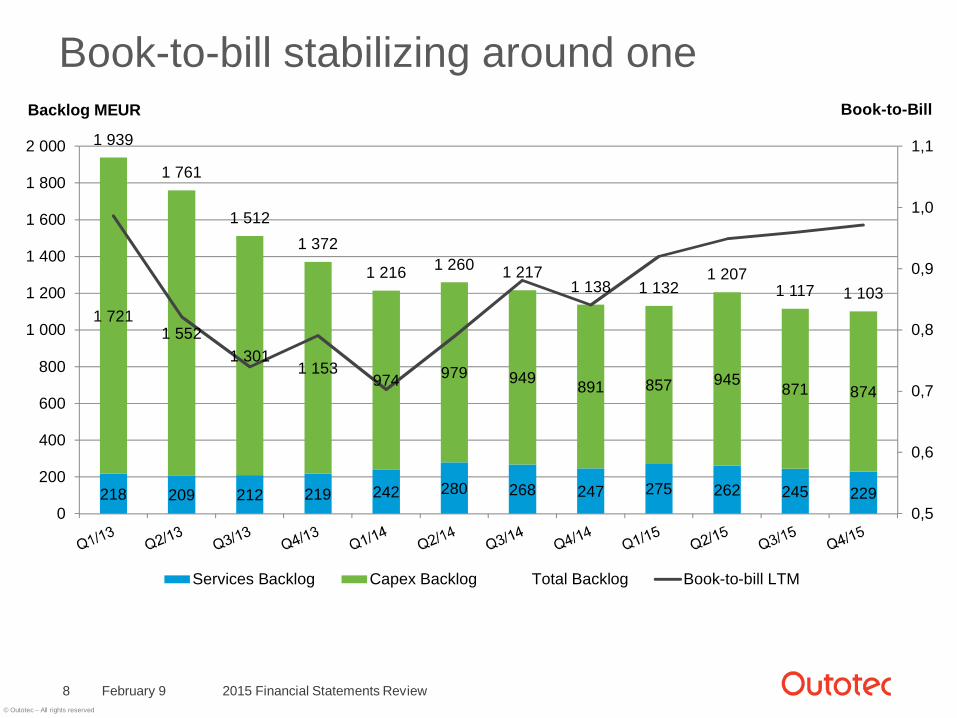
Stabile order backlog with healthy margins
February 9 2015 Financial Statements Review7
• Order backlog: EUR 1,103 (1,138) million, of which services EUR 229 (247) million
• 24 (19) projects with value in excess of EUR 10 million, accounting for 66 (58)% of the backlog
• Roughly 70 (81)%, or roughly EUR 760 (925) million of the backlog is estimated to be delivered in 2016
EUR million
240
371
235168
493 418384
299
475
260
120139106 202111
419 350269
357344
532
803
327
425
736
452471 491366
230
426
210
380266
322 260395
268 267
0
200
400
600
800
1 000
1 200
1 400
1 600
1 800
2 000
2 200
2 400
Q2/
2006
Q3/
2006
Q4/
2006
Q1/
2007
Q2/
2007
Q3/
2007
Q4/
2007
Q1/
2008
Q2/
2008
Q3/
2008
Q4/
2008
Q1/
2009
Q2/
2009
Q3/
2009
Q4/
2009
Q1/
2010
Q2/
2010
Q3/
2010
Q4/
2010
Q1/
2011
Q2/
2011
Q3/
2011
Q4/
2011
Q1/
2012
Q2/
2012
Q3/
2012
Q4/
2012
Q1/
2013
Q2/
2013
Q3/
2013
Q4/
2013
Q1/
2014
Q2/
2014
Q3/
2014
Q4/
2014
Q1/
2015
Q2/
2015
Q3/
2015
Q4/
2015
Order backlog at the end of the periodOrder intake by quarterShare of unannounced orders
© Outotec – All rights reserved
February 9 2015 Financial Statements Review8
Book-to-bill stabilizing around one
218 209 212 219 242 280 268 247 275 262 245 229
1 7211 552
1 3011 153
974 979 949 891 857 945 871 874
1 939
1 761
1 5121 372
1 216 1 260 1 2171 138 1 132
1 2071 117 1 103
0,5
0,6
0,7
0,8
0,9
1,0
1,1
0
200
400
600
800
1 000
1 200
1 400
1 600
1 800
2 000
Book-to-BillBacklog MEUR
Services Backlog Capex Backlog Total Backlog Book-to-bill LTM
© Outotec – All rights reserved
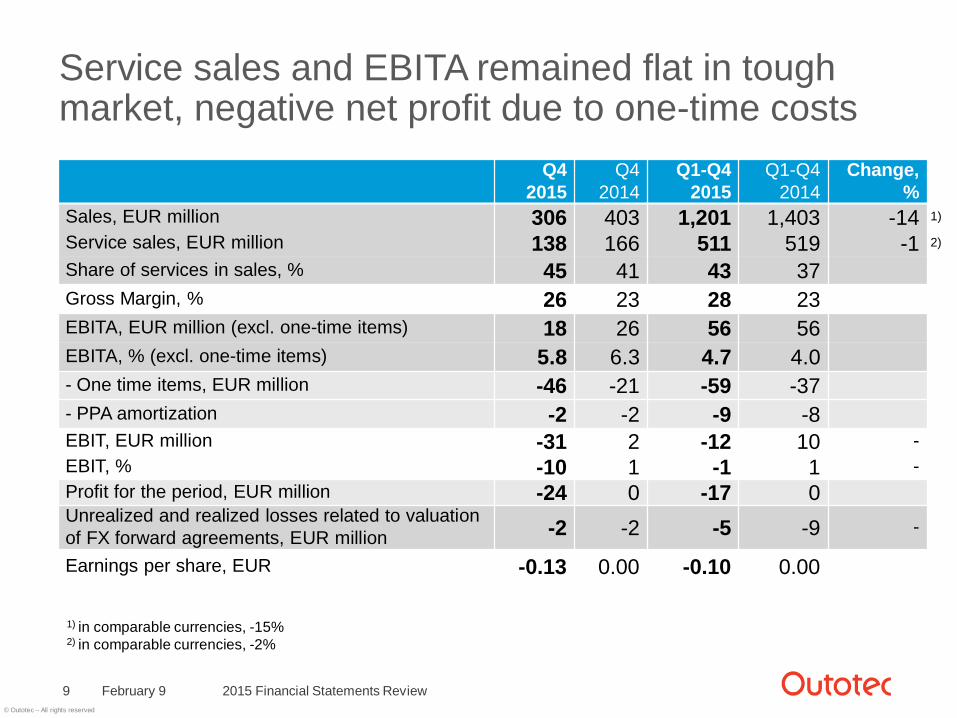
Service sales and EBITA remained flat in tough market, negative net profit due to one-time costs
February 9 2015 Financial Statements Review9
1) in comparable currencies, -15%2) in comparable currencies, -2%
Q4 2015
Q4 2014
Q1-Q4 2015
Q1-Q4 2014
Change, %
Sales, EUR million 306 403 1,201 1,403 -14 1)
Service sales, EUR million 138 166 511 519 -1 2)
Share of services in sales, % 45 41 43 37Gross Margin, % 26 23 28 23EBITA, EUR million (excl. one-time items) 18 26 56 56EBITA, % (excl. one-time items) 5.8 6.3 4.7 4.0- One time items, EUR million -46 -21 -59 -37- PPA amortization -2 -2 -9 -8EBIT, EUR million -31 2 -12 10 -EBIT, % -10 1 -1 1 -Profit for the period, EUR million -24 0 -17 0Unrealized and realized losses related to valuation of FX forward agreements, EUR million -2 -2 -5 -9 -
Earnings per share, EUR -0.13 0.00 -0.10 0.00
© Outotec – All rights reserved
February 9 2015 Financial Statements Review10
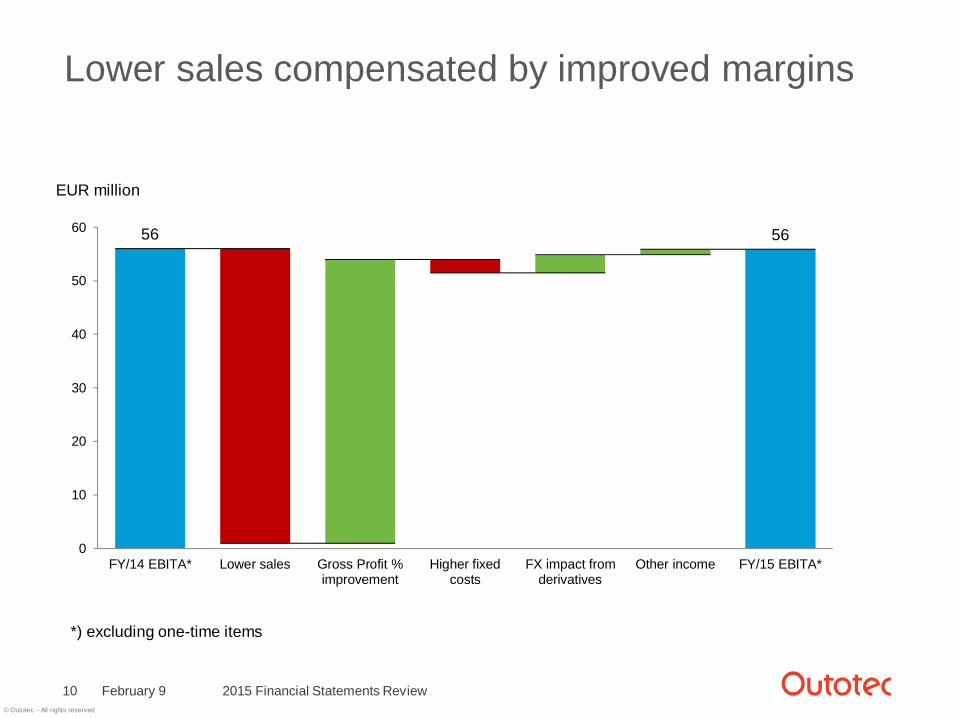
Lower sales compensated by improved margins
*) excluding one-time items
EUR million
56 56
0
10
20
30
40
50
60
FY/14 EBITA* Lower sales Gross Profit %improvement
Higher fixedcosts
FX impact fromderivatives
Other income FY/15 EBITA*
© Outotec – All rights reserved
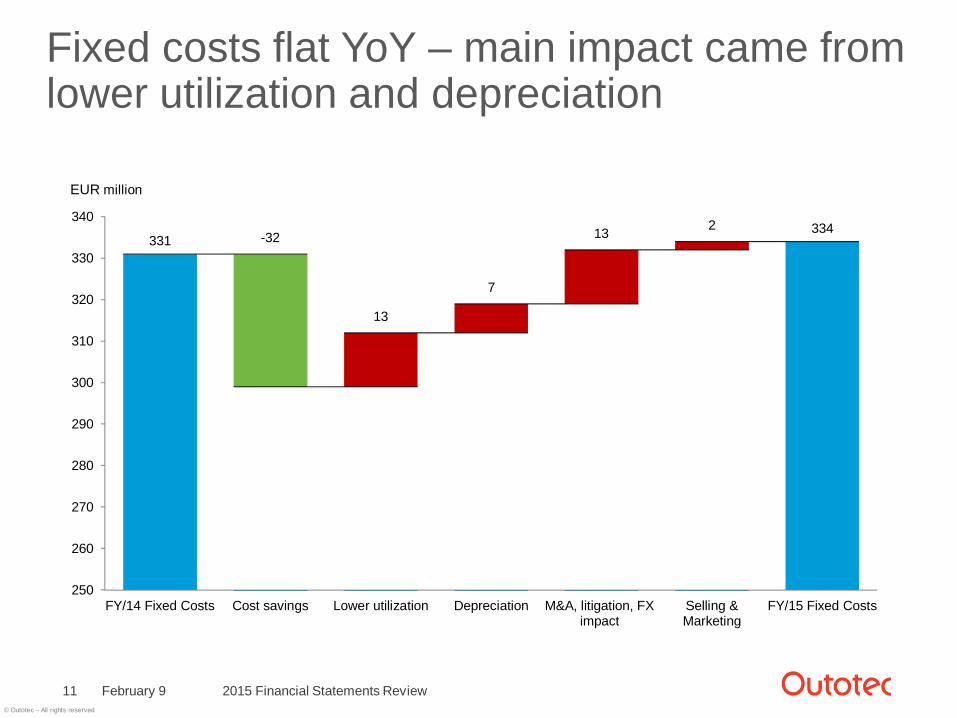
Fixed costs flat YoY – main impact came fromlower utilization and depreciation
February 9 2015 Financial Statements Review11
EUR million
331334
-32
13
7
13 2
250
260
270
280
290
300
310
320
330
340
FY/14 Fixed Costs Cost savings Lower utilization Depreciation M&A, litigation, FXimpact
Selling &Marketing
FY/15 Fixed Costs
© Outotec – All rights reserved
Spare parts & other services
Service projects(incl. Capex spares)
050
100150200250
01020304050
Q4/
12Q
3/12
Q3/
11Q
4/11
Q2/
12
Q2/
11
Q1/
12
Q1/
11
%
Q3/
15Q
4/15
EUR million
Q2/
15
Q4/
14
Q1/
14
Q3/
14Q
2/14
Q2/
13
Q1/
15
Q4/
13
Q1/
13
Q3/
13
February 9 2015 Financial Statements Review12
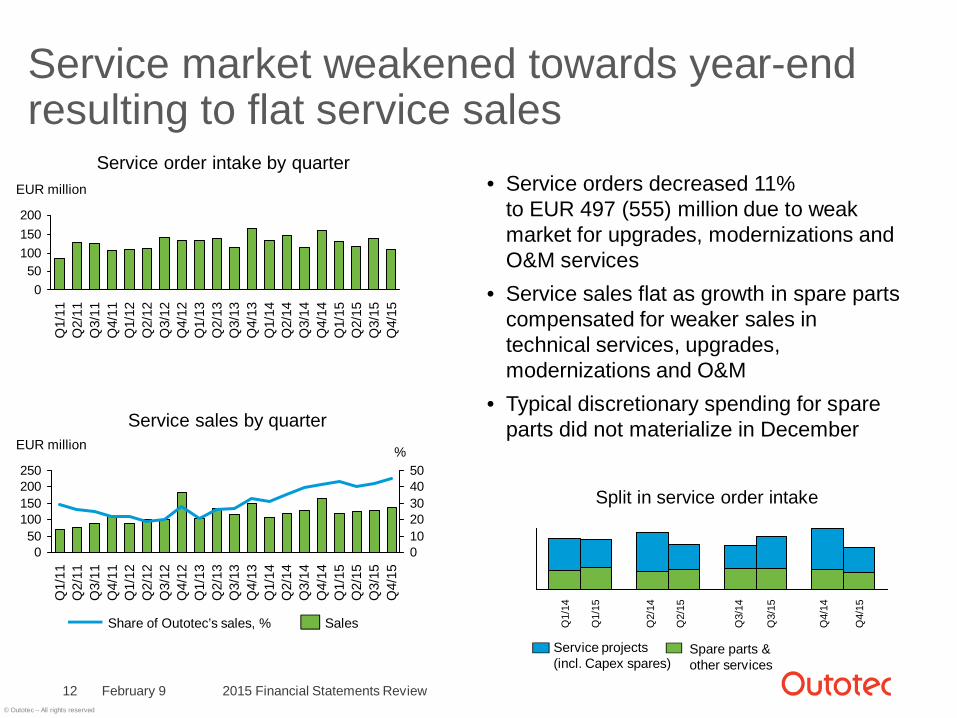
Service market weakened towards year-end resulting to flat service sales
• Service orders decreased 11% to EUR 497 (555) million due to weak market for upgrades, modernizations and O&M services
• Service sales flat as growth in spare parts compensated for weaker sales in technical services, upgrades, modernizations and O&M
• Typical discretionary spending for spare parts did not materialize in December
050
100150200
EUR million
Q2/
15
Q4/
15Q
3/15
Q1/
15
Q2/
11Q
1/11
Q3/
11
Q1/
12Q
4/11
Q4/
13
Q4/
14
Q4/
12
Q2/
14Q
3/14
Q2/
13
Q1/
14
Q3/
13
Q3/
12Q
2/12
Q1/
13
Service order intake by quarter
Service sales by quarter
Split in service order intake
Q1/
14
Q1/
15
Q2/
14
Q2/
15
Q3/
14
Q3/
15
Q4/
14
Q4/
15
SalesShare of Outotec’s sales, %
© Outotec – All rights reserved
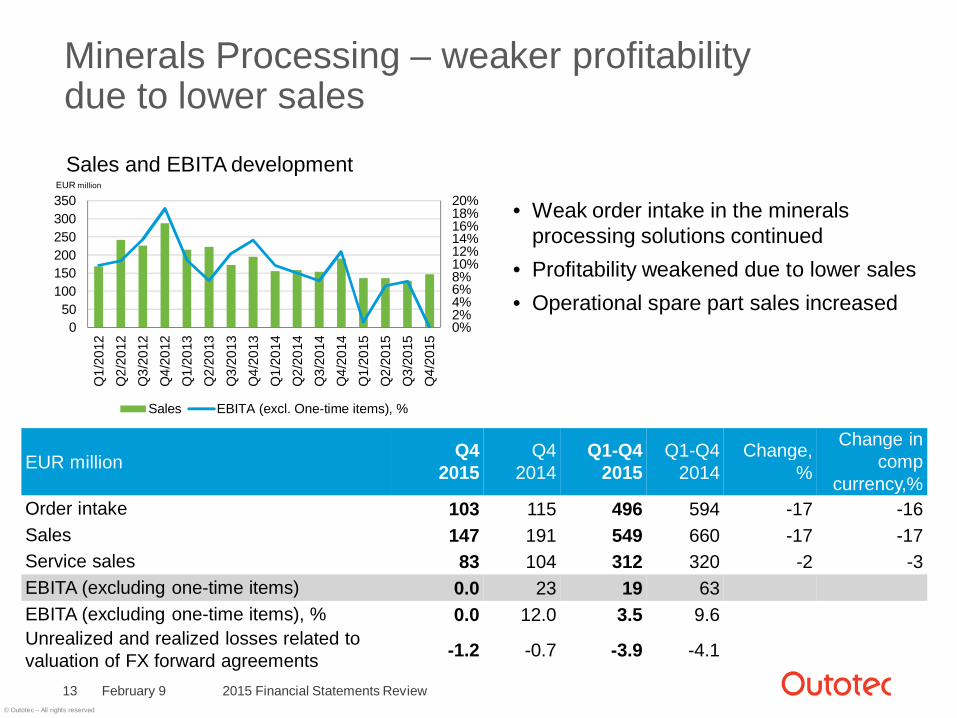
Minerals Processing – weaker profitabilitydue to lower sales
• Weak order intake in the minerals processing solutions continued
• Profitability weakened due to lower sales • Operational spare part sales increased
February 9 2015 Financial Statements Review13
0%2%4%6%8%10%12%14%16%18%20%
050
100150200250300350
Q1/
2012
Q2/
2012
Q3/
2012
Q4/
2012
Q1/
2013
Q2/
2013
Q3/
2013
Q4/
2013
Q1/
2014
Q2/
2014
Q3/
2014
Q4/
2014
Q1/
2015
Q2/
2015
Q3/
2015
Q4/
2015
Sales EBITA (excl. One-time items), %
EUR million
Sales and EBITA development
EUR million Q4 2015
Q4 2014
Q1-Q4 2015
Q1-Q4 2014
Change, %
Change in comp
currency,%Order intake 103 115 496 594 -17 -16Sales 147 191 549 660 -17 -17Service sales 83 104 312 320 -2 -3EBITA (excluding one-time items) 0.0 23 19 63EBITA (excluding one-time items), % 0.0 12.0 3.5 9.6Unrealized and realized losses related to valuation of FX forward agreements -1.2 -0.7 -3.9 -4.1

© Outotec – All rights reserved
Metals, Energy & Water – improved profitability dueto improved execution and orders growth
• Multiple aluminum, zinc, iron and energy solutions increased order intake
• Improved margins due to improved project execution
• Flat service sales despite weak upgrade & modernization market
February 9 2015 Financial Statements Review14
-5%
0%
5%
10%
15%
050
100150200250300350400
Q1/
2012
Q2/
2012
Q3/
2012
Q4/
2012
Q1/
2013
Q2/
2013
Q3/
2013
Q4/
2013
Q1/
2014
Q2/
2014
Q3/
2014
Q4/
2014
Q1/
2015
Q2/
2015
Q3/
2015
Q4/
2015
Sales EBITA (excl. One-time items), %
Sales and EBITA developmentEUR million
EUR million Q4 2015
Q4 2014
Q1-Q4 2015
Q1-Q4 2014
Change, %
Change in comp.
currency, %Order intake 165 208 694 584 19 12Sales 159 213 652 743 -12 -13Service sales 55 62 199 199 0 -1EBITA (excluding one-time items) 18 4 42 -1EBITA (excluding one-time items), % 11.4 2.1 6.5 -0.2Unrealized and realized losses related to valuation of FX forward agreements -0.5 -1.1 -1.5 -4.5
© Outotec – All rights reserved
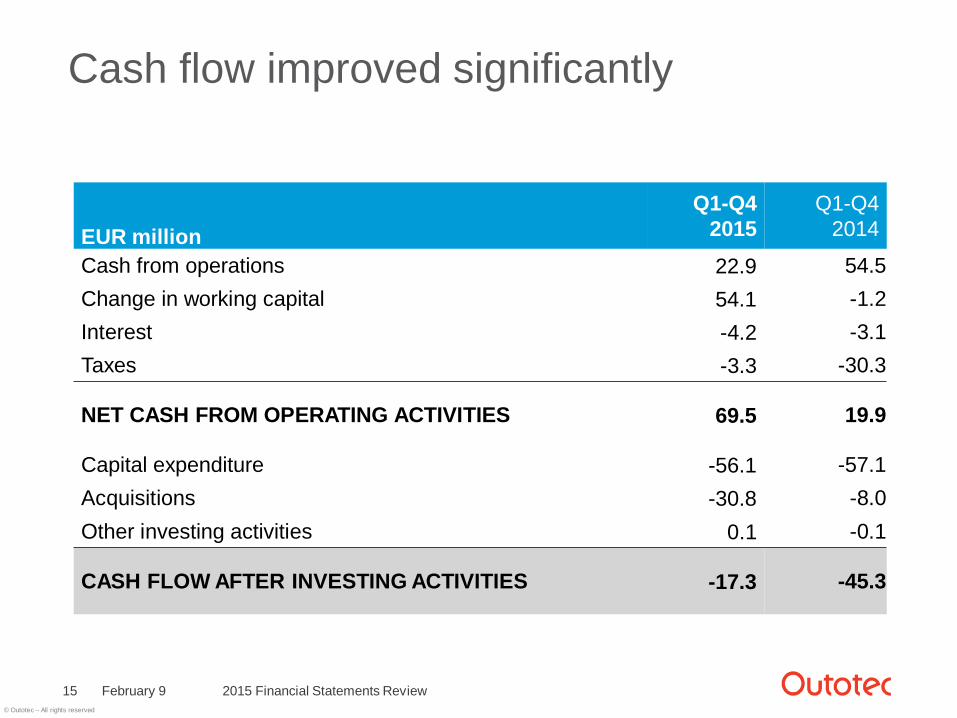
Cash flow improved significantly
February 9 2015 Financial Statements Review15
EUR millionQ1-Q4
2015 Q1-Q4
2014
Cash from operations 22.9 54.5Change in working capital 54.1 -1.2Interest -4.2 -3.1Taxes -3.3 -30.3
NET CASH FROM OPERATING ACTIVITIES 69.5 19.9
Capital expenditure -56.1 -57.1Acquisitions -30.8 -8.0Other investing activities 0.1 -0.1
CASH FLOW AFTER INVESTING ACTIVITIES -17.3 -45.3
© Outotec – All rights reserved
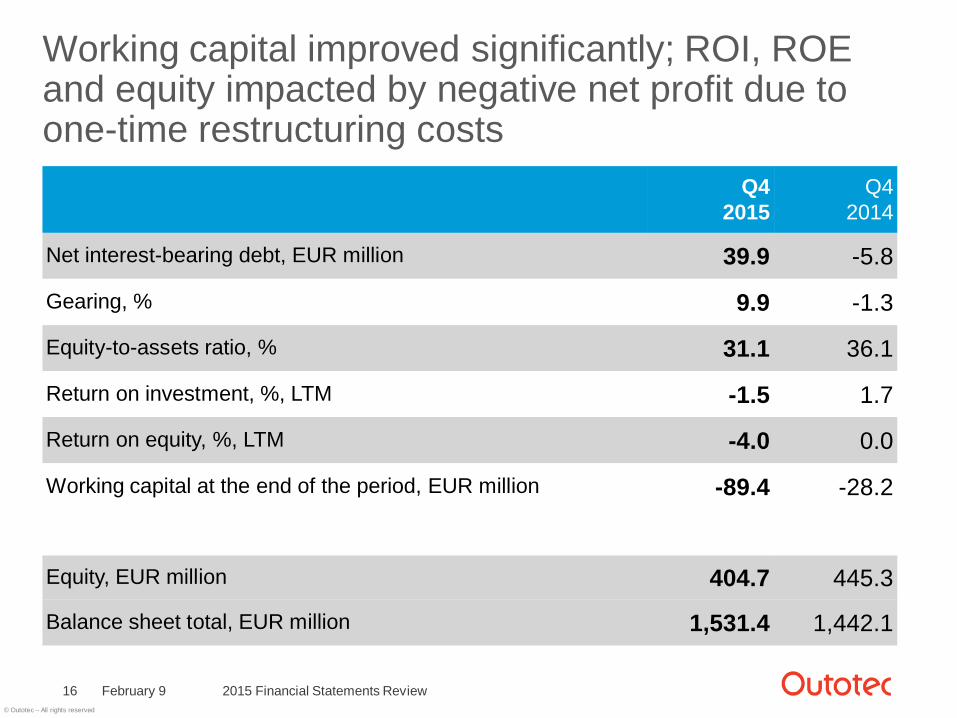
Working capital improved significantly; ROI, ROE and equity impacted by negative net profit due to one-time restructuring costs
February 9 2015 Financial Statements Review16
Q4 2015
Q4 2014
Net interest-bearing debt, EUR million 39.9 -5.8
Gearing, % 9.9 -1.3
Equity-to-assets ratio, % 31.1 36.1
Return on investment, %, LTM -1.5 1.7
Return on equity, %, LTM -4.0 0.0
Working capital at the end of the period, EUR million -89.4 -28.2
Equity, EUR million 404.7 445.3
Balance sheet total, EUR million 1,531.4 1,442.1

© Outotec – All rights reserved
Slight decrease in personnel – 538 net reductions, 449 additions through service acquisitions
February 9 2015 Financial Statements Review17
30449
16841759
0
5000
4500
4000
3500
3000
4,859
3175
December 2015 headcount
Acquisitions(mainly service
business)
AdditionsReductions
-568
September 2014 headcount
4,948
3189
CapexService

© Outotec – All rights reserved
Key events after December 31, 2015
February 9 2015 Financial Statements Review18
Jan 4, 2016 Jan 7, 2016 Jan 21, 2016 Jan 25, 2016 Jan 27, 2016Outotec completed employee cooperation negotiations and as a result, 150 jobs were reduced in Finland.
Outotec had agreed on the design and delivery of a ferrochrome plant for MintalGroup in China. > EUR 25 million was booked in Q4/2015 order intake.
Outotec was ranked the world’s 3rd most sustainable company on the Global 100 Index and received the Silver Class distinction in RobecoSAM’sannual Corporate Sustainability Assessment.
Robin Lindahl, head of Metals, Energy & Water business leaves Outotec to join Normet Group as their new President and CEO latest on May 1, 2016.
The arbitration court’s final decision in MMX SudesteMineração S.A. dispute for Outotec was EUR 6.4 million negative, which was booked in non-recurring items in Q4/2015.
© Outotec – All rights reserved
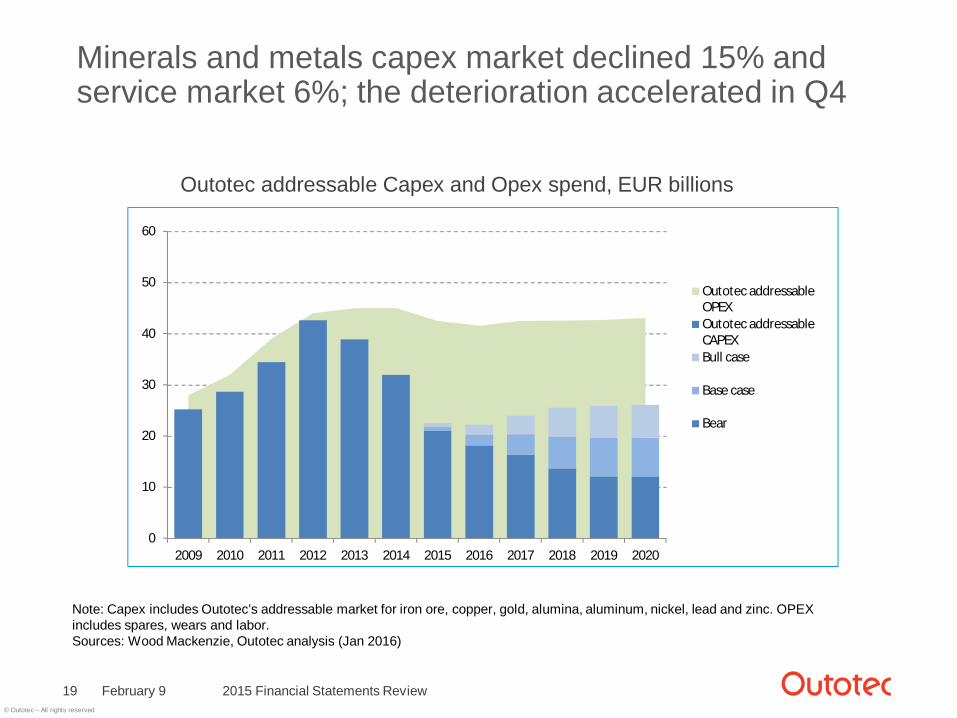
Minerals and metals capex market declined 15% and service market 6%; the deterioration accelerated in Q4
February 9 2015 Financial Statements Review19
Outotec addressable Capex and Opex spend, EUR billions
Note: Capex includes Outotec’s addressable market for iron ore, copper, gold, alumina, aluminum, nickel, lead and zinc. OPEX includes spares, wears and labor.Sources: Wood Mackenzie, Outotec analysis (Jan 2016)
0
10
20
30
40
50
60
2009 2010 2011 2012 2013 2014 2015 2016 2017 2018 2019 2020
Outotec addressableOPEXOutotec addressableCAPEXBull case
Base case
Bear
© Outotec – All rights reserved
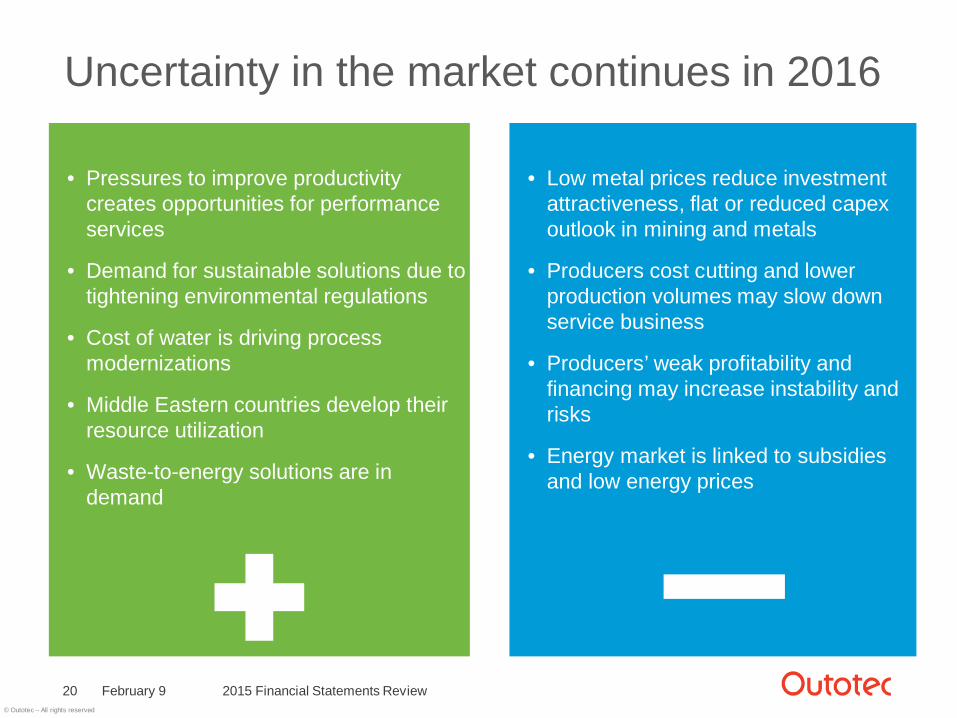
Uncertainty in the market continues in 2016
• Pressures to improve productivity creates opportunities for performance services
• Demand for sustainable solutions due to tightening environmental regulations
• Cost of water is driving process modernizations
• Middle Eastern countries develop their resource utilization
• Waste-to-energy solutions are in demand
February 9 2015 Financial Statements Review20
• Low metal prices reduce investment attractiveness, flat or reduced capex outlook in mining and metals
• Producers cost cutting and lower production volumes may slow down service business
• Producers’ weak profitability and financing may increase instability and risks
• Energy market is linked to subsidies and low energy prices
© Outotec – All rights reserved
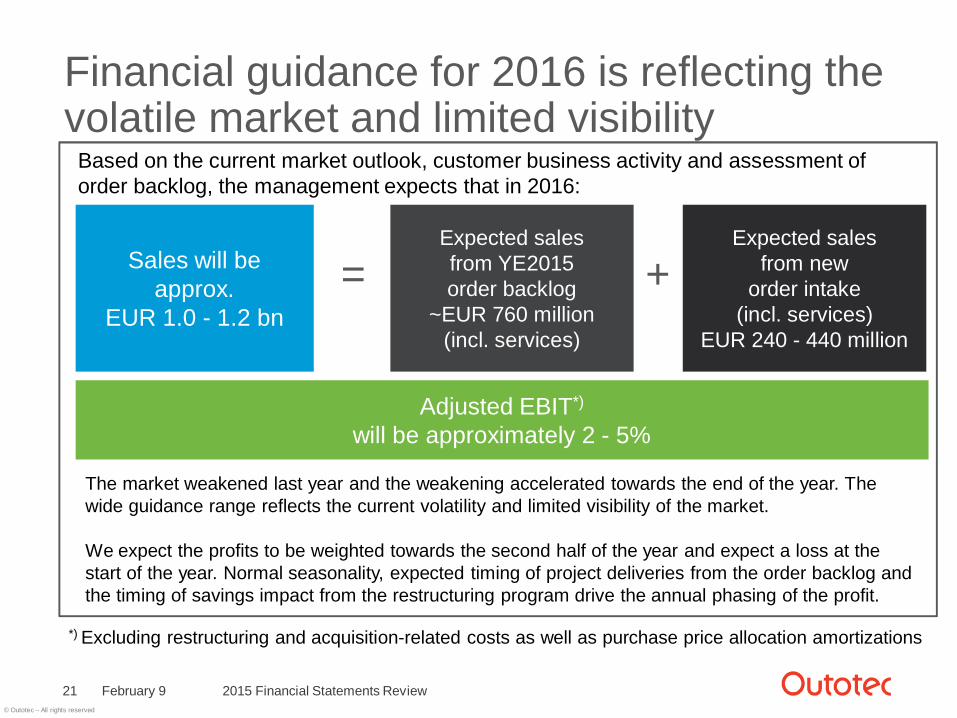
Based on the current market outlook, customer business activity and assessment of order backlog, the management expects that in 2016:
Financial guidance for 2016 is reflecting the volatile market and limited visibility
February 921 2015 Financial Statements Review
Expected salesfrom YE2015 order backlog
~EUR 760 million(incl. services)
Expected salesfrom new
order intake(incl. services)
EUR 240 - 440 million
+=Sales will be approx.
EUR 1.0 - 1.2 bn
Adjusted EBIT*)
will be approximately 2 - 5%
*) Excluding restructuring and acquisition-related costs as well as purchase price allocation amortizations
The market weakened last year and the weakening accelerated towards the end of the year. The wide guidance range reflects the current volatility and limited visibility of the market.
We expect the profits to be weighted towards the second half of the year and expect a loss at the start of the year. Normal seasonality, expected timing of project deliveries from the order backlog and the timing of savings impact from the restructuring program drive the annual phasing of the profit.

© Outotec – All rights reserved
Focus in 2016
1. Improve product and fixed costs
2. Develop service business
3. Seek opportunities from growth segments
2015 Financial Statements Review22
1
2
February 9
3