sustainable use of earth’s natural resources - outotec is a global leader in minerals and...
TRANSCRIPT

Sustainable use ofEarth’s natural resources
Company presentation
July 27, 2016

© Outotec – All rights reserved
Safety performance in Q1-Q2/2016
OUTOTEC IR presentation2 July 27, 2016
0
1.5 (2015: 2.8)
10 1,207
Fatal accidents
Lost-Time Injury Rate
per million hours
incl. employees and
subcontractors
Lost time injuries reported Reported near misses

© Outotec – All rights reserved
Outotec at a glance
July 27, 2016 OUTOTEC IR presentation3
Key figures
Financial performance
Geographic coverage
Business overview
740
1,000
1,218
878970
1,386
2,087
1,912
1,403
1,201
0
2
4
6
8
10
12
0
400
800
1200
1600
2000
2400
2006 *) 2007 2008 2009 2010 2011 2012 2013 2014 2015
Sales Operating profit margin
*) Combined basis 2010 onwards represents adj. EBIT, excl. restructuring and acquisition-
related costs as well as purchase price allocation amortizations.
EUR million %
Outotec R&D, sales and service centers
Outotec manufacturing/assembly
FY 2015 FY 2014
Net Sales, EUR million 1,201 1,403
Share of services in sales, % 43 37
Gross Margin, % 28 23
EBITA, % (excl. one-time items) 4.7 4.0
Gearing, % 9.9 -1.3
Equity ratio, % 31.1 36.1
Balance sheet total, EUR million 1,531 1,442
• Outotec is a global leader in minerals and metals processing
technology delivering to more than 80 countries
• HQ in Finland, some 4,300 employees (Q2/2016) in 34 countries
• Outotec designs and delivers tailored solutions for minerals and
metals processing, water treatment, and producing energy from
biomass and wastes
• Company develops technologies which utilize natural resources,
raw materials, energy and water efficiently, and minimize the plant’s
lifetime costs

© Outotec – All rights reserved
A century of accumulated expertise 1/2
July 27, 2016 OUTOTEC IR presentation4

© Outotec – All rights reserved
A century of accumulated expertise 2/2
July 27, 2016 OUTOTEC IR presentation5

© Outotec – All rights reserved
Proven track record with thousands of references globally
• 130 non-ferrous smelters
• 650 sulfuric acid plants
• 1,100 grinding mills
• 10,000 flotation units
• 1,800 thickeners
• 3,500 filters
• 20 pelletizing and sintering plants for chromites
(ferroalloys), and 9 ferroalloy smelters
• 340 iron ore sintering plants
• 67 iron ore pelletizing plants
• 290 fluidized bed roasting plants
• 50 alumina calcination plants
• 109 fluidized bed energy systems for biomass
6
TankCell® flotation cells
First Quantum Minerals
Kevitsa, Finland
Flash Smelting and Flash
Converting Plant
Guangxi Jinchuan Non-
Ferrous Metals
China
Manganese Sinter Plant
Kalagadi Manganese
South Africa
July 27, 2016 OUTOTEC IR presentation

© Outotec – All rights reserved
R&D investments have resulted to many market leadership technologies
July 27, 2016 OUTOTEC IR presentation7
#1 in
ferrochrome
smelting
#1 in large,
emission
efficient
ACID plants
#1 in non-
ferrous
smelting/
converting
#1 in
ferrous
pelletizing
#1 in
copper
solvent
extraction
and
tankhouse
Among top3
in
concentrator
equipment
#1 in alumina
calcination,
aluminium
paste plants
and rod shops
6,485 national patents & applications (Q2/2016)
Strong digital process assets
© Outotec – All rights reserved
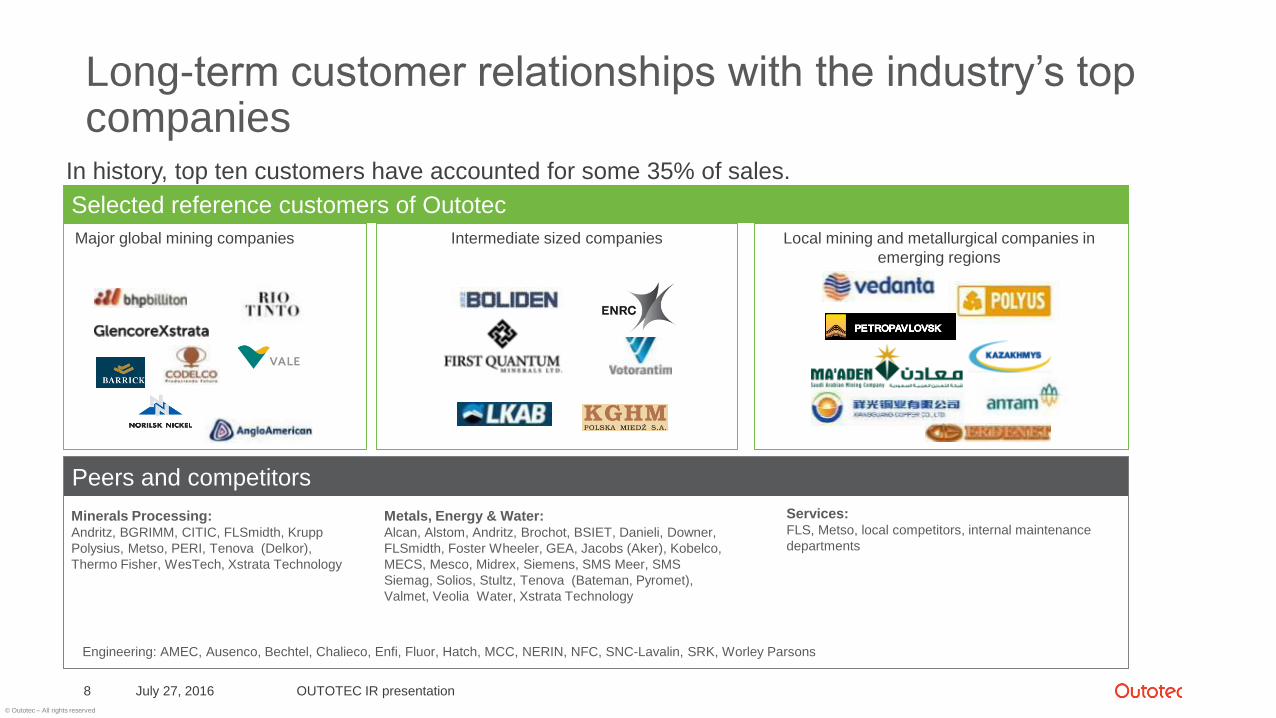
Long-term customer relationships with the industry’s top companies
July 27, 2016 OUTOTEC IR presentation8
Major global mining companies Local mining and metallurgical companies in
emerging regions
Intermediate sized companies
Services:FLS, Metso, local competitors, internal maintenance
departments
Peers and competitors
Engineering: AMEC, Ausenco, Bechtel, Chalieco, Enfi, Fluor, Hatch, MCC, NERIN, NFC, SNC-Lavalin, SRK, Worley Parsons
Minerals Processing:Andritz, BGRIMM, CITIC, FLSmidth, Krupp
Polysius, Metso, PERI, Tenova (Delkor),
Thermo Fisher, WesTech, Xstrata Technology
Metals, Energy & Water:Alcan, Alstom, Andritz, Brochot, BSIET, Danieli, Downer,
FLSmidth, Foster Wheeler, GEA, Jacobs (Aker), Kobelco,
MECS, Mesco, Midrex, Siemens, SMS Meer, SMS
Siemag, Solios, Stultz, Tenova (Bateman, Pyromet),
Valmet, Veolia Water, Xstrata Technology
In history, top ten customers have accounted for some 35% of sales.
Selected reference customers of Outotec

© Outotec – All rights reserved
Share of sales by end product
July 27, 2016 OUTOTEC IR presentation9
* Incl. water, sulfuric acid and off-gas
4%
10%
8%
17%
6%5%
10%4%
5% 8%
13%
4%
3%
7%
5%11%
7%
15%
32%28%
Others
Copper
Precious Metals
Zinc
Aluminium
2015
Ferroalloys
Iron
Nickel
Other Metals
2014
Energy and environmental
solutions*

© Outotec – All rights reserved
Outotec’s strategy
July 27, 2016 OUTOTEC IR presentation10

© Outotec – All rights reserved
Outotec provides life-cycle solutions for minerals and metals processing and energy production
July 27, 2016 OUTOTEC IR presentation11
Application area of Outotec’s technologies
RESOURCE EXTRACTION PRIMARY PRODUCTION RECYCLING
MANUFACTURING USERS
FERTILIZER PRODUCTION
AGRICULTURE ENERGYPRODUCTION
PHOSPHORUS
SULFURIC ACIDPHOSPHORUSLandfill
BackfillEnergyrecovery
INDUSTRIALMINERALS
METALSSALTS
CHEMICALSSLAG
RECYCLE REMANUFACTURE
EffluentTreatment
Airboneemission
Watermanagement
Airboneemission
MINING
Equipment
reuseReuse
Urban mine
NATURAL RESOURCES
ORES
MINERALS
WATER
BIOMASS
SERVICES AND
SOLUTIONS
COMBUSTIBLE
WASTE
MUNICIPAL SLUDGE
MINERAL PROCESSING
METALPROCESSING
Construction
materials
CONCENTRATES

© Outotec – All rights reserved
CAPEX and OPEX markets are under strain as producers seek to reduce costs
July 27, 2016 OUTOTEC IR presentation12
Low
incentives
for new
greenfield
investmentsProducers
are cutting
costs and
reducing
capacity
Outotec addressable mining and metals market
CAPEX and OPEX spend, EUR billions
Note: Capex includes Outotec’s addressable market for iron ore, copper, gold, alumina, aluminum, nickel, lead and zinc. OPEX includes spares, wears and labor.Sources: Wood Mackenzie, Outotec analysis (May 2016)
• Oversupply in most metals and minerals
• Slowing metals demand growth
• Low metals prices
• Further uncertainty from China:
2%-pts change in China GDP growth means 1%-pts
change in global metals demand

© Outotec – All rights reserved
Metals demand is forecasted to grow 2-4%
July 27, 2016 OUTOTEC IR presentation13
SUPPLY DEMAND
2016F Production, Mt 2016F Consumption, Mt CAGR% 2015-25E Increase, Kt/a
Aluminium 57,8 57,6 2,7 % 1692
Copper 22,5 22,3 1,8 % 419
Zinc 14,0 14,5 2,4 % 367
Nickel 2,0 1,9 1,4 % 29
Source: Wood Mackenzie, Morgan Stanley, Outotec analysis

© Outotec – All rights reserved
Cu LME cash price end of July 16, 220 (c/lb) Cu cash 2020 consensus, 266 (c/lb)
90th percentile
2016 copper production ranked on all-in-sustaining cost
90th percentile
Cu LME cash price end of July 16, 220 (c/lb) Cu cash 2020 consensus, 266 (c/lb)
July 27, 2016 OUTOTEC IR presentation14
Sustaining capital = costs needed to maintain the operation over a mine’s life that do not generate additional revenue for the operation
Service & Capex
© Outotec – All rights reserved
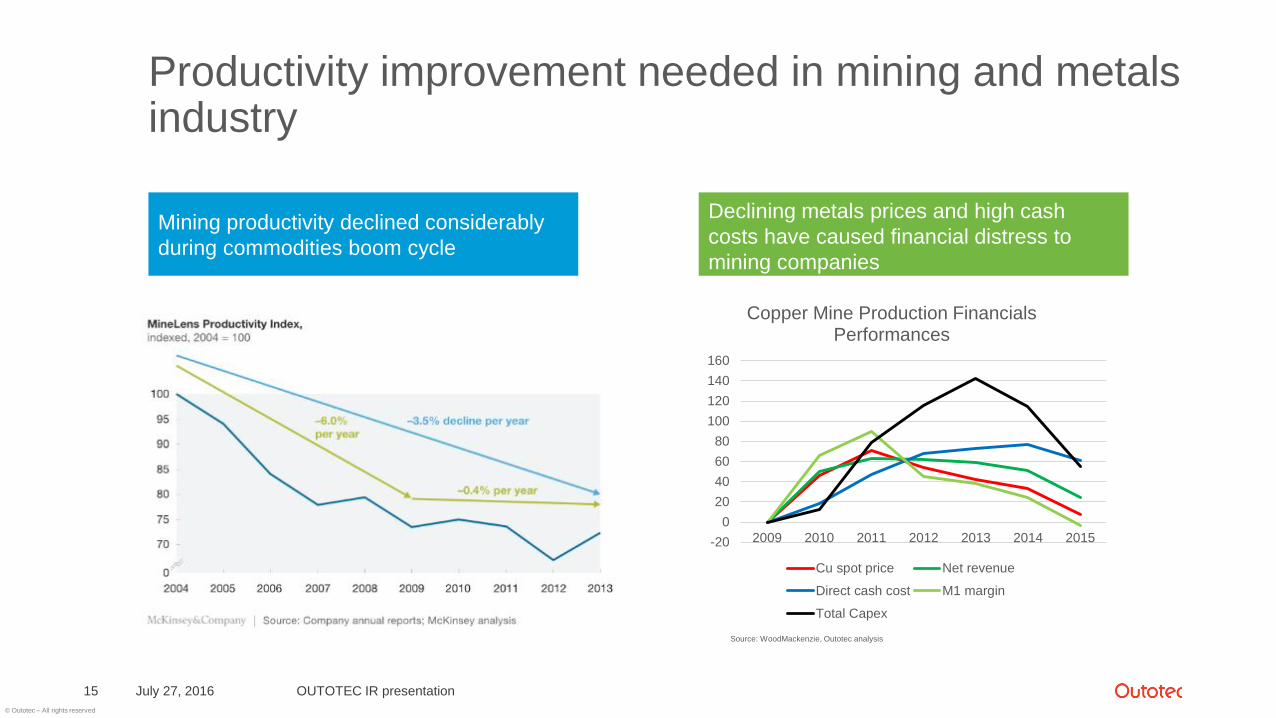
Productivity improvement needed in mining and metalsindustry
July 27, 2016 OUTOTEC IR presentation15
Mining productivity declined considerably
during commodities boom cycle
Declining metals prices and high cash
costs have caused financial distress to
mining companies
-20
0
20
40
60
80
100
120
140
160
2009 2010 2011 2012 2013 2014 2015
Copper Mine Production Financials Performances
Cu spot price Net revenue
Direct cash cost M1 margin
Total Capex
Source: WoodMackenzie, Outotec analysis

© Outotec – All rights reserved
July 27, 2016 OUTOTEC IR presentation16
Grow performance services
Grow spare & wear parts
business
Strengthen service
capabilities and
intensity
• Increase penetration to installed base
• Capture opportunities in commercial spare & wear parts
• Strengthen the end-to-end supply chain
• Strengthen field service presence at customers and service delivery
capabilities
• Bolt on M&A to increase service intensity and accelerate service
capability building
• Introduce new service solutions improving customers’ productivity
• Leverage industry leading process knowledge and digital solutions
• Gain sharing based on performance
Current State: Our penetration to installed base is still low (below 15%), customers need services that
improve productivity and reduce opex
Service sales target:
average growth 5-15%

© Outotec – All rights reserved
Offering industry’s most sustainable processing technologies
July 27, 2016 OUTOTEC IR presentation17
343545
2015
6,600
2014
5,900
2013
5,400
Our handprint is bigger than our footprint
Thousands of tons of CO2-equivalent
Footprint: Outotec’s greenhouse gas emissions
Handprint: Greenhouse gas emissions avoided
through use of Outotec’s technologies
The 3rdmost
sustainable
company in the
world (2016)
Environmental
Goods and
Services equals
to 90% of
orders (2014-15)

© Outotec – All rights reserved
Strategy roadmap
July 27, 2016 OUTOTEC IR presentation18
Stabilize profitability Grow
2016 2017
Creating high performing team• Strengthening service competences
• Empowering and engaging leadership
2018
Competitiveness of Spare & Wear parts
Performance services, service M&A
Service focus
Scalable operating model, improved product cost and sourcing
Fixed cost right-sizingProfitability
Adjacent segment growth
Service growth
Growth
Our people
Shareholder
return
Customer
satisfaction
and service
growth
Sales growth
Engaged and
empowered
professionals
Target
Continuous improvement

© Outotec – All rights reserved
Long-term financial targets (updated June 7, 2016)
July 27, 2016 OUTOTEC IR presentation19
Financial
targets
• Sales growing faster than the market
• Annual average service sales growth 5-15%
• Reach 10% adjusted EBIT margin* by 2020
• Gearing at maximum 50%
* Excluding restructuring and acquisition-related costs as well as purchase price allocation amortizations.

© Outotec – All rights reserved
Q1-Q2 2016 financial information
July 27, 2016 OUTOTEC IR presentation20

© Outotec – All rights reserved
Minerals Processing stabilizing; Metals, Energy & Water remains challenging
July 27, 2016 OUTOTEC IR presentation21
Minerals
Processing
market
stabilizing
Low metal
prices are
not
promoting
new
investments
Investments
to existing
capacity
with fast
returns and
environment
al reasons
Slowness in
services as
producers
focus on
cost
optimization
EMEA and
South
America
more active
markets,
gold, copper,
sulfuric acid
and waste-
to-energy
most active

© Outotec – All rights reserved
Q2 in a nutshell
July 27, 2016 OUTOTEC IR presentation22
• Continued challenges in the
Metals, Energy & Water segment
• Project finalization and payment
collection remain challenging
• Despite significant savings, work
still remain
• Savings program proceeds,
fixed costs reduced by 19%
• Plant and equipment orders in
Minerals Processing segment
increased
• Service order intake +5% in
comparable currencies
+
_

© Outotec – All rights reserved
Plant and equipment orders picked up in minerals processing
July 27, 2016 OUTOTEC IR presentation23
EMEA
53%
APAC
16%
405
237
249
214
0
100
200
300
400
500
600
700
Q2/2015 Q2/2016
Serviceorders
Capexorders
AMERICAS
31%
• Minerals Processing order intake: EUR 261 million, 6%
(17% in comparable currencies)
• Metals, Energy & Water order intake: EUR 190 million, -54%
(-51% in comparable currencies)
Process equipment for
Houndé Gold, Burkina
Faso
13 M€
Sulfuric acid plant
for Intesca
Industrial, Egypt
Over 30 M€
Copper smelter and
acid plant revamp,
South America
Over 33 M€
Process equipment
for Acacia Maden,
Turkey
Approx. 14 M€
Process equipment
for Bakyrchik
Mining, Kazakhstan
Approx. 15-20 M€
Process equipment
for SDM iron
concentrator, Iran
Approx. 10 M€

© Outotec – All rights reserved
Stable order backlog
July 27, 2016 OUTOTEC IR presentation24
€ million
Iranian projects
not included in
Q2 end backlog:
EUR 185 (225)
million
240
371
235
168
493418
384299
475
260
120139
106
202
111
419350
269
357 344
532
803
327
425
736
452 471 491
366
230
426
210
380
266322
260
395
268 267
170
281
0
200
400
600
800
1 000
1 200
1 400
1 600
1 800
2 000
2 200
2 400
Q2
/200
6
Q3
/200
6
Q4
/200
6
Q1
/200
7
Q2
/200
7
Q3
/200
7
Q4
/200
7
Q1
/200
8
Q2
/200
8
Q3
/200
8
Q4
/200
8
Q1
/200
9
Q2
/200
9
Q3
/200
9
Q4
/200
9
Q1
/201
0
Q2
/201
0
Q3
/201
0
Q4
/201
0
Q1
/201
1
Q2
/201
1
Q3
/201
1
Q4
/201
1
Q1
/201
2
Q2
/201
2
Q3
/201
2
Q4
/201
2
Q1
/201
3
Q2
/201
3
Q3
/201
3
Q4
/201
3
Q1
/201
4
Q2
/201
4
Q3
/201
4
Q4
/201
4
Q1
/201
5
Q2
/201
5
Q3
/201
5
Q4
/201
5
Q1
/201
6
Q2
/201
6
Order backlog at the end of the period Share of unannounced orders Order intake by quarter
Roughly EUR 490
million of the Q2
end backlog to be
delivered in 2016

© Outotec – All rights reserved
Timing of plant and equipment orders in 2015 and weak service order intake in 2016 decreased sales
July 27, 2016 OUTOTEC IR presentation25
EUR millionQ2
2016
Q2
2015
Q1-Q2
2016
Q1-Q2
2015
Change,
%
In
comparable
currencies
Sales 268 311 507 588 -14% -9%Service sales 100 126 214 244 -12% -4%
Share of services in sales, % 37 40 42 41
Gross Margin, % 26 29 25 29
Adjusted EBIT*
5 16 0 24
Adjusted EBIT*, % 2 5 0 4
- Restructuring and acquistion-related costs -4 -6 -9 -7
- PPA amortization -2 -2 -4 -5EBIT -1 8 -13 12EBIT, % -0 3 -3 2Profit for the period -3 4 -14 5* Excl. restructuring and acquisition-related costs and PPA amortizations.

© Outotec – All rights reserved
Fixed cost savings not fully compensating lower sales
July 27, 2016 OUTOTEC IR presentation26
0M€
OtherFixed cost
decrease*
Provision
releases
FX gain on
derivatives(-2M€ in Q1-Q2/16 vs.
-3M€ in Q1-Q2/15)
Adjusted EBIT
Q1-Q2/2016
Sales
decrease
Adjusted EBIT
Q1-Q2/2015
24M€
*Decline yoy 19%, in comparable currencies 17%

© Outotec – All rights reserved
Minerals Processing
July 27, 2016 OUTOTEC IR presentation27
0%2%4%6%8%10%12%14%16%18%20%
0
50
100
150
200
250
300
350
Q1/2
012
Q2/2
012
Q3/2
012
Q4/2
012
Q1/2
013
Q2/2
013
Q3/2
013
Q4/2
013
Q1/2
014
Q2/2
014
Q3/2
014
Q4/2
014
Q1/2
015
Q2/2
015
Q3/2
015
Q4/2
015
Q1/2
016
Q2/2
016
Sales EBIT*, %
Sales and adjusted EBIT development
• Improved order intake
• Fixed costs savings starting to show
• Service sales impacted by low order
intake in Q1
Minerals ProcessingEUR million
Q1-Q2
2016
Q1-Q2
2015
Change,
%
Change in
comp
currency, %
Order intake 261 245 6 17
Sales 232 273 -15 -8
Service sales 125 150 -17 -7
Adjusted EBIT*)10 10
Adjusted EBIT*), % 4 4Unrealized and realized losses
related to valuation of FX
forward agreements -0 -4
* Excl. restructuring and acquisition-related costs and PPA amortizations

© Outotec – All rights reserved
-7%
-5%
-3%
-1%
1%
3%
5%
7%
9%
11%
13%
0
50
100
150
200
250
300
350
400
Q1/2
012
Q2/2
012
Q3/2
012
Q4/2
012
Q1/2
013
Q2/2
013
Q3/2
013
Q4/2
013
Q1/2
014
Q2/2
014
Q3/2
014
Q4/2
014
Q1/2
015
Q2/2
015
Q3/2
015
Q4/2
015
Q1/2
016
Q2/2
016
Sales EBIT*, %
Metals, Energy & Water
• Metals refining orders on a low level
• Demand for sulfuric acid and off-gas
solutions
• Profitability remained challenging
July 27, 2016 OUTOTEC IR presentation28
Metals, Energy & Water
EUR million
Q1-Q2
2016
Q1-Q2
2015
Change,
%
Change in
comp.
currency, %
Order intake 190 409 -54 -51
Sales 275 315 -13 -9
Service sales 90 94 -4 2
Adjusted EBIT*)-7 17
Adjusted EBIT*), % -3 5
Unrealized and realized losses
related to valuation of FX
forward agreements -1 1
* Excl. restructuring and acquisition-related costs and PPA amortizations
Sales and adjusted EBIT development

© Outotec – All rights reserved
Service order intake by quarter
0
50
100
150
200
EUR million
Q3/1
3
Q2/1
3
Q1/1
3
Q4/1
2
Q3/1
2
Q2/1
2
Q2/1
6
Q1/1
6
Q4/1
5
Q3/1
5
Q2/1
5
Q1/1
5
Q4/1
4
Q3/1
4
Q2/1
4
Q1/1
4
Q4/1
3
Q1/1
2
Q4/1
1
Q3/1
1
Q2/1
1
Q1/1
1
Upgrade and long-term service contract orders and salesdeclined
• Cost optimization puts pressure on
services
• Upgrades and shut down services
postponed
• Spare part inventories optimized
July 27, 2016 OUTOTEC IR presentation29
Service sales by quarterSplit in service order intake
0
50
100
150
200
250
0
10
20
30
40
50
Q1/1
2
Q4/1
1
Q3/1
1
Q2/1
1
Q1/1
1
%
Q2/1
6
Q1/1
6
Q4/1
5
Q3/1
5
Q2/1
5
EUR million
Q1/1
5
Q4/1
4
Q3/1
4
Q2/1
4
Q1/1
4
Q4/1
3
Q3/1
3
Q2/1
3
Q1/1
3
Q4/1
2
Q3/1
2
Q2/1
2
Share of Outotec’s sales, % Sales
Spare parts & other servicesService projects
(incl. Capex spares)
Q1/1
4
Q1/1
5
Q2/1
4
Q2/1
5
Q3/1
4
Q3/1
5
Q4/1
4
Q4/1
5
Q1/1
6
Q2/1
6

© Outotec – All rights reserved
Ongoing projects tied up more capital
July 27, 2016 OUTOTEC IR presentation30
EUR millionQ1-Q2
2016
Q1-Q2
2015
Cash from operations 22 28
Change in working capital -66 -67
Interest 0 1
Taxes -6 -5
NET CASH FROM OPERATING ACTIVITIES -50 -43
Capital expenditure -11 -32
Acquisitions -3 -22
Other investing activities 2 0
CASH FLOW AFTER INVESTING ACTIVITIES -62 -96

© Outotec – All rights reserved
Liquidity & equity remained solid, EUR 30 million debt repaid
July 27, 2016 OUTOTEC IR presentation31
Q2
2016
Q2
2015
Q4
2015
Net interest-bearing debt, EUR million -50* 105 40
Gearing, % -9* 24 10
Equity-to-assets ratio, % 42* 33 31
Return on investment, %, LTM -4 2 -1
Return on equity, %, LTM -7 0 -4
Working capital at the end of the period, EUR million -37 39 -89
Equity, EUR million 540 444 405
Balance sheet total, EUR million 1,500 1,501 1,531
* If the hybrid bond were treated as a liability: Equity-to-assets ratio 30%, gearing 26%, and net interest-
bearing debt would be EUR 100 million.

© Outotec – All rights reserved
Fixed cost savings achieved as planned
32 July 27, 2016 OUTOTEC IR presentation
• Target is EUR 70
million annual fixed
cost reduction
compared to Q1-
Q3/2015 run rate.
• Of this, EUR 34
million was reached
in Q1-Q2/2016.
Fixed cost Fixed cost
2015 2016
278
348
84
95
82
Q2
Q1
Q3
Total Q1-Q3
Annualized
Target fixed cost level
69
74
Cumulative
savings
8
34

© Outotec – All rights reserved
Key events after June 30, 2016
July 27, 2016 OUTOTEC IR presentation33
July 1, 2016 July 4, 2016
Outotec updated its
Disclosure Policy
Outotec to deliver process
equipment for Acacia
Maden's Gökirmak
greenfield copper project in
Turkey, EUR 14 million
order booked in Q2/2016.
July 12, 2016
Outotec to deliver process
equipment for Bakyrchik
Mining's gold project in
Kyzyl, Kazakhstan. Order
booked in Q2/2016, value
not disclosed.
July 27, 2016
Markku Teräsvasara assumes the duties of Outotec’s CEO on
October 1, 2016
July 27, 2016
Order of process equipment to the Iron Concentrate Project
Sangan in North-Eastern Iran. Approx. EUR 10 million order
has been booked in the second quarter.

© Outotec – All rights reserved
Market outlook remains uncertain– industry’s investment forecast for 2016 lower than in 2015
July 27, 2016 OUTOTEC IR presentation34
Further capacity adjustments expected
in the current metals supply capacity,
which exceeds the demand.
The current market conditions and long-
term metals price outlook is not supportive
for investments.
Waste-to-energy
solutions are in
demand in certain
countries but
linked to
subsidies and
environmental
regulations.
Sustainable solutions are
in demand due to
tightening environmental
regulations.
Some geographic areas, such
as the Middle East, are more
active.
Service opportunities through productivity improvement
Process modernizations are
driven by the scarcity and cost of
water as well as emission control.

© Outotec – All rights reserved
Key focus in 2016
July 27, 2016 OUTOTEC IR presentation35
1. Improve fixed and product costs
2. Develop service business
3. Seek opportunities from growth
segments
1
2
3

© Outotec – All rights reserved
Based on the continued challenges of the Metals, Energy & Water segment, current order backlog
and uncertain market condition, the management narrows its profitability guidance range and
expects that in 2016:
Sales guidance for 2016 reiterated, profitability guidance range narrowed
July 27, 2016 OUTOTEC IR presentation36
Expected sales
from Q2
order backlog
(incl. services)
~EUR 490 million
Expected sales
from new
order intake
(incl. services)
EUR 3-200 million
+=Sales will be
approx.
EUR 1.0 - 1.2 bn
Adjusted EBIT*
will be approximately 2 – 4%
* Excluding restructuring and acquisition-related costs as well as purchase price allocation amortizations.
The wide guidance range reflects the current volatility of the market.
+Sales from Q1-Q2
EUR 507 million

© Outotec – All rights reserved
Profitability roadmap from 2015 to 2016
July 27, 2016 OUTOTEC IR presentation37
DepreciationProvision
release
Savings* Sales reduction,
market risk
aEBIT 2015 aEBIT
2016e
*Incl. cost structure program and other actions
Guidance upper
boundary 4%
Guidance lower
boundary 2%

© Outotec – All rights reserved
Interest bearing loans and hybrid bond, repayment profile
July 27, 2016 OUTOTEC IR presentation38
0
50
100
150
200
250
300
350
400
450
Q2/
16
Q3/
16
Q4/
16
Q1/
17
Q2/
17
Q3/
17
Q4/
17
Q1/
18
Q2/
18
Q3/
18
Q4/
18
Q1/
19
Q2/
19
Q3/
19
Q4/
19
Q1/
20
Q2/
20
Q3/
20
Q4/
20
Q1/
21
MEUR
Hybrid bond
OP Corporate Bank loan
EIB R&D loan
NIB R&D loan
Senior unsecured bond
Other IB debt

© Outotec – All rights reserved
Ongoing projects tying more capital, negative impact on working capital and cash flow
July 27, 2016 OUTOTEC IR presentation39
• Working capital is driven
by Order Intake due to
advance payments
• Capex is expected to
decrease from past years
• Cash flow typically
stronger in H2 than in H1
0,00
0,20
0,40
0,60
0,80
1,00
1,20
1,40
1,60
-300
-200
-100
0
100
200
300
Dec 2009 Dec 2010 Dec 2011 Dec 2012 Dec 2013 Dec 2014 Dec 2015 Jun 2016
Working Capital Capex Free Cash Flow Book-to-Bill

© Outotec – All rights reserved
Equity to assets ratio, gearing and liquidity at healthylevels
July 27, 2016 OUTOTEC IR presentation40
-160,0
-140,0
-120,0
-100,0
-80,0
-60,0
-40,0
-20,0
0,0
20,0
0,0
5,0
10,0
15,0
20,0
25,0
30,0
35,0
40,0
45,0
50,0
Dec 2006 Dec 2007 Dec 2008 Dec 2009 Dec 2010 Dec 2011 Dec 2012 Dec 2013 Dec 2014 Dec 2015 Jun 2016
171 291 318 258 280 403 359 324 282 301 299 Cash at hand
Equity to
assets
Gearing

© Outotec – All rights reserved
Customer solutions
July 27, 2016 OUTOTEC IR presentation41

© Outotec – All rights reserved
Services and solutions for minerals processing
July 27, 2016 OUTOTEC IR presentation42
METALPROCESSING
MININGORES, MINERALS, WATER CONCENTRATE
INDUSTRIAL
MINERALS
Services
Automation
Digitalization
Water management
Comminution
Dewatering
Sorting
BeneficiationMINERAL
PROCESSING
Landfill
Backfill
Construction
materials
Equipment
reuse

© Outotec – All rights reserved
We offer sustainable life cycle solutions for minerals processing sites
July 27, 2016 OUTOTEC IR presentation43
Quality, Environment,
Health, SafetyProcess
expertise
Maximized
plant productivity
Optimized
operating costs R&D
Higher community
expectations and
legal requirements
in terms of
environmental
responsibility
Shortage of
skilled labor
Declining ore
grade and
increasing
mineralogical
complexity

© Outotec – All rights reserved
Minerals processing customer case: Ore sorting
July 27, 2016 OUTOTEC IR presentation44
Ore sorting
Declining ore
grade and
increasing
mineralogical
complexity

© Outotec – All rights reserved
Laiva Gold mine in FinlandCustomer case, ore sorting
July 27, 2016 OUTOTEC IR presentation45
Laiva gold mine is owned by Nordic Mines.
Nordic Mines is a Nordic mining and exploration company aiming to
become one of the leading gold produces in Europe and at the same
time to be a role model in environmental mining.
Customer challenge:
• Mine is closed because of low head
grade ore
• Study completed around Outotec ore
sorting solution considering
reopening the mine
Outotec solution:
• Outotec sensor-based ore sorting
solution removing waste rock and
improving the head grade.
• When waste rock is removed there
is less ore feed to the crushing and
grinding circuit, reducing energy and
water consumption

© Outotec – All rights reserved
Laiva Gold mine in FinlandCustomer case, ore sorting
July 27, 2016 OUTOTEC IR presentation46
Study indicates that the Outotec ore sorting
solution enables reopening the mine:
“The economic assessment for the Laiva
Gold Mine indicated the potential for
restarting the site, which can be operated on
a long-term basis at a broad range of
commodity prices. Base-case net present
value of €77 million, producing 529,000 troy
ounces of gold over a seven-year mine life.”

© Outotec – All rights reserved
Minerals processing customer cases: Comminution
July 27, 2016 OUTOTEC IR presentation47
Comminution

© Outotec – All rights reserved
Reducing mill downtime at a gold mineCustomer case, comminution
July 27, 2016 OUTOTEC IR presentation48
Customer challenges:
• Excessive grinding mill downtime during
the year leading to decreased yearly
production
• Unplanned mill downtime due to liner
failure
• Inadequate tooling
• Limited reline shutdown planning
• Coordination between different
maintenance vendors
• In total of over 340 hours downtime
due to mill maintenance

© Outotec – All rights reserved
Reducing mill downtime at a gold mineCustomer case, comminution
Solution:
• Pre shutdown planning
• Liner redesign – to reduce the number of
pieces
• Tooling improvements – liner handler, skid
steers & hand tooling
• Changes to liner fixtures & fittings
• Continuous Improvement Program
• Optimizing liner life time through Outotec
patented MillMapper™ software
July 27, 2016 OUTOTEC IR presentation49

© Outotec – All rights reserved
Reducing mill downtime at a gold mineCustomer case, comminution
Customer benefits:
• 50% less downtime due to mill
maintenance
• In total a reduction of 170 hours of reline
incurred downtime
• Safer, less labor intensive relines
• Circa 12-14 million USD in additional
production revenue
July 27, 2016 OUTOTEC IR presentation50

© Outotec – All rights reserved
HIGmillTM fine grinding for FQM KevitsaCustomer case, comminution
Customer challenges
• Kevitsa mine started production 2012 – copper
circuit followed by nickel circuit
• As ore-body mined, valuable minerals became
finer and more difficult to recover
• 12% copper not recovered in copper circuit due
to poor liberation
• If liberation poor, copper-nickel separation
insufficient
• Existing plant in arctic circle with limited
footprints
July 27, 2016 OUTOTEC IR presentation51
• First Quantum Minerals (FQM) Kevitsa Mine in
Northern Finland
• Copper and Nickel operation
• HIGmill Project commissioned in 2015
Fine grinding circuit set up in FQM Kevitsa mine

© Outotec – All rights reserved
HIGmill fine grinding for FQM KevitsaCustomer case, comminution
Outotec solution:
• Mineral analysis showed very fine grind < 20
micron required for copper & nickel liberation
• Outotec conducted laboratory HIGmill fine grinding
and mineral recovery (flotation) tests
• Test showed full-scale HIGmill would improve
mineral recovery and grade
• HIGmill chosen as most energy efficient and
smallest footprint technology on market today
• Installation & commissioning only 2 weeks; Feb
2015
• Outotec provided ramp-up and operation support
July 27, 2016 OUTOTEC IR presentation52

© Outotec – All rights reserved
HIGmill fine grinding for FQM KevitsaCustomer case, comminution
Customer benefits:
• HIGmill improved overall plant performance
• Copper loss to nickel circuit improved
from 12% to 8%
• Overall copper recovery increased by up to 1.5%• 1.5% increase represents around $1million increase in final
copper value, after smelting and refining to produce LME grade
copper
• Improved concentrate grades• Less nickel in final copper concentrate
• Less copper in final nickel concentrate
• Installed & commissioned without effecting
production
• HIGmill allowed coarser primary grind and hence
higher plant throughput
• More metal out of same ton of ore < 2 year payback
July 27, 2016 OUTOTEC IR presentation53

© Outotec – All rights reserved
Minerals processing customer case: Flotation
July 27, 2016 OUTOTEC IR presentation54
Flotation
© Outotec – All rights reserved
Turn-key flotation retrofit with fast turnaroundCustomer case, flotation
Customer challenge:
• Poor flotation performance in terms of copper
and gold recovery
• Flotation circuit had poor availability
• Substantial maintenance requirements
• Limited time available for shutdown
Outotec solution:
• In-depth metallurgical assessment identified
large improvement potential in the flotation plant
• Retrofit of 10 x 160 m3 flotation cells
• A full turn-key delivery
• Advanced operator training with Outotec´s
Virtual Experience training
July 27, 2016 OUTOTEC IR presentation55
Yamana Gold is a Canadian-based gold producer, with
mines and operations in Canada, Mexico, Brazil,
Argentina and Chile. The Chapada (or Maracá) open pit
gold-copper mine in Brazil began production in 2007.
Retrofit project commissioned in 2016.
© Outotec – All rights reserved
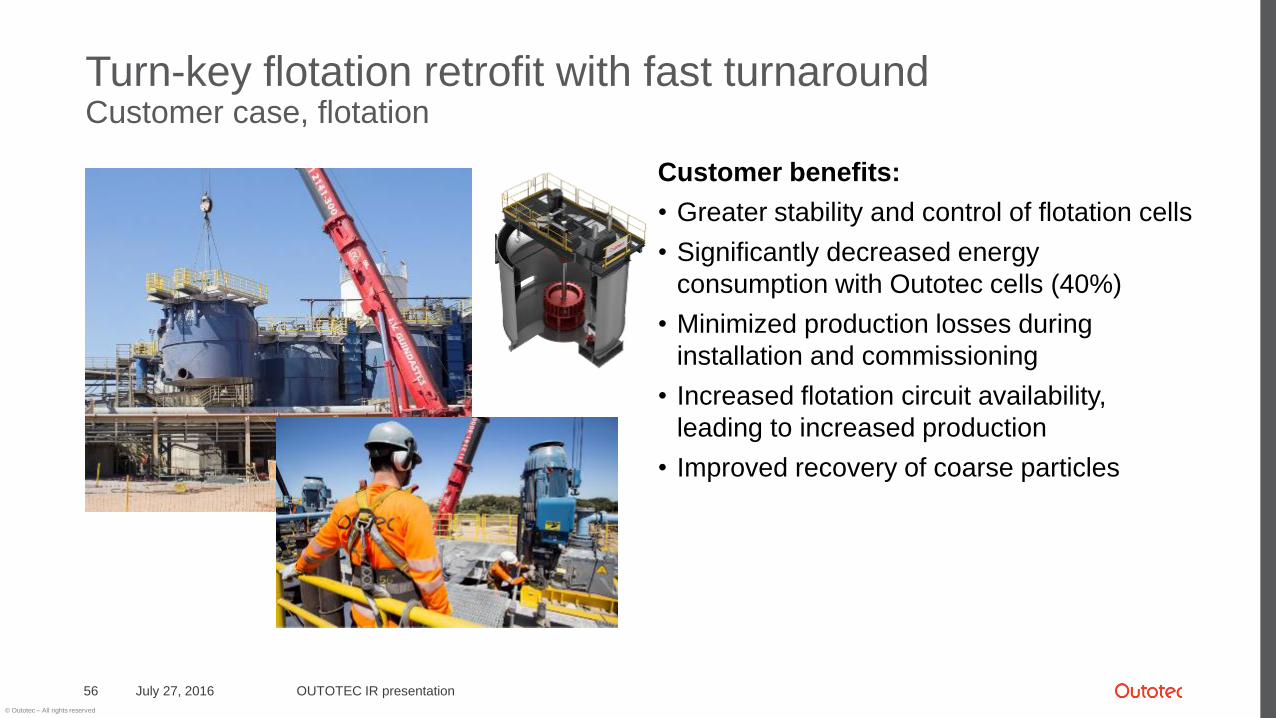
Turn-key flotation retrofit with fast turnaroundCustomer case, flotation
Customer benefits:
• Greater stability and control of flotation cells
• Significantly decreased energy
consumption with Outotec cells (40%)
• Minimized production losses during
installation and commissioning
• Increased flotation circuit availability,
leading to increased production
• Improved recovery of coarse particles
July 27, 2016 OUTOTEC IR presentation56

© Outotec – All rights reserved
Minerals processing customer case: Dewatering
July 27, 2016 OUTOTEC IR presentation57
Dewatering

© Outotec – All rights reserved
Digitalization creating new growth and opportunities -managing water balance and quality at mine sites
July 27, 2016 OUTOTEC IR presentation58
Solution: Intelligent digital solution for monitoring and managing data
on the mine site’s water balance and quality.
Value: Sustainable balance of water supply and consumption,
while stabilizing production and reducing business risks.
Online
monitoring
Digital
platform
Modeling &
simulation
Predictability
& reliability
Access
to water
Alternative
water
sources
Stable
process
Mitigation
of risks
License
to
operate
Outotec experts explaining the
challenges and introducing the
Outotec solution. More info and
registration: www.outotec.com

© Outotec – All rights reserved
Holistic process water management reduces operational risks, OPEX and effluents
July 27, 201659
With higher closure rate
• Reducing raw water need
• Reducing process variations to improve yield
• Process water doesn’t need to be potable water grade
• At full closure basically no effluents
• Less socio-political risk related to fresh water
OUTOTEC IR presentation
* Example of 20 Mt/a Cu concentrator water balance
in Chilean climate using paste tailings, price of raw
water 4 USD / m3.
© Outotec – All rights reserved
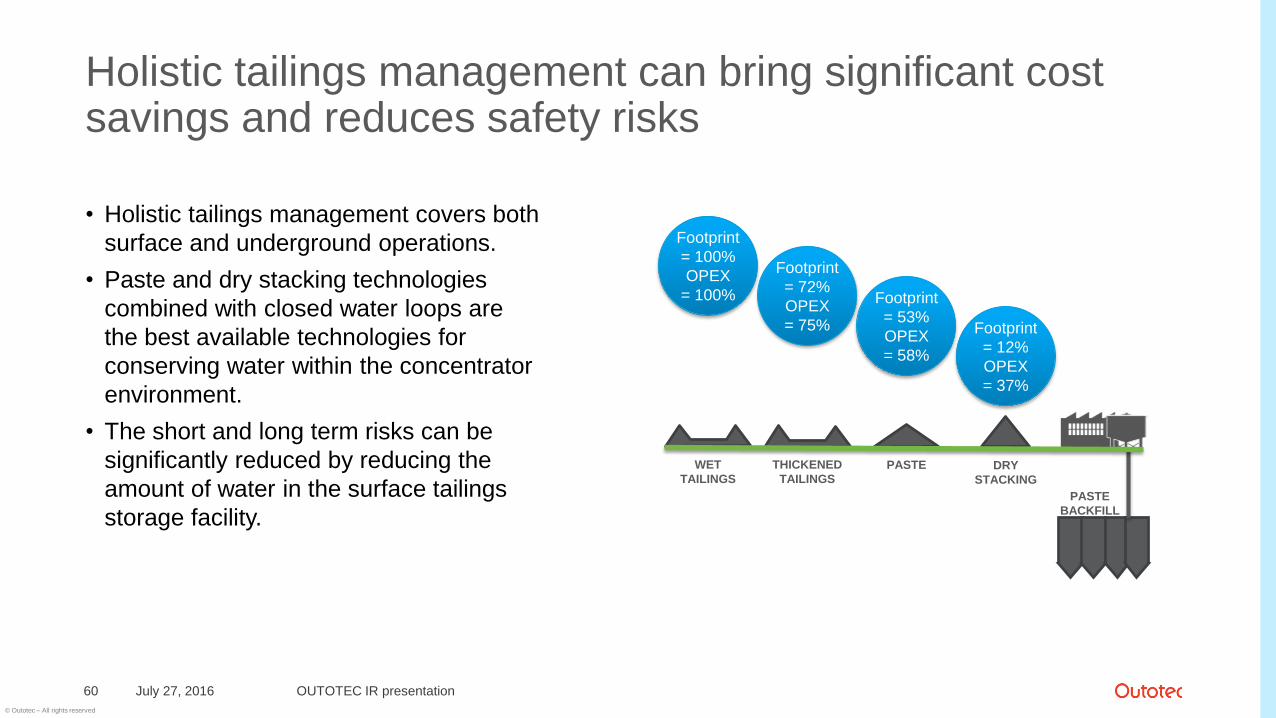
Holistic tailings management can bring significant cost savings and reduces safety risks
• Holistic tailings management covers both
surface and underground operations.
• Paste and dry stacking technologies
combined with closed water loops are
the best available technologies for
conserving water within the concentrator
environment.
• The short and long term risks can be
significantly reduced by reducing the
amount of water in the surface tailings
storage facility.
July 27, 2016 OUTOTEC IR presentation60
PASTE
BACKFILL
DRY
STACKING
Footprint
= 12%
OPEX
= 37%
PASTE
Footprint
= 53%
OPEX
= 58%
THICKENED
TAILINGS
Footprint
= 72%
OPEX
= 75%
WET
TAILINGS
Footprint
= 100%
OPEX
= 100%

© Outotec – All rights reserved
Technological solutions for metal processing
July 27, 2016 OUTOTEC IR presentation61
Gas cleaning and sulfuric acid
Roasting
Sintering and pelletizing
Smelting and refining
CalcinationProcess control
Leaching and solution
purification
Direct and smelting
reduction of iron ore
Solvent extraction
Electrorefining and
electrowinning
Services
CONCENTRATE METALS, SALTS, CHEMICALS
METALPROCESSING
SLAG, RESIDUES, RECYCLED METAL
FERTILIZER PRODUCTIONSULFURIC
ACID
MANUFACTURINGMINERAL PROCESSING

© Outotec – All rights reserved
Customer caseFull solution
Metals, Energy & Water
July 27, 2016 OUTOTEC IR presentation62
© Outotec – All rights reserved
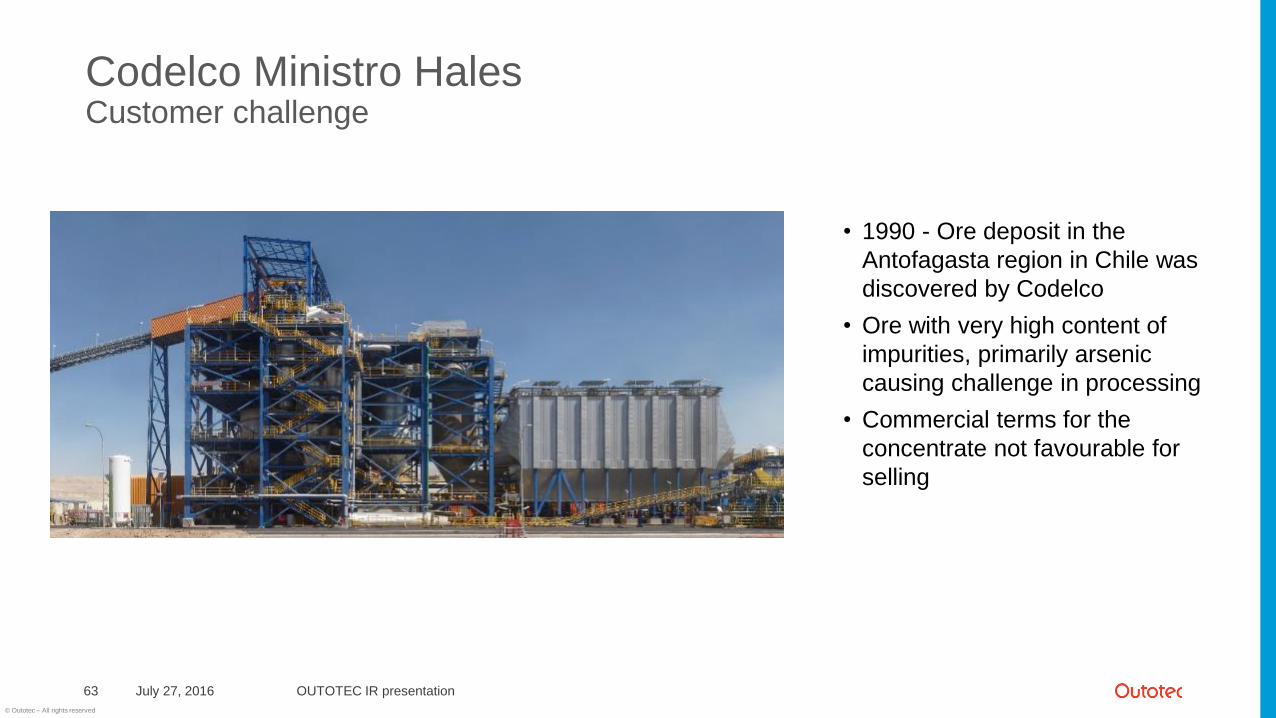
Codelco Ministro HalesCustomer challenge
July 27, 201663
• 1990 - Ore deposit in the
Antofagasta region in Chile was
discovered by Codelco
• Ore with very high content of
impurities, primarily arsenic
causing challenge in processing
• Commercial terms for the
concentrate not favourable for
selling
OUTOTEC IR presentation

© Outotec – All rights reserved
Codelco Ministro HalesOutotec solution
July 27, 201664 OUTOTEC IR presentation
1991
• Codelco and Outotec start working together on solving the challenges
2010• Investment decision made
2014• Commissioning completed
2016• Official inauguration
© Outotec – All rights reserved
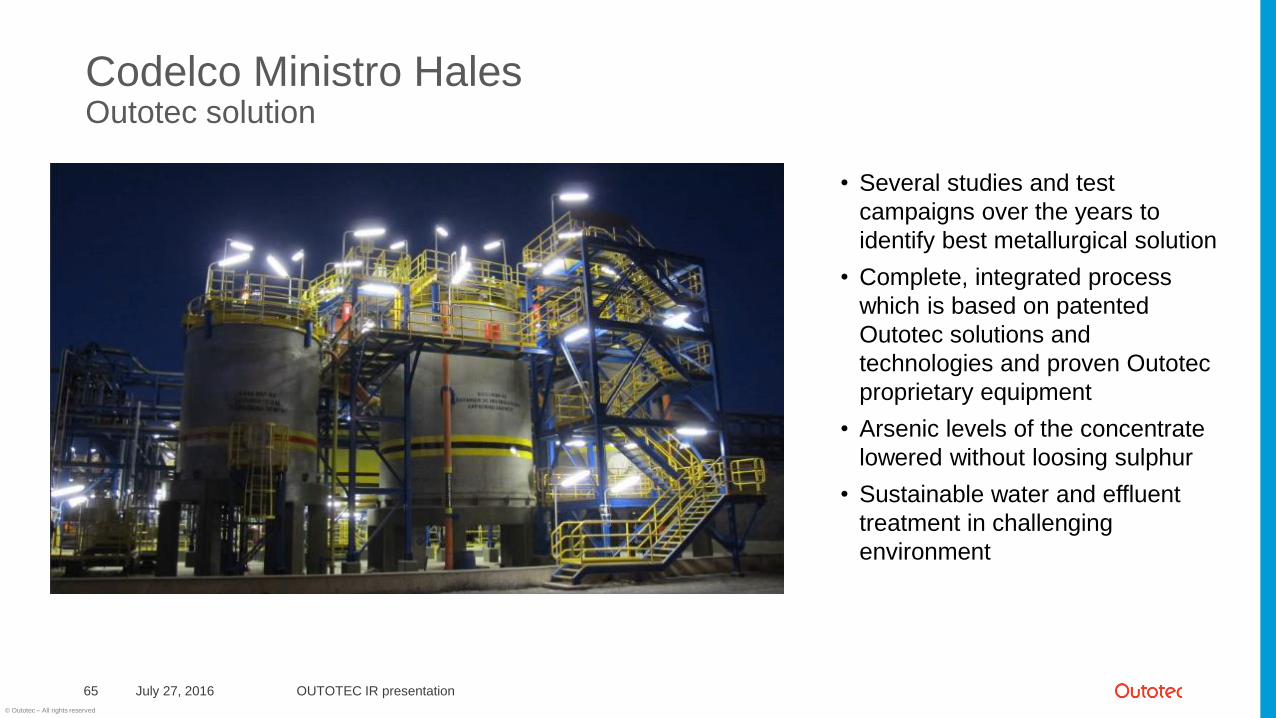
Codelco Ministro HalesOutotec solution
July 27, 201665
• Several studies and test
campaigns over the years to
identify best metallurgical solution
• Complete, integrated process
which is based on patented
Outotec solutions and
technologies and proven Outotec
proprietary equipment
• Arsenic levels of the concentrate
lowered without loosing sulphur
• Sustainable water and effluent
treatment in challenging
environment
OUTOTEC IR presentation

© Outotec – All rights reserved
Codelco Ministro HalesOutotec solution
July 27, 2016 OUTOTEC IR presentation66
Partial roasting
• Patented Outotec solution which
removes over 90% of the arsenic in
the ore concentrate
• Exceeding 605,000 tpa concentrate
(110%)
Gas Cleaning
• Outotec’s proprietary gas cleaning
and sulfuric acid production
technology eliminates over 99.9% of
the gaseous emission of the facility.
Effluent Treatment
• Outotec’s proprietary effluent treatment technology cleans the process
effluents and recirculates clean water back to the process.
Outotec delivers a complete, integrated solution from a broad portfolio of patented and
proprietary solutions, and a long history of process technology

© Outotec – All rights reserved
Customer caseModernization
Metals, Energy & Water
July 27, 2016 OUTOTEC IR presentation67

© Outotec – All rights reserved
Norilsk Nickel, Nadezhda Flash Smelting Furnace No.1 modernizationCustomer challenge
July 27, 201668 OUTOTEC IR presentation
• Changing raw material base requires
dealing with low-heat value and more
complex concentrates
• Very tight implementation schedule
• Supplier responsible for providing
Russian Safety Approvals which is
normally out of scope

© Outotec – All rights reserved
Norilsk Nickel, Nadezhda Flash Smelting Furnace No.1 modernizationOutotec solution
July 27, 201669 OUTOTEC IR presentation
• Higher capacity feeder and concentrate burner and new furnace cooling elements and cooling monitoring system based on Outotecproprietary technologies
• Pre-planning and experienced personnel
• Extensive performance guarantees combined with a long-term service contract
• Using internal and external resources to obtain Russian Safety Approvals
• Short implementation and down time and fastramp up after start up

© Outotec – All rights reserved
Norilsk NickelA satisfied customer
July 27, 201670 OUTOTEC IR presentation

© Outotec – All rights reserved
Customer caseProfitability improvementMetals, Energy & Water
July 27, 2016 OUTOTEC IR presentation71

© Outotec – All rights reserved
Pelletizing Segregation SolutionCustomer challenge
OUTOTEC IR presentationJuly 27, 201672
• Customer had a profitability
challenge in an iron-ore pelletizing
plant in Brazil
• Improvement was required through
• Improved productivity
• Improved product quality
• Reduced fuel consumption
Fuel
Consumption
Productivity
Product
Quality

© Outotec – All rights reserved
Pelletizing Segregation SolutionOutotec solution
July 27, 2016 OUTOTEC IR presentation73
• Assess to identify improvement potential
• Plant Performance Assessment
• CFD Study
• Pot Grate Tests
• Design a tailored solution
• 3D area scanning
• Double Deck Roller Screen basic design.
• Shutdown planning
• Deliver a holistic, safe & efficient implementation
• Detail design for modernization
• Retrofit new Outotec Double Deck Roller
Screen
• Shutdown execution
• Verify & support performance results
• Segregation verification test
• Energy efficiency test
Delivered Value*
10.5% fuel savings
Improved productivity
2,8 M€ annual OPEX
savings*
6 month payback*
*Value Assumptions:
Natural Gas: € 0.37/Nm3, Antracite: € 0.12/kg
Only estimates based on pot grate tests.

© Outotec – All rights reserved
Solutions and services for energy production
July 27, 2016 OUTOTEC IR presentation74
STEAM, ELECTRICITY, ENERGY PRODUCTION
Heat recovery
Bio energy
Flue gas cleaning
Waste to Energy
Combustion and gasification
ServicesENERGY
PRODUCTION
USERSAGRICULTURE
PHOSPHORUS
BIOMASS COMBUSTIBLE WASTE
MUNICIPAL SLUDGE

© Outotec – All rights reserved
Customer caseWaste to Energy
Metals, Energy & Water
July 27, 2016 OUTOTEC IR presentation75

© Outotec – All rights reserved
ERZ Zürich, sludge incineration plantCustomer challenge
July 27, 201676
• Sustainable solution required to treat
sewage sludge from the entire canton
of Zürich, Switzerland covering over
70 waste water treatment plants!
• March 2013 – public must approve
such an investment in a referendum.
96% vote in favor, project goes ahead
• Summer 2015 – commissioning
complete and plant goes into
operation
• October 2015 – official inauguration
OUTOTEC IR presentation

© Outotec – All rights reserved
• Limitations for sewage sludge
disposal in landfill and as fertilizer
• High transport and logistics costs
for sludge containing > 70% water
• Strict emissions limits with plant
location in the heart of Zürich
ERZ Zürich, sludge incineration plantCustomer challenge
July 27, 201677 OUTOTEC IR presentation

© Outotec – All rights reserved
ERZ Zürich, sludge incineration plantOutotec solution
July 27, 201678
• Self-sustaining thermal treatment of
sewage sludge without additional
fuel.
• Thermal incineration of sewage
sludge using Outotec fluidized
bed technology
• Thermal dryer using heat from
the process.
• State-of-the-art flue gas cleaning
system
• Phosphorus recovery possible from
ash
OUTOTEC IR presentation

© Outotec – All rights reserved
Customer caseWaste to Energy
Metals, Energy & Water
July 27, 2016 OUTOTEC IR presentation79

© Outotec – All rights reserved
UK moving to a new renewable energy subsidy scheme
July 27, 2016 OUTOTEC IR presentation80
Ending of the previous subsidy
scheme resulted in record high
order intake for Outotec Waste
to Energy solutions for Advanced
staged gasification using
renewable fuels
6 plants & four
12-year O&M
New subsidy scheme
continued to be good for
Outotec Waste to Energy
technologies
1 plant,
next CFD auction
expected late
2016

© Outotec – All rights reserved
Levenseat Renewable ltdCustomer challenge
July 27, 201681
• UK is exporting high amounts
of RDF to be incinerated in
Europe
• High landfill cost in the UK
OUTOTEC IR presentation

© Outotec – All rights reserved
Levenseat Renewable ltdOutotec solution
July 27, 201682 OUTOTEC IR presentation
• Waste to Energy plant in UK
• Gasification of waste is an
environmentally friendly way of
efficiently converting waste to
energy
• Reliable and tested solution
based on the Outotec
Fluidized bed technology with
over 100 references
• 2015 Contract signing
• 2017 Expected start up

© Outotec – All rights reserved
Service offering
building blocks
Our solutions target to address customer challenges and improve their performance and efficiency
July 27, 2016 OUTOTEC IR presentation83
Performance Services
Operations
Services
Advisory
Services
Maintenance
ServicesRemote
Services
Training
Services
Spare and
Wear PartsUpgrades
Decreased
operating cost
Improved health and
safety
Improved
environmental
efficiency
Improved capital
efficiency
Improved equipment
and process
efficiency

© Outotec – All rights reserved
Share information
July 27, 2016 OUTOTEC IR presentation84
Shareholders June 30, 2016 Shares % of shares and votes Change +/- Change %
1 Solidium Oy 27,265,232 14.89 0 0
2 Varma Mutual Pension Insurance Company 12,778,363 6.98 0 0
3 Ilmarinen Mutual Pension Insurance Company 11,234,530 6.14 -300,000 -2.6
4 Tamares Nordic Investments B.V. 10,192,356 5.57 0 0
5 The State Pension Fund 4,100,000 2.24 0 0
6 Kumera Oy 2,426,136 1.32 0 0
7 Keva 2,425,120 1.32 0 0
8 Outotec Oyj 1,797,526 0.98 -590 -0.03
9 Holding Manutas Oy 1,600,000 0.87 0 0
10 Kumpulainen Vesa 1,033,758 0.56 0 0
11 Mandatum Life Insurance Company Limited 1,032,939 0.56 0 0
12 Sijoitusrahasto Aktia Capital 1,000,751 0.55 271,385 37.21
13 Etera Mutual Pension Insurance Company 717,000 0.39 0 0
14 OP Life Assurance Company Ltd 716,465 0.39 -21,689 -2.94
15 Security Trading Oy 625,000 0.34 0 0
16 Etola Erkki 600,000 0.33 0 0
17 Kaleva Mutual Insurance Company 550,000 0.30 0 0
18 Tiiviste-Group OY 500,000 0.27 0 0
19 SEB Finlandia Investment Fund 469,801 0.26 0 0
20 Veritas Pension Insurance Company Ltd. 367,900 0.20

© Outotec – All rights reserved
POC and cashflow profile example
July 27, 2016 OUTOTEC IR presentation85
0
20
40
60
80
100
120
1 2 3 4 5 6 7 8 9 10 11 12 13 14 15 16 17 18 19 20 21 22 23 24 25 26 27
POC Cumulative cashflow
MEUR
Month
Total order backlog
structure in 2012
Total order backlog
structure in 2015
0% 100%
Percentage of Completion, %
Timing of large project
completions, and
possible release of
provisions, affects
quarterly earnings.
Advance
payment
~10-30%
NOTE: The figures are illustrative and vary project by project
Timing of large project completions affects quarterly earnings
