sustainable urban mobility in latin america and the … · sustainable urban mobility in latin...
TRANSCRIPT

Paola Jirón is a Professor of Urban and Housing issues at the Institute of Housing (INVI), Faculty of Architectura and Urbanismo (FAU), University of Chile. She holds a PhD urban and regional planning, and her work is mainly based on Latin American cities. Her main interests relate to urban daily mobility practices, urban exclusion, urban quality of life, gender differences in urban areas, on which she has published widely. She is also Director of Research and Development (since 2010), at FAU, UCHILE. Comments can be sent to the author at: [email protected].
Sustainable Urban Mobility in Latin America and the Caribbean
Paola Jirón
Thematic study prepared for
Global Report on Human Settlements 2013
Available from http://www.unhabitat.org/grhs/2013

Disclaimer: This case study is published as submitted by the consultant, and it has not been edited by the United Nations. The designations employed and the presentation of the material in this publication do not imply the expression of any opinion whatsoever on the part of the Secretariat of the United Nations concerning the legal status of any country, territory, city or area, or of its authorities, or concerning delimitation of its frontiers or boundaries, or regarding its economic system or degree of development. The analysis, conclusions and recommendations of the report do not necessarily reflect the views of the United Nations Human Settlements Programme, the Governing Council of the United Nations Human Settlements Programme or its Member States. Nairobi, 2011

Contents 1. The Crisis of Sustainability in Urban Transport .............................................................. 1
2. Non-Motorized Transport ................................................................................................... 3
2.1. Walking in Cali............................................................................................................... 4 2.2. Cycling in Santiago ........................................................................................................ 5 2.3. Main challenges.............................................................................................................. 5
3. Public Transport .................................................................................................................. 7
3.1. Bus rapid transit (BRT) in Latin America ...................................................................... 9 3.2. Metro networks in Latin American and the Caribbean ................................................ 13 3.3. Urban trains .................................................................................................................. 16 3.4. Integrated systems ........................................................................................................ 16 3.5. Challenges .................................................................................................................... 17
4. Informal Motorized Transport ......................................................................................... 18
4.1. Challenges .................................................................................................................... 24
5. Private Motorized Transport ............................................................................................ 25
5.1. Motorization rates......................................................................................................... 25 5.2. Distance travelled ......................................................................................................... 27 5.3. Urban concessions ........................................................................................................ 28 5.4. Helicopters as a means of urban transport.................................................................... 29 5.5. Challenges .................................................................................................................... 29
6. Commercial Goods Transport .......................................................................................... 30
6.1. Belo Horizonte, Brazil.................................................................................................. 31 6.2. Freight transport and infrastructure in Mexico City..................................................... 32 6.3. Challenges .................................................................................................................... 33
7. Integrated Land Use and Transport Planning ................................................................ 34
7.1. Guadalajara, Mexico: The need to understand urban structure .................................... 34 7.2. Curitiba, Brazil: The right to access ............................................................................. 35 7.3. Bogotá, Colombia: Resurgence of public space........................................................... 35 7.4. The case of Ecuador ..................................................................................................... 35 7.5. Santiago, Chile: Conditioned planning......................................................................... 36 7.6. Challenges .................................................................................................................... 36
8. Social Sustainability of Urban Transport ........................................................................ 37
8.1. Strategic Mobility Plan for Medellin 2008–2011......................................................... 38 8.2. Road safety and transport ............................................................................................. 39 8.3. Successful experiences regarding prevention of traffic accidents................................ 41 8.4. Road safety plan by Inter-American Development Bank............................................. 42 8.5. Traffic accidents in Bogotá .......................................................................................... 43 8.6. Cyclists’ institutions ..................................................................................................... 43
9. Urban Transport and the Environment........................................................................... 45
9.1. Brazil: Second largest producer of ethanol fuel ........................................................... 46 9.2. Bicycle use as a response to environmental concerns .................................................. 46 9.3. Mobility plan, Montevideo, Uruguay........................................................................... 48 9.4. Rosario strategic plan 2018 (PERM+10): Integral urban mobility plan in Rosario..... 48 9.5. Challenges .................................................................................................................... 49
GRHS 2013: Regional report Paola Jirón iii Latin America and the Caribbean

10. Economically Sustainable Urban Transport ................................................................. 50
10.1. Integrated urban transport plan, PITU 2025, São Paulo, Brazil ................................. 50 10.2. Congestion charge ...................................................................................................... 52
11. Urban Transport Institutions and Governance............................................................. 56
11.1. Transmilenio vs Transantiago: Institutional frameworks to implement integrated transport systems........................................................................................................ 56
11.2. Civic demonstrations against transport ...................................................................... 58 11.2.1. Chile, the Case of the Southern Access to Santiago ........................................... 58 11.2.2. The case of the women-only passenger cars in Mexico City ............................. 58 11.2.3. Protests against Transmilenio in Colombia ........................................................ 59 11.2.4. The railway system crisis in Argentina............................................................... 59 11.2.5. Naked cyclists ..................................................................................................... 60
12. Towards Sustainable Urban Transport ......................................................................... 61
List of References ................................................................................................................... 63
List of boxes
Box 1. Santiago de Chile (Transantiago) ................................................................................. 12
Box 2. Informal transport in Lima ........................................................................................... 20
Box 3. Informal transport in Colombian cities......................................................................... 21
Box 4. Urban road concession systems in Chile and Argentina .............................................. 28
List of figures
Figure 1. Modal split according to income groups in Santiago de Chile ................................... 3
Figure 2. Modal split according to socioeconomic level in Bogotá, Colombia ......................... 4
Figure 3. Types of collective passenger transport systems ........................................................ 9
Figure 4. Latin American cities metro extension (in kilometres) ............................................ 15
Figure 5. Traffic fatalities in Latin America and the Caribbean (1996 and 2001)................... 40
Figure 6. Trends in number of traffic accidents in Latin America and the Caribbean (1990–2004) .......................................................................................................................... 41
Figure 7. Number of cars in Santiago metropolitan region (1993–2007) ................................ 53
List of tables
Table 1. Modal partition in Mexico City, Bogotá and Santiago ................................................ 3
Table 2. Non-motorized transport in Chilean cities ................................................................... 5
Table 3. Types of collective transport supply (2007)................................................................. 7
Table 4. São Paulo public transport bus operation..................................................................... 8
Table 5. Distance travelled by buses in km................................................................................ 8
GRHS 2013: Regional report Paola Jirón iv Latin America and the Caribbean

Table 6. BRT results, selected LAC cities ............................................................................... 10
Table 7. Summary of BRT systems in Latin America ............................................................. 11
Table 8. Existing metro networks in Latin America and the Caribbean .................................. 13
Table 9. Planned metro networks in Latin America and the Caribbean .................................. 14
Table 10. Metro stations in Latin America .............................................................................. 15
Table 11. Mass transport cost in Latin American cities ........................................................... 16
Table 12. Informal transport systems in some selected Latin-American cities ....................... 18
Table 13. Collective transport fleet in some selected Latin-American cities (2007) ............... 19
Table 14. Average age of collective transport fleet (2007)...................................................... 20
Table 15. Modal split, Bogotá.................................................................................................. 21
Table 16. Evolution of urban transport modal split in Buenos Aires, Argentina..................... 22
Table 17. Modal split metropolitan region of Rio de Janeiro (2004) and Bogotá ................... 22
Table 18. Increases in the number of cars, selected Latin American countries (2000–2007) . 25
Table 19. Number of cars and motorcycles in selected cities .................................................. 26
Table 20. Motorization rates in Colombia ............................................................................... 27
Table 21. Daily travelled distance in private cars (2007) ........................................................ 27
Table 22. Energy consumption in road transportation: The case of El Salvador..................... 30
Table 23. Vehicle fleet in Mexico City .................................................................................... 33
Table 24. Number of car traffic fatalities in Latin America and the Caribbean (1996–2003). 40
Table 25. Institutions working on cycling promotion .............................................................. 43
Table 26. Transport indicators in selected cities ...................................................................... 45
Table 27. Cycling scorecard for Santiago, Montevideo, Quito and Florianopolis................... 47
Table 28. PITU proposed investment....................................................................................... 51
Table 29. Number of cars in Santiago metropolitan region, 2007 ........................................... 52
Table 30. Households, inhabitants and cars in Greater Santiago (1991–2001) ....................... 53
Table 31. Evolution of household size in Greater Santiago..................................................... 54
Table 32. Household distribution according to income ........................................................... 54
Table 33. Number of motorized trips, per person and per household (1977–2001) ................ 54
List of acronyms and abbreviations
AUSA Autopistas Urbanas Sociedad Anónima (Urban Highways Limited)
BRT bus rapid transit
CO2 Carbon dioxide
ECLAC Economic Commission for Latin America and the Caribbean
encuesta origen destino (origin and destination survey) EOD
GRHS 2013: Regional report Paola Jirón v Latin America and the Caribbean

GRHS 2013: Regional report Paola Jirón vi Latin America and the Caribbean
FPV Fondo de Prevención Vial (road prevention fund), Colombia
GDP gross domestic product
IADB Inter-American Development Bank (Banco Interamericano de Desarrollo, BID)
km kilometre
LAC Latin America and the Caribbean
LRT light rail transit
Mexico DF México Distrito Federal (Mexico Federal District, capital of Mexico)
MMMex metropolitan municipalities of the State of Mexico
PITU plan integrado de transporte urbano (integrated urban transport plan)
PTUS Plan de Transporte Urbano para Santiago (Urban Transportation Plan for Santiago)
R$ Brazilian real
US United States of America
US$ US dollar

1. The Crisis of Sustainability in Urban Transport Most cities in Latin America and the Caribbean (LAC)1 face similar problems in relation to urban transport and urban daily mobility including deficient public transport supply, informality in transport systems, congestion, pollution and traffic fatalities,2 all of which have differentiated impacts according to cities, income groups, gender, age, disability or level of education, amongst other. As a region characterized by significant income inequality, accessibility issues directly impact the way people travel, how trips are organized, how long it takes them to do so, the distances they are able to travel, the issues that arise during these trips and what exactly people have access to, become significant questions when attempting to address mobility and transport.3
The region is characterized by an accelerated urbanization process and a significant percentage of urban population. Countries may be grouped according to their degree of urbanization, where the first group, with more than 70 per cent urbanization includes Argentina, Uruguay, Chile, Venezuela, Brazil, Mexico and Peru. A second group, with urban population between 50 and 70 per cent of total population is made up of Colombia, Nicaragua, Ecuador, Panama and Bolivia.4 Central American and Caribbean countries make up the third group with predominant rural populations.
Moreover, one of the most important differentiating factors in the urbanization process in LAC rests on the structure and consolidation of the city system. Some countries have a macrocephalic model, with a high concentration of total population in the main city, while others have a set of urban nuclei of similar sizes that counterbalance the main city influence. This situation affects the magnitude of problems and possible transport and infrastructure solutions.
The rapid urbanization process has generated cities that grow faster than their ability to provide adequate infrastructure to cope with it in an organized and planned manner. Failure to provide adequate mobility solutions for the population as a whole becomes a pressing issue today when people are switching from predominant pedestrian mobility mainly to private transport, but also public transport or cycling as new forms of mobility.
A consequence of the rapid speed in which cities are growing is the limited provision of formal transport means. One major trend in mobility solutions in LAC relates to informality as a common and often predominant form of collective transport. This generates a proliferation of low capacity transport units moving about the city and increasing traffic congestion. The diversity of modes, operations, prices, and routes used by informal transport means, fill an important gap left by formal transport means.
Along with previous trends, economic growth, import tariff reduction and ease in credit access, have generated an increase in car numbers in most cities in the region and the desire for car ownership. This increase in demand also requires investment in urban highways that do not always benefit society as a whole. This trend generates great levels of congestion as well as environmental concerns in terms of urban expansion and its consequences,
1. The geographic area of study includes 46 countries (22 in Latin America and 26 in the Caribbean) including their main cities. For some of these cities an abundance of information can be gathered, particularly for Brazil, Colombia, Chile and Mexico, however, for many of the other countries and cities (particularly Central America and the Caribbean) information is weaker and despite efforts to obtain significant data, the result is somewhat weak. Moreover, often the level of information is more readily available at country than at a city level. 2. Vasconcellos, 2010. 3. Jiron, 2010. 4. Valadares and Coelho, undated.
GRHS 2013: Regional report Paola Jirón 1 Latin America and the Caribbean

contamination and high-energy consumption, all of which question the sustainability of such trends in the future.
Furthermore, although some cities have rich information feeding transport interventions, this is mostly demand and supply based. For the most part, transport interventions have been sectoral, mainly guided from transport ministries, leaving the link between urban transformations and transport unresolved.5 This generates a fragmented approach to transport plans and urban development as well as great inequality in urban areas and accessibility problems in most cities in the region. Furthermore, these interventions rarely consider the way local transport systems operate, despite the fact that these often make and important contribution to transport systems.6
The perception of safety, fear and crime in transport systems and infrastructure is another issue present in LAC cities. This situation affects people at various levels of mobility processes, particularly women and young girls being harassed in public transport, or the impossibility to travel with valuable goods for the fear of being robbed; fear of using taxis for possible theft; fear of driving and being robbed or kidnapped. Motorcyclists and cyclists face increasing fear being hit by buses or cars or being robbed if bicycles are parked in public places and transport fatalities are a great concern for the population.
To overcome these difficulties, cities present important advances which would indicate a slow yet positive attempt to improve mobility conditions in many the region’s urban areas. Although public transport provision is not always formal and safe in the region, many cities are making important efforts to formalize collective transport modes. The main trends in the region relative to formal public transport means include plans and implementations of BRT (Bus Rapid Transit) systems and metro extensions. For private transport, urban highways are also a parallel trend. However, regardless of the amount of investment and subsidies, these are not often translated into better transport quality.
Cities like Curitiba, Brazil, have a long history in implementing innovative and inte–grated forms of transport. Bogotá and Medellin in Colombia are continuously incorporating new and increasingly participative forms of transport decisions. Others have made sudden and considerable changes to transport and mobility systems, as is the case of Santiago de Chile. While others propose new ideas, as is the case with Montevideo, Uruguay, or Rosario and Salta in Argentina. The institutional frameworks upon which the decisions are made become increasingly relevant if they are to be taken as models to be followed in the future.
5. Montezuma, 2003a. 6. Montezuma, 2003b.
GRHS 2013: Regional report Paola Jirón 2 Latin America and the Caribbean

2. Non-Motorized Transport Non Motorized Transport, basically walking and cycling, are considered intrinsically clean transport modes as they do not use combustion fuel or energy beyond that capable by the human body, thus its only consumption is translated to calories and its air and acoustic emissions null. These forms of transport are also the most accessible transport modes for urban dwellers in the region, due to its cost. However, users lack safe infrastructure and are generally overly represented in traffic accidents.
In Mexico City, Bogotá and Santiago, as shown in Table 1, together public transport and walking are the predominant modes of transport. However, as seen in Chapter 5, private transport is rapidly replacing this mode. Although walking is still a preferable mode of transport in the region, most pedestrians belong to lower income groups, while car users are mostly in the higher income groups, as can be seen in Figure 1 for the case of Santiago and Figure 2 for the case of Bogotá. As discussed in the following section, the conditions in which walking takes place require urgent measures if it is to be considered as a sustainable transport mode.
Table 1. Modal partition in Mexico City, Bogotá and Santiago
City Public Transport Walking Cycling Car, motorcycle,
taxi Mexico 50 30 1 19
Bogotá 57 15 2 25
Santiago 33 37 3 27
Source: Based on Ciudad Viva, 2011.
Figure 1. Modal split according to income groups in Santiago de Chile
Source: Jiron, 2008, based on SECTRA.
GRHS 2013: Regional report Paola Jirón 3 Latin America and the Caribbean

Figure 2. Modal split according to socioeconomic level in Bogotá, Colombia
0%
10%
20%
30%
40%
50%
60%
70%
80%
90%
100%
Low Middle HighIncome Group
Public Transport Non Motorised Private Vehicle Other
Source: Flechas, 2007.
2.1. Walking in Cali The situation in Cali, Colombia, is similar to that of most cities in the region, where conditions for pedestrians are often physically difficult and dangerous. Along with cyclists, pedestrians face the weakest position in the current urban transport organization in the city, mainly due to the lack or deficient state of infrastructure. Although there are sidewalks in the city, these are not uniformly flat, either due to their construction or because cement is falling apart. There is difficulty in walking and constant risk of feet dislocation or falling into holes or open sewerages. House or building owners construct their own sidewalks, often with ramps to allow car entrance to garages. The differing levels makes walking very difficult and pedestrians require awareness, especially women with heels; baby carriages are impossible to carry on sidewalks. Many sidewalks are narrow and barely allow for one person to walk on them at a time. In inbuilt land plots there are no sidewalks, and pedestrians are obliged to walk on car lanes. Walking on sidewalks at night is practically impossible due to lack of public lighting, thus many pedestrians are forced to walk on car lanes, becoming exposed to car accidents.7
In Cali, only 70 per cent of roads are paved, hence pedestrians and cyclists become filthy with dust in dry weather and in rainy season, they walk in mud. Where sidewalks exist, they are often unusable due to obstacles on the road, either from construction waste, parked vehicles or informal vendors. Another risk for pedestrians relates to lack of separate signage at crossing points or limited painted pedestrian zebra crossings.8 A major problem for pedestrians in Cali, and in many other Latin American cities, is air pollution exposure while moving between different sources of contamination (cars, motorcycles, buses, taxis, trucks and other cargo transport) without any sort of protection. Finally, a problem for pedestrians and most urban travellers in general is the fear of being mugged.
7. Moller, 2006. 8. Moller, 2006.
GRHS 2013: Regional report Paola Jirón 4 Latin America and the Caribbean
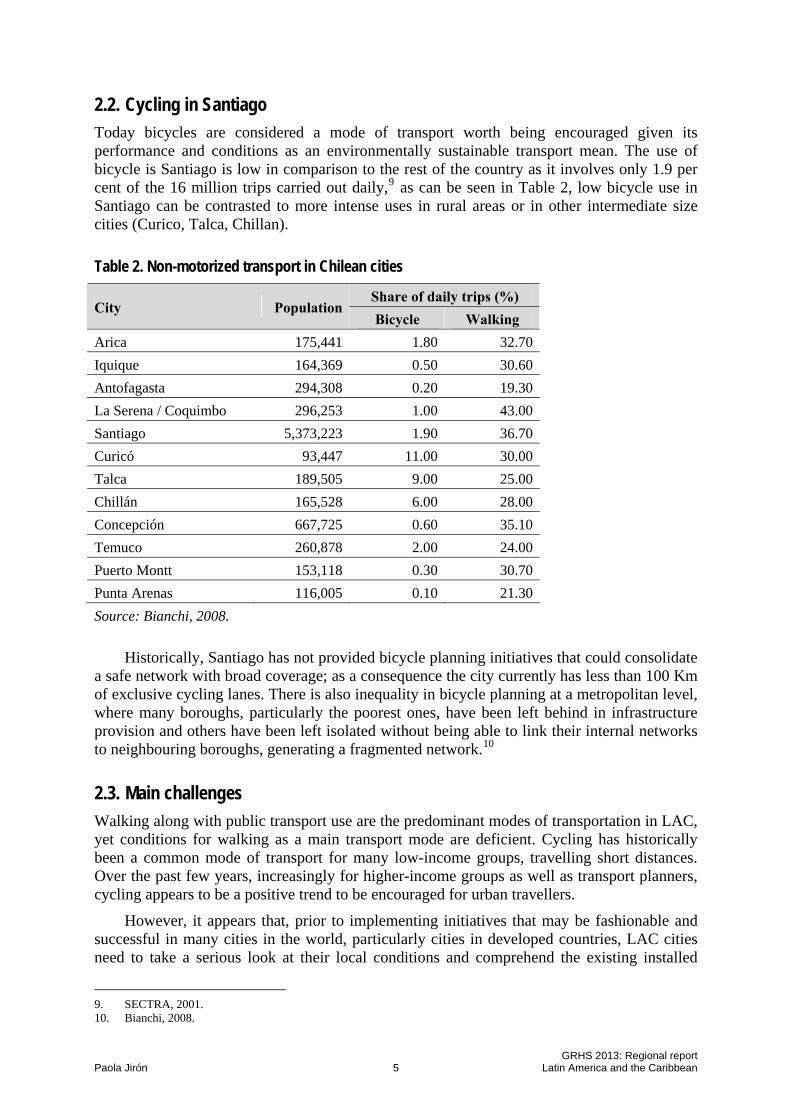
2.2. Cycling in Santiago Today bicycles are considered a mode of transport worth being encouraged given its performance and conditions as an environmentally sustainable transport mean. The use of bicycle is Santiago is low in comparison to the rest of the country as it involves only 1.9 per cent of the 16 million trips carried out daily,9 as can be seen in Table 2, low bicycle use in Santiago can be contrasted to more intense uses in rural areas or in other intermediate size cities (Curico, Talca, Chillan).
Table 2. Non-motorized transport in Chilean cities
Share of daily trips (%) City Population
Bicycle Walking
Arica 175,441 1.80 32.70
Iquique 164,369 0.50 30.60
Antofagasta 294,308 0.20 19.30
La Serena / Coquimbo 296,253 1.00 43.00
Santiago 5,373,223 1.90 36.70
Curicó 93,447 11.00 30.00
Talca 189,505 9.00 25.00
Chillán 165,528 6.00 28.00
Concepción 667,725 0.60 35.10
Temuco 260,878 2.00 24.00
Puerto Montt 153,118 0.30 30.70
Punta Arenas 116,005 0.10 21.30
Source: Bianchi, 2008.
Historically, Santiago has not provided bicycle planning initiatives that could consolidate a safe network with broad coverage; as a consequence the city currently has less than 100 Km of exclusive cycling lanes. There is also inequality in bicycle planning at a metropolitan level, where many boroughs, particularly the poorest ones, have been left behind in infrastructure provision and others have been left isolated without being able to link their internal networks to neighbouring boroughs, generating a fragmented network.10
2.3. Main challenges
Walking along with public transport use are the predominant modes of transportation in LAC, yet conditions for walking as a main transport mode are deficient. Cycling has historically been a common mode of transport for many low-income groups, travelling short distances. Over the past few years, increasingly for higher-income groups as well as transport planners, cycling appears to be a positive trend to be encouraged for urban travellers.
However, it appears that, prior to implementing initiatives that may be fashionable and successful in many cities in the world, particularly cities in developed countries, LAC cities need to take a serious look at their local conditions and comprehend the existing installed
9. SECTRA, 2001. 10. Bianchi, 2008.
GRHS 2013: Regional report Paola Jirón 5 Latin America and the Caribbean

capacity and viability to incorporate such policies. It is important to reinforce the existing trends and improve travelling conditions – particularly deficient infrastructure including pavement, sidewalks, signalling, lighting – prior to incorporating new campaigns. Safety measures at night are a constant concern for women who fear mugging, harassment or sexual assaults.
Particular concern should be placed on isolated initiatives that improve conditions for specific groups, yet leave the rest of the city fragmented and unable to enjoy such improvements. Moreover, non-motorized transport may be seen as a feasible alternative transport mode to overcome congestion and pollution, however, interconnection between these modes of transport along with public and private modes is essential for these initiatives to succeed.
GRHS 2013: Regional report Paola Jirón 6 Latin America and the Caribbean

3. Public Transport Most collective transport systems in LAC are traditionally made up of private bus routes and are slow, congested, expensive, and incapable of responding to the challenges of urban expansion. Moreover, most travellers require long distance travel from their residential areas located in the urban periphery to their jobs in downtown areas.11 Forms of collective transport can be formal or informal; however, the boundaries between what is formal and what is informal can be blurry. Although this chapter concentrates on formal public transport systems, many cities have formal public transport systems operated privately through public bids.
Historically, the public sector has been responsible for collective forms of transport as is the case of the Buenos Aires subway or the various bus systems which have operated in various cities including Santiago, Mexico City or São Paulo. However, formal, efficient, structured public transport systems have only relatively recently been incorporated in LAC cities. Most cities have a diverse mix of formal, yet messy public transport system, as can be seen in Table 3, which shows the different types of collective transport supply in selected cities.
Table 3. Types of collective transport supply (2007)
Metropolitan area
Collective Taxi Jeep Combis
and vansMicro-buses
Mini-buses
Standard bus
Articulated bus
Bi-articulated
bus
Belo Horizonte X X X
Bogotá X X X
Buenos Aires X X X
Caracas X X X X
Mexico City X X X
Curitiba X X X
Guadalajara X
Leon X X
Lima X X X X
Montevideo X X
Porto Alegre X X X
Rio de Janeiro X X X
San José X
Santiago X X X
São Paulo X X X
Source: CAF, 2009.
The city of São Paulo is well known for a well implemented public transport system. However, over the years, the quality and use of public transport is decreasing as can be seen in Table 4, due to an increase in car use and congestion.
11. Banick, 2009.
GRHS 2013: Regional report Paola Jirón 7 Latin America and the Caribbean

Table 4. São Paulo public transport bus operation
Indicator 1990 1999Passengers/day 6,745,000 3,794,000
Fleet in operation 8,850 10,562
Passengers/vehicle/day 857 366
Passengers/km 3.62 1.72
Average speed (km/h) 19 12
Age of fleet 6.5 6.7
Source: Monzón, 2005.
As to the distance travelled – as cities grow and expand due to housing location on the urban periphery – time spent travelling also increases, as does congestion in specific access points. The situation in Mexico City, Rio de Janeiro and Lima are relevant as their size and extension are significant in the region (see Table 5).
Table 5. Distance travelled by buses in km
Cities Buses Belo Horizonte 1.6
Bogotá 2.6
Buenos Aires 4.5
Caracas 3.3
Mexico City 12.9
Curitiba 0.7
Guadalajara 1.2
Leon 0.3
Lima 6.9
Montevideo 0.3
Porto Alegre 1.1
Río de Janeiro 7.8
San José 0.2
Santiago 3.9
São Paulo 5.4
Source: CAF, 2009.
Based on the number of cities implementing new transport systems, two main trends can be observed in Latin American cities: BRT (bus rapid transit) implementation and metro systems construction in capital cities. Moreover, concerned with the transport crisis in large cities in Latin America, along with urban expansion in these cities and the need to serve an increasing number of urban dwellers, new integrated urban plans have started to arise, acknowledging that public transport need to be vital to these plans.
GRHS 2013: Regional report Paola Jirón 8 Latin America and the Caribbean

3.1. Bus rapid transit (BRT) in Latin America The BRT system is based on buses that provide fast urban mobility through the provision of segregated lanes.12 The first city to implement this system in the continent was Curitiba in Brazil in 1972 as part of a broader urban planning policy, complemented with development schemes oriented to move along corridors. Since then, a real boom in BRT systems emerged, followed by the experiences of Quito and Bogotá, considered the only fully implemented BRT in Latin America. Later on in Colombia, based on the experience of TransMilenio S.A. in Bogotá, the city of Pereira started developing the system in 2006. In Brazil, following the Curitiba success, the model was followed in São Paulo. Other cities that have implemented the system include Mexico DF, with Metrobus, and Santiago de Chile with Transantiago, Guayaquil with Metrovia Guayaquil, and Guatemala City, where the BRT system is part of an upgrading plan called Plan Guatemala 2020. In Lima, BRT is still in the planning phase and the World Bank will support the project. Figure 3 shows the evolution from informal systems to a complete BRT.
Figure 3. Types of collective passenger transport systems
Source: ITDP, 2010.
Over the past few years, BRTs have demonstrated to be an efficient and sustainable solution to improve public transport in congested cities. BRTs have become popular political initiatives at national and municipal levels in the region, as a way of reducing congestion, contamination and road safety.13 Research shows that BRT corridors can carry up to 43,000 passengers per hour in each direction, with comparatively low capital investments of less than
12. ITDP, 2010. 13. Banick, 2009.
GRHS 2013: Regional report Paola Jirón 9 Latin America and the Caribbean

US$12.5 million per kilometre and small operational subsidies. Moreover, BRTs can be implemented quickly and provide high-capacity transportation for urban residents.14
Among the benefits for implementing a BRT include:
Opportunity to integrate population to the city, particularly the poorest.
Discourages the use of private car and promotes the use of mass transport.
Contributes to offset deterioration of urban quality of life.
Increases public awareness of privileging common good over individual benefits.
Improves energy efficiency due to technology.
Increases frequencies due to access control to ease minimal boarding time.
Service: quality, cleanliness, safety.
Cost effect: similar transport capacity to LRT, with lower capital cost.
Political advantages: fast implementation periods, between 3 to 5 years.
Urban renovation: increase in surplus value and environmental quality.
As shown in Table 6, some experiences have been quite successful, managing to reduce travel time and offer increased comfort and safety for passengers; while others have faced great challenges. Institutional and operation policies and the measures adopted by local governments have contributed to the success of BRT systems in Latin America.
Table 6. BRT results, selected LAC cities
City
Passengers per day (1000)
Passengers per hour
per direction
Passenger fare in
US$ (2009)
Total cost (infrastructure + equipment in US$ millions)
per km
Average daily
passenger per bus (2009)
Daily passenger boarding
per bus-km
Curitiba (RIT) 2,260 13,000 1.27 2.4 1,027 -
Quito (Metrobus-Q) 560 12,000 0.25 3.6 1,055 9.5
Bogotá (Transmilenio) 1,600 43,000 0.79 12.5 1,584 5.1
São Paulo 6,060 20,000 1.33 3.5 625 -
Leon (SIT-Optibus) 220 6,000 0.48 1.8 396 8.5
Mexico City (Metrobus) 450 9,000 0.39 2.8 2,045 9.6
Pereira (Megabus) 115 6,900 0.74 5.7 2,212 6
Guayaquil (Metrovia) 300 6,500 0.25 2 2,975 13.2
Santiago (Transantiago) 5,659 22,000 0.74 - - 6.4
Guadalajara (Macrobus) 127 5,000 0.47 3.8 3,100 10
Source: Hidalgo, 2010.
Trole Quito (1995) has generated a radical change in mobility and urban impact transforming urban quality of life and metropolitan urban planning. Moreover, through Transmilenio (2000), Bogotá has become an important reference in transport planning worldwide, and it has re-launched BRT systems as an affordable comfortable and safe transport option in Latin America. Although the total cost appears higher that the other systems, this cost is reflected in the quality of its installation and improvement in public space. Optibus Leon and Insurgentes Corridor in Mexico DF, was inspired by Transmilenio, and both corridors are the first step towards developing BRT systems in Mexico.
14. Hidalgo, 2010.
GRHS 2013: Regional report Paola Jirón 10 Latin America and the Caribbean

Cities that have already implemented their BRT systems include Curitiba, São Paulo in Brazil; Santiago in Chile; Bogotá, Pereira, Barranquilla, Bucaramanga and Cali in Colombia; León, Mexico DF, Guadalajara, Monterrey, Estado de Mexico, Tuxtla Gutierrez in Mexico; Quito, Guayaquil, Loja and Cuenca in Ecuador; Ciudad de Guatemala in Guatemala and Lima in Peru. Table 7 summarizes the overall results of 10 cities in the region that have imple-mented BRT systems.
Table 7. Summary of BRT systems in Latin America
City project (initial year) General description Supply/demand Comments
Curitiba RIT (1973)
Citywide integrated bus system with five BRT corridors (65 km of median busways), 139 stations, 26 terminal, 340 km of feeder routes, 185 km of inter-district circular routes, 205km of ‘rapid bus’ routes; total of 340 bus lines and 1,100 km of bus routes
2,200 vehicles, including 114 bi-articulated diesels as well as articulated, conventional, small buses, special service buses; electronic fare collection system.
2.26 million passenger/day
7 private operators under agreement with a public authority
New 22 km BRT corridor under construction
Quito Metrobus-Q (1995)
Three BRT corridors (37 km, mostly median busways; 68 stations, 9 terminals: integrated feeder services; centralized control separately for each corridor)
189 articulated buses (113 troley buses), 185 feeder buses, coin based fare collection.
560,000 passengers/day
Public operator/owner (Trolebus and Ecovia corridors), private operator (North corridor), no fare integration among corridors. Discussion to replace Trolebus with an LRT.
Bogotá Transmilenio (2000)
High capacity BRT system with 84 km median busways, 104 stations, 10 integration points, integrated feeder services and advanced centralized control
1,190 articulated buses
10 bi-articulated buses,
448 feeder buses, electronic fare collection system.
1.6 million passengers/day
Five private groups partially formed by some traditional operations, hold concession contract for 7 trunk and 6 feeder zones. Two new corridors (22km) under development as well as a citywide reform of traditional bus services. Metro system under study.
São Paulo Integrated System (2002)
Integrated system under single fare with partial BRT treatments in some corridors, 104 km median busways, preferential bus lanes, 327 transfer stations, 24 terminals
13, 711 buses, 1,073 articulated, 5,599 padron (elevated floor buses with left side door at platform level and right side at floor level – 90 passenger capacity), 2,423 conventional, 3,063 microbus (21-passenger), 1553 minibus (42-passenger), integrated electronic fare collection system.
6 million passengers/day
Private operators under concession contracts with the municipal agency SPTrans. Integration has been expanded to regional rail and several municipal services within the metropolitan area.
Leon SIT-Optibus (2003)
3 BRT trunk corridors with 25 km median busways (60% segregated), 3 terminals, 51 stations, integrated feeder services, centralized control
55 articulated buses; 500 auxiliary and feeder buses; electronic fare collection system
220,000 passengers/day
Thirteen existing private concessionaries formed 4 new operators for trunk-ways and continue feeder service operation. System under expansion (Phase II) including reorganization of citywide services.
GRHS 2013: Regional report Paola Jirón 11 Latin America and the Caribbean

City project General description Supply/demand (initial year) Comments
Mexico City Metrobus Insurgentes (2005)
Two BRT corridors, 50 km median busway, 77 stations, four terminals, centralized control using Intelligent Transportation Systems (ITS*)
209 articulated buses, 12 bi-articulated buses electronic fare collection system.
450,000 passengers/day
Eight bus operators (one public), two fare collection contractors, physical integration with regional buses, regional rail and Metro.
Pereira Megabus (2006
16 km exclusive busways (50% in median, 50% on left side on one-way streets in downtown), plus 800 metres in mixed traffic on a major bridge, 37 stations, two terminals, centralized control
52 articulated buses, 82 small feeder buses, electronic fare collection and control system
115, 000 passengers/day
Two private operators of buses, one fare collection concessionaire
Guayaquil Metrovia (2006)
35 km exclusive bus lanes on the median or left side on one way streets, 60 stations, 3 terminals, centralized control.
92 articulated buses, 80 feeder buses, electronic fare collection system.
300,000 passenger/day.
One private concessionaire for bus operations, one fare collection and technology provider. System expansion in 2007.
Santiago Transantiago (2007)
18.8 km of segregated corridors, 4.6 km of new road connections, 62.7 km of improvements in road geometry and pavements (in seven corridors), 70 large bus shelters along main corridors, and three intermodal stations.
45 km expansion of Metro network
1,200 new low-floor articulated buses, 1,500 conventional trunk buss (to be gradually replaced by low-floor buses), and 2,300 feeder buses, integrated electronic fare collection system.
5.7 million passengers/day
Buses privately operated through 14 concession contract: on private operator for financial management, one private operator for systems integration (control and user information, one public operator (Metro)
Guadalajara Macrobus (2009)
16 km of median busways, 27 stations, integrated feeders, centralized control
41 articulated buses, 103 feeder buses, electronic fare collection
Good integration with light rail system and feeder routes, one private concessionaire for bus operations. 127,000 passenger/day
* Technologies that allow for dynamic control and operation of a transit system including automatic vehicle locators, centralised vehicle control, integrated signal control, automatic fare collection and real-time passenger information systems.
Source: Hidalgo, 2010.
Box 1. Santiago de Chile (Transantiago)
Transantiago is Santiago’s public urban transport system destined to completely modify the organization of existing collective transport using a trunk and feeder system and integrated this with Santiago’s existing and expanding Metro system. Transantiago started a pilot operation in 2005, and was fully implemented in 2007, when the definitive transition to the system took place and should be fully implemented in 2011 with new buses, routes and infrastructure. The implementation of Transantiago generated a series of problems including insufficient number of buses on the streets, inadequate route definition, unfinished infrastructure, breach of contracts, as well as payment and control systems failure. These problems led people to experience extreme difficulties in adapting to a new system. This situation exacerbated travel and waiting time, number of transfers, overcrowding and complaints, amongst others, with serious difficulties for many to reach their destinations. This had significant consequences in the daily activities people undertake on a regular basis and generated a severe crisis at a national level in social, financial and political terms. Implementation problems revealed significant deficiencies and errors in the design as well as in the project implementation, many of which are still being fixed. These were mainly due to serious institutional deficiencies and lack of a clear and powerful transport authority and the logic behind the system as a market driven
GRHS 2013: Regional report Paola Jirón 12 Latin America and the Caribbean

approach to urban transport.a As a consequence of the problems faced by the implementation of Transantiago, Latin-American cities are carrying our extensive revision on the way in which transport changes in metropolitan areas are implemented.b
Sources: a. Jiron, 2010; b. Colmenares, 2007.
Cities in LAC that are planning BRT systems in the following years, or have projects under construction, include Buenos Aires in Argentina, Rio de Janeiro, Porto Alegre, Goiânia, Belo Horizonte, Fortaleza, Recife, Salvador in Brazil; Cartagena de Indias, Cúcuta, Medellín in Colombia; Chihuahua, Ciudad de Juárez and Tijuana in Mexico; Asunción in Paraguay; Arequipa in Peru; Barquisimeto, Merida and Ciudad Guyana in Venezuela; Tegucigalpa and San Pedro Sula in Honduras; and Managua in Nicaragua.
3.2. Metro networks in Latin American and the Caribbean
The first metro to be built in Latin America was the Buenos Aires metro in 1913, followed by the Mexico City one, built in 1969, which currently operates the largest network in the region. The cities of São Paulo and Santiago de Chile followed in 1975. These were then followed by many cities as can be seen in Table 8. Table 9 provides a list of metro networks in the planning phase or under construction in the region.
Table 8. Existing metro networks in Latin America and the Caribbean
Country City and Metro Metro System Administration Year Underground metro (Subte) 1913
Urban and suburban train 1857
Argentina Buenos Aires
Premetro (LRT)
Concession
1987
Underground metro 1974 Brazil São Paulo
Suburban train 1992
State/private Company
Underground metro 1979 Rio de Janeiro
Suburban train 1998
Brasilia Underground metro 2001
Belo Horizonte Underground metro 1986
Underground metro 1985 Recife
Diesel train 1988
Porto Alegre Underground metro 1980
Teresina Metro de Teresina 1984
Fortaleza Metro de Fortaleza 1993
Salvador de Bahía Metro de Salvador 2005
Santiago Underground metro 1975 Chile
Valparaíso metropolitan train 2005
State company
Concepción Suburban train 2005
Colombia Medellin: Rapid transit train metrocable State company 1995
2004
GRHS 2013: Regional report Paola Jirón 13 Latin America and the Caribbean

Underground metro 1969 Mexico Mexico DF
Suburban train
State company
2008
Underground metro 1989 Guadalajara
Pre-tren (LRT) 2007
Monterrey Underground metro 1991
Peru Lima Underground metro (not in use) 1990
Puerto Rico San Juan Underground metro Concession 2004
Dominican Republic
Santo Domingo Underground metro State company 2009
Caracas Underground metro 1983 Venezuela
Los Teques Underground metro 2006
State company
Maracaibo Metropolitan train 2006
Valencia Underground metro 2006
Source: Metrovias S.A,, 2010; Metrobits.org, 2010; Metros del mundo, 2010.
Table 9. Planned metro networks in Latin America and the Caribbean
Country City Plans Buenos Aires In expansion Argentina
Córdoba Projected
São Paulo In expansion and under construction. Brazil
Recife In expansion.
Porto Alegre In expansion and planning phase.
Rio de Janeiro In expansion and projected
Brasilia In expansion
Belo Horizonte In expansion, under construction and projected.
Fortaleza Planned
Chile Santiago In expansion and planned
Bogotá Under construction Colombia
Medellin In expansion, metrocable under construction
Costa Rica San Juan In expansion
Mexico DF under construction Mexico
Guadalajara In expansion and station modernization, planned, and projected
Monterey Projected
Panama Ciudad de Panamá In planning phase
Peru Lima In expansion
Dominican Republic Santo Domingo Under construction
GRHS 2013: Regional report Paola Jirón 14 Latin America and the Caribbean

Country City Plans Caracas In expansion and projected Venezuela
Valencia Under construction and planned
Maracaibo Projected
Los Teques Planned
Caracas-Guarenas-Guatire
Under construction
Source: Metrovias S.A., 2010; Metrobits.org, 2010; Metros del mundo, 2010.
The longest metro system in the LAC region today is the Santiago Metro, as shown is Figure 4, with over 60 km of extension, followed by Caracas and Buenos Aires. These cities are also the metro systems with most stations and lines (see Table 10).
Table 10. Metro stations in Latin America
City
Figure 4. Latin American cities metro extension (in kilometres)
0 10 20 30 40 50 60 7
Belo Horizonte
Brasilia
Buenos Aires
Caracas
Lima
Maracaibo
Medellin
Santiago
Santo Domingo
Valencia
Valparaiso
0
Source: http://www.urbanrail.net/.
Number of lines
Number of stations
Belo Horizonte 2 19
Brasilia 2 11
Buenos Aires 6 63
Caracas 4 48
Lima 1 6
Maracaibo 1 6
GRHS 2013: Regional report Paola Jirón 15 Latin America and the Caribbean

Number of lines City
Number of stations
Medellin 2 26
Santiago 5 82
Santo Domingo 2 16
Valencia 1 6
Valparaiso 1 20
Source: http://www.urbanrail.net/.
3.3. Urban trains
Another model being followed in LAC refers to the urban trains. In Brazil, the World Bank finances a programme started in the 1990s at the request of the Brazilian government to decentralize urban trains in São Paulo, Rio de Janeiro, Belo Horizonte, Recife, Salvador and Fortaleza, when the federal government transferred its operations to the states and municipalities. Also with World Bank support, other countries have applied the Brazilian model, including Buenos Aires, Argentina, Bogotá, Colombia and Mexico. These projects have great advantages as the population in Latin America is increasingly concentrated in urban areas, and, given that most users are low-income dwellers, these systems promote accessibility, availability and admission of urban transport at reasonable prices improving urban quality of life.15
3.4. Integrated systems Many cities have attempted to implement integrated transport plans, that is, integration between different modes of transport, including integrating metro networks with bus networks (especially BRT). In the case of Santiago de Chile, after a negative experience of implementation of Transantiago,16 the metro system doubled its demand and new clients were incorporated into the system, becoming a major support for urban mobility, thus the current emphasis on its extension.17 In Medellin, the metro system has been integrated to Metrocable, (aerial corridors that broaden that influence area of metro), guaranteeing integration and speed while using diverse modes of transport.18 Table 11 shows the different costs of various mass transport means.
Table 11. Mass transport cost in Latin American cities
Doing
nothingLanes of
buses Light rail Metro BRTCapacity/vehicle 30 60 180 300 160
Speed (km/h) 11 18 20 35 26
Units (Buses or Train wagons) 4,714 1.440 432 148 374
Infrastructure cost (US$ billion/km) 0.00 1.00 15.00 68.00 7.20
15. World Bank, 2008. 16. Jiron, 2008. 17. Metro S.A., 2009. 18. Metro de Medellin, 2010.
GRHS 2013: Regional report Paola Jirón 16 Latin America and the Caribbean

Doing Lanes of nothing buses Light rail Metro BRTMaintenance cost (US$ billion/km per year) 0.24 0.10 0.15 0.10 0.12
Equipment (US$/unit) 0 80,000 1,000,000 3,000,000 200,000
Operation (includes operation maintenance-US$/km travelled) 0.68 0.56 0.60 0.60 0.79
Kilometre travelled/year 179,842,963 89,921,481 29,973,827 17,984,296 33,720,556
Source: Castro, 2008.
As can be seen, the costs of implementing a metro system are considerably higher compared to other alternatives and the capacity to recover investment of this infrastructure is about 30 years,19 however, the capacity to move passengers is greater than with other means. The main social problems linked to this transport mode include: vandalism, informal commerce, suicides and sexual harassment of women at peak hours. The latter has generated various institutional ways of approaching it; the case of Mexico with separate wagons for women is one of them.
3.5. Challenges The importance of BRTs is that less investment can generate quite positive results in what can be considered a shorter investment period. Underground investment is difficult logistically as well as expensive, yet it generates quite fast travelling systems. In spite of the various options to improve collective transport in LAC cities, integrating such systems, in terms of fares, modes, transfers and capacity to reach multiple and distant destinations, appears to be the biggest challenge in the region. An important criterion to consider under the multiple possibilities is uneven transport access, thus targeted investment appears increasingly relevant. This is because the cost of investment (social, economic, environmental, cultural) are high, and benefiting a few can generate serious mobility inequalities in contemporary cities, thus generating new forms of urban exclusion. The challenge today is to use transport planning as a way to overcome mobility inequality.
19. Fundacion Rescatemos Guadalajara A.C., 2010.
GRHS 2013: Regional report Paola Jirón 17 Latin America and the Caribbean

4. Informal Motorized Transport The steady urban growth and expansion in the LAC region creates the need to move through the city for work, study, shop, etc. In many cities, such mobility needs have been reached by reformulating transport systems and road reconfiguration, as a way of implementing efficient and safe mass transport systems (and environmentally sustainable). However, when these systems do not cover mobility needs, informal systems transform into the fastest and easiest solution. These alternative means adequate to the travellers’ needs in spatial and in monetary terms, thus becoming a well-explored economic niche by those who undertake this activity. These entrepreneurs recondition all types of vehicles (motorcycles, bicycles, tricycles, cars, trucks, charts, vans, minibuses, combis, etc.), mostly in very poor conditions to transport passengers at varying own times and routes.
In LAC the category of informal transport service does not adequately illustrate the type of services and vehicles in this area, as services may or may not be illegal, and may operate in central and consolidated areas of the city. Their main characteristic is that the vehicles used are not quite adequate for collective transport, due to their low capacity, irregular operation and unclear responsibility as a public service. In many of the largest cities in the region, these services are generalized and regardless of them being legal or illegal, tolerated or repressed, the importance is that it is a travel modality with reduced transport capacity, making an important contribution to congestion in many Latin American cities.20
In many cities in LAC, informal transport is the most common and extensively used form of urban transport. Cities have extended parallel to the increase in informal transport systems,21 without the provision of norms that regulate these activities. Vehicles in use are not always suited for public transport in terms of passenger capacity and comfort; however they provide spatial and time flexibility,22 they are also more accessible, faster and cheaper than formal systems. They also provide significant and effective benefits to many segments of the population, including mobility, sources of employment, complementarity with formal systems and efficiency. However, simultaneously they generate negative externalities including traffic congestion, unfair and disorderly practices, accidents segregation, air pollution and environmental problems.23
Their presence is due to unmet transport needs by public authorities through formal transport services.24 Most users adopted this means after state-ran transport companies disappeared and the sector was deregulated in the 1980s. Another factor influencing the increase in informal transport supply is the lowering of import tariffs that allowed cars to be used for informal transport modes.25 Table 12 shows cities where informal transport systems prevail in Latin America and the Caribbean.26
Table 12. Informal transport systems in some selected Latin-American cities
City Mini and micro buses
Trucks or jeep
Collective taxies
Vans Motorcycle taxies
Bogotá X X X
Buenos Aires X
20. Figueroa, 2005. 21. Barragán, 2005. 22. Figueroa, 2005. 23. Cervero, 2000. 24. GTZ, 2010. 25. Cervero, 2000. 26. Figueroa, 2005.
GRHS 2013: Regional report Paola Jirón 18 Latin America and the Caribbean

City Vans Mini and Trucks or Collective micro buses jeep taxies
Motorcycle taxies
Brasilia X X
Fortaleza X X X X
La Paz X X
Lima X X X
Mexico X X
Porto Alegre X
Recife X
Rio de Janeiro X
Salvador X
San Salvador X X
Santiago X
Santo Domingo X X X X
São Paulo X
Source: Figueroa, 2005.
The common mode of transport present in most cities is mini or microbuses. Table 13 shows the fleet available for each mode in 16 LAC cities.
Table 13. Collective transport fleet in some selected Latin-American cities (2007)
Metropolitan Areas
Collective taxi
Jeep Combis and vans
Micro-buses
Mini- buses
Standard bus
Belo Horizonte 0 291 0 6,495
Bogotá 0 4,300 0 10,245
Buenos Aires 0 401 0 496 15,585
Caracas 0 5,691 326 10,541 0 1,220
Mexico City 0 45,996 0 8,863
Curitiba 0 91 0 2,144
Guadalajara 0 0 4,607
Leon 0 0 1,733
Lima 3,620 11,327 7,990 0 4,337
Montevideo 0 43 0 1,435
Porto Alegre 0 403 0 4,876
Rio de Janeiro 0 13,000 1,353 0 14,746
San José 0 0 1,197
Santiago 10,736 0 5,444
São Paulo 0 7,569 0 12,629
Total 14,356 5,691 25,054 78,577 496 95,555Source: CAF, 2009.
GRHS 2013: Regional report Paola Jirón 19 Latin America and the Caribbean

As to the age of the existing fleet, this varies considerably; many cities have vehicles that are more than 40 years old. Table 14 provides an overview of the average age of various categories of vehicles in some LAC cities.
Table 14. Average age of collective transport fleet (2007)
Metropolitan Areas
Collective Taxi
Jeep Combis and vans
Micro-buses
Mini-buses
Standard bus
Belo Horizonte - - - N/A - 4.6Bogotá - - - 8 - 12.8Buenos Aires - - 3.6 - 7.2 10.3Caracas - 18 20 16 - 16Mexico City - - - N/A - N/ACuritiba - - - N/A - 5.2Guadalajara - - - - - 5Leon - - - - - 7Lima N/A - 15 18 - 20Montevideo - - - 5 - 12.3Porto Alegre - - - N/A - 4.8Rio de Janeiro - - N/A 6 - 6San José - - - - - 7.6Santiago 6.3 - - - - 5São Paulo - - - N/A - 5
Source: CAF, 2009.
Limited information exists on the actual informality figures, even less so in comparative terms. Therefore, the following information is based on specific cities in the LAC region.
Box 2. Informal transport in Lima
In Lima, in 1985, 91 per cent of car taxis operated informally, this included five-passenger sedan cars (autotaxi) and eight passenger station wagon (‘camionetas’).a Most transport was in the hands of private omnibuses (or combis), which provided routes that reached a great variety of places at high frequency. In 1990, the system was liberalized even further, declaring absolute freedom of routes and tariffs.b This generated a breakdown in the public transport system, informalizing urban transport almost completely, a situation that still predominates with hundreds of companies in Lima. The great number of informal vehicles on the roads, including over 600 bus lines running the same sectors along with taxis (approximately 140,000 informal taxis run in Lima, equivalent to 60 per cent of the whole collective transport marketc), are the main cause of traffic congestion in the Peruvian capital. Furthermore, the safety of the system is a big concern.
Transport informality in Limad is mainly due to the transport authority’s (Dirección Municipal de Transporte Urbano, DMTU) high authorization demands and the fear from vehicle owners of requesting authorization from, due to possible sanctions. DMTU regulations are extremely high, in light of the existing vehicle fleet, if the regulations were enforced they would leave out many vehicles that do not comply with requirements, they thus work informally and the transport authority has little control capacity. Furthermore, authorization is provided for fixed routes specified by authorities; however, local car owners prefer to work at their own convenience, thus satisfying an existing demand. Finally, minimal authority control leads higher willingness to take risks.
Source: a. Cervero, 2000; b. Barragán, 2005; c. Pichihua 2010; d. Avellaneda 2007.
GRHS 2013: Regional report Paola Jirón 20 Latin America and the Caribbean

Box 3. Informal transport in Colombian cities
In Bogotá, Colombia insufficient coverage by formal transport services has generated various areas of the city with different forms of informal transport including pirate buses and tricimobiles (motorbikes or bicycles that pull a passenger trailer). For local authorities ‘pirate’ refers to those transport services that operate without city issued licenses and are persecuted and fined periodically for their activity. However, for many inhabitants living in these subserviced areas, informal vehicles are their only option. Uncontrolled city growth generates neighbourhoods that, due to the reduced number of residents, are not economically viable for formal transport companies and once Transmilenio was put in place, it eliminated various collective service routes.a The precise number of vehicles providing this service is unclear, an estimate suggests that there are around 1,500 tricimobiles covering a distance of 1–2km and charging less than US$0.50 per trip;b authorities have identified the critical zones covered by these.
In Cali there are also ‘pirate’ services.c In 2004, 1,587 vehicles were immobilized for informal transport, while in 2005, 1,909 sanctions were issued for the same activity. There are seven bus companies operating illegally in Cali, out of the 200,000 passengers using informal transport, 50 per cent use informal cars while the rest use informal taxis, urban and interurban buses.d
Informal transport in Medellin emerged in response for better mobility options and it includes: collective taxis and privately owned cars that work as taxis (‘chiveros’ or ‘piratas’). There are also buses that cover the routes that formal transport companies either do not cover or cover only partially. There are no exact official figures, but pick up points in the city have been identified. The Medellin Transport Secretary works to control informality by intensifying controls in most critical places and hours.e
Sources: a. de Roux Rengifo, 2010; b. El Tiempo, 2009; c. Cardona, 2010; d. El Pais, 2006; e. El Tiempo, 2008.
Table 15. Modal split, Bogotá
Mode Trips/day %Foot 1,430,000 15.1
Motorcycle 65,127 0.6
Taxi 350,130 3.7
Public transport 4,499,276 47.5
Private bus 92,578 1.0
Truck 5,884 0.1
Bicycle 213,033 2.3
Car 1,394,301 15.0
Transmilenio 912,938 9.6
Intermunicipal 68,515 0.7
School bus 416,978 4.4
Other 13,998 0.1
Total 9,462,758 100.0 Source: Secretaria de Movilidad, 2010.
Informal services in Argentina running on the streets on Buenos Aires and its surroundings are mostly shared taxis, called ‘remises’. They are driven by their owners and take passengers anywhere at half the cost of traditional taxis. Surveys carried out in 2000 show that there were about 7,000 ‘remises’ transporting about 120,000 passengers daily,
GRHS 2013: Regional report Paola Jirón 21 Latin America and the Caribbean

approximately 8 per cent of trips in the Buenos Aires region (see Table 16). Among the causes of loss of passengers for public transport services include: increase in prices, increase in insecurity, deterioration of public transport, urban expansion, suburbanization of middle and low-income groups, peri-urbanization of high-income groups.27
Table 16. Evolution of urban transport modal split in Buenos Aires, Argentina
Modes 1970 1992 2007/2010Public 66.7 53.6 42.5
Bus 54.3 46.4 33.5
Over-ground trains 7.0 4.7 6.1
Underground trains 5.4 2.4 2.9
Private car 15.4 27.3 36.6
Other 17.9 19.1 20.9
Taxis, remis, charter 6.8 7.7 7.9
Motorcycles, bicycles 3.0 3.4 4.4
Foot 8.1 8.0 8.6
Source: Kralich, 2005.
In Brazil, an informal transport explosion over the last decade has had profound effects on formal public transport systems, and is a source of great controversy in the urban transport sector. A variety of policies have been proposed to manage the sector’s growth,28 including legalization of this regime. Vans in Rio de Janeiro and São Paulo duplicated their routes, benefiting users, broadening their mobility possibilities, but threatening formal transport through an aggressive and unjust competition. Studies show that three quarters of bus passengers in Rio de Janeiro, Recife and Salvador, switched to vans to save time.
In Rio de Janeiro, informal buses are called ‘cabritinhos’, they are combis transporting people to and from favelas and downtown areas; a model that was then used in other Brazilian cities, and that is one of the main cause for lowering of regular public system users.29 United Nations estimates in 2000,30 calculated that the number of unlicensed vans operating in Rio de Janeiro, was about 8000–9000, while in São Paulo the number was 10,000–15,000. In Rio de Janeiro they work side by side in the most popular routes, with about 350,000 passengers daily, about 5 per cent of all trips made in vans as can seen in Table 17. In the poorest parts of Brazil, pick-ups are used for collective transport of passengers.
Table 17. Modal split metropolitan region of Rio de Janeiro (2004) and Bogotá
Mode Trips/day %Foot 645,510 3.2
Bicycle 1,630.985 8.2
Van 6,916,387 34.7
Bus 2,969,634 14.9
27. Kralich and Gutiérrez, 2007; Kralick and Muller, 2010. 28. Golub, Balassiano et al, 2009. 29. Almeida, 2009; Cervero, 2000. 30. Cervero, 2000.
GRHS 2013: Regional report Paola Jirón 22 Latin America and the Caribbean

Mode Trips/day %Car 303,578 1.5
Metro 355,404 1.8
Boat 82,091 0.4
Motorcycle 100,922 0.5
Other 170,752 0.9
Total 19,915,951 100
Source: Nassi, 2005.
In Kingston, Jamaica, mini-vans and station wagons, compete with public buses. It is known that bus drivers leave their passengers and go the other way, if they see an opportunity of making more money.31 In Kingston, unlicensed sedans (‘robots’) are a famous form of informal transport.
In Mexico City, the strongly subsidized low cost metro system does not reach many of the neighbourhoods in the borders of the Federal District. Clusters of minibuses fill the service void, providing connectivity between terminal metro stations and peripheral residences. Given that many of the poor live in the periphery and take up to five transfers per day for work purposes, informal transport costs can take up to a fourth of their daily salary,32 while the average Mexican spends 4.9 per cent of their income on public transport.33 Informal cars in Mexico City have defined routes and pick up and drop off passengers anywhere on the road, often changing their routes depending on traffic and time of day.34
In Havana, Cuba ‘camels’ are large trucks that carry passengers. As petrol subsidy from the Soviet Union disappeared, many motorized vehicles where used for informal transport throughout Cuba, including farm trucks. With limited formal options, Cuban had to find other means, including ‘amarillos’ (‘yellows’), traffic guards dressed in yellow organizing queues and stop traffic to find out where vans are going and board passengers in that direction.35 There are also ‘bici-taxis’, bicycles used as taxis. These can also be found in secondary streets in Lima, Peru and some parts of Mexico
In Nicaragua it is possible to find buses and trucks that provide informal transport.36 In Caracas, Venezuela, approximately 3,000 jeeps, sedans and minibuses called ‘carros por puesto’, operated during the 1970s as ‘pirates’ through densely occupied roads at peak hours with fixed routes, covering 47 per cent of the transport market. They were popular for their adaptability, with drivers that modified routes after asking passengers, in order to go faster or to avoid congested areas. Today most services are ‘carros por puestos’ which have been registered and license.37 In the Dominican Republic there are ‘moto-conchos’, old vehicles in very poor state.38 In 1986 there were 7,000 of these in Santo Domingo driven by their owners. In Paraguay, there are mototaxis in Asunción, Ciudad del Este, Encarnación, Capital, Pedro Juan Caballero and other border towns.
31. Cervero, 2000. 32. Cervero, 2000. 33. Quiroga Agencia de Medios, 2010. 34. Cervero, 2000. 35. Cervero, 2000. 36. Cervero, 2000. 37. Cervero, 2000. 38. Cervero, 2000.
GRHS 2013: Regional report Paola Jirón 23 Latin America and the Caribbean

In Costa Rica, pirate taxis are about to become an irreversible phenomenon due to inhabitants dissatisfaction with the bus service, about fifty per cent claims dissatisfaction with the formal system. There are approximately 2,000 pirate taxis, 500 cloned taxis (with fake plates) and 3,000 private taxis competing along with 13,000 official taxis.39
In Quito, Ecuador, the reasons for using informal transport range from municipal abandonment of transport in peripheral areas to the need for users to reach their destinations in short time, despite the existence of urban transport on different corridors. According to MetrobúsQ, Quitos’s formal urban transport on corridors only covered 40 per cent (638,000) of the total daily public transport demand for 1,621,091 trips. This is because unauthorized municipal transport –executive taxies, taxirrutas, pickup trucks, and vans – are gaining space in that city and in the rural areas surrounding it.40
In Santiago de Chile, in 2008, according to the Chilean National Taxi Confederation there were 2500–3000 pirate units. Pirate taxis also circulate on segregated and exclusive avenues, and because they look like private cars, they are unnoticed by authorities.
4.1. Challenges
In most cities, it is those with the lowest resources that are forced to use informal transport, as it is lower-income neighbourhoods that have inefficient or almost inexistent formal public transport. Moreover, service quality and fares are relevant when choosing to travel via informal systems. This undoubtedly generates social, environmental, spatial, and economic consequences to the city and its inhabitants. On one side, informal transport systems – as they are not regulated and many of their divers lack training – are involved in many car accidents, often with fatal consequences. Also, deregulation affects service fare, where fares are high and many transfers are necessary to reach destinations, and passengers have to spend a large percentage of their income on transport. Economic consequences arise from loss of income in formal transport systems, which generate financing problems for them, and price increases, discouraging their use. At a city level, proliferation of such services generates vehicle chaos, as these vehicles stop anywhere to take passengers and generate great congestion, particularly in cities’ main avenues and roads. Also, these services increase air and acoustic contamination considerably.
39. Oviendo, 2008. 40. Corporación Lima Norte, 2008.
GRHS 2013: Regional report Paola Jirón 24 Latin America and the Caribbean

5. Private Motorized Transport During the 20th century the characteristics of the Latin-American population transformed drastically, from a mostly rural population at the beginning of the century to a predominantly urban population living in large urban centres, to a point that these centres currently host more than 70 per cent of the population in countries like Colombia, Uruguay, Brazil, Venezuela, Mexico, Argentina and Chile. This rapid urban growth, concentrated in metropolitan and capital cities, has produced significant morphological transformations in urban areas as well as behavioural modifications in their residents. Many Latin American cities have followed the North American low density, extended cities urban development model, which tends to create greater car dependency. Moreover, transport use has changed from predominately non-motorized means, to motorized vehicles.41 This is particularly so for cars, although motorcycles have also experienced a significant increase, particularly in light of car congestion and petrol costs.
5.1. Motorization rates Economic liberalization processes set up from the 1980s in most Latin-American countries have influenced most economic sectors and produced changes in the internal structures of countries. Lower import restrictions have allowed more access to foreign products, including cars. Furthermore, countries like Brazil and Mexico developed their car manufacturing industry, supplying much of the car demand in the region. Used car import restriction vary from country to country, in places like Peru and Bolivia, there is a 5 year restrictions, whereas in Chile, except for tax free zones, import of used cars is not allowed.
As can be seen in Table 18, cars numbers in most countries in the region has increased considerably over the past decade. The most significant increase can be observed in countries like Paraguay (from 161,196 units in 2000 to 608,109 in 2007), this is followed by Guatemala, Bolivia, Mexico and Brazil.
Table 18. Increases in the number of cars, selected Latin American countries (2000–2007)
% change 2000–2007 2000–2001
2001–2002
2002–2003
2003–2004
2004–2005
2005–2006
2006–2007 Country
2000–2007
Belize 12 11 8 9 5 8 -6 55
Bolivia 5 3 6 11 9 12 16 80
Brazil 8 7 7 7 7 8 9 68
Chile 2 2 1 5 6 6 6 33
Colombia 3 3 4 5 8 12 12 58
Costa Rica 4 15 1 -3 0 3 9 31
Guatemala 3 8 6 8 3 21 20 89
Honduras - 7 5 7 6 9 - 38
Mexico 11 9 5 5 7 12 6 70
Panama -2 2 4 4 1 5 8 24
Paraguay - 113 29 8 7 8 10 277
41. Jaramillo et al, 2009.
GRHS 2013: Regional report Paola Jirón 25 Latin America and the Caribbean

% change 2000–2007 2000– 2001– 2002– 2003– 2004– 2005– 2006–
2007 Country 2001 2002 2003 2004 2005 20062000–2007
Peru 4 11 9 3 7 4 - 44
Dominican Rep. 11 12 4 4 9 4 8 64
Venezuela 9 8 4 40 -17 0 14 62
Source: Based on CEPAL, 2010.
In comparison to more developed countries, motorization rates in Latin American countries are relatively low, as can be seen in Table 19. However, this relatively low figure is likely to continue increasing in the near future as incomes increase, and probably reach the rates of developed countries of approximately 300 to 400 cars per 1000 person42 as most countries in the region continue their steady economic growth.
Table 19. Number of cars and motorcycles in selected cities
Motorization rate (2007) (cars/1000 inhabitants) Cities Population Number of
carsCity
Number of
National motorcycles
Belo Horizonte 4,803,198 1,074,808 220 200 215,922
Bogotá 7,823,957 792,951 100 70 116,433
Buenos Aires 13,267,181 4,285,312 320 310 470,000
Caracas 3.104,076 820,000 260 170 114,369
Mexico City 19.239,910 5.592,239 290 240 108.420
Curitiba 2,872.486 774,738 270 200 124.522
Guadalajara 4,374.721 1,442,517 330 240 72,304
Leon 1.360,310 185,981 140 240 11,563
Lima 8.482,619 453,198 50 50 27,000
Montevideo 1.325,968 210,004 160 180 75,500
Porto Alegre 3.410,676 620,484 180 200 116,513
Rio de Janeiro 10.689,406 2,290,902 210 200 226,563
San José 1,286,877 321,719 250 152 51,621
Santiago 6,038,971 819,174 140 200 22,634
São Paulo 18,783,649 4,386,159 230 200 652,225
Sources: Based on CAF 2009; Instituto de Seguridad y Educación Vial, 2009; and World Bank, undated.
In Colombia, according to the Ministry of Transport, in 2008 there were 5,300,000 cars, most of which were registered in urban areas, making car ownership an urban phenomenon. In spite of the significant investment made by the public sector to improve collective transport systems, the trend has not decreased. The constant increase in number of new cars in
42. Figueroa, 2005.
GRHS 2013: Regional report Paola Jirón 26 Latin America and the Caribbean

Colombian cities is mainly due to free trade policies adopted in the 1990s, and the growth in car park from 1985–2007 is 2 to 3 times above population growth.43
Table 20. Motorization rates in Colombia
Motorization rate (number of cars per 1000 persons)1985 1990City 2000 2007
Bogotá 60.5 67.6 101.7 140.6
Cali 49.1 57.9 98.6 123.5
Medellin 57.3 65.3 92.4 97.1
Barranquilla 50.7 59.3 88.1 120.3
Sources: Jaramillo et al, 2009.
The list of negative consequences is long in economic, social and environmental terms, but it is mostly related to air and noise pollution and heavy congestion. The large number of cars on Colombian streets has led to various campaigns to discourage the use of private cars, including the ‘peak and plate’ (‘pico y plata’) campaign that consists in car restriction during peak hours based on plate numbers. In São Paulo, Quito and Caracas, car restriction is aimed to reduce heavy congestion. In Santiago and Mexico City, car restriction policies are formulated to reduce heavy contamination rates. In cities in Honduras and in San José, Costa Rica, car restriction is used for petrol rationing.
Car explosion is the main cause for traffic congestion in Mexican cities. The time lost in traffic is considerable for millions of citizens, many spend five or more years of their lives in traffic; especially those who spend more than two hours daily on their journeys.44 In comparison to birth rates, motorization rates in Mexico City are high (290 cars per 1000 persons), two new cars enter into circulation every time a child is born.45
5.2. Distance travelled
The extended city planning model requires long travel distances. In the absence of adequate public transport systems, private cars provide the best solution to cover such distances. When analysing the distance travelled daily in selected LAC cities it can be observed that in physically extended cities, including Buenos Aires, São Paulo, Mexico City and Rio de Janeiro, travel distances by car are greater, as can be seen in Table 21. The long distances travelled by taxi in Mexico City and Lima become relevant as it is likely that these taxis may be informal.
Table 21. Daily travelled distance in private cars (2007)
Individual travel (million of vehicle-km per day) Cities Car Motorcycle Taxis Moto-taxi Total
Belo Horizonte 8.4 1.2 1.7 11.3
Bogotá 9.2 1.2 10.9 21.3
Buenos Aires 83.2 1.4 5.4 90.0
43. Jaramillo et al, 2009. 44. Lopez. undated. 45. According to the Centro de Transporte Sustentable of the city (Planetaazul, 2011).
GRHS 2013: Regional report Paola Jirón 27 Latin America and the Caribbean

Individual travel (million of vehicle-km per day) Cities Car Motorcycle Taxis Moto-taxi Total
Caracas 9.8 1.1 2.7 13.6
Mexico City 51.2 3.6 45.7 100.5
Curitiba 5.7 1.3 1.0 8.0
Guadalajara 16.5 1.2 1.2 18.9
Leon 2.5 0.2 1.1 3.8
Lima 13.6 0.3 18.0 1.2 33.1
Montevideo 1.3 1.5 0.6 3.4
Porto Alegre 10.1 1.3 1.2 12.6
Río de Janeiro 42.0 2.3 7.9 52.2
San José 3.9 0.7 1.2 5.8
Santiago 9.8 0.2 5.9 15.9
São Paulo 80.4 7.2 8.5 96.1
Source: CAF, 2009.
5.3. Urban concessions As a way of tackling car congestion generated by the increasing rates of motorization, authorities generally see road infrastructure provision as the most adequate solution. Urban highway construction involves large investment that is not always possible for local or national governments to cover, thus the need for new forms to finance their construction. From the beginning of the 1990s, the expansion of road networks via concessions can be observed in several LAC countries.
Concessions for highway construction or reconstruction and administration consist of public bids over a period of time during which the concessionary company charges for the use of such infrastructure, in order to recover the invested money and to make a profit. The company has the concession for the service, but does not own the infrastructure, as this still belongs to the State.
Up to 2004, 13 Latin-American countries had started concessions, for 36,103 kilometres of highways (246 concessions), a quarter of which were made for specific works (bridges or tunnels) or interurban highways, or extensive distances inserted in urban frames.46 This latter is becoming a common way of building urban highways in cities like Santiago, Mexico City and Bogotá. Box 4 provides examples of how concessions for public works take place in Chile and Argentina.
Box 4. Urban road concession systems in Chile and Argentina
The Chilean case: The Chilean government is considered advanced in terms of urban highways concessionsa and many Latin American countries have replicated its concession system. Through the 1996 Concessions Law, the private sector was able to participate for the first time in public works’ investment, maintenance and operation, developing important road and airport connectivity plans.b
46. CEPAL, 2004.
GRHS 2013: Regional report Paola Jirón 28 Latin America and the Caribbean

From this system, five different concessioned highways have been built in Santiago: Autopista Central; Américo Vespucio Tramo Nor-Poniente; Américo Vespucio Tramo Sur; Costanera Norte; and Acceso Sur. These new highways use a modern free flow toll payment system which is meant to increase the capacity of existing roads and reduce travel time, congestion, accidents and pollution.
A major problem identified in Chilean urban highway concession involves complaints regarding the rise of toll prices, especially on weekends and holidays, as well as peak hours, due to congested side roads, evidencing lack of continuity and homogeneity in their design. Other problems include stone attacks from level crossings injuring car users and the many problems attributed to highway design, which often breaks up the urban fabric, leaving certain areas of the city, disconnected, privileging car flow over city continuity.
The Argentinean case: During the 1970s, the different road accesses to Buenos Aires collapsed as a result of the increase in motorization and only two main roads were designed for fast traffic. Additionally, the city lacked a connection to Ezeiza International Airport. In 1977 the Buenos Aires City Council, along with the central government, undertook the Urban Highways Plan, based on a toll system through an international tendering for two highways.c
In 1978 a Spanish-Argentinean consortium (Autopistas Urbanas Sociedad Anónima, Urban Highways Ltd.) was awarded the 28-year highway concession. The concession also included a 3km subway extension, thus improving the urban transport system by taking advantage of the proximity of the future highway to the subway system.c However, in economic terms the highway performance did not meet expectations as currency conversion meant that the consortium was unable to manage both its debts and highways maintenance. Given this situation, the Buenos Aires City Council acquired the consortium’s shares in 1985 and the city council became formally in charge of the highways.c
Source: a. CEPAL, 1999; b. COPSA, 2010; c. AUSA, 2006.
5.4. Helicopters as a means of urban transport
Helicopter purchase or rental is gaining popularity among businessmen in Latin America,47 for more efficient and safe modes of transport,48 however it is a luxury that very few people can afford. Apart from being a fast service, it offers privacy and maximum security and users can avoid being an easy target for kidnappers in dangerous cities. According to helicopter manufacturing companies, São Paolo and Mexico City are the two cities in the world where most helicopters are sold.49 Both cities offer the best conditions to expand this means of transport: car saturated streets and an elite with enormous purchasing capacity. With the proliferation of high-rise buildings in the last decade, the number of heliports in Santiago increased from 27 in 2003 to 45 in 2007; in addition to the new heliports being built in newly built high-rise buildings.
5.5. Challenges
Increasing motorization rates and the expectation that these will continue to rise, as most countries experience economic growth, presents serious challenges to Latin American cities, particularly as this increase is bound to bring about greater congestion and pollution (noise and air). This is especially worrisome if policy response involve uncoordinated urban transport policies, as it can often be seen that urban highway constructions are implemented without coordination to other policies, including public transport, environmental policies, urban planning or road safety measures.
47. Piedragil, 2008. 48. El Pais, 2008. 49. Martinez, 2010.
GRHS 2013: Regional report Paola Jirón 29 Latin America and the Caribbean

6. Commercial Goods Transport The opening of economies in the region over the last decades has produced an expansion in supply chains, as a result of free trade agreements and transport intensive globalization. The movement of goods within Latin American countries has also increased as a result of economic growth, infrastructure improvement and overall growth in the region. Private goods producers and commercial firms have also developed goods management strategies, dealing simultaneously with the costs of transport, quality of service and storage costs along the supply process, production and distribution. Governments have played a crucial role in the provision of infrastructure, regulating transport service and private sectors.50
Road transport is the dominant internal mode of transport in the region. In Brazil 60 per cent of total transport of goods is made by road, 66 per cent in Argentina, 70 per cent Mexico and 80 per cent in Colombia. Demand for road use has increased significantly over the past few years, based on the increased motorization processes. This has generated congestion in various stretches of the network, fundamentally in cities and in urban accesses.51 Urban freight is indispensable for the cities economy but at the same time it significantly affects the attractiveness and the quality of urban life. The impact of transport trucks delivery vans or messenger motorcycles also generate considerable environmental impacts and heavy congestion. Freight trucks have greater energy consumption than other vehicles, and their impact over pollution is greater as can be seen in Table 22 for the case of El Salvador.
Table 22. Energy consumption in road transportation: The case of El Salvador
Energy (in trillion calories)
Type Area Modality Means Gasoline Diesel
Liquefied petroleum gas (LPG)
Total
Taxi 175 2 0 177Minibus 180 274 0 454
Road
Motorcycle 296 0 0 296
Urban
Urban Subtotal 1,981 334 0 2,316Road Busses 2 644 0 646Rail Rail 0 6 0 6
Inter-urban
Inter-urban Subtotal 2 650 0 653
Passenger
Total Passenger 1,984 985 0 2,968Urban Light trucks 2,609 1,107 0 3,716Inter-urban
Road Heavy trucks 33 2,812 0 2,845
Freight
Total Freight 2,641 3,919 0 6,560Total Transport 4,625 4,903 0 9,529Source: Guerrero, 2011.
Another problem faced by many cities in Latin America is the transport of vegetables, gas tanks and cardboard, paper and scrap on tricycles. There are also modified tricycles used as a source of work to sell ice cream, popcorn, cotton candy, drinks, sweets, prepared food, and packaged delivery.
50. Barbero, 2010. 51. Barbero, 2010.
GRHS 2013: Regional report Paola Jirón 30 Latin America and the Caribbean

The following cases show the specific situation for two cities in the region attempting to implement freight transport policies.
6.1. Belo Horizonte, Brazil52 Belo Horizonte’s metropolitan region has experienced a significant population growth, making it the third largest metropolitan region of Brazil and the eighth in Latin America. Like most cities in the LAC region, Belo Horizonte’s main transport problems include: inefficient public transportation pattern; private car use growth; traffic saturation in the central area; metropolitan disarticulation; inadequate conditions for pedestrian movement; and excessive congestion.
Over the past few years one of the most noticeable consequences of these problems has been congestion. The road system is conditioned by the rugged topography of the region as well as by other barriers like rivers and mountain ranges, which hamper an easy articulation of movement between many areas of the city. Some of the main features of the road system are frequent topographic gaps, even in cases of roads that play an important role within this transport system. The radial structure of roads makes the city central area a place of traffic convergence.
In terms of freight vehicles movement, the main problems in Belo Horizonte include:
Increase in the quantity of trucks, vans and motorcycle movements, especially in the central area;
Inadequate capacity for traffic in the Ring Road: more than 30 per cent of the truck movements on this road transit through the city;
Lack of cargo terminals with logistic platforms that could consolidate smaller deliveries and use more adequate freight vehicles that drive within the central area;
Lack of logistics platforms within the central area support storage operations of products in retail shops;
Lack of a system that concentrates on the deliveries of small goods. This could then reduce motorcycles and other freight vehicles movement performing single deliveries.
The conflict between the movement of freight vehicles and other types of vehicles will worsen over the next few years because of the increase in the quantity of freight and passengers vehicle movements and because of the lack of traffic capacity of the ring road which can be seen at two levels:
Conflict between freight vehicles and private vehicles: this is probably the main concern of urban logistics in Brazilian cities. With a growing car and motorcycle fleet over the last decades and given the available infrastructure, the immediate consequence is that traffic conditions will get worse. Economic growth and goods purchasing pattern changed (increase of telephone and internet shopping) and trade storage (‘just in time’ delivery) have increased the number of trips made.
Conflict between freight vehicles and public transport vehicles: it is expected that the implementation of BRT will claim a significant part of the main road infrastructure for public transportation, thus reducing space for the circulation of traffic in general. Unlike cars, that find alternative routes, large freight vehicles will have more difficulty to move on main roads and seeking alternatives there will possibly have a negative impact on secondary roads.
52. TURBLOG, 2011a.
GRHS 2013: Regional report Paola Jirón 31 Latin America and the Caribbean

Other possible future problems are the difficulty of finding areas to build distribution centres in more consolidated zones and the increase freight motorcycles movement (motofrete).
The urban logistic in the Belo Horizonte Mobility Plan considers the measures of freight already been adopted in Belo Horizonte as an initial approach of the policy. It considers intensifying loading and unloading operations control, especially in the downtown area, and stimulating the deployment of distribution centres in the city and highways and areas with compatible land use and transportation system, particularly in the ring road areas. The most important action proposed is to create a database and comprehensive diagnosis in order to develop an urban logistic plan.
The main objectives of these restrictive measures are (1) to reduce the flow of medium and large freight vehicles during rush hours; and (2) to facilitate loading and unloading operations. The City Council introduced this measure in agreement with the stakeholders regarding the rules and deadlines and implemented the measure in stages.
6.2. Freight transport and infrastructure in Mexico City53
Mexico City presents serious difficulties in its roadway network related to the linkage between the Federal district and Mexico State roads, where the Federal District has a mesh pattern and the Metropolitan Municipalities of the State of Mexico (MMMex) a more linear pattern. This generates lack of connectivity in several sectors of the roadway net of MMMex. In a couple of situations this is due to the urbanization pattern, as it was not a conurbation when this started to happen, this was not properly adjusted for continuity in roadways. The structure of the roadway net in the Federal District is hierarchical with relatively good articulation between the net of roadway axis and the main roads. Nothing like this exists in MMMex, and furthermore there is hardly any continuity between the roadways in one municipality and the neighbouring one.
Moreover, in MMMex, in particular to the north of the Federal District, roadways all feed into the northern periphery highway. During the period 2002–2008, the Mexico City Government made a very important investment in infrastructure to improve vehicle circulation and reduce vehicle emissions. Flyovers and traffic interchangers were built, geometric continuity of lanes in speedways was improved, and the first elevated viaduct was built over the peripheral highway in the centre-south sector. Currently the project of a new elevated roadway is being adjusted in the Federal District (Viaduct South-West, which will connect the new Santa Fe Business Centre with the south of Mexico City), and the last stage of the Bicentennial Elevated Viaduct is being built in MMMex, over the northern periphery. Obviously none of these roadways solves traffic jams, as infrastructure of this kind only transfers jams from one zone to another in the City.
As in all Latin American cities, gated communities proliferate, at a rate equivalent to indicators of unsafe levels due to crime threats. A common practice in the Mexico City metropolitan area is that neighbours in one section of a neighbourhood decide to close road accesses to vehicles that do not belong to residents.
Urban freight transport in the Mexico City metropolitan area is faced with the above-mentioned infrastructure problems of the road network. Furthermore, in the Federal District freight transport vehicles cannot access speedways or elevated viaducts. Also, they can only circulate on roadway axis and on the secondary roadway net in neighbourhoods. The
53. TURBLOG, 2011b.
GRHS 2013: Regional report Paola Jirón 32 Latin America and the Caribbean

circulation of vehicles is limited from 07:00 am to 10:00 pm in the historic centre (vehicles of more than 3.5 tonnes) and in the whole urban area (vehicles of more than 17.5 tonnes), with some exceptions for specific urban sectors.
The fleet of vehicles registered in Mexico City exceeds 3.5 million vehicles with another 4 million entering the city during the day, coming from the MMMex and from other federate entities. Thus it is estimated that the number of vehicles in circulation on the roadway net during the day is more than five million (see Table 23).
Table 23. Vehicle fleet in Mexico City
Vehicle fleet 2003 2005 2007Private vehicles 1,987,753 2,592,621 3,106,282
Freight vehicles 61,652 74,974 85,841
Taxis 105,955 106,763 108,141
Collective passenger vehicles 23,317 28,532 30,057
Total 2,178,677 2,802,890 3,330,321Source: TURBLOG, 2011b.
In the Mexico City metropolitan area pedestrians, bicycles, motorbikes, automobiles, public services vehicles (e.g. security, garbage collectors and sanitation), public passenger transport vehicles, freight transport vehicles and weekly street markets in each neighbourhood compete for public space.
The difficulties for freight transport vehicles to circulate in the roadway net of Mexico City metropolitan area can be envisioned according to the type of transport service, in the average number of points of delivery, the average length of journeys and the average distance interval between points of attention for the typical vehicle in each type of service.
At national and federal levels in the country there are no specific policies for urban freight transport. The technical regulations for federal public service vehicle transport in federal highways are applied by extension to vehicles in the urban context. In particular in the Mexico City metropolitan area, there are neither formal policies on urban transport of merchandize nor an official document that regulates it completely. Both in Mexico DF and in the State of Mexico there is no integrated body of rules and regulations, but isolated actions. The most relevant actions that impact urban freight transport in Mexico City are related to restrictions for freight transport vehicles and programmes for controlling emissions of pollutant and greenhouse effect gases.
From the business side measures include inventory reduction; development of innovative alternatives for order processing; using delivery points for ‘e-commerce’; introduction of information technology innovations in logistics; technology innovation in vehicles; operation outsourcing through logistics operators with assigned fleets; and preference to locate logistics support in logistics centres.
6.3. Challenges
Urban freight plays an important role in city congestion and as cities grow, freight activity has been mostly neglected in terms of tackling the environmental and congestion impact it generates. Structuring roads, storage, terminals, restriction and logistic coordination will become a difficult task. In this endeavour, public policies are crucial, however, private measure from small and large business are also urgent.
GRHS 2013: Regional report Paola Jirón 33 Latin America and the Caribbean

7. Integrated Land Use and Transport Planning Urban transport is an essential element to be considered in land use policies in cities. Studies show that a transport agenda requires intentional links between land use that favours a rational use of the transport system in an economic, environmental and financial sustainable way, thus solving serious problems regarding exclusion and insecurity.54 However, decisions relating urban infrastructure and transport services and the whole urbanization processes (including housing, suburbanization and urban extension) and population growth are not often harmonious.
LAC cities show a variety of combinations of possible interventions linking land use and transport. Current trends in integrating land use policies with transport include direct intervention from the competent administration or allowing the market to self-regulate. The first includes transport time control, route shortening and public transport use promotion, simultaneous to planning and developing infrastructure. The second involves real estate developers participating in new developments programmes, allowing, within legal limits, market agents to determine the points of transport demand and transport policies and services that facilitate service, parallel to the dependence on vehicles.55 Experience shows that policies that legislate land use have been not been effective in terms of favouring harmonious development and that the interests of the market do not contemplate long-term planning.
In this context, a third possibility arises that is a somewhat intermediate proposal. It involves the creation of an agency or legal tool that concentrates infrastructure investment in specific spaces in the urban periphery, as a way of promoting high density developments. In this type of solution, the planning process can be made quicker and real estate promoter can finance part of the infrastructure costs. In Latin American cities, following European and North American models, this has been considered as conditioned planning. The following cases show different trends in various Latin American cities.
7.1. Guadalajara, Mexico: The need to understand urban structure
The absence of a transport planning policy in Guadalajara meant that service providers carried out a lucrative routing, especially in the downtown area, which turned the centre of Guadalajara into a massive transfer point. The city network has connecting routes that link most parts of the city to the downtown area, forcing users to travel downtown and transfer in order to reach their destinations, increasing users’ travel time and causing congestion and environmental deterioration at best. The high number of routes that cross the downtown area contrasts with the low population density of the area. This routing system is inefficient, as it does not involve greater urban coverage, but concentration in specific zones: 90 per cent of public transport routes operate in the central area of the city, while vast peripheral areas, where low-income settlements are located, do not have many transport options.56
The response from the State administration to tackle this situation over the last ten years, involve mechanisms to optimize the existing infrastructure which did not modify the core of the system. This includes allocation of exclusive ways for public transport, restricted bus access to downtown area, bus stops distribution, road signage, and speed control devices did not contribute in a significant way transport problem57 as transport system continued to pass through downtown areas, continuing to generate congestion and long travel time, having as a
54. Rania, 2010. 55. Agosta, 2008. 56. Velazco Castaneda, 2001. 57. Velazco Castaneda, 2001.
GRHS 2013: Regional report Paola Jirón 34 Latin America and the Caribbean

consequence: the gradual loss of internal accessibility, road congestion and deterioration of downtown. It appears that Guadalajara requires a comprehensive road plan modification and an overall understanding of travel origin and destination in order to define an adequate structure and avoid loss of accessibility.
7.2. Curitiba, Brazil: The right to access Curitiba is considered a positive example in transport planning due to the way the city sees the link between transport and urban planning. From the origins of its Research and Urban Planning Institute in 1925, this municipal institution has explicitly linked road structure with urban expansion and transport. Since then it has made special emphasis to relieve the pressure on the roads, control population growth within physical-territorial limits and provide public amenities and infrastructure services considering accessibility rights to its citizens.58
Its lineal structural north-south and west-east axes composed of a main street with exclusive lanes for collective transport, two side routes for slow local commercial traffic and two parallel lanes to the axis designed for fast traffic. Land use parameters involve lineal growth and densification of the city along the structural axes, contributing to relieve pressure on the downtown. This is further complemented by a network of urban amenities and social services to ensure access to education, training, health and housing, without necessary having to travel to downtown areas to access these services.
7.3. Bogotá, Colombia: Resurgence of public space
Bogotá considered there was a misuse of public space caused by the high number of vehicles, pollution and noise. This situation meant loss of opportunities regarding communication and socialization, seen as essential in an urban context. This situation was evidenced by the modal split of trips, which, despite predominance of public transport (57 per cent) and travels by foot (15 per cent), most of public roads are used by private vehicles (15 per cent).59
However, there is clear awareness of the benefits of joint planning policies, resulting in two areas for coordination that affects mobility. The first involves a mixture of activities in urban development (a combination of stores, offices, leisure facilities and residence) that facilitates multiple destination trips, and thus the use of public instead of private transport, due to proximity of a wide range of services available.
The second area relates the effectiveness of the urban transport to land planning. In this case, transport network and services have to be developed before the generation of demand for transport. Based on these two areas for coordination, land use planning determines the urban systems that compose its basic structure, defining at the same time the configuration of the mobility system.60
7.4. The case of Ecuador Within the framework of a project developed by the Ministry for the Environment and the United Nations Development Programme – aimed to strengthen national capacity to assess and develop policies with reference to climate change – transport and land use planning have become important topics to incorporate and create spaces for public or non-motorized transport. In addition, urban planning may create mixed areas, integrating residential and
58. Vallicelli, 2002. 59. SDP, 2009. 60. Contraloria de Bogotá, 2005.
GRHS 2013: Regional report Paola Jirón 35 Latin America and the Caribbean

commercial zones, thus reducing the need for long trips. These actions would meet the objective of decreasing the emissions of greenhouse gases.61
7.5. Santiago, Chile: Conditioned planning Conditioned planning refers to a type of land use planning, where urban land use is extended beyond the city limits under certain conditions where developers cover specific costs. This model has been implemented in Santiago and transport has been a crucial aspect in its mitigation costs. These new tools allow the development of new residential areas outside the urban limit with the condition of self-sufficiency in terms of infrastructure and amenities; or large real estate projects which may develop in any area outside the urban limit under the condition that they comply with enough infrastructure and amenities through urban impact studies which identify the areas of influence, determine the impacts and propose mitigation actions for natural risks, transport and roadways, running water, sewage, water treatment and drainage.
Some of the problems that arise from this model is that physical integration among these projects or their thematic or functional relation is often spelled out after individual projects are conceived or even built, thus generating islands of urban development throughout the periphery of the city. Under strong competition for urban land, speculation for land prices abound as do the new forms of segregation through gated communities increasingly located outside the urban limit in search for suitable land plots. Growth in peripheral areas is clearly defined according to income groups, as there are districts for social housing for low-income groups, districts for middle-income groups and districts for high-income groups. The main mitigation response has involved accessibility improvement, with urban highways connecting high-income developments to inner city amenities. When developments are targeted for lower-income groups, accessibility mitigation is not as quick to respond. Due to the long-term construction plan for these developments, new location needs will take a long time to become urgent, mainly in road network and transport.
7.6. Challenges
Future trends in urban development will necessarily need to incorporate mobility as one of the key guiding objectives. If conditioned planning becomes a trend in the future, it requires careful analysis and consideration. It particularly requires early definition of mitigation costs and those paying for them require to be defined at the beginning of the process. This trend does not necessarily go hand in hand with current congestion and environmental costs of transport problems, thus requiring a critical approach prior to implementation.
61. Ministerio de Medio Ambiente, 2011.
GRHS 2013: Regional report Paola Jirón 36 Latin America and the Caribbean

8. Social Sustainability of Urban Transport One of the most relevant processes in LAC during the 20th century has been its accelerated demographic explosion. This has been characterized by high birth rates but also by an aging population, particularly in Argentina, Chile and Uruguay. In these countries (in 2000), 12.7 per cent of the population was 60 or older, and only 28 per cent was less than 15 years old. Between 1990 and 2000, the population under 15 years of age decreased from 36 percent to 32 percent and those over 60 increased from 7.1 per cent to 7.9 per cent. Household size also decreases, in Santiago, in 1977 there were 4.89 persons per household and in 1991 only 3.77. Household size is one of the explicative variables of motorization level and of car occupation in trips.62
Equity and social and intergenerational integration implies similar access to transport conditions, including trip cost and safety. This has two components, geographic (equity for all neighbourhoods) and social (equality for whole population) and it has two temporal horizons, present and future. One of the most worrisome issues of car dependent society is the social injustice from physical and social isolation for important groups of society. Often lower-income groups, disabled, youth and elderly do not have cars, or access to a good number of opportunities. Similarly, this isolation implies accessing opportunities for work.
This increasing quality of urban transport not only provides economic efficiency, but also eases opportunities to access employment and services for lower-income groups. Many citizens depend exclusively on public transport, and better transport can increase opportunities. As cities grow and congestion increases, the costs of travelling increases in terms of both money and time. This has more impact on lower-income countries. In São Paulo and many cities in Latin America, lower-income population live in distant areas of the city, where housing at a lower price is available, but often without adequate public services, including public transport, forcing them to walk or use an increasingly restrictive public transport. Lower-income groups spend between 20 and 40 per cent of family income on transport, and other studies show that transport expenditure of over 10 to 120 per cent is a heavy load on families and not equitable.63 Safe, reliable, affordable and sustainable public transport options could be integral to a comprehensive policy to address inequality in the region.
However, issues of inequality in mobility not only relate to overall disparity in travel time, modes or distance. Particularly crucial to understanding mobility in the region is to understand how this inequality takes place and how vulnerable and fragile households are to face mobility challenges. The differences in travel comfort, however and where people wait for public transport, street conditions to walk during the day and at night, the limited options, are all part of exclusionary mobility practices.
Moreover, when considering transport decisions, looking at origin and destination is no longer enough to make transport decisions, as organizational practices within the household become imperative to decision making. Here, gender considerations are necessary. Gender disaggregated information on mobility is not always available for the region, however, more qualitative research informs how mobility decisions in most Latin American cities are not only based on the shortest or fastest routes, but that household organizational decisions come first. Who and how children will be taken to (or picked up from) school, where will cooking take place, how will clothes get ironed – all involved a support network (grandparents, friends, family) which is orchestrated to organize household chores. Often women orchestrate
62. Monzón, 2005. 63. Monzón, 2005.
GRHS 2013: Regional report Paola Jirón 37 Latin America and the Caribbean

these decisions, and family mobility decisions depend on how these are tackled, and when support networks fail, the fragility of the network is evidenced, as are mobility strategies.64
Linking cities through fast and affordable bus systems like Bogotá’s TransMilenio certainly makes them more connected and cohesive, while providing poorer residents with improved access to cities’ economic centres. Improving access to schools and workplaces can help historically marginalized and economically excluded groups break from the cycle of poverty and inequality.
While the benefits of achieving a healthy lifestyle and a high level of education might, in theory, be equal for all people, the costs of achieving these goals are quite different for a family living far from a city centre and a family living nearby. Farther distances imply reduced access to schools and health services, greater transport costs, and higher opportunity costs: more time spent in transit reduces the amount of time that children can contribute to family tasks or even work outside of the home, for example.
This analysis of human development from the ‘operative restrictions’ perspective implies that policymakers and planners must account for the interaction between services that are available for families — for instance, health and education — and these families’ capacity to take full advantage of these services. Improved transport is crucial, in this respect, for advances in human development and reduced inequality in LAC.
8.1. Strategic Mobility Plan for Medellin 2008–2011
Medellín is located in north-western Colombia and has a population of 2,249,074 inhabitants, making it the second larges city in Colombia, after Bogotá.65 The Strategic Mobility Plan for Medellin aims to facilitate movement from any neighbourhood in the city to other areas for work, recreation or shopping in a safe, comfortable and easy way. The main mass transport mode in the city is the metro, and the plan integrates various transport modes, as well as improvement of public spaces for pedestrian and bicycle circulation. It attempts to decrease the use of motorcycles, which have become increasingly problematic due to the large number of them present and the accidents they generate. The plan aims at generating a cultural change in behaviour in public spaces and streets.
The plan involved investments of a total of US$400 million during the 2008–2011 period, and included improvement in improvement in the public transport services, new roads (including a ring road, construction of which started in 2008, and foot and bicycle paths), modernization of traffic controls and improvements in the urban environment. The purpose of the plan was to facilitate people to reach all areas of the city for work, recreation shopping, etc, in a safe, comfortable and fast way. The plan was inspired by the high rates of traffic accidents in the city and the great number of motorcycles that circulate daily.66
The plan saw infrastructure as part of the city development, aiming to overcome sectoral views of the city, thus putting on a same plane the actions of the different secretaries. It also integrates public transport with private transport, while integrating other transport means including Metro, Metrocable, Metroplús, integrated routes and all the roads that will be constituted complementing the previously built ones
64. SSM, 2011. 65. http://www.medellin.gov.co/irj/portal/visitantes?NavigationTarget=navurl://cc87bacd71801ad7d6519aa01c823073, last accessed 2 June 2011. 66. Alcaldia de Medellin, 2008; Fajardo, 2000.
GRHS 2013: Regional report Paola Jirón 38 Latin America and the Caribbean

This plan attempts to significantly reduce level of fatality in traffic accidents in will implement and transit control schemes. Offender control will be strict to guarantees norm respect, creating a Transit Control Centre with the latest technology, placing cameras in strategic places in the city. It will also control drunk driving in night entertainment areas, speed control with radars, motorcycle control, increase fines, among others. It will also create a Mobility Laboratory that will collect information for expert analysis on what is happening on roads with cars, pedestrians and traffic control.67
One of the most important transformations for the plan to work involves improving street behaviour. For this it will increase the presence of authorities, to ensure that transit norms are complied with, as well as educative and cultural actions to promote new attitudes. So far some of the results include:68
In terms of infractions: o Since 2006 the number of traffic offenders that have been dealt with by the police
has increased each year.
o Most infractions are related to public services control, mechanic certification and motorcycle control.
o Parking control has generated better road conditions for pedestrians and relieved congestion.
o Sanctions for lack of technical and mechanical certification have increased by 180 per cent in 2009.
o Road safety on public transport has increased due to open door driving control, less infractions for excess capacity and for picking up passengers in places not established.
o 58 percent increase in infraction for lacking driver’s license.
Accidental rate: o All accident rates in the city have decreased in the last two years in a systematic
way.
o The number of deaths caused by traffic accidents has been reduced.
o The accident rate target has been met.
Drunk driving: o Accidents due to drunk driving decreased in 2009 by18.1 percent.
o The number of drivers testing positive for drunk driving has been reduced.
8.2. Road safety and transport
According to IADB figures announced in 2010, 125,000 people die every year in Latin America as a result of traffic accidents, which led countries to spend 4 per cent of their GDP to take care of victims.69 All forecasts for Latin America predict that the number of traffic accidents will double within ten years. At present, there are 17 deaths per 100,000 inhabitants in the region,70 if this trend continues, the number of deaths may increase to 31 per 100,000
67. Alcaldia de Medellin, 2008. 68. Alcaldia de Medellin, 2008. 69. La Estrella, 2010. 70. According to the World Health Organization, the rate is 26.1 deaths per 100,000 inhabitants (http://www.comiteseguridadvial.org/es/index.php, last accessed 2 June 2011).
GRHS 2013: Regional report Paola Jirón 39 Latin America and the Caribbean

Figure 5. Traffic fatalities in Latin America and the Caribbean (1996 and 2001)
(Fatalities per 100,000 inhabitants)
Source: CEPAL, 2005.
inhabitants by 2020.71 This is why the Inter-American Development Bank submitted an Integral Action Plan to improve road safety in Latin America and the Caribbean and to halve the number of deaths as a result of traffic accidents by the next decade.72
Figure 5 indicates that, in 1996, Venezuela and Colombia had the highest traffic death rates (fatal victims per 100,000 inhabitants), while the Bahamas and Barbados had the lowest number of fatal accidents.73
Table 24. Number of car traffic fatalities in Latin America and the Caribbean (1996–2003)
Traffic fatalities Country
1996 Percentage
2003 variation
Brazil 26,903 31,000 15%
Colombia 7,874 5,632 -28%
Argentina 6,473 9,556 48%
Venezuela 2,563 3,221 26%
Peru 2,163 3,323 54%
Chile 1,925 1,703 -12%
Cuba 1,424 1,309 -8%
Source: CEPAL, 2005.
71. UNL, 2010. ECLAC estimates show that the number of deaths from traffic accidents will rise by 48 per cent by 2020 (CEPAL, 2005). 72. CNN Mexico, 2010. 73. CEPAL, 2005.
GRHS 2013: Regional report Paola Jirón 40 Latin America and the Caribbean

Figure 6. Trends in number of traffic accidents in Latin America and the Caribbean (1990–2004)
Source: CEPAL, 2005.
Between 1990 and 2004, the number of traffic accidents decreased in Brazil, Chile, Ecuador and Nicaragua and increased sharply in Argentina, Costa Rica and Colombia (see Figure 6). This rate did not vary greatly in Bolivia, Honduras and Venezuela. The high number of accidents in Colombia and Brazil is striking. The same trends occur when contrasting traffic death rates with traffic accidents, except in Colombia, where rates decreased since 1998.74
8.3. Successful experiences regarding prevention of traffic accidents
There is no doubt that Colombia has adopted successful road safety measures. In 1994, the Fondo de Prevención Vial (FPV, road prevention fund) was established to promote road safety campaigns and thus reducing, in coordination with funding authorities, the number of traffic accidents. The FPV aims at: 75
Helping to promote awareness among people on mobility risks.
Being the ‘voice of conscience’ of road safety.
Incorporating the concepts of ‘quality of life’ and ‘civic culture’ into road safety through education programmes and road education.
The FPV is divided into the following programmes:76
Safe users; which consists in road safety education, training of drivers and civic awareness.
Safe vehicles; which consists in technical and mechanical inspections.
Safe infrastructure; this programme is managed by road safety authorities and addresses critical issues.
Safe traffic; this programme includes road safety certificates, road safety plans, research and information on likelihood of accidents.
74. CEPAL, 2005. 75. CEPAL, 2005. 76. CEPAL, 2005.
GRHS 2013: Regional report Paola Jirón 41 Latin America and the Caribbean

In Costa Rica, traffic accidents are a public health issue, as they are one of the main causes of deaths. Given the seriousness and complexity of road safety problems, people from different areas and disciplines formulated a set of coordinated actions. In 1996, the National Council on Road Safety, part of the Ministry of Transport, reformulated its policies and implemented the National Plan for Road Safety, aimed to reduce the number of deaths. This Plan is engaged in a number of activities, such as transit laws, police inspection, education, infrastructure and research.77
Paraguay, with the support of IADB, launched the Plan for Road Safety 2008–2013 in 2008. According to available data, this country has the highest mortality and morbidity rates caused by the lack of road safety. It is estimated that 1,500 people die and 12,000 people result injured as a consequence of traffic accidents every year.78 This problem is caused mainly by:79
Lack of social and governmental awareness on the problem.
Lack of nationwide plans and policies on road safety.
Institutional weakness and lack of coordination among entities.
Limited information.
Inadequate, limited and uncoordinated control of infrastructure and urban roads for road security and traffic surveillance.
Limited education of users, drivers and authorities regarding road security.
Lack of traffic and transport guidelines regarding road security.
The age of vehicles and the limited control of their condition.
Limited resources allocated to road safety.
This Plan is an instrument that links and coordinates strategies to face critical causes from different action lines, so as to reducing the likelihood of road accidents in Paraguay. Governmental and private institutions, as well as some groups of society take part in this initiative.80
8.4. Road safety plan by Inter-American Development Bank81
The Inter-American Development Bank (IADB) presented the Integral Action Plan to improve road safety in Latin America and the Caribbean, supporting the efforts of individual countries to halve the number of traffic accidents by the next decade. Under this plan, the IADB will help countries to elaborate and update their plans to improve road safety conditions and reduce death rates. Joint work with governments and public and private actors in order to mobilize resources to promote road safety initiatives is another goal of the Plan. The IADB project also suggests the incorporation of road safety elements into infrastructure and transport initiatives funded by the Bank.
The IADB will help countries to develop and promote road safety among different economic sectors. The Bank will also support the design of nationwide strategies for road safety and action plans, as well as promoting both public awareness campaigns and new technologies that may improve the safety of vehicles manufactured in the region.
77. CEPAL, 2005. 78. www.mopc.gov.py/mopcweb/pdf/pnsv_2008_2013.pdf, last accessed 3 June 2011. 79. www.mopc.gov.py/mopcweb/pdf/pnsv_2008_2013.pdf, last accessed 3 June 2011. 80. Ministerio de Obras Públicas y Comunicaciones, 2008. 81. IADB, 2010.
GRHS 2013: Regional report Paola Jirón 42 Latin America and the Caribbean

8.5. Traffic accidents in Bogotá The situation in Bogotá may reflect that of many cities in the LAC region. In Bogotá in 2009, there were 528 traffic accident deaths, 7.2 per cent of deaths per 100,000 inhabitants. This is a worrisome number, compared to cities like London (1.8) or Madrid (2.4). Those most affected are pedestrians (60 per cent of all victims), and motorcyclists and cyclists (20 per cent of victims). The main victims are older men, 19 per cent are older than 60 years and 17 per cent between 25 and 34 years old.82 To reduce these rates, actions required include improving public transport services, as in the case of Bogotá, 15 per cent of collisions and 17 per cent of deaths involve one or more collective transport vehicles. Another action includes regulating motorcycle use as these are involved in 40 per cent of transit accident deaths and 45 of those injured in these collisions. It is also necessary to verify, analyse and determine the highways, arteries and main roads where speed limits need to be modified, as the main causes for accidents are associated to speed, drunk driving and drivers imprudence. The role of road prevention campaigns with citizens and private car drivers is also considered imperative, as private cars were involved in 46 per cent of reported deaths.83 For this, citizen perception indicators to evaluate impact of accident prevention policies and campaigns, and dissemination mechanisms are also relevant.
8.6. Cyclists’ institutions
There are many institutions, non-governmental organizations and web pages dedicated to urban cycling around Latin America (see Table 25 for a list of some of these).
Table 25. Institutions working on cycling promotion
Country Name of organization Argentina Asociación de ciclista urbanos
Brasil Amigos de bike, Apocalipse motorizado, Associaçao Bike, Associaçao Blumenauense Pro-ciclovías, Associaçao Ciclistica de zona Sud Porto Alegre, Campinas CicloViável, Escola de Bicileta, Grupo CicloBrasil, Grupo Transporte humano, Instituto Pedala, Mundo da Bike, Night bikers Club do Brasil, Uniao de Ciclistas do Brasil, Vá de Bike, Viaciclo Floranopolis
Chile Centro de bicicultura, Cicliteros Talca, CicloRecrovias, CicloSantiago, Macleta, Red Prociclista, Unidad Ciclista de Primeros Auxilios. Movimiento Furiosos Ciclistas, Ciudad Viva, ciclistas Universidad Central, Asociación Regional de Ciclismo Metropolitano, Arriba e la Chancha, Pedalea, Contrapedal, Recicleta, Bicivilizate, Ciclismo Urbano Chile, Ciclo-monos de Valdivia.
Colombia Ciclismo de Colombia, Pedalenado, Mundo Ciclismo UCI
Ecuador Biacción, Ciclopolis, CicloPaseo, Vía Recreovía
Mexico IMFUBU, Maya pedal, Bicitekas, Vía RecreActiva, Pasos y Pedales Guatemanal, Xalapa Pro-Ciclismo, Ciclismo en México, Ciclismo Urbano México
Peru CicloAxion, Tour del Caminante
Uruguay UruBike, Ciclismo Uruguayo
Venezuela Amigos de la Ciclovía
Source: Own elaboration
82. Camara de Comercio de Bogotá, 2010. 83. Camara de Comercio de Bogotá, 2010.
GRHS 2013: Regional report Paola Jirón 43 Latin America and the Caribbean

Cyclists’ mobilizations have also taken place in many cities in the LAC region. In 1996, the first ‘Bicycle March’ took place in Buenos Aires and in 2006, approximately 600 cyclists marched naked in Mexico to promote the use of bicycles and concern on the environment. In Peru and Argentina in 2007, there were manifestations against road safety. On 22 September 2009, Argentina established a ‘Car Free Day’, along with other 1,500 cities worldwide in order to give a break to the city by leaving cars at home and use public transport, walk and especially use the bicycle. That same day in Peru, 500 cyclists were mobilized to the Congress of the Republic to demand the approval of a law that promotes the use of bicycle as a mode of transport and declared 22 September as a ‘Car Free Day’. In 2010, 600 young people marched on the streets of Mexico City to promote the ‘Rolling for Your City’ campaign. In September 2010, 86 Mexican cities joined in the ‘Bicycle Crusade’ (promoted by the Health and Environment Secretaries of the Federal District) with the aim of promoting bicycle use to combat obesity, overweight and climate change and more friendly cities. In Santiago de Chile, every 9 September the ‘Bici-culture Festival’ takes place. Furthermore, the ‘Cycling School for Women’ is an initiative that has taken place in Santiago since 2008, to teach women to overcome their fear of cycling in the city.
GRHS 2013: Regional report Paola Jirón 44 Latin America and the Caribbean

9. Urban Transport and the Environment From a transport point of view, the main aim of policies concerned with climate change, should be to reduce polluting and noise making emissions, and avoiding negative effects on the environment. Greenhouse gas emissions from electricity and heat production, manufacturing, transportation and other sources account for a significantly smaller percentage of LAC’s total greenhouse gas emissions: 28 per cent in LAC compared with 61 per cent globally. The transport sector, which accounts for 8 per cent of total greenhouse gas emissions in LAC, plays an important role in the region’s climate mitigation agenda. CO2 emissions from transport sources have increased more rapidly than any other energy consuming sector as a consequence of rapid urbanization, increased vehicle ownership, aging vehicle fleet, and fuel combustion patterns.
In cities whose mobility systems are not sustainable, polluting emissions tend to increase, mainly due to low population densities, congestion, low proportion of public transport, old stock, etc. As can be seen in Table 26, numerous cities in Latin America, including Mexico City, Santiago, São Paulo, suffer from very high atmospheric contamination. From these cities, it can be stated that overall, the greater the distance covered the greater the pollution emissions. Hence the need to carefully analyse the impact of car use, particularly in relation to other transport modes, decreasing distances travelled and cleaner modes. The situation in Mexico City appears as the most concerning one of all.
Table 26. Transport indicators in selected cities
City Average travel
time by car (minutes)
Cars/km of road
Public transport and walking (%)
CO2 emissions per capita
kilogrammes/year Mexico 38 354 54 152.6
Rio de Janeiro 35 129 65 38.4
São Paulo 44 314 68 94.6
Santiago 32 n/d 76 24.2
Bogotá 18 50 70 51.8
Source: Mazorra and Peña, 2009.
Another source of contamination for pedestrians is noise, and Cali is the third noisiest city in Colombia with an average noise level of 86.5 dBA (65 dBA is the permissible street noise), most of it coming from cars.
This situation could change as LAC cities promote bus rapid transit (BRT) projects as an alternative to private transport, coupled with better land use, transport planning, and manage-ment of transport demand. BRT projects in Curitiba, Bogotá, Cali, Lima, Quito, Santiago, Rio de Janeiro, São Paulo and a growing number of other LAC cities have the potential to reduce emissions between 60 per cent and 80 per cent. However, to produce such results, BRT projects must be accompanied by measures to promote the transfer of passengers to mass transit, including the construction of cycle paths and pedestrian spaces for non-motorized transport, traffic control systems, and technologies to ensure improvement in the performance of BRT systems.84 Moreover, public transport interventions must be accompanied by urban planning initiatives, considering both aspects as indivisible from each other.
84. IADB, 2009.
GRHS 2013: Regional report Paola Jirón 45 Latin America and the Caribbean

Increased climatic variations will increase the vulnerability of the LAC region’s transport infrastructure. Of particular concern are increased stresses from flooding, erosion, and tidal and storm surges. Adaptation measures to protect or enhance resilience of a transport facility or network could include changing the location of key facilities and transport hubs and improving the design of facilities.
9.1. Brazil: Second largest producer of ethanol fuel Brazil is the leader in biofuels,85 and a model for other countries. Its 30-year-old ethanol fuel programme has generated the most successful alternative fuel is sugarcane ethanol as it can significantly reduce greenhouse gas emissions, including emissions related to land use changes. Ethanol fuel is available throughout the country and is based on the most efficient agricultural technology for sugarcane cultivation in the world. However, the feasibility of using such fuel is sustainable mainly in Brazilian cities, due to its advanced agri-industrial technology and land available.
9.2. Bicycle use as a response to environmental concerns
To encourage reduction in car use to diminish CO2 emissions and noise control, implementing public transport policies is considered necessary as well as feasibility studies that highlight the importance of cycling.86 The need to consider bicycles in public transport planning, goes beyond its benefits (ecological, healthy and efficient), but on the need to efficiently comple-ment both systems for more flexibility to urban mobility as a whole.87
Bicycle infrastructure promotion initiatives include cycle paths and cycle lanes. The first refers to public road signalled for the use of bicycles.88 In Bogotá, cycle paths were introduced in 1975 with temporal road closure of main city avenues on weekends to provide recreational and sport spaces used mainly for bicycles.89 Cycle lanes promote exclusive bicycles use on a daily basis, and tend to reduce traffic, congestion and reach positive social, economic and environmental dividends. Bogotá is the Latin-American city with the most complete cycle lane network, which is one of the longest in the world. These have been designed and built during the last two city government periods between 1999 and 2006, aiming to provide the city with a complete network of roads for bicycles, considering the city’s morphology and topography. Currently, the network is made up of more than 300 km, throughout the city. Zoning of future bicycle stations has also been planned, this will support and reinforce mobility towards corridors.
Santiago has a limited cycle lane network, on segregated ways and along the roads, on central median strip, or on the sidewalk itself. In 2007, the regional government initiated a plan to build 690 kilometres of cycle lanes before 2012, 550 kilometres urban and 140 kilometres rural, however, this plan is yet to be implemented.90 The district of Providencia in Santiago implemented a public bicycle system in 2009, which increased by 400 per cent one year later, starting with 1,020 bikes, rising to 4,050. The service is practically free, with only 1,000 pesos (US$2.00) monthly to hire a bicycle for one-hour trips, as many trips as desired
85. http://en.wikipedia.org/wiki/Biofuel, last accessed 2 June 2011. 86. Mazorra and Pena, 2009. 87. Urrutia and Rodríguez, 2010. 88. Ciclovías Recreativas de las Américas, 2010. 89. Instituto Distrital de Recreacion, 2010. 90. Cabello, 2010.
GRHS 2013: Regional report Paola Jirón 46 Latin America and the Caribbean

during that month. The system is designed for everyone to use, including women, children, the elderly, users ages range from 14 to 80 years old.91
In Mexico City bicycles are recognized as vehicles with rights and obligations to circulate on streets and established priority for pedestrians and cyclists, by introducing calm transit zones, cycle lanes and cyclist waiting areas.92 Venezuela implemented its first 14 kilometres of cycle paths in the district of Chacao in Caracas in mid-2004, with the aim of improving social, environmental and economic conditions of the district’s dwellers and passers-by. However, the routes are yet to be built. Similarly in Argentina, as part of the reorganization of transit and transport, the city of Buenos Aires is preparing plans for the implementation of a cycle path network. Various bicycle circulation studies have been undertaken, using both surveys and circulation census with a variety of variables.93
In Bolivia, CicloSucre is a non-profit organization aiming to provide efficient alternatives for urban mobility through the use of bicycles and improve public transport in the city of Sucre. The plan has three phases; the first consists in a technical analysis to install a cycle ways network, connecting tourist, academic and administrative attractions. The second phase complements cycle lanes with public transport, thus presenting a combined solution to the city’s contamination and congestion of the city. The third phase involves making proposals to municipal, regional and national authorities. It is currently undertaking an origin-destination survey and designing cycle path implementation in the city.94
In Rio de Janeiro there are 100 kilometres of exclusive lanes for bicycles and another 150 kilometres are being planned. The city has also resolved bicycle parking, with 2,600 parking spaces. However, most cycle paths are in tourist routes along the beaches, used mainly for relaxing and health purposes as opposed to transport. There are three million bicycles in Rio, twice as many as there are cars. The city does not allow motorcycles, animals and pedestrians on the cycle lanes, but people in wheelchairs and on skates – as well as fire trucks, police vehicles and ambulances in case of emergency – are allowed.95
Based on Ciudad Viva’s evaluation of the integration of bicycle to public transport in the cities of Santiago, Montevideo, Quito and Florianopolis, Table 27 shows that Santiago presents the best levels of integration, especially due to the advances in Metro integration and public bicycles system in Providencia. The lowest score is for Florianopolis and none of the cities have bicycle parking.
Table 27. Cycling scorecard for Santiago, Montevideo, Quito and Florianopolis
Santiago Montevideo Quito Florianopolis Score per itemShort and medium term parking in stations and bus stops
1 1 0 1 3
Service stations for cyclists, including rental, repair, spare parts, showers, lockers and route information
0 1 0 0 1
Buses with bicycle racks 0 0 0 0 0
91. Ponce Arqueros, 2010. 92. Carreon, 2010. 93. Rizzi, 2009. 94. http://sites.google.com/site/ciclosucre/, last accessed 10 December 2010. 95. Garcia, 2001.
GRHS 2013: Regional report Paola Jirón 47 Latin America and the Caribbean

Santiago Montevideo Quito Florianopolis Score per itemBicycles allowed on board only off peak (3) any time (4) special facilities (5)
0 1 1 0 2
Bicycle ease access to public station/stops
2 0 1 0.1 3.1
Public Bicitaxis and/or bicycles access to stops and stations
1 0 0 0 1
Cycling facilities at stations/stops, lifts, ramps, etc.
2 0 0 0.6 2.6
Educational facilities that encourage use of bicycles
2 1 2 0.3 5.3
Other policies that promote cycle friendly culture. Ex. Coordinating agency for public transport and cycling.
2 1 0 0.3 3.3
General quality 10 5 4 2.3 Score explanation: 0: there is nothing; 1: minimum facilities; 3: reasonable quality facilities 5: broad existence of high quality facilities and high level of integration
Source: Ciudad Viva, 2011.
9.3. Mobility plan, Montevideo, Uruguay
Montevideo has a population of 1,338,408 inhabitants but considering its Metropolitan area, it reaches 1,968,324 inhabitants, 58.8 per cent of national total.96 Since 2005, the City of Montevideo has been developing the Montevideo Mobility Plan, to transform the transport system. Its long-term project includes deep transformations in public transport, cargo system and commercial development which imply better connectivity to ports, airports, roads and trains. The most relevant aspect of the Mobility Plan is that it emphasizes movement by foot and bicycle, from which the transport and territorial model is articulated, based on origin and destination surveys for management, normative, evaluation and monitoring tools.97
9.4. Rosario strategic plan 2018 (PERM+10): Integral urban mobility plan in Rosario The city of Rosario is located on the southern zones of the Santa Fe Province in Argentina and it is part of the Metropolitan Area of Rosario, which encompasses the cities of Rosario, Villa Gobernador Gálvez, San Lorenzo, Pérez, Capitán Bermúdez, Granadero Baigorria, Fray Luis Beltrán, Funes and Puerto General San Martín. 2001 Census data counted 909,399 in the Rosario district.
After 10 years of experience in strategic planning, Rosario’s current strategic plan considers pedestrians as articulators of mobility in the city; with plans to build pedestrian access, either via public transport, use of bicycles or walking. The plan considers measures at various scales (local, metropolitan) making them dynamic and integral. One of the most interesting measures refers to the discouragement of car use in central areas by parking control. The plan is relatively new, and it is an example of how small cities can function in a
96. Montevideo Comm, 2011. 97. Intendencia Municipal de Montevideo, 2010.
GRHS 2013: Regional report Paola Jirón 48 Latin America and the Caribbean

broader territorial context, conforming networks that ease mobility between different localities.
The central area of the city as well as its metropolitan area has experienced significant changes in their centralities; this has modified mobility patterns, from a centre-periphery movement, to metropolitan scale mobility. Moreover, an increase in car use generated great congestion, contamination and transport infrastructure saturation. This requires a public space conformation model that allows for circulation, leisure and economic, commercial, cultural educational activities.
The mobility plan includes exclusive lanes to make public transport quicker, a Rosario Metro project, parking difficulty in order to dissuade car use, and a Cycle Path Master Plan. The aim of these initiatives is to generate equilibrium with the different transport modes, reduce accidents, car congestion, and acoustic and air contamination. The plan defines citizens as the main actors, and as their measuring unit, putting cars aside. It establishes the following three intervention areas: Promotion of mass public transport for passengers, priority for pedestrians in central areas and control of private transport.
9.5. Challenges
Although there is widespread evidence of the contribution of transport to environmental problem in cities, policy responses are not quite aggressive or integral enough to minimize the impact. BRT implementation appears as a positive trend. However, these require integrated systems with other modes. Moreover, cycling, walking and public transport promotion appears to be minimal, and car use continues to be promoted and urban highways remain as the larges urban investment in most cities.
GRHS 2013: Regional report Paola Jirón 49 Latin America and the Caribbean

10. Economically Sustainable Urban Transport A consequence of economic growth is increase in car demand: increase rates of 6 to 8 per cent over GDP growth of half that rate. Chronic congestion can become a threat to efficiency and competitiveness of the system. In LAC, the socio-demographic conditions may generate an economic growth that may have a negative increase in car transport, generating congested and inefficient systems. Urban population is growing twice as much as total population. However, while industrialized countries accommodate this in a broad number of cities, in LAC, development is mainly concentrated in mega cities. Moreover, regardless of the size of the city, motorization rates are increasing at a speed two or three times population growth, and this is associated with a low proportion of urban space dedicated to roads, which is often less than 11 percent of their space in comparison to Europe, which assign from 20 to 25 per cent.98
10.1. Integrated urban transport plan, PITU 2025, São Paulo, Brazil The São Paulo State Transport Secretary has undertaken the Integrated Urban Transport Plan (PITU) until 2025, to determine investment needs and the necessary projects for urban development, with the aim that projects such as urban renewal linked to transport systems can be more effective and cheaper than traditional transport projects. The Tranus transport and land use modelling system was used to model 20 million people’s travel behaviour, 70 per cent of whom are public transport users. São Paulo is known for its novel integrated bus routes system of exclusive corridors and electronic payment, a metro and train network.99 However, its car congestion was making it increasingly difficult to travel due to the urban distribution of activities, which increasingly destabilized the city. Jobs are still located downtown, while the population living in the periphery increase, this (in financial terms) means greater investment and greater operating for the transport service.100 PITU recognizes the need to get people closer to their jobs, incorporating housing development plans to transport plans, and creating a city around transport facility and structure new financing mechanisms.101
The PITU transport project includes:102
Downtown integration, both physically, operationally and fare wise of train, metro likes, constituting a 330 kilometres network.
Modernization of metropolitan train, with new stations.
Implementation of express metropolitan train with new stations.
Metro line extension.
Seven bus corridors.
Road treatment for 470 kilometres.
Implementation of 41 bus terminals, and installing 2,114 new boarding stations.
PITU proposes to distribute demand in space, by controlling urban and housing development.103
98. Monzon, 2005. 99. Modelistica, 2010. 100. Secretaria de Transporte Metropolitanos de São Paulo, 2009. 101. Secretaria de Transporte Metropolitanos de São Paulo, 2009. 102. Secretaria de Transporte Metropolitanos de São Paulo, 2009. 103. Secretaria de Transporte Metropolitanos de São Paulo, 2009.
GRHS 2013: Regional report Paola Jirón 50 Latin America and the Caribbean
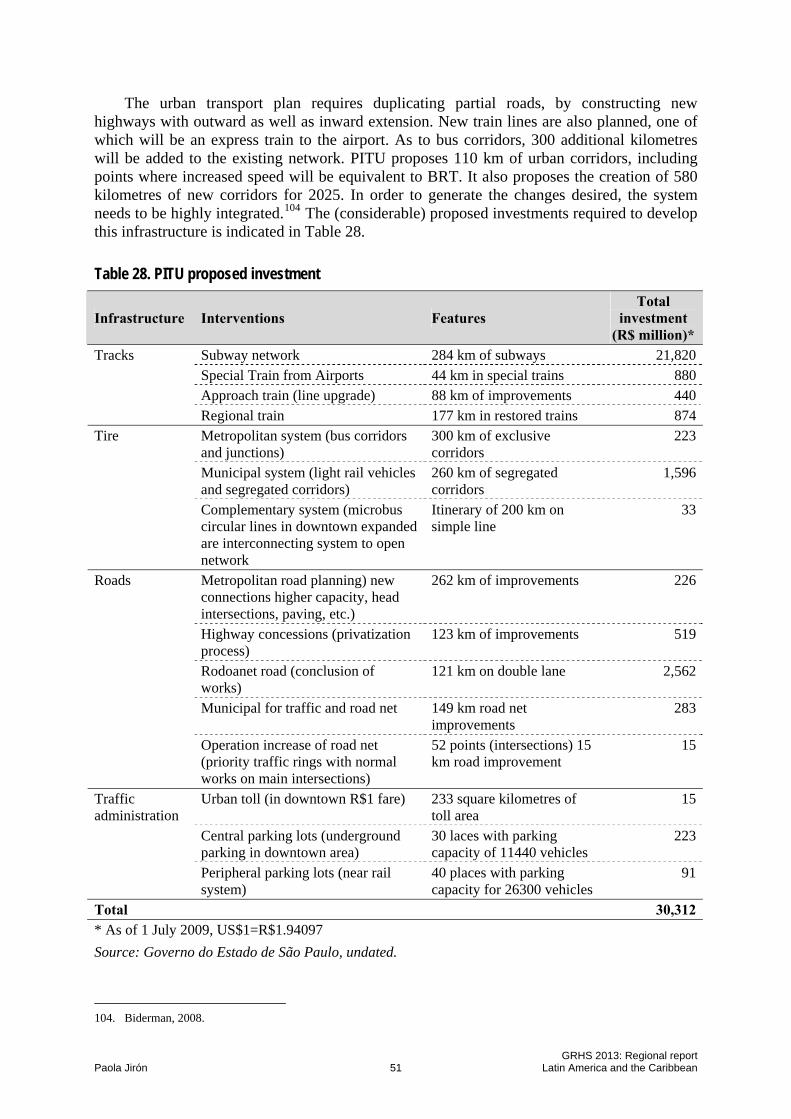
The urban transport plan requires duplicating partial roads, by constructing new highways with outward as well as inward extension. New train lines are also planned, one of which will be an express train to the airport. As to bus corridors, 300 additional kilometres will be added to the existing network. PITU proposes 110 km of urban corridors, including points where increased speed will be equivalent to BRT. It also proposes the creation of 580 kilometres of new corridors for 2025. In order to generate the changes desired, the system needs to be highly integrated.104 The (considerable) proposed investments required to develop this infrastructure is indicated in Table 28.
Table 28. PITU proposed investment
Infrastructure Interventions Features Total
investment (R$ million)*
Subway network 284 km of subways 21,820Special Train from Airports 44 km in special trains 880Approach train (line upgrade) 88 km of improvements 440
Tracks
Regional train 177 km in restored trains 874Metropolitan system (bus corridors and junctions)
300 km of exclusive corridors
223
Municipal system (light rail vehicles and segregated corridors)
260 km of segregated corridors
1,596
Tire
Complementary system (microbus circular lines in downtown expanded are interconnecting system to open network
Itinerary of 200 km on simple line
33
Metropolitan road planning) new connections higher capacity, head intersections, paving, etc.)
262 km of improvements 226
Highway concessions (privatization process)
123 km of improvements 519
Rodoanet road (conclusion of works)
121 km on double lane 2,562
Municipal for traffic and road net 149 km road net improvements
283
Roads
Operation increase of road net (priority traffic rings with normal works on main intersections)
52 points (intersections) 15 km road improvement
15
Urban toll (in downtown R$1 fare) 233 square kilometres of toll area
15
Central parking lots (underground parking in downtown area)
30 laces with parking capacity of 11440 vehicles
223
Traffic administration
Peripheral parking lots (near rail system)
40 places with parking capacity for 26300 vehicles
91
Total 30,312* As of 1 July 2009, US$1=R$1.94097
Source: Governo do Estado de São Paulo, undated.
104. Biderman, 2008.
GRHS 2013: Regional report Paola Jirón 51 Latin America and the Caribbean

With the aim of becoming a competitive city, through this plan, São Paulo wishes to increase overall accessibility, access to urban goods and services, motorized trips, average speed of trips; traffic speed in downtown area and decrease traffic jams. It also aims to improve urban environment by doubling mobility of low-income population; decrease of approximately 35 per cent of carbon monoxide concentration in the expanded metropolitan downtown area; and decrease on noise levels in the expanded downtown. Furthermore, it also wishes to improve regional access from business/industrial centres to regional areas. In economic terms, it wishes to provide economic efficiency to the population by reducing travel time to an the equivalent to US$ 40 million during the next 30 years.
10.2. Congestion charge
Car congestion is one of the inevitable consequences of urban growth and car use. Industrialized countries are a clear example of this, and this panorama repeats itself in the main cities of the world, and also in Latin America. Congestion causes severe negative externalities in terms of costs and quality of life.105
In Chile the Ministry of Transport has presented various intentions for congestion charge on all those arteries that produce major congestion at peak hours in the capital. However congestion charge in Santiago has been at a standstill in Parliament for 19 years. However, the measure has been backed up by authorities and experts, who recognize that charging within cities reduce traffic flow between 3 to 4 per cent, depending on the tariff.106 It is estimated that one toll to enter downtown should have the value of a daily parking, which is between US$8 and US$12.
The system could be implemented via concession or operated by the government. The latter case would require a law to allow the application of tax to cope with congestion and at the same time use these resources to improve infrastructure in the zone within this regime.107 Criticism to this proposal include concern that this system would affect those with middle and low income living close to the roads to be charged, having to pay for over US$80 monthly to go to work and come back. Moreover, those wanting to visit them would have to pay to get there. Criticism also relate to why urban planning initiatives did not consider congestion in their developments. The data presented below indicates that congestion charge is appropriate in cities like Santiago.
The number of cars in the Santiago Metropolitan region has increased between 1993 and 1999, coinciding with periods of high economic growth in the country (see Figure 7 and Table 29). Between 2000 and 2003, the numbers tend to stabilize, a time with the economy of the country was low, and then from 2004 onwards, when the economic growth was re-established at 4 per cent, the number of cars started increasing again.108
Table 29. Number of cars in Santiago metropolitan region, 2007
Geographic area Light vehicles TotalMetropolitan region 1,091,863 1,217,938
Greater Santiago 939,517 1,039,191
Source: Steer Davies Gleave, 2009, citing INE, 2007.
105. La Tercera, 2007. 106. Rosenberg, A. 2010. 107. Vásquez et al, 2010. 108. Steer Davies Gleave, 2009.
GRHS 2013: Regional report Paola Jirón 52 Latin America and the Caribbean

Figure 7. Number of cars in Santiago metropolitan region (1993–2007)
Source: Steer Davies Gleave, 2009.
With the existing number of cars and the population estimates until 2007, motorization rates can reach 165 cars per 1,000 inhabitants, which is low in comparison to Europe or the US, but in 1993 the rate was 100 cars per 1,000 inhabitants, meaning that the rate has increased at about 3.3 per cent per year, which is much higher than population growth. According to 1991 and 2001 Origin and Destination Surveys (EOD), the number of total households has increased from 1,162,845 to 1,473,735, which is an annual growth of 2.5 per cent. As to the number of cars in the city, between 1991 and 2001, they have increased by 5 per cent per year. The size of households has also changed significantly from 1991 to 2001, as can be seen in Table 30.
Table 30. Households, inhabitants and cars in Greater Santiago (1991–2001)
1991 2001 Average annual change 1991–2001
Number of households 1,162,845 1,484,927 2.5
Number of inhabitants 4,502,099 5,389,957 1.8
Number of cars 421,419 683,546 5.0
Inhabitants per household 3.87 3.63 -0.4
Cars per households 0.36 0.46 2.6
Vehicles/1000 inhabitants 93.61 127 3.1
Source: SECTRA, 2001.
According to EOD, the number of households has increased from 1991 to 2001, an average of 2.5 per cent. Those households with 1 or 2 inhabitants are those that have most increased since 1991 to 2001 (see Table 31), meaning that on average, size of households is diminishing over time.
GRHS 2013: Regional report Paola Jirón 53 Latin America and the Caribbean

Table 31. Evolution of household size in Greater Santiago
Number of households Distribution of households by household size (%) Persons per
household 1991
2001 1991 2001
1 to 2 persons 262,963 362,237 22.6 24.4
3 to 5 persons 706,112 9,120,030 60.7 61.4
6 or more 193,770 210,687 16.7 14.2
Total 1,162,845 1,484,927 100.0 100.0 Source: Steer Davies Gleave, 2009.
The number of daily trips increased from 7,599,673 to 13,103,554 between 1991 and 2001.109 The number of trips have increased more rapidly than the number of inhabitants between 1991 to 2001, as seen in Table 33, this may be explained by an increase in number of middle and high-income households (see Table 32). The trips have increased from 1991 to 2001 in over 5.5 million trips, mainly in non-obligatory trips (not for study or for work).
Table 32. Household distribution according to income
Low-income Middle-income High-income EOD 1991 798,846 245,873 44,756
73% 23% 4%
EOD 2001 790,026 772,162 222,739
33% 52% 15%
Change between 1991 and 2001 (%) -39% 214% 398%
Source: Steer Davies Gleave, 2009.
The modal split has changed over the years. The proportion of trips carried out by bus or taxi bus has reduced significantly, over 17 per cent, from 47.1 per cent of trips to 30.4 per cent. This reduction is reflected in the proportion of trips carried out by walking and car. Walking as increased from 21.1 per cent to 26.6 per cent and cars has increased from 14.6 to 27.4 per cent.110 This is an expected result from an increase in motorization per households, and a concern for public transport. Considering only motorized trips, the number of trips per person have increased from 1.29 to 1.75 between 1991 to 2001, while the average number of motorized trips made per household have increased from 4.99 to 6.34 (see Table 33).
Table 33. Number of motorized trips, per person and per household (1977–2001)
Year Trips per person Trips per household 1977 0.87 4.65
1991 1.29 4.99
2001 1.75 6.34
Source: Steer Davies Gleave, 2009.
109. Steer Davies Gleave, 2009. 110. Steer Davies Gleave, 2009.
GRHS 2013: Regional report Paola Jirón 54 Latin America and the Caribbean

The metropolitan region observes a strong growth both in number of households as in population, particularly in peripheral zones, thus increasing length of trip, which added to an increasing rate of trip generation per household and increase in motorization rates, generate a set of conditions that are detrimental to the transport system of the city, thus increasing car congestion, thus the justification to implement congestion charging.
GRHS 2013: Regional report Paola Jirón 55 Latin America and the Caribbean

11. Urban Transport Institutions and Governance This section provides examples of the manner in which various transport institutions are structured in Latin America and how they include (or not) citizen participation. It compares the institutional framework used for Transmilenio in Bogotá and Transantiago in Santiago, to analyse the different implications of such different institutions. It also discusses mobilization against the construction of highways in Santiago de Chile, mobilization against train services in Buenos Aires or mobilization for the use of bicycles in Mexico City.
11.1. Transmilenio vs Transantiago: Institutional frameworks to implement integrated transport systems
During the past decade, two major transport plans have been implemented in metropolitan cities in LAC: Transmilenio and Transantiago. The first provides the city of Bogotá with strategies to improve mass transit but it also pretends to recuperate public space, discourage the use of cars and proposes a mobility alternatives through the use of bicycles. The second aims to significantly improve the quality of the public transport system by reducing travel time and polluting agents, making it attractive and efficient.
Transmilenio has been in operation since 2000, providing mass public transport services for the city of Bogotá. It is based on a BRT system which operates thought articulated buses with 120 person capacity, using exclusive lanes, picking up and dropping off passengers in strategically located stations throughout the urban extension of the city.
In 1998, by municipal law, the municipality of Bogotá was allowed to participate, along with other entities, in the creation of a public society named Empresa de Transporte del Tercer Milenio Transmilenio S.A. which had the mandate to manage, plan and control passenger urban transport services in the city of Bogotá and its influence area. The entity was formally constituted in 1999. In the operation for Transmilenio, infrastructure is built and maintained by the state, and operation, fleet acquisition, and transport service provision is carried out by private transport companies habilitated by the transit authority.
Transmilenio S.A. is not a transport company, or the owner or affiliate or renter of transport vehicles, it does not provide public transport services, it does not have contracts with drivers or collect fares, these activities are carried out by private entities. Transmilenio is the management entity for the public transport system, it administers infrastructure and controls that concession contracts with private companies are carried out.111 Transmilenio staff is composed of 280 workers, 264 of which are official workers (the rest are hired by temporary contracts).112 Institutionally it is part of the mobility sector within the municipality. The Integrated Public Transport Plan for Bogotá (SITP) includes a cycle path network and a project for the first metro line. The project designed and implemented an urban mass transport system for the city, conceived by the city Mayor for the short term and it is the central axis over which the solution to the mobility problems of Bogotá’s inhabitants is structured.
All this to explain that Transmilenio is based on a strong formal institutional framework, that is provided with political leadership and authority to make the appropriate decisions necessary to implement the transport system. This does not mean that there are not management problems, however, but that it is institutionally solid. The main critiques and problems present in Transmilenio include issues of safety and robbery on buses, long queues to purchase travel cards, problems with routes timetables especially on Sundays and holidays,
111. www.transmilenio.gov.co, last accessed 8 June 2011. 112. Alcaldia de Bogotá, 2009.
GRHS 2013: Regional report Paola Jirón 56 Latin America and the Caribbean

bus overcrowding, lack of cleanliness, use of air contaminating diesel, road deterioration, traffic problems at crossing points and distance between stations particularly those which are over 500 metres from the travel point.
In the case of Transantiago, in 2002 the Urban Transportation Plan for Santiago (Plan de Transporte Urbano para Santiago, PTUS) started taking place. In broad terms, PTUS aimed to contribute to a better quality of life for all residents of the city and neighbourhoods and second, to help correct income inequalities and unequal opportunities to access basic social services in the city. These aims were translated into an idea of urban transport policy for Santiago with specific targets, which were translated into eleven programmes to be carried out by year 2010, in time to celebrate the bicentenary of the independence of the nation.
One of the eleven programmes contained in PTUS, and the one that attracted most attention, was the public transport system, later known as Transantiago. The system was based on two main concepts: complementation and integration. Complementation referred to complementing the use of the bus with the Metro system, and integration, involved using a single travel fare for buses and Metro.113 Another of the eleven programmes was the creation of an institutional framework to implement the plan, through the creation of a Presidential Advisory Commission with the participation of the Ministers of Public Works (President) and Housing, the Head of the Santiago Metropolitan Region, Transport Under-secretary, Environmental Commission Director (CONAMA) and the President of Metro. This commission had a coordinator that also led anther team called the General Coordination for Transport in Santiago.114
By 2003, a complete restructuring of public surface transportation was announced, based on a competitive transport bid for the urban streets of Santiago. However, after two years of work, those involved in the original PTUS were replaced, the plan was simplified and, within a few months, the original PTUS was transformed into Transantiago.115
Although PTUS disappeared, the institutional framework remained, i.e. the presidential commission. This commission, by definition, does not have an executive capacity or resources and the Transantiago coordinator is a weak position, with little efficiency capacity. Furthermore, the committee was full of high level authorities, with limited coordination and execution possibilities. This lack of a real and integral execution head for decision-making is a characteristic that has consequences throughout the management of Transantiago. Furthermore, no participation from local authorities is considered, this is exacerbated by the fact that Santiago does not have a Metropolitan mayor, but instead 34 separate districts that make up greater Santiago. Moreover, the staff working in Transantiago are not public servants, most of them are hired on a temporary basis, thus there are no specific responsibility with their decisions.116
Lack of political or institutional conditions were the main cause of the failure to implement PTUS, as the changes that were being suggested required these conditions to exist. With this lack of necessary institutional framework, Transantiago was carried out from the highest political level, including presidents and ministers. A challenge like the one presented by PTUS required a mayor political risk. A more adequate institutional framework would require more participation from actors, more recognition of technical knowledge, and more decentralization of power.117 Nonetheless, the execution of each fragmented project is carried
113. Jiron 2008. 114. Figueroa and Orellana, 2007. 115. Jiron, 2008. 116. Figueroa and Orellana, 2007. 117. Martinez, 2008.
GRHS 2013: Regional report Paola Jirón 57 Latin America and the Caribbean

through by the multiple entities that participate, and since the implementation of Transantiago, they manage to carry out their individual chores.
11.2. Civic demonstrations against transport
11.2.1. Chile, the Case of the Southern Access to Santiago
The southern access to the Santiago highway was intended to be an alternative access to the city, benefiting all users who headed to the southeast area of Santiago. This road would relieve congestion on the central highway.118
Awarded ten years ago, as part of the concession of the Santiago-Talca highway, the southern access should have become operational in 2003. However, due to a lack of governmental coordination, the location of housing next to the highway was disregarded. Conflicts and opposition of neighbours delayed the construction of the final segment of the highway (6km of the planned 45km) to 2009.119
The problem emerged in 1999 when construction began only few metres away from houses, as a result, anti-noise panels were set up. In some cases, only 60 centimetres separated houses from the building work.120
The project did not take environmental mitigation into account, since houses were located within the highway construction area. The expropriation of the first line of houses would have been an efficient solution to this problem, as there would be adequate space between the houses and the building work. However, the Ministry of Public Works dismissed the idea; instead, new mitigation contracts with the building contractor were signed and US$15,000 compensation was given to the families living in the first line of houses. This situation gave rise to a deep sense of unease among the rest of the affected neighbours and created controversy, as the instalments were paid during an election time.121
Another group of neighbours demand US$30,000 in compensation for each of the 192 apartments built in 1993. This claim arose as a result of the construction of a 50 metre separation between the highway and the housing to be used as a park.122
From April 2007 to 2008, a group of neighbours took over a segment of the construction site. They demanded more compensation for all the negative effects the highway had on their lives, as they regarded the indemnification as insufficient, considering the conditions of isolation and lack of communication they had to face, as well as the difficulties people had to reach their destinations. Finally, the southern access was opened on April 2010 after paying US$30,000 for each of the 237 expropriated houses in 2009.
11.2.2. The case of the women-only passenger cars in Mexico City
It is well-known that there are women-only passenger cars in Mexico City, which correspond to the first two cars of the train. There is a line on the floor that divides the platform and ‘Reserved for women and children under twelve’ signs in each station. There are also fences and police presence in the busiest subway stations. Before the implementation of these
118. Ponce Arqueros, 2008. 119. Ponce Arqueros, 2008. 120. http://mapadeconflictos.sitiosur.cl/view.php?pid=73, last accessed 8 June 2011. 121. Ponce Arqueros, 2008. 122. Ponce Arqueros, 2008.
GRHS 2013: Regional report Paola Jirón 58 Latin America and the Caribbean

security measures, using the subway was a problem for women, as they were victims of touching, rape, obscene whispers, gazing at breasts, smacks and skirt lifting.123
In 2001, the high number of sexual assaults led to the launching of a campaign under the name ‘Si la tocas, te toca’ (‘if you touch, it’s your turn’) and ‘No más rollos, el acoso sexual es un delito’ (‘no more struggle, sexual harassment is a crime’). Both victims and wrongdoers ranged in age from 16 to 25 years. As a result both men and women were separated during peak hours.124
In addition, Mexico City implemented a programme called ‘pink cabs’, which are vehicles driven only by women so as to offer safe transport to women. This all-female cab service is another initiative aimed at reducing the attacks, robberies and harassment suffered by women when using public transport.125 This experience is being replicated in Rio de Janeiro and is being analysed in other cities.
11.2.3. Protests against Transmilenio in Colombia
In April 2008, a group of people used Facebook to organize a protest against Transmilenio. The reason of this protest is that a great number of users are affected by the problems of the system, such as the crowding conditions of stations and portals, congestion inside the buses, long queues in ticket offices and the low frequency of feeders.126 Protests were not only organized by users, but also by drivers, who fear losing income as a result of the modernization of public transport.127
In April 2010, seven demonstrations against Transmilenio were held in less than three weeks. In view of the blockades in the city, Samuel Moreno Rojas, Major of Bogotá, convened an operative committee to assess the problems of the system.128 There were also protests against the ‘Peak traffic and plate’ campaign in 2009. This initiative aims at relieving pressure on the city roads. According to demonstrators, authorities insist on applying this measure and conducting more studies regarding this initiative, while on the streets people has to cope with bad traffic conditions and the negative economic effects this campaign has on them.129
11.2.4. The railway system crisis in Argentina
Trains and stations were burned by users has been a common picture in Buenos Aires. Several train stations have been burnt over the last years as a result of dissatisfaction with service,130 due to accidents, delays, precarious services, mistreatment, robberies, etc.131
Indignation for train delay reached its limits on August 2008 in Buenos Aires, when passengers burnt cars and vandalized stations. This line consists of 41 stations, most of them located in poor neighbourhoods.132 In the absence of information provided by Buenos Aires
123. http://gatitosuicida.com/2009/04/01/la-educacion-en-mexico-y-los-hombres-en-los-vagones-para-mujeres/, last accessed 2 June 2011. 124. http://www.20minutos.es/noticia/22335/, last accessed 2 June 2011. 125. http://www.terra.com/mujer/noticias/mexico_lanza_un_taxi_rosa_exclusivo_para_mujeres/hof191123, last accessed 2 June 2011. 126. http://www.radiosantafe.com/2008/04/17/protesta-por-mal-servicio-de-tranmilenio/, last accessed 14 June 2011. 127. http://www.ntn24.com/content/continua-paro-transporte-publico-bogota, last accessed 2 June 2011. 128. http://elnuevosiglo.com.co/bogota/metropolitana/2690-septima-protesta-contra-transmilenio-en-tres-semanas.html, last accessed 2 June 2011. 129. http://www.caracol.com.co/nota.aspx?id=772452, last accessed 2 June 2011. 130. http://www.lanacion.com.ar/nota.asp?nota_id=912284, last accessed 2 June 2011. 131. http://www.lahaine.org/index.php?blog=3&p=47063, last accessed 2 June 2011. 132. http://www.elmundo.es/elmundo/2008/09/04/internacional/1220544189.html, last accessed 2 June 2011.
GRHS 2013: Regional report Paola Jirón 59 Latin America and the Caribbean

Trains (TBA, Trenes de Buenos Aires), an important group of users reacted angrily, throwing stones and destroying the offices located in the station, while a small group set fire to the plastic elements of the train. Passengers watched how the train burnt and although television channels broadcast the incident live; neither fire-fighters nor the police came to the scene. In addition, ATM machines and stores were looted.
11.2.5. Naked cyclists
In Mexico City and Lima, for a number of years now, cyclists have protested (naked) for better cycling conditions. The reason of this particular demonstration is that cyclists feel they are ‘naked’, since there are no laws to protect them against mistreatment from vehicle drivers and traffic accidents. This activity takes place every year in the aforementioned cities (as well as in some European cities).133 In other countries of the region, such as Panama, this type of protest is gradually becoming popular.134 Cyclists also demand that cities become pedestrian-friendly by having more and better spaces for walking and cycling.135
133. http://www.larepublica.pe/fotos/ciclistas-salen-desnudos-en-lima-para-promover-uso-de-bicicletas, last accessed 14 June 2011. 134. http://eddelgar.blogcindario.com/2007/06/01088-la-poli-jode-a-la-protesta-de-desnudos-en-panama.html, last accessed 2 June 2011. 135. http://pospost.blogspot.com/2007/03/vdeo-de-protesta-de-ciclistas-desnudos.html, last accessed 2 June 2011.
GRHS 2013: Regional report Paola Jirón 60 Latin America and the Caribbean

12. Towards Sustainable Urban Transport The main challenges LAC cities face in terms of urban mobility, relate first of all to approaching urban mobility inequality, secondly to improving traffic congestion and environmental impacts, and thirdly to the development of urban transport policies and initiatives to cope with such challenges. The three challenges are just as relevant for all cities in the region, and obviously some cities present more urgency in their treatment than others. These challenges have mostly been observed as unrelated, perhaps promoting transport policies more for economic reasons, than for inequality of environmental concerns. However, explicit efforts to reduce urban mobility inequality and environmental damages via transport initiatives would probably generate new ways of understanding urban phenomena, and new ways of addressing current pressing issues. The challenge then becomes to use transport planning as a way to overcome mobility inequality and environmental problems. This involves seeing transport interventions as possibilities rather than as simple investments.
Although many commonalities may be found in several of the cities studied, not all present the same cause or manifestation of the problems, neither are the magnitude and complexity of the problems equal. The success of any measures depends on local conditions, therefore what may be effective in one city, may not work in another. As a result, there are no universal formulas to solve transport problems, and although trends can be found in transport solutions, the specificity of each implementation is unique. However, the experiences analysed here provide some indications that can guide transport policies in the region.
Urban mobility inequality refers to the way in which differences in income, gender, ethnicity, life cycle, age, etc. make mobility experiences diverse and often impact negatively on the access to the various benefits of the city. Understanding accessibility, not only as connection from one point to another, but as a possibility to access activities, relations and places, may help to overcome the various barriers that make accessibility difficult. These barriers are socio-culturally enhanced, particularly in places where women play an important role in household organization, or where populations are getting older, or life cycle involves travelling with children, for instance.
Environmental problems linked to air pollution, noise, smell and risks involved in infrastructure planning that does not contemplate the risks involved in flooding, volcanoes, earthquakes, and mud slides. The LAC region presents a visible trend to improving BRT systems and metros, however, simultaneously, many cities are planning and building large urban highway infrastructure, alluding to economic growth requirements with little consideration for the extra congestion they generate and the contamination at a city-wide level.
As to transport initiatives, their main challenge to deal with inequality and environmental concerns are the need to look at the integrally and irrevocably links to other initiatives taking place in the city. This involves generating public transport integration and coherence with other transport modes, including non-motorized transport, as well as urban policies. Integration and coherence also relate to investments made in private and public transport and the priorities established by governments. Another integration challenge includes adjustment in implementation times and political times as well as carrying out rigorous feasibility studies, alternative analysis, and incorporating citizen participation in order to have successful projects in short, medium and long term.
Integrated approaches are also required considering that no single solution can tackle such complex problems. Therefore, coordination is required in terms of infrastructures, vehicles, technological innovation, service regulation, operator competition and quality of
GRHS 2013: Regional report Paola Jirón 61 Latin America and the Caribbean

services. It is also important that the various actors perceive a long-term commitment, as this can allow for material and equipment investment. This obviously requires clear leadership from authorities, as well as political agreements to make ensure the necessary resources for 8 to 10 years.
Integrated services are also required; this involves a planning agent, with necessary competences to regulate land use and coordinate with the appropriate instance. That is the only way an efficient (and sustainable) transport network can be achieved. This is eased with integration between lines and modes, facilitating transfers and reducing waiting time. Finally a common tariff that does not penalize longer trips in pubic transport is important. Through transport, metropolitan integration policies can be developed.
It is also necessary to consider the economic, social and cultural LAC context, where complex and sophisticated pubic transport provision and management can be expensive and require complex structures that may be difficult to achieve. Thus simple mechanisms that place emphasis on citizen participation and multiple actor agreements are positive. This implies initiatives that are not overly expensive for infrastructure, or highly sophisticated administration.
Quality public transport in terms of fleet, regularity, and trust, is important not just because it increases the cities competitiveness, but because improving the quality of transport can somewhat ease mobility inequality, by providing better services to the whole network, or targeting investment to specific areas.
In terms of land use, densification and activity combination in neighbourhoods and urban centres is important. Instead of building underground parking areas in downtown areas, pedestrian activities should be enhanced, with the possibility to reach these areas in transport modes that are comfortable as well as reliable and safe.
Improving walkability and cycling may be done with adequate urban design in intersections, priorities, roads, and safety. This implies improving existing infrastructure, including streets, pavements, sidewalks, lighting, signalling, places of rest, recreation and waiting, as well as recognizing the different groups that walk and cycle as a means of transport.
The above discussion involves putting some paradigms aside, including the idea that higher-income groups need to live in suburban areas, and that cars are signs of social status; public transport is the mobility means for the poor, that there is opposition among the solutions provided by public or private sector; that solutions always involver new infra-structure investment, forgetting the role of managing existing resources.
GRHS 2013: Regional report Paola Jirón 62 Latin America and the Caribbean

List of References Agosta, R. (2008) ‘Transporte, tránsito y uso del suelo’, Encrucijadas no 42, http://www.uba.
ar/encrucijadas/42/sumario/enc42-usodelsuelo.php, last accessed 14 June 2011 Alcaldia de Bogotá (2009) ‘Transmilenio S.A. logros y retos en Bogotá, Positiva gestión y
estados financieros 2008’, Bogotá, March, http://www.transmilenio.gov.co/AdmContenidoUpload/administrador.contenido/Files/TransmilenioSA/Info_Gestion_Estados_Fianacieros_Ajuste_Junta.pdf, last accessed 8 June 2011
Alcaldía de Medellín (2008) ‘Separata especial del plan maestro de movilidad de Medellín 2008–2011’, Medellin
Alcaldía de Medellín (2010) ‘Medellín, la ciudad de la movilidad inteligente, balance de gestión enero De 2008 – Diciembre de 2010’, Coleccion Analisis, Secretaría de transportes y tránsito, Medellin,
Almeida, R. (2009) ‘A evolução dos serviços de transportes coletivos e da mobilidade urbana na América Latina a partir de 1980: os casos de Buenos Aires, Cidade do México, Rio de Janeiro, Santiago e São Paulo’, 12do Encuentro de Geografia de America Latina, EGAL 2009, Montevideo, Uruguay
Alonso, C. (2007) ‘Los dueños del cielo’, La Nación, Santiago AUSA (Autopistas Urbanas Sociedad Anónima) (2006) ‘Historia institucional’, http://www.
ausa.com.ar/site/subpagina.asp?IdSeccion=9&IdSub=37, last accessed 23 September 2010
Avellaneda, P. (2007) ‘Movilidad, pobreza y exclusión social’, Doctorado en Geografía, Departament de Geografía, Universitat Autónoma de Barcelona, Barcelona
Banick, R. (2009) ‘Bus rapid transit and the Latin American city: Successes to date, but miles to go’, Council on Hemispheric Affairs (COHA)
Barbero, J. (2010) ‘La logística de cargas en América Latina y el Caribe: una agenda para mejorar el desempeño’, Banco Interamericano de Desarrollo, Washington, DC
Barragán, A. P (2005) ‘La magnitud de la economía informal en el Perú y en el mundo’, Gestión del Tercer Milenio, Revista de Investigación de la Facultad de Ciencias Administrativas, UNMSM, 7(14): 43–51
Bianchi, H. (2008) ‘Uso y movilidad de la bicicleta en la ciudad, plan de incentivo al transporte no motorizado (TNM) en Recoleta,’ Tesis Título de Arquitecto y Magíster en Desarrollo Urbano, Facultad de Arquitectura, Diseño y Estudios Urbanos de la Pontificia Universidad Católica de Chile, Santiago
Biderman, C. (2008) São Paulo’s urban transport infrastructure, Essay, London Cabello, N. (2010) ‘Ciclovías en Santiago ya suman una distancia equivalente a un viaje entre
la capital y Talca’, El Mercurio, Viernes, 16 April CAF (Corporación Andina de Fomento) (2009) ‘Observatorio de movilidad urbana para
América Latina – Información para mejores políticas y mejores ciudades’, Corporación Andina de Fomento, Caracas
Camara de Comercio de Bogotá (2010) ‘CCB Pide Fortalecer Medidas Para Reducir La Accidentalidad Vial’, Comunidado de la CCB, Bogotá
Cardona, M. (2010) ‘Fuertes controles al transporte informal,’ http://www.cali.gov.co/publicaciones.php?id=31319, last accessed 1 June 2011
Carreón, A. (2010) ‘Nuevo reglamento de tránsito metropolitano: avance para la promoción del uso de la bicicleta en la Ciudad de México’, Bicitekas por ciudades + humanas, Ciudad de México, 18 February
GRHS 2013: Regional report Paola Jirón 63 Latin America and the Caribbean

Castro, A. (2008) ‘Ejemplos de BRTs en Latinoamerica y el Mundo’, en Taller Latinoamericano Planificacion e Implementacion de Sistemas de Autobuses Confinados (BRT), Red de Transporte Sustentable NESTLAC, Ciudad de Guatemala, 8–9 May 2008
CEPAL (Comision Economica para America Latina, i.e. ECLAC Economic Commission for Latin America and the Caribbean) (1999) ‘Un análisis del concesionamiento de autopistas urbanas, con referencia a los casos de la costanera norte de Santiago de Chile y del Eje Javier Prado de Lima’, Unidad de Transporte, División de Comercio Internacional, Transporte y Financiamiento
CEPAL (2004) ‘Concesiones viales en América Latina: situación actual y perspectivas’, Recursos naturales e infraestructura, Unidad de Transporte, División de Comercio Internacional, Transporte y Financiamiento, División de Recursos Naturales e Infraestructura. Santiago de Chile, Naciones Unidas
CEPAL (2005) ‘La seguridad vial en la región de América Latina y el Caribe; Situación actual y desafíos’, Serie Recursos Naturales e infraestructura N°102, Santiago de Chile
CEPAL (2010) ‘Base de datos de estadísticas e indicadores de los objetivos de desarrollo del milenio’, CEPAL
Cervero, R. (2000) Informal Transport in Developing World, UN-Habitat, Nairobi Ciclovias Recreativas de las Americas (2010) ‘Glosario’, http://www.cicloviasunidas.org/?
page_id=8, last accessed 3 June 2011 Ciudad Viva (2011) ‘Construyendo capacidades para una ciudadanía activa que enfrente el
cambio climático en América Latina’, Red Activa por el Transporte Sostenible en América Latina y el Caribe, Santiago
CNN Mexico (2010) ‘América Latina duplica muertes en accidentes de tránsito’, 19 march 2010, http://mexico.cnn.com/nacional/2010/03/19/america-latina-duplica-muertes-en-accidentes-de-transito, last accessed 3 June 2011
Colmenares I. (2007) ‘Desarrollo sustentable y sostenible de sistemas de transporte público urbano: Impacto en la gerencia, organización y liderazgo’, Paper presented at Seminar ‘Administración: Teorías y Categorías de Análisis’, UCV, Caracas
Contraloria de Bogotá (2005) ‘El Transporte Público Colectivo, Individual y Masivo De Pasajeros, El Transporte Intermunicipal y las Terminales Satelites en Bogotá’, Bogotá
COPSA (Asociación de Concesionarios de Obras de Infraestructura Pública A.G. (2010) ‘Quienes Somos’, http://www.copsa.cl/quienes_somos.php, last accessed 22 September 2010
Corporación Lima Norte (2008) ‘Quito, sin datos del transporte pirata’, Corporación Lima Norte, Lima, 29 March 2008, http://corporacionlimanorte.wordpress.com/2008/03/29/quito-sin-datos-del-transporte-pirata/, last accessed 8 June 2011
De Roux Rengifo, C. V. (2010) ‘El transporte informal: resultado de varios problemas de movilidad apuesta por la ciudad’, Bogotá, http://www.carlosvicentederoux.org/index.shtml?apc=a-f1;03;-;;&x=2089, last accessed 14 June 2011
El País (2006) ‘Transporte informal se toma vías de Cali’, Cali, 29 March, http://historico.elpais.com.co/paisonline/calionline/notas/Mayo212006/ca1.html, last accessed 14 June 2011
El País (2008) ‘El helicóptero gana adeptos corporativos’ El País, Montevideo, Uruguay, 4 January
El Tiempo (2008) ‘Buscan legalizar el transporte informal’, El Tiempo, Bogotá, 27 October
GRHS 2013: Regional report Paola Jirón 64 Latin America and the Caribbean

El Tiempo (2009) ‘Bogotá, sitiada por el transporte ‘pirata’; EL Tiempo revela los puntos donde más se presenta’, El Tiempo Bogotá, 10 May
Fajardo, S. (2007) Medellín del miedo a la esperanza, 2004–2007: Alcaldia de Medellin: Medellin:47
Figueroa, O. (2005) ‘Transporte urbano y globalización, políticas y efectos en América Latina’ Revista Eure 31(94): 41–53
Figueroa, O. and A. Orellana (2007) ‘Transantiago: gobernabilidad e institucionalidad’, EURE (Santiago) 33(100): 165–171
Flechas, A. L. (2007) ‘Planificación de la movilidad y políticas públicas para el transporte en Bogotá’, Seminario Taller Internacional ‘Ordenamiento del Transporte en Ciudades Patrimonio,’ 28 November, Cusco, Peru
García, M. I. (2001) ‘No reino da ciclovia’, Revista Internet Tierramérica: Medioambiente y desarrollo, 24 de Junio de 2001, Banco Mundial, Inter Press Service (IPS), PNUMA, PNUD
Golub, A., R. Balassiano, A. Araujo, and E. Ferreira (2009) ‘Regulation of the informal transport sector in Rio de Janeiro, Brazil: welfare impacts and policy analysis’ Transportation 36(5): 601–616
Governo do Estado de São Paulo (undated) ‘Integrated Urban Transport Plan for 2020 – Pitu 2020’, http://www.stm.sp.gov.br/index.php?option=com_content&view=article&id=2227&Itemid=237, last accessed 3 June 2011
GTZ (2010) ‘Informal public transport: Recommended readings and link’, Water Energy and Transport, GTZ Division 44, June, http://www.sutp.org/documents/READLIST-IPT-160610-EN.pdf, last accessed 8 June 2011
Guerrero, P. (2011) ‘Freight logistics: Strategic focus in sustainable development’ Transforming Transportation, Inter-American Development Bank, Washington, DC
Hidalgo, D and A Carrigan (2010) Modernizing Public Transportation: Lessons learned from major bus improvements in Latin America and Asia, World Resources Institute, Washington DC
IADB (2010), ‘BID lanza plan de acción para mejorar seguridad vial en América Latina y el Caribe’, Noticias, Banco Interamericano de Desarrollo, http://www.iadb.org/comunicados-de-prensa/2010-03/spanish/bid-lanza-plan-de-acción-para-mejorar-seguridad-vial-en-america-latina-y-el-cari-6707.html, last accessed 3 June 2011
IADB (Inter-American Development Bank) (2009) Taking Action on Climate Change in Latin America and the Caribbean, Inter-American Development Bank, Washington, DC
Instituto de Seguridad y Educación Vial (2009) ‘Sexto reporte mercosur y cuarto Latino Americano de Siniestralidad Vial Base 2007/2008, Buenos Aires
Instituto Distrital de Recreacion (2010) ‘Ciclovia’, http://www.elespectador.com/noticias/bogota/articulo-213709-ciclovia-cumple-35-anos, 15 July, last accessed 11 November 2010
Intendencia Municipal de Montevideo (2010), ‘Plan de movilidad hacia un sistema de movilidad accesible, democrático y eficiente, 2010–2020’, Intendencia Municipal de Montevideo Montevideo
ITDP (2010) ‘Guía de Planificación de Sistemas BRT’ (Bus rapid transit guide), http://www.itdp.org/index.php/microsite/guia_de_planificacion_de_sistemas_brt_spanish_bus_rapid_transit_guide/, last accessed 3 June 2011
Jaramillo, C., P.A. Rios and A.R. Ortiz (2009) ‘Incremento del parque automotor y su influencia en la congestión de las principales ciudades colombianas’, Paper presented at 12 Encuentro de Geógrafos de América Latina EGAL, Montevideo, Uruguay
GRHS 2013: Regional report Paola Jirón 65 Latin America and the Caribbean

Jiron, P (2008) ‘Mobility on the move; Examining the experience of urban daily mobility in Santiago de Chile’, PhD presented at Geography and Environment Department, London School of Economics and Political Science, London
Jiron, P (2010) ‘Analyzing the implementation of the public transport system Transantiago from a daily mobility point of view’, CODATU, Buenos Aires
Kralich (2005) ‘Crisis urbana y transporte alternativo: La opción remise, Revista Scripta Nova Revista Electronica de Geografia y Ciencias Sociales 9(194): 66 http://www.ub.edu/geocrit/sn/sn-194-66.htm, last accessed 3 June 2011
Kralich, S. and A. Gutierrez (2007) ‘Más allá de la informalidad en el transporte de pasajeros: reflexiones sobre los servicios de charters en al RMBA,’ Laboratorio: revista de estudio sobre cambio social 20: 51–57
Kralich, S. and A. Muller (2010) ‘Pasado, presente y perspectivas del transporte colectivo en la Región Metropolitana de Buenos Aires (RMBA)’, CLADHE II, Simposio 9 sobre Transporte y Servicios Públicos, Ciudad de Mexico
La Estrella (2010) ‘América Latina: 125 mil personas mueren en accidentes de tránsito’, Sección Mundo, 8 June, http://www.renacerdearauco.cl/noticias/site/artic/20100608/pags/20100608154604.php, last accessed 3 June 2011
La Tercera (2007) ‘Editorial – Tarificación vial y los costos de congestión’, 23 August, http://www.scribd.com/doc/5442600/8-23-La-Tercera-Editorial-Tarificacion-vial-y-los-costos-de-congestion, last accessed 3 June 2011
Martinez (2008) ‘Transantiago, la mirada desde la evolución’, http://mataderopalma.blogspot.com/2008/01/transantiago-la-mirada-desde-la.html, last accessed 3 June 2011
Martinez, R. (2010) ‘Accede solo 1% al uso de helicoptero en Mexico’ El Economista, Mexico DF
Mazorra, A. and R. J. Peña (2009) ‘Las ciclovías y su operación en Bogotá D.C., infraestructuras sostenibles y para la movilidad’, XVI Congreso Latinoamericano de Transporte Público y Urbano, México DF, 6–8 October, Centro de Transporte Sustentable
Metro de Medelllin (2010) ‘Documentos encontrados’ http://www.metrodemedellin.gov.co/index.php?option=com_content&view=article&id=51&lang=es, last accessed 3 June 2011
Metro S.A. (2009) ‘Gobierno corporativo’ http://www.metro.cl/corporativo, last accessed 3 June 2011
Metrobits.org (2010) ‘World metro database’, http://mic-ro.com/metro/table.html, last accessed 3 June 2011
Metros del mundo (2010) ‘Guía mundial de metros organizados por ciudades, países y continentes, http://www.metrosdelmundo.com.ar/, last accessed 3 June 2011
Metrovías S.A. (2010) ‘Mapa premetro’, http://www.metrovias.com.ar/v2/Mapas-181.asp, last accessed 3 June 2011
Ministerio de Medio Ambiente (2011) ‘Convencion Marco de las Naciones Unidas: Cambio Climatico’, Proyecto ECU/99/G31 Cambios Climático, Comité Nacional sobre el Clima, Ministerio del Ambiente, Quito
Ministerio de Obras Públicas y Comunicaciones (2008), ‘Plan nacional de seguridad vial 2008-2013, documento ejecutivo’ República del Paraguay, www.mopc.gov.py/mopcweb/pdf/pnsv_2008_2013.pdf, last accessed 3 June 2011
Modelistica (2010) ‘Tranus, sección noticias’, http://www.modelistica.com/english, last accessed 9 August 2010
GRHS 2013: Regional report Paola Jirón 66 Latin America and the Caribbean

Moller, R. (2006) Transporte urbano y desarrollo sostenible en América Latina: el ejemplo de Santiago de Cali, Colombia, Universidad del Valle, Cali
Montezuma, R. (2003a) ‘Ciudad y transporte, la movilidad urbana,’ in M. Balbo, R. Jordán and D. Simioni (eds) La Ciudad Inclusiva, Santiago de Chile, CEPAL, pp175–191
Montezuma, R. (2003b) ‘Transformación urbana y movilidad, Contribución al debate en América Latina’, Quito
Monzón, A. (2005) ‘Gestión del transporte metropolitano’, in E. Rojas, J. Cuadrado-Roura, J. M. Fernández Güell (eds) Gobernar las metropolis, Banco Interamericano de Desarrollo and Universidad de Alcalá de Henares, Washington, DC, pp409–472
Nassi (2005) ‘La coordinación entre el sector formal e informal, El caso de Río de Janeiro,’ Conferencia CODATU, 30 November – 2 December, Quito
Oviendo, E. (2008) ‘Insatisfacción con buses consolida taxis piratas’, San José, Costa Rica Pichihua, S. (2010) ‘Hay unos 140 mil taxis informales en lima’, Peru21.pe. Lima, 28 June,
http://peru21.pe/noticia/502014/hay-140-mil-taxis-informales-lima, last accessed 8 June 2011
Piedragil, A. (2008) ‘Sin miedo a tomar el vuelo’, La Prensa, Managua, http://archivo.laprensa.com.ni/archivo/2008/febrero/25/noticias/economia/245188.shtml, last accessed 8 June 2011
Planetaazul (2011) http://www.planetaazul.com.mx/www/2008/10/28/reprueban-indice-de-motorizacion-en-df/ last accessed 15 March 2011
Ponce Arqueros, P. (2008) ‘Acceso Sur Santiago: una autopista sin salida’, 22 February, http://www.plataformaurbana.cl/archive/2008/02/22/acceso-sur-santiago-una-autopista-sin-salida/, last accessed 8 June 2011
Ponce Arqueros, P. (2010) ‘Las exitosas bicicletas públicas de providencia’, Plataforma Urbana, 24 January, http://www.plataformaurbana.cl/archive/2010/01/24/las-exitosas-bicicletas-publicas-de-providencia/, last accessed 8 June 2011
Quiroga Agencia de Medios (2010) ‘Radiografía del consumo en México’, Departamento de Research, Quiroga Agencia de medios http://www.quirogamedios.com/pdf/Radiograf%C3%ADa_del_consumo_en_M%C3%A9xico.pdf, last accessed 3 June 2011
Rania P. (2010) ‘En triciclo bajo la lluvia’, http://www.purochile.com/mostrardetalle.php?full=1&table=articulos&id=31, Santiago
República, I. (2009) ‘El parque caneguín será remodelado y habrá una zona skate’, RepublicaMX, Ciudad de México, 26 October
Rescatemos Guadalajara A.C. (not dated) ‘¿Metro o BRT?’ http://www.metrogdl.org/?page_id=14, last accessed 3 June 2011
Rizzi, P. (2009) ‘Argentina: 100 kilómetros de ciclovías en Buenos Aires para fines de 2010’, tuverde.com, 16 September, Buenos Aires, http://www.tuverde.com/2009/09/argentina-100-kilometros-de-ciclovias-en-buenos-aires-para-fines-de-2010/, last accessed 8 June 2011
Rosenberg, A. (2010) ‘Tarificación vial en Sanhattan : ¿Descongestión o exclusión?’ Plataforma urbana, 5 August
SDP (Secretaria Distrital de Planeación) (2009) ‘Estudio prospectivo del sistema integrado de transporte de Bogotá y la región’, Contrato 391 de 2008, Informe Resumen, Secretaria Distrital de Planeación, Gobierno de Bogotá
Secretaria de Movilidad (2010) ‘Movilidad en cifras 2010’, Alcaldía Mayor de Bogotá, Bogotá
GRHS 2013: Regional report Paola Jirón 67 Latin America and the Caribbean

GRHS 2013: Regional report Paola Jirón 68 Latin America and the Caribbean
Secretaria de Transporte Metropolitano de São Paulo (2009) ‘Plan integrado de transporte urbano, PITU 2025’, Gobierno del estado de São Paulo, São Paulo
SECTRA (2001) ‘Encuesta Origen Destino de Viajes’, MIDEPLAN, http://sintia.sectra.cl/, last accessed 5 August 2007
SSM (Santiago se Mueve) (2011) ‘Santiago se Mueve’, Proyecto FONDECYT N° 1090198, www.santiagosemueve.com, last accessed 14 June 2011
Steer Davies Gleave (2009) ‘Tarificación vial por congestión para la ciudad de Santiago’, paper prepared for Programa de Naciones Unidas para el Desarrollo
TURBLOG (2011a) ‘Transferability of urban logistics concepts and practices from a worldwide perspective – Deliverable 3.3 – Urban logistics practices’ – Case Study Belo Horizonte, Brazil, http://www.turblog.eu/, last accesses 6 June 2011
TURBLOG (2011b) ‘Transferability of urban logistics concepts and practices from a worldwide perspective – Deliverable 3.4 – Urban logistics practices – Public policies for urban logistics – Mexico City Metropolitan Area, http://www.turblog.eu/, last accesses 6 June 2011
UNL (2010) ‘En América Latina se duplicarán los accidentes de tránsito’, Universidad Nacional del Litoral, http://www.unl.edu.ar/noticias/noticia.php?nid=7543, last accessed 3 June 2011
Urrutia, M. and C. Rodríguez (2010) ‘Transantiago y la bicicleta; ¿competencia de modos o complemento natural de sistemas?’, XVI Congreso Latinoamericano de Transporte Público y Urbano (CLATPU), Centro de Transporte Sustentable (CTS), 6–8 October, México
Valladares, L. and M. Coelho (not dated) ‘La Investigación urbana en América Latina. tendencias actuales y recomendaciones’, Documentos de Debate, Gestion de Transformaciones Sociales – (MOST), UNESCO
Vallicelli, L. (2002) ‘Un modelo de desarrollo sostenible: Curitiba (Brasil)’, Las nuevas funciones urbanas: gestión para la ciudad sostenible 48: 71–80, CEPAL, Santiago de Chile
Vasconcellos, E. (2010) ‘Integrated transport systems and the mobility divide’, Paper presented to UN-Habitat’s Urban Researchers Roundtable ‘Bridging the Urban Transport Divide’ at World Urban Forum (WUF), 5 March, Rio de Janeiro, Brazil
Vásquez, C., C. Argandoña and A. Neira (2010) ‘Gobierno impulsará tarificación vial para desatochar las calles de Santiago’, La Tercera, Nacional, http://latercera.com/contenido/680_239591_9.shtml, last accessed 3 June 2011
Velazco Castañeda, A. R. (2001) ‘Planificación de la red de transporte público en Guadalajara’, Carta Económica Regional 13(76): 5
World Bank (2008) ‘Trenes urbanos, nuevo adelanto en el desarrollo de las ciudades’, http://go.worldbank.org/VVZWZPLVX1, last accessed 3 June 2011
World Bank (undated) ‘Population and Motor vehicle data’, http://data.worldbank.org/, indicator/EN.URB.LCTY.UR.ZS