sustainable supply chain risk management in dairy industry
TRANSCRIPT

School of Marketing
Sustainable Supply Chain Risk Management in Dairy Industry: An
Empirical Study in Bangladesh
Tasnuba Nasir
This thesis is presented for the Degree of
Doctor of Philosophy
of
Curtin University
October 2016

i
DECLARATION
To the best of my knowledge and belief, this thesis contains no material previously
published by any other person except where due acknowledgement has been made.
This thesis contains no material which has been accepted for the award of any other
degree or diploma in any university.
Tasnuba Nasir
Date: 13 October 2016

DEDICATION
To My Loving Family
My Mom, Dad, Sisters and Brother
My Mother-in-Law and her family
My Husband: Professor Dr. Mohammad Shamsuddoha (Doha)
My Kids:
Mohammad Saifuddoha Fawaaz
Mohammad Samiuddoha Faizaan and
Mohammad Sadiddoha Farzeen
“THANKS TO ALL THOSE WHO KEEP ME IN THEIR CONSTANT PRAYERS”

iii
ACKNOWLEDGEMENTS
“In The Name of Allah, The Most Beneficent, The Most Merciful." First, thanks to my creator Allah for giving me this opportunity, the patience and the strength to complete my thesis after all the challenges. My foremost and deepest gratitude goes to my supervisor, Professor Mohammed Quaddus. This work would not have been possible without his support, guidance, encouragement and suggestions. His immense patience and care enabled me to develop an understanding of doing research. Under his guidance I was able to overcome many difficulties and learned a lot. My sincere gratitude also is devoted to my co-supervisor Dr Nazrul Islam from Department of Agriculture and Food, WA (DAFWA) for his helpful comments and advice on this journey. I take this opportunity to sincerely acknowledge the Australian Government and Curtin University for their exclusive CIPRS scholarship along with tuition and living expenses. My extended appreciation goes to Professor Nigel de Bussy, Professor Al Rainne and Associate Professor Therese Jefferson. In addition, I would like to convey my warmest gratitude to all the CGSB staff of the Marketing School and my alumni PhD colleagues. My thanks go, in particular to Mr Maruf Hossan Chowdhury from whom I learned some basic techniques for my analysis. I would also like to give special thanks to Mohammed Alamgir for his logistical support to finish this thesis. My special thanks to all participants of my field study and all respondents of the survey, for their willingness to share their knowledge, time and experience. At this moment, I gratefully acknowledge the cooperation of Mr. Md. Rakibur Rahman of Nahar dairy and Mr. Didarul Alam of Paharika dairy respectively. Without their cooperation the data collection process of this research would have been delayed and impossible. Their utmost and sincere cooperation and generosity is greatly appreciated. I am particularly indebted to my parents, my mother-in-law, my loving sisters, only brother and to all my relatives who always offered support and love at the time of my depression during this PhD journey. Also my gratitude goes to my friends and colleagues for providing a motivating and fun-filled environment. Last but not least, I would like to give my warmest and deepest appreciation to my loving husband, Professor Dr. Mohammad Shamsuddoha (University of Chittagong) who was also a PhD student during my first two years of study. How could we forget those stressful days having three kids? His support was unconditionally with me during the critical moments to keep me on track during the research. His constructive suggestions were also helpful in formatting the whole thesis. I have really deprived my children, 13-year old Fawaaz, 4-year old Faizaan and 17-months old Farzeen. They have grown up watching their mom busy with laptop, journal articles and books. This piece of work would not have been possible without their support. I appreciate their unconditional love, immense sacrifice and patience. Words are not enough to express my love and gratitude towards all of you. My achievements are dedicated to you all. May Allah reward all.

iv
ABSTRACT
The practice of supply chain risk management is essential for modern businesses facing
the immense challenges of competition and managing economic, social and
environmental sustainability. Contemporary literature reveals that, to date, the dairy
livestock sub-sector has not received sufficient consideration from academics. In
particular, supply chain risks and their possible mitigation strategies at different
processing levels of the dairy industry have received little consideration. In fact this
specific industry suffers from various kinds of supply chain risk associated with cattle
rearing, storing, processing, distribution and forward and backward supply chain
activities. A few research studies have explored existing supply chain risks in the dairy
industry based on different geographic locations. They have identified various supply
chain or general risks but appropriate mitigation strategies have not been considered.
Identifying supply chain risks and finding their appropriate mitigation strategies are
major challenges for this particular industry. Efficient and effective dairy supply chain
risk management is necessary to achieve higher and more sustainable production
outcomes. So far, a few unstructured research initiatives have been undertaken to close
the research gap. To ensure a sustainable supply chain risk management process in the
dairy industry, research on this particular industry is essential. Thus, the current study
is an attempt to depict existing supply chain risks embedded in the storage, processing
and distribution levels of the dairy industry and suggest ways to manage them
appropriately in order to gain the maximum benefits in terms of their social, economic
and environmental aspects.
The research was conducted using a “mixed methods” research design (a combination
of qualitative as well as quantitative methods) under a positivist paradigm. The
methodology was developed in the light of contingency theory and sustainability
theory and incorporated the Quality Function Deployment (QFD) technique. Initially, a
qualitative method was deployed to identify various risks from the case dairy
operation. Then the variables were matched with those in the existing literature. Once
the risks were identified through qualitative interviews and literature, Quality Function
Deployment (QFD) technique was used to analyse the quantitative data obtained from
the questionnaire.

v
The findings of this study reveal appropriate supply chain risk management
comprising proper risk identification and the effective application of risk mitigation
strategies in accordance with the research objectives. Some of the high impact and high
probable risks are found to be high rate of interest, absence of insurance coverage,
Illiterate and inefficient worker and Hartal and strike. On the other hand, the most
preferred mitigation strategies are adequate credit support with low interest rate,
purchase insurance against production loss, hiring skilled staff, appropriate training
facilities and initiative to remove political uncertainty. Such mitigation strategies
ultimately bring economic, social and environmental outcomes for the concern
industry. The profit maximisation, cost minimisation, increase in personal income,
increase in production, product quality improvement, scientific farming and diversified
products belong to economic sustainability. Whereas goodwill enhancement, quality
food supply, nutritional development, improved living standard and employment
creation are considered as social sustainability. Finally environmental sustainability
relied on sound working environment, proper waste management and animal genetic
development.
This research has both theoretical and practical implications. In terms of its theoretical
implications, the research expands the fields of contingency theory and sustainability
theory to include dairy supply chain risk management. This research focused on three
aspects of contingency theory: contingency, response and performance. These aspects
are concerned with situational characteristics, managerial actions and the effectiveness
of existing supply chain risks and mitigation strategies. On the other hand,
sustainability theory deals with the social, economic and environmental aspects of
dairy supply chain risk management.
In terms of its practical implications, the findings of this research will help to identify
dairy supply chain risks in time to develop appropriate mitigation strategies for
sustainable outcomes. The outcomes can be categorised in terms of three aspects of
sustainability: social, economic and environmental. The findings of this research will
benefit dairy farmers, supply chain members, policy makers, concerned livestock
ministries and officials.

vi
PUBLICATIONS FROM THIS DISSERTATION
1. Nasir, T., et al. (2014). "Dairy Supply Chain Risk Management in Bangladesh: Field
studies of Factors and Variables." Jurnal Teknik Industri 16(2): 127-138.
2. Nasir, T. (2014). Dairy Supply Chain Risk Mitigation: A QFD Approach. Curtin Business
School Doctoral Colloquium. Bentley, Australia, CBS, Curtin University: 1-14.
3. Nasir, T. (2013). Dairy Supply Chain Risk Management: Bangladesh Perspective. Curtin
Business School Doctoral Colloquium. J. Goodison. Bentley, Australia, CBS, Curtin
University: 1-12.
4. Shamsuddoha, M., T. Nasir and M. Quaddus (2013). Dairy Supply Chain: A Vensim
based Conceptual Model. 3rd International Forum & Conference on Logistics and
Supply Chain Management (LSCM), Bali, Indonesia.

vii
TABLE OF CONTENTS
PARTICULARS PAGE NO.
DECLARATION I
DEDICATION II
ACKNOWLEDGEMENT III
ABSTRACT IV
PUBLICATION VI
TABLE OF CONTENT VII
LIST OF TABLES XII
LIST OF FIGURES
XV
CHAPTER 1: INTRODUCTION 1
1.1 OVERVIEW 1
1.2 BACKGROUND OF THE RESEARCH AREA 3
1.3 PROBLEM STATEMENT 3
1.4 RESEARCH QUESTIONS AND OBJECTIVES 5
1.5 FOCUS AND SCOPE OF THE RESEARCH 6
1.6 DEFINITION OF TERMS 6
1.7 SIGNIFICANCE OF THE RESEARCH 7
1.8 ORGANISATION OF THE THESIS 7
1.9 SUMMARY 10
CHAPTER 2: BANGLADESH DAIRY INDUSTRY AND RESEARCH CASE DESCRIPTION
11
2.1 INTRODUCTION 11
2.2 BANGLADESH DAIRY INDUSTRY 11
2.2.1 Structure of dairy farms in Bangladesh 12
2.2.2 Genesis of Cooperative Union in Bangladesh dairy industry 13
2.2.3 Scope of dairy sector 15
2.3 PRESENT STATUS OF BANGLADESH DAIRY INDUSTRY 16
2.3.1 Bangladesh dairy at a glance 16
2.3.2 The development of dairy industries in Bangladesh 17
2.3.3 Dairy products and production in Bangladesh 17
2.3.4 Factors influencing dairy sector growth 19
2.3.5 Cattle feed and feed management 19
2.3.6 Cattle breed and breed management 20
2.4 CONTRIBUTION TO RURAL AND NATIONAL ECONOMY 20
2.5 DAIRY SUPPLY CHAIN PROCESS 22
2.6 RISK IN THE DAIRY SECTOR OF BANGLADESH 24
2.7 RISK MANAGEMENT STRATEGIES FOR DAIRY INDUSTRIES IN BANGLADESH
25
2.8 THE CASE DAIRY DESCRIPTION 28
2.8.1 THE CASE DAIRY FARMS 28
2.8.2 NAHAR DAIRY
29

viii
PARTICULARS PAGE NO.
2.8.2.1 Historical background of Nahar Dairy 30
2.8.2.2 Vision 31
2.8.2.3 Market share 31
2.8.3 PAHARIKA DAIRY FARMS 32
2.8.4 COMPARISON BETWEEN THE TWO DAIRY FARMS 32
2.8.5 SOURCES OF CATTLE BREED 34
2.8.6 FARMING UNDER DIFFERENT CALAMITIES 34
2.8.6.1 Dairy disease 34
2.8.6.2 Natural disaster 36
2.8.6.3 Under production 36
2.8.6.4 Government policy 37
2.8.6.5 Market demand 37
2.8.7 TECHNOLOGIES USED IN DEVELOPED COUNTRY AND CASE FARM
37
2.8.7.1 Housing 37
2.8.7.2 Milking machine/milk parlour 38
2.8.7.3 Chiller 38
2.8.7.4 Nutrition analyser 39
2.8.7.5 Flooring 39
2.8.7.6 Others 39
2.9 SUMMARY 39
CHAPTER 3: LITERATURE REVIEW 40
3.1 INTRODUCTION 40
3.2 WORLD DAIRY INDUSTRY 40
3.2.1 USA dairy 42
3.2.2 Indian dairy 42
3.2.3 China dairy 43
3.2.4 New Zealand dairy 43
3.2.5 Australian dairy 43
3.2.6 Bangladesh dairy 44
3.2.7 Other dairy countries 44
3.2.8 Comparative study on dairy production worldwide 45
3.3 SUPPLY CHAIN RISK AND SUPPLY CHAIN RISK MANAGEMENT (SCRM) 46
3.3.1 Supply chain 46
3.3.2 Supply chain risks 47
3.3.3 Supply chain risk management (SCRM) 51
3.3.4 Supply chain risk management in the dairy 55
3.4 SUPPLY CHAIN RISK MANAGEMENT FOR SUSTAINABILITY 57
3.4.1 Sustainability: An examination of the literature 57
3.4.2 Sustainable dairy production 60
3.5 THE DAIRY SUPPLY CHAIN 61
3.6 DAIRY SUPPLY CHAIN RISK 65
3.7 DAIRY SUPPLY CHAIN RISK MITIGATION 70
3.8 PERFORMANCE OUTCOME
74

ix
PARTICULARS PAGE NO.
3.9 THEORETICAL FRAMEWORK: CONTINGENCY THEORY AND SUSTAINABILITY THEORY FOR SCRM
3.10 SUMMARY OF RESEARCH GAPS 3.11 PROPOSED RESEARCH MODEL 3.12 SUMMARY
76
78 80 80
CHAPTER 4: RESEARCH METHODOLOGY 81
4.1 INTRODUCTION 81
4.2 RESEARCH PARADIGM 81
4.3 RESEARCH METHOD 83
4.3.1 Mixed methods 83
4.3.2 Case studies 85
4.3.2.1 Nahar Agro Farms Limited 86
4.3.2.2 Paharika Farms Limited 86
4.4 RESEARCH PROCESS 87
4.5 RESEARCH FRAMEWORK BASED ON QFD 90
4.5.1 Quality Function Deployment (QFD) 90
4.5.2 Applications of QFD 92
4.6 FRAMEWORK OF HOUSE OF QUALITY FOR QFD MODEL 93
4.6.1 The QFD Process 94
4.7 DATA COLLECTION: PHASE 1 97
4.7.1Qualitative data collection 97
4.7.2 Quantitative data collection: Phase 1 99
4.8 DATA COLLECTION : PHASE 2 105
4.9 SUMMARY 107
CHAPTER 5: RESULTS OF DATA ANALYSES 108
5.1 INTRODUCTION 108
5.2 PROBLEMS OF DATA COLLECTION 108
5.3 IN-DEPTH INTERVIEW 109
5.3.1 The development of the interview questions 110
5.3.2 Respondents profile 110
5.3.3 Findings: Risks (Inductive Analysis) 111
5.3.3.1 Description of risks 115
5.3.4 Findings: Mitigation Strategies (Inductive Analysis) 119
5.3.4.1 Description of mitigation strategies 122
5.3.5 Findings: Sustainable Outcomes (Inductive Analysis) 124
5.3.5.1 Description of sustainable outcomes 125
5.3.6 Deductive Analysis 129
5.3.7 The Quality Function Deployment Analysis 139
5.4 QUESTIONNAIRE – BASED SURVEY 139
5.4.1 Respondents Profile 140
5.5 THE QFD PROCESS 141
5.5.1 QFD PART I: PHASE 1 141
5.5.1.1 Identifying risks 141
5.5.1.2 Identifying risk mitigation strategies
143

x
PARTICULARS PAGE NO.
5.5.1.3 Degree of Importance (DI) 144
5.5.1.4 Identifying the relationship between risks and mitigation strategies
147
5.5.1.5 Identifying relative costs (Cost Constraints)
149
5.5.1.6 Developing QFD roof matrix 152
5.5.1.7 Absolute Importance (AI) 153
5.5.1.8 Relative Importance (RI) 156
5.5.2 QFD PART II: PHASE 1 156
5.5.2.1 Formulation of dairy supply chain risk mitigation problems through (0,1) linear programming (Without Savings)
156
5.5.2.2 Formulation of dairy supply chain risk mitigation problems through (0,1) quadratic integer programming (with savings)
163
5.6 QFD ANALYSIS: PHASE 2 169
5.6.1 Identifying optimised mitigation strategies and sustainable outcomes
170
5.6.2 Identifying the relationship between mitigation strategies and sustainable outcomes
173
5.6.3 Relative Importance (RI): Phase 2 173
5.7 SUMMARY 177
CHAPTER 6: DISCUSSIONS 178
6.1 INTRODUCTION 178
6.2 RESULTS FOR HIGHLY PROBABLE AND HIGH IMPACT RISKS 178
6.2.1 Mitigating strategies for the highly probable and high impact risks
182
6.3 EXPLORING THE HIGHLY IMPORTANT STRATEGIES TO MITIGATE RISKS
187
6.4 OPTIMAL MITIGATION STRATEGIES 197
6.5 RELIABILITY AND VALIDITY OF THE QFD MODEL 204
6.5.1 Model reliability 204
6.5.2 Model validity 205
6.6 ADDRESSING THE RESEARCH QUESTIONS 205
6.6.1 RESEARCH QUESTION 1: How sustainability theory can be used to categorise the risks associated with dairy supply chain in Bangladesh?
205
6.6.2 RESEARCH QUESTION 2: What are the strategies to mitigate the high probable and high impact risks with dairy supply chain in Bangladesh?
211
6.6.3 RESEARCH QUESTION 3: What are the probable outcomes of implementing the mitigation strategies at the organisation level?
217
6.7 SUMMARY 223

xi
PARTICULARS PAGE NO.
CHAPTER 7: CONCLUSIONS AND RECOMMENDATIONS 224
7.1 INTRODUCTION 224
7.2 SUMMARY OF THE RESEARCH 225
7.3 CONTRIBUTIONS OF THE RESEARCH 227
7.3.1 Theoretical Contributions 227
7.3.2 Practical Contributions 229
7.4 IMPLICATIONS FOR DAIRY INDUSTRY AND POLICY MAKERS 230
7.5 RESEARCH LIMITATIONS
231
7.6 FUTURE DIRECTIONS 232
REFERENCES 233
APPENDICES 248

xii
LIST OF TABLES
PARTICULARS OF THE TABLES PAGE NO.
Table 2.1: Volume of Sales of Processed Liquid Milk by Different Dairy
Enterprises Milk Processing Capacity, 2007
12
Table-2.2: Plants of the BMPCUL 15
Table 2.3: The BRAC Chilling Facilities 15
Table 2.4: Contribution of the Livestock Sector to GDP 21
Table 2.5: Sustainable Contribution of the Dairy Sector 22
Table 2.6: Parties involved in Bangladesh Dairy Supply Chain 22
Table 2.7: Risks to the Dairy Sector from Sustainable Perspectives 25
Table 2.8: Average Milk Production of Case Industries 33
Table 2.9: Distinguishing Features of Nahar and Paharika Dairy Farms 33
Table 2.10: Breeds and Milk Collection of Bangladesh 35
Table 3.1: Production worldwide 45
Table 3.2: Different Definitions of Supply Chain Management 46
Table 3.3: Supply Chain Risk Mitigation Strategies 53
Table 3.4: Risks from Literature 68
Table 3.5: Dairy Mitigation Strategies from Literature 71
Table 3.6: Sustainable Outcomes from Literature 75
Table 4.1: Nahar and Paharika at a glance 87
Table 4.2: Average Milk Production of Case Industries 87
Table 5.1: Sample Interview Questions for Qualitative Data Collection 110
Table 5.2: Profile of the Respondents (In-depth interview) 111
Table 5.3: Common (Storage, Processing and Distribution) Risk Factors
and Variables
112
Table 5.4: Risk Factors and Variables (Storage Level) 113
Table 5.5: Risk Factors and Variables (Processing Level) 114
Table 5.6: Risk Factors and Variables (Distribution Level) 115
Table 5.7: Common Mitigation Strategies (Storage, Processing and
Distribution)
120
Table 5.8: Mitigation Strategies (Storage Level) 120
Table 5.9: Mitigation Strategies (Processing Level) 121
Table 5.10: Mitigation Strategies (Distribution Level) 122
Table 5.11: Sustainable Outcomes 125
Table 5.12: Common Risks with Relevant Literature 130
Table 5.13: Risk Factors (Storage) with Relevant Literature 132
Table 5.14: Risk Factors (Processing) with Relevant Literature 133
Table 5.15: Risk factors (Distribution) with relevant literature 134
Table 5.16: Common Mitigation Strategies with relevant literature 135
Table 5.17: Mitigation Strategies with relevant literature (Storage) 136
Table 5.18: Mitigation Strategies with relevant literature (Processing) 136
Table 5.19: Mitigation Strategies with Relevant Literature (Distribution) 137
Table 5.20: Sustainable outcomes with relevant literature
138

xiii
PARTICULARS OF THE TABLES PAGE NO.
Table 5.21: Background Information of Respondents 140
Table 5.22: Dairy Supply Chain Risks 142
Table 5.23: Dairy Supply Chain Risk Mitigation Strategies 144
Table 5.24: Calculation of Degree of Importance (Nahar) 146
Table 5.25: Tabulation of Data regarding Risk and Strategy Relationship 148
Table 5.26: Tabulation of Data for Relationship Matrix (Nahar) 148
Table 5.27: Value of Relationship Matrix for QFD Analysis (Nahar) 150
Table 5.28: Calculation of Total Relative Cost (Nahar and Paharika) 151
Table 5.29: Cost Saving Data (Nahar) 152
Table 5.30: Cost Savings Data (Paharika) 153
Table 5.31: QFD – Nahar Employees 155
Table 5.32: Optimisation of Risk Mitigation level without savings
(Nahar Employees)
160
Table 5.33: Optimisation of Risk Mitigation level without savings
(Paharika Employees)
162
Table 5.34: Optimisation of Risk Mitigation level with savings
(Nahar Employees)
165
Table 5.35: Optimisation of Risk Mitigation level with savings
(Paharika Employees)
167
Table 5.36a: List of Optimised Mitigation Strategies for Nahar (WHATs) 171
Table 5.36b: Categorised Optimum Mitigation Strategies for Nahar (WHATs) 172
Table 5.37a: Probable Sustainable Outcomes 172
Table 5.37b: Categorised Probable Sustainable Outcomes 173
Table 5.38: QFD Analysis Phase 2 (Nahar) 175
Table 5.39: QFD Analysis Phase 2 (Paharika) 176
Table 6.1: Identification of Highly Probable and High Impact Risks 179
Table 6.2: Full Expression of Highly Probable and High Impact Risk 179
Table 6.3: Mitigation Strategies for Highly Probable and High Impact Risks 183
Table 6.4: List of Selected Strategies 184
Table 6.5: Highly Important Strategies (Nahar Employees) 188
Table 6.6: Highly Important Strategies (Paharika Employees) 191
Table 6.7: Nahar Employees vs. Paharika Employees 191
Table 6.8: Highly Important Strategies (Nahar Executives) 192
Table 6.9: Highly Important Strategies (Paharika Executives) 193
Table 6.10: Nahar Executives vs. Paharika Executives 194
Table 6.11: Highly Important Strategies (Nahar Supply Chain) 195
Table 6.12: Highly Important Strategies (Paharika Supply Chain) 196
Table 6.13: Nahar Supply Chain vs. Paharika Supply Chain 197
Table 6.14: Optimization results for Nahar Employees 199
Table 6.15: Optimisation results for Paharika Employees 201
Table 6.16: Comparison of Optimisation Results 202
Table 6.17: Categorisation of Risks using Sustainability Aspects 207
Table 6.18: List of Economic Risks
209
xiv
PARTICULARS OF THE TABLES PAGE NO.
Table 6.19: List of Social Risks 210
Table 6.20: Optimal Strategies to Mitigate Highly Probable and High Impact
Risks (Nahar Employees)
213
Table 6.21: Optimal Strategies to Mitigate Highly Probable and High Impact
Risks (Nahar Executives)
214
Table 6.22: Optimal Strategies to Mitigate Highly Probable and High Impact
Risks (Nahar SC members)
215
Table 6.23: Optimal Strategies to Mitigate Highly Probable and High Impact
Risks (Paharika Employees)
215
Table 6.24: Optimal Strategies to Mitigate Highly Probable and High Impact
Risks (Paharika Executives)
216
Table 6.25: Optimal Strategies to Mitigate Highly Probable and High Impact
Risks (Paharika SC members)
217
Table 6.26: Overall Ranking of Sustainable Outcomes 218
Table 6.27: Segmented Ranking of Sustainable Outcomes 219

xv
LIST OF FIGURES
NAME OF THE FIGURES PAGE NO.
Figure 1.1: Structure of the thesis 8
Figure 2.1: Milk Production and Change in Bangladesh (million tons) (DLS 2012)
17
Figure 2.2: Chart of Traditional Dairy Products of Bangladesh 18
Figure 2.3: Chart of Non-traditional Dairy Products of Bangladesh 18
Figure 2.4: Milk Marketing Chain 23
Figure 2.5: Dairy Processing and Marketing System in Bangladesh 24
Figure 2.6: Satellite Image of Nahar Dairy (Unit 1) 30
Figure 2.7: Satellite Image of Paharika Dairy 30
Figure 3.1: Major producers of cow milk worldwide in 2013, by country (in million metric tons)
41
Figure 3.2 : Supply Chain Risk Factors 49
Figure 3.3: Supply Risks, Process Risks, and Demand Risks 51
Figure 3.4: Supply Chain Risk Management-The Basic Constructs 52
Figure 3.5: Sustainability: The Triple Bottom Line 59
Figure 3.6: Major Challenges to the Sustainable Development 59
Figure 3.7: Milk Collection and Transport System 63
Figure 3.8: PRAN’s Dairy Supply Chain 64
Figure 3.9: The Oakhurst Dairy Supply Chain 64
Figure 3.10: Dairy Supply Chain Risk Mitigation Strategy Model 80
Figure 4.1: Four types of mixed methods design 85
Figure 4.2: The Sequential Presentation of the Research Process 88
Figure 4.3: House of Quality (HoQ) for QFD Model 93
Figure 4.4: Networked QFD Process 95
Figure 4.5: QFD Model – Phase 2 107
Figure 5.1: Roof Matrix (Nahar) 153
Figure 5.2: Comparison of risk mitigation level between with saving and without savings (Nahar Employees).
168
Figure 5.3: Comparison of risk mitigation level between with saving and without savings (Nahar Executives).
169
Figure 5.4: Comparison of risk mitigation level between with saving and without savings (Nahar SC members).
169

1
CHAPTER 1: INTRODUCTION
1.1 OVERVIEW
Bangladesh is a South-East Asian country with more than 160 million people and a
plethora of problems. Despite this the country is progressing steadily. They are
managing food and other basics in a modest way. In recent decades, Bangladesh has
attained phenomenal growth in agro-based industries. Dairy, poultry and fisheries are
the main livestock sub-sectors in the economy of Bangladesh. These sub-sectors have a
reputation for providing cheap sources of protein, creating employment opportunities,
and serving as direct and indirect income sources for millions of people (Das et al.
2008). Livestock is not only a source of protein but also of cash income through the sale
of a range of products such as meat, eggs, milk, skin, draught animal power, manure,
feathers and horns. The sale of livestock and livestock products enables poor families,
particularly insolvent women, to increase income for the family without detracting
from household activities. The dairy industry is one of the most important sub-sectors
in Bangladesh, contributing in immense ways to the country’s economy and society. It
is one of the sectors best suited to alleviating poverty in the rural economy of
Bangladesh. It generates employment by providing jobs to the whole family, i.e.,
children, men and women alike. However, unlike other sectors,the dairy industry has
not shown significant growth. This is due to the various risks associated with the
sector. The dairy farming industry in Bangladesh is beset with different risks in its
different sectors. Its input sector faces risks like feed scarcity, treatment inadequacy,
credit unavailability, low productivity of breeds and so on. Due to the poor functioning
of the input sector, the production sector, i.e. Farming operation, is also handicapped
(Raha and Talukder 2004). The distribution sector is also affected due to limited access
to markets, too many middlemen, poor transport facilities and improper
infrastructural facilities.
The concepts of risk and risk management have been associated with various field of
knowledge. Supply chain risk management (SCRM) is rapidly developing into a
favoured research area for academicians as well as practitioners, especially in the
modern business era (Manuj and Mentzer 2008b). As risk pervades every dimension of
our lives, both personal and professional, so we need to encounter and manage risk in
every aspect of our daily routine. In this sense, the Bangladesh dairy is no exception.

2
The Bangladesh dairy industry is major sub-sector serving to alleviate poverty and
create employment. It is an important livestock sub-sector for generating income and
employment for rural poor people (Saadullah 2011). It contributes to the economic and
social development of the country. Dairy consumption has doubled in the past three
years, though the rise is moderately low per capita (TheDairySite 2013). This industry
has immense prospects in terms of production and consumption, as consumption per
capita is still significantly below the standard level. But theindustry is associated with
a number of risks which hinder its development and growth(Nasir, Quaddus and
Shamsuddoha 2014).
The dairy industry is still unstructured in terms of managing and mitigating current
and possible risks. Therefore the purpose of this research is to develop a framework
to identify potential risks to supply chain processes and to suggest potential mitigation
strategies that can be implemented to mitigate these risks. A mixed methods approach
has been developed in the light of contingency theory (Zeithaml, Varadarajan and
Zeithaml 1988a) and sustainability theory (Carter and Rogers 2008b) by which
different risks to the dairy supply chain are categorised. Risk mitigation strategies are
developed through the Quality Function Deployment (QFD) tool (Park and Kim 1998)
and the outcomes are analysed through network QFD (Kahraman, Ertay and
Büyüközkan 2006). Qualitative and quantitative data are combined with literature
support to build a QFD model.
After starting with an overview, the thesis presents an extensive literature review of
the Bangladesh dairy industry, supply chain risks, supply chain risk management
strategiesand other relevant studies. Then research questions and methodologies are
described in detail, followed by a description and analysis of qualitative data identifing
risk factors,mitigation strategies and probable sustainable outcomes specific to
Bangladesh dairy industry production and its supply chain.
Quantitative data collected from the respondents of two case dairies through survey
questionnaires via in-depth interviews is analysed. Results, interpretations and
discussion of the data are provided and the thesis closes with a summary of the
research and a description of its contribution to the literature and agribusiness. Finally,
the limitations of the study are acknowledged and directions for future research are
proposed.

3
1.2 BACKGROUND OF THE RESEARCH AREA
A supply chain is not just a single relationship of business to business but a network of
multiple businesses and relationships among the supply chain actors (Lambert and
Cooper 2000; Lambert, Stock and Ellram 1998).It is a complex chain which is
connected through multiple relationships among the supply chain actors. The goal of
supply chain risk management (SCRM) is to manage supply chain risks through
coordination and collaboration among the supply chain partners in order to ensure
profitability and continuity (Brindley 2004). Supply chain risk management (SCRM) is
still a relatively new concept in developing countries like Bangladesh, and many
companies have not even begun to consider the formal management of their supply
chains. In Bangladesh, economic, social and environmental issues are equally
significant due to huge population pressures, the high level of poverty, limited land
resources, food shortages and drastic climatic changes (Shamsuddoha 2012;
Shamsuddoha, Quaddus and Klass 2011; Shamsuddoha, Klass and Quaddus 2011).
Companies are struggling to operate their dairy businesses to achieve profitability with
minimum environmental hazards.
Moreover, in the dairy business, the nature of raw milk (input), processed product
(output), frequency of transactions, present market structure and environmental
hazards have added more risks(Mishra and Shekhar 2011).Support for implementing
supply chain risk management and sustainability programmes at the industry level is
intensifying.There is a noteworthy gap in existing knowledge about the
implementation of proper supply chainsin this particular industry. Risk and risk
management strategies for dairy industries have received little attention in agricultural
research. Therefore, an exploratory study has been carried out to provide empirical
insights into Bangladeshi dairy farmers’ risk perceptions and risk management
responses. This research seeks to identify the major risks facing the dairy supply chain
in the context of sustainability, rank them in terms of their potential impact and
frequency, and offer a framework for improving risk management practices. It also
suggests possible sustainable outcomes as a result of implementation of proper
mitigation strategies.
1.3 PROBLEM STATEMENT
In recent years, supply chain risk management has become an important research area
as supply chains face a multitude of risks (Rao and Goldsby 2009). The flow of a supply
chain is often interrupted by disruptions such as protests, outbreaks of disease,

4
accidents at plants, the loss of a critical supplier, terrorist attacks, natural disasters,
and economic downturns (Sheffi 2005; Christopher and Peck 2004; Kleindorfer and
Saad 2005; Jüttner, Peck and Christopher 2003; Thun and Hoenig 2011). Disruption of
the supply chain can negatively affect the ability of corporations to continue the normal
flow of supply chain operations (Jüttner, Peck and Christopher 2003). The rapid
escalation of supply chain disruptions highlights the need for more attention to be
given to supply chain risk management to enable businesses to remain sustainable and
competitive (Christopher and Lee 2004).
Recently the widespread disruptions caused by terrorist attacks in the USA, by foot
and mouth disease in the UK, and by the SARS outbreak in China, Hong Kong and
Canada, have drawn attention to the issue of safety across supply chains, and have
highlighted their susceptibility (Jüttner, Peck and Christopher 2003).In the global
market place, floods caused by Hurricane Floyd disrupted the business of
DaimlerChrysler in Greenville, North Carolina, where seven different plants of the
company across North America had to be shut down for several days (McGillivray
2000). In a similar way, Toyota was forced to close down for six weeks following a fire
at its brake-fluid proportioning valve supplier. This disruption cost the company an
estimated $40 million per day (Nelson, Moody and Mayo 1998). More recently, in the
USA, 29 ports were shut down for ten days, which cost $1 billion per day to the US
economy (Jüttner, Peck and Christopher 2003). These are examples of events that have
paralysed the flow of supply chains. From these examples, it is clear that modern
supply chains are a very complex bonding of several entities where a disruption
affecting a single entity within the supply chain can have a direct effect on the ability of
a corporation to continue to operate the supply chain smoothly. The discontinuity of
supply chain operations can negatively affect both cost and revenue of the whole chain
(Ponomarov and Holcomb 2009).
Supply chain risk management helps a supply chain to prepare for unpredicted
disruptions and to recover from unexpected losses (Christopher and Peck 2004).
Though awareness is increasing among practitioners, the concepts of supply chain risk
and supply chain risk management (SCRM) are still in their infancy (Jüttner 2005).
Additionally, a number of contributions regarding risk and risk management from a
logistics perspective have emerged in academia (Miller 1991; Svensson 2000; Zsidisin,
Panelli and Upton 2000). However, there is still a lack of research on issues of supply
chain risk management from a practical perspective (Jüttner 2005). Therefore

5
empirical work is needed in the field of supply chain risk management for proper
identification of supply chain risks and effective management of those risks (Thun and
Hoenig 2011).
The Bangladesh dairy industry is an important livestock sub-sector for generating
income and employment for rural poor people in Bangladesh. This industry is still
unstructured in terms of managing and mitigating current and possible risks. A huge
number of risks hinder the development of this industry. Supply chain risk
management is still a relatively new concept in the dairy sector of Bangladesh. Many
companies have not even begun to consider formal management of their supply chains.
Very limited research has been conducted in the field of dairy supply chain risk
management, especially in the Bangladesh context. Thus, this research attempts to
identify the multidimensional dairy supply chain risks in Bangladesh and considers
their likelihood and their potential impact on the supply chain, in order to develop
appropriate mitigation strategies.
1.4 RESEARCH QUESTION AND OBJECTIVES
The purpose of this study is to identifythe various riskslikely to arise at the storage,
processing and distribution levels of the dairy industry and to explorethe various
strategies developed to mitigate those risks, along with possible sustainable outcomes.
Supply chain risks and the outcomes after implementing risk mitigation strategies are
considered from economic, social and environmental perspectives. The variables are
evaluated with the help of a QFD model with respect to three research questions and
four research objectives.
This research addresses the following research questions (RQs):
RQ1: How can sustainability theory be used to categorise the risks associated with the
dairy supply chain in Bangladesh?
RQ2: What are the optimal strategies to mitigate the highly probable, high impact risks
associated with the dairy supply chain in Bangladesh?
RQ3: What are the probable outcomes of implementing the mitigation strategies at the
organisation level?
The above research questions give rise to the following research objectives (ROs):
RO1: To identify the risks associated with the dairy sector in Bangladesh using
sustainability theory.

6
RO2: To identify the highly probable high impact risks associated with the dairy supply
chain.
RO3: To develop risk mitigation strategies through a QFD (Quality Function
Deployment) approach.
RO4: To identify the possible sustainable outcomes resulting from implementing
mitigation strategies at the dairy farm level.
1.5 FOCUS AND SCOPE OF THE RESEARCH
Despite the importance of SCRM in today’s business practices, there are noteworthy
gaps in the existing literature. Therefore, the focus of this research is on identification
of risks and investigation of risk management strategies, along with probable
sustainable outcomes. More specifically, the research identifies risk factors and
explores risk mitigation strategies associated with the dairy suppy chain. Subsequently
possible sustainable outcomes after implementing suggested risk mitigation strategies
are also presented in. Two dairies in Bangladesh have been selected as case studies
and theresearch assesses their risks at various supply chain levels and examines their
mitigation strategies. Consequently the variables are used to develop a QFD model for
the dairy industry. The model can be replicated in individual dairy companies if the
variables are replaced.
1.6 DEFINITION OF TERMS
Risk: Risk is the likelihood of the occurrence of a particular event or outcome (Ritchie
and Brindley 2007).
Supply Chain Risk Management (SCRM): SCRM can be defined as the management of
SC risks through co-ordination or collaboration among the SC partners so as to ensure
profitability and continuity (Tang and Musa 2011).
Sustainability: Sustainability is the balance between economic development,
environmental stewardship and social equity (Sikdar 2003).
Sustainable Supply Chain Management (SSCM): SSCM is the strategic, transparent
integration and achievement of an organisation’s economic, social and environmental
goals in the systemic coordination of key inter-organisational business processes for
improving the long-term economic performance of an individual company and its
supply chains (Carter and Rogers 2008b).

7
1.7 SIGNIFICANCE OF THE RESEARCH
This research has both theoretical and practical implications for the Bangladesh dairy
industry This study combines sustainability theory and contingency theory to develop
a QFD model which is used to construct a true representation of dairy supply chain
risk management by analysing risk issues and risk mitigation strategies. Practically,
dairy industrialists and policy makers will benefit from this research in their decision-
making processes. The research has following theoritical and practical significance.
Theoretical significance: This study uses a research framework based on contingency
and sustainability theory to categorise risks in the dairy supply chain and to
identifypossible risk mitigation strategies. Effective risk mitigation strategies are
developed through Quality Function Deployment (QFD) techniques and the outcomes
are analysed using a network QFD process (Kahraman, Ertay and Büyüközkan 2006).
Thus this research adds to existing knowledge and contributes significantly to theories
of dairy supply chain risk management.
Practical significance: This research contributes to the dairy supply chain
management process by identifying the existing risks and appropriate risk mitigation
strategies associated with the dairy sector in Bangladesh. The proposed model will deal
with the issues of the different categories of dairy supply chain risk and identify the
high probable and high impact risks associated with dairy supply chain in Bangladesh
along with the risk mitigation strategies. It is thus expected that the practical
application of the study will contribute significantly to the dairy sector of Bangladesh
in terms of mitigating existing risks. Outcomes of the research will benefit dairy
stakeholders, supply chain members, concerned livestock ministries and officials. As a
consequence, this study makes a significant practical contribution to the Bangladesh
dairy industry.
1.8 ORGANISATION OF THE THESIS
This thesis is organised and presented in sevenchapters as shown in Figure 1.1. A brief
outline ofeach chapter is as follows:
Chapter 1: Introduction
This current chapterpresents the the research background and draws attention to the
importance of the research and the gap in existing literature. It describes the focus of
the research, the research questions and the research objectives.The theoretical and

8
practical contributions of the research are also presented in this chapter, followed by
an overview of the whole thesis structure.
Chapter 2: Bangladesh dairy industry and research case description
Chapter 2 discusses the basics of the dairy industry including its structure, scope,
present status, contribution, supply chain process, associated supply chain risks and
adopted risk mitigation strategies in Bangladesh. This chapter also includes some
statistical information regarding the Bangladesh dairy industry. A description of case
dairiesis also included in this chapter.
Figure 1.1: Structure of the Thesis
Description Output Structure
Introduction to the thesis ● Establish the research problem
Determines the research questions and objectives
Chapter 1
Provides the research subject and rationale of the study
Bangladesh Dairy Industry ●Structure ● Present status of dairy industry ●Dairy Supply chain process
Dairy risks and risk mitigation strategies
Chapter 2
Discusses the relevant literatures and theoretical framework
Literature Review ●The theoretical background
● Discussion about the existing gap ● Theoretical framework
Chapter 3
Chapter 4 Presents the methodology adopted for this research
Methodology ● Descriptions of research method
Presents the numerical results of analysis
Results ● Numerical results of qualitative and
quantitative data ● Analysis of the study
Chapter 5
Delivers the interpretations of the research findings
Discussion ● Discussion of the analyses
Chapter 6
Wrapping up the dissertation and proposes the future
Chapter 7 Conclusion and Recommendation ● Overview of the research and future
direction

9
Chapter 3: Literature review and conceptual model
In Chapter 3, an extensive literature review focusing on dairy supply chain, dairy risk,
supply chain risk and risk mitigation strategy mostly associated with the dairy
industry,is presented. The literature review relates the current study to the relevant
concepts of sustainability and the supply chain. At the same time, attention is also
drawn to the existing gap in knowledge.
Chapter 4: Research methodology
The methodological underpinning of this research is presented in Chapter 4. It involves
a mixed methodology that combines quantitative and qualitative approaches. The
rationale and justification for the methodologyare also discussed.
This chapter describes the process and outcome of a qualitative field studythat was
conducted using semi-structured interviews with ten interviewees including
executives and employees from two large scale commercial dairy industries with long
experience in the Bangladesh dairy sector. Content analysis was used to analyse the
responses. Details of the development of the questionnaire for the research survey is
also provided in this chapter.
The quantitative approach used in this study is also discussed in this chapter. A survey
questionnaire was distributed to twenty two key persons including employees,
executives and supply chain members of two large commercial dairy farms in
Bangladesh. Quality Function Deployment (QFD) was used to analyse the survey data.
Chapter 5: Results of data analysis
The findings are presented in Chapter 5, where problems encountered during data
collection are also recorded. This chapter presents the factors and variables associated
with dairy supply chain risk, risk mitigation strategies, relative costs incurred in
strategy implementation and the correlation between strategies when two are
implemented simultenously. The QFD results including various equations are also
described in this chapter, as well as the optimisation results of QFD analysis.
Chapter 6: Discussion
Chapter 6presents a discussion of the research findings based on the research
questions and research objectives. Contrasts and comparisonsare made between the
two case dairiesin terms of practical implementation.

10
Chapter 7:Conclusion and future research directions
Chapter 7, the final chapter, presents a summary of the research and the significanceof
its contribution to theory and practice. The limitations of this current research study
are acknowledged and recommendations of possible directionsfor future research are
proposed.
1.9 SUMMARY
This chapter has provided the background and scope of the current research study.
Ithas provided an overview of the existing literature, identified the gap in knowledge,
and described how the gap has been addressed by this research. It has also discussed
the theoretical framework by reference to the concepts of sustainability and supply
chain concepts and the use of the Quality Function Deployment (QFD) research
process. Furthermore, the research objectives, research questions and key definitions
have been outlined in order to point oute the direction of the current research. This
chapter concluded with a brief outline of the organisation of the thesis. The following
chapter discusses the Bangladesh dairy operation and the detail of the case industries
in the light of the current study.

11
CHAPTER 2: BANGLADESH DAIRY INDUSTRY AND RESEARCH CASE DESCRIPTION
2.1 INTRODUCTION
This chapter provides an account of the basics of the dairy industry and its
contribution to the livestock industryin Bangladesh. It also discusses the development
of dairy industries, dairy breeds, feeding systems, structures, processs, supply chain
networks, factors affecting dairy production, dairy risks and risk management
strategies. By showing the scope and future demands of the dairy industryin
Bangladesh, this chapter highlights the significance of the industry for the future of the
country. In the final section, twocase dairiesare described in terms of their existing
operations and procedures for maintaining farming in the Bangladesh environment.
2.2 BANGLADESH DAIRY INDUSTRY
Bangladesh is an agro-based country with a land area of 130,000 square kilometres of
which 69.4% is classified as agricultural land. Only 6.6% of the agricultural area is
permanent pasture (FAOSTAT, 2005). Agriculture, dairy, poultry and fisheries are the
main occupations of the rural people (Shahnaz, Shimazaki and Kato 2004). Dairy is an
important livestock sub-sector in the economy of Bangladesh. It provides food in the
form of milk, milk products and meat; energy in the form of draft and traction power;
fuel for cooking; raw materials in the form of wool, hair, skins, hides, bones, hoof and
horns; manure for crops and cow dung for fuel (Raha and Talukder 2004). The dairy
industry is a major sub-sector which serves to alleviate poverty and create
employment and thus contributes to the economic and social development in the
country. In Bangladesh, dairy is not only a popular livestock sub-sector in the rural
economy but also a powerful avenue for additional income generation which is passed
on to the next generation through inheritance. Thus dairy is increasingly proving to be
a worthwhile livelihood option for a large number of households engaged in milk
production and trade. But this sector features small scale, unorganised animal holdings,
low productivity, inappropriate animal feeding and health care, inadequate
infrastructure for procurement, scanty transportation facilities, low processing and
marketing facilities for milk and an absence of professional management (Raha and
Talukder 2004).

12
The Bangladesh dairy industry is an integral part of the livestock business, enriched
with deep-rooted history, from time immemorial. Dairy farming has been conducted
both commercially and at subsistence level since British reign. Milk cow rearing has
been practiced by millions of rural households for centuries (Raha and Talukder 2004).
According to Hemme and Khan (2004), an estimated 3% of the milk is produced
through formal channels (commercial structured supply chain channels) of production in
Bangladesh and the remaining 97%is traded by informal distributers (Hemme and
Khan 2004). The majority of dairy farms in Bangladesh are privately owned. New
entrepreneurs are becoming involved in small scale dairy farming in urban and peri-
urban areas (Saadullah 2011). At present, there are fourteen structured companies
operating dairy business in Bangladesh. Of these, Milk Vita, BRAC and PRAN hold the
largest share of the market (see Table-2.1). The Bangladesh Milk Producers
Cooperative Union Limited (BMPCUL) was first established in 1973 under the brand
name of Milk Vita. Table 2.1 shows the market share of different dairy enterprises.
Table 2.1: Volume of Sales of Processed Liquid Milk by Different Dairy
Enterprises Milk Processing Capacity, 2007 (Haque 2009)
Sl. No.
Dairy (Establishment Year)
Average milk Collection
(litres/day)
Small-holder Milk Suppliers
Percentage of Market Share
1 Milk Vita ( 1973) 200,000 150,000 52% 2 Amomilk (1996) 10,000 5,000 2.6% 3 Tulip Dairy (1998) 3,000 2,000 0.78% 4 Arong-BRAC dairy (1998) 80,000 70,000 21% 5 Bikrampur Dairy (1998) 10,000 6,000 2.6% 6 Shelaida Dairy (1998) 10,000 4,000 2.6% 7 Aftab (1998) 8,000 4,000 2.08% 8 PRAN (2001) 40,000 30,000 10.42% 9 Grameen- CLDDP (1999) 7,000 6,000 1.82%
10 Rangpur Dairy (2007) 8,000 7,000 2.08% 11 Akij Group (2007) 4,000 500 1.04% 12 GrameenDanone (2007) 1,000 From CLDDP 0.26% 13 Savar Dairy (1974) 3,000 From own farm 0.78% 14 Army Self-consumption From own farm
Total 384,000 284,500
2.2.1 Structure of dairy farms in Bangladesh
In Bangladesh, 90% of dairy farms have an average farm size of 1–3 cows; 96% have an
average of 110 cows. The remaining 4% of the farms have more than 10 cows (Hemme
and Uddin 2009). The majority of dairy farms in the country are privately owned.
These can be categorised into five different groups on the basis of their primary use of
cows and farm size (Saadullah 2011):

13
a) Dairying for home consumption: This group comprises farmers with large and
medium size farms, who normally keep 1–3 cows to meet primarily their household
demand for milk products, the surplus being sold in the local market
b) Dairying for dual purposes (cultivation and milking): Farms in this group take
the form of a rural household with 2–6 animals, including both bulls and dairy cows.
They often have to use their dairy cows for cultivating. During the off season when
cows are free from agricultural farm use, they produce milk which is sold to markets.
c) Small-scale dairy farming: This group comprises farms with small- and
medium-size livestock holdings, having 2–5 cows and aided by financial and technical
support from the government, NGOs and cooperatives. 90% of the milk is sold to a
nearby milk market.
d) Medium size commercial dairy farming: This group is made up of medium size
households keeping 6–25 cows and also receiving mostly government incentives or
cooperative support to establish rural dairy farms. All the milk and milk products are
sold to the market.
e) Private large commercial dairy farms: These are modern dairy farms, which are
privately owned, usually keeping 26+ cows. 98%of the milk is sold to a milk
processing company with a nearby collection point (Hemme and Khan 2004).
Small dairy farms are part and parcel of almost every family home in the rural areas.
Interestingly, large private farms produce the maximum proportion of milk compared
to millions of small-scale farms, but it is the small scale farms that fulfil the nutritional
demands of the local community. Dairy cooperatives were established to collect milk
from rural communities to supply the city areas where consumption is higher than the
rural communities. The next section discusses the genesis of cooperative societies in
Bangladesh.
2.2.2 Genesis of Cooperative Union in the Bangladesh dairy industry
Before the partition of India, in 1946, an organisation named ‘National Nutrients Co.
Ltd.’ made a plan to set up a dairy plant with a capacity of 2,000 litres of milk per day at
Lahiri Mohanpur, Pabna (presently Serajganj district). However, the plan was not fully
executed due to the partition of India and Pakistan in 1947 (Raha and Talukder 2004).
In 1952, Eastern Milk Products Limited, a private company, purchased this dairy plant
from the original owner, Mr Mokhlesur Rahman of Calcutta, and adopted the brand
name Milk Vita. In 1965, a cooperative system was introduced into the management

14
and operation of the plant and the first milk producers’ cooperative society was
formed, with government patronisation (Haque 2009).
In 1967 it was handed over to the Cooperative Marketing Society. In 1973, soon after
the liberation, the Government of the People' Republic of Bangladesh initiated a
development project titled Cooperative Dairy Complex, based on recommendations
from the United Nations Development Program, the Danish Agency for Development
Assistance (DANIDA) and the Food and Agriculture Organization of the United Nations
(Jahan and Rahman 2003). Both dairies were amalgamated into the new project
named, Eastern Milk Producers’ Cooperative Union Ltd., was maintained until 1977.
Subsequently, it was changed to the Bangladesh Milk Producers’ Cooperative Union
Ltd. There were about 335 primary milk producers' cooperatives with a membership
of over 28,000 small and landless farmers around this plant area (Haque 2009). Milk
Vita owns the largest processing plant in the country and collects milk from 565
primary associations of milk producers, each comprising 60 to 80 members (Knips
2006).
In 1983, BRAC initiated a new livestock programme in Manikgonj. BRAC also offered a
package of services including credit, skill training, artificial insemination (AI) and
veterinary services to reduce the rate of animal mortality, improve the breed and
increase productivity (Halder and Barua 2003). Later BRAC initiated a dairy food
project under the brand name of Arong with the establishment of seven chilling centres
in the Sahajadpur, Pabna and Manikgonj districts with a total handling capacity of
27,000 litres per day (Halder and Barua 2003).
The project expanded to another five districts and 13 new chilling centres were
established in different districts of Bangladesh. Moreover, PRAN Dairy Limited, a sister
concern of the PRAN group, began to place more emphasis on its dairy sectors. In 2001,
PRAN established nine chilling centres (PRAN 2005). Table 2.2 provides a summary of
different plants established by BMPCUL based on year, capacity and distance from the
capital city of Dhaka. Table 2.3 shows the BRAC chilling facilities in different places at
different times. The next section discusses the scope of the dairy sector in Bangladesh.

15
Table2.2: Plants of the BMPCUL (Raha and Talukder 2004)
Location Distance from Dhaka
(km)
Nature of plant
Capacity/ Day
(Litre)
Date of installation
Mirpur Tangail Manikganj Takerhat Baghabari Rangpur Bhangura Lahirimohanpur Bhairab Raipur Natore Islampur Gabtali
10 100 90
190 125 300 155 155 75
208 265 211 185
Processing Chilling Chilling Pasteurisation Processing Chilling Chilling Chilling Chilling Chilling Chilling Chilling Chilling
110,000 10,000 10,000 25,000
162,000 10,000
5,000 10,000
5,000 10,000
5,000 5,000 5,000
May 1976 June1975
September 1975 December 1977
October 1993 December 1995
October 1999 November 2000
April 2001 February 2002
January 2003 May 2003 June 2004
Table 2.3: The BRAC Chilling Facilities (Halder and Barua 2003)
SL No.
Name of Chilling Centre (CC)
Year of Establishment
Handling Capacity (‘000 Litre/day)
1 Shahjadpur CC, Serajgonj 1998 6 2 Bera C & B CC, Pabna 1999 10 3 Bera CC, Pabna 1998 2 4 Sujanogor CC, Pabna 1998 2 5 Ataikula CC, Pabna 1998 3 6 Vhangura CC, Pabna 1998 8 7 Foridpur CC, Pabna 2000 10 8 Demra CC, Pabna 1999 6 9 Betila CC, Manikgonj 1998 2 10 Kawalipara CC, Manikgonj 1998 2 11 Birampur CC, Dinajpur 2001 2 12 Thakurgaon CC 2002 2 13 Amtala CC, Barguna 2003 2 2.2.3 Scope of the dairy sector
Dairy provides nutritional security by producing milk which is only one of many direct
products those farmers receive from dairy cattle rearing. Milk is used for child feeding
and in the preparation of dessert items, and meat is a source of protein (Halder and
Barua 2003). Dairy animals comprising cows and buffaloes are the major source of
drafting power. This reduces production costs in agriculture and can be considered as
indirect income (Saadullah 2011). Apart from their role in milk production, cattle
contribute as an important source of organic fertiliser by providing manure for crops.
They also contribute to the industrial sector by providing hide, skin, and bone as
industrial raw materials (Shamsuddoha and Edwards 2000). In addition, if attention is
paid to proper waste management, bio-gas can be produced (PRAN-RFL 2007).

16
The scope of dairy is very promising as 5.67 million tons of milk produced in the 2012–
13 fiscal years which is 46.32% more than 2011–12 fiscal year (DLS 2014).
Importantly, such milk production covers 91.03 mL/day or 32 litres/year/person
(ChartsBin 2015). This consumption is remarkably lower than the world average
consumption of 108 litres/year/person (ChartsBin 2015). The countries with the
highest milk consumption are Finland, Sweden, Netherlands and Switzerland where
people consume 361.19 litres, 355.86 litres, 320.15 litres, and 315.78
litres/year/person respectively (ChartsBin 2015). The following section discusses the
present status of the Bangladesh dairy industry.
2.3 PRESENT STATUS OF BANGLADESH DAIRY INDUSTRY
The following shows the present status of the Bangladesh dairy industry.
2.3.1 Bangladesh dairy at a glance
According to DLS (2005), the numbers of livestock in Bangladesh are estimated to be
22.6 million cattle, 1.06 million buffalo, 18.4 million goats, 2.38 million sheep, 164.1
million fowls, and 13.5 million ducks (cited in Bari,2008). Milk production was 2.27
million tonnes in 2006 (Haque 2009). Half of the milk is produced in the north of the
country (Hemme and Khan 2004). The four major milk sheds in Bangladesh are in
Tangail, Manikgonj, Baghabari (Sirajganj) and Takerhat (Madaripur). Hemme and Khan
(2004) estimate that 3% of the milk produced through formal channels (commercial
structured supply chain channels) of production and the remaining 97% are traded
by informal distributers. New entrepreneurs are becoming involved in small scale
dairy farming in urban and peri-urban areas (Saadullah 2011). Low productivity,
small scale and unorganised firms, inappropriate animal feeding, inadequate
infrastructure and the absence of professional management are the main
characteristics of this industry (Raha and Talukder 2004). Figure 2.1 shows milk
production and change from 1996 to 2010.

17
Figure 2.1: Milk Production and Change in Bangladesh (million tons)
(DLS 2012; Hemme 2010)
2.3.2 The development of the dairy industry in Bangladesh
The development of the dairy industry in Bangladesh has been inconsistent due to
natural, political and methodological issues, a failure to protect cattle from outbreaks
of disease and improper implementation problems (Rahman 2015). In Bangladesh, 10
million dairy cattle, including 4 million cross-breeds, produce 2.82 million tons of milk.
This is much lower than Pakistan, where only 5.5 million dairy cattle produce 25
million tons of milk (Raja 2001; DLS 2010; Hemme 2010). Bangladesh has doubled its
milk production in the past decade but the growth rate has fluctuated considerably due
to natural disasters, regular flooding and the severity of the monsoons (Uddin et al.
2011). The long-standing floods in 1998 and 2004 and the sidor (like a tsunami) in
2007 affected milk production drastically. Crucially, the nationwide prevalence of
anthrax during the last quarter of 2010 dramatically decreased milk production from
5.4% in 2009 to 0.7% in 2010 (Hemme 2010).
2.3.3 Dairy products and production in Bangladesh
The Bangladesh Milk Producers Cooperative Union Limited (brand name Milk Vita)
products include fresh milk, flavoured milk, butter, ghee, ice-cream and sweet curd.
The products of Arong (a concern of BRAC) include low fat fresh milk, flavoured milk,
butter, ghee, yogurt, UHT fresh milk and UHT flavoured milk. Basically dairy products
in Bangladesh can be categorised into two types:
a) Traditional dairy products: Traditionally milk is consumed in liquid form in
Bangladesh. Before consumption, milk is boiled to prevent spoilage and micro-
organisms (Jabbar 2010). Milk is also consumed in the form of curd and sweets and

18
clarified butter. Basically local sweet shops produce and sell the traditional dairy
products. The traditional dairy products of Bangladesh are shown in Figure 2.2.
Gulabjamun, Kalajam, Lalmohan, Kulfi (Sweets)
Kheer (Sweetened Dessert)
Khoa (Dehydrated Whole milk)
Whole Milk
Paneer (Cheese) Chana (Milk Solid) Dahi (Yogurt)
Variety of Sweets like Rosogolla, Rosmalai, Sandesh, Monda, Chanamukhi, Kachagolla,
ChamchamMakhan (Butter)
Ghee (Clarified Butter)
ConcentrateConcentrate
Ferment
Coag
ulat
eCoagulate
Figure 2.2: Chart of Traditional Dairy Products of Bangladesh (Shahnaz,
Shimazaki and Kato 2004)
a) Non-traditional dairy products: Among the non-traditional dairy products,
processed liquid milk, skimmed milk, milk powder, condensed milk, ice-cream, full
cream milk, flavoured milk and butter are the most common in Bangladesh. The
non-traditional dairy products are depicted in Figure 2.3.
Non-Traditional Dairy Products
Full Cream Powder Milk
Condensed Milk
Ice Cream Skimmed Milk Powder
Butter
Flavoured Milk
Processed Liquid MilkDairy Based Fruit Drink
Figure 2.3 Chart of Non-traditional dairy products of Bangladesh (Shahnaz,
Shimazaki and Kato 2004)

19
2.3.4 Factors influencing dairy sector growth
The growth of the dairy sector is influenced by many factors including technology
implementation and policy intervention. Technologies relating to feed, veterinary
services, and policy relating to investment in infrastructural development, technology
delivery and regulation of input and output markets, can alter the market situation
(Jabbar 2010). With respect to the dairy sector, Jabbar found that dairy farming is
affected by many factors. These include: i) Feed scarcity or poor quality of feed, ii) Poor
quality breed of cattle, iii) Frequent occurrence of diseases, iv) Shortage of technical
skills and limited knowledge, v) Lack of credit support and insurance coverage, vi)
Limited milk collection and processing facilities, and vii) Absence of proper market
information. Scarcity of cattle feed and poor quality of cattle feed results in low
productivity of cattle. Most of the farmers in Bangladesh are used to feeding their cattle
with crop residues and cereal by-products. A few dairy farmers produce Napier grass
and supplement it with broken rice, oilseed meals and other by-products. However, in
most cases this feed management is done in an unscientific manner and does not
improve productivity.
Milk collection and processing facilities are very limited in Bangladesh and milk
producers have very limited access to the market (Raha and Talukder 2004). An
assured market and a reasonable price for the dairy producers can significantly
contribute to stabilising the milk production and dairy sector development. Diseases
and parasites are a major concern for the dairy industry and can impede dairy sector
growth, but vaccination and veterinary services are poor and limited because of
budgetary constraints (Shamsuddoha and Edwards 2000). The animal health services
need to be developed and upgraded at every level by means of quality training
programmes. The development of sectoral growth depends on efficient and successful
marketing activities. The objective of any marketing programme is to physically
distribute products to consumers in an orderly manner so as to satisfy the customers
and ensure profit to producers and processors. Efficient milk collection and processing
facilities are needed for perishable nature of milk. Such facilities are rare in Bangladesh
to maintain high quality supply.
2.3.5 Cattle feed and feed management
Normally cattle are fed with agricultural by-products, mainly rice straw which
constitutes more than 90% of total cattle feed energy intake. As cattle fodder, shrubs,

20
tree leaves, tender shoots and twigs are also traditionally used in the village (Saadullah
2011). Everyday each head of cattle needs 8 kg of green grass and 2 kg of rice straw but
there is a deficit of more than 57.44 million tons of green grass and 0.17 million tons of
rice straw in Bangladesh (Jahan and Rahman 2003). During the dry season, Bangladesh
experiences a shortage of feed and especially quality feed. In the rainy season, plenty of
green grass grows on the river sides, roadsides and embankments, but surplus green
grass cannot be preserved due to a shortage of knowledge, technology and
infrastructure. Thus the cattle do not receive adequate feed as per their requirement
most of the year. Dairy farmers are recommended to feed 1 kg concentrate for 2-3 kg of
milk yield (Khan, Peters and Uddin 2009). The concentrate feed contain rice polish,
wheat bran and oil cakes, which are expensive. So small scale farmers cannot afford to
buy the required amount of concentrate. Some farmers of medium and large farms feed
concentrate regularly to their animals. Due to a shortage of knowledge, some rich
farmers feed their cattle concentrate adlibitum basis, which results in a lower
conception rate (Khan, Peters and Uddin 2009).
2.3.6 Cattle breed and breed management
Over 90% of the cattle in the country are of the indigenous zebu type and the remaining
10% are either pure breeds of Sahiwal, Sindhi, Holstein Friesian and Jersey or their
crosses with indigenous cattle (Khan, Peters and Uddin 2009). Indigenous cows are
usually characterised by low production of milk, short lactation and prolonged calving
intervals (Halder and Barua 2003). However indigenous cows also have some
favourable characteristics, including affordable maintenance cost, strong resistance to
local diseases and high adaptation to the local environment (Ghosh and Maharjan
2001). But these types of cows are not suitable for commercial farming because of their
low production rate. The Department of Livestock Services (DLS) has an extensive
artificial insemination (AI) network consisting of 22 District Artificial Insemination or
AI centres, 433 Upazilla AI sub-centres and 641 Union AI points using liquid and frozen
semen (Ghani and Rahman 2004).
2.4 CONTRIBUTION TO RURAL AND NATIONAL ECONOMY
In Bangladesh, dairy is a popular livestock sub-sector of the rural economy and a
powerful avenue for additional income. Thus dairy is an important and growing sector
of Bangladesh’s economy, and is increasingly proving to be a worthwhile livelihood
option for a large number of households engaged in milk production and trade. The
contribution of the livestock sub-sector and the agriculture sector as a whole to Gross

21
Domestic Product (GDP) is currently 3.2% and 19% respectively (BBS 2010). Table 2.4
shows that the livestock sub-sector contribution in 2012-13 was 2.45% of GDP while
the annual growth rate was 13.91% which was slightly down from the year 2008-09.
Furthermore, dairy generates more job opportunities in production, processing and
sales and marketing, particularly for the rural poor, many of whom regard livestock as
their only livelihood option (Bari 2008; Saadullah 2011). The small scale dairy also
contributes to the creation of employment opportunities for family members of the
entrepreneur which helps to reduce unemployment in the country. Likewise the dairy
sector contributes largely by offering sustained employment opportunities, particularly
for rural poor through income and employment generation.
Table 2.4: Contribution of the Livestock Sector to GDP
(Raihan and Mahmud 2008; BBS 2008)
Year 2000-2001 2005-06 2008-09 2012-13
GDP (%) 2.95 2.92 2.73 2.45 Annual Growth Rate 2.81 6.15 15.83 13.91
This sector also serves as a concrete tool in the development of the village level micro-
economy of Bangladesh by improving rural livelihoods and alleviating rural poverty
(Shamsuddin et al. 1987; Shamsuddin, Alam, Hossein, Goodger, Bari, Ahmed and
Hossain 2007). Between 1996 and 2006, the livestock sector accounted for 2.45% of
GDP and 15% of employment (Jabbar 2010). Small scale livestock farming provided
self-employment to approximately 3 million poor women during the years 1993–2002
(Karim et al. 2010). The livestock sub-sector contributed 3% of GDP in 2006, but this
amount doubles (i.e. 6%) when the indirect benefit of draught power, manure for fuel
and fertiliser is added to the direct economic output of meat, milk and hides (Haque
2009). Moreover, the dairy sector makes a considerable contribution to the agricultural
sector and also serves as a source of food (milk and meat) and industrial raw materials
(horn, hair and hide). The value of milk in the early protein nutrition of young children
cannot be underestimated as it provides good nutrition and resistance against disease,
and also supports the development of the child’s cognitive abilities.
The contributions of the dairy sector can be categorised in terms of three factors:
economic, social and environmental, as shown in Table 2.5. In summary, the economic
contribution of the dairy industry is high GDP, better export earnings and sources of
secondary income; the social contribution is poverty alleviation, protein needs,

22
employment generation and national health and nutrition; and the environmental
contribution is energy producing bio-fuel, biogas and the creation of biodiversity.
Table 2.5: Sustainable Contribution of the Dairy Sector
Economic Social/ Organisational Environmental
Higher GDP Higher export
earnings Source of
secondary income
Poverty alleviation Improvement of living
standard Contribution in fulfilling our
daily protein needs Employment generation Contribution to national
health and nutrition by providing fresh milk and milk products
Optimisation of available resources: energy for drafting, raw material in the form of wool, skins, bones, etc.
Optimisation of unused resources: cow dung for fuel and manure purpose, biogas
Biodiversity creation
Source: (Raha and Talukder 2004; Bari 2008; Halder and Barua 2003; Shamsuddoha
and Edwards 2000; Shamsuddoha 2009)
2.5 DAIRY SUPPLY CHAIN PROCESS
The dairy supply chain in Bangladesh is exclusively dominated by the informal private
sector. Only 3% of total production is processed and marketed through formal
channels. The remaining 97% is marketed by informal agents in raw form in the supply
chain (Hemme and Khan 2004). The dairy supply chain consists of various groups, each
performing a dedicated role at a relevant point in the chain. A chain of dairy producers,
collectors, middlemen, processors, traders/wholesalers/retailers, and consumers is
involved in transferring milk and milk products from producers to consumers
(Saadullah 2011). The party involved at each point is briefly mentioned in Table 2.6.
Table 2.6: Parties involved in Bangladesh Dairy Supply Chain
Type Description Dairy producers Rural home consumption farmers, rural dual purpose farmers,
commercial dairy farmers, & city and peri-urban milk producers Dairy collectors Goala, Paikers (wholesalers) milk collection centres and dairy
cooperatives Milk processors & producers of milk products
Gosh (who use milk for preparing sweet, curd and ghee) khoya makers, confectioners, pasteurising plants, UHT milk plants, chilling plants
Milk retailers Sweet shop, tea shop, restaurant, local hotel, urban hotel, grocery shop, super market, departmental store
Consumers Consumers of fresh milk, consumer of milk products, local consumers and urban consumers.

23
Feed, veterinary and animal health services, financial and artificial insemination
services play a vital role as links in this chain. There is an organised supply chain
network for the formal and large scale dairy industries in Bangladesh. The BMPCUL
and BRAC are the two leading dairy ventures in the country and they provide feeds,
vaccines, and AI services to the dairy farmers. The chain of milk marketing from
producer to consumer which is developed by the large scale dairy industries and the
cooperative societies is shown in Figure 2.4.
Milk Producers
Village Dairy Cooperatives Collecting, Weighing and Grading
Cooperative Processing Unit
Processing and Packaging
Transport
Marketing and Distributing
Consumers
Services Provided by Cooperatives/Milk
Processing Enterprises
Artificial Insemination and first aid facilities,
animal feed and veterinary services. In
Some Cases, Profit Sharing, Training of
Farmers and Supervision of Farming Activities are
also Provided.
Figure 2.4: Milk Marketing Chain (Saadullah 2011)
There are formal and informal sectors for processing and marketing dairy products in
Bangladesh. The processing and marketing systems differ between formal and informal
sectors. The formal sectors consist of public and private sector companies/dairy
cooperative such as Milk Vita, Arong, PRAN dairy, Rangpur dairy, etc. In the informal
sectors, there are different groups who are engaged in the trade of milk. Goala
(milkman) is the active player of this sector. Goala is the local term for milkmen who
collect milk from the farmers’ houses and sell it through door-to-door visits and to the
local market. There is also a group of people named Paikars (wholesalers) who buy and
sell milk in larger quantities on a regular basis by maintaining regular contact with the
large scale commercial dairy farms. Another group, who are called Ghosh, are also
associated with this sector. Normally Ghosh (retail milk seller) are engaged in
preparing milk products and sweets from milk. They buy bulk amounts of milk from
the Paikers. After collecting milk from the producers or local market, the Paikers

24
sometimes supply it to different chilling centres but this is limited only to selected
areas (Halder and Barua 2003).
In case of the formal sector of the dairy industry, there are organised collection,
processing and marketing procedures. Bangladesh Milk Producers Co-operative Union
Ltd (Milk Vita), BRAC (Arong), PRAN dairy, Rangpur dairy and some other private dairy
industries in Bangladesh have their own contact farmers in urban and peri urban areas
for processing, packaging and marketing activities (Saadullah 2011). Figure 2.5 shows
the dairy processing and marketing system in Bangladesh as described by Halder and
Barua in 2003.
Figure 2.5: Dairy Processing and Marketing System in Bangladesh
(Halder and Barua 2003)
2.6 RISKS IN THE DAIRY SECTOR OF BANGLADESH
Bangladesh dairy industries, especially small and medium scale industries, face
difficulties relating to insufficient supplies, poor technological adoption and low yield
at harvest. Small and scattered animal holdings, scarcity of feed and pastureland, and
limited availability of quality feed are major constraining factors, which generate risks
in commercial growth of the dairy sector. Frequent occurrences of diseases resulting in
high losses are also a risk factor. The country’s climate, along with the poor nutritional
status of cattle and limited coverage of veterinary services, are responsible for the

25
frequent occurrence of diseases. There are also limited credit and insurance services
support which is most important but unavailable for the dairy business.
Milk collection and processing facilities are also inadequate, along with an erratic
power supply which brings significant difficulties to the dairy supply chain and
generates huge financial losses, largely as a result of milk spoilage when milk cannot be
effectively chilled. Storage is another problem during peak seasons because the
majority of rural farmers do not have refrigerators. The absence of adequate and
appropriate transport to move milk from rural areas to urban markets is also a major
distribution risk to the Bangladesh dairy industry. This sector does not attract
adequate attention from researchers (Shamsuddoha and Edwards 2000). Although
dairy farming is an ancient occupation of the people of Bangladesh, this sector is not
free from risks. Different types of problems associated with this industry create
different risks in its different sectors. Problems which may create risks for the dairy
supply chain fall into three sustainability categories. These are shown in table 2.7.
Table 2.7: Risks to the Dairy Sector from Sustainable Perspectives
Economic Social/ Organisational Environmental
Inadequate credit facilities
Lack of organised market
Scarcity of land Scarcity of quality
feed High cost of feed Inadequate
transport facilities. Scanty adaptation
with modern technology.
Inadequate treatment facilities AI facilities
Shortage of professional staff
Inadequate public and private investment
Poor infrastructure facilities
Poor training facilities. Absence of proper
market information Heavy dependence on
imported products. Mismanagement of
staff Absence of research
centre Lack of fixed
government policy Involvement of
middlemen
Climatic change Repetitive occurrence of
diseases Natural disasters: flood,
heavy rainfall, storm, earthquake etc.
Pollution
Source: (Shamsuddoha and Edwards 2000; Bari 2008; Raha and Talukder 2004;
Halder and Barua 2003; Curtis 2011)
2.7 RISK MANAGEMENT STRATEGIES FOR DAIRY INDUSTRIES IN BANGLADESH
In Bangladesh livestock services are provided to farmers by different public sector
organisations, including the Directorate of Livestock Services (DLS), the Bangladesh

26
Livestock Research Institute (BLRI), a number of Non-Governmental Organisations
(NGOs) and cooperative societies such as Milk Vita. Different services are provided to
the farmers in order to mitigate or minimise the different risks associated with the
dairy industry. Table 2.7 categorises some of the risks in terms of three sustainability
aspects.
a) Breed management
Dairy farming in Bangladesh has been enhanced by improving local breeds of dairy
animals through artificial insemination services. Artificial insemination services are
provided by a number of organisations, including DLS, Milk Vita and BRAC. The BLRI is
also engaged in developing appropriate breeds to suit the local environment.
Additionally, they are involved in researching diseases and epidemiology of the bovine
population (PRAN-RFL 2007). Moreover, to foster rapid development in the dairy
sector, the government recently allowed the commercial import and distribution of
exotic breeds of cattle with subsidised credit (Islam et al. 2001).
b) Feed management
To improve dairy productivity, researchers and government officials need to give
special and immediate attention to issues of feeding and nutrition. Many commercial
farms in Bangladesh have their own feeding standards for dairy animals. These
standards vary among farms due to differences in breed, available feed resources,
financial ability and possible level of technology.
c) Financial services
Access to finance to enable farmers to expand their dairy production is complex. In
Bangladesh, some NGOs provide micro-credit which is highly valued by farmers. Under
this programme, farmers receive training to become eligible to obtain this credit for
rearing poultry, fattening cattle, milk cows, and goats (Jahan and Rahman 2003). So
beneficiaries are able to expand their business with the help of both credit and training.
d) Education and training programme
Farmers need training in animal care, housing management, hygiene practices, and
prevention of diseases, vaccination, de-worming, and resource utilisation for improved
productivity of safe milk. Particular breeds, especially highly productive breeds, need
very precise management for optimum output. In this regard, a joint effort of public-
private organisation is needed to educate and train farmers. The DLS (Directorate of

27
Livestock Services) has five training institutes which are primarily used to provide
basic knowledge about dairying. So far the DLS has trained 10,000 voluntary rural
workers in different types of package rearing (Islam et al. 2002).
e) Dairy Development Board
Considering the great potential for increased production of livestock products to meet
current market demand, the Bangladesh government has commenced various
measures, including the provision of institutional loans through the public sector,
extension services for breeding and raising cattle, and fostering commercial farms
(Shamsuddoha and Edwards 2000). The government has also developed a National
Milk Grid which identifies the surplus and deficit milk production zones and seasons so
as to improve milk quality and reduce seasonal variations in milk production and
consumption (PRAN-RFL 2007).
f) Technology adoption
BLRI has the authority to generate low-cost technologies to advance livestock
production, but since its establishment in 1985, it has failed to adopt suitable
technologies for the rural poor due to poor staffing and low motivation and
commitment of staff (Jahan and Rahman 2003). In contrast, DLS has introduced fodder
extension technologies by means of fodder nurseries at dairy farms and different
veterinary hospital compounds (DLS 1998). Through these nurseries, small dairy
entrepreneurs acquire most of the fodder genetic materials at a very low price to
established milk processing plant to balance the market demand and supply.
g) Improvement of extension services
The lack of effective livestock extension services is a well-recognised limitation to the
expansion of Bangladesh livestock production. Good extension workers try to utilise
every single opportunity to spread their messages using all the advances in
communications science that are available to them. These may include group talks,
farm demonstrations, posters and cartoons, leaflets and comic strips (Shamsuddoha
and Edwards 2000). In the private sector, most companies offer extension services to
their suppliers, but the government is still far behind the private companies when it
comes to offering extension services to encourage dairy development. The major
extension services provided by the DLS include entrepreneur development, feed
production, arrangement of training programme and technology development
(Saadullah 2000). The extension services of BMPCUL (Milk Vita) include Artificial

28
Insemination and veterinary services with a focus on improving the quality and
quantity of milk (PRAN-RFL 2007).
h) Animal health services and veterinary services
The most voluminous component of the DLS’s service is animal health protection and
veterinary services. These services are provided through a network of 464 Upazila
Veterinary Hospitals (UVH), nine regional diagnostic laboratories, seventeen district
diagnostic laboratories and one Veterinary Vaccine Production Laboratory (VVPL)
(Jahan and Rahman 2003). The VVPL produces the necessary vaccines to protect cattle
from contagious diseases like foot and mouth disease, Black Quarter, Anthrax,
Haemorrhagic Septicaemia and so on. The different veterinary services used by the
dairy producers include vaccination, clinical assessment, internal parasite control, bull
services and so on. DLS and BMPCUL provide various veterinary services (Islam et al.
2002). The Upazilla Veterinary Hospitals (UVH), each of which is staffed with 3 to 5
Veterinary Field Assistants (VFA), one Upazilla livestock officer, one veterinary
surgeon and one compounder, works as the nucleus of DLS activities at grass roots
level. Besides these, 20 national and 150 local NGOs are engaged in delivering services
related to disease protection, as well as some output services (Jahan and Rahman
2003). Moreover, there are about 25 pharmaceutical companies engaged in the
manufacture or import of livestock drugs, vaccines, sera, premix and vitamins (Jahan
and Rahman 2003).
The above sections of the thesis provided an account of the Bangladesh dairy industry
and its status in terms of present conditions, scope and risks associated with the
industry. The following section presents details of the case dairies used in this
research.
2.8 THE CASE DAIRY DESCRIPTION
This section introduces two well-known Bangladesh dairy farms which are used as
case studies in this research, and presents details of their history, market share, vision,
production, supply chains, products and the technologies used in their operation.
2.8.1 THE CASE DAIRY FARMS
The two dairies, Nahar Dairy and Paharika Dairy, were selected on the basis of their
production capacity, usage of modern technology and scientific dairy management.
They are briefly described below.

29
2.8.2 NAHAR DAIRY
Nahar Dairy is a sister concern of the reputed ‘Nahar Agro Group’. They also have one
of the largest and best organised poultry parent stock (PS) farms in Bangladesh. At the
same time, they own one of the biggest dairy units in Bangladesh. Many sources
confirm that Nahar Dairy is the largest milk producing farm in Bangladesh. Neither
farm produces more than 2,500 (maximum 3000) litres milk in a day (Rahman 2015).
Figures 2.6 and 2.7 show the physical locations of both farms using Google Earth. The
map shows their location close to the Dhaka–Chittagong highway but isolated from the
populated areas. Such a place is ideal for the dairy farming. They have chosen isolated
and grassy areas to protect against possible disease outbreaks. All of the dairy sheds
are environmentally controlled so that no wild species can enter and carry diseases. All
farm employees live on the farm and a strict no-visitors' policy is enforced.
The Nahar Dairy farm was founded in the beginning of 1990s. It was initially a family-
owned farm, having a cluster of 35 cattle. They have invested one million Bangladeshi
Taka1, which is equivalent to AUD $14,500 (approximately). For around ten years they
had a maximum of 55 cattle, worth AUD $30,000, and produced 250 litres of milk per
day. In 1999, Nahar Dairy restructured their farm with the introduction of bigger lands,
capital and logistics. At present, they have 560 cattle of all kinds with 2,600 to 3,000
litres of milk production a day. Their vision for 2020 is to improve their milk
production capacity to around 8,000 litres per day. At the same time, they have
incorporated an additional 50 acres of grass land to supply their cattle with healthy
and organic feed. They also added chiller facilities holding 3,000 litres to preserve their
milk for 8-12 hours. They have expanded their farm to three different locations to rear
cattle scientifically and have developed their supply chain network to maintain proper
supply.
1 Taka= Name of Bangladesh Currency

30
Figure 2.6: Satellite Image of Nahar Dairy (Unit 1), Source: www.maps.google.com
Figure 2.7: Satellite Image of Paharika Dairy, Source: www.maps.google.com
2.8.2.1 Historical background of Nahar Dairy
Nahar Agro Group Limited is an agro-based company. It started its operations in 1986
with a small-scale dairy and poultry rearing. It is now a group of companies that

31
consists of almost every type of agro-based and livestock business. Poultry, dairy,
fisheries, livestock wastage by-products and commercial fruits and vegetables are their
main businesses. Of these, poultry has been their highest investment project since
1995. Nahar Agro Group is ranked first in individual milk production and is in the top
seven in the production of poultry day-old chicks in Bangladesh (Rahman 2015).
Nahar Agro Group Limited is a family-owned company that started operations in 1986
with 35 laying hens and 15 dairy cows. The initial investment was around AUD $3,000.
The present business worth is around AUD $15 million dollars, excluding other
associated businesses. The main initiator of this small business operation was the late
Tipu Sultan Mahbubur Rahman, who had been an ex-officer of Bangladesh Railway
since 1963. After his death in 1994, his wife, Shamsun Nahar, and two of his sons
followed him, inspired and motivated by his example of conducting livestock and agro-
based business, not only for the sake of their own profit but also for the benefit of the
country. His eldest son, Mohammad Rakibur Rahman Tutul, was the most motivated.
He became an outstanding entrepreneur. His younger brother, Dr. Mohammad
Shamsuddoha (Doha) (Professor of Marketing, University of Chittagong), always
backed them with knowledge, time and hard-working attitudes. They started adding
new concepts (technology, dynamic ideas, and risk measurement) to their farming
procedures, along with high technology from the USA, France, China, Thailand, India,
and Canada. At the same time, they managed to get bank finance to develop their new
projects and that helped their business to flourish.
2.8.2.2 Vision
The vision statement of Nahar Dairy states that they want to be a market leader
through achieving sustainability and introducing hi-tech concepts into their existing
operations. Initially, they just started their business and did not think too much about
the impact of hi-tech, analysis of the supply chain or sustainability. Now, they are trying
hard to incorporate such knowledge into their farming operations so that they can
achieve sustainability and stability, gain a larger share of the market, and become a
market leader.
2.8.2.3 Market share
Table 2.8 shows the average milk production of the two case dairies from 2010 to
2015. It shows that Paharika Dairy produced more milk in 2010 than Nahar, but

32
recently, Nahar Dairy has more than doubled Paharika’s production, using appropriate
management.
2.8.3 PAHARIKA DAIRY
Paharika Dairy was founded at the beginning of 1996 as a private limited commercial
farm. They started with around 200 cattle and produced 700 litres of milk per day.
They have invested six million Bangladeshi Taka2 (approximately) which is equivalent
to approximate AUD $103,000. This money is to maintain milking machines, chiller
machines, transport and science sheds and management. They have slowly expanded
their farm. At present, they have 352 cattle of all kinds producing a maximum of 1,300
to 1,500 litres of milk per day.
Nowadays, it has dropped down to 1,000 litres, but they expect to restore their
production within a year. Unfortunately, they lost momentum when they failed to
expand their farm like Nahar Dairy. Although they have amalgamated 30 acres of
grassland to supply their cattle with healthy and organic feed input and also added
chiller facilities for 1,000 litres to preserve their milk for hours at a time in the
summer, they still confined their farm within the same place to maintain their modest
scientific farm. Paharika Dairy has also developed their supply chain network.
2.8.4 COMPARISON BETWEEN THE TWO DAIRY FARMS
Nahar started their farm six years earlier than Paharika but it was on a small scale
under family supervision. Although Paharika initiated their farm later than Nahar, they
began with a more structured approach. Interestingly Nahar re-launched their farm in
1999 with a huge investment, better management and greater capacity. They have set
their visionary targets for expansion and are meeting their targets. Unfortunately,
Paharika is getting little sluggish due to its awkward location, poor management and
less investment. Nevertheless, both are maintaining their farms in more scientific and
hygienic ways than the other farms in Bangladesh. Table 2.8 shows the average milk
production for both dairies from 2010 to 2014. It is observed that Nahar Dairy is well
ahead of Paharika Dairy in terms of milk production per day.
2 1 Australian Dollar (A$) = 57.79 Bangladeshi Taka, July 12, 2015,
http://www.oanda.com/currency/converter/

33
Table 2.8: Average Milk Production of Case Dairies
Table 2.9 shows the distinctive features of the two case dairies in order to highlight the
differences between them. Some distinguishing features include milk production,
competitive advantages, locations, suppliers, number of livestock, number of
employees and number of milk sheds. Both farms help each other if required. They
have a strategic relationship in light of profit and service maximisation for quality
output. It is apparent that Nahar Dairy is much further ahead than Paharika Dairy in
terms of their average milk production.
Table 2.9: Distinguishing Features of Nahar and Paharika Dairy Farms
Subject Nahar Paharika Size (No. of employees)
55 32
Time period 1990-till date 1996-till date Number of livestock
560 352
Production 2600L-3000 L/day 1300L-1500L/day Supply Feni based (Urban area)
- Madhumela - Bonoful - MilkVita
Chittagong based (Rural area) - Bonoful - Local consumer
Vision 8000 litre within 2020 ----- Competitive advantage
Strategic location ( near highway) 75%-80% breed upgradation More grass/land availability 2 veterinarian
Bio-security- high 70-90% mechanised milking but
100% capacity
Country side location/ rural area 50%-60% breed upgradation Less grass/ land availability
1 veterinarian Bio-security- low 50-60% mechanised milking but
70% capacity Chiller capacity 2500-3000 litre 1000-1350 litre Milk shed 3 (Olinagar, Chakoria,
Mirarsharai) 1 (Fatikchari)
Year Nahar Production litre (average) Paharika Production litre
2010 670 720
2011 877 770
2012 1522 1184
2013 1928 1232
2014 2630 1355

34
2.8.5 SOURCES OF CATTLE BREED
Initially, Nahar Dairy imported their breeds from different countries including France,
USA, Canada, and Australia. Currently, they are close to self-sufficient in terms of breed
management for future cattle. On the other hand, Paharika Dairy is also trying to be
self-sufficient in breed management, but they are also receiving help from government
AI centres and strategic alliances/partners like Nahar Dairy. Table 2.10 presents a list
of ten breeds and milk producing companies in Bangladesh. Among them, Nahar Dairy
is positioned at the top while Paharika Dairy is in third position on the list. Table 2.10
also provides information about the breeds which are being reared by the different
companies in Bangladesh. Most of the companies are relying highly on the Holstein-
Friesian and Sahiwal cross breed. They all try to improve their genetics although
creating alliances between scientific farms, government livestock and artificial
insemination centres.
2.8.6 FARMING UNDER DIFFERENT CALAMITIES
Bangladesh dairies face a huge number of calamities in their operations, including
natural and man-made/controlled calamities. Dairy diseases and natural disasters may
be categorised as natural calamities whereas over/under production, market demand,
government policy and competitors’ actions are man-made calamities. Bangladesh is a
densely populated country having small area of land for living and cultivation and this
disadvantage hinders the growth of the dairy industry in Bangladesh. Moreover, there
are no specific industrial policies to isolate dairy zones from the community.
2.8.6.1 Dairy disease
The direct and indirect socio-cultural and economic impacts of disease outbreaks
influence policy measures and disturb markets, causing the loss of assets. There are
strong negative impacts on the livelihoods of rural communities for all producer
groups including small holders. Risk assessment at different points along the supply
chain and guidance on measures for safe dairy production are therefore of great
importance. Specific consideration should be given to strategies and measures that
ensure a sustainable approach to support the poor. Dairy diseases can contaminate the
community or market place through ignorant behaviour associated with waste
management and improper vaccination. The Bangladesh dairy industry is losing
millions of dollars every year due to various kinds of common disease. There is also a
fear of mad-cow disease, although there is no evidence of mad-cow disease in
Bangladesh.

35
Table 2.10: Breeds and Milk Collection of Bangladesh (Chowan 2015; Shamsuddoha 2015)
SL No.
Name of Milk Collection Organisation
District Type of
Organisation Tentative Milk Collection
Per Day (Litre )
No. of Milking Cow
(App.)
Avg. (Litre)
Total Cow
Name of Dairy Breed
1 Nahar Dairy Chittagong Private 2550 To 2850 205 12.56 538 Holstein-Friesian cross and very few number of Sahiwal cross.
2 GUK (Gram UnnonKormochuci)
Bogra NGO 1025 To 1060 81 12.9 152 Holstein-Friesian cross and Jersey cross
3 Paharika Farms Chittagong Private 900 To 1050 105 12.3 352 Holstein-Friesian cross and Jersey cross
4 Molla Dairy Chittagong Private 950 To 970 70 13.7 180 Holstein-Friesian cross and Sahiwal cross.
5 Saver Dairy Shaver, Dhaka
Government 710 To 750 150 4.87 1400 Holstein-Friesian cross and Sahiwal cross, Jersey cross and also meat type Bramaha
6 HosanSoudagor Chittagong Private 280 To 290 30 9.5 60 Holstein-Friesian cross and Sahiwal cross
7 Akiz Dairy Chittagong Private 260 To 280 61 4.4 250 Holstein-Friesian cross and Sahiwal cross
8 Reduan Dairy Chittagong Private 250 To 260 21 12.1 48 Holstein-Friesian cross and Sahiwal cross
9 M/S ShaAmanot Chittagong Private 240 To 250 21 11.7 42 Holstein-Friesian cross and Sahiwal cross
10 Khamer Dairy Chittagong Private 190 To 210 18 11.1 50 Holstein-Friesian cross and Sahiwal cross
Total 6455 6670 657 10.0 2720

36
2.8.6.2 Natural disasters
Bangladesh is a low-lying, riverine country located in South Asia with a largely marshy
jungle coastline of 710 km (441 miles) on the northern littoral of the Bay of Bengal.
Formed by a delta plain at the confluence of the Ganges (Padma), Brahmaputra
(Jamuna), and Meghna Rivers and their tributaries, Bangladesh's alluvial soil is highly
fertile, but vulnerable to flood and drought. In a report entitled “A Global Report:
Reducing Disaster Risk: A Challenge for Development”, the UN Development
Programme (UNDP) identified Bangladesh as the country most vulnerable to tropical
cyclones and the sixth most vulnerable to floods (UNDP 2009).
According to data from the government’s Centre for Environmental and Geographic
Information Systems (CEGIS), two-thirds of the country is only five metres above sea
level, rendering it particularly vulnerable to sea level rises and tidal waves
(www.cegisbd.com). Experts opine that melting Himalayan glaciers and an encroaching
Bay of Bengal in the south further increase the risk of flooding (IRIN 2013). Natural
disasters hamper various kinds of businesses every year in Bangladesh and the dairy
industry is no exception. Market demands and supplies are completely susceptible to
natural disaster. If a massive flood occurs, huge numbers of dairy farms have to cease
production due to their farm areas and grasslands being under floodwater. Farmers
who have no insurance cover lose their capital forever. Thousands of farmers are never
able to farm again due to inadequate further sources of finance to recommence their
farming. Others somehow manage to obtain funds from financiers, friends, or personal
loans with high interest. In this way, some have success and some do not. Nevertheless,
most of those who carry on their business despite the vicissitudes of calamities,
ultimately achieve success in terms of profitability.
2.8.6.3 Underproduction
Under production is one of the main problems for the dairy industry of Bangladesh.
Dairy production is a business which is always controlled by the natural cycle of cows
giving birth to calves. The natural cycle determines the milk production cycle and it
cannot be manipulated. When a farm forecasts future production, they make plans to
ensure that forecasted production will become a reality in the near future. Once
milking starts, it must be carried on, as no one can stop its production. This is the
reason behind under production based on market volatility. Market volatility is
influenced by trends in the consumption of milk and milk related products.
Consumption is, in turn, linked to seasons, festivals, and the frequency of social

37
activities like marriages, birthdays, and post-marriage parties. Dairy disease also
influences market volatility, as disease break outs make people panic, resulting in
drastic falls in milk related product consumption.
2.8.6.4 Government policy
Recently, the government failed to take proper initiatives to control existing market
supply and demand and that created an imbalance in the market. The most suicidal
decision taken by the government has been to invite foreign companies to do business
in the local market. This kind of decision hampers the ability of local entrepreneurs to
do profitable business. Local companies are now really struggling to compete with
foreign companies in terms of capital, technology, and market coverage.
2.8.6.5 Market demand
The dairy industry in Bangladesh is not expanding sufficiently to meet the increasing
demand for milk and dairy products. Between 2001 and 2011, Bangladeshi milk
consumption doubled to 44 millilitres per capita per day (TheDairySite 2013). The
production situation has improved slightly but not enough to meet expected target.
Therefore, demand is not a major concern. Rather, the concern is to concentrate on
production increase and the conversion of milk into milk related products like butter,
yogurt and so on.
2.8.7 TECHNOLOGIES USED IN DEVELOPED COUNTRY AND CASE FARMS
There are many types of dairy equipment necessary for successful dairy farming.
Entrepreneurs are interested in becoming involved with this business as there are
huge opportunities for profit. The demand for dairy and dairy related products is
increasing day by day. It is always necessary to have modern equipment and
technologies to carry out effective and efficient farming and to achieve maximum
output in order to serve the community and the country. Scientific management of
housing, grass areas, feeding habits and others are briefly described below:
2.8.7.1 Housing
Appropriate dairy housing is necessary for healthy cattle and high standard milk
production. The different kinds of dairy house may include a concrete house, a sealed
house with controlled temperature, a roofed shed with no walls, a roofed shed with
minimum height walls, and a completely open field with no roof and no walls. The
roofed shed with minimum height walls is a popular variation in Bangladesh. They

38
maintain a moderate temperature by using curtains in the vacuum space in winter and
electric fans in summer. Although the standard space required for a cow is around
eight or nine square metres, many farms can only provide four or five square metres.
Some farms do not have any grassland; they just bring grass in from outside and serve
it in the confined housing space. A few more modern farms have separate spaces for
resting and grassing their cattle. Interestingly, the findings revealed no evidence of
cattle being reared only in grassland. The important things to consider before
preparing cattle sheds are sufficient air, light, optimum temperature, adequate feed
with grass and enough water to drink all the time.
2.8.7.2 Milking machine/milk parlour
Filipovic and Kokaj (2009), in a study conducted in Croatia, compared the effects of two
different milking methods (hand vs. machine milking) on milking time, milk yield, milk
composition, somatic-cell-count (quality of milk) and micro-organisms (bacteria and
archaea test) in milk. They found that the average milk yield per milking was
significantly higher (5.06 vs. 3.69 L, P<0.05) and milking time was significantly shorter
(4.42 vs. 6.05 min, P<0.05) with machine rather than hand milking. Differences in milk
composition (fat, protein and lactose contents) using different milking methods were
not significant (Filipovic and Kokaj 2009). The average value of somatic-cell-count
(SCC) was much higher (65%) in milk from hand milked rather than machine milked
cows, but the difference was insignificant due to the excessive discrepancy of the
values. The average value of micro-organisms was considerably higher (P<0.05) in milk
from hand milked cows (Filipovic and Kokaj 2009). Therefore, for these reasons,
experts do not recommend hand milking. The case dairies use a mix of hand and
machine milking due to inadequate finance and lack of knowledge. But the case dairies
determine to raise enough finance to cover 100% automatic milking within a few years.
2.8.7.3 Chiller
A chiller is a reservoir for holding milk for a particular time to prevent it from
perishing. Both the case dairies have chiller but not sufficient to their needs. Nahar
Dairy has a chiller of 2,000 litre capacity whereas Paharika Dairy has only a 1,200 litre
capacity chiller. Both farms have plan to increase their capacity as their existing chiller
capacity is not enough to save their milk from different uncertainties like political
unrest or natural disasters.

39
2.8.7.4 Nutrition analyser
In the case of dairy farming systems, it is essential to maintain a nutrition analyser to
measure the required nutrition intake for the cows. Herds of different ages need
appropriate nutritional intake to deliver the best results in providing milk and meat.
Both case dairies use conventional way of analysing nutrition rather than investing
more money to adopt the latest analyser.
2.8.7.5 Flooring
Neat, clean and dry floor keeps the cattle herd healthy. So farmers are always trying to
keep their floors appropriately hygienic. Indoor farming methods use scratchy brick or
concrete floors with a soft artificial bed.
2.8.7.6 Others
The case dairies try to combine local and imported semen so that the next generation
can be grown as higher breeds, along with better productivity and less disease.
2.9 SUMMARY
This chapter discussed two different aspects of Bangladesh dairy operations and
provided descriptions of the research case studies. The first seven sections of the
chapter described the existing status, trends, scope, and contributions of the
Bangladesh dairy industry. It revealed the importance of the dairy sub-sector for the
Bangladesh economy and its people. The second part of the chapter presented the
research case dairies in light of their mission, vision, market share, products, current
production, and technologies for maintaining sustainable farming. The discussion also
included reference to the various calamities and factors which need to be addressed for
successful farming. The next chapter presents a review of the literature on this topic.

40
CHAPTER 3: LITERATURE REVIEW
3.1 INTRODUCTION
This chapter reviews the literature related to the research topic. It focuses on literature
explaining sustainability, dairy supply chain, supply chain risk issues and supply chain
risk management. Different sections of this chapter reveal the gaps in the extant
literature. This not only informs the current research but also reveals differences
between previous research and the current study and confirms the significance of the
study. The chapter shows that there has been a dearth of research conducted on dairy
supply chain risk management based on sustainability issues. The chapter also
describes contingency theory and sustainability theory, both of which are used as
theoretical bases to explicate various concepts in the study. This chapter concludes
with the construction of a dairy supply chain risk management model.
3.2 WORLD DAIRY INDUSTRY
The dairy industry is an important and dynamic part of the global agricultural
economy. Due to the rapidly increasing demand for dairy products, the global dairy
industry has flourished in recent decades. But the rapid growth and development of
this industry has been beset by a series of problems associated with milk production,
processing, distribution and profit allocation (Cross 2006). The worldwide demand for
milk and milk products has increased in response to the rapidly increasing population.
Recently the private sector has made a large scale investment in dairy production and
processing (Godfray et al. 2010). In spite of having different policies to attract private
investment into the dairy sector, many hindrances significantly influence the dairy
sector in negative ways. The basic concern is that, in most countries, the dairy sector is
still unstructured and underutilised. As noted by Vivien Knips (2005), dairy industries
all over the world are facing different types of challenges and these are forcing them to
reconsider and adopt different strategies. The challenges are related to the growing
demand for dairy products, an increasing number of customer requirements, limited
market opportunities and the like. The literature also reveals that dairy companies are
handling a growing number of consumer necessities, in combination with growing
customer power, in a market where the food processing and food service industries are
key customers for dairy products.

41
In India, in response to competitive forces, the dairy cooperatives of different states
have started to work in an integrated way by practising supply chain management
(SCM). This practice includes inventory management, procurement of milk supplies,
logistics and distribution management. Organisations are struggling to overcome the
different risks that arise from the immense competition for existing customers (Mishra
and Shekhar 2011). The industry is engaged with several stake holders’ including milk
producers, transport authorities, processors and consumers from rural to urban areas
involved in processes like storage, transportation and pasteurisation. With the
involvement of so many stakeholders, the system is at risk of being disrupted at
various times over the course of its operation. The dairy industry is also confronted by
some common constraints like low productivity of cattle, limited processing facilities,
limited coverage of veterinary services, improper milk cooling infrastructure, poor
road infrastructure, poor quality of milk and seasonal and price variability of milk
(Choudhary et al. 2011).
Figure 3.1 shows the world's major cow milk producers in 2013. The United States
ranked first having a milk production (cow) quantity of about 91.27 million metric tons
(Statistica 2014). The following is a description of each of the world’s leading milk
producing countries.
Figure 3.1: Major Producers of Cow Milk Worldwide in 2013, by country
(in million metric tons) (Statistica 2014)

42
3.2.1 USA dairy
The US dairy industry produces10% of the world’s milk, with noteworthy structural
modification over the past eight years (IUF 2013b).The USA produces around 90
million tons of milk per year. This is generated from 78,000 dairy farms with average
dairy herds of 115 cows producing approximately 23 litres per cow (Statistica
2014)(www.thecattlesite.com). Since 1975,the USA has achieved a steady growth of
1.1% per annum, determined by revenue growths of 1.5% and a 0.3% reduction in the
number of dairy cows (8,400 litres per cow/year) (www.thecattlesite.com). It is
observed that Southeast Asia, Mexico and Canada remained the major destinations for
US dairy products, whereas Canada, New Zealand and Italy are the top three countries
retailing dairy products to the USA with the support of its dairy policy (Kress, Miller
and Koehler 2010). The US dairy policy has five main components: Dairy Product Price
Support Program; Federal Milk Marketing Orders; the Dairy Export Incentive Program;
direct payments under the Milk Income Loss Contract (MILC) Program; and tariff‐rate
quotas on dairy imports (IUF 2013b). Dairy cooperatives also play a major role in the
US dairy industry (IUF 2013b). Although the volume of milk production per capita is
high, the USA does not always receive a high ranking due to the fact that it has a smaller
population than India, Mexico and whole EU union. After that, the USA and Canada are
the leading milk producing countries with sophisticated technology and methods for
rearing and producing diversified dairy related products (Thornton 2010).
3.2.2 India dairy
India is one of the world’s largest milk and dairy products producing countries by
volume, although it consumes almost all of its own milk production. Prior to 2000,
India failed to export any of its dairy items although it also did not import such items
from other countries (IUF 2013a). However, since 2001, India has become a net
exporter following the implementation of its Operation Flood Programme (IUF 2013a).
In India, 65% of milk comes from buffaloes with 113 million head of cattle/buffaloes
and 75 million dairy farming households each having an average of 1.5 adult female
cows or buffaloes per farm (www.thecattlesite.com). Although India is a promising
country in terms of dairy production, it suffers from various problems associated with
environmental impacts, waste management, proper technology, effective methods of
producing dairy products and improper guidance for exports (Patankar, Patwardhan
and Verbong 2010).

43
3.2.3 China dairy
The people of China drink more milk and consume more dairy products today than
ever before (Wang, Parsons and Zhang 2010). Figure 3.1 shows that China produced
35.31 million metric tonnes which makes it the third highest producer in the world,
after having secured fifth place in 2005. China is probably going to secure second
position next year (Simpson 2006). Most of its milk goes to formal processing centres
to be reprocessed into dairy products. Chinese dairy farms can be categorised into two
groups: small farms with 1 to 40 cows and large farms with more than 200 cows having
local collection point (www.thecattlesite.com). China is also a huge importer of dairy
products as it can only fulfil 86% of its own milk requirements (Du et al. 2002). At the
same time, the Chinese dairy industry is also suffering from various difficulties related
to productivity, structural problems and efficiency in Chinese dairy farms (Wang and
Yu 2012).
3.2.4 New Zealand dairy
New Zealand is one of the world’s largest exporters of dairy products, representing
one-third of the international dairy trade each year (Dobson 1990). Its farmers do not
receive any subsidies but have low-cost, high productivity farming systems (Dobson
1990). Recently, New Zealand produced 18.8 million tons of milk which is equivalent
to 20% of USA milk production. This was produced by 12,300 dairy farmers with
average dairy herds of 315 cows yielding 3,526 kg/day (or11.2 kg/cow)
(www.thecattlesite.com). It exports about 95% of its milk production and, with 15
million tons export volume. New Zealand is the world’s largest exporter of the
commodity. Simultaneously, New Zealand dairy is facing challenges associated with
cattle health, environment, water contamination and others (Chesterton et al. 1989).
3.2.5 Australia dairy
According to Collard and McElhone (2014), 6,700 Australian dairy farmers produce 9.2
billion litres of milk a year, having a value of AUD $4 billion with the investment of AUD
$13 billion. Australia is one of the countries that export dairy products around the
world. It is a country with diversified farms, as well as manufacturing and export
industries. Importantly, the Australian dairy industry directly creates employment for
Australians on farms and also employs more than 100,000 Australians in associated
factories and service industries (Collard and McElhone 2014). Conversely, the
Australian dairy industry is also suffering from lack of appropriate research, progress

44
and extension, market access, health, nutrition, and efficient people, as well as supply
chain and policy issues (Collard and McElhone 2014).
3.2.6 Bangladesh dairy
Bangladesh Dairy production systems are similar to systems in Pakistan and India.
However, milk production and yields (2.8 million tons ECM from cows and buffaloes,
and 711 kg of ECM per cow/per day, respectively) are significantly lower than those of
other sub-continental countries like India and Pakistan (www.thecattlesite.com).
The major proportion of the milk is consumed by farming households or sold on to the
informal market, and less than 20% is delivered to formal milk processors (Hemme
and Khan 2004). At the same time, per capita milk consumption is around 32 kg/year.
It is observed that Bangladesh is 85% self-sufficient in milk and imports 0.4 million
tons per annum from other dairy developed countries. Bangladesh, like other dairy
producing countries, is facing the multi-faceted challenges associated with this
industry.
3.2.7 Other dairy countries
In Uganda, dairy is a vital and rising sector of the economy. It is gradually proving to be
a productive livelihood option for a number of people dealing in milk production and
trade. Choudhary et al. (2011) describe the Ugandan dairy industry as comprising both
subsistence and commercial farming systems. More than 90% of farmers practise
subsistence farming whereas less than 10% practise commercial farming. Their report
also reveals that the future prospects of the Ugandan dairy industry are bright, with
stakeholders investing enough interest and effort to make the dairy business profitable
for all. But for this effort to be successful, it is necessary to identify and mitigate risks
and most of the farmers in the different regions are already doing this. Coudhary et al.
(2011) also highlight the different risks associated with the Ugandan dairy supply
chain and describe some of the coping mechanisms used to mitigate the identified
risks.
Livestock is an important component of the rural economy of Bangladesh which is
basically based on agriculture. The livestock sector has an important place, not only in
the economy of Bangladesh, but in the economies of most South Asian countries. The
dairy sector of such countries as India, Bangladesh, Nepal, Sri Lanka and Pakistan is
characterised by small scale, unorganised animal holders; inadequate basic
infrastructure and transport facilities; low productivity; and shortage of skilled

45
management (Singh and Pandir 2001). Dairy farming is a popular and ancient
occupation in the rural areas of Bangladesh, but its development is subject to a number
of risks (Nasir, Shamsuddoha and Quaddus; Nasir, Quaddus and Shamsuddoha 2014).
At the same time, the Bangladesh dairy industry suffers from a lack of relevant
information, modern breeding systems, feeding, management, diseases and marketing.
To address the industry’s current problems effectively, it is necessary to assess the role
of market failures and of government policies and their contribution to rural poverty
(Shamsuddoha and Edwards 2000). Appropriate research and policies can contribute
to solving these problems.
3.2.8 Comparative study on dairy production worldwide
Table 3.1 compares the top ten countries for cow, sheep and goat milk in a year. It is
evident that the USA ranks first in cow milk production whereas China and India have
the same position in sheep and goat milk respectively. Interestingly, Bangladesh
secured second position in goat milk production, which means they have great
prospects in this sub-sector. Highest production does not mean highest availability and
consumption, as it depends on a country’s population, consumption habits and milk
affordability. The above discussions have clearly shown that most dairy developed
countries have some problems and challenges to deal with, and Bangladesh is no
exception. This research seeks to identify the related problems and risks and to identify
ways to mitigate them appropriately. The next section deals with supply chain, supply
chain risks and supply chain risk management.
Table 3.1: Production Worldwide (FAOSTAT 2014)
Rank Country Production Rank Country Production Rank Country Production
1 United States 90,865,000 1 China 1,580,000 1 India 4,850,000
2 India 54,000,000 2 Turkey 1,010,007 2 Bangladesh 2,608,000
3 China 37,419,500 3 Syria 703,008 3 Pakistan 779,000
4 Brazil 32,304,421 4 Greece 699,500 4 Mali 715,000
5 Russia 31,576,047 5 Romania 650,912 5 France 624,016
6 Germany 30,506,929 6 Somalia 615,000 6 Somalia 500,000
7 France 23,983,196 7 Spain 552,517 7 Spain 443,625
8 New Zealand 20,053,000 8 Iran 465,000 8 Greece 407,000
9 Turkey 15,977,837 9 Italy 406,177 9 Turkey 369,429
10 United
Kingdom13,884,000 10 Algeria 336,000 10 Niger 288,974
Top ten goat milk producers
(Metric Tonnes)
Top ten cow milk producers
(Metric Tonnes)
Top ten sheep milk producers
(Metric Tonnes)

46
3.3 SUPPLY CHAIN RISK AND SUPPLY CHAIN RISK MANAGEMENT (SCRM)
This section discusses the concepts of supply chain, supply chain risk and supply chain
risk management (SCRM).
3.3.1 Supply chain
Supply chain is a popular term in business and academia due to its relevance for the
processes of forward and reverse logistics to accomplish the tasks required to make
substantial profits(Lambert and Cooper 2000; Mentzer et al. 2002; Wisner, Tan and
Leong 2015). A number of clarifications and delineations of the term are available in
various academic writings. The most simple definition is: the supply chain is a process
that starts from managing raw materials, and continues through the relevant
suppliers, retailers, and other parties who provide services to the customer (Cox,
Blackstone and Spencer 1995) and different points of consumption (Svensson 2007),
culminating with the final consumer. Essentially, the supply chain is an amalgamation
of numerous parties and processes that include raw material collection (backward),
production, and forward progressions within a business firm to accomplish its daily
chores (Shamsuddoha 2014). A supply chain comprises every step involved in
producing and distributing the ultimate product, on or after the supplier’s supplier to
the customer’s customer (Cooper, Lambert and Pagh 1997; Council 1999; Ellram and
Cooper 1993; Lummus and Vokurka 1999; Lummus and Alber 1997). A number of
models designed based on various practical problems. Similarly Mentzer, et. al. (2002)
highlights this concept as a traditional business model for systemic, strategic and
tactical harmonisation with other functions. Croom, Romano and Giannakis (2002) cite
a number of other definitions (See Table 3.2).
Table 3.2: Different Definitions of Supply Chain Management
(Croom, Romano and Giannakis 2000)
Authors Definition Tan, Handfield and Krause(1998)
“Supply chain management encompasses materials/supply management from the supply of basic raw materials to final product (and possible recycling and re-use). Supply chain management focuses on how firms utilise their suppliers' processes, technology and capability to enhance competitive advantage. It is a management philosophy that extends traditional intra-enterprise activities by bringing trading partners together with the common goal of optimisation and efficiency”.
Berry, Towill and Wadsley(1994)
“Supply chain management aims at building trust, exchanging information on market needs, developing new products, and reducing the supplier base to a particular OEM (original equipment manufacturer) so as to release management resources

47
for developing meaningful, long term relationship”. Jones and Riley (1985)
“An integrative approach to dealing with the planning and control of the materials flow from suppliers to end-users”.
Saunders (1995) “External Chain is the total chain of exchange from original source of raw material, through the various firms involved in extracting and processing raw materials, manufacturing, assembling, distributing and retailing to ultimate end customers”.
Ellram(1991) “A network of firms interacting to deliver product or service to the end customer, linking flows from raw material supply to final delivery”.
Christopher (1992)
“Network of organisations that are involved, through upstream and downstream linkages, in the different processes and activities that produce value in the form of products and services in the hands of the ultimate consumer”.
Lee and Billington(1992)
“Networks of manufacturing and distribution sites that procure raw materials, transform them into intermediate and finished products, and distribute the finished products to customers”.
Kopczak(1997) “The set of entities, including suppliers, logistics services providers, manufacturers, distributors and resellers, through which materials, products and information flow”.
Lee and Ng (1997) “A network of entities that starts with the suppliers' supplier and ends with the customers' custom the production and delivery of goods and services”.
Therefore, the supply chain manages and incorporates all of these activities into a
unified process (Tan 2002; Ponomarov and Holcomb 2009). Aitken (1998) describes
the supply chain as “a network of connected and interdependent organisations,
mutually and co-operatively working together to control, manage and improve the flow
of material and information from suppliers to end users” (Aitken 1998). In the
implementation of this process, supply chain stakeholders face some risks in their own
operations which they need to mitigate. The next section discusses risks to the supply
chain.
3.3.2 Supply chain risks
Supply chain risks and the associated financial and operational risks are burning issues
for all firms in the present competitive market (Roth et al. 2008). Trkman and
McCormack (2009) observe that the need to solve supply chain management problems
is emerging as an important issue (Trkman and McCormack 2009).They argue that the
ability to identify suppliers with greatest risk potential is a critical step in the
management of risk within the supply chain. Briefly, supply chain risks are disruptions
that occur to the flow of products, information and finance from producer to consumer
within the supply chain. They are unplanned and unanticipated events which disrupt
the normal flow along the supply chain (Svensson 2000; Hendricks and Singhal 2003).

48
Various organisations approach the risks that arise across the supply chain in a
number of different ways. A few industries accept the risks and take appropriate measures
to mitigate them; otherorganisations avoid the risks (Thun and Hoenig 2011). Whatever
their approach, they must assess the impact of risks throughout the supply chain
process. Thun and Hoenig (2011) conducted a survey of 67 German automotive
industries to identify and examine the key drivers of supply chain risk. They identified
some of the key drivers for disrupting the supply chain as: outsourcing; cultural risk;
transportation risk, exchange rate risk and catastrophes such as terrorist attacks,
bankruptcy, and financial loss. They identified the risks and predicted the likelihood of
their occurrence and their potential impact on the supply chain by means of a
probability impact matrix, which is also one of the research objectives for this study.
Raoand Goldsby (2009) identifies some sources of risk (Figure 3.2) in terms of
organisational, environmental and social factors. Political instability, shifts in
government policy, social uncertainties and natural uncertainties are the primary
variables associated with environmental risk (Miller 1991). Saha (2007) reveals that
political instability in Bangladesh is one of the major causes why many large firms have
begun to find it unfeasible to conduct business there. Therefore, political instability
could also be a source of supply chain risk. Social uncertainties, which may include
terrorism and theft, also represent a threat to the supply chain (Sheffi 2005), as do
organisational uncertainties (at the firm level) such as labour strikes, scarcity of raw
materials, and technological change (Ritchi and Marshall 1993)
Tang and Musa (2011) identify the supply chain risks associated with the flow of
different elements, namely, material (single sourcing, outsourcing, product quality,
operational disruption), information (information disruption and accuracy) and cash
(financial strengths of supply chain partners, cost and price risks). Actually, supply
chain risks can have different sources internal and external to a supply chain network.
Consequently the impact of risks also varies according to the risk sources. For instance,
natural disaster is an environmental risk destroying production capacity with high
impact. Different scholars have constructed different typologies and/or taxonomies of
supply chain risks e.g., Svensson 2000; Christopher and Peck 2004; Jüttner, Peck and
Christopher 2003; Ritchie and Marshall 1993. For instance, Jüttner (2005) posits three
categories: supply, demand and environmental. Svensson (2000) proposes two
categories: qualitative and quantitative. Ritchie and Marshall (1993) distinguish five
categories: environmental, industrial, problem specific, organisational and decision

49
related. After examining these definitions it can be concluded that supply chain risk is
related to the chance of damage, danger, loss, injury or any other unexpected
consequence (Harland, Brenchley and Walker 2003). Figure 3.2 depicts the
classification of supply chain risk sources identified by Ritchie and Marshall (1993) but
also confirmed by Rao and Goldsby (2009).
Figure 3.2: Supply Chain Risk Factors (Rao and Goldsby 2009)
Supply chain risk factors are discussed below:
Environmental factors
Environmental risk variables are considered in the overall business context across
industries (Ritchie and Marshall 1993). Akcaoz, Kizilay and Ozcatalbas(2009) consider
the same variables for analysing risk management strategies in Turkish dairy farming.
Variables representing environmental risks are political (Shubik and Herring 1986),
policy related (Ting 1988), micro-economic (Oxelheim and Wihlborg 1987), social
(Dunn and Herring 1983) natural (Miller 1991) and those associated with uncertainty
(Rao and Goldsby 2009).
Industrial factors
Industry risk variables refer to a particular segment of an industry rather than to the
whole sector (Ritchie and Marshall 1993). Three different types of industrial risk are
identified in the literature: input market, product market and competitive uncertainty
(Rao and Goldsby 2009).
Organisational factors
Ritchie and Marshall (1993) draw attention to the organisational uncertainty
associated with the first level of the farm supply chain. They posit four different sub-

50
variables: operational, liability, credit, and agency uncertainties (Miller, 1991; Wu et al.,
2006).
Problem-specific factors
This particular risk is associated with the potential negative effects of a risk reduction
process (Bettis 1982). For instance, outsourcing is a risk reduction strategy which also
gives rise to vulnerability as control over a particular element in the supply chain may
be lost. Moreover, problem-specific risks are influenced by the structure of the overall
risk and their interrelationship (Ritchie and Marshall, 1993), objectives and constraints
associated with the resolution of the problem (Bettisand Hall, 1982) and overall
decision making complexity (Cohen and Levesque 1990).
Decision-maker factors
Decision-maker related risks could be related to an individual or to a decision making
group within an organisation (Rao and Goldsby 2009). This factor is influenced by the
decision maker’s detailed knowledge (Ritchie and Marshall, 1993), information seeking
behaviour and institutional rules and procedures for taking decisions (Wilson 1982),
and bounded rationality (Simon 1987).
Tang and Tomlin (2008) also refer to supply risks, process risks, demand risks,
intellectual property risks, behavioural risks, and political/social risks. Figure 3.3
shows the supply, process and demand risks and their relationships with upstream and
downstream partners. Here process risks are linked with the manufacturing processes
of both the partners. There are two ways to measures such risks: the likelihood of the
occurrence of an undesirable event, and the negative implications of the event (Bogataj
and Bogataj 2007). Two options to diminish the occurrence of certain undesirable
events are risk avoidance and the application of TQM principles. A “Triple-A” model can
also eliminate the negative implications of some undesirable occurrences associated
with supply, process, and demand. The “Triple-A” model was first presented by Lee
(2004). Its principles are alignment, adaptability and agility.
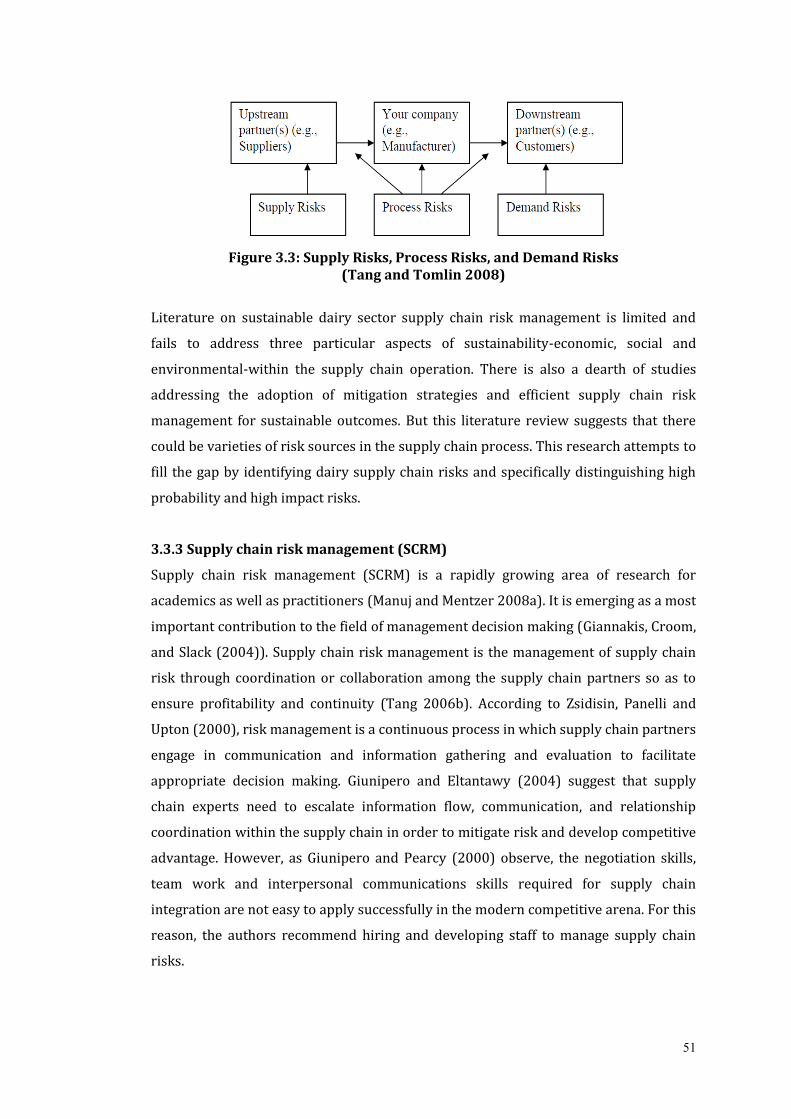
51
Figure 3.3: Supply Risks, Process Risks, and Demand Risks (Tang and Tomlin 2008)
Literature on sustainable dairy sector supply chain risk management is limited and
fails to address three particular aspects of sustainability-economic, social and
environmental-within the supply chain operation. There is also a dearth of studies
addressing the adoption of mitigation strategies and efficient supply chain risk
management for sustainable outcomes. But this literature review suggests that there
could be varieties of risk sources in the supply chain process. This research attempts to
fill the gap by identifying dairy supply chain risks and specifically distinguishing high
probability and high impact risks.
3.3.3 Supply chain risk management (SCRM)
Supply chain risk management (SCRM) is a rapidly growing area of research for
academics as well as practitioners (Manuj and Mentzer 2008a). It is emerging as a most
important contribution to the field of management decision making (Giannakis, Croom,
and Slack (2004)). Supply chain risk management is the management of supply chain
risk through coordination or collaboration among the supply chain partners so as to
ensure profitability and continuity (Tang 2006b). According to Zsidisin, Panelli and
Upton (2000), risk management is a continuous process in which supply chain partners
engage in communication and information gathering and evaluation to facilitate
appropriate decision making. Giunipero and Eltantawy (2004) suggest that supply
chain experts need to escalate information flow, communication, and relationship
coordination within the supply chain in order to mitigate risk and develop competitive
advantage. However, as Giunipero and Pearcy (2000) observe, the negotiation skills,
team work and interpersonal communications skills required for supply chain
integration are not easy to apply successfully in the modern competitive arena. For this
reason, the authors recommend hiring and developing staff to manage supply chain
risks.

52
The risk management procedure starts with identification of the risk and ends with
mitigation of the risk through strategies of risk avoidance and risk transference
(Mishra and Shekhar 2011), cooperation and control (Jüttner, Peck and Christopher
2003). Jüttner, Peck and Christopher (2003), (shown in Figure 3.4) draw attention to
four elements of supply chain risk management:
a) Measuring the risk sources for the supply chain;
b) Recognising the risk concept of the supply chain by defining the most relevant
risk consequences;
c) Tracking the risk drivers in the supply chain strategy; and
d) Mitigating risks in the supply chain.
Figure 3.4: Supply Chain Risk Management-The Basic Constructs (Jüttner, Peck
and Christopher 2003)
Conversely, Thun and Hoenig (2011) identify two approaches to supply chain risk
management, namely, preventive and reactive. In a comparative study they found that
the group using reactive supply chain risk management had higher average values in
terms of disruption resilience or the reduction of the ‘bull whip effect’, whereas the
group using preventive supply chain risk management had better values in relation to
flexibility or safety stock. Tang and Musa (2011) identify some risks associated with
flow (material flow, information flow and cash flow) along with some quantitative and
qualitative solutions for those risks. Quantitative solutions include multiple sourcing,
single sourcing, resilience supply chain, supply chain design, operation hedging, and so
on. Qualitative solutions include simulation-based decision support system (DSS)
model, optimisation model, multivariate analysis, postponement model and others.

53
Blos et al. (2009) conducted an empirical study of 46 industries (automotive and
electronic) in Brazil. They developed a supply chain vulnerability map with four
quadrants (financial, strategic, hazard and operations) of supply chain risk. To mitigate
supply chain risk, they recommend improved supply chain communication: supply
chain and business continuity risk management training programmes; and the creation
of a chief risk officer. Miller (1991) posits five generic strategies to mitigate risk in a
single organisation. Four of these are adapted to the supply chain context by Jüttner,
Peck and Christopher (2003). These four strategies are summarised in Table 3.3 and
then discussed in greater detail:
Table 3.3: Supply Chain Risk Mitigation Strategies (Jüttner, Peck and Christopher 2003)
Avoidance Dropping specific products/geographical markets/supplier and/or customer organisations
Control Vertical integration Increased stockpiling and the use of buffer inventory Maintaining excess capacity in productions, storage, handling and/or
transport Imposing contractual obligations on suppliers
Co-operation
Joint efforts to improve supply chain visibility and understanding Joint efforts to share risk-related information Joint efforts to prepare supply chain continuity plans
Flexibility Postponement Multiple sourcing Localised sourcing
a) Avoidance
Risk associated with operations or geographical areas are unacceptable. One
strategy to mitigate such risks is avoidance. A company could avoid risk by
dropping particular products, markets or supplier if they become unreliable.
b) Control
Control strategies are the most well-known strategies (Jüttner, Peck and
Christopher 2003). Companies can control various risk sources within which they
must operate, rather than consider these risks as constraints (Miller 1991).
Vertical integration, use of buffer inventory or managing excess capacity in
production, storage and distribution are some common examples of control in
supply chains.

54
c) Cooperation
To reduce risk, cooperative responses may take the form of joint agreements
(Miller 1991). Joint agreements among organisations, information sharing and
preparation of joint business continuity plans are instances of cooperation in a
supply chain.
d) Flexibility
The strategy of flexibility increases responsiveness while the strategy of control
attempts to increase the predictability of contingencies arising from different risk
sources. An example of flexibility is postponement (delay in decision making). This
decreases dependency on forecasts and increases responsiveness to variability or
disruptions. Multiple sourcing (managing risk through spreading risk) and
localised sourcing (sourcing with short lead times and quick response
potentialities) are other examples of flexibility in supply chain risk mitigation.
Jüttner, Peck and Christopher (2003) propose three sources of risk to the supply chain.
These are: environmental risk sources, network-related risk sources and
organisational risk sources. One example of an environmental risk source is the
occurrence of fire in an organisation. Network-related risk sources include socio-
political actions, such as fuel protests or terrorist attacks, and acts of God, such as
extreme weather or earthquakes. Organisational risk sources include various types of
labour disturbance such as strikes, production uncertainties such as machine failure,
and IT-system uncertainties.
Tang (2006a) suggests a risk assessment programme based on the following four tasks:
a) Identify different types of risks;
b) Estimate the likelihood of each type of major disruption occurring;
c) Assess potential loss due to a major disruption; and
d) Identify strategies to reduce risk.
This risk assessment programme can be effective if administration is able to
successfully sort out the risk types and identify appropriate strategies for their
mitigation.
The following recommendations are compiled from studies conducted by Rice and
Caniato(2003) and Zsidisin, Panelli and Upton (2000):

55
a) To assess the risks, industries should undertake risk assessment programmes
and deploy different formal quantitative models to develop informal qualitative
plans.
b) They should develop their own contingency plans to meet legal requirements
c) They should have alternative suppliers for strategic parts of the supply chain.
This is the most common approach for reducing supply chain risks.
d) They should develop data points to efficiently estimate the probability of the
incidence of any particular disruption and to measure correct impact for each
disaster that may difficult to predict.
The literature reveals that an assessment of risk should be made prior to the adoption
of particular mitigation strategies for sustainable outcomes in a particular dairy
industry. Accordingly, industries should have their own contingency plan to protect
against sudden hazards. Although the previous studies addressed supply chain risk
management, they did not highlight the dairy industry. A few studies have been
conducted on dairy disease management, but they have not identified the industry’s
operational risks. This research is an attempt to fill this research gap.
3.3.4 Supply chain risk management in the dairy industry
The literature on supply chain risk management suggests various policies including
risk insurance, information sharing, relationship development, agreed performance
standards, partnership structures, joint training and development programmes, joint
pro-active assessment, regular joint reviews, planning exercises, developing risk
management awareness and skills, joint strategies and relationship marketing
initiatives (Ritchie and Brindley 2007). There is some evidence of successful risk
management through insurance and co-operative responses like sharing strategic
information (Kleindorfer and Saad 2005). The management of supply chain risks vary
according to the type of organisations/industry. Sometimes researchers trial strategies
and policies from different industries and analyse their impacts.
One of the objectives of this research is to determine the supply chain risks in the
Bangladesh dairy industry and to deploy appropriate mitigation strategies for highly
probable and high impact risks. So far the existing literature has revealed a variety of
risks related to certification and traceability (Meuwissen et al. 2003), food supply
chains (for example, Melamine in infant formula and powdered milk sourced from
China) (Narasimhan and Talluri 2009), botulinum toxin in milk (Wein and Liu 2005),

56
environmental impact (Sonesson and Berlin 2003), restructuring existing vertical
supply chains(Dries et al. 2009), emerging foodborne pathogens (Altekruse et al.
1999), vulnerability and political regulation (Deimel, Frentrup and Theuvsen 2008),
dairy products retailing (Hendrickson et al. 2001), the effects of the metabolism of
propylene glycol (Nielsen and Ingvartsen 2004), quality control (Faye and Loiseau
2002b), and cooperative models (Chaddad and Cook 2004).
From the literature, it is apparent that dairy milk producing countries suffer from a
number of risks and problems, and Bangladesh is no exception. Jabber (2010)
identifies some of the risks experienced by the Bangladesh dairy industry as follows:
(i) Inadequate knowledge and technical skills of dairy farmers
(ii) Feed scarcity and poor quality
(iii) Diseases
(iv) Inadequate veterinary service coverage and diagnostic facilities
(v) Lack of credit support
(vi) Milk collection constraints due to distance and quantity
(vii) Low price, breed management and problem associated with regulatory body
Jabbar (2010) also suggests the following strategies to overcome the situation:
(i) Cooperative dairy development
(ii) Community-based contact farming schemes
(iii) Smallholder dairy farming, integrated with crop and fish culture
(iv) Supply chain based production, processing and marketing of milk and milk
products
(v) The establishment of an active dairy regulatory body to promote dairy
development
(vi) The establishment of a ‘National Dairy Research Institute’ to carry out dairy
research
The literature on dairy supply chain risk management, particularly in the Bangladesh
context, is limited. This research attempts to redress this limitation by identifying dairy
supply chain risks, especially those associated with sustainability, and subsequently
analysing the risks in terms of high probability and high impact, with the
understanding that such problems can be solved through identifying suitable
strategies to solve particular risks (Han et al. 2001). This research identifies relevant

57
and appropriate strategies to mitigate risks to the dairy supply chain through a QFD
approach (Park and Kim 1998).
3.4 SUPPLY CHAIN RISK MANAGEMENT FOR SUSTAINABILITY
Another aim of this research is to identify ways to ensure that risk mitigation strategies
have appropriate sustainable outcomes in terms of a triple bottom line of economic,
social and environmental development. Other business disciplines, such as operations
and management, are likewise concerned with sustainability. No matter what the
nature of operation is, nowadays almost every organisation, institution and industryis
concerned withachieving sustainability.
3.4.1 Sustainability: An examination of the literature
Sustainability has three aspects: economic output, social welfare and the natural
environment. These aspects are reflected in the concept of the triple bottom line (TBL)
(figure 3.5) developed by Elkington (1998, 2004) in the mid-1990s to measure
performance in corporates. The TBL refers not only to economic profits and returns on
investment, but also to shareholder values associated with social and environmental
issues. The TBL also represents the three keywords of profit, people and planet as the
three pillars of sustainability (Bader 2008). Thus the concept of triple bottom line is
based on the idea that there are activities that organisations can be involved in at the
intersection of economic performance, social welfare and environmental benefit which
not only positively affect society and the natural environment, but are also able to
generate long term economic benefit and competitive advantage for the organisation
(Carter and Rogers 2008a). So the interrelated elements of profit, people and planet-
the triple bottom line-can be an important device for measuring sustainability in a
livestock business. Sustainability is a vital indicator of smart management (Savitz and
Weber 2006). Other aspects of sustainability include risk management, strategy,
transparency, and culture (Gladwin, Kennelly and Krause 1995; Hart 1995; Elkington
1998; Henriques and Richardson 2004; Jennings and Zandbergen 1995; Sarkis 2001;
Savitz and Weber 2006; Shrivastava 1995; Starik and Rands 1995). Hence,
consideration of the risks associated with the dairy industry needs to include
consideration of their impact on sustainability, so that the industry can effectively
serve the people of Bangladesh.
The most widely adopted and most often cited definition of sustainable
developmentcomes from the “Brundtland Report” of the World Commission on

58
Environment and Development (WCED 1987), which defines it as “development that
meet the needs of the present without compromising the ability of future generations
to meet their own needs”. According to the United States Environmental Protection
Agency, sustainability represents the preservation or recovery of certain social
conditions and ecological capabilities (Sikdar 2003; Elkington 1994; Jennings and
Zandbergen 1995). Scarcity of resources (Davis 1990; Wakeford 2012; Daily and
Ehrlich 1992), polluted natural resources (Tilman et al. 2002), acceleration in non-
renewable resource consumption (Goodland and Daly 1996), huge population (Davis
1990; Daily and Ehrlich 1992), radical change of global climate (Belisle 2011), chaotic
industrialisation (Barrera-Roldán and Saldıvar-Valdés 2002) and problematic
biodiversity and ecosystems (Tilman, Wedin and Knops 1996) are the main reasons for
the increased attention being given to sustainability.
Sustainability issues like the impact of economic activity on the ecology (Erlich and
Erlich 1991); fulfilment of fundamental human needs (Savitz and Weber 2006);
preservation of non-renewable resources (Whiteman and Cooper 2000) and ensuring
food security (Lal et al. 2002) are all issues requiring action. Diesendorf (2000)
distinguishes three principles of sustainability: economic growth, societal equity and
environmental protection. These principles reflect the “triple bottom line: economic,
social and environmental or profit, people, and planet” (Elkington 2004; Norman and
MacDonald 2004; Peacocka and Shermanb 2010; Elkington 1994). Shrivastava (1995)
adds that sustainability requires the reduction of long term risks associated with
resource depletion, energy cost fluctuations, pollution and waste management.
In recent years, the application of the principles of sustainability has improved
productivity in many domains including management, operations, supply chain and
engineering, although the terminology differs in different domains. In the management
literature, sustainability refers more to the natural environment with only an implied
recognition of economic and social responsibilities (Starik and Rands 1995; Jennings
and Zandbergen 1995). The operations literature considers sustainability from the
three common viewpoints of economy, society and ecology (Sarkis 2001; Hill 2001;
Daily and Huang 2001). Sustainability is explicitly incorporated into the engineering
field as well, where it is defined as “a wise balance between economic development,
social equity and environmental stewardship” (Sikdar 2003; Go´ncz et al. 2007).

59
Figure 3.5: Sustainability: The Triple Bottom Line (Carter and Rogers 2008a)
Solaiman and Belal(1999) identifies some of the major challenges (figure 3.6) for
sustainable development based on Hart’s (1997) earlier findings. These challenges are
environmental pollution, natural resource depletion and extreme poverty. They also
posit some strategies for achieving sustainable development, including indigenous
technology development, skill development of poor people, development of village
based entrepreneurship, strong legal enforcement, and so on.
Figure 3.6: Major Challenges to Sustainable Development (Hart 1997)

60
Moreover, eco-friendly packaging, recycling, and adequate waste disposal have also
assumed importance as contributors to environmental sustainability (Faisal 2010).
Although the concept of sustainability is considered in different academic disciplines, it
is not widely understood by the general public (Komiyama et al. 2011). The concept of
sustainable development has yet to be adopted by many developing countries
(Ravindranath and Hall 1995; Ahern, Cilliers and Niemelä 2014; Cohen 2006). Thus
this study attempts to mitigate supply chain risks in a sustainable way.
3.4.2 Sustainable dairy production
Sustainable dairy production needs to be practiced and the principles of sustainability
need to be incorporated into the production process (Darnhofer et al. 2011).
Sustainable health security and comfort can also be achieved through maintaining eco-
friendly goods and services for human wellbeing (McMichael, Butler, and Folke 2003).
On the environmental side, human lives are under threat due to depletion of soil
fertility and natural resources, scarcity of fresh water and biosecurity degradation
(Raven 2002; McMichael, Butler and Folke 2003). Coordination among the natural
sciences, social sciences, humanities and engineering would help societies to attain
sustainability (Ostrom 2002; McMichael, Butler and Folke 2003).
Dairy industries face environmental challenges arising from air and water pollution.
The degradation of air and water quality impedes the development of the dairy
industry by spreading diseases and hindering the upkeep of optimum health of dairy
cattle. Sustainability in the dairy industry can be attained by developing cattle breeds
that can survive the rough weather with minimum and inexpensive inputs and that are
resistant to exotic and local disease (Khanna 2004). It is also necessary to identify the
problem areas responsible for social and environmental damage. Severe environmental
pollution is caused by dumping livestock farming waste into rivers, vacant lands and
crop lands in the natural environment (Rasul and Thapa 2004; Payraudeau and van der
Werf 2005). To reduce the short- and medium-term negative environmental effects of
this, science and technology can be used (Boyazoglu 2002). Moreover, to maintain
sustainable production and prevent natural and social degradation, technological
advances in scientific production, processing, preservation and promotion are rapidly
changing throughout the world.
Sustainable dairy farming involves principles and practices across the whole farm
system including its economic, social and environmental aspects (SAI 2009). In this

61
report, economic sustainability refers to financial stability, diversification, safety,
quality and transparency. Social sustainability refers to working conditions, rights and
obligations of workers, and training facilities. Environmental sustainability refers to
the minimisation of adverse impacts on global environment through waste
management, proper handling of recycling, and biodiversity enhancement.
Consequently, attention needs to be given not only to livestock production but also to
the enclosing environment. Productivity needs to be sustainable so that the
environment is not degraded, and management gains increased societal acceptance
and economic advantages for future generations (de Jong 2013).Thus farms must be
careful to improve their socio-economic conditions; otherwise humans and livestock
will suffer from the socio-economic hazards (Boyazoglu 2002). Kliebenstein (1998)
suggests that industries can avoid natural disasters through their collective efforts by
upgrading their positive environmental impact by means of improved process
technologies. At the same time, innovative management practices can reduce the air
pollution caused by the livestock industry (Colletti et al. 2006). Suppliers need to
modify their existing production methods, invest in skill development and improve
infrastructure in order to transform a supply chain into a sustainable supply chain
(Faisal 2010).
The literature discussed suggests that sustainable production depends on meeting
certain criteria for improving infrastructure, environmental hazards, skills, collective
efforts and the like. Very few research recommendations have been implemented in
practice to test the match between theory and reality. Thus this research examines
existing dairy operations and their outcomes in terms of the three aspects of
sustainability.
3.5 THE DAIRY SUPPLY CHAIN
The word dairy is related to the production of milk-based products and processes, like
dairy farm, dairy cow, dairy goat and so on (ACF 2012). Basically, the extraction and
processing of animal milk (cows, buffalo or goats) for human consumption are
facilitated by dairies. Usually, a dairy farm produces milk and a dairy factory processes
the produced milk and converting it into different dairy products. So dairy can be
identified as a department of agribusiness that deals with milk production and milk
conversion into different consumable products like fluid milk, skim milk, cheese,
yogurt, butter, powdered milk, ice cream and different types of sweets (Raha and

62
Talukder 2004; Shahnaz, Shimazaki and Kato 2004). Additionally meat, leather goods
and organic fertilisers are also end products of the dairy industry.
On the other hand, the supply chain is the process that links suppliers and users within
and outside a company, starting with the raw materials and ending with the finished
product (Maxwell and Vorst 2003; Croom, Romano and Giannakis 2000). In supply
chain management, the entire process appears as one system (Lummus and Vokurka
1999). The supply chain also includes inside and outside partners, transporters,
information providers and third-party companies. Moreover, recycling, disposal,
remanufacturing of rejected or used products are additional elements of the supply
chain (Kocabasoglu, Prahinski and Klassen 2007). Other elements of the supply may
include production of by-products, design of by-products, product life expansion, and
retrieval and recovery of products and processes at end-of-life (Linton, Klassen and
Jayaraman 2007).
The dairy supply chain begins with dairy farms producing raw milk. The raw milk is
supplied to a processing centre where the raw milk is processed and converted into
consumable milk or other dairy products. Once processing is completed, the milk is
transported to wholesale distributors. From the wholesale distributors, the milk goes
to the retailers where it is purchased by consumers. This is the general flow of a formal
dairy supply chain. In the case of an informal dairy supply chain, after the raw milk is
produced, it is supplied to milk traders (Ghosh, Goala, and wholesalers), retailers
(sweetshops, tea stalls, local hotels, etc.) and local consumers. In a World Bank report
based on a field study in Uganda, Choudhary et al. (2011) evaluate and assess risk in
different types of dairy supply chain. Four types of milk distribution channels are
identified. These channels include raw warm milk, raw chilled milk, boiling centres and
pasteurized milk. They also identify the major stakeholders in the dairy supply chain.
These include national dairy traders’ association, dairy cooperatives, veterinary
services and pharmaceutical industry.
Mishra (2011) conducted survey of Indian dairies and found that the supply chain is
entangled with many stakeholders. They report that it is a complex bonding of several
stakeholders, and that distortion of one of the components distorts the entire chain in
varying degrees. Raw milk has a tendency to spoil quickly, as it has very short life. So
after collecting milk from the collection point, most dairy companies add ice to the milk
to preserve it and save it from perishing (Javed 2004). Javed identifies the different

63
parties involved in a dairy supply chain. These include contractors of milk, suppliers of
milk, gawalas (middlemen), milk collection centres in villages and those involved in
direct collection from small scale dairy farmers, transport authorities and so on. After
being collected, the milk should be transported to a chiller within 5-6 hours of milking.
Then the temperature of the milk should be brought down to 2-4 degree Celsius. After
that, the milk should be transported to the processing centre for processing. A very
common milk collection and transport system is shown in Figure 3.7.
Figure 3.7: Milk Collection and Transport System (Javed 2004)
The whole dairy supply chain consists of different parties, each of which has a separate
role within the chain. Producers, collectors, processors, middlemen, traders and
consumers are the different parties engaged in the dairy supply chain (ZIA 2006).
Qiang et al. (2010) present the findings of a study on the quality control mechanism of
a dairy supply chain for a single moral hazard. They presented two coordination
models: “External Lose Sharing Model” and “Internal Punishment model”. Okano et al.
(2010) measured dairy chain productivity usingdifferent indicators of best practices to
improve productivity. After analysing a unique data set on dairy supply chain
characteristics, Fałkowski (2012) identifies factors associated with households not
participating in the market. The study also found that modernisation of the supply
chain is not significant if commercial farms are compared to subsistence farms in
supplying the traditional marketing channel. As noted by IFC (Hemme 2010; Hemme
and Uddin 2009), the starting point of a dairy supply chain is the dairy farmer and the
end point is consumers, including different authorities like agents, collection centres,
processing centres, dealers and retailers. Figure 3.8 shows the dairy supply chain
developed by PRAN Dairy in Bangladesh. Nevertheless, a report from Oakhurst Dairy
found that the dairy supply chain begins with feed management, i.e. producing feed for
the animals. The report also distinguishes different supply chain parties including
farmers, processing units, packaging and transport authorities, distributors, retailers
and consumers (shown in Figure 3.9).

64
Figure 3.8: PRAN’s Dairy Supply Chain (Kumar and Iversen 2012)
Figure 3.9: The Oakhurst Dairy Supply Chain (Schmitz 2012)

65
Studies on the dairy supply chain have given little attention to the associated risk
factors (Venkatesh 2006; Zokaei and Hines 2007). Moreover, there has been only
limited work done on dairy supply chain risk management. This research categorises
the risks to the dairy supply chain from a sustainability perspective and simultaneously
develops mitigation strategies and discusses probable outcomes. Thus this research
fills the existing gaps in knowledge concerning the dairy supply chain.
3.6 DAIRY SUPPLY CHAIN RISK
Risk can be broadly defined as the likelihood of the occurrence of a particular event or
outcome (Ritchie and Marshall 1993) or as the probability of variation surrounding an
anticipated outcome (Carter and Rogers 2008a). Risk has been observed via
behavioural decision theory in economics and management (Wiseman and Gomez-
Mejia 1998; Kahneman and Tversky 1979) and finance in terms of insurance and
portfolio analysis (Stulz 1996). Supply chain risk can be defined as the possible
occurrence of an inbound supply event which may lead to the incapability of fulfilling
customer demand (Zsidisin, Panelli and Upton 2000). Supply chain risks may arise
from legal obligations (Giunipero and Eltantawy 2004), natural adversities (Atkinson,
Mourato and Szymanski 2006), price fluctuations for main raw materials (Barry, 2004),
poor demand forecasting (Christopher and Lee 2004), poor environmental and social
activities of a firm and its supplier that may result in costly legal actions (Carter and
Jennings 2004), and logistic failure and higher transportation costs (Schoenherr, Rao
Tummala and Harrison 2008).
Agro business is comparatively riskier than any other type of business. Financial risk,
low productivity, land scarcity, technological disruptions, shortage of logistic support,
poor quality feed, diseases and natural uncertainties are the most frequently cited risks
in the dairy sector. Low productivity in dairy originates from food shortage, diseases
and inefficient management (Ghani and Rahman 2004). As a dairy supply chain
engages with its various stakeholders, it faces various risks to its operation. Moreover,
the only raw material, with which this dairy industry deals, milk, is perishable in
nature. This perishable nature of milk increases the probability of risk occurrence in
the daily operation of the supply chain. Mishra and Shekhar (2011) identified some
dairy risks after conducting in-depth personal interviews with different corporate
authorities. They found that the major risks were: logistic risk, hazard risk, high cost of
food, low risks, product shortage, delivery risk and lack of skilled staff. Choudhary et al.
(2011) identified cattle diseases, drought, abrupt regulation, erratic power supply,

66
flood, drought and milk spoilage as major risks to the dairy supply chain (Choudhary et
al. 2011). The same report considered limited extension and veterinary services,
limited availability of pastures and water, limited milk-cooling infrastructure, poor
milk-handling practices, improper road infrastructure and perishability of milk to also
be supply chain constraints.
Vulnerabilities in terms of risks and uncertainties are multiplied by the perishable
nature of the raw material (milk) in the dairy industry. The absence of a proper cold
chain and the distribution of milk in plastic containers contribute to the spoilage of
milk, especially in hot weather. Mishra and Shekhar (2012) classified three types of
dairy risk: procurement, processing and distribution. They identify illiterate farmers,
high cost of feed, inadequate infrastructure and milk testing equipment and improper
transport facilities as procurement related risks. As processing related risks, they
identify out dated technology, shortage of skilled staff, competition, hazard risk (fire
and sabotage) and inadequate transport facilities. In this context, the high cost of fuel
adds to the present transport problems. Last of all, they identify transportation
problems, inferior quality of product and the absence of demand forecasting skills as
distribution related risk. Farmers in rural areas rely on middlemen to sell their
product, but the middlemen deprive them by taking the maximum share (Ghani and
Rahman 2004). After production there is a need to preserve the raw milk in the chilling
centre. Disruption in the supply of power at the chilling centre and processing plant,
shortage in treated water and flawed machinery may disrupt operational activities and
this may, in turn, affect the quality of the product and profitability (Food 2011a).
There is inefficient cold chain management in most developing countries, including
Bangladesh (Huq 2007). Central chilling centres are setup at strategic locations so that
different dairy processors can chill their milk for the convenience of transporting it
over greater distances. In this context, most small scale dairy farmers, who do not have
the convenience of chilling facilities, sell their product to local consumers where
demand is very limited. Seasonal fluctuations in milk production and consumption
which are at relative odds with each other may create further risk for the dairy
industry (Zia 2007). Zia (2007) reports that milk production is at its maximum
between January and April because of the availability of green fodder, but production is
low from May to August. In contrast, during winter, the consumption of milk is low, but
it is high during summer because of the higher intake of consumer items such as ice

67
cream, yogurt and lassi (milk made drinks). So production is lower in the season of
high consumption and higher in the season of low consumption.
Akcaoz, Kizilay, and Ozcatalbas (2009) point out some agricultural risks which are also
relevant to dairy farming. These are associated with production, marketing, financial,
human resource management and the environment. Patrick et al. (1985) and Boggess,
Anaman, and Hanson (1985) found that livestock farms were perceived to have a high
risk of animal diseases and personal safety health risks. But Wilson, Luginsland, and
Armstrong (1988) and Patrick and Musser (1997) found that risks related to yields and
input-output prices were perceived to be the most important risks for livestock farms.
The US dairy farmers were concerned about production risk, commodity price risk and
changes in government laws and regulations (Harwood et al. 1999), whereas Indian
dairy farmers are more concerned about animal diseases and see the lack of
institutional support as a major risk source (Bardhan et al. 2006).
In Norway, institutional risk was perceived as the most important risk for dairying
(Flaten et al. 2005) but in New Zealand, rainfall variation and price risk were found to
be the highest risk sources for dairy farming (Martin 1996) Moreover, climatic
conditions (hot weather, too much humidity) may also create risks for dairy if the cold
chain cannot be maintained properly (Faye and Loiseau 2002a). Drought, flood, and
diseases are the biggest risk factors because they cause unpredictability in milk
production which, in turn, leads to financial losses in the dairy industry (Choudhary et
al. 2011). Table 3.4 shows risks identified in the existing literature based on different
levels of supply chain and sustainability respectively. Various dairy risks have been
identified by different authors (Table 3.4) but there has been little research on
identification of the risks on the basis of sustainability, which is covered by this
research in the context of Bangladesh.

68
Table 3.4: Risks identified in the Literature
Level Aspects Risks References
S T O R A G E
Eco
no
mic
al
Technology Disruption (PRAN-RFL 2007; Chowdhury 2007; Akcaoz, Kizilay and Ozcatalbas 2009)
Erratic Power Failure
(Blos et al. 2009; Choudhary et al. 2011; Chowdhury 2007)
Logistic Failure (Mishra and Shekhar 2011; Schoenherr, Rao Tummala and Harrison 2008)
Perishability of product (Choudhary et al. 2011)
Soci
al
Employee Strike/ Labour dispute.
(Mishra and Shekhar 2011; Rao and Goldsby 2009; Jüttner, Peck and Christopher 2003)
Political risks (Strike, lock- out etc.)
(Mishra and Shekhar 2011; Peck 2005; Blos et al. 2009; Wagner and Bode 2006)
Mismanagement of staff (Theft, Spoilage, Corruption etc.)
(Choudhary et al. 2011; Akcaoz, Kizilay and Ozcatalbas 2009; Blos et al. 2009; Finch 2004)
En
viro
nm
enta
l
Pollution and unhygienic environment.
(Akcaoz, Kizilay and Ozcatalbas 2009; Blos et al. 2009)
Contamination(Improper temperature control)
(Faye and Loiseau 2002a)
Hazard Risks (Fire, Accident etc.)
(Mishra and Shekhar 2011; Finch 2004; Jüttner, Peck and Christopher 2003; Akcaoz, Kizilay and Ozcatalbas 2009)
P R O C E S S I N G
Eco
no
mic
al
Land Scarcity (Mishra and Shekhar 2011) High cost of food (Mishra and Shekhar 2011; Akcaoz,
Kizilay and Ozcatalbas 2009; Shamsuddoha and Edwards 2000)
Poor quality of feed (Schoenherr, Rao Tummala and Harrison 2008; Bari 2008; Mishra and Shekhar 2011)
Financial problem / Inadequate loan facilities
(Akcaoz, Kizilay and Ozcatalbas 2009; Chowdhury 2007; Bari 2008; Ghosh and Maharjan 2001)
Logistic failure (Mishra and Shekhar 2011; Akcaoz, Kizilay and Ozcatalbas 2009; Schoenherr, Rao Tummala and Harrison 2008; PRAN-RFL 2007; Food 2011b)
Supply Disruption (Damage or Delay)
(Schoenherr, Rao Tummala and Harrison 2008)
Absence of modern technology
(Ghani and Rahman 2004; Jüttner, Peck and Christopher 2003; PRAN-RFL 2007; Raha and Talukder 2004; Shamsuddoha and Edwards 2000)

69
Lack of Training (Ghani and Rahman 2004; Shamsuddoha and Edwards 2000; Akcaoz, Kizilay and Ozcatalbas 2009; Bari 2008)
Inadequacy of AI Facilities (Akcaoz, Kizilay and Ozcatalbas 2009; Shamsuddoha and Edwards 2000; Raha and Talukder 2004)
Bankruptcy. (Thun and Hoenig 2011; Manuj and Mentzer 2008a)
Soci
al
Political Unrest and interference
(Choudhary et al. 2011; Chowdhury 2007; Rao and Goldsby 2009)
Poor quality product (Blos et al. 2009; Curtis 2011; Wagner and Bode 2006)
Mistrust worthy Employees (Ahsan 2011) Adulteration and contamination
(Faye and Loiseau 2002a)
Policy barrier/ Changes in Government Policy
(Choudhary et al. 2011; Akcaoz, Kizilay and Ozcatalbas 2009; Rao and Goldsby 2009; PRAN-RFL 2007; Manuj and Mentzer 2008a)
Labour uncertainty (Rao and Goldsby 2009; Jüttner, Peck and Christopher 2003; Sheffi and Rice 2005)
Competition (Manuj and Mentzer 2008a)
En
viro
nm
enta
l
Cattle diseases (Choudhary et al. 2011; Akcaoz, Kizilay and Ozcatalbas 2009; Peck 2005; Bari 2008)
Natural disaster (flood, heavy rain, drought etc.)
(Choudhary et al. 2011; Jüttner, Peck and Christopher 2003; Finch 2004; Schoenherr, Rao Tummala and Harrison 2008)
Abrupt regulation (Choudhary et al. 2011; PRAN-RFL 2007; Kang et al. 2012)
Contamination by environmental germs
(Faye and Loiseau 2002a)
Fresh water scarcity (Choudhary et al. 2011; Carter and Rogers 2008b)
D I S T R I B U T I O N
Eco
no
mic
al
Too long chain (Peck 2005; Thun and Hoenig 2011)
Too many middlemen/ Deprived by the middlemen.
(Ali and Kapoor 2008; Ahsan 2011; Ghani and Rahman 2004)
Transport disruption (damage or delay)
(Chowdhury 2007; Jüttner, Peck and Christopher 2003; Schoenherr, Rao Tummala and Harrison 2008; Giunipero and Eltantawy 2004)
Inadequate infrastructure (roads and highway)
(Ali and Kapoor 2008)
Milk price variation (Akcaoz, Kizilay and Ozcatalbas 2009; Mishra and Shekhar 2011; Ghani and Rahman 2004)
Demand unpredictability (Giunipero and Eltantawy 2004)
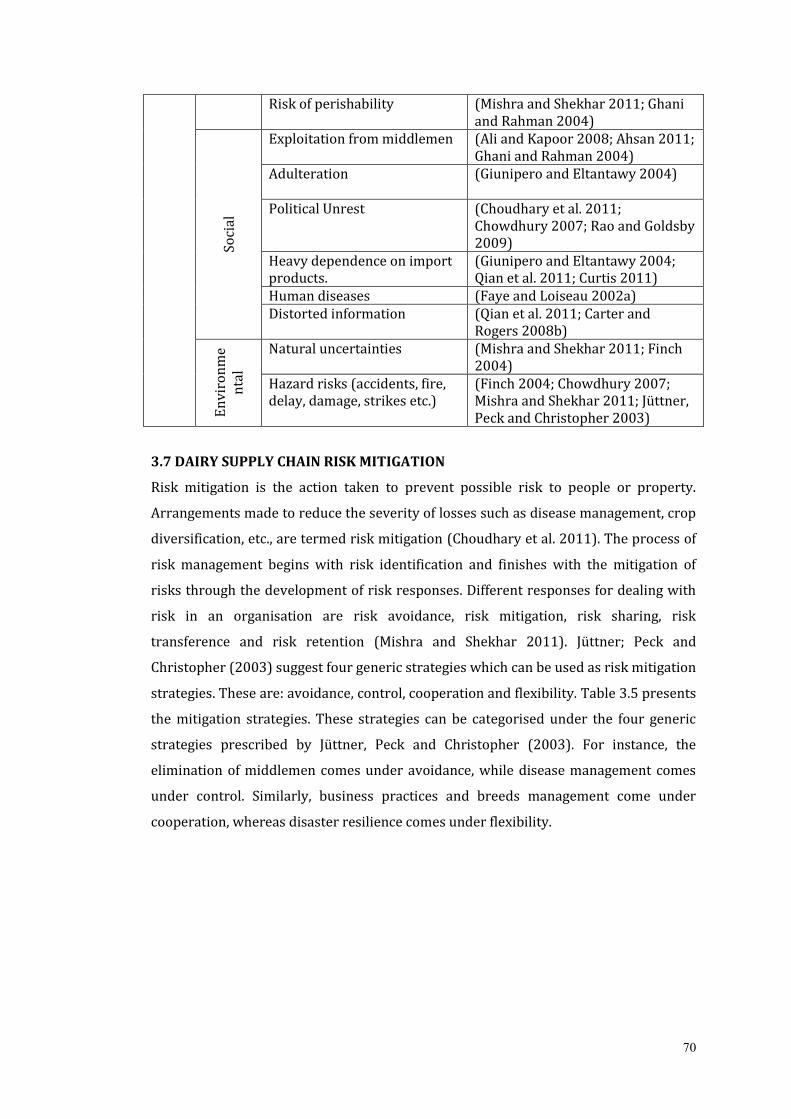
70
Risk of perishability (Mishra and Shekhar 2011; Ghani and Rahman 2004)
Soci
al
Exploitation from middlemen (Ali and Kapoor 2008; Ahsan 2011; Ghani and Rahman 2004)
Adulteration (Giunipero and Eltantawy 2004)
Political Unrest (Choudhary et al. 2011; Chowdhury 2007; Rao and Goldsby 2009)
Heavy dependence on import products.
(Giunipero and Eltantawy 2004; Qian et al. 2011; Curtis 2011)
Human diseases (Faye and Loiseau 2002a) Distorted information (Qian et al. 2011; Carter and
Rogers 2008b)
En
viro
nm
en
tal
Natural uncertainties (Mishra and Shekhar 2011; Finch 2004)
Hazard risks (accidents, fire, delay, damage, strikes etc.)
(Finch 2004; Chowdhury 2007; Mishra and Shekhar 2011; Jüttner, Peck and Christopher 2003)
3.7 DAIRY SUPPLY CHAIN RISK MITIGATION
Risk mitigation is the action taken to prevent possible risk to people or property.
Arrangements made to reduce the severity of losses such as disease management, crop
diversification, etc., are termed risk mitigation (Choudhary et al. 2011). The process of
risk management begins with risk identification and finishes with the mitigation of
risks through the development of risk responses. Different responses for dealing with
risk in an organisation are risk avoidance, risk mitigation, risk sharing, risk
transference and risk retention (Mishra and Shekhar 2011). Jüttner; Peck and
Christopher (2003) suggest four generic strategies which can be used as risk mitigation
strategies. These are: avoidance, control, cooperation and flexibility. Table 3.5 presents
the mitigation strategies. These strategies can be categorised under the four generic
strategies prescribed by Jüttner, Peck and Christopher (2003). For instance, the
elimination of middlemen comes under avoidance, while disease management comes
under control. Similarly, business practices and breeds management come under
cooperation, whereas disaster resilience comes under flexibility.

71
Table 3.5: Dairy Mitigation Strategies
Strategy Description References Feed Management
Focus on certified supplier of feed in order to get high quality of feed.
(Ahsan 2011; PRAN-RFL 2007)
Breed Management
Attempts to create various cross breeds to increase productivity by adopting AI services.
(Ghani and Rahman 2004; Shamsuddoha and Edwards 2000; Ahsan 2011; Khanna 2004; PRAN-RFL 2007)
Herd Management
Cattle management by arranging proper housing with water in quantity and quality and disinfecting in milk operation.
(Ha and Kim 2004)
Training Management
Staff training and development programmes.
(Ritchie and Brnidley 2007a; Chowdhury 2007; Bari 2008; Raha and Talukder 2004; PRAN-RFL 2007)
Diseases Management
Prevention of diseases by providing vaccination services and veterinary facilities.
(Choudhary et al. 2011; Shamsuddoha and Edwards 2000; Ghani and Rahman 2004; Bari 2008)
Disasters Resilience
The capacity of hazard-affected bodies to resist loss during disaster in a specific area in a given period by proper food and water supply and managing early warning system.
(Habiba, Shaw and Takeuchi 2011; Tang and Musa 2011; Choudhary et al. 2011)
Eliminate Middlemen
Removal of the unnecessary influence of middlemen from the chain.
(Peck 2005; Sheffi and Rice 2005; Jüttner, Peck and Christopher 2003; Ahsan 2011)
Insurance Management
Buying insurance against production loss.
(Akcaoz, Kizilay and Ozcatalbas 2009; Choudhary et al. 2011; Bari 2008)
Technology Development
Adoption of improved technology and hiring technical know-how.
(Akcaoz, Kizilay and Ozcatalbas 2009; Choudhary et al. 2011; Okano, Vendrametto and Santos 2010)
Multiple Sourcing
Undertaking multiple source of feed to ensure the delivery of feed in case of the delivery or quality problem.
(Ahsan 2011; Jüttner, Peck and Christopher 2003; Tang and Musa 2011)
Sound business Practice
Promote sound business practices by cooperation, better coordination and information sharing.
(Choudhary et al. 2011; Jüttner, Peck and Christopher 2003; Carter and Rogers 2008b; Shamsuddoha and Edwards 2000)
Diversification Focus on product diversification and value addition.
(Choudhary et al. 2011; Karim et al. 2010)
Incentive Programme
Undertake motivational and incentives programmes for staffs.
(Rao and Goldsby 2009; Ritchie and Brnidley 2007a; Okano, Vendrametto and Santos 2010; Abdullah 2004)

72
Financial Management
Assurance of adequate institutional credit support.
(Shamsuddoha and Edwards 2000; Raha and Talukder 2004; Ahsan 2011)
Monitoring team
Maintenance of monitoring team. (Peck 2005; PRAN-RFL 2007; Sheffi and Rice 2005; RD_Food 2011)
Government support
Create a national dairy development policy and improve transparency and accountability at all levels.
(Choudhary et al. 2011; PRAN-RFL 2007; Food 2011b; Raha and Talukder 2004)
Business policy Reduction of risks through merger, acquisition and integration.
(Rao and Goldsby 2009; Peck 2005; Manuj and Mentzer 2008a; Jüttner, Peck and Christopher 2003; Carter and Rogers 2008b)
Backup capacity Managing adequate power backup (own powerful generator).
(Food 2011b; Choudhary et al. 2011; Sheffi and Rice 2005)
Direct Marketing
Arrange direct marketing by reducing extra involvement of middlemen.
(Akcaoz, Kizilay and Ozcatalbas 2009; Ahsan 2011)
Transport Management
Arrangement of adequate refrigerated transport services for perishable milk and milk products to ensure timely distribution.
(Choudhary et al. 2011; Food 2011b; Barabas 1995)
Total Quality Management (TQM)
Following the improvement of total quality throughout the whole chain.
(Khanna 2004)
Liquidity Management
Managing adequate amount of cash and personal savings for the business.
(Akcaoz, Kizilay and Ozcatalbas 2009; Ahsan 2011)
Off-farm income and Investment
Introducing off- farm activities. (Ahsan 2011; Akcaoz, Kizilay and Ozcatalbas 2009)
Liaison with the Political Party
Maintaining a good relationship with leading political group.
Field observation
Risk management strategies may be preventive or reactive. Thun and Hoenig (2011)
state that the preventive approach involves cause related measurements that attempt
to reduce the probability of risk happenings whereas the reactive approach involves
effect related measurements that attempt to absorb the damage after risk occurrences.
Akcaoz, Kizilay, and Ozcatalbas (2009) conducted a survey on risk and risk
management strategies associated with dairy in the Antalya province of Turkey. The
survey categorised farms as small, medium and large. According to the findings for
small farms, the most important risk management strategies were decreasing livestock
disease, implementing strict hygiene rules and keeping good liquidity. For medium
farms, the most effective strategy was keeping debt low. For large farms, producing at
lowest possible cost was found to be the most important risk mitigation strategy. Dairy

73
is a high risk business because of the raw material that the industry deals with (Mishra
and Shekhar 2012). Due to the perishable nature of milk (the main product of dairy),
dairy industries need to adopt strategies to either prevent or reduce the risks. Milk has
to be kept cold and maintained at a certain temperature throughout its progress along
the marketing chain. Hence the distribution of milk should be done in an insulated
vehicle in order to reduce the risk of perishability by avoiding excessive temperature
increases (Abdullah 2004).
In order to mitigate risk, the elimination of both economic and technical constraints is
important (Shamsuddoha, 2000). Economic constraints can be overcome by providing
adequate loan facilities. Technical constraints can be overcome by improving breeds,
feed and production methods. At the Asian Productivity Organization (APO) conference,
Khanna (2004) suggested the Total Quality Management (TQM) approach as a risk
mitigation policy, where improvement of quality has to follow the entire chain from the
producer’s doorstep to the arrival of products to the consumer. This approach includes
good hygiene practices, good housekeeping, and good manufacturing practices.
Training programmes for employees could be another strategy for mitigating risk. To
increase the lifetime productivity of dairy animals, farmers need to be properly trained
in management practices (Khanna 2004). According to Hall, Alam and Raha (2012),
technical training in feeding management, breed management and milk preservation
could also help to mitigate risk. They also suggest regular and consistent delivery of
health services including veterinary and marketing services and development.
Although different strategies to mitigate dairy risks have been put forward, risk cannot
be avoided completely in this sector. Therefore, this research explores a further
mechanism for developing mitigation strategies by taking a Quality Function
Deployment (QFD) approach (Han et al. 2001). In response to the lack of formal
approaches to dairy risk mitigation, this research develops a new framework that
categorises risks to the supply chain in terms of sustainability, and identifies possible
outcomes of appropriate mitigation strategies. This is a significant contribution to the
theoretical aspects of dairy supply chain risk management. It is important to know the
impact of mitigation strategies for various risks based on performance outcome. This
research uses performance analysis to find the perfect match between supply chain
risks and mitigation strategies selected from available options. The next section
discusses performance outcomes based on the implementation of mitigation strategies.

74
3.8 PERFORMANCE OUTCOME
Performance outcome is the result of effective and efficient management responses.
Outcomes in terms of efficiency and effectiveness are linked to risk management
responses which help to measure existing risks in supply chain (Ritchie and Brnidley
2007b). Ritchie and Brindley (2007) explain that risk management responses include
risk insurance, information sharing, joint training, regular joint reviews and developing
risk management awareness and skills.Several research models have been developed
to identify the performance outcomes that can able to measure the risks. Bettis (1982)
developed a model in which performance outcomes are linked to industry
characteristics, strategic decisions and risk. Carter & Rogers (2008) propose a
sustainable supply chain model, which features sustainable outcomes like warehouse
safety, worker safety, lower labour costs due to the motivation of supply chain
personnel, better quality product and reputation enhancement.
The dairy industry, which plays a crucial role in the agro-based economy of a country,
provides enough scope for the rural and sub-urban people to earn extra money in their
leisure time (Mishra and Shekhar 2012; Mishra and Shekhar 2011). Livestock are well
integrated into the mixed farming system in Bangladesh, where 25% of the population
are directly involved in livestock production and another 60% are indirectly involved
(BBS 2010). Livestock are reared, not only to be eaten on occasion, but also to earn
cash income through a range of other products such as meat, milk, eggs, draught
power, manure, skin, feather and horns. Sale of livestock and livestock products
enables poor families-in particular destitute women-to attain increased stability in
income for the family without disrupting household activities. Small-scale livestock
production does not compete with crop production. Instead crop and livestock
production supplement each other. The livestock production therefore provides
opportunities for rural people to improve their livelihood without disrupting the
balance of the integrated farming system (Jahan and Rahman 2003).
Dairying is a good source of income for small and marginal farmers. The feeds required
for milk production can be met from their limited land resources, as most of the milch
animals are ruminants and the majority of their food can be derived from forage,
coarse roughage and by-products not utilised by human beings, without incurring
much additional cost. Dairy animals, comprising cows and buffaloes, are the major
livestock and hold a very important place in the national economy of Bangladesh. Apart
from their role in milk production, they contribute a huge quantity of organic manure,

75
which is one of the major inputs to Bangladesh agriculture. Dairying is a subsidiary
occupation of almost all farmers in Bangladesh. More than 60% of the families involved
in dairying consist of small and marginal farmers and even agricultural labourers.
Diseases and parasites are a major problem for the dairy industry in Bangladesh.
Diseases like rinderpest, contagious bovine pleuro-pneumonia, and foot and mouth
disease cause high mortality and severe economic loss (Shamsuddoha and Edwards
2000; Edwards and Daniel 1992).
Table 3.6 shows sustainable outcomes described by various authors based on the
concept of triple bottom line. For instance, profit maximisation, cost minimisation,
income and production increments are categorised as economic outcomes. Goodwill,
food quality, nutrition development, increased living standards and employment
creation are categorised as social outcomes. Waste management and hygiene practice
are categorised as environmental outcomes. If a farm can implement appropriate
strategies to achieve these sustainable outcomes, then it can be called a sustainable
business.
Table 3.6: Sustainable Outcomes from Literature
Sustainable aspects
Outcomes References
Economic
Profit maximisation through increasing sales
(Fawcett, Magnan and McCarter 2008), Wagner and Neshat 2010) (Shamsuddin, Alam, Hossein, Goodger, Bari, Ahmed, Hossain, et al. 2007)
Cost minimisation through reducing utility cost
(Carter and Rogers 2008, Bennett 2004, Wagner and Neshat 2010, Fawcett, Magnan, and McCarter 2008)
Increasing income through higher production
(Bari 2008Abdullah 2004, Ghani and Rahman 2004, Jabbar 2010, Shamsuddoha 2009, Kabir and Huo 2011)
Increase in production by proper cattle management
( Abdullah 2004)
Product quality improvement by TQM approach
(Abdullah 2004, Raha and Talukder 2004, Fawcett, Magnan, and McCarter 2008)
Expansion of farming system (Shamsuddoha and Edwards 2000, Bari 2008)
Production of value added product and diversified product
( Ghani and Rahman 2004)

76
Social
Goodwill enhancement (Carter and Rogers 2008b)
Supply of quality food to the consumer
( Raha and Talukder 2004)
Nutritional development (Okano, Vendrametto, and Santos 2010, Bari 2008, Haque 2009, Ghani and Rahman 2004, Halder and Barua 2003)
Improvement of living standard
(Bari 2008; Curtis 2011; Khan, Peters and Uddin 2009)
Creation of employment opportunity
(Ritchie and Brnidley 2007, Bari 2008, Jabbar 2010)
Environmental
Creation of sound working environment
(Carter and Rogers 2008 , Group 2009)
Waste management (Al Mamun, Nasrat, and Debi 2012, Loehr 1974)
Environmental development(increase in hygiene practice)
(Khanna 2004 , Group 2009)
Despite numerous research studies into supply chain risk management, little attention
has been given to dairy supply chain risk management and the probable outcomes of
risk mitigation strategies in terms of sustainability. This research attempts to meet this
gap by identifying the possible sustainability outcomes of risk mitigation strategies
implemented at the dairy farm level in Bangladesh.
3.9 THEORETICAL FRAMEWORK: CONTINGENCY THEORY AND SUSTAINABILITY
THEORY FOR SCRM
This research is built on two theoretical underpinnings: Sustainability and Contingency
theories (Carter and Rogers 2008a; Faisal 2010). As described earlier, sustainability
incorporates environmental, social and economic components that allow an
organisation to achieve long term viability (Carter and Rogers 2008a). According to the
World Commission on Environment and Development (WCED1987, p.8), sustainable
development is ‘development that meets the needs of the present without
compromising the ability of future generations to meet their needs’.
On the other hand, potential initiatives for reducing long term risks related to resource
depletion, fluctuation in energy costs, pollution and waste management can also be
described as sustainability (Shrivastava 1995). The Sustainable Agriculture Initiative
(SAI) Platform 2005 reports that good management of a farming system refers to
economic, environmental and social sustainability. The report adds that overall
sustainability is the outcome of sustainable farming systems (breed management, feed
77
management, milking hygiene), economic sustainability (food quality, production
quality and production profitability), social sustainability (proper training and fair
treatment to employees) and environmental sustainability (bio-diversity, energy,
waste management, water).
Bagheri and Hjorth (2007) consider that sustainability is not a fixed ideal but an
evolutionary process which can improve management systems by improving
knowledge and understanding. In recent years, improved understanding has required
that strong attention be given to the sustainability of supply chains. However, as Faisal
(2010) observes, very limited research has been conducted into the impact of
sustainable supply chains focusing on the protection of green, global and social capital
associated with an organisation’s overall economic welfare. In addition, research has
ignored the area of competitive advantage development arising from sustainable
supply chains (Markley and Davis 2007) and future competitive advantage through
sustainable supply chains. Thus it is apparent that, in order to develop a sustainable
global economy, it is necessary to implement sustainable supply chain strategies and
evaluate their impact.
The dairy sector of Bangladesh is rural based and experiences various risk factors
concerned with breeding, feeding, management, diseases and marketing
(Shamsuddoha and Edwards 2000). The risks can be eliminated using proper
strategies. At the same time, the Bangladesh dairy industry could achieve sustainable
outcomes through the appropriate implementation of strategies. The term
sustainability has been used in different research domains but little research has been
conducted on the dairy sector and its supply chain management. In an effort to explore
sustainability theory in a supply chain context, this research will categorise the supply
chain risks in terms of their sustainability aspects. This categorisation will be useful for
developing risk mitigation strategies which will ultimately lead to sustainable
outcomes for the dairy sector.
Contingency theory assumes that the effectiveness of an organisation in coping with
the demand of its environment is contingent upon the elements of its various sub-
systems (Thomas 1986) and situation favourableness (Fiedler 1971). Tosi and Selcom
(1984) argue that contingency theory must include both environmental sectors (users
of output, input sources and external regulators) and attributes of specific sectors
(customers, raw product supplies, capital sources, technology). Contingency theory is a

78
framework for organising knowledge in a given area, acknowledging that certain
variables may affect the outcome of a process (Tait and Vessey 1988). Zeithaml,
Varadarajan and Zeithaml 1988b) distinguish three types of variables: contingency
variables, response variables and performance variables (Zeithaml, Varadarajan and
Zeithaml 1988b).
Contingency variables are situational characteristics, response variables are
managerial actions and performance variables are dependent measures which evaluate
the effectiveness of contingency variables and response variables (Thomas 1986;
Zeithaml, Varadarajan and Zeithaml 1988b). In this research, contingency theory is
used to develop a framework based on these three variables, where contingency
variables represent the risk categories in terms of sustainability, response variables
represent risk mitigation strategies, and performance variables represent possible
outcomes. The adoption of principles of sustainability in supply chain management is
challenging because there are pressures from surrounding stakeholders to integrate
sustainable components into the supply chain. Dairy supply chain risks are situational,
and contingent upon environmental uncertainty, technology and organisational size.
Moreover, this industry directly or indirectly involves the livelihood of a significant
number of people. This research will thus resolve the existing problems relating to
achieving sustainability in the context of current dairy supply chain risks.
3.10 SUMMARY OF RESEARCH GAPS
This section articulates the research gaps found in sections 3.3 to 3.9. Initially, the
literature studies found limited research on Bangladesh dairy supply chain risk
management. The research limitation is based on identifying dairy supply chain risks,
especially those associated with sustainability, and subsequently analysing the risks in
terms of high probability and high impact. Such problems can be solved through
identifying suitable strategies to solve particular risks. The literature review also failed
to explore appropriate recommendations for real-life practices on improving
infrastructure, environmental hazards, operational skills, accumulated efforts and the
like. Hence this research investigates existing dairy operations and their outcomes in
terms of the triple bottom line aspects of sustainability.
This research also attempts to categorise the risks associated with the dairy supply
chain from a sustainability perspective and simultaneously develops mitigation
strategies and discusses probable outcomes. In existing studies, there has been little

79
research on identification of the risks on the basis of sustainability. Thus this research
fills the existing gaps in knowledge concerning the dairy supply chain. It is important
to know the impact of mitigation strategies for various risks based on performance
outcome. In response to the lack of formal approaches to dairy risk mitigation, a new
framework is developed to categorise risks to the supply chain in terms of
sustainability, and identifies possible outcomes of appropriate mitigation strategies.
This is a significant contribution to the theoretical aspects of dairy supply chain risk
management. This research also uses performance analysis to find the perfect match
between supply chain risks and mitigation strategies selected from available options.
In this research, contingency theory is used to develop a framework based on three
variables, where contingency variables represent the risk categories in terms of
sustainability, response variables represent risk mitigation strategies, and
performance variables represent possible outcomes. The adoption of principles of
sustainability in supply chain management is challenging because there are pressures
from surrounding stakeholders to integrate sustainable components into the supply
chain. Dairy supply chain risks are situational, and contingent upon environmental
uncertainty, technology and organisational size. Moreover, this industry directly or
indirectly involves the livelihood of a significant number of people. This research will
thus resolve the existing problems relating to achieving sustainability in the context of
current dairy supply chain risks.
Overall this study has filled the research gaps for Bangladesh dairy and its supply chain
risk management issues to achieve sustainability. First this research has taken
initiative to explore the risks associated with the dairy industry in Bangladesh. Then ,
risks are categorised based on probability of occurrence and severity of impact. The
current research has then identified appropriate mitigation strategies for specific risks
found in the dairy operations in Bangladesh. Lastly probable outcomes are identified
for sustainable dairy production and process. Dairy supply chain risk management is
very contemporary. Yet there is no adequate comprehensive approach to identify
dairy risks and their sustainable mitigation strategies. Hence this study contributes to
fill the research gap prevailing in dairy supply chain risk management in Bangladesh.
3.11 PROPOSED RESEARCH MODEL
Drawing on the relevant literature, a risk mitigation model was developed (Figure
3.10). In this model, supply chain risks are identified based on different level of storage,
process and distribution. Identified risks are then categorised in terms of the three

80
aspects of sustainability. Similarly, mitigation strategies are identified and classified in
terms of the three aspects of sustainability. Finally mitigation strategies are
implemented in order to achieve a sustainable outcome.
Supply chain risk variables were collected from the primary sources through
qualitative interviews. Interview responses were transcribed and key variables were
identified. A number of variables were rejected due to insufficient responses and
limited importance. Respondents were asked about particular mitigation strategies
associated with various supply chain risks. The findings show that sustainable
outcomes can be achieved once appropriate mitigation strategies are deployed for
particular supply chain risks. A sustainable outcome is a combined result of the
economic, social and environmental aspects of mitigation strategies over the risks
arising at the storage, process and distribution levels.
Supply Chain Risks
(Economic, Social and
Environmental)
Risk Mitigation
StrategySustainable
Outcome
Storage Process
Economic Social Environmental Economic Social Environmental Economic Social Environmental
Distribution
Economic Social Environmental
Figure 3.10: Dairy Supply Chain Risk Mitigation Strategy Model
3.12 SUMMARY
This chapter reviewed the literature relevant to this current research. The theoretical
concepts of sustainability, triple bottom line, sustainable supply chain, dairy supply
chain, supply chain risks, supply chain risk management, dairy supply chain risk and
dairy supply chain risk management were defined and reviewed. The review revealed
the gaps in knowledge and highlighted the significance of this research. This chapter
also presented an initial research model based on sustainability and contingency
theories. The next chapter discusses the research methodology and research design,
along with the operationalisation of the major phases of the research.

81
CHAPTER 4: RESEARCH METHODOLOGY
4.1 INTRODUCTION
This chapter details the research methodology used to conduct the current research. It
describes the research method, process and tools used in the study. Different authors
have defined research methodology variously as the systematic exploration of facts and
principles or the collection and analysis of information to address specific research
objectives and questions (Tress, Tress and Fry 2006; Ritchie and Lewis 2003; Bernard
2012; Denzin and Lincoln 2011; Wilkes and Krebs 1995). In this chapter, the research
questions and objectives that were presented in Chapter 1 provide the basis for the
action of this study. The ‘mixed methods’ approach, that is, the combination of both
qualitative and quantitative approaches, is used (Teddlie and Tashakkori 2003;
Tashakkori and Teddlie 2003). A step-by-step method for conducting the three basic
stages of this research-the interview, questionnaire survey and case studies-is
described in this chapter. The chapter also explains the adopted methods in terms of a
positivist paradigm and includes the rationale and justification for using this method to
conduct the research.
4.2 RESEARCH PARADIGM
A research paradigm is a conceptual framework that guides the research activities,
including the research design, data collection method, presentation and interpretation
of findings. The research paradigm can be regarded as a set of basic principles which
allows researchers to recognise their role in the research process (Lincoln and Guba
1994). According to Gephart (1999), there are three philosophical paradigms:
positivism, interpretivism, and critical science.
The positivist research paradigm attempts to apply the methods and principles of the
natural sciences model to explain the behaviour or phenomena in terms of a causal
relationship. In positivist research, researchers assume that reality is independent from
the knower and the research is objective-oriented (Johnson 2004; Smith 1983). In this
view, data collection and analysis are value-free rather than based on subjective
interpretation (Krauss 2005). The positivist paradigm features specific research
questions and hypotheses testing connected with quantitative research (Johnson 2004;
Johnson and Onwuegbuzie 2004; Creswell 2008; Creswell 2002). Furthermore,
positivist researchers do not reach conclusions based on their own cognition or

82
rationality; rather they usually maintain a distance from the participant(s) and what is
being researched, and see reality as ‘being’ rather than ‘becoming’ (Dwivedi 2007).
The second research paradigm is the interpretivist paradigm. This paradigm features
qualitative methods. Interpretivism attempts to interpret the inter-subjective meanings,
where a phenomenon is subject to multiple explanations or realities rather than one
causal relationship or one theory (Schwandt 1994; Neuman 1997; Creswell 2002, 2013).
In contrast with the positivist researcher, the interpretivist researcher believes that the
researcher should interact with and affect the issues being researched and see all
things as ‘becoming’ (Creswell 2013). The positivist paradigm informs quantitative
research by seeing information as flowing from a logical and mathematical scientific
process (Fairclough 2003; Larraâin 1979), whereas the interpretivist approach aims to
develop a natural science through social interpretation (Neuman 2005) which is
normally used in qualitative research (Creswell 2013).
The third paradigm, critical science, is a combination of critical theory and
postmodernism. It seeks to provide historical understandings through the re-
examination of important events to reveal unacknowledged forms of exploitation and
domination (Swanson and Holton 2009). This paradigm usually focuses upon opposites,
conflicts, and contradictions (Myers 1997) and takes a qualitative approach, although
the quantitative approach is becoming increasingly prominent.
The use of these underlying paradigms varies. Orlikowski and Baroudi (1991) state
that 96.8% of studies they examined took a positivism approach, only 3.2% took an
interpretivism approach and none employed critical epistemology. Mingers (2003)
states that 75% of the research studies were examined using positivist approach, 17%
took an interpretivist approach and only 5% took a critical theory approach.
When considering the research paradigm and methodology of the present study, it is
necessary to reflect on the objectives, nature, and context of the research. This research
on dairy supply chain risk management attempts to identify risk sources, measure the
risks and develop risk mitigation strategies with probable outcomes. Initially qualitative
methods were used to identify risks and possible mitigation strategies; later quantitative
methods were used to examine the effectiveness of the risk mitigation strategies and the
probable outcomes. Most studies take either a mono-method approach (such as a
positivist (quantitative) or an interpretivist (qualitative) approach) or a mixed methods
approach (Venkatesh, Brown and Bala 2013). However, the nature of the current study

83
places both quantitative and qualitative research methods under a positivist paradigm.
There was a long debate on mixed methods and the positivist paradigm in the 1970s and
1980s, and some researchers favoured using mixed methods under positivist paradigm
(Hall 2012). The current study is conducted within a positivist paradigm.
This study takes a mixed methods approach as both qualitative (designed to collect
words) and quantitative (designed to collect numbers) (Greene, Caracelli and Graham
1989a; Marshall and Rossman 2014) data were collected. Within the positivist
paradigm, the mixed method design adopted in this research was concerned with the
collection of both qualitative (identification of risk sources and risk mitigation
strategies) and quantitative (measurement of the effectiveness of the risk mitigations
strategies and probable outcomes) data. The reason for quantifying the risks was to
identify the most highly probable and high impact risks. The effectiveness of mitigation
strategies was examined in terms of optimisation. Therefore, the acceptable risks and
mitigation strategies needed to be confirmed by a group of dairy farm representatives.
The likelihood of new risk sources and possible mitigation strategies was also
explored. For these purposes, a qualitative study was conducted. This was followed by
a quantitative study conducted to measure high probable and high impact risks,
objectively evaluate the effectiveness of mitigation strategies, and determine probable
outcomes.
The combination of qualitative and quantitative methods within one study is common
in behavioural studies (Bailey 2008; McEachern and Warnaby 2005; Beedell and
Rehman 1999). Most studies of supply chain risk management (SCRM) are guided by
either a positivist (quantitative) or an interpretivist (qualitative) paradigm. However,
for the above-mentioned reasons, a mixed methods approach has been approved for
this study. This approach combines the virtues of qualitative methods to answer
exploratory questions and quantitative methods to answer confirmatory questions
(Tashakkori and Teddlie 2003) posed by the study.
4.3 RESEARCH METHOD
4.3.1 Mixed methods
The combination of both qualitative and quantitative methods usually termed ‘mixed
methods’ (Tashakkori and Teddlie 1998) is used in this research. This mixed methods
approach implies a third paradigm (Tashakkori and Teddlie 1998). In the mixed
paradigm, a blend of qualitative and quantitative approaches is taken to diverse
segments within the whole research process. According to Greene et al. (1989b), mixed

84
methods refers to “studies that contain at least one qualitative method (to collect
words) and one quantitative method (designed to collect numbers), where none of the
methods is integrally linked to any particular inquiry paradigm”. Referring to
Tashakkori and Teddlie (1998), the mixed methods approach refers to studies that use
qualitative and quantitative data collection and data analysis either equally or
sequentially. Creswell (2003) identifies four major types of mixed methods research
design (shown in Figure 4.1): triangulation design (collect and compare the data
collected using both qualitative and quantitative methods to validate or expand
quantitative results with qualitative data); the embedded design (the collection of both
qualitative and quantitative data, but one of the data types takes a supplementary role
within the overall design)the explanatory design (the collection and analysis of
quantitative data addressing the study’s questions, followed by subsequent qualitative
data collection and analysis); and the exploratory design (to explore a phenomenon,
begins with qualitative data and then moves to a second quantitative phase).
The current research is an exploratory study that builds on the initial qualitative
findings and progresses to generalizable results in the quantitative phase (Creswell
2008). The qualitative part of this research is limited to a small number of interviews
as few respondents were available. As discussed in Chapter 1, the main objective of this
research was to explore the risk issues and mitigation strategies of dairy supply chains,
along with sustainable outcomes resulting from strategy implementation. Thus a
qualitative field study employing semi-structured interviews was conducted to identify
risks associated with the dairy sector in Bangladesh and potential strategies to mitigate
those risks. Finally, a quantitative study taking the form of a survey was carried out.

85
Figure 4.1: Four Types of Mixed Method Design (Creswell 2002)
4.3.2 Case studies
Case studies refer to a particular form of qualitative research consisting of in-depth
studies of cases over time, using multiple sources of information obtained through
observation, documents, questionnaires and interviews (Seawright and Gerring 2008).
A single case study involves an in-depth, longitudinal study of a single event with a
limited number of variables, rather than using large samples and following a rigid
protocol. Yin (2003) defines a case study as an empirical/practical investigation that
inspects a current phenomenon within its real-life context. Case studies can focus on
understanding or investigating relationships in either one or many organisations
(single or multiple cases). They provide a systematic way of examining events.
Therefore, they can be used for many purposes, including providing descriptions,
testing theories and generating theories (Yin 2009, 1994; Yin 2011; Yin 2003). An

86
extensive review of the research literature reveals that case studies could be most
appropriate for this research study because they principally address those research
problems that ask ‘how’ and ‘why’ type questions (Eisenhardt and Graebner 2007; Yin
2003). Thus, in this research, case studies of two large scale commercial dairy farms
were conducted using combined methods of data collection including observation,
interviews and questionnaires. It is noted here that both case industries have granted
permission to reveal their names. A dairy farm operating with more than 3.0 hectares
of land and eighty to one hundred cows can be classified as a large scale dairy farm
(Uddin 2003; Saadullah 2011; Islam et al. 2002). In this sense both of the cases are
large scale dairy farms. Miles and Huberman (1994b) and Eisenhardt and Graebner
(2007) suggest that case studies have the advantage of collecting a range of data from
experienced people. The two cases are briefly described below.
4.3.2.1 Nahar Agro Farms Limited
Nahar Dairy was founded at the beginning of the 1990s. It was a family-owned farm
initially having a cluster of 35 cattle. They invested one million Bangladeshi Taka which
is equivalent to AUD $14,500. They continued with that small dairy farm for around
ten years with a maximum of 55 cattle, AUD $30,000 and 250 litres of milk production.
In 1999, Nahar Dairy restructured their farm with the scope of bigger lands, capital and
logistics. At present, they have 560 cattle of all kinds with 2,600 to 3,000 litres of milk
production per day. Nahar Dairy also developed its supply chain network to maintain
proper supply. Table 4.1 shows the distinctive features of the two case farms to
highlight their differences.
4.3.2.2 Paharika Farms Limited
Paharika Dairy was founded at the beginning of 1996 as a private limited commercial
farm. They started with around 200 cattle with 700 litres of milk production per day.
They invested three millions Bangladeshi currencies (Taka) which is equivalent to
approximately AUD $43,000 to maintain milking machines, a chiller machine, transport
and scientific sheds and management. They have slowly expanded their farm. At
present, they have 352 cattle of all kinds with 1,300 to 1,500 litres of milk production
per day. They also added chiller facilities of 1,000 litres to preserve their milk for over
time in the summer. They still keep their modest, scientific farm confined within the
same place. Table 4.2 shows the comparison analysis for two case farms to highlight
the differences.

87
Table 4.1: Nahar and Paharika at a glance
Subject Nahar Paharika Size (No. of employees) 55 32 Production (L/day) 2600–3000 1300–1500 Chiller capacity (Litre) 3000 1000 Milk shed 3 1
Table 4.2: Average Milk Production of Case Industries
4.4 RESEARCH PROCESS
The research process was carried out in sequential steps. It commenced with an
extensive review of the literature related to theories of supply chain risk management.
From the literature review, the initial risks, mitigation strategies and sustainable
outcomes (after implementing mitigation strategies) for dairy industries were
identified. The next step was the conduct of the qualitative field study using interviews
and content analysis of the interview responses. The field study findings were then
used to refine the risks, mitigation strategies and sustainable outcomes identified from
the literature. The next phase involved the development and design of a questionnaire-
based survey using the literature review and field study findings. Data for QFD analysis
were collected from the two case industries. These data were collected through a three-
part questionnaire-based survey of employees, executives and supply chain members.
The gathered quantitative data was then analysed. The Quality Function Deployment
(QFD) tool was used to test the effectiveness of the results, which were then
interpreted and discussed. The whole process of this study is diagrammatically
presented in Figure 4.2.
Year Nahar Production Paharika Production 2010 670 720 2011 877 770 2012 1522 1184 2013 1928 1232 2014 2630 1355

88
Figure 4.2: The Sequential Presentation of the Research Process.
Step I: Literature review
This step involved a thorough review of the literature to identify gaps in knowledge
and produce research objectives and construct a model. This is done by reviewing
literature in journals, books, seminar proceedings, working papers and the other
sources. Following the literature review, the research questions and corresponding
research objectives were outlined. Several research questions and objectives were
developed. These were sketched in Chapter 1.
Step II: Initial identification of risks, mitigation strategies and sustainable
outcomes in the dairy industry
The review of the literature revealed a range of risks, mitigation strategies associated
with the dairy industry, and different sustainable outcomes that may be attained
through implementing mitigation strategies.
Step III: Qualitative data collection and content analysis
Interviews were conducted with 10 respondents (farm managers/owners) from two
large scale commercial dairy farms in Bangladesh. Both farms are rapidly growing and
I. Literature Review
III. Qualitative Data Collection and Content Analysis
IV. Refinement of risks, mitigation strategies and sustainable outcomes
V. Questionnaire Development
VI. Data Collection for QFD analysis
II. Initial identifications of risks, mitigation strategies and sustainable outcomes of dairy
VII. Data Analysis (QFD)
VII. Result Interpretation and Discussion

89
facing different risks to their existing operations. Different risks at the storage, process
and distribution levels of the dairy supply chain were identified. Possible risk
mitigation strategies were also identified through interviews with stakeholders in the
case industries and the probable sustainable outcomes were also identified. The
interviews were conducted using semi-structured questions and subsequently
transcribed by the researcher. Then the transcribed data were analysed using the
content analysis method recommended by Miles and Huberman (1994b) and Marshall
and Rossman (2010). The findings revealed the risks, mitigation strategies and
sustainable outcomes (after implementation of different risk mitigation strategies) for
the two dairy farms.
Step IV: Refinement of risks, mitigation strategies and sustainable outcomes
The dairy supply chain risks, possible mitigation strategies and sustainable outcomes
were identified. Decisions concerning the inclusion of important variables and the
exclusion of similar variables were made in this stage.
Step V: Questionnaire-based survey development
In this step, a three-part questionnaire-based survey was designed based on the
findings of the in-depth interviews. The first part of the questionnaire was structured
to collect data about the probability and impact of risks in the dairy farms. Participants
were asked to rank the probability of the occurrence of risk and its impact on the dairy
supply chain. The second part of the survey was developed to gather data regarding the
relationship between risks and mitigation strategies. The strength of this relationship
was scored (strong, medium, weak) by the participants. Once this was done, the third
part of the survey was designed to collect data about the relative costs of
implementation of each mitigation strategy.
Step VI: Data collection for QFD analysis
In this step, the data required for QFD analysis were collected via the survey. Data were
collected from two large scale commercial dairy farms. The researcher has access and
considerable contacts with these farms and their support enabled the collection of
detailed and accurate data. Data for the case studies were collected from employees,
executives and supply chain members. It should be noted that data were collected at
the farm level, as farms produce, store and distribute milk and milk products through
the supply chain.

90
Step VII: Data analysis (QFD)
Data gathered through the survey were analysed using the Quality Function
Deployment (QFD) technique. The QFD analysis produced a descriptive analysis which
helped to identify the highly probable and high impact risks and appropriate risk
mitigation strategies for each dairy farm. The QFD method is discussed in Section
4.5(Research Framework Based on QFD).
Step VIII: Results interpretation and discussion
The final step in the process was the interpretation and discussion of the results
obtained from the QFD analysis. The detailed results for each group (employees,
executives and supply chain members) of both case industries were included. .
4.5 RESEARCH FRAMEWORK BASED ON QFD
In this section, the meaning of QFD is explained and its applications, along with its
advantages and disadvantages, are described.
4.5.1 Quality Function Deployment (QFD)
Quality Function Deployment (QFD) was first developed in 1972 by Professor Yoji
Akao at the Tamagawa University in Tokyo. It has since been introduced into numerous
industrial and service applications throughout the world (Fowler 1991; Al-Mashari,
Zairi and Ginn 2005). Quality Function Deployment (QFD) is defined differently by
different authors. In a general sense, QFD is an organised process of a set of interlinked
engineering and management plans with a visual language that uses various
management tools. It involves establishing customer value by using the voice of the
customer and converting that value to design, manufacturing and production process
characteristics. The QFD process is often referred to as “listening to the voice of the
customer”(Sower, Savoie and Renick 1999). Ronald G. Day (1993) defines QFD as a
planning process, not a tool. Akao (1997) defines Quality Function Deployment as
“converting the consumers' requirements into design requirements and developing a
design quality for the finished product by systematically deploying the relationships
between the demands and the characteristics, starting with the quality of each
functional component and extending the deployment to the quality of each part and
process. Overall quality of the product formed through this network of relationships
(Akao 1997, 1994). So Quality Function Deployment assigns responsibility for
producing a quality item to all parts of a corporation. American Supplier Institute
(Bottani and Rizzi 2006) defines QFD as “a system for translating consumer
requirements into appropriate company requirements at each stage from research and

91
product development to engineering and manufacturing to marketing/sales and
distribution’’.
QFD is also referred to in terms of the “house of quality” (HOQ) model because when
the matrices in QFD fit together, they form a house-shaped diagram (Kutucuoglu et al.
2001; Bicheno 1994). This is a method of providing structure to the development cycle
by linking it to the framework of a house. The foundation of the house represents
customer requirements and the frame represents different types of planning matrices
including importance ratings, relationship ratings, scale-up factors and so on. The
second floor of the house represents design requirements and the roof represents the
correlation of design requirements. The walls represent the relationship matrix
between customer requirements and design requirements.
Generally in QFD modelling, “customer requirements” are referred to as WHATs and
“design requirements” are referred to as HOWs. Different users use QFD models in
different ways, each involving different components, but the most simple and widely
used QFD model contains at least the customer requirements (WHATs) and their
relative importance, technical measures or design requirements (HOWs), the
importance ratings of the HOWs and their relationships with the WHATs. In a basic
QFD model, the following input information is required:
I. WHATs: The required benefits of a product or service in the customer’s own
words – also called customer requirements.
II. HOWs: Design attributes or technical descriptors of the product also called
design requirements.
III. WHYs (Importance): Relative importance of the customer requirements as
perceived by the customers
IV. WHATsvs. HOWs (Relationship matrix): Relationship between WHATs and
HOWs (strong, medium or weak) prepared through the judgement of which
WHATs impact which HOWs and to what degree.
V. HOWs vs. HOWs (Correlation matrix): The interrelationships among the design
requirements (HOWs) also known as ‘’the roof matrix’’.
VI. Action plan: The weights of the HOWs.

92
4.5.2 Applications of QFD
QFD originally belonged to the domain of quality management (Bevilacqua, Ciarapica
and Giacchetta 2006; Chan and Wu 2002). The techniques of QFD later expanded to
wider fields including engineering, management, teamwork, planning and decision
making (Chan and Wu 2002). Overall, QFD is a planning technique to improve quality,
reduce development cost and pre-production costs, increase organisational capabilities
and, above all, make an industry more competitive. Although there have been different
applications of QFD reported in the literature, most focused on product development;
only a few focused on strategic planning (Wang and Hong 2007). This research makes
use of the QFD technique to assess the level of dairy supply chain risk mitigation and to
determine the optimum set of risk mitigation strategies so that the objectives of these
strategies can be achieved.
QFD Advantages
QFD has many advantages, primarily in management. There are many reports of its
successful application, including: Hsieh, C.-H. and Y.-C. Wu (2016), Yoji Akao (1997),
Robert King (1989), author of ‘Better Designs in Half the Time’, Bossert (1991), author
of Quality Function Deployment (QFD) for practitioner approach, Fortuna (1988) of
quality upstream, and Kenny (1988) for new paradigm for quality assurance and the
like. These authors list the advantages of QFD as follows:
QFD results in major savings in development time and costs, shorter design
cycles and changes (Gunasekaran 1998; Howell 2000).
QFD helps companies use competitive information effectively and prioritises
the results (Bossert 1991, 6).
QFD promotes teamwork by improving multifunctional communication and
participation (Bouchereau and Rowlands 2000b; Bouchereau and Rowlands 1999;
Carnevalli and Miguel 2008).
Using QFD makes the quality and output of a service more precise through a
continual improvement process, so that a company can reach world class (Howell
2000; Fortuna 1988).
QFD simplifies customer priorities for competitive advantage (Shahin 2005;
Stocker 1991).
QFD brings together large amounts of verbal data, organises data in a logical
way, and generates better data for filtering the design of future products and services
(Ermer and Kniper 1998).

93
QFD Disadvantages
Despite the numerous advantages listed above, QFD is not a panacea for planning and
manufacturing processes. It is a flexible tool that can be applied incorrectly or
inconsistently, like any new process. If applied incorrectly, QFD may increase the
workload and create problems in production development (Akao 2004, 3; Akao 1990).
A few common disadvantages of QFD are outlined below:
QFD is not always simple to implement, particularly in large, complex systems;
companies have faced problems using QFD (Harding et al. 2001).
QFD is a time consuming process (Prasad 1993).
In QFD, it is difficult to categorize the answers given by customers as demands,
due to ambiguity in the voice of the customer (Dahlgaard 1994).
4.6 FRAMEWORK OF HOUSE OF QUALITY FOR QFD MODEL
In this research, the QFD method is contextualised for the dairy industry, with different
connotations attached to the WHATs, HOWs, HOW MUCHs, etc. Figure 4.3 shows the
QFD model developed for this research. The below figure 4.3 portraits the House of
Quality (HoQ) based on QFD model.
Figure 4.3: House of Quality (HoQ) for QFD Model
2. How (Mitigation strategies)
(j)
1. WHAT(Risk Sources)
(k)
4. What vs. How(Relationship between risk and mitigation
strategy)RELkj
3. WHY(Importance of
risk)(DIk)
5. How much (Relative cost)(RCj)
7. Action Plan (Absolute importance, Relative
importance)(AIj)
6. Correlation between Strategy i and J (Savings Percentage)
(SVij)

94
Note: Risk=k, Mitigation strategy=j, Correlation matrix=SVij, Degree of importance of risk=DIk,
Relationship matrix (degree to which k is met by j)=RELkj, Absolute importance=AIj, Relative
cost=RCj.
In this model:
I. WHATs are the risks associated with the dairy supply chain.
II. HOWs are the mitigation strategies that an organisation can adopt to control
the risks.
III. WHYs (Importance) refer to the degrees of importance of risks; this is
determined by prioritising the risk sources.
IV. WHATS vs. HOWs (Relationship matrix) refers to the relationships between
risks (WHATs) and mitigation strategies (HOWs); this is determined by judging
which risks need which strategies and to what degree.
V. HOW MUCHs are the relative costs to implement each strategy.
VI. HOWs vs. HOWs (Correlation matrix) refers to the interrelationships among the
mitigation strategies (HOWs) and the cost savings associated with
implementing strategies simultaneously.
VII. Action plans are the weights of the mitigation strategies (HOWs).
4.6.1 The QFD Process Quality Function Deployment (QFD) is a useful tool that uses a series of structured
management processes (Chen and Ko 2010). Chen and Ko (2010) applied a four phase
QFD to mitigate risk in new product development processes. Ertay et al. (2005) used it
as a cross-functional planning tool for product planning and design. This research
applied a networked QFD process over two phases, as described by (Kahraman, Ertay
and Büyüközkan 2006). Phase1 involved constructing a HoQ showing the relationship
between risks and mitigation strategies, while Phase2 involved constructing a HoQ
showing the relationship between mitigation strategies and sustainable outcomes.
Figure 4.4 shows the two phase QFD process (Kahraman, Ertay and Büyüközkan 2006).

95
Phase 1 Phase 2
Figure 4.4: Networked QFD Process (Kahraman, Ertay and Büyüközkan 2006)
Phase1 of the QFD process is completed by following the approaches suggested by
Brown (1991), Griffin (1992), Griffin and Hauser (1993, 1992), Park and Kim (1998)
and Bevilacqua et. al. (2006). The whole process of Phase 1 has two parts: Part I and
Part II.
Part I:
According to step IV and VI of section 4.4 (Research Process), Part I of Phase 1 of the
process involves preparing data for QFD analysis and calculating the relationship
matrix, Absolute Importance (AI) and Relative Importance (RI). Part II of Phase 1 of the
process consists of optimisation of dairy supply chain risk mitigation problems through
the use of an appropriate mathematical programming model. The problems are solved
using linear and integer programming, considering the organisational resource
constraints.
The stepwise procedures for Part I of Phase 1 are as follows:
Step 1: Identify the WHATs: The risks associated with the dairy supply chain.
Step 2: Identify the HOWs: Possible strategies to mitigate risks associated with the
dairy supply chain.
Step3: Calculation of WHY: Calculate the degree of importance of the WHATs (risks) by
prioritising them.
Step 4: Preparation of the relationship matrix: The relationship between risks and
mitigation strategies (WHATs vs. HOWs), where the relationships are rated as weak,
medium and strong, with a corresponding value of 1, 5, and 9.
Step 5: Identify the HOW MUCHs: The relative costs of implementing each strategy.
Risks 1
Mitigation
Strategies
Sustainable Outcomes
Mitigation
Strategies 2

96
Step6: Elaboration of the correlation matrix: A correlation matrix of mitigation
strategies (HOWs), also known as a ‘roof matrix’ (How vs. How) was constructed to
depict the cost savings of implementing strategies simultaneously.
Step 7: Action plan: The weights of the mitigation strategies (HOWs) were calculated
which are also termed as absolute importance. These weights are one of the main
outputs of the QFD analysis. Relative importance (RI) of mitigation strategies was also
calculated at this step.
The approach has taken involved the translation of QFD principles from dairy supply
chain risk identification to dairy supply chain risk mitigation. While the traditional HoQ
correlates customer requirements (WHATs) with design requirements (HOWs), in this
research risks (WHATs) are correlated with possible mitigation strategies (HOWs) that
could be undertaken by the dairy industry stakeholders to improve the condition of
dairy supply chain risk management.
Part II:
Part II of Phase 1 of the QFD process was carried out to optimise the level of risk
mitigation. The data were taken from Part I of Phase 1 of the QFD analysis process. Two
steps were involved:
Step 1: Optimisation of dairy supply chain risk mitigation through Linear
Programming: The optimum level of risk mitigation was identified using a linear
programming model. This model does not consider cost savings of the organisations.
Step 2: Optimisation of dairy supply chain risk mitigation through Quadratic Integer
Programming: The optimum level of risk mitigation was identified using a quadratic
programming model. This model does consider cost savings of the organisations.
Phase 2 of the QFD process (see Figure 4.4) was executed as follows:
Step1: To develop a QFD matrix, optimum mitigation strategies from Step 2, Part II,
and Phase 1 of the QFD process were presented in rows (WHATs) and sustainable
outcomes from the qualitative interviews were presented in columns (HOWs).
Step 2: The relationship matrix was based on the extent to which sustainable outcomes
were realised through strategy implementation. The scales used were 0=not realised,
1=little realised, 5= moderately realised, and 9= highly realised.
Step3: The Degree of Importance (DI) is taken from Relative Importance (RI) data.
These RI data are obtained in steps 7 of QFD part I from Phase 1.

97
4.7 DATA COLLECTION: PHASE 1
4.7.1Qualitative data collection
a) In-depth interviews
In-depth interviews were used to collect data for QFD Part I (Steps 1 and 2 of the QFD
process described in Section 4.6.1). In accordance with the recommendations of Yin
(2003), a semi-structured interview guide was developed based on the literature
review. Risks at the storage, processing and distribution levels of the dairy supply
chain were identified and possible mitigation strategies were suggested. Probable
sustainable outcomes were also identified. Each question was given an identification
number. This phase of the data collection employed open-ended questions designed to
ascertain the respondents’ views on risks. Simultaneously this phase also ascertained
the respondents’ opinions regarding adopted or suggested mitigation strategies.
Overall 14 questions were designed to cover the three main topics (risks, mitigation
strategies and sustainable outcomes) of this study. A sample questionnaire is provided
later in Chapter 5 and appendix.
Curtin University Ethics Committee approved the data collection instruments before
the interviews took place. According to the conditions of this committee, participants
must be provided with a short statement of information about the research objectives
and advised that their personal details will remain confidential. Participants were also
assured that they had full freedom to quit the interview at any time without any
prejudice. Before each interview, the participants were given a clear explanation of the
research purpose. The interviews were recorded with the consent of the participants
and short notes were taken instantly throughout the interview. The time duration of
each interview was around one hour. The interviewer inserted the questions into
conversation and prompted whenever needed. The interview was recorded on a digital
voice recorder and then transferred to the researcher’s computer for subsequent
transcribing. Each recorded interview was transcribed immediately and reviewed
thoroughly by the researcher while the interview was still fresh in the researcher’s
mind.
b) Sample selection
The sample of this study was based on accessibility and availability of subjects who
were close at hand (Zikmund 2000). The main criteria for selecting the subjects were
their experience and their position in the organisation. So, for this research, purposive
sampling was employed (Corbin and Strauss 2008). Ten interviewees, including

98
executives (or employers) and employees from two dairies with long experience in the
dairy sector, were invited via telephone to participate in the interviews. In the two case
industries (Nahar Dairy and Paharika Dairy), five people from each dairy were
interviewed. The sample of 10 consisted of three executives and two employees of
Nahar Dairy and two executives and three employees of Paharika Dairy. Each and
every participant took part in this research voluntarily.
c) Data analysis
In qualitative research, data analysis is one of the challenging jobs. Several data
analyses techniques are available (Miles and Huberman 1994a). Researchers must
select the technique(s) based on the objective of the research (Quaddus and Xu 2005).
As this research was exploratory in nature, a content analysis technique was chosen to
analyse the data collected from the interviews (Berg 2004). There were more than one
hundred pages of interview transcripts to analyse from ten interviews. Using content
analysis, different factors and variables regarding risk issues and mitigation strategies
were explored. A number of possible sustainable outcomes after implementing the
mitigation strategies were also through interview. All content analyses were
conducted manually and both inductive and deductive approaches were employed to
identify and categorise the factors and variables from the raw data to fulfil the
objectives of this study (Berg 2004).
In the inductive phase, by reviewing the transcript line by line, factors and their
corresponding variables were identified and labels for these factors and variables were
created. A number of free nodes were established and each section of data was given a
label. Later, tree nodes were developed from sets of relevant free nodes. For example,
when respondents were asked about dairy supply chain risks, 49 variables (free nodes)
were identified. After combining the variables with similarities, 45 variables emerged
as distinct variables.
In the deductive phase, the factors and variables found in the qualitative interviews
were matched with those from the literature. A number of factors and variables
regarding risks and possible mitigation strategies were identified through extensive
content analysis and different sustainable outcomes resulting from the implementation
of strategies were also identified. Later these factors and variables were labelled,
where possible in line with the literature (Finch 2004);(Jüttner, Peck and Christopher
2003);(Mishra and Shekhar 2011);(Rao and Goldsby 2009; Choudhary et al.

99
2011);(Akcaoz, Kizilay and Ozcatalbas 2009);(Carter and Rogers 2008b);(Raha and
Talukder 2004);(Blos et al. 2009); and (Manuj and Mentzer 2008a).
The necessary qualitative data for Steps 1 and 2 of QFD Part I (risks and strategies)
were collected through interviews and analysed using content analysis. For QFD matrix
development, risks were listed as WHATs and risk mitigation strategies were listed as
HOWs.
4.7.2 Quantitative data collection: Phase 1
A three-part questionnaire-based survey was conducted with a view to collecting data
for Steps 3 to 5 of QFD process Part I of Phase 1 (see Section 4.6.1). The survey was
conducted among three different groups (employees, executives and supply chain
members) of both case industries (Nahar Dairy and Paharika Dairy) to explicate
probability and impact ratings of risks. The same investigation explored relationships
between risks and mitigation strategies and the relative costs of implementing each
strategy. Data were collected in the following ways.
a) Step 3 (WHY) rated the probability of occurrence and likely impact of a dairy
risk (section 4.6.1).
b) Step 4 (WHATs vs. HOWs) scored the relationship between risks and mitigation
strategies from which the relationship matrix was formed.
c) Step 5 (HOW MUCHs) identified the relative cost of implementing each risk
mitigation strategy
The different parts of this survey are as follows:
a) Questionnaire development
The Likert Linguistic scale was used to measure different dimensions of respondents’
opinions. The Likert scale has been applied to various research studies (Malhotra
2008), using odd and even numbers in selecting scale categories (Hair, Money and
Samouel 2007). Park and Kim (1998) observe that there are various rating scales,
including the 1–3–9, 1–3–5, 1–5–9, 1–2–4, and 1–6–9 scales. There is disagreement as
to which scale is most suitable for research studies. Cohen and Cohen (1995) consider
that there is no scientific basis for any of the choices. Hair et al. (2007) favour the use
of a midpoint as a ‘neutral’ point, but Mattel and Jacoby (1972) argue that a neutral
point should not be used when the scale consists of many points (Matell and Jacoby
1972). Thus this study used a four point scale with no neutral point.
100
This study included a threefold questionnaire with the expectation of collecting data
regarding probability ratings and impact ratings of risks (45 risks), relationship ratings
of risks and mitigation strategies and probable cost incurred to implement mitigation
strategies. The first part of the questionnaire aimed to determine the probability and
impact of risks, while the second part of the questionnaire measured the relationships
between risks and mitigation strategies. The last part of questionnaire was intended to
identify the relative cost of implementing each mitigation strategy. The probability and
impact of risk responses were rated using a scale of 0 to 9. Probability of risk responses
were rated from 0=cannot occur to 9= certain to occur, and impact responses were
rated from 0= low to 9= high (Ward 1999). The relationships between risks and
strategies were rated using measures 0, 1, 5, 9 (no, weak, medium and strong) (Park
and Kim 1998).Finally, the relative costs were rated from 10=minimum to 100=
maximum. A sample of the questionnaire is attached in Appendix 4A.
b) Sampling
The sample was taken from the stakeholders of two different dairy farms (Nahar and
Paharika). This study used convenient sampling procedure to collect data (Berg 2004).
The selection was based on the long experience of respondents in the relevant field.
The stakeholders included farm employees, executives and supply chain members. The
sample size was 22 and comprised six employees, three executives and two supply
chain members from each farm. The background information of sample is provided
later in Chapter 5.
c) Data collection
A self-administered printed questionnaire was used to collect required data for the
development of QFD matrices (Step VI of Section 4.4). The necessary matrices for Steps
3, 4, 5 and 6 of the QFD process described in Section 4.6 were produced from this
quantitative data. The questionnaire was distributed to the respondents based on their
experience in the related field. The respondents were given two weeks to complete the
survey. A reminder was given after a week. A sample of the completed survey,
guidelines about the completion procedure and the contact number of the researcher
were also added to the survey. This was to avoid or minimise any disruption or
confusion in completing the survey. Twenty four responses were received within the
given time. Of these, 22 were accepted because two were incomplete and therefore not
usable.

101
Data regarding the cost savings made by implementing two strategies simultaneously
were collected by telephone. This data was collected to form the correlation matrix
between mitigation strategies for QFD Part I (in Step 6 of the QFD process). These data
were collected from only the executives of the case industries, as only the executives
would have a clear idea about the costs and savings figures.
d) Data Analysis (QFD Part I: Steps 3 to Steps 7)
Data analyses for the quantitative phase of this study were completed by using the
technique of QFD (Step 3 to Step 7 of QFD Part I). As mentioned previously, the
questionnaire survey yielded data from three groups (employees, executives and
supply chain members) of both case industries (Nahar and Paharika). The survey asked
respondents to rate the probability and impact of risks, the relationship between risk
and mitigation strategies, as well as relative costs. After obtaining data for each group,
matrices for Step 3 to Step 6 of QFD Part I were formed by calculating the weighted
average for each group. Later, QFD analysis was performed to develop a matrix for Step
7 of QFD Part I which was mentioned in the QFD process (Section 4.6.1). A short
description of the quantitative data analysis is provided below.
(I) Degree of importance of individual risk was calculated using the following
equation (Ward 1999; Cox Jr 2012):
DI = P * I
Where DI= Degree of importance, P = Probability score and I=Impact score.
Later the weights of DI were represented to the importance of risk and were set as the
matrix for Step 3 of QFD Part I.
(II) The data regarding the relationship between risk and mitigation strategies were
normalised by calculating the weights of the relationship data which were
attained by the questionnaire survey. A cell containing the ith row and jth column
of the REL score (relationship matrix) is assigned 0, 1, 5, 9 to represent a no,
weak, medium or strong relationship between ith risk and jth strategies(Park
and Kim 1998). For example, ith risk is highly influenced (mitigated) by the jth
strategy, and then a nine point was assigned to the cell of these two attributes.In
a similar way, a zero point was assigned to the cell when the ith risk could not be
mitigated by the jth strategy. In this phase, the values for Step 4 of QFD Part I (in
the QFD process) were obtained. Relationship data (REL) were averaged for the
three respondent groups (ie. employees, executives and supply chain members).

102
(III) Data related to the relative cost (RC) was collected from the respondents who
assigned a 100 for most costly strategy and a 10 for least costly strategy. These
relative costs were then normalised for the matrix of Step 5 of QFD Part I in the
QFD process. Total relative costs (TRC) were formed by adding the individual RC
which was used later as budget items in the optimisation process.
(IV) The roof matrix for QFD Part I (Step 6) was developed by using the cost savings
data (SV) which were collected from three executives from each case industry.
These data were collected through a telephone conversation. They were asked to
discuss the correlation of strategies which may yield savings when implemented
simultaneously. They were also asked to state the expected percentage of
savings. The range of percentages was fixed within 10 to 50. After obtaining this
cost savings data, their weights were computed for the values of the roof matrix.
(V) The absolute importance (AI) relevant for each mitigation strategy was
calculated. This importance strives to determine which strategy has the highest
possible capability on risk mitigation. It takes into account the weights of risks or
degree of importance (DI) and the relationship matrix (REL). The absolute
importance of each mitigation strategy was then calculated by applying the
following equation:
∑ , ∀j = 1 …….32
k=1…….45, the number of risk
j=1…….32, the number of mitigation strategy
Where, AIj= absolute importance rating of strategies
DIk = degree of importance (i.e. weights of risks)
k=1…….45, the number of the risk
j= 1…….32, the number of the mitigation strategy
RELkj= relationship rating representing the strength of the relationship between
risk and mitigation strategy.
The calculation of relative importance (RI) related to each mitigation strategy was also
done in this step by normalising the AIs. The larger the RIj, the more important is Sj
(the strategy). Thus, without considering any other constraints (e.g. cost and time),
strategies should be implemented into risk mitigation in the order of their relative
importance rating to attain more success in mitigating risk.

103
e) Data Analysis (QFD Part II: Optimisation)
The data analysis for QFD Part II aimed to formulate the dairy supply chain risk
mitigation problem with an appropriate mathematical programming model, which
consists of two steps:
Step 1: Formulation of the dairy supply chain risk mitigation problem through a linear
programming model (without savings).
Step 2: Formulation of the dairy supply chain risk mitigation problem through
quadratic integer programming model (with savings).
As explained in Section 4.6.1, the analysis was performed for optimising the level of
risk mitigation which was followed in Step VII in Section 4.4 (Research process). A brief
description of these optimisation programmes follows.
Step 1: Formulation of the dairy supply chain risk mitigation problem through
linear programming model (without savings)
In Step1 of QFD Part II, the optimisation of the dairy supply chain risk mitigation
problem was formulated as a linear programming model using Microsoft Excel solver
where the problem did not consider cost savings of the organisation that were
achieved from the concurrent strategy implementation. Concurrent implementation
means the implementation of two or more mitigation strategies at a time (Park and
Kim 1998). To determine the optimum level of risk mitigation with limited resource
constraints, the problem was formulated as a linear programming model for
maximising the level of risk mitigation by selecting appropriate mitigation strategies
which were formulated through the following equation:
( ) ∑ ( ) ……………………… (1)
s.t. ∑
Xj ≤ B
Where AIj= absolute technical importance rating of mitigation strategy Sj
Xj=decision variables [0 or 1] for mitigation strategy Sj
(i.e. if Sjis selected, xj=1, otherwise it is 0)
J= 1…….32, the number of the mitigation strategy
RCj= relative cost for implementing the mitigation strategy.

104
The objective function in the above formula is to maximise the level of risk mitigation
from the selected mitigation strategies. At the time of selecting strategies to implement,
the conventional QFD does not consider the savings of the organisation. As discussed
earlier, the budget (B) has been taken as a percentage of total relative cost (TRC), for
example, 90% of the TRC down to 10% of TRC. At 100% TRC as the budget, all
strategies will be selected. Strategies should be selected in decreasing order of cost
until the total cost of selected strategies does not exceed the limited repair budget.
Step 2: Formulation of dairy supply chain risk mitigation problem through
quadratic integer programming model (with cost savings)
This step of QFD Part II was carried out to formulate the problem of dairy supply chain
risk mitigation as a quadratic integer programming model since there are savings from
simultaneous implementation of two mitigation strategies (Park and Kim 1998). If
there are correlations among strategies, then some savings in resource consumption
are expected when two or more correlated strategies are implemented simultaneously.
The objective function of this problem is to maximise the level of risk mitigation which
was solved with a quadratic integer programming technique using the following
equation:
( ) ∑ ( ) …………………. (2)
s.t. ∑ ∑
∑
≤ B (with cost savings)
Where, AIj= absolute technical importance rating of mitigation strategy Sj
Xj=decision variables [0 or 1] for mitigation strategy Sj
( i.e. if Sj is selected, xj=1, otherwise it is 0)
J= 1…….32, the number of the mitigation strategy
RCj= relative cost for implementing the mitigation strategy
B = budget available for implementing the risk mitigation strategy
SV= savings amount of resource (relative cost) usage associated with
simultaneous implementation of two mitigation strategies.
It is noted that, the budget (B) will be as discussed previously i.e. budget will be 90% of
TRC (total relative cost) down to 10% of TRC. As mentioned before, with the 100% of
TRC as the budget all strategies will be selected.

105
After formulating the QFD problem as a mathematical problem shown in QFD Part II
(Steps 1 & 2), the most appropriate mitigation strategies will be selected to mitigate
dairy risks. The most appropriate mitigation strategies will be selected without
considering the savings of organisation (discussed in Step 1 of QFD Part II). Similarly,
the most appropriate mitigation strategies will selected considering the savings of
organisational resource (Step 2).
4.8 DATA COLLECTION: PHASE 2
a) Questionnaire-based survey development
A questionnaire-based survey was designed to develop the relationship matrix
between mitigation strategies and sustainable outcomes (see Appendix 4B). The survey
was used to collect data for measuring the relationship between mitigation strategies
and sustainable outcomes. This relationship was rated as 0, 1, 5, 9 (no realisation, little
realisation, moderate realisation and strong realisation).
b) Sampling
A sample was taken from the targeted sample cited in Section 4.7.2(b). Only the
executive members of these two dairy farms (Nahar Dairy and Paharika Dairy) were
selected as the sample. The rationale for this decision was that the management have
specific ideas about the better realisation of outcomes through the appropriate
implementation of mitigation strategies. The sample size was determined as six,
namely three executives from each dairy.
c) Data collection
The survey was conducted to collect required data for developing relationship matrices
of strategies and outcomes for Phase two of the QFD analysis (Section 4.6.1). The
optimised data (mitigation strategies) from Phase 1 were taken as data for the row
(WHATs) and sustainable outcomes collected through qualitative interview (see
Section 4.7.1) were taken as data for the column (HOWs). In this phase, data collection
is based upon the degree of various sustainable outcomes achieved through
implementation of different optimised mitigation strategies. The scores given by the
respondents are gathered to identify the relationship between risk mitigation
strategies and sustainable outcomes. The data related to the degree of importance
(WHYs) which is the calculated RI values of the mitigation strategies are taken from
Phase 1.

106
d) Data analysis
Data analyses for Phase 2 of the QFD analysis (see Figure 4.5) consisted of three steps:
Step 1 Developing the matrix
With a view to developing the matrix for ‘WHATs’, the optimised mitigation strategies
from Phase 1 were considered as a row. Then to develop the matrix for ‘HOWs’, the
sustainable outcomes were taken as a column.
Step 2 Developing the relationship matrix
The data regarding the relationship between optimised mitigation strategies and
sustainable outcomes were normalised by calculating the weights of the relationship
data collected through the survey. In this step, the values for the relationship matrix
(WHATs vs. HOWs) were obtained.
Step 3 Calculating absolute importance
The absolute importance (AI) and relative importance (RI) for each sustainable
outcome was calculated with a view to determine which outcome has the highest
possible realisation on mitigation strategy implementation. It takes into account the RI
values of mitigation strategies from Phase 1 as degree of importance (DI) and the
relationship matrix (REL) developed in the previous step. The absolute importance of
each outcome was then calculated by applying the following equation:
∑ , ∀so = 1 ….15
J= 1…….32, the number of the mitigation strategy
so= 1 …….15, the number of the sustainable outcome
Where AIso= absolute importance rating of strategies
DIk = degree of importance (i.e. RI values of mitigation strategies)
so=1…….15, the number of outcome
j= 1…….32, the number of mitigation strategy
RELso,j= relationship rating representing the strength of relationship between
mitigation strategy and sustainable outcome.
After that, by normalising the AIs, the relative importance (RI) of each outcome was
calculated. The highest value of RI represents the most attainable outcome.

107
Figure 4.5: QFD Model – Phase 2
4.9 SUMMARY
This chapter described the research methodology and design. First, the research
paradigm, mixed methods and design were explained. Then, the research processes
were illustrated and clarified. A systematic overview of the research methods and tools
used for this research was also presented. The chapter continued with a description of
the two major stages of the research, comprising the qualitative study and the
quantitative questionnaire-based survey. Details of sample selection, data collection,
and data analysis for each stage were provided. In the next chapter, the research
results are presented.
2. How (Sustainable Outcomes)
(SO)
1. WHAT(Optimized Mitigation Strategy)
(j)
4. What vs. How(Relationship between Mitigation Strategy and
Sustainable Outcomes)RELso,j
3. WHY(Degree of
Importance - RI values of j)
(DIj)
5. Action Plan (Absolute Importance)
(AIso)

108
CHAPTER 5: RESULTS OF DATA ANALYSES
5.1 INTRODUCTION
This chapter presents the results of data analysis for the dairy supply chain risk
mitigation model using Quality Function Deployment (QFD). The data collection and
analysis processes were explained in the previous chapter. After obtaining all
necessary data, two mathematical programming models (Linear Programming and
Quadratic Programming) were used to determine the optimal sets of strategies to
mitigate the risks associated with the dairy supply chain. The QFD method with the
help of Microsoft Excel Solver was used to optimise the level of risk mitigation, taking
into consideration organisational resource constraints.
This chapter is organised as follows. The first part discusses different problems that
were faced at the time of data collection. The next part presents the findings of the
qualitative data analysis from the in-depth interviews through which different risks,
mitigation strategies and sustainable outcomes were identified from social, economic
and environmental viewpoints. Then the results of quantitative data analysis of the
questionnaire survey identify the probability impact of risks, relationship score of risk
and strategy, and relative cost to design various matrices for QFD Part I. Then the QFD
analyses for optimising the level of risk mitigation using the two different
mathematical programming models are presented to understand how budget change
affects the model output. Graphical presentation was then presented to observe the
improvement of risk mitigation level over budget increment. Finally, the determination
of optimal sets of mitigation strategies is presented.
5.2 PROBLEMS OF DATA COLLECTION
Several problems were faced in collecting data from the case industries. These
problems related to the interviews and survey, limited understandings of Quality
Function Deployment and delays in obtaining documents and records.
In-depth interview session
Some respondents were not inclined to reveal data relating to risks faced and the
strategies they tried to adopt. Gradually, by using probe questions, related data were
collected. Some respondents were not educated enough to answer the question

109
promptly. Therefore, much time and effort were needed to obtain data by assisting
them to understand the questions accurately.
Questionnaire-based survey session
The quantitative data in this research was collected using a questionnaire-based
survey. One issue with using questionnaires is that data is potentially vulnerable to
common method bias (Podsakoff et al. 2003). For example, some respondents tried to
guess the interviewers intention and answered accordingly, or each respondent
perceived the ranking scale in a different manner. It was hard to collect suitable data by
making respondents understand the research objective.
Quality Function Deployment (QFD) terminology
Most respondents did not know about Quality Function Deployment (QFD). So it was
challenging to ascertain their understanding and collect data regarding the relationship
matrix for QFD analysis. Although, it was time consuming, the respondents gradually
started to understand the model and the purpose of the QFD modelling.
Documents and records
Both case study industries were not well organised in storing their data and
documents. Due to the inappropriate storage of their documents and computer files,
delays were caused in some situations.
5.3 IN-DEPTH INTERVIEWS
Semi-structured in-depth interviews (step III of section 4.4) with ten stakeholders of
the two large-scale commercial dairy industries were conducted to fine tune and
contextualise the dairy supply chain risks, mitigation strategies and sustainable
outcomes identified in the literature. The questions asked respondents about how they
determine the existence of supply chain risk in their organisation and the overall risk
factors that the organisations are facing. Questions were then asked about risk factors,
mitigation strategies and sustainable outcomes for specific levels (storage, processing
and distribution) in the Bangladesh context.
This phase of the study contributes the refinement of risk factors, mitigation strategies
and sustainable outcome of dairy industry which has been followed in step IV of
section 4.4 (Research process). The identified risks and strategies were used to develop
the matrices for Steps 1 and 2 of the QFD process which was shown in section 4.6.1

110
(The QFD Process). Details of the qualitative data collection were explained in section
4.6.1 under methodology. This section provides additional information about the data
collected from qualitative interview.
5.3.1 Development of the in-depth interview questions
As mentioned before in Section 4.7.1, a total of14 questions were designed to cover the
three main topics (risks, mitigation strategies and sustainable outcomes) of this study.
The following table (Table 5.1) lists the interview questions.
Table 5.1: Interview Questions for Qualitative Data Collection
Sl No. Questions
1 How does your organisation determine what supply chain risks exist?
2 What are the risks that your organisation is facing?
3 What risks do exist at storage level?
4 How often these risks may arise?
5 How these risks could be mitigated?
6 What will be the sustainable outcomes if these risks could be mitigated properly?
7 What risks do exist at processing level?
8 How often these risks may arise?
9 How these risks could be mitigated?
10 What will be the sustainable outcomes if these risks could be mitigated properly?
11 What risks do exist at distribution level?
12 How often these risks may arise?
13 How these risks could be mitigated?
14 What will be the sustainable outcomes if these risks could be mitigated properly?
The first question to the respondents was about how they determine the existence of
supply chain risk in their organisation. The second question explored the overall risk
factors that the organisations are facing. Risk factors, mitigation strategies and
sustainable outcomes for specific levels (storage, processing and distribution) were
identified. For this purpose, questions 3 to 6 were designed to refer to the storage level,
questions 7 to 10 were designed to refer to the processing level, and questions 11 to 14
were designed to refer to the distribution level.
5.3.2 Respondents profile
Both case companies recommended that their experienced personnel participate in the
interviews. This participation was on a voluntary basis. The only criterion required for

111
participants was to have experience in dairy industry activities. The ten interviewees
included a managing director, production managers, farm managers and supervisors.
Their tenures ranged from 8 to 25 years. The case industries had been established for
more than 18 years, with the number of the employees ranging from 32 to 55. The
present livestock holding by both farms indicated the farm size. The profile of the
respondents and detail about the farms is presented in Table 5.2.
Table 5.2: Profile of the Respondents (In-depth interview)
Farm Respondents Position
No. of years
at work
About the farms Size
(Number of employees)
Age of
farm
No. of livestock
Nahar
A Managing Director
25
55 24 560
B Production Manager
12
C Supervisor 10 D Farm
Manager 12
E Supervisor 9
Paharika
F Production Manager
13
32 18 352
G Supervisor 8 H Farm
Manager 15
I Supervisor 11 J Supervisor 10
5.3.3 Findings: Risks (Inductive Analysis)
A number of factors and variables regarding risk issues (for both common and specific
levels) and possible mitigation strategies along with probable sustainable outcomes
after implementing strategies have been identified through extensive content analysis
procedures. Initially, respondents identified 49 variables or issues influencing dairy
supply chain risk issues. After combining these variables, 45 were named as distinct
variables. These were then grouped into seven nodes: ‘financial risk’, ‘technological
shortage’, ‘human resource risk’, ‘government policy and support’, ‘political risk’,
‘mismanagement of staff’ and ‘natural risk’.
Detailed findings related to the risk factors (for both common and specific levels) with
subsequent frequencies are shown in Tables 5.3, 5.4, 5.6 and 5.7. It is noted that 19
variables regarding risk issues were found in common at every level. The specific
number of variables at each level was: storage level (6), processing level (13) and

112
distribution level (7). The risk factors and variables that are common to all levels
(storage, processing and distribution) are shown in Table 5.3.
Table 5.3: Common Risk Factors and Variables (Storage, Processing and
Distribution)
Sustainability aspects
Risk factors Risk variables
Nahar Paharika
A B C D E F G H I J
Economical
Financial risk
Inadequate loan facilities Y Y Y
Complex loan procedures Y
High rate of interest Y
Inadequate finance Y Y Y Y Y Y Y
Absence of insurance or compensation coverage for dairy industry
Y Y
Technological shortage
Shortage of improved technology (milking machine, feed mixture, grass cutting, improved processing, cooling facilities)
Y Y Y
Social
Human resource risk
Labour disputes Y Y Y Y Y Y Illiteracy and inefficiency of worker
Y Y Y
Shortage of skilled staff Y Y Y
Switching of staff frequently
Y Y Y Y
Government policy and support
Lack of fixed government policy in dairy sector
Y Y Y Y Y Y Y
Poor law and order situation (terrorism, musclemen ship)
Y Y
Political risk
Hartal and strike cause delay in working process
Y Y Y Y Y Y Y Y Y
Political Unrest and interference
Y Y Y Y Y Y Y Y Y
Mismanagement and unethical behaviour of employees
Corruption (adulteration by mixing water)
Y Y Y Y Y
Damage of farm’s assets Y Y Y Y Y Y
Theft Y Y Y Y Y Y Y
Environmental Natural risk
Natural uncertainties (storm, excessive rain, flood)
Y Y Y Y Y
Quick perishability of milk Y Y
Table 5.3 shows that the variables related to political risk were identified by the
interview participants. Both the risk variables ‘Hartal and strike cause delay in working
process’ and ‘Political unrest and interference’ were identified by nine respondents.
The participants also identified ‘Lack of fixed government policy in dairy sector’ and
‘Theft’ as common risk sources for storage, processing and distribution levels in the
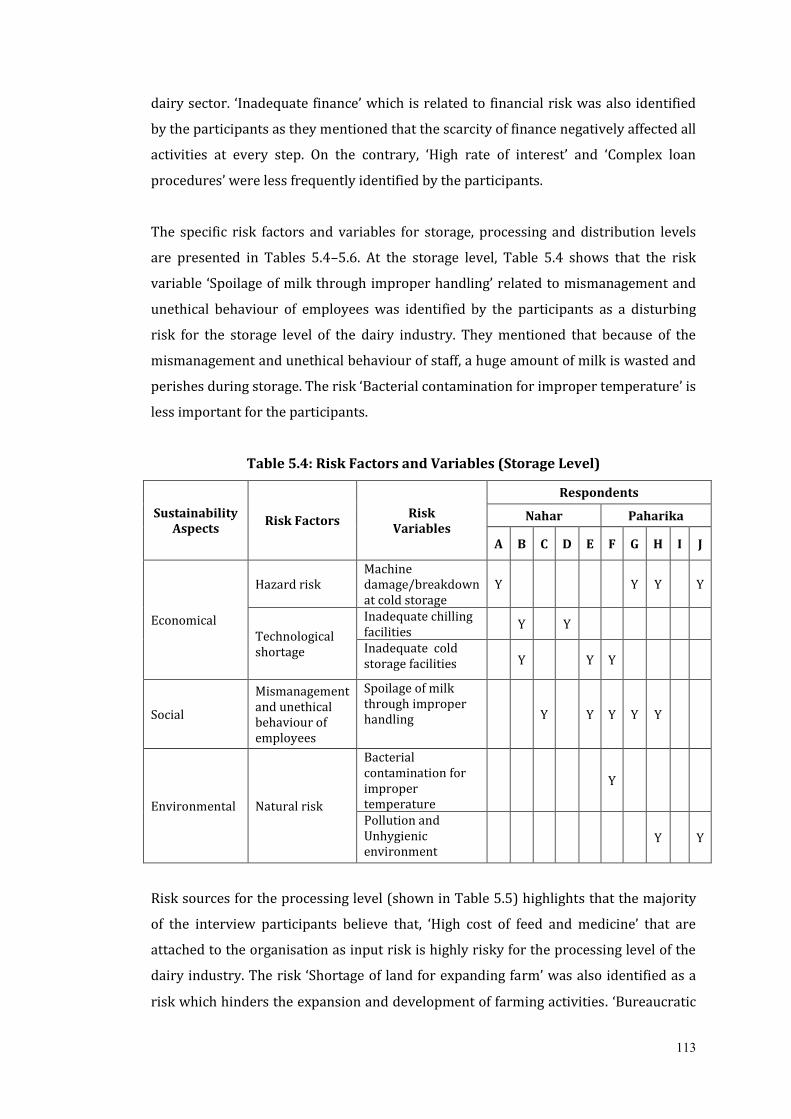
113
dairy sector. ‘Inadequate finance’ which is related to financial risk was also identified
by the participants as they mentioned that the scarcity of finance negatively affected all
activities at every step. On the contrary, ‘High rate of interest’ and ‘Complex loan
procedures’ were less frequently identified by the participants.
The specific risk factors and variables for storage, processing and distribution levels
are presented in Tables 5.4–5.6. At the storage level, Table 5.4 shows that the risk
variable ‘Spoilage of milk through improper handling’ related to mismanagement and
unethical behaviour of employees was identified by the participants as a disturbing
risk for the storage level of the dairy industry. They mentioned that because of the
mismanagement and unethical behaviour of staff, a huge amount of milk is wasted and
perishes during storage. The risk ‘Bacterial contamination for improper temperature’ is
less important for the participants.
Table 5.4: Risk Factors and Variables (Storage Level)
Sustainability Aspects
Risk Factors Risk
Variables
Respondents
Nahar Paharika
A B C D E F G H I J
Economical
Hazard risk Machine damage/breakdown at cold storage
Y Y Y Y
Technological shortage
Inadequate chilling facilities
Y Y
Inadequate cold storage facilities Y Y Y
Social
Mismanagement and unethical behaviour of employees
Spoilage of milk through improper handling Y Y Y Y Y
Environmental Natural risk
Bacterial contamination for improper temperature
Y
Pollution and Unhygienic environment
Y Y
Risk sources for the processing level (shown in Table 5.5) highlights that the majority
of the interview participants believe that, ‘High cost of feed and medicine’ that are
attached to the organisation as input risk is highly risky for the processing level of the
dairy industry. The risk ‘Shortage of land for expanding farm’ was also identified as a
risk which hinders the expansion and development of farming activities. ‘Bureaucratic

114
complexity on maintaining various formalities’ is a less frequently identified risk
source for the processing level of the dairy industry.
Table 5.5: Risk Factors and Variables (Processing Level)
Sustainability
aspects Risk factors
Risk
variables
Respondents
Nahar Paharika
A B C D E F G H I J
Economical
Hazard risk
Cattle diseases Y Y Y Y Y Y
Machine breakdown
at processing unit Y Y
Fire at farm shed Y Y Y
Accident (Staff
injury) Y Y
Input risk
Inadequate supply of
quality feed Y Y Y
High cost of feed and
medicine Y Y Y Y Y Y Y Y Y
Scarcity of feed Y Y Y Y Y
Lack of upgrade
vaccination and
veterinary services
Y Y
Poor
infrastructural
facilities
Shortage of land for
expanding farm Y Y Y Y Y Y Y Y
Social
Absence of
government policy
and support
Irregular supply of
vaccine from
government
Y Y
Strategic risk
Competition among
the farms Y Y Y
Bureaucratic
complexity on
maintaining various
formalities
Y
Environmental Natural risk
Drought leads to a
decline in milk
production
Y Y Y
At the distribution level, Table 5.6 shows that most of the interview participants
identified the risk variable of ‘Poor conditioned road for moving product’ which cause
delay and spoilage of milk at the time of milk distribution. Another risk ‘Too long chain
cause delay in product movement’ was also identified by the majority of participants as
they mentioned that for the perishable nature of milk delay in product movement
results in spoilage or a low quality of product.

115
Table 5.6: Risk Factors and Variables (Distribution Level)
Sustainability aspects
Risk factors Risk Variables
Respondents
Nahar Paharika
A B C D E F G H I J
Economical
Hazard risk
Accidents of transport vehicle
Y Y Y Y Y
Distribution risk
Existence of middlemen/ too many middlemen
Y Y Y Y
Too long chain cause delay in product movement
Y Y Y Y Y Y Y
Poor infrastructural facilities
Poor conditioned road for moving product (delay and spoilage)
Y Y Y Y Y Y Y Y Y
Inadequate transport facilities to move products frequently
Y Y Y Y Y
Lack of milk tanker with chilling facilities
Y Y Y
Social
Mismanagement and unethical behaviour of employees/ middlemen
Unethical behaviour of middle men (adulteration, added price, deprivation)
Y Y Y Y Y
5.3.3.1 Description of risks
This content analysis shows that the dairy supply chain in Bangladesh is associated
with different types of risks in its different sectors. These risks hinder the growth and
development of the dairy industry. These risk factors are briefly discussed in this
section. Details of the variables under each factor are discussed in Appendix 5A.
Financial risk
A number of financial risks were identified. These risks have a direct influence on the
activities at all levels (storage, processing and distribution) (see Table 5.3). These risks
arise from different financial occurrences that often hinder the growth and
development of the dairy, and subsequently affect the actions of supply chain.
Respondents talked about different financial risks such as inadequate loan facilities,
complex loan procedures, high interest rates, inadequate finance and lack of insurance
coverage. Regarding loan facility, respondent F mentioned that ‘most of the financial
institution in our country are not interested to invest in the dairy sector i.e. they are not
interested to give a loan to the dairy industry’. He also added that ‘the existing loan

116
procedure is too complex’. Participant A mentioned that, ‘inadequate loan and
inadequate finance are affecting the growth of their organisation’. He also stated that,
‘the rate of interest is just too high’.
Technological risk
Some of the risks arise from technological shortages. Respondents mentioned a
number of technological shortages which hampered and slowed down their production
and operational activities. Technological shortages include inadequate chilling system,
shortage of cold room, and absences of mechanised milking, feed mixture, improved
processing facilities and so on. For example, ‘we have shortage of upgrade technology in
milk processing’, mentioned by respondent F. Another participant, respondent D,
mentioned that, ‘our cooling infrastructures are not sufficient for our production’.
Respondent G discussed technological advancement, saying that, ‘still we are used to do
60% of milking manually which is time consuming, requiring more staff involvement and
also increasing the risk of mismanagement and pollution’.
Human resource risk
Human resource risks have been categorised into labour dispute, illiteracy and
inefficiency of worker, shortage of skilled staff and frequent staff turnover. Farming
businesses need efficient and experienced human resources. In this regard, respondent
F from Paharika Dairy struggled to manage the staff for a long time. He uttered that,
‘after trained the staff and making them skilled, they switch way’. Shortage of skilled and
efficient workers slows the processing activities. ‘Different workers from diverse
background coming here … .although work direction is described to them clearly, but it is
hard to make them understand properly…so for the inefficiency of them misuse of product
increased’, stated by respondent E from Nahar Dairy.
Absence of fixed government policy
The lack of fixed government policy regarding the dairy industry and the poor law and
order situations have a direct impact on storing, processing and distributing functions
of dairy production. The majority of respondents reported that a lack of fixed
government policy regarding feed management, breed management, loan
disbursement and the central distribution of milk. Moreover, the legal and regulatory
framework of the country is also characterised by a poor and non-transparent
administrative and judicial system, bureaucratic complexities, political interference
and musclemanship, and terrorism, for example. These issues are significantly affecting
the smooth running of the dairy industry in the country. For example, respondent F

117
revealed that, ‘sometimes we have to handle some unfair situation, which could be solved
by the interference of political leader … but it needs financial contribution to them’.
Another respondent H stated that, ‘for getting easy loan we have to maintain a good
relationship with the officers by giving them bribe and other facilities’.
Political risk
The political environment of Bangladesh, which is affected by hartals, strikes and
political instability, hampers the continuity of the production cycle. All respondents
mentioned these risks which have a direct influence on processing and distribution
activities. A series of prolonged hartal and strike cause delay in the whole working
process. For example, respondent A stated that, ‘for political unrest and long series of
hartal and strike we cannot properly distribute our product (milk), which is perishable in
nature’. ‘Sometimes for political uncertainties we have to preserve large quantity of milk
… when we need to arrange more room for our chiller to store the undistributed product’,
said respondent D. Another respondent J mention that, ‘last year three of our milk vans
were attacked and completely damaged by the picketers at the time of distribution which
resulted in financial loss for us.’
Mismanagement and unethical behaviour of employees
Mismanagement and unethical behaviour of employees was also mentioned by most of
the participants. This behaviour included corruption (mixing water with milk), damage
of farm assets, spoilage of milk through improper handling and theft. Due to the
mismanagement of staff, production costs also increased. In this regard, respondent I
mentioned that, ‘sometimes for the insincere working attitude of workers, we have to face
many unexpected loss like damage of farm assets, spoilage of milk’. Another respondent
A stated that, ‘as the income level of the people in our country is limited, so some
unethical activities like theft, corruption and misuse are present in employees behaviour
... we have to aware about that, which is regular in our industry’.
Natural risk
According to the respondents’ opinions, the dairy supply chain in Bangladesh is also
affected by natural risks. Natural risks include natural uncertainties (flood, storm,
drought, too much humidity, and heavy rainfall), pollution and unhygienic
environment, and the perishable nature of milk. These risks bring devastating loss for
all members within the supply chain network. For example, respondent A stated that,
‘our climate is very unpredictable…sometimes moisture is high…sometimes moisture is

118
low … sometimes there is too much rainfall which creates problem in maintaining
temperature.’
Hazard risk
Different types of hazard risks have been identified by the respondents. The nature of
hazard risk is different for specific levels. These hazard risks include: machine damage
at cold storage (storage); cattle diseases, fire at farm shed, staff injury (processing);
and accident of transport vehicle (distribution).
Input risk
At the processing level, some input risks were mentioned by the respondents. Input
risk occurs due to the disruptions to the supply of input. The most cited input risks
were: inadequate supply of quality feed, scarcity of feed, lack of upgrade vaccination
and veterinary services. Due to the input risk, production is hampered and production
quantity fluctuates. All respondents except E complained about the high cost of feed
and medicine that they need regularly. They also criticised the supply of vaccine from
the government which is irregular and unsatisfactory.
Poor infrastructural facilities
This study found that poor infrastructural facilities not only hinder the growth and
development of the industry but also hamper the smooth distribution of the product.
Due to land shortage, the farms cannot be expanded. Regarding shortage of land,
respondent A mentioned that, ‘we have plans for expansion and diversification … but
cannot convert those in action as we don’t have enough land resources’. Every
respondent mentioned that, the poor condition of roads and highways created delays
and caused spoilage when moving the product. Inadequate transport facilities and lack
of milk tankers with chilling facilities were also mentioned by some of the respondents
as a risk issue especially for the distribution level.
Strategic risk
This study finds that competition and bureaucratic complexity in maintaining
formalities acted as daunting factors for the development of the industry. Regarding
competition, respondents I mentioned that, ‘competition is very high in our industry …
we lost our customer due to the immense competition’.
Unethical behaviour of middlemen
Middlemen are present at every stage of the supply chain. Specifically, they are very
active at the distribution level. So exploitation by middlemen is considered another

119
major risk source. Respondents considered the middleman as the ‘profit sucker’ and
wished to get rid of their unethical activities like added price, adulteration and
deprivation.
5.3.4 Findings: Mitigation Strategies (inductive analysis)
The qualitative data analysis revealed numerous risk mitigation strategies which were
suggested by the respondents to mitigate the risks associated with dairy supply chain.
When probed deeper about supply chain risk mitigation strategies, different
respondents put forward different strategies. Some of them mentioned technological
development, a few of them demanded insurance coverage of the facilities , a number
of respondents stressed training management as well as human resource
management, and others focused on government support, financial management, back-
up capacity, off-farm income and investment, business policy and practice. Regarding
mitigation strategies, respondent F stated that, ‘as we deal with living things, risk could
occur at any time … we have to always be ready to face and mitigate the risk’. The
frequencies of mitigation strategies for both common and specific (storage, processing
and distribution) levels are presented in Tables 5.7, 5.8, 5.9 and 5.10. Detailed
descriptions of all mitigation strategies are provided in Appendix 5B.
The analysis in Table 5.7 shows that 11 variables were identified as common
mitigation strategies for all levels (storage, processing and distribution). Of these, only
two variables were supported by most of the respondents. These variables are
‘Adoption of improved technology (Milking machine, feed mixture, grass cutting,
improved processing facilities)’ and ‘Buying insurance against production losses’.
Although none of the respondents supported the variables related to business policy
and practice, this factor was supported by the literature.

120
Table 5.7: Common Mitigation Strategies (Storage, Processing and Distribution)
Mitigation strategy
(Factor)
Mitigation strategy
(Variable)
Nahar Paharika
A B C D E F G H I J
Technology
development
Adoption of improved technology
(milking machine, feed mixture,
grass cutting, improved processing
facilities)
Y Y Y Y Y Y Y Y
Insurance
management
Buying insurance against production
loss. Y Y Y Y Y Y
Human resource
management
Hiring skilled staff Y Y
Motivational and incentives facilities
for staff Y
Government
support
Initiative to remove political
uncertainty Y
Implementation of a fixed policy for
dairy sector Y
Financial
management
Assurance of adequate institutional
credit support with low rate of
interest.
Y
Off-farm income and
investment
Introducing off-farm activities Y
Focus on value addition Y
Business policy and
practice
Promote sound business practices by
cooperation, better coordination and
information sharing
Reduction of risks through merger,
acquisition and integration.
At the storage level, two strategies for mitigating risks were identified (see Table 5.8).
There was a strong support among the participants for the ‘Arrangement of proper
training to the staff regarding temperature control’. Raw milk needs to be placed
immediately into the chiller to maintain 2–4 °C and has to be transported to the next
vendor within 5–6 hours of milking due to its perishable nature (Javed 2004). For this
reason, one concern is that employees need proper training to save the milk from
spoilage.
Table 5.8: Mitigation Strategies (Storage Level)
Mitigation strategy (Factor)
Mitigation strategy
(Variable)
Nahar Paharika
A B C D E F G H I J
Training
Management
Arrangement of proper
training to the staff regarding
temperature control
Y Y Y Y Y Y Y Y
Backup capacity
Adoption of alternative
supply of power for cold
storage (powerful generator)
Y Y Y Y

121
To mitigate risk related to the processing level of the dairy industry, Table 5.9 shows
that most respondents supported the arrangement of proper training of the staff
regarding processing and hygiene management. This suggestion can be attributed to
the fact that proper training of staff as well as management regarding processing and
hygiene management has a positive effect on maintaining the quality of the product
and enhancing goodwill of the organisation. There was also overwhelming support for
both ‘Arranging regular vaccination for cattle’ and ‘Focusing on certified feed supplier
to get quality feed’. By contrast, the arrangement of adequate grassland for producing
Napier grass was less well supported by the interview participants.
Table 5.9: Mitigation Strategies (Processing Level)
Mitigation strategy
(Factor)
Mitigation strategy
( Variable)
Nahar Paharika
A B C D E F G H I J
Training management
Arrangement of proper training
to the staff regarding processing
and hygiene management
Y Y Y Y Y Y
Breed management Attempts to create various cross
breeds by adopting AI services.
Government support
Lease abandoned land to the
farmers for dairy farming Y Y Y
Strengthen the regular supply of
vaccine Y Y Y
Initiative to reduce the cost of
feed Y Y
Support to develop technology Y Y Y
Feed management
Focus on certified feed supplier
to get quality feed. Y Y Y Y Y
Arrangement of adequate
grassland for producing Napier
grass
Y
Diseases management
Arrangement of regular
vaccination for the cattle Y Y Y Y Y Y
Arrangement of improved and
upgraded veterinary services Y Y
Infrastructural
development
Building multi-storeyed complex
for farm extension Y Y Y
At the distribution level, Table 5.10 shows that the variable ‘Building monitoring team’
(described in Appendix 5B) related to human resource management was completely
supported by the field study participants. This strategy was considered important for
mitigating different risks related to the distribution level. There was also support for
the arrangement of ‘Direct marketing’ (see Appendix 5B). Most of the participants

122
supported the notion that direct marketing will positively lead to the removal of
unnecessary involvement of middlemen. The mitigation strategy ‘Focus on product
diversification’ was less well supported by the participants.
Table 5.10: Mitigation Strategies (Distribution Level)
Mitigation strategy (Factor)
Mitigation strategy
( Variable)
Nahar Paharika
A B C D E F G H I J
Human resource
management
Building monitoring
team Y Y Y Y Y Y Y Y Y Y
Government
support
Initiative to develop
roads and highways Y Y Y
Transport
Management
Arrangement of
adequate number of
transport
Y Y Y Y Y Y Y
Arrangement of
refrigerated transport
facilities
Y Y Y Y Y Y
Infrastructural
development
Development of roads
and highway Y Y Y Y Y Y Y
Business practices
and policy
Focus on product
diversification Y
Removal of
unnecessary influence
of middlemen
Y Y Y Y Y Y Y Y
Direct marketing Y Y Y Y Y Y Y Y Y
5.3.4.1 Description of mitigation strategies
Numerous strategies (Table 5.7, 5.8, 5.9 and 5.10) for mitigating dairy risks were
identified from the content analysis. The mitigation strategies were shortlisted based
on emphasis given in the interview phase to different levels of storage, processing and
distribution. All variables of mitigation strategies are discussed in detail in Appendix
5B. Short descriptions of important mitigation strategies are discussed as follows.
Technological development
The mitigation strategy supported most by the respondents in dairy supply chain risk
management is technological development. It includes adoption of improved
technologies like mechanised milking, mechanised feed mixing, improved processing
facilities and cold storage, adoption of RFID and so on. Most respondents agreed that
technological development would be a means of enhancing productivity and
profitability, reducing mismanagement, cost saving by less labour engagement and
improving time management.

123
Insurance management
Insurance coverage against production loss can help the supply chain members to
overcome different types of risks occurring from accidents, diseases, natural
uncertainties and hazards. Regarding insurance coverage respondent A stated with
frustration that, ‘In our country, there is no insurance coverage for the dairy industry…in
case of any disaster we face complexities to survive’.
Human resource management
In farming, , human resource management as a mitigation strategy consists of hiring
skilled staff, managing them through providing motivational and incentive facilities,
arranging training for them and building a monitoring team. It is evident from the
respondents that, skilled and efficient staff are needed for reducing risks regarding
mismanagement, temperature maintenance, and different hazards (e.g. machine
damage, staff injury).Most respondents stressed training management by stating that,
‘Arranging training facilities for the staffs are indispensable for making them efficient
and skilled’. It also acts as a motivating factor. Regarding motivational and incentive
facilities respondent E mentioned that, ‘We have to arrange some recreational and
motivational facilities for staff for making them enthusiastic in their work, like arranging
various game competitions, medical allowances, bonus during religious festivals,
arrangement of an annual picnic, etc.’.
Government support
All participants emphasised the need for government support regarding implantation
of a fixed policy for the dairy sector, removal of political uncertainties, strengthening
the regular supply of vaccine, reducing cost of feed, leasing abandoned land for the
dairy farmers and supporting the development of technology and infrastructure.
Respondent E was frustrated about the supply of regular vaccine from the government
by stating that, ‘Sometimes we do not get supply of vaccine from the government at right
time… then timely vaccination of the cattle could not be possible … if the government will
be more careful about that … then we could manage good health of farm animals which
will ensure us getting a calf in each year’.
Feed management
Feed management is another mitigation strategy for dairy supply chain risk
management identified by most of the respondents in this study. Feed management
consists of focusing on certified feed suppliers to procure quality feed and regular

124
supply of feed. An arrangement of adequate land for producing Napier grass for cattle
is also included in feed management. For example, respondent E stated that, ‘If we can
manage adequate land, then we could produce more Napier grass for cattle which reduce
the consumption of less concentrate feeds...as a result feed cost will be saved and
production will be increased for giving more grass’.
Disease management
As a mitigation strategy, a number of respondents focused on the disease management
by arranging regular, upgraded and improved vaccination for the cattle. Diseases in the
livestock business are very devastating. Sometimes cataclysmic diseases cause dairy
businesses to close down. So respondents stressed maintaining regular vaccination for
the farms live stocks.
Infrastructural development
Infrastructural development consists of multi-storeyed building for farm expansion,
and development of roads and highways. This development is important to maximise
the productivity of farm and reduce risk relating to farm expansion and product
distribution. For example, respondent F mentioned that, ‘We have just improved the
internal road from the project door to the main road...but the condition of the road before
that is terrible, which always generates accidents, messed up the product, [caused] delay
at the time of distribution...so government initiative and government support is needed to
improve the condition of roads and highways’.
Transport management
Arranging adequate transport and refrigerated transport facilities are included in
transport management, which was identified as a prerequisite for effective
distribution. Due to the rapid perishability of milk, quick distribution is needed.
Transportation and distribution need to be done in insulated vehicles to avoid
excessive temperature increases. For quick and timely distribution, managing adequate
transportation is a must. Regarding refrigerated transport facilities, respondent F
stated that, ‘Last year we bought two cold vans...we are now tension free at the time of
moving the product in long distance.’
5.3.5 Sustainable Outcomes (inductive analysis)
Numerous economic, social and environmental outcomes were explored in the
inductive phase of data analysis. These outcomes are shown in Table 5.11. Fifteen

125
sustainable outcomes were explored of which seven are directly related to economic
benefit, five are linked with social welfare and the remaining three are related to
environmental development. The field study participants were most supportive of cost
minimisation as a sustainable outcome. Analysis from the field interviews highlights
that the majority of the interview participants believe that the cost could be minimised
after adopting different mitigation strategies. There was also support for the ‘Increase
in production’. Most participants supported the notion that adoption of diverse
mitigation strategies will positively lead to reduction or mitigation of different risks
and that will result in production increment. By contrast, ‘Waste management’ and
‘Health improvement of cattle’ are supported by only one interview participant. Some
of these important sustainable outcomes are described below:
Table 5.11: Sustainable Outcomes
Sustainable Aspects
Outcomes
Nahar Paharika
A
B C D E F G H I J
Economic
Profit maximisation
Cost minimisation
Increase in personal income
Increase in production
Product quality improvement
Expansion of farming system
Production of value added product and diversified product
Social
Goodwill enhancement
Supply of quality food
Nutritional development
Improvement of living standard
Creation of employment opportunity
Environmental
Creation of sound working environment
Waste management
Health improvement of cattle(Animal Quality)
5.3.5.1 Description of sustainable outcomes
The descriptions of sustainable outcomes are below.
Profit maximisation
Profit is the main motive for all businesses. Without profit, no farm can operate its
business for the long term. Consistent profit generation can help to achieve

126
sustainability. To make a consistent profit, a firm should conduct regular checks and
balances between costs and profits.
Cost minimisation
Most of the businesses are trying their best to minimise their fixed and variable costs.
By doing so, a farm can add more profit to its balance sheet. Minimisation of cost is not
easy as it is directly related to the quality of products and services. A farm should take
care of its redundant costs. When farms adopt different mitigation strategies
simultaneously, extra costs can sometimes be avoided. For example, when a farm
adopts the strategy of hiring skilled staff, then additional costs for training them could
be reduced or avoided.
Increase in personal income
Although profit maximisation and income increment sound similar, there are
differences between them. Income increment is a part of profit maximisation. When a
company makes more profit, then the salary structure for the stakeholders is
increased. As a result, employees from farm level to distribution level receive more
salary than before which leads to an increment of income for each and every
stakeholders.
Increase in production
Every production-oriented farm has the vision of attaining a goal within a particular
time in terms of production, profit and scope. Dairy farms are no exception. Every dairy
farm has an intention to increase productivity based on a time frame. It is done
gradually as it is impossible to do it over a short span of time. The more production
brings more profit. This is a simple and useful concept for a business to achieve
maximum gain within their scope. The rate of production could be increased by
mitigating different risks like mismanagement of staff, infrastructural risk and so on.
Product quality improvement
Quality is an important term, for farms and their customers. Customers will not be
attracted if a company does not achieve optimum quality. Produced milk should have
all the necessary ingredients so that customers can get the nutrition they desire from
milk and milk-related products. Moreover, milk-related products should be maintained
at the optimum temperature while it is travelling over long distances.

127
Expansion of farming system
Expansion is necessary for all types of business if they want to survive against the
immense competition. Profit cannot be maximised if a farm is not expanded gradually.
It is preferable for a dairy farm to establish their farming activities in a location where
milk can be delivered immediately due to its perishable nature. Expansion may involve
arranging land resources for cattle to ultimately increase total milk production. In this
regard respondent A from Nahar Dairy mentioned that, ‘We are thinking about a multi-
storeyed complex for overcoming the land scarcity, but it will be hugely expensive as the
design and structure of building should be different for cattle management …if we could
manage, then farming activities could be expanded with limited land resources’.
Production of value added and diversified products
Dynamic marketing practices encourage farmers to generate more value-added and
diversified products. By doing this, a farm can obtain maximum market accessibility
while increasing its profit target. For example, a milk producer can adopt a policy to
convert a proportion of milk into other value-added products like yogurt of different
kinds, flavoured milk, ghee, butter and the like. If a company converts to such products
successfully, they can hold a distinctive cluster of customers with better profitability.
Respondents D from Nahar Dairy stated that, ‘we can introduce to procure more value-
added products to make an additional profit. Sometimes we cannot sell the produced milk
within the same day, and then it will perish. In that case, we can introduce packaged milk
including value-added products with the left over milk so that we can increase usual
profit within the same resources.’
Goodwill enhancement
Goodwill is an image which has additional worth for a company. Nobody can develop
their goodwill within a short time but rather by producing optimum quality day after
day. Products from a particular farm should be consistent in terms of quality, weight,
colour, nutrition and so on. Once, goodwill is established for a farm, customers will be
attracted to buy their products with satisfaction. By implementing different strategies
regarding quality control, herd management, training management and so on, a
company can achieve goodwill.
Supply of quality food
Quality means an essential or distinctive characteristic of particular products.
Obviously, some government or related quality control organisations set a standard for

128
a product. By maintaining the standard, a company can maintain the quality of the
product. As a result, customers procure quality products to meet their specific
purposes of consumption.
Nutritional development
Dairy products are related to nutrition, and good nutrition can be maintained through
the suitable intake (food) to the dairy cattle. They should be provided with a high
standard diet so that the produced milk will be appropriately nutritious. In this case, a
farm can recruit nutrition experts to cross-examine all the related issues so that
produced milk will have appropriate nutrition. As a result of production increment,
consumers may able to get milk and milk products at a low cost. When as a strategy, a
farm recruits experts for quality control and cross examination of all nutritional issues,
and then nutritional development could be easily achieved.
Improvement of living standard
People involved in farm activities should have a respectable living standard as part of
their motivation to work. To do so, good packages are offered to the employees, which
are directly related to farm profitability. When a business makes an optimum or
desired profit, it can easily provide relevant facilities to its stakeholders to maintain a
good quality living standard, which is helpful to improve the living standard of all.
Creation of employment opportunities
Employment opportunities create scope to involve more employees on the farm. More
employment can be created to manage expansion of the business, better profitability
and producing diversified products.
Creation of sound working environment
A sound working environment denotes maintaining standard occupational procedures
for activities to be completed. The main requirements for a sound working
environment are appropriate job roles, responsibilities, hierarchy, safety, environment
and logistics. The sound working environment could be automatically attained when a
company undertakes different strategies related to hygiene management, herd
management and human resource management.

129
Waste management
Dairy is an industry where huge wastes are generated every day. A farm must think
about wastes and their reuse so that the environment and hygiene can be managed
properly. For example, cow dung can be used as raw materials for generating biogas
which ultimately can be used for generating power. Regarding waste management,
respondent F mentioned that, ‘a good portion of cow dung is used as a fertiliser for our
plantation, while a slight portion of it is used as a raw material for fish feed in our farm’.
It is noted here that Nahar Dairy has already taken the initiative to produce biogas
from farm waste and are successful in producing it. In this way waste is managed
properly.
Health improvement of cattle (animal quality)
Animal quality is a significant issue all over the world. Quality in terms of breed is
important for ultimate production of milk from a farm. A quality breed can produce
more milk than the lower-quality breed. However, a farm needs to be careful to
upgrade the breed as breed management relies on the surrounding environment (such
as humid, temperature and weather). Farmers can gradually upgrade their cattle which
may give them better sustainability on their livestock. Respondent E stressed the
health improvement of cattle by stating that, ‘if we can ensure good health of animals by
proper feed management and disease management, then we will get a calf each year
which will be profitable for farm’.
5.3.6 Deductive analysis
A number of risk variables, mitigation strategies and sustainable outcomes were
identified through the inductive phase of the study. These variables and factors then
were labelled using deductive analysis in line with the exiting literature (Finch 2004;
Jüttner, Peck and Christopher 2003; Mishra and Shekhar 2011; Rao and Goldsby 2009;
Choudhary et al. 2011; Akcaoz, Kizilay and Ozcatalbas 2009; Carter and Rogers 2008a;
Raha and Talukder 2004; Blos, Quaddus and Wee 2009; Manuj and Mentzer 2008b;
Chowdhury 2007). In this deductive phase, justification of the selected risk variables,
mitigation strategies and sustainable outcomes was provided with support from the
literature. Most of the factors derived from the field study are supported based on
uniformity with the existing literature.
Hence, the competency and adequacy of each variable are established based on the
existing theory and empirical studies by which the justification is made. The field study

130
revealed that political unrest and interferences are causing various risks for the dairy
industry. Local political leaders are very active to keep the businessmen under
pressure to do something as per their instruction, and this hinders the normal flow of
business activities. The respondents mentioned that their distributional activities are
always hampered by different forms of political unrest. This finding is consistent with
Rao and Goldsby’s (2009) study, which found that political instability could be a key
component of supply chain risk. Common risks embedded in storage, processing and
distribution levels are shown in Table 5.12). For instance, financial risk factors have
five different risks of inadequate loan facilities, complex procedures, high interest
rates, inadequate finance and absence of compensation through insurance. Such risks
are verified in the existing literature (the references are shown in Table 5.12).
Similarly, other factors like technological shortage, human resource, government
support and the like are listed in the same table with appropriate references.
Table 5.12: Common Risks with Relevant Literature
Risk factors Risk Variables References
Financial risk
Inadequate loan facilities (Raha and Talukder 2004, Bari 2008, Halder and Barua 2003, Jabbar 2010, Ali and Kapoor 2008)
Complex loan procedures (Chowdhury 2007, Food 2011)
High rate of interest (Trkman and McCormack 2009, Ahsan 2011,Rao and Goldsby 2009, Food 2011)
Inadequate finance ( Ali and Kapoor 2008, Giunipero and Eltantawy 2004, Chowdhury 2007, Ghani and Rahman 2004 , Ghani and Rahman 2004)
Absence of insurance or
compensation coverage
for dairy industry
(Akcaoz, Kizilay, and Ozcatalbas 2009, Bari 2008, Jabbar 2010)
Technological
shortage
Shortage of improved technology (milking machine, feed mixture, grass cutting, improved processing, cooling facilities)
(Akcaoz, Kizilay, and Ozcatalbas 2009, Ghani and Rahman 2004, Raha and Talukder 2004, Shrestha and Yadav 2004)
Human resource
risk
Labour disputes (Rao and Goldsby 2009, Peck 2005, Blos et al. 2009, Tang and Musa 2011)
Illiteracy and inefficiency
of worker
(Mishra and Shekhar 2011, Ali and Kapoor 2008, Shamsuddoha and Edwards 2000, Jabbar 2010)
Shortage of skilled staff (Ali and Kapoor 2008, Shamsuddoha and Edwards 2000, Hashmi 2004, Shrestha and Yadav 2004, Bari 2008)
Switching of staff
frequently
(Giunipero and Eltantawy 2004)

131
Government
policy and
support
Lack of fixed government policy in dairy sector
(Chowdhury 2007, Halder and Barua 2003, Choudhary et al. 2011, Akcaoz, Kizilay, and Ozcatalbas 2009,Rao and Goldsby 2009,Peck 2005, Food 2011)
Poor law and order
situation (terrorism,
musclemen ship)
(Chowdhury 2007, Wagner and Neshat 2010, Trkman and McCormack 2009)
Political risk
Hartal and strike cause delay in working process
(Chowdhury 2007, Mishra and Shekhar 2011, Rao and Goldsby 2009, Jüttner, Peck, and Christopher 2003,Wagner and Neshat 2010)
Political unrest and
interference
(Choudhary et al. 2011,Akcaoz, Kizilay, and Ozcatalbas 2009,Ahsan 2011,Rao and Goldsby 2009, Trkman and McCormack 2009, Shamsuddin et al. 2007)
Mismanagement
and unethical
behaviour of
employees
Corruption (adulteration by mixing water)
(Faye and Loiseau 2002Hashmi 2004, Abdullah 2004, Shrestha and Yadav 2004)
Damage of farm’s assets (Mishra and Shekhar 2011)
Theft (Akcaoz, Kizilay, and Ozcatalbas 2009,Finch 2004, Blos et al. 2009)
Natural risk
Natural uncertainties (storm, excessive rain, flood)
(Finch 2004.Rao and Goldsby 2009, Peck 2005, Wagner and Neshat 2010, Trkman and McCormack 2009,Ali and Kapoor 2008,Choudhary et al. 2011, Blos et al. 2009)
Quick perishability of
milk
(Ghani and Rahman 2004, Choudhary et al. 2011, Shamsuddoha and Edwards 2000)
These risks are categorised according to their uniformity with the appropriate
literature First, the risk factors for storage are presented in Table 5.13. The risk factors
associated with storage level of the supply chain include: hazard, technology,
mismanagement and unethical behaviour and natural risk. At the same time, various
risk variables are related with each factor. For example, machine damage or
breakdown of a cold storage machine is a kind of hazard risk that has already been
pointed out in various literature (for example, Mishra and Shekhar 2011, Rao and
Goldsby 2009, Jüttner, Peck, and Christopher 2003). The same variable under hazard
risk was mentioned in the field study of this research.

132
Table 5.13: Risk Factors (Storage) with Relevant Literature
Risk factors Risk Variables References
Hazard risk Machine damage/breakdown at cold storage
(Mishra and Shekhar 2011, Rao and Goldsby 2009, Jüttner, Peck, and Christopher 2003)
Technological shortage
Inadequate chilling facilities
(Raha and Talukder 2004, Choudhary et al. 2011, Abdullah 2004,Halder and Barua 2003, Ali and Kapoor 2008)
Inadequate cold storage facilities
(Akcaoz, Kizilay, and Ozcatalbas 2009, Ghani and Rahman 2004, Raha and Talukder 2004, Ghani and Rahman 2004, Shrestha and Yadav 2004)
Mismanagement and unethical behaviour of employees
Spoilage of milk through improper handling
(Mishra and Shekhar 2011, Choudhary et al. 2011)
Natural risk
Bacterial contamination for improper temperature
(Mishra and Shekhar 2011, Choudhary et al. 2011, Shrestha and Yadav 2004)
Pollution and Unhygienic environment
Blos et al. 2009, Choudhary et al. 2011, Akcaoz, Kizilay, and Ozcatalbas 2009, Choudhary et al. 2011, Khanna 2004, Abdullah 2004, Shrestha and Yadav 2004 (Blos et al. 2009, Choudhary et al. 2011, Akcaoz, Kizilay, and Ozcatalbas 2009, Choudhary et al. 2011, Khanna 2004, Abdullah 2004, Shrestha and Yadav 2004)
The risk factors for the processing level of a supply chain process are shown in Table
5.14. It identifies six different risk factors explored in the field study and literature.
These factors are hazard, input, poor infrastructural facilities, absence of government
policy, strategic and natural risk. These risk factors have different variables as well. For
instance, drought leads to a decline in milk production due to the scarcity of green
grass, which is a natural risk. The farmer cannot do anything about the natural risk as it
is uncontrollable. In this situation, a farmer can explore alternative options to green
grass so that milk production remains at an optimum level. Similarly, hazard risks are
associated with cattle disease, machine breakdown at the processing unit, a fire at the
farm sheds and staff injury. There might be more risks, but the risks listed are the ones
that happen most frequently in the case companies.

133
Table 5.14: Risk Factors (Processing) with Relevant Literature
Risk Factors Risk Variables References
Hazard risk
Cattle diseases
(Akcaoz, Kizilay, and Ozcatalbas 2009, Finch
2004,Peck 2005, Saadullah 2000, Shamsuddoha and
Edwards 2000, Ghani and Rahman 2004, Bari 2008,
Halder and Barua 2003, Trkman and McCormack
2009, Choudhary et al. 2011, Shamsuddin et al.
2007)
Machine
breakdown at
processing unit
(Mishra and Shekhar 2011, Rao and Goldsby 2009,
Jüttner, Peck, and Christopher 2003)
Fire at farm shed
(Jüttner, Peck, and Christopher 2003, Blos et al.
2009, Mishra and Shekhar 2011,Rao and Goldsby
2009, Trkman and McCormack 2009)
Accident (Staff
injury)
(Jüttner, Peck, and Christopher 2003, Mishra and
Shekhar 2011, Wagner and Neshat 2010, Trkman
and McCormack 2009, Tang and Musa 2011)
Input risk
Inadequate supply
of quality feed
(Rao and Goldsby 2009, PRAN-RFL 2007, Saadullah
2000, Shamsuddoha and Edwards 2000)
High cost of feed
and medicine
(Mishra and Shekhar 2011,Ahsan 2011)
Scarcity of feed
(Saadullah 2000, Rao and Goldsby 2009,
Shamsuddoha and Edwards 2000, Raha and
Talukder 2004, Ghani and Rahman 2004, Shrestha
and Yadav 2004, Bari 2008, Halder and Barua 2003,
Shamsuddin et al. 2007, Jabbar 2010)
Lack of upgrade
vaccination and
veterinary services
(Rao and Goldsby 2009, Raha and Talukder 2004,
Ghani and Rahman 2004, Bari 2008, Jabbar 2010)
Poor
infrastructural
facilities
Shortage of land
for expanding farm
(Ghani and Rahman 2004, Ali and Kapoor
2008,Choudhary et al. 2011,Bari 2008)
Absence of
government
policy & support
Irregular supply of
vaccine from
government
(Akcaoz, Kizilay, and Ozcatalbas 2009,
Shamsuddoha and Edwards 2000)
Strategic risk
Competition among
the farms
(Manuj and Mentzer 2008, Abdullah 2004, Food
2011, Wagner and Neshat 2010, Halder and Barua
2003)
Bureaucratic
complexity on
maintaining
various formalities
(Chowdhury 2007)
Natural risk
Drought leads to a
decline in milk
production
(Choudhary et al. 2011, Wagner and Neshat 2010)
Table 5.15 represents the risk factors for distribution with relevant literature. The risk
factors identified within the distribution level processing in the dairy are hazard,
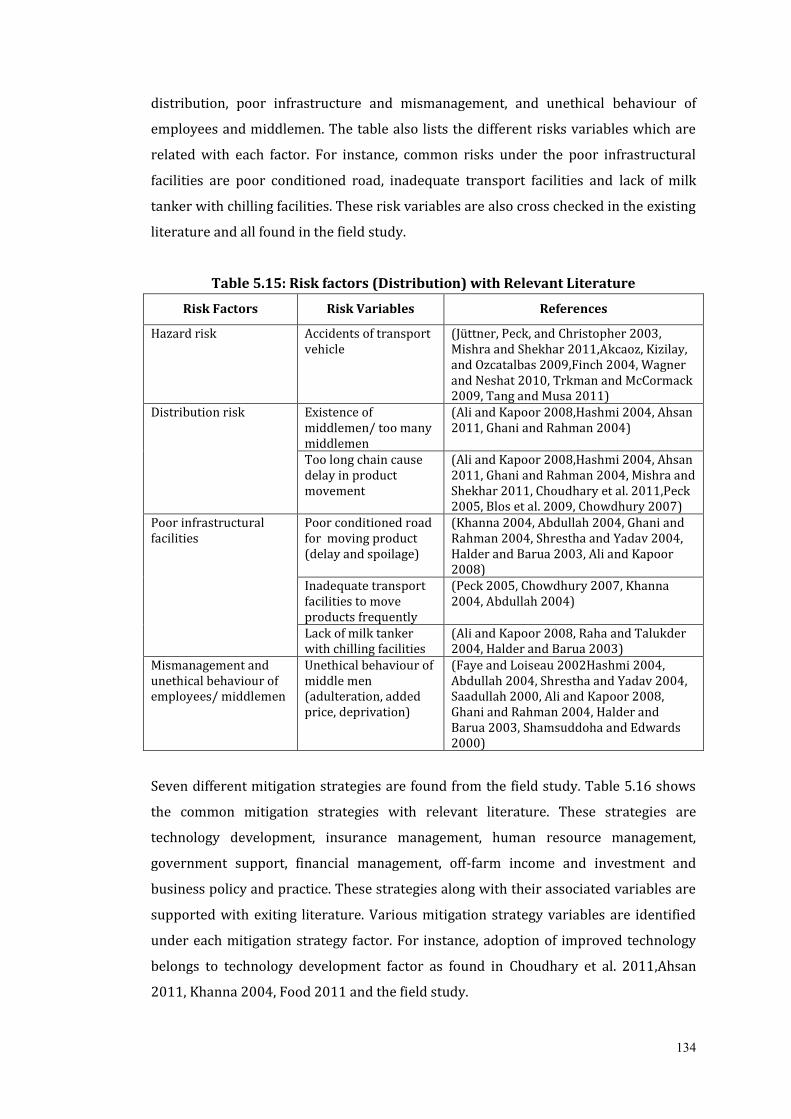
134
distribution, poor infrastructure and mismanagement, and unethical behaviour of
employees and middlemen. The table also lists the different risks variables which are
related with each factor. For instance, common risks under the poor infrastructural
facilities are poor conditioned road, inadequate transport facilities and lack of milk
tanker with chilling facilities. These risk variables are also cross checked in the existing
literature and all found in the field study.
Table 5.15: Risk factors (Distribution) with Relevant Literature
Risk Factors Risk Variables References
Hazard risk
Accidents of transport vehicle
(Jüttner, Peck, and Christopher 2003, Mishra and Shekhar 2011,Akcaoz, Kizilay, and Ozcatalbas 2009,Finch 2004, Wagner and Neshat 2010, Trkman and McCormack 2009, Tang and Musa 2011)
Distribution risk Existence of middlemen/ too many middlemen
(Ali and Kapoor 2008,Hashmi 2004, Ahsan 2011, Ghani and Rahman 2004)
Too long chain cause delay in product movement
(Ali and Kapoor 2008,Hashmi 2004, Ahsan 2011, Ghani and Rahman 2004, Mishra and Shekhar 2011, Choudhary et al. 2011,Peck 2005, Blos et al. 2009, Chowdhury 2007)
Poor infrastructural facilities
Poor conditioned road for moving product (delay and spoilage)
(Khanna 2004, Abdullah 2004, Ghani and Rahman 2004, Shrestha and Yadav 2004, Halder and Barua 2003, Ali and Kapoor 2008)
Inadequate transport facilities to move products frequently
(Peck 2005, Chowdhury 2007, Khanna 2004, Abdullah 2004)
Lack of milk tanker with chilling facilities
(Ali and Kapoor 2008, Raha and Talukder 2004, Halder and Barua 2003)
Mismanagement and unethical behaviour of employees/ middlemen
Unethical behaviour of middle men (adulteration, added price, deprivation)
(Faye and Loiseau 2002Hashmi 2004, Abdullah 2004, Shrestha and Yadav 2004, Saadullah 2000, Ali and Kapoor 2008, Ghani and Rahman 2004, Halder and Barua 2003, Shamsuddoha and Edwards 2000)
Seven different mitigation strategies are found from the field study. Table 5.16 shows
the common mitigation strategies with relevant literature. These strategies are
technology development, insurance management, human resource management,
government support, financial management, off-farm income and investment and
business policy and practice. These strategies along with their associated variables are
supported with exiting literature. Various mitigation strategy variables are identified
under each mitigation strategy factor. For instance, adoption of improved technology
belongs to technology development factor as found in Choudhary et al. 2011,Ahsan
2011, Khanna 2004, Food 2011 and the field study.

135
Table 5.16: Common Mitigation Strategies with Relevant Literature
Mitigation
Strategy (Factor)
Mitigation Strategy
(Variable) Reference
Technology
development
Adoption of improved technology
(milking machine, feed mixture,
grass cutting, improved
processing facilities)
(Choudhary et al. 2011,Ahsan 2011,
Khanna 2004, Food 2011)
Insurance
management
Buying insurance against
production loss
(Akcaoz, Kizilay, and Ozcatalbas
2009,Ahsan 2011)
Human resource
management
Hiring skilled staff (Tipples and Morriss 2002; Morriss et
al. 2006; Food 2011a)
Motivational and incentives
facilities for staff
(Abdullah 2004)
Government
support
Initiative to remove political
uncertainty
(Chowdhury 2007)
Implementation of a fixed policy
for dairy sector
(PRAN-RFL 2007, Shamsuddoha and
Edwards 2000, Shrestha and Yadav
2004)
Financial
management
Assurance of adequate
institutional credit support with
low rate of interest
(Ahsan 2011, Chowdhury 2007,
Shamsuddoha and Edwards 2000,
Shamsuddin et al. 2007)
Off-farm income
and investment
Introducing off-farm activities (Akcaoz, Kizilay, and Ozcatalbas 2009,
Ahsan 2011)
Focus on value addition Shrestha and Yadav 2004, Group
2009, Ali and Kapoor 2008
Business policy
and practice
Promote sound business
practices by cooperation, better
coordination and information
sharing
(Choudhary et al. 2011, Jüttner, Peck,
and Christopher 2003)
Reduction of risks through
merger, acquisition and
integration
(Rao and Goldsby 2009, Peck 2005,
Manuj and Mentzer 2008)
Table 5.17 lists different mitigation strategies for storage level that are identified
through the field study. Training management and backup capacity are two factors
found in the existing literature as well. For example, the field study supports training
management on temperature control and hygiene management. Shamsuddoha and
Edwards (2000) mentioned training management that could be overcome through
arranging proper training programmes.
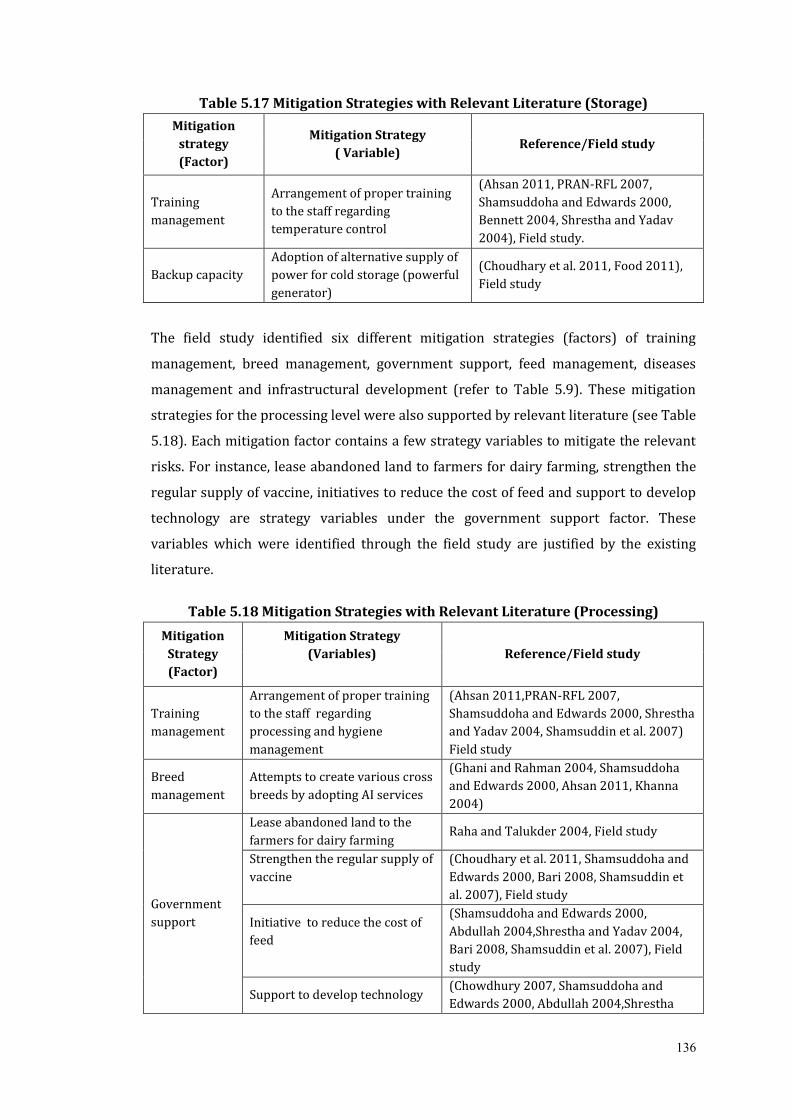
136
Table 5.17 Mitigation Strategies with Relevant Literature (Storage)
Mitigation
strategy
(Factor)
Mitigation Strategy
( Variable) Reference/Field study
Training
management
Arrangement of proper training
to the staff regarding
temperature control
(Ahsan 2011, PRAN-RFL 2007,
Shamsuddoha and Edwards 2000,
Bennett 2004, Shrestha and Yadav
2004), Field study.
Backup capacity
Adoption of alternative supply of
power for cold storage (powerful
generator)
(Choudhary et al. 2011, Food 2011),
Field study
The field study identified six different mitigation strategies (factors) of training
management, breed management, government support, feed management, diseases
management and infrastructural development (refer to Table 5.9). These mitigation
strategies for the processing level were also supported by relevant literature (see Table
5.18). Each mitigation factor contains a few strategy variables to mitigate the relevant
risks. For instance, lease abandoned land to farmers for dairy farming, strengthen the
regular supply of vaccine, initiatives to reduce the cost of feed and support to develop
technology are strategy variables under the government support factor. These
variables which were identified through the field study are justified by the existing
literature.
Table 5.18 Mitigation Strategies with Relevant Literature (Processing)
Mitigation
Strategy
(Factor)
Mitigation Strategy
(Variables)
Reference/Field study
Training
management
Arrangement of proper training
to the staff regarding
processing and hygiene
management
(Ahsan 2011,PRAN-RFL 2007,
Shamsuddoha and Edwards 2000, Shrestha
and Yadav 2004, Shamsuddin et al. 2007)
Field study
Breed
management
Attempts to create various cross
breeds by adopting AI services
(Ghani and Rahman 2004, Shamsuddoha
and Edwards 2000, Ahsan 2011, Khanna
2004)
Government
support
Lease abandoned land to the
farmers for dairy farming Raha and Talukder 2004, Field study
Strengthen the regular supply of
vaccine
(Choudhary et al. 2011, Shamsuddoha and
Edwards 2000, Bari 2008, Shamsuddin et
al. 2007), Field study
Initiative to reduce the cost of
feed
(Shamsuddoha and Edwards 2000,
Abdullah 2004,Shrestha and Yadav 2004,
Bari 2008, Shamsuddin et al. 2007), Field
study
Support to develop technology (Chowdhury 2007, Shamsuddoha and
Edwards 2000, Abdullah 2004,Shrestha

137
and Yadav 2004), Field study
Feed
management
Focus on certified feed supplier
to get quality feed
(Choudhary et al. 2011, PRAN-RFL 2007,
Khanna 2004)
Arrangement of adequate
grassland for producing Napier
grass
(Raha and Talukder 2004), Field study
Diseases
management
Arrangement of regular
vaccination for the cattle
(Choudhary et al. 2011,Akcaoz, Kizilay, and
Ozcatalbas 2009, Ghani and Rahman 2004,
Khanna 2004), Field study
Arrangement of improved and
upgraded veterinary services
(Shamsuddoha and Edwards 2000, Khanna
2004, Shamsuddin et al. 2007), Field study
Infrastructural
development
Building multi-storeyed
complex for farm extension Field study
The field study identified five different distribution mitigation strategies (factors),
namely, human resource management, government support, transport management,
infrastructural development and business practices and policy (see Table 5.10). These
different mitigation strategies along with supporting literature are shown in Table
5.19. Various mitigation strategies (variables) are also identified under each factor. For
example, under the business policy and practice factor, the following variables are
identified: focus on product diversification, removal of unnecessary influence of
middlemen and direct marketing variables.
Table 5.19 Mitigation Strategies with Relevant Literature (Distribution)
Mitigation
strategy
(Factor)
Mitigation Strategy
( Variable) Reference/Field study
Human resource
management Building monitoring team (Ahsan 2011, Food 2011), Field study
Government
support
Initiative to develop roads
and highways (Shamsuddin et al. 2007), Field study
Transport
Management
Arrangement of adequate
number of transport Field study
Arrangement of refrigerated
transport facilities (Abdullah 2004), Field study
Infrastructural
development
Development of roads and
highway
(Chowdhury 2007, Shamsuddin et al. 2007),
Field study
Business
practices and
policy
Focus on product
diversification
(Shrestha and Yadav 2004, Group 2009, Ali and
Kapoor 2008), Field study
Removal of unnecessary
influence of middlemen
(Peck 2005, Sheffi and Rice 2005, Jüttner, Peck,
and Christopher 2003), Field study
Direct marketing
(Choudhary et al. 2011, (Akcaoz, Kizilay, and
Ozcatalbas 2009), Field study

138
One of the major tasks of this research is to identify appropriate sustainable outcomes
through mitigating existing supply chain risks. Section 5.3.5.1 discussed these
sustainable outcomes in light of their economic, social and environmental aspects (see
Table 5.11). The table also identified various outcomes under each aspect of
sustainability. For instance, six different outcomes can be achieved through the
economic aspect. These outcomes are supported by the literature (see Table 5.20).
They are profit maximisation, cost minimisation, increase in personal income, increase
in production, product quality improvement, expansion of farming system, production
of value added product and diversified product.
Table 5.20: Sustainable Outcomes with Relevant Literature
Sustainable Aspects
Outcomes Reference
Economic
Profit maximisation (Wagner and Neshat 2010), field study Cost minimisation
(Carter and Rogers 2008, Bennett 2004, Abdullah 2004, Wagner and Neshat 2010, Fawcett, Magnan, and McCarter 2008), field study
Increase in personal income
(Shamsuddoha 2009, Kabir and Huo 2011, Bari 2008Ghani and Rahman 2004, Jabbar 2010), field study
Increase in production
(Abdullah 2004), field study
Product quality improvement
( Carter and Rogers 2008, Raha and Talukder 2004, Abdullah 2004,Fawcett, Magnan, and McCarter 2008), field study
Expansion of farming system
(Shamsuddoha and Edwards 2000, Jabbar 2010), field study
Production of value added product and diversified product
(Abdullah 2004, Ghani and Rahman 2004), field study
Social
Goodwill enhancement
(Carter and Rogers 2008b), field study
Supply of quality food ( Raha and Talukder 2004), field study
Nutritional development (Okano, Vendrametto, and Santos 2010, Bari 2008, Haque 2009, Ghani and Rahman 2004, Halder and Barua 2003), field study
Improvement of living standard
(Bari 2008; Curtis 2011; Khan, Peters and Uddin 2009), field study
Creation of employment opportunity
(Ritchie and Brnidley 2007a; Bari 2008), Abdullah 2004), field study
Environmental
Creation of sound working environment
(Carter and Rogers 2008, Group 2009), field study
Waste management (Loehr 1974, Al Mamun, Nasrat, and Debi 2012), field study
Health improvement of cattle(Animal Quality)
(Okano, Vendrametto, and Santos 2010, Fawcett, Magnan, and McCarter 2008, Group 2009), field study

139
Strategies (outcomes) can be implemented for the economic gain of the concerned
farms or industries. The field study explored ‘Product quality improvement’ as a
sustainable outcome. It is found that a better quality product could be ensured through
maintaining and implementing a set of standards regarding production methods.
Carter and Roger (2008) found this sustainable outcome and mentioned that
improvement of product quality is associated with the implementation of ISO 14000
standards.
5.3.7 THE QUALITY FUNCTION DEPLOYMENT ANALYSIS
This section presents and discusses the results of the data analysis using Quality
Function Deployment (QFD) method. This analysis was based on the completion of
questionnaire-based surveys conducted among three different groups of people
(employees, executives and supply chain members) of the same two large-scale
commercial dairy farms (Nahar and Paharika) (see Table 5.21 for a profile of the
respondents). The first part of the survey (see Appendix 4A) collected data related to
risk ratings, relationship scores of risks and strategies, and relative cost, while the
second part (see Appendix 4B) collected data for developing a relationship matrix for
the second phase of the QFD analysis. This data related to relationship scores of
strategies and outcomes were collected from only the executive members of both
farms. The respondents included six employees, three executives and two supply chain
members from each dairy farm. The respondents had between 8–25 years of service
experience in the dairy industry.
5.4 QUESTIONNAIRE-BASED SURVEY
This section discusses the results of the questionnaire-based survey (see Appendix 4A)
which, as explained in step VI of section 4.4 (Research Process) of previous chapter
(Chapter 4). A questionnaire survey was conducted among three different groups
(employees, executives and supply chain members) of the same two large-scale
commercial dairy farms (Nahar Dairy and Paharika Dairy). The first part of this survey
collected data related to risk ratings, relationship scores of risks and strategies, and
relative cost. The results of the data analysis using Quality Function Deployment (QFD)
method are discussed in the following sections of this chapter. The second part of the
survey (see Appendix 4B) was conducted to collect data for developing the relationship
matrix for the second phase of the QFD analysis. This data related to relationship
scores of strategies and outcomes were collected from only the executive members of

140
both farms. The sample of the questionnaire by which relationship data (strategies and
outcomes) was conducted is shown in appendix 4B.
5.4.1 Respondents Profile
The 22 respondents involved in this quantitative phase were employees, executives
and supply chain members of the two case industries. There were six employees, three
executives and two supply chain members from each. The respondents had between
eight and 25 years of service experience in the dairy industry. The employees of Nahar
are N1, N2, N3, N4, N5, N6 and the executives of Nahar are N7, N8, and N9. The supply
chain members of Nahar are N10, N11 (see Table 5.21). Similarly P1, P2, P3, P4, P5 and
P6 are employees of Paharika and P7, P8, P9 are executives of Paharika and P10 and
P11 are supply chain members of Paharika.
The data for the second part of the QFD analysis (Phase 2) were collected only from the
executives of both farms. Respondents for Phase 2 are six executives, three from each
farm: N7, N8 and N9 from Nahar Dairy and P7, P8 and P9 from Paharika Dairy (shown
in Table 5.21)
Table 5.21: Background Information of Respondents
Dairy Respondent No.
No. of years at work
Designation
Nahar Dairy
N1 13 Supervisor Employee N7 15 Production manager Executive N8 25 Managing director Executive N2 8 Assistant sales manager Employee N3 15 Regional sales manager Employee N4 12 Store keeper Employee N5 10 Assistant manager Employee N6 8 Store manager Employee N9 12 Sales manager Executive
N10 11 Milk distributor SC member N11 8 Feed supplier SC member
Paharika Dairy
P1 12 Store keeper Employee P2 18 Assistant store manager Employee P7 11 Sales Manager Executive P3 9 Regional sales manager Employee P4 10 Assistant sales manager Employee P5 12 Store manager Employee P8 22 Managing director Executive P9 20 Production manager Executive P6 14 Assistant production
manager Employee
P10 8 Milk distributor SC Member P11 11 Feed supplier SC Member

141
5.5 THE QFD PROCESS
The QFD process is an orderly sequence of activities, which uses a series of matrices to
organise, analyse and compare information. It utilises a process, containing the result
of research and analysis on customer groups and competitors, with the help of a
powerful analytical framework, called the ‘house of quality’ matrix (Walker 2002). This
matrix has its own shape with various rooms containing the result of different matrices
of each phase. Normally, the QFD process begins with customer requirements and then
translates the requirements into technical specifications (Bouchereau and Rowlands
2000a). While the methods of quantitative data analysis were explained in section 4.7.2
(d), in this phase the results of quantitative data analysis are presented.
5.5.1 QFD PART I: PHASE 1
After collecting all necessary data required for QFD analysis (explained in Section 4.6),
in this phase various matrices for QFD analysis are formed. The matrices for Step 1 and
Step 2 of QFD process (see Section 4.6.1) were developed from interview data, while
the matrices for Step 3 to Step 7 of the QFD process (see Section 4.6.1) were developed
from the data obtained through the survey. The results presented and discussed in this
section are as follows: identifying risk (Step 1 of Section 4.6.1), identifying mitigation
strategies (Step 2 of Section 4.6.1), calculating the degree of importance by prioritising
the risk factors (Step 3 of Section 4.6.1), evaluating the relationship between risk and
strategy (Step 4 of Section 4.6.1), identifying organisational resource constraints (Step
5 of Section 4.6.1), developing the roof matrix regarding the cost savings from
concurrent implementation of two strategies (Step 6 of Section 4.6.1), and calculating
the weights of mitigation strategies (Step 7 of Section 4.6.1).
5.5.1.1 Identifying Risks
Identification of risk consists of identifying and quantifying exposures that threaten a
company’s assets and profitability(Finch 2004). As mentioned in Section 5.3, to identify
multiple dairy risks, interviews with key dairy industry stakeholders and a review of
dairy sector documents was undertaken. After analysing the qualitative data using
content analysis, different factors and variables of dairy supply chain risk were
explored (explained in Section 5.3.3.1). Similar variables were combined to eliminate
redundancies. Finally, 45 variables were classified as distinct variables that are
grouped into seven factors. These factors are ‘financial risk’, ‘technological risk’,
‘human resource risk’, ‘government policy and support’, ‘political risk’,
‘mismanagement of staff’ and ‘natural risk’. Under each risk factor, several risk

142
variables were named. These 45 risks relevant to the dairy supply chain were finalised
as input data for the matrix development of Step 1 (WHATs) of QFD analysis.
As seen in Tables 5.3, 5.4, 5.5 and 5.6, some risks are common at every level (storage,
processing and distribution), where some apply solely to one specific level. The detail
of each risk factor was described in Section 5.3.3.1, whereas the descriptions of each
risk variable are provided in Appendix 5A. Table 5.22 shows all risks. Risk 1 (R1) to
risk 19 (R19) are common risk sources for every level. By contrast, the other risks only
apply to specific levels, as follows: risk 20 (R20) to risk 25 (R25) apply solely to the
storage level; risk 26 (R26) to risk 38 (R38) apply to the processing level; and risk 39
(R39) to risk 45 (R45) apply to the distribution level. More risks are associated with
the processing level than with the storage and distribution levels.
Table 5.22: Dairy Supply Chain Risks
R1 = Inadequate loan facilities R24 = Bacterial contamination for improper temperature
R2 = Complex loan procedures R25 = Pollution and unhygienic environment
R3 = High rate of interest R26 = Cattle diseases R4 = Inadequate finance R27 = Machine damage/breakdown at
processing unit R5 = Absence of insurance or
compensation coverage R28 = Fire at farm shed
R6 = Shortage of improved technology (Milking machine, feed mixture, grass cutting, improved processing facilities)
R29 = Accident (staff injury)
R7 = Labour disputes R30 = Inadequate supply of quality feed
R8 = Illiteracy and inefficiency of worker
R31 = High cost of feed and medicine
R9 = Shortage of skilled staff R32 = Scarcity of feed R10 = Switching of staff frequently R33 = Lack of upgrade vaccination and
veterinary services R11 = Lack of fixed government policy
in dairy sector R34 = Shortage of land for expanding
farm R12 = Poor law and order situation
(terrorism, musclemen ship) R35 = Irregular supply of vaccine from
government R13 = Hartal and strike cause delay in
work process R36 = Competition among the farms
R14 = Political Unrest and interference R37 = Bureaucratic complexity on maintaining various formalities
R15 = Corruption (adulteration by mixing water)
R38 = Drought leads to a decline in milk production
R16 = Damage of farm’s assets R39 = Accidents of transport vehicle R17 = Theft R40 = Existence of middlemen/ too
many middlemen

143
R18 = Natural disaster (flood, excessive rain, storm)
R41 = Too long chain cause delay in product movement
R19 = Quick perishability of Milk R42 = Poor conditioned road for moving product (delay & spoilage)
R20 = Machine damage/breakdown at cold storage
R43 = Inadequate transport facilities to move products frequently
R21 = Inadequate chilling facilities R44 = Lack of milk tanker (refrigerated)
R22 = Inadequate cold storage R45 = Unethical behaviour of middle men (adulteration, added price, deprivation)
R23 = Spoilage of milk through improper handling
The detailed descriptions of these above mentioned risks are provided in Appendix 5A.
5.5.1.2 Identifying Risk Mitigation Strategies
From the qualitative data analysis (see Section 5.3.3.2), numerous strategies were
suggested by the respondents as strategies to mitigate dairy risk. An extensive review
of literature related to supply chain risk management and the qualitative interviews
resulted in the listing of fourteen mitigation strategies. Some of these factors were
described in Section 5.3.3.2. Table 5.23 represents the list of 32 mitigation strategies.
As shown previously in Tables 5.15, 5.16, 5.17 and 5.19, mitigation strategies S1 to S11
are common strategies for all levels (storage, processing and distribution), with the
remainder of the mitigation strategies being applicable at only one specific level as
follows: Strategy 12 (S12) and Strategy 13 (S13) are only effective for the storage level;
Strategies S14 to S24 are possible mitigation strategies for the processing level; and
strategiesS25 to S32 for the distribution level. Two strategies were suggested for the
storage level, ten strategies were suggested for the processing level and seven
strategies were suggested for the distribution level. A detailed description of all the
variables of mitigation strategies is presented in Appendix 5B.

144
Table 5.23: Dairy Supply Chain Risk Mitigation Strategies
S1 = Adoption of improved technology (Milking machine, feed mixture, grass cutting, improved processing facilities)
S17 = Strengthen the regular supply of vaccine
S2 = Buying insurance against production loss.
S18 = Initiative to reduce the cost of feed
S3 = Hiring skilled staff S19 = Support to develop technology
S4 = Motivational and incentives facilities for staff
S20 = Focus on certified feed supplier to get quality feed.
S5 = Initiative to remove political uncertainty
S21 = Arrangement of adequate grassland for producing Napier grass
S6 = Implementation of a fixed policy for dairy sector
S22 = Arrangement of regular vaccination for the cattle
S7 = Assurance of adequate institutional credit support with low rate of interest
S23 = Arrangement of improved and upgraded veterinary services
S8 = Introducing off-farm activities S24 = Building multi-storeyed complex for farm extension
S9 = Focus on value addition S25 = Building monitoring team
S10 = Promote sound business practices by cooperation, better coordination and information sharing
S26 = Initiative to develop roads and highways
S11 = Reduction of risks through merger, acquisition and integration.
S27 = Arrangement of adequate number of transport
S12 = Arrangement of proper training to the staff regarding temperature control
S28 = Arrangement of refrigerated transport facilities
S13 = Adoption of alternative supply of power for cold storage (powerful generator)
S29 = Development of roads and highway
S14 = Arrangement of proper training to the staff regarding processing and hygiene management
S30 = Focus on product diversification
S15 = Attempts to create various cross breeds by adopting AI services.
S31 = Removal of unnecessary influence of middlemen
S16 = Lease abandoned land to the farmers for dairy farming
S32 = Direct marketing
5.5.1.3 Degree of Importance (DI)
After obtaining the required data from the survey for the QFD analysis, the degree of
importance for risks were calculated (as explained in Section 4.7.2 d). The data
regarding probability and impact were collected using a 0–10 rating scale and later
converted to a 0–1 scale. The findings from calculating the degree of importance for the
three respondent groups (employee, executives and supply chain members) of Nahar
Dairy is shown in Table 5.24. Here, ‘P’ refers to probability score, ‘I’ refers to impact

145
score, ‘DI’ refers to the product of risk and impact score, the degree of importance
score (see Section 4.7.2d). The Nahar respondents are coded ‘N1 … N11’with the
employees (N1–N6), the executives (N7–N10) and the supply chain members (N10&
N11). A similar table for the calculation of the degree of importance for Paharika
Dairy’s three groups of respondents is shown in Appendix 5C.
The result, according to the employees of Nahar Dairy, indicates that the most
important risks for the dairy supply chain in Bangladesh are: ‘Hartal and strike cause
delay in work process’ (R13), ‘High rate of interest’ (R3), ‘Absence of insurance or
compensation coverage’ (R5), and ‘Illiteracy and inefficiency of workers’ (R8).The
employee group of Nahar Dairy gave the highest priority to the risk ‘Hartal and strike
delay in work in process’ (R13) with 65% importance (see Table 5.24). According to
their opinion, the second most important risk is ‘High rate of interest’ (R3) with60%
importance followed by another two risks with same degree of importance. These risks
are ‘Absence of insurance’ and Compensation coverage’ (R5) and ‘Illiteracy and
inefficiency of workers’ (R8) with 59% importance. By contrast, the least important
risk was (R29) ‘Accident-staff injury’ which is of 10% importance.
The executive group of Nahar Dairy identified the most important risk as(R13) ‘Hartal
and strike cause delay in work process’ with 78% importance. This group also
indicated two other risks as important by prioritising them with 70% importance.
These two risks are: ‘Lack of fixed government policy in dairy sector’ (R11) and
‘Existence of middlemen/too many middlemen’ (R40). The ‘Risk of accident’ (R29) is
less significant to them with 8% importance.
Nahar Dairy supply chain members indicated that the most important risk is ‘Hartal
and strike cause delay in work process’ (R13) with 77% importance followed by
another risk, ‘Political unrest and interference’ (R14) with 72% importance. Another
important risk was (R44) ‘Lack of milk tanker (refrigerated)’ with 68% importance.
Risk (R15) ‘Corruption’ scored 5% which is considered least important. In summary,
according to all Nahar Dairy groups (employees, executives and supply chain
members), the most important risk is ‘Hartal and strike cause delay in work process’
(R13).

146
Table 5.24: Calculation of Degree of Importance (Nahar)
P I DI P I DI P I DI P I DI P I DI P I DI Total DI Av. P I DI P I DI P I DI Total DI Av. P I DI P I DI Total DI Av.
1 Inadequate loan facilities 0.7 0.6 0.42 0.4 0.6 0.24 0.4 0.5 0.2 0.5 0.6 0.3 0.6 0.7 0.42 0.6 0.4 0.24 1.82 0.30 0.4 0.5 0.2 0.5 0.6 0.3 0.4 0.4 0.16 0.66 0.22 0.8 0.4 0.32 0.8 0.6 0.48 0.8 0.40
2 Complex loan procedures 0.5 0.4 0.2 0.6 0.7 0.42 0.6 0.5 0.3 0.8 0.9 0.72 0.8 0.4 0.32 0.2 0.2 0.04 2 0.33 0.7 0.8 0.56 0.7 0.4 0.28 0.3 0.5 0.15 0.99 0.33 0.8 0.4 0.32 0.6 0.6 0.36 0.68 0.34
3 High rate of interest 0.9 0.9 0.81 0.7 0.8 0.56 0.8 0.8 0.64 0.7 0.7 0.49 0.8 0.7 0.56 0.8 0.7 0.56 3.62 0.60 0.8 0.8 0.64 0.7 0.7 0.49 0.8 0.6 0.48 1.61 0.54 0.7 0.5 0.35 0.8 0.5 0.4 0.75 0.38
4 Inadequate finance 0.9 0.8 0.72 0.5 0.6 0.3 0.5 0.5 0.25 0.7 0.8 0.56 0.5 0.8 0.4 0.7 0.8 0.56 2.79 0.47 0.5 0.6 0.3 0.7 0.7 0.49 0.9 0.5 0.45 1.24 0.41 0.6 0.4 0.24 0.8 0.6 0.48 0.72 0.36
5 Absence of insurance or compensation coverage 0.9 0.9 0.81 0.8 0.4 0.32 0.8 0.7 0.56 0.9 0.9 0.81 0.8 0.9 0.72 0.6 0.5 0.3 3.52 0.59 0.7 0.8 0.56 0.9 0.9 0.81 0.7 0.8 0.56 1.93 0.64 0.8 0.4 0.32 0.6 0.6 0.36 0.68 0.34
6
Shortage of improved technology (Milking machine,
feed mixture, grass cutting, improved processing
facilities) 0.7 0.7 0.49 0.2 0.7 0.14 0.9 0.2 0.18 0.8 0.8 0.64 0.7 0.6 0.42 0.7 0.6 0.42 2.29 0.38 0.7 0.7 0.49 0.7 0.5 0.35 0.7 0.7 0.49 1.33 0.44 0.9 0.7 0.63 0.9 0.5 0.45 1.08 0.54
7 Labour disputes 0.6 0.7 0.42 0.4 0.8 0.32 0.6 0.4 0.24 0.8 0.9 0.72 0.8 0.9 0.72 0.7 0.7 0.49 2.91 0.49 0.8 0.7 0.56 0.7 0.7 0.49 0.7 0.5 0.35 1.4 0.47 0.4 0.5 0.2 0.4 0.4 0.16 0.36 0.18
8 Illiteracy and inefficiency of worker 0.8 0.9 0.72 0.6 0.7 0.42 0.8 0.6 0.48 0.9 0.9 0.81 0.9 0.7 0.63 0.7 0.7 0.49 3.55 0.59 0.6 0.7 0.42 0.7 0.7 0.49 0.8 0.9 0.72 1.63 0.54 0.6 0.6 0.36 0.7 0.6 0.42 0.78 0.39
9 Shortage of skilled staff 0.7 0.7 0.49 0.8 0.6 0.48 0.9 0.7 0.63 0.9 0.8 0.72 0.8 0.7 0.56 0.7 0.7 0.49 3.37 0.56 0.8 0.6 0.48 0.7 0.7 0.49 0.9 0.8 0.72 1.69 0.56 0.6 0.7 0.42 0.6 0.8 0.48 0.9 0.45
10 Switching of staff frequently 0.5 0.6 0.3 0.7 0.5 0.35 0.9 0.9 0.81 0.8 0.6 0.48 0.7 0.7 0.49 0.6 0.6 0.36 2.79 0.47 0.5 0.7 0.35 0.7 0.7 0.49 0.8 0.7 0.56 1.4 0.47 0.8 0.5 0.4 0.4 0.3 0.12 0.52 0.26
11 Lack of fixed government policy in dairy sector 0.6 0.7 0.42 0.9 0.8 0.72 0.9 0.7 0.63 0.7 0.7 0.49 0.7 0.5 0.35 0.8 0.8 0.64 3.25 0.54 0.8 0.7 0.56 0.9 0.9 0.81 0.9 0.8 0.72 2.09 0.70 0.6 0.5 0.3 0.8 0.5 0.4 0.7 0.35
12Poor law and order situation
(terrorism, musclemen ship) 0.6 0.6 0.36 0.8 0.7 0.56 0.8 0.7 0.56 0.5 0.7 0.35 0.8 0.9 0.72 0.7 0.7 0.49 3.04 0.51 0.7 0.9 0.63 0.5 0.5 0.25 0.8 0.7 0.56 1.44 0.48 0.8 0.8 0.64 0.8 0.7 0.56 1.2 0.60
13 Hartal and strike cause delay in work process 0.9 0.9 0.81 0.9 0.8 0.72 0.7 0.6 0.42 0.6 0.8 0.48 0.9 0.9 0.81 0.8 0.8 0.64 3.88 0.65 0.8 0.9 0.72 0.9 0.9 0.81 0.9 0.9 0.81 2.34 0.78 0.9 0.9 0.81 0.9 0.8 0.72 1.53 0.77
14 Political Unrest and interference 0.9 0.9 0.81 0.7 0.8 0.56 0.6 0.8 0.48 0.6 0.6 0.36 0.8 0.9 0.72 0.7 0.8 0.56 3.49 0.58 0.6 0.8 0.48 0.7 0.6 0.42 0.7 0.6 0.42 1.32 0.44 0.9 0.9 0.81 0.9 0.7 0.63 1.44 0.72
15 Corruption ( adulteration by mixing water) 0.3 0.5 0.15 0.2 0.4 0.08 0.2 0.4 0.08 0.5 0.4 0.2 0.2 0.1 0.02 0 0.7 0 0.53 0.09 0.6 0.7 0.42 0 0 0 0.8 0.7 0.56 0.98 0.33 0.1 0.5 0.05 0.2 0.2 0.04 0.09 0.05
16 Damage of farm’s assets 0.4 0.5 0.2 0.8 0.9 0.72 0.5 0.6 0.3 0.5 0.9 0.45 0.4 0.5 0.2 0.5 0.7 0.35 2.22 0.37 0.7 0.7 0.49 0.6 0.6 0.36 0.8 0.7 0.56 1.41 0.47 0.3 0.5 0.15 0.2 0.3 0.06 0.21 0.11
17 Theft 0.4 0.4 0.16 0.8 0.7 0.56 0.4 0.4 0.16 0.5 0.5 0.25 0.1 0.2 0.02 0.5 0.7 0.35 1.5 0.25 0.8 0.8 0.64 0.1 0.1 0.01 0.6 0.7 0.42 1.07 0.36 0.1 0.3 0.03 0.3 0.3 0.09 0.12 0.06
18 Natural disaster ( flood, excessive rain, storm) 0.3 0.5 0.15 0.7 0.6 0.42 0.7 0.8 0.56 0.6 0.8 0.48 0.5 0.6 0.3 0.5 0.5 0.25 2.16 0.36 0.8 0.8 0.64 0.3 0.3 0.09 0.3 0.4 0.12 0.85 0.28 0.4 0.6 0.24 0.4 0.7 0.28 0.52 0.26
19 Quick perishability of Milk 0.4 0.6 0.24 0.7 0.6 0.42 0.7 0.5 0.35 0.6 0.7 0.42 0.3 0.5 0.15 0.3 0.4 0.12 1.7 0.28 0.6 0.8 0.48 0.3 0.3 0.09 0.4 0.3 0.12 0.69 0.23 0.6 0.8 0.48 0.7 0.5 0.35 0.83 0.42
20 Machine damage/breakdown at cold storage 0.4 0.5 0.2 0.6 0.7 0.42 0.5 0.6 0.3 0.6 0.5 0.3 0.2 0.2 0.04 0.2 0.2 0.04 1.3 0.22 0.5 0.6 0.3 0.2 0.2 0.04 0.2 0.3 0.06 0.4 0.13 0.7 0.7 0.49 0.4 0.7 0.28 0.77 0.39
21 Inadequate chilling facilities 0.3 0.5 0.15 0.4 0.5 0.2 0.2 0.2 0.04 0.7 0.5 0.35 0.1 0.1 0.01 0.1 0.1 0.01 0.76 0.13 0.8 0.9 0.72 0.2 0.2 0.04 0.5 0.3 0.15 0.91 0.30 0.8 0.7 0.56 0.5 0.7 0.35 0.91 0.46
22 Inadequate cold storage 0.7 0.8 0.56 0.7 0.6 0.42 0.4 0.5 0.2 0.8 0.8 0.64 0.2 0.4 0.08 0.2 0.4 0.08 1.98 0.33 0.6 0.8 0.48 0.2 0.2 0.04 0.3 0.4 0.12 0.64 0.21 0.8 0.7 0.56 0.8 0.7 0.56 1.12 0.56
23 Spoilage of milk through improper handling 0.4 0.4 0.16 0.4 0.5 0.2 0.1 0.2 0.02 0.9 0.9 0.81 0.1 0.1 0.01 0.1 0.1 0.01 1.21 0.20 0.5 0.7 0.35 0.2 0.2 0.04 0.1 0.2 0.02 0.41 0.14 0.8 0.5 0.4 0.5 0.5 0.25 0.65 0.33
24 Bacterial contamination for improper temperature 0.4 0.4 0.16 0.5 0.7 0.35 0.3 0.4 0.12 0.4 0.5 0.2 0.2 0.3 0.06 0.2 0.3 0.06 0.95 0.16 0.6 0.8 0.48 0.3 0.3 0.09 0.4 0.5 0.2 0.77 0.26 0.6 0.5 0.3 0.5 0.4 0.2 0.5 0.25
25 Pollution and Unhygienic environment 0.5 0.4 0.2 0.4 0.6 0.24 0.5 0.6 0.3 0.4 0.5 0.2 0.2 0.3 0.06 0.2 0.3 0.06 1.06 0.18 0.5 0.6 0.3 0.2 0.2 0.04 0.3 0.4 0.12 0.46 0.15 0.6 0.3 0.18 0.7 0.6 0.42 0.6 0.30
26 Cattle diseases 0.6 0.8 0.48 0.7 0.8 0.56 0.5 0.7 0.35 0.7 0.9 0.63 0.5 0.8 0.4 0.5 0.8 0.4 2.82 0.47 0.8 0.9 0.72 0.3 0.3 0.09 0.7 0.8 0.56 1.37 0.46 0.8 0.9 0.72 0.7 0.8 0.56 1.28 0.64
27 Machine damage/breakdown at processing unit 0.5 0.6 0.3 0.5 0.6 0.3 0.6 0.5 0.3 0.6 0.8 0.48 0.1 0.8 0.08 0.1 0.1 0.01 1.47 0.25 0.7 0.9 0.63 0.2 0.2 0.04 0.7 0.7 0.49 1.16 0.39 0.4 0.4 0.16 0.5 0.5 0.25 0.41 0.21
28 Fire at farm shed 0.6 0.8 0.48 0.7 0.8 0.56 0.2 0.6 0.12 0.5 0.8 0.4 0.4 0.1 0.04 0.4 0.9 0.36 1.96 0.33 0.5 0.5 0.25 0.1 0.1 0.01 0.2 0.3 0.06 0.32 0.11 0.2 0.9 0.18 0.3 0.7 0.21 0.39 0.20
29 Accident (Staff injury) 0.3 0.4 0.12 0.2 0.3 0.06 0.4 0.3 0.12 0.5 0.4 0.2 0.1 0.9 0.09 0.1 0.1 0.01 0.6 0.10 0.4 0.5 0.2 0.1 0.1 0.01 0.1 0.2 0.02 0.23 0.08 0.3 0.1 0.03 0.3 0.3 0.09 0.12 0.06
30 Inadequate supply of quality feed 0.5 0.5 0.25 0.5 0.6 0.3 0.8 0.6 0.48 0.7 0.8 0.56 0.4 0.1 0.04 0.4 0.5 0.2 1.83 0.31 0.8 0.9 0.72 0.5 0.5 0.25 0.4 0.5 0.2 1.17 0.39 0.6 0.4 0.24 0.7 0.8 0.56 0.8 0.40
31 High cost of feed and medicine 0.8 0.9 0.72 0.8 0.9 0.72 0.6 0.5 0.3 0.6 0.6 0.36 0.6 0.5 0.3 0.6 0.7 0.42 2.82 0.47 0.9 0.9 0.81 0.9 0.9 0.81 0.6 0.7 0.42 2.04 0.68 0.6 0.7 0.42 0.8 0.8 0.64 1.06 0.53
32 Scarcity of feed 0.8 0.8 0.64 0.5 0.7 0.35 0.6 0.5 0.3 0.5 0.8 0.4 0.3 0.7 0.21 0.3 0.5 0.15 2.05 0.34 0.6 0.6 0.36 0.7 0.7 0.49 0.4 0.5 0.2 1.05 0.35 0.4 0.6 0.24 0.8 0.9 0.72 0.96 0.48
33 Lack of upgrade vaccination and veterinary services 0.5 0.5 0.25 0.4 0.6 0.24 0.6 0.4 0.24 0.4 0.7 0.28 0.6 0.5 0.3 0.6 0.7 0.42 1.73 0.29 0.8 0.8 0.64 0.7 0.7 0.49 0.6 0.7 0.42 1.55 0.52 0.4 0.8 0.32 0.6 0.5 0.3 0.62 0.31
34 Shortage of land for expanding farm 0.8 0.8 0.64 0.7 0.8 0.56 0.8 0.6 0.48 0.9 0.8 0.72 0.7 0.7 0.49 0.7 0.7 0.49 3.38 0.56 0.9 0.9 0.81 0.6 0.6 0.36 0.2 0.3 0.06 1.23 0.41 0.7 0.4 0.28 0.6 0.5 0.3 0.58 0.29
35 Irregular supply of vaccine from government 0.3 0.4 0.12 0.8 0.7 0.56 0.9 0.6 0.54 0.8 0.6 0.48 0.7 0.7 0.49 0.7 0.5 0.35 2.54 0.42 0.8 0.9 0.72 0.6 0.6 0.36 0.6 0.7 0.42 1.5 0.50 0.5 0.6 0.3 0.7 0.8 0.56 0.86 0.43
36 Competition among the farms 0.5 0.5 0.25 0.6 0.5 0.3 0.2 0.3 0.06 0.4 0.4 0.16 0.4 0.5 0.2 0.4 0.3 0.12 1.09 0.18 0.4 0.5 0.2 0.3 0.3 0.09 0.4 0.5 0.2 0.49 0.16 0.8 0.2 0.16 0.5 0.4 0.2 0.36 0.18
37Bureaucratic complexity on maintaining various
formalities 0.5 0.5 0.25 0.7 0.8 0.56 0.6 0.8 0.48 0.7 0.6 0.42 0.5 0.3 0.15 0.5 0.6 0.3 2.16 0.36 0.4 0.5 0.2 0.5 0.5 0.25 0.6 0.7 0.42 0.87 0.29 0.3 0.2 0.06 0.7 0.4 0.28 0.34 0.17
38 Drought leads to a decline in milk production 0.4 0.5 0.2 0.6 0.5 0.3 0.5 0.7 0.35 0.5 0.8 0.4 0.5 0.6 0.3 0.5 0.4 0.2 1.75 0.29 0.5 0.4 0.2 0.3 0.3 0.09 0.2 0.3 0.06 0.35 0.12 0.8 0.5 0.4 0.2 0.7 0.14 0.54 0.27
39 Accidents of transport vehicle 0.4 0.6 0.24 0.8 0.9 0.72 0.8 0.6 0.48 0.9 0.9 0.81 0.2 0.4 0.08 0.2 0.6 0.12 2.45 0.41 0.6 0.9 0.54 0.2 0.7 0.14 0.7 0.6 0.42 1.1 0.37 0.7 0.4 0.28 0.6 0.5 0.3 0.58 0.29
40 Existence of middlemen/ too many middlemen 0.4 0.5 0.2 0.7 0.8 0.56 0.4 0.5 0.2 0.9 0.6 0.54 0.2 0.6 0.12 0.2 0.5 0.1 1.72 0.29 0.8 0.7 0.56 0.9 0.9 0.81 0.8 0.9 0.72 2.09 0.70 0.5 0.5 0.25 0.8 0.5 0.4 0.65 0.33
41 Too long chain cause delay in product movement 0.6 0.6 0.36 0.6 0.7 0.42 0.4 0.3 0.12 0.6 0.7 0.42 0.3 0.5 0.15 0.3 0.6 0.18 1.65 0.28 0.6 0.7 0.42 0.6 0.6 0.36 0.8 0.7 0.56 1.34 0.45 0.7 0.7 0.49 0.6 0.5 0.3 0.79 0.40
42Poor conditioned road for moving product
(delay & spoilage) 0.8 0.8 0.64 0.8 0.9 0.72 0.9 0.3 0.27 0.6 0.6 0.36 0.5 0.6 0.3 0.5 0.6 0.3 2.59 0.43 0.7 0.9 0.63 0.6 0.6 0.36 0.2 0.3 0.06 1.05 0.35 0.7 0.5 0.35 0.8 0.5 0.4 0.75 0.38
43Inadequate transport facilities to move products
frequently 0.5 0.6 0.3 0.7 0.8 0.56 0.7 0.8 0.56 0.7 0.8 0.56 0.7 0.6 0.42 0.7 0.8 0.56 2.96 0.49 0.6 0.8 0.48 0.8 0.8 0.64 0.5 0.5 0.25 1.37 0.46 0.8 0.6 0.48 0.8 0.6 0.48 0.96 0.48
44 Lack of milk tanker (refrigerated) 0.8 0.9 0.72 0.2 0.5 0.1 0.7 0.7 0.49 0.4 0.3 0.12 0.8 0.8 0.64 0.8 0.8 0.64 2.71 0.45 0.3 0.5 0.15 0.7 0.7 0.49 0.1 0.2 0.02 0.66 0.22 0.9 0.8 0.72 0.8 0.8 0.64 1.36 0.68
45
Unethical behavior of middle men
(adulteration, added price, deprivation) 0.3 0.4 0.12 0.5 0.7 0.35 0.7 0.6 0.42 0.8 0.9 0.72 0.6 0.7 0.42 0.6 0.7 0.42 2.45 0.41 0.9 0.9 0.81 0.6 0.6 0.36 0.8 0.9 0.72 1.89 0.63 0.7 0.8 0.56 0.9 0.8 0.72 1.28 0.64
RiskSL
N3 N4N1 N2 N10 N11N5 N6 N7 N8 N9

147
The risks ranking according to the degree of importance for the respondents from
Paharika Dairy differed from Nahar Dairy. The priority rating of risk, according to the
employee group of Paharika Dairy, indicates that ‘Hartal and strike cause delay in work
process’ (R13) is the most important risk for the dairy supply chain in Bangladesh with
71% importance (see Appendix 5C), slightly higher than the 65% rating of Nahar Dairy
employees. They indicated ‘Absence of insurance and compensation coverage’ (R5) as
the second most important risk for the dairy supply chain with 65% importance. Two
other risks of equal importance to them are ‘High rate of interest’ (R3) and ‘Political
unrest and interference’ (R14) both with 58% importance. The risk (R15) ‘Corruption
caused by adulteration’ is least important to them.
Paharika Dairy executives and supply chain members also agreed with the Nahar
executives by giving highest priority to risk R13 ‘Hartal and strike cause delay in work
process ‘with 81% importance. The supply chain members of Paharika also observed
that risks(R14)‘Political unrest and interference ‘and (R45)‘Unethical behaviour of
middle men (adulteration, added price, deprivation)’are equally important as (R13),as
they scored the risks as 81% importance. According to the Paharika executives, other
important risks are ‘High rate of interest’ (R3) and ‘Shortage of land for expanding
farm’ (R34) with 67% and 63% importance respectively. On the contrary, according to
the Paharika executives, the risk (R23) ‘Spoilage of milk through improper handling
‘was less important (8%) while the Paharika supply chain members group considered
risk (R15) ‘Corruption – adulteration by mixing water ‘as less risky (0%). .
5.5.1.4 Identifying the relationship between risks and mitigation strategies
As explained in Section 4.7.2d, another important step of QFD Part 1 is to calibrate the
relationship matrix. After identifying risks and possible strategies from the interview,
these strategies were presented in the questionnaire and respondents were asked to
score each strategy on a scale from (0–1–5-9) to indicate the degree of relationship
between the risks and mitigation strategies (i.e. no–weak–medium-strong). After
conducting the questionnaire survey, data related to relationship matrix were obtained
from twenty two participants from both case industries. Table 5.25 shows how the raw
data for relationship matrix were tabulated, where RiSj (i= 1…..45, j = 1…..32)
represents the relationship scores (0–1–5–9) for the RiSj combination. The raw data is
presented for various RiSj combinations per different respondents.

148
Table 5.25: Tabulation of Data regarding Risk and Strategy Relationship
Risk Strategy S1 S2 S3 S32
R1 R1S1 R1S2 R1S3 … R1S32 R2 R2S1 R2S2 R2S3 … R2S32
R3 R3S1 R3S2 R3S3 … R3S32
……
… … … …
……
R45 R45S1 R45S2 … … R45S32
Table 5.26 presents the raw relationship data for various R1Sj combinations by all the
respondents of Nahar Dairy. There are 45 risks and hence 45 matrices similar to Table
5.26 for the Nahar group. The same table shows that respondents N2 (Nahar employee
2) and N8 (Nahar executive 2) recorded the relationship between Risk 1 and Strategy 1
(R1S1) as strong by scoring it 9. By contrast, N3 (Nahar employee 3), N6 andN7 (Nahar
executive) noted this relationship as weak by scoring it 1. The rest of the respondents
scored 0 for this relationship (R1S1), indicating that there is no relationship between
risk 1 (R1) and strategy 1 (S1).
Table 5.26: Tabulation of Data for Relationship Matrix (Nahar)
Note: R=Risk, S= Mitigation Strategies, N1-N11= Participants of survey from Nahar
Dairy
N1 N2 N3 N4 N5 N6 N7 N8 N9 N10 N11 Total
R1S1 9 1 1 1 9 21
R1S2 0
R1S3 9 5 9 23
R1S4 5 5
R1S5 1 9 1 11
R1S6 5 9 9 5 9 5 9 5 56
R1S7 9 5 5 9 5 9 5 9 9 65
R1S8 9 9 1 9 9 5 42
R1S9 9 5 14
R1S10 5 1 5 1 12
R1S11 1 1
R1S12 0
R1S13 0
R1S14 0
R1S15 0
R1S16 0
R1S17 0
R1S18 1 1
R1S19 0
R1S20 0
R1S21 0
R1S22 0
R1S23 0
R1S24 0
R1S25 0
R1S26 0
R1S27 0
R1S28 0
R1S29 0
R1S30 0
R1S31 0
R1S32 0

149
When these data were tabulated, 45 Excel spread sheets containing the relationship
scores were created for each farm (Nahar and Paharika). The relationships were
constructed between45 risks and 32 mitigation strategies. The aggregate score was
also obtained in the same Excel spread sheet. In order to create the relationship matrix
for the QFD analysis, the weights of the total scores were calculated. To calculate the
weighted average, the data were separated based on groups (employees, executives
and supply chain members). A sample of this calculation (Relationship matrix for QFD
analysis for Nahar Dairy) is shown in Table 5.27. Weighted averages are then placed
into the section WHATs VS. HOWs (relationship matrix of risk and mitigation
strategies) for QFD analysis. This process was mentioned in Step 4 of Section 4.6.1(The
QFD process). The same process was carried out for developing the relationship
matrices for Paharika Dairy (see Appendix 5D).
5.5.1.5 Identifying relative costs (cost constraints)
The details of data identification related to relative costs (cost constraints) were
discussed in Section 4.7.2 (d). The data related to relative cost is used in QFD process
(Step 5 - HOW MUCHs in Section 4.6.1).For both farms, the employee group consists of
six participants, whereas the executive group consist of three participants and the
supply chain members group consist of two participants. The results of relative cost
identification is shown in Table 5.28.
According to all respondents from both farms, the highest cost will be required to
implement Strategy (S1) ‘Adoption of improved technology (milking machine, feed
mixture, grass cutting, improved processing facilities)’. However, the total weighted
value of the relative costs estimated by the groups of employee, executive and supply
chain member of Nahar Dairy were 1098.33, 1286.67 and 985 respectively. According
to the Paharika Dairy respondents, the total weighted value of the relative costs were
estimated as 958.33, 1006.67 and 1015 respectively. All participants from both farms
agreed that the implementation cost of S1 is the highest of all. However, Nahar
employees estimated the cost of implementation of S1 as 88.33, while Nahar executives
estimated the cost for same strategy as 93.33 and Nahar supply chain members
estimated the cost as 100. This same costing occurred with the Paharika respondents.

150
Table 5.27: Value of Relationship Matrix for QFD Analysis (Nahar)
Note: R=Risk, S= Mitigation strategies, N1–N6= employees of Nahar, N7–N9= executives of Nahar, N10–N11= supply chain members of
Nahar, WA= Weighted Average, for example, WA for R1S1 (employees) =1.83 [(9+1+1)/6)]
N1 N2 N3 N4 N5 N6 Total WA N7 N8 N9 Total WA N10 N11 Total WA
R1S1 9 1 1 11 1.83 1 9 10 3.33 0 0
R1S2 0 0.00 0 0.00 0 0
R1S3 9 5 14 2.33 9 9 3.00 0 0
R1S4 0 0.00 5 5 1.67 0 0
R1S5 1 1 0.17 9 1 10 3.33 0 0
R1S6 5 9 9 5 9 37 6.17 5 9 14 4.67 5 5 2.5
R1S7 9 5 5 9 5 9 42 7.00 5 5 1.67 9 9 18 9
R1S8 9 9 1 19 3.17 9 9 18 6.00 5 5 2.5
R1S9 9 9 1.50 5 5 1.67 0 0
R1S10 5 1 6 1.00 5 5 1.67 1 1 0.5
R1S11 1 1 0.17 0 0.00 0 0
R1S12 0 0.00 0 0.00 0 0
R1S13 0 0.00 0 0.00 0 0
R1S14 0 0.00 0 0.00 0 0
R1S15 0 0.00 0 0.00 0 0
R1S16 0 0.00 0 0.00 0 0
R1S17 0 0.00 0 0.00 0 0
R1S18 1 1 0.17 0 0.00 0 0
R1S19 0 0.00 0 0.00 0 0
R1S20 0 0.00 0 0.00 0 0
R1S21 0 0.00 0 0.00 0 0
R1S22 0 0.00 0 0.00 0 0
R1S23 0 0.00 0 0.00 0 0
R1S24 0 0.00 0 0.00 0 0
R1S25 0 0.00 0 0.00 0 0
R1S26 0 0.00 0 0.00 0 0
R1S27 0 0.00 0 0.00 0 0
R1S28 0 0.00 0 0.00 0 0
R1S29 0 0.00 0 0.00 0 0
R1S30 0 0.00 0 0.00 0 0
R1S31 0 0.00 0 0.00 0 0
R1S32 0 0.00 0 0.00 0 0

151
Table 5.28: Calculation of Total Relative Cost (Nahar and Paharika)
Note: N1–N6= employees of Nahar, N7–N9= executives of Nahar, N10–N11= SC members of Nahar, P1–P6= employees of Paharika, P7–P9= executives of Paharika, P10–
P11= SC members of Paharika, S1 to S32= mitigation strategies.
S1 S2 S3 S4 S5 S6 S7 S8 S9 S10 S11 S12 S13 S14 S15 S16 S17 S18 S19 S20 S21 S22 S23 S24 S25 S26 S27 S28 S29 S30 S31 S32
N1 90 10 40 30 10 20 20 50 40 10 10 40 70 10 50 20 10 10 20 10 60 10 30 70 10 10 50 30 10 20 10 20
N2 80 60 40 50 20 40 20 10 30 20 40 30 10 20 10 10 10 20 30 10 20 10 30 40 50 10 70 60 20 10 20 20
N3 90 60 50 30 20 40 20 40 10 20 30 10 40 10 30 10 20 10 10 10 20 10 20 30 50 20 70 50 30 40 30 30
N4 90 60 70 80 10 70 40 50 70 50 60 30 50 50 10 20 20 20 10 10 10 20 20 50 60 50 50 60 40 50 40 60
N5 80 40 70 10 30 10 10 40 70 30 10 20 30 20 10 10 10 10 30 50 40 40 70 60 10 10 50 80 10 20 20 30
N6 100 80 100 80 10 30 50 20 70 40 20 10 50 10 40 10 20 20 60 40 40 40 60 40 70 20 60 80 40 50 20 20
Total 530 310 370 280 100 210 160 210 290 170 170 140 250 120 150 80 90 90 160 130 190 130 230 290 250 120 350 360 150 190 140 180
WA 88.33 51.67 61.67 46.67 16.67 35.00 26.67 35.00 48.33 28.33 28.33 23.33 41.67 20.00 25.00 13.33 15.00 15.00 26.67 21.67 31.67 21.67 38.33 48.33 41.67 20.00 58.33 60.00 25.00 31.67 23.33 30.00 1098.33
N7 100 20 100 20 20 80 40 20 30 10 30 40 60 50 10 10 20 30 100 10 10 30 30 50 60 40 50 60 40 40 10 60
N8 90 60 60 80 10 80 50 30 40 10 50 40 60 50 10 10 20 30 40 10 10 30 30 50 60 40 50 60 40 40 10 60
N9 90 40 50 70 10 30 20 40 50 20 50 20 70 10 50 30 20 10 60 20 30 30 30 80 30 70 50 70 40 50 10 20
Total 280 120 210 170 40 190 110 90 120 40 130 100 190 110 70 50 60 70 200 40 50 90 90 180 150 150 150 190 120 130 30 140
WA 93.33 40.00 70.00 56.67 13.33 63.33 36.67 30.00 40.00 13.33 43.33 33.33 63.33 36.67 23.33 16.67 20.00 23.33 66.67 13.33 16.67 30.00 30.00 60.00 50.00 50.00 50.00 63.33 40.00 43.33 10.00 46.67 1286.67
N10 100 50 40 20 10 40 40 40 20 20 30 10 30 10 50 60 10 10 10 40 30 20 20 60 20 20 50 60 50 40 20 20
N11 100 50 60 40 10 10 50 20 20 30 30 10 30 20 10 20 10 10 10 30 40 20 20 40 20 20 40 60 40 10 10 30
Total 200 100 100 60 20 50 90 60 40 50 60 20 60 30 60 80 20 20 20 70 70 40 40 100 40 40 90 120 90 50 30 50
WA 100.00 50.00 50.00 30.00 10.00 25.00 45.00 30.00 20.00 25.00 30.00 10.00 30.00 15.00 30.00 40.00 10.00 10.00 10.00 35.00 35.00 20.00 20.00 50.00 20.00 20.00 45.00 60.00 45.00 25.00 15.00 25.00 985.00
P1 100 100 50 80 50 60 50 30 40 30 10 10 10 30 40 10 10 10 30 10 20 30 20 70 30 10 20 20 20 40 20 30
P2 80 60 30 40 10 10 10 50 30 30 40 10 50 10 40 10 20 10 60 40 10 10 20 70 50 10 50 70 40 40 10 10
P3 80 60 40 40 20 20 30 40 10 30 10 10 30 10 50 10 10 10 10 30 20 10 10 40 20 10 50 40 10 50 10 10
P4 90 40 70 10 10 10 40 30 40 20 10 10 30 20 40 10 30 10 10 20 20 10 20 70 50 20 40 50 40 50 10 10
P5 80 60 40 20 20 50 20 40 20 30 30 10 10 20 40 40 10 10 40 50 20 20 20 30 10 10 30 40 30 10 20 30
P6 100 60 40 30 20 10 40 10 10 20 30 20 10 10 40 10 10 20 50 30 20 20 20 70 40 20 10 70 50 40 10 10
Total 530 380 270 220 130 160 190 200 150 160 130 70 140 100 250 90 90 70 200 180 110 100 110 350 200 80 200 290 190 230 80 100
WA 88.33 63.33 45.00 36.67 21.67 26.67 31.67 33.33 25.00 26.67 21.67 11.67 23.33 16.67 41.67 15.00 15.00 11.67 33.33 30.00 18.33 16.67 18.33 58.33 33.33 13.33 33.33 48.33 31.67 38.33 13.33 16.67 958.33
P7 80 60 60 50 30 50 30 40 50 30 30 10 10 10 70 10 20 10 30 40 20 10 10 40 30 10 50 10 10 50 10 20
P8 100 60 50 50 10 10 40 50 10 20 30 10 40 20 20 10 20 20 10 20 20 30 20 50 30 10 40 50 10 10 20 10
P9 100 80 50 80 40 60 60 40 10 20 20 20 40 30 40 10 10 30 10 10 20 10 10 60 20 10 50 50 40 40 30 30
Total 280 200 160 180 80 120 130 130 70 70 80 40 90 60 130 30 50 60 50 70 60 50 40 150 80 30 140 110 60 100 60 60
WA 93.33 66.67 53.33 60.00 26.67 40.00 43.33 43.33 23.33 23.33 26.67 13.33 30.00 20.00 43.33 10.00 16.67 20.00 16.67 23.33 20.00 16.67 13.33 50.00 26.67 10.00 46.67 36.67 20.00 33.33 20.00 20.00 1006.67
P10 100 20 40 20 10 10 40 30 20 20 20 20 40 20 20 30 10 30 10 40 40 50 50 60 30 10 40 50 40 20 20 30
P11 100 30 40 20 10 10 50 30 20 20 20 30 60 30 20 20 10 10 30 40 50 20 50 70 40 10 50 60 40 20 10 20
Total 200 50 80 40 20 20 90 60 40 40 40 50 100 50 40 50 20 40 40 80 90 70 100 130 70 20 90 110 80 40 30 50
WA 100.00 25.00 40.00 20.00 10.00 10.00 45.00 30.00 20.00 20.00 20.00 25.00 50.00 25.00 20.00 25.00 10.00 20.00 20.00 40.00 45.00 35.00 50.00 65.00 35.00 10.00 45.00 55.00 40.00 20.00 15.00 25.00 1015.00

152
5.5.1.6 Developing QFD roof matrix
To identify cost savings information, the related data were collected from the
executives group through a telephone interview with three executives from each farm
(Nahar and Paharika), which was mentioned in Section 4.7.2 (d). The executives said
they may have some cost savings when two mitigation strategies are implemented at
the same time. The numerical values of roof matrix are shown in the Tables 5.29 and
5.30.According to Table 5.29, Nahar estimated a relative cost of 93 and 70 for
(S1)‘Adoption of improved technology-milking machine, feed mixture, grass cutting,
improved processing facilities’ and (S3)‘Hiring skilled staff’, if they would like to
implement the strategies separately. If both strategies are included together in a plan,
the farm can save 23%. Similarly, ‘Adoption of improved technology’ (S1) and ‘Focus on
value addition’ (S9) combined can save 40 which are from 30% of savings. Similarly, if
‘Adoption of improved technology’ (S1) and ‘Adoption of alternative supply of power
for cold storage (powerful generator)’ (S13) are implemented simultaneously, 47 are
saved due to 30% savings. It is noted that the cost savings data were collected from the
opinion of the executives from both the farms.
Table 5.29: Cost Saving Data (Nahar)
Pair of Strategies
Relative Cost
Total Relative
Cost
Saving %
Saving Amount
Cost Required After Saving
S1 S3 93 70 163 23 38 126
S1 S9 93 40 133 30 40 93
S1 S13 93 63 157 30 47 110
Table 5.30 shows the cost savings data for Paharika Dairy. Simultaneous
implementation of ‘Adoption of improved technology’ (S1) and ‘Buying insurance
against production loss’ (S2) can save 22% of farm budget. When ‘Adoption of
improved technology’ (S1) and ‘Hiring skilled staff’ (S3) are implemented at the same
time, they could save 30%. Similarly, ‘Adoption of improved technology’ (S1) and
‘Adoption of alternative supply of power for cold storage-powerful generator’ (S13)
jointly save 23%. A roof matrix was developed from the cost savings data from Table
5.29 and 5.30. The roof matrix of Nahar and Paharika is shown in Figure 5.1 and
Appendix 5E respectively. The roof matrix house contains with 32 mitigation
strategies. The name of these strategies can be found in Table 5.23. Figure 5.1 presents
cost savings data for Nahar Dairy. The highest three pairs of strategies with savings are
shown in the roof. The other pairs of strategies have not scored significant savings.

153
Ad
op
tio
n o
f im
pro
ve
d t
ec
hn
olo
gy
(M
ilk
ing
ma
ch
ine
, fe
ed
mix
ture
, g
ras
s c
utt
ing
,
imp
rov
ed
pro
ce
ss
ing
fa
cil
itie
s)
Bu
yin
g i
ns
ura
nc
e a
ga
ins
t p
rod
uc
tio
n l
os
s.
Hir
ing
sk
ille
d s
taff
Mo
tiv
ati
on
al
an
d i
nc
en
tiv
es
fa
cil
itie
s f
or
sta
ff
Init
iati
ve
to
re
mo
ve
po
liti
ca
l u
nc
ert
ain
ty
Imp
lem
en
tati
on
of
a f
ixe
d p
oli
cy
fo
r d
air
y s
ec
tor
As
su
ran
ce
of
ad
eq
ua
te i
ns
titu
tio
na
l c
red
it s
up
po
rt w
ith
lo
w r
ate
of
inte
res
t.
Intr
od
uc
ing
off
-fa
rm a
cti
vit
ies
Fo
cu
s o
n v
alu
e a
dd
itio
n a
nd
pro
du
ct
div
ers
ific
ati
on
Pro
mo
te s
ou
nd
bu
sin
es
s p
rac
tic
es
by
co
op
era
tio
n,
be
tte
r c
oo
rdin
ati
on
an
d
info
rma
tio
n s
ha
rin
g
Re
du
cti
on
of
ris
ks
th
rou
gh
me
rge
r, a
cq
uis
itio
n a
nd
in
teg
rati
on
.
Arr
an
ge
me
nt
of
pro
pe
r tr
ain
ing
to
th
e s
taff
re
ga
rdin
g t
em
pe
ratu
re c
on
tro
l
Ad
op
tio
n o
f a
lte
rna
tiv
e s
up
ply
of
po
we
r fo
r c
old
sto
rag
e (
po
we
rfu
l g
en
era
tor)
Arr
an
ge
me
nt
of
pro
pe
r tr
ain
ing
to
th
e s
taff
re
ga
rdin
g p
roc
es
sin
g a
nd
hy
gie
ne
ma
na
ge
me
nt
Att
em
pts
to
cre
ate
va
rio
us
cro
ss
bre
ed
s b
y a
do
pti
ng
AI
se
rvic
es
.
Le
as
e a
ba
nd
on
ed
la
nd
to
th
e f
arm
ers
fo
r d
air
y f
arm
ing
Str
en
gth
en
th
e r
eg
ula
r s
up
ply
of
va
cc
ine
Init
iati
ve
to
re
du
ce
th
e c
os
t o
f fe
ed
Su
pp
ort
to
de
ve
lop
te
ch
no
log
y
Fo
cu
s o
n c
ert
ifie
d f
ee
d s
up
pli
er
to g
et
qu
ali
ty f
ee
d.
Arr
an
ge
me
nt
of
ad
eq
ua
te g
ras
sla
nd
fo
r p
rod
uc
ing
Na
pie
r g
ras
s
Arr
an
ge
me
nt
of
reg
ula
r v
ac
cin
ati
on
fo
r th
e c
att
le
Arr
an
ge
me
nt
of
imp
rov
ed
an
d u
pg
rad
ed
ve
teri
na
ry s
erv
ice
s
Bu
ild
ing
mu
lti-
sto
rey
ed
co
mp
lex
fo
r fa
rm e
xte
ns
ion
Bu
ild
ing
mo
nit
ori
ng
te
am
Init
iati
ve
to
de
ve
lop
ro
ad
s a
nd
hig
hw
ay
s
Arr
an
ge
me
nt
of
ad
eq
ua
te n
um
be
r o
f tr
an
sp
ort
Arr
an
ge
me
nt
of
refr
ige
rate
d t
ran
sp
ort
fa
cil
itie
s
De
ve
lop
me
nt
of
roa
ds
an
d h
igh
wa
y
Va
lue
ad
dit
ion
an
d p
rod
uc
t d
ive
rsif
ica
tio
n
Re
mo
va
l o
f u
nn
ec
es
sa
ry i
nfl
ue
nc
e o
f m
idd
lem
en
Dir
ec
t m
ark
eti
ng
Table 5.30: Cost Savings Data (Paharika)
Pair of Strategy Relative Cost Total of Relative
Cost
Saving %
Saving Amount
Cost Required
After Saving
S1 S2 93.33 66.67 160 22 35 125
S1 S3 93.33 53.33 147 30 44 103
S1 S13 93.33 30.00 123 23 28 95
Figure 5.1: Roof Matrix (Nahar)
5.5.1.7 Absolute Importance (AI)
The method of calculating absolute importance (AI) appropriate for each strategy was
explained in detail with formula in Step five of Section 4.7.2 (d). Absolute importance
for each mitigation strategy is calculated using this formula. QFD results for AI (along
with relative importance (RI) for Nahar employees is shown in Table 5.31. Similar
tables for the remaining groups are placed in Appendices 5F, 5G, 5H, 5I and 5J.
.23
.30
.30

154
With regard to prioritisation of mitigation strategies, Nahar employees suggested
‘Hiring skilled staff’ (S3) is the most important strategy for mitigating dairy risk. They
also selected ‘To create various cross breeds through adopting artificial insemination
services’ (S15) as the least important strategy. The calculated values of absolute
importance are shown in the Table 5.31, where the highest AI value for S3 is 32.84 and
the lowest AI value for S15 is 1.10. According to the Nahar executives (Table shown in
Appendix 5F), the most important strategy to implement is ‘Fixed policy for dairy
sector’ (S6) with an AI value of 38.48. They selected ‘Product diversification’ (S30) as
the least important strategy with a value of 2.24.The Nahar supply chain members
agreed with the executives in prioritising this mitigation strategy. According to them,
(see Table in Appendix 5G) implementation of a ‘Fixed policy for dairy sector’ (S6) is
the most important strategy. At the same time, they nominated ‘Government initiative
to develop roads and highways’ (S26) as the least important strategy for mitigating
different risks associated with the dairy sector in Bangladesh. The AI value of S6 is
29.15 while S26 is 0.
Paharika employees (Table shown in Appendix 5H) selected ‘Hiring skilled staff’ (S3) as
the most important strategy with a value of 33.01 and ‘Focus on product
diversification’ (S30) as less important with a value of 1.30. Paharika executives
indicated (see Table in Appendix 5I) ‘Fixed policy for dairy sector’ (S6) as the most
important strategy with a value of 29.23, and they agreed with Paharika employees on
‘Focus on product diversification’ (S30) as the least important strategy with a value of
2.11. Likewise, Paharika supply chain members (Table in Appendix 5J) selected
‘Assurance of adequate institutional credit support with low rate of interest’ (S7) as the
most important strategy with an AI value of 21.67. The lowest AI value is 0 which is for
‘Government initiative to develop roads and highways’ (S26).

155
Table 5.31: QFD – Nahar Employees

156
5.5.1.8 Relative Importance (RI)
The relative importance (RI) can be derived through transforming the absolute
importance using certain formula (see Step five under Section 4.7.2(d)). The higher the
RIj , the more important the design attribute that should be applied to the product (Park
and Kim 1998). Park and Kim (1998) explain that the higher the RIj, the more
important are the mitigation strategies that should be adopted to mitigate dairy supply
chain risks. The Nahar Dairy respondent groups had different priorities and assigned
the highest relative importance to different mitigation strategies. The employees
ranked the most important mitigation strategy as ‘Hiring skilled staff’ (S3) with the
highest RI value of 0.08(see Table 5.31). The executives selected ‘Initiative to remove
political uncertainty’ (S5) as the most important strategy (see Appendix 5F) with the
highest RI value of 0.08. On the other hand, Nahar supply chain members considered
‘Implementation of a fixed policy for dairy sector’ (S6) as the most important
mitigation strategy with the highest RI value 0.09 (Appendix 5G).
The Paharika groups also selected different mitigation strategies as having the highest
relative importance. The employees considered (S3)‘Hiring skilled staff’ with the
highest RI value of 0.08, to be the most important, as did the Nahar employees (see
Appendix5H).The Paharika executives considered the most important strategy to be
‘Implementation of a fixed policy for dairy sector’ (S6)with the highest RI value of 0.08
(see Appendix 5I). This is similar to the opinion of Nahar supply chain members. The
Paharika supply chain members selected ‘Assurance of adequate institutional credit
support with low rate of interest’ (S7) as the most important mitigation strategy. This
has the highest RI value at 0.07 (see Appendix 5J).
5.5.2 QFD PART II: PHASE 1
QFD Part II essentially identifies optimal mitigation strategies via optimisation. There
are two sequential steps involved in completing this part which was explained with
Equations 1 and 2 in Section 4.7.2 (e). By following those equations, the optimisation
results are provided in this section.
5.5.2.1 Formulation of dairy supply chain risk mitigation problems through (0, 1)
linear programming (without savings)
The optimum level of risk mitigation with limited resource constraints is determined
through following equation number 1, of Step 1 in Section 4.7.2 (e). The problem does
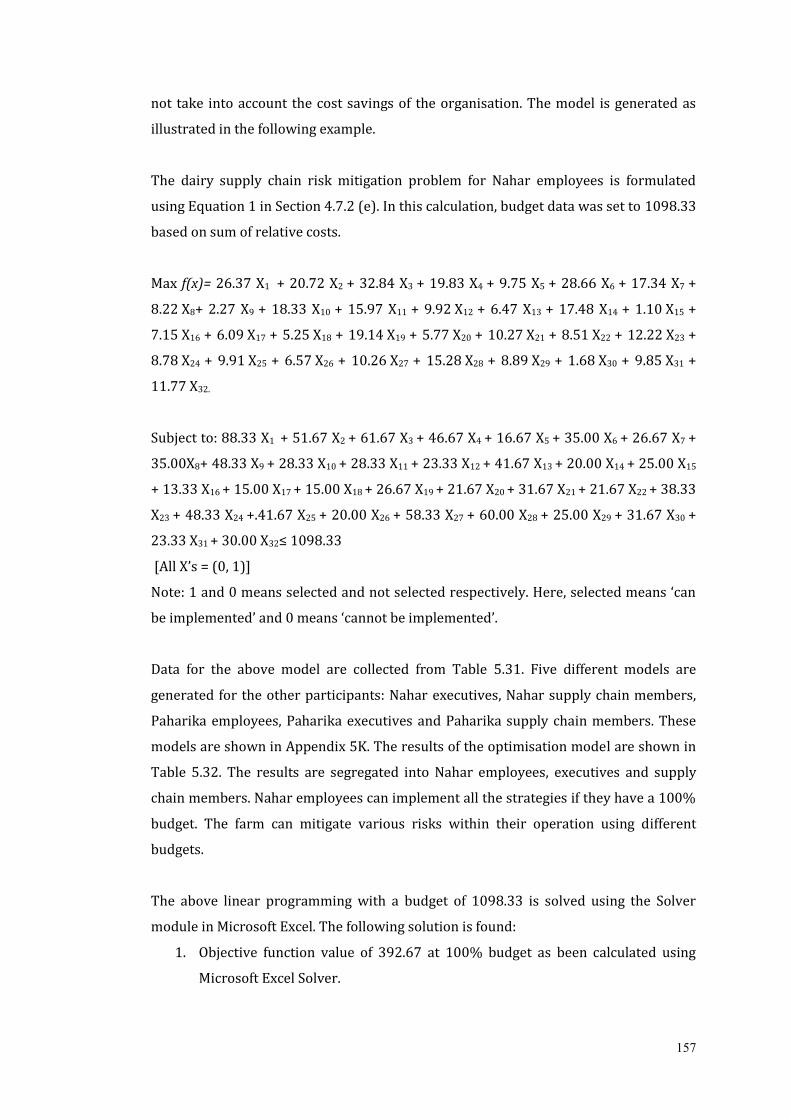
157
not take into account the cost savings of the organisation. The model is generated as
illustrated in the following example.
The dairy supply chain risk mitigation problem for Nahar employees is formulated
using Equation 1 in Section 4.7.2 (e). In this calculation, budget data was set to 1098.33
based on sum of relative costs.
Max f(x)= 26.37 X1 + 20.72 X2 + 32.84 X3 + 19.83 X4 + 9.75 X5 + 28.66 X6 + 17.34 X7 +
8.22 X8+ 2.27 X9 + 18.33 X10 + 15.97 X11 + 9.92 X12 + 6.47 X13 + 17.48 X14 + 1.10 X15 +
7.15 X16 + 6.09 X17 + 5.25 X18 + 19.14 X19 + 5.77 X20 + 10.27 X21 + 8.51 X22 + 12.22 X23 +
8.78 X24 + 9.91 X25 + 6.57 X26 + 10.26 X27 + 15.28 X28 + 8.89 X29 + 1.68 X30 + 9.85 X31 +
11.77 X32.
Subject to: 88.33 X1 + 51.67 X2 + 61.67 X3 + 46.67 X4 + 16.67 X5 + 35.00 X6 + 26.67 X7 +
35.00X8+ 48.33 X9 + 28.33 X10 + 28.33 X11 + 23.33 X12 + 41.67 X13 + 20.00 X14 + 25.00 X15
+ 13.33 X16 + 15.00 X17 + 15.00 X18 + 26.67 X19 + 21.67 X20 + 31.67 X21 + 21.67 X22 + 38.33
X23 + 48.33 X24 +.41.67 X25 + 20.00 X26 + 58.33 X27 + 60.00 X28 + 25.00 X29 + 31.67 X30 +
23.33 X31 + 30.00 X32≤ 1098.33
[All X’s = (0, 1)]
Note: 1 and 0 means selected and not selected respectively. Here, selected means ‘can
be implemented’ and 0 means ‘cannot be implemented’.
Data for the above model are collected from Table 5.31. Five different models are
generated for the other participants: Nahar executives, Nahar supply chain members,
Paharika employees, Paharika executives and Paharika supply chain members. These
models are shown in Appendix 5K. The results of the optimisation model are shown in
Table 5.32. The results are segregated into Nahar employees, executives and supply
chain members. Nahar employees can implement all the strategies if they have a 100%
budget. The farm can mitigate various risks within their operation using different
budgets.
The above linear programming with a budget of 1098.33 is solved using the Solver
module in Microsoft Excel. The following solution is found:
1. Objective function value of 392.67 at 100% budget as been calculated using
Microsoft Excel Solver.

158
2. Decision variables: S1 to S32 = 1 (All strategies could be implemented. The
name of strategies can be found in Table 5.23).
3. Total cost required: 1098.33.
4. 100% risk can be mitigated using a full budget.
The same linear programming model with a budget of 90% (988.50) is solved using the
Solver module in Microsoft Excel. The following solution is found:
1. Objective function value of 382.83 at 90% budget has been calculated using
Microsoft Excel Solver.
2. Decision variables:S1=…= S8=1, S9=0, S10=…= S12=1, S13= 0, S14=1, S15=0,
S16=…=S32=1 (This means all the strategies will be implemented except S9,
S13 and S15.).
3. Total cost required: 983.33.
4. 97.49% (382.83/392.67) risk can be mitigated.
Similarly, the model with a budget of 50% (549.17) is solved using the Solver module
in Microsoft Excel. The following solution is found:
1. Objective function value of 279.72 at 50% budget has been calculated using
Microsoft Excel Solver.
2. Decision variables:S1=S8=S9=S13 = S15 = S20 = S21 = S24 = … = S28 = S30 = 0,
S2=…S7=S10…S12=S14=S16= … =S19=S22=S23=S31=S32=1 (This means all
the strategies will be implemented except S9, S13 and S15.).
3. Total cost required: 546.67.
4. 71.23% (279.72/392.67) risk can be mitigated.
Finally, the model with a budget of 10% (109.83) is solved using the Solver module in
Microsoft Excel. The following solution is found:
1. Objective function value of 82.62 at 10% budget has been calculated using
Microsoft Excel Solver.
2. Decision variables:S6 = S7 = S14 = S19 = 1 could be implemented (28 strategies
cannot be implemented at 10% budget.).
3. Total cost required: 108.33.
4. 21.04% (82.62/392.67) risk can be mitigated.
Likewise, from the results of Nahar executives (see Table 5.32), 29 strategies could be
implemented under 90% of budget 97.27% (484.62/498.24) level of risk mitigation,
where, S1 = … = S8 = 1, S10 = … = S12 = 1, S14 = … S29 = 1, S31= S32 =1 and S9= S13=
S30= 0. Three strategies (S9, S13 and S30) out of 32 strategies cannot be implemented

159
due to a low percentage of the total budget. However, a 70.84% (352.95/498.24) level
of risk mitigation could be achieved with 50% of the total budget and 16 strategies
could be implemented, where, S2 = … S4 = S6 = S7 = S10 = S11=S12 = S14 = S17 = …
S23 = S25 = S27 = S31 = S32 = 1 and S1 = S5 = S8 = S9 = S13= S15 = S16 = S20 = … =
S22 = S24 = S26 = … S30=0. Only 5 strategies could be implemented and a 20.31%
(101.21/498.24) level of risk could be mitigated under 10% budgets.
In the same way, Nahar supply chain members indicated that 90% of budget allows for
mitigating 98.56% (324.85/329.59) of risks, where S1= S2 = S3 = S4 = S5 = S6 = S7 =
S8 = S9 = S10 = S11 = S12 = S13 = S14 = S15=S17= S18 = S19 = S20 = S21 = S22
=S23=S25=S27= S28 = S29 = S30 = S31 = S32=1 and S16= S24 =S26=0. A 50% budget
allows for mitigating 79.49% (114.23/329.59) of risks. In this situation 19 strategies
could be implemented, where S2= S3 = S4 = S5 = S6 = S7 = S8 = S10 = S12 = S13 = S14 =
S17 = S18 = S19 = S22=S23=S28 = S31 = S32 = 1 and S1 = S9 = S11 = S15 =
S16=S20=S21=S24= S25 = S26 =S27=S29=S30=0. In the same way, with 10% of the
budget, only seven strategies could be implemented with the achievement of 34.66%
(114.23/329.59) level of risk mitigation i.e. S5=S6=S12=S14=S17=S19=S31=1 and S1=
S2 = S3 = S4=S7= S8 = S9 = S10 =S11= S12 =S13 = S15 = S16 = S18 = S20= S21 = S22 =
S23 = S24 = S25 = S26 = S27 = S28 = S29 =S30= S32= 0.
The results for the level of risk mitigation for the Paharika farm are now presented.
According to the opinion of the Paharika employees (see Table 5.33), 98.66%
(422.56/428.29) level of risk mitigation could be achieved under 90% of budget, where
S1=…=S23=S25=…=S29 = S31 = S32 = 1 and S24 = S30 = 0. When the budget is reduced
to 50%, 20 strategies could be implemented having 73.12% (313.17/428.29) of risk
mitigation, where S1 = S8 = S9 = S15 = S20 = S21 = S24=S25=S27 = S28 = S29 = S30 = 0
and S2 = S2 = S3 = S4 = S5 = S6 = S7 = S10 = S11 = S12 = S13 =S14=S16= S17 = S18
=S19=S22=S23=S26=S31=S32=1. However, only 21.26% (91.09/428.29)level of
mitigation could be achieved with 10% of the budget with the implementation of only
five strategies where S6 = S10 = S12 = S14 = S31 = 1 and S1 = S2 = S3 = S4 =S5=S7= S8
=S9=S11=S13=S15=… =S30=S32=0.

160
Table 5.32: Optimisation of Risk Mitigation Level without Savings (Nahar Employees)
Optimisation of Risk Mitigation level without Savings (Nahar Executives)
Optimisation of Risk Mitigation level without Savings (Nahar Supply Chain members)
Objective
function
Level of
Risk
Mitigation
cost
constraints
Budgeted
cost1 2 3 4 5 6 7 8 9 10 11 12 13 14 15 16 17 18 19 20 21 22 23 24 25 26 27 28 29 30 31 32
392.67 100.00% 1098.33 <= 1098.33 100% 1 1 1 1 1 1 1 1 1 1 1 1 1 1 1 1 1 1 1 1 1 1 1 1 1 1 1 1 1 1 1 1
382.83 97.49% 983.33 <= 988.50 90% 1 1 1 1 1 1 1 1 0 1 1 1 0 1 0 1 1 1 1 1 1 1 1 1 1 1 1 1 1 1 1 1
365.65 93.12% 878.33 <= 878.67 80% 1 1 1 1 1 1 1 1 0 1 1 1 0 1 0 1 1 0 1 1 1 1 1 1 1 1 0 1 1 0 1 1
343.99 87.60% 768.33 <= 768.83 70% 1 1 1 1 1 1 1 0 0 1 1 1 0 1 0 1 1 1 1 1 1 1 1 0 0 1 0 1 1 0 1 1
312.66 79.62% 655.00 <= 659.00 60% 1 1 1 1 1 1 1 0 0 1 1 1 0 1 0 1 1 1 1 0 0 1 1 0 0 1 0 0 1 0 1 1
279.72 71.23% 546.67 <= 549.17 50% 0 1 1 1 1 1 1 0 0 1 1 1 0 1 0 1 1 1 1 0 0 1 1 0 0 0 0 0 1 0 1 1
241.58 61.52% 438.33 <= 439.33 40% 0 1 1 1 1 1 1 0 0 1 1 1 0 1 0 1 1 0 1 0 0 1 0 0 0 0 0 0 0 0 1 0
196.42 50.02% 326.67 <= 329.50 30% 0 0 1 1 1 1 1 0 0 1 1 1 0 1 0 1 0 0 1 0 0 0 0 0 0 0 0 0 0 0 0 0
143.67 36.59% 218.33 <= 219.67 20% 0 0 0 0 1 1 1 0 0 1 1 0 0 1 0 1 0 0 1 0 0 0 0 0 0 0 0 0 0 0 1 0
82.62 21.04% 108.33 <= 109.83 10% 0 0 0 0 0 1 1 0 0 0 0 0 0 1 0 0 0 0 1 0 0 0 0 0 0 0 0 0 0 0 0 0
Objective
function
Level of Risk
Mitigation
cost
constraints
Budgeted
cost% 1 2 3 4 5 6 7 8 9 10 11 12 13 14 15 16 17 18 19 20 21 22 23 24 25 26 27 28 29 30 31 32
498.24 100.00% 1286.67 <= 1286.67 100% 1 1 1 1 1 1 1 1 1 1 1 1 1 1 1 1 1 1 1 1 1 1 1 1 1 1 1 1 1 1 1 1
484.62 97.27% 1140.00 <= 1158.00 90% 1 1 1 1 1 1 1 1 0 1 1 1 0 1 1 1 1 1 1 1 1 1 1 1 1 1 1 1 1 0 1 1
462.02 92.73% 1026.67 <= 1029.33 80% 1 1 1 1 1 1 1 0 0 1 1 1 0 1 0 1 1 1 1 1 1 1 1 0 1 1 1 1 1 0 1 1
432.78 86.86% 896.67 <= 900.67 70% 1 1 1 1 1 1 1 0 0 1 1 1 0 1 0 0 1 1 1 1 1 1 1 0 1 0 1 0 1 0 1 1
396.05 79.49% 763.33 <= 772.00 60% 0 1 1 1 1 1 1 0 0 1 1 1 0 1 0 0 1 1 1 1 1 1 1 0 1 0 1 0 0 0 1 1
352.95 70.84% 640.00 <= 643.33 50% 0 1 1 1 0 1 1 0 0 1 1 1 0 1 0 0 1 1 1 0 0 0 1 0 1 0 0 0 0 0 1 1
300.73 60.36% 513.33 <= 514.67 40% 0 1 0 1 1 1 0 0 0 1 1 0 0 1 0 0 1 1 1 0 0 0 1 0 1 0 0 0 0 0 1 1
240.38 48.25% 380.00 <= 386.00 30% 0 0 0 0 1 1 1 0 0 1 0 0 0 1 0 0 1 1 1 0 0 0 0 0 1 0 0 0 0 0 1 1
176.43 35.41% 256.67 <= 257.00 20% 0 1 0 0 1 1 1 0 0 1 0 0 0 1 0 0 1 1 0 0 0 0 0 0 0 0 0 0 0 0 1 0
101.21 20.31% 120.00 <= 128.67 10% 0 0 0 0 1 1 0 0 0 1 0 0 0 0 0 0 1 0 0 0 0 0 0 0 0 0 0 0 0 0 1 0
Objective
function
Level of
Risk
Mitigation
cost
constraint
s Budgeted cost 1 2 3 4 5 6 7 8 9 10 11 12 13 14 15 16 17 18 19 20 21 22 23 24 25 26 27 28 29 30 31 32
329.59 100.00% 985 <= 985.00 100% 1 1 1 1 1 1 1 1 1 1 1 1 1 1 1 1 1 1 1 1 1 1 1 1 1 1 1 1 1 1 1 1
324.85 98.56% 875 <= 886.50 90% 1 1 1 1 1 1 1 1 1 1 1 1 1 1 1 0 1 1 1 1 1 1 1 0 1 0 1 1 1 1 1 1
314.26 95.35% 785 <= 788.00 80% 1 1 1 1 1 1 1 1 1 1 1 1 1 1 0 0 1 1 1 0 1 1 1 0 1 0 1 1 1 0 1 1
297.31 90.21% 680 <= 689.50 70% 1 1 1 1 1 1 1 1 0 1 0 1 1 1 0 0 1 1 1 0 0 1 1 0 0 0 1 1 1 0 1 1
280.02 84.96% 590 <= 591.00 60% 1 1 1 1 1 1 1 1 0 1 0 1 1 1 0 0 1 1 1 0 0 1 1 0 0 0 0 1 0 0 1 1
261.99 79.49% 490 <= 492.50 50% 0 1 1 1 1 1 1 1 0 1 0 1 1 1 0 0 1 1 1 0 0 1 1 0 0 0 0 1 0 0 1 1
238.14 72.25% 390 <= 394.00 40% 0 1 1 1 1 1 1 0 0 1 0 1 1 1 0 0 1 0 1 0 0 1 1 0 0 0 0 0 0 0 1 1
209.93 63.69% 290 <= 295.50 30% 0 0 1 0 1 1 1 0 0 1 0 1 0 1 0 0 1 1 1 0 0 1 1 0 0 0 0 0 0 0 1 1
169.13 51.31% 195 <= 197.00 20% 0 0 0 0 1 1 1 0 0 0 0 1 0 1 0 0 1 1 1 0 0 1 0 0 0 0 0 0 0 0 1 1
114.23 34.66% 95 <= 98.50 10% 0 0 0 0 1 1 0 0 0 0 0 1 0 1 0 0 1 0 1 0 0 0 0 0 0 0 0 0 0 0 1 0

161
Paharika executives (Table 5.33) indicate that a 97.82% (366.81/374.98) level of
mitigation could be achieved with a 90% budget. When the budget is lessened to 50%,
73.05% (273.91/374.98) of risks can be mitigated. They selected twenty nine
strategies under 90% budget, whereS1=…= S12= S14= S16= …= S29= S31= S32=1 and
S13= S15= S30= 0. Under 50% of the budget, twenty one strategies could be
implemented where S3=S5=…=S8=S10=…=S12=S14=S16=…=S23=S26=S29= S31=
S32=1 and S1=S2=S4=S9= S13= S15 = S24 = S25 = S27 = S28 = S30 = 0. In case the
budget goes down to 10%, 23% (83.24/374.98) of risks can be mitigated where S1=
…=S5= S7= S13= S15= S17=S18=S20=…=S22=S24=S32=0 and S6=S14=S19=S23=1.
Paharika supply chain members (see Table 5.33) considered that 98.07%
(303.79/309.75) (29 strategies) mitigation level could be achieved with 90% of the
budget, where S22=S24=S26=0 and S1= …= S21= S23= S25= S27=…=S32= 1. Eighteen
strategies could be implemented (77.57%, 240.26/309.75) under a 50% budget, where
S1= S8=…= S11 = S15 = S21 = … = S27 = S30 = 0 and S2 = …=S7=S12=…
=S13=S16=…=S20=S28= S29= S31=S32=1. Using a 10% budget, a 30.76%
(95.28/309.75) mitigation level could be achieved, where S4=S5= S6= S19= S31 = S32
= 1 and S1 = S2 = S3 = S7 = … = S18 = S20 = … = S30 = 0.. Table 5.33 shows the level of
risk mitigation under different budget constraints for respondents from Paharika
Dairy. For instance, changing budget levels will change the level of risk mitigation. All
strategies cannot be implemented under any sort of budget constraints. Only when the
budget is 100% is it possible to implement all strategies.
This section has clarified the formulation of dairy supply chain risk problems through
(0, 1) linear programming (without savings) for both the farms at different levels of
storage, processing and distribution. The outcome of these analyses is that a maximum
budget will solve more and more problems in a farm. Obviously a lack of budget will
create hindrances to implement strategies to mitigate the various risks on a priority
basis. The next section will discuss these results using quadratic integer programming
(with savings) for both the case farms.

162
Table 5.33: Optimisation of Risk Mitigation level without Savings (Paharika Employees)
Optimisation of Risk Mitigation level without Savings (Paharika Executives)
Optimisation of Risk Mitigation level without Savings (Paharika Supply Chain Members)
Objective
Function
Level of Risk
Mitigation
Cost
Constraints
Budgeted
Cost1 2 3 4 5 6 7 8 9 10 11 12 13 14 15 16 17 18 19 20 21 22 23 24 25 26 27 28 29 30 31 32
428.29 100.00% 958.33 <= 958.33 100% 1 1 1 1 1 1 1 1 1 1 1 1 1 1 1 1 1 1 1 1 1 1 1 1 1 1 1 1 1 1 1 1
422.56 98.66% 861.67 <= 862.50 90% 1 1 1 1 1 1 1 1 1 1 1 1 1 1 1 1 1 1 1 1 1 1 1 0 1 1 1 1 1 0 1 1
407.25 95.09% 765.00 <= 766.67 80% 1 1 1 1 1 1 1 1 0 1 1 1 1 1 0 1 1 1 1 0 1 1 1 0 1 1 1 1 1 0 1 1
377.10 88.05% 666.67 <= 670.83 70% 1 1 1 1 1 1 1 0 0 1 1 1 1 1 0 1 1 1 1 0 1 1 1 0 0 1 1 1 0 0 1 1
343.73 80.26% 573.33 <= 575.00 60% 0 1 1 1 1 1 1 1 0 1 1 1 0 1 0 0 1 1 1 0 1 1 1 0 0 1 1 1 0 0 1 1
313.17 73.12% 478.33 <= 479.17 50% 0 1 1 1 1 1 1 0 0 1 1 1 1 1 0 1 1 1 1 0 0 1 1 0 0 1 0 0 0 0 1 1
270.31 63.11% 383.33 <= 383.33 40% 0 1 1 0 1 1 1 0 0 1 1 1 0 1 0 1 1 1 1 0 0 0 0 0 0 1 0 0 0 0 1 1
224.38 52.39% 286.67 <= 287.50 30% 0 0 1 0 1 1 1 0 0 1 0 1 0 1 0 0 1 1 1 0 0 1 0 0 0 0 0 0 0 0 1 1
165.44 38.63% 191.67 <= 191.67 20% 0 0 1 0 1 1 1 0 0 1 0 1 0 1 0 0 0 1 0 0 0 0 0 0 0 0 0 0 0 0 0 0
91.09 21.27% 95.00 <= 95.83 10% 0 0 0 0 0 1 0 0 0 1 0 1 0 1 0 0 0 0 0 0 0 0 0 0 0 0 0 0 0 0 1 0
Objective
Function
Level of Risk
Mitigation
Cost
Constraints
Budgeted
Cost1 2 3 4 5 6 7 8 9 10 11 12 13 14 15 16 17 18 19 20 21 22 23 24 25 26 27 28 29 30 31 32
374.98 100.00% 1006.67 <= 1006.67 100% 1 1 1 1 1 1 1 1 1 1 1 1 1 1 1 1 1 1 1 1 1 1 1 1 1 1 1 1 1 1 1 1
366.81 97.82% 900.00 <= 906.00 90% 1 1 1 1 1 1 1 1 1 1 1 1 0 1 0 1 1 1 1 1 1 1 1 1 1 1 1 1 1 0 1 1
349.97 93.33% 803.33 <= 805.00 80% 1 1 1 1 1 1 1 1 0 1 1 1 0 1 0 1 1 1 1 1 1 1 1 1 0 1 0 1 1 0 1 1
323.25 86.21% 686.67 <= 704.67 70% 1 0 1 1 1 1 1 1 0 1 1 1 0 1 0 1 1 1 1 1 1 1 1 0 0 1 0 1 1 0 1 1
298.36 79.57% 590.00 <= 604.00 60% 1 0 1 0 1 1 1 1 0 1 1 1 0 1 0 1 1 1 1 1 1 1 1 0 0 1 0 0 1 0 1 1
273.91 73.05% 496.67 <= 503.33 50% 0 0 1 0 1 1 1 1 0 1 1 1 0 1 0 1 1 1 1 1 1 1 1 0 0 1 0 0 1 0 1 1
244.69 65.25% 400.00 <= 402.66 40% 0 0 1 0 1 1 1 0 0 1 1 1 0 1 0 1 1 1 1 0 1 1 1 0 0 0 0 0 1 0 0 1
204.00 54.40% 300.00 <= 302.00 30% 0 0 1 0 1 1 1 0 0 1 1 0 0 1 0 1 0 1 1 0 1 0 0 0 0 0 0 0 0 0 0 0
150.40 40.11% 200.00 <= 201.33 20% 0 0 0 0 1 1 1 0 0 1 0 0 0 1 0 1 0 1 1 0 0 0 0 0 0 0 0 0 0 0 0 0
86.24 23.00% 100.00 <= 100.67 10% 0 0 0 0 0 1 0 0 0 0 0 0 0 1 0 1 0 0 1 0 0 0 1 0 0 0 0 0 0 0 0 0
Objective
Function
Level of Risk
Mitigation
Cost
Constraints
Budgeted
cost1 2 3 4 5 6 7 8 9 10 11 12 13 14 15 16 17 18 19 20 21 22 23 24 25 26 27 28 29 30 31 32
309.75 100.00% 1015.00 <= 1015.00 100% 1 1 1 1 1 1 1 1 1 1 1 1 1 1 1 1 1 1 1 1 1 1 1 1 1 1 1 1 1 1 1 1
303.79 98.07% 905.00 <= 913.50 90% 1 1 1 1 1 1 1 1 1 1 1 1 1 1 1 1 1 1 1 1 1 0 1 0 1 0 1 1 1 1 1 1
294.36 95.03% 810.00 <= 812.00 80% 1 1 1 1 1 1 1 1 0 1 0 1 1 1 1 1 1 1 1 1 0 0 1 0 1 1 1 1 1 0 1 1
279.69 90.29% 710.00 <= 710.50 70% 1 1 1 1 1 1 1 0 0 1 0 1 1 1 1 0 1 1 1 1 0 0 1 0 0 0 1 1 1 0 1 1
260.23 84.01% 600.00 <= 609.00 60% 1 1 1 1 1 1 1 0 0 0 0 1 1 1 0 1 1 1 1 1 0 0 0 0 0 0 0 1 1 0 1 1
240.26 77.57% 500.00 <= 507.50 50% 0 1 1 1 1 1 1 0 0 0 0 1 1 1 0 1 1 1 1 1 0 0 0 0 0 0 0 1 1 0 1 1
217.37 70.17% 405.00 <= 406.00 40% 0 1 1 1 1 1 1 0 0 0 0 1 0 1 1 0 1 1 1 1 0 0 0 0 0 0 0 1 0 0 1 1
187.66 60.58% 300.00 <= 304.50 30% 0 0 1 0 1 1 1 0 0 0 0 1 0 1 0 0 1 1 1 0 0 0 0 0 0 0 0 1 0 0 1 1
147.17 47.51% 200.00 <= 203.00 20% 0 0 0 1 1 1 1 0 0 0 0 0 0 1 0 0 1 1 1 0 0 0 0 0 0 0 0 0 0 0 1 1
95.28 30.76% 100.00 <= 101.50 10% 0 0 0 1 1 1 0 0 0 0 0 0 0 0 0 0 0 0 1 0 0 0 0 0 0 0 0 0 0 0 1 1

163
5.5.2.2 Formulation of dairy supply chain risk mitigation problems through (0, 1)
quadratic integer programming (with savings)
Dairy supply chain risk mitigation problems are formulated as a quadratic integer
programming model involving cost savings. The optimisation model for Nahar
employees is formulated using equation mentioned in Step 2 under Section 4.7.2(e).
Here, 1098.33 is used as the 100% budget. This total budget is calculated through
summing up relative costs provided by Nahar employees.
Max f(x)= 26.37 X1 + 20.72 X2 + 32.84 X3 + 19.83 X4 + 9.75 X5 + 28.66 X6 + 17.34 X7 +
8.22X8+ 2.27 X9 + 18.33 X10 + 15.97 X11 + 9.92X12 + 6.47 X13 + 17.48 X14 + 1.10X15 +
7.15X16 + 6.09X17 + 5.25X18 + 19.14X19 + 5.77X20 + 10.27X21 + 8.51X22 + 12.22X23 + 8.78X24
+ 0.91X25 + 6.57X26 + 10.26X27 + 15.28X28 + 8.89X29 + 1.68X30 + 9.85X31 + 11.77X32.
Subject to: 88.33 X1 + 51.67 X2 + 61.67 X3 + 46.67 X4 + 16.67 X5 + 35.00 X6 + 26.67 X7 +
35.00X8+ 48.33 X9 + 28.33 X10 + 28.33 X11 + 23.33 X12 + 41.67 X13 + 20.00 X14 + 25.00 X15
+ 13.33 X16 + 15.00 X17 + 15.00 X18 + 26.67 X19 + 21.67 X20 + 31.67 X21 + 21.67 X22 + 38.33
X23 + 48.33 X24 +.41.67 X25 + 20.00 X26 + 58.33 X27 + 60.00 X28 + 25.00 X29 + 31.67 X30 +
23.33 X31 + 30.00 X32 –38 X1X3 – 40 X1X9 – 47 X1X13≤ 1098.33
[All X’s = (0, 1)].
The above model can be solved using a total budget of 1098.33 (sum of relative costs)
for Nahar employees. Table 5.34 shows the optimisation results with savings using
quadratic integer programming. The result shows that risk mitigation levels increased
based on budget increments. When the budget is 100%, all the strategies could be
implemented with a 100% level of mitigation. When the budget is starts to be reduced,
the level of risk mitigation is also decreased. The reduction of the budget from 90% to
50% decreased the level of risk mitigation from 100% (392.67/392.67) to75.90%
(298.02/392.67). Furthermore, if the budget decreased to 10%, the level of risk
mitigation became 21.04% (82.62/392.67). The result also shows that, all strategies
could be implemented with 90% of the budget, where S1 = … S32 = 1. Twenty
strategies could be implemented with 50% of the budget, where S1 = … =S7=S10= … =
S14 = S16 = … = S19 = S22 = S26 = S31 = S32=1 and S8=S9=S15=S20= S21 = S23 = S24
= S25 = S27 = … = S30=0. Four strategies could be implemented with 10% of the
budget, where S6=S7=S14=S19=1 and S1=…= S5=S8= …= S13= S15=…= S18=
S20=…=S32=0.

164
According to the Nahar executives (see Table 5.34), a 95.92% (477.93/498.24)level of
risk was mitigated with 90% of budget. This budget allows mitigating 29out of 32
strategies. When the budget drops from 90% to 50%, 71.85% (357.98/498.24) of risks
are mitigated. Seventeen strategies could be implemented under 50% budget, where
S1 =… = S6 = S9 = … = S11 = S14 = S17=S18=S19=S21=…S23=S25=S31=S32=1 and
S7=S8=S12=S13=S15=S16=S20=S21=S22=S24=S26=…=S30=0.Again a 10% budget can
manage only 20.31% (101.21/498.24) of risk mitigation. Only five strategies could be
implemented under such a budget, where S1 = … = S4 = S7 = … = S9 = S11 = … =
S16=S18=…=S30=S32=0 and S5=S6=S10=S17=S31=1.
For the Nahar supply chain members, when the budget was reduced to 90%
from100%, the level of risk mitigation remains 100%. The level of risk mitigation
reduced from 100% to 85.69% (282.435/329.593) when the budget reduced to 50%
from 90%. In this situation, 21 strategies could be implemented, where
S1=…=S10=S12=…S14=S17=…=S19=S22=S23=S28=S31=S32=1 and S11=S15=S16 =
S20 = S21 = S24 = … = S27 = S29 = S30 = 0. Another reduction of the budget from 50%
to 10% results in a 34.66% (114.22/329.59) level of risk mitigation with seven
mitigation strategies implemented, where S5=S6=S12=S14=S17=S19=S31=1 and
S1=…=S4=S7=…=S11=S13=S15=S16=S18=S20=….=S30= S32=0.
Paharika employees considered that all strategies could be implemented with a 90%
budget which had a 100% level of risk mitigation (see Table 5.35). In an 80% budget,
the performance level of risk mitigation reduced to 98.66% (422.56/428.29) along
with the implementation of thirty strategies, whereS1=…=S23= S25=…=
S29=S31=S32=1 and S24=S30=0. However, an 81.76% (350.16/428.29) level of risk
mitigation could be achieved with 50% of the total budget but only twenty two
strategies could be implemented. Likewise, with the reduction of budget to 10%, only a
21.27% (91.09/428.29) level of risk mitigation could be achieved along with the
implementation of only five strategies, where S6=S10= S12= S14=S31=1 and S1= …=
S5= S7=…= S9= S11=S13=S15=…= S30= S32=0.

165
Table 5.34: Optimisation of Risk Mitigation level with Savings (Nahar Employees)
Ob
ject
ive
F
un
ctio
n
Lev
el o
f R
isk
M
itig
atio
n
Co
st
Co
nst
rain
ts
Bu
dge
ted
C
ost
1
2
3
4
5
6
7
8
9
10
11
12
13
14
15
16
17
18
19
20
21
22
23
24
25
26
27
28
29
30
31
32
392.67 100.00% 973.33 <= 1098.33 100% 1 1 1 1 1 1 1 1 1 1 1 1 1 1 1 1 1 1 1 1 1 1 1 1 1 1 1 1 1 1 1 1
392.67 100.00% 973.33 <= 988.50 90% 1 1 1 1 1 1 1 1 1 1 1 1 1 1 1 1 1 1 1 1 1 1 1 1 1 1 1 1 1 1 1 1
381.12 97.06% 868.33 <= 878.67 80% 1 1 1 1 1 1 1 1 1 1 1 1 1 1 0 1 1 1 1 1 1 1 1 0 1 1 1 1 1 0 1 1
360.95 91.92% 768.33 <= 768.83 70% 1 1 1 1 1 1 1 1 1 1 1 1 1 1 0 1 1 1 1 1 1 1 1 0 0 1 0 1 1 0 1 1
332.19 84.60% 658.33 <= 659.00 60% 1 1 1 1 1 1 1 0 1 1 1 1 1 1 0 1 1 0 1 1 1 1 1 0 0 1 0 0 1 0 1 1
298.02 75.90% 548.33 <= 549.17 50% 1 1 1 1 1 1 1 0 0 1 1 1 1 1 0 1 1 1 1 0 0 1 0 0 0 1 0 0 0 0 1 1
256.07 65.21% 438.33 <= 439.33 40% 1 1 1 1 1 1 1 0 0 1 1 1 1 1 0 1 1 0 1 0 0 0 0 0 0 0 0 0 0 0 0 0
209.43 53.34% 325.00 <= 329.50 30% 1 0 1 0 1 1 1 0 0 1 1 1 1 1 0 1 0 0 1 0 0 0 0 0 0 0 0 0 0 0 0 0
149.29 38.02% 216.67 <= 219.67 20% 1 0 1 0 0 1 0 0 0 1 0 0 1 1 0 0 0 0 1 0 0 0 0 0 0 0 0 0 0 0 0 0
82.62 21.04% 108.33 <= 109.83 10% 0 0 0 0 0 1 1 0 0 0 0 0 0 1 0 0 0 0 1 0 0 0 0 0 0 0 0 0 0 0 0 0
Optimisation of Risk Mitigation level with Savings (Nahar Executives)
Optimisation of Risk Mitigation level with Savings (Nahar Supply Chain Members)
Objective
function
Level of Risk
Mitigation
cost
constraintsBudget % 1 2 3 4 5 6 7 8 9 10 11 12 13 14 15 16 17 18 19 20 21 22 23 24 25 26 27 28 29 30 31 32
498.24 100.00% 1161.67 <= 1286.67 100% 1 1 1 1 1 1 1 1 1 1 1 1 1 1 1 1 1 1 1 1 1 1 1 1 1 1 1 1 1 1 1 1
477.93 95.92% 1028.33 <= 1158.00 90% 1 1 1 1 1 1 1 0 1 1 1 1 1 1 1 1 1 1 1 1 1 1 1 0 1 1 1 1 1 0 1 1
477.93 95.92% 1028.33 <= 1029.00 80% 1 1 1 1 1 1 1 0 1 1 1 1 1 1 1 1 1 1 1 1 1 1 1 0 1 1 1 1 1 0 1 1
448.68 90.05% 898.33 <= 900.67 70% 1 1 1 1 1 1 1 0 1 1 1 1 1 1 1 0 1 1 1 1 1 1 1 0 1 0 1 0 1 0 1 1
411.88 82.67% 771.67 <= 772.00 60% 1 1 1 1 1 1 1 0 1 1 1 1 1 1 0 0 1 1 1 0 1 1 1 0 1 0 0 0 0 0 1 1
357.98 71.85% 638.67 <= 643.33 50% 1 1 1 1 1 1 0 0 1 1 1 0 0 1 0 0 1 1 1 0 0 0 1 0 1 0 0 0 0 0 1 1
300.13 60.24% 511.67 <= 514.67 40% 1 1 1 0 1 1 1 0 1 1 0 0 1 1 0 0 1 1 1 0 0 0 0 0 0 0 0 0 0 0 1 1
241.83 48.54% 383.33 <= 386.00 30% 0 1 0 0 1 1 0 0 0 1 0 0 0 1 0 0 1 1 1 0 0 0 0 0 1 0 0 0 0 0 1 1
176.43 35.41% 256.67 <= 257.33 20% 0 1 0 0 1 1 1 0 0 1 0 0 0 1 0 0 1 1 0 0 0 0 0 0 0 0 0 0 0 0 1 0
101.21 20.31% 120.00 <= 128.67 10% 0 0 0 0 1 1 0 0 0 1 0 0 0 0 0 0 1 0 0 0 0 0 0 0 0 0 0 0 0 0 1 0
Objective
function
Level of
Risk
Mitigation
cost
constraint
s
Budgeted cost 1 2 3 4 5 6 7 8 9 10 11 12 13 14 15 16 17 18 19 20 21 22 23 24 25 26 27 28 29 30 31 32
329.59 100.00% 860 <= 985 100% 1 1 1 1 1 1 1 1 1 1 1 1 1 1 1 1 1 1 1 1 1 1 1 1 1 1 1 1 1 1 1 1
329.59 100.00% 860 <= 886.5 90% 1 1 1 1 1 1 1 1 1 1 1 1 1 1 1 1 1 1 1 1 1 1 1 1 1 1 1 1 1 1 1 1
326.83 99.16% 765 <= 788 80% 1 1 1 1 1 1 1 1 1 1 1 1 1 1 1 1 1 1 1 1 1 1 1 0 1 0 1 1 1 0 1 1
316.68 96.08% 685 <= 689.5 70% 1 1 1 1 1 1 1 1 1 1 1 1 1 1 0 0 1 0 1 1 1 1 1 0 1 0 1 1 1 0 1 1
301.29 91.41% 585 <= 591 60% 1 1 1 1 1 1 1 1 1 1 0 1 1 1 0 0 1 1 1 0 1 1 1 0 1 0 0 1 1 0 1 1
282.44 85.69% 485 <= 492.5 50% 1 1 1 1 1 1 1 1 1 1 0 1 1 1 0 0 1 1 1 0 0 1 1 0 0 0 0 1 0 0 1 1
258.59 78.46% 385 <= 394 40% 1 1 1 1 1 1 1 0 1 1 0 1 1 1 0 0 1 0 1 0 0 1 1 0 0 0 0 0 0 0 1 1
232.94 70.67% 295 <= 295.5 30% 1 0 1 0 1 1 1 0 1 1 0 1 1 1 0 0 1 1 1 0 0 1 0 0 0 0 0 0 0 0 1 1
180.08 54.64% 195 <= 197 20% 1 0 1 0 1 1 0 0 1 0 0 1 1 1 0 0 1 0 1 0 0 0 0 0 0 0 0 0 0 0 1 1
114.23 34.66% 95 <= 98.5 10% 0 0 0 0 1 1 0 0 0 0 0 1 0 1 0 0 1 0 1 0 0 0 0 0 0 0 0 0 0 0 1 0

166
The result from the Paharika executives (see Table 5.35) found that all the strategies
could be implemented with 90% of the budget and 100% (374.98/374.98) level of risk
mitigation. However, the performance level of risk mitigation was reduced when a 50%
budget is selected. With this budget, twenty one strategies could be implemented with
the achievement of 78.04% (292.64/374.98) level of risk mitigation, where
S1=…=S3=S5=…= S7= S10=…=S14=S16=…=S19=S21=…=S23=S29=S31=S32=1 and
S4=S8=S9=S15=S20=S24= …=S28=S30= 0. Similarly, only five strategies could be
implemented and a 23% (86.24/374.98) level of risk mitigation could be achieved with
10% of the budget, where S6=S14=S16=S19=S23=1 and S1= …= S5= S7=…= S13=
S15=S17= S18=S20=…= S22=S24=…=S32=0.
Paharika supply chain members point out (see Table 5.35) that a 90% budget could
achieve a 100% level of risk mitigation. However, with a 50% of budget would have an
84.37% (261.35/309.75) level of risk mitigation and nineteen strategies could be
implemented, where S1= …=S7=S12=S13=S14=S17=…=S20=S25=S28=
S29=S31=S32=1 and S8=…=S11=S15=S16= S21=… =S24=S26= S27= S30=0. Likewise,
only six strategies could be implemented along with the achievement of 30.76%
(95.29/309.75) level of risk mitigation by 10% of the total budget, where S1=…= S4=
S7=…= S17= S20=…=S30=0 and S5=S6=S18= S19=S31=S32=1. Again the score of 0 and
1 represents ‘could not implement’ and ‘could be implement’ respectively.
These results are summarised and compared in graphical form presenting risk
mitigation levels with and without savings at different budget level for both case farms.
Figure 5.2 compares with and without savings for risk mitigation level of Nahar
employees. The X-axis denotes the budget level and the Y-axis denotes the level of risk
mitigation. The graph shows that the maximum level of risk mitigation could be
achieved under the highest budgets. With the increments of the budget, the level of risk
mitigation is also increased. For example, when savings are not considered, with the
increment of the budget from 20% to 30% the change of risk mitigation level is 13.43%
(50.02–36.59), while the increase caused by the budget changes from 219.67 to 329.50.
Likewise, when savings are considered, the change in achieved level of risk mitigation
is 15.32% (53.34–38.02), with the increase of budget from 20% to 30% which changes
from 219.67 to 329.50. In this way, both the models (with savings and without savings)
are compared with each other.

167
Table 5.35: Optimisation of Risk Mitigation level with Savings (Paharika Employees)
Optimisation of Risk Mitigation level with Savings (Paharika Executives)
Optimisation of Risk Mitigation level with Savings (Paharika SC Members)
Objective
function
Level of Risk
Mitigationcost
constraints
Budgeted
Cost 1 2 3 4 5 6 7 8 9 10 11 12 13 14 15 16 17 18 19 20 21 22 23 24 25 26 27 28 29 30 31 32
428.29 100.00% 851.33 <= 958.33 100% 1 1 1 1 1 1 1 1 1 1 1 1 1 1 1 1 1 1 1 1 1 1 1 1 1 1 1 1 1 1 1 1
428.29 100.00% 851.33 <= 862.50 90% 1 1 1 1 1 1 1 1 1 1 1 1 1 1 1 1 1 1 1 1 1 1 1 1 1 1 1 1 1 1 1 1
422.56 98.66% 754.67 <= 766.67 80% 1 1 1 1 1 1 1 1 1 1 1 1 1 1 1 1 1 1 1 1 1 1 1 0 1 1 1 1 1 0 1 1
407.25 95.09% 658.00 <= 670.83 70% 1 1 1 1 1 1 1 1 0 1 1 1 1 1 0 1 1 1 1 0 1 1 1 0 1 1 1 1 1 0 1 1
379.09 88.51% 574.67 <= 575.00 60% 1 1 1 1 1 1 1 1 0 1 1 1 1 1 0 1 1 1 1 0 0 1 1 0 0 1 1 1 0 0 1 1
350.16 81.76% 478.00 <= 479.17 50% 1 1 1 1 1 1 1 0 0 1 1 1 1 1 0 1 1 1 1 0 1 1 1 0 0 1 0 0 0 0 1 1
307.19 71.73% 383.00 <= 383.33 40% 1 1 1 0 1 1 1 0 0 1 1 1 1 1 0 0 1 0 1 0 0 1 1 0 0 0 0 0 0 0 1 1
250.30 58.44% 286.33 <= 287.50 30% 1 1 1 0 1 1 1 0 0 1 1 1 1 1 0 0 0 0 0 0 0 0 0 0 0 0 0 0 0 0 0 1
177.36 41.41% 188.00 <= 191.67 20% 1 1 1 0 0 1 1 0 0 0 0 0 1 1 0 0 0 0 0 0 0 0 0 0 0 0 0 0 0 0 0 0
91.09 21.27% 95.00 <= 95.83 10% 0 0 0 0 0 1 0 0 0 1 0 1 0 1 0 0 0 0 0 0 0 0 0 0 0 0 0 0 0 0 1 0
Objective
Function
Level of Risk
Mitigation
Cost
Constraints
Budgeted
Cost1 2 3 4 5 6 7 8 9 10 11 12 13 14 15 16 17 18 19 20 21 22 23 24 25 26 27 28 29 30 31 32
374.98 100.00% 899.67 <= 1006.67 100% 1 1 1 1 1 1 1 1 1 1 1 1 1 1 1 1 1 1 1 1 1 1 1 1 1 1 1 1 1 1 1 1
374.98 100.00% 899.67 <= 906.00 90% 1 1 1 1 1 1 1 1 1 1 1 1 1 1 1 1 1 1 1 1 1 1 1 1 1 1 1 1 1 1 1 1
365.11 97.37% 799.67 <= 805.00 80% 1 1 1 1 1 1 1 1 0 1 1 1 1 1 0 1 1 1 1 1 1 1 1 1 1 1 1 1 1 0 1 1
345.79 92.22% 703.00 <= 704.67 70% 1 1 1 1 1 1 1 1 0 1 1 1 1 1 0 1 1 1 1 1 1 1 1 0 1 1 0 1 1 0 1 1
320.48 85.46% 599.67 <= 604.00 60% 1 1 1 0 1 1 1 1 0 1 1 1 1 1 0 1 1 1 1 1 1 0 1 0 0 1 0 1 1 0 1 1
292.64 78.04% 503.00 <= 503.33 50% 1 1 1 0 1 1 1 0 0 1 1 1 1 1 0 1 1 1 1 0 1 1 1 0 0 0 0 0 1 0 1 1
254.01 67.74% 396.33 <= 402.66 40% 1 1 1 0 1 1 1 0 0 1 1 0 1 1 0 1 0 1 1 0 1 0 1 0 0 0 0 0 0 0 0 0
204.02 54.41% 301.33 <= 302.00 30% 1 0 1 0 1 1 0 0 0 1 1 0 1 1 0 1 0 1 1 0 0 0 1 0 0 0 0 0 0 0 0 0
143.25 38.20% 200.00 <= 201.33 20% 0 0 0 0 1 0 1 0 0 1 1 0 0 1 0 1 0 1 1 0 0 0 1 0 0 0 0 0 0 0 0 0
86.24 23.00% 100.00 <= 100.67 10% 0 0 0 0 0 1 0 0 0 0 0 0 0 1 0 1 0 0 1 0 0 0 1 0 0 0 0 0 0 0 0 0
Objective
Function
Level of Risk
Mitigation
Cost
Constraints
Budgeted
Cost1 2 3 4 5 6 7 8 9 10 11 12 13 14 15 16 17 18 19 20 21 22 23 24 25 26 27 28 29 30 31 32
309.75 100.00% 908.00 <= 1015.00 100% 1 1 1 1 1 1 1 1 1 1 1 1 1 1 1 1 1 1 1 1 1 1 1 1 1 1 1 1 1 1 1 1
309.75 100.00% 908.00 <= 913.50 90% 1 1 1 1 1 1 1 1 1 1 1 1 1 1 1 1 1 1 1 1 1 1 1 1 1 1 1 1 1 1 1 1
304.68 98.36% 793.00 <= 812.00 80% 1 1 1 1 1 1 1 1 1 1 0 1 1 1 1 1 1 1 1 1 1 1 1 0 1 0 1 1 1 0 1 1
295.10 95.27% 708.00 <= 710.50 70% 1 1 1 1 1 1 1 1 0 1 0 1 1 1 0 1 1 1 1 1 0 1 1 0 1 0 1 1 1 0 1 1
281.23 90.79% 608.00 <= 609.00 60% 1 1 1 1 1 1 1 0 0 1 0 1 1 1 0 1 1 1 1 1 0 0 1 0 0 0 1 1 1 0 1 1
261.35 84.37% 503.00 <= 507.50 50% 1 1 1 1 1 1 1 0 0 0 0 1 1 1 0 0 1 1 1 1 0 0 0 0 1 0 0 1 1 0 1 1
236.15 76.24% 403.00 <= 406.00 40% 1 1 1 1 1 1 1 0 0 0 0 0 1 1 0 0 1 1 1 1 0 0 0 0 0 0 0 1 0 0 1 1
200.24 64.64% 303.00 <= 304.50 30% 1 1 1 0 1 1 1 0 0 0 0 1 1 1 0 0 0 1 1 0 0 0 0 0 0 0 0 0 0 0 1 1
147.17 47.51% 200.00 <= 203.00 20% 0 0 0 1 1 1 1 0 0 0 0 0 0 1 0 0 1 1 1 0 0 0 0 0 0 0 0 0 0 0 1 1
95.29 30.76% 100.00 <= 101.50 10% 0 0 0 0 1 1 0 0 0 0 0 0 0 0 0 0 0 1 1 0 0 0 0 0 0 0 0 0 0 0 1 1

168
Figure 5.2: Comparison of Risk Mitigation Level between With Saving and
Without Savings (Nahar Employees)
Figure 5.3 compares risk mitigation levels under different budgets (with saving and
without savings) for Nahar Executives. The X-axis denotes budget level and the Y-axis
the level of risk mitigation. The level of the risk mitigation curve is almost same from
10% to 50% of the budget. At 60% of the budget with savings considered, the level of
risk mitigation is 70.43%. With the same budget if savings are not considered, the level
of risk mitigation is 71.85%.
The results differ for the Nahar supply chain members. Figure 5.4 shows that when the
budget moves from 20% to 30% without considering savings the change of risk
mitigation level is 16.65% (51.31–34.66). At the same time, the budget changed from
197 to 295.50. For the same budget changes when savings are considered, the change
in risk mitigation level is 19.98% (54.64–34.66) with the increase of budget from 197
to 295.50. Similar comparisons of the models with savings and without savings for
other groups (employees, executives and supply chain members) for the Paharika farm
are shown in Appendices 5L, 5M and 5N.
0%
20%
40%
60%
80%
100%
120%
0% 20% 40% 60% 80% 100% 120%
Leve
l of
Ris
k M
itig
atio
n
Budget
without savings
with savings

169
Figure 5.3: Comparison of Risk Mitigation Level between With Saving and
Without Savings (Nahar Executives)
Figure 5.4: Comparison of Risk Mitigation Level between With Saving and
Without Savings (Nahar Supply Chain Members)
5.6 QFD ANALYSIS: PHASE 2
As mentioned in Section 4.6.1 (The QFD process), Phase 2 of QFD analysis consists of
three steps. Necessary data (optimised strategies) related to the row matrix (WHATs)
are collected from Phase1 of the QFD analysis (see Tables 5.34 and 5.35). Sustainable
outcomes scores are collected through qualitative interview (see Table 5.20) for using
them as column matrix (HOWs). Then the matrices for Step 2 (relationship between
strategy and outcome) are formed using survey data. The matrices for Step 3 (degree of
importance) are formed from Phase 1 of the QFD analysis (RI values of mitigation
0%
20%
40%
60%
80%
100%
120%
0% 20% 40% 60% 80% 100% 120%
Leve
l of
Ris
k M
itig
atio
n
Budget
Without Savings
With Savings
0%
20%
40%
60%
80%
100%
0% 20% 40% 60% 80% 100% 120%
Leve
l of
Ris
k M
itig
atio
n
Budget
Without Savings
With Savings

170
strategies). The RI values of optimised mitigation strategies are used as DI (Degree of
Importance) value for Phase 2 of the QFD analysis.
5.6.1 Identifying optimised mitigation strategies and sustainable outcomes
In the first step of this phase of QFD analysis, the row matrix (WHATs) and the column
matrix (HOWs) is developed. As mentioned previously in section 4.5.1 (The QFD
Process) optimised strategies from phase 1 are considered as row (WHATs) and
sustainable outcomes which were obtained from qualitative interview (shown in table
5.11) is considered as column (HOWs). For the Nahar Dairy, 26 optimum strategies
(see Table 5.36a) are taken as WHATs, whereas the remaining six strategies (S8, S16,
S24, S26, S28 and S30) are not optimised. At the same time, Table 5.36b shows the
categorised optimum mitigation strategies for Nahar. These strategies could not be
implemented with less than 80% budget (see Table 5.34 Optimisation of risk
mitigation level with savings for Nahar Executives).
Similarly, twenty seven strategies were finalised for Paharika Dairy as WHATs (see
Table 5.35). The remaining five strategies (S9, S15, S24, S27, and S30) are not
considered as optimised strategies as they could not be implemented with less than an
80% budget. The column matrix (HOWs) for both dairies was developed by taking 15
sustainable outcomes obtained from the qualitative interviews (described in Section
5.3.5.1).
Fifteen sustainable outcomes are selected with a single notation in Table 5.37a. And
Table 5.37b shows categorised sustainable outcomes for both the industry. Here, SO1
to SO7 are economic sustainable outcomes, SO8 to SO12 are social outcomes and SO13
to SO15 are environmental outcomes.

171
Table 5.36a: List of Optimised Mitigation Strategies for Nahar (WHATs)
S1 = Adoption of improved technology (Milking machine, feed mixture, grass cutting, improved processing facilities)
S15 = Attempts to create various cross breeds by adopting AI services.
S2 = Buying insurance against production loss.
S17 = Strengthen the regular supply of vaccine
S3 = Hiring skilled staff S18 = Initiative to reduce the cost of feed
S4 = Motivational and incentives facilities for staff
S19 = Support to develop technology
S5 = Initiative to remove political uncertainty
S20 = Focus on certified feed supplier to get quality feed.
S6 = Implementation of a fixed policy for dairy sector
S21 = Arrangement of adequate grassland for producing Napier grass
S7 = Assurance of adequate institutional credit support with low rate of interest
S22 = Arrangement of regular vaccination for the cattle
S9 = Focus on value addition S23 = Arrangement of improved and upgraded veterinary services
S10 = Promote sound business practices by cooperation, better coordination and information sharing
S25 = Building monitoring team
S11 = Reduction of risks through merger, acquisition and integration.
S27 = Arrangement of adequate number of transport
S12 = Arrangement of proper training to the staff regarding temperature control
S29 = Development of roads and highway
S13 = Adoption of alternative supply of power for cold storage (powerful generator)
S31 = Removal of unnecessary influence of middlemen
S14 = Arrangement of proper training to the staff regarding processing and hygiene management
S32 = Direct marketing

172
Table 5.36b: Categorised Optimum Mitigation Strategies for Nahar (WHATs)
Common strategies at every level Strategies for the processing level
S1 = Adoption of improved technology (milking machine, feed mixture, grass cutting,
S14 = Arrangement of proper training to the staff regarding processing and hygiene management
improved processing facilities) S15 = Attempts to create various cross
S2 = Buying insurance against breeds by adopting AI services.
production loss S17 = Strengthen the regular supply of
S3 = Hiring skilled staff vaccine
S4 = Motivational and incentives facilities for staff
S18 = Initiative to reduce the cost of feed
S5 = Initiative to remove political uncertainty
S19 S20
==
Support to develop technology Focus on certified feed supplier
S6 = Implementation of a fixed to get quality feed
policy for dairy sector S21 = Arrangement of adequate
S7 = Assurance of adequate grassland for producing Napier
institutional credit support with low rate of interest
S22
=
grass Arrangement of regular
S9 = Focus on value addition vaccination for the cattle
S10 = Promote sound business S23 = Arrangement of improved and
practices by cooperation, better coordination and information
upgraded veterinary services
sharing Strategies for the distribution level
S11 = Reduction of risks through merger, acquisition and
S25 S27
==
Building monitoring team Arrangement of adequate
integration number of transport
Strategies for the storage level S29 = Development of roads and
S12 = Arrangement of proper training highway
to the staff regarding temperature control
S31 = Removal of unnecessary influence of middlemen
S13 = Adoption of alternative supply of power for cold storage
S32 = Direct marketing
(powerful generator)
Table 5.37a: Probable Sustainable Outcomes
SO1= Profit maximisation SO8= Goodwill enhancement
SO2= Cost minimisation
SO9= Supply of quality food
SO3= Increase in personal income SO10= Nutritional development
SO4= Increase in production SO11= Improvement of living standard
SO5= Product quality improvement SO12= Creation of employment opportunity
SO6= Expansion of farming system SO13= Creation of sound working environment
SO7= Production of value added product and diversified product
SO14= Waste management
SO15= Supply of quality food

173
Table 5.37b: Categorised Probable Sustainable Outcomes
Economic Social
SO1 = Profit maximisation SO8 = Goodwill enhancement
SO2 = Cost minimisation SO9 = Supply of quality food
SO3 = Increase in personal income SO10 = Nutritional development
SO4 = Increase in production SO11 = Improvement of living standard
SO5 = Product quality improvement SO12 = Creation of employment opportunity
SO6 = Expansion of farming system Environmental
SO7 = Production of value added product and diversified product
SO13 = Creation of sound working environment
SO14 = Waste management
SO15 = Supply of quality food
5.6.2 Identifying the relationship between mitigation strategies and sustainable
outcomes
In the second step of Phase 2 of the QFD analysis, the relationship matrix is developed
using the relationship data collected through the questionnaire survey. The optimised
mitigation strategies and sustainable outcomes are finalised from Phase 1 of the QFD
analysis and qualitative interview respectively. These were presented in the
questionnaire for rating the relationship between strategy and outcomes. This four
point rating scale is designed as (0–1–5-9) to indicate the degree of relationship. The
four different rating points denote no realisation (0), little realisation (1), moderate
realisation (5) and strong realisation. The data were collected from six executives of
both farms. Executives only can provide accurate ideas about the farm’s outcomes from
strategic implementations. After averaging the collected score (for three executives
from each farm), the results are placed as a relationship matrix for QFD analysis. The
QFD analysis (Phase 2) for Nahar farm is shown in Table 5.38and for Paharika farm in
Table 5.39.
5.6.3 Relative Importance (RI): Phase 2
The third step of the second phase of QFD analysis deals with the identification of the
relative importance (RI) of sustainable outcomes. The relative importance (RI) of each
sustainable outcome can be derived by transforming the absolute importance ratings
(AI) into relative importance (RI) ratings. Absolute Importance (AI) rating can be
calculated using the formula shown in Step V of Section 4.7(d). The RI values of
optimised strategies from QFD analysis (Phase 1) are considered as DI (see Appendix

174
5F for Nahar).Then RI values are calculated through normalising the AI values. The
higher RI value represents the most important design attribute (Park and Kim 1998).
In this research, the higher RI value represents the better realisable sustainable
outcome.
For Nahar, ‘Cost minimisation’ (SO2) is the best realisable outcome with the highest RI
value 0.12 (shown in Table 5.38). The second most achievable outcome is ‘Profit
maximisation’ (SO1) with an RI value of 0.11. The third most important realisable
outcome is ‘Increase in production’ (SO4) with an RI value 0.10.By contrast, the least
achievable outcome with the lowest RI value of 0.02 is ‘Improvement of living
standard’ (SO11).
For Paharika Dairy, the most realisable sustainable outcome is ‘Increase in production’
(SO4) with the highest RI value of 0.15 (see Table 5.39). Two other important
realisable outcomes are ‘Cost minimisation’ (SO2) and ‘Profit maximisation’ (SO1) with
the RI values of 0.14 and 0.11 respectively. The least realisable outcome is
‘Improvement of living standard’ (SO11) with an RI value of 0.02.

175
Table 5.38: QFD Analysis Phase 2 (Nahar)
SO1 SO2 SO3 SO4 SO5 SO6 SO7 SO8 SO9 SO10 SO11 SO12 SO13 SO14 SO15
Stra
tegy
No.
Degree of Importance
Prof
it m
axim
isat
ion
Cost
min
imis
atio
n
Incr
ease
in in
com
e
Incr
ease
in p
rodu
ctio
n
Prod
uct q
ualit
y im
prov
emen
t
Expa
nsio
n of
farm
ing
syst
em
Prod
uctio
n of
val
ue a
dded
pro
duct
and
dive
rsifi
ed p
rodu
ct
Good
will
enh
ance
men
t
Supp
ly o
f qua
lity
food
Nut
ritio
nal d
evel
opm
ent
Impr
ovem
ent o
f liv
ing
stan
dard
Crea
tion
of e
mpl
oym
ent o
ppor
tuni
ty
Crea
tion
of s
ound
wor
king
envi
ronm
ent
Was
te m
anag
emen
t
Hea
lth im
prov
emen
t of
cattl
e(An
imal
Qua
lity)
S1
Adoption of improved technology (Milking machine, feed
mixture, grass cutting, improved processing facilities) 0.05 6.33 5.00 1.67 6.33 3.33 0.00 3.67 3.67 2.00 0.33 0.00 0.33 3.33 0.33 0.00
S2 Buying insurance against production loss. 0.04 1.67 5.00 0.00 0.00 0.00 0.00 0.00 0.00 0.00 0.00 0.00 0.00 0.00 0.00 0.00
S3 Hiring skilled staff 0.06 5.00 3.67 3.33 3.67 0.67 3.67 2.33 2.33 2.00 3.33 1.67 0.33 3.33 0.00 3.67
S4 Motivational and incentives facilities for staff 0.05 0.00 0.33 3.33 0.00 0.33 0.00 0.00 5.00 0.00 0.00 5.00 3.33 3.67 0.00 0.00
S5 Initiative to remove political uncertainty 0.02 5.00 5.00 3.33 0.00 0.00 0.00 0.00 0.00 4.67 2.00 0.33 0.00 0.00 0.00 0.00
S6 Implementation of a fixed policy for dairy sector 0.08 7.67 7.67 1.67 3.33 3.33 2.00 0.00 0.00 0.33 0.33 0.33 1.67 5.00 0.33 2.33
S7
Assurance of adequate institutional credit support
with low rate of interest. 0.04 0.00 4.67 0.00 3.67 0.33 7.67 5.00 0.00 3.33 3.33 0.33 0.00 0.00 3.33 6.33
S9 Focus on value addition 0.01 6.33 2.00 0.00 3.33 2.33 2.00 7.67 3.67 0.67 2.00 0.00 5.00 0.00 2.00 0.00
S10
Promote sound business practices by cooperation,
better coordination and information sharing 0.04 3.33 5.00 0.00 4.67 3.67 2.33 5.00 0.33 0.33 3.67 0.00 1.67 2.00 2.33 0.67
S11 Reduction of risks through merger, acquisition and integration. 0.04 5.00 5.00 0.00 6.33 2.33 6.33 6.33 5.00 2.33 3.67 0.00 0.67 3.67 0.67 5.00
S12
Arrangement of proper training to the staff regarding
temperature control 0.02 1.67 0.33 0.00 0.00 6.33 0.00 0.00 2.33 3.67 2.33 0.00 0.00 0.00 0.00 0.00
S13
Adoption of alternative supply of power for cold
storage (powerful generator) 0.02 0.33 0.00 0.00 0.00 6.33 0.00 1.67 1.67 1.67 2.00 0.00 0.00 0.00 0.00 0.00
S14
Arrangement of proper training to the staff regarding
processing and hygiene management 0.04 2.33 0.33 0.00 5.00 6.33 0.33 0.00 2.33 3.67 5.00 0.00 0.00 0.33 2.33 5.00
S15 Attempts to create various cross breeds by adopting AI services. 0.01 5.00 0.00 0.00 6.33 0.00 0.00 0.00 0.67 0.00 0.00 0.00 0.00 0.00 0.00 6.33
S17 Strengthen the regular supply of vaccine 0.03 0.00 0.00 0.00 3.67 0.33 0.00 0.00 3.33 0.00 2.00 0.00 0.00 0.00 0.00 4.67
S18 Initiative to reduce the cost of feed 0.03 3.33 7.67 0.00 0.00 0.33 0.00 0.00 0.00 0.00 0.00 0.00 0.00 0.00 0.00 3.33
S19 Support to develop technology 0.07 1.67 0.33 0.00 3.67 5.00 0.00 0.00 3.67 3.33 5.00 0.00 0.33 1.67 1.67 5.00
S20 Focus on certified feed supplier to get quality feed. 0.01 0.00 5.00 0.00 3.67 0.33 0.00 0.00 0.00 2.00 1.67 0.00 0.00 0.00 0.00 7.67
S21 Arrangement of adequate grassland for producing Napier grass 0.01 1.67 4.67 0.00 6.33 0.00 0.00 0.00 0.00 1.67 4.67 0.00 0.00 0.00 0.00 5.00
S22 Arrangement of regular vaccination for the cattle 0.02 0.00 0.00 0.00 3.67 0.00 0.00 0.00 1.67 0.00 0.00 0.00 0.00 0.00 0.00 9.00
S23 Arrangement of improved and upgraded veterinary services 0.02 0.00 0.00 0.00 6.33 1.67 0.00 0.00 1.67 0.00 0.00 0.00 0.00 0.00 0.00 6.33
S25 Building monitoring team 0.05 5.00 3.67 2.33 2.00 4.67 0.00 0.00 3.67 5.00 3.67 0.00 3.33 2.33 0.33 0.33
S27 Arrangement of adequate number of transport 0.03 0.00 0.00 0.00 0.00 0.00 0.00 0.00 1.67 5.00 0.67 0.00 3.33 0.00 0.00 0.00
S29 Development of roads and highway 0.02 0.00 6.33 0.00 0.00 0.00 0.00 0.00 0.00 6.33 2.33 0.00 0.00 0.00 0.00 0.00
S31 Removal of unnecessary influence of middlemen 0.04 5.00 6.33 3.33 0.00 4.67 0.00 0.33 4.67 3.67 1.67 0.33 0.00 0.00 0.00 0.00
S32 Direct marketing 0.05 6.33 5.00 2.00 1.67 1.67 0.00 0.00 2.00 5.00 5.00 0.33 3.33 0.00 0.00 0.00
2.92 3.15 0.99 2.55 2.20 1.05 1.07 1.96 2.07 2.07 0.43 0.93 1.42 0.54 2.18 25.52
0.11 0.12 0.04 0.1 0.09 0.04 0.042 0.08 0.08 0.08 0.02 0.04 0.056 0.02 0.085 1
AI
RI
Outcomes No.
Sustainable Outcomes
Mitigation Strategies

176
Table 5.39: QFD Analysis Phase 2 (Paharika)
SO1 SO2 SO3 SO4 SO5 SO6 SO7 SO8 SO9 SO10 SO11 SO12 SO13 SO14 SO15Outcomes NO.
Stra
tegy
No.
Degree of Importance
Prof
it m
axim
isat
ion
Cost
min
imis
atio
n
Incr
ease
in in
com
e
Incr
ease
in p
rodu
ctio
n
Prod
uct q
ualit
y im
prov
emen
t
Expa
nsio
n of
farm
ing
syst
em
Prod
uctio
n of
val
ue a
dded
pro
duct
and
dive
rsifi
ed p
rodu
ct
Good
will
enh
ance
men
t
Supp
ly o
f qua
lity
food
Nut
ritio
nal d
evel
opm
ent
Impr
ovem
ent o
f liv
ing
stan
dard
Crea
tion
of e
mpl
oym
ent o
ppor
tuni
ty
Crea
tion
of s
ound
wor
king
env
iron
men
t
Was
te m
anag
emen
t
Hea
lth im
prov
emen
t of c
attle
(Ani
mal
Qua
lity)
S1Adoption of improved technology (Milking machine, feed mixture, grass
cutting, improved processing facilities) 0.07 9.00 3.67 0.00 7.67 0.33 2.00 3.33 3.67 2.00 0.33 0.00 0.00 2.00 1.67 0.00
S2 Buying insurance against production loss. 0.04 0.00 9.00 0.00 0.00 0.00 0.00 0.00 0.00 0.00 0.00 0.00 0.00 0.00 0.00 0.00
S3 Hiring skilled staff 0.08 6.33 2.00 2.00 7.67 3.33 0.67 2.00 0.67 2.00 3.33 0.00 1.67 0.00 3.33 4.67
S4 Motivational and incentives facilities for staff 0.04 2.00 1.67 2.00 2.00 0.00 0.33 0.00 3.67 0.33 0.33 2.33 0.00 0.33 0.00 0.00
S5 Initiative to remove political uncertainty 0.05 5.00 5.00 0.33 1.67 0.00 0.00 0.00 0.00 3.67 1.67 0.00 0.00 0.33 0.00 0.00
S6 Implementation of a fixed policy for dairy sector 0.08 6.33 9.00 1.67 1.67 6.33 2.00 0.00 0.67 7.67 5.00 2.00 2.00 0.67 0.00 5.00
S7Assurance of adequate institutional credit support with low rate of
interest. 0.07 0.00 0.00 0.00 9.00 0.33 7.67 1.67 0.00 0.00 0.00 1.67 1.67 0.00 0.00 0.00
S8 Introducing off-farm activities 0.03 1.67 0.00 3.33 0.00 0.00 5.00 5.00 0.00 0.00 0.00 0.00 9.00 0.00 0.00 0.00
S10Promote sound business practices by cooperation, better coordination
and information sharing 0.04 3.67 6.33 0.67 5.00 1.67 3.33 2.00 0.67 0.00 0.33 0.00 2.00 2.33 0.00 0.00
S11 Reduction of risks through merger, acquisition and integration. 0.04 3.33 7.67 2.00 6.33 2.00 2.00 3.33 0.33 0.33 0.67 0.33 2.33 0.67 1.67 0.00
S12 Arrangement of proper training to the staff regarding temperature control0.02 2.00 6.33 0.33 2.00 6.33 0.00 0.00 0.33 3.67 6.33 0.00 0.00 0.00 0.00 0.00
S13Adoption of alternative supply of power for cold storage ( powerful
generator) 0.01 0.67 4.67 0.00 6.00 5.00 0.00 0.00 1.67 2.33 0.33 0.00 0.00 0.00 0.00 0.00
S14Arrangement of proper training to the staff regarding processing and
hygiene management 0.04 1.67 3.00 0.00 4.67 7.67 0.00 1.67 5.00 6.33 6.33 0.33 0.00 3.67 3.67 1.67
S16 Lease abandoned land to the farmers for dairy farming 0.04 1.67 0.00 0.33 6.33 0.00 9.00 0.00 0.00 0.00 0.00 0.00 6.33 0.00 0.00 0.00
S17 Strengthen the regular supply of vaccine 0.02 2.00 0.00 0.00 6.33 1.67 0.00 0.00 0.00 2.00 3.67 0.00 0.00 0.00 0.00 9.00
S18 Initiative to reduce the cost of feed 0.03 2.00 9.00 0.33 1.67 0.00 0.00 0.00 0.00 0.00 0.00 0.00 0.00 0.00 0.00 3.33
S19 Support to develop technology 0.05 5.00 1.67 1.67 7.67 2.33 4.67 3.33 2.33 2.00 2.00 0.00 0.00 1.67 4.67 1.67
S20 Focus on certified feed supplier to get quality feed. 0.02 0.00 0.33 0.00 9.00 1.67 0.00 0.00 0.00 0.00 0.33 0.00 0.00 0.00 0.00 6.33
S21 Arrangement of adequate grassland for producing Napier grass 0.03 2.00 9.00 0.67 6.00 2.00 0.00 0.00 0.00 0.00 0.00 0.00 0.33 0.00 0.00 5.00
S22 Arrangement of regular vaccination for the cattle 0.01 0.00 0.00 0.00 5.00 3.33 0.00 0.33 1.67 1.67 0.33 0.33 0.00 0.00 0.00 9.00
S23 Arrangement of improved and upgraded veterinary services 0.02 0.00 0.00 0.00 1.67 1.67 0.00 0.00 0.00 0.00 1.67 0.00 0.00 0.00 0.00 9.00
S25 Building monitoring team 0.01 3.67 5.00 5.00 2.00 7.67 0.00 0.00 5.00 2.00 5.00 1.00 5.00 0.33 0.33 0.00
S26 Initiative to develop roads and highways 0.01 0.00 1.67 0.00 0.00 0.00 0.00 0.00 0.00 5.00 0.33 0.00 0.00 0.00 0.00 0.00
S28 Arrangement of refrigerated transport facilities 0.03 0.00 3.33 0.00 0.00 9.00 0.00 0.00 1.67 7.67 6.33 0.00 2.00 0.00 0.00 0.00
S29 Development of roads and highway 0.02 0.00 6.33 0.00 0.00 0.00 0.00 0.00 0.00 3.67 3.67 0.33 0.00 0.00 0.00 0.00
S31 Removal of unnecessary influence of middlemen 0.02 6.33 7.67 3.67 0.00 5.00 0.00 0.00 3.33 7.67 6.33 2.00 2.33 0.00 0.00 0.00
S32 Direct marketing 0.02 6.33 6.33 5.00 0.00 5.00 0.00 0.00 0.33 5.00 5.00 0.67 6.33 0.00 0.00 0.00
3.10 3.76 0.95 4.00 2.26 1.79 1.10 1.08 2.17 1.92 0.44 1.37 0.58 0.83 1.79 27.15
0.11 0.14 0.03 0.15 0.08 0.07 0.04 0.04 0.08 0.07 0.02 0.05 0.02 0.03 0.07 1
AI
RI
Sustainable Outcomes
Mitigation Strategies

177
5.7 SUMMARY
This chapter has provided the numerical results to optimise the dairy supply chain risk
mitigation problem. The results were obtained by following the Quality Function
Deployment (QFD) technique based on two dairy case industries. The dairy supply
chain risk mitigation problem was optimised for three different groups from both case
industries through two types of mathematical programs. The problem was formulated
by a linear equation model without consideration of cost savings. When cost savings
were considered, the problem was formulated through quadratic integer programming.
Importantly, all the necessary values, information and data flows were incorporated
with the relevant variables to make the QFD model workable. The result of the analysis
of the data and optimisation were also briefly explained in this chapter. The next
chapter discusses the research outputs as per the research objectives and questions.

178
CHAPTER 6: DISCUSSION
6.1 INTRODUCTION
This chapter discusses and presents the findings of the survey that were analysed using
the QFD model. It links the discussion of the QFD results with the research questions
and objectives. Additional tables and figures are also presented in this chapter to
demonstrate the connections between the QFD analyses, research questions and
objectives. The first section describes the results for highly probable and high impact
risks. The next section explores the highly important strategies for particular risks and
compares adopted strategies for particular risks. The next section provides an
interpretation of the results of optimal mitigation strategy in response to the second
research question. The answers to the research questions are linked with their
practical implications in the subsequent section. Possible outcomes emanating from
implementing mitigation strategies are then discussed.
6.2 RESULTS FOR HIGHLY PROBABLE AND HIGH IMPACT RISKS
The frequency of risk occurrences and the impact of these risks significantly impact on
the supply chain (Trkman and McCormack 2009). The findings of this section show the
highest degree of importance for supply chain risks (see Table 5.24) and Appendix 5C.
The highest three or four DI (Degree of Importance) values are shown in the following
table (Table 6.1) to give a clear idea of the selected highly probable and high impact
risks. Table 6.1 identifies highly probable and high impact risks for three groups
(employee, executive, supply chain members) of both dairy farms (Nahar and
Paharika). In this table, ‘Hartal and strike cause delay in work process’(R13) is
identified as selects as the most highly probable risk with high impact for respondents
from both farms.
The movement of materials from one place to the other is certainly a concern for all
stakeholders in a supply chain. Hartals and strikes often impede the transport of raw
products from farm house to processing plant as well as the finished products to
customers. Delays in the process hinder production and distribution and ultimately
lead to customer dissatisfaction (Mishra and Shekhar 2011). So delay caused by hartals
and strikes (R13), not only hampers production but also hinders the distribution
process and causes products to perish on the way to some extent. This risk was found

179
to be high for all stakeholders at all levels of the supply chain process. Once the
products are passed over to the distributor, then responsibility for these items is borne
by them and any deviation in distribution results in penalisation. So this risk has a high
impact as it not only results in penalisation, but also brings down profit.
Table 6.1: Identification of Highly Probable and High Impact Risks
Risks
Degree of Importance (DI)
Nahar
Employees
Nahar
Executives
Nahar
Supply Chain
Paharika
Employees
Paharika
Executives
Paharika
Supply Chain
R13 0.65 0.78 0.77 0.71 0.81 0.81
R3 0.60 - - 0.58 0.67 -
R5 0.59 0.64 - 0.64 0.61 -
R8 0.59 - - - - -
R44 - - 0.68 - - -
R14 - - 0.72 0.58 - 0.81
R11 - 0.70 - - - -
R40 - 0.70 - - - -
R26 - - 0.64 - -
R45 - - - - - 0.81
R34 0.63
The highly probable and high impact risks are shown in Table 6.2 below.
Table 6.2: Full Expression of Highly Probable and High Impact Risk
Risks No. Risks Name
R3 = High rate of interest
R5 = Absence of insurance or compensation coverage
R8 = Illiteracy and inefficiency of worker
R11 = Lack of fixed government policy in dairy sector
R13 = Hartal and strike cause delay in work process
R14 = Political Unrest and interference
R26 = Cattle diseases
R34 = Shortage of land for expanding farm
R40 = Existence of middlemen/ too many middlemen
R44 = Lack of milk tanker (refrigerated)
R45 = Unethical behaviour of middle men( adulteration, added price, deprivation)
Employees of both farms and Paharika executives mentioned ‘High rate of interest’ as
one of the highly probable risks. Finch (2004) observes that companies that form
supply chain partnerships with other companies that may not be equally sound
financially increase their own levels of risk. Farmers have to pay a high rate of
interest/financial charges against any kind of borrowed funds. So a rise in the interest
rate escalates the cost of funds and consequently may have an impact on profitability
(Food 2011a) which may, in turn, bring disaster for all parties within the chain.

180
The results of this study also reveal that employees and executives of both farms
perceived ‘Absence of insurance and compensation coverage’ (R5) as a highly probable
and high impact risk. In this regard, Kleindorfer and Saad (2005) opined that primary
suppliers who face severe financial adversity could be particularly harmful for the
overall supply chain. According to the Nahar employees, ‘Illiteracy and inefficiency of
worker’ (R8) is also considered to be a highly probable risk with high impact. Illiteracy
and inefficiency results in producers having limited access to the complexities of
business practices and this creates difficulties, not only for them, but also for the
downstream members of the supply chain (Mishra and Shekhar 2012).
Nahar executives mentioned R11, ‘Lack of fixed government policy in dairy sector’, as a
highly probable and high impact risk. They considered that fixed government policies
regarding stabilising market prices, controlling high prices of feed and medicine,
setting a national milk grid, managing adequate processing facilities, and providing
institutional loans through public services are essential for fostering the development
and growth of the dairy sector in Bangladesh (Shamsuddoha and Edwards 2000).
Government intervention is required to remove different political uncertainties which
are responsible for creating various distributional risks as well as affecting the
processing activities, by adopting appropriate regulatory actions. Although the
Bangladesh government has taken various measures regarding breeding policies and
the raising of commercial farms, to date, these government policies have failed to
effectively alleviate the risks faced by the industry.
Nahar executives also worry about another highly probable risk, that is, ‘Existence of
middlemen/too many middlemen’ (R40). Dairy production in Bangladesh involves a
complex and a long supply chain consisting of too many middlemen. Milk reaches the
city markets through a long chain of middlemen (Hashmi 2004). Between the producer
and the consumer, costs and time are added for the passage of milk through the big
collectors, for transport, for processing in chilling units and milk plants, for retailers till
the milk reaches the consumer. The involvement of too many middlemen may result in
increases in price and delays in product movement. Because of the perishable nature of
milk, this delay creates risk for all members of supply chain.
Paharika supply chain members give the highest priority to ‘Political unrest and
interference’ (R14) and ‘Unethical behaviour of middlemen like adulteration, added

181
price and deprivation’ (R45) as highly probable risks for the dairy supply chain with
high impact. Rao and Goldsby (2009) and Akcaoz, Kizilay and Ozcatalbas (2009)
discussed risk R14 and R45 is discussed by Chowdhury 2007; Blos, Quaddus and Wee
2009; Peck 2005. R14 is also perceived as a highly probable risk with high impact by
the supply chain members of Nahar and the employees of Paharika Dairy. It is
unfortunate that, although a favourable political and economic climate is a pre-
condition for the development of any business in any country in the world, it is too
polluted and confrontational in Bangladesh. Personal and political antagonism between
political opponents and a lack of respect for the elementary principles of democratic
governance have given birth to a culture of corruption, bribery, hooliganism, and
musclemanship. All activities from the farm level to the top level are hindered by such
political unrest and interference.
The involvement of middlemen is quite common in the Bangladesh dairy supply chain,
where milk is likely to be adulterated through the changing of hands, by mixing with
water to increase volume, adding sodium bicarbonate to minimise acidity and adding
starch and sugar to increase solid content. Adulterated milk is the main carrier of
dangerous diseases feared by consumers. Adulteration and contamination lead to
quality deterioration which is also liable to abolish the goodwill of company. Supply
chain members of Nahar identified ‘Lack of refrigerated milk tanker’ (R44) as high risk
area with high impact. Milk has to be kept cold throughout the marketing chain as it
has a tendency to spoil very quickly in the tropical weather. So the provision of
refrigerated transport is necessary to keep it fresh (Abdullah 2004). Milk can be
transported unrefrigerated for a short distance and duration but within 5-7 hours of
milking, it begins to sour and becomes useless. As a result, the quality of product
deteriorates.
It was estimated that around 35,000 litres of milk is spoiled every day in Bangladesh
due to non-availability of a central milk collection system and good transport facilities
(Rahman 2015). Most of the dairy companies, including the case companies, are used to
adding ice to save milk from spoilage. It dilutes the milk, resulting in deteriorating
quality and reduction of total solid contents (Curtis 2011).
Shortage of land for expanding farms (R34) was also perceived to be a highly probable
risk area by Paharika executives, for whom farm expansion was not possible (Ali and
Kapoor 2008; Choudhary et al. 2011). Executives of Paharika farm mentioned that it is

182
difficult to expand their farming activities due to the shortage of land. They also added
that, because of the shortage of land, it is difficult to grow green fodder for their cattle.
Due to the shortage of green pastures for cattle, they have to buy dry fodder in the
market which is definitely costlier.
Cattle diseases (R26) pose the biggest risk to the dairy supply chain. Nahar supply
chain members observed that there is a high frequency of occurrence of different cattle
diseases in Bangladesh. This has high impact, causing substantial economic losses for
the dairy industry. These diseases include anthrax, lumpy skin disease, rabies, bovine
tuberculosis and brucellosis (Choudhary et al. 2011). Most of the diseases negatively
affect milk production and some of them affect the fertility of animals. For example,
brucellosis causes abortion during the pregnancy of cattle. The major causes of
economic losses due to disease are mortality, morbidity and post slaughter
condemnation. An outbreak of the abovementioned diseases could disrupt the normal
flow of the milk supply chain in Bangladesh. The simple reason for the frequent
outbreaks of cattle diseases in Bangladesh is the shortage of veterinary services and
diagnostic laboratories. Although there are vaccines available to manage these
diseases, they are still largely inaccessible in the public domain.
6.2.1 Mitigating strategies for the highly probable and high impact risks
This section discusses mitigation strategies for the highly probable and high impact
risks based on relationship (REL) scores. For this purpose, highly probable and high
impact risks are collected from Section 6.2. At the same time Table 6.3 represents
selected mitigation strategies for highly probable and high impact risks. Twenty two
mitigation strategies (Table 6.4) were selected on the basis of relationship scores
considering the REL scores of equal to or more than 2.50. The relationship scores were
collected using a four-point scale of 0, 1, 5 and 9. These four points denote no relation,
little relation, moderate relation and strong relation respectively between risks and
mitigation strategies. Hence, the REL scores of 2.50 and above stand between little
relation and strong relation. Thus various risks can be mitigated through implementing
strategies.

183
Table 6.3: Mitigation Strategies for Highly Probable and High Impact Risks
Risks Mitigation
Strategy
Nahar
Employees
Paharika
Employees
Nahar
Executives
Paharika
Executives
Nahar
Supply
Chain
Paharika
Supply
Chain
R3
S6 2.50
S7 8.33 9.00 7.67
S8 3.50 6.33
S10 2.50
R5
S2 5.50 7.50 6.33 9.00
S6 6.00
S7 3.00
S11 2.50 4.33 4.67 3.33
R8
S3 6.83
S4 4.00
S12 3.33
S14 5.33
R11 S6 7.67
S18 3.33
R13
S5 6.17 7.00 6.00 9.00 7.00 9.00
S6 2.67 6.00 3.33 2.50
S18 4.50
R14 S5 9.17 9.00 9.00
S6 3.33 3.00
R26
S2 9.00
S6 2.50
S11 2.50
S15 5.00
S17 5.00
S22 9.00
S23 7.00
R34 S16 9.00
S24 9.00
R40
S10 3.33
S11 6.00
S25 6.00
S31 7.67
S32 9.00
R44
S7 2.50
S10 2.50
S28 9.00
R45
S10 2.50
S11 2.50
S31 9.00
S32 7.00
Selected mitigation strategies are shown in table 6.4.These strategies are from table 6.3
with REL≥2.50.

184
Table 6.4: List of Selected Strategies No. Strategy Name No. Strategy Name
S2 = Buying insurance against production loss. S15 = Attempts to create various cross
breeds by adopting AI services.
S3 = Hiring skilled staff S16 = Lease abandoned land to the farmers
for dairy farming
S4 = Motivational and incentives facilities for staff S17 = Strengthen the regular supply of
vaccine
S5 = Initiative to remove political uncertainty S18 = Initiative to reduce the cost of feed
S6 = Implementation of a fixed policy for dairy sector S22 = Arrangement of regular vaccination
for the cattle
S7 = Assurance of adequate institutional credit support with
low rate of interest
S23 = Arrangement of improved and
upgraded veterinary services
S8 = Introducing off-farm activities S24 = Building multi-storeyed complex for
farm extension
S10 = Promote sound business practices by cooperation,
better coordination and information sharing
S25 = Building monitoring team
S11 = Reduction of risks through merger, acquisition and
integration.
S28 = Arrangement of refrigerated transport
facilities
S12 = Arrangement of proper training to the staff regarding
temperature control
S31 = Removal of unnecessary influence of
middlemen
S14 = Arrangement of proper training to the staff regarding
processing and hygiene management
S32 = Direct marketing
Table 6.3 shows that stakeholders of both the case industries have suggested strategy
(S5)‘Initiative to remove political uncertainty’ as the most important for mitigating risk
(R13)‘Hartal and strike cause delay in work process’ which emerged as the most highly
probable risk with high impact. A favourable political environment is the key factor for
the development of any kind of business in any country in the world. Unfortunately the
political environment is too polluted in Bangladesh (Chowdhury 2007). Such
tumultuous political situations ultimately cause problems for businesses. Sometimes a
series of frequent and prolonged hartals and strikes causes delays in the work process
and supply network of dairy products. This also badly affects the health of the political
environment and the socio-economic condition of the country as well. To remove this
risk, Bangladesh needs to establish a market-oriented economy based on a sound
regulatory structure and supported by the instruction of law (Chowdhury 2007).
Government support with a stable policy and structure that direct all actors is the best
guarantor of political stability.
Dairy executives report that they have requested all major political parties to protect
this sector from political activities so that they can establish a smooth supply of dairy
products all over the country. In response, political parties are strongly considering
their appeal to protect their industry from such harmful political events. Recently,
political activities like strikes and Hartals are not applicable for the supply of
perishable goods so that industries will not be affected. This is a good sign, although

185
the dairy industry needs more support from political institutions that ultimately hold
the power to produce effective policy and sustainable implementation of such policies.
Strategy (S7) ‘Assurance of adequate institutional credit support with low rate of
interest’ is another important mitigation strategy to reduce the high impact of dairy
risk. All the groups of Nahar Dairy have suggested this strategy for mitigating the three
highly probable risks (R3, R5 and R44). These risks are associated with rates of
interest, buying insurance and buying milk tankers. All these risks can be resolved once
farms can receive credit support with low interest rates. In reality, institutional
support for dairies is very limited in Bangladesh. In the absence of adequate
institutional credit support, farmers cannot acquire loans during any type of hazard
risks. In recent years, different NGOs have distributed 50–55% of their annual rural
development loans to livestock activities (Jabbar 2010). However, only a small share of
the disbursed loans goes to dairy farms, as most of the NGOs provide loans to the poor
and landless farmers for raising small stock animals. Institutional credit support with a
lower rate of interest is needed for the expansion of dairy farms, enabling them to
cover various expenses relating to animal health, breed management, extension
services, feed management and disease management.
The Bangladesh government has introduced a policy to disburse loans to farmers in the
livestock sectors at low interest rates. At the same time, the World Bank, IMF, Asian
Development Program (ADP), DFID, DANIDA and others introduced almost the same
strategy for the sake of developing the dairy sector in Bangladesh. It may take a couple
of decades to get ultimate results, but it is a good initiative for dairy farms to receive
maximum support through these kinds of funds. Now, the dairy owners have started
complaining about the loan strategies as they involve political people. Nevertheless, it
is a good start which may result in something good for the country in general and the
dairy sector in particular.
Likewise, mitigation strategy (S11) ‘Reduction of risks through merger, acquisition and
integration’ could solve the risks R5, R26, R40 and R45. These risks are linked with
insurance compensation, controlling cattle disease, removing too many middlemen and
controlling unethical behaviour of middlemen. For example, if a few farms were to
merge, then they could buy insurance, as the aggregate costs would be less than for an
individual farm. On top of that, too many middlemen can be removed through mergers,
acquisitions and the integration of several dairy farms. Integrated farms can establish

186
their own supply chain network to reduce the middlemen and control their unethical
behaviour. Unfortunately, there is no example of a successful merger, acquisition or
integration of dairy farms in Bangladesh. However, there are a number of cooperatives
working together to collect milk from rural areas and supply it to processing centres
for reprocessing. These cooperatives are successful enough to maximise their profit
and involve a significant number of people. These cooperatives are characteristically
similar to integrated networks, though it is a different concept from the merger.
However, both the case industry employees, executives and supply chain members
identified the importance of integration for making extra profit and adopting logistics
support.
Furthermore, R3, R5, R11, R13, R14, and R26 can be controlled through Strategy (S6)
‘Implementation of a fixed policy for dairy sector’. Reasonable interest rates, insurance
coverage and compensation, a fixed government policy for the dairy industry, avoiding
political activities and political unrest, and controlling cattle disease are the main risks
mitigated through the use of strategy S6. Dairy industry stakeholders have long
demanded such fixed government policy. They believe that the government is the only
authority that can implement such changes through establishing rules, regulation and
strict policies. Six groups from both case industries gave this strategy a high score in
relation to these risks. They also opined that most of the problems can be solved if the
government implements such policies for the sake of developing the dairy industry.
Four different mitigation strategies have been discussed in the above section. A total of
twenty two strategies were selected by the different groups of the selected case
industries. Table 6.3 shows that S31 and S32 are favoured by the Nahar executives and
Paharika supply chain respectively. This may be because Nahar executives are focused
on strategies of removal of middlemen and direct marketing, but Paharika executives
are focused on other approaches based on their priorities and visionary plans.
Sometimes, company executives directly interfere in supply chain and distribution
work for the sake of making greater profits and earning goodwill and reputations.
Again it depends on individual farm strategies and plans. The six groups suggested a
few other mitigation strategies which are common between the two case industries,
but they earned different REL scores. In fact REL scores determine the relationship
status between risks and strategies. Strategies with higher scores get higher priority
than strategies with lower REL scores. Therefore, this discussion is successfully

187
delivered the degree of relationship between risks and mitigation strategies of this
study.
6.3 EXPLORING THE HIGHLY IMPORTANT STRATEGIES TO MITIGATE RISKS This section explores the strategies for mitigating dairy risks on the basis of highest
relative importance (RI). This refers to data on RI collected during Phase 1 of the QFD
analysis (Section 5.5.1.8). The strategies with respect to the top five RIs for different
groups are considered as highly important strategies to mitigate risks. At the same
time, risks are ranked based on the relationship index (REL). This research considers
the highest relationship score (REL) between risk and mitigation strategies as 6.0 and
above scores of REL 6.0 and above indicate the most highly prioritised strategies to
mitigate highly probable and high impact risks. Due to budget constraints, REL scores
of 6.0 and above are considered instead of 5.0 or below. If the farm budget is sufficient,
it can implement all the strategies to mitigate every risk. As mentioned before in
Section 5.5.1.4, the linguistic scales used to determine relationships between risks and
mitigation strategies were 0–1–5–9 (no–weak–medium–strong). The relationships
between medium and strong (REL value more than6) are considered while the no and
weak relationships are ignored. This section identifies appropriate strategies to
mitigate risks for sustainable outcomes in the dairy industry. Tables 6.5, 6.6, 6.8, 6.9,
6.10, 6.11, 6.12 and 6.13 shows suitable strategies based on the judgment of different
groups from the selected case industries. The calculation of RI values for different
groups are shown in Chapter 5 (Table 5.31) and in Appendix 5 (Tables 5F, 5G, 5H, 5I
and 5J).
Group 1: Employees
Nahar Dairy employees prioritised risks and mitigation strategies (see Table 6.5).
Nahar employees considered three strategies for mitigating eleven risks based on
highest RI values and REL scores respectively. This table shows that Nahar employees
select the five highest mitigation strategies (S1, S2, S3, S4 and S6) to mitigate risks R1,
R6, and R7. Other risks are also shown in Table 6.5. For example, if strategy S1 is
implemented, then R6, R22, R24, and R25 could be mitigated for better performance.
Likewise, R7, R8, R9 and R37 could be mitigated by implementing StrategyS3and R1,
R11, R33 and R37 could be mitigated by implementing Strategy S6. The
relationshipsofR6S1 and R11S6 scored the highest (9.00) among the REL scores.
Hence, this highest relationship articulates that R6 and R11 could be best mitigated
byS1 and S6 respectively. Table 6.5 also shows the specific relative importance (RI)

188
values of each particular mitigation strategy to identify the most suitable approach for
the company. S3 has the highest RI value (0.08) than other strategies which highlights
its priority over other strategies.
Table 6.5: Highly Important Strategies (Nahar Employees)
Strategy Number S1 S2 S3 S4 S 6
Ris
k N
um
be
r
Mitigation Strategy
Risk
Adoption of improved
technology (milking
machine, feed mixture, grass
cutting, improved
processing facilities)
Buying insurance
against production
loss
Hiring skilled
staff
Motivational and
incentives facilities for
staff
Implementation of a fixed policy for dairy sector
R1 Inadequate loan facilities 6.17
R 6
Shortage of improved technology (Milking machine, feed mixture, grass cutting, improved processing facilities)
9.00
R 7 Labour disputes 6.33 7.67
R 8 Illiteracy and inefficiency of worker 6.83
R 9 Shortage of skilled staff 8.33
R10 Switching of staff frequently 6.83
R 11 Lack of fixed government policy in dairy sector
9.00
R15 Corruption (Adulteration by mixing water)
7.00
R18 Natural disaster ( flood, excessive rain, storm)
7.50
R20 Machine damage/breakdown at cold storage
7.50
R 22 Inadequate cold storage 6.33
R 24 Bacterial contamination for improper temperature
6.33
R 25 Pollution and Unhygienic environment
6.17
R26 Cattle diseases 6.17
R27 Machine damage/breakdown at
processing unit 7.00
R28 Fire at farm shed 7.17
R 33 Lack of upgrade vaccination and veterinary services
6.17
R 37 Bureaucratic complexity on maintaining various formalities
6.83 6.17
Absolute Importance (AI) 26.37 20.72 32.84 19.83 28.66
Relative Importance (RI) 0.07 0.05 0.08 0.05 0.07
Note: Table containing all values is shown in Table 5.31 in Chapter 5
Strategy (S1) ‘Adoption of improved technology’ acquired the highest score (9) for
mitigating risk R6 ‘Shortage of improved technology’. For instance, if a farm adopts
improved technology in the form of milking machines, feed mixtures, grass cutting, or
improved processing facilities, then they can easily overcome the shortage of improved
technology. Choudhary et al. 2011 and Ahsan 2011 also emphasise the adoption of
improved technologies. On the other hand, some respondents chose S6 which is related
to the implementation of fixed government policy on dairy industry. This variable is
discussed by Shamsuddoha and Edwards 2000 and Shrestha and Yadav 2004. So the
respondents rightly expressed their opinions in relation to S1 and S6. ‘Implementation

189
of fixed government policy’ (S6) and ‘Lack of fixed government policy in dairy sector’
(R11) have a strong relationship and thus risk R11 can be solved through
implementing strategy S6.
If there is a fixed government policy for the dairy industry, farms can access many
facilities at a time to mitigate multiple risks. For example, if there was a fixed
government policy regarding a system for moving milk from the rural milk sheds to
urban milk consuming demand centres, producers would get a good price without
middlemen deprivation. Simultaneously, this would be helpful for developing a regular
and secure market for their products. Although S1 and S6 have high REL scores, (S3)
‘Hiring skilled staff’ acquires the highest RI which makes it most important of the five
strategies. Farms can hire skilled people (S3) more easily than they can than adopt the
strategy (S1) ‘Adoption of improved technology’ due to costs. Adaptation of new
technologies costs more than hiring skilled staff for particular tasks. Application of (S6)
‘Implementation of fixed government policy’ is also beyond the control of farms as it
comes from a government authority. This statement is verified by the previous cases of
China’s milk scandal and food product policy for industrialised and developing
countries respectively (Henson and Reardon 2005; Jia et al. 2012).
Paharika employees categorised existing risks and mitigation strategies as shown in
Table 6.6. They classified five mitigation strategies and 23 risks based on the highest RI
and REL scores respectively. They selected mitigation strategies (S1, S2, S3, S6 and S7)
to mitigate risks R1-R6, R8, R9, R11, R16, and others. For instance, if mitigation
strategy S3is chosen, then risks R8, R9, R20, R23 and R37 could be mitigated in the
Paharika dairy industry for maximum output. Similarly, Strategy (S2)‘buying insurance
against production loss’ could mitigate risks R5, R16, R18, R20, R27, R28, and R29.
This finding supports the earlier findings of Wolf, Roy Black and Hadrich (2009) and
Van Asseldonk and Meuwissen (2006) concerning the way a farm/industry can protect
its assets from different unusual incidents, including natural disasters. Risks R1, R2, R3,
and R4 could be mitigated by employing Strategy (S7) ‘adequate institutional credit
support with low rate of interest’.R3S7, R6S1, R9S3, R11S6 and R22S1 have the highest
REL scores. Ahsan (2011), Chowdhury (2007), Shamsuddoha and Edwards (2000)
and Shamsuddin, Alam, Hossein, Goodger, Bari, Ahmed, Hossain, et al. (2007) have also
found that adequate financial credit support can solve a number of problems for a
farm.

190
Table 6.6 shows the RI values and highlights the most appropriate strategy from
among the whole list. It shows that S3 has a higher RI value than the other four
strategies. This means that S3 is the most important of all the strategies. The strategy
of ‘Hiring skilled staff (S3)’ has the highest score (9) for the risk of ‘Shortage of skilled
staff (R9)’. The shortage of skilled staff could be mitigated by hiring skilled staff at
different levels of operation in the dairy farms. Tipples and Morriss 2002 and Morriss
et al. 2006 also saw this as the solution to a shortage of skilled staff. Employees from
both farms detected five strategies but they prioritised a different number of risks (see
Table 6.7). Nahar employees identified 18 risks while Paharika employees identified 23
risks. In contrast, employees of both farms scored the same RI value for S3. In terms of
strategy ranking, S1, S2, S3 and S6 are common, whereas Paharika included the
additional strategy of S7. Table 6.7 also shows the relationship scores for Nahar and
Paharika respectively.
Group 2: Executives
Table 6.8 shows that Nahar executives referred to five strategies (S3, S4, S6, S19 and
S25). According to them, the most important strategy for mitigating dairy risk is (S6)
‘Implementation of a fixed policy for dairy sector) which has the highest RI value of
0.08. Shamsuddoha and Edwards (2000) and Shrestha and Yadav (2004) also
emphasise the importance of this strategy. Appropriate and essential fixed policies can
help farmers boost their existing operations for greater profitability. There are
significant relationships between R10S4, R15S25, R17S25, R21S19, R22S19 and R24S3
as all of these possess the highest REL score which is 9.00. Nahar executives
highlighted Strategy S6 (0.08) to mitigate four different risks,(R5, R11, R12, and R35).
Executives also prioritised S3 (0.06) for mitigating six risks (R6, R7, R8, R23, R24 and
R25). Similarly, implementation of Strategy S25 (0.05) can mitigate or minimise risks
R15, R17 and R45. Likewise, the effects of risks R10, R16, R17, R23 and R37 could be
reduced by applying Strategy S4 (0.05). These findings on implementing mitigation
strategies for particular risks are also reflected in the real-life dairy supply chain. For
example, on farms which focus on different incentives for staff (S4), such as bonuses,
financial rewards, medical allowances, and house rent, the frequency rate of switching
of staff (R10) from this farm is reduced by a striking amount. Theft (R17) and different
forms of mismanagement of employees (R16, R23) could also be controlled by
providing various social and financial benefits. Abdullah (2004) discusses this in his
research on cost effective technologies for milk preservation and processing.

191
Table 6.6: Highly Important Strategies (Paharika Employees)
Strategy Number S 1 S 2 S 3 S 6 S 7
Ris
k N
um
be
r
Mitigation Strategy
Risk
Adoption of improved
technology (Milking machine,
feed mixture, grass cutting,
improved processing facilities)
Buying insurance
against production
loss.
Hiring skilled
staff
Implementation of a fixed policy for dairy sector
Assurance of adequate institutional
credit support with low
rate of interest.
R 1 Inadequate loan facilities 8.33
R 2 Complex loan procedures 7.00
R 3 High rate of interest 9.00
R 4 Inadequate finance 7.67
R 5 Absence of insurance or compensation coverage
7.50
R 6 Shortage of improved technology (Milking machine, feed mixture, grass cutting, improved processing facilities)
9.00
R 8 Illiteracy and inefficiency of worker 6.83
R 9 Shortage of skilled staff 9.00
R 11 Lack of fixed government policy in dairy sector
9.00
R 16 Damage of farm’s assets
6.17
R 18 Natural disaster (flood, excessive rain, storm)
8.33
R 19 Quick perishability of milk 8.33
R 20 Machine damage/breakdown at cold storage
6.83 6.17
R 21 Inadequate chilling facilities 7.00
R 22 Inadequate cold storage 9.00
R 23 Spoilage of milk through improper handling
8.33
R 24 Bacterial contamination for improper temperature
7.67
R 27 Machine damage/breakdown at processing unit
6.83
R 28 Fire at farm shed 7.50
R 29 Accident (Staff injury) 6.17
R 35 Irregular supply of vaccine from government
R 37 Bureaucratic complexity on maintaining various formalities
6.33
R 44 Lack of milk tanker (refrigerated) 7.00
Absolute Importance (AI) 28.70 28.46 33.01 27.13 27.65
Relative Importance (RI) 0.07 0.07 0.08 0.06 0.06
Note: Table containing all values is shown in appendix 5H.
Table 6.7: Nahar Employees vs. Paharika Employees
Particulars Nahar Dairy Paharika Dairy Total Strategies Selected 5 5 Total Risks Considered 18 23 Highest RI Value 0.08 0.08 Important Strategies S3, S6, S1, S2, S4 S3, S1, S2, S7, S6 Top Relationships (at least 5)
R6S1, R11S6, R9S3, R22S1, R3S7 R3S7, R6S1, R9S3, R11S6, R22S1

192
Table 6.8: Highly Important Strategies (Nahar Executives)
Strategy Number S 3 S 4 S 6 S19 S25
Ris
k N
um
be
r Mitigation Strategy
Risk
Hiring
skilled
staff
Motivational
and
incentives
facilities for
staff
Implementation
of a fixed policy
for dairy sector
Support to
develop
technology
Building
monitoring
team
R 5 Absence of insurance or compensation
coverage 6.00
R 6
Shortage of improved technology (Milking
machine, feed mixture, grass cutting,
improved processing facilities)
6.33 6.00
R 7 Labour disputes 6.00
R 8 Illiteracy and inefficiency of worker 6.33
R10 Switching of staff frequently 9.00
R11 Lack of fixed government policy in dairy
sector 7.67
R12 Poor law and order situation (terrorism,
musclemen ship) 7.67
R15 Corruption (adulteration by mixing water) 9.00
R16 Damage of farm’s assets 6.00 6.00 7.67
R17 Theft 6.33 6.33 9.00
R21 Inadequate chilling facilities 9.00
R22 Inadequate cold storage 9.00
R23 Spoilage of milk through improper
handling 7.67 6.33 6.33
R24 Bacterial contamination for improper
temperature 9.00 6.00
R25 Pollution and Unhygienic environment 6.00
R26 Cattle disease 6.00
R32 Scarcity of feed 6.00
R34 Support to develop technology 6.00
R35 Irregular supply of vaccine from
government 6.00
R37 Bureaucratic complexity on maintaining
various formalities 6.00
R40 Existence of middlemen/ too many
middlemen 6.00
R41 Too long chain cause delay in product
movement 6.00
R45 Unethical behaviour of middle men(
adulteration, added price, deprivation) 7.67
Absolute Importance (AI) 29.16 25.74 38.48 34.06 26.54
Relative Importance (RI) 0.06 0.05 0.08 0.07 0.05
Note: Table containing all values is shown in Appendix 5F.
Table 6.9 shows the ranked risks and mitigation strategies as described by Paharika
executives. In Table 6.9, Paharika executives’ identified five mitigation strategies
associated with twenty four risks having the highest RI and REL scores respectively.
The executives identified five mitigation strategies, (S1, S3, S5, S6 and S7), to mitigate
risks R1, R3, R4, R6 and others shown in Table 6.9. The executives opined that risks R6,
R17, R19, R21-R25 and R44 could be mitigated by implementing Strategy S1 (0.07).
Interestingly, although Strategy S6 gained highest RI value (0.08), it can mitigate only
three risks (R11, R33 and R37). This is because it is beyond the control of the farm

193
(Shamsuddoha and Edwards 2000, Shrestha and Yadav 2004). The relevant policy
comes from a government authority which has no connection with farm decisions.
Without government intervention, farms cannot enact any policy for the betterment of
their business.
Table 6.9: Highly Important Strategies (Paharika Executives)
Strategy Number S1 S3 S5 S6 S7
Ris
k N
um
be
r
Mitigation Strategy
Risks
Adoption of
improved
technology
(Milking
machine,
feed mixture,
grass cutting,
improved
processing
facilities)
Hiring
skilled
staff
Initiative to
remove
political
uncertainty
Implementation
of a fixed policy
for dairy sector
Assurance
of adequate
institutional
credit
support
with low
rate of
interest.
R 1 Inadequate loan facilities 9.00
R 3 High rate of interest 7.67
R 4 Inadequate finance 9.00
R 6
Shortage of improved technology (Milking
machine, feed mixture, grass cutting,
improved processing facilities)
9.00 6.33 9.00
R 7 Labour disputes 6.00
R 8 Illiteracy and inefficiency of worker 9.00
R 9 Shortage of skilled staff 7.67
R
11
Lack of fixed government policy in dairy
sector 9.00
R12 Poor law and order situation (terrorism,
musclemen ship) 7.67
R13 Hartal and strike cause delay in work process 9.00
R14 Political Unrest and interference 9.00
R
16 Damage of farm’s assets 6.00
R
17 Theft 9.00
R
19 Quick perishability of milk 9.00
R
20 Machine damage/breakdown at cold storage
6.33
R
21 Inadequate chilling facilities 9.00
R
22 Inadequate cold storage 9.00
R
23 Spoilage of milk through improper handling 9.00
R
24
Bacterial contamination for improper
temperature 7.67 6.33
R
25 Pollution and Unhygienic environment 9.00
R
33
Lack of upgrade vaccination and veterinary
services 7.67
R
37
Bureaucratic complexity on maintaining
various formalities 6.33
R
39 Accidents of transport vehicle 6.33
R
44 Lack of milk tanker (refrigerated) 9.00
Absolute Importance (AI) 24.45 29.12 19.93 29.23 24.71
Relative Importance (RI) 0.07 0.08 0.05 0.08 0.07
Note: Table containing all values is shown in Appendix 5I.

194
S3 (0.08) could also decrease risks R6-R9, R16, R20, R24 and R39, and the deployment
of Strategy S7 (0.07) would improve the situation in relation to risks R1, R3, R4, and
R6. The results obtained from the QFD analysis (shown in Table 6.9) show that R6S1,
R17S1, R19S1, R21S1, R22S1, R23S1, R25S1 and R44S1 scored highest of all REL scores
for Strategy S1. At the same time, R8S3 and R11S6 gained the highest REL scores under
Strategies S3 and S6 respectively. Strategy S7 prioritised risks R1, R4 and R6 in regards
to highest REL scores. Ahsan (2011), Chowdhury (2007), Shamsuddoha and Edwards
(2000), Shamsuddin et al. (2007) discuss the importance of an assurance of adequate
institutional credit support with a low rate of interest. Low interest can save a farmer
in a various ways, including reducing costs and increasing profitability. Table 6.9 also
shows aggregate RI value to measure the top most highly prioritised approaches
among thirty two mitigation strategies. S6 (0.08) has a higher RI value than other
strategies. This means that S6 is the most important strategy, although S1 and S3 can
mitigate the maximum number of risks with different scores.
The strategy of ‘Assurance of adequate institutional credit support with low rate of
interest (S7)’ gained the highest score (9.00) for the risks of ‘Inadequate loan facilities
(R1)’, ‘Inadequate finance (R2)’ and ‘Shortage of improved technology (Milking
machine, feed mixture, grass cutting, improved processing facilities) (R6)’. It is
understandable that credit support with low interest could solve the problem of
inadequate loan facilities, over expenses for with high interest for buying sophisticated
improved technology. Such improvements on several existing risks could help the farm
to gain more profit through reducing costs and adopting technological equipment for
better efficiency.
Paharika and Nahar executives have also selected five strategies (shown in Table 6.10).
Three strategies (S1, S3 and S6) are common to both farms, but Nahar executives have
chosen Strategy S4 while Paharika executives have selected Strategy S7. The table also
shows the top four relationship scores for each farm. In fact they have prioritised many
other risk and strategy relationships through positioning different scores.
Table 6.10: Nahar Executives vs. Paharika Executives
Particulars Nahar Dairy Paharika Dairy Total Strategies Selected 5 5 Total Risks Considered 23 24 RI Value 0.08 0.08 Important Strategies S6, S19, S3, S25 and S4 S6, S3, S7, S1 and S5 Top Relationship (at least four)
R10S4, R15S25, R17S25 and R22S19 R1S7, R4S7, R6S1 and R6S7

195
Group 3: Supply chain members
In this study, Nahar supply chain members opined that (See Table 6.11) five major
strategies (S1, S3, S6, S7 and S14) have the highest capacity to mitigate sixteen
different risks, R1, R2, R3, R6 R8 and others, based on highest RI values. Among those
strategies, the most important is S6 with an RI value of 0.09. The highest relationship
score (REL) (9.00)was achieved by relationships R1S7, R3S7, R6S1, R9S3, R11S6,
R19S1, R20S3, R33S6 and a few others. They suggested that ‘Shortage of skilled staff’
(R9) and ‘Machine breakdown from improper handling’ (R20) could be best mitigated
by Strategy (S3) ‘Hiring skilled staff’. In practice, skilled staff can easily be trained to
deal with sophisticated matters such as bacterial contamination, temperature
management, value addition and technological device usage. The milking machine is
one of the important instruments for the dairy industry and staff can be trained to use
it appropriately to get maximum production. All these problems can be solved through
hiring skilled staff.
Table 6.11: Highly Important Strategies (Nahar Supply Chain)
Strategy Number S1 S 3 S 6 S 7 S14
Ris
k N
um
be
r
Mitigation Strategy Risk
Adoption of improved technology (milking machine, feed mixture, grass cutting, improved processing facilities)
Hiring skilled staff
Implementation of a fixed policy for dairy sector
Assurance of adequate institutional credit support with low rate of interest.
Arrangement of proper training to the staff regarding processing and hygiene management
R 1 Inadequate loan facilities 9.00
R 2 Complex loan procedures 7.00
R 3 High rate of interest 9.00
R 6 Shortage of improved technology (milking machine, feed mixture, grass cutting, improved processing facilities)
9.00
R 8 Illiteracy and inefficiency of worker 7.00
R 9 Shortage of skilled staff 9.00 9.00
R11 Lack of fixed government policy in dairy sector
9.00
R19 Quick perishability of milk 9.00 7.00
R20 Machine damage/breakdown at cold storage 9.00
R21 Inadequate chilling facilities 9.00
R24 Bacterial contamination for improper temperature
7.00 7.00 7.00
R25 Pollution and Unhygienic environment 9.00
R27 Machine damage/breakdown at processing unit
7.00 9.00
R30 Inadequate supply of quality feed 7.00
R33 Lack of upgrade vaccination and veterinary services
9.00
R35 Irregular supply of vaccine from government 7.00
Absolute Importance (AI) 18.03 21.90 29.15 27.49 18.50
Relative Importance (RI) 0.05 0.07 0.09 0.08 0.06
Note: Table containing all values is shown in appendix 5G.

196
On the other hand, Table 6.12 shows the hierarchical risks and mitigation strategies
selected by Paharika supply chain members. They have selected seventeen risks and
five important mitigation strategies relying on highest RI and REL scores respectively.
Here, Paharika supply chain members identified five mitigation strategies, S1, S5, S7,
S28 and S31, which can alleviate risks R1-R3, R6, R12-R15, R19 and others. For
example, supply chain members judged Strategy S7 (0.07) as the most important
strategy to reduce risks R1, R2 and R3. Similarly, R12, R13 and R14 could be mitigated
through implementing Strategy S5.
Table 6.12: Highly Important Strategies (Paharika Supply Chain)
Strategy Number S 1 S 5 S 7 S28 S31
Ris
k N
um
be
r
Mitigation Strategy
Risks
Adoption of
improved
technology
(milking
machine, feed
mixture,
grass cutting,
improved
processing
facilities)
Initiative to
remove
political
uncertainty
Assurance of
adequate
institutional
credit
support with
low rate of
interest.
Arrangement
of
refrigerated
transport
facilities
Removal of
unnecessary
influence of
middlemen
R 1 Inadequate loan facilities 0.00 0.00 9.00 0.00 0.00
R 2 Complex loan procedures 0.00 0.00 9.00 0.00 0.00
R 3 High rate of interest 0.00 0.00 9.00 0.00 0.00
R 6
Shortage of improved technology
(milking machine, feed mixture,
grass cutting, improved processing
facilities)
9.00 0.00 5.00 0.00 0.00
R12 Poor law and order situation
(terrorism, musclemen ship) 0.00 9.00 0.00 0.00 0.00
R13 Hartal and strike cause delay in work
process 0.00 9.00 0.00 0.00 0.00
R14 Political Unrest and interference 0.00 9.00 0.00 0.00 0.00
R15 Corruption ( adulteration by mixing
water) 7.00 0.00 0.00 0.00 0.00
R19 Quick perishability of milk 9.00 0.00 0.00 4.50 0.00
R21 Inadequate chilling facilities 9.00 0.00 5.00 4.50 0.00
R22 Inadequate cold storage 9.00 0.00 5.00 4.50 0.00
R24 Bacterial contamination for
improper temperature 7.00 0.00 0.00 4.50 0.00
R40 Existence of middlemen/too many
middlemen 0.00 0.00 0.00 0.00 9.00
R41 Too long chain cause delay in
product movement 0.00 0.00 0.00 0.00 9.00
R42 Poor conditioned road for moving
product (delay & spoilage) 0.00 0.00 0.00 9.00 0.00
R44 Lack of milk tanker (refrigerated) 0.00 0.00 0.00 9.00 0.00
R45
Unethical behaviour of middlemen
(adulteration, added price,
deprivation)
0.00 0.00 0.00 0.00 9.00
Absolute Importance (AI) 19.97 20.62 21.67 21.25 18.45
Relative Importance (RI) 0.06 0.07 0.07 0.07 0.06
Note: Table containing all values is shown in appendix 5J.
The strategy of ‘Initiative to remove political uncertainty (S5)’ was perceived to be one
of the important strategies for solving three major risks. These three risks are ‘Poor

197
law and order situation (terrorism, musclemenship) (R12)’, ‘Hartal and strike cause
delay in work process (R13)’ and ‘Political unrest and interference (R14)’. Bangladesh
is an unstable country in regard to political uncertainty. Political uncertainty consists
of corruption of political leaders, personal and political antagonism between political
opponents, musclemenship, and hooliganism. Moreover, different political parties have
diverse policies which hinder the consistent development of the dairy industry. In this
situation, if the government or related authorities were to take the initiative to reduce
such uncertainties, such problems could be removed from the dairy industry.
Distribution and other operations of the dairy industry would be smooth if political
uncertainties were removed.
Both groups of supply chain members have chosen five strategies (Table 6.13), but they
have selected different strategies and risks in light of their practical experiences.
Paharika employees selectedS1, S3, S6, S7 and S14, whereas Nahar employees selected
S1, S5, S7, S28 and S31 relying on highest RI values. Nahar and Paharika Dairies scored
different RI values of 0.09 and 0.07. Table 6.13 shows the top four relationships scores
for Nahar and Paharika respectively.
Table 6.13: Nahar Supply Chain vs. Paharika Supply Chain Particulars Nahar Dairy Paharika Dairy
Total Strategies Selected 5 5 Total Risks Considered 16 17 RI Value 0.09 0.07 Strategy Ranking S6, S7, S3, S14 and S1 S7, S28, S5, S1 and S31 Top Relationship (at least four) R1S7, R3S7, R9S3 and R11S6 R1S7, R2S7, R3S7 and R6S1
At the end, it is observed that both farms and their stakeholders (employees,
executives and supply chain members) are looking for suitable strategies which can be
implemented in their industry for more sustainable outcomes. Different stakeholders
have chosen different numbers and types of strategies and risks based on their
particular farm requirements. Interestingly, stakeholders prioritised few risks and
strategies out of the thirty-two strategies and forty-five risks. Most were treated as
insignificant based on QFD analyses.
6.4 OPTIMAL MITIGATION STRATEGIES
A number of mitigation strategies were identified by optimising the level of risk
mitigation based on the QFD analysis in Section 5.5.2. The details of optimisation
results were shown in table 5.32 and table 5.33. For the ease of discussion the a
summary of these results is provided in table 6.14 and 6.15.The optimum mitigation

198
strategies for all respondents of both companies are listed in Tables 6.14 and 6.15 and
Appendices 6A, 6B, 6C and 6D.
Once the QFD model is formulated using the linear programming model (without
savings) and quadratic integer programming model (with savings) (shown in Section
5.62), the most appropriate strategies could be determined to mitigate dairy risks with
limited organisational resources. It is assumed that a 100% budget could implement all
strategies listed by the respondents. When the budget is less than full capacity (100%),
further analysis is needed to determine how many strategies could be implemented
under a limited budget (less than 100%).
According to the Nahar employees (Table 6.14), Strategies S6, S7, S14 and S19 are the
most optimum that could be implemented under different budgets ranging from100%
to 10%. These strategies are selected without considering savings. This means that a
reduction in the budget would not affect the implementation of these strategies.
However, when savings are considered, then S7 and S19 could not be implemented
with 20% and 30% of the budgeted amount respectively. By contrast, the remaining
two strategies, ‘Implementation of a fixed policy for dairy sector’ (S6) and
‘Arrangement of proper training to the staff regarding processing and hygiene
management’ (S14), could be implemented with a reduced budget.

199
Table 6.14: Optimisation results for Nahar Employees
Strategies
Budgeted Cost (Without Savings) Budgeted Cost (With Savings)
100% 90% 80% 70% 60% 50% 40% 30% 20% 10% 100% 90% 80% 70% 60% 50% 40% 30% 20% 10% 1,098.33 988.50 878.67 768.83 659.00 549.17 439.33 329.50 219.67 109.83 1098.33 988.50 878.67 768.83 659.00 549.17 439.33 329.50 219.67 109.83
S1
S2
S3
S4
S5
S6
S7
S8
S9
S10
S11
S12
S13
S14
S15
S16
S17
S18
S19
S20
S21
S22
S23
S24
S25
S26
S27
S28
S29
S30
S31
S32
Total Selected
Strategies 32 29 26 24 21 19 15 11 9 4 32 32 29 27 24 20 15 12 7 4
Objective Function
392.67 382.83 365.65 343.99 312.66 279.72 241.58 196.42 143.67 82.62 392.67 392.67 381.12 360.95 332.19 298.02 256.07 209.43 149.29 82.62
Level Of Risk
Mitigation 100.00% 97.49% 93.12% 87.60% 79.62% 71.23% 61.52% 50.02% 36.59% 21.04% 100.00% 100.00% 97.06% 91.92% 84.60% 75.90% 65.21% 53.34% 38.02% 21.04%

200
The result obtained from Nahar executives (Appendix 6A) shows that when savings are
not taken into consideration, then four strategies (S6, S10, S17 and S31) could be
implemented with any rate of reduced budget (10–100%). However, when savings are
taken into consideration, five strategies (S5, S6, S10, S17 and S31) could be
implemented with a changed budget. Therefore, Strategy S5 could be implemented
with any kind of changed budget when a farm takes savings into consideration.
According to Nahar supply chain members (see Appendix 6B), seven strategies (S5, S6,
S12, S14, S17, S19, and S31) could be implemented with a reduction in budget
regardless of whether they take savings into consideration or not.
According to the Paharika employees (see Table 6.15) when savings are not taken into
consideration, four strategies (S6, S10, S12 and S14) are optimal as they could be
implemented for any rate of reduction in the budget. However, when savings are taken
into consideration, only two strategies (S6 and S14) are optimal, as they could be
implemented with any rate of reduction in the budget. The Paharika executives named
StrategiesS6, S14, S16, and S19 (Appendix 6C) as optimal, because they could be
implemented under different rates of reduced budget (10–100%) when savings are not
taken into consideration. However, when savings are taken into consideration,
S6‘Implementation of a fixed policy for dairy sector ‘could not be implemented with a
20% reduction in the budgeted amount. Instead, S23‘Arrangement of improved and
upgraded veterinary services’ could be implemented at any rate of reduction in the
budget when savings are taken into consideration.
According to the Paharika supply chain members, five strategies (S5, S6, S19, S31 and
S32) could be implemented under different budgets ranging from 10% to 100%, when
savings are not taken into consideration (Appendix 6D). However, when savings are
taken into consideration, an additional strategy (S18) is considered as an optimal
strategy together with the other five strategies.

201
Table 6.15: Optimisation results for Paharika Employees
Strategies
Budgeted cost (without savings) Budgeted cost (with savings)
100% 90% 80% 70% 60% 50% 40% 30% 20% 10% 100% 90% 80% 70% 60% 50% 40% 30% 20% 10% 958.33 862.50 766.67 670.83 575.00 479.17 383.33 287.50 191.67 95.83 958.33 862.50 766.67 670.83 575.00 479.17 383.33 287.50 191.67 95.83
S1
S2
S3
S4
S5
S6
S7
S8
S9
S10
S11
S12
S13
S14
S15
S16
S17
S18
S19
S20
S21
S22
S23
S24
S25
S26
S27
S28
S29
S30
S31
S32 Total selected strategies
32 30 27 24 22 20 16 13 8 5 32 32 30 27 24 22 17 12 7 5
Objective Function
428.29 422.56 407.25 377.10 343.73 313.17 270.31 224.38 165.44 91.09 428.29 428.29 422.56 407.25 379.09 350.16 307.19 250.30 177.36 91.09
Level Of risk mitigation
100.00% 98.66% 95.09% 88.05% 80.26% 73.12% 63.11% 52.39% 38.63% 21.27% 100.00% 100.00% 98.66% 95.09% 88.51% 81.76% 71.73% 58.44% 41.41% 21.27%

202
All respondents, except the Paharika executives, agreed that the implementation of a
fixed policy for the dairy sector (S6) would be the most optimal strategy that could be
implemented within budget constraints (see Table 6.16). The government of the
country is liable to implement different policies, but the stakeholders of the company
have to spend a portion of the budget to adopt and implement government policies.
According to the respondents, , government policy is required to resolve different risks
in the dairy industry by taking appropriate regulatory actions such as by establishing a
national milk grid, stabilising market prices, controlling high prices of feed and
medicine, developing different infrastructures, strengthening the regular supply of
vaccine and providing institutional loans with a lower interest rate through public
services, with the overall objective of accomplishing full economic effectiveness.
Table 6.16: Comparison of Optimisation Results
Groups Nahar
Employees
Nahar
Executives
Nahar
SC Members
Paharika
Employees
Paharika
Executives
Paharika
SC Members
Optimum
Strategies
S6, S14 S6, S10,
S17, S31
S5, S6, S12,
S14, S17, S19
S31
S6, S14 S14, S16,
S19
S5, S6, S19,
S30, S31
Total 2 4 7 2 3 5
A fixed government policy is needed for developing a national milk grid, a government
system for moving milk from the rural milk sheds to urban milk consuming demand
centres. With the help of such a system, producers would get a good price without
having to pay middlemen and simultaneously it would be helpful for developing a
regular and secure market for their products. However, there is no national milk grid in
Bangladesh. The development of a milk grid for the dairy industry would help to
increase milk production and reduce the current losses. So attention should be given
to their establishment by the government.
To reduce different risks associated with the dairy industry, the government could
implement various policies including the provision of institutional loans, extension
services for breeding and raising cattle, and removing uncertainties created by hartals,
strikes and different political risks. To mitigate political uncertainties, the government
could develop and implement a policy to ensure that transport of dairy products is
excluded from political strikes. By implementing such a policy, the government could
save dairy transports from damage triggered by strikers. Thus, a good number of risks
could be mitigated through implementing a fixed policy for the dairy industry.

203
However, such policy would have to come from a government authority and they
would have to have an allocated budget for adopting the strategies.
‘Arrangement of proper training to the staff regarding processing and hygiene
management’ (S14) was considered as an optimum mitigation strategy by all groups
except Nahar executives and Paharika a supply chain member. These two groups
regarded ‘Removal of unnecessary influence of middlemen’ (S31) as the optimum
mitigation strategy. Both strategies could be implemented with a budget ranging from
10% to 100%.
Bangladesh does not have enough facilities for training and creating skilled manpower
at the higher and middle levels. A study on the Bangladesh dairy industry conducted by
Shamsuddin, Alam, Hossein, Goodger, Bari, Ahmed, Hossain, et al. (2007) reveals that
training management is an important risk mitigation strategy. As milk is highly
perishable, it needs extra care in storing and processing. To ensure product quality,
milk has to be chilled at 4oC within a couple of hours of milking. This is the most
favoured method for sustaining good quality milk for processing and consumption.
Hygiene practice in production and processing is another important issue for retaining
the quality of products. However, there is lack of awareness of practices for clean and
hygienic milk production in Bangladesh. Animals are not properly cleaned while
milking and the utensils used for milking and storing milk are of poor quality metal and
construction. Milking is done in an unclean environment where dust, dung and flies are
usually present and this can be an additional source of contamination and quality
deterioration. So training of staff (S14) is needed in basic hygiene practices in order to
strengthen their capacity to procure quality milk through a proper management
system. Farmers prioritised their need for training in management of profitable farms,
and the need for training of inseminators and veterinarians to enable them to deliver
effective services (Shamsuddin, Alam, Hossein, Goodger, Bari, Ahmed, Hossain, et al.
2007). In this regard, the prominent agricultural universities in the country could
establish dairy technology centres where training could be provided to the workers,
dealers and other supply chain members in various aspects of nutrition, hygiene and
quality control. Moreover, the government could sponsor vocational training centres
and mass awareness training programmes using mass media. The curriculum of these
training centres and training programmes could be expanded to include training for

204
agents involved in the supply chain on various issues regarding production, nutrition,
hygiene and transportation.
It has also been observed that the elimination of the unnecessary influence of
middlemen from the supply chain is very important for the betterment of business.
Middlemen are responsible for product adulteration as well as farmers deprivation.
While carrying milk, they are used to adding ice to the milk to prevent heat spoilages,
especially in extreme weather conditions. Another wicked practice among the
middlemen is to add water to the milk in order to increase volume. This practice not
only harms the consumer financially, but also brings adverse health effects, because in
many instances, dirty and contaminated water is added. Moreover, producers rely on
middlemen to sell raw milk and they cannot realise a good and predictable price for
their milk. Farmers in rural areas/remote areas far from cities or towns receive the
minimum milk price. Milk price for producers near the peri-urban areas is much lower
and the middlemen take the maximum share of the price realised from the consumer.
So implementation of appropriate government policies and the merger and acquisition
of farms would be effective strategies to remove the unnecessary influence of
middlemen from the Bangladesh dairy supply chain.
6.5 RELIABILITY AND VALIDITY OF THE QFD MODEL
The reliability and validity of the QFD model are discussed in the following section.
6.5.1 Model reliability
Reliability tests are absent from most of the QFD-related research studies. By
comparison, this research conceptualises a reliability measure for QFD research. This
study considers particular variables which were identified as high risks in the field
study. Then the existing literature was examined for confirmations of these high risks
and their variables. For instance, R26 (Cattle Diseases) scored a DI value (Degree of
Importance) of 0.64 which is one of the highly probable and high impact risks
according to the Nahar supply chain members. The same risk was found in the existing
literature where it was identified as a high risk for the dairy industry (Choudhary et al.
2011). Other researchers, including Akcaoz, Kizilay, and Ozcatalbas 2009, Finch 2004,
Peck 2005, Saadullah 2000, Shamsuddoha and Edwards 2000, Ghani and Rahman
2004, Bari 2008, Halder and Barua 2003, Trkman and McCormack 2009, and
Shamsuddin et al. 2007) found the same in their studies. Furthermore, Paharika
executives identified R3 (High rate of interest) and R34 (shortage of land for expanding
farm) as highly probable and high impact risks which are also evident in the current

205
literature (Trkmanand McCormack 2009, Ahsan 2011, Rao and Goldsby 2009, Ghani
and Rahman 2004, Ali and Kapoor 2008, Choudhary et al. 2011, Bari 2008). All found
the same variable as one of the major risks for their individual research context.
Therefore, it can be said that this research and its variables are reliable in the light of
existing research and field studies on the dairy industry.
6.5.2 Model Validity
Every research study has a general expectation that its findings will correspond with
reality. It is evident that a focus on validity in QFD related research is absent in the
existing literature. This research study attempted to validate its findings by comparing
the outcomes of one case with another. Two case industries were examined in this
study to validate the results. For example, risk R13 (Hartal and strike cause delay in
work process) was identified as a highly probable risk with high impact by the three
different groups from both industries. These three different groups are employees,
executives and supply chain members. Respondents from these three groups
mentioned R13 in their responses. They also explained how this risk can damage their
current business, when, for instance, employees cannot come to daily work due to
political unrest like hartals and strikes. At the same time, executives cannot get
together in their work to take important and instant decisions, and supply chain
members fail to get their products to the destination. As milk is perishable, it needs
quick processing and quick distribution. But hartals and strikes hamper the physical
distribution of the product. The current study is validated by having similar opinions
from six different groups within the two different case industries. This also proves that
the data is completely biasfree and expresses the real situation of the process.
6.6 ADDRESSING THE RESEARCH QUESTIONS
This section links the discussion of QFD results with the research objectives and
questions. In support of this connection, additional tables are presented.
6.6.1 RESEARCH QUESTION 1: How can sustainability theory be used to
categorise the risks associated with the dairy supply chain in Bangladesh?
The current study has focused on developing and designing appropriate supply chain
risk mitigation strategies for the dairy industry in Bangladesh. In doing so, the study
has identified several risks to the triple bottom line associated with sustainability.
Previous chapters have presented a number of tables to show the existing risks and
their high probability and high impact to the dairy industry. This current section

206
particularly addresses research Question 1 which categorises the risks in the light of
sustainability.
The following discussion presents details of the dairy supply chain risks related to
economic, social and environmental sustainability, and shows how sustainability
theory can be used to categorise the dairy supply chain risks.
In this research the categorisation of risks and outcomes is framed by sustainability
theory (Carter and Rogers 2008b). According to Carter and Rogers (2008b),
sustainability incorporates environmental, social and economic components that allow
an organisation to achieve long term economic viability. Sustainable development is
“development that meets the needs of the present without compromising the ability of
future generations to meet their needs” (WCED 1987, 8). On the other hand, potential
initiatives for reducing long term risks related to resource depletion, fluctuation in
energy costs, pollution and waste management can also be described as sustainability
(Shrivastava 1995). Taking into consideration the three sustainability components, this
research categorised dairy supply chain risks as economic, social or environmental
risks (shown in Table 6.17). This categorisation is useful for developing risk mitigation
strategies which will lead to sustainable outcomes for the dairy sector.

207
Table 6.17: Categorisation of Risks using Sustainability Aspects
Su
sta
ina
bil
ity
A
spe
cts
R1
R2
R3
R4
R5
R6
R7
R8
R9
R1
0
R1
1
R1
2
R1
3
R1
4
R1
5
R1
6
R1
7
R1
8
R1
9
R2
0
R2
1
R2
2
R2
3
R2
4
R2
5
R2
6
R2
7
R2
8
R2
9
R3
0
R3
1
R3
2
R3
3
R3
4
R3
5
R3
6
R3
7
R3
8
R3
9
R4
0
R4
1
R4
2
R4
3
R4
4
R4
5
To
tal
Eco
no
mic
al
Y Y Y Y Y Y Y Y Y Y Y Y Y Y Y Y Y Y Y Y Y Y Y Y 24
So
cia
l
Y Y Y Y Y Y Y Y Y Y Y Y Y Y Y Y 16
En
vir
on
me
nta
l
Y Y Y Y Y 5
Note: This table is generated from table 5.3, 5.4, 5.5, and 5.6 in Chapter 5.

208
Economic Risks Economic risks are associated with fluctuations in the levels of economic activity and
prices (Oxelheim and Wihlborg 1987). The most leading economic risks are price
fluctuations which may arise from changes in the cost of goods (inflation), relative
changes in the prices of inputs such as labour or raw material, and interest rates(Miller
1991). Dairy farmers face different economic risks due to their limited ability to
forecast factors like the high cost of feed and medicine, high interest rates, inadequate
loan facilities, and so on. Dairy farmers in Bangladesh consider the risk of credit
unavailability as another major economic risk in this industry. Credit unavailability is
the fundamental risk troubling the dairy farmers of developing countries (Bardhan et
al. 2006). Credit facilities can play a significant role in overcoming liquidity constraints
to enable dairy farmers to meet operating costs. But credit accessibility for livestock
activities, especially in the dairy industry, is very limited. Moreover, complex loan
procedures, high rates of interest, and cumbersome selection criteria for screening loan
applicants do not allow the dairy industries to benefit from the credit market (Jabbar
2010). 45riskswere identified for the Bangladesh dairy industry (see Table 5.22) and
24 were categorised as economic risks (see Table 6.17).
Table 6.18 lists the economic risks based on the opinions of respondents from different
groups within the case industries. The table shows that R1 to R6, R20 to R22, R26 to
R34 and R39 to R44 were considered to be economic risks. These risks were identified
in the inductive phase (qualitative phase) of this study which was discussed in Chapter
5. They were also identified in the deductive phase of the study through an
examination of the literature. For instance, (R1)‘Inadequate loan facilities ‘was
considered to be an economic risk because farms cannot implement the necessary
processing without having adequate loan facilities. If a farm possesses inadequate loan
facilities, it may fail to adopt the latest technology, such as milking machines, chiller
machines, transport vehicles, and the like. Without such facilities, the farm concerned
will be unable to meet economic goals like appropriate production, profits and
expansions.
(R26) ‘Cattle disease’ is another economic risk which has already been discussed in
Chapter 5. This is considered to be an economic risk based on possible economic losses.
Cattle disease will lessen milk production and increase the mortality of milking cows.
Such losses are directly related to the economic matters of a farm. For this reason,

209
respondents have considered it as an economic risk. Other risks are also categorised as
economic risks and the logic behind this categorisation is detailed in Table 6.18.
Table 6.18: List of Economic Risks
Risk
No.
Risk Name Risk
No.
Risk Name
R1 = Inadequate loan facilities R29 = Accident (Staff injury)
R2 = Complex loan procedures R30 = Inadequate supply of quality feed
R3 = High rate of interest R31 = High cost of feed and medicine
R4 = Inadequate finance R32 = Scarcity of feed
R5 = Absence of insurance or compensation coverage
R33 = Lack of upgrade vaccination and veterinary services
R6 = Shortage of improved technology (Milking machine, feed mixture, grass cutting, improved processing facilities)
R34 = Shortage of land for expanding farm
R20 = Machine damage/breakdown at cold storage
R39 = Accidents of transport vehicle
R21 = Inadequate chilling facilities R40 = Existence of middlemen/ too many middlemen
R22 = Inadequate cold storage R41 = Too long chain cause delay in product movement
R26 = Cattle diseases R42 = Poor conditioned road for moving product (delay & spoilage)
R27 = Machine damage/breakdown at processing unit
R43 = Inadequate transport facilities to move products frequently
R28 = Fire at farm shed R44 = Lack of milk tanker (refrigerated)
Social Risks Social risks are related to legal issues and human resources (Ali and Kapoor 2008).
According to Dunn and Herring (1983), Social risks arise from people’s attitudes,
philosophies and beliefs that are not reflected in the current business practice and
government policy. Government and society are integral parts of social risks (Rao and
Goldsby 2009). In the same literature, terrorism activities are also considered to be
social risks. The key sources of social risk are government rules and regulation, human
resource risk, family issues and unemployment (Ali and Kapoor 2008). Various drivers
of social risks in dairy farming are shown in Table 6.17. The table shows that 16 of the
45 risks are identified as social risks. Social risks were included in the list of identified
risks to the dairy industry presented in Chapter 5 (see Table 5.22). These social risks
are reiterated in Table 6.19.
Table 6.19 shows the social risks which have been identified from respondents’
interviews and later cross-checked with the existing literature. It is always challenging
to match the interview opinions with the literature as different environments have

210
identical situations in regards to social risks. The table shows that R7 to R17, R23, R34
to R37 and R45 were considered to be social risks. They were identified in the
inductive and deductive phases of the qualitative part of this research described in
Chapter 5. Moreover, these risks were also identified through an examination of the
existing literature. For instance, (R12) ‘Poor law and order situation, terrorism,
musclemenship’ is identified as one of the social risks because poor law and order
situations create a number of social risks like terrorism (bribery, forced contributions,
and the creation of panic) and musclemenship (forced to do something illegal).
Moreover, theft, corruption, adulteration and contamination, and deteriorating product
quality are also associated with the same risk. These issues can directly related to
social problems such as losing employment, decreasing income, increasing antisocial
activities, demoralising entrepreneurs, hindering usual supply chain processes,
obstructing middlemen processes and the like.
Table 6.19: List of Social Risks
Risk
No.
Risk Name Risk
No.
Risk Name
R7 = Labour disputes R15 = Corruption (adulteration by mixing
water)
R8 = Illiteracy and inefficiency of worker
R16 = Damage of farm’s assets
R9 = Shortage of skilled staff R17 = Theft
R10 = Switching of staff frequently R23 = Spoilage of milk through improper
handling
R11 = Lack of fixed government policy in dairy sector
R35 = Irregular supply of vaccine from government
R12 = Poor law and order situation (terrorism, musclemen ship)
R36 = Competition among the farms
R13 = Hartal and strike cause delay in work process
R37 = Bureaucratic complexity on maintaining various formalities
R14 = Political Unrest and interference
R45 = Unethical behaviour of middle men (adulteration, added price, deprivation)
(R36) ‘Competition among the farms’ is also regarded as a social risk in both the
qualitative interviews and the literature. For example, if competition among the farms
is intense, farms may fail to achieve their optimum goals including profit maximisation
and cost minimisation. Such problems ultimately create societal problems like
unhealthy competition among the farms and actors on the farms. Such unhealthy
competition leads to deteriorating product quality, employees’ mismanagement, illegal
practices, too much employee switching, sometimes decreased salaries due to
insufficient company profits, and others. The rest of the social risks also have

211
associated reasons for being considered as social risks. Such categorisation is validated
by the literature and higher official interviews. Ultimately, these sixteen social risks are
somehow hindering social activities which create problems for the concerned farms
and prevent them from operating their existing business processes.
Environmental Risks Environmental risks are those which affect the overall activities of an industry due to
weather dependency (Ali and Kapoor 2008). Natural uncertainties are the major
source of environmental risk in the dairy industry. These include various risk sources
such as flood, drought, heavy rainfall, too much humidity and so on. The impact of
environmental risks is one of the serious concerns for the dairy industry as it can
hardly be controlled. These risks can extremely impair a farm’s activities and reduce
overall farming production (Miller 1991). In this research, the literature review and
consultation with industry stakeholder’s found five environmental risks (see Table
6.17). The leading environmental risk sources in dairy production included ‘natural
uncertainties (storm, excessive rain, flood)’ (R18), ‘quick perishability of milk’ (R19),
‘bacterial contamination caused by improper temperature’ (R24), ‘pollution and
unhygienic environments’ (R25), and ‘drought’ (R38).
Risk (R18) ‘natural uncertainties (storm, excessive rain, and flood)’ is considered to be
one of the major environmental risks which directly damage dairy farms in Bangladesh.
Bangladesh is a country with a high prospect of natural disasters such as floods,
storms, cyclones, high tides and excessive rains). Dairy housing, cattle management,
and the supply chain network are hampered by natural disasters like excessive rainfall,
floods, too much humidity and sudden storms. In addition, dairy farming depends on
green grass which farms manage through Napier grass cultivation in enclosed lands.
This hybrid grass cultivation is hindered by natural disasters which ultimately affect
dairy production and cattle health. Furthermore, the possibility of dairy diseases
increases at post-natural disasters. Thus, above discussions attempted to response the
first research question which categorise the dairy supply chain risks in light of
sustainability theory.
6.6.2 RESEARCH QUESTION 2: What are the optimal strategies to mitigate the
highly probable and high impact risks to the dairy supply chain in Bangladesh?
This particular section discusses optimal mitigation strategies for highly probable and
high impact risks to the dairy supply chain in Bangladesh. The second research

212
question aims to find most suitable mitigation strategies for the existing dairy supply
chain risks. Previous QFD analyses found many risks and mitigation strategies with
high relationship scores and ranked them in order of priority. Obviously, the highest
REL score suggests the most suitable strategies to be implemented to mitigate
particular risks. It is quite impossible for a farm to mitigate all of the risks by
implementing each and every strategy. It is not also justifiable due to budget
constraints and the scope of the farms.
In this situation, this research identifies the most important and well-ordered
mitigation strategies which can be implemented. Priority is given to REL scores of five
(5.00) and above. Table 6.20 lists mitigation strategies and related risks where the
relationship score is five and above. This particular section considers highly probable
and high impact risks (see Section 6.2) and optimum mitigation strategies (see Section
6.4). After scrutiny of risks and mitigations strategies, the researcher found four risks
and five mitigation strategies with REL scores of five and above. This means that there
are five different relationships (indicating a strong match between risk and mitigation
strategy) that need to be implemented as soon as farms can get the opportunity.
Table 6.20 shows the top most highly probable and high impact risks that can be
mitigated through highly related mitigation strategies. For instance, R3 (High rate of
interest) can be mitigated appropriately through strategy S7 (Assurance of adequate
institutional credit support with low rate of interest) at different levels of budget
except 20% budget. This means that a 20% budget cannot mitigate that risk, but it can
be mitigated under any other circumstances. On the other hand, risk R8 (Illiteracy and
inefficiency of worker) can be mitigated through the S3 (Hiring skilled staff) and S14
(Arrangement of proper training to the staff regarding processing and hygiene
management) mitigation strategies. However, although risk R8 can be mitigated
through Strategy S14 at any level of budget from 10% to 100%, in the same
circumstances, S3 cannot be applied at the 10% budget level. Therefore, decision
makers will choose the strategy that can be implemented at maximum level of budget
for their convenience.

213
Table 6.20: Optimal Strategies to Mitigate Highly Probable and High Impact Risks
(Nahar Employees)
High Probable and High Impact Risks
Highly related Strategies
Optimisation Results
R3 S7 S7 is selected at any budget level except 20% of budget
R5 S2 S2 is selected at any budget level except 30%,20% and 10% of budget
R8 S3, S14 S3 is selected at any budget level except 10% of budget S14 is selected at any budget level within 10% to 100%
R13 S5 S5 is selected at any budget level except 20% and 10% of budget
Nahar executives identified four different risks (highly probable and high impact) that
can be mitigated through nine different mitigation strategies. Table 6.21 shows that R5,
R11, R13 and R40 are rated as highly probable and high impact risks. At the same time
these four major risks can be resolved by implementing mitigation strategies S2, S5, S6,
S11, S25, S31 and S32. Farm executives have confidence in implementing these seven
strategies to mitigate four major risks. They believe that R5 can be mitigated through
implementing (S2)‘Buying insurance against production loss’ and (S6)‘Implementation
of fixed policy in dairy sector’. These risks are related to insurance compensation, lack
of suitable policies and political events like hartals and strikes. The farm executives
also gave a high score to(S31)‘Removal of unnecessary influence of middlemen’ to
mitigate (R40)‘Too many middlemen’. This means, both the middlemen related risks
can be resolved through eliminating redundant middlemen. For illustration, risk R40
can be mitigated through strategies S11, S25, S31 and S32 at different levels of budget.
S31 can resolve R40 at the maximum point of budget from 10% to 100%. On the other
hand, (R13) ‘Hartal and strike cause delay in work process’ can be mitigated through
(S5) ‘Initiative to remove political uncertainty’ and (S6) ‘Implementation of a fixed
policy for dairy sector’, both of which can be implemented at every level of budget of
10% to 100%. This means that executives will prefer S5 and S6 as these can be
implemented without taking further consideration of budget deficiency.

214
Table 6.21: Optimal Strategies to Mitigate Highly Probable and High Impact Risks
(Nahar Executives)
High Probable and High Impact Risks
Highly related Strategies
Optimisation Results
R5 S2, S6
S2 is selected at any budget level except 10% of budget S6 is selected at any budget level within 10% to 100%
R11 S6 S6 is selected at any budget level within 10% to 100%
R13 S5, S6 S5 and S6 are selected at any budget level within 10% to 100%
R40 S11, S25, S31
and S32
S11 is selected at any budget level except 40%, 30%, 20% and 10% S25 is implemented at any budget except 40%, 20% and 10% S31 is implemented at any budget level within 10% to 100% S32 is implemented at any budget level except 20% and 10%
Table 6.22 shows the opinions of supply chain members relating to the most highly
probable and high impact risks which can be mitigated through highly relevant
mitigation strategies. For example, (R13) ‘Hartal and strike cause delay in work
process’ can be mitigated effectively through Strategy S5 at every point of budget of
10% to 100%. The same thing applies to risk (R14) ‘Political unrest and interference
‘which can also be mitigated by (S5) ‘Initiative to remove political uncertainty’ at all
levels of budget. These strategies are suitable for the industry and can be easily applied
under any circumstances without having a second thought. On the other hand,
(S17)‘Strengthen the regular supply of vaccine’ can mitigate (R26)‘Cattle diseases’ at
diverse levels of budget. However, (S2) ‘Buying insurance against production loss’,
(S15) ‘Attempts to create various cross breeds by adopting AI services’, (S22)
‘Arrangement of regular vaccination for the cattle’ and (S23)‘Arrangement of improved
and upgraded veterinary services can mitigate risk (R26) ‘Cattle diseases’ at selected
levels of budget. In this situation, industry will consider relevant mitigation strategies
that can be implemented at every level of budget. Later, they will start considering
minimum to maximum amount of budget availability to implement such strategies to
overcome various risks. Therefore, supply chain members will indicate those strategies
which can be executed at minimum level of budget for their suitability.

215
Table 6.22: Optimal Strategies to Mitigate Highly Probable and High Impact Risks
(Nahar SC members)
High Probable and High Impact Risks
Highly Related Strategies
Optimisation Results
R13 S5 S5 is implemented at any budget level within 10% to 100%
R14 S5 S5 is implemented at any budget level within 10% to 100%
R26 S2,S15, S17,
S22, S23
S2 is implemented at any budget level except 30%, 20% and 10% of budget S15 is implemented at 100%, 90% and 80% of budget. S17 is implemented at any budget level within 10% to 100% S22 is implemented at any budget level except 20% and 10% of budget S23 is implemented at any budget level except 30%, 20% and 10% of budget
R44 S28 S28 is implemented at any level except 40%, 30%, 20% and 10% of budget
Paharika employees (see Table 6.23), like Nahar employees, consider their choices of
strategies to mitigate risks and they suggest that (R5)‘Absence of insurance or
compensation coverage’, (R1)‘Hartal and strike cause delay in work process’ and
(R14)‘Political unrest and interference’ are mitigated by (S2)‘Buying insurance against
production loss’ and (S5)‘Initiative to remove political uncertainty’ respectively. These
strategies can be implemented at various levels of budget from 20% to 100% but they
are not suitable for 10% level of budget. Strategy S7 (Assurance of adequate
institutional credit support with low rate of interest) can resolve the problem of risk
(R3) ‘High rate of interest’. This how, Paharika employees provided their opinion
relating to highly probable and high impact risks that can be eliminated through
different mitigation strategies.
Table 6.23: Optimal Strategies to Mitigate Highly Probable and High Impact Risks
(Paharika Employees)
High Probable and High Impact Risks
Highly Related Strategies
Optimisation Results
R3 S7 S7 is implemented at any budget level except 20% and 10% of budget
R5 S2 S2 is implemented at any budget level except 10% of budget
R13 S5 S5 is implemented at any budget level except 10% of budget
R14 S5 S5 is implemented at any budget level except 10% of budget

216
Table 6.24 shows that Paharika executives have chosen highly related mitigation
strategies to alleviate the various existing risks. (R34) ‘Shortage of land for expanding
farm’ can be mitigated through (S16) ‘Lease abandoned land to the farmers for dairy
farming’ and (S24) ‘Building multi-storeyed complex for farm extension’. The QFD
analysis shows that S16 can be implemented to mitigate R34 at any level of budget,
whereas S24 can be implemented only at 100%, 90% and 80% of budget level. This
means that S24 takes more budget than S16 to resolve the issue of R34. (S7) ‘Assurance
of adequate institutional credit support with low rate of interest’ and (S8) ‘Introducing
off-farm activities; can be deployed to mitigate R3 ‘High rate of interest’. S5 ‘Initiative
to remove political uncertainty’ and S2 ‘Buying insurance against production loss’ can
be deployed to mitigate risks (R5) ‘Absence of insurance or compensation coverage’
and (R13) ‘Hartal and strike cause delay in work process’ respectively. Paharika
executives delivered their opinion relating to highly probable and high impact risks
that can be eliminated through different mitigation strategies at various level of
budget. But according to them that S8 and S16 are the most optimal mitigation
strategies as these two could be implemented at any budget level from 10% to 100%.
Table 6.24: Optimal Strategies to Mitigate Highly Probable and High Impact Risks
(Paharika Executives)
High Probable and High Impact Risks
Highly Related Strategies
Optimisation Results
R3 S7, S8 S7 is implemented at any budget level except 30% and 10% of budget S8 is implemented at any level except 50%, 40%, 30%, 20% and 10% of budget
R5 S2 S2 is implemented at any level except 30%, 20% and 10% of budget
R13 S5 S5 is implemented at any level except 10% of budget
R34 S16, S24 S16 is implemented at any level of budget S24 is implemented at only 100%, 90% and 80% of budget
Table 6.25 shows responses from Paharika supply chain members concerning their
selections of highly related strategies to mitigate risks. The table shows that (R13)
‘Hartal and strike cause delay in work process’ and (R14) ‘Political unrest and
interference can be mitigated through (S5) ‘Initiative to remove political uncertainty’ at
any level of budget (10-100%). (S31) ‘Removal of unnecessary influence of middlemen’
and (S32) ‘Direct marketing’ can mitigate (R45) ‘Unethical behaviour of middle men
(adulteration, added price, deprivation)’ at all levels of budget. Paharika supply chain

217
members selected S5 as the most optimal mitigation strategy, because this strategy is
applicable at all budget levels to mitigate two different highly probable risks with high
impact.
Table 6.25: Optimal Strategies to Mitigate Highly Probable and High
Impact Risks (Paharika SC Members)
High Probable and High Impact Risks
Highly Related Strategies
Optimisation Results
R13 S5 S5 is implemented at any level of budget
R14 S5 S5 is implemented at any budget level R45 S31, S32 S31 is implemented at any budget level
S32 is implemented at any budget level
In short, the groups of employees, executives and supply chain members of Nahar and
Paharika selected different mitigation strategies to mitigate various risks. Later, QFD
analyses determined the budget and found the strategies appropriate for different
levels of budget. Obviously, decision makers will choose optimal strategies which can
be implemented at all levels of budget due to monetary constraints. Nevertheless, there
are number of risks and strategies which gained REL scores below six. This does not
mean that those strategies cannot be implemented to alleviate a few risks. This
research has only discussed highly prioritised strategies to mitigate related risks. If a
farm can manage funds to implement all the strategies, they can implement other
strategies as well. This section has discussed Research Question 2 which is concerned
with identifying optimal mitigation strategies to alleviate related highly probable and
high impact risks to the dairy supply chain. Above discussions were answered the
research question two through describing the relevant strategies to mitigate the highly
probable and high impact risks within the dairy supply chain.
6.6.3 RESEARCH QUESTION 3: What are the probable outcomes of implementing
the mitigation strategies at the organisation level?
A good performance outcome is the result of effective and efficient management
(Ritchie and Brnidley 2007b). This section provides detailed results of probable
outcomes after implementing particular strategies to mitigate different supply chain
risks. As mentioned in Section 5.3.5.1, this research measures outcomes in terms of
economic, social and environmental sustainability. Based on the RI values of different
economic, social and environmental outcomes, all the results for Nahar and Paharika
Dairies are ranked twice. The integrated approach and the segmented approach are
employed to prioritise the outcomes in two different ways. Integrated ranking grades

218
the results collectively (see Table 6.26) and segmented ranking grades them in terms of
specific aspects of sustainability (see Table 6.27). The lists for sustainable outcomes
are found from the table 5.37a and 5.37b in chapter 5 (QFD analysis phase 2). A few of
the outcomes carry the same importance to the farm. But a number of outcomes do not
have same importance to the farm due to dearth of substantial benefits. An individual
farm will implement these strategies based on prioritise sustainable outcome
according to their urgency.
Table 6.26: Overall Ranking of Sustainable Outcomes
Sustainability Aspects
Sustainable Outcomes
RI Values Order of Importance
Nahar Paharika Nahar Paharika
Economic
Profit maximisation(SO1) 0.11 0.11 2 3 Cost minimisation (SO2) 0.12 0.14 1 2 Increase in personal income(SO3)
0.04 0.03 7 8
Increase in production (SO4) 0.10 0.15 3 1 Product quality improvement (SO5)
0.09 0.08 4 4
Expansion of farming system(SO6)
0.04 0.07 7 5
Production of value added product and diversified product (SO7)
0.04 0.04 7 7
Social
Goodwill enhancement(SO8) 0.08 0.04 5 7 Supply of quality food (SO9) 0.08 0.08 5 4 Nutritional development (SO10)
0.08 0.07 5 5
Improvement of living standard (SO11)
0.02 0.02 8 9
Creation of employment opportunity (SO12)
0.04 0.05 7 6
Environmental
Creation of sound working environment (SO13)
0.06 0.02 6 9
Waste management (SO14) 0.02 0.03 8 8 Health improvement of cattle(Animal Quality) (SO15)
0.09 0.07 4 5
Integrated Approach
In the integrated approach, outcomes are ranked with all three aspects of sustainability
combined (see table 6.27). Nahar has given top priority to the outcome SO2 ‘Cost
minimisation’ with an RI value of 0.12, but Paharika has identified SO4 ‘Increase in
production’ as the top most achievable outcome with an RI value of 0.15. In fact, the
two case farms have given identical responses in regard to sustainable outcomes and
their priority to work on their own farm. Initially, Nahar gave top ranking to cost
minimisation which is logical in terms of their existing operation. They have moderate
production with a big market share and they are focusing on minimising the cost so

219
that profit can be maximised. On the other hand, Paharika is lagging behind optimum
production and they desire to increase production so as to maximise their market
share.
Table 6.27: Segmented Ranking of Sustainable Outcomes
Sustainability Aspects
Sustainable Outcomes RI Values Order of Importance
Nahar Paharika Nahar Paharika
Economic
Profit maximisation(SO1) 0.11 0.11 2 3 Cost minimisation (SO2) 0.12 0.14 1 2 Increase in personal income(SO3)
0.04 0.03 5 7
Increase in production (SO4) 0.10 0.15 3 1 Product quality improvement (SO5)
0.09 0.08 4 4
Expansion of farming system(SO6)
0.04 0.07 5 5
Production of value added product and diversified product (SO7)
0.04 0.04 5 6
Social
Goodwill enhancement(SO8) 0.08 0.04 1 4 Supply of quality food (SO9) 0.08 0.08 1 1 Nutritional development (SO10)
0.08 0.07 1 2
Improvement of living standard (SO11)
0.02 0.02 3 5
Creation of employment opportunity (SO12)
0.04 0.05 2 3
Environmental
Creation of sound working environment (SO13)
0.06 0.02 2 3
Waste management (SO14) 0.02 0.03 3 2 Health improvement of cattle(Animal Quality) (SO15)
0.09 0.07 1 1
Nahar identified SO1 ‘Profit maximisation’, but Paharika consider this to be the third
most achievable outcome. Paharika considered outcome SO2 as the second most
achievable outcome, but that was ranked as the most achievable outcome by Nahar
Dairy. Paharika Dairy considered ‘Production increment’ (SO4) to be the most
achievable outcome but Nahar Dairy expressed a different opinion by ranking this as
the third most achievable outcome. Both dairies have chosen similar outcomes but
they ranked them in different ways. Different opinions were given in light of individual
farm situations, needs and priorities.
Both dairies agreed on ordering the outcomes SO5 ‘Product quality improvement’,
SO10 ‘Nutritional development’, SO7 ‘Production of value added product and
diversified product’, and SO14 ‘Waste management’. The order of importance of these
outcomes was 4, 5, 7 and 8 respectively. These four outcomes are an integral part of a

220
sustainable modern dairy industry. Product quality and nutritional value are especially
important with regard to dairy products. Furthermore, dairy generates huge wastes
which need to be reused and recycled to reduce waste hazards and make additional
by-products to achieve greater profitability.
It can be seen from Table 6.26 that the dairies differ significantly in their opinions
regarding the achievement of outcome SO13 ‘Creation of sound working environment’.
Nahar Dairy ranked SO13as sixth with an RI value of 0.06, whereas Paharika Dairy gave
it the lowest possible ranking with an RI value of 0.02. Nahar is more optimistic than
Paharika regarding the achievement of this outcome. The reason for this is that Nahar
has already adopted such measures to create a sound working environment whereas
Paharika is still struggling to accomplish this outcome. In reality, Nahar Dairy has
efficiently adopted improved technologies and hired more skilled staff than Paharika
Dairy.
Segmented Approach
The segmented approach is used to order the outcomes in respect of the three aspects
of sustainability: economic, social and environmental (see Table 6.27). Individual
aspects of sustainability are considered to rank the outcomes. So the outcomes are
ordered discretely under economic, social and environmental issues. The results of this
prioritisation are discussed as follows:
Economically Sustainable Outcomes
The results of the QFD analysis show that for Nahar Dairy, the most achievable of all
the economic outcomes is ‘Cost minimisation’ (0.12). The second most achievable
economic outcome is SO1‘Profit maximisation’ (0.11). Respondents identified (SO4)
‘Increase in production’ (0.10) as the third most achievable outcome. It is also observed
that, among all the economic outcomes, ‘Increase in income’ (SO3), ‘Expansion of
farming system’ (SO6) and ‘Production of value added product and diversified product’
(SO7) have the same rating of importance, which is 0.04.
In practice, outcome scores of seven and above are intricately related to economic
issues which can help achieve economic sustainability. For example, if a farm can
minimise its costs, this will directly influence the economic status of that farm. A farm
can minimise its costs through reducing feed costs, controlling middlemen influences,
hiring skilled staff and the like. On top of that, direct government help through fixing
appropriate policies and improving roads and highways can reduce farm costs as well.

221
The QFD analysis shows that ‘Increase in production’ (SO4), ‘Cost minimisation’ (SO2)
and ‘Increase in income’ (SO3) are the top three achievable economic sustainable
outcomes for Paharika Dairy. Paharika Dairy identified SO4 (0.15) as the top most
achievable economic outcome, whereas Nahar Dairy identified (SO4) as the third most
achievable outcome. As the second most achievable economic outcome, Paharika Dairy
identified SO2 (0.14) while Nahar Dairy identified SO1. As the third most achievable
economic outcome, Paharika Dairy identified SO1 (0.11) whereas Nahar Dairy
identified SO4 (0.10).
Both dairies are in agreement regarding the achievement of outcomes SO5 and SO6.
Although the RI values differ, the order of importance is same for these outcomes.
Product quality improvement (SO5) and expansion of farming system (SO6) have
acquired the same order of importance which is 4 and 5 respectively. For example,
product quality improvement and expansion of farm are strategies that must be
adopted if possible. It is quite impossible for farms to survive in a competitive
environment without expanding individual farms and making product improvements.
In practice, production can be increased through expanding a farm and this may result
in sustainable economic outcomes for the concerned farm and its stakeholders.
The two dairies had different opinions regarding the achievement of outcomes SO3
‘Increase in personal income’ and SO4 ‘Increase in production’. Nahar Dairy prioritised
SO3 as fifth while Paharika Dairy ranked it as seventh in order of importance. Likewise
SO4 was considered by Paharika to be the most achievable economic outcome but it
was considered by Nahar to be the third most achievable outcome. For instance, Nahar
observed that they may increase staff salaries once they can maximise profits or
minimise costs. On the other hand, Paharika did not show a similar intention to
increase staff’s personal income.
Social Sustainable Outcomes
Regarding social sustainable outcomes, Nahar Dairy has graded three social outcomes
with the same rating of importance (Table 6.27). These outcomes are ‘Goodwill
enhancement (SO8)’, ‘Supply of quality food (SO9)’ and ‘Nutritional development
(SO10)’. The RI value collected from the QFD analysis (Table 5.38) of all three
outcomes is 0.08. So these three outcomes are considered to be the most achievable
social outcomes. ‘Creation of employment opportunity (SO12)’ and ‘Improvement of
living standard (SO11)’ hold the second and third highest degrees of relative
importance which are 0.04 and 0.03 respectively. Thus Nahar consider SO12 and SO11

222
to be the second and third most achievable social outcomes respectively. For instance,
‘Enhanced goodwill’ (SO8) can provide societal benefits such as social status, increased
respectability, remuneration and employment guarantee for the related stakeholders.
On the other hand, ‘Employment creation’ (SO12) and ‘Living standard improvement’
(SO11) are the second and third most achievable outcomes for the dairy industry. If a
dairy farm is expanded from time to time, it can employ more people and increase their
living standard, which is a positive social outcome.
Paharika (Table 6.27), it is obtained from QFD analysis that (see the table 5.39) the top
most achievable social outcome is ‘Supply of quality food’ (SO9) with the highest RI
value of 0.08. SO10 ‘Nutritional development’ is considered to be the second most
achievable social outcome with the second highest RI value of 0.07. The third most
achievable social outcome is ‘Creation of employment opportunity’ (SO12) with the
third highest RI value of0.05. In reality, quality food supply will have a great impact
resulting in societal outcomes like a healthier society, nutritional improvement and
superior quality food.
In comparison, Nahar identified three social outcomes (SO8, SO9 and S010) with the
same RI value of 0.08 which are considered to be the most achievable outcomes.
However, Paharika gave top priority to SO9 (0.08) and SO10 (0.07) and SO12 (0.05)
which are ranked the second and third most achievable social outcomes respectively.
Both dairies agreed that ‘Improvement of living standard’ (SO11) is the least
achievable social outcome resulting from the application of suggested mitigation
strategies. Although the RI value of SO11 of 0.02 is the same for both dairies, they
ranked SO11 differently. Nahar ranked it as the third most achievable social outcome
while Paharika ranked it as the fifth most achievable social outcome.
Environmentally Sustainable Outcomes
With regard to environmentally sustainable outcomes, results obtained from the QFD
analysis, show that Nahar Dairy (see Table 6.22) identified ‘Health improvement of
cattle (Animal Quality) (SO15) as the most achievable outcome from among all the
possible environmentally sustainable outcomes. For instance, animal quality results in
improved genetics as well as increased production. If one milking cow produces three
times as much milk as a normal breed animal, the environment can be better managed
within that farm, because of the savings on space and food. Such genetics can lower the
burden on the surrounding environment of the farm. The highest RI value for
environmental sustainability, which is 0.09, is given to outcome SO15. ‘Creation of

223
sound working environment ‘(SO13), with an RI value of 0.06, is considered to be the
second most achievable environmental outcome. ‘Waste management’ (SO14) with an
RI value of 0.02, is identified by Nahar as the third lowest and least achievable
environmental outcome. Waste management is a very important matter in modern
society. Dairy wastes can be used to make further by-products, including biogas,
fertilisers, fish feed and artificial burning appliances.
In contrast, Paharika Dairy gave the highest RI value (0.07) toSO15. This implies that
‘Health improvement of cattle (Animal Quality)’ (SO15) is the most achievable
environmental outcome likely through applying the recommended mitigation
strategies. ‘Waste management’ (SO14) holds the second highest RI value (0.03) which
identifies it as the second most achievable environmental outcome. Lastly, SO13
‘Creation of sound working environment’ with the lowest RI value of 0.02, is identified
by Paharika Dairy as the least achievable environmental outcome. Implementation of
SO13 would improve the working environment through hygiene atmosphere,
cleanliness and disease control management.
There is no significant difference between the opinions of Nahar and Paharika Dairies
regarding the achievement of environmental outcomes. Although the RI values given to
SO13 are quite different, their order of importance is the same, at second and third
respectively. Nahar identified outcome SO13 (0.06) as the second most achievable
environmental outcome, whereas Paharika saw it as the least achievable
environmental outcome with an RI value of 0.02. Both dairies identified outcome
(SO15) as the top most achievable environmental outcome.
6.7 SUMMARY
This chapter discussed the findings which were based on the combination of literature
review and QFD analysis on dairy supply chain risk mitigation management. The
clarification of the findings has been carried out to support the research questions. The
findings reveal that real-life dairy supply chains could achieve sustainability if dairy
farms were to implement the suggested mitigation strategies. Sometimes, a maiden
strategy implementation can mitigate more than one risk for the dairy industry in
Bangladesh. Finally, this chapter has provided a guideline for adopting appropriate
strategies to mitigate possible risks and enhance economic, social and environmental
sustainability. The following chapter provides concluding remarks and future
directions arising from the current research.

224
CHAPTER 7:
CONCLUSIONS AND FUTURE RESEARCH DIRECTIONS
7.1 INTRODUCTION
The final chapter of this thesis recaps all the research that has been conducted to
complete this study. A review of the literature revealed that the Quality Function
Deployment (QFD) technique has not been used in dairy supply chain risk management
to date. The literature was reviewed and practical interviews were conducted to
identify existing supply chain risks. Subsequently, QFD played a vital role in identifying
high impact and highly probable risks and strategies for their mitigation. After
undertaking a through literature review regarding various theoretical and industrial
aspects of the research problem, the next section provides a summary of the research
questions and objectives.
The research theme, methodology, analysis, results and discussion are also included in
this section. To conduct this research, in-depth interviews were undertaken with
different stakeholders of two case industries to identify different supply chain risks
and risk mitigation strategies, along with different possible outcomes after
implementing the various risk mitigation strategies in the dairy industry (Chapter 5).
The qualitative interviews were employed to contextualise the factors and variables in
the current settings. Based on the findings of the qualitative interviews and the
literature, different supply chain risks, risk mitigation strategies and possible
sustainable outcomes (associated with Bangladesh dairy sector) were identified. Later,
quantitative data was collected through a questionnaire survey for QFD analysis to
ascertain probability and impact ratings of risk, relationship ratings of risk and
mitigation strategies, and relative cost for implementing each strategy. The data from
the questionnaire survey were analysed using the QFD (Quality Function Deployment)
technique.
Data related to probable sustainable outcomes were also collected through the
questionnaire survey. Later these data were analysed using the networked QFD
technique. The findings of the literature review and an analysis of the qualitative data
and quantitative data were presented in Chapter 5. A brief discussion of the analysis
was presented in Chapter 6. How the research findings contribute to existing
knowledge in terms of methodology, theory and practice are also addressed in this

225
chapter and the implications and limitations of the study are highlighted. In the final
section, several ideas for future research are outlined.
7.2 SUMMARY OF THE RESEARCH
There is a genuine lack of empirical studies on supply chain risk management, and even
more so in relation to the dairy supply chain. The dairy industry in Bangladeshis a
major sub-sectors which serves to alleviate poverty and create employment and thus
contributes to the economic and social development of the country. In spite of having
such great potential, the dairy industry has not attracted much attention from
academics or government officials from the beginning. Most of the dairy industries in
Bangladesh face various risks associated with feed, breed, land scarcity, diseases,
logistics facilities and many others arising from economic, social, political, and
environmental issues. In recent years, although supply chain risk management is a
burning issue, very limited study has been conducted in this field, especially in the
Bangladesh context. Till now, very few studies have been conducted in relation to the
basic components of the dairy industry in Bangladesh and discussion has been
confined to dairy production, consumption and marketing in Bangladesh (Halder and
Barua 2003), policy barriers for the dairy value chain (Jabbar 2010), problems and
prospects of smallholder dairy production (Singh and Pandir 2001), feeding strategy
for dairy development (Khan, Peters and Uddin 2009), social gains from dairy
development (Haque 2009) and vertical integration in the Bangladesh dairy sector
(Raha and Talukder 2004).
In recent years, the Bangladesh dairy industry has developed significantly with a
systematic production process within a commercial environment. New entrepreneurs
are becoming involved in small scale dairy farming in urban and peri-urban areas
(Saadullah 2001; Imtiaz and Rana 2014; Rahman 2014). The dairy industry contributes
significantly towards the country’s GDP. This sector is also an important and growing
sector of Bangladesh’s economy, which is increasingly proving to be a worthwhile
livelihood option for a large number of households engaged in milk production and
trade.
The dairy sector in Bangladesh is well integrated into the mixed farming system
(Saadullah 2001; Devendra and Thomas 2002; Imtiaz and Rana 2014). Cattle are
reared not only for eating purposes but also to earn cash through selling a variety of
products like milk, milk made products, meat, manure and skin (Ahuja and Redmond

226
2004; Sultana 2002; Rahman 2014). Although the dairy sector contributes significantly
to the economic development of Bangladesh, there are still some risks associated with
this sector which handicap its growth and development. The development, structure,
risk, scope and contribution of the Bangladesh dairy industry were discussed in
Chapter 2. Chapter 2 also described the research case industry operation. The
description is also presented the Bangladesh dairy operation and case industry
operation to this thesis.
The intention and uniqueness of this research is expressed in Chapter 2 based on its
importance for filling the gap in the current literature and practice. The scope and
focus of the research are also included in that chapter to highlight the boundaries of the
current research. The research objectives and research questions were also included,
together with an explanation of the reasons for taking this particular research
direction. Then the relevant literature was reviewed in Chapter 3 to identify the
research gap. At the same time the aptness and the worthiness of the current research
were discussed in light of the research gap.
In terms of methodology, this research took a mixed methods approach that combined
both qualitative and quantitative methods in a three-phase data collection process (as
described in Chapter 4). A rigorous research process was also described in that chapter
(see Figure 4.2). The research employed a Quality Function Deployment (QFD)
technique using a quantitative approach which was also detailed in the methodological
section of the thesis. The first phase involved qualitative research designed to identify
different risks existing at the storage, processing and distribution levels of the dairy
supply chain, various possible mitigation strategies to mitigate those risks, and
different probable outcomes. Data gathered from the in-depth interviews were
combined with data from the literature review collected by means of content analysis
(as described in chapter 5).
The quantitative phase of the research involved the development and administration of
the questionnaire for the research survey with a view to collecting data for QFD
analysis (as described in Chapter 4). After obtaining the required data, different
matrices for QFD analysis were developed. Later, the calculations for the quantitative
analysis were made, as described in Chapter 5. The QFD analysis revealed that
additional research was required to identify the sustainable outcomes referred to in
the research question. This requirement led to the third phase of the research.

227
Telephone interviews were conducted to gather in-depth knowledge about the
probable sustainable outcomes after applying different optimal mitigation strategies
(as described in Chapter 5). Overall, the findings identified the prioritised dairy supply
chain risks, important risk mitigation strategies and most realisable sustainable
outcomes (as described in Chapter 6). Chapter 6 focused on discussing the answers to
the research questions one after another with related results from the data analyses.
The reliability and validity of the QFD model were also discussed in this chapter.
7.3 CONTRIBUTIONS OF THE RESEARCH
7.3.1 Theoretical Contributions
This study makes several theoretical contributions. The leading theoretical
contribution refers to the identification of supply chain risks associated with the dairy
sector of Bangladesh in a sustainability context(Carter and Rogers 2008a). The study is
also explored the possible sustainable outcomes of developing risk mitigation
strategies. Such strategies can be helpful for improving farm’s productivity and
efficiency. These variables are related with the contingency theory (Zeithaml,
Varadarajan and Zeithaml 1988b) which can assist to reduce or eliminate dairy supply
chain risks. The study identified 45 supply chain risks of various kinds. Risks were then
categorised in terms of different operational levels, such as storage, processing and
distribution. Such categorisation of risks helped the researcher to identify the most
problematic areas at different levels. Categorised risks were then sub-categorised in
terms of the three aspects of sustainability: economic, social and environmental. Later
these risks were arranged according to their high probability and high impact on
existing operations.
The second theoretical contribution of this study is to develop a Quality Function
Deployment (QFD)-based supply chain risk mitigation model for the Bangladesh dairy
industry. By employing QFD analysis, this research was able to categorise different
risks to the dairy supply chain that are highly probable with high impact. The
effectiveness of risk mitigation strategies in terms of budget constraints was also
revealed through the use of the Quality Function Deployment (QFD) tool and the
possible sustainable outcomes were determined using networked QFD. So this
research is a comprehensive version of real-life practice in mitigating different dairy
supply chain risks by applying effective and appropriate mitigation strategies that
bring sustainable benefits for the farmers, society and the environment. This study
incorporates scattered risks and their suitable mitigation strategies into one

228
framework for the sake of better risk management which, in turn, leads to better
productivity.
Another contribution of this study is the confirmation of a number of important risk
factors and mitigation strategies associated with dairy supply chain risk management.
The risk factors were classified according to sustainability theory and these were
separated according to individual sectors, such as risks in the storage sector, risks in
the processing sector and risks in the distribution sector. Risks common to all sectors
and risks specific to each individual sector were also included in the study. The
mitigation strategies were also classified in the same way. This study also contributes
by revealing sustainable outcomes that could be achieved through the application of
different risk mitigation strategies. The different kinds of risk include financial,
technological, human resource, political and natural risks. The risk mitigation
strategies consist of training management, breed management, diseases management,
infrastructural support and government support. The model is unique in the sense that
the factors and variables of risk, mitigation strategies and outcomes have been
identified and finalised from data from a qualitative field study together with previous
literature. Thereby, this study contributes to the body of knowledge as there is no
previous research on dairy supply chain risk mitigation that identifies the supply chain
risks in terms of sustainability and simultaneously explains the possible mitigation
strategies for different risks along with probable sustainable outcomes. This massive
interaction of risks, risk mitigation strategies and sustainable outcomes had not been
found in any previous research. Thus this specific contribution enriches the relevant
knowledge of Bangladesh dairy supply chain risk management.
Finally, the use of the Quality Function Deployment (QFD) technique in this study
enables identification of the highly probable and high impact risks, most important
mitigation strategies to reduce or mitigate those risks, and most achievable sustainable
benefits from mitigating those risks. This model also reflects the budget constraints
that must be considered when applying different risk mitigation strategies, especially
in case of dairy supply chain risk mitigation in Bangladesh. This technique can track
possible disasters in time by identifying upcoming risk and by adopting a preventive
approach in advance. By doing so, the dairy industry can avoid financial losses and take
care to identify possible risks in different sectors (storage, processing, and
distribution). In this way the QFD-based model for dairy supply chain risk mitigation
adds to knowledge about prediction in an unpredictable situation.

229
7.3.2 Practical Contribution
This study makes some specific contributions to real life practice for the dairy industry
in Bangladesh. The following sections underline the practical contribution of this study.
Firstly, the study contributes to the Bangladesh dairy industry in terms of risk
identification. The research showed that the Bangladesh dairy industry is still
unstructured due to several risks which hinder its growth and development. This
suggests that dairy industry stakeholders need a structured and effective approach for
identifying dairy supply chain risks. In the context of this research, dairy supply chain
risks embedded in storage, processing and distribution are identified in view of their
economic, social and environmental aspects. The economic risks come from shortage of
funds; the social risks arise from the influence of social pressure; and environmental
risks come from natural uncertainties. All possible risks are gathered and analysed in
this study. Furthermore, these risks are also categorised on the basis of their high
probability and high impact. Therefore, not only in the dairy industry, but in any other
livestock industry, concerned authorities may consider the findings of this study useful
as a guide to identify possible risks for specific levels.
Secondly, the study explored the possible strategies to mitigate the risks related to the
dairy industry in Bangladesh. Using the QFD approach, these strategies were also
analysed in relation to their budget constraints. The optimum mitigation strategies
according to the opinion of different stakeholders (employees, executives and supply
chain members) were determined from this analysis. Thus it is expected that practical
application of the study contributes significantly to the dairy sector of Bangladesh in
terms of planning and determining appropriate and effective strategies to mitigate
existing or potential risks.
Thirdly, a number of sustainable outcomes are also identified from the findings of this
study. The most realisable outcome through implementation of mitigation strategy is
traced out with the help of QFD analysis. For example, cost minimisation is identified as
the most attainable economic outcome where supply of quality food is fixed as the most
realisable social outcome. Improvement of animal health is identified as the most
attainable environmental outcome. These sustainable outcomes could be achieved
through mitigation strategy implementation. So the outcomes of this research will
benefit the dairy stakeholders, supply chain members, the concerned livestock ministry
and officials by providing ideas for realisable sustainable outcomes.

230
Fourthly, the dairy supply chain risk mitigation model has become the top priority for
the case industries to implement within their supply chain network. The QFD
technique is an effective way to track the most important strategies for mitigating
highly probable and high impact risks in the dairy supply chain. The industry can
identify potential risks in advance and can adopt time-based strategies to mitigate
different risks associated with this industry’s storing, processing and distributing
activities. Such a facility would help the industry to improve productivity by achieving
sustainable growth.
Finally, the research model can generate a clear idea of different risks in the dairy
supply chain, possible strategies for mitigating those risks, along with probable
sustainable outcomes. Thus, if the model is applied to dairy practice, decision making
will be easy and smooth. Prediction can assist the relevant authorities to identify
different dairy risks and help them to prepare themselves in order to prevent or lessen
the effects of those risks by taking proper time-based decisions.
7.4 IMPLICATIONS FOR THE DAIRY INDUSTRY AND POLICY MAKERS
The major implication of this research is its practical implementation and
interpretation by the dairy stakeholders, policy makers, concerned livestock ministry
and officials. The practice of supply chain risk management is still a very new concept
in the Bangladesh dairy sector. Many companies in Bangladesh are not even serious
about the formal management of their supply chain. The findings of this research will
contribute to the dairy supply chain process by identifying the existing risks embedded
in the dairy sector. The research identifies different categories of dairy supply chain
risk in Bangladesh and emphasises categorising highly probable and high impact risks,
along with suggesting effective mitigation strategies. Therefore the practical
application of this research will contribute significantly to the dairy sector of
Bangladesh in terms of taking the decision to mitigate the existing risks. The outcomes
of this study will benefit the dairy stakeholders, supply chain members, concerned
authorities and policy makers who significantly contribute to the practical aspects of
the Bangladesh dairy industry.
The supply chain risk mitigation model could be adopted to increase productivity and
bring sustainable development to the Bangladesh dairy industry through effective
supply chain risk mitigation. Through QFD analysis, the best alternative from a variety
of different risk mitigation strategies can be easily selected. So using this technique,

231
and supported by the relevant software application, the management of dairy
industries may be able to judge their decisions more efficiently compared to the
traditional method. In addition, the level of risk mitigation taking into consideration
various budget constraints could be realised through QFD analysis. Industry personnel
can identify the different levels of risk mitigation with changing budgets and this would
help them to decide whether or not their risk could be mitigated with their budgeted
amount.
7.5 RESEARCH LIMITATIONS
There are some limitations of this research which are detailed as follows:
Firstly, the qualitative data for this research were collected through in-depth
interviews. All the factors and variables were composed through qualitative data which
were collected via a rigorous questionnaire survey. A number of factors and variables
were identified in the qualitative phase of the research. The outcome of the
questionnaire survey was subject to quantitative analyses of various factors and
variables. Obviously, misleading (if there is any) information may lead to inaccurate
judgement of research findings. The research examined two case industries to
determine the aggregate situation in the dairy industry of Bangladesh. It is a little risky
to attempt to generalise from these to the whole scenario, although the research has
selected the most scientific dairy farms in the case area. There would be greater
justification for such a generalisation if more case industries could be added to
construct a huge data base.
Secondly, the research considered the Bangladesh dairy industry as its field rather
than considering other countries. So the findings of the study are a generic picture of
the Bangladesh dairy industry which may not reflect the situation of a different
country. For example, political risks are frequent in Bangladesh but may not be so
frequent in another country.
Thirdly, this research was conducted among stakeholders (employees, executives and
supply chain members) of two case dairy farms in Bangladesh. Most of the respondents
were not educated and capable enough to understand the objectives of the research.
Hence, the original questionnaire, which was written in English, needed to be
translated into local language. It was observed that respondents did not feel free to
express the real true scenarios relating to the risks they suffer and strategies they

232
adopt, thus giving rise to problems related to accuracy. Based on the abovementioned
limitations, some important directions for future research can be suggested, which are
highlighted in the next section.
7.6 FUTURE DIRECTIONS
The findings of this research relating to supply chain risk, supply chain risk mitigation,
sustainability, sustainable outcomes, QFD and the Bangladesh dairy industry can be
extended in future in a variety of ways. This study had only a small geographic
coverage and a sample of only two case industries in one particular country. A model
developed for a specific industry within a particular country may not work in the same
way in another country, but might provide guidelines and information for the same
kind of study. The present study has taken the first step by using information from one
particular country and this can be extended to other countries. Further research could
also be conducted to test the model on dairy industries of different sizes.
This study is the first example of research based on sustainability theory and using the
QFD method on SCRM in the Bangladesh dairy industry. It is recommended that more
research be conducted to reveal the importance of QFD for appropriate policy making
related to the same types of industry. More research work would definitely help
farmers and decision makers to achieve better productivity and time-based decision
making.
Without undermining the findings of the present study, it is acknowledged that the
sample size used in this research is small. Therefore, future research could be
conducted using larger samples to draw accurate conclusions about the risks, risk
mitigation strategies and attainable sustainable outcomes associated with the dairy
industry in Bangladesh.
Although Quality Function Deployment (QFD) technique was used in the current
research to identify important mitigation strategies and detect sustainable outcomes,
the application of QFD involves very lengthy and complex procedures that need
massive calculations. The reliability and validity of the QFD method should be further
examined and verified. Other decision making techniques could be incorporated in
further research to increase the applicability and usefulness of decision making.

233
REFERENCES
Abdullah, Dr. Muhammad. 2004. "Cost Effective Technologies for Milk Preservation and Processing by Dairy Smes." In Sustainable Dairy-sector Development for Poverty Reduction, Pakistan, 22 to 27 November. 41-47. Asian Productivity Organization (APO).
ACF. 2012. "Performance & Competitiveness of the Dairy Value-Chain in Zambia." In A vibrant multi-stakeholder consultative platform in the Zambian agricultural sector, Lusaka, Zambia, 02 July. 1-4. The Agricultural Consultative Forum Secretariat.
Ahern, Jack, Sarel Cilliers, and Jari Niemelä. 2014. "The Concept of Ecosystem Services in Adaptive Urban Planning and Design: A Framework for Supporting Innovation." Landscape and Urban Planning 125: 254-259.
Ahsan, Dewan Ali. 2011. "Farmers’ Motivations, Risk Perceptions and Risk Management Strategies in a Developing Economy: Bangladesh Experience." Journal of Risk Research 14 (3): 325-349.
Ahuja, Vinod, and Elizabeth Redmond. 2004. "Livestock Services and the Poor." Tropical Animal Health and Production 36 (3): 247-268.
Aitken, James M. 1998. "Supply Chain Integration within the Context of a Supplier Association: Case Studies of Four Supplier Associations; In: Peck, Helen. 2006. "Reconciling Supply Chain Vulnerability, Risk and Supply Chain Management." International Journal of Logistics: Research and Applications No. 9 (2):128.", Cranfield University.
Akao, Y. 1990. Quality Function Deployment (Qfd) - Integrating Customers’ Requirements into Product Design, English Translation Copyright USA: Productivity Press.
Akao, Yoji. 1994. "Development History of Quality Function Deployment." The Customer Driven Approach to Quality Planning and Deployment: 339.
———. 1997. "Qfd: Past, Present, and Future" International Symposium on QFD, ———. 2004. "Quality Function Deployment." Akcaoz, Handan, Hatice Kizilay, and Orhan Ozcatalbas. 2009. "Risk Management Strategies in
Dairy Farming: A Case Study in Turkey." Journal of Animal and Veterinary Advances 8 (5): 949-958.
Al-Mashari, Majed, Mohamed Zairi, and David Ginn. 2005. "Key Enablers for the Effective Implementation of Qfd: A Critical Analysis." Industrial management & Data systems 105 (9): 1245-1260.
Ali, Jabir, and Sanjeev Kapoor. 2008. "Farmers' Perception on Risks in Fruits and Vegetables Production: An Empirical Study of Uttar Pradesh." Agricultural Economics Research Review 21 (2008).
Altekruse, Sean F, Norman J Stern, Patricia I Fields, and David L Swerdlow. 1999. "Campylobacter Jejuni--an Emerging Foodborne Pathogen." Emerging infectious diseases 5 (1): 28.
Atkinson, Giles, Susana Mourato, and S Szymanski. 2006. "Quantifying the “Un-Quantifiable”: Valuing the Intangible Impacts of Hosting the Summer Olympic Games." London, unpublished manu-script, London School of Economics and Imperial College London.
Bader, Pascal. 2008. Sustainability – from Principle to Practice , . Goethe-Institut. Bagheri, Ali, and Peder Hjorth. 2007. "Planning for Sustainable Development: A Paradigm Shift
Towards a Process‐Based Approach." Sustainable Development 15 (2): 83-96. Bailey, Kenneth. 2008. Methods of Social Research: SimonandSchuster. com. Barabas, J. 1995. "An Alternative Method of Milk Treatment." World animal review 83: 71-73. Bardhan, Dwaipayan, YPS Dabas, SK Tewari, and Avadhesh Kumar. 2006. "An Assessment of
Risk Attitude of Dairy Farmers in Uttaranchal (India)" Proc. of the Agricultural Economists Conference, Gold Coast, Australia, August,
Bari, Md. Ehsanul. 2008. Action Plan for Dairy Development in Bangladesh. Dhaka. Barrera-Roldán, Adrián, and Américo Saldıvar-Valdés. 2002. "Proposal and Application of a
Sustainable Development Index." Ecological Indicators 2 (3): 251-256. BBS. 2008. "Statistical Yearbook of Bangladesh." Government of Bangladesh. ———. 2010. Rural Povery Portal. Accessed 29/03/2012,
http://www.ruralpovertyportal.org/web/guest/country/statistics/tags/bangladesh.

234
Beedell, JDC, and Tahir Rehman. 1999. "Explaining Farmers' Conservation Behaviour: Why Do Farmers Behave the Way They Do?" Journal of Environmental management 57 (3): 165-176.
Belisle, Peter T. 2011. "Sustainability/Climate Change." Strategic Planning for Energy and the Environment 30 (4): 71-78.
Berg, Bruce Lawrence. 2004. Qualitative Research Methods for the Social Sciences. Vol. 5: Pearson Boston.
Bernard, H. Russell. 2012. Social Research Methods: Qualitative and Quantitative Approaches: Sage Publications, Incorporated.
Berry, Danny, Denis R Towill, and Nick Wadsley. 1994. "Supply Chain Management in the Electronics Products Industry." International Journal of Physical Distribution & Logistics Management 24 (10): 20-32.
Bettis, R. A. 1982. "Risk Considerations in Modelling Corporate Strategy" Academy of management proceeding.,
Bevilacqua, Maurizio, FE Ciarapica, and G Giacchetta. 2006. "A Fuzzy-Qfd Approach to Supplier Selection." Journal of Purchasing and Supply Management 12 (1): 14-27.
Bicheno, John. 1994. "The Quality 50: A Guide to Gurus, Tools, Wastes, Techniques and Systems." Buckingham, PICSIE.
Blos, Mauricio F., Mohammed Quaddus, H.M. Wee, and Kenji Watanabe. 2009. "Supply Chain Risk Management (Scrm): A Case Study on the Automotive and Electronic Industries in Brazil." Supply Chain Management: An International Journal 14 (4): 247–252.
Bob, King. 1989. "Better Designs in Half the Time." Goal/QPC, Methuen MA. Bogataj, David, and Marija Bogataj. 2007. "Measuring the Supply Chain Risk and Vulnerability in
Frequency Space." International Journal of Production Economics 108 (1): 291-301. Boggess, William G, Kwabena A Anaman, and Gregory D Hanson. 1985. "Importance, Causes and
Management Responses to Farm Risks: Evidence from Florida and Alabama." Southern Journal of Agricultural Economics 17 (2): 105-116.
Bossen, IL. 1991. "Quality Function Deployment. A Practitionerïs Approach." Marcel Dekker. USA.
Bossert, James L. 1991. Quality Function Deployment: A Practitioner's Approach: ASQC Quality Press Milwaukee, WI.
Bottani, Eleonora, and Antonio Rizzi. 2006. "Strategic Management of Logistics Service: A Fuzzy Qfd Approach." International Journal of Production Economics 103 (2): 585-599.
Bouchereau, V, and H Rowlands. 1999. "Analytical Approaches to Qfd." Manufacturing Engineer 78 (6): 249-254.
Bouchereau, Vivianne, and Hefin Rowlands. 2000a. "Methods and Techniques to Help Quality Function Deployment (Qfd)." Benchmarking: An International Journal 7 (1): 8-20.
———. 2000b. "Quality Function Deployment: The Unused Tool." Engineering Management Journal 10 (1): 45-52.
Boyazoglu, J. 2002. "Livestock Research and Environmental Sustainability with Special Reference to the Mediterranean Basin." Small Ruminant Research 45: 193-200.
Brindley, Clare. 2004. Supply Chain Risk: Ashgate Aldershot. Brown, Patrick G. 1991. "Qfd: Echoing the Voice of the Customer." AT&T Technical Journal 70
(2): 18-32. Carnevalli, Jose A, and Paulo Cauchick Miguel. 2008. "Review, Analysis and Classification of the
Literature on Qfd—Types of Research, Difficulties and Benefits." International Journal of Production Economics 114 (2): 737-754.
Carter, C.R., and M.M. Jennings. 2004. "The Role of Purchasing in Corporate Social Responsibility: A Structural Equation Analysis." Journal of Business Logistics 25 (1): 145-86.
Carter, Craig R., and Dale S. Rogers. 2008a. "A Framework of Sustainable Supply Chain Management: Moving toward New Theory." International Journal of Physical Distribution & LogisticsManagement 38 (5): 360-387.
———. 2008b. "A Framework of Sustainable Supply Chain Management: Moving toward New Theory." International Journal of Physical Distribution & Logistics Management 38 (5): 360-387.
Chaddad, Fabio R, and Michael L Cook. 2004. "Understanding New Cooperative Models: An Ownership–Control Rights Typology." Applied Economic Perspectives and Policy 26 (3): 348-360.

235
Chan, Lai-Kow, and Ming-Lu Wu. 2002. "Quality Function Deployment: A Literature Review." European Journal of Operational Research 143 (3): 463-497.
ChartsBin. 2015. Current Worldwide Total Milk Consumption Per Capita. Accessed April 10, Chen, Liang-Hsuan, and Wen-Chang Ko. 2010. "Fuzzy Linear Programming Models for Npd
Using a Four-Phase Qfd Activity Process Based on the Means-End Chain Concept." European Journal of Operational Research 201 (2): 619-632.
Chesterton, RN, DU Pfeiffer, RS Morris, and CM Tanner. 1989. "Environmental and Behavioural Factors Affecting the Prevalence of Foot Lameness in New Zealand Dairy Herds—a Case-Control Study." New Zealand Veterinary Journal 37 (4): 135-142.
Choudhary, Vikas, Anton Van Engelen, Sam Sebadduka, and Pablo Valdivia. 2011. Uganda Dairy Supply Chain Risk Assessment. Switzerland
Chowan, Monoj. 2015. Status of Dairy Management in Bangladesh, february 28, Dairy management in Bangladesh, Sonapahar, Mirarsharai Chittagong, Bangladesh.
Chowdhury, Mohammed S. 2007. "Overcoming Entrepreneurship Development Constraints: The Case of Bangladesh." Journal of Enterprising Communities: People and Places in the Global Economy 1 (3): 240-251.
Christopher, Martin. 1992. "Logistics &." Supply Chain Management. Christopher, Martin, and Hau Lee. 2004. "Mitigating Supply Chain Risk through Improved
Confidence." International Journal of Physical Distribution & Logistics Management 34 (5): 388-396.
Christopher, Martin, and Helen Peck. 2004. "Building the Resilient Supply Chain." International Journal of Logistics Management, The 15 (2): 1-14.
Cohen, Barney. 2006. "Urbanization in Developing Countries: Current Trends, Future Projections, and Key Challenges for Sustainability." Technology in society 28 (1): 63-80.
Cohen, Lou, and Lou Cohen. 1995. Quality Function Deployment: How to Make Qfd Work for You: Addison-Wesley Reading, MA.
Cohen, Philip R, and Hector J Levesque. 1990. "Intention Is Choice with Commitment." Artificial intelligence 42 (2): 213-261.
Collard, Natalie, and Charles McElhone. 2014. Australian Dairy Industry. Melbourne, Australia. Colletti, Joe, Steven Hoff, Janette Thompson, and John Tyndall. 2006. "Vegetative Environmental
Buffers to Mitigate Odor and Aerosol Pollutants Emitted from Poultry Production Sites" Proceedings of The Workshop on Agricultural Air Quality: State of Science, Potomac, MD,
Cooper, C.M., M.D. Lambert, and D.J. Pagh. 1997. "Supply Chain Management: More Than a New Name for Logistics." International Journal of Logistics Management 8 (1): 1-9.
Corbin, Juliet, and Anselm Strauss. 2008. "Basics of Qualitative Research." Thousand Oaks, CA: Sage.
Council, Supply-Chain. 1999. Supply-Chain Council: The Council. Cox, J.F., J.H. Blackstone, and M.S. Spencer. 1995. "Apics Dictionary (8th Ed.)." Falls Church, VA:
American Production and Inventory Control Society. Cox Jr, Louis Anthony Tony. 2012. "Evaluating and Improving Risk Formulas for Allocating
Limited Budgets to Expensive Risk‐Reduction Opportunities." Risk Analysis 32 (7): 1244-1252.
Creswell, J W. 2008. Research Design: Qualitative, Quantitative, and Mixed Methods Approaches: Sage Publications, Incorporated.
Creswell, John W. 2002. "Educational Research: Planning, Conducting, and Evaluating Quantitative."
———. 2013. Research Design: Qualitative, Quantitative, and Mixed Methods Approaches: Sage. Croom, Simon, Pietro Romano, and Mihalis Giannakis. 2000. "Supply Chain Management: An
Analytical Framework for Critical Literature Review." European journal of purchasing & supply management 6 (1): 67-83.
Cross, John A. 2006. "Restructuring America's Dairy Farms*." Geographical Review 96 (1): 1-23. Curtis, Mark. 2011. Milking the Poor: How Eu Subsidies Hurt Dairy Producers in Bangladesh.
Dhaka: Actionaid. Dahlgaard, K. Kanji 1994. " Break Down Barriers between Departments." Advances in Total
Quality Management: 81-89. Daily, B.F., and S. Huang. 2001. "Achieving Sustainability through Attention to Human Resource
Factors in Environmental Management." International journal of operations & production Management 21 (12): 1539-52.

236
Daily, Gretchen C., and Paul R. Ehrlich. 1992. "Population, Sustainability, and Earth's Carrying Capacity." BioScience 42 (10): 761-771.
Darnhofer, Ika, Stéphane Bellon, Benoît Dedieu, and Rebecka Milestad. 2011. "Adaptiveness to Enhance the Sustainability of Farming Systems." In Sustainable Agriculture Volume 2, 45-58. Springer.
Das, S.C., S.D. Chowdhury, M.A. Khatun, M. Nishibori, N. Isobe, and Y. Yoshimura. 2008. "Poultry Production Profile and Expected Future Projection in Bangladesh." World's Poultry Science Journal 64 (01): 99-118. doi: doi:10.1017/S0043933907001754.
Davis, Kingsley. 1990. "Population and Resources: Fact and Interpretation." Population and Development Review 16: 1-21.
Day, Ronald G. 1993. Quality Function Deployment: Linking a Company with Its Customers. Vol. 180: ASQC Quality Press Milwaukee WI.
de Jong, Peter. 2013. "The Future of Sustainable Dairy Production." Sustainable Dairy Production: 243-250.
Deimel, Mark, Mechthild Frentrup, and Ludwig Theuvsen. 2008. "Transparency in Food Supply Chains: Empirical Results from German Pig and Dairy Production." Journal on Chain and Network Science 8 (1): 21-32.
Denzin, Norman K., and Yvonna S. Lincoln. 2011. The Sage Handbook of Qualitative Research: SAGE Publications, Incorporated.
Devendra, C, and D Thomas. 2002. "Crop–Animal Interactions in Mixed Farming Systems in Asia." Agricultural Systems 71 (1): 27-40.
Diesendorf, Mark. 2000. "Sustainability and Sustainable Development." Sustainability: The corporate challenge of the 21st century: 19-37.
DLS. 2005. Development and Activities of Livestock-an Overview. Dhaka. ———. 2010. Development and Activities of Livestock-an Overview. Dhaka. ———. 2012. Livestock Production and Information. Dhaka. www.dls.gov.bd. ———. 2014. Livestock Production and Information. Dhaka. www.dls.gov.bd. Dobson, William D. 1990. "Dairy Board." Agribusiness 6 (6): 541-558. Dries, Liesbeth, Etleva Germenji, Nivelin Noev, and Johan FM Swinnen. 2009. "Farmers, Vertical
Coordination, and the Restructuring of Dairy Supply Chains in Central and Eastern Europe." World development 37 (11): 1742-1758.
Du, XQ, H Greenfield, DR Fraser, KY Ge, ZH Liu, and W He. 2002. "Milk Consumption and Bone Mineral Content in Chinese Adolescent Girls." Bone 30 (3): 521-528.
Dunn, John, and RJ Herring. 1983. "Country Risk: Social and Cultural Aspects." Managing international risk: 139-68.
Dwivedi, YK. 2007. Consumer Adoption and Usage of Broadband. NY: IRM Press. Edwards, D.R., and T.C. Daniel. 1992. "Environmental Impacts of on-Farm Poultry Waste
Disposal-a Review." Bioresource Technology 41 (1): 9-33. Eisenhardt, Kathleen M, and Melissa E Graebner. 2007. "Theory Building from Cases:
Opportunities and Challenges." Academy of management journal 50 (1): 25-32. Elkington, John. 1994. "Towards the Sustainable Corporation: Win-Win-Win Business Strategies
for Sustainable Development." California Managemnet Review 36 (2): 90-100. ———. 1998. Cannibals with Forks: The Triple Bottom Line of the 21st Century Business. Vol.
Reprint 2002. Stoney Creek, CT.: New Society Publishers. ———. 2004. "Enter the Triple Bottom Line." The triple bottom line: Does it all add up: 1-16. Ellram, L., and M. Cooper. 1993. "Characteristics of Supply Chain Management and the
Implications for Purchasing and Logistics Strategy." International Journal of Logistics Management 4 (2): 1-10.
Ellram, Lisa M. 1991. "Supply-Chain Management: The Industrial Organisation Perspective." International Journal of Physical Distribution & Logistics Management 21 (1): 13-22.
Erlich, P.R., and A.H. Erlich. 1991. The Population Explosion. New York, NY: Touchstone. Ermer, Donald S, and Mark K Kniper. 1998. "Delighting the Customer: Quality Function
Deployment for Quality Service Design." Total Quality Management 9 (4-5): 86-91. Ertay, Tijen, Gülçin Büyüközkan, Cengiz Kahraman, and Da Ruan. 2005. "Quality Function
Deployment Implementation Based on Analytic Network Process with Linguistic Data: An Application in Automotive Industry." Journal of Intelligent & Fuzzy Systems: Applications in Engineering and Technology 16 (3): 221-232.
Fairclough, Norman. 2003. Analysing Discourse: Textual Analysis for Social Research: Routledge.
237
Faisal, Mohd Nishat. 2010. "Sustainable Supply Chains: A Study of Interaction among the Enablers." Business Process Management Journal 16 (3): 508-529.
Fałkowski, Jan. 2012. "Dairy Supply Chain Modernisation in Poland: What About Those Not Keeping Pace?" European Review of Agricultural Economics 39 (3): 397-415.
FAOSTAT. 2014. Milk Production Worldwide FAO. http://www.adbi.org/3rdpartycdrom/2005/06/01/1507.fao.agriculture.statistics/.
Fawcett, Stanley E, Gregory M Magnan, and Matthew W McCarter. 2008. "Benefits, Barriers, and Bridges to Effective Supply Chain Management." Supply Chain Management: An International Journal 13 (1): 35-48.
Faye, B, and G Loiseau. 2002a. "Sources of Contamination in Dairy Supply Chains and Approaches to Quality Control." International Cooperation in International Research for Agricultural Development (CIRAD) -FAO, Montpellier, France,
———. 2002b. "Sources of Contamination in Dairy Supply Chains and Approaches to Quality Control." International Cooperation in International Research for Agricultural Development (CIRAD) -FAO, Montpellier, France,
Fiedler, Fred E. 1971. "Validation and Extension of the Contingency Model of Leadership Effectiveness: A Review of Empirical Findings." Pshycological Bulletin 76 (2): 128-148.
Filipovic, D, and M Kokaj. 2009. "The Comparison of Hand and Machine Milking on Small Family Dairy Farms in Central Croatia." Livestock Research for Rural Development 21 (5): 4.
Finch, Peter. 2004. "Supply Chain Risk Management." Supply Chain Management: An International Journal 9 (2): 183-196.
Flaten, Ola, Gudbrand Lien, Matthias Koesling, Paul Steinar Valle, and Martha Ebbesvik. 2005. "Comparing Risk Perceptions and Risk Management in Organic and Conventional Dairy Farming: Empirical Results from Norway." Livestock Production Science 95 (1): 11-25.
Fortuna, Ronald M. 1988. "Beyond Quality-Taking Spc Upstream." Quality Progress 21 (6): 23-28.
Fowler, CT. 1991. "Qfd-Easy as 1-2-3." 1991 SAVE (Society of American Engineers) Proceedings 26: 177-82.
Gephart, Robert. 1999. "Paradigms and Research Methods" Research Methods Forum: Basic Books.
Ghani, Nasimul, and Mohammed Habibur Rahman. 2004. "Sustainable Dairy-Sector Development for Poverty Reduction " In APO Seminar on Sustainable Dairy-sector Development for Poverty Reduction, Pakistan, 22-27 November.
Ghosh, Ashoke Kumar, and Keshav Lall Maharjan. 2001. "Impacts of Dairy Cooperative on Rural Income Generation in Bangladesh." Journal of International Development and Cooperation 8 (1): 67–90.
Giannakis, MIHALIS, Simon Croom, and Nigel Slack. 2004. "Supply Chain Paradigms." Understanding Supply Chains, Oxford University Press, UK: 1-22.
Giunipero, Larry C, and Reham Aly Eltantawy. 2004. "Securing the Upstream Supply Chain: A Risk Management Approach." International Journal of Physical Distribution & Logistics Management 34 (9): 698-713.
Giunipero, Larry C, and Dawn H Pearcy. 2000. "World‐Class Purchasing Skills: An Empirical Investigation." Journal of Supply Chain Management 36 (3): 4-13.
Gladwin, T.N., J.J. Kennelly, and T. Krause. 1995. "Shifting Paradigms for Sustainable Development: Implications for Management Theory and Research." Academy of Management Review 20 (4): 874-907.
Go´ncz, E., U. Skirke, H. Kleizen, and M. Barber. 2007. "Increasing the Rate of Sustainable Change: A Call for a Redefinition of the Concept and the Model for Its Implementation." Journal of Cleaner Production 15 (6): 525-37.
Godfray, H Charles J, John R Beddington, Ian R Crute, Lawrence Haddad, David Lawrence, James F Muir, Jules Pretty, Sherman Robinson, Sandy M Thomas, and Camilla Toulmin. 2010. "Food Security: The Challenge of Feeding 9 Billion People." science 327 (5967): 812-818.
Goel, Veena, and Suku Bhaskarkan. 2010. "Supply Chain Management in a Private Farming Vis-À-Vis Cooperative Processing and Distribution Environment of Dairy Sector in India." Journal of Food Products Marketing 16 (2): 212-231.
Goodland, Robert, and Herman Daly. 1996. "Environmental Sustainability: Universal and Non-Negotiable." Ecological Applications: 1002-1017.

238
Greene, Jennifer C, Valerie J Caracelli, and Wendy F Graham. 1989a. "Toward a Conceptual Framework for Mixed-Method Evaluation Designs." Educational evaluation and policy analysis 11 (3): 255-274.
Greene, Jennifer C., Valerie J. Caracelli, and Wendy F. Graham. 1989b. "Toward a Conceptual Framework for Mixed-Method Evaluation Designs." Education Evaluation and Policy Analysis 11: 255-274.
Griffin, Abbie. 1992. "Evaluating Qfd's Use in Us Firms as a Process for Developing Products." Journal of Product Innovation Management 9 (3): 171-187.
Griffin, Abbie, and John R Hauser. 1992. "Patterns of Communication among Marketing, Engineering and Manufacturing—a Comparison between Two New Product Teams." Management science 38 (3): 360-373.
———. 1993. "The Voice of the Customer." Marketing science 12 (1): 1-27. Gunasekaran, A. 1998. "Agile Manufacturing: Enablers and an Implementation Framework."
International Journal of Production Research 36 (5): 1223-1247. Ha, Dr. Jong Kyu, and Hyun Jin Kim. 2004. "Management of Dairy-Animal Feeding for Better
Productivity and Food Safety." In Sustainable Dairy-sector Development for Poverty Reduction, Faisalabad, Pakistan, November 25-35. Asian Productivity Organization (APO).
Habiba, Umma, Rajib Shaw, and Yukiko Takeuchi. 2011. "Drought Risk Reduction through a Socio-Economic, Institutional and Physical Approach in the Northwestern Region of Bangladesh." Environmental Hazards 10 (2): 121-138.
Hair, JF, AH Money, and P Samouel. 2007. Research Methods for Business. USA: Wiley. Halder, Shantana R, and Proloy Barua. 2003. Dairy Production, Consumption and Marketing in
Bangladesh. Dhaka. Hall, David C., Md. Golam Shah Alam, and Shankar K. Raha. 2012. "Improving Dairy Production
in Bangladesh: Application of Integrated Agriculture and Ecohealth Concepts." International Journal of Livestock Production 3 (3): 29-35.
Hall, Ralph. 2012. "Mixed Methods: In Search of a Paradigm." Vortrag. Download (am 10.01. 2013) unter: http://www. auamii. com/proceedings_Phuket_2012/Hall. pdf.
Han, S Bruce, Shaw K Chen, Maling Ebrahimpur, and Manbir S Sodhi. 2001. "A Conceptual Qfd Planning Model." The international Journal of Quality and Reliability Management 18 (8/9): 796-812.
Haque, S A M Anwarul. 2009. "Bangladesh: Social Gains from Dairy Development." Smallholder dairy development: Lessons learned in Asia: 8-21.
Harding, Jennifer A, K Popplewell, Richard YK Fung, and Abdul R Omar. 2001. "An Intelligent Information Framework Relating Customer Requirements and Product Characteristics." Computers in Industry 44 (1): 51-65.
Harland, Christine, Richard Brenchley, and Helen Walker. 2003. "Risk in Supply Networks." Journal of Purchasing and Supply management 9 (2): 51-62.
Hart, S.L. 1995. "A Natural-Resource-Based View of the Firm." Academy of Management Review 20 (4): 986-1014.
Hart, Stuart L. 1997. "Beyond Greening: Strategies for a Sustainable World." Harvard business review 75 (1): 66-77.
Harwood, Joy L, Richard Heifner, Keith Coble, Janet Perry, and Agapi Somwaru. 1999. Managing Risk in Farming: Concepts, Research, and Analysis: US Department of Agriculture, Economic Research Service.
Hashmi, Arshad Hussain. 2004. "Role of Small and Medium Enterprises (Smes) in Sustainable Dairy Development in Pakistan." In The seminer on sustainable dairy development for poverty reduction, Faisalabad, 22 to 27 NOvember. Asian productivity organisation (APO), Government of Pakistan.
Hemme, T. 2010. Ifcn Dairy Report 2010. Kiel, Germany, Website: www.ifcndairy.org. Hemme, T O, and A R Khan. 2004. A Review of Milk Production in Bangladesh with Particular
Emphasis on Small Scale Prodicers. Rome. Hemme, Torsten, and Mohammad Uddin. 2009. Dairy Case Study: Bangladesh Vs. The Eu. Kiel,
Germany. http://www.oxfam.de/sites/www.oxfam.de/files/20091128_Englischsprachige_Hintergrundstudie_des_IFCN.pdf.
Hendricks, K B, and V. R. Singhal. 2003. "The Effect of Supply Chain Glitches on Shareholder Value." Journal of Operations Management 21 (5): 501–522.
239
Hendrickson, Mary, William D Heffernan, Philip H Howard, and Judith B Heffernan. 2001. "Consolidation in Food Retailing and Dairy." British Food Journal 103 (10): 715-728.
Henriques, A., and J. Richardson. 2004. The Triple Bottom Line: Does It All Add Up? London: Earthscan.
Henson, Spencer, and Thomas Reardon. 2005. "Private Agri-Food Standards: Implications for Food Policy and the Agri-Food System." Food policy 30 (3): 241-253.
Hill, M.R. 2001. "Sustainability, Greenhouse Gas Emissions, and International Operations Management." International Journal of Operations & Production Management, 21 (12): 1503-20.
Howell, David. 2000. "Making Wishes Come True." Professional Engineering 13 (3): 39. Hsieh, C.-H. and Y.-C. Wu 2016. A New QFD Model for Strategic Resource Based Product
Innovation. ISPIM Innovation Symposium, The International Society for Professional Innovation Management (ISPIM).
Huq, Khondaker Muzammel. 2007. Integrated Energy and Food Security Farming through Mini Dairy Farms in Bangladesh. Dhaka, Bangladesh.
Imtiaz, MA, and S Rana. 2014. "Problems Faced by the Small Scale Dairy Owners in Receiving Veterinary Services in Selected Areas of Chittagong." Bangladesh Journal of Veterinary Medicine 12 (1): 63-65.
IRIN. 2013. Bangladesh: Poultry Industry Still Reeling from Bird Flu. http://www.irinnews.org/report/96056/bangladesh-poultry-industry-still-reeling-from-bird-flu.
Islam, S M Fakhrul, M A Jabbar, S K Ehui, Chris Delgado, Md. Kamruzzaman, and Md. Aminul Islam. 2002. Differential Impacts of Policy and Scale Factors on Dairy Producers in Bangladesh. Dhaka.
Islam, SM Fakhrul, MA Jabbar, SK Ehui, M KAMRUZZAMAN, and MA ISLAM. 2001. "Differential Impacts of Policy Scale Factors on Dairy Producers in Bangladesh" Proceeding of Workshop on Policy and Institutional Factors Affecting Poultry and Daily Producers in Bangladesh, Dhaka,
IUF. 2013a. Indian Dairy Industry. USA: IUF. www.iuf.org/sites/cms.iuf.org/files/USA%20Dairy%20Industry.pdf.
———. 2013b. United States of America Dairy Industry. USA. www.iuf.org/sites/cms.iuf.org/files/USA%20Dairy%20Industry.pdf.
Jabbar, Mohammad A. 2010. Policy Barriers for Dairy Value Chain Development in Bangladesh with a Focus on the North West Region.
Jahan, N, and H Rahman. 2003. "Livestock Services and the Poor in Bangladesh: A Case Study." Edited by S. Chipeta, an initiative by DANIDA, IFAD and the World Bank.
Javed, Muhammad Nasir. 2004. "Sustainable Development of the Cottage Dairy Sector in Asia and the Pacific–Challenges and Opportunities." Part III Country Papers 85 (82.2): 108-109. www.apo-tokyo.org/publications/wp-content/.../pjrep-04-ag-ge-sem-16.pdf.
Jennings, P.D., and P.A. Zandbergen. 1995. "Ecologically Sustainable Organizations: An Institutional Approach." The Academy of Management review 20 (4): 1015-1052.
Jia, Xiangping, Jikun Huang, Hao Luan, Scott Rozelle, and Johan Swinnen. 2012. "China’s Milk Scandal, Government Policy and Production Decisions of Dairy Farmers: The Case of Greater Beijing." Food Policy 37 (4): 390-400.
Johnson, R Burke, and Anthony J Onwuegbuzie. 2004. "Mixed Methods Research: A Research Paradigm Whose Time Has Come." Educational researcher 33 (7): 14-26.
Johnson, R. B. 2004. "Mixed Methods Research: A Research Paradigm Whose Time Has Come." Educational Researcher 33 (7): 14.
Jones, T.C., and D.W. Riley. 1985. "Using Inventory for Competitive Advantage through Supply Chain Management." International Journal of Physical Distribution & Materials Management 15 (5): 16-26.
Jüttner, Uta. 2005. "Supply Chain Risk Management: Understanding the Business Requirements from a Practitioner Perspective." International Journal of Logistics Management, The 16 (1): 120-141.
Jüttner, Uta, Helen Peck, and Martin Christopher. 2003. "Supply Chain Risk Management: Outlining an Agenda for Future Research." International Journal of Logistics : Research & Applications 6 (4): 197-210.
Kahneman, Daniel, and Amos Tversky. 1979. "Prospect Theory: An Analysis of Decision under Risk." Econometrica: Journal of the Econometric Society: 263-291.

240
Kahraman, Cengiz, Tijen Ertay, and Gülçin Büyüközkan. 2006. "A Fuzzy Optimization Model for Qfd Planning Process Using Analytic Network Approach." European Journal of Operational Research 171 (2): 390-411.
Kang, Suk-Ho, Bokyoung Kang, Kwangsup Shin, Daeyoung Kim, and Jihee Han. 2012. "A Theoretical Framework for Strategy Development to Introduce Sustainable Supply Chain Management." Procedia-Social and Behavioral Sciences 40: 631-635.
Karim, Zahurul, Khan Shahidul Huque, Md. Golam Hussain, Zulfiqar Ali, and Mosharraf Hossain. 2010. "Growth and Development Potential of Livestock and Fisheries in Bangladesh." In Bangladesh Food Security Investment Forum, Dhaka.
Kenny, Andrew A. 1988. "A New Paradigm for Quality Assurance." Quality Progress 21 (6): 30-32.
Khan, MJ, KJ Peters, and MM Uddin. 2009. "Feeding Strategy for Improving Dairy Cattle Productivity in Small Holder Farm in Bangladesh." Bangladesh Journal of Animal Science 38 (1-2): 67-85.
Khanna, Rattan Sagar. 2004. "Sustainable Development of the Cottage Dairy Sector in Asia and the Pacific – Challenges and Opportunities." In The Seminar on Sustainable Dairy-sector Development for Poverty Reduction, Faisalabad, 22 to 27 November. 7-20. Faisalabad: Asian Productivity Organization (APO), Government of Pakistan. www.apo-tokyo.org/publications/wp-content/.../pjrep-04-ag-ge-sem-16.pdf.
Kleindorfer, Paul R, and Germaine H Saad. 2005. "Managing Disruption Risks in Supply Chains." Production and operations management 14 (1): 53-68.
Kliebenstein, James. 1998. Economic and Associated Social and Environmental Issues with Large-Scale Livestock Production Systems. https://www.researchgate.net/publication/254424998_Economic_and_Associated_Social_and_Environmental_Issues_with_Large-Scale_Livestock_Production_Systems.
Knips, Vivien. 2005. "Developing Countries and the Global Dairy Sector Part I Global Overview." FAO, Pro-Poor Livestock Policy Inniciative.
———. 2006. Developing Countries and Global Sector Part Ii: Country Case Studies. Kocabasoglu, Canan, Carol Prahinski, and Robert D. Klassen. 2007. "Linking Forward and
Reverse Supply Chain Investments: The Role of Business Uncertainty." Journal of Operations Management 25: 1141-1160.
Komiyama, Hiroshi, Kazuhiko Takeuchi, Hideaki Shiroyama, and Takashi Mino. 2011. Sustainability Science: A Multidisciplinary Approach: United Nations University.
Kopczak, Laura Rock. 1997. "Logistics Partnerships and Supply Chain Restructuring: Survey Results from the Us Computer Industry." Production and Operations Management 6 (3): 226-247.
Krauss, Steven Eric. 2005. "Research Paradigms and Meaning Making: A Primer." The qualitative report 10 (4): 758-770.
Kress, Guenther G, Randi L Miller, and Gus Koehler. 2010. "Strategic Perspectives on State Government as a Promoter of International Trade and Investment: The Case of California." INTERNATIONAL JOURNAL OF ORGANIZATION THEORY AND BEHAVIOR 13 (3): 378-407.
Kumar, Ruchira, and Vegard Iversen. 2012. Pran Dairy : Indirect Employment and Poverty Reduction Effects in the Supply Chain Washington DC. http://documents.worldbank.org/curated/en/2012/01/18433652/pran-dairy-indirect-employment-poverty-reduction-effects-supply-chain.
Kutucuoglu, KY, Jamil Hamali, Zahir Irani, and JM Sharp. 2001. "A Framework for Managing Maintenance Using Performance Measurement Systems." International Journal of Operations & Production Management 21 (1/2): 173-195.
Lal, R., D.O. Hansen, N. Uphoff, and S.A. Slack. 2002. Food Security and Environmental Quality in the Developing World. Boca Raton, FL.: CRC Press.
Lambert, Douglas M., and Martha C. Cooper. 2000. "Issues in Supply Chain Management." Industrial Marketing Management 29: 65-83.
Lambert, Douglas M., James R. Stock, and Lisa M. Ellram. 1998. Fundamentals of Logistics Management: Irwin/McGraw-Hill Chicago, IL.
Larraâin, Jorge. 1979. The Concept of Ideology: University of Georgia Press (Athens). Lee, Hau L. 2004. "The Triple-a Supply Chain." Harvard business review 82 (10): 102-113. Lee, Hau L, and Corey Billington. 1992. "Managing Supply Chain Inventory: Pitfalls and
Opportunities." Sloan management review 33 (3).

241
Lee, Hau L, and Shu Ming Ng. 1997. "Introduction to the Special Issue on Global Supply Chain Management." Production and Operations Management 6 (3): 191-192.
Lim, Puay Cheng, and Nelson KH Tang. 2000. "The Development of a Model for Total Quality Healthcare." Managing Service Quality 10 (2): 103-111.
Lincoln, Yvonna S, and Egon G Guba. 1994. "Competing Paradigms in Qualitative Research." Handbook of qualitative research: 105-117.
Linton, Jonathan D., Robert Klassen, and Vaidyanathan Jayaraman. 2007. "Sustainable Supply Chains: An Introduction." Journal of Operations Management 25 (6): 1075–1082.
Lummus, R. R., and K.L. Alber. 1997. Supply Chain Management: Balancing the Supply Chain with Customer Demand. Alexandria,VA.: APICS Educational and Research Foundation, Inc.,.
Lummus, Rhonda R., and Robert J. Vokurka. 1999. "Defining Supply Chain Management: A Historical Perspective and Practical Guidelines." Industrial Management & Data Systems 99 (1): 11-17.
Malhotra, Naresh K. 2008. Marketing Research: An Applied Orientation, 5/E: Pearson Education India.
Manuj, Ila, and John T Mentzer. 2008a. "Global Supply Chain Risk Management." Journal of Business Logistics 29 (1): 133-155.
———. 2008b. "Global Supply Chain Risk Management Strategies." International Journal of Physical Distribution & Logistics Management 38 (3): 192-223.
Markley, Melissa J, and Lenita Davis. 2007. "Exploring Future Competitive Advantage through Sustainable Supply Chains." International Journal of Physical Distribution & Logistics Management 37 (9): 763-774.
Marshall, Catherine, and Gretchen B Rossman. 2010. Designing Qualitative Research: Sage. ———. 2014. Designing Qualitative Research: Sage publications. Martin, Sandra. 1996. "Risk Management Strategies in New Zealand Agriculture and
Horticulture." Review of Marketing and Agricultural Economics 64: 31-44. Matell, Michael S, and Jacob Jacoby. 1972. "Is There an Optimal Number of Alternatives for
Likert-Scale Items? Effects of Testing Time and Scale Properties." Journal of Applied Psychology 56 (6): 506.
Maxwell, D., and R. van der Vorst. 2003. "Developing Sustainable Products and Services." Journal of Cleaner Production 11 883-895.
McEachern, Morven, and Gary G Warnaby. 2005. "Improving Customer Orientation within the Fresh Meat Supply Chain: A Focus on Assurance Schemes." Journal of Marketing Management 21 (1-2): 89-115.
McGillivray, Glenn. 2000. "Commercial Risk under Jit." Canadian Underwriter 67 (1): 26-30. McMichael, Anthony J., Colin D. Butler, and Carl Folke. 2003. "New Visions for Addressing
Sustainability." Science 302 (5652): 1919-1920. Mentzer, J.T., W. Dewitt, J.S. Keebler, S. Min, N.W. Nix, C.D. Smith, and Z.G. Zacharia. 2002.
"Defining Supply Chain Management." Journal of Business Logistics 22 (2): 1-25. Meuwissen, Miranda PM, Annet GJ Velthuis, Henk Hogeveen, and Ruud BM Huirne. 2003.
"Traceability and Certification in Meat Supply Chains." Journal of Agribusiness 21 (2): 167-182.
Miles, Matthew B, and A Michael Huberman. 1994a. "An Expanded Sourcebook Qualitative Data Analysis."
———. 1994b. Qualitative Data Analysis: An Expanded Sourcebook: Sage. Miller, K. 1991. "A Framework for Integrated Risk Management in International Business."
Journal of International Business Studies 23 (2): 311-31. Mingers, John. 2003. "The Paucity of Multimethod Research: A Review of the Information
Systems Literature." Information Systems Journal 13 (3): 233-249. Mishra, Pramod Kumar, and B Raja Shekhar. 2012. "Evaluating Supply Chain Risk in Indian
Dairy Industry: A Case Study." International Journal of Decision Sciences, Risk and Management 4 (1): 77-91.
Mishra, Pramod Kumar, and B. Raja Shekhar. 2011. "Impact of Risks and Uncertainties on Supply Chain: A Dairy Industry Perspective." Journal of Management Research 3 (2:E11): 1-18.
Morriss, Stuart, Claire Massey, Ross Flett, Fiona Alpass, and Frank Sligo. 2006. "Mediating Technological Learning in Agricultural Innovation Systems." Agricultural Systems 89 (1): 26-46.
Myers, M. 1997. "Qualitative Research in Information Systems." MIS Quarterly 21 (2): 241-242.

242
Narasimhan, Ram, and Srinivas Talluri. 2009. "Perspectives on Risk Management in Supply Chains." Journal of Operations Management 27 (2): 114-118.
Nasir, Tasnuba, Mohammed Quaddus, and Mohamamd Shamsuddoha. 2014. "Dairy Supply Chain Risk Management in Bangladesh: Field Studies of Factors and Variables." Jurnal Teknik Industri 16 (2): 127-138.
Nasir, Tasnuba, Mohammad Shamsuddoha, and Mohammed Quaddus. "Dairy Supply Chain: A Simulation Study." INTERNATIONAL JOURNAL OF ECONOMICS & SOCIAL SCIENCE VOLUME 2 (2013): 89.
Nelson, Dave, Patricia E Moody, and Rick Mayo. 1998. Powered by Honda: Developing Excellence in the Global Enterprise: Wiley New York.
Neuman, W L. 1997. Social Research Methods. Neuman, William Lawrence. 2005. Social Research Methods: Quantitative and Qualitative
Approaches: Allyn and Bacon. Nielsen, Nicolaj Ingemann, and Klaus Lønne Ingvartsen. 2004. "Propylene Glycol for Dairy Cows:
A Review of the Metabolism of Propylene Glycol and Its Effects on Physiological Parameters, Feed Intake, Milk Production and Risk of Ketosis." Animal Feed Science and Technology 115 (3): 191-213.
Norman, Wayne, and Chris MacDonald. 2004. "Getting to the Bottom of" Triple Bottom Line"." Business Ethics Quarterly: 243-262.
Okano, Marcelo Tsuguio, Oduvaldo Vendrametto, and Osmildo Sobral dos Santos. 2010. "Organizing the Dairy Chain through Productivity Indicators for a Sustainable Supply Chain." In International Conference on Chemistry and Chemical Engineering (ICCCE 2010), São Paulo, Brazil. ICCCE.
Orlikowski, Wanda J., and Jack J. Baroudi. 1991. "Studying Information Technology in Organizations: Research Approaches and Assumptions." Information Systems Research 2 (1).
Ostrom, Elinor. 2002. The Drama of the Commons: National Academies Press. Oxelheim, Lars, and Clas Wihlborg. 1987. Macroeconomic Uncertainty-International Risks and
Opportunities for the Corporation: John Wiley & Sons. Park, Taeho, and Kwang-Jae Kim. 1998. "Determination of an Optimal Set of Design
Requirements Using House of Quality." Journal of operations management 16 (5): 569-581.
Patankar, Mahesh, Anand Patwardhan, and Geert Verbong. 2010. "A Promising Niche: Waste to Energy Project in the Indian Dairy Sector." environmental science & policy 13 (4): 282-290.
Patrick, George F, and Wesley N Musser. 1997. "Sources of and Responses to Risk: Factor Analyses of Large-Scale Us Cornbelt Farmers." Risk management strategies in agriculture 7.
Patrick, George R, Paul N Wilson, Peter J Barry, William G Boggess, and Douglas L Young. 1985. "Risk Perceptions and Management Responses: Producer-Generated Hypotheses for Risk Modeling." Southern Journal of Agricultural Economics 17 (2): 231-238.
Payraudeau, Sylvain, and Hayo MG van der Werf. 2005. "Environmental Impact Assessment for a Farming Region: A Review of Methods." Agriculture, Ecosystems & Environment 107 (1): 1-19.
Peacocka, C., and D.M. Shermanb. 2010. "Sustainable Goat Production: Some Global Perspectives." Small Ruminant Research (89): 70-80.
Peck, Helen. 2005. "Drivers of Supply Chain Vulnerability: An Integrated Framework." International Journal of Physical Distribution & Logistics Management 35 (4): 210-232.
Podsakoff, Philip M, Scott B MacKenzie, Jeong-Yeon Lee, and Nathan P Podsakoff. 2003. "Common Method Biases in Behavioral Research: A Critical Review of the Literature and Recommended Remedies." Journal of applied psychology 88 (5): 879.
Ponomarov, Serhiy Y, and Mary C Holcomb. 2009. "Understanding the Concept of Supply Chain Resilience." International Journal of Logistics Management, The 20 (1): 124-143.
PRAN-RFL. 2007. The Development of Dairy Industry in Bangladesh. Dhaka. PRAN. 2005. Pran Dairy Website. PRAN. www.pranfoods.net/. Prasad, B. 1993. "Product Planning Optimization Using Quality Function Deployment." Artificial
intelligence in optimal design and Manufacturing: 117-152.

243
Qian, Guixia, Xiaochuan Guo, Jianjun Guo, and Jianguo Wu. 2011. "China's Dairy Crisis: Impacts, Causes and Policy Implications for a Sustainable Dairy Industry." International Journal of Sustainable Development & World Ecology 18 (5): 434-441.
Qiang, SHEN, HOU Yun-xian, LU Xian-glin, HU Xiao-jing, and HUANG Ling-ling. 2010. "Study on the Quality-Control Mechanism of Dairy Supply Chain for Single Moral Hazard." In 17th International Conference on Management Science & Engineering Melbourne, Australia, November 24-26.
Quaddus, Mohammed, and Jun Xu. 2005. "Adoption and Diffusion of Knowledge Management Systems: Field Studies of Factors and Variables." Knowledge-Based Systems 18 (2): 107-115.
Raha, S. K., and R. K. Talukder. 2004. "Vertical Integration in the Dairy Sector in Bangladesh the Case of Bangladesh Milk Producers Co-Operative Union Ltd." Bangladesh Journal of Political Economy Vol. 20, No 1 20 (1).
Rahman, M. Rakibur. 2015. Dairy Management and Implication of Modern Technologies, March 21, Development of Bangladesh dairy industries Mirarsharai, Chittagong, Bangladesh.
Rahman, Md. 2014. Milk Production and Its Influential Factors in Different Dairy Cattle Genetic Resources of Comilla District.
Raihan, Selim, and Nahid Mahmud. 2008. Trade and Poverty Linkages: A Case Study of the Poultry Industry in Bangladesh. CUTS International. http://www.cuts-citee.org/pdf/rreport08-08.pdf.
Raja, RH. 2001. "Pakistan Smallholder Dairy Production and Marketing" Smallholder dairy production and marketing—opportunities and constraints: Proceedings of a South-South workshop,
Rao, Shashank, and Thomas J. Goldsby. 2009. "Supply Chain Risks: A Review and Typology." The International Journal of Logistics Management 20 (1): 97-123.
Rasul, Golam, and Gopal B Thapa. 2004. "Sustainability of Ecological and Conventional Agricultural Systems in Bangladesh: An Assessment Based on Environmental, Economic and Social Perspectives." Agricultural systems 79 (3): 327-351.
Raven, Peter H. 2002. "Science, Sustainability, and the Human Prospect." Science 297 (5583): 954-958.
Ravindranath, Nijavalli H, and David Oakley Hall. 1995. Biomass, Energy and Environment: A Developing Country Perspective from India: Oxford University Press.
RD_Food. 2011. "Rangpur Dairy." edited by Rangpur Dairy & Food Products Limited, Dhaka. Rice, James B, and Federico Caniato. 2003. "Supply Chain Response to Terrorism: Creating
Resilient and Secure Supply Chains." Report by MIT Center for Transportation and Logistics.
Ritchie, Bob, and Clare Brindley. 2007. "Supply Chain Risk Management and Performance: A Guiding Framework for Future Development." International Journal of Operations & Production Management 27 (3): 303-322.
Ritchie, Bob, and Clare Brnidley. 2007a. "Supply Chain Risk Management and Performence a Guiding Framework for Future Development." International journal of operations and
production management 27 (3): 303-322. ———. 2007b. "Supply Chain Risk Management and Performence : A Guiding Framework for
Future Development." International journal of operations and production management 27 (3): 303-322.
Ritchie, Bob, and David Vaughan Marshall. 1993. Business Risk Management: Chapman & Hall. Ritchie, Jane, and Jane Lewis. 2003. Qualitative Research Practice: A Guide for Social Science
Students and Researchers: SAGE Publications Limited. Roth, Aleda V, Andy A Tsay, Madeleine E Pullman, and John V Gray. 2008. "Unraveling the Food
Supply Chain: Strategic Insights from China and the 2007 Recalls*." Journal of Supply Chain Management 44 (1): 22-39.
Saadullah, M. 2001. "Smallholder Dairy Production and Marketing in Bangladesh" Smallholder diary production and marketing—opportunities and constraints: Proceedings of a South-South Workshop,
Saadullah, M. 2000. "Smallholder Dairy Production and Marketing in Bangladesh.". ———. 2011. Smallholder Dairy Production and Marketing in Bangladesh. Accessed
14/11/2012, http://www.ilri.cgiar.org/InfoServ/Webpub/fulldocs/South_South/ch06.htm.

244
Saha, P M. 2007. Asia-Pacific Supply Chain Management: Weak Links in Bangladesh. The Ethical Corporation Magazine.
SAI. 2009. Principles & Practices for Sustainable Dairy Farming. www.saiplatform.org/uploads/Library/PPsDairy2009-2.pdf.
Sarkis, J. 2001. "Manufacturing’s Role in Corporate Environmental Sustainability." International Journal of Operations & Production Management 5 (6): 666-86.
Saunders, MJ. 1995. "Chains, Pipelines, Networks and Value Stream: The Role, Nature and Value of Such Metaphors in Forming Perceptions of the Task of Purchasing and Supply Management" First Worldwide Research Symposium on Purchasing and Supply Chain Management,
Savitz, Andrew W., and K. Weber. 2006. The Triple Bottom Line. San Francisco, CA.: Jossey-Bass. Schmitz, Andy. 2012. Oakhurst Dairy: Operations Management and Sustainability.
http://2012books.lardbucket.org/books/sustainable-business-cases/s14-case-oakhurst-dairy-operations.html.
Schoenherr, Tobias, VM Rao Tummala, and Thomas P Harrison. 2008. "Assessing Supply Chain Risks with the Analytic Hierarchy Process: Providing Decision Support for the Offshoring Decision by a Us Manufacturing Company." Journal of Purchasing and Supply Management 14 (2): 100-111.
Schwandt, T. A. 1994. "Constructivist, Interpretivist Approaches to Human Inquiry " In Handbook of Qualitative Research, eds N. K. Denzin and Y. S. Lincoln. Thousand Oaks, California: Sage Publications.
Seawright, Jason, and John Gerring. 2008. "Case Selection Techniques in Case Study Research a Menu of Qualitative and Quantitative Options." Political Research Quarterly 61 (2): 294-308.
Shahin, Arash. 2005. "Quality Function Deployment: A Comprehensive Review." Available Source: http://www. dci. ir/ravabet/f/shahin. pdf.
Shahnaz, Parvin, Kei-ichi Shimazaki, and Isao Kato. 2004. "Mil and Milk Prodicts in Bangladesh." Journal of Rakuno Gakuen University 29 (1): 9-16.
Shamsuddin, M, J U Ahmed, M G S Alam, and P C Modak. 1987. "Effect of Age of Semen on Conception Rate under Farm Condition." Bangladesh Veterinary Journal 21: 51-58.
Shamsuddin, M, MM Alam, MS Hossein, WJ Goodger, FY Bari, TU Ahmed, and MM Hossain. 2007. "Participatory Rural Appraisal to Identify Needs and Prospects of Market-Oriented Dairy Industries in Bangladesh." Tropical Animal Health and Production 39: 567-581.
Shamsuddin, M, MM Alam, MS Hossein, WJ Goodger, FY Bari, TU Ahmed, MM Hossain, and AHMSI Khan. 2007. "Participatory Rural Appraisal to Identify Needs and Prospects of Market-Oriented Dairy Industries in Bangladesh." Tropical animal health and production 39 (8): 567-581.
Shamsuddoha, A K, and Geoff Edwards. 2000. "Dairy Industry in Bangladesh: Problems and Prospects." In AARES 2000 Conference, School of Business, La Trobe University.
Shamsuddoha, Mohammad. 2009. "Dairy Farming-an Alternative Income Generating Activity." The Bulletin UASVM 66 (2): 352-356.
———. 2012. "Achieving Sustainability through Poultry Supply Chain" Emerging Research Initiatives and Developments in Business: CGSB Research Forum 2012, Perth, Australia: Curtin University.
———. 2014. "Integrated Supply Chain Model for Sustainable Poultry Production in Bangladesh: A System Dynamics Approach." Dissertation, Graduate School of Business (GSB), Curtin University, Perth, Australia. http://espace.library.curtin.edu.au:80/R?func=dbin-jump-full&local_base=gen01-era02&object_id=199515.
———. 2015. Prospects and Problems of Dairy Industry in Bangladesh, March 25, Information about Bangladesh dairy, South Khulshi, Chittagong, Bangladesh.
Shamsuddoha, Mohammad, Desmond Klass, and Mohammed Quaddus. 2011. "A Simulation Supply Chain Model for a Sustainable and Environment Friendly Poultry Industry: Insights from Bangladesh." In Australian and New Zealand Academy of Management (ANZAM), Wellington, New Zealand, December 07-09. edited by Kevin Voges and Bob Cavana, 1-12. Newzealand
Shamsuddoha, Mohammad, Mohammed Quaddus, and Desmond Klass. 2011. "Reducing Environmental Hazards through Reverse Supply Chain Model " 5TH Asian Business Research Conference, Dhaka, Bangladesh: World Business Institute (WBI).

245
Sheffi, Yosef. 2005. The Resilient Enterprise: Overcoming Vulnerability for Competitive Advantage: Mit Press.
Sheffi, Yossi, and J Rice. 2005. "A Supply Chain View of the Resilient Enterprise." MIT Sloan Management Review 47 (1).
Shrivastava, P. 1995. "The Role of Corporations in Achieving Ecological Sustainability " Academy of Management Review 20 (4): 936-60.
Shubik, Martin, and Richard J Herring. 1986. "Political Risk: Analysis, Process, and Purpose." Managing International Risk,(Cambridge: Cambridge University Press) pp: 109-138.
Sikdar, Subhas K. 2003. "Sustainable Development and Sustainability Metrics." AIChE journal 49 (8): 1928.
Simon, Herbert A. 1987. "Making Management Decisions: The Role of Intuition and Emotion." The Academy of Management Executive (1987-1989): 57-64.
Simpson, James R. 2006. "China’s Dairy Industry: Current Situation and Long-Term Projections" China's Evolvling Agriculture Economy conference,
Singh, Katar, and RS Pandir. 2001. "Problems and Prospects of Small Holder Dairy Production and Marketing in South Asia: An Overview" Regional paper presented in South-South Workshop, March,
Smith, J K. 1983. "Quantitative Versus Qualitative Research: An Attempt to Clarify the Issue." Educational Researcher 12 (3): 6-13.
Solaiman, Mohammed, and Ataur Rahman Belal. 1999. "An Account of the Sustainable Development Process in Bangladesh." Sustainable Development 7 (3): 121-131.
Sonesson, U, and J Berlin. 2003. "Environmental Impact of Future Milk Supply Chains in Sweden: A Scenario Study." Journal of Cleaner Production 11 (3): 253-266.
Sower, Victor E, Michael J Savoie, and Stephen Renick. 1999. An Introduction to Quality Management and Engineering: Based on the American Society for Quality's Certified Quality Engineer Body of Knowledge. Vol. 1: Prentice Hall.
Starik, M., and G.P. Rands. 1995. "Weaving an Integrated Web: Multilevel and Multisystem Perspectives of Ecologically Sustainable Organizations." Academy of Management Review 20 (4): 908-35.
Statistica. 2014. Major Producers of Cow Milk Worldwide in 2013, by Country (in Million Metric Tons). Statista, Inc. http://www.statista.com/statistics/268191/cow-milk-production-worldwide-top-producers/.
Stocker, GD. 1991. "Using Qfd to Identify Customer Needs." Quality Progress 24 (1): 120-120. Stulz, René M. 1996. "Rethinking Risk Management." Journal of applied corporate finance 9 (3):
8-25. Sultana, Nasrin. 2002. "Conceptualising Livelihoods of the Extreme Poor." Dhaka: Proshika,
mimeo. Svensson, G. 2000. "A Conceptual Framework for the Analysis of Vulnerability in Supply Chains."
International Journal of Physical Distribution & Logistics Management 30 (9/10): 21-35. Svensson, G. 2007. "Aspects of Sustainable Supply Chain Management (Sscm): Conceptual
Framework and Empirical Example." Supply Chain Management 12 (4): 262-266. Swanson, R A, and E F Holton. 2009. The Process of Framing Research in Organizations: Berrett-
Koehler Publishers. Tait, Peter, and Iris Vessey. 1988. "The Effect of User Involvement on System Success: A
Contingency Approach." MIS Quarterly 12 (1): 91-108. Tan, K.C., R.B. Handfield, and D.R. Krause. 1998. "Enhancing Firm's Performance through Quality
and Supply Base Management: An Empirical Study." International Journal of Production Research 36 (10): 2813-2837.
Tan, Keah Choon. 2002. "Supply Chain Management: Practices, Concerns, and Performance Issues." Journal of Supply Chain Management 38 (1): 42-53.
Tang, Christopher S. 2006a. "Robust Strategies for Mitigating Supply Chain Disruptions." International Journal of Logistics: Research and Applications 9 (1): 33-45.
Tang, Christopher, and Brian Tomlin. 2008. "The Power of Flexibility for Mitigating Supply Chain Risks." International Journal of Production Economics 116 (1): 12-27.
Tang, Ou. 2006b. "Perspectives in Supply Chain Risk Management. ." International Journal of Production Economics 103 (2): 451–488.
Tang, Ou, and S Nurmaya Musa. 2011. "Identifying Risk Issues and Research Advancements in Supply Chain Risk Management." International Journal of Production Economics 133: 25-34.

246
Tashakkori, A., and C. Teddlie. 1998. Mixed Methodology: Combining Qualitative and Quantitative Approaches. Vol. 46, Applied Social Research Methods Series. California: Sage Publications, Inc.
Tashakkori, Abbas, and Charles Teddlie. 2003. "The Past and Future of Mixed Methods Research: From Data Triangulation to Mixed Model Designs." Handbook of mixed methods in social and behavioral research: 671-701.
Teddlie, Charles, and Abbas Tashakkori. 2003. "Major Issues and Controveries Inthe Use of Mixed Methods in the Social and Behvioral Sciences." Handbook of mixed methods in social & behavioral research: 3-50.
TheDairySite. 2013. The Bangladesh Dairy Market: Times of Change. USDA. Accessed April 10, http://www.thedairysite.com/articles/3633/the-bangladesh-dairy-market-times-of-change/#sthash.HWdkR4La.dpuf.
Thomas, Andrew P. 1986. "The Contingency Theory of Corporate Reporting: Some Empirical Evidence." Accounting, Organizations and Society 11 (3): 253-270.
Thornton, Philip K. 2010. "Livestock Production: Recent Trends, Future Prospects." Philosophical Transactions of the Royal Society B: Biological Sciences 365 (1554): 2853-2867.
Thun, Jorn-Henrik, and Daniel Hoenig. 2011. "An Empirical Analysis of Supply Chain Risk Management in the German Automotive Industry." International Journal of ProductionEconomics 131: 242-249.
Tilman, David, Kenneth G Cassman, Pamela A Matson, Rosamond Naylor, and Stephen Polasky. 2002. "Agricultural Sustainability and Intensive Production Practices." Nature 418 (6898): 671-677.
Tilman, David, David Wedin, and Johannes Knops. 1996. "Productivity and Sustainability Influenced by Biodiversity in Grassland Ecosystems."
Ting, Wenlee. 1988. "Multinational Risk Assessment and Management: Strategies for Investment and Marketing Decisions." The International Executive 30 (2‐3): 31-33.
Tipples, Rupert, and Stuart Morriss. 2002. "The Farm Labour Crisis." Primary Industry Management 5 (3): 25-27.
Tosi, Henry L., and John W. Slocum. 1984. "Contingency Theory: Some Suggested Directions." Journal of Management 1984 10: 9 10 (1): 9-26.
Tress, Bärbel, Gunther Tress, and Gary Fry. 2006. "Defining Concepts and the Process of Knowledge Production in Integrative Research." From landscape research to landscape planning: 13-26.
Trkman, Peter, and Kevin McCormack. 2009. "Supply Chain Risk in Turbulent Environments - a Conceptual Model for Managing Supply Chain Network Risk." International Journal of Production Economics 119: 247–258.
Uddin, M M, M N Sultana, O A Ndambi, O Alqaisi, T Hemme, and K J Peters. 2011. "Milk Production Trends and Dairy Development in Bangladesh." Outlook on AGRICULTURE 40 (3): 263-271.
Uddin, R. 2003. "Existing Extension System: Strengths, Weaknesses and Proposed Reforms in Bangladesh" Regional Workshop on Operationalizing Reforms in Agricultural Extension in South Asia New Delhi, India,
UNDP. 2009. Human Developmet Report. UNDP. Accessed September 05, http://www.undp.org/content/undp/en/home/ourwork/crisispreventionandrecovery/overview.html and http://hdrstats.undp.org/en/countries/country_fact_sheets/cty_fs_BGD.html.
van Asseldonk, Marcel APM, and Miranda PM Meuwissen. 2006. "Public and Private Schemes Indemnifying Epidemic Livestock Losses in the European." The Economics of Livestock Disease Insurance: Concepts, Issues and International Case Studies: 115.
Venkatesh, Viswanath. 2006. "Where to Go from Here? Thoughts on Future Directions for Research on Individual‐Level Technology Adoption with a Focus on Decision Making*." Decision Sciences 37 (4): 497-518.
Venkatesh, Viswanath, Susan A Brown, and Hillol Bala. 2013. "Bridging the Qualitative-Quantitative Divide: Guidelines for Conducting Mixed Methods Research in Information Systems." MIS quarterly 37 (1): 21-54.
Wagner, Stephan M, and Christoph Bode. 2006. "An Empirical Investigation into Supply Chain Vulnerability." Journal of Purchasing and Supply Management 12 (6): 301-312.

247
Wakeford, Jeremy J. 2012. "Socioeconomic Implications of Global Oil Depletion for South Africa: Vulnerabilities, Impacts and Transition to Sustainability." Stellenbosch: Stellenbosch University.
Walker, Mike. 2002. "Customer-Driven Breakthroughs Using Qfd and Policy Deployment." Management Decision 40 (3): 248-256.
Wang, Hsiao-Fan, and Wei-Kuo Hong. 2007. "An Integrated Service Strategy by Qfd Approach: A Case of a Telecom Company in Taiwan." International Journal of Management and Decision Making 8 (2): 251-267.
Wang, Qingbin, Robert Parsons, and Guangxuan Zhang. 2010. "China's Dairy Markets: Trends, Disparities, and Implications for Trade." China Agricultural Economic Review 2 (3): 356-371.
Wang, Yanling, and Xiaohua Yu. 2012. "Productivity, Efficiency and Structural Problems in Chinese Dairy Farms." China Agricultural Economic Review 4 (2): 168-175.
Ward, Stephen C. 1999. "Assessing and Managing Important Risks." International Journal of Project Management 17 (6): 331-336.
WCED. 1987. Our Common Future (the Brundtland Report), Chapter 2: Towards Sustainable Development. New York, NY.
Wein, Lawrence M, and Yifan Liu. 2005. "Analyzing a Bioterror Attack on the Food Supply: The Case of Botulinum Toxin in Milk." Proceedings of the National Academy of Sciences of the United States of America 102 (28): 9984-9989.
Whiteman, Gail, and William H Cooper. 2000. "Ecological Embeddedness." Academy of Management Journal 43 (6): 1265-1282.
Wilkes, Gerald Alfred, and William Alwyn Krebs. 1995. Collins English Dictionary: An Extensive Coverage of Contemporary International and Australian English: HarperCollinsPublishers.
Wilson, David C. 1982. "Electricity and Resistance: A Case Study of Innovation and Politics." Organization Studies 3 (2): 119-140.
Wilson, PN, TR Luginsland, and DV Armstrong. 1988. "Risk Perceptions and Management Responses of Arizona Dairy Producers." Journal of Dairy Science 71 (2): 545-551.
Wiseman, Robert M, and Luis R Gomez-Mejia. 1998. "A Behavioral Agency Model of Managerial Risk Taking." Academy of management Review 23 (1): 133-153.
Wisner, Joel, Keah-Choon Tan, and G Leong. 2015. Principles of Supply Chain Management: A Balanced Approach: Cengage Learning.
Wolf, Christopher A, J Roy Black, and Joleen C Hadrich. 2009. "Upper Midwest Dairy Farm Revenue Variation and Insurance Implications." Agricultural Finance Review 69 (3): 346-358.
Yin, Robert K. 2011. Applications of Case Study Research: Sage. Yin, Robert K. 1994. Case Study Research: Design and Methods. Vol. 2nd ed. Newbury Park, CA:
Sage. ———. 2003. Case Study Research: Design and Methods. Vol. 5th Ed.: Sage. ———. 2009. Case Study Research: Design and Methods. Zeithaml, Valarie A., P Rajan Varadarajan, and Carl P Zeithaml. 1988a. "The Contingency
Approach: Its Foundations and Relevance to Theory Building and Research in Marketing." European Journal of Marketing 22 (7): 37-64.
Zeithaml, Valarie A., P. Rajan Varadarajan, and Carl P. Zeithaml. 1988b. "The Contingency Approach: Its Foundations and Relevance to Theory Building and Research in Marketing." European Journal of Marketing 22 (7): 37 - 64.
Zia, U. 2007. "Improved Market Access and Smallholder Dairy Farmer Participation for Sustainable Dairy Development." Consultancy Report CFCIFIGMDP/16FT. Lessons Learned Study. Islamabad, Pakistan.
ZIA, UMME. 2006. "Analysis of Milk Marketing Chain." Zikmund, William. 2000. G.(2000), Business Research Methods. Fort Worth, TX: Dryden Press. Zokaei, Keivan, and Peter Hines. 2007. "Achieving Consumer Focus in Supply Chains."
International Journal of Physical Distribution & Logistics Management 37 (3): 223-247. Zsidisin, George A, Alex Panelli, and Rebecca Upton. 2000. "Purchasing Organization
Involvement in Risk Assessments, Contingency Plans, and Risk Management: An Exploratory Study." Supply Chain Management: An International Journal 5 (4): 187-198.

248
APPENDICES
4 A. Survey Questionnaires
This survey questionnaire is for Supply Chain Risk Management for Dairy Industry in Bangladesh. It consists of two sections: (i) Probability of occurrence and likely impact of a Dairy risk and (ii) Risk mitigation strategies for the risks and cost of implementation risk mitigation strategy. Section 1: Probability of occurrence and likely impact of dairy risk The dairy supply chain, which entangles several stakeholders, may get disrupted due to various risks arising within the chain. Proper identification, frequent realisation of risks and effective management strategies are most essential for the better performance of the supply chain. Through review of literature, dairy supply chain risks existing in Bangladesh are identified. However, these risks are contextual and vary greatly in regard to their occurrence and likely impact to the supply chain. For each of the risks listed in this section, please circle the number that best indicates the likely occurrence of a particular risk and its likely impact on the dairy supply chain for Bangladesh. The sequence followed in presenting the risks does not represent any importance or priority of the risk over other in the supply chain.
Risk Probability
Risk Sl. No.
Dairy Supply Chain Risk
Impact of Risk
0 5 9 Probability scale
0 5 9 Impact scale
Please circle as appropriate Please circle as appropriate
0 1 Inadequate loan facilities 0
0 2 Complex loan procedures 0
0 3 High rate of interest 0
0 4 Inadequate finance 0
0 5 Absence of insurance or compensation coverage
0
0 6 Shortage of improved technology (Milking machine, feed mixture, grass cutting, improved processing facilities)
0
0 7 Labour disputes 0
0 8 Illiteracy and inefficiency of worker 0
0 9 Shortage of skilled staff 0
0 10 Switching of staff frequently 0
0 11 Lack of fixed government policy in dairy sector
0
0 12 Poor law and order situation (terrorism, musclemen ship)
0
Cannot occur
Certain to occur
May or may not occur
Low Moderate High

249
0 13 Hartal and strike cause delay in work process
0
0 14 Political Unrest and interference 0
0 15 Corruption ( adulteration by mixing water)
0
0 16 Damage of farm’s assets 0
0 17 Theft 0
0 18 Natural disaster ( flood, excessive rain, storm)
0
0 19 Quick perishability of Milk 0
0 20 Machine damage/breakdown at cold storage
0
0 21 Inadequate chilling facilities 0
0 22 Inadequate cold storage 0
0 23 Spoilage of milk through improper handling
0
0 24 Bacterial contamination for improper temperature
0
0 25 Pollution and Unhygienic environment 0
0 26 Cattle diseases 0
0 27 Machine damage/breakdown at processing unit
0
0 28 Fire at farm shed 0
0 29 Accident (Staff injury) 0
0 30 Inadequate supply of quality feed 0
0 31 High cost of feed and medicine 0
0 32 Scarcity of feed 0
0 33 Lack of upgrade vaccination and veterinary services
0
0 34 Shortage of land for expanding farm 0
0 35 Irregular supply of vaccine from government
0
0 36 Competition among the farms 0
0 37 Bureaucratic complexity on maintaining various formalities
0
0 38 Drought leads to a decline in milk production
0

250
0 39 Accidents of transport vehicle 0
0 40 Existence of middlemen/ too many middlemen
0
0 41 Too long chain cause delay in product movement
0
0 42 Poor conditioned road for moving product (delay & spoilage)
0
0 43 Inadequate transport facilities to move products frequently
0
0 44 Lack of milk tanker (refrigerated) 0
0 45 Unethical behaviour of middle men (adulteration, added price, deprivation)
0
Section 2: Dairy Supply Chain Risk Mitigation Strategies
I. Instructions to assess the relation between risks and risk mitigation strategies: Risk mitigation is the action which is taken for preventing possible risk to people or property. Risk mitigation strategies are actions that help industry to avoid or minimize impacts of risks and help to achieve business objectives. Through the review of literature, risk mitigation strategies for dairy supply chain risks are identified and presented in the following table with dairy supply chain risk issues. Not all strategies are relevant, appropriate or effective with same level of performance to mitigate a specific risk. Please assess each strategy in relation to its relevance to a particular risk and score it based on the following scale. 1--- Little relevant 5---moderately relevant 9---Highly relevant
II. Assessment of relative cost of implementing risk mitigation strategies: Relative cost of risk mitigation strategy is the cost of implementation of risk mitigation
a) Assess the largest cost of implementation a risk mitigation strategy; Score it as 100. b) Assess the lowest cost of implementation a risk mitigation strategy; Score it as 10 c) Assess the remaining risk mitigation strategies compared to the highest and lowest cost
strategies and score a number in between 10 and 100. Note: Example of assessment matrix (partial) is provided in Appendix 1 for your convenience.

251
I. Assessment of relation between risks and risk mitigation strategies Appendix 4A1: (First 23 Risk with first 11 mitigation strategy)
Strategy Number 1 2 3 4 5 6 7 8 9 10 11
Ris
k N
um
ber
Risk Mitigation Strategy Dairy Supply Chain Risk
Ad
op
tio
n o
f im
pro
ved
te
chn
olo
gy (
Mil
kin
g m
ach
ine,
fe
ed m
ixtu
re, g
rass
cu
ttin
g,
imp
rove
d p
roce
ssin
g fa
cili
ties
) B
uy
ing
insu
ran
ce a
gain
st
pro
du
ctio
n lo
ss.
Hir
ing
skil
led
sta
ff
Mo
tiv
atio
nal
an
d i
nce
nti
ves
faci
liti
es f
or
staf
f
Init
iati
ve t
o r
emo
ve
po
liti
cal
un
cert
ain
ty
Imp
lem
enta
tio
n o
f a
fix
ed
po
licy
fo
r d
airy
sec
tor
Ass
ura
nce
of
adeq
uat
e in
stit
uti
on
al c
red
it s
up
po
rt w
ith
lo
w r
ate
of
inte
rest
Intr
od
uci
ng
off
-far
m a
ctiv
itie
s
Fo
cus
on
val
ue
add
itio
n
Pro
mo
te s
ou
nd
bu
sin
ess
pra
ctic
es b
y c
oo
per
atio
n, b
ette
r co
ord
inat
ion
an
d in
form
atio
n
shar
ing
Red
uct
ion
of
risk
s th
rou
gh
mer
ger,
acq
uis
itio
n a
nd
in
tegr
atio
n
1 Inadequate loan facilities
2 Complex loan procedures
3 High rate of interest
4 Inadequate finance
5 Absence of insurance or compensation coverage
6
Shortage of improved technology (Milking machine, feed mixture, grass cutting, improved processing facilities)
7 Labour disputes
8 Illiteracy and inefficiency of worker
9 Shortage of skilled staff
10 Switching of staff frequently
11 Lack of fixed government policy in dairy sector
12 Poor law and order situation (terrorism, musclemen ship)
13 Hartal and strike cause delay in work process
14 Political Unrest and interference
15 Corruption ( adulteration by mixing water)
16 Damage of farm’s assets
17 Theft
18 Natural disaster ( flood, excessive rain, storm)
19 Quick perishability of Milk
20 Machine damage/breakdown at cold storage
21 Inadequate chilling facilities
22 Inadequate cold storage
23 Spoilage of milk through improper handling

252
Appendix: 4A2 (Second 22 Risk with first 11 mitigation strategy) Strategy Number 1 2 3 4 5 6 7 8 9 10 11
Ris
k N
um
ber
Risk Mitigation Strategy Dairy Supply Chain Risk
Ad
op
tio
n o
f im
pro
ved
tec
hn
olo
gy
(Mil
kin
g m
ach
ine,
fee
d m
ixtu
re,
gras
s cu
ttin
g, im
pro
ved
p
roce
ssin
g fa
cili
ties
)
Bu
yin
g in
sura
nce
aga
inst
p
rod
uct
ion
loss
.
Hir
ing
skil
led
sta
ff
Mo
tiv
atio
nal
an
d i
nce
nti
ves
faci
liti
es f
or
staf
f
Init
iati
ve t
o r
emo
ve
po
liti
cal
un
cert
ain
ty
Imp
lem
enta
tio
n o
f a
fix
ed p
oli
cy
for
dai
ry s
ecto
r
Ass
ura
nce
of
adeq
uat
e in
stit
uti
on
al c
red
it s
up
po
rt w
ith
lo
w r
ate
of
inte
rest
.
Intr
od
uci
ng
off
-far
m a
ctiv
itie
s
Fo
cus
on
val
ue
add
itio
n
Pro
mo
te s
ou
nd
bu
sin
ess
pra
ctic
es
by
co
op
erat
ion
, bet
ter
coo
rdin
atio
n a
nd
info
rmat
ion
sh
arin
g
Red
uct
ion
of
risk
s th
rou
gh
mer
ger,
acq
uis
itio
n a
nd
in
tegr
atio
n.
24 Bacterial contamination for improper temperature
25 Pollution and Unhygienic environment
26 Cattle diseases
27 Machine amage/breakdown at processing unit
28 Fire at farm shed
29 Accident (Staff injury)
30 Inadequate supply of quality feed
31 High cost of feed and medicine
32 Scarcity of feed
33 Lack of upgrade vaccination and veterinary services
34 Shortage of land for expanding farm
35 Irregular supply of vaccine from government
36 Competition among the farms
37 Bureaucratic complexity on maintaining various formalities
38 Drought leads to a decline in milk production
39 Accidents of transport vehicle
40 Existence of middlemen/too many middlemen
41 Too long chain cause delay in product movement
42 Poor conditioned road for moving product (delay & spoilage)
43 Inadequate transport facilities to move products frequently
44 Lack of milk tanker (refrigerated)
45 Unethical behaviour of middle men (adulteration, added price, deprivation)

253
Appendix: 4A3 (First 23 Risk with second 12 mitigation strategy) Strategy Number 12 13 14 15 16 17 18 19 20 21 22 23
Ris
k N
um
ber
Risk Mitigation Strategy Dairy Supply Chain Risk A
rran
gem
ent
of
pro
per
tra
inin
g to
th
e st
aff
rega
rdin
g te
mp
erat
ure
co
ntr
ol
Ad
op
tio
n o
f al
tern
ativ
e su
pp
ly o
f p
ow
er f
or
cold
sto
rage
( p
ow
erfu
l ge
ner
ato
r)
Arr
ange
men
t o
f p
rop
er t
rain
ing
to
the
staf
f r
egar
din
g p
roce
ssin
g an
d
hy
gien
e m
anag
emen
t
Att
emp
ts t
o c
reat
e va
rio
us
cro
ss
bre
eds
by
ado
pti
ng
AI
serv
ices
.
Lea
se a
ban
do
ned
lan
d t
o t
he
farm
ers
for
dai
ry f
arm
ing
Stre
ngt
hen
th
e re
gula
r su
pp
ly o
f v
acci
ne
Init
iati
ve t
o r
edu
ce t
he
cost
of
feed
Su
pp
ort
to
dev
elo
p t
ech
no
logy
F
ocu
s o
n c
erti
fied
fee
d s
up
pli
er t
o
get
qu
alit
y f
eed
.
Arr
ange
men
t o
f ad
equ
ate
gras
slan
d f
or
pro
du
cin
g N
apie
r gr
ass
Arr
ange
men
t o
f re
gula
r v
acci
nat
ion
fo
r th
e ca
ttle
Arr
ange
men
t o
f im
pro
ved
an
d
up
grad
ed v
eter
inar
y s
erv
ices
1 Inadequate loan facilities
2 Complex loan procedures
3 High rate of interest
4 Inadequate finance
5 Absence of insurance or compensation coverage
6
Shortage of improved technology (Milking machine, feed mixture, grass cutting, improved processing facilities)
7 Labour disputes
8 Illiteracy and inefficiency of worker
9 Shortage of skilled staff
10 Switching of staff frequently
11 Lack of fixed government policy in dairy sector
12 Poor law and order situation (terrorism, musclemen ship)
13 Hartal and strike cause delay in work process
14 Political Unrest and interference
15 Corruption (adulteration by mixing water)
16 Damage of farm’s assets
17 Theft
18 Natural disaster (flood, excessive rain, storm)
19 Quick perishability of Milk
20 Machine damage/breakdown at cold storage
21 Inadequate chilling facilities
22 Inadequate cold storage
23 Spoilage of milk through improper handling
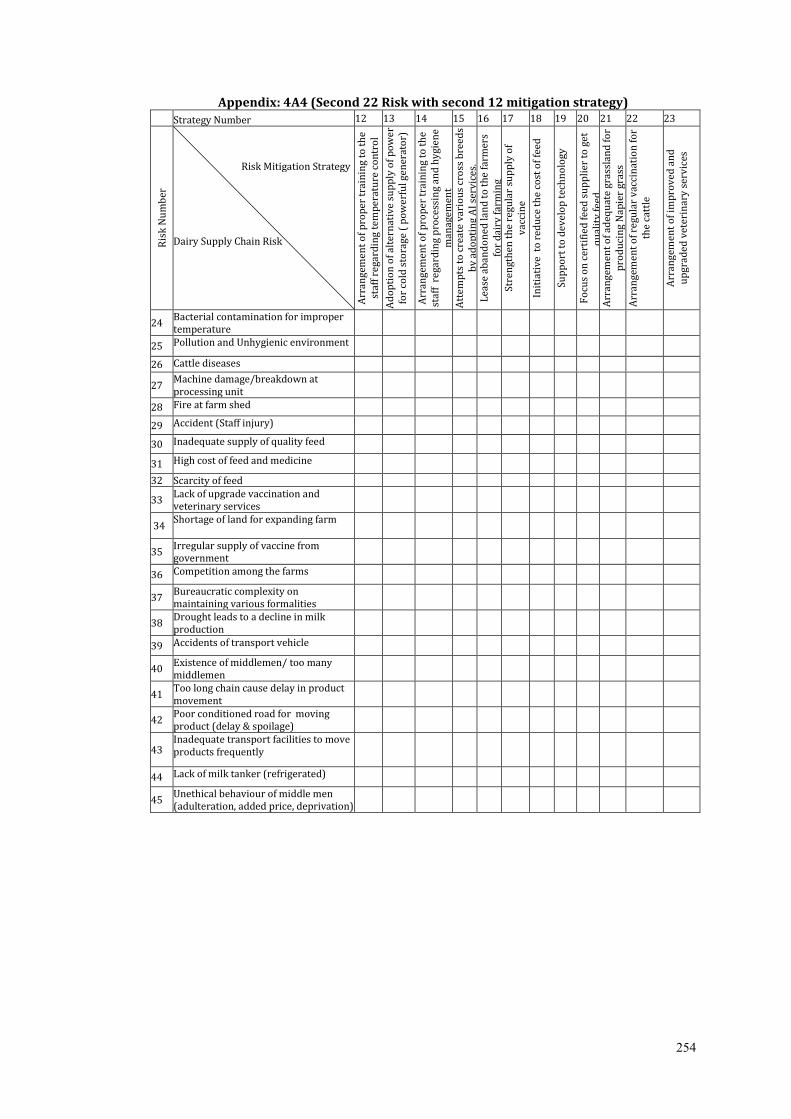
254
Appendix: 4A4 (Second 22 Risk with second 12 mitigation strategy)
Strategy Number 12 13 14 15 16 17 18 19 20 21 22 23
Ris
k N
um
ber
Risk Mitigation Strategy Dairy Supply Chain Risk A
rran
gem
ent
of
pro
per
tra
inin
g to
th
e st
aff
rega
rdin
g te
mp
erat
ure
co
ntr
ol
Ad
op
tio
n o
f al
tern
ativ
e su
pp
ly o
f p
ow
er
for
cold
sto
rage
( p
ow
erfu
l gen
erat
or)
Arr
ange
men
t o
f p
rop
er t
rain
ing
to t
he
staf
f r
egar
din
g p
roce
ssin
g an
d h
ygi
ene
man
agem
ent
Att
emp
ts t
o c
reat
e va
rio
us
cro
ss b
reed
s b
y a
do
pti
ng
AI
serv
ices
. L
ease
ab
and
on
ed la
nd
to
th
e fa
rmer
s fo
r d
airy
far
min
g St
ren
gth
en t
he
regu
lar
sup
ply
of
vac
cin
e
Init
iati
ve t
o r
edu
ce t
he
cost
of
feed
Sup
po
rt t
o d
evel
op
tec
hn
olo
gy
F
ocu
s o
n c
erti
fied
fee
d s
up
pli
er t
o g
et
qu
alit
y fe
ed.
Arr
ange
men
t o
f ad
equ
ate
gras
slan
d f
or
pro
du
cin
g N
apie
r gr
ass
Arr
ange
men
t o
f re
gula
r v
acci
nat
ion
fo
r th
e ca
ttle
Arr
ange
men
t o
f im
pro
ved
an
d
up
grad
ed v
eter
inar
y s
erv
ices
24 Bacterial contamination for improper temperature
25 Pollution and Unhygienic environment
26 Cattle diseases
27 Machine damage/breakdown at processing unit
28 Fire at farm shed
29 Accident (Staff injury)
30 Inadequate supply of quality feed
31 High cost of feed and medicine
32 Scarcity of feed
33 Lack of upgrade vaccination and veterinary services
34 Shortage of land for expanding farm
35 Irregular supply of vaccine from government
36 Competition among the farms
37 Bureaucratic complexity on maintaining various formalities
38 Drought leads to a decline in milk production
39 Accidents of transport vehicle
40 Existence of middlemen/ too many middlemen
41 Too long chain cause delay in product movement
42 Poor conditioned road for moving product (delay & spoilage)
43 Inadequate transport facilities to move products frequently
44 Lack of milk tanker (refrigerated)
45 Unethical behaviour of middle men (adulteration, added price, deprivation)

255
Appendix: 4A5 (First 23 Risks with third 09 mitigation strategy)
Strategy Number 24 25 26 27 28 29 30 31 32
Ris
k N
um
ber
Risk Mitigation Strategy Dairy Supply Chain Risk B
uil
din
g m
ult
i-st
ore
yed
co
mp
lex
for
farm
ext
ensi
on
B
uil
din
g m
on
ito
rin
g te
am
Init
iati
ve
to d
evel
op
ro
ads
and
h
igh
way
s A
rran
gem
ent
of
adeq
uat
e n
um
ber
o
f tr
ansp
ort
Arr
ange
men
t o
f re
frig
erat
ed
tran
spo
rt f
acil
itie
s D
evel
op
men
t o
f ro
ads
and
hig
hw
ay
Fo
cus
on
pro
du
ct d
iver
sifi
cati
on
Rem
ov
al o
f u
nn
eces
sary
infl
uen
ce
of
mid
dle
men
D
irec
t m
ark
etin
g
1 Inadequate loan facilities
2 Complex loan procedures
3 High rate of interest
4 Inadequate finance
5 Absence of insurance or compensation coverage
6 Shortage of improved technology (Milking machine, feed mixture, grass cutting, improved processing facilities)
7 Labour disputes
8 Illiteracy and inefficiency of worker
9 Shortage of skilled staff
10 Switching of staff frequently
11 Lack of fixed government policy in dairy sector
12 Poor law and order situation (terrorism, musclemen ship)
13 Hartal and strike cause delay in work process
14 Political Unrest and interference
15 Corruption ( adulteration by mixing water)
16 Damage of farm’s assets
17 Theft
18 Natural disaster ( flood, excessive rain, storm)
19 Quick perishability of Milk
20 Machine damage/breakdown at cold storage
21 Inadequate chilling facilities
22 Inadequate cold storage
23 Spoilage of milk through improper handling

256
Appendix: 4A6 (Second 22 Risk with third 09 mitigation strategy)
Strategy Number 24 25 26 27 28 29 30 31 32
Ris
k N
um
ber
Risk Mitigation Strategy Dairy Supply Chain Risk
Bu
ild
ing
mu
lti-
sto
rey
ed
com
ple
x fo
r fa
rm e
xten
sio
n
Bu
ild
ing
mo
nit
ori
ng
team
Init
iati
ve
to d
evel
op
ro
ads
and
hig
hw
ays
Arr
ange
men
t o
f ad
equ
ate
nu
mb
er o
f tr
ansp
ort
A
rran
gem
ent
of
refr
iger
ated
tra
nsp
ort
fa
cili
ties
D
evel
op
men
t o
f ro
ads
and
h
igh
way
Fo
cus
on
pro
du
ct
div
ersi
fica
tio
n
Rem
ov
al o
f u
nn
eces
sary
in
flu
ence
of
mid
dle
men
Dir
ect
mar
ket
ing
24 Bacterial contamination for improper temperature
25 Pollution and Unhygienic environment
26 Cattle diseases
27 Machine damage/breakdown at processing unit
28 Fire at farm shed
29 Accident (Staff injury)
30 Inadequate supply of quality feed
31 High cost of feed and medicine
32 Scarcity of feed
33 Lack of upgrade vaccination and veterinary services
34 Shortage of land for expanding farm
35 Irregular supply of vaccine from government
36 Competition among the farms
37 Bureaucratic complexity on maintaining various formalities
38 Drought leads to a decline in milk production
39 Accidents of transport vehicle
40 Existence of middlemen/ too many middlemen
41 Too long chain cause delay in product movement
42 Poor conditioned road for moving product (delay & spoilage)
43 Inadequate transport facilities to move products frequently
44 Lack of milk tanker (refrigerated)
45 Unethical behaviour of middle men (adulteration, added price, deprivation)

257
B. Assessment of Relative Cost of Implementing Mitigation Strategies
Mitigation Strategies
1 2 3 4 5 6 7 8 9 10 11
Ad
op
tio
n o
f im
pro
ved
tec
hn
olo
gy
(Mil
kin
g m
ach
ine,
fee
d m
ixtu
re,
gras
s cu
ttin
g, i
mp
rov
ed p
roce
ssin
g fa
cili
ties
)
Bu
yin
g in
sura
nce
aga
inst
p
rod
uct
ion
loss
.
Hir
ing
skil
led
sta
ff
Mo
tiv
atio
nal
an
d in
cen
tive
s fa
cili
ties
fo
r st
aff
Init
iati
ve
to r
emo
ve
po
liti
cal
un
cert
ain
ty
Imp
lem
enta
tio
n o
f a
fix
ed p
oli
cy f
or
dai
ry s
ecto
r
Ass
ura
nce
of
adeq
uat
e in
stit
uti
on
al
cred
it s
up
po
rt w
ith
low
rat
e o
f in
tere
st.
Intr
od
uci
ng
off
-far
m a
ctiv
itie
s
Fo
cus
on
val
ue
add
itio
n a
nd
p
rod
uct
div
ersi
fica
tio
n
Pro
mo
te s
ou
nd
bu
sin
ess
pra
ctic
es
by
co
op
erat
ion
, bet
ter
coo
rdin
atio
n
and
info
rmat
ion
sh
arin
g
Red
uct
ion
of
risk
s th
rou
gh m
erge
r,
acq
uis
itio
n a
nd
in
tegr
atio
n
Relative Cost
Mitigation Strategies
12 13 14 15 16 17 18 19 20 21 22 23
Arr
ange
men
t o
f p
rop
er t
rain
ing
to t
he
staf
f re
gard
ing
tem
per
atu
re c
on
tro
l
Ad
op
tio
n o
f al
tern
ativ
e su
pp
ly o
f p
ow
er f
or
cold
sto
rage
(p
ow
erfu
l ge
ner
ato
r)
Arr
ange
men
t o
f p
rop
er t
rain
ing
to t
he
staf
f r
egar
din
g p
roce
ssin
g an
d
hy
gien
e m
anag
emen
t A
ttem
pts
to
cre
ate
vari
ou
s cr
oss
b
reed
s b
y a
do
pti
ng
AI
serv
ices
.
Lea
se a
ban
do
ned
lan
d t
o t
he
farm
ers
for
dai
ry f
arm
ing
Stre
ngt
hen
th
e re
gula
r su
pp
ly o
f v
acci
ne
Init
iati
ve
to
red
uce
th
e co
st o
f fe
ed
Sup
po
rt t
o d
evel
op
tec
hn
olo
gy
Fo
cus
on
cer
tifi
ed f
eed
su
pp
lier
to
get
q
ual
ity
fee
d.
Arr
ange
men
t o
f ad
equ
ate
gras
slan
d
for
pro
du
cin
g N
apie
r gr
ass
Arr
ange
men
t o
f re
gula
r v
acci
nat
ion
fo
r th
e ca
ttle
Arr
ange
men
t o
f im
pro
ved
an
d
up
grad
ed v
eter
inar
y se
rvic
es
Relative Cost
Mitigation Strategies
24 25 26 27 28 29 30 31 32
Bu
ild
ing
mu
lti-
sto
rey
ed
com
ple
x fo
r fa
rm e
xten
sio
n
Bu
ild
ing
mo
nit
ori
ng
team
Init
iati
ve
to d
evel
op
ro
ads
and
hig
hw
ays
Arr
ange
men
t o
f ad
equ
ate
nu
mb
er o
f tr
ansp
ort
Arr
ange
men
t o
f re
frig
erat
ed
tran
spo
rt f
acil
itie
s
Dev
elo
pm
ent
of
road
s an
d
hig
hw
ay
Val
ue
add
itio
n a
nd
pro
du
ct
div
ersi
fica
tio
n
Rem
ov
al o
f u
nn
eces
sary
in
flu
ence
of
mid
dle
men
Dir
ect
mar
ket
ing
Relative Cost

258
Response Sample for Appendix 4A (I & II)
Strategy Number 1 2 3 4 5 6 7 8 9 10 11
Ris
k N
um
ber
Risk Mitigation Strategy Dairy Supply Chain Risk
Ad
op
tio
n o
f im
pro
ved
tec
hn
olo
gy
(Mil
kin
g m
ach
ine,
fee
d m
ixtu
re, g
rass
cu
ttin
g, i
mp
rov
ed p
roce
ssin
g fa
cili
ties
)
Bu
yin
g in
sura
nce
aga
inst
pro
du
ctio
n
loss
.
Hir
ing
skil
led
sta
ff
Mo
tiv
atio
nal
an
d in
cen
tive
s fa
cili
ties
fo
r st
aff
Init
iati
ve
to r
emo
ve
po
liti
cal u
nce
rtai
nty
Imp
lem
enta
tio
n o
f a
fix
ed p
oli
cy f
or
dai
ry s
ecto
r
Ass
ura
nce
of
adeq
uat
e in
stit
uti
on
al
cred
it s
up
po
rt w
ith
low
rat
e o
f in
tere
st.
Intr
od
uci
ng
off
-far
m a
ctiv
itie
s
Fo
cus
on
val
ue
add
itio
n a
nd
pro
du
ct
div
ersi
fica
tio
n
Pro
mo
te s
ou
nd
bu
sin
ess
pra
ctic
es b
y
coo
per
atio
n, b
ette
r co
ord
inat
ion
an
d
info
rmat
ion
sh
arin
g
Red
uct
ion
of
risk
s th
rou
gh m
erge
r,
acq
uis
itio
n a
nd
in
tegr
atio
n.
1 Inadequate loan facilities 9
5 9 1
2 Complex loan procedures
3 High rate of interest
9 1
4 Inadequate finance
9
5
5 Absence of insurance or compensation coverage
9 5
5
6 Shortage of improved technology (Milking machine, feed mixture,
grass cutting, improved processing facilities) 9
5
5 5
5 5
7 Labour disputes
5 9
1
8 Illiteracy and inefficiency of worker
1 9
9 Shortage of skilled staff
9 9
5 1
10 Switching of staff frequently
9 5
9 1
11 Lack of fixed government policy in dairy sector
9
5 1
12 Poor law and order situation (terrorism, musclemen ship)
9
13 Hartal and strike cause delay in work process
9 9
5
14 Political Unrest and interference
5
9 5
15 Corruption ( adulteration by mixing water)
5
9 5
16 Damage of farm’s assets
9
5

259
17 Theft
9 1 9
1
1
18 Natural disaster ( flood, excessive rain, storm)
5
9
19 Quick perishability of Milk
9
5 5
20 Machine damage/breakdown in cold storage 9 9 5 5
21 Fire in chilling centre
9 9
22 Inadequate chilling facilities 9 5 9
9
23 Inadequate cold storage 9
Relative Cost 90 90 90 50 40 60 80 50 70 60 40
4B. Survey questionnaires Survey Questionnaire for QFD Part III Instructions to assess the relation between risk mitigation strategies and sustainable outcomes Through the review of literatures, qualitative interview and optimisation by QFD method some risk mitigation strategies for dairy supply chain risks are finalised and presented in the following table with sustainable outcomes. Not all outcomes are achievable with same level of implementing mitigation strategies. Please assess each outcome in relation to its relevance to a particular strategy and score it based on the following scale. 0--- No relevant 1--- Little relevant 5---Moderately relevant 9---Highly relevant

260
Appendix 4B: Assessment of Relation between Mitigation Strategies and Sustainable Outcomes
SL N
o
Sustainable Outcome Mitigation Strategy
Pro
fit
max
imis
atio
n
Co
st m
inim
isat
ion
Incr
ease
in
in
com
e
Incr
ease
in
pro
du
ctio
n
Pro
du
ct q
ual
ity
im
pro
vem
ent
Exp
ansi
on
of
farm
ing
syst
em
Pro
du
ctio
n o
f va
lue
add
ed
pro
du
ct a
nd
div
ersi
fied
pro
du
ct
Go
od
wil
l en
han
cem
ent
Sup
ply
of
qu
alit
y f
oo
d
Nu
trit
ion
al d
evel
op
men
t
Imp
rov
emen
t o
f li
vin
g st
and
ard
Cre
atio
n o
f em
plo
ym
ent
op
po
rtu
nit
y
Cre
atio
n o
f so
un
d w
ork
ing
env
iro
nm
ent
Was
te m
anag
emen
t
Hea
lth
im
pro
vem
ent
of
catt
le(A
nim
al Q
ual
ity
)
S1 Adoption of improved technology (Milking machine, feed mixture, grass
cutting, improved processing facilities)
S2 Buying insurance against production loss.
S3 Hiring skilled staff
S4 Motivational and incentives facilities for staff
S5 Initiative to remove political uncertainty
S6 Implementation of a fixed policy for dairy sector
S7 Assurance of adequate institutional credit support with low rate of
interest.
S8 Introducing off-farm activities
S9 Focus on value addition
S10 Promote sound business practices by cooperation, better coordination
and information sharing
S11 Reduction of risks through merger, acquisition and integration.
S12 Arrangement of proper training to the staff regarding temperature
control
S13 Adoption of alternative supply of power for cold storage (powerful
generator)
S14 Arrangement of proper training to the staff regarding processing and
hygiene management
S15 Attempts to create various cross breeds by adopting AI services

261
S16 Lease abandoned land to the farmers for dairy farming
S17 Strengthen the regular supply of vaccine
S18 Initiative to reduce the cost of feed
S19 Support to develop technology
S20 Focus on certified feed supplier to get quality feed.
S21 Arrangement of adequate grassland for producing Napier grass
S22 Arrangement of regular vaccination for the cattle
S23 Arrangement of improved and upgraded veterinary services
S24 Building multi-storeyed complex for farm extension
S25 Building monitoring team
S26 Initiative to develop roads and highways
S27 Arrangement of adequate number of transport
S28 Arrangement of refrigerated transport facilities
S29 Development of roads and highway
S30 Focus on product diversification
S31 Removal of unnecessary influence of middlemen
S32 Direct marketing

262
5A. DESCRIPTION OF IDENTIFIED RISKS Inadequate Loan Facilities (R1) Scarcity of loan facilities is one of the main problems in dairy farming. Farmers are struggling to manage fund from the financial institution due to lack of security, complex loan procedures, high interest rates and the likes.
Complex Loan Procedures (R2) Loan procedures are often complex in terms of various documents submission, security terms and conditions, mortgage fixed assets or deposits, and time. There are number of documents needs to be submitted for a loan application even it will not be a successful one. Such documents are difficult to prepare and need to collect from different authorities like previous loan profile, environment certificates, ledger history, customer information and distributors profile and so on.
High Rate of Interest (R3) Dairy loan interest rate is so high in compare to general loan. Dairy is identified as vulnerable business in Bangladesh due to the number of problems incorporated with this industry. For this, financial institutions have set high interest rate for the sake of recovery assurance and possibility of default loan. For example, government banks offers 15% -18% whereas private banks charges more than 20% which is almost unbearable. Inadequate Finance (R4) The sources of dairy finance are limited. Usually, farmers have the capability to extend their farm but failed to do so due to inadequate finance supplied from financier and own sources.
Absence of Insurance or Compensation Coverage (R5) In Bangladesh, it is yet to develop insurance system for dairy cattle which cause uncertainties in a disaster situation like flood, fire, political unrest, and disease. Shortage of Improved Technology (Milking Machine, Feed Mixture, Grass Cutting, Improved Processing Facilities) (R6) Farmers are facing problem in collecting and managing milking machine, feed mixture, grass cutting and other improved technology. Most of them are absent in medium size farms due to lack of finances and feasibility of the particular farm.
Labour Disputes (R7) Dairy industry in Bangladesh is always facing labour disputes. They need to focus to eliminate labour disputes for smooth dairy processing in their farms.
Illiteracy and Inefficiency of Worker (R8) Most of the dairy workers are illiterate to understand the dairy process. They are ready to be instructed but not to be instructing somebody. It is hard to work with so many illiterate workers who do not understand the consequences of an incident. At the same time, they are treated and found as inefficient due to their ignorant observance.
Shortage of Skilled Staff (R9) There are no registered dairy workers in Bangladesh. Workers can switch the industry at any time. They do not have any specialized training on dairy management. They learn by observance from the existing employees. They are often switching their working place for the sake of better facilities like improved wages, bonus, facilities and locations. Once they learnt so many things and get enough experience, they want to switch to the other farms for better facilities. This is why; dairy industry is facing frequent staff mobility which suffers them shortage of skilled staff. Switching of Staff Frequently (R10) Better package (wages and other facilities) inspire a worker to move their existing work place. Consequently, dairy industry facing immediate problem to manage their process efficiently in absence of experienced employees.

263
Lack of Fixed Government Policy in Dairy Sector (R11) Till now, Bangladesh government did not make relevant policy for the dairy sector. The dairy industry eagerly looks for improved policy on dairy zones, tax free imported equipment’s, training facilities to the dairy workers, loan facilities and so many related issues. Poor Law and Order Situation (Terrorism, Musclemen Ship) (R12) Poor law and order situation makes this industry more vulnerable. Local musclemen are always creating problems in the name of various donations. Hartal and Strike Cause Delay in Work Process (R13) Political hartal and strike cause the delay in supply of milk and value added milk products to the final destination. Sometimes, hartal and strike calls for several days or more. In this situation, there is no alternative to save the perishable products like milk which causes huge capital losses for the farmers. Political Unrest and Interference (R14) Political unrests and interferences are causing various risks for the dairy industry. Local political leaders are forcing the farmers to do something opposite which hinders their business. For instance, they insist the farmers not to send their milk to the distributors to favour hartal announcer. Corruption (Adulteration by Mixing Water) (R15) The most common adulteration problem in dairy is to mixing water into the milk by the employees or distributors. Damage of Farm’s Assets (R16) Generally, dairy workers are illiterate and inefficient which cause huge damage of farms assets. They do not do all these intentionally rather doing it for ignorant mind. Theft (R17) Theft case is also common in dairy farms in Bangladesh as the workers came from very poor family. They cannot stop themselves not to do so due to long sufferings from deficiency. Natural Disaster (Flood, Excessive Rain, Storm) (R18) Bangladesh is a country of natural disaster like flood, cyclone, over rain, shortage of rain and too much heat and humid. Dairy farmers suffer from all these disaster in various terms. Quick Perishability of Milk (R19) Milk and milk related products are highly perishable in nature. For this characteristic, farmers are facing problems to reach higher distance consumers and distributors. Sometimes, their milk gets perished on the way to the ultimate destination which makes huge loss for them. Machine Damage/Breakdown at Cold Storage (R20) Cold storage damage/breakdown cause enormous problem for the farmers. Dairy farmers collected milk twice in a day. They usually store their evening collection which is for less than the morning collection. Cold storage breakdown or damage failed to supply stored milk in the next morning. Such collected milk becomes waste due to machine damage. Inadequate Chilling Facilities (R21) Chilling facilities is not available in most of the farms in Bangladesh. Sometimes, farm increases their production without considering adequate chilling facilities based on current milk productions. Inadequate Cold Storage (R22) Dairy farmers are always facing problems for storing their milk for as many days as they can. This facility requires massive investments which is almost impossible to manage for them.

264
Spoilage of Milk through Improper Handling (R23) Milk is highly perishable product and need to maintain optimum temperature throughout the processing from its collection from the farms. Sometimes, inefficient and ignorant workers handle the milk improperly which cause spoilage. Bacterial Contamination for Improper Temperature (R24) Bacterial contamination is obvious if prescribed temperature will not maintain in collected milk. Bacterial contamination causes the collected milk as waste. Pollution and Unhygienic Environment (R25) Dairy farms must maintain required biosecurity to protect pollution and unhygienic environment. Polluted and unhygienic farms affected through the various diseases. Cattle Diseases (R26) Cattle disease in dairy is common as different age group of cattle have the different risk of having diseases. Disease may cause less milk production, increase overall expenditure and cattle dead. Machine Damage/Breakdown at Processing Unit (R27) In processing unit, machine damage and breakdown hampers to process the milk and milk related value added products. Fire at Farm Shed (R28) There is always having a risk of fire which may cause burn the whole farms including cattle and processing units. Accident (Staff Injury) (R29) Sometimes farmers have reported staff injury from the farming and processing level. Such accident may cause harms for the concern farm. Inadequate Supply of Quality Feed (R30) Quality feed is necessary for better milk production and decent nutrition for the dairy cattle. Otherwise, farms may suffer from inadequate productions, improper fertility and nutrition etc. High Cost of Feed and Medicine (R31) High cost of feed and medicine will increase the unit cost of milk and mill related value added products. To minimize this, the cost should be reduced as less as they can to gain maximum profitability. Scarcity of Feed (R32) Sometimes feed stock is scarce due to flood, cyclone and import related problems. Poultry stock must need consistent supply of nutritious feed to get better productivity and profitability. Lack of Upgrade Vaccination and Veterinary Services (R33) Vaccination and veterinary services are very important for the farm to manage healthy cattle. These two facilities are almost unavailable or inadequate in the regional areas where dairy farms exist. Shortage of Land for Expanding Farm (R34) Bangladesh is densely populated country where vacant land is almost non-exist around the farm. But dairy need expanded land to do grass cultivation and cattle movement. Irregular Supply of Vaccine from Government (R35) Government officials are reluctant to supply adequate vaccine through regional artificial insemination centre.

265
Competition among the Farms (R36) Intense competition makes this business worst. Unhealthy competition creates an artificial crisis and reduced milk price by the giant farmers. In this way, small and medium farmers drain out from the milk market within short time. Bureaucratic Complexity on Maintaining Various Formalities (R37) Any formal approval from government official gives a bureaucratic complication to process. For instance, importing milk machine and applying for the finance needs highest bureaucratic process to achieve. Drought Leads to a Decline in Milk Production (R38) Green grass is the key for better milk production. In dry season, there are less green grass in the field to serve the cattle which hampers the milk productions. Accidents of Transport Vehicle (R39) The roads and highway is not structured and scientific in Bangladesh. Accidents are part and parcel of daily lives. An accident of transport vehicle is one of the common issues which cause significant amount of loss for the farmers. Existence of Middlemen/ Too Many Middlemen (R40) Too many middlemen exist in the dairy sector in Bangladesh. Too many middlemen increase prices for the ultimate milk and milk related product. Too Long Chain Cause Delay in Product Movement (R41) Long supply chain is ultimately making delay of reaching milk to the final destination. It caused risks on wasting milk and increases the cost at the day end. Poor Conditioned Road for Moving Product (Delay & Spoilage) (R42) The condition of roads and highways are very poor in terms of structure, maintenance, space and quality. This is why; the milk product may reach in delay with a chance of spoilage.
Inadequate Transport Facilities to Move Products Frequently (R43) A transport facility is not available due to lack of finance for a farm. They need to hire the milk van which cost them additional money. Moreover, they failed to supply the milk frequently rather waiting for the third party services. Lack of Milk Tanker (Refrigerated) (R44) In the tropical weather condition, raw milk has a tendency to spoil very fast with short shelf life. Most of the dairy farms in Bangladesh transport milk after adding ice as a means to ‘preserve’ and save milk from spoilage, which deteriorates quality. Considering the weather conditions, milk tanker (refrigerated) is needed to transport milk to long distance. Milk tanker is also need significant amount of finance to manage and to maintain. Unfortunately, there are limited use of milk tanker in Bangladesh do not have such facilities. Unethical Behaviour of Middle Men (Adulteration, Added Price, Deprivation) (R45) Unethical behaviour like adulteration, price hike and deprivation creates more problems for the dairy farms. 5B. Description of Identified Mitigation Strategies Adoption of Improved Technology (Milking Machine, Feed Mixture, Grass Cutting, Improved Processing Facilities) (S1) Improved technology like incorporating milking machine, feed mixture, and grass cutting devices can increase efficiency which leads more profitability and productivity in a dairy farm. Buying Insurance against Production Loss (S2) Production loss can be happened frequently in dairy industry due to natural disasters, man and machine made problems like adulteration, inefficient handling of milk and machine breakdown. Proper insurance policy can give some sort of assurance against various production losses Insurance coverage against production loss can help the supply chain members to overcome

266
different types of risks occurred from accidents, diseases, natural uncertainties and hazard risks. Regarding insurance coverage respondent A stated with frustration that, ‘In our country, there is no insurance coverage for the dairy industry…in case of any disaster we face complexities to survive’. Hiring Skilled Staff (S3) Skilled staff can handle a process more efficiently than an ordinary unskilled staff. For this, dairy industry focuses on hiring skilled staff to things done more efficiently. Motivational and Incentives Facilities for Staff (S4) Lucrative wages, incentives and appropriate motivation can assist a staff to reach perfection in doing a particular work. Zero motivation will demoralize them not to do such work effectively. For instance, better facilities can hold a staff for the long run to work in an industry in an efficient manner. Initiative to Remove Political Uncertainty (S5) Political uncertainty has major influence over the industry. Industry can spend some money to increase social awareness along with political parties so that they can escape from the political bad affects. Implementation of a Fixed Policy for Dairy Sector (S6) Dynamic dairy policy is a long time demand to the government for the sake of structuring the farms and farms-related supply chain. Obviously, improved policy will have better consequences over making profit and productivity. Assurance of Adequate Institutional Credit Support with Low Rate of Interest (S7) Interest rate is one of the main factors to get a long term loan to develop modern dairy farm having all logistic facilities. At present, interest rate is too high to bear the cost by the farm. If dairy industry can get assurance of adequate loan facilities with bearable interest rate, industry will grow and improve their facilities instantly. Introducing Off-Farm Activities (S8) Integration of some off-farm activities can bring more profits to the concern industry. For instance, planting vegetables and local fruits can be adding more profit to their ledger having minimum investment. It can be done within their dairy premises using cow dung as fertilizers. Focus on Value Addition (S9) Farms can focus more on value addition through making value added milk product like sweets. In addition, industry can concentrate on utilizing farm wastes to make biogas, fertilizers and artificial charcoals. If they have huge production of value added products then they can commercial it for making extra profits. Promote Sound Business Practices by Cooperation, Better Coordination and Information Sharing (S10) Dynamic business practices, coordination among various supply chain parties and sharing information among the stakeholders can make this industry more profitable and rich. Reduction of Risks through Merger, Acquisition and Integration (S11) Sometimes, industry can use the business concepts like merger acquisition and integration of similar supply chain members to reduce cost to get competitive advantage. Arrangement of Proper Training to the Staff Regarding Temperature Control (S12) Temperature is the primate matter for milk related product as it is highly perishable in nature. Relevant staff members should get proper training to handle the produced milk to avoid hazard. Adoption of Alternative Supply of Power for Cold Storage (Powerful Generator) (S13) Powerful generator is almost necessary in dairy industry in Bangladesh as central power supply is not consistent enough. So, adopting a powerful generator can save from the spoilage of milk.

267
Arrangement of Proper Training to the Staff Regarding Processing and Hygiene Management (S14) Staff members who are related with milk processing and hygiene management, they should get modern training. Such training can maintain smooth processing and hygiene in the farm and its processing. Attempts to Create Various Cross Breeds by Adopting AI Services (S15) Artificial insemination (AI) is an important matter for cross breed cattle. AI service is controlled by the government livestock ministry through zonal AI centre. If AI centre imports different improved breed from dairy developed country, farmers can easily improve their cattle breed day by day. Lease Abandoned Land to the Farmers for Dairy Farming (S16) In Bangladesh, land is scarce to the farm owner. In this situation, government can take initiative to provide abandoned property as a lease to the farmers. In this way, farmers can get it in cheapest price to increase their productivity. Strengthen the Regular Supply of Vaccine (S17) Vaccination is an important part of rearing dairy cattle. Disease and health are relied based on proper vaccination. Vaccine should be given on prescribed time. Consequently, relevant authority should supply those vaccines on time so that farmers can be benefited in terms of maintaining cattle. Initiative to Reduce the Cost of Feed (S18) The cost of dairy products mostly depends on feed costs. If relevant authorities take initiative to reduce feed cost, the farmers will be privileged to reduce the costs of milk. Support to Develop Technology (S19) Government can support the farmers to develop necessary devices using local materials. For instance, one imported milk machine may cost 10,000 dollars. If local engineers have the opportunity to carry research on it to build it in locally, they may reduce 50% cost. Focus on Certified Feed Supplier to Get Quality Feed (S20) Feed quality is essential for the dairy cattle for providing optimum productions, maintaining good health and nutrition and long-term genetic maintenance. In this case, government can make a policy to encourage certified feed supplier to maintain good quality feed for the dairy farms. Arrangement of Adequate Grassland for Producing Napier Grass (S21) Dairy cattle are fond of green grass. It is almost unavailable as most of the dairy does not have enough land to cultivate it. Nippier is a German green grass breed which can be cultivated in small piece of land. This can be collected within 3 weeks cycle then it grows up again. The more green grass provides to the farm, the fertility and production problem will be less. Arrangement of Regular Vaccination for the Cattle (S22) A dairy farm must maintain prescribed vaccination for the cattle to maintain healthy fertility and optimum production. Arrangement of Improved and Upgraded Veterinary Services (S23) Veterinary services are upgrading day by day relied on technological development. Therefore, responsible authorities needs to arrange improved technology in veterinary services or upgrade existing services for the sake of betterment of dairy sector. Building Multi-Storeyed Complex for Farm Extension (S24) Dairy in Bangladesh need to find a way to build multi-storeyed farm so that more cattle can be accommodated in one dairy complex. It is essential for Bangladesh case as land is unavailable and rare to the dairy owners.

268
Building Monitoring Team (S25) Farm should build a monitoring team for various supply chain members to observe their activities in favour of their advancement. Monitoring team can be built in the government, association, cooperation and regional level as well. Initiative to Develop Roads and Highways (S26) It is mandatory have a good structure of roads and highway to mobilize dairy milk and milk related products towards other cities and regions. Arrangement of Adequate Number of Transport (S27) It is always vital to keep adequate and relevant transport based on farm production. Available transport can provide instant service to the supply chain members to get the products on time. Arrangement of Refrigerated Transport Facilities (S28) Milk is perishable in nature and it needs refrigerated transport to carry it to the long distance places. Farms need to arrange chiller van to mobilize their products to the final destinations. Development of Roads and Highway (S29) Government or local authority need to take initiative to develop road system from the remote farms to the highway to travel their products to the final destinations. Focus on Product Diversification (S30) Product diversification is popular concept of minimizing risk of making losses. A dairy farm can take initiative to diverse their business such as converting milk into value added product like sweets, yogurt, Ghee and the likes. On the other hand, some other agriculture products can be cultivated in the same premises. Removal of Unnecessary Influence of Middlemen (S31) Farmers should always find a way to minimize middlemen so that they can keep maximum profit share. Too many middlemen will reduce profitability. Direct Marketing (S32) It is always intelligent to deliver their products through one stop service or using direct marketing. If a farm can implement direct marketing policy, they can hold maximum profit share by not splitting it to other supply chain members. A few giant farms already working on it to hold most of the supply chain activities within their own process to reduce ultimate costs.

269
Appendix 5C: Calculation of DI (Paharika)
P I DI P I DI P I DI P I DI P I DI P I DI Total DI Av. P I DI P I DI P I DI Total DI Av. P I DI P I DI Total DI Av.
1 Inadequate loan facilities 0.7 0.6 0.42 0.7 0.6 0.42 0.4 0.6 0.24 0.5 0.5 0.25 0.6 0.5 0.3 0.5 0.5 0.25 1.88 0.31 0.4 0.6 0.24 0.5 0.5 0.25 0.9 0.9 0.81 1.3 0.43 0.7 0.5 0.35 0.8 0.6 0.48 0.83 0.42
2 Complex loan procedures 0.9 0.8 0.72 0.5 0.7 0.35 0.6 0.7 0.42 0.5 0.5 0.25 0.7 0.6 0.42 0.7 0.7 0.49 2.65 0.44 0.6 0.5 0.3 0.5 0.8 0.4 0.9 0.8 0.72 1.42 0.47 0.7 0.5 0.35 0.6 0.4 0.24 0.59 0.30
3 High rate of interest 0.9 0.9 0.81 0.9 0.7 0.63 0.8 0.8 0.64 0.5 0.5 0.25 0.9 0.8 0.72 0.7 0.6 0.42 3.47 0.58 0.8 0.7 0.56 0.9 0.9 0.81 0.7 0.9 0.63 2 0.67 0.8 0.6 0.48 0.8 0.4 0.32 0.8 0.40
4 Inadequate finance 0.8 0.8 0.64 0.6 0.8 0.48 0.7 0.8 0.56 0.9 0.9 0.81 0.8 0.6 0.48 0.5 0.5 0.25 3.22 0.54 0.9 0.4 0.36 0.5 0.7 0.35 0.8 0.9 0.72 1.43 0.48 0.9 0.7 0.63 0.9 0.3 0.27 0.9 0.45
5 Absence of insurance or compensation coverage 0.9 0.9 0.81 0.7 0.9 0.63 0.9 0.9 0.81 0.9 0.9 0.81 0.6 0.3 0.18 0.8 0.8 0.64 3.88 0.65 0.9 0.5 0.45 0.7 0.8 0.56 0.9 0.9 0.81 1.82 0.61 0.6 0.6 0.36 0.5 0.4 0.2 0.56 0.28
6
Shortage of improved technology (Milking
machine,
feed mixture, grass cutting, improved processing
facilities) 0.8 0.8 0.64 0.3 0.7 0.21 0.6 0.7 0.42 0.9 0.9 0.81 0.7 0.3 0.21 0.7 0.7 0.49 2.78 0.46 0.9 0.4 0.36 0.7 0.6 0.42 0.6 0.5 0.3 1.08 0.36 0.8 0.8 0.64 0.9 0.6 0.54 1.18 0.59
7 Labour disputes 0.7 0.8 0.56 0.4 0.9 0.36 0.5 0.6 0.3 0.5 0.1 0.05 0.1 0.2 0.02 0.9 0.9 0.81 2.1 0.35 0.7 0.5 0.35 0.7 0.7 0.49 0.7 0.5 0.35 1.19 0.40 0.3 0.4 0.12 0.2 0.2 0.04 0.16 0.08
8 Illiteracy and inefficiency of worker 0.8 0.7 0.56 0.8 0.7 0.56 0.8 0.9 0.72 0.5 0.9 0.45 0.8 0.3 0.24 0.8 0.8 0.64 3.17 0.53 0.7 0.6 0.42 0.8 0.7 0.56 0.6 0.9 0.54 1.52 0.51 0.5 0.3 0.15 0.6 0.1 0.06 0.21 0.11
9 Shortage of skilled staff 0.7 0.8 0.56 0.7 0.9 0.63 0.9 0.9 0.81 0.5 0.5 0.25 0.4 0.2 0.08 0.7 0.8 0.56 2.89 0.48 0.9 0.5 0.45 0.7 0.6 0.42 0.5 0.9 0.45 1.32 0.44 0.7 0.4 0.28 0.6 0.3 0.18 0.46 0.23
10 Switching of staff frequently 0.6 0.8 0.48 0.7 0.8 0.56 0.5 0.7 0.35 0.5 0.5 0.25 0.2 0.6 0.12 0.6 0.7 0.42 2.18 0.36 0.8 0.6 0.48 0.7 0.7 0.49 0.7 0.7 0.49 1.46 0.49 0.6 0.6 0.36 0.4 0.3 0.12 0.48 0.24
11 Lack of fixed government policy in dairy sector 0.9 0.8 0.72 0.9 0.3 0.27 0.9 0.9 0.81 0.9 0.5 0.45 0.6 0.5 0.3 0.8 0.8 0.64 3.19 0.53 0.9 0.5 0.45 0.9 0.8 0.72 0.9 0.7 0.63 1.8 0.60 0.8 0.8 0.64 0.8 0.6 0.48 1.12 0.56
12Poor law and order situation
(terrorism, musclemen ship) 0.7 0.8 0.56 0.9 0.8 0.72 0.9 0.9 0.81 0.5 0.9 0.45 0.6 0.3 0.18 0.8 0.8 0.64 3.36 0.56 0.9 0.5 0.45 0.9 0.9 0.81 0.8 0.9 0.72 1.98 0.66 0.8 0.9 0.72 0.7 0.8 0.56 1.28 0.64
13 Hartal and strike cause delay in work process 0.9 0.9 0.81 0.8 0.8 0.64 0.9 0.9 0.81 0.9 0.9 0.81 0.7 0.8 0.56 0.8 0.8 0.64 4.27 0.71 0.9 0.9 0.81 0.9 0.9 0.81 0.9 0.9 0.81 2.43 0.81 0.9 0.9 0.81 0.9 0.9 0.81 1.62 0.81
14 Political Unrest and interference 0.7 0.8 0.56 0.6 0.9 0.54 0.6 0.8 0.48 0.9 0.9 0.81 0.6 0.7 0.42 0.8 0.8 0.64 3.45 0.58 0.8 0.7 0.56 0.7 0.6 0.42 0.9 0.9 0.81 1.79 0.60 0.9 0.9 0.81 0.9 0.9 0.81 1.62 0.81
15 Corruption ( adulteration by mixing water) 0.3 0.5 0.15 0.1 0.2 0.02 0.2 0.1 0.02 0.1 0.5 0.05 0.3 0.3 0.09 0.2 0.2 0.04 0.37 0.06 0 0.2 0 0.4 0.5 0.2 0.2 0.3 0.06 0.26 0.09 0 0.2 0 0 0.3 0 0 0.00
16 Damage of farm’s assets 0.8 0.8 0.64 0.7 0.7 0.49 0.3 0.5 0.15 0.9 0.9 0.81 0.3 0.4 0.12 0.5 0.5 0.25 2.46 0.41 0.6 0.4 0.24 0.6 0.7 0.42 0.4 0.9 0.36 1.02 0.34 0.3 0.4 0.12 0.3 0.4 0.12 0.24 0.12
17 Theft 0.9 0.9 0.81 0.7 0.6 0.42 0.2 0.4 0.08 0.5 0.5 0.25 0.4 0.4 0.16 0.3 0.3 0.09 1.81 0.30 0.7 0.4 0.28 0.2 0.2 0.04 0.3 0.2 0.06 0.38 0.13 0.3 0.2 0.06 0.4 0.1 0.04 0.1 0.05
18 Natural disaster ( flood, excessive rain, storm) 0.7 0.8 0.56 0.7 0.8 0.56 0.5 0.7 0.35 0.5 0.9 0.45 0.6 0.7 0.42 0.7 0.7 0.49 2.83 0.47 0.7 0.4 0.28 0.2 0.2 0.04 0.4 0.7 0.28 0.6 0.20 0.4 0.7 0.28 0.3 0.7 0.21 0.49 0.25
19 Quick perishability of Milk 0.7 0.7 0.49 0.5 0.6 0.3 0.4 0.5 0.2 0.5 0.5 0.25 0.8 0.9 0.72 0.4 0.4 0.16 2.12 0.35 0.4 0.2 0.08 0.6 0.2 0.12 0.2 0.4 0.08 0.28 0.09 0.7 0.5 0.35 0.7 0.5 0.35 0.7 0.35
20 Machine damage/breakdown at cold storage 0.6 0.9 0.54 0.5 0.7 0.35 0.5 0.6 0.3 0.5 0.9 0.45 0.8 0.8 0.64 0.2 0.2 0.04 2.32 0.39 0.3 0.3 0.09 0.1 0.1 0.01 0.2 0.9 0.18 0.28 0.09 0.5 0.5 0.25 0.7 0.5 0.35 0.6 0.30
21 Inadequate chilling facilities 0.5 0.6 0.3 0.6 0.9 0.54 0.8 0.7 0.56 0.5 0.9 0.45 0.7 0.6 0.42 0.2 0.7 0.14 2.41 0.40 0 0.1 0 0.7 0.7 0.49 0.6 0.6 0.36 0.85 0.28 0.7 0.7 0.49 0.7 0.7 0.49 0.98 0.49
22 Inadequate cold storage 0.8 0.9 0.72 0.7 0.8 0.56 0.9 0.9 0.81 0.8 0.1 0.08 0.8 0.7 0.56 0.2 0.7 0.14 2.87 0.48 0.2 0.2 0.04 0.7 0.7 0.49 0.6 0.5 0.3 0.83 0.28 0.8 0.7 0.56 0.8 0.7 0.56 1.12 0.56
23 Spoilage of milk through improper handling 0.2 0.7 0.14 0.4 0.3 0.12 0.3 0.4 0.12 0.5 0.5 0.25 0.2 0.1 0.02 0.2 0.2 0.04 0.69 0.12 0.1 0.1 0.01 0.1 0.1 0.01 0.3 0.7 0.21 0.23 0.08 0.8 0.4 0.32 0.4 0.5 0.2 0.52 0.26
24 Bacterial contamination for improper temperature 0.2 0.7 0.14 0.8 0.8 0.64 0.7 0.8 0.56 0.5 0.9 0.45 0.4 0.2 0.08 0.6 0.6 0.36 2.23 0.37 0.7 0.5 0.35 0.1 0.1 0.01 0.4 0.9 0.36 0.72 0.24 0.8 0.5 0.4 0.8 0.4 0.32 0.72 0.36
25 Pollution and Unhygienic environment 0.5 0.7 0.35 0.6 0.4 0.24 0.3 0.4 0.12 0.5 0.5 0.25 0.8 0.6 0.48 0.3 0.3 0.09 1.53 0.26 0.5 0.5 0.25 0.3 0.3 0.09 0.5 0.9 0.45 0.79 0.26 0.9 0.4 0.36 0.5 0.4 0.2 0.56 0.28
26 Cattle diseases 0.8 0.8 0.64 0.6 0.7 0.42 0.7 0.8 0.56 0.5 0.9 0.45 0.5 0.8 0.4 0.5 0.5 0.25 2.72 0.45 0.8 0.6 0.48 0.3 0.8 0.24 0.5 0.9 0.45 1.17 0.39 0.5 0.8 0.4 0.3 0.9 0.27 0.67 0.34
27 Machine damage/breakdown at processing unit 0.6 0.9 0.54 0.7 0.5 0.35 0.4 0.5 0.2 0.5 0.9 0.45 0.5 0.6 0.3 0.4 0.4 0.16 2 0.33 0.2 0.2 0.04 0.1 0.6 0.06 0.2 0.9 0.18 0.28 0.09 0.5 0.6 0.3 0.3 0.8 0.24 0.54 0.27
28 Fire at farm shed 0.3 0.9 0.27 0.4 0.9 0.36 0.3 0.2 0.06 0.9 0.5 0.45 0.8 0.7 0.56 0.2 0.2 0.04 1.74 0.29 0.1 0.1 0.01 0.1 0.7 0.07 0.1 0.9 0.09 0.17 0.06 0.2 0.8 0.16 0.1 0.9 0.09 0.25 0.13
29 Accident (Staff injury) 0.1 0.3 0.03 0.3 0.5 0.15 0.3 0.4 0.12 0.5 0.5 0.25 0.2 0.1 0.02 0.2 0.2 0.04 0.61 0.10 0.1 0.1 0.01 0.1 0.1 0.01 0.5 0.6 0.3 0.32 0.11 0.4 0.4 0.16 0.2 0.2 0.04 0.2 0.10
30 Inadequate supply of quality feed 0.5 0.6 0.3 0.6 0.5 0.3 0.8 0.7 0.56 0.5 0.5 0.25 0.5 0.5 0.25 0.5 0.5 0.25 1.91 0.32 0.7 0.5 0.35 0.2 0.5 0.1 0.4 0.7 0.28 0.73 0.24 0.7 0.6 0.42 0.8 0.6 0.48 0.9 0.45
31 High cost of feed and medicine 0.7 0.8 0.56 0.7 0.7 0.49 0.9 0.9 0.81 0.5 0.9 0.45 0.6 0.6 0.36 0.7 0.7 0.49 3.16 0.53 0.9 0.9 0.81 0.7 0.7 0.49 0.7 0.8 0.56 1.86 0.62 0.8 0.8 0.64 0.7 0.6 0.42 1.06 0.53
32 Scarcity of feed 0.5 0.7 0.35 0.4 0.5 0.2 0.7 0.8 0.56 0.5 0.1 0.05 0.7 0.6 0.42 0.4 0.3 0.12 1.7 0.28 0.8 0.6 0.48 0.9 0.9 0.81 0.6 0.7 0.42 1.71 0.57 0.7 0.8 0.56 0.8 0.7 0.56 1.12 0.56
33 Lack of upgrade vaccination and veterinary services 0.7 0.7 0.49 0.6 0.9 0.54 0.8 0.9 0.72 0.5 0.9 0.45 0.8 0.9 0.72 0.2 0.2 0.04 2.96 0.49 0.9 0.8 0.72 0.7 0.7 0.49 0.8 0.7 0.56 1.77 0.59 0.7 0.8 0.56 0.5 0.8 0.4 0.96 0.48
34 Shortage of land for expanding farm 0.7 0.8 0.56 0.6 0.8 0.48 0.9 0.9 0.81 0.5 0.5 0.25 0.7 0.5 0.35 0.5 0.5 0.25 2.7 0.45 0.9 0.7 0.63 0.9 0.7 0.63 0.9 0.7 0.63 1.89 0.63 0.4 0.4 0.16 0.8 0.6 0.48 0.64 0.32
35 Irregular supply of vaccine from government 0.6 0.7 0.42 0.6 0.7 0.42 0.9 0.9 0.81 0.8 0.5 0.4 0.7 0.2 0.14 0.7 0.7 0.49 2.68 0.45 0.6 0.5 0.3 0.9 0.7 0.63 0.9 0.7 0.63 1.56 0.52 0.4 0.6 0.24 0.5 0.7 0.35 0.59 0.30
36 Competition among the farms 0.3 0.8 0.24 0.4 0.4 0.16 0.4 0.3 0.12 0.5 0.9 0.45 0.8 0.7 0.56 0.2 0.1 0.02 1.55 0.26 0.5 0.7 0.35 0.5 0.5 0.25 0.8 0.5 0.4 1 0.33 0.3 0.4 0.12 0.4 0.5 0.2 0.32 0.16
37Bureaucratic complexity on maintaining various
formalities 0.4 0.6 0.24 0.6 0.7 0.42 0.6 0.7 0.42 0.3 0.9 0.27 0.4 0.4 0.16 0.4 0.4 0.16 1.67 0.28 0.6 0.4 0.24 0.4 0.6 0.24 0.8 0.9 0.72 1.2 0.40 0.2 0.3 0.06 0.2 0.2 0.04 0.1 0.05
38 Drought leads to a decline in milk production 0.5 0.7 0.35 0.6 0.5 0.3 0.4 0.6 0.24 0.3 0.9 0.27 0.4 0.3 0.12 0.6 0.6 0.36 1.64 0.27 0.6 0.4 0.24 0.6 0.8 0.48 0.5 0.6 0.3 1.02 0.34 0.2 0.2 0.04 0.2 0.6 0.12 0.16 0.08
39 Accidents of transport vehicle 0.7 0.9 0.63 0.3 0.8 0.24 0.6 0.7 0.42 0.5 0.5 0.25 0.3 0.8 0.24 0.6 0.6 0.36 2.14 0.36 0.6 0.4 0.24 0.1 0.8 0.08 0.9 0.9 0.81 1.13 0.38 0.5 0.3 0.15 0.2 0.4 0.08 0.23 0.12
40 Existence of middlemen/ too many middlemen 0.5 0.6 0.3 0.6 0.9 0.54 0.4 0.5 0.2 0.7 0.9 0.63 0.7 0.7 0.49 0.6 0.6 0.36 2.52 0.42 0.4 0.2 0.08 0.4 0.4 0.16 0.9 0.6 0.54 0.78 0.26 0.8 0.7 0.56 0.8 0.8 0.64 1.2 0.60
41 Too long chain cause delay in product movement 0.3 0.5 0.15 0.7 0.7 0.49 0.3 0.5 0.15 0.8 0.5 0.4 0.5 0.5 0.25 0.6 0.6 0.36 1.8 0.30 0.3 0.1 0.03 0.2 0.2 0.04 0.7 0.8 0.56 0.63 0.21 0.8 0.8 0.64 0.8 0.8 0.64 1.28 0.64
42Poor conditioned road for moving product
(delay & spoilage) 0.5 0.7 0.35 0.4 0.5 0.2 0.9 0.9 0.81 0.5 0.9 0.45 0.7 0.8 0.56 0.7 0.7 0.49 2.86 0.48 0.3 0.1 0.03 0.2 0.5 0.1 0.6 0.9 0.54 0.67 0.22 0.8 0.6 0.48 0.9 0.7 0.63 1.11 0.56
43Inadequate transport facilities to move products
frequently 0.5 0.6 0.3 0.6 0.8 0.48 0.9 0.9 0.81 0.5 0.5 0.25 0.8 0.7 0.56 0.7 0.7 0.49 2.89 0.48 0.9 0.5 0.45 0.3 0.5 0.15 0.6 0.7 0.42 1.02 0.34 0.8 0.8 0.64 0.9 0.8 0.72 1.36 0.68
44 Lack of milk tanker (refrigerated) 0.6 0.7 0.42 0.7 0.6 0.42 0.6 0.7 0.42 0.9 0.9 0.81 0.9 0.8 0.72 0.6 0.6 0.36 3.15 0.53 0.9 0.5 0.45 0.8 0.5 0.4 0.1 0.6 0.06 0.91 0.30 0.9 0.8 0.72 0.8 0.8 0.64 1.36 0.68
45
Unethical behavior of middle men
(adulteration, added price, deprivation) 0.5 0.5 0.25 0.6 0.5 0.3 0.6 0.8 0.48 0.9 0.9 0.81 0.6 0.5 0.3 0.7 0.7 0.49 2.63 0.44 0.5 0.3 0.15 0.1 0.3 0.03 0.6 0.6 0.36 0.54 0.18 0.9 0.9 0.81 0.9 0.9 0.81 1.62 0.81
SL
P9P7 P11P8P5 P6 P10P1 P2 P3 P4
Risk

270
Appendix 5D: Value of Relationship Matrix for QFD Analysis (Paharika)
P1 P2 P3 P4 P5 P6 Total WA
P7 P8 P9 Total WA
P10 P11 Total WA R1S1 0 0.00
5 5 1.67
0 0.00
R1S2 1 1 2 0.33
1 1 0.33
0 0.00 R1S3 1 5 6 1.00
5 5 1.67
0 0.00
R1S4 0 0.00
5 5 1.67
0 0.00 R1S5 0 0.00
0 0.00
0 0.00
R1S6 9 5 1 15 2.50
5 5 1.67
5 5 2.50 R1S7 5 9 9 9 9 9 50 8.33
9 9 9 27 9.00
9 9 18 9.00
R1S8 5 5 5 5 5 25 4.17
5 5 5 15 5.00
5 5 2.50 R1S9 0 0.00
9 9 3.00
0 0.00
R1S10 1 5 6 1.00
1 1 0.33
1 1 0.50 R1S11 0 0.00
5 5 1.67
0 0.00
R1S12 0 0.00
0 0.00
0 0.00 R1S13 0 0.00
0 0.00
0 0.00
R1S14 0 0.00
0 0.00
0 0.00 R1S15 0 0.00
0 0.00
0 0.00
R1S16 0 0.00
0 0.00
0 0.00 R1S17 0 0.00
0 0.00
0 0.00
R1S18 0 0.00
0 0.00
0 0.00 R1S19 0 0.00
0 0.00
0 0.00
R1S20 0 0.00
0 0.00
0 0.00 R1S21 0 0.00
0 0.00
0 0.00
R1S22 0 0.00
0 0.00
0 0.00 R1S23 0 0.00
0 0.00
0 0.00
R1S24 0 0.00
0 0.00
0 0.00 R1S25 0 0.00
0 0.00
0 0.00
R1S26 0 0.00
0 0.00
0 0.00 R1S27 0 0.00
0 0.00
0 0.00
R1S28 0 0.00
0 0.00
0 0.00 R1S29 0 0.00
0 0.00
0 0.00
R1S30 0 0.00
0 0.00
0 0.00 R1S31 0 0.00
0 0.00
0 0.00
R1S32 0 0.00
0 0.00
0 0.00

271
Appendix 5E : Roof Matrix (Paharika)
1 2 3 4 5 6 7 8 9 10 11 12 13 14 15 16 17 18 19 20 21 22 23 24 25 26 27 28 29 30 31 32
Adoptio
n o
f im
proved t
ech
nolo
gy (
Mil
kin
g m
ach
ine,
feed
mix
tu
re,
grass c
uttin
g,
improved p
rocessin
g f
acil
itie
s)
Bu
yin
g i
nsu
ran
ce a
gain
st p
rodu
ctio
n l
oss.
Hir
ing s
kil
led s
taff
Motiv
atio
nal
an
d i
ncen
tiv
es f
acil
itie
s f
or s
taff
Init
iativ
e t
o r
em
ove p
oli
tic
al
un
certain
ty
Imple
men
tatio
n o
f a
fix
ed p
oli
cy f
or d
air
y s
ector
Assu
ran
ce o
f adequ
ate i
nstit
utio
nal
credit
su
pport w
ith
low
rate o
f in
terest.
Introdu
cin
g o
ff-fa
rm
activ
itie
s
Focu
s o
n v
alu
e a
ddit
ion
an
d p
rodu
ct d
iversif
icatio
n
Prom
ote s
ou
nd b
usin
ess p
ractic
es b
y c
ooperatio
n,
better
coordin
atio
n a
nd i
nfo
rm
atio
n s
harin
g
Redu
ctio
n o
f ris
ks t
hrou
gh
merger,
acqu
isit
ion
an
d
integratio
n.
Arran
gem
en
t o
f proper t
rain
ing t
o t
he s
taff
regardin
g
tem
peratu
re c
on
trol
Adoptio
n o
f alt
ern
ativ
e s
upply
of
pow
er f
or c
old
storage (
pow
erfu
l gen
erator)
Arran
gem
en
t o
f proper t
rain
ing t
o t
he s
taff
regardin
g
processin
g a
nd h
ygie
ne m
an
agem
en
t
Attem
pts t
o c
reate v
ario
us c
ross b
reeds b
y a
doptin
g A
I
servic
es.
Lease a
ban
don
ed l
an
d t
o t
he f
arm
ers f
or d
air
y f
arm
ing
Stren
gth
en
th
e r
egu
lar s
upply
of
vaccin
e
Init
iativ
e
to r
edu
ce t
he c
ost o
f fe
ed
Su
pport t
o d
evelo
p t
ech
nolo
gy
Focu
s o
n c
ertif
ied f
eed s
uppli
er t
o g
et q
uali
ty f
eed.
Arran
gem
en
t o
f adequ
ate g
rassla
nd f
or p
rodu
cin
g N
apie
r
grass
Arran
gem
en
t o
f regu
lar v
accin
atio
n f
or t
he c
attle
Arran
gem
en
t o
f im
proved a
nd u
pgraded v
eterin
ary s
ervic
es
Bu
ildin
g m
ult
i-storeyed c
om
ple
x f
or f
arm
exten
sio
n
Bu
ildin
g m
on
itorin
g t
eam
Init
iativ
e t
o d
evelo
p r
oads a
nd h
igh
ways
Arran
gem
en
t o
f adequ
ate n
um
ber o
f tran
sport
Arran
gem
en
t o
f refr
igerated t
ran
sport f
acil
itie
s
Develo
pm
en
t o
f roads a
nd h
igh
way
Valu
e a
ddit
ion
an
d p
rodu
ct d
iversif
icatio
n
Rem
oval
of
un
necessary i
nfl
uen
ce o
f m
iddle
men
Dir
ect m
arketin
g
.22
.30
.23

272
Appendix 5F: QFD – Nahar Executives

273
Appendix 5G: QFD – Nahar Supply Chain

274
Appendix 5H: QFD – Paharika Employees

275
Appendix 5I: QFD – Paharika Executives

276
Appendix 5J: QFD – Paharika Supply Chain

277
Appendix 5K: The Model for Each Group of Both Case Industries Nahar Executives Max f (x)= 25.00 X1 + 20.74 X2 + 29.16 X3 + 25.74 X4 + 8.36 X5 + 38.48 X6 + 19.29 X7 + 5.87X8 + 3.09 X9 + 19.87 X10 + 20.80 X11 + 12.13 X12 + 8.29 X13 + 21.51 X14 + 4.52 X15 + 3.94 X16 + 15.00 X17 + 13.69 X18 + 34.06X19 + 4.37 X20 + 5.55X21 + 8.63X22 + 12.35 X23 + 12.21X24 + 26.54 X25 + 10.30 X26 + 16.19 X27 + 15.01 X28 + 11.72 X29 + 2.24 X30 + 19.50 X31 + 24.09 X32
s.t.93.33 X1 + 40.00 X2 + 70.00 X3 + 56.67 X4 + 13.33 X5 + 63.33 X6 + 36.67 X7 + 30.00X8 + 40.00 X9
+ 13.33 X10 + 43.33 X11 + 33.33 X12 + 63.33 X13 + 36.67 X14 + 23.33 X15 + 16.67 X16 + 20.00 X17 + 23.33 X18 + 66.67 X19 + 13.33 X20 + 16.67 X21 + 30.00 X22 + 30.00 X23 + 60.00 X24 +50.00 X25 + 50.00 X26 + 50.00 X27 + 63.33 X28 + 40.00 X29 + 43.33 X30 + 10.00 X31 + 46.67 X32 ≤ 1286.67 Nahar SC members Max f (x)= 18.03 X1 + 13.61 X2 + 21.90 X3 + 7.81 X4 + 17.51 X5 + 29.15 X6 + 27.49 X7 + 7.42X8 + 2.42 X9 + 11.41 X10 + 4.43 X11 + 10.78 X12 + 10.06 X13 + 18.50 X14 + 4.10 X15 + 2.79 X16 + 12.49X17 + 3.26 X18 + 12.48 X19 + 5.68 X20 + 6.29 X21 + 10.70 X22 + 7.49 X23 + 1.96 X24 + 3.82 X25 + 0.00 X26 + 8.55 X27 + 13.17 X28 + 8.75 X29 + 0.81 X30 + 13.32 X31 + 13.45 X32
s.t.100.00 X1 + 50.00 X2 + 50.00 X3 + 30.00 X4 + 10.00 X5 + 25.00 X6 + 45.00 X7 + 30.00X8 + 20.00 X9 + 25.00 X10 + 30.00 X11 + 10.00 X12 + 30.00 X13 + 15.00 X14 + 30.00 X15 + 40.00 X16 + 10.00 X17 + 10.00 X18 + 10.00 X19 + 35.00 X20 + 35.00 X21 + 20.00 X22 + 20.00 X23 + 50.00 X24 +20.00 X25 + 20.00 X26 + 45.00 X27 + 60.00 X28 + 45.00 X29 + 25.00 X30 + 15.00 X31 + 25.00 X32 ≤ 1286.67 Paharika Employees Max f (x)= 28.70 X1 + 28.46 X2 + 33.01 X3 + 14.92 X4 + 15.42 X5 + 27.13 X6 + 27.65 X7 + 10.28X8 + 4.61 X9 + 21.02 X10 + 15.00 X11 + 9.75 X12 + 9.55 X13 + 22.85 X14 + 5.11 X15 + 5.40 X16 + 10.08 X17 + 8.61 X18 + 18.07 X19 + 5.58 X20 + 8.29 X21 + 8.70 X22 + 9.70 X23 + 4.43 X24 + 10.14 X25 + 5.76 X26 + 10.70 X27 + 16.23 X28 + 9.74 X29 + 1.30 X30 + 10.34 X31 + 11.75 X32
s.t.88.33 X1 + 63.33 X2 + 45.00 X3 + 36.67 X4 + 21.67 X5 + 26.67 X6 + 31.67 X7 + 33.33X8 + 25.00 X9
+ 26.67 X10 + 21.67 X11 + 11.67 X12 + 23.33 X13 + 16.67 X14 + 41.67 X15 + 15.00 X16 + 15.00 X17 + 11.67 X18 + 33.33 X19 + 30.00 X20 + 18.33 X21 + 16.67 X22 + 18.33 X23 + 58.33 X24 +33.33 X25 + 13.33 X26 + 33.33 X27 + 48.33 X28 + 31.67 X29 + 38.33 X30 + 13.33 X31 + 16.67 X32 ≤ 958.33 Paharika Executives Max f (x)= 24.45 X1 + 14.89 X2 + 29.12 X3 + 15.15 X4 + 19.93 X5 + 29.23 X6 + 24.71 X7 + 12.57X8 + 4.38 X9 + 15.05X10 + 14.09 X11 + 6.41 X12 + 2.68 X13 + 16.66 X14 + 3.38 X15 + 13.35 X16 + 7.59 X17 + 12.45 X18 + 19.01 X19 + 8.03 X20 + 10.39 X21 + 5.20 X22 + 7.99 X23 + 11.83X24 + 4.97 X25 + 2.68 X26 + 7.49 X27 + 9.75 X28 + 6.57 X29 + 2.11 X30 + 5.94 X31 + 6.92X32
s.t.93.33 X1 + 66.67 X2 + 53.33 X3 + 60.00 X4 + 26.67 X5 + 40.00 X6 + 43.33 X7 + 43.33X8 + 23.33 X9
+ 23.33 X10 + 26.67 X11 + 13.33 X12 + 30.33 X13 + 20.00 X14 + 43.33 X15 + 10.00 X16 + 16.67 X17 + 20.00 X18 + 16.67 X19 + 23.33 X20 + 20.00 X21 + 16.67 X22 + 13.33 X23 + 50.00 X24 +26.67 X25 + 10.00 X26 + 46.67 X27 + 36.67 X28 + 20.00 X29 + 33.33 X30 + 20.00 X31 + 20.00X32 ≤ 1006.67 Paharika Supply chain Max f (x)= 19.97 X1 + 8.71 X2 + 16.88 X3 + 7.42 X4 + 20.62X5 + 13.57 X6 + 21.67 X7 + 4.42X8 + 1.60 X9 + 3.58 X10 + 2.15 X11 + 9.78 X12 + 11.61 X13 + 16.33 X14 + 3.02 X15 + 4.56 X16 + 6.46 X17 + 7.43 X18
+ 18.20 X19 + 10.56 X20 + 4.97 X21 + 3.76 X22 + 9.40 X23 + 2.21 X24 + 5.69 X25 + 0.00 X26 + 8.03 X27 + 21.25 X28 + 9.74 X29 + 0.72 X30 + 18.45 X31 + 17.02 X32
s.t.100.00 X1 + 25.00 X2 + 40.00 X3 + 20.00 X4 + 10.00 X5 + 10.00 X6 + 45.00 X7 + 30.00X8 + 20.00 X9 + 20.00 X10 + 20.00 X11 + 25.00 X12 + 50.00 X13 + 25.00 X14 + 20.00 X15 + 25.00 X16 + 10.00 X17 + 20.00 X18 + 20.00X19 + 40.00 X20 + 45.00 X21 + 35.00 X22 + 50.00 X23 + 65.00 X24 +35.00 X25 + 10.00 X26 + 45.00 X27 + 55.00 X28 + 40.00 X29 + 20.00 X30 + 15.00 X31 + 25.00 X32 ≤ 1015.00
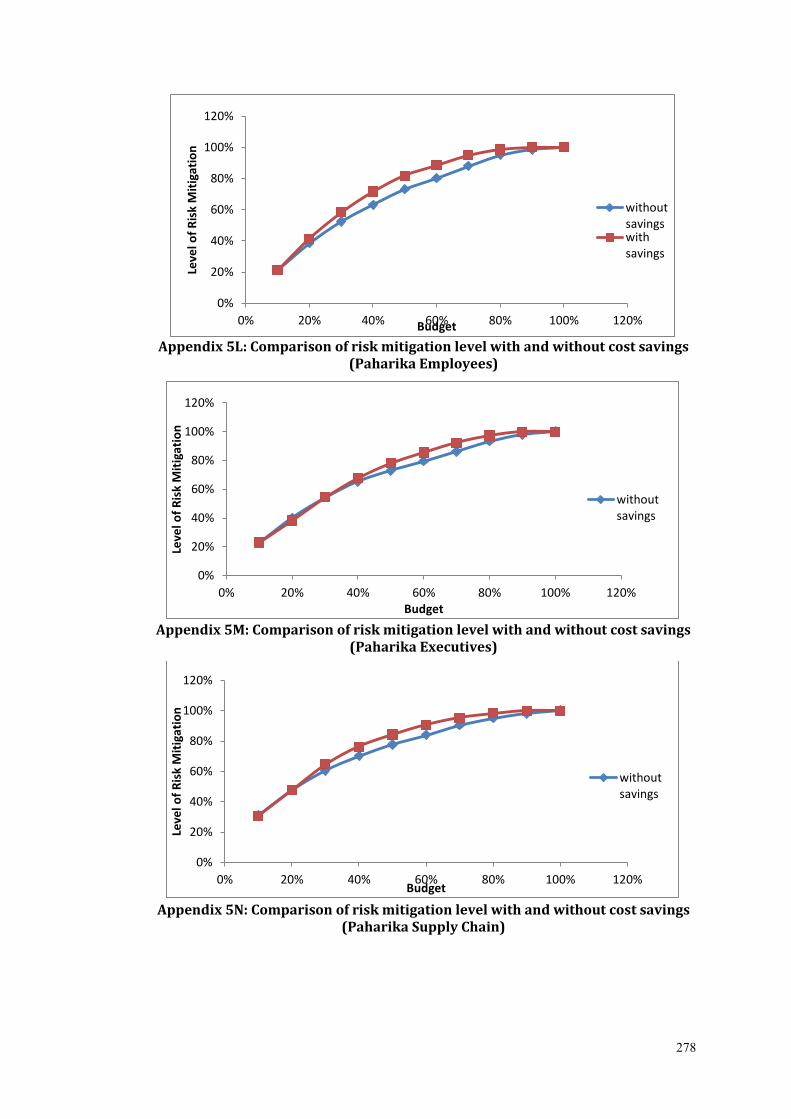
278
Appendix 5L: Comparison of risk mitigation level with and without cost savings
(Paharika Employees)
Appendix 5M: Comparison of risk mitigation level with and without cost savings
(Paharika Executives)
Appendix 5N: Comparison of risk mitigation level with and without cost savings
(Paharika Supply Chain)
0%
20%
40%
60%
80%
100%
120%
0% 20% 40% 60% 80% 100% 120%
Leve
l of
Ris
k M
itig
atio
n
Budget
withoutsavingswithsavings
0%
20%
40%
60%
80%
100%
120%
0% 20% 40% 60% 80% 100% 120%
Leve
l of
Ris
k M
itig
atio
n
Budget
withoutsavings
0%
20%
40%
60%
80%
100%
120%
0% 20% 40% 60% 80% 100% 120%
Leve
l of
Ris
k M
itig
atio
n
Budget
withoutsavings

279
Appendix 6A: Optimization Result for Nahar Executives
100% 90% 80% 70% 60% 50% 40% 30% 20% 10% 100% 90% 80% 70% 60% 50% 40% 30% 20% 10%
1286.67 1158 1029.33 900.67 772 643.33 514.67 386 257 128.67 1286.67 1158 1029.33 900.67 772 643.33 514.67 386 257 128.67
S1
S2
S3
S4
S5
S6
S7
S8
S9
S10
S11
S12
S13
S14
S15
S16
S17
S18
S19
S20
S21
S22
S23
S24
S25
S26
S27
S28
S29
S30
S31
S32
Total
selected
strategies
32 29 26 23 21 16 14 11 9 5 32 29 29 26 22 17 15 11 9 5
Objective
Function498.24 484.62 462.02 432.78 396.05 352.95 300.73 240.38 176.43 101.21 498.24 477.93 477.93 448.68 411.88 357.98 300.13 241.83 176.43 101.21
Level Of
risk
mitigation
100.00% 97.27% 92.73% 86.86% 79.49% 70.84% 60.36% 48.25% 35.41% 20.31% 100.00% 95.92% 95.92% 90.05% 82.67% 71.85% 60.24% 48.54% 35.41% 20.31%
StrategiesBudgeted cost (without savings) Budgeted cost (with savings)

280
Appendix 6B: Optimization Result for Nahar Supply Chain
100% 90% 80% 70% 60% 50% 40% 30% 20% 10% 100% 90% 80% 70% 60% 50% 40% 30% 20% 10%
985 886.5 788 689.5 591 492.5 394 295.5 197 98.5 985 886.5 788 689.5 591 492.5 394 295.5 197 98.5
S1
S2
S3
S4
S5
S6
S7
S8
S9
S10
S11
S12
S13
S14
S15
S16
S17
S18
S19
S20
S21
S22
S23
S24
S25
S26
S27
S28
S29
S30
S31
S32
Total
selected
strategies
32 29 26 22 20 19 16 14 11 7 32 32 29 26 24 21 18 16 12 7
Objective
Function329.59 324.85 314.26 297.31 280.02 261.99 238.14 209.93 169.13 114.23 329.59 329.59 326.83 316.68 301.29 282.44 258.59 232.94 180.08 114.23
Level Of
risk
mitigation
100.00% 98.56% 95.35% 90.21% 84.96% 79.49% 72.25% 63.69% 51.31% 34.66% 100.00% 100.00% 99.16% 96.08% 91.41% 85.69% 78.46% 70.67% 54.64% 34.66%
Strategies
Budgeted Cost (Without Savings) Budgeted Cost (With Savings)

281
Appendix 6C: Optimization Result for Paharika Executives
100% 90% 80% 70% 60% 50% 40% 30% 20% 10% 100% 90% 80% 70% 60% 50% 40% 30% 20% 10%
1006.67 906 805 704.67 604 503.33 402.66 302 201.33 100.67 1006.67 906 805 704.67 604 503.33 402.66 302 201.33 100.67
S1
S2
S3
S4
S5
S6
S7
S8
S9
S10
S11
S12
S13
S14
S15
S16
S17
S18
S19
S20
S21
S22
S23
S24
S25
S26
S27
S28
S29
S30
S31
S32
Total
selected
strategies
32 29 26 24 22 21 17 11 8 5 32 32 29 27 24 21 15 12 9 5
Objective
Function374.98 366.81 349.97 323.25 298.36 273.91 244.69 204 150.4 86.24 374.98 374.98 365.11 345.79 320.48 292.64 254.01 204.02 143.25 86.24
Level Of
risk
mitigation
100.00% 97.82% 93.33% 86.21% 79.57% 73.05% 65.25% 54.40% 40.11% 23.00% 100.00% 100.00% 97.37% 92.22% 85.46% 78.04% 67.74% 54.41% 38.20% 23.00%
Strategies
Budgeted cost (without savings) Budgeted cost (with savings)

282
Appendix 6D: Optimization Result for Paharika Supply Chain
100% 90% 80% 70% 60% 50% 40% 30% 20% 10% 100% 90% 80% 70% 60% 50% 40% 30% 20% 10%
1015 913.5 812 710.5 609 507.5 406 304.5 203 101.5 1015 913.5 812 710.5 609 507.5 406 304.5 203 101.5
S1
S2
S3
S4
S5
S6
S7
S8
S9
S10
S11
S12
S13
S14
S15
S16
S17
S18
S19
S20
S21
S22
S23
S24
S25
S26
S27
S28
S29
S30
S31
S32
Total
selected
strategies
32 29 26 22 19 18 16 12 10 6 32 32 28 25 22 19 16 13 10 6
Objective
Function309.75 303.79 294.36 279.69 260.23 240.26 217.37 187.66 147.17 95.28 309.75 309.75 304.68 295.1 281.23 261.35 236.15 200.24 147.17 95.29
Level Of
risk
mitigation
100.00% 98.07% 95.03% 90.29% 84.01% 77.57% 70.17% 60.58% 47.51% 30.76% 100.00% 100.00% 98.36% 95.27% 90.79% 84.37% 76.24% 64.64% 47.51% 30.76%
StrategiesBudgeted cost (without savings) Budgeted cost (with savings)