sustainable solutions to end hunger
TRANSCRIPT

Sustainable Solutions to End Hunger

Ceres2030 is a research project of:
Supported by:
Publishing partner:
ceres2030.org

ACKNOWLEDGEMENTS
This project was made possible through the generous support of the Bill and Melinda Gates Foundation, and the German Federal Ministry of Economic Cooperation and Development (BMZ). The authors are particularly grateful to Ammad Bahalim and Neil Watkins from the Bill and Melinda Gates Foundation, and to Anna Friedemann-Pfautsch, Heike Henn, Martin Hoppe, and Stefan Schmitz from BMZ, for their invaluable contributions to the report and their support and guidance throughout the project. The authors are extremely grateful for inputs and contributions from the following people: Wenceslao Almazan, Sofía Balino, Amy Barry, Katherine Clark, Jon Date, Elise Epp, Kiranne Guddoy, David Hegwood and Tess Lallement.

CONTENTS
Editorial: To end hunger, science must change its focus............................................................................1
Foreword ...............................................................................................................................................2
Summary ...............................................................................................................................................4
Economic Modelling .............................................................................................................................37
SUSTAINABLE SOLUTIONS TO END HUNGER: NATURE PORTFOLIO COLLECTION OF ARTICLES
Feast and famine in agricultural research ..............................................................................................62
Evidence synthesis for sustainability .....................................................................................................63
Accelerating evidence-informed decision-making for the Sustainable Development Goals using machine learning ...............................................................................................................64
ON THE FARMShedding light on the evidence blind spots confounding the multiple objectives of SDG 2 ......................71
A scoping review of feed interventions and livelihoods of small-scale livestock keepers .........................79
A scoping review of adoption of climate-resilient crops by small-scale producers in low- and middle-income countries .......................................................................................................87
A scoping review of research funding for small-scale farmers in water scarce regions .............................98
A scoping review on incentives for adoption of sustainable agricultural practices and their outcomes ............................................................................................................................107
FOOD ON THE MOVEA scoping review of market links between value chain actors and small-scale producers in developing regions .........................................................................................................119
A scoping review of interventions for crop postharvest loss reduction in sub-Saharan Africa and South Asia ...................................................................................................................................129
EMPOWERING THE EXCLUDEDA scoping review of the contributions of farmers’ organizations to smallholder agriculture ..................144
A systematic review of employment outcomes from youth skills training programmes in agriculture in low- and middle-income countries .............................................................................155
Social protection to combat hunger ....................................................................................................170
68 | Sustainable solutions to end hunger Sustainable solutions to end hunger | 69
Of some 570 million farms in the world, more than 475 million are smaller than 2 hectares.”
from the Ceres2030 team’s findings includes the striking statement that “most of the included studies only involved researchers without any participation from farmers”5.
So why aren’t more researchers answering more prac-tical questions about ending hunger that are relevant to smallholder farmers? Many of the reasons can be traced to the changing priorities of agricultural-research funding.
During the past four decades, funding provision for this type of research has been shifting towards the private sector, with more than half of funding now coming from agribusinesses, according to the work of Philip Pardey, who researches science and technology policy at the University of Minnesota in Saint Paul, and his colleagues6.
Small is less desirableAt the same time, applied research involving working with smallholder farmers and their families doesn’t immedi-ately boost an academic career. Many researchers — most notably those attached to the CGIAR network of agricul-tural research centres around the world — do work with smallholders. But in larger, research-intensive universities, small is becoming less desirable. Increasingly, university research-strategy teams want their academics to bid for larger grants — especially if a national research-evaluation system rewards those who bring in more research income.
Publishers also bear some responsibility. Ceres2030’s co-director, Jaron Porciello, a data scientist at Cornell University in Ithaca, New York, told Nature that smallhold-er-farming research might not be considered sufficiently original, globally relevant or world-leading for journal pub-lication. This lack of a sympathetic landing point in journals is something that all publishers must consider in the light of the Ceres2030 team’s findings.
The Ceres2030 collaboration is to be congratulated for highlighting these issues. The group had two funders, the Bill & Melinda Gates Foundation in Seattle, Washington, and the German Federal Ministry for Economic Coopera-tion and Development. Both have pledged extra funding to the intergovernmental Global Agriculture and Food Security Program, which channels money from interna-tional donors to smallholder farmers. This is important, but doesn’t fully address Ceres2030’s overarching finding: that most research on hunger is of little practical use in the goal to make hunger a thing of the past.
National research agencies, too, need to listen, because they are the major funding source for researchers at uni-versities. Achieving the SDG to end hunger will require an order of magnitude more research engagement with smallholders and their families. Their needs — and thus the route to ending hunger — have been neglected for too long.
1. Laborde, D., Porciello, J. & Smaller, C. Ceres2030: Sustainable Solutions to End Hunger (Ceres2030, 2020).
2. Nature Plants https://doi.org/10.1038/s41477-020-00795-9 (2020).3. Bizikova, L. et al. Nature Food https://doi.org/10.1038/s43016-020-00164-xX
(2020).4. Liverpool-Tasie, L. S. O. et al. Nature Sustain. https://doi.org/10.1038/
s41893-020-00621-2 (2020).5. Stathers, T. et al. Nature Sustain. https://doi.org/10.1038/s41893-020-
00622-1 (2020).6. Pardey, P. G., Chan-Kang, C., Dehmer, S. P. & Beddow, J. M. Nature 537,
301–303 (2016).
To end hunger, science must change its focus Policymakers need research on ways to end hunger. But a global literature review finds most research has had the wrong priorities.
How can research help to end hunger? One way to answer this question is to assess pub-lished research on hunger, and determine which interventions can make a difference to the lives of the 690 million people who go
hungry every day. That’s what an international research consortium called
Ceres2030 has been doing1. And the results of its 3-year effort to review more than 100,000 articles are pub-lished this week across the Nature Research journals2 (see go.nature.com/3djmppq). The consortium’s findings — coming just days after this year’s Nobel Peace Prize was awarded to the World Food Programme — are both reveal-ing and concerning.
The team was able to identify ten practical interventions that can help donors to tackle hunger, but these were drawn from only a tiny fraction of the literature. The Ceres2030 team members found that the overwhelming majority of agricultural-research publications they assessed were unable to provide solutions, particularly to the challenges faced by smallholder farmers and their families.
The World Food Programme is the United Nations’ primary agency in the effort to eliminate hunger, which includes the flagship Sustainable Development Goal (SDG) to end hunger by 2030.
The researchers found many studies that conclude that smallholders are more likely to adopt new approaches — specifically, planting climate-resilient crops — when they are supported by technical advice, input and ideas, collec-tively known as extension services.
Other studies found that these farmers’ incomes increase when they belong to cooperatives, self-help groups and other organizations that can connect them to markets, shared transport or shared spaces where produce can be stored3. Farmers also prosper when they can sell their pro-duce informally to small- and medium-sized firms4.
There was one finding, however, that surprised and trou-bled the Ceres2030 team. Two-thirds of people who are hungry live in rural areas. Of some 570 million farms in the world, more than 475 million are smaller than 2 hectares. Rural poverty and food insecurity go hand in hand, and yet the Ceres2030 researchers found that the overwhelming majority of studies they assessed — more than 95% — were not relevant to the needs of smallholders and their families. Moreover, few studies included original data. One paper
336 | Nature | Vol 586 | 15 October 2020
Editorials

Sustainable solutions to end hunger | 1
Of some 570 million farms in the world, more than 475 million are smaller than 2 hectares.”
from the Ceres2030 team’s findings includes the striking statement that “most of the included studies only involved researchers without any participation from farmers”5.
So why aren’t more researchers answering more prac-tical questions about ending hunger that are relevant to smallholder farmers? Many of the reasons can be traced to the changing priorities of agricultural-research funding.
During the past four decades, funding provision for this type of research has been shifting towards the private sector, with more than half of funding now coming from agribusinesses, according to the work of Philip Pardey, who researches science and technology policy at the University of Minnesota in Saint Paul, and his colleagues6.
Small is less desirableAt the same time, applied research involving working with smallholder farmers and their families doesn’t immedi-ately boost an academic career. Many researchers — most notably those attached to the CGIAR network of agricul-tural research centres around the world — do work with smallholders. But in larger, research-intensive universities, small is becoming less desirable. Increasingly, university research-strategy teams want their academics to bid for larger grants — especially if a national research-evaluation system rewards those who bring in more research income.
Publishers also bear some responsibility. Ceres2030’s co-director, Jaron Porciello, a data scientist at Cornell University in Ithaca, New York, told Nature that smallhold-er-farming research might not be considered sufficiently original, globally relevant or world-leading for journal pub-lication. This lack of a sympathetic landing point in journals is something that all publishers must consider in the light of the Ceres2030 team’s findings.
The Ceres2030 collaboration is to be congratulated for highlighting these issues. The group had two funders, the Bill & Melinda Gates Foundation in Seattle, Washington, and the German Federal Ministry for Economic Coopera-tion and Development. Both have pledged extra funding to the intergovernmental Global Agriculture and Food Security Program, which channels money from interna-tional donors to smallholder farmers. This is important, but doesn’t fully address Ceres2030’s overarching finding: that most research on hunger is of little practical use in the goal to make hunger a thing of the past.
National research agencies, too, need to listen, because they are the major funding source for researchers at uni-versities. Achieving the SDG to end hunger will require an order of magnitude more research engagement with smallholders and their families. Their needs — and thus the route to ending hunger — have been neglected for too long.
1. Laborde, D., Porciello, J. & Smaller, C. Ceres2030: Sustainable Solutions toEnd Hunger (Ceres2030, 2020).
2. Nature Plants https://doi.org/10.1038/s41477-020-00795-9 (2020).3. Bizikova, L. et al. Nature Food https://doi.org/10.1038/s43016-020-00164-xX
(2020).4. Liverpool-Tasie, L. S. O. et al. Nature Sustain. https://doi.org/10.1038/
s41893-020-00621-2 (2020).5. Stathers, T. et al. Nature Sustain. https://doi.org/10.1038/s41893-020-
00622-1 (2020).6. Pardey, P. G., Chan-Kang, C., Dehmer, S. P. & Beddow, J. M. Nature 537,
301–303 (2016).
To end hunger, science must change its focus Policymakers need research on ways to end hunger. But a global literature review finds most research has had the wrong priorities.
How can research help to end hunger? One way to answer this question is to assess pub-lished research on hunger, and determine which interventions can make a difference to the lives of the 690 million people who go
hungry every day. That’s what an international research consortium called
Ceres2030 has been doing1. And the results of its 3-year effort to review more than 100,000 articles are pub-lished this week across the Nature Research journals2 (see go.nature.com/3djmppq). The consortium’s findings — coming just days after this year’s Nobel Peace Prize was awarded to the World Food Programme — are both reveal-ing and concerning.
The team was able to identify ten practical interventions that can help donors to tackle hunger, but these were drawn from only a tiny fraction of the literature. The Ceres2030 team members found that the overwhelming majority of agricultural-research publications they assessed were unable to provide solutions, particularly to the challenges faced by smallholder farmers and their families.
The World Food Programme is the United Nations’ primary agency in the effort to eliminate hunger, which includes the flagship Sustainable Development Goal (SDG) to end hunger by 2030.
The researchers found many studies that conclude that smallholders are more likely to adopt new approaches — specifically, planting climate-resilient crops — when they are supported by technical advice, input and ideas, collec-tively known as extension services.
Other studies found that these farmers’ incomes increase when they belong to cooperatives, self-help groups and other organizations that can connect them to markets, shared transport or shared spaces where produce can be stored3. Farmers also prosper when they can sell their pro-duce informally to small- and medium-sized firms4.
There was one finding, however, that surprised and trou-bled the Ceres2030 team. Two-thirds of people who are hungry live in rural areas. Of some 570 million farms in the world, more than 475 million are smaller than 2 hectares. Rural poverty and food insecurity go hand in hand, and yet the Ceres2030 researchers found that the overwhelming majority of studies they assessed — more than 95% — were not relevant to the needs of smallholders and their families. Moreover, few studies included original data. One paper
336 | Nature | Vol 586 | 15 October 2020
Editorials
©2020SpringerNatureLimited.Allrightsreserved.

22
FOREWORD: A WORLD WITHOUT HUNGER IS POSSIBLEBY DR. AGNES KALIBATA AND DR. GERD MÜLLER
Planet Earth has the potential to feed 10 billion people. No one should have to suffer hunger or malnutrition. Worldwide, there is a vast variety of factors causing hunger and malnutrition: war, disasters, and diseases have fatal consequences, as does climate change. Today, more than 10 million hectares of land are already lost to erosion every year. Droughts and heat are reducing yields. In the future, water will become a scarce, life-saving resource.
Too much food also rots in the field, is destroyed by pest damage or thrown away because of inadequate storage or cooling facilities, processing or logistics. But hunger is also a problem of poverty. Two-thirds of hungry people live in rural areas: they are smallholder families. Every day, the global population grows by 250,000 people – 80 million a year, two-thirds of them in developing countries. Africa’s population is set to double by 2050.
The answer to the global hunger problem has many facets and requires different approaches – but we know which way to go, we have the knowledge and the technology. What is needed,above all, is a change in government decision-makers’ way of thinking so they make agriculturaldevelopment a priority in each country and combine investment in the food and agriculturesector with training campaigns, the development of decentralized energy systems, appropriatemechanization, the further development of animal and plant breeding, and equal access to landownership for women and men.
There are many avenues that we jointly have to pursue in order to create a world without hunger. Ceres2030: Sustainable Solutions to End Hunger, is a unique research project that provides practical recommendations. Scientists from Cornell University, the International Institute for Sustainable Development (IISD) and the International Food Policy Research Institute (IFPRI), using the latest AI technology, have painstakingly investigated the most effective instruments and actions to end hunger by 2030 worldwide and on a lasting basis. They have also calculated the costs of this endeavor. In association with Ceres2030, Nature is dedicating a special edition to this issue, telling us how we can make a world without hunger – if we act now.
The study comes at a critical time. The dramatic consequences of the COVID-19 crisis are exacerbating the suffering of the most vulnerable, especially in the poorest regions of the world. For them, the COVID-19 pandemic is also a hunger pandemic. With this in mind, next year the UN Food Systems Summit will launch bold new actions, solutions and strategies to deliver progress on all 17 Sustainable Development Goals, each of which relies on healthier, more sustainable and more equitable food systems. The Summit is already sending a message: do more, do it better – and start now!
Here are some figures that highlight the urgency of taking action: 690 million people worldwide suffer from hunger daily – as many as the combined populations of our two countries, Rwanda

32
FOREWORD: A WORLD WITHOUT HUNGER IS POSSIBLEBY DR. AGNES KALIBATA AND DR. GERD MÜLLER
Planet Earth has the potential to feed 10 billion people. No one should have to suffer hunger or malnutrition. Worldwide, there is a vast variety of factors causing hunger and malnutrition: war, disasters, and diseases have fatal consequences, as does climate change. Today, more than 10 million hectares of land are already lost to erosion every year. Droughts and heat are reducing yields. In the future, water will become a scarce, life-saving resource.
Too much food also rots in the field, is destroyed by pest damage or thrown away because of inadequate storage or cooling facilities, processing or logistics. But hunger is also a problem of poverty. Two-thirds of hungry people live in rural areas: they are smallholder families. Every day, the global population grows by 250,000 people – 80 million a year, two-thirds of them in developing countries. Africa’s population is set to double by 2050.
The answer to the global hunger problem has many facets and requires different approaches – but we know which way to go, we have the knowledge and the technology. What is needed, above all, is a change in government decision-makers’ way of thinking so they make agricultural development a priority in each country and combine investment in the food and agriculture sector with training campaigns, the development of decentralized energy systems, appropriate mechanization, the further development of animal and plant breeding, and equal access to land ownership for women and men.
There are many avenues that we jointly have to pursue in order to create a world without hunger. Ceres2030: Sustainable Solutions to End Hunger, is a unique research project that provides practical recommendations. Scientists from Cornell University, the International Institute for Sustainable Development (IISD) and the International Food Policy Research Institute (IFPRI), using the latest AI technology, have painstakingly investigated the most effective instruments and actions to end hunger by 2030 worldwide and on a lasting basis. They have also calculated the costs of this endeavor. In association with Ceres2030, Nature is dedicating a special edition to this issue, telling us how we can make a world without hunger – if we act now.
The study comes at a critical time. The dramatic consequences of the COVID-19 crisis are exacerbating the suffering of the most vulnerable, especially in the poorest regions of the world. For them, the COVID-19 pandemic is also a hunger pandemic. With this in mind, next year the UN Food Systems Summit will launch bold new actions, solutions and strategies to deliver progress on all 17 Sustainable Development Goals, each of which relies on healthier, more sustainable and more equitable food systems. The Summit is already sending a message: do more, do it better – and start now!
Here are some figures that highlight the urgency of taking action: 690 million people worldwide suffer from hunger daily – as many as the combined populations of our two countries, Rwanda
3
and Germany, plus the populations of the United States and Indonesia. The UN’s Food and Agriculture Organization expects this will grow to 840 million by 2030 – instead of reaching zero as resolved by the nations of the world in 2015 in their pact on the world’s future.
In order to eradicate hunger within the ten years that remain, eight Ceres2030 teams of 77 researchers from 23 countries and 53 organizations collected the most promising solutions. The researchers came up with ten key recommendations on the sort of interventions that work, and conclude that approximately 330 billion US dollars will be needed in additional funding in the period up to 2030 – in other words, 33 billion dollars a year (or 28 billion euros).
These experts believe that it would be realistic for donor countries to provide an average of 14 billion US dollars a year, and low- and middle-income countries, 19 billion. After all, the world is also able to spend 1,917 billion dollars year after year on military and arms projects! The much lower spending needed to eradicate hunger, by contrast, will generate a revitalizing dividend. It will save hundreds of millions of people from starving, enabling most of them to lead productive lives and provide for their families.
The 330 billion dollars spent over the next decade would go, for example, toward farmers’ alliances, enabling smallholders to work together and providing training for young people; the cultivation of climate-resilient crops; and appropriate irrigation, storage and processing of crops to prevent them from spoiling.
More thoroughly than ever before, the Ceres2030 researchers have explored which actions are effective, where they are effective, how effective they are – and what makes them fail. After all, there is no panacea. Governments, the private sector and scientists have to link several agendas.
Farmers not only have to be able to grow climate-resilient crops. They also have to be able to transport and sell their crops. Governments have to combine investments in agriculture with social protection programs, so as to ensure that people have an income and access to food even in difficult times. And the relevant government departments have to work together more closely: agriculture and environment, health and education, economic affairs and development cooperation.
If all this is in place, sustainable development can succeed – food security, resource-conserving productivity, fair trade, education, and protection from the consequences of climate change. This is why the Ceres2030 study is so important and its conclusion is truly transformative: a world without hunger is possible – it is within reach. So let us take action.
Dr. Agnes KalibataUN Special Envoy for the 2021 Food Systems Summit
Dr. Gerd MüllerFederal Minister for Economic Cooperation and Development
44
Summary Report
David Laborde, Sophia Murphy, Marie Parent, Jaron Porciello and Carin Smaller
Designer: Elise Epp (International Institute for Sustainable Development)
Citation: Laborde, D., Murphy, S., Parent, M., Porciello, J. & Smaller C. (2020). Ceres2030: Sustainable Solutions to End Hunger - Summary Report. Cornell University, IFPRI and IISD.
CONTENTS
SUMMARY AND RECOMMENDATIONS .....................................................................................................5
What will it cost? ...................................................................................................................................................... 9
1. HUNGER, EXCLUDED SMALL-SCALE PRODUCERS, AND THE CLIMATE CRISIS: A TRIPLE BURDEN ..........10
Economic Precarity and Vulnerability of Small-Scale Producers ..........................................................11
Adapting to Changing Weather and Ecological Conditions, While Reducing Harm to the Environment ............................................................................................................................................................12
The 2030 Agenda for Sustainable Development ......................................................................................12
2. THE EVIDENCE BASE: END HUNGER, INCREASE INCOMES, AND REDUCE ENVIRONMENTAL HARM .......13
Evidence Synthesis and Nature Portfolio ......................................................................................................15
The Economic Model ..........................................................................................................................................16
3. FINDINGS & RECOMMENDATIONS ....................................................................................................18
Empower the Excluded .......................................................................................................................................18
On the Farm .............................................................................................................................................................21
Food on the Move .................................................................................................................................................25
What Is the Funding Gap? ..................................................................................................................................27
4. CROSS-CUTTING LESSONS ................................................................................................................29
5. CONCLUSION ....................................................................................................................................32
REFERENCES ........................................................................................................................................33

54
Summary Report
David Laborde, Sophia Murphy, Marie Parent, Jaron Porciello and Carin Smaller
Designer: Elise Epp (International Institute for Sustainable Development)
Citation: Laborde, D., Murphy, S., Parent, M., Porciello, J. & Smaller C. (2020). Ceres2030: Sustainable Solutions to End Hunger - Summary Report. Cornell University, IFPRI and IISD.
CONTENTS
SUMMARY AND RECOMMENDATIONS .....................................................................................................5
What will it cost? ...................................................................................................................................................... 9
1. HUNGER, EXCLUDED SMALL-SCALE PRODUCERS, AND THE CLIMATE CRISIS: A TRIPLE BURDEN ..........10
Economic Precarity and Vulnerability of Small-Scale Producers ..........................................................11
Adapting to Changing Weather and Ecological Conditions, While Reducing Harm to the Environment ............................................................................................................................................................12
The 2030 Agenda for Sustainable Development ......................................................................................12
2. THE EVIDENCE BASE: END HUNGER, INCREASE INCOMES, AND REDUCE ENVIRONMENTAL HARM .......13
Evidence Synthesis and Nature Portfolio ......................................................................................................15
The Economic Model ..........................................................................................................................................16
3. FINDINGS & RECOMMENDATIONS ....................................................................................................18
Empower the Excluded .......................................................................................................................................18
On the Farm .............................................................................................................................................................21
Food on the Move .................................................................................................................................................25
What Is the Funding Gap? ..................................................................................................................................27
4. CROSS-CUTTING LESSONS ................................................................................................................29
5. CONCLUSION ....................................................................................................................................32
REFERENCES ........................................................................................................................................33
5
SUMMARY AND RECOMMENDATIONS
1 The three targets of SDG 2 are ending hunger (Target 2.1), doubling the incomes and productivity of small-scale producers (Target 2.3), and producing food sustainably and resiliently (Target 2.4). The nutrition target (Target 2.2) was not included. This is because there are other global efforts to assess the cost of ending some forms of malnutrition (definitions vary) and they use a different model. The scope of malnutrition overlaps but also reaches beyond food and agriculture, making a comprehensive costing particularly complex. Biodiversity and preservation of associated traditional knowledge (Target 2.5) is also beyond the scope of the project. There is a dearth of data about biodiversity, and it remains an important area in which to develop quantification techniques.
Hunger is rising, reversing decades of progress. An estimated 690 million people are hungry, an increase of 60 million people over the past five years (Food and Agriculture Organization of the United Nations [FAO] et al., 2020). We predict that a further 95 million people will be living in extreme poverty and hunger as a result of COVID-19 (Laborde and Smaller, 2020). Perversely, the very people whose livelihoods depend on food and agriculture are among the most likely to experience hunger. Small-scale food producers and food workers and their families are often left out of economic growth, technological change, and political decision making. Globally, today’s food systems are not producing affordable healthy diets for all in a sustainable way (FAO et al., 2020). The climate crisis poses a mounting threat to food systems (FAO et al., 2018; Intergovernmental Panel on Climate Change [IPCC], 2018), while at the same time, the current food system is a major driver of climate change (FAO et al., 2020).
This is not how the UN 2030 Agenda for Sustainable Development was meant to unfold. The ambition was transformative. Governments acknowledged the central importance of ending hunger, but they set themselves a bolder target: they wanted everyone to enjoy an affordable, healthy and nutritious diet, and committed to supporting the most vulnerable food producers to earn the means to live in dignity. They also made a commitment to sustainable change, vowing to preserve biological diversity and to better protect the resources and the ecosystems that our children will need to feed themselves into the future.
Governments have 10 years to take back control of their bold agenda. Ceres2030 was an experiment designed to help with the challenge. The project team, employing a complex and rigorous economic model and cutting-edge machine-learning tools, made a partnership with Nature Portfolio that focused on answers to two linked questions: First, what does the published evidence tell us about agricultural interventions that work, in particular to double the incomes of small-scale producers and to improve environmental outcomes for agriculture? And second, what will it cost governments to end hunger, double the incomes of small-scale producers, and protect the climate by 2030? The project focuses on three of the five targets in the second sustainable development goal (SDG 2) and looks at the public spending needed in low- and middle-income countries, including the contribution from donors through official development assistance (ODA).1

6 6
Donors must spend an additional USD 14 billion a year on average to end hunger sustainably
FIGURE 1. ADDITIONAL PUBLIC SPENDING AND DONOR CONTRIBUTION
The Ceres2030 and Nature Portfolio collection pushes the frontiers of science to support evidence-based decision making. It is the first attempt to analyze the past 20 years of agricultural development literature using artificial intelligence to support a rigorous methodology for evidence synthesis. The Ceres2030 team worked with researchers to support the integration of the findings from that research into the parameters of a general equilibrium model. The modelling is one of the most complex modelling exercises ever attempted, applying hundreds of thousands of equations to account for complex relationships across different levels of the economy over time. The model used data from all levels, from the global to the national, right down to the household.
The research shows that agricultural interventions are more effective with a population that enjoys at least a minimum level of income, education, with access to networks and resources such as extension services and robust infrastructure. Whether the intervention is climate-resilient crops, membership in a farmers’ organization, or reducing crop losses, this minimum threshold matters.
Both the evidence syntheses and the model show it is much more effective to create integrated portfolios of interventions rather than seek improvements in isolation. Interventions are also more successful if they are designed to meet complex objectives, such as paying attention to the marketability of a crop and not just its climate resilience or resistance to pests. The evidence from studies of small and medium enterprises (SMEs) working with small-scale producers in the informal sector shows significant success with linking producers to markets, particularly in Africa. Importantly, a large share of these SMEs provide other, linked services, such as capacity building and access to credit. The SMEs are correlated with higher levels of technology adoption and productivity among small-scale producers.
Donor share
USD 14 billion
Country share
USD 19 billion
An additional
USD 33 billionis needed
per year
Source: Authors’ calculations.

76
Donors must spend an additional USD 14 billion a year on average to end hunger sustainably
FIGURE 1. ADDITIONAL PUBLIC SPENDING AND DONOR CONTRIBUTION
The Ceres2030 and Nature Portfolio collection pushes the frontiers of science to support evidence-based decision making. It is the first attempt to analyze the past 20 years of agricultural development literature using artificial intelligence to support a rigorous methodology for evidence synthesis. The Ceres2030 team worked with researchers to support the integration of the findings from that research into the parameters of a general equilibrium model. The modelling is one of the most complex modelling exercises ever attempted, applying hundreds of thousands of equations to account for complex relationships across different levels of the economy over time. The model used data from all levels, from the global to the national, right down to the household.
The research shows that agricultural interventions are more effective with a population that enjoys at least a minimum level of income, education, with access to networks and resources such as extension services and robust infrastructure. Whether the intervention is climate-resilient crops, membership in a farmers’ organization, or reducing crop losses, this minimum threshold matters.
Both the evidence syntheses and the model show it is much more effective to create integrated portfolios of interventions rather than seek improvements in isolation. Interventions are also more successful if they are designed to meet complex objectives, such as paying attention to the marketability of a crop and not just its climate resilience or resistance to pests. The evidence from studies of small and medium enterprises (SMEs) working with small-scale producers in the informal sector shows significant success with linking producers to markets, particularly in Africa. Importantly, a large share of these SMEs provide other, linked services, such as capacity building and access to credit. The SMEs are correlated with higher levels of technology adoption and productivity among small-scale producers.
Donor share
USD 14 billion
Country share
USD 19 billion
An additional
USD 33 billionis needed
per year
Source: Authors’ calculations.
7
Crucially, the project team and researchers found there is surprisingly little research to support the types of questions that donors and governments are interested in answering—less than 2% of the available evidence base in our review. There is an urgent need to invest in the development of standardized frameworks to improve the quality and relevance of research for policy-makers. Evidence-based policy is only as good as the available evidence.
Ten recommendations emerged from the research on how to increase the effectiveness of public spending on agricultural interventions and how much it will cost donors (see Table 1). The topics were selected in an iterative process that relied on policy experts, a machine-learning-assisted review of the published data on agricultural interventions, and on decision-makers’ experience. The costs are based on the results of the model, which optimally allocates financial resources among a portfolio of interventions. The modelled interventions are based on existing data sources and a number of new parameters from the collection of evidence syntheses published in Nature Portfolio.
TABLE 1. TEN RECOMMENDATIONS AND THE DONOR CONTRIBUTION
The central findings with additional donor costs, from the results of the evidence syntheses in Nature Portfolio and the interventions costed in one of the most complex modelling exercises ever attempted.
Empower the ExcludedDONOR CONTRIBUTION: USD 3 BILLION PER YEAR
1. Enable participation in farmers’ organizations.
2. Invest in vocational programs for rural youth that offer integrated training in multiple skills.
3. Scale up social protection programs.
Programs that offer training in multiple skills to rural youth show promise in increasing employment levels and wages.
Vocational training
Membership in a farmers’ organization was associated with positive effects on income in 57% of the cases reviewed.
Currently no modellable intervention
Social protection programs work best when they create a bridge to productive employment and remove barriers in accessing markets, education, and credit.
Income support through food subsidy
FINDINGS FROM NATURE PORTFOLIO MODEL INTERVENTIONS RECOMMENDATIONS

8 8
On the FarmDONOR CONTRIBUTION: USD 9 BILLION PER YEAR
5. Agricultural interventions to support sustainable practices must be economically viable for farmers.
Market and non-market regulations and cross-compliance incentives that include short-term economic benefits are more successful than measures that only provide an ecological service.
Agroforestry subsidy
Capital endowment
Extension services
Investment subsidy
Production subsidy
R&D National Agricultural Systems (NARS) & Consultative Group on International Agricultural Research (CGIAR)
4. Investment in extension services, particularly for women, must accompany research and development (R&D) programs.
The most important determinants of adoption of climate-resilient crops were the availability and effectiveness of extension services.
Extension services
6. Support adoption of climate-resilient crops.
Successful adoption is positively correlated with inclusive extension services, access to inputs, and crop varieties that are commercially viable.
Extension services combined with input, production, and investment subsidies
R&D National Agricultural Systems (NARS) & CGIAR
7. Increase research on water-scarce regions to scale up effective farm-level interventions to assist small-scale producers.
Nearly 80% of small-scale farms in developing countries are in water-scarce regions. Underexplored solutions include digital applications and adding livestock to mixed farming systems.
Capital endowment
Extension services
Rural infrastructure (irrigation)
8. Improve the quantity and quality of livestock feed, especially for small and medium-scale commercial farms.
Obvious and useful options to improve the quantity and quality feed are being overlooked, such as better support for the use of crop residues.
Capital endowment
Extension services
Improved forage subsidy
Production subsidy
R&D National Agricultural Systems (NARS) & CGIAR
FINDINGS FROM NATURE PORTFOLIO MODEL INTERVENTIONS RECOMMENDATIONS

98
On the FarmDONOR CONTRIBUTION: USD 9 BILLION PER YEAR
5. Agricultural interventions to support sustainable practices must be economically viable for farmers.
Market and non-market regulations and cross-compliance incentives that include short-term economic benefits are more successful than measures that only provide an ecological service.
Agroforestry subsidy
Capital endowment
Extension services
Investment subsidy
Production subsidy
R&D National Agricultural Systems (NARS) & Consultative Group on International Agricultural Research (CGIAR)
4. Investment in extension services, particularly for women, must accompany research and development (R&D) programs.
The most important determinants of adoption of climate-resilient crops were the availability and effectiveness of extension services.
Extension services
6. Support adoption of climate-resilient crops.
Successful adoption is positively correlated with inclusive extension services, access to inputs, and crop varieties that are commercially viable.
Extension services combined with input, production, and investment subsidies
R&D National Agricultural Systems (NARS) & CGIAR
7. Increase research on water-scarce regions to scale up effective farm-level interventions to assist small-scale producers.
Nearly 80% of small-scale farms in developing countries are in water-scarce regions. Underexplored solutions include digital applications and adding livestock to mixed farming systems.
Capital endowment
Extension services
Rural infrastructure (irrigation)
8. Improve the quantity and quality of livestock feed, especially for small and medium-scale commercial farms.
Obvious and useful options to improve the quantity and quality feed are being overlooked, such as better support for the use of crop residues.
Capital endowment
Extension services
Improved forage subsidy
Production subsidy
R&D National Agricultural Systems (NARS) & CGIAR
FINDINGS FROM NATURE PORTFOLIO MODEL INTERVENTIONS RECOMMENDATIONS
9
Sources: Acevedo et al., 2020; Baltenweck et al., 2020; Bizikova et al., 2020b; Laborde et al., 2020; Liverpool-Tasie et al., 2020; Piñeiro et al., 2020; Maiga et al., 2020; Ricciardi et al., 2020; Stathers et al., 2020; Wouterse et al., 2020.
WHAT WILL IT COST?
The results from the model show that donors need to contribute an additional USD 14 billion per year on average until 2030 to end hunger and double incomes of small-scale producers in low- and middle-income countries. The investment achieves these goals while maintaining greenhouse gas emissions for agriculture below the commitments made in the Paris Agreement (see Figure 1).
Donors currently spend USD 12 billion per year on food security and nutrition and therefore need to double their contributions to meet the goals. However, ODA alone will not be enough. Additional public spending of USD 19 billion per year on average until 2030 will have to be provided by low- and middle-income countries through increased taxation (see Figure 1).
Together, the additional public investment from donors and low- and middle-income countries will prevent 490 million people from experiencing hunger, double the incomes of 545 million producers and their families on average, and limit greenhouse gas emissions for agriculture to the
Food on the MoveDONOR CONTRIBUTION: USD 2 BILLION PER YEAR
10. Invest in the infrastructure, regulations, services and technical assistance needed to support SMEs in the value chain.
SMEs are successfully serving farmers in low and middle-income countries, particularly in Africa, and are correlated with technology adoption and higher productivity.
Rural infrastructure (roads)
Storage (post-harvest losses)
9. Reduce post-harvest losses by expanding the focus of interventions beyond the storage of cereals, to include more links in the value chain, and more food crops.
Storage interventions are effective, but other interventions are also needed, such as better handling, improved packaging, and careful timing of the harvest.
Extension services
Storage (post-harvest losses)
FINDINGS FROM NATURE PORTFOLIO MODEL INTERVENTIONS RECOMMENDATIONS
10 10
commitments made in the Paris Agreement.2 Importantly, the additional public spending will, on average, spur an extra USD 52 billion in private investment per year.
2 The results from the modelling should be interpreted as an estimate of the scale of resources needed at the big-picture level. This is useful to inform resource allocation decisions from the global level down to the national level but is insufficient to inform strategy, planning, and programming at the subnational level.
1. HUNGER, EXCLUDED SMALL-SCALE PRODUCERS, AND THE CLIMATE CRISIS: A TRIPLE BURDEN
Despite remarkable inroads made to reduce hunger worldwide, food insecurity is on the rise, while small-scale food producers are excluded from economic opportunities, and the climate crisis poses a mounting threat to food production and distribution. The number of people affected by hunger has increased by 60 million people over the past five years, and up to 130 million more people are at risk as a result of COVID-19 (FAO et al., 2020; Intergovernmental Panel on Climate Change [IPCC], 2019). Perversely, the very people whose livelihoods depend on food and agriculture are among the most likely to experience hunger. Small-scale food producers and workers and their families are among those most often left out of economic growth, technological change, and political decision making. Globally, food systems are not producing affordable healthy diets accessible to all. Instead, some forms of agriculture are important drivers of deteriorating environmental conditions. At the same time, agriculture is one of the sectors most at risk because of the climate crisis (IPCC, 2019).
The pressures of demographic change and economic growth driving increased future food demand are strongest in Africa and South Asia (FAO et al., 2018). Africa in particular is predicted to become the continent with the largest share and number of people living in poverty, a problem expected to be severely exacerbated by the COVID-19 pandemic. Africa still lags the world in terms of farm incomes and productivity, and its agriculture and food systems are characterized by the dominant role of small-scale producers. The continent is not on track to afford to achieve the transformative changes demanded by the UN 2030 Agenda for Sustainable Development. That ambition will require strong support from the global donor community. Indeed, ODA remains the first source of external financial resources for Africa south of the Sahara (36% in 2017), above remittances and foreign direct investment (OECD, n.d.b) (see Box 1).

1110
commitments made in the Paris Agreement.2 Importantly, the additional public spending will, on average, spur an extra USD 52 billion in private investment per year.
2 The results from the modelling should be interpreted as an estimate of the scale of resources needed at the big-picture level. This is useful to inform resource allocation decisions from the global level down to the national level but is insufficient to inform strategy, planning, and programming at the subnational level.
1. HUNGER, EXCLUDED SMALL-SCALE PRODUCERS, AND THE CLIMATE CRISIS: A TRIPLE BURDEN
Despite remarkable inroads made to reduce hunger worldwide, food insecurity is on the rise, while small-scale food producers are excluded from economic opportunities, and the climate crisis poses a mounting threat to food production and distribution. The number of people affected by hunger has increased by 60 million people over the past five years, and up to 130 million more people are at risk as a result of COVID-19 (FAO et al., 2020; Intergovernmental Panel on Climate Change [IPCC], 2019). Perversely, the very people whose livelihoods depend on food and agriculture are among the most likely to experience hunger. Small-scale food producers and workers and their families are among those most often left out of economic growth, technological change, and political decision making. Globally, food systems are not producing affordable healthy diets accessible to all. Instead, some forms of agriculture are important drivers of deteriorating environmental conditions. At the same time, agriculture is one of the sectors most at risk because of the climate crisis (IPCC, 2019).
The pressures of demographic change and economic growth driving increased future food demand are strongest in Africa and South Asia (FAO et al., 2018). Africa in particular is predicted to become the continent with the largest share and number of people living in poverty, a problem expected to be severely exacerbated by the COVID-19 pandemic. Africa still lags the world in terms of farm incomes and productivity, and its agriculture and food systems are characterized by the dominant role of small-scale producers. The continent is not on track to afford to achieve the transformative changes demanded by the UN 2030 Agenda for Sustainable Development. That ambition will require strong support from the global donor community. Indeed, ODA remains the first source of external financial resources for Africa south of the Sahara (36% in 2017), above remittances and foreign direct investment (OECD, n.d.b) (see Box 1).
11
BOX 1. THE IMPORTANCE OF AID FOR AFRICA
ODA is a critical source of finance for developing countries, especially in Africa. It has been the largest single source of foreign finance since 2002, consistently providing over 30% of the total. In 2017, ODA represented 36% of the foreign finance received by African countries south of the Sahara compared to 31% from overseas personal remittances and 23% from foreign direct investment (FDI) (OECD, n.d.b). In other regions, ODA is less dominant. The main source of foreign finance in South Asia, for example, is personal remittances, comprising 55% of foreign finance; in South America, it is FDI, at 68% of the total (OECD, n.d.b).3
3 Statistics of foreign financial resources in this section refer to values according to 2016 constant USD.
ECONOMIC PRECARITY AND VULNERABILITY OF SMALL-SCALE PRODUCERS
Small-scale producers in low- and middle-income countries face economic precarity and vulnerability. Too many live in poverty, at chronic risk of hunger. At the same time, they are among the populations most vulnerable to climate change (Bizikova et al., 2020; Acevedo et al., 2020). Yet this population is large and important, both for food security and the environment, which is why governments have singled them out for support in SDG 2. Small-scale producers represent over 80% of the world’s farms (Lowder et al., 2016). Although the evidence base, especially from Africa, is far from complete, it is clear that small-scale producers make an essential contribution to the food supply. Recent studies using different methods and data have converged broadly around estimates that farms under 2 hectares produce 30%–34% of the global food supply and grow a greater diversity of crops than larger farms. Farms of less than 5 hectares are estimated to produce just over half the world’s food calories (Samberg et al., 2016; Ricciardi et al., 2018).
Chronic underinvestment in the production systems of small-scale producers in low- and middle-income countries, particularly in Africa, has resulted in low productivity and incomes (FAO, 2012). This undermines efforts to move out of subsistence livelihoods and to eradicate hunger and poverty. Crops spoil due to a lack of good storage systems, insufficient processing capacity, or gaps in communications and transportation infrastructure. Livestock productivity is low, in part due to the poor quality and low availability of feed. Small-scale producers lack bargaining power in their markets, and there is a dearth of sustained vocational training for rural youth. Similarly, there is a marked lack of investment in water management and irrigation infrastructure, especially on the land farmed by small-scale producers, especially in some of the most drought-affected areas.
12 12
ADAPTING TO CHANGING WEATHER AND ECOLOGICAL CONDITIONS, WHILE REDUCING HARM TO THE ENVIRONMENT
There is strong evidence that some food and agriculture systems are an important source of GHG emissions (IPCC, 2019; Willett et al., 2019). The largest sources of GHG emissions linked to agriculture are land expansion, methane emissions from livestock and rice production, and nitrous oxide from the heavy use of synthetic fertilizers (IPCC, 2019). In addition to emitting GHGs, agriculture has contributed to 70% of biodiversity loss on land (Secretariat of the Convention on Biological Diversity, 2014). At the same time, climate change poses significant risks to food and agriculture systems. These risks include rising sea levels and coastal inundation, changing and less-predictable weather patterns, and an increase in the incidence of extreme weather events as well as the spread of new pests and crop diseases as average temperatures change. The expected impact of these events depends on their magnitude, as well as the capacities of producers, governments, and the private sector to adapt and build resilience. Typically, smaller-scale producers in countries facing the highest risks have limited access to risk management tools and climate-adapted technologies (Bizikova et al., 2020a; Porter et al., 2014).
The benefits that people derive from ecosystems (known as “ecosystem services”), such as the provision of food and clean water, or the control of floods and disease, are in general undervalued in markets and overlooked in investment strategies. Instead, many farmers struggle to balance their need for an income with the long-term health of their natural resources, including the soil and water (Piñeiro et al., 2020). The issue is particularly acute in low- and middle-income countries where producers’ lack of access to information, financial services, and land rights create barriers to realizing opportunities and using incentives to address the trade-offs between ecosystem health and income (Lipper et al., 2020).
THE 2030 AGENDA FOR SUSTAINABLE DEVELOPMENT
The adoption of the UN 2030 Agenda for Sustainable Development opened the possibility of new pathways for solving complex problems. It signalled a willingness from governments to embrace a significantly higher level of complexity than they had shown before. The Agenda lists 17 SDGs, including SDG 2, which is a commitment to eradicate hunger, improve nutrition, double the productivity and incomes of small-scale producers, promote sustainable and resilient food systems, and protect biodiversity. The goal deliberately sets out the complexity of the challenge societies face.
Ideally, increased investment in SDG 2 will also contribute to climate change mitigation (SDG 13), reduced inequalities (SDG 10), women’s rights to full and equal participation in economic and public life (SDG 5), and to more sustainable patterns of production and consumption (SDG 12). Done wrong, however, agriculture can do significant harm to these other SDGs. For example, too many interventions designed primarily to increase crop yields have failed to pay sufficient

1312
ADAPTING TO CHANGING WEATHER AND ECOLOGICAL CONDITIONS, WHILE REDUCING HARM TO THE ENVIRONMENT
There is strong evidence that some food and agriculture systems are an important source of GHG emissions (IPCC, 2019; Willett et al., 2019). The largest sources of GHG emissions linked to agriculture are land expansion, methane emissions from livestock and rice production, and nitrous oxide from the heavy use of synthetic fertilizers (IPCC, 2019). In addition to emitting GHGs, agriculture has contributed to 70% of biodiversity loss on land (Secretariat of the Convention on Biological Diversity, 2014). At the same time, climate change poses significant risks to food and agriculture systems. These risks include rising sea levels and coastal inundation, changing and less-predictable weather patterns, and an increase in the incidence of extreme weather events as well as the spread of new pests and crop diseases as average temperatures change. The expected impact of these events depends on their magnitude, as well as the capacities of producers, governments, and the private sector to adapt and build resilience. Typically, smaller-scale producers in countries facing the highest risks have limited access to risk management tools and climate-adapted technologies (Bizikova et al., 2020a; Porter et al., 2014).
The benefits that people derive from ecosystems (known as “ecosystem services”), such as the provision of food and clean water, or the control of floods and disease, are in general undervalued in markets and overlooked in investment strategies. Instead, many farmers struggle to balance their need for an income with the long-term health of their natural resources, including the soil and water (Piñeiro et al., 2020). The issue is particularly acute in low- and middle-income countries where producers’ lack of access to information, financial services, and land rights create barriers to realizing opportunities and using incentives to address the trade-offs between ecosystem health and income (Lipper et al., 2020).
THE 2030 AGENDA FOR SUSTAINABLE DEVELOPMENT
The adoption of the UN 2030 Agenda for Sustainable Development opened the possibility of new pathways for solving complex problems. It signalled a willingness from governments to embrace a significantly higher level of complexity than they had shown before. The Agenda lists 17 SDGs, including SDG 2, which is a commitment to eradicate hunger, improve nutrition, double the productivity and incomes of small-scale producers, promote sustainable and resilient food systems, and protect biodiversity. The goal deliberately sets out the complexity of the challenge societies face.
Ideally, increased investment in SDG 2 will also contribute to climate change mitigation (SDG 13), reduced inequalities (SDG 10), women’s rights to full and equal participation in economic and public life (SDG 5), and to more sustainable patterns of production and consumption (SDG 12). Done wrong, however, agriculture can do significant harm to these other SDGs. For example, too many interventions designed primarily to increase crop yields have failed to pay sufficient
13
attention to soil health and local freshwater supplies. Increasing agricultural productivity is associated in some places with significant environmental damage and with undermining important ecosystem services that the wider rural community relied upon (Lipper et al., 2020). Relying on cereals such as rice and maize has successfully met minimum calorie needs in many countries but has discouraged the production of a diversity of cultivated and non-cultivated foods, including animal-sourced foods, that provided better nutritional outcomes, as well as opportunities for income diversification. Multifaceted commitments pose a puzzle for decision-makers. Some issues lack data and indicators with which to measure progress, while others are awash in data, but analysis of that data offers contradictory evidence (Lipper et al., 2020). It is in addressing this puzzle that Ceres2030 makes such an important contribution.
2. THE EVIDENCE BASE: END HUNGER, INCREASE INCOMES, AND REDUCE ENVIRONMENTAL HARM
The Ceres2030 and Nature Portfolio collection is guided by the premise of SDG 2: increasing the incomes and productivity of small-scale producers, in a way that supports the transition to environmentally sustainable food systems, is the most effective way to end hunger. In the 2030 Agenda, governments identified increased productivity and incomes for small-scale producers and their families as essential to the goal of ending hunger sustainably. Our premise does not exclude the importance of supporting larger-scale producers to also make the transition to more sustainable practices, but it recognizes that small-scale producers are both caught up in the problem we are trying to solve and critical to the answers we seek.
The project was not mandated to work on nutrition specifically, though it is central to both food security and to the realization of SDG 2. There were, however, existing costing initiatives focused specifically on nutrition underway when the Ceres2030 project was launched in 2018, including work by the World Bank, Results for Development, and 1000 Days. Nutrition, moreover, is its own complex goal. Costing nutrition goes beyond agriculture and food systems, to include sanitation and access to clean water, for example. It also relies on intra-household-level data, which is a level of granularity that is not easily integrated with the global projections modelled by the Ceres2030 cost model. It would have required significantly more time and resources to include nutrition in the project.
The project relies on state-of-the-art economic modelling techniques, artificial intelligence, evidence synthesis, and a strong partnership with one of the world’s leading publishers, Nature Portfolio, which were the main tools used to build that evidence base (see Box 2). The results offer decision-makers a way to cost and assess interventions as a portfolio of complementary investments rather than in isolation. The combination of these research tools provides the kind of information that decision-makers can use to direct spending, and the confidence that it is backed by the highest standards of research.

14 14
BOX 2. THE CERES2030 AND NATURE PORTFOLIO COLLECTION
Ceres2030 includes the Nature Portfolio collection of eight evidence syntheses and two front matter pieces published in Nature Portfolio Journals; a report on what it would cost to end hunger, increase incomes, and mitigate climate change; and a policy brief comparing the CGE modelling approach in Ceres2030 to the marginal abatement cost curves (MACC) approach used by the Center for Development Research (ZEF) and FAO. A total of 84 researchers—economists, crop breeders, information specialists, and scientists—from 25 countries worked on the project. They reviewed over 100,000 articles, primarily published between 2000–2019. The project was guided by an advisory board of 20 food and agriculture experts from over 10 countries.
The economic modelling team worked with the evidence synthesis teams to see how to strengthen the evidence used to inform the economic cost model. Together, they set up a system to extract data from the articles the researchers were reviewing that could be used in the model. This eventually led to the inclusion of new interventions in the costing and the refinement of some of the existing interventions, improving the accuracy of the cost estimate.
The project is a working model of how a donor might use evidence to guide investment decisions. Ceres2030 demonstrates how to build an evidence base, assess it, quantify it, and how to use the results to answer complex questions for specific populations, grounded in country-specific contexts. The 2030 Agenda requires that governments meet multiple targets with their choice of interventions. If there are no considerable changes in agricultural management practices, a push to increase food production will increase GHG emissions (Mbow et al., 2019). The approach taken by Ceres2030 is to look at how interventions can be balanced to take account of trade-offs, manage competing goals, and enhance synergies, thereby achieving the multiple targets of SDG 2. For example, extension services can improve farmers’ skills, while roads and storage capacity make an important contribution to farm income. Together, the benefits of each expand, strengthening the resilience beyond what either intervention can offer on its own and creating the possibility of greater returns. The economic model accounts for such interactions, using the relationships to generate a portfolio of interventions that complement each other and keep costs to a minimum while meeting objectives.

1514
BOX 2. THE CERES2030 AND NATURE PORTFOLIO COLLECTION
Ceres2030 includes the Nature Portfolio collection of eight evidence syntheses and two front matter pieces published in Nature Portfolio Journals; a report on what it would cost to end hunger, increase incomes, and mitigate climate change; and a policy brief comparing the CGE modelling approach in Ceres2030 to the marginal abatement cost curves (MACC) approach used by the Center for Development Research (ZEF) and FAO. A total of 84 researchers—economists, crop breeders, information specialists, and scientists—from 25 countries worked on the project. They reviewed over 100,000 articles, primarily published between 2000–2019. The project was guided by an advisory board of 20 food and agriculture experts from over 10 countries.
The economic modelling team worked with the evidence synthesis teams to see how to strengthen the evidence used to inform the economic cost model. Together, they set up a system to extract data from the articles the researchers were reviewing that could be used in the model. This eventually led to the inclusion of new interventions in the costing and the refinement of some of the existing interventions, improving the accuracy of the cost estimate.
The project is a working model of how a donor might use evidence to guide investment decisions. Ceres2030 demonstrates how to build an evidence base, assess it, quantify it, and how to use the results to answer complex questions for specific populations, grounded in country-specific contexts. The 2030 Agenda requires that governments meet multiple targets with their choice of interventions. If there are no considerable changes in agricultural management practices, a push to increase food production will increase GHG emissions (Mbow et al., 2019). The approach taken by Ceres2030 is to look at how interventions can be balanced to take account of trade-offs, manage competing goals, and enhance synergies, thereby achieving the multiple targets of SDG 2. For example, extension services can improve farmers’ skills, while roads and storage capacity make an important contribution to farm income. Together, the benefits of each expand, strengthening the resilience beyond what either intervention can offer on its own and creating the possibility of greater returns. The economic model accounts for such interactions, using the relationships to generate a portfolio of interventions that complement each other and keep costs to a minimum while meeting objectives.
15
EVIDENCE SYNTHESIS AND NATURE PORTFOLIO
4 Evidence synthesis is a guidelines-based approach to bring primary studies together and draw high-level conclusions. It provides a model under which policy and intervention examinations can be made with greater focus, reliability, and transparency. These approaches are more commonly known as systematic and scoping reviews, evidence gap maps, and meta-analyses.
The evidence synthesis teams searched the databases for agricultural interventions that would increase the productivity of small-scale producers while supporting the transition to more environmentally sustainable production systems (see Figure 2 for more detail on the selection of the eight intervention topics). Specific areas of agricultural intervention were chosen that had demonstrated their importance to ending hunger inclusively and sustainably. For each research area, the task was to produce a synthesis of the available evidence, such as a systematic or scoping review. Evidence synthesis is an umbrella term for the process of drawing scientific findings and policy implications from a large database of evidence.4 It uses a predetermined methodology to create replicability and to allow others to validate or falsify the results. Evidence synthesis is a still-evolving adaptation of evidence review methodologies, designed to cope with the heterogeneity of disciplines that produce agriculture and food systems research. The project published an open-source evidence synthesis protocol for agriculture and a machine-learning model, both of which make a lasting contribution to the use of evidence synthesis in agriculture and development (Young et al., 2019).
Tools to synthesize evidence are invaluable in the face of the volume of research being produced each year: global knowledge production is estimated to double every nine years (Bornmann & Mutz, 2015). The sheer volume makes new research tools necessary, including those made possible by the advent of artificial intelligence techniques. The team created a machine-learning model to provide each author team with a series of shortcuts to streamline the evidence synthesis process. The researchers worked with the machine-learning datasets to narrow their dataset in the initial title and abstract screening stages.
16 16
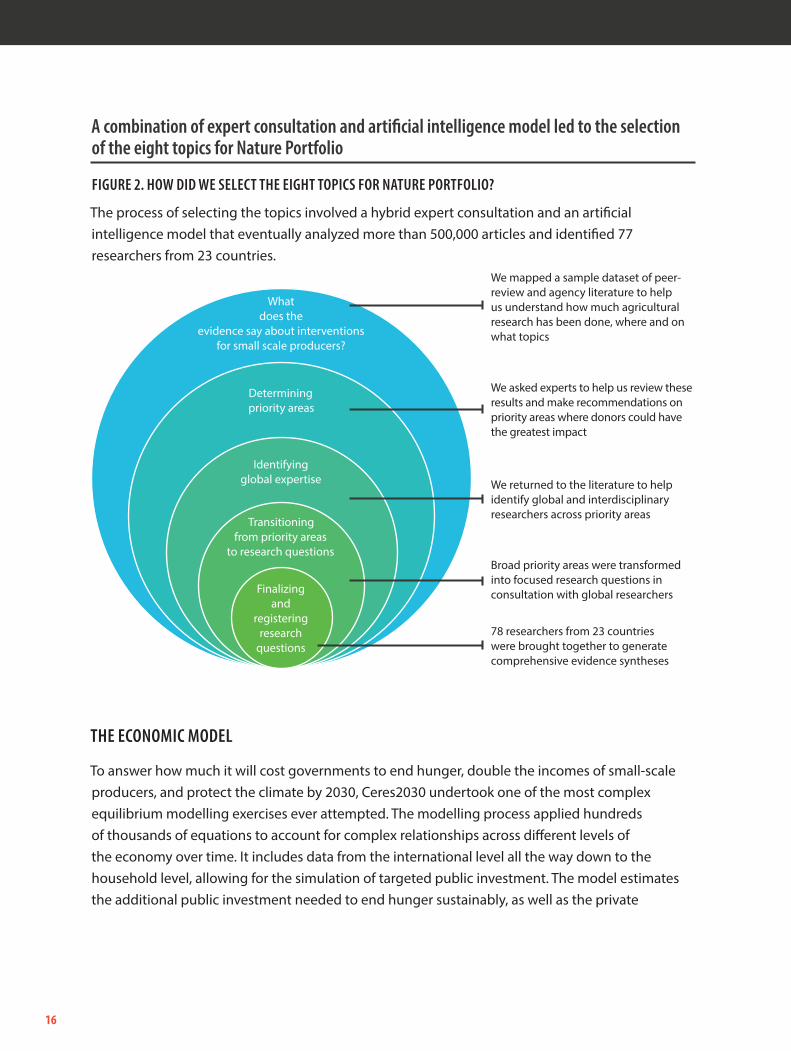
A combination of expert consultation and artificial intelligence model led to the selection of the eight topics for Nature Portfolio
FIGURE 2. HOW DID WE SELECT THE EIGHT TOPICS FOR NATURE PORTFOLIO?
The process of selecting the topics involved a hybrid expert consultation and an artificial intelligence model that eventually analyzed more than 500,000 articles and identified 77 researchers from 23 countries.
THE ECONOMIC MODEL
To answer how much it will cost governments to end hunger, double the incomes of small-scale producers, and protect the climate by 2030, Ceres2030 undertook one of the most complex equilibrium modelling exercises ever attempted. The modelling process applied hundreds of thousands of equations to account for complex relationships across different levels of the economy over time. It includes data from the international level all the way down to the household level, allowing for the simulation of targeted public investment. The model estimates the additional public investment needed to end hunger sustainably, as well as the private
What does the
evidence say about interventions for small scale producers?
Determining priority areas
Identifying global expertise
Transitioning from priority areas
to research questions
Finalizing and
registering research
questions78 researchers from 23 countries were brought together to generate comprehensive evidence syntheses
Broad priority areas were transformed into focused research questions in consultation with global researchers
We returned to the literature to help identify global and interdisciplinary researchers across priority areas
We asked experts to help us review these results and make recommendations on priority areas where donors could have the greatest impact
We mapped a sample dataset of peer-review and agency literature to help us understand how much agricultural research has been done, where and on what topics

1716
A combination of expert consultation and artificial intelligence model led to the selection of the eight topics for Nature Portfolio
FIGURE 2. HOW DID WE SELECT THE EIGHT TOPICS FOR NATURE PORTFOLIO?
The process of selecting the topics involved a hybrid expert consultation and an artificial intelligence model that eventually analyzed more than 500,000 articles and identified 77 researchers from 23 countries.
THE ECONOMIC MODEL
To answer how much it will cost governments to end hunger, double the incomes of small-scale producers, and protect the climate by 2030, Ceres2030 undertook one of the most complex equilibrium modelling exercises ever attempted. The modelling process applied hundreds of thousands of equations to account for complex relationships across different levels of the economy over time. It includes data from the international level all the way down to the household level, allowing for the simulation of targeted public investment. The model estimates the additional public investment needed to end hunger sustainably, as well as the private
What does the
evidence say about interventions for small scale producers?
Determining priority areas
Identifying global expertise
Transitioning from priority areas
to research questions
Finalizing and
registering research
questions78 researchers from 23 countries were brought together to generate comprehensive evidence syntheses
Broad priority areas were transformed into focused research questions in consultation with global researchers
We returned to the literature to help identify global and interdisciplinary researchers across priority areas
We asked experts to help us review these results and make recommendations on priority areas where donors could have the greatest impact
We mapped a sample dataset of peer-review and agency literature to help us understand how much agricultural research has been done, where and on what topics
17
investment generated by that additional public investment. The model also calculates the share of the total cost that ODA donors need to commit.5
When the International Food Policy Research Institute (IFPRI) and International Institute for Sustainable Development (IISD) ran a similar model in 2016, they found that governments were not on track to end hunger by 2030 (Laborde et al., 2016). However, the model results showed the goal could be achieved if governments invested additional resources, prioritized countries with the highest need, and used a better mix of the most effective interventions. With Ceres2030, the project team has generated new estimates of the additional public spending needed, factoring in estimates of the impacts of the COVID-19 pandemic and the requirements that small-scale producer income should double and demands on the environment be minimized.6 The strength of the model is that it captures the effects of the interactions among several interventions and uses household-level data to target spending to small-scale producers and households affected by hunger. It also captures the interactions between countries, considering positive spillovers through increased income and demand, as well as competitive effects through international trade. This allows decision-makers to optimize resource allocation and minimize their costs in their context. The additional public spending needed each year in each country is paid with a mix of external and domestic resources. The total costs are the sum of additional donor support required, together with the sums needed from domestic public spending in each country.7
In order to simulate the portfolio of interventions, the model uses policy instruments (for example, research and development spending in the CGIAR system) to represent the given intervention. Overall, 14 policy instruments were modelled based on existing data sources and a number of new parameters from the collection of evidence syntheses published in Nature Portfolio. The 14 policy instruments are as follows: food subsidies, vocational training, investment subsidies, fertilizer subsidies, capital endowments, production subsidies, national R&D, international R&D, extension services, irrigation infrastructure, agroforestry, improved forage, storage, and roads. Three of the
5 The allocation decisions between domestic and external resources are driven by an econometrically estimated co-funding rule linking the level of ODA contribution to the domestic public spending in relation to the income per capita of the recipient country. We found that the richer the country, the less it depends on external resources for its public spending. Full dependency on ODA occurs for countries with income per capita below USD 500. At the other end of the range, ODA is phased out from the model for countries that have USD 15,000 per capita or more. The model assumes domestic taxation is used to make up the difference between the ODA contribution and total public funding needed (Laborde et al., 2016).6 Greenhouse gas emissions from agriculture, including through use of land, energy, and fertilizers, was used as one key proxy for environmental sustainability. Economic growth was constrained by the greenhouse gas emissions targets for agriculture that countries agreed to in the UNFCCC Paris Agreement of 2015 to avoid dangerous climate change by limiting global warming to well below 2°C, aiming for 1.5°C. The projected quantity of water used was also analyzed to ensure a sustainable extraction of freshwater resources.7 The results should be interpreted as an estimate of the scale of resources needed at a big-picture level. This is useful to inform resource allocation decisions from the global level down to the national level, but are insufficient to inform strategy, planning, and programming at the sub-national level.

18 18
14—vocational training, agroforestry, and improved forage—are interventions based heavily on the collaboration with the evidence synthesis teams. Of the 11 based on existing data sources, two—extension services and storage—were augmented based on knowledge and parameters emerging from collaboration with the evidence synthesis teams.
3. FINDINGS & RECOMMENDATIONS
EMPOWER THE EXCLUDED
MAIN FINDINGS
• Enable participation in farmers’ organizations. Comparing data in 24 countries, mostly from Africa, membership in a farmers’ organization was associated with positive effects on income in 57% of the cases reviewed. Other positive effects correlated with farmers’ organizations included positive impacts on crop yield (19% of cases), crop quality (20%) and the environment (24%) (Bizikova et al., 2020).
• Invest in vocational programs for rural youth that offer integrated training in multiple skills. Programs that offer training in multiple skills to rural youth show promise in increasing employment levels and wages among the program graduates, creating new possibilities for income (Maiga et al., 2020).
• Scale up social protection programs. Social protection works best when the programs create a bridge for households living in poverty to find productive employment, removing the barriers they face in accessing markets, education, credit and other economic opportunities (Wouterse et al., 2020).
EVIDENCE ON EFFECTIVELY EMPOWERING THE EXCLUDED
Analyzing the available evidence with a focus on outcomes for small-scale producer income and productivity, it is clear that successful agricultural interventions work with a population that enjoys a minimum level of income and education, with access to networks and resources such as extension services and robust infrastructure. Whether the intervention is climate-resilient crops, membership in a farmers’ organization, or reducing crop losses, this minimum threshold matters (Acevedo et al., 2020; Bizikova et al., 2020; Stathers et al., 2020).

1918
14—vocational training, agroforestry, and improved forage—are interventions based heavily on the collaboration with the evidence synthesis teams. Of the 11 based on existing data sources, two—extension services and storage—were augmented based on knowledge and parameters emerging from collaboration with the evidence synthesis teams.
3. FINDINGS & RECOMMENDATIONS
EMPOWER THE EXCLUDED
MAIN FINDINGS
• Enable participation in farmers’ organizations. Comparing data in 24 countries, mostly from Africa, membership in a farmers’ organization was associated with positive effects on income in 57% of the cases reviewed. Other positive effects correlated with farmers’ organizations included positive impacts on crop yield (19% of cases), crop quality (20%) and the environment (24%) (Bizikova et al., 2020).
• Invest in vocational programs for rural youth that offer integrated training in multiple skills. Programs that offer training in multiple skills to rural youth show promise in increasing employment levels and wages among the program graduates, creating new possibilities for income (Maiga et al., 2020).
• Scale up social protection programs. Social protection works best when the programs create a bridge for households living in poverty to find productive employment, removing the barriers they face in accessing markets, education, credit and other economic opportunities (Wouterse et al., 2020).
EVIDENCE ON EFFECTIVELY EMPOWERING THE EXCLUDED
Analyzing the available evidence with a focus on outcomes for small-scale producer income and productivity, it is clear that successful agricultural interventions work with a population that enjoys a minimum level of income and education, with access to networks and resources such as extension services and robust infrastructure. Whether the intervention is climate-resilient crops, membership in a farmers’ organization, or reducing crop losses, this minimum threshold matters (Acevedo et al., 2020; Bizikova et al., 2020; Stathers et al., 2020).
19
For agricultural interventions to work, complementary approaches to overcome barriers to inclusion are important, especially for commonly marginalized populations such as small-scale producers. Important services that support the inclusion of small-scale producers include agricultural extension, market analysis (e.g., price information), and weather forecasts, all of which help to manage production risks (Acevedo et al., 2020; Piñeiro et al., 2020). One of the important enablers of improved income and productivity for producers is membership in a farmers’ organization. However, household poverty is inversely related to the probability of membership in a farmers’ organization (Bizikova et al., 2020). This is not only because poor households lack the means to pay membership fees and other participation costs, but also because small-scale producers are typically less well placed to take advantage of the services that membership in the organization confers, such as access to discounted prices on inputs or the opportunity to certify production. People living in poverty also have less capacity to participate in the governance of membership organizations (Bizikova et al., 2020).
Social safety nets can help to overcome these barriers. These interventions take the form of cash transfers, food stamps, or vouchers paid to people affected by hunger. They are expensive for public budgets but important. If well designed and given time, they can support the participation of poor households in productive economic activities and in supporting institutions such as farmers’ organizations. More recently, social protection has become the focus of more ambitious program design, in policies that aim to build a bridge to productive employment. These social protection interventions are targeted to overcome the barriers people living in poverty face in accessing markets, including skills training, access to credit, and guaranteed employment (Wouterse et al., 2020). Social protection also plays a critically important role during a crisis. The COVID-19 pandemic has been a stark reminder of how quickly the impressive gains in reducing the incidence of poverty and hunger in the world could be lost. We predict that a further 95 million people will be living in extreme poverty and hunger as a result of COVID-19 (Laborde & Smaller, 2020). The primary cause will be the loss of income caused by economic measures imposed to contain the pandemic (Laborde & Smaller, 2020).
Reviewing evidence on the effectiveness of incentives to improve sustainable agricultural practices on-farm showed that equity and efficiency objectives can sometimes conflict. If programs are targeted to regions with higher wealth and environmental degradation, wealthier farmers are more likely to take up and use incentive programs. If financial incentives are used to encourage uptake, higher uptake by wealthier farmers could deepen inequalities. The review showed interventions should be designed to take account of the population and to determine if incentives are needed to obtain the improved environmental practice desired (Piñeiro et al., 2020).
One of the time-tested ways that farmers have overcome their relative lack of bargaining power in their markets is by self-organizing. Returns to small-holder investment are determined by both efficiency gains (more output for units of land, labour, and purchased inputs) and the extent and

20 20
nature of market distortions and market failures, both of which will change the profitability of an activity. Comparing data in 24 countries (primarily in East, Southern and West Africa, as well as India), the researchers found that membership in a farmers’ organization is associated with positive effects on income in 57% of the cases reviewed. Other positive effects correlated with farmers’ organizations included positive impacts on crop yield (19% of cases), production (20%), and on the environment (24%) (Bizikova et al., 2020). The literature shows the single greatest benefit farmers’ organizations offer is to strengthen producers’ market power, which increases the share of the benefits from agricultural production that producers receive (Bizikova et al., 2020). The review of services to small-scale producers provided by SMEs also showed the importance of farmers’ organizations as an interface with the market (Liverpool-Tasie et al., 2020). Almost a quarter of the farmer’s organizations (22%) in the cases reviewed provided product marketing services to their members (Bizikova et al., 2020).
The international development community has recognized the challenge of including youth in agricultural development for some time (FAO et al., 2014; IFAD, 2019). Despite this recognition, the researchers found almost no studies assessing interventions to provide vocational training to rural youth. Promising projects and programs, as well as lessons learned in other sectors, suggest the important benefits of investing in programs for rural youth that provide integrated training in multiple skills (both vocational and technical, and including information and communication technology skills) (Maiga et al., 2020). The findings underlined the importance of education more broadly, which was also supported in other evidence syntheses in the series (Acevedo et al., 2020; Piñeiro et al., 2020). The finding is another reminder of the indivisible nature of the 2030 Agenda, with SDG 4 committing to provide good quality education for all.
2120
nature of market distortions and market failures, both of which will change the profitability of an activity. Comparing data in 24 countries (primarily in East, Southern and West Africa, as well as India), the researchers found that membership in a farmers’ organization is associated with positive effects on income in 57% of the cases reviewed. Other positive effects correlated with farmers’ organizations included positive impacts on crop yield (19% of cases), production (20%), and on the environment (24%) (Bizikova et al., 2020). The literature shows the single greatest benefit farmers’ organizations offer is to strengthen producers’ market power, which increases the share of the benefits from agricultural production that producers receive (Bizikova et al., 2020). The review of services to small-scale producers provided by SMEs also showed the importance of farmers’ organizations as an interface with the market (Liverpool-Tasie et al., 2020). Almost a quarter of the farmer’s organizations (22%) in the cases reviewed provided product marketing services to their members (Bizikova et al., 2020).
The international development community has recognized the challenge of including youth in agricultural development for some time (FAO et al., 2014; IFAD, 2019). Despite this recognition, the researchers found almost no studies assessing interventions to provide vocational training to rural youth. Promising projects and programs, as well as lessons learned in other sectors, suggest the important benefits of investing in programs for rural youth that provide integrated training in multiple skills (both vocational and technical, and including information and communication technology skills) (Maiga et al., 2020). The findings underlined the importance of education more broadly, which was also supported in other evidence syntheses in the series (Acevedo et al., 2020; Piñeiro et al., 2020). The finding is another reminder of the indivisible nature of the 2030 Agenda, with SDG 4 committing to provide good quality education for all.
21
ON THE FARM
MAIN FINDINGS
• Investment in extension services, particularly for women, must accompany R&D programs. The most important determinants of adoption of climate-resilient crops were the availability and effectiveness of extension services (Acevedo et al., 2020). Small and medium-sized enterprises such as cooperatives, processors, traders, and marketing platforms frequently couple their provision of inputs and purchase of producer output with training or extension services; this was the case for 40% of cooperatives and 19% of processors studied (Liverpool-Tasie et al., 2020).
• Agricultural interventions to support sustainable practices must be economically viable for farmers. Market and non-market regulations, regulatory measures and cross-compliance incentives linked to short-term economic benefits have a higher adoption rate and have been more successful when it comes to improving the environment than those aimed only at providing an ecological service. In the long term, and regardless of the incentive type, one of the strongest motivations to adopt and maintain sustainable practices is when farmers perceive positive outcomes of these practices for their farm or the environment (Piñeiro et al., 2020).
• Support adoption of climate-resilient crops. Where they are accessible, small-scale producers will use climate-resilient crops to cope with stresses such as drought, heat, flooding, salinity, and changes to the growing season. Adoption is markedly improved if the crops are supported by inclusive extension services and access to inputs. Higher levels of education and socioeconomic status are also positively correlated with the adoption of climate-resilient crops, as are crops that are commercially viable (Acevedo et al., 2020).
• Increase research on water-scarce regions to scale up effective farm-level interventions to assist small-scale producers. Nearly 80% of small-scale farms across low- and middle-income countries are located in water-scarce regions, a number similar to larger-scale farms, yet around 35% are irrigated compared to over 40% of larger farms. Promising areas that remain underexplored for small-scale producers in water-scarce regions include digital solutions and livestock in mixed farming systems (Ricciardi et al., 2020).
• Target improvements in the quantity and quality of livestock feed to small and medium-sized commercial farms. Obvious and useful options to improve the quality of feed are being overlooked, including better support for the use of crop residues. The literature shows a bias toward understanding the technicalities of livestock feeding while not paying enough attention to how technologies fit into farm practices (Baltenweck et al., 2020).
22 22
EVIDENCE FOR EFFECTIVE INTERVENTIONS ON THE FARM
Despite the importance of small-scale producers and their contribution to global food systems, the evidence teams found that research into how interventions affected small-scale producer income and well-being was scarce. Several of the research teams did find that interventions are more successful if they meet more than one objective simultaneously (e.g., paying attention to the marketability of a crop and not just its climate resilience or resistance to pests) (Acevedo et al., 2020; Baltenweck et al., 2020; Piñeiro et al., 2020). To increase their effectiveness, regulatory measures are often linked to economic incentives, such as short-term financial support to incentivize the participation of farmers. If environmental conditions on the farm improved with the intervention, the evidence shows farmers were more likely to persist with the more sustainable practices (Piñeiro et al., 2020).
A variety of interventions exist to encourage more sustainable on-farm practices. Market and non-market regulations and cross-compliance incentives that are linked to short-term economic benefits have been more successful at improving the environment than the interventions that focused only on ecological services (Piñeiro et al., 2020). Successful incentive programs are correlated with market conditions, farmers’ attitudes to the environmental problems being addressed, and the structure of the programs offered. For example, legal regulations have proven to be relatively effective for environmental outcomes, but they are a relatively complex and inflexible instrument—and unpopular with farmers, especially if the regulations do not make any provision for increased on-farm costs (Piñeiro et al., 2020).
Climate variability exposes food systems to greater risk and increases farmers’ costs. These risks threaten domestic food production in many low- and middle-income countries and disrupt international markets. Significant public investment has gone into successfully developing climate-resilient crops and crop varieties; the evidence shows that where they can access them, small-scale producers use climate-resilient crops to cope with stresses such as drought, heat, flooding, salinity, and changes to the growing season (Acevedo et al., 2020). They also adopt crops adapted to cope with the pests associated with changes in weather and climate patterns. Yet the evidence shows important barriers to adoption, too. They are best overcome in the presence of additional factors: the most important determinants of adoption of climate-resilient crops are the availability and effectiveness of extension services and outreach followed by education levels, farmers’ access to inputs, and socioeconomic status (see Figure 3). Nearly 50% of the studies on climate-resilient crops identify extension services as a factor for successful adoption. The evidence also suggests these factors do not work in isolation, but rather are mutually reinforcing. The most successful climate-resilient crops are accessible through a variety of distributors, reliable, affordable, easy to grow, and produce a crop for which there is market demand (Acevedo et al., 2020).

2322
EVIDENCE FOR EFFECTIVE INTERVENTIONS ON THE FARM
Despite the importance of small-scale producers and their contribution to global food systems, the evidence teams found that research into how interventions affected small-scale producer income and well-being was scarce. Several of the research teams did find that interventions are more successful if they meet more than one objective simultaneously (e.g., paying attention to the marketability of a crop and not just its climate resilience or resistance to pests) (Acevedo et al., 2020; Baltenweck et al., 2020; Piñeiro et al., 2020). To increase their effectiveness, regulatory measures are often linked to economic incentives, such as short-term financial support to incentivize the participation of farmers. If environmental conditions on the farm improved with the intervention, the evidence shows farmers were more likely to persist with the more sustainable practices (Piñeiro et al., 2020).
A variety of interventions exist to encourage more sustainable on-farm practices. Market and non-market regulations and cross-compliance incentives that are linked to short-term economic benefits have been more successful at improving the environment than the interventions that focused only on ecological services (Piñeiro et al., 2020). Successful incentive programs are correlated with market conditions, farmers’ attitudes to the environmental problems being addressed, and the structure of the programs offered. For example, legal regulations have proven to be relatively effective for environmental outcomes, but they are a relatively complex and inflexible instrument—and unpopular with farmers, especially if the regulations do not make any provision for increased on-farm costs (Piñeiro et al., 2020).
Climate variability exposes food systems to greater risk and increases farmers’ costs. These risks threaten domestic food production in many low- and middle-income countries and disrupt international markets. Significant public investment has gone into successfully developing climate-resilient crops and crop varieties; the evidence shows that where they can access them, small-scale producers use climate-resilient crops to cope with stresses such as drought, heat, flooding, salinity, and changes to the growing season (Acevedo et al., 2020). They also adopt crops adapted to cope with the pests associated with changes in weather and climate patterns. Yet the evidence shows important barriers to adoption, too. They are best overcome in the presence of additional factors: the most important determinants of adoption of climate-resilient crops are the availability and effectiveness of extension services and outreach followed by education levels, farmers’ access to inputs, and socioeconomic status (see Figure 3). Nearly 50% of the studies on climate-resilient crops identify extension services as a factor for successful adoption. The evidence also suggests these factors do not work in isolation, but rather are mutually reinforcing. The most successful climate-resilient crops are accessible through a variety of distributors, reliable, affordable, easy to grow, and produce a crop for which there is market demand (Acevedo et al., 2020).
23
Nearly 50% of the studies on climate-resilient crops identify extension services as a factor for successful adoption
FIGURE 3. IMPORTANCE OF EXTENSION SERVICES FOR CLIMATE-RESILIENT CROPS
Source: Acevedo et al., 2020
Climate change is increasing the incidence of extreme weather events that pose a risk to agricultural production and small-scale producer livelihoods, including both droughts and floods (IPCC, 2012; 2019). Estimates suggest that over 4.8 billion people worldwide will face at least one month of water scarcity each year by 2050 (Ricciardi et al., 2020). The creation of a map of small-scale farms (less than 5 hectares) overlaid with the availability of irrigation infrastructure showed a paucity of interventions where they are most needed.
0 20% 40% 60% 80% 100%
EXTENSION SERVICES
Extension/awareness/information
Education
Experience/skills
Climate information
Farmer knowledge and perceptions
Social networks and cooperatives
Farm inputs
Finance instruments, credit
Distance to seed and fertilizer markets
Land
Farm infrastructure & equipment (irrigation)
Access to labour
Social and economic status
Wealth
Government policy/program
ACCESS TO FINANCE
EDUCATION & EXPERIENCE
ENABLING ENVIRONMENT

24 24
Over a billion people depend on livestock for their livelihoods. Their animals are not just a food source for the household or an asset to be sold; the animals also serve vital roles on-farm, including draft power for plowing and high-value compost for crops. The demand for animal-sourced foods is increasing as both populations, and income levels rise. These foods are an important source of nutrition and income for the families that care for them and can be especially important for small-scale producers with limited access to land. However, dairy yields (litres of milk per cow) from livestock in Africa are up to 20 times below what they are in developed countries (Baltenweck et al., 2020). Increasing the productivity of livestock through improved feed, veterinary services and breeding programs are powerful interventions that support the goal of access for all to sufficient healthy food grown more sustainably. Such interventions can simultaneously reduce GHG emissions, for example by raising the yield of milk per animal (reducing the number of animals needed overall), or by switching to feeds that produce lower levels of methane as they are digested, while also increasing access to nutritious food and improving livelihoods (Baltenweck et al., 2020).
The evidence also provides reminders that small-scale producers are not a homogeneous population. For example, interventions to improve feed quality that target small-scale, semi-commercial farmers are particularly effective, as these farmers have the resources and the business interest to make better feed a priority. The evidence also shows that the use of crop residues as a means of feed improvement remains relatively underexploited. Access to improved crop residues could reduce dependence on purchased feed, thereby lowering costs. Making better use of crop residues is a good compromise solution for small-scale livestock producers, as they are close at hand, cheap, and effective, making them attractive for wider adoption (Baltenweck 2020).

2524
Over a billion people depend on livestock for their livelihoods. Their animals are not just a food source for the household or an asset to be sold; the animals also serve vital roles on-farm, including draft power for plowing and high-value compost for crops. The demand for animal-sourced foods is increasing as both populations, and income levels rise. These foods are an important source of nutrition and income for the families that care for them and can be especially important for small-scale producers with limited access to land. However, dairy yields (litres of milk per cow) from livestock in Africa are up to 20 times below what they are in developed countries (Baltenweck et al., 2020). Increasing the productivity of livestock through improved feed, veterinary services and breeding programs are powerful interventions that support the goal of access for all to sufficient healthy food grown more sustainably. Such interventions can simultaneously reduce GHG emissions, for example by raising the yield of milk per animal (reducing the number of animals needed overall), or by switching to feeds that produce lower levels of methane as they are digested, while also increasing access to nutritious food and improving livelihoods (Baltenweck et al., 2020).
The evidence also provides reminders that small-scale producers are not a homogeneous population. For example, interventions to improve feed quality that target small-scale, semi-commercial farmers are particularly effective, as these farmers have the resources and the business interest to make better feed a priority. The evidence also shows that the use of crop residues as a means of feed improvement remains relatively underexploited. Access to improved crop residues could reduce dependence on purchased feed, thereby lowering costs. Making better use of crop residues is a good compromise solution for small-scale livestock producers, as they are close at hand, cheap, and effective, making them attractive for wider adoption (Baltenweck 2020).
25
FOOD ON THE MOVE
8 For the purposes of this paper, the term “SMEs” refers to cooperatives, traders, processors, logistics firms, and other value chain actors.
MAIN FINDINGS
• Reduce post-harvest losses by expanding the focus of interventions beyond the storage of cereals, to include more links in the value chain and more food crops. The evidence base confirmed that several storage interventions, including the use of airtight bags and containers, are effective at reducing post-harvest losses for cereals and pulses. Other technology interventions were effective at reducing losses of fruits and vegetables: these included better handling practices, improved packaging, more careful timing of the harvest, and cold storage. There is a need to look at the effect of combining interventions and the need for more interventions for users other than farmers, as well as to investigate the potential of post-harvest training, finance, marketing, organization, governance, policies, and infrastructure interventions (Stathers et al., 2020).
• Invest in the infrastructure, regulations, services and technical assistance needed to support SMEs in the value chain. The evidence shows that SMEs8 are successfully serving farmers in low- and middle-income countries, particularly in Africa, and are correlated with technology adoption and higher productivity. They are typically more accessible to small farmers than larger enterprises (such as supermarkets) and small-scale producers value the mix of services that SMEs provide (Liverpool-Tasie et al., 2020).
EVIDENCE FOR EFFECTIVE INTERVENTIONS FOR FOOD ON THE MOVE
Small-scale producer productivity and income depend in part on access to post-harvest services such as storage, marketing information, processors, and food retailers. Drivers such as urbanization, population growth, and rising incomes in many low- and middle-income countries, have transformed both how much and what people eat (FAO, 2017; HLPE, 2017). These trends are transforming markets in which small-scale producers, changing what they need to know and the risks and opportunities they face.
The researchers looked at effective interventions to reduce post-harvest losses for 22 food crops with a focus on Africa and the low- and middle-income countries of South Asia. Interventions that increase the use of airtight containers (including hermetic bags) or admixture of a range of protectants are effective at reducing post-harvest losses for cereals and pulses. These measures kept quantity losses below 2% for maize, rice and sorghum, and below 5% for wheat during a 6-month storage period (Stathers et al., 2020). Simple improvements in handling practices such

26 26
as choosing the right time to harvest combined with good drying and sorting practices reduced losses in cereals and pulses. For example, simple improvements in handling practices for cereals (excluding rice) and pulses, such as drying, early harvesting, and sorting kept losses at or below 5%. Without these measures, cereal losses were between 11% and 20%. The use of improved handling methods (such as careful and timely harvesting for fruits, or curing for onions), transport packaging containers, and evaporatively cooled and cold storage reduced losses in the focal fruits and vegetables. Evaporatively cooled, cold, or well-ventilated structures or improved pits kept quantity and quality losses of potato below 16% and 9% during storage, respectively (Stathers et al., 2020). Harvesting rice at the recommended time kept losses below 1% and damage below 10%, while harvesting rice too early or too late led to losses of up to 20% and up to a third of the crop sustaining damage (Stathers et al., 2020).
The researchers looking at post-harvest losses found the evidence base to be skewed toward cereal crops (particularly maize), as opposed to a wider variety of foods. Other biases included a focus on technologies rather than training, finance, policy, infrastructure, or market interventions—let alone combinations of these elements. The evidence base is also scarce on food losses outside of storage, such as during harvesting, transportation, and processing, and on non-farm actors in the food chain. There is almost nothing on the socioeconomic and environmental outcomes of post-harvest loss interventions, nor on farmers’ understanding and knowledge (Stathers et al., 2020).
The growth of food systems has created huge market and employment opportunities for farmers along supply chain segments, including food processing, wholesale, and retail. The extent to which these opportunities are available to small-scale producers has not been well established. These segments are often the farmers’ immediate interface with the market, through which they sell their products, obtain logistics and intermediation services, and purchase farm inputs. Where accessible, they could potentially improve the revenue-generation opportunities for small-scale producers. Researchers reviewed 202 studies on market interactions between small-scale producers and a variety of market channels (including product traders, logistics firms, processors, and retailers) through the use of non-formal contractual arrangements. These services were primarily offered by SMEs (Liverpool-Tasie et al., 2020).
The evidence shows SMEs are flourishing in rural areas, providing farmers with a host of linked services, including the provision of inputs (especially credit and training), buying crops, connecting farmers to processors, and offering market information. This economic activity has not been well understood to date. Actors in the midstream of crop value chains are sometimes mistakenly referred to as the “missing middle” in descriptions of food systems in developing countries. In fact, the evidence shows they are very much present—and active and dynamic. They are not so much missing as “hidden” in the policy debate (Liverpool-Tasie et al., 2020). Yet the coverage SMEs can provide is uneven and usually informal. As a result, economic risk is fairly high

2726
as choosing the right time to harvest combined with good drying and sorting practices reduced losses in cereals and pulses. For example, simple improvements in handling practices for cereals (excluding rice) and pulses, such as drying, early harvesting, and sorting kept losses at or below 5%. Without these measures, cereal losses were between 11% and 20%. The use of improved handling methods (such as careful and timely harvesting for fruits, or curing for onions), transport packaging containers, and evaporatively cooled and cold storage reduced losses in the focal fruits and vegetables. Evaporatively cooled, cold, or well-ventilated structures or improved pits kept quantity and quality losses of potato below 16% and 9% during storage, respectively (Stathers et al., 2020). Harvesting rice at the recommended time kept losses below 1% and damage below 10%, while harvesting rice too early or too late led to losses of up to 20% and up to a third of the crop sustaining damage (Stathers et al., 2020).
The researchers looking at post-harvest losses found the evidence base to be skewed toward cereal crops (particularly maize), as opposed to a wider variety of foods. Other biases included a focus on technologies rather than training, finance, policy, infrastructure, or market interventions—let alone combinations of these elements. The evidence base is also scarce on food losses outside of storage, such as during harvesting, transportation, and processing, and on non-farm actors in the food chain. There is almost nothing on the socioeconomic and environmental outcomes of post-harvest loss interventions, nor on farmers’ understanding and knowledge (Stathers et al., 2020).
The growth of food systems has created huge market and employment opportunities for farmers along supply chain segments, including food processing, wholesale, and retail. The extent to which these opportunities are available to small-scale producers has not been well established. These segments are often the farmers’ immediate interface with the market, through which they sell their products, obtain logistics and intermediation services, and purchase farm inputs. Where accessible, they could potentially improve the revenue-generation opportunities for small-scale producers. Researchers reviewed 202 studies on market interactions between small-scale producers and a variety of market channels (including product traders, logistics firms, processors, and retailers) through the use of non-formal contractual arrangements. These services were primarily offered by SMEs (Liverpool-Tasie et al., 2020).
The evidence shows SMEs are flourishing in rural areas, providing farmers with a host of linked services, including the provision of inputs (especially credit and training), buying crops, connecting farmers to processors, and offering market information. This economic activity has not been well understood to date. Actors in the midstream of crop value chains are sometimes mistakenly referred to as the “missing middle” in descriptions of food systems in developing countries. In fact, the evidence shows they are very much present—and active and dynamic. They are not so much missing as “hidden” in the policy debate (Liverpool-Tasie et al., 2020). Yet the coverage SMEs can provide is uneven and usually informal. As a result, economic risk is fairly high
27
for the actors involved, and it is hard to protect the standards that buyers along the value chain impose. Tin addition, the evidence suggests government agencies often fail to make the most of the services provided by SMEs. For example, they are inclined to set up competing services rather than complementing existing activity. The evidence synthesis identified weaknesses in the SME sector that governments might address, including limited technical capacity, weak managerial and organizational skills, and poor coordination within the sector (Liverpool-Tasie et al., 2020).
Farmers appreciate the complementary services that SMEs provide, which are also correlated with technology adoption and higher productivity among farmers (Liverpool-Tasie et al., 2020). Services found to be offered together include: providing credit along with transport and processing services (the case of 22% of traders and 31% of processors studied); inputs coupled with training or extension services (the case of over 40% of cooperatives and 19% of processors); logistics service providers also acting as buyers (the case of 44% of logistics service providers) and input providers also acting as buyers (the case of 25% of cooperatives) (Liverpool-Tasie et al., 2020).
9 The results from the modelling should be interpreted as an estimate of the scale of resources needed at the big-picture level. This is useful to inform resource allocation decisions from the global level down to the national level but is insufficient to inform strategy, planning, and programming at the subnational level.
WHAT IS THE FUNDING GAP?
The second question the Ceres2030 project sought to answer was, what will it cost governments to end hunger, double the incomes of small-scale producers, and protect the climate by 2030? The additional cost is distributed across the three categories of interventions: empower the excluded, on the farm, and food on the move.
The results from the model show that donors need to contribute an additional USD 14 billion per year on average until 2030 to end hunger and double incomes of small-scale producers in low- and middle-income countries. The investment achieves these goals while maintaining greenhouse gas emissions for agriculture below the commitments made in the Paris Agreement (see Figure 4).
Donors currently spend USD 12 billion per year on food security and nutrition and therefore need to double their contributions to meet the goals. However, ODA alone will not be enough. Additional public spending of USD 19 billion per year on average until 2030 will have to be provided by low- and middle-income countries through increased taxation.
Together, the additional public investment from donors and low- and middle-income countries will prevent 490 million people from experiencing hunger, double the incomes of 545 million producers and their families on average, and limit greenhouse gas emissions for agriculture to the commitments made in the Paris Agreement.9 Importantly, the additional public spending will, on average, spur an extra USD 52 billion in private investment per year.

28 28
The current level of donor spending averages USD 12 billion per year, only half of what is needed to meet the goal of ending hunger by 2030
FIGURE 4. THE FUNDING GAP OVER TIME AND BY CATEGORY OF INTERVENTION
Source: Author’s calculations.
By far the region with the greatest need for additional resources is in Africa. Figure 5 shows the donor contribution needed in Africa compared to other low- and middle-income countries and distributed across the three categories of interventions. The need in Africa is particularly high since more than half of the global undernourished population will be concentrated on this continent by 2030.
Two thirds of the additional public spending is needed in Africa to achieve the targets
FIGURE 5. FUNDING GAP BY REGION AND BY CATEGORY OF INTERVENTION*
Source: Authors’ calculations.* Funding gap for global R&D is not included in the regional breakdown.
USD
bill
ion
0
5
10
15
20
25
30
35
2020 2021 2022 2023 2024 2025 2026 2027 2028 2029 2030
Food on the Move
On the Farm
Empower the Excluded
ODA (Actual)
ODA (Target)
USD 26 billion
+ USD 14 billion
02468
10121416
Africa Other low- and middle-income countries
USD
bill
ion
(201
8), a
nnua
l ave
rage
Funding gap by region and by category of intervention
Food on the Move
On the Farm
Empower the Excluded
ODA (actual)
USD
8.2 b
illio
n
USD
4bi
llion

2928
The current level of donor spending averages USD 12 billion per year, only half of what is needed to meet the goal of ending hunger by 2030
FIGURE 4. THE FUNDING GAP OVER TIME AND BY CATEGORY OF INTERVENTION
Source: Author’s calculations.
By far the region with the greatest need for additional resources is in Africa. Figure 5 shows the donor contribution needed in Africa compared to other low- and middle-income countries and distributed across the three categories of interventions. The need in Africa is particularly high since more than half of the global undernourished population will be concentrated on this continent by 2030.
Two thirds of the additional public spending is needed in Africa to achieve the targets
FIGURE 5. FUNDING GAP BY REGION AND BY CATEGORY OF INTERVENTION*
Source: Authors’ calculations.* Funding gap for global R&D is not included in the regional breakdown.
USD
bill
ion
0
5
10
15
20
25
30
35
2020 2021 2022 2023 2024 2025 2026 2027 2028 2029 2030
Food on the Move
On the Farm
Empower the Excluded
ODA (Actual)
ODA (Target)
USD 26 billion
+ USD 14 billion
02468
10121416
Africa Other low- and middle-income countries
USD
bill
ion
(201
8), a
nnua
l ave
rage
Funding gap by region and by category of intervention
Food on the Move
On the Farm
Empower the Excluded
ODA (actual)
USD
8.2 b
illio
n
USD
4bi
llion
29
There are two instruments used to generate an estimate of the donor contribution needed for empowering the excluded: income support through food subsidies (social protection programs) and vocational training programs. The donor contribution for these instruments is an additional USD 3 billion per year on average.
To estimate the donor contribution needed for interventions on the farm, the modellers used 10 policy instruments that directly affect the technologies available for small-scale producers and what and how they produce: investment subsidies, fertilizer subsidies, capital endowments, production subsidies, national R&D, international R&D, extension services, irrigation infrastructure, agroforestry, and improved forage. The donor contribution for this category is an additional USD 9 billion per year on average. Interestingly, each instrument’s investment follows a different time profile to achieve the targets by 2030, with spending on core public goods—especially R&D, which has a long lag before payoff but a high return—to be prioritized first.
The modellers used two policy instruments to estimate the donor contribution needed to support moving food to market. Both instruments contribute directly to increased income opportunities for farmers while reducing overall costs for consumers. The two instruments are increased rural infrastructure and storage opportunities, both of which contribute to a reduction in post-harvest losses. The donor contribution is an additional USD 2 billion per year on average.
4. CROSS-CUTTING LESSONS
SUCCESSFUL INTERVENTIONS DEPEND ON HUMAN, SOCIAL, FINANCIAL, AND KNOWLEDGE CAPITAL
Effective technology interventions rely on interdependencies among human, social, financial and knowledge capital. To protect the 2030 Agenda commitment to leave no one behind, governments must underwrite all these forms of capital. The lack of information on complex outcomes has to be addressed to build a knowledge base on how to nurture different facets of sustainable development (Bizikova et al., 2020; Liverpool-Tasie, 2020; Stathers et al., 2020)
IT IS IMPORTANT TO BUILD AN INTEGRATED PORTFOLIO OF POLICY INTERVENTIONS
The evidence synthesis researchers found that integrated portfolios of policy interventions work better than isolated fixes. SMEs, in particular, are providing farmers with a range of services. In addition to linking them to markets, SMEs are an important source of credit and capacity building on product standards. The research shows these “wraparound” services are one of the things small-scale producers most appreciate about SMEs (Liverpool-Tasie et al., 2020). The adoption of climate-resilient crops, too, showed the importance of extension services, education about climate change, and the great importance that farmers that attached to ensuring crops also have good sales markets (Acevedo et al., 2020). In addition, incentives for sustainable agricultural practices showed both the usefulness of meeting farmers’ short-term financial constraints with the incentives

30 30
schemes, and the importance of farmers’ understanding the environmental benefits to sustain participation in the program in the longer term (Piñeiro et al., 2020).
GENDER-DISAGGREGATED STATISTICS FOR AGRICULTURE AND RURAL DEVELOPMENT REMAIN SCARCE
Gender-disaggregated datasets are slowly being built. Researchers and policy-makers know more now than they did 10 years ago. However, although they are becoming more available for health and nutritional outcomes, gender-disaggregated statistics for agriculture and rural development are still sparse (Bizikova, 2020). Among the evidence that synthesis teams counted, just 10% or so of the reviewed papers considered gender differences in the outcomes of the interventions. The team researching SMEs found that only 12% of the 202 studies they reviewed included a focus on gender. However, gender matters—first as a human rights issue and also for the effectiveness of interventions. For example, the findings from the papers reviewed for the livestock study found two-thirds of livestock keepers in low- and middle-income countries are female (Baltenweck et al., 2020). Gender and marital status also affect membership in farmers’ organizations, with married women less likely to join (Bizikova, 2020). Data collection is necessary to better understand social gendered differences between and within households, yet the research teams found little evidence of socioeconomic outcomes, including gender-disaggregated outcomes (Acevedo et al., 2020; Ricciardi et al., 2020; Stathers et al., 2020).
EVIDENCE-BASED POLICY IS ONLY AS GOOD AS THE EVIDENCE BASE AVAILABLE
The data gaps are not confined to gender. The evidence teams found large gaps in the research to support answers to the kinds of questions that donors and governments are asking. Based on our studies and a review of 20 other systematic reviews, less than 2% of the available evidence base is pertinent for the questions donors typically want to investigate, such as the cost of an intervention (Porciello et al., 2020a). Most challenging for calibrating the model with outcomes from the evidence, almost none of the published evidence considers the cost of the technology—or who should pay. For example, the research on livestock interventions found that very few studies (6 out of 73) reported combined evidence of adoption, productivity, and livelihood effects (Baltenweck et al., 2020).
Large areas of the world are invisible in the literature. The researchers found many of the widely shared beliefs and assumptions about agricultural development rest on a geographically incomplete database. In addition, Decision-makers are increasingly asking for policy prescriptions that mix interventions. However, the researchers did not find a lot of evidence that looked at the system effects of multiple interventions. Investments in developing standardized frameworks and indices for links between livelihoods and the environment, livelihoods, and youth, similar to the Women’s Empowerment in Agriculture Index (WEAI), is one approach that can fill critical gaps in the evidence base. There is an urgent need to invest in the development of standardized frameworks to improve the quality and availability of research over time.

3130
schemes, and the importance of farmers’ understanding the environmental benefits to sustain participation in the program in the longer term (Piñeiro et al., 2020).
GENDER-DISAGGREGATED STATISTICS FOR AGRICULTURE AND RURAL DEVELOPMENT REMAIN SCARCE
Gender-disaggregated datasets are slowly being built. Researchers and policy-makers know more now than they did 10 years ago. However, although they are becoming more available for health and nutritional outcomes, gender-disaggregated statistics for agriculture and rural development are still sparse (Bizikova, 2020). Among the evidence that synthesis teams counted, just 10% or so of the reviewed papers considered gender differences in the outcomes of the interventions. The team researching SMEs found that only 12% of the 202 studies they reviewed included a focus on gender. However, gender matters—first as a human rights issue and also for the effectiveness of interventions. For example, the findings from the papers reviewed for the livestock study found two-thirds of livestock keepers in low- and middle-income countries are female (Baltenweck et al., 2020). Gender and marital status also affect membership in farmers’ organizations, with married women less likely to join (Bizikova, 2020). Data collection is necessary to better understand social gendered differences between and within households, yet the research teams found little evidence of socioeconomic outcomes, including gender-disaggregated outcomes (Acevedo et al., 2020; Ricciardi et al., 2020; Stathers et al., 2020).
EVIDENCE-BASED POLICY IS ONLY AS GOOD AS THE EVIDENCE BASE AVAILABLE
The data gaps are not confined to gender. The evidence teams found large gaps in the research to support answers to the kinds of questions that donors and governments are asking. Based on our studies and a review of 20 other systematic reviews, less than 2% of the available evidence base is pertinent for the questions donors typically want to investigate, such as the cost of an intervention (Porciello et al., 2020a). Most challenging for calibrating the model with outcomes from the evidence, almost none of the published evidence considers the cost of the technology—or who should pay. For example, the research on livestock interventions found that very few studies (6 out of 73) reported combined evidence of adoption, productivity, and livelihood effects (Baltenweck et al., 2020).
Large areas of the world are invisible in the literature. The researchers found many of the widely shared beliefs and assumptions about agricultural development rest on a geographically incomplete database. In addition, Decision-makers are increasingly asking for policy prescriptions that mix interventions. However, the researchers did not find a lot of evidence that looked at the system effects of multiple interventions. Investments in developing standardized frameworks and indices for links between livelihoods and the environment, livelihoods, and youth, similar to the Women’s Empowerment in Agriculture Index (WEAI), is one approach that can fill critical gaps in the evidence base. There is an urgent need to invest in the development of standardized frameworks to improve the quality and availability of research over time.
31
For a number of intervention areas reviewed, the evidence shows governments are investing in proven technologies. This was true of post-harvest management and loss reduction, for example, and climate-resilient crops. Amid the proliferation of published research, however, the results showed significant blind spots. There was a lot of evidence on yield effects, but with very little consideration of effects on farm income, nutrition, or environmental cost (Liverpool-Tasie et al., 2020; Ricciardi et al., 2020; Stathers et al., 2020). There was also a lot of evidence on the effectiveness of technologies; for example, on whether and by how much GHG emissions were reduced or water quality improved. But broader ecosystem effects were captured much less often. Even less evidence has been published on whether a proven technology is actually used on the farm, whether it increases incomes, and if it changed on-farm practices or expanded market opportunities.
10 Data extracted from the OECD Development Assistance Committee (DAC) Creditor Reporting System (CRS) database (OECD, n.d.a). Spending on agriculture is defined by the DAC codes for agriculture, forestry and fishing total (sector code 310) and rural development (purpose code 43040). Percentages calculated relative to total ODA, all sectors. Values refer to total disbursements in constant 2018 US dollars.
SPENDING MORE AND BETTER IS VITAL
Total ODA for agriculture increased significantly in response to the 2007–2008 international food price crisis. New institutions were built, bridging spending to reduce poverty and social exclusion with investments in raising agricultural productivity. However, agricultural spending is still a relatively small share of the ODA budget (since 2014, G7 donors have each disbursed between 3% and 7% of their total ODA budget on agriculture10) (Eber-Rose et al., 2020). We estimate that spending needs to double to meet the ambition of SDG 2, and yet actual disbursements to agriculture are faltering. ODA flows are predicted to decrease because of the global economic slowdown associated with the COVID-19 pandemic—the International Monetary Fund (IMF) has predicted a global growth decline of 5% that will reduce fiscal space in donor countries, which is likely to reduce ODA flows (IMF, 2020).
Nowhere is ODA playing as central a role as it does in Africa. Total ODA spending is increasingly concentrated in Africa and Asia; Africa has been the main recipient of agricultural ODA since 2011 (Eber-Rose et al., 2020). In 2017, the share of ODA in the foreign finances received by African countries south of the Sahara was 36%, compared to 31% from overseas personal remittances and 23% from FDI (OECD, n.d.b).

32 32
5. CONCLUSION
Governments have 10 years until 2030. The sooner the investments are made in the 2030 Agenda, the less it will cost the public purse and the more sustained the outcomes are likely to prove. Building resilient and inclusive economies is a much better basis for ending hunger than providing a social safety net; social protection is necessary for the resilience of a society, but it is not sufficient in and of itself. There is a further reason for urgency, beyond the rising costs associated with inaction: the need to act now to limit irreversible damage to the earth’s ecosystems. For the environment, too, waiting means foreclosing options, some of them permanently.
Ceres2030 was an experiment, an effort to make better use of the available evidence in policy decisions. A multidisciplinary team equipped with a variety of research tools and some relatively clear—if broad—questions was able to use machine learning, teams of researchers, and a highly sophisticated cost model to answer complex questions. The experiment is ripe for reiteration, improvement, and new frontiers.

3332
5. CONCLUSION
Governments have 10 years until 2030. The sooner the investments are made in the 2030 Agenda, the less it will cost the public purse and the more sustained the outcomes are likely to prove. Building resilient and inclusive economies is a much better basis for ending hunger than providing a social safety net; social protection is necessary for the resilience of a society, but it is not sufficient in and of itself. There is a further reason for urgency, beyond the rising costs associated with inaction: the need to act now to limit irreversible damage to the earth’s ecosystems. For the environment, too, waiting means foreclosing options, some of them permanently.
Ceres2030 was an experiment, an effort to make better use of the available evidence in policy decisions. A multidisciplinary team equipped with a variety of research tools and some relatively clear—if broad—questions was able to use machine learning, teams of researchers, and a highly sophisticated cost model to answer complex questions. The experiment is ripe for reiteration, improvement, and new frontiers.
33
REFERENCES
Acevedo, M., Pixley, K., Zinyengere, N., Meng, S., Tufan, H., Cichy, K., Bizikova, L., Issacs, K., Ghezzi-Kopel, K., & Porciello J. (2020). A scoping review of adoption of climate resilient crops by small-scale producers in low-and middle-income countries. Nature Plants. https://doi.org/10.1038/s41477-020-00783-z
Baltenweck, I., Cherney, D., Duncan, A., Eldermire, E., Lwoga, T., Labarta, R., Rao, E.J., Staal, S., & Teufel, N. (2020). A scoping review of feed interventions and livelihoods of small-scale livestock keepers. Nature Plants. https://doi.org/10.1038/s41477-020-00786-w
Bizikova, L. (2020). Ending hunger sustainably: The role of gender. IISD, IFPRI, and Cornell University. https://ceres2030.org/wp-content/uploads/2020/08/ceres2030-en-background-note-ending-hunger-sustainably-the-role-of-gender.pdf
Bizikova, L., Brewin, S., Bridle, R., Laan, T., Murphy, S., Sanchez, L., & Smaller, C. (2020a). The sustainable agriculture transition: Technology options for low- and middle-income countries. IISD. https://www.iisd.org/sites/default/files/2020-08/sustainable-agriculture-transition-technology.pdf
Bizikova, L., Nkonya, E., Minah, M., Hanisch, M., Turaga, R.M.R., Speranza, C., Muthumariappan, K., Tang, L., Ghezzi-Kopel, K., Kelly, J., Celestin, A., & Timmers, B. (2020b). A scoping review of the contributions of farmers’ organizations to smallholder agriculture. Nature Food. https://doi.org/10.1038/s43016-020-00164-x
Bornmann, L., & Mutz, R. (2015). Growth rates of modern science: A bibliometric analysis based on the number of publications and cited references. Journal of the Association for Information Science and Technology, 66(11), 2215–2222. https://doi.org/10.1002/asi.23329
Eber-Rose, M., Laborde, D. & Murphy, S. (2020). Ending Hunger Sustainably: Trends in ODA Spending for Agriculture. Cornell University, IFPRI and IISD.
Evidence synthesis for sustainability. (2020). Nature Sustainability. https://doi.org/10.1038/s41893-020-00629-8
Feast and famine in agricultural research. (2020). Nature Plants. https://doi.org/10.1038/s41477-020-00795-9
Food and Agriculture Organization of the United Nations (FAO). (2012). The state of food and agriculture: Investing in agriculture for a better future. http://www.fao.org/3/i3028e/i3028e.pdf
Food and Agriculture Organization of the United Nations. (2017). The state of food and agriculture: Leveraging food systems for inclusive rural transformation. http://www.fao.org/3/a-i7658e.pdf
Food and Agriculture Organization of the United Nations, International Fund for Agricultural Development (IFAD), United Nations Children’s Fund (UNICEF), World Food Programme (WFP) and World Health Organization (WHO). (2018). The state of food security and nutrition in the

34 34
world 2018. Building climate resilience for food security and nutrition. FAO. http://www.fao.org/3/I9553EN/i9553en.pdf
Food and Agriculture Organization of the United Nations, International Fund for Agricultural Development, United Nations Children’s Fund, World Food Programme, and World Health Organization. (2020). The state of food security and nutrition in the world 2020. Transforming food systems for affordable healthy diets. FAO. http://www.fao.org/3/ca9692en/online/ca9692en.html
Food and Agriculture Organization of the United Nations, Technical Centre for Agricultural and Rural Cooperation (CTA) and International Fund for Agricultural Development. (2014). Youth and agriculture: Key challenges and concrete solutions. http://www.fao.org/3/a-i3947e.pdf
High Level Panel of Experts (HLPE). (2017). Nutrition and food systems. A report by the High Level Panel of Experts on Food Security and Nutrition of the Committee on World Food Security. http://www.fao.org/3/a-i7846e.pdf
Intergovernmental Panel on Climate Change (IPCC). (2012). Managing the risks of extreme events and disasters to advance climate change adaptation. A special report of working Groups I and II of the Intergovernmental Panel on Climate Change. C.B. Field, V. Barros, T.F. Stocker, D. Qin, D.J. Dokken, K.L. Ebi, M.D. Mastrandrea, K.J. Mach, G.-K. Plattner, S.K. Allen, M. Tignor, & P.M.Midgley (Eds.). Cambridge University Press. https://www.ipcc.ch/report/managing-the-risks-of-extreme-events-and-disasters-to-advance-climate-change-adaptation/
Intergovernmental Panel on Climate Change. (2019). Summary for policymakers. In P.R. Shukla, J. Skea, E. Calvo Buendia, V. Masson-Delmotte, H.- O. Pörtner, D. C. Roberts, P. Zhai, R. Slade, S. Connors, R. van Diemen, M. Ferrat, E. Haughey, S. Luz, S. Neogi, M. Pathak, J. Petzold, J. Portugal Pereira, P. Vyas, E. Huntley, K. Kissick, M. Belkacemi, & J. Malley, (Eds.). Climate change and land: An IPCC special report on climate change, desertification, land degradation, sustainable land management, food security, and greenhouse gas fluxes in terrestrial ecosystems. https://www.ipcc.ch/srccl/
International Fund for Agricultural Development (IFAD). (2019). Creating opportunities for rural youth: 2019 development report. https://www.ifad.org/documents/38714170/41190221/RDR2019_Overview_e_W.pdf/699560f2-d02e-16b8-4281-596d4c9be25a
International Monetary Fund (IMF). (2020). World economic outlook update, June. https://www.imf.org/en/Publications/WEO/Issues/2020/06/24/WEOUpdateJune2020
Laborde, D., Bizikova, L., Lallemant, T., & Smaller, C. (2016). Ending hunger: What would it cost? International Institute for Sustainable Development and International Food Policy Research Institute. http://ebrary.ifpri.org/utils/getfile/collection/p15738coll5/id/5532/filename/5533.pdf
Laborde, D. & Smaller, C. (2020). What would it cost to avert the COVID-19 hunger crisis? Ceres 2030 Report. International Institute for Sustainable Development. https://hdl.handle.net/1813/70172
Laborde, D., Parent, M. & Smaller, C. (2020). Ending hunger, increasing incomes and protecting the climate: What would it cost? Cornell University, IFPRI and IISD.

3534
world 2018. Building climate resilience for food security and nutrition. FAO. http://www.fao.org/3/I9553EN/i9553en.pdf
Food and Agriculture Organization of the United Nations, International Fund for Agricultural Development, United Nations Children’s Fund, World Food Programme, and World Health Organization. (2020). The state of food security and nutrition in the world 2020. Transforming food systems for affordable healthy diets. FAO. http://www.fao.org/3/ca9692en/online/ca9692en.html
Food and Agriculture Organization of the United Nations, Technical Centre for Agricultural and Rural Cooperation (CTA) and International Fund for Agricultural Development. (2014). Youth and agriculture: Key challenges and concrete solutions. http://www.fao.org/3/a-i3947e.pdf
High Level Panel of Experts (HLPE). (2017). Nutrition and food systems. A report by the High Level Panel of Experts on Food Security and Nutrition of the Committee on World Food Security. http://www.fao.org/3/a-i7846e.pdf
Intergovernmental Panel on Climate Change (IPCC). (2012). Managing the risks of extreme events and disasters to advance climate change adaptation. A special report of working Groups I and II of the Intergovernmental Panel on Climate Change. C.B. Field, V. Barros, T.F. Stocker, D. Qin, D.J. Dokken, K.L. Ebi, M.D. Mastrandrea, K.J. Mach, G.-K. Plattner, S.K. Allen, M. Tignor, & P.M. Midgley (Eds.). Cambridge University Press. https://www.ipcc.ch/report/managing-the-risks-of-extreme-events-and-disasters-to-advance-climate-change-adaptation/
Intergovernmental Panel on Climate Change. (2019). Summary for policymakers. In P.R. Shukla, J. Skea, E. Calvo Buendia, V. Masson-Delmotte, H.- O. Pörtner, D. C. Roberts, P. Zhai, R. Slade, S. Connors, R. van Diemen, M. Ferrat, E. Haughey, S. Luz, S. Neogi, M. Pathak, J. Petzold, J. Portugal Pereira, P. Vyas, E. Huntley, K. Kissick, M. Belkacemi, & J. Malley, (Eds.). Climate change and land: An IPCC special report on climate change, desertification, land degradation, sustainable land management, food security, and greenhouse gas fluxes in terrestrial ecosystems. https://www.ipcc.ch/srccl/
International Fund for Agricultural Development (IFAD). (2019). Creating opportunities for rural youth: 2019 development report. https://www.ifad.org/documents/38714170/41190221/RDR2019_Overview_e_W.pdf/699560f2-d02e-16b8-4281-596d4c9be25a
International Monetary Fund (IMF). (2020). World economic outlook update, June. https://www.imf.org/en/Publications/WEO/Issues/2020/06/24/WEOUpdateJune2020
Laborde, D., Bizikova, L., Lallemant, T., & Smaller, C. (2016). Ending hunger: What would it cost? International Institute for Sustainable Development and International Food Policy Research Institute. http://ebrary.ifpri.org/utils/getfile/collection/p15738coll5/id/5532/filename/5533.pdf
Laborde, D. & Smaller, C. (2020). What would it cost to avert the COVID-19 hunger crisis? Ceres 2030 Report. International Institute for Sustainable Development. https://hdl.handle.net/1813/70172
Laborde, D., Parent, M. & Smaller, C. (2020). Ending hunger, increasing incomes and protecting the climate: What would it cost? Cornell University, IFPRI and IISD.
35
Lipper, L. DeFries, R., & Bizikova, L. (2020). Shedding light on the evidence blind spots confounding the multiple objectives of SDG 2. Nature Plants. https://doi.org/10.1038/s41477-020-00792-y
Liverpool-Tasie, L.S., Wineman, A., Young, S., Tambo, J., Vargas, C., Reardon, T., Adjognon, G.S., Porciello, J., Gathoni, N., Bizikova, L. Galiè, A., & Celestin, A. (2020). A scoping review of market links between value chain actors and small-scale producers in developing regions. Nature Sustainability. https://10.1038/s41893-020-00621-2
Lowder, S. K., Skoet, J. & Raney, T. (2016). The number, size, and distribution of farms, smallholder farms, and family farms worldwide. World Development, 87, 16–29. https://www.sciencedirect.com/science/article/pii/S0305750X15002703
Maiga, E., Porgo, M., Zahonogo, P., Amegnaglo, C., Coulibaly, D., Flynn, J., Seogo , W., Traoré, S., Kelly, J., & Chimwaza, G., (2020). A systematic review of employment outcomes from youth skills training programmes in agriculture in low and middle-income countries. Nature Food. https://doi.org/10.1038/s43016-020-00172-x
Mbow, C., Rosenzweig, C. Barioni, L.G., Benton, T.G., Herrero, M., Krishnapillai, M., Liwenga, E., Pradhan, P., Rivera-Ferre, M.G., Sapkota, T., Tubiello, F.N., & Xu, Y. (2019). Food security. In P.R. Shukla, J. Skea, E. Calvo Buendia, V. Masson-Delmotte, H.-O. Pörtner, D.C. Roberts, P. Zhai, R. Slade, S. Connors, R. van Diemen, M. Ferrat, E. Haughey, S. Luz, S. Neogi, M. Pathak, J. Petzold, J. Portugal Pereira, P. Vyas, E. Huntley, K. Kissick, M. Belkacemi, & J. Malley, (Eds.), Climate change and land: an IPCC special report on climate change, desertification, land degradation, sustainable land management, food security, and greenhouse gas fluxes in terrestrial ecosystems. https://www.ipcc.ch/site/assets/uploads/sites/4/2020/02/SRCCL-Chapter-5.pdf
Organisation for Economic Co-operation and Development (OECD). (n.d.a). Creditor reporting system (CRS). https://stats.oecd.org/Index.aspx?datasetcode=CRS1
Organisation for Economic Co-operation and Development. (n.d.b). Resource flows beyond ODA in DAC statistics. http://www.oecd.org/dac/stats/beyond-oda.htm#dataviz
Piñeiro, V., Arias, J., Dürr, J., Elverdin, P., Ibáñez, A.M., Kinengyere, A., Opazo, C.M., Owoo, N., Page, J., Prager, S.D., & Torero, M. (2020) A scoping review on incentives for adoption of sustainable agricultural practices and their outcomes. Nature Sustainability. https://doi.org/10.1038/s41893-020-00617-y
Porciello, J., Ivanina, M., Islam, M., Einarson, S., & Hirsh, H. (2020). Accelerating evidence-informed decision making for the Sustainable Development Goals using machine learning. Nature Machine Intelligence. https://10.1038/s42256-020-00235-5
Porter, J.R., Xie, L., Challinor, A.J., Cochrane, K., Howden, S.M., Iqbal, M.M., Lobell, D.B. & Travasso, M.I. (2014). Food security and food production systems. In C.B. Field, V.R. Barros, D.J. Dokken, K.J. Mach, M.D. Mastrandrea, T.E. Bilir, M. Chatterjee, K.L. Ebi,Y.O. Estrada, R.C. Genova, B. Girma, E.S. Kissel, A.N. Levy, S. MacCracken, P.R. Mastrandrea, & L.L. White (Eds.), Climate change 2014: Impacts, adaptation, and vulnerability. Part A: Global and sectoral aspects. Contribution

36 36
of Working Group II to the Fifth Assessment Report of the Intergovernmental Panel on Climate Change (IPCC). Cambridge University Press, 485–533. https://www.ipcc.ch/report/ar5/wg2/
Ricciardi, V., Ramankutty, N., Mehrabi, Z., Jarvis, L. & Chookolingo, B. (2018). How much of our world’s food do smallholders produce? Global Food Security, 17. 64–72. https://www.sciencedirect.com/science/article/pii/S2211912417301293
Ricciardi, V., Wane, A., Sidhu, B.S., Goode, C., Solomon, D., McCullough, E., Diekmann, F., Porciello, J., Jain, M., Randall, N., & Mehrabi, Z. (2020). A scoping review of research funding for small-scale farmers in water scarce regions. Nature Sustainability. https://doi.org/10.1038/s41893-020-00623-0
Samberg, L.H., Gerber, J.S., Ramankutty, N., Herrero, M., West, P.C. (2016). Subnational distribution of average farm size and smallholder contributions to global food production. Environmental Research Letters, 11(12). http://dx.doi.org/10.1088/1748-9326/11/12/124010
Secretariat of the Convention on Biological Diversity. (2014). Global biodiversity outlook 4: A mid-term assessment of progress towards the implementation of the Strategic Plan for Biodiversity 2011-2020. https://www.cbd.int/gbo/gbo4/publication/gbo4-en-hr.pdf
Stathers, T., Holcroft, D., Kitinoja, L., Mvumi, B., English, A., Omotilewa, O., Kocher, M., Ault, J., & Torero, M. (2020). A scoping review of interventions for crop postharvest loss reduction in sub-Saharan Africa and South Asia. Nature Sustainability. https://doi.org/10.1038/s41893-020-00622-1
Willett, W., Rockström, J., Loken, B., Springmann, M., Lang, T., Vermeulen, S., Garnett, T., Tilman, D., DeClerck, F., Wood, A., Jonell, M., Clark, M., Gordon, L.J., Fanzo, J., Hawkes, C., Zurayk, R., Rivera, J.A., De Vries, W., … Murray, C. (2019). Food in the Anthropocene: the EAT–Lancet Commissionon healthy diets from sustainable food systems. The Lancet Planetary Health, 393(10170),447–492. http://doi.org/10.1016/S0140-6736(18)31788-4
Wouterse, F., Murphy, S., & Porciello, J. (2020). Social protection to combat hunger. Nature Food, 1(9), 517–518. https://www.nature.com/articles/s43016-020-00144-1.epdf?sharing_token=ryJ00m-MyqBQkdvV6l4Te9RgN0jAjWel9jnR3ZoTv0M2ueHHNidXXM2e8LYgFf_BRgq7k0HOwwQ-1NlcYG3aEZad7s1gC1XguMjCHHNds8NRG-uhuIc30hL7Dc1Pb1m-LeL12SJ4lISrCZ-supazjjqDIwx05MZaDv-OJECEllU%3D
Young, S., Eldermire, E., Ghezzi-Kopel, K., Page, J., Diekmann, F., Kocher, M., Kelly, J., Chimwaza, G., Lwoga, E.T., Ault, J., Thompson, W., Schoepke, T., Kinengyere, A.A., Gathoni, N. & Porciello, J. (2019). Ceres2030. Open Science Framework. https://osf.io/adxek/
3736
of Working Group II to the Fifth Assessment Report of the Intergovernmental Panel on Climate Change (IPCC). Cambridge University Press, 485–533. https://www.ipcc.ch/report/ar5/wg2/
Ricciardi, V., Ramankutty, N., Mehrabi, Z., Jarvis, L. & Chookolingo, B. (2018). How much of our world’s food do smallholders produce? Global Food Security, 17. 64–72. https://www.sciencedirect.com/science/article/pii/S2211912417301293
Ricciardi, V., Wane, A., Sidhu, B.S., Goode, C., Solomon, D., McCullough, E., Diekmann, F., Porciello, J., Jain, M., Randall, N., & Mehrabi, Z. (2020). A scoping review of research funding for small-scale farmers in water scarce regions. Nature Sustainability. https://doi.org/10.1038/s41893-020-00623-0
Samberg, L.H., Gerber, J.S., Ramankutty, N., Herrero, M., West, P.C. (2016). Subnational distribution of average farm size and smallholder contributions to global food production. Environmental Research Letters, 11(12). http://dx.doi.org/10.1088/1748-9326/11/12/124010
Secretariat of the Convention on Biological Diversity. (2014). Global biodiversity outlook 4: A mid-term assessment of progress towards the implementation of the Strategic Plan for Biodiversity 2011-2020. https://www.cbd.int/gbo/gbo4/publication/gbo4-en-hr.pdf
Stathers, T., Holcroft, D., Kitinoja, L., Mvumi, B., English, A., Omotilewa, O., Kocher, M., Ault, J., & Torero, M. (2020). A scoping review of interventions for crop postharvest loss reduction in sub-Saharan Africa and South Asia. Nature Sustainability. https://doi.org/10.1038/s41893-020-00622-1
Willett, W., Rockström, J., Loken, B., Springmann, M., Lang, T., Vermeulen, S., Garnett, T., Tilman, D., DeClerck, F., Wood, A., Jonell, M., Clark, M., Gordon, L.J., Fanzo, J., Hawkes, C., Zurayk, R., Rivera, J.A., De Vries, W., … Murray, C. (2019). Food in the Anthropocene: the EAT–Lancet Commission on healthy diets from sustainable food systems. The Lancet Planetary Health, 393(10170), 447–492. http://doi.org/10.1016/S0140-6736(18)31788-4
Wouterse, F., Murphy, S., & Porciello, J. (2020). Social protection to combat hunger. Nature Food, 1(9), 517–518. https://www.nature.com/articles/s43016-020-00144-1.epdf?sharing_token=ryJ00m-MyqBQkdvV6l4Te9RgN0jAjWel9jnR3ZoTv0M2ueHHNidXXM2e8LYgFf_BRgq7k0HOwwQ-1NlcYG3aEZad7s1gC1XguMjCHHNds8NRG-uhuIc30hL7Dc1Pb1m-LeL12SJ4lISrCZ-supazjjqDIwx05MZaDv-OJECEllU%3D
Young, S., Eldermire, E., Ghezzi-Kopel, K., Page, J., Diekmann, F., Kocher, M., Kelly, J., Chimwaza, G., Lwoga, E.T., Ault, J., Thompson, W., Schoepke, T., Kinengyere, A.A., Gathoni, N. & Porciello, J. (2019). Ceres2030. Open Science Framework. https://osf.io/adxek/
37
CONTENTS
1. THREE PROBLEMS, FIVE FINDINGS ....................................................................................................38
Three Problems ......................................................................................................................................................39
Five Findings ...........................................................................................................................................................39
2. THE IMPORTANCE OF AID ..................................................................................................................40
3. WHAT WOULD IT COST? .....................................................................................................................41
The Need for Improved Targeting ...................................................................................................................45
4. HOW DID WE CALCULATE THE COST? .................................................................................................46
The Model ................................................................................................................................................................46
The Baseline and the Scenarios ........................................................................................................................49
Calculating the Donor Contribution ...............................................................................................................52
5. CONCLUSION ....................................................................................................................................53
REFERENCES ........................................................................................................................................54
APPENDIX 1. LIST OF POLICY INSTRUMENTS MODELLED TO SIMULATE THE PORTFOLIO OF INTERVENTIONS ...56
APPENDIX 2. LIST OF COUNTRIES AND THEIR PRIORITY LEVEL ..............................................................58
Ending Hunger, Increasing Incomes, and Protecting the Climate: What would it cost donors?David Laborde, Marie Parent and Carin Smaller
Designer: Elise Epp (International Institute for Sustainable Development)
Citation: Laborde, D., Parent, M., & Smaller, C. (2020). Ending Hunger, Increasing Incomes, and Protecting the Climate: What would it cost donors? Ceres2030. International Institute for Sustainable Development (IISD) and International Food Policy Research Institute (IFPRI).

38 38
1. THREE PROBLEMS, FIVE FINDINGS
1 The three targets of SDG 2 are ending hunger (target 2.1), doubling the incomes and productivity of small-scale producers (target 2.3), and producing food sustainably and resiliently (target 2.4). Nutrition (target 2.2) and biodiversity and preservation of associated traditional knowledge (target 2.5) were not included. See Box 1.
Hunger is rising, reversing decades of progress. Today 690 million people are hungry, an increase of 60 million people over the past five years (Food and Agriculture Organization of the United Nations [FAO] et al., 2020). We predict that a further 95 million people will be living in extreme poverty and hunger as a result of COVID-19 (Laborde & Smaller, 2020). Perversely, the very people whose livelihoods depend on food and agriculture are among the most likely to experience hunger. Small-scale food producers and food workers and their families are among those most often left out of economic growth, technological change, and political decision making. Globally, today’s food systems are not producing affordable, healthy, and sustainable diets for all (FAO et al., 2020). The climate crisis poses a mounting threat to food systems (FAO et al., 2018; Intergovernmental Panel on Climate Change [IPCC], 2018), while at the same time, the current food system is a major driver of climate change (FAO et al., 2020).
In response to the global commitment to rid the world of hunger, Ceres2030 partnered with Nature Portfolio to answer two linked questions: First, what does the published evidence tell us about agricultural interventions that work, in particular to double the incomes of small-scale producers and to improve environmental outcomes for agriculture? And second, what will it cost governments to end hunger, double the incomes of small-scale producers, and protect the climate by 2030? The project focuses on three of the five targets in the second sustainable development goal (SDG 2, Zero Hunger) and looks at the public spending needed in low- and middle-income countries, including the contribution from donors through official development assistance (ODA) (Laborde et al., 2020).
This report answers the second question. The answer to the first question is published as a special collection of Nature Portfolio. This report is published alongside a complementary research project by the Centre for Development Research (ZEF) and the FAO that also identifies high-impact, cost-effective interventions to address the challenges of SDG 2. The use of different research approaches and methodologies helps to identify levels of coherence and strengthens the credibility of proposed policy actions and investments. The approaches show results that are consistent and compatible, confirming that between now and 2030 donors need to double their efforts (von Braun et al., 2020).1
The Ceres2030 project was guided by the premise within SDG 2 that increasing the incomes of small-scale producers in a way that supports the transition to environmental sustainability is the most effective way to end hunger and realize the multifaceted objectives of the 2030 Agenda for Sustainable Development.

3938
1. THREE PROBLEMS, FIVE FINDINGS
1 The three targets of SDG 2 are ending hunger (target 2.1), doubling the incomes and productivity of small-scale producers (target 2.3), and producing food sustainably and resiliently (target 2.4). Nutrition (target 2.2) and biodiversity and preservation of associated traditional knowledge (target 2.5) were not included. See Box 1.
Hunger is rising, reversing decades of progress. Today 690 million people are hungry, an increase of 60 million people over the past five years (Food and Agriculture Organization of the United Nations [FAO] et al., 2020). We predict that a further 95 million people will be living in extreme poverty and hunger as a result of COVID-19 (Laborde & Smaller, 2020). Perversely, the very people whose livelihoods depend on food and agriculture are among the most likely to experience hunger. Small-scale food producers and food workers and their families are among those most often left out of economic growth, technological change, and political decision making. Globally, today’s food systems are not producing affordable, healthy, and sustainable diets for all (FAO et al., 2020). The climate crisis poses a mounting threat to food systems (FAO et al., 2018; Intergovernmental Panel on Climate Change [IPCC], 2018), while at the same time, the current food system is a major driver of climate change (FAO et al., 2020).
In response to the global commitment to rid the world of hunger, Ceres2030 partnered with Nature Portfolio to answer two linked questions: First, what does the published evidence tell us about agricultural interventions that work, in particular to double the incomes of small-scale producers and to improve environmental outcomes for agriculture? And second, what will it cost governments to end hunger, double the incomes of small-scale producers, and protect the climate by 2030? The project focuses on three of the five targets in the second sustainable development goal (SDG 2, Zero Hunger) and looks at the public spending needed in low- and middle-income countries, including the contribution from donors through official development assistance (ODA) (Laborde et al., 2020).
This report answers the second question. The answer to the first question is published as a special collection of Nature Portfolio. This report is published alongside a complementary research project by the Centre for Development Research (ZEF) and the FAO that also identifies high-impact, cost-effective interventions to address the challenges of SDG 2. The use of different research approaches and methodologies helps to identify levels of coherence and strengthens the credibility of proposed policy actions and investments. The approaches show results that are consistent and compatible, confirming that between now and 2030 donors need to double their efforts (von Braun et al., 2020).1
The Ceres2030 project was guided by the premise within SDG 2 that increasing the incomes of small-scale producers in a way that supports the transition to environmental sustainability is the most effective way to end hunger and realize the multifaceted objectives of the 2030 Agenda for Sustainable Development.
39
THREE PROBLEMS
2 2018 constant USD. All the numbers in this document use this monetary unit.3 All figures of existing donor spending represent 3-year averages (2016-2018) of ODA from listed public donors, extracted from the Organisation for Economic Cooperation and Development (OECD) Development Assistance Committee (DAC) Creditor Reporting System (CRS) database (OECD, n.d.a). Spending on food security and nutrition is defined by the DAC codes, including but not limited to: basic nutrition (12240), agriculture (311), agro-industries (32161), rural development (43040), and non-emergency food aid (52010).
1. Today 690 million people are hungry, and 95 million more people are at risk as a result of COVID-19 (FAO et al., 2020; Laborde & Smaller, 2020).
2. The people whose livelihoods depend on food and agriculture are among the most likely to experience hunger. The households of small-scale producers, especially those who live in Africa, are the people most often left out of economic growth, technological change, and political decision making (International Fund for Agricultural Development [IFAD], 2016).
3. Food systems are a central driver of deteriorating environmental conditions, particularly climate change and biodiversity loss, while at the same time being one of the sectors put most at risk by the climate crisis. There is an urgent need for food systems to reduce greenhouse gas emissions, adapt to deteriorating environmental conditions, and provide affordable, healthy diets for all (FAO et al., 2018, 2020; IPCC, 2018).
FIVE FINDINGS
1. Donors need to contribute an additional USD 14 billion2 per year until 2030 to end hunger and double the incomes of small-scale producers. This is achieved while maintaining greenhouse gas emissions for agriculture below the commitments made in the Paris Agreement. Donors currently spend USD 12 billion per year on food security and nutrition and therefore need to double their contributions to meet the goals.3
2. Aid will not be enough. Additional efforts of USD 19 billion per year on average will have to be provided by low- and middle-income countries through increased taxation.
3. The additional public spending will prevent 490 million people from experiencing hunger and double the incomes of 545 million small-scale producers on average, while at the same time maintaining greenhouse gas emissions for agriculture below the commitments made in the Paris Agreement. The additional public spending will also spur an extra USD 52 billion in private investment per year on average in primary and processed food sectors from both small- and large-scale producers.

40 40
Donors must spend an additional USD 14 billion a year on average to end hunger sustainably
FIGURE 1. ADDITIONAL PUBLIC SPENDING AND DONOR CONTRIBUTION
Source: Authors’ calculations.
4. Any delay in spending will not only have human costs but will also increase the total monetary costs. Early spending, on the other hand, allows investment in interventions that take more time—like research and development (R&D)—but have a bigger payoff. It also allows downstream (processing) and upstream (farm inputs) investments to be spread over time.
5. A portfolio of interventions is needed to achieve the multiple SDG 2 targets. Ceres2030 estimated the optimal investment using three categories of interventions: (1) empower the excluded, (2) on the farm, and (3) food on the move. The interventions in the model are balanced by their synergies and trade-offs according to the impact on greenhouse gas emissions, economic growth, and the country context. This report offers a starting point for considering proper portfolio balance.
2. THE IMPORTANCE OF AID
Aid is a critical source of finance for developing countries, especially in Africa. Analysis of the sources of foreign finance for developing countries shows that ODA has been the largest single source of foreign finance since 2002, consistently providing over 30% of the total. In 2017, ODA represented 36% of the foreign finance received by African countries south of the Sahara, compared with 31% from overseas personal remittances and 23% from foreign direct investment (FDI) (Organisation for Economic Co-operation and Development [OECD], n.d.b). In other regions, ODA is less dominant. The main source of foreign finance in South Asia, for example, is personal remittances, comprising 55% of foreign finance; in South America, it is FDI, at 68% of the total
Donor share
USD 14 billion
Country share
USD 19 billion
An additional
USD 33 billionis needed
per year

4140
Donors must spend an additional USD 14 billion a year on average to end hunger sustainably
FIGURE 1. ADDITIONAL PUBLIC SPENDING AND DONOR CONTRIBUTION
Source: Authors’ calculations.
4. Any delay in spending will not only have human costs but will also increase the total monetary costs. Early spending, on the other hand, allows investment in interventions that take more time—like research and development (R&D)—but have a bigger payoff. It also allows downstream (processing) and upstream (farm inputs) investments to be spread over time.
5. A portfolio of interventions is needed to achieve the multiple SDG 2 targets. Ceres2030 estimated the optimal investment using three categories of interventions: (1) empower the excluded, (2) on the farm, and (3) food on the move. The interventions in the model are balanced by their synergies and trade-offs according to the impact on greenhouse gas emissions, economic growth, and the country context. This report offers a starting point for considering proper portfolio balance.
2. THE IMPORTANCE OF AID
Aid is a critical source of finance for developing countries, especially in Africa. Analysis of the sources of foreign finance for developing countries shows that ODA has been the largest single source of foreign finance since 2002, consistently providing over 30% of the total. In 2017, ODA represented 36% of the foreign finance received by African countries south of the Sahara, compared with 31% from overseas personal remittances and 23% from foreign direct investment (FDI) (Organisation for Economic Co-operation and Development [OECD], n.d.b). In other regions, ODA is less dominant. The main source of foreign finance in South Asia, for example, is personal remittances, comprising 55% of foreign finance; in South America, it is FDI, at 68% of the total
Donor share
USD 14 billion
Country share
USD 19 billion
An additional
USD 33 billionis needed
per year
41
(OECD, n.d.b). Despite these differences, and especially in Africa and South Asia, ODA is a crucial resource for economic development (Eber-Rose et al., 2020).
In this context, capturing both the financial constraints faced by low- and middle-income countries and the role of donors in alleviating these constraints in the short and long terms is key. The model used to estimate the costs integrates these elements and considerations. Details on how the donor contribution is calculated can be found in Section 4.
4 The results from the modelling should be interpreted as an estimate of the scale of resources needed at the big-picture level. This is useful to inform resource allocation decisions at the global level and can be helpful at the national level for our focus countries and the sub-regional level (see Box 2), but it is insufficient to inform strategy, planning, and programming at the subnational level.
3. WHAT WOULD IT COST?
The results from the model show that donors need to contribute an additional USD 14 billion per year on average until 2030 to end hunger and double incomes of small-scale producers in low- and middle-income countries. The investment achieves these goals while maintaining greenhouse gas emissions for agriculture below the commitments made in the Paris Agreement.
Donors currently spend USD 12 billion per year on food security and nutrition and therefore need to double their contributions to meet the goals. However, ODA alone will not be enough. Additional public spending of USD 19 billion per year on average until 2030 will have to be provided by low- and middle-income countries through increased taxation.
Together, the additional public investment from donors and low- and middle-income countries will prevent 490 million people from experiencing hunger, double the incomes of 545 million producers and their families on average, and limit greenhouse gas emissions for agriculture to the commitments made in the Paris Agreement.4
To be effective, the additional public investment needs to be allocated to a balanced portfolio of interventions. Ceres2030 modelled a portfolio of interventions using 14 policy instruments grouped into three broad categories: (1) empower the excluded, (2) on the farm, and (3) food on the move (see Figure 2).
The first category includes interventions such as social safety nets, targeting the broader population and aimed to promote inclusiveness and enhance human capital. The second category increases the economic productivity of farmers, allowing them to be more cost efficient and address the rising needs of the population. The last category of interventions connects farmers to markets, guaranteeing the distribution of surplus production and providing better prices for farmers while reducing the cost for consumers.

42 42
The additional investment needs to be distributed across three categories of interventions
FIGURE 2. THREE CATEGORIES OF INTERVENTIONS
The public spending is grouped into three broad categories of interventions, and the model assigns costs for policy instruments, such as research and development that each fall into one of these categories.
Note: These categories can be mapped to the donor classification system of the Organisation for Economic Co-operation and Development (OECD) Development Assistance Committee (DAC) Creditor Reporting System (CRS) database.
Even if not exhaustive, Ceres2030’s holistic modelling approach uses diverse policy instruments so that investment in interventions will benefit from synergies, avoid bottlenecks, and balance trade-offs. For example, a fertilizer subsidy could be provided to help farmers increase yields, but its effectiveness would be hampered if a poor road network makes it too costly for produce to reach markets. A production subsidy may boost food production and producer incomes but could result in clearing of land and unsustainable agricultural practices. The mix of policy instruments used in the model thus includes interventions that account for these interactions and complement each other, illustrating with broad strokes an appropriate investment strategy to accomplish multiple objectives.
Figure 3 shows the funding gap over time and by category of intervention. It compares actual levels of ODA, based on a 3-year average of USD 12 billion, to the additional donor contribution needed over the investment period of 2020 to 2030, an average of USD 14 billion per year, with detail on how the additional donor contribution is distributed among the three categories of interventions.
Empower the Excluded
Interventions related to social protection, institutions such as farmers’ organizations, and education through vocational training.
On the Farm
Interventions provided directly to farmers, including farm inputs, R&D, improved livestock feed, and irrigation infrastructure.
Food on the Move
Interventions to reduce post-harvest losses, including storage, to improve returns from sales, and to support the mix of services provided by SMEs, such as cooperatives, traders, and processors.
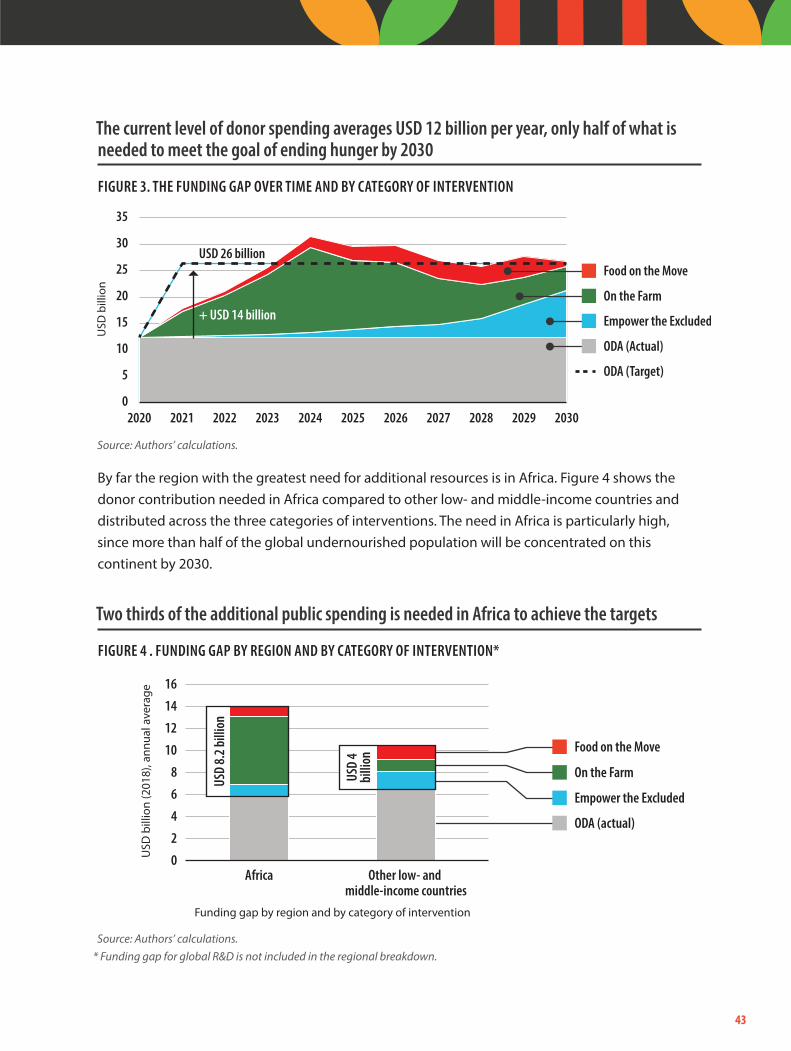
4342
The additional investment needs to be distributed across three categories of interventions
FIGURE 2. THREE CATEGORIES OF INTERVENTIONS
The public spending is grouped into three broad categories of interventions, and the model assigns costs for policy instruments, such as research and development that each fall into one of these categories.
Note: These categories can be mapped to the donor classification system of the Organisation for Economic Co-operation and Development (OECD) Development Assistance Committee (DAC) Creditor Reporting System (CRS) database.
Even if not exhaustive, Ceres2030’s holistic modelling approach uses diverse policy instruments so that investment in interventions will benefit from synergies, avoid bottlenecks, and balance trade-offs. For example, a fertilizer subsidy could be provided to help farmers increase yields, but its effectiveness would be hampered if a poor road network makes it too costly for produce to reach markets. A production subsidy may boost food production and producer incomes but could result in clearing of land and unsustainable agricultural practices. The mix of policy instruments used in the model thus includes interventions that account for these interactions and complement each other, illustrating with broad strokes an appropriate investment strategy to accomplish multiple objectives.
Figure 3 shows the funding gap over time and by category of intervention. It compares actual levels of ODA, based on a 3-year average of USD 12 billion, to the additional donor contribution needed over the investment period of 2020 to 2030, an average of USD 14 billion per year, with detail on how the additional donor contribution is distributed among the three categories of interventions.
Empower the Excluded
Interventions related to social protection, institutions such as farmers’ organizations, and education through vocational training.
On the Farm
Interventions provided directly to farmers, including farm inputs, R&D, improved livestock feed, and irrigation infrastructure.
Food on the Move
Interventions to reduce post-harvest losses, including storage, to improve returns from sales, and to support the mix of services provided by SMEs, such as cooperatives, traders, and processors.
43
The current level of donor spending averages USD 12 billion per year, only half of what is needed to meet the goal of ending hunger by 2030
FIGURE 3. THE FUNDING GAP OVER TIME AND BY CATEGORY OF INTERVENTION
Source: Authors’ calculations.
By far the region with the greatest need for additional resources is in Africa. Figure 4 shows the donor contribution needed in Africa compared to other low- and middle-income countries and distributed across the three categories of interventions. The need in Africa is particularly high, since more than half of the global undernourished population will be concentrated on this continent by 2030.
Two thirds of the additional public spending is needed in Africa to achieve the targets
FIGURE 4 . FUNDING GAP BY REGION AND BY CATEGORY OF INTERVENTION*
Source: Authors’ calculations.* Funding gap for global R&D is not included in the regional breakdown.
USD
bill
ion
0
5
10
15
20
25
30
35
2020 2021 2022 2023 2024 2025 2026 2027 2028 2029 2030
Food on the Move
On the Farm
Empower the Excluded
ODA (Actual)
ODA (Target)
USD 26 billion
+ USD 14 billion
02468
10121416
Africa Other low- and middle-income countries
USD
bill
ion
(201
8), a
nnua
l ave
rage
Funding gap by region and by category of intervention
Food on the Move
On the Farm
Empower the Excluded
ODA (actual)
USD
8.2 b
illio
n
USD
4bi
llion
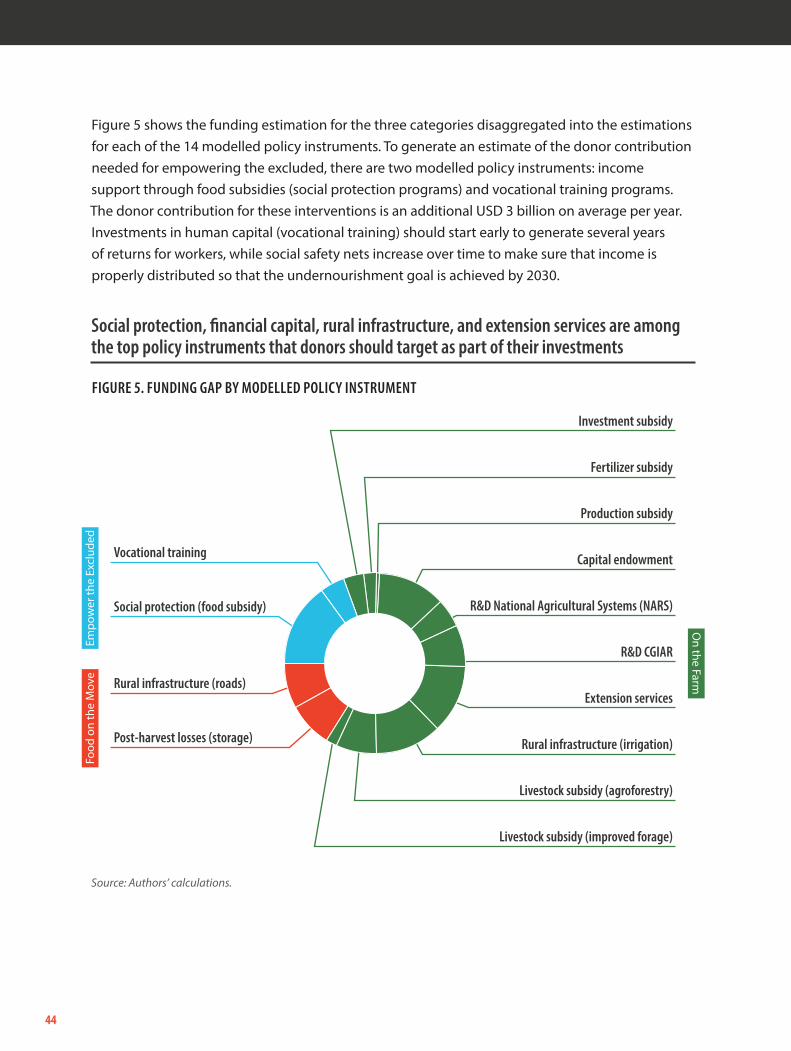
44 44
Figure 5 shows the funding estimation for the three categories disaggregated into the estimations for each of the 14 modelled policy instruments. To generate an estimate of the donor contribution needed for empowering the excluded, there are two modelled policy instruments: income support through food subsidies (social protection programs) and vocational training programs. The donor contribution for these interventions is an additional USD 3 billion on average per year. Investments in human capital (vocational training) should start early to generate several years of returns for workers, while social safety nets increase over time to make sure that income is properly distributed so that the undernourishment goal is achieved by 2030.
Social protection, financial capital, rural infrastructure, and extension services are among the top policy instruments that donors should target as part of their investments
FIGURE 5. FUNDING GAP BY MODELLED POLICY INSTRUMENT
Source: Authors’ calculations.
Social protection (food subsidy)
Vocational training
Post-harvest losses (storage)
Rural infrastructure (roads)
Investment subsidy
Fertilizer subsidy
Production subsidy
Capital endowment
R&D National Agricultural Systems (NARS)
R&D CGIAR
Extension services
Rural infrastructure (irrigation)
Livestock subsidy (agroforestry)
Livestock subsidy (improved forage)
Food
on
the
Mov
eEm
pow
er th
e Ex
clud
edO
n the Farm
4544
Figure 5 shows the funding estimation for the three categories disaggregated into the estimations for each of the 14 modelled policy instruments. To generate an estimate of the donor contribution needed for empowering the excluded, there are two modelled policy instruments: income support through food subsidies (social protection programs) and vocational training programs. The donor contribution for these interventions is an additional USD 3 billion on average per year. Investments in human capital (vocational training) should start early to generate several years of returns for workers, while social safety nets increase over time to make sure that income is properly distributed so that the undernourishment goal is achieved by 2030.
Social protection, financial capital, rural infrastructure, and extension services are among the top policy instruments that donors should target as part of their investments
FIGURE 5. FUNDING GAP BY MODELLED POLICY INSTRUMENT
Source: Authors’ calculations.
Social protection (food subsidy)
Vocational training
Post-harvest losses (storage)
Rural infrastructure (roads)
Investment subsidy
Fertilizer subsidy
Production subsidy
Capital endowment
R&D National Agricultural Systems (NARS)
R&D CGIAR
Extension services
Rural infrastructure (irrigation)
Livestock subsidy (agroforestry)
Livestock subsidy (improved forage)
Food
on
the
Mov
eEm
pow
er th
e Ex
clud
ed
On the Farm
45
To estimate the donor contribution needed for interventions on the farm, the modellers used 10 policy instruments that directly affect the technologies available for small-scale producers and what and how they produce: investment subsidies, fertilizer subsidies, capital endowments, production subsidies, national R&D, international R&D, extension services, irrigation infrastructure, agroforestry, and improved forage. The donor contribution for this category is an additional USD 9 billion per year on average. Interestingly, each instrument’s investment follows a different time profile to achieve the targets by 2030, with spending on core public goods—especially R&D, which has a long lag before payoff but a high return—to be prioritized first.
To generate an estimate of the donor contribution needed for interventions to move food to market, there are two policy instruments that directly contribute to increased income opportunities for farmers while reducing overall costs for consumers. They are increased rural infrastructure (roads) and storage opportunities, both of which contribute to a reduction in post-harvest losses and an increase in prices for farmers. The donor contribution for this group of interventions is an additional USD 2 billion.
The additional public spending will also spur an extra USD 52 billion in private investment per year on average in both primary and processed food production activities. This number includes, among other investments, increased investments by small-scale producers, made possible by higher incomes, and by large-scale producers, due to enhanced agricultural productivity and increased food demand.
THE NEED FOR IMPROVED TARGETING
Figure 6 provides a picture of the external financing needs of each country. It shows the donor priority levels for countries and regions, based on their degree of dependency on external resources (see Appendix 2). Among regions, Africa will need the greatest level of support, especially to achieve the ending hunger target. However, other countries, including in Asia, will require important attention to increase productivity and incomes of small-scale producers. Some countries, such as the Democratic Republic of Congo, South Sudan, and Eritrea, will rely on donor support for more than 90% of their public budgets.

46 46
Africa will need the greatest level of support
5 The mode is adapted from the MIRAGRODEP model. See Laborde et al., 2013.
FIGURE 6. PRIORITY COUNTRIES FOR DONOR INVESTMENT BASED ON THEIR DEPENDENCY ON EXTERNAL RESOURCES UNTIL 2030
Note: “High Priority” includes countries that will depend on donors for over 50% of their budgets; “Medium Priority” includes countries that will depend on donors for between 30% to 50% of their budgets; “Low Priority” includes countries that will depend on donors for less than 30% of their budgets. “On Target” includes countries that will need to retain existing levels of donor support but will not need any extra donor support from now until 2030. For a full list of countries, see Appendix 2.
4. HOW DID WE CALCULATE THE COST?
THE MODEL
The modelling team used a computable general equilibrium (CGE) model to estimate the additional public investment needed to end hunger, double the incomes of small-scale producers, and protect the environment by 2030. The framework was developed based on three of the five targets of SDG 2: ending hunger (Target 2.1), doubling the incomes and economic productivity of small-scale producers (Target 2.3), and producing food sustainably and resiliently (Target 2.4).5
High Priority Medium Priority Low Priority On Target Not Included in Assessment

4746
Africa will need the greatest level of support
5 The mode is adapted from the MIRAGRODEP model. See Laborde et al., 2013.
FIGURE 6. PRIORITY COUNTRIES FOR DONOR INVESTMENT BASED ON THEIR DEPENDENCY ON EXTERNAL RESOURCES UNTIL 2030
Note: “High Priority” includes countries that will depend on donors for over 50% of their budgets; “Medium Priority” includes countries that will depend on donors for between 30% to 50% of their budgets; “Low Priority” includes countries that will depend on donors for less than 30% of their budgets. “On Target” includes countries that will need to retain existing levels of donor support but will not need any extra donor support from now until 2030. For a full list of countries, see Appendix 2.
4. HOW DID WE CALCULATE THE COST?
THE MODEL
The modelling team used a computable general equilibrium (CGE) model to estimate the additional public investment needed to end hunger, double the incomes of small-scale producers, and protect the environment by 2030. The framework was developed based on three of the five targets of SDG 2: ending hunger (Target 2.1), doubling the incomes and economic productivity of small-scale producers (Target 2.3), and producing food sustainably and resiliently (Target 2.4).5
High Priority Medium Priority Low Priority On Target Not Included in Assessment
47
BOX 1. WHAT ABOUT NUTRITION (TARGET 2.2) AND BIODIVERSITY (TARGET 2.5)?
The project was not mandated to work on nutrition (Target 2.2) specifically because existing global efforts, such as those by 1000 Days, R4D, and the World Bank, have estimated the cost of ending some forms of malnutrition using a different model (see Shekar et al., 2016). Nutrition, moreover, is its own complex goal and would have required significantly more time and resources to include in the project. Costing nutrition goes beyond agriculture and food systems to include sanitation and access to clean water, for example (Development Initiatives, 2018). It also relies on data at the intra-household level, which is a level of granularity not yet widely available or comparable across countries. That said, it is important to note that doubling small-scale producer income can be expected to have an important positive impact on nutrition. Especially at lower income levels, increases in income are quickly captured in consumption of more, and more varied, foods.
Biodiversity and preservation of associated traditional knowledge (Target 2.5) is also beyond the scope of the project. There is a dearth of data about biodiversity, and it remains an important area in which to develop quantification techniques that can be integrated into a model. Nevertheless, by limiting greenhouse gas emissions for agriculture, there is a reduction in land use changes due to agriculture, which should have a positive impact on biodiversity.
The model is a system of hundreds of thousands of equations designed to take into account complex relationships across different levels of the economy. It includes data from the international level all the way down to the household level, allowing for simulation of targeted public investment (see Figure 7). It captures household characteristics,6 regional and sectoral interactions, including prices and quantities of goods, services, and factors of production, and interactions among countries, considering positive spillovers through increased income and demand as well as competitive effects through international trade. Earlier work using the model had found that governments are not on track to end hunger by 2030, but that the goal could be achieved if governments invested additional resources, prioritized countries with the highest need, and used a better mix of the most effective interventions (Laborde et al., 2016).
6 Consumption and production data for households originated from the World Bank’s Living Standards Measurement Study, but additional sources are used to increase the country coverage (for example for China). In addition, the calorie consumption pattern is reconciled with the FAO Prevalence of Undernourishment data.

48 48
Our computable general equilibrium model inputted data from the global to the household level, simulating markets with hundreds of thousands of equations
FIGURE 7. A COMPLEX MODEL TO END HUNGER, INCREASE INCOMES, AND PROTECT THE CLIMATE
Source: Authors’ diagram.
Traditionally, equilibrium models are used to quantify the impact of a shock from a policy or package of policies, such as a reduction of tariffs linked to a new trade agreement or the introduction of a biofuels target for a renewable energy policy. The impact is quantified in respect to a business-as-usual world where the policy shock does not exist, referred to as the baseline. For example, applying the shock of a doubling of corn tariffs, a model can show how other variables in the model, such as farm income, will be affected by this change versus baseline conditions. Equilibrium models can show the full effect of a policy shock as it is transmitted through all the elements of the economic system that are presented in the model (Laborde et al., 2019).
We want to know
how much it will cost...
...so we developed a model with
hundreds of thousands of equations
designed to take into account complex relationships across di�erent levels of the economy...
...to estimate the cost of achieving
three SDG 2 targets.
SDG 2.1 SDG 2.3 SDG 2.4
Additional public spending on interventions
Economic model of the world
...including international and national data, regional and sectoral data, all the way down to the household level...

4948
Our computable general equilibrium model inputted data from the global to the household level, simulating markets with hundreds of thousands of equations
FIGURE 7. A COMPLEX MODEL TO END HUNGER, INCREASE INCOMES, AND PROTECT THE CLIMATE
Source: Authors’ diagram.
Traditionally, equilibrium models are used to quantify the impact of a shock from a policy or package of policies, such as a reduction of tariffs linked to a new trade agreement or the introduction of a biofuels target for a renewable energy policy. The impact is quantified in respect to a business-as-usual world where the policy shock does not exist, referred to as the baseline. For example, applying the shock of a doubling of corn tariffs, a model can show how other variables in the model, such as farm income, will be affected by this change versus baseline conditions. Equilibrium models can show the full effect of a policy shock as it is transmitted through all the elements of the economic system that are presented in the model (Laborde et al., 2019).
We want to know
how much it will cost...
...so we developed a model with
hundreds of thousands of equations
designed to take into account complex relationships across di�erent levels of the economy...
...to estimate the cost of achieving
three SDG 2 targets.
SDG 2.1 SDG 2.3 SDG 2.4
Additional public spending on interventions
Economic model of the world
...including international and national data, regional and sectoral data, all the way down to the household level...
49
In contrast to traditional equilibrium modelling, the approach used in Ceres2030 simulates a series of targets (the targets set out in SDGs 2.1, 2.3, and 2.4). The model minimizes the total public costs of achieving the targets by optimally allocating financial resources among the portfolio of 14 policy instruments. Resources are targeted through the instruments to households where they are most needed, but the model intentionally does not assume perfect targeting. For example, a food subsidy program is allocated based on income status, not hunger status, since the latter is not as easily observable. Each country has its own profile in the baseline of the model, so the balance of the portfolio of instruments and the trajectory of progress toward the targets are country specific.
Each of the 14 policy instruments has a cost, paid either by the public or private sector, and a direct impact, such as an increase in labour productivity, that will contribute to at least one of the three final outcomes—more calories available per household, greater net incomes for small-scale producer households, and limited greenhouse gas emissions. For example, the research and development spending on the Consultative Group on International Agricultural Research [CGIAR] is a fixed cost paid by the public sector for research services that increase agricultural productivity over time, with larger productivity benefits for low- and middle-income countries. Fertilizer subsidies, another instrument, are paid by the public sector for each unit of fertilizer, reducing the cost paid by the farmers receiving it on a recurrent basis. The parameters used for modelling instruments are based on existing data sources and a number of new parameters from the collection of evidence syntheses published in Nature Portfolio (See Appendix 1 for a full list of policy instruments). Because the model accounts for a complex web of economic relationships, it captures not only the direct effect but also indirect and interactive effects of the interventions.
The portfolio of interventions relies on the interdependence of many kinds of capital: human, social, financial, and knowledge. While the evidence shows a significant lack of detailed information on complex outcomes, especially those involving such capital (Bizikova et al., 2020; Liverpool-Tasie, 2020; Stathers et al., 2020), the modelling approach captures some of the interlinkages between access to different forms of capital at the household level and its impact on the broader economy.
7 Based on the medium scenario of the Population Division of the United Nation Department of Economic and Social Affairs.8 Based on FAO (2018).
THE BASELINE AND THE SCENARIOS
The cost is calculated by comparing the baseline, in this case representing a business-as-usual trajectory of the world where existing spending patterns are maintained, to a scenario where the three targets of SDG 2 are reached. The core assumptions in the business-as-usual trajectory were based on: demographic growth,7 yield projections, including climate change effects,8

50 50
and economic growth.9 Importantly, the climate targets as defined by the 2016 UNFCCC Paris Agreement were also included as a baseline assumption.
Combining these assumptions leads to a new baseline for the numbers of small-scale producers and people affected by hunger. In 2018, there were 680 million people affected by hunger (FAO et al., 2020). In the baseline used for our central estimate, taking into account current population and economic growth projections and constant donor contributions, we estimated that there would be 660 million people affected by hunger in 2030 (see Figure 8).
9 Based on the mid-term macroeconomic projections of the IMF World Economic Outlook (October 2019, i.e., pre-COVID-19). The macroeconomic impact of the COVID-19 pandemic for the period 2020–2023 is included, based on Laborde & Smaller (2020), but we do not assume a long-term impact on productivity as a result of COVID-19.
An additional USD 14 billion from donors and 19 billion from countries can prevent hunger for 490 million. If no additional effort is made, 660 million will still suffer in 2030
FIGURE 8. POPULATION AFFECTED BY HUNGER IN 2018 AND 2030
Source: Authors’ calculation.
SDGs 2.1, 2.3, and 2.4 are each interpreted in the model as targets to be achieved, under some constraints. Corresponding to Target 2.1, the model simulates removal of households from the status of hunger, as defined by the FAO’s Prevalence of Undernutrition (PoU). For Target 2.3, then net incomes of small-scale producers double on average between 2015 and 2030. For Target 2.4, greenhouse gas emissions for agriculture conform to the commitments made in the nationally determined contributions (NDCs) from the 2016 UNFCCC Paris Agreement. The NDCs are integrated into both the baseline and the scenario where SDG 2 is achieved. Each country has a carbon budget for its agriculture; land use emissions and production emissions from energy and fertilizer use are included in this budget. The model maintains the budget through a domestically determined carbon tax.
0100200300400500600700800900
680
2018
170
490
190
2030
Removed from hunger in the baseline
2018 (SOFI 2020)Removed from hunger in central scenario
Remaining people in hunger (3% PoU at the country level)
Millions of people
660 m
illio
n peo
ple

5150
and economic growth.9 Importantly, the climate targets as defined by the 2016 UNFCCC Paris Agreement were also included as a baseline assumption.
Combining these assumptions leads to a new baseline for the numbers of small-scale producers and people affected by hunger. In 2018, there were 680 million people affected by hunger (FAO et al., 2020). In the baseline used for our central estimate, taking into account current population and economic growth projections and constant donor contributions, we estimated that there would be 660 million people affected by hunger in 2030 (see Figure 8).
9 Based on the mid-term macroeconomic projections of the IMF World Economic Outlook (October 2019, i.e., pre-COVID-19). The macroeconomic impact of the COVID-19 pandemic for the period 2020–2023 is included, based on Laborde & Smaller (2020), but we do not assume a long-term impact on productivity as a result of COVID-19.
An additional USD 14 billion from donors and 19 billion from countries can prevent hunger for 490 million. If no additional effort is made, 660 million will still suffer in 2030
FIGURE 8. POPULATION AFFECTED BY HUNGER IN 2018 AND 2030
Source: Authors’ calculation.
SDGs 2.1, 2.3, and 2.4 are each interpreted in the model as targets to be achieved, under some constraints. Corresponding to Target 2.1, the model simulates removal of households from the status of hunger, as defined by the FAO’s Prevalence of Undernutrition (PoU). For Target 2.3, then net incomes of small-scale producers double on average between 2015 and 2030. For Target 2.4, greenhouse gas emissions for agriculture conform to the commitments made in the nationally determined contributions (NDCs) from the 2016 UNFCCC Paris Agreement. The NDCs are integrated into both the baseline and the scenario where SDG 2 is achieved. Each country has a carbon budget for its agriculture; land use emissions and production emissions from energy and fertilizer use are included in this budget. The model maintains the budget through a domestically determined carbon tax.
0100200300400500600700800900
680
2018
170
490
190
2030
Removed from hunger in the baseline
2018 (SOFI 2020)Removed from hunger in central scenario
Remaining people in hunger (3% PoU at the country level)
Millions of people
660 m
illio
n peo
ple
51
Figure 9 illustrates conceptually the relationship between achieving a target, Target 2.1 in this case, and estimating the additional donor spending required. The model calculates the donor spending in the baseline and the donor spending incurred in the scenario where the targets are achieved. The additional cost to donors is the difference between the two.
The additional cost to donors is the difference between the baseline and the scenario where the targets are achieved
FIGURE 9. FROM TARGET TO COST ESTIMATE
Source: Adapted from Laborde et al., 2019.
Figure 10 shows the additional public costs, including the donor contribution, using three scenarios. In the central scenario, the PoU is set so that hunger decreases to 3% or less in each country, net incomes of small-scale producers double on average, and greenhouse gas emissions conform to the NDCs.
The second scenario includes trade policy reform in the baseline assumptions and maintains the same targets as the central scenario. Specifically, it assumes that the negotiations at the World Trade Organization (WTO) to reduce domestic support and tariffs in the agricultural sector are concluded and that the African Continental Free Trade Area (AfCFTA) is implemented.
The third scenario reduces the PoU to 0% by 2030, in line with the principle of leaving no one behind. While this scenario is more coherent with SDG 2, it is not used in the central scenario for a few reasons. First, there is limited data on the population under the 3% PoU threshold, making it difficult both to measure the actual calorie deficit the affected households face and to identify a proper set of interventions to support this segment of the population. In this context, we assume that interventions needed for this segment of the population go beyond agricultural interventions and will be limited to safety nets with a fixed per capita payment determined at the country level.
Prev
alen
ce of
Und
erno
urish
men
t
2018 2030
Baseline
Scenario (3%)
O�cia
l Dev
elop
men
t Ass
istan
ce
2018 2030
Baseline
Additional Cost
Scenario

52 52
Three scenarios to estimate the additional public cost to end hunger, double the incomes of small-scale producers, and ensure greenhouse gas emissions from agriculture conform to the Paris Agreement by 2030
FIGURE 10. ESTIMATING THE ADDITIONAL PUBLIC COSTS USING THREE SCENARIOS, INCLUDING THE DONOR CONTRIBUTION
CALCULATING THE DONOR CONTRIBUTION
In the model, we define the allocation between domestic and external resources based on an econometrically estimated co-funding rule that links the level of ODA contribution to a country’s domestic public spending in relation to its income per capita. We found that the richer the country, the less it depends on external resources for its public spending. Full dependency on ODA occurs for countries with per capita income below USD 500. At the other end of the range, ODA is phased out from the model for countries that have per capita income of USD 15,000 or more. The model determines the total additional public expenditures required for each country annually and the split between the country and the donor (Laborde et al., 2016). The model assumes domestic taxation is used to make up the difference between the ODA contribution and total public funding needed. We have one exception to this rule: the spending on CGIAR R&D is paid in full by external donors.
Central Scenario
Central Scenario with WTO Agreement + AfCFTA
Central Scenario + PoU 0%
PoU 3% Doubled Incomes Constrained agricultural GHG emissions
PoU 3% Doubled Incomes Constrained agricultural GHG emissions
PoU 0% Doubled Incomes Constrained agricultural GHG emissions
SCENARIO TARGETSAdditional Annual Country Cost
2020 - 2030 (USD billion)
Additional Annual Donor Contribution
0 10 20 30 40 50 60
19.1 13.9
18.7 13.5
42 21

5352
Three scenarios to estimate the additional public cost to end hunger, double the incomes of small-scale producers, and ensure greenhouse gas emissions from agriculture conform to the Paris Agreement by 2030
FIGURE 10. ESTIMATING THE ADDITIONAL PUBLIC COSTS USING THREE SCENARIOS, INCLUDING THE DONOR CONTRIBUTION
CALCULATING THE DONOR CONTRIBUTION
In the model, we define the allocation between domestic and external resources based on an econometrically estimated co-funding rule that links the level of ODA contribution to a country’s domestic public spending in relation to its income per capita. We found that the richer the country, the less it depends on external resources for its public spending. Full dependency on ODA occurs for countries with per capita income below USD 500. At the other end of the range, ODA is phased out from the model for countries that have per capita income of USD 15,000 or more. The model determines the total additional public expenditures required for each country annually and the split between the country and the donor (Laborde et al., 2016). The model assumes domestic taxation is used to make up the difference between the ODA contribution and total public funding needed. We have one exception to this rule: the spending on CGIAR R&D is paid in full by external donors.
Central Scenario
Central Scenario with WTO Agreement + AfCFTA
Central Scenario + PoU 0%
PoU 3% Doubled Incomes Constrained agricultural GHG emissions
PoU 3% Doubled Incomes Constrained agricultural GHG emissions
PoU 0% Doubled Incomes Constrained agricultural GHG emissions
SCENARIO TARGETSAdditional Annual Country Cost
2020 - 2030 (USD billion)
Additional Annual Donor Contribution
0 10 20 30 40 50 60
19.1 13.9
18.7 13.5
42 21
53
BOX 2. ILLUSTRATING HETEROGENEITY THROUGH A FOCUS ON 11 COUNTRIES
In order to develop a global estimate, the model was applied at different levels and in different countries. The household-level analysis was conducted on 68 low- and middle-income countries. The detailed modelling across instruments and over time was done for 11 countries, mostly in Africa: Bangladesh, Ethiopia, Ghana, Guatemala, Malawi, Nigeria, Rwanda, Senegal, Tanzania, Uganda, and Zambia. A sub-regional aggregate (for example, Central Africa) was done for the remaining low- and middle-income countries. This means that the remaining countries have portfolios of interventions optimized at the sub-regional level instead of the country level. Population data, hunger levels, and economic growth projections remain country specific. The 11 countries were selected because of the levels of hunger, the availability and reliability of data, the diversity of socioeconomic and agricultural situations, and the relevance to donors. This sample gave us sufficient data to confidently extrapolate the cost of ending hunger and the donor contributions at a global scale.
The relative donor contribution varies greatly among the 11 countries. For example, Malawi is expected to still have a low per capita GDP in 2030; therefore, we calculate that the country will still depend on donors to cover 90% of its public budget. Nigeria, on the other hand, is expected to have a higher per capita GDP in 2030; as a result, we calculate that it will depend on donors for less than 10% of its public budget.
5. CONCLUSION
To achieve the global commitment to end hunger sustainably between now and 2030, donors need to double their current level of spending. That means an additional USD 14 billion per year is needed on top of current spending, which stands at USD 12 billion per year. Most of the additional resources need to be targeted to countries in Africa where there will be the highest concentration of hunger and the highest dependency on external resources in the next decade. But ODA will not be enough. Additional efforts of USD 19 billion per year on average will have to be committed by low- and middle-income countries. The additional public spending will prevent 490 million people from experiencing hunger and double the incomes of 545 million small-scale producers on average, while maintaining greenhouse gas emissions for agriculture below the commitments made in the Paris Agreement. Such an outcome would be truly historic.

54 54
REFERENCES
Bizikova, L., Nkonya, E., Minah, M., Hanisch, M., Turaga, R.M.R., Speranza, C., Muthumariappan, K., Tang, L., Ghezzi-Kopel, K., Kelly, J., Celestin, A., & Timmers, B. (2020). A scoping review of the contributions of farmers’ organizations to smallholder agriculture. Nature Food. https://doi.org/10.1038/s43016-020-00164-x
Development Initiatives. (2018). 2018 Global nutrition report: Shining a light to spur action on nutrition. Development Initiatives. https://globalnutritionreport.org/reports/global-nutrition-report-2018/
Eber-Rose, M., Laborde, D. & Murphy, S. (2020). Ending Hunger Sustainably: Trends in ODA Spending for Agriculture. Cornell University, IFPRI and IISD.
Evidence synthesis for sustainability. (2020). Nature Sustainability. https://doi.org/10.1038/s41893-020-00629-8
Feast and famine in agricultural research. (2020). Nature Plants. https://doi.org/10.1038/s41477-020-00795-9
Food and Agriculture Organization of the United Nations (FAO). (2018). The future of food and agriculture – Alternative pathways to 2050. http://www.fao.org/global-perspectives-studies/food-agriculture-projections-to-2050/en/
Food and Agriculture Organization of the United Nations, International Fund for Agricultural Development (IFAD), United Nations Children’s Fund (UNICEF), World Food Programme (WFP), and World Health Organization (WHO). (2020). The state of food security and nutrition in the world 2018. Building climate resilience for food security and nutrition. FAO. http://www.fao.org/3/I9553EN/i9553en.pdf
Intergovernmental Panel on Climate Change (IPCC). (2018). Global Warming of 1.5°C. An IPCC Special Report on the impacts of global warming of 1.5°C above pre-industrial levels and related global greenhouse gas emission pathways, in the context of strengthening the global response to the threat of climate change, sustainable development, and efforts to eradicate poverty. V. Masson-Delmotte, P. Zhai, H.-O. Pörtner, D. Roberts, J. Skea, P.R. Shukla, A. Pirani, W. Moufouma-Okia, C. Péan, R. Pidcock, S. Connors, J.B.R. Matthews, Y. Chen, X. Zhou, M.I. Gomis, E. Lonnoy, T. Maycock, M. Tignor, & T. Waterfield (Eds.). https://www.ipcc.ch/sr15/download/#full
International Fund for Agricultural Development (IFAD). (2016). Rural development report 2016: Fostering inclusive rural transformation. IFAD. https://www.ifad.org/documents/38714170/39155702/Rural+development+report+2016.pdf/347402dd-a37f-41b7-9990-aa745dc113b9
Laborde D., Bizikova, L., Lallemant, T., & Smaller, C. (2016). Ending hunger: What would it cost? IISD and IFPRI. https://www.iisd.org/sites/default/files/publications/ending-hunger-what-would-it-cost.pdf

5554
REFERENCES
Bizikova, L., Nkonya, E., Minah, M., Hanisch, M., Turaga, R.M.R., Speranza, C., Muthumariappan, K., Tang, L., Ghezzi-Kopel, K., Kelly, J., Celestin, A., & Timmers, B. (2020). A scoping review of the contributions of farmers’ organizations to smallholder agriculture. Nature Food. https://doi.org/10.1038/s43016-020-00164-x
Development Initiatives. (2018). 2018 Global nutrition report: Shining a light to spur action on nutrition. Development Initiatives. https://globalnutritionreport.org/reports/global-nutrition-report-2018/
Eber-Rose, M., Laborde, D. & Murphy, S. (2020). Ending Hunger Sustainably: Trends in ODA Spending for Agriculture. Cornell University, IFPRI and IISD.
Evidence synthesis for sustainability. (2020). Nature Sustainability. https://doi.org/10.1038/s41893-020-00629-8
Feast and famine in agricultural research. (2020). Nature Plants. https://doi.org/10.1038/s41477-020-00795-9
Food and Agriculture Organization of the United Nations (FAO). (2018). The future of food and agriculture – Alternative pathways to 2050. http://www.fao.org/global-perspectives-studies/food-agriculture-projections-to-2050/en/
Food and Agriculture Organization of the United Nations, International Fund for Agricultural Development (IFAD), United Nations Children’s Fund (UNICEF), World Food Programme (WFP), and World Health Organization (WHO). (2020). The state of food security and nutrition in the world 2018. Building climate resilience for food security and nutrition. FAO. http://www.fao.org/3/I9553EN/i9553en.pdf
Intergovernmental Panel on Climate Change (IPCC). (2018). Global Warming of 1.5°C. An IPCC Special Report on the impacts of global warming of 1.5°C above pre-industrial levels and related global greenhouse gas emission pathways, in the context of strengthening the global response to the threat of climate change, sustainable development, and efforts to eradicate poverty. V. Masson-Delmotte, P. Zhai, H.-O. Pörtner, D. Roberts, J. Skea, P.R. Shukla, A. Pirani, W. Moufouma-Okia, C. Péan, R. Pidcock, S. Connors, J.B.R. Matthews, Y. Chen, X. Zhou, M.I. Gomis, E. Lonnoy, T. Maycock, M. Tignor, & T. Waterfield (Eds.). https://www.ipcc.ch/sr15/download/#full
International Fund for Agricultural Development (IFAD). (2016). Rural development report 2016: Fostering inclusive rural transformation. IFAD. https://www.ifad.org/documents/38714170/39155702/Rural+development+report+2016.pdf/347402dd-a37f-41b7-9990-aa745dc113b9
Laborde D., Bizikova, L., Lallemant, T., & Smaller, C. (2016). Ending hunger: What would it cost? IISD and IFPRI. https://www.iisd.org/sites/default/files/publications/ending-hunger-what-would-it-cost.pdf
55
Laborde, D., Bizikova, L., Parent, M., & Smaller, C. (2019). The making of a model: Integrating environmental sustainability and farmer incomes to measure the cost of ending hunger. IISD and IFPRI. https://ceres2030.org/resources/research-publications/
Laborde, D., Murphy, S., Parent, M., Porciello, J., & Smaller, C. (2020). Ceres2030: Sustainable solutions to end hunger - Summary report. IISD, IFPRI, and Cornell University.
Laborde, D. & Smaller, C. (2020). What would it cost to avert the COVID-19 hunger crisis? Ceres2030. IISD and IFPRI. https://ceres2030.org/resources/research-publications/
Laborde, D., Robichaud, V., & Tokgoz, S. (2013). MIRAGRODEP 1.0: Documentation (AGRODEP Technical Note). IFPRI.
Liverpool-Tasie, L.S., Wineman, A., Young, S., Tambo, J., Vargas, C., Reardon, T., Adjognon, G.S., Porciello, J., Gathoni, N., Bizikova, L. Galiè, A., & Celestin, A. (2020). A scoping review of market links between value chain actors and small-scale producers in developing regions. Nature Sustainability. https://doi.org/10.1038/s41893-020-00621-2
Organisation for Economic Co-operation and Development (OECD). (n.d.a). Creditor reporting system (CRS). https://stats.oecd.org/Index.aspx?datasetcode=CRS1
Organisation for Economic Co-operation and Development. (n.d.b). Resource flows beyond ODA in DAC statistics. http://www.oecd.org/dac/stats/beyond-oda.htm#dataviz
Shekar, M., Kakietek, J., D’Alimonte, M., Walters, D., Rogers, H., Dayton Eberwein, J., Soe-Lin, S., & Hecht, R. (2016). Investing in nutrition: The foundation for development. The World Bank. https://thousanddays.org/wp-content/uploads/Investing-in-Nutrition-The-Foundation-for-Development.pdf
Stathers, T., Holcroft, D., Kitinoja, L., Mvumi, B., English, A., Omotilewa, O., Kocher, M., Ault, J., & Torero, M. (2020). A scoping review of interventions for crop postharvest loss reduction in sub-Saharan Africa and South Asia. Nature Sustainability. https://doi.org/10.1038/s41893-020-00622-1
Von Braun, J., Bezawit Beyene, C., Torero Cullent, M., Laborde, D., & Smaller, C. (2020, in press). Ending hunger by 2030 – policy actions and costs. ZEF, FAO, Cornell University, IFPRI and IISD.

56 56
APPENDIX 1. LIST OF POLICY INSTRUMENTS MODELLED TO SIMULATE THE PORTFOLIO OF INTERVENTIONS
POLICY INSTRUMENTS TARGETING / COVERAGE STRUCTURAL EFFECTS
NATURE OF EXPENDITURE
EMPOWER THE EXCLUDED
Food subsidy Food items for households with income below the poverty line (USD 1.95 purchasing power parity [PPP])
Food cost reduction per capita through an endogenous, homogenous subsidy rate at the household level
Cost of the public subsidies
Vocational training
Allows people to move between rural and urban employment more easily
Cost of the public subsidies
ON THE FARM
Investment subsidy
All agricultural sectors, all producers
Ad volumen subsidy to domestic investments
Cost of the public subsidies
Fertilizer subsidy Crop sectors, all producers Ad valorem subsidy on chemical inputs used by agricultural sectors and yield effects capturing changes in the production function
Cost of the public subsidies
Capital endowment
All agricultural sectors, only small-scale producers
Allocation of physical capital (e.g. machinery, livestock) given to targeted households
Investment goods bought by public expenditures
Production subsidy
All staple crop sectors, all producers
Ad valorem production subsidy applied to the farm gate price
Cost of the public subsidies
R&D National Agricultural Systems (NARS)
All agricultural sectors, all producers
Agricultural total factor productivity (TFP) is increased based on the stock evolution of NARS R&D
Additional NARS expenditures spent on public services
R&D CGIAR All agricultural sectors, all producers
Agricultural TFP is increased based on the stock evolution of CGIAR R&D
Additional CGIAR expenditures spent on public services

5756
APPENDIX 1. LIST OF POLICY INSTRUMENTS MODELLED TO SIMULATE THE PORTFOLIO OF INTERVENTIONS
POLICY INSTRUMENTS TARGETING / COVERAGE STRUCTURAL EFFECTS
NATURE OF EXPENDITURE
EMPOWER THE EXCLUDED
Food subsidy Food items for households with income below the poverty line (USD 1.95 purchasing power parity [PPP])
Food cost reduction per capita through an endogenous, homogenous subsidy rate at the household level
Cost of the public subsidies
Vocational training
Allows people to move between rural and urban employment more easily
Cost of the public subsidies
ON THE FARM
Investment subsidy
All agricultural sectors, all producers
Ad volumen subsidy to domestic investments
Cost of the public subsidies
Fertilizer subsidy Crop sectors, all producers Ad valorem subsidy on chemical inputs used by agricultural sectors and yield effects capturing changes in the production function
Cost of the public subsidies
Capital endowment
All agricultural sectors, only small-scale producers
Allocation of physical capital (e.g. machinery, livestock) given to targeted households
Investment goods bought by public expenditures
Production subsidy
All staple crop sectors, all producers
Ad valorem production subsidy applied to the farm gate price
Cost of the public subsidies
R&D National Agricultural Systems (NARS)
All agricultural sectors, all producers
Agricultural total factor productivity (TFP) is increased based on the stock evolution of NARS R&D
Additional NARS expenditures spent on public services
R&D CGIAR All agricultural sectors, all producers
Agricultural TFP is increased based on the stock evolution of CGIAR R&D
Additional CGIAR expenditures spent on public services
57
POLICY INSTRUMENTS TARGETING / COVERAGE STRUCTURAL EFFECTS
NATURE OF EXPENDITURE
Extension services
All agricultural sectors, small-scale producers
Efficiency of production factors, i.e. difference between physical and efficient units, for small-scale producers
Public services expenditures
Rural Infrastructure (irrigation)
Crop sectors, all producers Agricultural TFP is increased based on the growth of irrigated area
Aggregated capital goods for expenditures based on unit costs by type of investments
Livestock subsidy (agroforestry)
Dairy sector, small-scale producers
Ad volumen subsidy to year 1 fixed costs (extension and shrubs). Ad volumen reduction in GHG emissions.
Cost of the public subsidies
Livestock subsidy (improved forage)
Ruminant sector, small-scale producers
Ad volumen subsidy to year 1 fixed costs (extension, seed, and inputs)
Cost of the public subsidies
FOOD ON THE MOVE
Post-harvest losses (storage)
Crop sectors, small-scale producers
Efficiency of production factors for small-scale producers and reduction of an initial shadow tax on factors of production
Aggregated capital goods for expenditures based on unit costs by type of investment
Rural Infrastructure (roads)
All agricultural sectors, all producers
Agricultural TFP is increased based on the growth of road infrastructure

58 58
APPENDIX 2. LIST OF COUNTRIES AND THEIR PRIORITY LEVEL
COUNTRY NAME PRIORITY LEVEL
Afghanistan Low Priority
Angola Low Priority
Albania On Target
Algeria Low Priority
Andorra On Target
Argentina On Target
Armenia On Target
Antigua and Barbuda On Target
Azerbaijan On Target
Burundi High Priority
Benin Low Priority
Burkina Faso Medium Priority
Bangladesh Low Priority
Bahamas On Target
Bosnia and Herzegovina On Target
Belarus On Target
Belize Low Priority
Bermuda On Target
Bolivia Low Priority
Brazil Low Priority
Barbados On Target
Bhutan On Target
Botswana Low Priority
Cabo Verde Medium Priority
COUNTRY NAME PRIORITY LEVEL
Central African Republic High Priority
Chile On Target
China On Target
Cote d'Ivoire Medium Priority
Cambodia Low Priority
Cameroon Low Priority
Chad High Priority
Congo Medium Priority
Colombia Low Priority
Comoros Medium Priority
Costa Rica On Target
Cuba On Target
Democratic Republic of Congo
High Priority
Djibouti On Target
Dominica Low Priority
Dominican Republic Low Priority
Ecuador Low Priority
Egypt Low Priority
Eswatini Medium Priority
Ethiopia Medium Priority
Fiji On Target
Gabon Low Priority
Georgia On Target
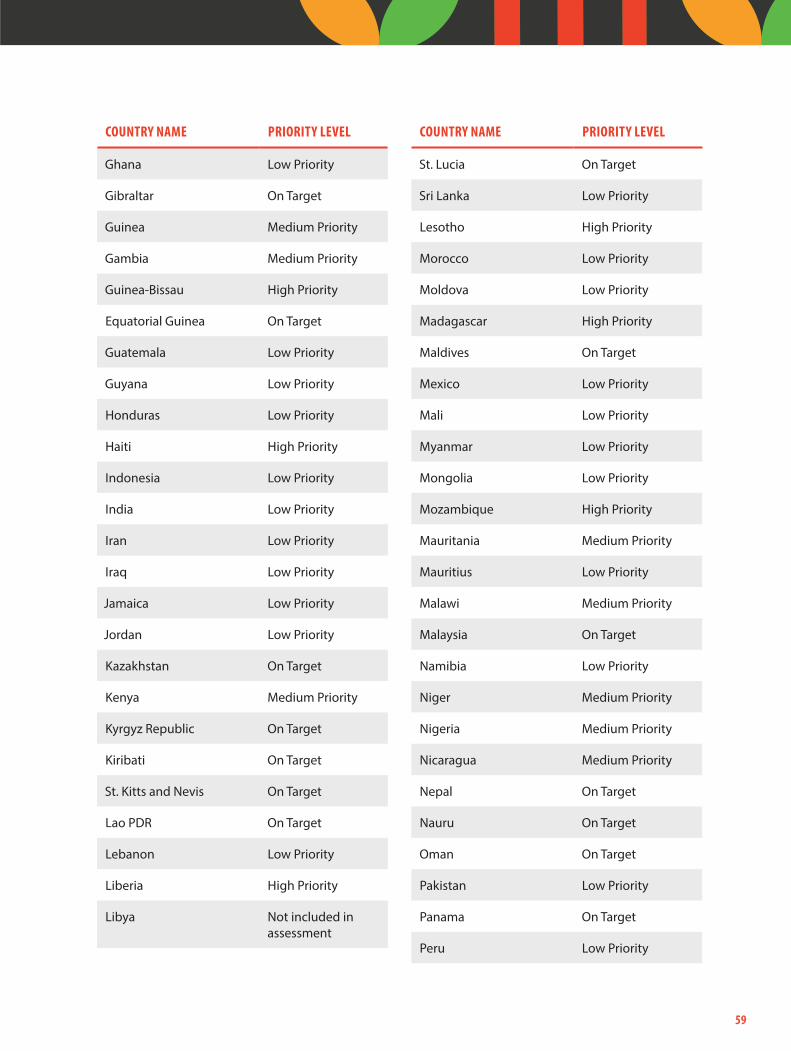
5958
APPENDIX 2. LIST OF COUNTRIES AND THEIR PRIORITY LEVEL
COUNTRY NAME PRIORITY LEVEL
Afghanistan Low Priority
Angola Low Priority
Albania On Target
Algeria Low Priority
Andorra On Target
Argentina On Target
Armenia On Target
Antigua and Barbuda On Target
Azerbaijan On Target
Burundi High Priority
Benin Low Priority
Burkina Faso Medium Priority
Bangladesh Low Priority
Bahamas On Target
Bosnia and Herzegovina On Target
Belarus On Target
Belize Low Priority
Bermuda On Target
Bolivia Low Priority
Brazil Low Priority
Barbados On Target
Bhutan On Target
Botswana Low Priority
Cabo Verde Medium Priority
COUNTRY NAME PRIORITY LEVEL
Central African Republic High Priority
Chile On Target
China On Target
Cote d'Ivoire Medium Priority
Cambodia Low Priority
Cameroon Low Priority
Chad High Priority
Congo Medium Priority
Colombia Low Priority
Comoros Medium Priority
Costa Rica On Target
Cuba On Target
Democratic Republic of Congo
High Priority
Djibouti On Target
Dominica Low Priority
Dominican Republic Low Priority
Ecuador Low Priority
Egypt Low Priority
Eswatini Medium Priority
Ethiopia Medium Priority
Fiji On Target
Gabon Low Priority
Georgia On Target
59
COUNTRY NAME PRIORITY LEVEL
Ghana Low Priority
Gibraltar On Target
Guinea Medium Priority
Gambia Medium Priority
Guinea-Bissau High Priority
Equatorial Guinea On Target
Guatemala Low Priority
Guyana Low Priority
Honduras Low Priority
Haiti High Priority
Indonesia Low Priority
India Low Priority
Iran Low Priority
Iraq Low Priority
Jamaica Low Priority
Jordan Low Priority
Kazakhstan On Target
Kenya Medium Priority
Kyrgyz Republic On Target
Kiribati On Target
St. Kitts and Nevis On Target
Lao PDR On Target
Lebanon Low Priority
Liberia High Priority
Libya Not included in assessment
COUNTRY NAME PRIORITY LEVEL
St. Lucia On Target
Sri Lanka Low Priority
Lesotho High Priority
Morocco Low Priority
Moldova Low Priority
Madagascar High Priority
Maldives On Target
Mexico Low Priority
Mali Low Priority
Myanmar Low Priority
Mongolia Low Priority
Mozambique High Priority
Mauritania Medium Priority
Mauritius Low Priority
Malawi Medium Priority
Malaysia On Target
Namibia Low Priority
Niger Medium Priority
Nigeria Medium Priority
Nicaragua Medium Priority
Nepal On Target
Nauru On Target
Oman On Target
Pakistan Low Priority
Panama On Target
Peru Low Priority

60 60
COUNTRY NAME PRIORITY LEVEL
Philippines Low Priority
Palau On Target
Papua New Guinea Low Priority
Puerto Rico On Target
Paraguay Low Priority
West Bank and Gaza On Target
Rwanda Medium Priority
Sudan Medium Priority
Senegal Low Priority
Solomon Islands Low Priority
Sierra Leone Medium Priority
El Salvador Low Priority
San Marino On Target
Sao Tome and Principe Low Priority
Serbia On Target
Somalia High Priority
South Sudan High Priority
Seychelles On Target
St. Vincent and the Grenadines
Low Priority
Suriname Low Priority
Syrian Arab Republic Not included in assessment
Turks and Caicos Islands On Target
Togo Medium Priority
Thailand Low Priority
COUNTRY NAME PRIORITY LEVEL
Tajikistan On Target
Turkmenistan On Target
Timor-Leste Low Priority
Tonga On Target
Trinidad and Tobago On Target
Tunisia Low Priority
Turkey On Target
Tuvalu On Target
Tanzania Medium Priority
Uganda Medium Priority
Uruguay On Target
Uzbekistan On Target
Venezuela Medium Priority
Vietnam On Target
Vanuatu Low Priority
Samoa On Target
Yemen High Priority
South Africa Low Priority
Zambia High Priority
Zimbabwe High Priority

6968
Gentilini, U., Almenfi, M., Lopez, A. V., Mujica, I. V., Quintana, R. & Zafar, U. (2020, June 12). Social protection and jobs responses to COVID-19: A real-time review of country measures (Living paper v. 11). World Bank.
Haas, A. & Strohm, R. (3 May 2020) A novel idea: Integrating urban and rural safety nets in Africa during the pandemic. The Conversation. https://theconversation.com/a-novel-idea-integrating-urban-and-rural-safety-nets-in-africa-during-the-pandemic-137532
High Level Panel of Experts on Food Security and Nutrition. (2017). Nutrition and food systems. http://www.fao.org/3/a-i7846e.pdf
Hoddinott, J. (2008). Social safety nets and productivity enhancing investments in agriculture (IFPRI Discussion Paper). International Food Policy Research Institute. http://dx.doi.org/10.2139/ssrn.1661284.
International Food Policy Research Institute. (2020). COVID-19 Policy Response (CPR) Portal. https://www.ifpri.org/project/covid-19-policy-response-cpr-portal
International Monetary Fund (IMF). (2020, June). A crisis like no other, an uncertain recovery (World Economic Outlook Update). https://www.imf.org/en/Publications/WEO/Issues/2020/06/24/WEOUpdateJune2020
Laborde, D., Robichaud, V., & Tokgoz, S. (2013). MIRAGRODEP 1.0: Documentation. AGRODEP.
Laborde, D., & Smaller, C. (2020). What would it cost to avert the COVID-19 hunger crisis? International Food Policy Research Institute, Cornell University, & International Institute for Sustainable Development. https://ecommons.cornell.edu/handle/1813/70172
Mbaye, S. (2020). Senegal phone survey on COVID-19 crisis. [Unpublished report]. Université Gaston Berger, St-Louis, Senegal.
Ratha, D., De, S., Kim, E. J., Plaza, S., Seshan, G. & Yameogo, N. D. (April 2020). COVID-19 crisis through a migration lens (Migration and Development Brief 32). KNOMAD & World Bank. http://documents1.worldbank.org/curated/en/989721587512418006/pdf/COVID-19-Crisis-Through-a-Migration-Lens.pdf
Strauss, J. (1986). Does better nutrition raise farm productivity? Journal of Political Economy, 94 (2), 297–320.
United Nations General Assembly. (2015). Transforming our world: The 2030 Agenda for Sustainable Development (A/RES/70/1). https://www.un.org/ga/search/view_doc.asp?symbol=A/RES/70/1&Lang=E
World Bank. (2016). The Atlas of Social Protection: Indicators of Resilience and Equity. https://datacatalog.worldbank.org/dataset/atlas-social-protection-indicators-resilience-and-equity
World Bank. (2019). The World Bank and nutrition. https://www.worldbank.org/en/topic/nutrition/overview#1
World Bank. (2020). The World Bank in Africa: Overview. https://www.worldbank.org/en/region/afr/overview
69
On the Farm
Food on the Move
Empower the Excluded
Nature Collection of Articles
69
On the Farm
Food on the Move
Empower the Excluded
Nature Collection of Articles
69
On the Farm
Food on the Move
Empower the Excluded
Nature Collection of Articles
Sustainable solutions to end hunger:Nature Portfolio collection of articles
nature.com/collections/end-hunger
Empower the Excluded
On the Farm
Food on the Move
Shedding light on the evidence blind spots confounding the multiple objectives of SDG 2
Accelerating evidence-informed decision-making for the Sustainable Development Goals using machine learning
Feast and famine in agricultural research
Evidence synthesis for sustainability
Social protection to combat hunger
A scoping review of the contributions of farmers’ organizations to smallholder agriculture
A systematic review of employment outcomes from youth skills training programmes in agriculture in low- and middle-income countries
A scoping review of feed interventions and livelihoods of small-scale livestock keepers
A scoping review of adoption of climate-resilient crops by small-scale producers in low- and middle-income countries
A scoping review of research funding for small-scale farmers in water scarce regions
A scoping review on incentives for adoption of sustainable agricultural practices and their outcomes
A scoping review of market links between value chain actors and small-scale producers in developing regions
A scoping review of interventions for crop postharvest loss reduction in sub-Saharan Africa and South Asia
62
63
64
71
79
87
98
107
119
129
144
155
170

62 | Sustainable solutions to end hunger
1195
editorial
Feast and famine in agricultural researchEnding hunger is a major objective of the United Nations’ Sustainable Development Goals. A cross-journal collection of articles takes a systematic look at what we might already know about achieving it.
The global health emergency is both overshadowing and exacerbating chronic problems that existed well
before this time last year. World Food Day, which falls on 16 October 2020, would have been important enough had its focus only been the United Nations’ second Sustainable Development Goal to abolish hunger by 2030. But according to the World Food Program’s 2020 Global Report on Food Crises1, the last year has seen at least 130 million more people at risk of hunger as a result of COVID-19. Countless others have discovered that food security is not permanent, and that the fall from food abundance to food scarcity can occur in a matter of weeks when one’s access to income is upended2. One credible estimate of the additional investment needed to prevent millions more people from becoming food insecure as a result of COVID-19 is US$10 billion3.
This month, a collection (https://www.nature.com/collections/dhiggjeagd) of articles published across a number of Nature Research journals (Nature Food, Nature Machine Intelligence, Nature Plants and Nature Sustainability) attempts to tackle this problem head on. In so doing it starkly highlights that the scarcity and abundance endemic in our actual food systems is mirrored in the body of research about agriculture and food systems. Despite a systematic scouring of the literature aided by sophisticated machine-learning approaches, scant research can be found concentrating on one of the largest populations of hungry people: small-scale farmers.
These studies emerge from the Ceres2030: Sustainable Solutions to End Hunger project, which brought together more than 75 global experts from 23 countries. These researchers looked at a diverse set of issues in their evaluation of more than 100,000 articles in agricultural research. Using detailed protocols registered on the Open Science Framework (https://osf.io/adxek/) before the work commenced, they identified all articles capable of contributing to their scientific assessment. A surprisingly consistent result was that only around 2% of published agricultural
and agronomic research has original and high-quality data about solutions for small-scale producers4.
However, their scientific assessment should be a clear reminder that 2% of an evidence base is not zero. Despite the patchy nature of the evidence base, the teams have identified many robust and significant effects.
• Farmers are increasingly under pres-sure to switch to new, climate-resilientcrops due to uncertain and constantlychanging weather patterns. Higher ratesof crop adoption by farmers are linked totraining and advisory services.
• In low- and middle-income countries,76.7% of small-scale farms are locatedin water-scarce regions, and fewer than37.2% of these have irrigation systems.These water needs must be addressed,and the use of livestock and digital tech-nologies are under-assessed alternativesto irrigation.
• Farmers’ organizations are particularlyhelpful to smallholder farmers.Membership was associated withpositive effects on income in 57% of thecases reviewed, and on crop yield, onproduction and on the environment in20–25% of studies.
There are also uncomfortable data onthe degree to which women — representing nearly 50% of the agricultural workforce in the countries studied5 — are overlooked when assessing the efficacy of aid initiatives, with only around one in ten studies considering the outcomes for different genders. The costing of interventions is another factor frequently not included despite this being a vital piece of information to support policymaking.
Two Perspectives in the collection point out that the questions asked by policymakers and by researchers are different, and each is frustrated by the other’s time scales4,6. But two things both parties agree on are a lack of evidence in the evidence base, and that researchers are forced to waste an inordinate amount of time due to inefficiencies in the research process7.
Sustainable Development Goal 2 is a constant reminder that we need to transform food systems to deliver affordable, nutritious and sustainable diets for all. Even before the COVID-19 pandemic the clock was ticking, and millions of people were going hungry every day8. When faced with a highly variable body of research capable of guiding our responses to such threats, it is imperative to employ every possible byte of data. Yet in most disciplines — agriculture included — the methodological processes and standards needed to help analyse the results of thousands of heterogeneous studies are still in their infancy9.
Agriculture is faced with a very broad array of information sources and study designs, hampering the effectiveness of many evidence synthesis approaches10. The researchers of the Ceres2030 project must be applauded for demonstrating to the full the powers of evidence syntheses — especially the frequently undervalued Scoping Review — to mine even the messiest of evidence bases.
The ability to engage in informed, systematic and rational decision making will be essential in tackling hunger and poverty in general. This is not only necessary and urgent but, as Ceres2030 has demonstrated, also achievable. ❐
Published online: 13 October 2020 https://doi.org/10.1038/s41477-020-00795-9
References 1. 2020 Global Report on Food Crises (Food Security Information
Network, 2020). 2. Goodman, P. S., Dahir, A. L. & Singh, K. D. The Other Way Covid
Will Kill: Hunger. The New York Times (11 September 2020). 3. Laborde, D. & Smaller, C. What Would it Cost to Avert the
COVID-19 Hunger Crisis? (Ceres2030, 2020). 4. Porciello, J., Ivanina, M., Islam, M., Einarson, S. & Hirsh, H. Nat.
Mach. Intell. https://doi.org/10.1038/s42256-020-00235-5 (2020). 5. The State of Food and Agriculture 2010-11, Women in
Agriculture: Closing the Gender Gap for Development. Food andAgriculture Organization of the United Nations http://www.fao.org/3/i2050e/i2050e.pdf (2011).
6. Lipper, L., DeFries, R. & Bizikova, L. Nat. Plants https://doi.org/10.1038/s41477-020-00792-y (2020).
7. Chalmers, I. et al. Lancet 383, 156–165 (2014). 8. The State of Food Security and Nutrition in the World 2020:
Transforming Food Systems for Affordable Healthy Diets (FAO, IFAD, UNICEF, WFP and WHO, 2020).
9. Gurevitch, J., Koricheva, J., Nakagawa, S. & Stewart, G. Nature555, 175–182 (2018).
10. Webb, P. & Kennedy, E. Food Nutr. Bull. 35, 126–132 (2014).
Nature PlaNts | VOL 6 | OcTObEr 2020 | 1195 | www.nature.com/natureplants

Sustainable solutions to end hunger | 63771
editorial
Evidence synthesis for sustainabilityThe volume of work contributing substantial understanding and new evidence about sustainability challenges is growing. Making the most of it is imperative for interventions to be really effective.
Sustainability scholarship, practice and policy encompass a huge variety of needs, skills and experiences.
Sustainability challenges are varied and complex as we all know. They are also pressing and increasingly so. This in turn means that growing knowledge and evidence are being produced and disseminated through various channels including academic journals and grey literature documents among others. Keeping abreast of such a growing amount of research can be daunting. In addition, some of these valuable documents often including the outcomes of policy evaluations are shelved, once complete, and remain unread. In one way or another, available knowledge risks not having the impact it should — producing syntheses of such knowledge and evidence does enhance taking stock and moving forward. Ultimately, it does make a real difference in how research money is invested and interventions and policies designed. Robust syntheses can help understand multifaceted problems such as, for example, improving sanitation conditions and achieving food security in developing regions. It helps in identifying critical knowledge gaps, and, when it comes to interventions and policies it allows learning lessons about what worked and what didn’t. Ultimately, society stands to gain from all this. So, there is no doubt, robust evidence synthesis should be promoted.
There is a long tradition of evidence synthesis in the medical sciences which is where robust tools and methods have been developed and are now well established. The output of evidence syntheses can take various forms, including systematic reviews, meta-analyses, scoping reviews, rapid evidence assessments, systematic maps and a lot more. Among the many types of evidence synthesis, systematic reviews have been the most widely used so far and are well known for rigour, breadth and impact. Systematic reviews as defined by the Cochrane Collaboration address clearly defined research questions and follow systematic and explicit methods to select the relevant literature, and collect and analyse data from the studies selected. In order to ensure a robust and replicable approach, these synthesis articles follow strict reporting guidelines, such as those set out by the PRISMA statement. In short, these syntheses represent original research efforts developed
following structured protocols preregistered and publicly available before the actual synthesis articles are developed.
Though quite popular approaches to evidence synthesis, systematic reviews carry some costs. In particular, they are extremely resource demanding. In addition, they might not work in domains where data are not consistently and continuously collected or when interventions vary substantially in design, as is the case for example in the context of sustainable development. Other types of evidence synthesis can be more suitable. One emerging article is the scoping review — useful to scope a body of published work in order to identify gaps or to clarify concepts, or even confirm the importance of potential questions, among other things. In this issue, Nature Sustainability publishes four such examples contributing knowledge synthesis to various dimensions of Sustainable Development Goal 2, zero hunger. An article by Liverpool-Tasie et al. sheds light on whether interactions not formalized through contracts between small farmers and both small- and large-scale value chain actors have impacts on small farmers’ livelihoods. Another article by Piñeiro and colleagues analyses whether or not incentive-based programmes lead to the adoption of sustainable practices and what the effects are on environmental, economic and productivity outcomes. Stathers and co-authors focus on analysing the kind of interventions designed
to reduce postharvest losses of food crops in sub-Saharan Africa and South Asia. Finally, Ricciardi and colleagues map the existing literature about on-farm interventions that improve the incomes or yields of small-scale farmers in water scarce regions. These scoping reviews, included in a collection (https://www.nature.com/collections/end-hunger) jointly with Nature Food and Nature Plants, are the outcome of an innovative and broad effort, including the work of more than 70 researchers from 25 countries, to evaluate agricultural interventions that have potential to sustainably improve the living conditions of among the poorer farmers around the world.
Increasing the use of evidence synthesis for, and adapting methods and types of syntheses to, sustainability-relevant research questions, including about biodiversity conservation programmes, climate change policies and natural resource management strategies, will further knowledge about the complexity of human–nature interfaces and improve the design and effectiveness of interventions. A lot is already happening, but more work is needed. We hope that going forward more resources and scholarly interest will support the development of worthwhile evidence synthesis efforts that contribute to change practices in view of achieving a better future for all. ❐
Published online: 13 October 2020 https://doi.org/10.1038/s41893-020-00629-8
Credit: Zoonar GmbH / Alamy Stock Photo
Nature SuStaiNability | VOL 3 | OctOber 2020 | 771 | www.nature.com/natsustain

64 | Sustainable solutions to end hunger
PersPectivehttps://doi.org/10.1038/s42256-020-00235-5
1Department of Global Development, Cornell University, Ithaca, NY, USA. 2EPAM Systems, Minsk, Belarus. 3Belarusian State University, Minsk, Belarus. 4Department of Computer and Information Sciences, Cornell University, Ithaca, NY, USA. ✉e-mail: [email protected]
The United Nations’ 17 Sustainable Development Goals (SDGs) are guideposts for an international community that aspires to achieve a better life for all people. For example, SDG 2 seeks to
achieve zero hunger by 2030. This requires ensuring that the world is food secure while at the same time preserving the environment for future use far beyond 2030.
Solutions to development problems are rooted in domain-specific knowledge such as agriculture and livelihoods, environment and natural resource management, nutrition and health, human capital and education. Policy and funding organizations need a synthesis of scientific information to inform their decision-making1–3. But it is difficult to synthesize the world’s accumulated scientific knowl-edge for complex issues like food security, because these solutions are spread across millions of individual studies, and the breadth and depth of human research is estimated to double every nine years4.
Moreover, the questions of policy actors are substantially dif-ferent from the questions that researchers are trained to answer. Evidence-informed decision-making rose as a means to fill the gaps between research and policy5,6. Systematic and scoping reviews, evi-dence gap maps, and meta-analyses all fall under the broad umbrella of evidence synthesis and provide a model under which policy and intervention examinations can be made with greater focus, reli-ability and transparency6. In recent years researchers in education, international development, economics and ecology have adapted these methodologies—originally designed by the health and medi-cal communities to evaluate claims presented in clinical trials—in order to introduce more standardized approaches to examine their own growing evidence bases7,8.
Producing evidence syntheses are time-consuming. A single evi-dence synthesis takes a research team anywhere from 18 months to three years and involves an initial analysis of thousands of search results to determine which are capable of supporting evalu-ation of the original research question9,10. This frustrates policy’s demand-driven cycle, wherein answers are needed now in order to make decisions about resource allocation.
Machine learning models (MLMs) can support evidence synthesis11. Recommender systems, which learn from a user’s behaviour to determine real-time prioritization, are embed-ded within some screening softwares12. One of the best-known groups of evidence syntheses for health and medical sciences, the Cochrane Collaboration, regularly uses MLMs to identify random-control trial (RCT) experiments from within larger datasets. In addition, the SWIFT-Review is a workbench of tools that can conduct topic modelling, study categorization and prior-ity ranking for relevance of literature in the health sciences, and the tool RobotReviewer performs data extraction on RCTs to aid in systematic reviews13,14.
These approaches have been designed around the specific needs of the health sciences community. Other solutions are needed to support synthesis across other evidence bases, especially if the SDGs are to retain their commitment to make decisions based on evidence-informed policy15. Achieving this will require invest-ments to transform the information discovery and retrieval landscape to clear one of the lowest thresholds in the research process: quick sense-making of thousands of scientific articles that result from keyword-based searches. We need sophisticated tools and approaches to evaluate text-based domains. Investment at scale to produce tools and approaches that can work across all domains has the potential to place evidence rapidly in the hands of policy-makers.
In this article, we present a use case of a sponsored-research project. First, we describe the development of Persephone, a MLM that has been designed to analyse, classify, label and perform data extraction on 500,000 unstructured summaries from prominent sources for agricultural research in order to support a global net-work of researchers who were performing evidence synthesis. We then describe some findings from the model as they pertain to the use of MLMs in supporting evidence synthesis before concluding with thoughts about the role of AI and machine-learning to design systems and tools that are relevant for real-world use cases.
Accelerating evidence-informed decision-making for the Sustainable Development Goals using machine learningJaron Porciello 1 ✉, Maryia Ivanina 2,3, Maidul Islam4, Stefan Einarson1 and Haym Hirsh4
The United Nations Sustainable Development Goal 2 (SDG 2) is to achieve zero hunger by 2030. We have designed Persephone, a machine learning model, to support a diverse volunteer network of 77 researchers from 23 countries engaged in creat-ing interdisciplinary evidence syntheses in support of SDG 2. Such evidence syntheses, whatever the specific topic, assess original studies to determine the effectiveness of interventions. By gathering and summarizing current evidence and provid-ing objective recommendations they can be valuable aids to decision-makers. However, they are time-consuming; estimates range from 18 months to three years to produce a single review. Persephone analysed 500,000 unstructured text summaries from prominent sources of agricultural research, determining with 90% accuracy the subset of studies that would eventually be selected by expert researchers. We demonstrate that machine learning models can be invaluable in placing evidence into the hands of policymakers.
Nature MachiNe iNtelligeNce | VOL 2 | OCtOBEr 2020 | 559–565 | www.nature.com/natmachintell 559
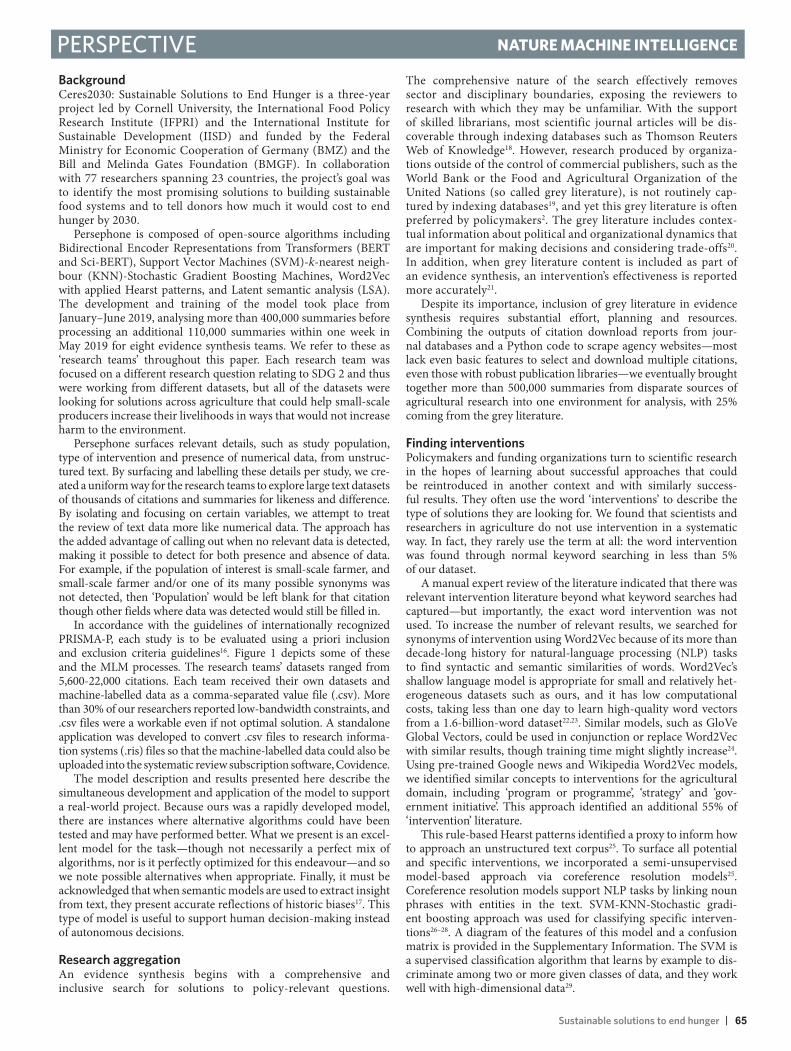
|Sustainable solutions to end hunger 65
PersPective Nature MachiNe iNtelligeNce
BackgroundCeres2030: Sustainable Solutions to End Hunger is a three-year project led by Cornell University, the International Food Policy Research Institute (IFPRI) and the International Institute for Sustainable Development (IISD) and funded by the Federal Ministry for Economic Cooperation of Germany (BMZ) and the Bill and Melinda Gates Foundation (BMGF). In collaboration with 77 researchers spanning 23 countries, the project’s goal was to identify the most promising solutions to building sustainable food systems and to tell donors how much it would cost to end hunger by 2030.
Persephone is composed of open-source algorithms including Bidirectional Encoder Representations from Transformers (BERT and Sci-BERT), Support Vector Machines (SVM)-k-nearest neigh-bour (KNN)-Stochastic Gradient Boosting Machines, Word2Vec with applied Hearst patterns, and Latent semantic analysis (LSA). The development and training of the model took place from January–June 2019, analysing more than 400,000 summaries before processing an additional 110,000 summaries within one week in May 2019 for eight evidence synthesis teams. We refer to these as ‘research teams’ throughout this paper. Each research team was focused on a different research question relating to SDG 2 and thus were working from different datasets, but all of the datasets were looking for solutions across agriculture that could help small-scale producers increase their livelihoods in ways that would not increase harm to the environment.
Persephone surfaces relevant details, such as study population, type of intervention and presence of numerical data, from unstruc-tured text. By surfacing and labelling these details per study, we cre-ated a uniform way for the research teams to explore large text datasets of thousands of citations and summaries for likeness and difference. By isolating and focusing on certain variables, we attempt to treat the review of text data more like numerical data. The approach has the added advantage of calling out when no relevant data is detected, making it possible to detect for both presence and absence of data. For example, if the population of interest is small-scale farmer, and small-scale farmer and/or one of its many possible synonyms was not detected, then ‘Population’ would be left blank for that citation though other fields where data was detected would still be filled in.
In accordance with the guidelines of internationally recognized PRISMA-P, each study is to be evaluated using a priori inclusion and exclusion criteria guidelines16. Figure 1 depicts some of these and the MLM processes. The research teams’ datasets ranged from 5,600-22,000 citations. Each team received their own datasets and machine-labelled data as a comma-separated value file (.csv). More than 30% of our researchers reported low-bandwidth constraints, and .csv files were a workable even if not optimal solution. A standalone application was developed to convert .csv files to research informa-tion systems (.ris) files so that the machine-labelled data could also be uploaded into the systematic review subscription software, Covidence.
The model description and results presented here describe the simultaneous development and application of the model to support a real-world project. Because ours was a rapidly developed model, there are instances where alternative algorithms could have been tested and may have performed better. What we present is an excel-lent model for the task—though not necessarily a perfect mix of algorithms, nor is it perfectly optimized for this endeavour—and so we note possible alternatives when appropriate. Finally, it must be acknowledged that when semantic models are used to extract insight from text, they present accurate reflections of historic biases17. This type of model is useful to support human decision-making instead of autonomous decisions.
Research aggregationAn evidence synthesis begins with a comprehensive and inclusive search for solutions to policy-relevant questions.
The comprehensive nature of the search effectively removes sector and disciplinary boundaries, exposing the reviewers to research with which they may be unfamiliar. With the support of skilled librarians, most scientific journal articles will be dis-coverable through indexing databases such as Thomson Reuters Web of Knowledge18. However, research produced by organiza-tions outside of the control of commercial publishers, such as the World Bank or the Food and Agricultural Organization of the United Nations (so called grey literature), is not routinely cap-tured by indexing databases19, and yet this grey literature is often preferred by policymakers2. The grey literature includes contex-tual information about political and organizational dynamics that are important for making decisions and considering trade-offs20. In addition, when grey literature content is included as part of an evidence synthesis, an intervention’s effectiveness is reported more accurately21.
Despite its importance, inclusion of grey literature in evidence synthesis requires substantial effort, planning and resources. Combining the outputs of citation download reports from jour-nal databases and a Python code to scrape agency websites—most lack even basic features to select and download multiple citations, even those with robust publication libraries—we eventually brought together more than 500,000 summaries from disparate sources of agricultural research into one environment for analysis, with 25% coming from the grey literature.
Finding interventionsPolicymakers and funding organizations turn to scientific research in the hopes of learning about successful approaches that could be reintroduced in another context and with similarly success-ful results. They often use the word ‘interventions’ to describe the type of solutions they are looking for. We found that scientists and researchers in agriculture do not use intervention in a systematic way. In fact, they rarely use the term at all: the word intervention was found through normal keyword searching in less than 5% of our dataset.
A manual expert review of the literature indicated that there was relevant intervention literature beyond what keyword searches had captured—but importantly, the exact word intervention was not used. To increase the number of relevant results, we searched for synonyms of intervention using Word2Vec because of its more than decade-long history for natural-language processing (NLP) tasks to find syntactic and semantic similarities of words. Word2Vec’s shallow language model is appropriate for small and relatively het-erogeneous datasets such as ours, and it has low computational costs, taking less than one day to learn high-quality word vectors from a 1.6-billion-word dataset22,23. Similar models, such as GloVe Global Vectors, could be used in conjunction or replace Word2Vec with similar results, though training time might slightly increase24. Using pre-trained Google news and Wikipedia Word2Vec models, we identified similar concepts to interventions for the agricultural domain, including ‘program or programme’, ‘strategy’ and ‘gov-ernment initiative’. This approach identified an additional 55% of ‘intervention’ literature.
This rule-based Hearst patterns identified a proxy to inform how to approach an unstructured text corpus25. To surface all potential and specific interventions, we incorporated a semi-unsupervised model-based approach via coreference resolution models25. Coreference resolution models support NLP tasks by linking noun phrases with entities in the text. SVM-KNN-Stochastic gradi-ent boosting approach was used for classifying specific interven-tions26–28. A diagram of the features of this model and a confusion matrix is provided in the Supplementary Information. The SVM is a supervised classification algorithm that learns by example to dis-criminate among two or more given classes of data, and they work well with high-dimensional data29.
Nature MachiNe iNtelligeNce | VOL 2 | OctOber 2020 | 559–565 | www.nature.com/natmachintell560

| 66 Sustainable solutions to end hunger
PersPectiveNature MachiNe iNtelligeNce
We created a training dataset of 2,000 examples of broad con-cepts that resembled how interventions are described in agriculture and food systems: as technological, socioeconomic or ecosys-tem interventions, and more specifics of storage, mechanization. Non-interventions were also captured. Next, we sought to surface and cluster specific interventions, such as drip-irrigation systems, for each broad class. The dataset was separated into hyperplanes in a 600-dimensional space using SVM with radially based functions and KNN to predict multiple narrow classes within each broad class for new points by majority of k neighbour votes, where five neigh-bours gave sufficient results.
KNN helps to find local connections between concepts that can be lost using SVM. One limitation of this model is it gives good results with frequent words, and less reliable results with rare words. To address this, rare words FastText word embeddings were trained on our domain materials30. In addition, boosting helped
to unite different models, connect the results and improve overall quality. Boosting algorithms repeatedly apply a changing distribu-tion of data to a ‘weak learner’ to combine the learned models into a final model whose performance vastly exceeds the ability of the original learner31.
BERT is a fine-tuning based representation model which can find relationships not only within a sentence, but also in a small piece of text32. It is designed for sentence-level and token-level tasks and can be applied to the unstructured text. Due to our small training dataset and small amounts of information captured with a narrow concept, the use of BERT did not achieve better results compared with SVM-KNN-Shocastic gradient boosting. This could be in part because our word embeddings are from the same domain, whereas pre-trained BERT models are useful for more general domains. We describe the use of BERT and Sci-BERT for other tasks. Many evi-dence syntheses are conducted because policymakers are interested
Topics
Study design type
Intervention classes(Broad|Middle|Narrow)
Geographies
Plant and animal types
Outcomes
Population
Identity the issue anddetermine the question
Write a plan for the review (protocol)
Sift andselect studies
Extract data fromthe studies
Assess the qualityof the studies
Combine the data(synthesis or
meta-analysis)
Discuss and concludeoverall findings
Evidence synthesis
Dissemination
Search for studies
MACHINE-LEARNING ANALYTICS
Measurements for interventions and plants
WHAT AUTHORS DO
Fig. 1 | Evidence synthesis and machine learning analytics. This is an overview of two processes. On the left are steps taken by researchers to complete an evidence synthesis and on the right under ‘Machine-learning analytics’ are the outputs produced by Persephone. Some of these machine-labelled analytics are interventions, geographies, plant and animal names, outcomes, population, topics, study design type and measurements detected per intervention.
Nature MachiNe iNtelligeNce | VOL 2 | OcTOber 2020 | 559–565 | www.nature.com/natmachintell 561

|Sustainable solutions to end hunger 67
PersPective NATURE MACHINE INTELLIGENCE
in sector-level research for a particular region, such as developing world countries. Figure 2 shows our model’s capacity to detect and quantify how much and what types of intervention literature from our three categories are available across Kenya at the level of a prov-ince, thus offering some reasonable assessments about where we might expect to find gaps in the evidence-base.
NLP Many of the details important to evidence synthesis, such as study population and geography, can be discovered using NLP and named-entity libraries such as sPacy. There is an active community of researchers dedicated to NLP, data-mining and information retrieval, and new discoveries in the field are presented at conferences such as the Workshop on Mining Scientific Publications and the Conference on Research and Development in Information Retrieval.
The ability to discover these granular details—identification of specific plant types from scientific text, for instance—rely on join-ing MLM models with existing controlled dictionaries and taxono-mies such as AGROVOC produced by the Food and Agricultural Organization of the United Nations. We used AGROVOC to iden-tify plant names (non-scientific) and animal products; others have been used this resource to inform ontology development 33 , 34 .
When no controlled dictionary is available, Word2Vec’s capacity to identify synonyms within a dataset can save researchers substan-tial time in search strategy development and dataset evaluation by first making apparent all of the ways that researchers describe ‘cli-mate change’ and find all of the studies that use the synonyms that are of interest. We created an open-to-use and standalone Synonyms Search tool for agricultural data using Word2Vec .
Surfacing indicators of quality Scientific comprehension is based on years of training to under-stand methodologies, statistical significance and a general ability to
place the knowledge in context of the broader field. It comes from the evaluation of thousands of scientific studies (and often, this knowledge is so specialized that it is non-transferable between dis-ciplines). In this respect, scientific articles are artefacts that embody norms that have been nurtured as part of closed, expert systems. The goal for the model is to detect some of these norms and make them apparent to the researcher. Evidence syntheses rely on studies with original data connected to a specific intervention. We trained the model to detect when measurement data was presented and could be connected to a specific intervention. For instance, the statement ‘the farmer used five polyethylene bags’ includes an intervention (polyethylene bags for storage) with a corresponding measurement (the number five), whereas the statement ‘it took us five months to get used to plastic bags for crop storage’ contains numerical data that does not correspond to an intervention or crop, because ‘five’ is related to a time period but does not describe measurements for the intervention, ‘plastic bags’.
We trained BERT to detect when numerical data had a relation-ship to narrow classes from the intervention ontology and to label a citation with ‘measurements for intervention’. The training dataset and test dataset consisted of 5,100 and 250 examples, respectively. A single example consists of a sentence, an intervention from the ontology and/or plant, animal product from the AGROVOC dic-tionary and numerical data from the sentence. When the model detects whether a numeric datum is connected with a particular concept in the context of a sentence, it labels the citation as contain-ing a ‘measurement with intervention’ (Fig. 1 ).
Lastly, we trained the model to identify study design types. Agriculture has very few random-control trial studies and lacks a standard taxonomy about its other types of studies, such as labora-tory study or controlled field experiment. We used SciBERT, which has been pre-trained on scientific articles, to identify and label study design types 35 . The Supplementary Information contains a
Marsabit
Turkana
West Pokot
BaringoBungomaBusia
SiayaHoma Bay
MigoriNarok
KisumuKakamega
Nakuru
Laikipia
Kajiado
KiambuMachakos
Makueni
Meru
Samburu Isiolo
Kitui
Mandera
Wajir
Garissa
Tana River
Taita Taveta
Kwale
Kilifi
0–10
10–25
25–50
50–100
100–200
200–500
Ecosystem interventions
Forestry 12,501Water conservation 10,200
Agroforestry 7,800Greenhouse gas 7,700
Carbon sequestration 4,200Natural resource management 3,200
Biodiversity conservation 3,000Ecosystem services 2,900
Socioeconomic interventionsFood security 6,800Value chain 4,900
Extension services 4,000Agribusiness 3,300Land tenure 2,200
Agricultural policies 1,900Certification schemes 1,500
Technology interventionsIrrigation 10,004Fertilizer 9,000
Cropping systems 7,000Grazing 5,000
Pest management 5,000Soil fertility 3,000
Tillage 1,200
a b
Fig. 2 | Agricultural interventions ontology. This shows how we model interventions at the country level. a , Technology, socioeconomic, ecosystem interventions detected for provinces across Kenya. The legend indicates the unique count of articles across all intervention types per province, providing a sense of where more or less research has been done. b , Seven narrow classes (for example, specific interventions) per each broad class of socioeconomic, technology and ecosystem in Kenya, and a unique count of articles per narrow class.
NATURE MACHINE INTELLIGENCE | VOL 2 | OCTOBER 2020 | 559–565 | www.nature.com/natmachintell562

| 68 Sustainable solutions to end hunger
PersPectiveNature MachiNe iNtelligeNce
consolidated table of all F1 measures and confusion matrices for the machine learning tasks. Figure 3 shows how all of the process pieces came together, from aggregation of data to algorithms and creation of labels, to create Persephone.
The Ceres2030 research teams reported that labelling the cita-tions with population, geographies, topics, and plant and animal types were the most useful labels to cull their datasets during title and abstract screening (Fig. 4). Six teams achieved rapid progress of screening during an in-person workshop: a 50% reduction of cita-tions in just three days. Two teams used alternative processes and are not noted here as part of the results. Five of the six teams requested additional processing, such as coding their results for environ-mental outcomes or gender, and submitted their manuscripts for peer review 90–120 days ahead of those that did not use the MLM approach. In the end, there is no obvious correlation between the extent of MLM involvement and quality of the evidence syntheses. These are available from refs. 36–43.
FindingsWe conducted an ex-post comparison of the studies selected by expert researchers to support their evidence synthesis to the model’s capacity to select the same studies. We found using just two of the variables—population and measurements with intervention labels—capture a relevant dataset that includes the titles eventually selected by the expert researchers with 90% accuracy and at the same time reduce the original dataset by 40% (Fig. 5).
For similarly heterogeneous datasets, we anticipate that a simi-larly trained intervention ontology would produce similar patterns thus saving researchers’ time and effort prior to any human screen-ing taking place.
We were interested in the rate of attrition between the initial Ceres2030 dataset containing nearly 110,000 studies to the final dataset of less than 2,500 studies. We conducted a review of 20 other evidence synthesis in agriculture published between 2011 and 2018. For any evidence synthesis, about 2% of published, accessible lit-erature is selected to support the original question. This trend is consistent independent of the size of the original dataset. While it might be tempting to sensationalize this kind of figure, we urge cau-tion. The evidence base is composed of millions of articles, and 2% of this base is still thousands of high-quality articles.
For us, the more practical response is not to look at the haystacks of research before us and conclude ‘there are no needles’, but rather to focus on developing the tools we need to make short work of the hay and present a stack of needles. We need tools to quickly get us to this 2%. There are few approaches other than human expertise that can as yet determine high-quality from low-quality studies. While there is certainly a need for more investment in high-powered studies of the right populations that can generate cross-comparable results in agriculture, there is also a need for more automated approaches to evaluate the evidence base that we have before us44.
Computational approaches to support policy-driven research are lagging behind the questions that need to be answered. Without additional investments to spur transformative change in this sector,
COMPUTER MODEL
NORMALIZATION+DEDUPLICATION
Support Vector Machines (SVM)-KNN-Sto-chastic Gradient Boosting Machines
Keyword + specializeddictionaries
Word2Vec + CBOW
Bidirectional Encoder Representationsfrom Transformers (BERT)
SCIENCEDATABASES
GREYLITERATURE
EVIDENCESYNTHESIS
Topics
Study design type
Intervention classes(Broad|Middle|Narrow)
Geographies
Plant and animal types
Outcomes
Population
Measurements for interventions and plants
AGRICULTURAL DATA INGESTION ENRICHMENT ANALYTICS ANALYSIS
Fig. 3 | Persephone. This is a process illustration. Using ‘agricultural data’, we process unstructured text (usually summaries, but not always) through ‘ingestion’ where we check for duplicates and character oddities prior to ‘enrichment’ where we apply some of the listed algorithms and models in order to achieve various ‘analytics’ including but not limited to interventions, geographies, plants and animal types, outcomes, population, topics, study design type and measurements with interventions, that contributes to ‘analysis’ which can accelerate an evidence synthesis.
Nature MachiNe iNtelligeNce | VOL 2 | OcTOber 2020 | 559–565 | www.nature.com/natmachintell 563

|Sustainable solutions to end hunger 69
PersPective Nature MachiNe iNtelligeNce
we will continue to waste millions of research hours and dol-lars on the same set of repeatable screening steps in the pursuit of high-quality evidence.
There are many criticisms of evidence synthesis to acknowledge10,45. Evidence synthesis can over-promote smaller-than-statistically significant findings, and their recom-mendations may be difficult to implement1. They typically exclude undocumented information, and exclusion of grey literature has been linked to exaggerated estimates of intervention effectiveness21. This is of particular concern in agriculture, where unpublished findings from stakeholders are an important source of evidence46.
The value of evidence synthesis as a diagnostic to reduce confirmation bias—the tendency of people to interpret new infor-mation that supports existing beliefs or theories, consequently ignoring or disregarding information that may contradict previous knowledge and experiences—extends beyond the conclusions of the synthesis itself47. Selecting information that reinforces exist-ing preferences is heightened when we are presented with enor-mous amounts of information48. At the same time, a double-blind evaluation of thousands of documents with inclusion and exclusion criteria documented as part of an a priori protocol reduces the like-lihood of cherry-picking research that does not support the original study aims.
MLMs are effective in reducing the vast amounts of human effort ordinarily expended in the creation of an evidence synthe-sis. Investment in new tools does not always require cutting-edge technology, or untested novelties. Computer algorithms already exist to handle classification tasks with speed and accuracy49. Simple analytics, applied intelligently using the available data, can be highly effective.
Received: 9 March 2020; Accepted: 9 September 2020; Published online: 12 October 2020
References 1. Ioannidis, J. P. A. The mass production of redundant, misleading,
and conflicted systematic reviews and meta-analyses: mass productionof systematic reviews and meta-analyses. Milbank Q. 94, 485–514 (2016).
2. Masaki, T., Custer, S., Eskenazi, A., Stern, A. & Latourell, R. Decoding DataUse: How Do Leaders Use Data and Use it to Accelerate Development (AidData, 2017).
3. Cairney, P. & Oliver, K. How should academics engage in policymaking toachieve impact? Polit. Stud. Rev. 18, 228–244 (2020).
4. Bornmann, L. & Mutz, R. Growth rates of modern science: a bibliometricanalysis based on the number of publications and cited references.J. Assoc. Inf. Sci. Technol. 66, 2215–2222 (2015).
5. Head, B. W. Reconsidering evidence-based policy: key issues and challenges.Policy Soc. 29, 77–94 (2010).
6. Littell, J. H. Conceptual and practical classification of research reviews andother evidence synthesis products. Campbell Syst. Rev. 14, 1–21 (2018).
7. Gurevitch, J., Koricheva, J., Nakagawa, S. & Stewart, G. Meta-analysis and thescience of research synthesis. Nature 555, 175–182 (2018).
8. Parker, T. H. et al. Transparency in ecology and evolution: real problems,real solutions. Trends Ecol. Evol. 31, 711–719 (2016).
9. Haddaway, N. R. & Westgate, M. J. Predicting the time needed forenvironmental systematic reviews and systematic maps. Conserv. Biol. 33, 434–443 (2019).
10. Chalmers, I. et al. How to increase value and reduce waste when researchpriorities are set. Lancet 383, 156–165 (2014).
11. Lau, J. Editorial: systematic review automation thematic series. Syst. Rev. 8, 70 (2019).
12. Çano, E. & Morisio, M. Hybrid recommender systems: a systematic literaturereview. Intell. Data Anal. 21, 1487–1524 (2017).
13. Howard, B. E. et al. SWIFT-Review: a text-mining workbench for systematicreview. Syst. Rev. 5, 87 (2016).
14. Marshall, I. J. & Wallace, B. C. Toward systematic review automation:a practical guide to using machine learning tools in research synthesis.Syst. Rev. 8, 163 (2019).
15. Espey, J. Using evidence & data to drive action on the SDGs. SDSNhttp://unsdsn.org/news/2018/06/28/using-evidence-data-to-drive-action- on-the-sdgs/ (2018).
16. Moher, D., Liberati, A., Tetzlaff, J. & Altman, D. G. Preferred reporting itemsfor systematic reviews and meta-analyses: the PRISMA statement. PLoS Med. 339, b2535 (2009).
17. Caliskan, A., Bryson, J. J. & Narayanan, A. Semantics derived automaticallyfrom language corpora contain human-like biases. Science 356, 183–186 (2017).
18. Rethlefsen, M. L., Farrell, A. M., Osterhaus Trzasko, L. C. & Brigham, T. J.Librarian co-authors correlated with higher quality reported search strategiesin general internal medicine systematic reviews. J. Clin. Epidemiol. 68, 617–626 (2015).
19. Fagan, J. C. An evidence-based review of academic web search engines,2014–2016: implications for librarians’ practice and research agenda.Inf. Technol. Libr. 36, 7–47 (2017).
0
5,000
10,000
15,000
20,000
25,000
Team A Team B Team C Team D Team E Team F Team G
Num
ber o
f arti
cles
MLMs reduce screening task workloads for researchers
Initial dataset size Dataset size after 3 days
Fig. 4 | MLMs reduce screening time for researchers. This shows the change in dataset size based on an evaluation of three days of work across seven teams (A–G). Datasets are determined by the number of article citations under review by each team. The combination of machine-learning analytics and teamwork helped to achieve each team achieve at least a 50% reduction in dataset size. Teams C, E and F requested additional processing of their data and as can be seen had the most dramatic decreases, approximately 70%.
600
500
400
300
200
100
Comparison of human versus machine-selected studies
Studies selected by experts Studies selected by machine
0 1 2 3 4 5 6 7 8
Eight research teams of Ceres2030
Num
bers
of a
rticl
es in
the
data
base
s
Fig. 5 | Comparison of human versus machine-selected studies. This shows the model’s capacity to detect a dataset that will include the same articles as those eventually selected by the expert researchers using only two of the variables, population and measurements with intervention labels. The accuracy rate of the model to do this work is on average 90%.
Nature MachiNe iNtelligeNce | VOL 2 | OCTObEr 2020 | 559–565 | www.nature.com/natmachintell564
| 70 Sustainable solutions to end hunger
PersPectiveNature MachiNe iNtelligeNce
20. Davidson, B. Storytelling and evidence-based policy: lessons from the greyliterature. Palgrave Commun. 3, 17093 (2017).
21. McAuley, L., Pham, B., Tugwell, P. & Moher, D. Does the inclusion of greyliterature influence estimates of intervention effectiveness reported inmeta-analyses? Lancet 356, 1228–1231 (2000).
22. Mikolov, T., Chen, K., Corrado, G. & Dean, J. Efficient estimation of wordrepresentations in vector space. https://arxiv.org/abs/1301.3781 (2013).
23. Yano, T. & Kang, M. Taking advantage of Wikipedia in natural languageprocessing. http://www.cs.cmu.edu/~taey/pub/wiki.pdf (2008).
24. Sharma, Y., Agrawal, G., Jain, P. & Kumar, T. Vector representation of wordsfor sentiment analysis using GloVe. In 2017 Int. Conf. IntelligentCommunication and Computational Techniques 279–284 (ICCT, 2017).
25. Hearst, M. A. Automatic acquisition of hyponyms from large text corpora.In Proc. 14th Conf. Computational Linguistics Vol. 2 539–545 (Associationfor Computational Linguistics, 1992).
26. Pavlidis, P., Wapinski, I. & Noble, W. S. Support vector machine classificationon the web. Bioinformatics 20, 586–587 (2004).
27. Veena, G., Gupta, D., Daniel, A. N. & Roshny, S. A learning methodfor coreference resolution using semantic role labeling features. In 2017 Int.Conf. Advances in Computing, Communications and Informatics 67–72(ICACCI, 2017).
28. Paulavets, M. E., Porciello, J., Kiryllau, Y. I. & Einarson, S. A taxonomycreation for agriculture using classical machine learning algorithms.Big Data Adv. Anal. 5, 45–50 (2019).
29. Lewis, D. P., Jebara, T. & Noble, W. S. Support vector machine learning fromheterogeneous data: an empirical analysis using protein sequence andstructure. Bioinformatics 22, 2753–2760 (2006).
30. Bojanowski, P., Grave, E., Joulin, A. & Mikolov, T. Enriching word vectorswith subword information. Trans. Assoc. Comput. Linguist. 5, 135–146 (2017).
31. Joshi, M., Agarwal, R. C. & Kumar, V. Predicting rare classes: can boostingmake any weak learner strong? In Proc. Eighth ACM SIGKDD Int. Conf.Knowledge Discovery and Data Mining 297–306 (ACM, 2002).
32. Devlin, J., Chang, M.-W., Lee, K. & Toutanova, K. BERT: pre-training of deepbidirectional transformers for language understanding. https://arxiv.org/abs/ 1810.04805 (2018).
33. Willett, J., Baldwin, T., Martinez, D. & Webb, A. Classification of study regionin environmental science abstracts. In Proc. Australasian Language TechnologyAssociation Workshop 118–122 (ALTA, 2012).
34. Kaushik, N. & Chatterjee, N. Automatic relationship extraction fromagricultural text for ontology construction. Inf. Process. Agric. 5, 60–73 (2018).
35. Beltagy, I., Lo, K. & Cohan, A. SciBERT: a pretrained language model forscientific text. https://arxiv.org/abs/1903.10676 (2019).
36. Acevedo, M. et al. A scoping review of adoption of climate-resilient crops bysmall-scale producers in low- and middle-income countries. Nat. Plantshttps://doi.org/10.1038/s41477-020-00783-z (2020).
37. Baltenwick, I. et al. A scoping review of feed interventions and livelihoods ofsmall-scale livestock keepers. Nat. Plants https://doi.org/10.1038/s41477-020-00786-w (2020).
38. Stathers, T. et al. A scoping review of interventions for crop postharvest lossreduction in sub-Saharan Africa and South Asia. Nat. Sustain. https://doi.org/10.1038/s41893-020-00622-1 (2020).
39. Liverpool-Tasie, L. S. O. et al. A scoping review of market links betweenvalue chain actors and small-scale producers in developing regions.Nat. Sustain. https://doi.org/10.1038/s41893-020-00621-2 (2020).
40. Ricciardi, V. et al. A scoping review of research funding for small-scalefarmers in water scarce regions. Nat. Sustain. https://doi.org/10.1038/s41893-020-00623-0 (2020).
41. Piñeiro, V. et al. A scoping review on incentives for adoption of sustainableagricultural practices and their outcomes. Nat. Sustain. https://doi.org/10.1038/s41893-020-00617-y (2020).
42. Bizikova, L. et al. A scoping review of the contributions of farmers’organizations to smallholder agriculture. Nat. Food https://doi.org/10.1038/s43016-020-00164-x (2020).
43. Maïga, W. H. E. et al. A systematic review of youth skills trainingprogrammes in agriculture in low- and middle-income countries. Nat. Food https://doi.org/10.1038/s43016-020-00172-x (2020).
44. Webb, P. & Kennedy, E. Impacts of agriculture on nutrition: nature of theevidence and research gaps. Food Nutr. Bull. 35, 126–132 (2014).
45. Yuan, Y. & Hunt, R. H. Systematic reviews: the good, the bad, and the ugly.Am. J. Gastroenterol. 104, 1086–1092 (2009).
46. Haddaway, N. R. et al. A framework for stakeholder engagement duringsystematic reviews and maps in environmental management. Environ. Evid. 6, 11 (2017).
47. Arnott, D. Cognitive biases and decision support systems development:a design science approach. Inf. Syst. J. 16, 55–78 (2006).
48. Minas, R. K. & Crosby, M. E. In Foundations of Augmented Cognition:Neuroergonomics and Operational Neuroscience (eds Schmorrow, D. D.& Fidopiastis, C. M.) 242–252 (Springer, 2016).
49. Gil, Y., Greaves, M., Hendler, J. & Hirsh, H. Amplify scientific discovery withartificial intelligence. Science 346, 171–172 (2014).
AcknowledgementsWe gratefully acknowledge the funding of this research was provided by the Federal Ministry of Economic Cooperation (BMZ Germany) and the Bill and Melinda Gates OPP1210352 for the project Ceres2030: Sustainable Solutions to End Hunger. Thank you to Wences Almazan for the artful reproductions of Persephone, and a very heartfelt thank you to all of collaborators and partners who participated in Ceres2030.
Author contributionsJ.P. designed the approach, managed the project and contributed to some of the programming. M.Ivanina performed most of the programming. M.Islam performed most of the automation and retrieval for grey literature. S.E. assisted with automation and technical infrastructure. H.H. consulted on machine-learning models. J.P. wrote the paper with contributions from M.Ivanina.
Competing interestsThe authors declare no competing interests.
Additional informationSupplementary information is available for this paper at https://doi.org/10.1038/s42256-020-00235-5.
Correspondence should be addressed to J.P.
Reprints and permissions information is available at www.nature.com/reprints.
Publisher’s note Springer Nature remains neutral with regard to jurisdictional claims in published maps and institutional affiliations.
© Springer Nature Limited 2020
Nature MachiNe iNtelligeNce | VOL 2 | OctOber 2020 | 559–565 | www.nature.com/natmachintell 565

Sustainable solutions to end hunger | 71
PersPectivehttps://doi.org/10.1038/s41477-020-00792-y
1Department of Global Development, College of Agriculture and Life Sciences, Cornell University, Ithaca, NY, USA. 2Department of Ecology, Evolution, and Environmental Biology (E3B), Columbia University, New York, NY, USA. 3Lead, Monitoring and Governance, Tracking Progress Program, International Institute for Sustainable Development, Winnipeg, Manitoba, Canada. ✉e-mail: [email protected]
The targets of Sustainable Development Goal (SDG) 2 call upon the global community to eradicate hunger and malnutrition, and to double the productivity and incomes of small-scale
agricultural producers while achieving sustainable agriculture and maintaining agricultural genetic diversity by 2030 (ref. 1). Reaching these ambitious goals requires increased and more effectively tar-geted investments, which demands the right kind of evidence and the capacity and means to use it.
A complex evidence baseThe complexity of SDG 2, which incorporates vastly different, but closely interacting objectives, makes realizing its goals chal-lenging (Box 1; ref. 1). SDG 2 calls for a fundamental reshaping of food systems and gives a major role to small-scale agricultural producers. Food systems are characterized by multiple interactions between food production, processing, distribution and consump-tion. Interventions in one part of the food system are linked directly or indirectly to other parts2. For example, interventions to increase the productivity and incomes of small-scale food producers (SDG 2.3) will also affect the sustainability of the production, the food consumption patterns and the ability to achieve SDGs 2.2 and 2.4.
To fulfil the multiple targets of SDG 2, we must consider both the positive and negative interactions that may occur between dif-ferent segments of the food system. There exists a broad consensus on the value of using evidence to guide investments, as well as the need to take a systematic view of the food system in making inter-ventions, but the evidence base we currently have consists mostly of analyses considering only one or perhaps two dimensions of food system impact. We may find evidence of how effective the introduc-tion of improved crop varieties has been at increasing productivity of small-scale food producers, but there is no consideration of how the adoption of these new varieties affected the food consumption patterns and nutritional status of these producers. How to effec-tively use unidimensional pieces of evidence to guide investments in a multidimensional system is thus a key issue.
Evidence-guided intervention within the complexity of the food system requires an understanding of how the food system is conceptualized and of the assumptions that underpin data analy-ses. Such analyses cannot be separated from the narratives which frame the perceived problems and their possible solutions3. If failing to feed the growing global population is seen as the main threat then closing yield gaps will be the priority, with a strong focus on agricultural interventions to raise yields. But if the main threat is the inability of the current system to deliver nutritious food for healthy diets, closing the nutrition gap by focusing atten-tion on making nutritious sources of food widely accessible should be the priority. There has also been much discussion about the urgency of reducing agriculture’s threat to the environment and its contribution to climate change, which then prioritizes land- and resource-use efficiency4,5.
The numerous targets of SDG 2 testify to the multiple narratives and assumptions that have led to their develop-ment. Whilst representing the inputs, views and priorities of a broad group of stakeholders, it makes using evidence in this context problematic.
Take the case of SDG 2.3. Underlying this target is the assump-tion that increasing the productivity of the most marginalized agri-cultural groups by increasing their access to means of production and markets is key to increasing their incomes and reducing ineq-uity. This differs from narratives focusing on the need to close yield gaps to maintain global food supplies, where the means of increas-ing productivity do not necessarily involve small-scale producers. Using evidence based on the yield-gap narrative to inform strategies for achieving SDG 2.3 requires interpretation of its relevance and feasibility for small-scale producers.
The effective use of evidence to support SDG 2 requires consid-eration of sources based on varying narratives and their interac-tions. Colliding assumptions can create evidence ‘blind spots’ which will lead to very poor decision making. In these situations, tools to improve the use of evidence are needed.
Shedding light on the evidence blind spots confounding the multiple objectives of SDG 2Leslie Lipper 1 ✉, Ruth DeFries2 and Livia Bizikova3
Sustainable Development Goal (SDG) 2 consists of five targets ranging from the eradication of hunger and malnutrition to dou-bling productivity of small-scale farmers and ensuring sustainable and resilient food production systems. Trade-offs and syner-gies arise between strategies to achieve any one of these targets, which complicates the use of evidence to guide policies and investments since most analyses focus solely on one objective. This gives rise to ‘blind spots’ in the evidence base, where acting to achieve one objective can have strong impacts on achieving others, hampering attempts to establish a systematic approach to attaining the multiple objectives of SDG 2. Here, we focus on three key blind spots that arise from potential interactions between increasing agricultural productivity and enhancing the sustainability of food production systems, eradicating hunger and malnutrition, and increasing the resilience of food production systems to climate change. Incorporating the consideration of synergies and trade-offs into policy-making is also essential; however, there is relatively little evidence of this occurring in national policies to date.
Nature PlaNts | VOL 6 | OctOber 2020 | 1203–1210 | www.nature.com/natureplants 1203

72 | Sustainable solutions to end hunger
PersPective Nature PlaNts
Agricultural productivity growth often conflicts with sustainabilityPerhaps the most contentious blind spot forms at the intersection of environmental outcomes and increases in productivity. Agricultural productivity increases have frequently entailed environmental dam-age, and so using evidence on productivity increases requires some interpretation of the implications for “ensuring sustainable food production systems...” (SDG 2.4; ref. 1).
Historically, increasing agricultural productivity has often had significant negative impacts on ecosystems and the services they provide to farmers and broader communities. In simple terms, the negative environmental impacts can be largely attributed to the overuse of agricultural inputs such as nitrogen fertilizer and pesti-cides, production practices that deplete and degrade soil and water, a move towards homogenization of production systems with an associated loss of biodiversity within and around agriculture, and land-use changes to facilitate agricultural expansion4,6–9.
All of these factors have also been associated with increases in agricultural productivity—albeit in differing configurations and with varying environmental and productivity impacts depending on the region from which the data were collected7–9. The complexity of interactions between productivity increases and environmental implications can create many situations where no relevant evidence exists to prioritize actions for increasing agricultural productivity while enhancing agricultural sustainability (that is, simultaneously achieving SDGs 2.3 and 2.4). This hardly means we should ignore our entire evidence base on agricultural productivity increases, but rather it requires some active interpretation of what the evidence shows—and what it does not.
One key indicator of productivity and environmental impact is the efficiency with which inputs are applied in agricultural sys-tems (that is, the relationship between input use and agricultural output). This relationship is commonly measured by total factor
productivity (TFP) and gives an indication of the degree to which inputs reach their intended target and generate productivity growth, rather than being lost to the environment and causing ecosystem damage. Productivity growth driven by increases in TFP can result in a reduction of agricultural input use while maintaining and aug-menting output growth. While standard measures of TFP growth in agriculture do not explicitly include environmental impacts, it is considered to be associated with better environmental outcomes compared with other potential sources of productivity growth, such as the expansion of land area or increased input use10–12.
The good news is that since 1990, TFP has been the major driver of agricultural productivity growth globally; there has recently been rapid growth in this measure in some developing countries, although the levels are considerably lower than developed coun-tries13. The growth in TFP is attributed to investments in agricul-tural research and development, policy reforms that reduced market distortions, and innovations developed and disseminated by inter-national agricultural research centres13.
An example of relevant evidence comes from Cui et al.14, who describe a project aimed at increasing the efficiency of agricul-tural input use involving 20.9 million smallholder producers in China, where inputs are often overused. The project was built upon detailed analyses of how factors such as irrigation, plant density and sowing depth affected agricultural productivity across different localities, using the information to guide and spread best practices across several regions. They achieved major increases in input-use efficiency while also enhancing productivity: maize, rice and wheat output grew by 11% over that decade, whereas the use of damaging and expensive fertilizers decreased by 15–18% depending on the crop14.
In addition to technology, the role of ecosystem services is becoming increasingly recognized as an important factor in pro-ductivity growth and in TFP in particular. Coomes et al.10 assessed the possible interactions between TFP growth, agricultural sus-tainability and resilience of the agricultural system, and found that while most frequently there were synergies between the two fac-tors, there were also possible trade-offs depending on local circum-stances. They also noted that data to measure these interactions are generally lacking.
Evidence on the relationship between ecosystem services and agricultural productivity has recently received greater atten-tion, and the analyses provide new insights into the interactions between productivity growth and the sustainability and resilience of agriculture15. Tilman16 summarizes the body of work resulting from the efforts of hundreds of ecologists worldwide, concluding that biodiversity is a surprisingly strong determinant of productiv-ity and agriculture and ecosystem functioning. Greater plant bio-diversity was associated with higher levels of ecosystem stability, agricultural productivity, more complete use of limiting resources, lower disease incidence, less invasion by exotic and competing species, and thus low densities of herbivorous insects16. Renard and Tilman17 reported robust—albeit correlational—support for the hypothesis that greater effective national crop diversity leads to greater year-to-year stability of national yields. Power summa-rizes the literature on ecosystem services that support agricultural functions, including biological pest control, pollination, soil fertil-ity and water quality and quantity18. The presence or lack of any of these services can be expected to affect productivity. For example, the loss of soil fertility through land degradation is estimated to have led to a 0.43% decline in agricultural productivity annually in the European Union19.
Evidence on productivity gains must be interpreted in the con-text of the source of growth and potential environmental impacts, while evidence on the sustainability and resilience of food produc-tion systems should be considered within the context of interactions with productivity growth.
Box 1 | SDG 2: Zero hunger
Targets:2.1: By 2030, end hunger and ensure access by all people, in
particular the poor and people in vulnerable situations, including infants, to safe, nutritious and sufficient food all year round.
2.2: By 2030, end all forms of malnutrition, including achieving, by 2025, the internationally agreed targets on stunting and wasting in children under 5 years of age, and address the nutritional needs of adolescent girls, pregnant and lactating women and older persons.
2.3: By 2030, double the agricultural productivity and incomes of small-scale food producers, in particular women, indigenous peoples, family farmers, pastoralists and fishers, including through secure and equal access to land, other productive resources and inputs, knowledge, financial services, markets and opportunities for value addition and non-farm employment.
2.4: By 2030, ensure sustainable food production systems and implement resilient agricultural practices that increase productivity and production, that help maintain ecosystems, that strengthen capacity for adaptation to climate change, extreme weather, drought, flooding and other disasters and that progressively improve land and soil quality.
2.5: By 2020, maintain the genetic diversity of seeds, cultivated plants and farmed and domesticated animals and their related wild species, including through soundly managed and diversified seed and plant banks at the national, regional and international levels, and promote access to and fair and equitable sharing of benefits arising from the utilization of genetic resources and associated traditional knowledge, as internationally agreed.
Nature PlaNts | VOL 6 | OctOber 2020 | 1203–1210 | www.nature.com/natureplants1204

Sustainable solutions to end hunger | 73
PersPectiveNature PlaNts
Increasing calories does not mean better nutrition. Global calorie production is currently more than sufficient for the world popu-lation, yet people in places such as sub-Saharan Africa (SSA) and South Asia still have a deficit. The Green Revolution resulted in significant increases in the yields of three major cereal crops (rice, wheat and maize) through the introduction of improved crop vari-eties together with the complementary agricultural inputs of irriga-tion, fertilizers and agricultural chemicals20. A major impact of the productivity increase was a decrease in the price of staple foods20,21. The growth of the supply and accessibility of staples resulted in a substantial increase in calorie consumption. It was also an impor-tant factor in reducing poverty since a large proportion of the income of the poor is spent on food20.
However, the impacts on a full range of nutritional outcomes—including micronutrients (minerals and vitamins)—is a more nuanced story. An often-cited statistic is that two billion people in the world suffer from deficiencies of micronutrients—a so-called ‘hidden hunger’ because its effects are less visible than chronic hun-ger, although accurate assessments are frustrated by the multiple types of deficiencies and lack of indicators. Taking hidden hunger into account, the nutritional gains associated with productivity increases stimulated by the Green Revolution have been uneven. In some areas and for some people (most often the poor), an over-all gain in calorie consumption was offset by a decline in dietary diversity and micronutrient consumption. One reason was the sub-stitution of nutrient-dense traditional foods with high-productivity staple crops20,22,23.
In low- and low-middle-income countries, cereals provide at least half the energy in the national food supply, more than 40% of protein and zinc, and 30% of iron. This indicates the impor-tant role of cereals in nutrition for people in low-income countries compared to high-income countries (Table 1). In terms of other micronutrients, cereals supply up to 13% and 27% of their calcium and folate intake, respectively, and essentially no vitamin B12, vitamin A or vitamin D.
The nutritional content of cereals in low-income countries thus takes on particular importance in seeking to achieve SDGs 2.1 and 2.2. With the dominance of Green Revolution cereals, the nutrient density of the cereal supply has declined24,25. To the extent that coun-tries produce rather than import cereals for domestic consumption, the nutritional content of cereals domestically produced could play a substantial role in combatting hidden hunger (Table 2).
The nutritional characteristics of the global food supply have even broader health implications through the impacts on obesity and non-communicable diseases linked to poor diet. Benton and Bailey26 state that productivity increases in energy-dense staples has vastly expanded the global calorie supply, which in turn has con-tributed to the growth in obesogenic processed foods as food manu-facturers have formulated products derived from these abundant, low-cost, high-calorie commodities. The same point is made in the 2019 EAT–Lancet report27.
A potential blind spot is created regarding the evidence on achieving productivity gains, as nutritional aspects are not
necessarily considered. Evidence on productivity gains need to be interpreted in light of the potential negative and positive impacts on nutrition, while evidence on how to improve nutritional outcomes should be evaluated in the context of potential impacts on agricul-tural productivity increases.
Increasing productivity can reduce resilience to climate changeClimate change is already having considerable impacts on produc-tivity, albeit with variability across crops and locations. Ray et al.28 estimate that for SSA, maize and sugarcane yields decreased by 5.8% and 3.9%, respectively, from 1974–2008. In contrast, they find that recent climate change caused yields to increase in the more heat- and drought-tolerant sorghum (a 0.7% increase) and cassava (a 1.7% increase). Globally, climate change is already reducing global grain yields of some cereals although overall production continues to increase5.
Climate change affects cereal production through multiple pathways: heat stress through increases in temperature; increased frequency of extreme weather events such as droughts and floods; reduced precipitation in some places and increases in others; changes in the length of the growing season; an increased spread of pests and disease with high temperatures; and fertilization effects from increasing atmospheric carbon dioxide5. At a very general level, results from integrated assessment models indicate strong negative effects of climate change for major cereals. Higher levels of warming are reported to affect cereal growth at all latitudes, but cereals grown at lower latitudes are particularly susceptible28. In contrast, coarse cereals have characteristics associated with higher resilience to climate change (Table 3).
The degree of uncertainty on future impacts of climate change is high, suggesting that prudent decisions about prioritization for breeding and dissemination of cereal crops need to be supported with evidence on both the potential productivity increases and the adaptability and resilience of crops to varying conditions29,30. Existing genetic variability across cereals provides an opportunity to develop adaptable cultivars (see Reynolds et al.31 for important traits of different cereals and cultivars).
Tools and approaches to interpret evidenceThe key to achieving SDG 2 lies in intelligent and informed use of all available evidence. One way of dealing with potential blind spots like those we have discussed is to summarize relevant evidence from different sources and diverse narratives to obtain a picture of positive and negative interactions between the targets of SDG 2. For example, Table 3 summarizes evidence relating to the productivity, resilience and nutritional characteristics of Green Revolution cere-als versus coarse cereals.
Tools to support decision making that use information gleaned from reviews and evidence syntheses are an important means of interpreting underlying interactions. Models are widely used to support decision making and there are already a number available that incorporate a large range of different scales, parameters and assumptions. Economic models, and specifically models that gen-erate information about costs and benefits of interventions across different objectives, are an important class of model to use when looking at trade-offs32,33.
Ceres2030 is developing a model to measure the costs of achiev-ing the multiple targets of SDG 2 and incorporate some relevant key trade-offs. This model captures the impacts on key dimensions of environmental sustainability necessary to achieve SDG 2.4, together with indicators of economic and social sustainability that relate to achieving the targets of SDGs 2.1 and 2.3. The model can generate estimates of potential trade-offs that arise in specific interventions between increasing productivity and farm incomes, and environ-mental impacts on water use and greenhouse gas emissions. The
table 1 | Average proportion of macro and micro nutrients from cereals in the total food supply of countries by income category
Income category Number of countries
Energy Protein Iron Zinc
Low 36 0.55 0.50 0.36 0.53
Lower-middle 46 0.49 0.43 0.30 0.42
Upper-middle 40 0.40 0.32 0.23 0.30
High 45 0.31 0.22 0.18 0.18
Estimates are based on calculations following methods in Wood et al.41.
Nature PlaNts | VOL 6 | OctOber 2020 | 1203–1210 | www.nature.com/natureplants 1205

74 | Sustainable solutions to end hunger
PersPective Nature PlaNts
model provides one route to combining results from evidence reviews across a range of objectives and allows for the analysis of how they may interact under varying types of interventions and scenarios.
Of course, models have their own shortcomings and assump-tions that must be considered when interpreting their results. The fairly wide range of models available differ in terms of their main focus, the types of interactions they allow and those they assume to be constant, and the degree to which they build upon existing evidence. For example, Sridaran et al.34 summarized the scale and nature of interactions between agriculture, climate, energy, land and water use across a set of 30 integrated assessment models, indicating considerable differences in the interactions they cover. Models esti-mating the costs of ending hunger have shown a wide range of val-ues: from US$11 billion additional resources per year to end hunger by 2030 (ref. 35) to over US$265 billion by 2025 aiming to achieve both SDG1 and SDG 2 (refs. 36,37). These models vary in the factors they include and the interactions they can capture.
Another way to shed light onto blind spots is to develop and use metrics that embody information about synergies and trade-offs
across multiple dimensions. For example, a ‘nutritional yield’ metric can provide information about the nutritional impacts of increases in cereal productivity25. Nutritional yield combines the nutritional content of each nutrient (such as iron and zinc) and computes yields in terms of nutrients per hectare and weight according to the daily recommended dietary intake, to allow for comparisons across nutri-ents. The nutrient yield for iron, for example, provides a measure of the number of adults who could receive a sufficient amount of iron from production on a hectare of land24. Another example is the proposal to improve TFP metrics by including the effects of eco-system services and the evidence base on sources of productivity growth10,38. The development and use of such metrics may be most useful in setting priorities at a national level.
National and local prioritiesUltimately, the success or failure of investments depends on the willingness and capacity of the countries and the people involved to participate and make changes in their behaviour. In the context of SDG 2 this ranges from the consumers of food to the producers,
table 2 | Nutrient content of two macronutrients, two micronutrients and the antinutrient phytate
Green Revolution cereals Coarse cereals
Brown rice Milled rice Whole wheat
Refined wheat
Maize Sorghum Pearl milleta Finger milletb
Content (per 100 g dry weight)
Energy (kcal) 354–357 356–370 320–332 352–364 334–365 329–334 348 320
Protein (g) 7.14–7.81 6.81–7.94 9.61–10.57 10.33–10.36 8.80–9.42 9.97–10.62 10.96 7.16
Iron (mg) 1.02–1.71 0.65–1.60 3.71–4.10 1.17–1.77 2.49–2.71 2.26–3.95 6.42 4.62
Zinc (mg) 1.682 1.20–1.21 2.85–2.96 0.70–0.88 2.21–2.27 1.67–1.96 2.76 2.53
Phytate (mg)b 742 266 632 123 646 549 485 306
Phytate/iron molar ratioc
45.99 20.02 13.69 7.08 21.02 12.71 6.39 5.60
Phytate/zinc molar ratioc
43.75 21.87 21.55 15.42 28.57 29.96 17.41 11.98
aThe USDA database does not distinguish between different millets. The values given for ‘millets’ are 378, 11.02, 3.01 and 1.68 for energy, protein, iron and zinc, respectively. Values in Table 2 are from Longvah et al.42. bPhytate for all cereals and zinc for brown rice are not reported in the USDA database. The values in the table are from Longvah et al.42. cMolar ratio is the molar weight of phytate divided my molar weight of iron or zinc. Molar masses of phytate, iron and zinc are 660.04, 55.85 and 65.39 g mol−1 respectively. Values used for iron and zinc are midpoints of the range in estimates. The critical thresholds are 1 and 15 for the phytate/iron and phytate/zinc ratios, respectively. The range is taken from two sources for nutrient content42,43.
table 3 | Relative benefits of cereals in multiple dimensions of production, nutrient content and climate resilience
Green Revolution cereals Coarse cereals
Milled rice Whole-wheat Maize Sorghum Millets
Production
Yield High High High Low Low
Biomass increase from CO2 increase High High Low Low Low
Nutrient content
Energy Mid Mid Mid Mid Mid
Protein Mid Mid Mid Mid Mid
Iron Low Mid Mid Mid High
Zinc Low High High Mid High
Phytatea Low High High Mid Mid
Sensitivity of nutrient loss from CO2 increasea High High Low Low Low
Climate resilience
Water-use efficiency Low Low High High High
Yield stability ? ? ? ? ?
See Wood41 for background on this assessment. Mid, middle. a‘Low’ is beneficial; ‘high’ is harmful.
Nature PlaNts | VOL 6 | OctOber 2020 | 1203–1210 | www.nature.com/natureplants1206
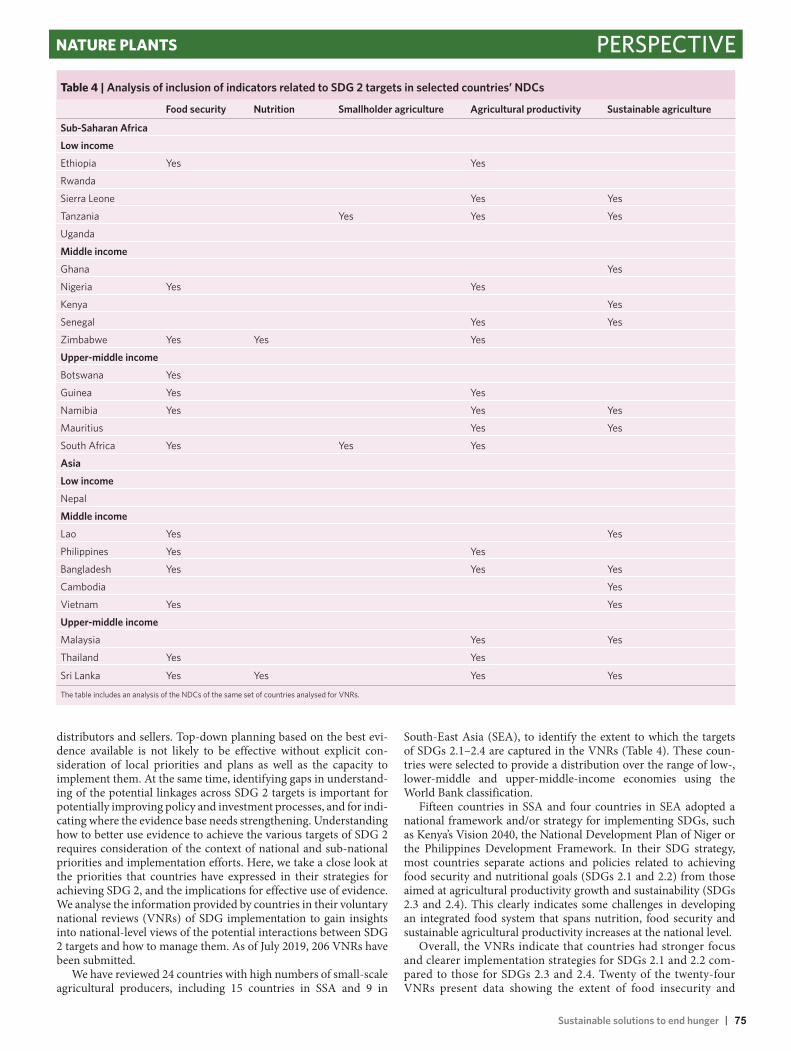
Sustainable solutions to end hunger | 75
PersPectiveNature PlaNts
distributors and sellers. Top-down planning based on the best evi-dence available is not likely to be effective without explicit con-sideration of local priorities and plans as well as the capacity to implement them. At the same time, identifying gaps in understand-ing of the potential linkages across SDG 2 targets is important for potentially improving policy and investment processes, and for indi-cating where the evidence base needs strengthening. Understanding how to better use evidence to achieve the various targets of SDG 2 requires consideration of the context of national and sub-national priorities and implementation efforts. Here, we take a close look at the priorities that countries have expressed in their strategies for achieving SDG 2, and the implications for effective use of evidence. We analyse the information provided by countries in their voluntary national reviews (VNRs) of SDG implementation to gain insights into national-level views of the potential interactions between SDG 2 targets and how to manage them. As of July 2019, 206 VNRs have been submitted.
We have reviewed 24 countries with high numbers of small-scale agricultural producers, including 15 countries in SSA and 9 in
South-East Asia (SEA), to identify the extent to which the targets of SDGs 2.1–2.4 are captured in the VNRs (Table 4). These coun-tries were selected to provide a distribution over the range of low-, lower-middle and upper-middle-income economies using the World Bank classification.
Fifteen countries in SSA and four countries in SEA adopted a national framework and/or strategy for implementing SDGs, such as Kenya’s Vision 2040, the National Development Plan of Niger or the Philippines Development Framework. In their SDG strategy, most countries separate actions and policies related to achieving food security and nutritional goals (SDGs 2.1 and 2.2) from those aimed at agricultural productivity growth and sustainability (SDGs 2.3 and 2.4). This clearly indicates some challenges in developing an integrated food system that spans nutrition, food security and sustainable agricultural productivity increases at the national level.
Overall, the VNRs indicate that countries had stronger focus and clearer implementation strategies for SDGs 2.1 and 2.2 com-pared to those for SDGs 2.3 and 2.4. Twenty of the twenty-four VNRs present data showing the extent of food insecurity and
table 4 | Analysis of inclusion of indicators related to SDG 2 targets in selected countries’ NDCs
Food security Nutrition Smallholder agriculture Agricultural productivity Sustainable agriculture
Sub-Saharan Africa
Low income
Ethiopia Yes Yes
Rwanda
Sierra Leone Yes Yes
Tanzania Yes Yes Yes
Uganda
Middle income
Ghana Yes
Nigeria Yes Yes
Kenya Yes
Senegal Yes Yes
Zimbabwe Yes Yes Yes
Upper-middle income
Botswana Yes
Guinea Yes Yes
Namibia Yes Yes Yes
Mauritius Yes Yes
South Africa Yes Yes Yes
Asia
Low income
Nepal
Middle income
Lao Yes Yes
Philippines Yes Yes
Bangladesh Yes Yes Yes
Cambodia Yes
Vietnam Yes Yes
Upper-middle income
Malaysia Yes Yes
Thailand Yes Yes
Sri Lanka Yes Yes Yes Yes
The table includes an analysis of the NDCs of the same set of countries analysed for VNRs.
Nature PlaNts | VOL 6 | OctOber 2020 | 1203–1210 | www.nature.com/natureplants 1207

76 | Sustainable solutions to end hunger
PersPective Nature PlaNts
prevalence of undernourishment in the country, and demon-strate a strong understanding of the key aspects of malnutrition in terms of wasting, stunting and being underweight, especially in children. In contrast, very few countries had any indicators or data on SDGs 2.3 and 2.4. A set of three indicators are still under development for these two targets (Tier II)39. Countries could present indicators and data in their VNRs indicating their interpretation of the targets, but most did not. The ones that did included: production of main food crops (Ethiopia); production of cereals and other food crops (Zimbabwe); percentage of small-holder producers in total producers (Senegal and Namibia); and labour productivity in agriculture (Laos and Malaysia). None of the countries presented data on the smallholder producers’ productivity and their incomes. For SDG 2.4, only five coun-tries listed potential indicators such as areas under conservation management (Tanzania and Ethiopia), amount of land under sustainable use (Nigeria and Senegal) and land under organic certification (Mauritius).
The degree of evidence in the VNRs about potential evidence blind spots caused by interactions between SDG 2 targets varies depending on which blind spot is considered.
Productivity increase versus sustainability and resilienceThe analysis of VNRs indicates that national policies on achieving SDGs 2.3 and 2.4 are still quite underdeveloped and that the poten-tial for interaction between the two is not evident in the strategies presented. Only three countries in SSA and three countries in SEA developed and/or updated their strategies on agriculture to address SDGs 2.3 and 2.4. Approaches focused on agriculture productivity were generally of a shorter term, concluding in 2019 or 2020. Only two (Thailand and Rwanda) have strategies that explicitly include aspects of environmental management.
Priorities listed by countries to achieve SDG 2.3 included increasing crop productivity—with some countries focusing more specifically on increasing the access of small-scale producers to agricultural inputs and extension—and agricultural land consoli-dation. Most countries emphasize the importance of increasing the engagement of the private sector in value chains, in investments to reduce post-harvest loss, in agricultural development and in promoting agribusiness to sustain agriculture growth in the next years (Zimbabwe, Rwanda, Senegal and Kenya). Most did not list priorities for SDG 2.4, with the only examples including improving irrigation and erosion control (Ethiopia, Nepal and Tanzania) and promoting organic agriculture (Mauritius).
This rudimentary analysis indicates that the potential interac-tions between sustainability and productivity objectives are not well recognized at the national policy level, which presents an important opportunity to work with countries in building an understanding and capacity for identifying potential interactions between produc-tivity growth in the small-scale agricultural sector and the sustain-ability and resilience of agricultural production systems in their specific national context.
Nutrition versus productivityMost VNRs have indicators for SDGs 2.1 and 2.2 which are related to nutrition, but these are not linked to the indicators or strategies for SDG 2.3 on productivity. Eradicating hunger and malnutrition seem completely divorced from issues of agricultural productivity increases, but poor farmers and farm-dependent populations fre-quently suffer from food insecurity and poor nutrition.
The analysis of the VNRs indicates a lack of understanding of the potential linkages between diversity in agricultural production and dietary diversity and nutritional outcomes. This implies that countries are missing the potential for capturing syn-ergies between productivity and nutritional outcomes in their policy frameworks.
Productivity increase versus resilienceInteraction with climate change objectives, including both adap-tation and mitigation, feature very prominently in the countries’ VNRs. Twenty-two countries reported that impacts of climate change that manifest in the form of droughts, agricultural pest incidence and extreme weather can all affect the achievement of SDGs 2.3 and 2.4. Fourteen countries stated that climate change will impact their abilities to achieve SDGs 2.1 and 2.2 through impacts on the agriculture and on other economic sectors in both rural and urban areas, such as coastal communities.
Analysis of another national strategy document—the Nationally Determined Contribution (NDC) to the Paris Agreement under the United Nations Framework Convention on Climate Change (available from the NDC registry40)—gives an even clearer pic-ture of the strong interaction countries perceive between climate change and achieving the targets of SDG 2 (particularly SDGs 2.3 and 2.4). In their NDCs, more than 60% of the countries call for using climate-smart agricultural practices to increase productiv-ity. There is also a high level of awareness of the environmental impacts of agricultural practices. Over 50% of the countries men-tion the importance of promoting sustainable and resilient agricul-tural practices that support environmental conservation. The NDCs report that 54% of the countries mention the role of food security in responding to climate change, which mostly focusses on the need for avoiding negative impacts on food security in the design of mitigation and adaptation measures. However, explicit linkages between climate change and nutrition were not considered impor-tant, with only two countries mentioning it. Small-scale producers were not prominent in the NDCs and were also only mentioned by two countries.
The analysis indicates a fairly broad awareness of the interac-tions between climate change and productivity growth, as well as sustainable agriculture. That such an awareness exists in this case, but not in the previous two, may be related to our analysis of man-aging interactions using modelling and indicators. There has been a huge effort to model climate change impacts on agricultural pro-ductivity and (more recently) on resilience of agricultural systems, which may be one reason for enhanced awareness. Also, indica-tors of agricultural productivity are closely linked to one mea-sure of the resilience of agricultural systems—that is, the level of productivity over time and in the wake of extreme events. Finally, the greater awareness of climate change impacts on agricultural productivity and sustainability may simply be due to the fact that these effects are already being experienced and are highly visible, which is not the case with other blind spots where the sustainabil-ity and nutritional impacts of agricultural productivity increases are less immediately obvious.
ConclusionAchieving the multiple targets of SDG 2 by 2030 is a huge chal-lenge that requires robust and effective investments. Synthesizing and utilizing evidence to help guide investment strategies is a key tool in this endeavour. However, intelligent use of this evidence base requires careful consideration of the assumptions the evidence is built upon and the possible blind spots these create. The potential for positive or negative interactions between strategies to achieve any one of the SDG 2 targets is a fundamental source of uncertainty. Since most of the evidence we have focusses on strategies to achieve only one objective, it is easy to overlook the full implications across all SDG 2 targets.
We have identified three major blind spots in the evidence base relevant to achieving the multiple targets of SDG 2. The first is in the interaction between productivity growth (SDG 2.3) and achiev-ing sustainable food production systems (SDG 2.4). Overcoming this requires interpretation of the evidence base, focusing on the source and nature of productivity growth and the possible impact
Nature PlaNts | VOL 6 | OctOber 2020 | 1203–1210 | www.nature.com/natureplants1208

Sustainable solutions to end hunger | 77
PersPectiveNature PlaNts
on the environment and natural resources. The potential effect of ecosystem services in productivity growth is also important. Here, the emerging evidence indicates tremendous potential to achieve synergies between SDGs 2.3 and 2.4 by increasing the efficiency of input use and better utilizing ecosystem services in agriculture.
Increasing productivity and incomes for smallholders does not directly and positively correlate with eradicating hunger and mal-nutrition, and in fact could have negative impacts. Overcoming this blind spot requires consideration of the diversity and nutrient density of the food targeted for productivity increases. Our analysis makes a strong and urgent case for investing in a nutrient-rich agri-cultural supply chain to capture synergies between achieving SDGs 2.1–2.3. This in turn has implications for prioritizing specific types of food products for productivity-increasing investments.
Thirdly, there is the interaction between productivity increases and resilience to climate change impacts. Here, as in the case with nutrition, the characteristics of agricultural crops and products and their vulnerability to the types of climate change impacts likely to occur in specific locations are important to consider when assessing the evidence base on productivity increases.
Consideration of priorities and capacities at a local level is neces-sary for the effective use of evidence to design investment strategies. The VNRs to achieving the SDGs indicate that awareness of inter-actions between productivity growth and sustainability are lacking and that there is little recognition of potential interactions between strategies for eradicating hunger and malnutrition and those of increasing agricultural productivity. There is, however, consider-able awareness of the potential interactions with climate change, particularly in the areas of agricultural productivity growth and sustainable agriculture. Capacity building at a national level could help achieve better articulation across all the objectives of SDG 2, and move towards strategies that enhance synergies and reduce trade-offs. The lack of both understanding and analysis of linkages between reducing hunger and malnutrition, and achieving produc-tivity growth and sustainability in agricultural systems, indicates a clear need for concentrated and urgent efforts to improve the evi-dence base and the capacity to use it amongst a wide range of factors in the food system.
Received: 11 September 2020; Accepted: 16 September 2020; Published online: 12 October 2020
References 1. Goal 2: Zero Hunger. United Nations https://www.un.org/
sustainabledevelopment/hunger/ (2015). 2. Nutrition and Food Systems: A Report by the High Level Panel of Experts on
Food Security and Nutrition (HLPE, 2017). 3. Béné, C. et al. When food systems meet sustainability —
current narratives and implications for actions. World Dev. 113, 116–130 (2019).
4. Creating a Sustainable Food Future: A Menu of Solutions to Feed Nearly 10Billion People by 2050 (World Resources Institute, 2019).
5. IPCC Summary for Policymakers. In Climate Change and Land: An IPCCSpecial Report on Climate Change, Desertification, Land Degradation,Sustainable Land Management, Food Security, and Greenhouse Gas Fluxes inTerrestrial Ecosystems (eds Shukla, P. R. et al.) (in the press, 2019).
6. Tilman, D. Global environmental impacts of agricultural expansion: the needfor sustainable and efficient practices. Proc. Natl Acad. Sci. USA 96, 5995–6000 (1999).
7. The State of the World’s Land and Water Resources for Food and Agriculture:Managing Systems at Risk (FAO, 2011).
8. Foley, J. A. et al. Global consequences of land use. Science 309, 570–574 (2005).
9. Foley, J. A. et al. Solutions for a cultivated planet. Nature 478, 337–342 (2011).
10. Coomes, O. T., Barham, B. L., MacDonald, G. K., Ramankutty, N. & Chavas,J. Leveraging total factor productivity growth for sustainable and resilientfarming. Nat. Sustain. 2, 22–28 (2019).
11. The State of Food and Agriculture Report: Innovation in Family Farming (FAO, 2014).
12. Byerlee, D. & Murgai, R. Sense and sustainability revisited: the limits of totalfactor productivity measures of sustainable agricultural systems. Agric. Econ.26, 227–236 (2001).
13. Fuglie, K. Is agricultural productivity growth slowing? Glob. Food Sec. 17, 73–83 (2018).
14. Cui, Z. et al. Pursuing sustainable productivity with millions of smallholderfarmers. Nature 555, 363–366 (2018).
15. Díaz, S. et al. (eds) Summary for Policymakers: The Global Assessment Reporton Biodiversity and Ecosystem Services (IPBES, 2019).
16. Tilman, D. In Agricultural Resilience: Perspectives from Ecology and Economics (eds Gardner, S. et al.) 39–59 (Cambridge University Press, 2018).
17. Renard, D. & Tilman, D. National food production stabilized by cropdiversity. Nature 571, 257–260 (2019).
18. Power, A. Review of ecosystem services and agriculture: trade-offs andsynergies. Philos. Trans. R. Soc. B 365, 2959–2971 (2010).
19. Panagos, P. et al. Cost of agricultural productivity loss due to soil erosion inthe European Union: from direct cost evaluation approaches to the use ofmacroeconomic models. Land Degrad. Dev. 29, 383–859 (2018).
20. Pingali, P. Green Revolution: impacts, limits, and the path ahead. Proc. NatlAcad. Sci. USA 109, 12302–12308 (2012).
21. Evenson, R. E. & Gollin, D. Assessing the impact of the Green Revolution,1960 to 2000. Science 300, 758–762 (2003).
22. Pandey, V. L., Mahendra, D. S. & Jayachandran, U. Impact of agriculturalinterventions on the nutritional status in South Asia: a review. Food Policy 62, 28–40 (2016).
23. Gómez, M. et al. Post-green revolution food systems and the triple burden ofmalnutrition. Food Policy 42, 129–138 (2013).
24. DeFries, R. Trade-offs and synergies among climate resilience, humannutrition and agricultural productivity of cereals — what are the implicationsfor the agricultural research agenda? In Science Forum 2018 (IndependentScience and Partnership Council, 2018).
25. DeFries, R. et al. Metrics for land-scarce agriculture: nutrientcontent must be better integrated into planning. Science 349, 238–240 (2015).
26. Benton, T. & Bailey, R. The paradox of productivity: agriculturalproductivity promotes food system inefficiency. Glob. Sustain. 2, E6 (2019).
27. Willett, W. et al. Food in the Anthropocene: the EAT–Lancet Commission onhealthy diets from sustainable food systems. Lancet 393, 447–492 (2019).
28. Ray, D. K. et al. Climate change has likely already affected global foodproduction. PLoS ONE 14, e0217148 (2019).
29. Rosenzweig, C. et al. Assessing agricultural risks of climate change in the 21stcentury in a global gridded crop model intercomparison. Proc. Natl Acad. Sci.USA 111, 3268–3273 (2014).
30. Burke, M., Dykema, J., Lobell, D. B., Miguel, E. & Satyanath, S. Incorporatingclimate uncertainty into estimates of climate change impacts. Rev. Econ. Stat.97, 461–471 (2015).
31. Reynolds, M. et al. An integrated approach to maintaining cereal productivityunder climate change. Glob. Food Secur. 8, 9–19 (2016).
32. Kanter, D. R. et al. Evaluating agricultural trade-offs in the age of sustainabledevelopment. Agric. Syst. 163, 73–88 (2018).
33. Antle, J. M. et al. Toward a new generation of agricultural system data,models, and knowledge products: state of agricultural systems science.Agric. Syst. 155, 255–268 (2017).
34. Sridharan, V. et al. The climate–land–energy–water nexus: implications foragricultural research. In Science Forum 2018 (Independent Science andPartnership Council, 2018).
35. Laborde, D., Debucquet, D., Bizikova, L., Lallemant, T. & Smaller, C.Ending Hunger: What Would it Cost? (IISD, 2016).
36. Prakash, A. (ed) Safeguarding Food Security in Volatile Global Markets543–569 (FAO, 2011).
37. Bellu, L. G., Mueller, M. & Kavallari, A. Achieving Zero Hunger: The CriticalRole of Investments in Social Protection and Agriculture (FAO, 2015).
38. Laborde, D. & Piñeiro, V. Monitoring agricultural productivity for sustainableproduction and R&D planning. Econ.: Open-Access, Open-Assess. E-J. 12, 1–11 (2018).
39. IAEG-SDGs: tier classification for global SDG indicators. United Nationshttps://unstats.un.org/sdgs/iaeg-sdgs/tier-classification/ (2020).
40. NDC Registry (Interim) (UNFCCC, 2020); https://www4.unfccc.int/sites/NDCStaging/Pages/All.aspx
41. Wood, S., Smith, M., Fanzo, J., Remans, R. & DeFries, R. Trade andthe equitability of global food nutrient distribution. Nat. Sustain. 1, 34–37 (2018).
42. Longvah, T (ed.) Indian Food Composition Tables (National Institute ofNutrition, 2017).
43. Composition of Foods Raw, Processed, Prepared: USDA National NutrientDatabase for Standard Reference, Release 27 (Agricultural Research Service,2015); h tt ps :/ /c at al og .d at a. go v/ da ta se t/ composition-of-foods-raw-processed- prepared-usda-national-nutrient-database-for-standard-r.
Nature PlaNts | VOL 6 | OctOber 2020 | 1203–1210 | www.nature.com/natureplants 1209

78 | Sustainable solutions to end hunger
PersPective Nature PlaNts
AcknowledgementsWe thank J. Porciello and S. Murphy for insightful discussions on the framing of the paper and the Independent Science and Partnership Council of the CGIAR for supporting the early work underlying some analysis in the manuscript. This work was supported by the Ceres 2030 project.
Author contributionsL.L. conceived the idea and led in writing the paper. R.D. and L.B. contributed analysis and text for sections of the paper. All authors contributed to the narrative and writingof the paper.
Competing interestsThe authors declare no competing interests.
Additional informationCorrespondence should be addressed to L.L.
Reprints and permissions information is available at www.nature.com/reprints.
Publisher’s note Springer Nature remains neutral with regard to jurisdictional claims in published maps and institutional affiliations.
© Springer Nature Limited 2020
Nature PlaNts | VOL 6 | OctOber 2020 | 1203–1210 | www.nature.com/natureplants1210

Sustainable solutions to end hunger | 79
Articleshttps://doi.org/10.1038/s41477-020-00786-w
1International Livestock Research Institute, Nairobi, Kenya. 2Cornell University, Ithaca, NY, USA. 3University of Edinburgh, Edinburgh, UK. 4College of Business Education, Dar es Salaam, Tanzania. 5Center for Tropical Agriculture (CIAT), Cali, Colombia. ✉e-mail: [email protected]
One billion poor people in Low- and Middle-Income Countries (LMICs) derive part of their livelihood from livestock1. As well as providing income and financial
security for the rural poor, livestock products are a vital source of protein and micronutrients in regions where their regular supply could reduce the currently high prevalence of childhood stunting2. Unlike in the Global North, in LMICs, urbanization and growth in incomes and populations are fuelling strong growth in the demand for livestock products. A key challenge therefore is to identify and promote solutions to increase livestock production and produc-tivity. Currently, livestock productivity is much lower in LMICs than in high-income countries3. For example, the average cow milk yields in Western Europe are 20 times higher than in Eastern Africa4. Moreover, increasing per-animal productivity is essential for environmental sustainability as systems intensify. For example, sub-Saharan Africa is a livestock greenhouse gas emissions intensity hotspot mainly because yields are low5. Poor productivity is caused by many factors including unimproved genetic stock, inadequate veterinary provision and a general scarcity of high-quality inputs. Although access to enough high-quality feed is generally agreed to be the main constraint on better productivity6,7, the livestock feed challenge has proved to be intractable despite considerable research and development effort over the past three decades. This effort has included many programmes aimed at delivering high-quality feed options to smallholder livestock keepers, but the evidence for their effectiveness is sparse8. The research field is characterized by anec-dotes with very little rigorous and systematic analysis of success and the factors underlying success9.
Feeding practices are varied and comprise the mix of differ-ent feeds offered to livestock (planted forages, crop residues such as straw, supplementation with commercial feeds and so on) and the amounts offered to different animals in different seasons. Feed improvement interventions among LMIC smallholders include the introduction of improved grasses and legumes10, the use of mul-tipurpose trees11, methods of increasing intake and the nutritive
value of crop residues by physical or chemical treatment12, and methods of preserving fresh feed to fill seasonal feed gaps13 (Box 1). Although ‘improved’ feed options have been researched and pro-moted widely in many systems by many stakeholders over many years14, less research has addressed the uptake of these options by farmers, their effects on ruminant productivity and ultimately their impact on farmer livelihoods, possibly due to overall underinvest-ment in impact assessment studies9. The objective of this scoping review is to assess the availability and quality of evidence for the uptake of improved livestock feed options by small-scale producers, the effects of this uptake on ruminant livestock productivity and the degree to which this improves smallholder farmer livelihoods (Box 2). The overarching aim is to identify promising strategies to improve livestock feeding for improved productivity and ultimately farmer livelihoods, on the basis of the analysis of the reviewed evidence.
ResultsAs shown in Tables 1 and 2, there has been increased attention to and documentation of feed intervention adoption processes over time: in our final set of 73 included papers, 9 were published before the year 2000, 28 between 2000 and 2010, and 36 between 2011 and 2019. This increase in the adoption literature complements the more common technically oriented papers (mainly feeding trials) that dominated the earlier literature.
In terms of geographical representation, almost half of the papers (35) analysed sites in East Africa or in the Horn of Africa. Southeast Asia was the second most represented region (12 papers). The dominance of papers from these two regions is probably due to relevant development and research projects that have been implemented there, including those by centres of CGIAR. The two regions are also over-represented in the scoping review because unlike South America, they are dominated by small-scale livestock systems, which was an inclusion criterion. The relatively few papers from West Africa, despite our inclusion of papers in French, may
A scoping review of feed interventions and livelihoods of small-scale livestock keepersIsabelle Baltenweck 1 ✉, Debbie Cherney2, Alan Duncan1,3, Erin Eldermire 2, Edda Tandi Lwoga 4, Ricardo Labarta 5, Elizaphan James Oburu Rao1, Steven Staal1 and Nils Teufel1
Livestock support the livelihoods of one billion people in Africa, Asia and Latin America, but the productivity of animals remains low, reducing the potential of the sector to support higher incomes and better nutrition. Improved livestock feeding has been identified as the most important step towards higher productivity. This scoping review assessed the evidence for the uptake of improved ruminant livestock feed options, the effect of this uptake on livestock productivity and the degree to which this improves smallholder farmer livelihoods. In total, 22,981 papers were identified, of which 73 papers were included in the final analysis after a rigorous double-blind screening review. Only papers that reported farmers’ decision to use a new feed inter-vention were selected, thereby excluding feeding trials and participatory feed assessments. Of the 73 papers, only 6 reported combined evidence of adoption, effect on productivity and livelihood changes. A total of 58 papers looked at adoption, 19 at productivity change and 22 at livelihood change. This scoping review highlights the gap in evidence for the adoption of new livestock feeding practices and provides recommendations to support farmers’ uptake of feed interventions.
Nature PlaNts | VOL 6 | OctOber 2020 | 1242–1249 | www.nature.com/natureplants1242
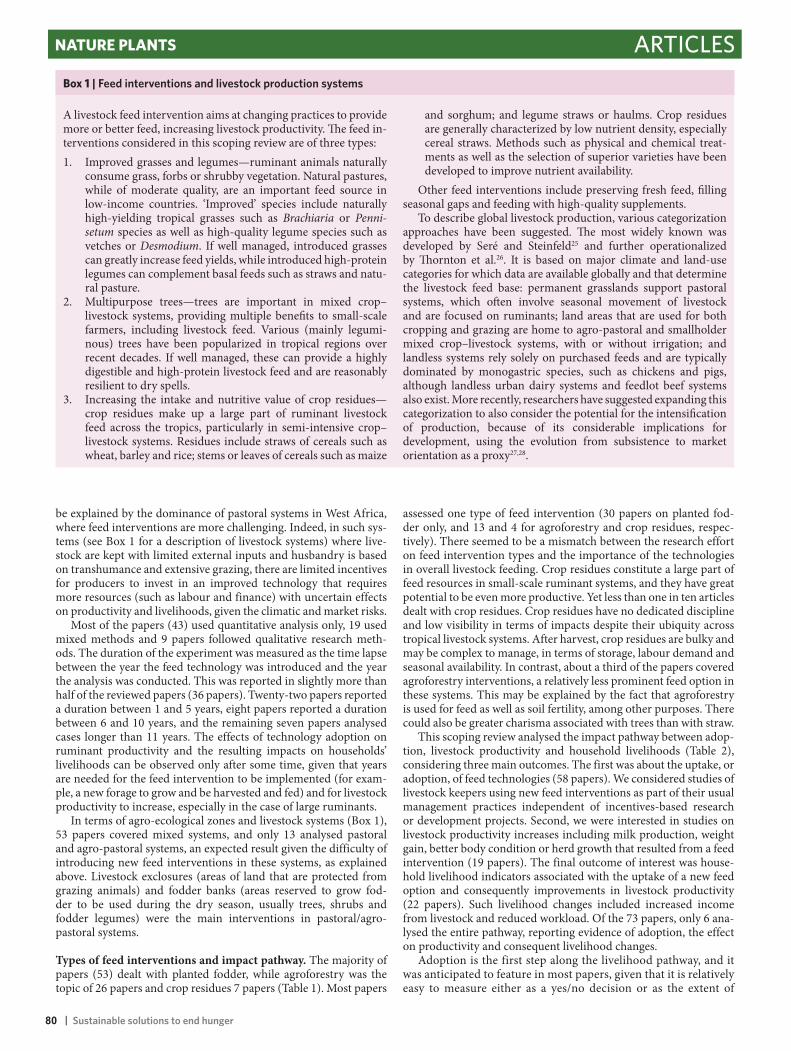
| 80 Sustainable solutions to end hunger
ArticlesNature PlaNts
be explained by the dominance of pastoral systems in West Africa, where feed interventions are more challenging. Indeed, in such sys-tems (see Box 1 for a description of livestock systems) where live-stock are kept with limited external inputs and husbandry is based on transhumance and extensive grazing, there are limited incentives for producers to invest in an improved technology that requires more resources (such as labour and finance) with uncertain effects on productivity and livelihoods, given the climatic and market risks.
Most of the papers (43) used quantitative analysis only, 19 used mixed methods and 9 papers followed qualitative research meth-ods. The duration of the experiment was measured as the time lapse between the year the feed technology was introduced and the year the analysis was conducted. This was reported in slightly more than half of the reviewed papers (36 papers). Twenty-two papers reported a duration between 1 and 5 years, eight papers reported a duration between 6 and 10 years, and the remaining seven papers analysed cases longer than 11 years. The effects of technology adoption on ruminant productivity and the resulting impacts on households’ livelihoods can be observed only after some time, given that years are needed for the feed intervention to be implemented (for exam-ple, a new forage to grow and be harvested and fed) and for livestock productivity to increase, especially in the case of large ruminants.
In terms of agro-ecological zones and livestock systems (Box 1), 53 papers covered mixed systems, and only 13 analysed pastoral and agro-pastoral systems, an expected result given the difficulty of introducing new feed interventions in these systems, as explained above. Livestock exclosures (areas of land that are protected from grazing animals) and fodder banks (areas reserved to grow fod-der to be used during the dry season, usually trees, shrubs and fodder legumes) were the main interventions in pastoral/agro- pastoral systems.
Types of feed interventions and impact pathway. The majority of papers (53) dealt with planted fodder, while agroforestry was the topic of 26 papers and crop residues 7 papers (Table 1). Most papers
assessed one type of feed intervention (30 papers on planted fod-der only, and 13 and 4 for agroforestry and crop residues, respec-tively). There seemed to be a mismatch between the research effort on feed intervention types and the importance of the technologies in overall livestock feeding. Crop residues constitute a large part of feed resources in small-scale ruminant systems, and they have great potential to be even more productive. Yet less than one in ten articles dealt with crop residues. Crop residues have no dedicated discipline and low visibility in terms of impacts despite their ubiquity across tropical livestock systems. After harvest, crop residues are bulky and may be complex to manage, in terms of storage, labour demand and seasonal availability. In contrast, about a third of the papers covered agroforestry interventions, a relatively less prominent feed option in these systems. This may be explained by the fact that agroforestry is used for feed as well as soil fertility, among other purposes. There could also be greater charisma associated with trees than with straw.
This scoping review analysed the impact pathway between adop-tion, livestock productivity and household livelihoods (Table 2), considering three main outcomes. The first was about the uptake, or adoption, of feed technologies (58 papers). We considered studies of livestock keepers using new feed interventions as part of their usual management practices independent of incentives-based research or development projects. Second, we were interested in studies on livestock productivity increases including milk production, weight gain, better body condition or herd growth that resulted from a feed intervention (19 papers). The final outcome of interest was house-hold livelihood indicators associated with the uptake of a new feed option and consequently improvements in livestock productivity (22 papers). Such livelihood changes included increased income from livestock and reduced workload. Of the 73 papers, only 6 ana-lysed the entire pathway, reporting evidence of adoption, the effect on productivity and consequent livelihood changes.
Adoption is the first step along the livelihood pathway, and it was anticipated to feature in most papers, given that it is relatively easy to measure either as a yes/no decision or as the extent of
Box 1 | Feed interventions and livestock production systems
A livestock feed intervention aims at changing practices to provide more or better feed, increasing livestock productivity. The feed in-terventions considered in this scoping review are of three types: 1. Improved grasses and legumes—ruminant animals naturally
consume grass, forbs or shrubby vegetation. Natural pastures,while of moderate quality, are an important feed source inlow-income countries. ‘Improved’ species include naturallyhigh-yielding tropical grasses such as Brachiaria or Penni-setum species as well as high-quality legume species such asvetches or Desmodium. If well managed, introduced grassescan greatly increase feed yields, while introduced high-protein legumes can complement basal feeds such as straws and natu-ral pasture.
2. Multipurpose trees—trees are important in mixed crop–livestock systems, providing multiple benefits to small-scalefarmers, including livestock feed. Various (mainly legumi-nous) trees have been popularized in tropical regions overrecent decades. If well managed, these can provide a highlydigestible and high-protein livestock feed and are reasonablyresilient to dry spells.
3. Increasing the intake and nutritive value of crop residues—crop residues make up a large part of ruminant livestockfeed across the tropics, particularly in semi-intensive crop–livestock systems. Residues include straws of cereals such aswheat, barley and rice; stems or leaves of cereals such as maize
and sorghum; and legume straws or haulms. Crop residues are generally characterized by low nutrient density, especially cereal straws. Methods such as physical and chemical treat-ments as well as the selection of superior varieties have been developed to improve nutrient availability.
Other feed interventions include preserving fresh feed, filling seasonal gaps and feeding with high-quality supplements.
To describe global livestock production, various categorization approaches have been suggested. The most widely known was developed by Seré and Steinfeld25 and further operationalized by Thornton et al.26. It is based on major climate and land-use categories for which data are available globally and that determine the livestock feed base: permanent grasslands support pastoral systems, which often involve seasonal movement of livestock and are focused on ruminants; land areas that are used for both cropping and grazing are home to agro-pastoral and smallholder mixed crop–livestock systems, with or without irrigation; and landless systems rely solely on purchased feeds and are typically dominated by monogastric species, such as chickens and pigs, although landless urban dairy systems and feedlot beef systems also exist. More recently, researchers have suggested expanding this categorization to also consider the potential for the intensification of production, because of its considerable implications for development, using the evolution from subsistence to market orientation as a proxy27,28.
Nature PlaNts | VOL 6 | OctOber 2020 | 1242–1249 | www.nature.com/natureplants 1243

|Sustainable solutions to end hunger 81
Articles Nature PlaNts
adoption. We found 15 papers that did not explicitly report or analyse that first step but only reported a change in productiv-ity and/or livelihood indicators among adopters. More frequently, papers reported livelihood changes compared to productivity changes. This may be explained by a focus on development goals, such as producers’ livelihoods, and by the technical challenges of measuring livestock productivity. Livelihood indicators such as income and diet are relatively well established, and tools are avail-able to systematically report them. In contrast, livestock produc-tivity indicators vary across species (such as milk yield, weight gain, herd size and fertility indicators), require demanding mea-surement protocols and are calculated using different periods (such as lactation, reproductive cycle, season and year), making comparisons difficult.
Across the three outcome sets, there were no specific differences in types of publication or years of publication. Studies in mixed systems dominated across all outcomes, with few papers covering agro-pastoral or pastoral systems. For regions, papers from East Africa were most common for adoption studies, while for liveli-hood outcomes, there was a relatively large number of papers from Southeast Asia (8 out of 22 papers), possibly driven by research in development projects implemented in that region. In terms of research methods, the general observation that studies were mainly quantitative applied to all three outcomes. There were more mixed-methods approaches for adoption studies, possibly reflecting the importance of not only analysing the decision-making processes quantitatively but also assessing the ‘why’ and the ‘how’ that are bet-ter captured using qualitative approaches. There was no qualitative study measuring productivity indicators.
Analysis of the results reported by the studies. The outcome indi-cator results reported in the studies are shown in Table 3. Although 43 studies reported the adoption of forages, only 32 included data that could be used to estimate adoption. The same pattern applied to the adoption of agroforestry practices and crop residues. Analysing the results as reported in these studies, we found that the ranges of livestock keepers adopting the technology varied widely, from 0 to 90% for forages, 8 to 87% for agroforestry and 20 to 86% for crop residues.
Productivity indicators included increase in milk yields, animal weight gain, improved body condition and growth in flock/herd size. The number of papers with sufficient data was very low, with only nine papers across the three feed interventions. Changes in productivity ranged from 7 to 61%, with only one paper reporting productivity change related to crop residues.
Finally, for livelihood indicators, the scoping review identi-fied 22 papers with sufficient data across the three feed types, with 14 papers quantifying the impact. Household income change (8 papers) ranged from 6 to 285%, gross margins (3 papers) increased by 58 to 519% and labour or workload change (5 papers) from −24 to −70%.
Drivers of adoption. To better understand the reported changes, 25 papers were identified that explicitly examined the reasons for adoption. These were further examined for underlying drivers or constraints to adoption. Of the adoption drivers, the following were mentioned most often. Farmer experience or level of education was mentioned in ten papers; these variables are commonly collected as part of the household characterization in adoption studies and tend
Box 2 | Summary of methods
1. A comprehensive literature search for CAB Abstracts was cre-ated (see the search strategy at https://osf.io/5ec9k/).
2. The CAB Abstracts search strategy was translated to 22 addi-tional bibliographic databases and grey literature sources (seethe list of sources searched at https://osf.io/kghtc/).
3. To ensure accountability and reduce bias, a protocol was reg-istered before data collection at https://osf.io/6ywht/.
4. After all bibliographic databases and sources were searched,the results were combined, duplicates were removed and22,981 unique records were identified.
5. Using inclusion and exclusion criteria specified in the proto-col, the records were screened blindly by two authors at eachstep, with a third author as a tie-breaker. The screening com-prised three steps:
a. A machine learning process that used metadata to identifypopulations, geographies, interventions and outcomes ofinterest was applied. This process generated Excel files thatcould be quickly sorted and screened; 12,195 records wereexcluded, leaving 10,786 records.
b. The titles and abstracts of the remaining records werescreened; 10,243 records were excluded, leaving 543records.
c. The full texts of the remaining records were retrieved andscreened; 470 records were excluded, leaving 73 recordsthat were included in this scoping review.
After the full-text screening, 73 papers were identified that met our PRIMSA-P a priori inclusion criteria and were included in the analysis, as shown in Tables 1, 2 and 3. Data were extracted to document all themes of interest including types of feed interventions, type of analysis, outcome variables and reported effects.
The inclusion criteria for this scoping review were: 1. The study focus includes a population of small-scale and
agro-pastoral keepers of large and small ruminants. 2. The study is primary empirical research. 3. The explicit population focus is small-scale and agro-pastoral
ruminant livestock keepers. 4. The study describes the adoption of ‘improved feed options’
and/or their effect on productivity, livelihoods or both. 5. The study area or focus includes target populations in LMICs. 6. The study is in English, French, Spanish or German.
High proportion of excluded articles: the highly inclusive search process returned many false positives. Thousands of irrelevant records were excluded at the title and abstract screening phase. Of the 470 articles excluded at the full-text screening, 257 did not include analysis of farmers’ adoption and/or the effect of the feed intervention on livestock productivity or livelihoods, and instead addressed feed trials and experiments.
Quality control: a subjective quality assessment was employed to categorize each study. Three criteria were used: the quality of the study methodology, the justification of the study methodology and an overall subjective quality. Table 4 summarizes these results.
Decision to use the scoping review methodology: scoping reviews are useful for incorporating a heterogeneous range of study designs typically found in agriculture. Unlike traditional narrative reviews, scoping reviews aim to consider all evidence on a topic and to reduce author, publication, confirmation and other forms of bias. Other evidence syntheses, such as meta-analyses (which aggregate quantitative results) and systematic reviews (which rely on homogeneous study methodologies and address intervention and outcome scenarios), did not fit the exploratory nature of this scoping review and the available evidence base.
Nature PlaNts | VOL 6 | OctOber 2020 | 1242–1249 | www.nature.com/natureplants1244
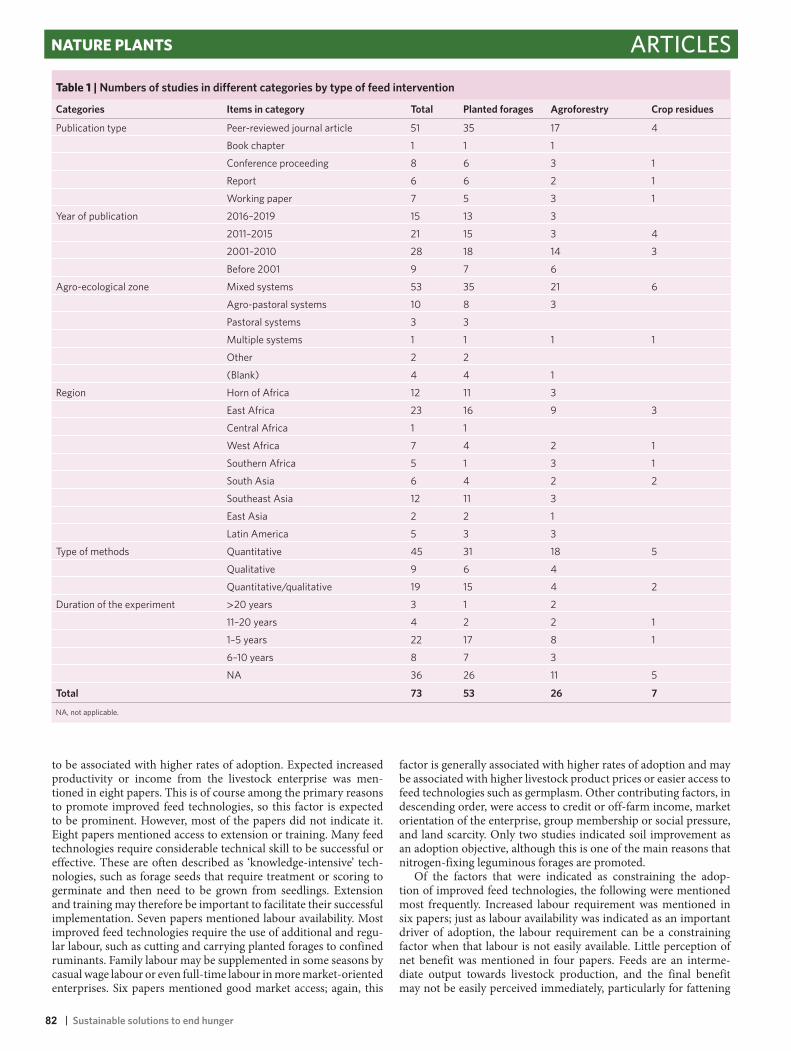
| 82 Sustainable solutions to end hunger
ArticlesNature PlaNts
to be associated with higher rates of adoption. Expected increased productivity or income from the livestock enterprise was men-tioned in eight papers. This is of course among the primary reasons to promote improved feed technologies, so this factor is expected to be prominent. However, most of the papers did not indicate it. Eight papers mentioned access to extension or training. Many feed technologies require considerable technical skill to be successful or effective. These are often described as ‘knowledge-intensive’ tech-nologies, such as forage seeds that require treatment or scoring to germinate and then need to be grown from seedlings. Extension and training may therefore be important to facilitate their successful implementation. Seven papers mentioned labour availability. Most improved feed technologies require the use of additional and regu-lar labour, such as cutting and carrying planted forages to confined ruminants. Family labour may be supplemented in some seasons by casual wage labour or even full-time labour in more market-oriented enterprises. Six papers mentioned good market access; again, this
factor is generally associated with higher rates of adoption and may be associated with higher livestock product prices or easier access to feed technologies such as germplasm. Other contributing factors, in descending order, were access to credit or off-farm income, market orientation of the enterprise, group membership or social pressure, and land scarcity. Only two studies indicated soil improvement as an adoption objective, although this is one of the main reasons that nitrogen-fixing leguminous forages are promoted.
Of the factors that were indicated as constraining the adop-tion of improved feed technologies, the following were mentioned most frequently. Increased labour requirement was mentioned in six papers; just as labour availability was indicated as an important driver of adoption, the labour requirement can be a constraining factor when that labour is not easily available. Little perception of net benefit was mentioned in four papers. Feeds are an interme-diate output towards livestock production, and the final benefit may not be easily perceived immediately, particularly for fattening
table 1 | Numbers of studies in different categories by type of feed intervention
Categories Items in category Total Planted forages Agroforestry Crop residues
Publication type Peer-reviewed journal article 51 35 17 4
Book chapter 1 1 1
Conference proceeding 8 6 3 1
Report 6 6 2 1
Working paper 7 5 3 1
Year of publication 2016–2019 15 13 3
2011–2015 21 15 3 4
2001–2010 28 18 14 3
Before 2001 9 7 6
Agro-ecological zone Mixed systems 53 35 21 6
Agro-pastoral systems 10 8 3
Pastoral systems 3 3
Multiple systems 1 1 1 1
Other 2 2
(Blank) 4 4 1
Region Horn of Africa 12 11 3
East Africa 23 16 9 3
Central Africa 1 1
West Africa 7 4 2 1
Southern Africa 5 1 3 1
South Asia 6 4 2 2
Southeast Asia 12 11 3
East Asia 2 2 1
Latin America 5 3 3
Type of methods Quantitative 45 31 18 5
Qualitative 9 6 4
Quantitative/qualitative 19 15 4 2
Duration of the experiment >20 years 3 1 2
11–20 years 4 2 2 1
1–5 years 22 17 8 1
6–10 years 8 7 3
NA 36 26 11 5
Total 73 53 26 7
NA, not applicable.
Nature PlaNts | VOL 6 | OctOber 2020 | 1242–1249 | www.nature.com/natureplants 1245

|Sustainable solutions to end hunger 83
Articles Nature PlaNts
enterprises where nutritional benefits accrue over longer periods. Four papers mentioned difficult access to the technology or inputs. For some forage species, there may be limited systematic supply of seeds or planting material, and this is often a limit to sustained use after the withdrawal of project support. Many LMICs lack function-ing forage seed systems. Four papers mentioned the complexity of the technology; as indicated, some feed technologies may require specific techniques, the training in which may not be available. Finally, competition with other land uses was mentioned in four papers. In land-scarce settings, priority may be given to food crops or to short-term cash crops such as seasonal vegetables, since these may represent a more profitable use of land. Likewise, some alterna-tive land uses may be affected by subsidies and price control and may influence the relative returns from some feeding options.
Quality assessment. The research quality assessment was con-ducted using three indicators for all 73 papers (Table 4). In terms of study methodology, 17 papers scored high, and almost half of the papers (32) scored low. The quality assessment on the justification
of the study methodology was slightly better, with 31 papers being scored high. The scores for the overall quality were relatively evenly distributed, with 17 papers having the highest scores and 15 the low-est ones. Overall, the quality of the papers was judged to be average to low. Both the number and quality of studies that were included in this analysis are rather disappointing, given the role that improved feed options can and should play in enhancing livestock productiv-ity and household livelihoods.
DiscussionFirst, it is worth noting that the scoping review identified very few studies that answer our research question on the comparative impacts of various ruminant feed interventions on the livelihoods of livestock keepers. Indeed, the exercise yielded only 73 papers from a starting population of 23,018. We found many papers that stud-ied the technical aspects of feed supply for ruminant livestock but were excluded because they did not assess the interventions’ uptake by or usefulness to farmers. This points to a strong bias among the scientific community towards understanding the technical
table 2 | Numbers of studies in different categories by level along the impact pathway
Categories Items in category Total Adoption Productivity Livelihoods
Publication type Peer-reviewed journal article 51 42 10 12
Book chapter 1 1 1 1
Conference proceeding 8 6 3 2
Report 6 6 4 3
Working paper 7 3 1 4
Year of publication 2016–2019 15 10 3 7
2011–2015 21 19 7 6
2001–2010 28 24 6 8
Before 2001 9 5 3 1
Agro-ecological zone Mixed systems 53 41 12 15
Agro-pastoral systems 10 9 2 2
Pastoral systems 3 1 2 1
Multiple systems 1 1 1 1
Other 2 2 1
(Blank) 4 4 2 2
Regions Horn of Africa 12 11 2 3
East Africa 23 19 5 6
Central Africa 1 1
West Africa 7 5 2 1
Southern Africa 5 5 2 1
South Asia 6 4 1 2
Southeast Asia 12 7 3 8
East Asia 2 2 2 1
Latin America 5 4 2
Type of methods Quantitative 45 40 14 13
Qualitative 9 5 2
Quantitative/qualitative 19 13 5 7
Duration of the experiment >20 years 3 1 1 2
11–20 years 4 4 1 1
1–5 years 22 16 6 8
6–10 years 8 6 3 5
NA 36 31 8 6
Total 73 58 19 22
Nature PlaNts | VOL 6 | OctOber 2020 | 1242–1249 | www.nature.com/natureplants1246

| 84 Sustainable solutions to end hunger
ArticlesNature PlaNts
intricacies of ruminant feeding without paying sufficient attention to how such technologies fit into general farming practices or farmer objectives. Additionally, a number of studies were dropped as per the exclusion criteria because they focused on large-scale livestock production. Several studies from Latin America fell in this category, which is consistent with the fact that farms in Latin America and the Caribbean are generally larger than farms in other regions, includ-ing sub-Saharan Africa and Asia15.
Second, among the few papers included in the final analysis, the majority only analysed the adoption of feed interventions, and only six studies additionally documented the productivity and live-lihood impact pathways of the feed interventions. The funding of research to generate rigorous and relevant evidence of feed inno-vation outcomes and impacts has been restricted mainly to those development projects introducing such innovations. However, such development-project-linked research may not be able to analyse the whole pathway from adoption to animal and household impact given the limited lifespans of such projects, particularly since pro-ductivity gains may only translate to sustained herd growth over time, and project termination may lead to the withdrawal of needed farmer support services.
Third, the literature was found to be skewed towards forages and agroforestry, yet crop residues are among the largest sources of basal feed for ruminant livestock across tropical regions (in addition to natural pasture). This apparent mismatch may result from the fact that forages and multipurpose trees can offer a step change in
productivity, compared with the more incremental productivity benefits from the improved use of crop residues. Forages and trees also have a disciplinary home, with whole research institutes devoted to their study. Crop residues are generally seen as by-products of human food production despite the fact that the market value of straw can in some cases approach that of grain for human food16. The focus on human food production by cereal breeding research institutes leaves the residues as an ‘orphan crop’. Our scoping review points to the need to focus more research effort on improving crop residue yields and quality characteristics such as through orienting crop breeding towards improving the feed quality of underutilized residues17. Practices involving improving crop residue quality and yield may have a strong likelihood of adoption, since few changes to farming practices are required in contrast to planted forages and forage trees.
Fourth, no clear conclusion emerged from comparing the effects of various feed-oriented interventions. Indeed, the ranges of change indicators presented are so large that meaningful comparisons are difficult. Several factors seem to have contributed to this. First, the intervention categories (that is, planted forages, agroforestry and crop residues) contain a wide variety of individual interventions with very different potentials for inducing change. For instance, introducing a new forage crop into a system without any prior for-age cultivation can yield substantial improvements in productivity18 compared with the incremental effects of introducing a new vari-ety of an established forage species19. Second, the approaches to determine intervention impacts differ considerably between stud-ies. Where a development project is focused on development impact (for instance, by creating an enabling environment for farmers to adopt or by targeting mainly high-potential benefi-ciaries), outcomes are likely to be greater than in an independent study aiming to determine how farmers benefit from a variety of interventions. An example of the former is presented by Roothaert and Kerridge20, reporting a gross margin increase of 239% among project participants, whereas a study on various fodder shrubs in central Kenya was able to detect an income improvement of only 10% (ref. 21). Third, the time horizon considered by the reviewed studies varies greatly (Table 2). Most studies report changes only for the entire study period rather than average annual changes. Also, the rate of change brought about by feed interventions might not be constant. It is probable that a single intervention would generate change along an S-curve with only little evidence of change initially, followed by a period of considerable change, after which the rate would decrease. The reported rates may refer to very different periods within the change processes. Finally, the success of land-based interventions, such as those targeting feeds, is generally very site-specific, depending on biophysical features (such as rainfall or temperature) as well as on social characteristics (such as land prices or market access). The reviewed studies cover a wide range of such features and characteristics, from densely populated and humid Philippines and Vietnam22 to mountainous Nepal23, showing increases in household income of 285% and 11%, respectively.
Finally, this scoping review has identified various factors driv-ing or constraining the adoption of feed interventions, which can be grouped into three broad and inter-related categories. The first category refers to managing a sometimes-challenging technol-ogy, requiring certain skills on the part of the farmer as well as access to the technology, to extension and to training in its use. Second, the benefits of using a technology and its alignment with the farmer’s objectives must be perceived and valued by the farmer for adoption to occur. This is often an issue because feed is an intermediate technology in the livestock value chain, and the link between better feeding and financial benefits may not be easily perceived. Furthermore, livestock may be kept for a range of reasons other than the production of milk and meat, and the
table 3 | Descriptive statistics of the results reported in the included studies, by level (adoption, productivity and livelihoods) and type of feed intervention
Indicators Planted forages Agroforestry Crop residues
Adoption N (total) 43 19 6 N (studies with usable data) 32 11 3 Adoption range 0–90% 8–87% 20–86%Productivity N (total) 18 6 38 N (studies with usable data) 2 1 6 Productivity change range 10–30% 0% 7–61%Livelihoods N (total) 18 7 1 Household income change range (N)
6–285% (5) 10–80% (3) NA (0)
Gross margin change range (N)
58–519% (3) 239% (1) NA (0)
Labour use change range (N) −70 to −24% (5) NA (0) NA (0)
table 4 | Summary statistics for quality assessment
Quality levels Quality of study methodology
Study methodology justification
Overall subjective quality
High 17 31 17
High-medium 0 6 12
Medium 24 14 19
Medium-low 0 8 10
Low 32 14 15
Total 73 73 73
Nature PlaNts | VOL 6 | OctOber 2020 | 1242–1249 | www.nature.com/natureplants 1247

|Sustainable solutions to end hunger 85
Articles Nature PlaNts
farmers’ primary objective may not be immediately obvious to well-meaning development agents. Third, the availability of the key resources of land and labour, and the trade-offs between them that the feed technology may impose, will limit or facilitate adop-tion, with adequate availability of both (particularly labour) gen-erally having a positive effect. The trade-offs in certain contexts may mean that farmers can derive greater benefit from allocating land and labour to non-livestock activities, and this needs careful consideration when considering feed interventions.
The consideration of these adoption drivers and constraints is helpful for considering future approaches to enhancing livestock feed supply among poor livestock keepers. Too often, technologies have been promoted without systematically considering barriers to their uptake, whether target farmers have sufficient resources (both financial and human) to successfully implement them and whether the technologies make economic sense given the market conditions and the competing opportunities for the use of land and labour in target communities. Box 3 presents recommendations for research-ers and development practitioners.
MethodsEvidence synthesis methodology and protocol preregistration. This scoping review was conducted following the PRISMA-ScR (Preferred Reporting for Items for Scoping Reviews) checklist. A protocol was registered in Open Science Framework on 5 June 2019 at https://osf.io/6ywht/.
Information sources, searches and citation management. A comprehensive search strategy was developed (by E.L. and E.E.) to identify all available research pertaining to the livelihoods of small-scale and agro-pastoral livestock keepers in LMICs in Africa, Asia and Latin America, in relation to the improvement of ruminant feed interventions. The search terms included variations of the key concepts in the research question: improvement or conservation of crops; small-scale producers or pastoralists; LMICs in Africa, Asia or Latin America; and innovation or adoption indicators. The comprehensiveness of the search strategy was ensured by including all known search-term synonyms and appropriate subject term searches, conducting a peer review of search strategy by expert librarians familiar with the discipline, and confirming the inclusion of eight seminal studies in the results set. See Supplementary Appendix A for the search strategy used for CAB Abstracts (accessed via the Clarivate Analytics platform).
On 5 June 2019, four bibliographic databases were searched. These included CAB Abstracts (Clarivate Analytics, 1910–present), Web of Science Core Collection (Clarivate Analytics, 1900–present), Scopus (Elsevier, 1970–present) and Dissertations and Theses Global (ProQuest, 1743–present). On the same day, 20 grey literature sources were searched, including Africa Theses and Dissertations, AgEcon Search, AGRIS, Campbell Collaboration, Cochrane Collaboration, Collaboration for Environmental Evidence, Commonwealth Scientific and Industrial Research Organization, Brazilian Agricultural Research Corporation (Embrapa), French Agricultural Research Centre for International Development, GARDIAN, International Fund for Agricultural Development, International Institute for Environment and Development, JPAL/ATAI Impact Evaluations, Overseas Development Institute, UK Department for Internal Development, United Nations Environment Programme, World Food Programme, World Health Organization, World Bank, and Cgspace.
The search results were deduplicated to remove citations identified in multiple databases. The titles, abstracts and keywords of all citations were exported as RIS files.
Study selection and eligibility criteria. To accelerate the identification of potential articles for exclusion at the title stage, a machine learning process that used metadata to identify populations, geographies, interventions and outcomes of interest was applied. This process generated Excel files that could be quickly sorted and screened. The majority of the records (N = 20,173) were screened via this method, blindly, by author pairs (including I.B., E.J.R., E.E., E.L., R.L., A.D. and D.C.), and citations that both authors excluded did not progress to the title and abstract screening phase. The remaining studies were imported into Covidence, a systematic review screening software, and were screened blindly via title and abstract by two authors with a third as a tie-breaker (I.B., S.S., E.J.R., N.T., R.L., A.D. and D.C.). Studies that were not excluded by title and abstract screening were considered at the full-text level. These were screened blindly using the same inclusion and exclusion criteria, and conflicts were resolved by a third author as a tie-breaker (I.B., S.S., E.J.R., N.T., R.L., A.D. and D.C.). Individual reasons for exclusion were recorded at the full-text screening stage (Extended Data Fig. 1).
During all stages of screening (title, title and abstract, and full text), studies were excluded if they did not meet all of the following inclusion criteria: (1) the study focus includes a population of small-scale and agro-pastoral keepers of large and small ruminants; (2) the study is primary empirical research; (3) the explicit population focus is small-scale and agro-pastoral ruminant livestock keepers; (4) the study describes the adoption of ‘improved feed options’ and/or their effect on productivity, livelihoods or both; (5) the study area or focus includes target populations in LMICs; and (6) the study is in English, French, Spanish or German.
In addition, studies were excluded if they met one or more of the following exclusion criteria: (1) the study is a review or a case study; (2) the study does not include small-scale or agro-pastoral as the target population; (3) the study does not take place in LMICs in Latin America, Africa or Asia; (4) the study does not consider improved feed options (introduced by an external entity or the farmer’s own experimentation); (5) the study considers only industrial by-products and/or concentrates; (6) the study is in a language other than English, French, Spanish or German; and (7) the study considers only fish, pigs, poultry, camels, wild buffaloes, yaks, alpacas, guinea pigs (or cavies), bees, equines, rabbits or any wild animal.
Data extraction and analysis. A data extraction template was created on the basis of Barrett et al.24 and adapted to the scoping review requirements. The data extracted included the author(s), year of publication, type of paper, study location, intervention type, comparator (if any), duration of the intervention, study population and methodology; the outcome measures differentiated by adoption, effects on livestock productivity and effects on livelihoods; and important results in terms of drivers of adoption and potential for scaling. The template was tested by I.B. and A.D. before being finalized. Google forms were used to extract the data by I.B., A.D., N.T., D.C., E.J.R., S.S. and R.L. Conflicts were resolved by a third author as a tie-breaker. The data analysis tables were created and data processed by N.T., I.B. and E.J.R. Data were extracted on 51 peer-reviewed journal articles, 8 papers published in conference proceedings, 7 working papers, 6 reports and 1 book chapter. The quality assessment was conducted on the 73 included papers using three criteria. The first one considered the quality of the study methodology (low versus high), the second assessed the justification of the methodology (low versus
Box 3 | Recommendations
This scoping review has shown that besides technical feed effi-ciency characteristics, various other factors enhance or constrain the adoption of improved feeds. On the basis of our analysis, we recommend the following:
• For ‘knowledge-intensive’ technologies, the capacity of locallivestock keepers and the strength of the extension adviceenvironment to support ongoing implementation should beconsidered. If these are limited, some re-evaluation of thetechnology options or a parallel effort to enhance the neces-sary capacity among local livestock keepers is needed.
• In planning development efforts for livestock feeding, thefocus needs to be on small-scale, semicommercial farmerswho have both the resources and the incentive to make theinvestments needed for feed technologies to succeed. Live-stock keepers whose primary objectives for keeping livestock are not to produce milk and meat for the market need a dif-ferent kind of support and are much less likely to invest innew feed technologies.
• The resource requirements for livestock feed options needcareful consideration. If other uses for land and labour aremore lucrative, livestock keepers are unlikely to invest in new feed options. This requires the whole farming system to beconsidered, as well as how livestock fit into overall livelihood strategies. In addition, unlike food crops, forage seed systems are underdeveloped in many regions (especially sub-Saharan Africa), with unclear demand and limited supply from theprivate sector. Public–private partnerships and investmentmay be needed to develop these supply chains and can belinked to local seed-producing entrepreneurs and collectivegroups.
• Decision makers and development agents should considerthese factors and constraints in deciding when and where totarget investments promoting these technologies. The con-ditions that favour feed technology adoption go far beyondbiophysical suitability, extending to the social, economic andknowledge domains.
Nature PlaNts | VOL 6 | OctOber 2020 | 1242–1249 | www.nature.com/natureplants1248

| 86 Sustainable solutions to end hunger
ArticlesNature PlaNts
high) and the third criterion was an overall quality assessment with three levels (low, medium and high). Each paper was scored by two persons (D.C., A.D., I.B. and R.L.). The levels were first transformed into scores (high, 1; medium, 2; low, 3) and then averaged.
To better understand some of the underlying drivers of adoption of improved feed technologies, a subset of the final papers was selected for more detailed examination if they mentioned analysis of factors that either facilitated adoption or constrained adoption. Of the 73 papers in the full set, 25 met this criterion. Each of these papers was then re-examined by one researcher, and a set of adoption drivers and constraints was identified; the papers were scored on whether they mentioned each adoption driver or constraint. Twelve different adoption drivers emerged, such as increased productivity and good access to markets. Nine constraining factors were also indicated across this set of papers, such as low perceived benefit of the technology and competition with other land uses.
Data availabilityThe data that support the findings of this study are available from the corresponding author upon request.
Received: 18 January 2020; Accepted: 9 September 2020; Published online: 12 October 2020
References 1. Thorne, P. & Conroy, C. in Agricultural Systems 2nd edn (eds Snapp, S. &
Pound, B.) 303–330 (Academic Press, 2017); https://doi.org/10.1016/B978-0-12-802070-8.00009-8
2. Headey, D., Hirvonen, K. & Hoddinott, J. Animal sourced foods and childstunting. Am. J. Agric. Econ. 100.5, 1302–1319 (2018).
3. Gerosa, S. & Skoet, J. Milk Availability: Trends in Production and Demandand Medium-Term Outlook ESA Working Paper No. 12-01 (FAO, 2012);http://www.fao.org/3/a-an450e.pdf
4. Livestock Primary (FAO, accessed January 2020). 5. McDermott, J. J., Staal, S. J., Freeman, H. A., Herrero, M. & Van de Steeg, J. A.
Sustaining intensification of smallholder livestock systems in the tropics.Livest. Sci. 130.1-3, 95–109 (2010).
6. Ayantunde, A. A., Fernández-Rivera, S. & McCrabb, G. (eds) Coping withFeed Scarcity in Smallholder Livestock Systems in Developing Countries(Wageningen UR, University of Reading, Swiss Federal Institute ofTechnology, International Livestock Research Institute, 2005).
7. Thornton, P. K. Livestock production: recent trends, future prospects.Phil. Trans. R. Soc. B 365, 2853–2867 (2010).
8. White, D. S., Peters, M. & Horne, P. Global impacts from improved tropicalforages: a meta-analysis revealing overlooked benefits and costs, evolvingvalues and new priorities. Trop. Grassl. Forrajes Tropicales 1.1, 12–24 (2013).
9. Jutzi, S. C. & Rich, K. M. An Evaluation of CGIAR Centers’ Impact AssessmentWork on Livestock Related Research (1990-2014) (Standing Panel on ImpactAssessment, CGIAR Independent Science and Partnership Council, 2016).
10. Horne, P. M. & Stür, W. W. Developing Forage Technologies with SmallholderFarmers: How to Select the Best Varieties to Offer Farmers in Southeast AsiaMonograph No. 62 (ACIAR, 1999); https://aciar.gov.au/node/7721
11. Franzel, S., Wambugu, C., Arimi, H. K. & Stewart, J. L. in Sustainable LandManagement Sourcebook (Ed. World Bank) 88–94 (World Bank, 2008).
12. Devendra, C. in Crop Residues in Mixed Crop/Livestock Farming Systems (Ed. Renard, C.) 241–268 (CAB International/ICRISAT, 1997).
13. Titterton, M. & Bareeba, F. B. in Silage Making in the Tropics with ParticularEmphasis on Smallholders FAO Plant Production and Protection Paper No.161 (Ed. ‘t Mannetje, L.) Paper 4.0 (FAO, 2000); http://www.fao.org/3/X8486E/x8486e0c.htm
14. Hall, A., Sulaiman, R. & Bezkorowajnyj, P. G. Reframing Technical Change:Livestock Fodder Scarcity Revisited as Innovation Capacity Scarcity—aConceptual Framework (ILRI, UNU/MERIT, 2007).
15. Lowder, S. K., Skoet, J. & Raney, T. The number, size, and distribution offarms, smallholder farms, and family farms worldwide. World Dev. 87, 16–29 (2016).
16. Ayantunde, A. A., Blummel, M., Grings, E. & Duncan, A. J. Price and qualityof livestock feeds in suburban markets of West Africa’s Sahel: case study fromBamako, Mail. Rev. Elev. Méd. Vét. Pays Trop. 67, 13–21 (2014).
17. Sharma, K., Pattanaik, A. K., Anandan, S. & Blümmel, M. Food-feed cropsresearch: a synthesis. Anim. Nutr. Feed Technol. 10S, 1–10 (2010).
18. Bezabih, M. et al. The role of irrigated fodder production to supplement thediet of fattening sheep by smallholders in southern Ethiopia. Trop. Subtrop.Agroecosyst. 19, 263–275 (2016).
19. Jorge, M. a. B. et al. Assessing the Uptake and Disease Impact of Napier Grassin Kenya (ILRI, 2014); https://cgspace.cgiar.org/handle/10568/51336
20. Roothaert, R. & Kerridge, P. C. in Participatory Livestock Research: A Guide (ed. Conroy, C.) 225–236 (ITDG, 2004); https://cgspace.cgiar.org/handle/10568/75672
21. Franzel, S., Wambugu, C. & Tuwei, P. The Adoption and Dissemination ofFodder Shrubs in Central Kenya Working Paper No. 131 (ODI AgriculturalResearch & Extension Network, 2003); https://www.odi.org/sites/odi.org.uk/files/odi-assets/publications-opinion-files/5190.pdf
22. Bosma, R. H. et al. Financial and Social Benefits of New Forage Technologies inMindanao, Philippines and Tuyen Quang, Vietnam CIAT Working Paper(CIAT, 2003); http://agris.fao.org/agris-search/search.do?recordID=PH2003 001044
23. Pandit, B. H. et al. Impacts of market-oriented agroforestry on farm incomeand food security: insights from Kavre and Lamjung districts of Nepal.Agrofor. Syst. 93, 1593–1604 (2019).
24. Barrett, C. B., Ghezzi-Kopel, K., Hoddinott, J., Tennant, E. & Upton, J. The State of the Literature on Individual and Household Resilience: A ScopingReview (Open Science Framework, 2018); https://doi.org/10.17605/OSF.IO/5RGB7
25. Seré, C. & Steinfeld, H. World Livestock Production Systems, Current Status,Issues and Trends Animal Production and Health Paper No. 127 (FAO, 1996).
26. Thornton, P. K. et al. Mapping Poverty and Livestock in the Developing World(ILRI, 2002).
27. Notenbaert, A. et al. Classifying Livestock Production Systems for TargetingAgricultural Research and Development in a Rapidly Changing WorldDiscussion Paper No. 19 (ILRI, 2009).
28. Robinson, T. P. et al. Global Livestock Production Systems (FAO, ILRI, 2011).
AcknowledgementsSix of the authors are in the CGIAR system and thank all partners and donors that globally support our work through their contributions to the CGIAR system and in particular to the Livestock CRP (http://www.cgiar.org/about-us/our-funders).
Author contributionsE.L. and E.E. led the search process and contributed to the title screening and writing the manuscript. I.B. liaised with E.L. and E.E. on the search process, coordinated the paper screening, contributed to the screening at all stages, developed the data extraction template and contributed to the data extraction, data analysis and writing. S.S. identified the overall research question, contributed to the abstract and paper screening, and contributed to the data extraction and writing. A.D. supplied tropical livestock nutrition expertise, contributed to the screening at all stages and contributed to writing. D.C. and R.L. contributed to the screening at all stages and contributed to writing. E.J.R. contributed to the screening at all stages, data analysis and writing. N.T. contributed to the screening at some stages, led the data analysis and contributed to writing.
Competing interestsThe authors declare no competing interests.
Additional informationExtended data is available for this paper at https://doi.org/10.1038/s41477-020-00786-w.
Supplementary information is available for this paper at https://doi.org/10.1038/s41477-020-00786-w.
Correspondence and requests for materials should be addressed to I.B.
Reprints and permissions information is available at www.nature.com/reprints.
Publisher’s note Springer Nature remains neutral with regard to jurisdictional claims in published maps and institutional affiliations.
Open Access This article is licensed under a Creative Commons Attribution 4.0 International License, which permits use, sharing, adap-tation, distribution and reproduction in any medium or format, as long
as you give appropriate credit to the original author(s) and the source, provide a link to the Creative Commons license, and indicate if changes were made. The images or other third party material in this article are included in the article’s Creative Commons license, unless indicated otherwise in a credit line to the material. If material is not included in the article’s Creative Commons license and your intended use is not permitted by statu-tory regulation or exceeds the permitted use, you will need to obtain permission directly from the copyright holder. To view a copy of this license, visit http://creativecommons.org/licenses/by/4.0/.© The Author(s) 2020
Nature PlaNts | VOL 6 | OctOber 2020 | 1242–1249 | www.nature.com/natureplants 1249

Sustainable solutions to end hunger | 87
Articleshttps://doi.org/10.1038/s41477-020-00783-z
1Cornell University, Ithaca, NY, USA. 2CIMMYT, Mexico City, Mexico. 3World Bank, Washington, DC, USA. 4University of Notre Dame, Notre Dame, IN, USA. 5USDA-ARS, East Lansing, MI, USA. 6International Institute for Sustainable Development, Winnipeg, Manitoba, Canada. 7Michigan State University, East Lansing, MI, USA. 8These authors contributed equally: Kevin Pixley, Nkulumo Zinyengere. ✉e-mail: [email protected]
Agriculture and food production are highly vulnerable to climate change. Extreme weather events such as droughts, heat waves and flooding have far-reaching implications for
food security and poverty reduction, especially in rural communi-ties with high populations of small-scale producers who are highly dependent on rain-fed agriculture for their livelihoods and food. Climate change is expected to reduce yields of staple crops by up to 30% due to lower productivity and crop failure1. Moreover, the pro-jected global population growth and changes in diets toward higher demand for meat and dairy products in developing economies will stretch natural resources even further, increasing demands on food production and food insecurity2. To cope with climate change, farm-ers need to modify production and farm management practices, such as adjusting planting time, supplementing irrigation (when possible), intercropping, adopting conservation agriculture, access-ing short- and long-term crop and seed storage infrastructure, and changing crops or planting more climate-resilient crop varieties.
This scoping review examines the conditions that have led to the adoption of climate-resilient crops over the past 30 yr in lower- and middle-income countries. For all countries, but especially those that rely on domestic agriculture production for food security, one of the most critical and proactive measures that can be taken to cope with food insecurity caused by unpredictable weather patterns is for farmers to adopt climate-resilient crops. Climate-resilient crops and crop varieties have enhanced tolerance to biotic and abiotic stresses3 (Box 1). They are intended to maintain or increase crop yields under stress conditions and thereby provide a means of adapting to diminishing crop yields in the face of droughts, higher
average temperatures and other climatic conditions4. Adoption of climate-resilient crops, such as early-maturing cereal crop variet-ies, heat-tolerant varieties, drought-tolerant legumes or tuber crops, crops or varieties with enhanced salinity tolerance, or rice with sub-mergence tolerance, can help farmers to better cope with climate shocks. Climate-resilient crops and crop varieties increase farmers’ resilience to climate change, but despite their benefits, adoption rates by small-scale producers are not as high as expected in some cropping systems4–6. In this study, we focus on scoping (review-ing and synthesizing) the published evidence on the adoption of climate-resilient crops and crop varieties from climate-vulnerable countries and countries that have experienced climate-related impacts as determined by 45 indicators established by the Notre Dame Global Adaptation Initiative.
Overall, we find that the most important determinants of adop-tion of climate-resilient crops are the availability and effective-ness of extension services and outreach, education level of heads of households, including some awareness of climate change and adaptation measures, and farmers’ access to inputs, especially seeds and fertilizers. On the basis of the collected evidence, this scop-ing review presents a series of pathways and interventions that can contribute to higher adoption rates of climate-resilient crops and reduce dis-adoption (Box 2).
ResultsA scoping review aims to explore the key concepts underpinning a research area and the main sources and types of evidence available7. Established scoping review methods provide an evidence-based
A scoping review of adoption of climate-resilient crops by small-scale producers in low- and middle-income countriesMaricelis Acevedo 1 ✉, Kevin Pixley 2,8, Nkulumo Zinyengere3,8, Sisi Meng4, Hale Tufan 1, Karen Cichy5, Livia Bizikova6, Krista Isaacs 7, Kate Ghezzi-Kopel 1 and Jaron Porciello 1
Climate-resilient crops and crop varieties have been recommended as a way for farmers to cope with or adapt to climate change, but despite the apparent benefits, rates of adoption by smallholder farmers are highly variable. Here we present a scoping review, using PRISMA-P (Preferred Reporting Items for Systematic review and Meta-Analysis Protocols), examin-ing the conditions that have led to the adoption of climate-resilient crops over the past 30 years in lower- and middle-income countries. The descriptive analysis performed on 202 papers shows that small-scale producers adopted climate-resilient crops and varieties to cope with abiotic stresses such as drought, heat, flooding and salinity. The most prevalent trait in our dataset was drought tolerance, followed by water-use efficiency. Our analysis found that the most important determinants of adop-tion of climate-resilient crops were the availability and effectiveness of extension services and outreach, followed by educa-tion levels of heads of households, farmers’ access to inputs—especially seeds and fertilizers—and socio-economic status of farming families. About 53% of studies reported that social differences such as sex, age, marital status and ethnicity affected the adoption of varieties or crops as climate change-adaptation strategies. On the basis of the collected evidence, this study presents a series of pathways and interventions that could contribute to higher adoption rates of climate-resilient crops and reduce dis-adoption.
Nature PlaNts | VOL 6 | OCTOBER 2020 | 1231–1241 | www.nature.com/natureplants 1231

88 | Sustainable solutions to end hunger
Articles Nature PlaNts
framework for systematically searching and thematically character-izing the extent, range and nature of existing evidence. A PRISMA-P protocol for this scoping review8 was registered on 4 June 2019 on the Open Science Framework. We performed double-blind title and abstract screening of 5,649 citations, selecting 568 papers for full-text screening using a priori inclusion and exclusion criteria; 202 papers met the inclusion criteria for data extraction. The inclu-sion and exclusion criteria are available in the protocol (Methods and Supplementary Information), and the data-extraction proce-dure and the PRISMA flow diagram of included and excluded stud-ies are presented in the Supplementary Information.
Of the 202 papers included, 89% were published in peer-reviewed journals and 11% were published in the grey literature. Eighty-seven studies used mixed methods, 82 used quantitative methods and 33 studies used qualitative methods.
Evidence of adoption of climate-resilient crops. Of the 29 evaluated potential social and economic factors related to adoption, interven-tions related to the availability, effectiveness and access to agricul-tural extension services were the most prominent determinants of the adoption of climate-resilient crops in low- and middle-income countries. Nearly 50% of the studies identified extension services and awareness outreach as important factors for the effective adop-tion of climate-resilient crops in low- and middle-income countries (Fig. 1). The individual figures per characteristic are presented in
detailed summary graphs in Extended Data Figs. 1–5. The deter-minants are plotted in bar charts to provide additional context and visualization. The unit of analysis is per study, and a single study can report on multiple determinants.
The principal factors determining adoption of climate-resilient crops or crop varieties were largely consistent across the three regions with robust numbers of publications: sub-Saharan Africa, South Asia and East Asia. The most important determinants across these regions were, in order of importance: (1) access to extension services or information about options, (2) education level of head of household, (3) access to needed farm inputs, (4) experience and skills of farmer, (5) social status, and (6) access to climate informa-tion (Fig. 2). Access to extension services and information about options, and education level of head of household were among the top five determinants for adoption for all three regions. Access to farm inputs was the first and second most important determinants for adoption in South Asia and sub-Saharan Africa, respectively, but was only sixth most important for East Asia. Experience and skills of farmers were first and third most important determinants for adoption in East Asia and sub-Saharan Africa, respectively, and sixth most important in South Asia. Social status was highly important in South Asia and sub-Saharan Africa, but only moder-ately important for determining adoption of technologies in East Asia. Although there were few papers and thus limited information for Latin America and Middle East and North Africa regions, the
Box 1 | Definitions and assumptions
• Small-scale food producers. Definitions of small-scale foodproducers in the literature are mostly based on four criteria:land size, labour input (especially of family members), mar-ket orientation and economic size2. Land size is the mostcommonly used criterion. The clear majority of definitionsof small-scale food producers are based on the acreage of thefarm and/or a headcount of the livestock raised. Sometimes an arbitrary size is created (commonly 2 hectares or less), but oth-erwise a relative measure is used, which considers the averagesize of landholdings in the country, as well as a poverty meas-ure (farms that generate 40% or less of the median income).A second important criterion of small-scale producer is thesource of the labour used on the farm (whether it is providedby the household that runs the farm or workers who are paid a wage). A third criterion is the extent to which the farm outputis sold to market rather than consumed by the farm household or bartered with neighbours (some authors caution that this isalso contextual and many small-scale producers are engaged in commercial markets). A fourth criterion is economic size (thevalue of the farm’s production)56.
• Climate-vulnerable countries are countries that are con-sidered to be vulnerable to climate change. The ND-GAINindex presents a list of countries ranked by vulnerability toclimate change and readiness to respond (https://gain.nd.edu/our-work/country-index/rankings/).
• Climate resiliency is the capacity for a socio-ecological system to absorb stresses and maintain function in the face of external stresses imposed on it by climate change, and adapt, reorgan-ize and evolve into more desirable configurations that improve the sustainability of the system, leaving it better prepared forfuture climate change impacts.
• Climate change adaptation includes planned or autonomousactions that seek to lower the risks posed by climatic changes,either by reducing exposure and sensitivity to climate hazardsor by reducing vulnerabilities and enhancing capacities to
respond to them. Adaptation also includes exploiting any ben-eficial opportunities presented by changing climates.
• Climate-resilient crops are crops and crop varieties that haveenhanced tolerance to biotic and abiotic stresses. They areintended to maintain or increase crop yields under stress con-ditions such as drought, flooding (submergence), heat, chilling,freezing and salinity, and thereby provide a means of adapting to diminishing crop yields in the face of droughts, higher and lower than seasonal temperatures, and other climatic conditions3,57.
• Climate-smart agriculture is an approach or set of practicesaimed at increasing agricultural productivity and incomessustainably, while building resilience and adapting to climatechange conditions and reducing and/or removing greenhousegas emissions where possible6.
• Conservation agriculture is a farming system that promotesminimum soil disturbance (that is, no tillage), maintenance ofa permanent soil cover, and diversification of plant species; forinstance, through crop rotation58.
• Adoption is the stage at which technology has been selectedand is being used over a sustained period by an individual oran organization. Adoption is more than acceptance; it is inclu-sion of a product or innovation among the common practicesof the adopter.
• Gender refers to the social relations between men and women, boys and girls, and how this is socially constructed. Genderroles are dynamic and change over time.
• Agricultural extension is a form of outreach that sharesresearch-based knowledge with farmers and communities inorder to improve agricultural practices and productivity. Theapproach to delivering these services varies in terms of farmerparticipation and engagement. This range includes technol-ogy transfer, advisory, experiential and iterative learning,farmer-led extension services (such as farmer field schools),and facilitation, in which farmers define their own problemsand develop their own solutions.
Nature PlaNts | VOL 6 | OctOber 2020 | 1231–1241 | www.nature.com/natureplants1232

Sustainable solutions to end hunger | 89
ArticlesNature PlaNts
education level of the head of household was cited as the most important determinant for adoption in both regions.
The climate-resilient crops are included in this scoping review on the basis of data found in the included papers (Fig. 3). We clas-sified them as cereals (maize, rice, grain (general), wheat, millet, sorghum barley and teff), legumes (soybean, chickpeas, cowpea, common beans, mung beans and groundnut), vegetables and fruits (tomato, eggplant, pepper, cocoa, mango, clover, garlic, mustard, pea, onion, saffron, green grams and cola nut) and roots, tubers and bananas (banana, plantain, yam, sweet potato, cassava and potato). Thirty-three per cent of the studies did not report on a specific crop or variety in their research; of the studies that did report on a specific crop or variety, 67% reported on cereals only. Despite their importance for food security and nutrition, less than 1% of the studies reported on legumes only and 25% reported on a combina-tion of cereals and legumes, roots, tubers, bananas, vegetables and fruits. We also assessed the 202 papers to determine the purpose of
the crops as primarily for human consumption (44%), for human consumption and animal feed (26%) or not clearly stated (30%).
Climate-resilient crops and crop varieties were adopted to cope with abiotic stresses such as drought, heat, flooding, salinity and shorter growing season (early-maturing crops), as well as pests associated with changes in weather or climate patterns (disease and pest resistance) (Fig. 4). Climate-resilient crops and crop varieties were also adopted to address general challenges associated with climate change and crop system sustainability, such as to improve moisture retention in soil, improve soil quality, and reduce erosion (planting of cover crops and legumes and to reduce vulnerability to food insecurity). The most studied trait in the dataset was drought tolerance, followed by water-use efficiency and earlier maturity. Adoption of early-maturing crops enables farmers to cope with cli-mate change-induced weather variability by allowing them to adjust planting dates when rains are delayed and reducing the chances of yield losses caused by drought or heat waves late in the growing sea-son. Changing of planting dates was identified in 32% of the papers as a strategy to cope with climate change.
In general, the evidence suggests that farmers do not adopt a new crop or crop variety without changing other practices. A total of 136 papers (67%) describe that farmers adopt climate-resilient crops in conjunction with other climate-resilient technologies such as climate-smart agriculture (CSA) schemes and conservation agri-culture (CA). Other climate-resilient technologies included: plant-ing of trees and shrubs, reduced or increased investment in livestock and modified planting dates and irrigation (Table 1).
Seed and adoption of climate-resilient crops. Seventy-three papers mentioned the topic of seed. The major themes associated with seed that emerged with direct evidence drawn from the papers are summarized in Table 2. Access to and availability of seed were the most prevalent themes, with 60% of papers mentioning these as issues in the adoption of climate-resilient strategies. Social networks such as farmers’ organizations or co-operatives, as well as access to information, were also reported as facilitators of adoption. These themes refer to different social groups and ways in which farmers can exchange seed or get information about seed.
Social differences and adoption of climate-resilient crops. About 53% of studies reported that social differences (such as sex, educa-tion and age of household head) influence adoption of varieties or crops as mitigation strategies against the effects of climate change, whereas 30% of studies did not report any effect of social difference. Fifteen per cent of studies did not include data on social differences. Of the studies that identified social differences as influencing adop-tion of climate-resilient crops and crop varieties, education (22%), sex (28 %), age (24%) and family size (14%) emerged as the most important factors. Income (6%), access to information (5%), marital status (2%) and experience (2%) were also mentioned, but much less frequently. We examined the papers for sex disaggregation of data, in which sex of household heads was considered. Forty-five per cent of studies reported on the sex of respondents, with 39% reporting on both male and female household heads, 5% including men only, and only 1% of studies including only female respondents. Most of the studies explored social differences only superficially, by includ-ing variables in surveys, but few substantiated these findings with follow-up qualitative research to understand the social dynamics driving the observed adoption decisions.
The studies largely concur that socio-economic status of farmers plays a large part in their adoption of climate-resilient technologies. Thirty-one per cent of the studies highlighted the socio-economic status of farmers. Various studies indicated that a nuanced under-standing of the socio-economic status of farmers is vital for the tar-geting of climate-resilient crop technology interventions and their adoption and sustainability in practice. Thirteen studies reported a
Box 2 | Summary methods
• A double-blind title and abstract screening was performedon 5,650 articles that were identified through a compre-hensive search of multiple databases and grey literaturesources and then uploaded to the systematic review soft-ware Covidence. The full search protocol is described inthe Supplementary Information.
• The resulting 886 articles were subjected to a second roundof full-text screening, and 684 articles that did not meet theinclusion criteria were excluded, leaving 202 articles thatwere read in full and included in the qualitative synthesis.
• We performed data extraction on each of the 202 includedstudies. A data-extraction template (available in the Sup-plementary Information) was developed to documentthe data, study type and context of each citation and allthemes of interest.
• The extracted data were qualitatively summarized on thebasis of emerging themes and with the aim of providing rec-ommendations to donors and policy makers.
• Among the 684 articles that were excluded at the full-textscreening phase, 230 were excluded because they did notinclude an explicit analysis of factors for climate-resilientcrop adoption and 204 were excluded because there wasno explicit focus on crops, varieties, seed, planting materialsor germplasm.
The inclusion criteria for this study were: (1) The study focus includes population of small-scale food pro-
ducers, as defined in the protocol (2) The study was published after 1990 (1990 was the year the
Intergovernmental Panel on Climate Change (IPCC) pro-duced its first report on climate change).
(3) The study includes original research (qualitative and quan-titative reports) and/or a review of existing research, includ-ing grey literature.
(4) An explicit focus or clear relevance on climate changeresilience or climate change adaptation, as defined inthe protocol.
(5) An explicit focus on crops, varieties, seed, planting materials or germplasm.
(6) The study mentions factors for adoption, as defined inthe protocol.
(7) The area of focus of the study includes target populationsin lower- and middle-income countries, as defined by theWorld Bank.
Nature PlaNts | VOL 6 | OctOber 2020 | 1231–1241 | www.nature.com/natureplants 1233

90 | Sustainable solutions to end hunger
Articles Nature PlaNts
positive effect of farmer income on adoption. Farmers with access to finance, such as risk transfers (for example, insurance or remit-tances) and credit (for example, bank loans or community loans), were more likely to adopt climate-resilient crop technologies. Farmers who reported constrained credit were less likely to grow modern crops and more likely to cultivate local varieties9. This is partly because the lack of cash or credit may prevent farmers from using purchased inputs10.
Evidence on the dis-adoption of climate-resilient crops. Dis-adoption of climate-resilient crops and crop varieties was dis-cussed in 12 of the 202 papers included in our evidence synthesis. The major reasons for dis-adoption included technology not meeting expectations due to poor performance or quality of the technology
or variety (8 papers), government policies (3 papers), technical con-straints (2 papers), labour shortages (1 paper) or financial constraints (1 paper). Eight of the twelve studies indicated that dis-adoption was specifically due to the performance of a crop variety, and four of these eight studies indicated that the varieties’ performance under stress conditions did not meet farmers’ expectations10–13.
DiscussionThe primary goal of this scoping review was to identify factors in adoption of climate-resilient crops in climate-vulnerable countries. Insights into these factors may inform the design of interventions aimed at equipping farmers to adopt climate-resilient technolo-gies before experiencing devastating impacts of climate change and encourage adoption best practices14,15.
Access to advisory
networks and
knowledge about
climate change
Climate information
Education
Experience and skills
Farmer knowledge and
perceptions of crops
and traits
Social networks and
cooperatives
Crops fit for purpose
Biotic and climate
Education, experience
and household
characteristics
Social and
economic status of
household
Resource
availability and wealth
Access
to fin
ance
and
techn
ical re
sourc
es
(not a
dviso
ry)
Access to labour
Distance to seed and
fertilizer m
arkets
Farm infrastructure andequipment (irrigation)
Farm
inpu
ts (s
eeds
and
ferti
lizer
)
Land (size and tenure)Enabling environm
ent
Governm
ent
policy and programm
es
Exte
nsion
,awa
rene
ss
and
infor
mat
ion
Finan
ce in
strum
ents
(tran
sfer a
nd cr
edit)
Fig. 1 | Summary of determinants of adoption of climate-resilient crops and crop varieties by farmers. The inner ring outlines the five broad categories to which the 29 social and economic factors are mapped. The outer ring shows the factors within each broad category that were most frequently mentioned across the included studies. The relative area occupied by categories indicates their relevance. Charts with the full data and frequencies for each category are presented in the Supplementary Information. For illustrative purposes, factors mentioned in less than 20% of studies as determinants of adoption were excluded from this figure.
Nature PlaNts | VOL 6 | OCTOber 2020 | 1231–1241 | www.nature.com/natureplants1234
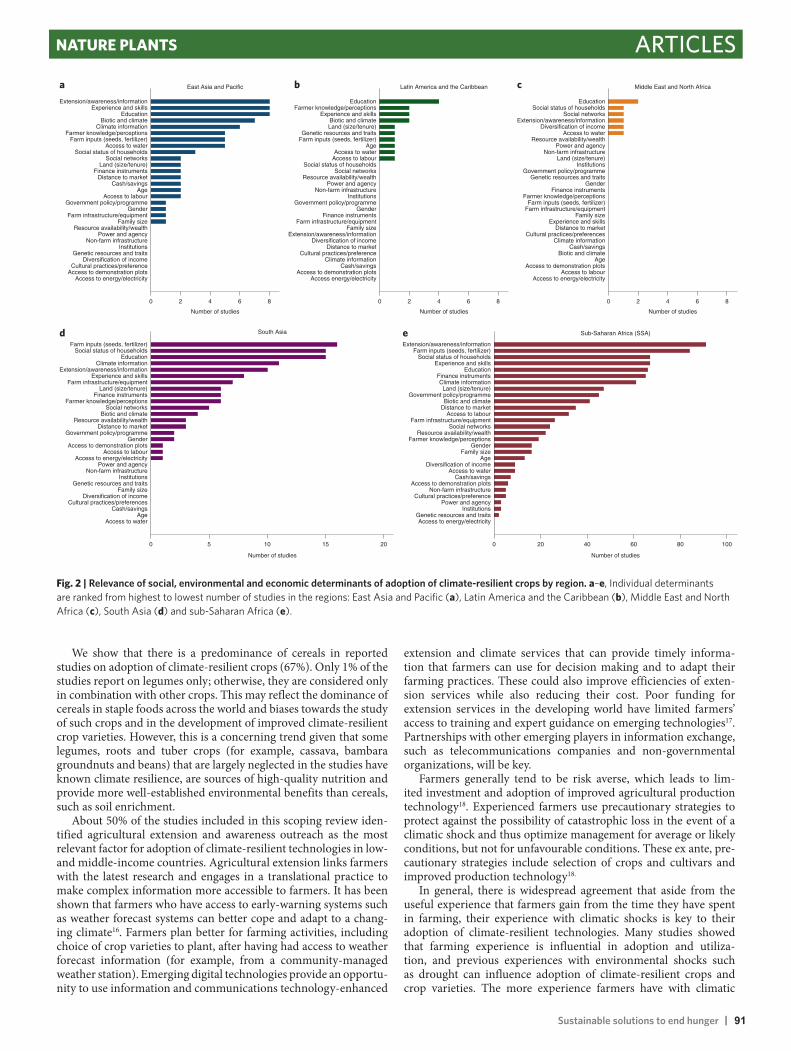
Sustainable solutions to end hunger | 91
ArticlesNature PlaNts
We show that there is a predominance of cereals in reported studies on adoption of climate-resilient crops (67%). Only 1% of the studies report on legumes only; otherwise, they are considered only in combination with other crops. This may reflect the dominance of cereals in staple foods across the world and biases towards the study of such crops and in the development of improved climate-resilient crop varieties. However, this is a concerning trend given that some legumes, roots and tuber crops (for example, cassava, bambara groundnuts and beans) that are largely neglected in the studies have known climate resilience, are sources of high-quality nutrition and provide more well-established environmental benefits than cereals, such as soil enrichment.
About 50% of the studies included in this scoping review iden-tified agricultural extension and awareness outreach as the most relevant factor for adoption of climate-resilient technologies in low- and middle-income countries. Agricultural extension links farmers with the latest research and engages in a translational practice to make complex information more accessible to farmers. It has been shown that farmers who have access to early-warning systems such as weather forecast systems can better cope and adapt to a chang-ing climate16. Farmers plan better for farming activities, including choice of crop varieties to plant, after having had access to weather forecast information (for example, from a community-managed weather station). Emerging digital technologies provide an opportu-nity to use information and communications technology-enhanced
extension and climate services that can provide timely informa-tion that farmers can use for decision making and to adapt their farming practices. These could also improve efficiencies of exten-sion services while also reducing their cost. Poor funding for extension services in the developing world have limited farmers’ access to training and expert guidance on emerging technologies17. Partnerships with other emerging players in information exchange, such as telecommunications companies and non-governmental organizations, will be key.
Farmers generally tend to be risk averse, which leads to lim-ited investment and adoption of improved agricultural production technology18. Experienced farmers use precautionary strategies to protect against the possibility of catastrophic loss in the event of a climatic shock and thus optimize management for average or likely conditions, but not for unfavourable conditions. These ex ante, pre-cautionary strategies include selection of crops and cultivars and improved production technology18.
In general, there is widespread agreement that aside from the useful experience that farmers gain from the time they have spent in farming, their experience with climatic shocks is key to their adoption of climate-resilient technologies. Many studies showed that farming experience is influential in adoption and utiliza-tion, and previous experiences with environmental shocks such as drought can influence adoption of climate-resilient crops and crop varieties. The more experience farmers have with climatic
0 2 4 6 8
East Asia and Pacific
Number of studies Number of studies Number of studies
Access to energy/electricityAccess to demonstration plots
Cultural practices/preferenceDiversification of income
Genetic resources and traitsInstitutions
Non-farm infrastructurePower and agency
Resource availability/wealthFamily size
Farm infrastructure/equipmentGender
Government policy/programmeAccess to labour
AgeCash/savings
Distance to marketFinance instruments
Land (size/tenure)Social networks
Social status of householdsAccess to water
Farm inputs (seeds, fertilizer)Farmer knowledge/perceptions
Climate informationBiotic and climate
EducationExperience and skills
Extension/awareness/information
a
d e
b c
0 2 4 6 8
Latin America and the Caribbean
Access energy/electricityAccess to demonstration plots
Cash/savingsClimate information
Cultural practices/preferenceDistance to market
Diversification of incomeExtension/awareness/information
Family sizeFarm infrastructure/equipment
Finance instrumentsGender
Government policy/programmeInstitutions
Non-farm infrastructurePower and agency
Resource availability/wealthSocial networks
Social status of householdsAccess to labourAccess to water
AgeFarm inputs (seeds, fertilizer)Genetic resources and traits
Land (size/tenure)Biotic and climate
Experience and skillsFarmer knowledge/perceptions
Education
0 2 4 6 8
Middle East and North Africa
Access to energy/electricityAccess to labour
Access to demonstration plotsAge
Biotic and climateCash/savings
Climate informationCultural practices/preferences
Distance to marketExperience and skills
Family sizeFarm infrastructure/equipmentFarm inputs (seeds, fertilizer)
Farmer knowledge/perceptionsFinance instruments
GenderGenetic resources and traits
Government policy/programmeInstitutions
Land (size/tenure)Non-farm infrastructure
Power and agencyResource availability/wealth
Access to waterDiversification of income
Extension/awareness/informationSocial networks
Social status of householdsEducation
0 5 10 15 20
Number of studies
South Asia
Access to waterAge
Cash/savingsCultural practices/preferences
Diversification of incomeFamily size
Genetic resources and traitsInstitutions
Non-farm infrastructurePower and agency
Access to energy/electricityAccess to labour
Access to demonstration plotsGender
Government policy/programmeDistance to market
Resource availability/wealthBiotic and climate
Social networksFarmer knowledge/perceptions
Finance instrumentsLand (size/tenure)
Farm infrastructure/equipmentExperience and skills
Extension/awareness/informationClimate information
EducationSocial status of households
Farm inputs (seeds, fertilizer)
0 20 40 60 80 100
Number of studies
Sub-Saharan Africa (SSA)
Access to energy/electricityGenetic resources and traits
InstitutionsPower and agency
Cultural practices/preferenceNon-farm infrastructure
Access to demonstration plotsCash/savings
Access to waterDiversification of income
AgeFamily size
GenderFarmer knowledge/perceptions
Resource availability/wealthSocial networks
Farm infrastructure/equipmentAccess to labour
Distance to marketBiotic and climate
Government policy/programmeLand (size/tenure)
Climate informationFinance instruments
EducationExperience and skills
Social status of householdsFarm inputs (seeds, fertilizer)
Extension/awareness/information
Fig. 2 | Relevance of social, environmental and economic determinants of adoption of climate-resilient crops by region. a–e, Individual determinants are ranked from highest to lowest number of studies in the regions: East Asia and Pacific (a), Latin America and the Caribbean (b), Middle East and North Africa (c), South Asia (d) and sub-Saharan Africa (e).
Nature PlaNts | VOL 6 | OCtObEr 2020 | 1231–1241 | www.nature.com/natureplants 1235

92 | Sustainable solutions to end hunger
Articles Nature PlaNts
shocks, the more likely they are to be receptive to the adoption of related climate-resilient technologies. For example, experience with drought shock in the agro-ecological zone of Brong Ahafo, Ghana, increased the probability of adoption of drought-tolerant varieties by 15%, and farmers reported that drought shock was the primary reason for adoption of drought-tolerant varieties19.
It has been widely acknowledged that education levels of farm-ers have a positive correlation with technology adoption, and our synthesis demonstrates that this is also relevant for the adoption of climate-resilient crops16,20–22. Highly educated heads of households
are more likely to readily accept and access information about new technologies in a shorter period of time than less educated heads of households; education was measured as educational attainment and reported in 49% of the studies. A study based in Zimbabwe showed a 52% decrease in production of traditional sorghum varieties in favour of new varieties better suited to drier conditions for every additional year of schooling, and a 5% increase in growing new early-maturing varieties23.
Changing crop varieties is one of the most frequently cited climate-resiliency strategies for both men and women farmers, but
Cereal
Roots, tubersand bananas
Legumes
Vegetables
Number of articles
a b
c d
0–1 2 3 4–5 6–17
S
N
W E
Fig. 3 | Map of evidence distribution by country and crops. a–d, Countries are colour-coded from yellow to red based on number of relevant studies involving cereal (a), legumes (b) vegetables (c) and roots, tubers and bananas (d).
0
20
40
60
80
100
120
140
160
South Asia East Asia and Pacific Latin America and the Caribbean Sub-Saharan Africa Middle East and North Africa
Num
ber
of s
tudi
es (
n =
202
)
Drought tolerance Water efficiency Shorter maturity Pest resistance Disease resistance Longer maturity Heat tolerance Trees and shrubs Cover crops
Fig. 4 | Climate-resilient trait or crop change adopted in response to climate change. Studies are divided into the same geographical regions as in Fig. 2.
Nature PlaNts | VOL 6 | OCtOber 2020 | 1231–1241 | www.nature.com/natureplants1236
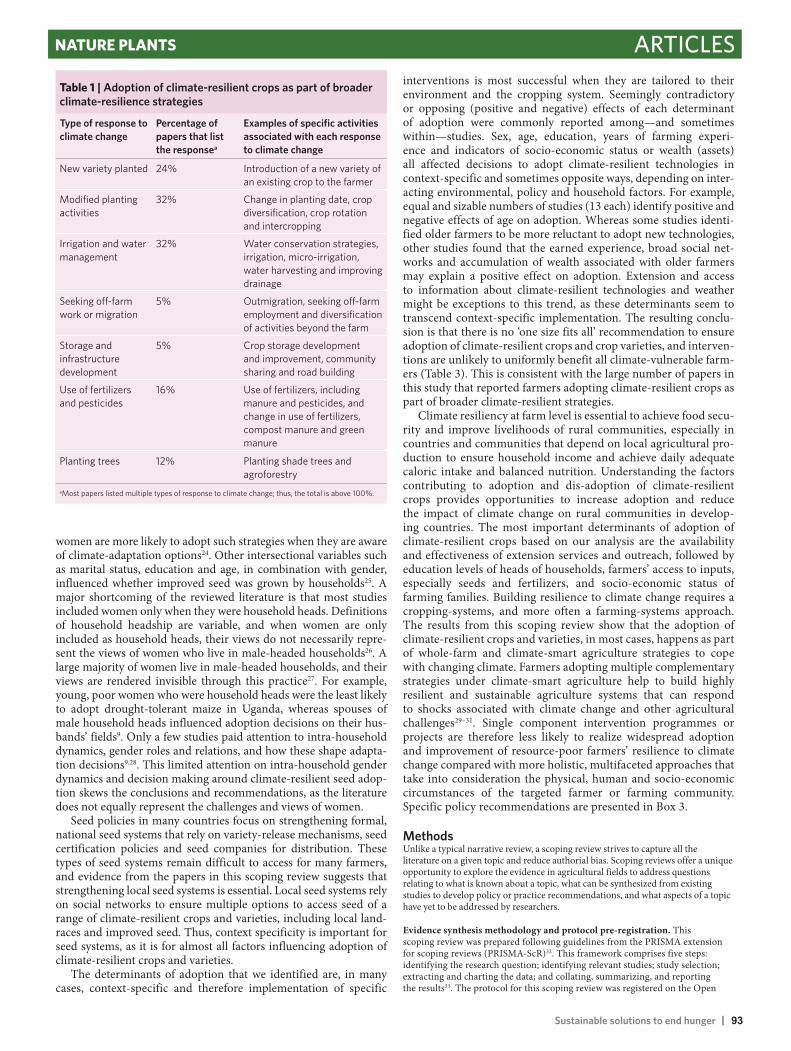
Sustainable solutions to end hunger | 93
ArticlesNature PlaNts
women are more likely to adopt such strategies when they are aware of climate-adaptation options24. Other intersectional variables such as marital status, education and age, in combination with gender, influenced whether improved seed was grown by households25. A major shortcoming of the reviewed literature is that most studies included women only when they were household heads. Definitions of household headship are variable, and when women are only included as household heads, their views do not necessarily repre-sent the views of women who live in male-headed households26. A large majority of women live in male-headed households, and their views are rendered invisible through this practice27. For example, young, poor women who were household heads were the least likely to adopt drought-tolerant maize in Uganda, whereas spouses of male household heads influenced adoption decisions on their hus-bands’ fields9. Only a few studies paid attention to intra-household dynamics, gender roles and relations, and how these shape adapta-tion decisions9,28. This limited attention on intra-household gender dynamics and decision making around climate-resilient seed adop-tion skews the conclusions and recommendations, as the literature does not equally represent the challenges and views of women.
Seed policies in many countries focus on strengthening formal, national seed systems that rely on variety-release mechanisms, seed certification policies and seed companies for distribution. These types of seed systems remain difficult to access for many farmers, and evidence from the papers in this scoping review suggests that strengthening local seed systems is essential. Local seed systems rely on social networks to ensure multiple options to access seed of a range of climate-resilient crops and varieties, including local land-races and improved seed. Thus, context specificity is important for seed systems, as it is for almost all factors influencing adoption of climate-resilient crops and varieties.
The determinants of adoption that we identified are, in many cases, context-specific and therefore implementation of specific
interventions is most successful when they are tailored to their environment and the cropping system. Seemingly contradictory or opposing (positive and negative) effects of each determinant of adoption were commonly reported among—and sometimes within—studies. Sex, age, education, years of farming experi-ence and indicators of socio-economic status or wealth (assets) all affected decisions to adopt climate-resilient technologies in context-specific and sometimes opposite ways, depending on inter-acting environmental, policy and household factors. For example, equal and sizable numbers of studies (13 each) identify positive and negative effects of age on adoption. Whereas some studies identi-fied older farmers to be more reluctant to adopt new technologies, other studies found that the earned experience, broad social net-works and accumulation of wealth associated with older farmers may explain a positive effect on adoption. Extension and access to information about climate-resilient technologies and weather might be exceptions to this trend, as these determinants seem to transcend context-specific implementation. The resulting conclu-sion is that there is no ‘one size fits all’ recommendation to ensure adoption of climate-resilient crops and crop varieties, and interven-tions are unlikely to uniformly benefit all climate-vulnerable farm-ers (Table 3). This is consistent with the large number of papers in this study that reported farmers adopting climate-resilient crops as part of broader climate-resilient strategies.
Climate resiliency at farm level is essential to achieve food secu-rity and improve livelihoods of rural communities, especially in countries and communities that depend on local agricultural pro-duction to ensure household income and achieve daily adequate caloric intake and balanced nutrition. Understanding the factors contributing to adoption and dis-adoption of climate-resilient crops provides opportunities to increase adoption and reduce the impact of climate change on rural communities in develop-ing countries. The most important determinants of adoption of climate-resilient crops based on our analysis are the availability and effectiveness of extension services and outreach, followed by education levels of heads of households, farmers’ access to inputs, especially seeds and fertilizers, and socio-economic status of farming families. Building resilience to climate change requires a cropping-systems, and more often a farming-systems approach. The results from this scoping review show that the adoption of climate-resilient crops and varieties, in most cases, happens as part of whole-farm and climate-smart agriculture strategies to cope with changing climate. Farmers adopting multiple complementary strategies under climate-smart agriculture help to build highly resilient and sustainable agriculture systems that can respond to shocks associated with climate change and other agricultural challenges29–31. Single component intervention programmes or projects are therefore less likely to realize widespread adoption and improvement of resource-poor farmers’ resilience to climate change compared with more holistic, multifaceted approaches that take into consideration the physical, human and socio-economic circumstances of the targeted farmer or farming community. Specific policy recommendations are presented in Box 3.
MethodsUnlike a typical narrative review, a scoping review strives to capture all the literature on a given topic and reduce authorial bias. Scoping reviews offer a unique opportunity to explore the evidence in agricultural fields to address questions relating to what is known about a topic, what can be synthesized from existing studies to develop policy or practice recommendations, and what aspects of a topic have yet to be addressed by researchers.
Evidence synthesis methodology and protocol pre-registration. This scoping review was prepared following guidelines from the PRISMA extension for scoping reviews (PRISMA-ScR)32. This framework comprises five steps: identifying the research question; identifying relevant studies; study selection; extracting and charting the data; and collating, summarizing, and reporting the results33. The protocol for this scoping review was registered on the Open
table 1 | Adoption of climate-resilient crops as part of broader climate-resilience strategies
Type of response to climate change
Percentage of papers that list the responsea
Examples of specific activities associated with each response to climate change
New variety planted 24% Introduction of a new variety of an existing crop to the farmer
Modified planting activities
32% Change in planting date, crop diversification, crop rotation and intercropping
Irrigation and water management
32% Water conservation strategies, irrigation, micro-irrigation, water harvesting and improving drainage
Seeking off-farm work or migration
5% Outmigration, seeking off-farm employment and diversification of activities beyond the farm
Storage and infrastructure development
5% Crop storage development and improvement, community sharing and road building
Use of fertilizers and pesticides
16% Use of fertilizers, including manure and pesticides, and change in use of fertilizers, compost manure and green manure
Planting trees 12% Planting shade trees and agroforestry
aMost papers listed multiple types of response to climate change; thus, the total is above 100%.
Nature PlaNts | VOL 6 | OCtOber 2020 | 1231–1241 | www.nature.com/natureplants 1237

94 | Sustainable solutions to end hunger
Articles Nature PlaNts
Science Framework before study selection8. The full protocol is available in the Supplementary Information.
Research question. The guiding question for this scoping review was, ‘what are determinants that lead small-scale producers in low-and middle-income countries to adopt climate-resilient crops and crop varieties?’.
Information sources, search methods and citation management. An exhaustive search strategy was developed to identify all available research pertaining to facilitators that lead small-scale producers in low- and middle-income countries to adopt climate-resilient crop varieties. Search terms included variations of the key concepts in the research question: small-scale producers, germplasm and climate resilience. The search algorithms were formatted for compatibility with each database so that they may be reproduced in their entirety, and they can be accessed at https://osf.io/sfzcm/. Searches were performed in the following electronic databases by K.G.K.: CAB Abstracts and Global Health (accessed via Web of Science), Web of Science Core Collection (accessed via Web of Science) and Scopus (accessed via Elsevier). A comprehensive search of grey literature sources was also conducted. Search results were de-duplicated to remove redundant citations identified from multiple sources. To facilitate acceleration of the screening process, machine-derived metadata were added to individual citations, for example, identifying populations, geographies, interventions and outcomes of interest. This enabled accelerated identification of potential articles for exclusion at the title- or abstract-screening stage.
Eligibility criteria and study selection. Studies were included for data extraction and analysis if (1) their focus included a population of small-scale food producers;
(2) they were published between 1990 and the start of the search (1990 is when the IPCC first met and produced their first report on climate change); (3) they presented original research (qualitative and quantitative reports) and/or reviewed existing research, including grey literature; (4) they explicitly focused on or were clearly relevant to climate change resiliency or climate change adaptation; (5) they explicitly focused on crops, varieties, seed, planting materials or germplasm; (6) they mentioned factors for adoption; (7) they included target populations in countries classified as lower and middle-income by the World Bank. Studies that did not meet all of the aforementioned inclusion criteria were excluded.
Study selection was performed in two stages. In a first step, articles were uploaded to the systematic review software Covidence, and title and abstract screening was performed by all authors to exclude articles that did not meet all inclusion criteria. Each article was reviewed by two independent authors, and discrepancies were resolved by a third independent author. Full-text screening was then performed by M.A., K.C., S.M., N.Z., H.T., K.P., L.B. and K.I., and inclusion decisions were made by a single reviewer. Studies included in full-text screening were those that met all inclusion criteria or those whose eligibility could not be established during title and abstract screening. The PRIMSA flow diagram in the Supplementary Information presents the study selection process and indicates the number of articles excluded at each phase of screening.
Data extraction and analysis. A data-extraction template (available in the Supplementary Information) was developed to document the data and study type and context of each citation and all themes of interest. The data extraction first collected data on the paper quality, study location, population socio-economic data of the population and crop and cropping system characteristics. Second, the data-extraction template was used to collect information about the determinants
table 2 | Seed factors associated with adoption of climate-resilient crops and crop varieties
Emergent themes about seed
Summary of the evidence
Access Access to seed or the ability to afford seed was a principal barrier for small-scale farmers’ adoption of climate-resilient varieties. Several papers mentioned that cost was even more challenging for women and farmers with fewer assets, smaller parcels of land or lower economic status. At least four papers suggested seed subsidies as a strategy to improve access to seed35–38.
Availability Availability, or the ability to acquire seed on time, in the quantity needed and within reasonable proximity, was a determinant of adoption related to seed. Community seed banks also enhanced availability of seed.
Social networks Participation in social networks that enable the exchange of seed was a climate-resilient strategy for farmers. Participation in social networks, which included community-based seed banks, seed organizations, farmer groups and intra-village or neighbour networks improved the adoption of seed (or new varieties for climate resilience), and these social networks also increased the spread of seed that was distributed as part of development projects. Conversely, one paper reported that seed did not spread beyond the immediate beneficiaries of the project39. Another report stressed the importance of reciprocity within strong social networks as important for maintaining access to seed40, and several others recommended supporting social networks to strengthen seed systems40–44. According to three papers, community seed banks strengthened social networks for exchange, provided landraces for participatory crop improvement, and increased the availability of seed44–46. Integration of informal and formal seed system elements is important because most of the seeds planted by small farmers are uncertified and sourced through informal seed system channels or social networks47. Social networks also have an important role in enhancing farmers’ access to information.
Information Farmers lacked information about varieties, adaptation and attributes, or did not know where to acquire seed. Extension services, seed companies, seed suppliers and seed traders were a source of information about seed, and in some cases increased use of seed and other management practices. In a few cases, there was evidence that access to extension services positively influenced the use of certified seed, and in another, the authors suggested that extension services could help farmers become aware of different adaptive strategies and help in the distribution of seed of improved varieties.
Gender Few papers explicitly linked gender and seed. Improved seed was more difficult to acquire for female-headed households and women were less likely to use improved seed or have access to extension services; small, affordable seed packs were suggested as a potential solution.
Strategy Improved or hybrid seed and exchanging seed with other villages were considered to be climate-resilience strategies for farmers.
Policy A few papers discussed agricultural policies related to seed, arguing that policies should enable the seed sector to provide suitable varieties and aim to increase the availability of funds for seed distribution research and access to improved seed, and one paper indicated that government policies restrict farmers options for obtaining their preferred seed48–50.
Experience One paper indicated that farmers’ experience had a positive effect on adoption of new seed, whereas another indicated the opposite9,51.
Seed or variety attributes
Four papers reported on concerns related to the attributes of the hybrid seed varieties and their adaptation to the environment, suitability for storage, flour to grain ratio, and other processing issues52–54. One study found that farmers favour composite varieties and local landraces under conditions of abiotic stress55.
Seed sovereignty One paper discussed issues related to seed sovereignty, reporting that farmers wanted a say in where seed comes from and were resistant to the use of transgenic crops. They expressed a belief that seed industries are appropriating a resource that belongs to humanity. Autonomy is highly valued by these communities, and local varieties are valued in part for their contribution to maintaining independence from commercial hybrid seed sources40.
Nature PlaNts | VOL 6 | OCTObEr 2020 | 1231–1241 | www.nature.com/natureplants1238

Sustainable solutions to end hunger | 95
ArticlesNature PlaNts
of adoption and associated socio-economic factors influencing the adoption or dis-adoption of the climate-resilient crops. In total, 29 factors and determinants were selected. Additional rater observations and comments were included to increase analysis depth. Finally, raters also recorded policy and programmatic information and recommendations mentioned in the papers to support the adoption of climate-resilient crops. The data-extraction template was tested by the review team before use and data were extracted by the authors. The extracted data were qualitatively summarized on the basis of emerging themes and with the aim of providing recommendations to donors and policy makers. An assessment of study quality is not typically carried out as part of a scoping review7,34.
Data availabilityThe data that support the findings of this study are available from the corresponding author upon request.
Received: 4 March 2020; Accepted: 8 September 2020; Published online: 12 October 2020
References 1. Jain, M., Naeem, S., Orlove, B., Modi, V. & DeFries, R. S. Understanding the
causes and consequences of differential decision-making in adaptationresearch: adapting to a delayed monsoon onset in Gujarat, India. Glob. Environ. Change 31, 98–109 (2015).
2. Smith, S. M. Food Crisis in the Horn of Africa: Progress Report, July 2011–July2012 (Oxfam International, 2012).
3. Dhankher, O. P. & Foyer, C. H. Climate resilient crops for improving globalfood security and safety. Plant Cell Environ. 41, 877–884 (2018).
4. Gollin, D., Morris, M. & Byerlee, D. Technology adoption in intensivepost-green revolution systems. Am. J. Agric. Econ. 87, 1310–1316 (2005).
5. Lin, B. B. Resilience in agriculture through crop diversification: adaptivemanagement for environmental change. BioScience 61, 183–193 (2011).
6. Lipper, L. et al. Climate-smart agriculture for food security. Nat. Clim.Change 4, 1068–1072 (2014).
7. Levac, D., Colquhoun, H. & O’Brien, K. K. Scoping studies: advancing themethodology. Implement. Sci. 5, 69 (2010).
8. Acevedo, M. et al. What are determinants that lead small-scaleproducers in low-and middle-income countries to adopt climate resilientcrops and crop-varieties? A scoping review protocol (Ceres 2030, 2019);https://osf.io/j7b6p/
9. Fisher, M. & Carr, E. R. The influence of gendered roles and responsibilitieson the adoption of technologies that mitigate drought risk: the case ofdrought-tolerant maize seed in eastern Uganda. Glob. Environ. Change 35, 82–92 (2015).
10. Kabote, S. J. et al. Rain-fed farming system at a crossroads in semi-arid areasof Tanzania: what roles do climate variability and change play? J. Environ.Earth Sci. 4, 85–101 (2014).
11. Ward, P. S., Makhija, S. & Spielman, D. J. Drought‐tolerant rice, weatherindex insurance, and comprehensive risk management for smallholders:evidence from a multi‐year field experiment in India. Aust. J. Agric. Resour.Econ. 64, 421–454 (2020).
12. Yamano, T., Rajendran, S. & Malabayabas, M. L. Farmers’ self-perception towardagricultural technology adoption: evidence on adoption of submergence-tolerantrice in Eastern India. J. Soc. Econ. Dev. 17, 260–274 (2015).
13. Fisher, M. & Snapp, S. Smallholder farmers’ perceptions of drought riskand adoption of modern maize in southern Malawi. Exp. Agric. 50, 533–548 (2014).
Box 3 | Recommendations
• Access and availability of climate-resilient crops seeds mustbe combined with relevant and timely advisory services, such as early-warning systems for weather.
• Ensuring that farmers have multiple options to access seedsfor a range of climate-resilient crops and varieties is essen-tial. This can be achieved by empowering existing social net-works, such as farmer organizations.
• There is no single profile that applies to all farmers. There-fore, extension services will need to continue to evolve to be(1) participatory, (2) information and communications tech-nology enhanced, and (3) partnerships based. This partner-ship should include various actors, such as women’s groups,universities, the private sector and non-governmental organ-izations in order to provide customized and appropriateinformation for diverse needs.
• High-quality studies are needed on how members of house-holds—and not just heads of households—make decisions about how to respond to climate change. This research will fill in the evidence gaps on gender and social differences and reasons for dis-adoption of climate-resilient crops and related technologies, and promote a more diverse group of climate-resilient crops that also provide food security and nutrition, such as legumes and root crops.
• National policies need to support farmers’ access to otherassets and services, such as education, land, finance ser-vices and diverse income-earning opportunities. With-out these provisions, especially education, the adoption ofclimate-resilient crops and technologies will be limited.
• A multiple-interventions approach is needed if countrieswant to promote adoption of climate-resilient crops. Farm-ers do not adopt climate-resilient crop or crop varietieswithout changing other practices, such as planting dates,water-conserving technologies, planting trees and shrubs, orincreasing or decreasing livestock.
• Farmers will not adopt climate-resilient crops solely on thebasis of environmental-adaptation qualities. Developmentand breeding programmes must consider farmer and markettrait preferences.
• Mandating disaggregated data collection to identify strat-egies that are working and who they are working for inagricultural surveys and research will enable policymakers and donors to respond with more appropriate andinformed interventions.
table 3 | What does the evidence say? Specific undertakings to improve adoption of climate-resilient crops and crop varieties
Types of suggested specific actions to increase adoption of climate-resilient crops
Number of papers (%)a
Providing extension programmes to support the uptake of climate-resilient crops
38 (15.8%)
Providing access to financial instruments (credit, insurance and loans)
29 (12.1%)
Implementing community programmes to support the uptake of climate-resilient crops
28 (11.7%)
Promoting of germplasm conservation programme and research
25 (10.4%)
Providing access to fertilizer, pesticides and other inputs
20 (8.3%)
Awareness raising about climate change, weather and impacts
19 (7.9%)
Awareness raising of climate-resilient crops 15 (6.3%)
Promoting infrastructure development, especially irrigation and roads
14 (5.8%)
Targeted programmes on youth and women to engage them in climate-resilient crops
14 (5.8%)
Providing access to climate-resilient seed 13 (5.4%)
Providing low-cost climate-resilient options for farmers
13 (5.4%)
Livestock-focused initiatives to address fodder development in the context of climate change
6 (2.5%)
Linking support for climate-resilient crops as part of poverty-reduction efforts
6 (2.5%)
aMultiple potential activities were occasionally listed together.
Nature PlaNts | VOL 6 | OcTOber 2020 | 1231–1241 | www.nature.com/natureplants 1239

96 | Sustainable solutions to end hunger
Articles Nature PlaNts
14. Roge, P., Friedman, A. R., Astier, M. & Altieri, M. A. Farmer strategiesfor dealing with climatic variability: a case study from the MixtecaAlta region of Oaxaca. Mex. Agroecol. Sustain. Food Syst. 38, 786–811 (2014).
15. Kihupi, M. L., Mahonge, C. & Chingonikaya, E. E. Smallholder farmers’adaptation strategies to impact of climate change in semi-arid areas of IringaDistrict Tanzania. Biol. Agric. Healthc. 5, 123–131 (2015).
16. Mujeyi, A., Mudhara, M. & Mutenje, M. J. Adoption determinants of multipleclimate smart agricultural technologies in Zimbabwe: Considerations forscaling-up and out. Afr. J. Sci. Technol. Innov. Dev. https://doi.org/10.1080/20421338.2019.1694780 (2019).
17. Meena, T. & Rout, J. Macrophytes and their ecosystem services fromnatural ponds in Cachar district, Assam, India. Indian. J. Tradit. Knowl. 15, 553–560 (2016).
18. Hansen, J. et al. Climate risk management and rural poverty reduction.Agric. Syst. 172, 28–46 (2019).
19. Abdoulaye, T., Bamire, S. A., Akinola, A. A. & Etwire, P. M. Smallholder Farmers’ Perceptions and Strategies for Adaptation to Climate Change in BrongAhafo and Upper West Regions of Ghana CCAFS Working Paper no. 207(Consultative Group for International Agricultural Research, 2017).
20. Asfaw, S., McCarty, N., Lipper, L., Arslan, A. & Cattaneo, A. Adaptation toclimate change and food security: micro-evidence from Malawi. In African Association of Agricultural Economists Fourth International Conference (2013).
21. Onu, D. O. Socioeconomic factors influencing farmers’ adoption of alleyfarming technology under intensified agriculture in Imo State, Nigeria.Philipp. Agric. Sci. 89, 172–179 (2006).
22. Tenge, A. J., De Graaff, J. & Hella, J. P. Social and economic factors affectingthe adoption of soil and water conservation in West Usambara highlands,Tanzania. Land Degrad. Dev. 15, 99–114 (2004).
23. Taruvinga, A., Visser, M. & Zhou, L. Determinants of rural farmers’ adoptionof climate change adaptation strategies: evidence from the Amathole DistrictMunicipality, Eastern Cape Province, South Africa. Int. J. Environ. Sci. Dev. 7, 687–692 (2016).
24. Twyman, J. et al. Adaptation actions in Africa: Evidence that GenderMatters Adaptation Actions in Africa: Evidence that Gender Matters CCAFSWorking Paper no. 83 (Consultative Group for International AgriculturalResearch, 2014).
25. Smale, M., Assima, A., Kergna, A., Thériault, V. & Weltzien, E. Farm familyeffects of adopting improved and hybrid sorghum seed in the Sudan Savannaof West Africa. Food Policy 74, 162–171 (2018).
26. Fuwa, N. A note on the analysis of female headed households indeveloping countries. Tech. Bull. Faculty Horticult. Chiba Univ. 54, 125–138 (2000).
27. Doss, C. & Kieran, C. Standards for collecting sex-disaggregated data forgender analysis: a guide for CGIAR researchers In Workshop on Methods andStandards for Research on Gender and Agriculture (Consultative Group forInternational Agricultural Research, 2013).
28. Ngigi, M., Mueller, U. & Birner, R. Gender Differences in Climate ChangePerceptions and Adaptation Strategies: An Intra-Household Analysis from RuralKenya (2016); https://dx.doi.org/10.2139/ssrn.2747856
29. Justin, C. O., Wiliams, C. E. & Vera, T. S. Understanding the factors affectingadoption of subpackages of CSA in Southern Malawi. Int. J. Agric. Econ. Ext.5, 259–265 (2017).
30. Teklewold, H., Kassie, M., Shiferaw, B. & Köhlin, G. Cropping systemdiversification, conservation tillage and modern seed adoption in Ethiopia:impacts on household income, agrochemical use and demand for labor.Ecol. Econ. 93, 85–93 (2013).
31. Abegunde, V. O., Sibanda, M. & Obi, A. Determinants of the adoptionof climate-smart agricultural practices by small-scale farming householdsin King Cetshwayo District Municipality, South Africa. Sustainability 12, 195 (2020).
32. Tricco, A. C. et al. PRISMA extension for scoping reviews (PRISMA-ScR):checklist and explanation. Ann. Intern. Med. 169, 467–473 (2018).
33. Arksey, H. & O’Malley, L. Scoping studies: towards a methodologicalframework. Int. J. Soc. Res. Meth. 8, 19–32 (2005).
34. Peters, M. D. et al. Guidance for conducting systematic scoping reviews.Int. J. Evid. Based Healthc. 13, 141–146 (2015).
35. Fagariba, C. J., Song, S. & Baoro, S. K. G. S. Climate Change in Upper EastRegion of Ghana; challenges existing in farming practices and new mitigationpolicies. Open Agric. 3, 524–536 (2018).
36. Lunduka, R. W., Mateva, K. I., Magorokosho, C. & Manjeru, P. Impact ofadoption of drought-tolerant maize varieties on total maize production insouth Eastern Zimbabwe. Clim. Dev. 11, 35–46 (2019).
37. Vincent, K., Joubert, A., Cull, T., Magrath, J. & Johnston, P. Overcoming the Barriers: How to Ensure Future Food Production Under Climate Changein Southern Africa (Oxfam GB, 2011); https://oxfamilibrary.openrepository.com/bitstream/handle/10546/188929/rr-overcoming-barriers-southern- africa-091111-en.pdf;jsessionid=C1F77A3656B59D133EB76145AAAC174E? sequence=1
38. Teklewold, H., Mekonnen, A., Kohlin, G. & di Falco, S. Does adoption ofmultiple climate-smart practices improve farmers’ climate resilience?Empirical evidence from the Nile Basin of Ethiopia. Clim. Chang. Econ. 8, 1750001 (2017).
39. Gotor, E., Fadda. C. & Trincia, C. Matching Seeds to Needs—Female FarmersAdapt to a Changing Climate in Ethiopia (Bioversity International, 2014).
40. Vasconcelos, A. C. F. et al. Landraces as an adaptation strategy to climatechange for smallholders in Santa Catarina, Southern Brazil. Land Use Policy 34, 250–254 (2013).
41. Cavatassi, R., Lipper, L. & Narloch, U. Modern variety adoption and riskmanagement in drought prone areas: insights from the sorghum farmers ofeastern Ethiopia. Agr. Econ. 42, 279–292 (2011).
42. Mwongera, C., Boyard-Micheau, J., Baron, C. & Leclerc, C. Socialprocess of adaptation to environmental changes: how Eastern Africansocieties intervene between crops and climate. Weather Clim. Soc. 6, 341–353 (2014).
43. Westengen, O. T. & Brysting, A. K. Crop adaptation to climate change in thesemi-arid zone in Tanzania: the role of genetic resources and seed systems.Agric. Food Secur. 3, 3 (2014).
44. Maharjan, S. & Maharjan, K. Roles and contributions of communityseed banks in climate adaptation in Nepal. Dev. Pract. 28, 292–302 (2018).
45. Makate, C., Makate, M., Mango, N. & Siziba, S. Increasing resilience ofsmallholder farmers to climate change through multiple adoption ofproven climate-smart agriculture innovations. Lessons from Southern Africa.J. Environ. Manage. 231, 858–868 (2019).
46. vom Brocke, K. et al. Helping farmers adapt to climate and croppingsystem change through increased access to sorghum genetic resourcesadapted to prevalent sorghum cropping systems in Burkina Faso.Exp. Agr. 50, 284–305 (2014).
47. Westengen, E. & Brysting, A. K. Crop adaptation to climate change in thesemi-arid zone in Tanzania: the role of genetic resources and seed systems.Agric. Food Secur. 3, 3 (2014).
48. Morris, M. L. Impacts of International Maize Breeding Research in DevelopingCountries, 1966-98 (CIMMYT, 2001).
49. Clay, N. & King, B. Smallholders’ uneven capacities to adapt to climatechange amid Africa’s ‘green revolution’: Case study of Rwanda’s cropintensification program. World Dev. 116, 1–14 (2019).
50. Sanchez, A. C., Fandohan, B., Assogbadjo, A. E. & Sinsin, B. A countrywidemulti-ethnic assessment of local communities’ perception of climate changein Benin (West Africa). Clim. Dev. 4, 114–128 (2012).
51. Cholo, T. C., Fleskens, L., Sietz, D. & Peerlings, J. Is land fragmentationfacilitating or obstructing adoption of climate adaptation measures inEthiopia?. Sustainability 10, 2120 (2018).
52. Lunduka, R., Fisher, M. & Snapp, S. Could farmer interest in a diversity ofseed attributes explain adoption plateaus for modern maize varieties inMalawi? Food Policy 37, 504–510 (2012).
53. Ojwang’, P. P. O., Melis, R., Songa, J. M., Githiri, M. & Bett, C.Participatory plant breeding approach for host plant resistance tobean fly in common bean under semi-arid Kenya conditions. Euphytica 170, 383–393 (2009).
54. Fisher, M. et al. Drought tolerant maize for farmer adaptation to drought insub-Saharan Africa: determinants of adoption in eastern and southern Africa.Climatic Change 133, 283–299 (2015).
55. Raghu, P. T., Erenstein, O., Böber, C. & Krishna, V. V. Adoption andoutcomes of hybrid maize in the marginal areas of India. Q. J. Int. Agric. 54, 189–214 (2015).
56. Khalil, C. A. et al. Defining Small-Scale Food Producers to Monitor Target 2.3.of the 2030 Agenda For Sustainable Development (FAO, 2017); http://www.fao.org/3/a-i6858e.pdf
57. Saab, A. Climate-resilient crops and international climate change adaptationlaw. J. Int. Law 29, 503–528 (2016).
58. Partey, S. T., Zougmoré, R. B., Ouédraogo, M. & Campbell, B. M. Developingclimate-smart agriculture to face climate variability in West Africa: challengesand lessons learnt. J. Clean. Prod. 187, 285–295 (2018).
AcknowledgementsWe thank the Federal Ministry of Economic Cooperation of Germany (BMZ) and the Bill and Melinda Gates Foundation for the support to conduct this study under the Ceres2030: Sustainable Solutions to End Hunger programme.
Author contributionsM.A., K.C., S.M., N.Z., H.T., K.P., L.B., K.I. and J.P. provided expertise on content, extracted data and wrote the manuscript. K.G.-K. and J.P. provided systematic review methods and information retrieval.
Competing interestsThe authors declare no competing interests.
Nature PlaNts | VOL 6 | OctOber 2020 | 1231–1241 | www.nature.com/natureplants1240
Sustainable solutions to end hunger | 97
ArticlesNature PlaNts
Additional informationExtended data is available for this paper at https://doi.org/10.1038/s41477-020-00783-z.
Supplementary information is available for this paper at https://doi.org/10.1038/s41477-020-00783-z.
Correspondence and requests for materials should be addressed to M.A.
Peer review information Nature Plants thanks Chiedozie Egesi, Christine Foyer and the other, anonymous, reviewer(s) for their contribution to the peer review of this work.
Reprints and permissions information is available at www.nature.com/reprints.
Publisher’s note Springer Nature remains neutral with regard to jurisdictional claims in published maps and institutional affiliations.
Open Access This article is licensed under a Creative Commons Attribution 4.0 International License, which permits use, sharing, adap-tation, distribution and reproduction in any medium or format, as long
as you give appropriate credit to the original author(s) and the source, provide a link to the Creative Commons license, and indicate if changes were made. The images or other third party material in this article are included in the article’s Creative Commons license, unless indicated otherwise in a credit line to the material. If material is not included in the article’s Creative Commons license and your intended use is not permitted by statu-tory regulation or exceeds the permitted use, you will need to obtain permission directly from the copyright holder. To view a copy of this license, visit http://creativecommons.org/licenses/by/4.0/.© The Author(s) 2020
Nature PlaNts | VOL 6 | OctOber 2020 | 1231–1241 | www.nature.com/natureplants 1241

98 | Sustainable solutions to end hunger
Articleshttps://doi.org/10.1038/s41893-020-00623-0
1The Institute for Resources, Environment, and Sustainability, University of British Columbia, Vancouver, British Columbia, Canada. 2School of Public Policy and Global Affairs, University of British Columbia, Vancouver, British Columbia, Canada. 3Policies, Institutions, and Livelihoods Program, International Livestock Research Institute, Nairobi, Kenya. 4The Mediterranean and Tropical Livestock Systems Joint Research Unit - SELMET (CIRAD, INRAE, SUPAGRO), Université de Montpellier, Abidjan, Côte d’Ivoire. 5Agriculture and Food, Commonwealth Scientific and Industrial Research Organisation, St. Lucia, Queensland, Australia. 6School for Environment and Sustainability, University of Michigan, Ann Arbor, MI, USA. 7Department of Agricultural and Applied Economics, University of Georgia, Athens, GA, USA. 8Food, Agricultural, and Environmental Sciences Library, The Ohio State University, Columbus, OH, USA. 9Department of Global Development, Cornell University, Ithaca, NY, USA. 10Centre for Evidence Based Agriculture, Harper Adams University, Newport, UK. ✉e-mail: [email protected]
The 2015 Sustainable Development Goals (SDGs) have moti-vated the development community to focus on improving the livelihoods and climate resilience of small-scale farms. To
focus research, programmatic efforts and donor funding towards supporting small-scale farmers, SDG 2.3 aims to "double the agri-cultural productivity and incomes of small-scale food producers [by 2030]"1. Critical to achieving SDG 2.3 is to sustain farmers’ produc-tion and incomes through climate shocks and stressors. As climate projections indicate that drier regions will become drier and that droughts are likely to increase2, small-scale farmers in already water scarce regions will require additional support3.
Tackling water scarcity in small-scale farming systems remains a top priority for development organizations, researchers and donors4,5. As precipitation patterns change with climate change, the livelihoods of small-scale farmers who lack access to water and tech-nologies will become even more marginalized6,7. Small-scale farm-ers represent >80% of the world’s farms8 and are major contributors to the food system9–11; farms of <5 ha produce nearly 50% of the global food supply11. Finding options for this large and diverse set of farmers to adapt to increasing water scarcity is a growing central tenet to alleviate poverty and to ensure a resilient food system4,5.
A key question for donors is which interventions have proven impacts. For instance, improved water access and water-use effi-ciency have been shown to increase yields and farmer incomes but interventions that are successful in one region do not neces-sarily work elsewhere. Many interventions (such as water har-vesting, soil improvement strategies, drought-resistant crops and livestock breed selection) are heterogeneous and their impacts can vary across physical, social and political dimensions12. This creates
a challenge for donors seeking to focus their investments around the goals of increasing food production, improving livelihoods and reducing climate vulnerability for small-scale farmers. Despite the large volume of evidence produced every year in peer-reviewed journals, grey literature and monitoring and evaluation reports, it is difficult to track which interventions have adequate research support. For instance, in water scarce regions it remains unknown if general research trends have kept up to date with policy trends that have shifted from the focus of the Green Revolution era on improving yields to modern development initiatives (for example, SDGs) that include livelihoods, commitment to reducing environ-mental impacts and gender. To date, the evidence base addressing interventions to improve the livelihoods of small-scale farmers in water scarce regions is limited. Structured evidence syntheses such as systematic reviews and meta-analyses do exist13–20, as do more traditional literature reviews21,22, but all tend to focus on subtopics such as conservation agriculture, irrigation or policy frameworks.
This scoping review collates many different types of interven-tions aimed at small-scale farmers in water scarce regions across low- and middle-income countries (LMICs) to understand the breadth of evidence for available on-farm interventions. Our effort seeks to help donors identify future research funding, to focus the efforts of researchers towards filling knowledge gaps and to build a repository of studies on a broad swath of interventions that may improve the yields and incomes of small-scale farmers.
We focus our evidence synthesis on water scarce, small-scale farms across LMICs to assess whether research effort is being con-ducted in the locations that need it most. Our research identifies countries that have limited research for adaptation solutions, yet
A scoping review of research funding for small-scale farmers in water scarce regionsVincent Ricciardi 1,2 ✉, Abdrahmane Wane 3,4, Balsher Singh Sidhu 1,2, Cecile Goode5, Divya Solomon6, Ellen McCullough 7, Florian Diekmann 8, Jaron Porciello 9, Meha Jain 6, Nicola Randall10 and Zia Mehrabi 1,2
Water scarcity is a global issue that disproportionately affects small-scale farmers in low- and middle-income countries (LMICs). Through geospatial analysis, we estimated that less than 37% of small-scale farms probably have irrigation in water scarce regions across LMICs, compared with 42% of non-small-scale farms. Through a literature synthesis assisted by machine learning, we then systematically mapped the existing research for on-farm interventions that improve the incomes or yields of small-scale farmers in water scarce regions. We mapped over 888 on-farm interventions used to combat water scarcity from 560 publications and showed a research bias towards yields rather than livelihoods. We found gaps in evidence for many com-monly proposed solutions, including livestock management, digital technology and solutions to protect natural resources at the farm-level, such as buffer strips. Our findings can be used to set a funding agenda for research on the geographies that are most at risk of water scarcity and the interventions that most lack evidence.
Nature SuStaiNability | VOL 3 | OCTOBER 2020 | 836–844 | www.nature.com/natsustain836

Sustainable solutions to end hunger | 99
ArticlesNature SuStaiNability
high numbers of small-scale farmers in water scarce regions. On the basis of the available evidence, we systematically map research effort onto intervention types to identify which interventions lack research (Box 1). We also assess whether studies examined environmental trade-offs or gender effects to ensure that there is evidence for integrated solutions that reflect the relationship between SDG 2.3 and other development goals. Our scoping review provides a rapid way to identify the breadth of evidence represented in the literature to assist the adaptation of small-scale farmers to water scarcity.
ResultsResearch needs versus research effort. We found that 76.7% of small-scale farms and 72.4% of small-scale farm area across all LMICs were probably located in water scarce regions. We also found that existing technological penetration of basic irrigation infra-structure for these farms was low. For example, we estimated that fewer than 37.2% of small-scale farms in water scarce regions across all LMICs were irrigated, compared to 43.2% of non-small-scale farms (Fig. 1 and Supplementary Fig. 1). The largest disparities in irrigation coverage between non-small-scale farms and small-scale farms were in Latin America and the Caribbean, South Asia and Sub-Saharan Africa. Yet, in East Asia and the Pacific and in the Middle East and North Africa regions, small-scale farms had greater irrigation coverage than non-small-scale farms.
We also found a large variation across countries of the number of studies of interventions for farmers living in water scarce regions
(Fig. 2). When comparing where research on interventions was conducted with where high numbers of water scarce, small-scale farms were located, we observed considerable gaps for countries where few studies met our criteria, such as Nigeria, Mali, Uganda, Chad and Ivory Coast (Fig. 3 shows that these countries had 12, 10, 7, 1 and 0 studies, respectively). There were also hotspots of water scarce, small-scale farms with more moderate research effort, which included India, Ethiopia, Kenya, Tanzania and Ghana (Fig. 3 shows that these countries had 74, 54, 48, 33 and 28 studies, respectively). These differences in the amount of studies are quite large when con-sidering that the included studies ranged from 1962 to 2019.
A promising finding was that 55% of studies tested interventions in controlled field trials and 18% were modelling studies both of which focus on the causal relationships between the interventions and yield and/or incomes. In addition, 28% of studies were from household surveys to determine if interventions designed for water scarce, small-scale farms worked in farmers’ local contexts accord-ing to farmers’ responses on yield and livelihood outcomes. Studies in high-income countries were excluded unless they were relevant to LMICs (for example, studies that used experiments and mod-elling to mimic water scarce conditions) and those accounted for 2% of the studies we analysed. We found eight meta-analyses and six systematic reviews in our literature search. Five of the meta- analyses found that seed priming, soil management and water management contributed to increased yields in water scarce con-texts; the three meta-analyses that examined conservation agricul-ture showed mixed results in its effects on yield for water scarce contexts (Table 1).
Research focus on yields versus livelihoods. We found that most articles assessed outcomes associated with yield (91% of articles) as compared to livelihoods (21% of articles examined incomes and/or expenditures) (Fig. 4). Despite shifts from Green Revolution rhetoric in the 1950s–1970s to language used in the Millennium Development Goals that launched in 2000 and the subsequent 2015 SDGs, research continues to focus on yields compared to liveli-hoods (Supplementary Fig. 2).
We checked this research bias towards yields compared to live-lihoods by assessing meta-analyses that synthesized the literature on interventions for small-scale farmers in water scarce regions. We found that all eight meta-analyses focused on yield (Table 1). This shows that not only is the focus on yield prevalent in the primary literature but it is also the sole focus of existing research syntheses that quantifies the relationships between interventions and outcome for small-scale farmers in water scarce regions to date.
In addition to outcomes, the coverage and evidence for differ-ent kinds of interventions is also diverse. Farm-level interventions represent a toolbox of actions that farmers can take to tackle water scarcity directly, which include drip irrigation, soil improvement strategies, integrated pest management, crop rotation and so on (Fig. 4). While we found higher coverage for interventions around irrigation, tillage, soil amendments, cropping systems, crop varieties and pest management (145–210 articles), we found little work on key interventions of interest, including livestock interventions (43 articles), solutions that protect natural resources at the farm scale, such as buffer strips and contouring (15 articles) and digital tech-nology interventions (three articles) (see Supplementary Table 1 for full definitions of interventions). Changes in the number of stud-ies increased for all interventions over time but the relative share of studies per intervention remained stagnant since the early 1990s (Supplementary Fig. 3).
Research on environmental impacts and effects on gender. We found relatively high coverage of research that examined environ-mental impacts of the intervention assessed (68.9% of interven-tions and 50.4% of articles; Fig. 5a). Most of these studies assessed
box 1 | Method summary
Spatial analysisTo calculate how many small-scale farmers live in water
scarce regions, we overlaid spatial datasets of farm size and water scarcity. We then estimated the disparity that small-scale farmers face in accessing irrigation, a critical on-farm resource in water scarce regions. While this was a coarse method that relied on spatial overlays, it enabled us to take a high-level view on where water scarce areas and small-scale farmers are colocated and estimate the number of these farms that probably have access to irrigation.Evidence synthesis
To identify research trends and gaps, we synthesized academic and grey literature from 26 databases. We focused on studies that tested the effects of on-farm interventions on small-scale farmers’ incomes or yields in water scarce regions across LMICs. We used a ‘systematic mapping’ method51 assisted by machine learning to quantify the number of studies per type of intervention and to identify countries that had few studies.
The inclusion criteria for our scoping review were that: (1) studies explicitly addressed small-scale farmers (2) studies examined on-farm production management tech-
niques or technologies that explicitly addressed water scar-city, drought adaptation or water efficiency adaptation
(3) studies examined the effect on yield or incomes of anon-farm intervention
(4) study assessments needed to include either a control casefor comparison (temporal or spatial) for identifying theoutcomes in the absence of the intervention (this can befrom a randomized control trial, pre–post design, post–post design and so on) or a comparison between alternativeinterventions
Full description available in Methods. Evidence synthesis protocol available in the Supplementary Information.
Nature SuStaiNability | VOL 3 | OctOber 2020 | 836–844 | www.nature.com/natsustain 837

100 | Sustainable solutions to end hunger
ARTICLE S NATURE SUSTAINABILITY
win–wins between farmers and the environment in the context of water scarcity, such as improving water efficiency, increasing water availability (for example, through rainwater harvesting) and manag-ing soil for greater water retention. A smaller share of research (7% of interventions and 6.3% of articles; Fig. 5b ) addressed the nega-tive environmental effects of interventions, such as greenhouse gas emissions, biodiversity loss and land conversion/degradation.
We found few studies that considered gender aspects of the effects of interventions on yields and incomes. Only 9.6% of interventions (and 9.6% of articles; Fig. 5a ) either assessed gender differences in the outcomes measured or framed their research with a gender lens, with most of these studies examining if the intervention could reduce the time burden many female farmers face. This limited number of studies was uncovered even though we used broad inclusion crite-ria to include studies not only if they directly addressed gender out-comes but also if they were framed in terms of gender issues.
Discussion This scoping review quantified the global irrigation gap of small-scale farms and found that water scarce regions needed equi-table irrigation infrastructure the most. While our results generally found that small-scale farmers face unequal access to one critical resource in adapting to water scarcity across LMICs, local politi-cal, economic and environmental realities may determine irriga-tion access. These realities may explain the variation in irrigation coverage between small-scale and non-small-scale farmers across regions. Hence, donors and researchers should focus on water scarce regions with the largest disparities in access to critical resources (for example, irrigation or other) and the lowest amount of evidence for the efficacy of on-farm interventions on yields and livelihoods. A limitation to these findings is that our research highlights only one type of disparity that small-scale farmers face (irrigation coverage) but future studies can build on our methods to examine other types of marginalization (for example, poor soil quality, distance to mar-kets, climate exposure, land use, land tenure/governance and so on) to help prioritize research funding towards evidence-backed inter-ventions for disadvantaged small-scale farmers.
We found that the shift in funding priorities for small-scale farmers from improving yields during the Green Revolution to including livelihoods, environmental trade-offs and gender impacts in the SDGs was not always reflected in the research. Yields have
Water scarce Not water scarce
0 20 40 60 80 0 20 40 60 80
All LMIC countries
Sub-Saharan Africa
Latin America and Caribbean
Europe and Central Asia
East Asia and Pacific
South Asia
Middle East and North Africa
Percentage of farms with irrigationin low- and middle-income countries
Not small scale Small scale
Fig. 1 | Irrigation coverage for small-scale farms in water scarce regions. The percentage of small-scale and non-small-scale farms under irrigation (as opposed to rainfed) by region and across all LMICs. The left plot shows the relationships in water scarce regions, while the right plot shows the relationships in non-water scarce regions.
0 5 20 40 80
Number of studies
Fig. 2 | Number of studies per country included in literature synthesis. A map showing the number of studies that measured the impact of an intervention on the incomes and/or yields of small-scale farmers in water scarce regions. Countries in grey indicate that no studies met our inclusion criteria. High-income countries were only included if they tested an intervention relevant to small-scale farmers in water scarce regions of LMICs.
NATURE SUSTAINABILITY | VOL 3 | OCTOBER 2020 | 836–844 | www.nature.com/natsustain 838

Sustainable solutions to end hunger | 101
ArticlesNature SuStaiNability
Number of studies
MacedoniaCubaMexicoThailandChinaUzbekistanTunisiaVietnamPakistanMyanmarIndonesiaPhilippinesSudanKenyaEgyptCameroonIvory CoastGhanaNigeriaIndiaMozambiqueSouth SudanNigerDemocratic Republic of the CongoAfghanistanNorth KoreaTogoTanzaniaHaitiSyriaBeninUgandaChadEthiopiaMali
1 5 20 80Number of small-scale farms
in water scarce regions (in millions)
Low income
Lower-middle income
Upper-middle income
Fig. 3 | Number of small-scale farms in water scarce regions compared to research coverage. Each point represents the number of small-scale farms in a country that are in water scarce regions. The size of the points corresponds to the number of studies that measured the impact of an intervention on the incomes and/or yields of small-scale farmers in water scarce regions. The colours indicate the economic grouping of the countries as low, lower-middle or upper-middle income.
table 1 | Results from the eight meta-analyses included in our evidence synthesis
Refs. Intervention Outcome Effect Number of studies
Quality score (out of 4)
Regions
Ref. 13 Water harvesting Yields Increase 29 2.13 Semi-arid Africa and Asia
Ref. 14 On-farm seed priming Yields Increase 44 2.31 Global
Ref. 15 Agricultural water management technology
Yields Increase 1,430 2.25 Southern Africa
Ref. 16 Combined cattle manure and inorganic fertilizer
Yields Increase 46 2.19 Global
Ref. 17 Nutrient management Yields Increase 29 2.25 Africa
Ref. 18 Conservation agriculture Yields Decreasea 610 1.88 Global
Ref. 19 Conservation agriculture Yields Decrease 41 2.00 Sub-Saharan Africa
Ref. 20 Conservation agriculture Yields Increase 27 1.94 Southern Africa
Results are from the eight meta-analyses our scoping review identified to synthesize interventions for small-scale farmers to adapt to water scarcity. Each meta-analysis synthesized the effect of the intervention on small-scale farms’ yields. The ‘number of studies’ refers to the number of studies the meta-analysis included in their synthesis. The ‘quality score’ was the average score we rated each meta-analysis by using CEESAT55. aIncrease occurred only in certain conditions.
Nature SuStaiNability | VOL 3 | OCTObER 2020 | 836–844 | www.nature.com/natsustain 839

102 | Sustainable solutions to end hunger
Articles Nature SuStaiNability
remained the main focus in this research literature since the 1960s (Supplementary Fig. 2). Yet, yields only provide a partial farm pro-ductivity measure based on output per unit of land cultivated. They cannot proxy for productivity measures that incorporate more production factors (for example, total factor productivity), for eco-nomic measures (for example, farm profitability or farm household welfare measures based on income, consumption or asset holdings) or for dynamic measures that address the probability that the wel-fare of a farm household falls below some threshold in a given year (for example, vulnerability or resilience). All of these outcomes can be difficult to measure and even yields, which are relatively straight-forward to measure, are subject to bias when self-reported23. One cannot conclude whether an intervention has been successful for small-scale farmers without incorporating economic measures that properly account for self-provisioned inputs such as family labour and capture aspects of farmers’ livelihoods24.
Critical environmental trade-offs of interventions need to be tested to ensure that funded projects do not have deleterious effects on local natural resources and, in turn, on small-scale farmers’ future livelihoods. While clear environmental and productivity win–wins were prevalent in the literature, such as water-use efficiency25–27, it was concerning that so few studies jointly addressed cost-cutting solutions to both environmental degradation and productivity, which include, sustainable intensification, minimizing biodiversity loss and solutions across the food–energy–water nexus28–30. Future research should help identify where and when win–win interven-tions exist or when environmental trade-offs are inevitable.
Similarly, there was a large research gap on gender dimensions of interventions. Donors should focus funding research that assesses interventions specifically designed to improve women’s outcomes, for example by addressing their large time burden. In addition, existing interventions need to be tested to ensure avoidance of
unintended consequences on women. We were concerned to find that gender themes were so rarely addressed, even though women comprise 43% of the agricultural labour force, account for two-thirds of livestock keepers in LMICs and are often responsible for very large shares of agricultural tasks (for example, 90% of hand weeding across Sub-Saharan Africa), while consistently farming plots that are smaller than male farmers’ plots31. Studies examining the gender effects of on-farm interventions in water scarce regions should focus on gender-specific interventions, such as reducing unpaid labour requirements of women32, to free up women’s time towards the most productive activities. Improving the gender bal-ance of female extension agents or agricultural researchers—for instance, only 24% of African agricultural researchers are female31—may help to better align research priorities towards the needs of female small-scale farmers.
Given the importance of livestock for adaptation in water scarce conditions, climate solutions that protect farm-level natu-ral resources, and the benefits of climate services and digital tech-nology for in-season recommendations and responses, the lack of evidence we found suggests a need for more research addressing these three types of interventions. While the dearth of research in digital technology is probably due to its relatively recent emergence, the low interest in livestock and interventions that protect natural resources have been persistently low throughout the last several decades (Supplementary Fig. 3). The lack of research on livestock interventions to improve productivity or incomes in water scarce regions was particularly concerning considering an estimated 23% of farmers own cattle33. Our findings compliment the notion that pastoral systems in LMICs have tended to receive less investment from the international research community and other institutions, compared to livestock systems in high-income countries and crop-ping systems more broadly34. While interest in livestock systems
Income/expenditure Yield
Water
Soil
Crop and pest
Tillage
Cropping system
Livestock
Natural resourceprotection
Digital technology
100 200 300 100 200 300
Number of studies
Methodology study used
Experimental
Observational
Modelling
Meta-analysis
Systematic review
Outcomes by interventions
Fig. 4 | Number of studies per outcome by intervention. The number of studies classified by intervention type, outcome and methodology. The left plot classifies studies that examined the effects of interventions on farmer incomes or expenditures, while the right plot classifies studies examining the effects of interventions on yields. Different colours correspond with different methodological approaches (for example, experimental plots, observational household or plot surveys, statistical modelling, meta-analysis or systematic review). Interventions are grouped into eight broad classes (see Supplementary Table 1 for full definitions). Water refers to direct water interventions (for example, irrigation or water harvesting). Soil includes direct soil-based interventions (for example, fertilizer or liming). Crop and pest include crop species and crop variety-based interventions and pest management as these can consist of overlapping interventions. Tillage includes all variants of tillage. Cropping system includes crop rotation, intercropping, fallow, monocropping and so on. Livestock refers to any intervention directly related to livestock (for example, species feed or vaccinations). Natural resource protection includes protection of farm natural resources (for example, via erosion control or buffer strips). Digital technology refers to any digital intervention (for example, weather advisories or precision agriculture).
Nature SuStaiNability | VOL 3 | OCTOber 2020 | 836–844 | www.nature.com/natsustain840

Sustainable solutions to end hunger | 103
ArticlesNature SuStaiNability
has, however, been growing in recent years, driven by increasing concerns about food security, land competition, the vulnerability of remote communities and the environment as well as by a rais-ing awareness regarding the contribution of livestock systems to all these aspects35,36, we did not see relative increases in the num-ber of studies examining these systems over time (Supplementary Fig. 3). Climate resilience strategies for livestock keepers require increased institutional support through policies that address the issues of land tenure, fragmentation and degradation35. The evi-dence gap we found pertaining to natural resource protection may reflect the focus of this particular literature on different outcome metrics, such as contouring to prevent soil erosion or using buffer strips to improve biodiversity instead of the focused outcomes of improving yields and livelihoods of the SDG 2.3. However, as eco-system services are an important dimension of a farm’s resilience to climate stressors and shocks37, natural resource protecting interven-tions require more evidence for their effects on farmer livelihoods in water scarce regions.
Digital solutions for water scarce, small-scale farms is an emerg-ing field but funders should prioritize research grants to test the livelihood impacts of these solutions. There are more applications for small-scale farmers generally38 but there is limited evidence to apply these interventions even outside of water scarce regions. For example, a meta-analysis carried out in 2019 only found five studies with nine observations that examined digital solutions that improved small-scale farmers’ yields (researchers found a 0–8% increase) and the odds of adopting a recommended agricultural input (researchers found a 13–31% increase)38. While the goal of our systematic map was not to identify studies suitable for a meta-analysis, we found seven studies that examined digital solu-tions for farmers in water scarce regions. These studies focused on providing farmers with tools to improve the water-use efficiency of their irrigation systems39, climate information to farmers40 and to aid decisions in nutrient, water and weed management to reduce production risks41. Despite the promise of digital solutions in
water scarce environments, we suggest that there needs to be better proof of digital technologies that are tested in low-bandwidth set-tings since many small-scale farmers live outside of 3G and higher
box 2 | Recommendations
These recommendations address research funding priorities to bolster outcomes for small-scale farmers in water scarce regions. (1) Geographic focus. Donors should increase their focus on
water scarce regions, especially in countries with manysmall-scale farmers and little research available, when evalu-ating the impacts of on-farm interventions to improve out-comes for small-scale farmers.
(2) Sustainability focus. By requiring funded research to meas-ure key environmental outcomes associated with interven-tions in water scarce regions, donors can reduce the gap inevidence that quantifies trade-offs between on-farm inter-ventions and deleterious environmental effects, whetherthey are experienced off-farm, thus harming other farmers,or on-farm, thus harming future livelihoods opportunities.
(3) Gender focus. Donors should address the dearth of evidence seeking to improve outcomes for women in water scarce re-gions by requiring funded research to explicitly address gen-der themes.
(4) Intervention focus. Donors can earmark research funds foraddressing digital solutions and livestock interventions, twointervention types that have been neglected by research-ers focusing on on-farm interventions to assist small-scalefarmers in water scarce regions. Digital solutions comprisean emerging field that holds promise for improving farmmanagement in water scarce regions. Interventions to en-hance livestock productivity in mixed farming systems alsooffer an important opportunity to enhance the productivityof small-scale farmers in water scarce regions.
0
200
400
600
1980 1990 2000 2010 2020
Num
ber o
f stu
dies
(cum
ulat
ive)
Environmental impactsNo cross-cutting themeGender
0
100
200
300
400
1990 2000Year
2010 2020
Num
ber o
f stu
dies
(cum
ulat
ive)
Water quantitySoil healthGHG emissionsBiodiversityWater qualityEnergyLand cover conversionAir quality
1980
Fig. 5 | Number of studies per cross-cutting theme over time. The upper plot shows the cumulative number of studies that included analysis on environmental impacts and/or gender dimensions of the interventions assessed. The lower plot disaggregates the environmental impacts into eight subcategories.
Nature SuStaiNability | VOL 3 | OcTOber 2020 | 836–844 | www.nature.com/natsustain 841

104 | Sustainable solutions to end hunger
Articles Nature SuStaiNability
mobile coverage areas42. Research in these geographies, metrics and outcomes will bring us closer to meeting the needs of water scarce, small-scale farms on the ground.
To achieve the SDG 2.3 goal of bolstering small-scale farmers’ yield and livelihoods, a greater research focus is needed in water scarce regions of LMICS. Future research needs to test the effects of on-farm interventions not only on yields but also on more outcomes that are relevant for farmer livelihoods, such as farm profitability, farmer income and resilience. Trade-offs between interventions and the environment need to continue to become part of research designs and donor requirements to ensure that unintended environmental impacts can be avoided, especially in regions with limited water resources and for populations that are systemati-cally disadvantaged from accessing critical on-farm infrastructure. Similarly, gender dimensions of interventions require a tremen-dous amount of support in research funding since these remain under-researched despite being an SDG cross-cutting theme. We suggest that funders incorporate these outcomes into their impact assessment frameworks for research grants. For specific policy recommendations see Box 2.
MethodsSpatial analysis. To contextualize the disparity small-scale farmers face in accessing critical resources, we quantified the number of small-scale farms with irrigation in water scarce regions in LMICs. We created a spatial layer of small-scale farms and overlaid it with available water scarcity and irrigation spatial layers. Our analysis provided estimates aggregated to the country level. While this was a coarse method that relied on spatial overlays, it enabled us to take a high-level view on where water scarce small-scale farmers live and how many of these farms have access to irrigation.
To create the small-scale farms layer, we implemented the SDG 2.3 definition of small-scale farms through spatial proxies at 10 km2 resolution. SDG 2.3 defines small-scale farms as the smallest 40% of farms in a country and farms with the lowest 40% of agricultural revenue in a country43. We used an available farm size map at 10 km2 resolution with a global spatial extent42. It was created by using a crowd-sourced field size map44 to downscale the national farm size distributions of the World Census of Agriculture8. Each grid cell contains the most common farm size using World Census of Agriculture categories: 0–1 ha, 1–2 ha, 2–5 ha, 5–10, ha, 10–20 ha, 20-50 ha, 50–100 ha, 100–200 ha, 200–500 ha, 500–1,000 ha and farms >1,000 ha. We computed the smallest 40% of farms in a country on the basis of this map. Since there are no comparable spatial data on agricultural revenue, we used a proxy for agricultural revenue. We used a downscaled gross domestic product (GDP) per capita dataset available at 110 km2 resolution45, which we subsetted to cropland area46. We computed the lowest 40% of GDP per capita per country using this data. We aggregated the farm size map to the same spatial resolution as the GDP per capita map and overlaid these two layers to find pixels that were both the smallest 40% of farms in each country and in agricultural areas with the lowest 40% of GDP per capita in each country. We estimated the number of farms in each pixel by dividing the agricultural area by the predominant farm size of that pixel. This approach allowed us to identify the poorest agricultural areas with the smallest farms in each country.
We created the water scarcity layer by combining two different measures of water scarcity at 10 km2 resolution. Each grid cell needed to be either green (rainwater stored in the soil) or blue (fresh surface water and groundwater) water scarce. We defined green water scarcity according to the IPCC definitions of a semi-arid region, which is an area with <250 mm of rainfall in a year47. We used the Global Precipitation Climatology Centre rainfall dataset (full v.2018)48 to calculate the median rainfall per grid cell from 1996 to 2005. We relied on Mekonnen and Hoekstra’s blue water scarcity dataset to identify grid cells that had on average at least one month of blue water scarcity a year from 1996 to 200549. Through using subnational and intra-annual green and blue water scarcity data, we implemented a more detailed view on water scarcity than commonly reported country-level water scarcity metrics reported at annual intervals.
To determine the irrigation area for small-scale farms compared to non-small-scale farms, we used the global rainfed and irrigated croplands (GRIPC) layer, which is a global irrigation map at 500 m2 resolution50. The irrigation map was created through remote sensing and calibrated to nationally reported irrigation coverage statistics to represent circa 2005 values. This irrigation map provided the percentage of agricultural area in a grid cell covered by irrigated cultivation, rice paddy or rainfed cultivation. For our analysis, we only used the irrigated and rainfed categories. We excluded paddy cropland (and the corresponding farming populations) from our analysis because GRIPC does not further classify paddy fields as irrigated or rainfed in their pixel level dataset but they do offer that irrigated paddy accounts for 66 Mha of global cropland and non-irrigated paddy accounts for 63 Mha of global cropland in their manuscript; put another
way, this near 50/50 split should not have a major effect on our estimates of the share of water scarce areas that are irrigated but future studies would benefit from better spatial data that splits irrigated and non-irrigated paddy. To provide the full range of values, our scoping review did not include paddy and found that 37.22% of crop area farmed by small-scale farmers in water scarce regions is irrigated (versus 43.19% farmed by not small-scale farmers). If we assume all paddy fields are rainfed, then 26.48% of crop area farmed by small-scale farmers in water scarce regions is irrigated (versus 37.24% farmed by not small-scale farmers). If we assume all paddy fields are irrigated, then 55.07% of crop area farmed by small-scale farmers in water scarce regions is irrigated (versus 52.82% farmed by not small-scale farmers).
We overlaid the small-scale farm layer, the water scarcity layer and the irrigation layer to calculate the number of farms with and without irrigation. We repeated this analysis for non-small-scale farms and non-water scarce regions. Results were aggregated to the country level and summed across all LMICs and per world region.
Evidence synthesis. We used a ‘systematic map’ assisted by machine learning and natural language processing (NLP) to perform our evidence review. Systematic maps (also referred to as ‘evidence maps’ and ‘gap maps’) are an emerging type of systematic review that attempt to identify patterns of research, to identify gaps in a field and future priorities for research51. A systematic map is not like traditional expert-based or narrative reviews in that it attempts to capture all of the research on a given topic and reduce the authors’ biases51. Systematic maps can capture the full-breadth of interventions relevant to a population, such as our scoping review that asks: What is the spectrum of farm-level interventions that have been tested to increase small-scale farmers’ incomes, yields and productivity in water scarce regions?
Our systematic map method had six steps: (1) forming the research question; (2) querying academic and grey literature databases for relevant studies; (3) screening titles and abstracts to determine if a study should be included in our synthesis; (4) screening the full text of studies that passed step 3 to determine if a study should be included in our synthesis; (5) extracting relevant data from each included study; and (6) summarizing and reporting the results. The protocol for this scoping review was registered on the Open Science Framework (https://osf.io/c6n4k/) before study selection, which can also be accessed in our Supplementary Information.
The guiding question for this systematic map was: ‘What spectrum of farm-level interventions to alleviate water scarcity has been tested to increase small-scale farmers’ incomes, yields and productivity?’
An exhaustive search strategy was developed and applied to 26 academic and grey literature databases to identify all available research pertaining to on-farm interventions that have been tested to increase small-scale farmers’ incomes and yields in water scarce regions in low- and middle-income countries. Search terms included variations of the key concepts in the research question: small-scale farmers, water scarcity, and income, yield and productivity. Searches were performed in the following bibliographic databases: CAB Abstracts and Global Health (access via CAB Direct), Web of Science Core Collection (access via Web of Science), Scopus (access via Elsevier), Agricola (access via EBSCOhost), EconLit (access via EBSCOhost) and ProQuest Dissertations & Theses Global (access via ProQuest). A search of grey literature sources (20 specialist organizations and online databases) was also conducted. Full search strategies for each database, including grey literature, can be accessed in their entirety in our protocol available in our Supplementary Information or at https://osf.io/c6n4k/. Search results were de-duplicated to remove redundant citations identified from multiple sources, resulting in 18,365 unique publication records.
We screened the 18,365 titles and abstracts to include or exclude from our scoping review. Two independent reviewers assessed each title and abstract. If there was disagreement between reviewers on whether the study was to be included, a third independent reviewer decided. Articles needed to meet the following eligibility criteria for inclusion in our systematic map. (1) Studies needed to address small-scale farms explicitly. For inclusion in the evidence synthesis, we defined a small-scale farm to meet two of four dimensions: land size, labour input (especially of family members), market orientation and economic size. (2) Studies examining on-farm production management techniques or technologies explicitly addressing water scarcity, drought adaptation or water efficiency adaptation. For the systematic map, we erred on the side of inclusivity and used a general definition of water scarcity to include a broad range of studies and interventions across a spectrum of agricultural regions as well as the concept of water stress. We considered water scarcity as when there is not enough water to be used by a farmer for agricultural purposes, which includes blue and green water. We considered water stress to be an additional subset of water scarcity where certain farmers are economically disadvantaged due to poor access to water resources. (3) Studies examining the effect of an on-farm intervention on yields or incomes. While interventions that improve small-scale farmers welfare can range across plot-level technologies, farm-level management, collective action, government infrastructure projects and bi/multilateral trade agreements, we only focused on-farm-level interventions to represent a toolbox of actions that
Nature SuStaiNability | VOL 3 | OctOber 2020 | 836–844 | www.nature.com/natsustain842

Sustainable solutions to end hunger | 105
ArticlesNature SuStaiNability
farmers can take to tackle water scarcity directly. (4) Studies including either a control case for comparison (temporal or spatial) for identifying counterfactual outcomes in the intervention’s absence (for example, by using randomized control trials, pre–post designs, random block designs, modelling and so on) or studies comparing alternative interventions. We included reviews if they were systematic reviews or meta-analyses. The most common reason an article was excluded was because it characterized a farming practice, rather than measuring the effects of the farming practice on yields or livelihoods. Other common reasons that studies were excluded were because the interventions were not explicitly linked to water scarcity, water savings or improving adaptation to drought. Several studies were not in English, which was a limitation of our research.
To assist the time-consuming task of sorting the 18,365 titles and abstracts that we identified in the academic and grey literature databases, we used a machine learning approach. Using NLP and machine learning for this stage of systematic reviews is an emerging method52. While studies have used Naive Bayes and Support Vector Machines (SVM) models52,53 the Google Development Team released the Bidirectional Encoder Representations from Transformers (BERT) model on Tensorhub in 2019 and it has outperformed other NLP models in a variety of tasks54. BERT is a deep learning language representation model that is context aware, in which the word in context of the sentence and the sentence in the context of the paragraph are embedded in the structure of the model. The BERT comes pretrained, which speeds up processing time since the end user only needs to fine-tune the model. Our scoping review tests the BERT model against other classification models to assist a systematic review.
Our team manually classified 1,500 titles and abstracts to include or exclude from our scoping review. We split the manually classified titles and abstracts into training and test data to build and validate several machine learning classifiers. We tested the accuracy of Naive Bayes and SVM, where we used a bag-of-words model with term-frequency times inverse document-frequency (TFIDF) to construct the features of the model. We conducted cross-validated grid searches to identify optimal sets of hyperparameters, which included removing stop words (common words in the English language) and stemming (converting the word to the root word); all hyperparameters assessed can be found in the supplemental code provided. We compared these scores to a BERT model that we fine-tuned to minimize binary cross entropy loss in a classification layer. We used the multilanguage base version of BERT (12-layer, 768-hidden, 12-heads, 110 M parameters), which was trained on the top 102 languages with the largest Wikipedias. Our supplemental code details all parameterization (https://github.com/vinnyricciardi/Ricciardi_etal_2020_ceres). For all models, we calculated accuracy, precision, recall and F1 scores through k-fold cross validation (k = 10) (Supplementary Table 3). The goal was for the model to perform better than the level of agreement our team achieved during the manual classification of titles and abstracts. During the manual classification, two random reviewers (out of a team of ten reviewers) classified each title and abstract. If there was disagreement, a third reviewer broke the tie. Reviewers agreed on the classification 82% of the time. Each of the NLP models performed better than 82%. BERT was the best-performing model with an 88% accuracy (Supplementary Table 3). We applied this final model to the 18,365 titles and abstracts to classify each study to be included or excluded from our scoping review. The model included 1,423 studies in our scoping review for full-text review, of which we were able to find and download 1,355 texts.
In the next phase of our assessment, we downloaded the 1,355 full-texts and manually checked if they were to be included or excluded from our scoping review. In the fourth stage of our assessment, for each of the 560 articles included, we manually extracted the location each study was conducted, the type of method, the type of farming system (crop, livestock or mixed), the intervention assessed (see Supplementary Table 1 for full list), the outcome assessed (yield or income) and whether the study measured a cross-cutting theme (gender effects or environmental impacts). This final stage consisted of one reviewer extracting the information from each text, with communication between reviewers to ensure consistency. Supplementary Fig. 4 shows the number of publications included and excluded at each stage. Our final analysis consisted of cross-tabulations and descriptive statistics.
Through our evidence synthesis, we identified eight meta-analyses. We extracted the intervention and outcome assessed, the location(s) that the meta-analysis included, also the number of studies the meta-analysis included. We recorded the main finding of the meta-analysis to understand the impact of the intervention on the outcome (for example, did water harvesting increase, decrease or have no effects on yields of water scarce, small-scale farms). To assess the quality of each meta-analysis, we relied on Collaboration for Environmental Evidence Synthesis Assessment Tool (CEESAT)55, which provides a score sheet of 16 questions to appraise the rigour, transparency and limitations of the systematic review or meta-analysis. For each question, the meta-analysis can receive a red score for the lowest score, an amber score, a green score or a gold score for the highest rating. We converted these scores from one to four, averaged the scores and presented them in Table 1. Our Supplementary Information provides our scoring for the CEESAT score sheet.
Reporting Summary. Further information on research design is available in the Nature Research Reporting Summary linked to this article.
Data availabilityFor reproducibility, updatability and future research to further develop our methods, the data that support the findings of this scoping review are available in figshare: https://doi.org/10.6084/m9.figshare.12867038
Code availabilityFor reproducibility, updatability and future research to further develop our methods, all analysis codes are available in the public GitHub repository: https://github.com/vinnyricciardi/Ricciardi_etal_2020_ceres
Received: 14 March 2020; Accepted: 9 September 2020; Published online: 12 October 2020
References 1. Sustainable Development Goals (UN, 2017); https://go.nature.com/3i2kPqM 2. Adams, S. et al. Turn Down the Heat: Climate Extremes, Regional Impacts, and
the Case for Resilience (World Bank, 2013); https://go.nature.com/3kD12Qj 3. Intended Nationally Determined Contributions (INDCs) (UNFCCC, 2019);
https://go.nature.com/3kKIDAT 4. FAO, IFAD, UNICEF, WFP & WHO The State of Food Security and Nutrition
in the World: Building Climate Resilience for Food Security and Nutrition(WHO, 2018).
5. Coping with Water Scarcity: An action Framework for Agriculture and FoodSecurity (FAO, 2012).
6. Morton, J. F. The impact of climate change on smallholder and subsistenceagriculture. Proc. Natl Acad. Sci. USA 104, 19680–19685 (2007).
7. Diffenbaugh, N. S. et al. Quantifying the influence of global warming onunprecedented extreme climate events. Proc. Natl Acad. Sci. USA 114, 4881–4886 (2017).
8. Lowder, S. K., Skoet, J. & Raney, T. The number, size, and distribution of farms,smallholder farms, and family farms worldwide. World Dev. 87, 16–29 (2016).
9. Samberg, L. H., Gerber, J. S., Ramankutty, N., Herrero, M. & West, P. C.Subnational distribution of average farm size and smallholder contributionsto global food production. Environ. Res. Lett. 11, 124010 (2016).
10. Herrero, M. et al. Farming and the geography of nutrient production for humanuse: a transdisciplinary analysis. Lancet Planet. Health 1, e33–e42 (2017).
11. Ricciardi, V., Ramankutty, N., Mehrabi, Z., Jarvis, L. & Chookolingo, B.How much of our world’s food do smallholders produce? Glob. Food Sec. 17, 64–72 (2018).
12. Giordano, M., Barron, J. & Ünver, O. in Sustainable Food and Agriculture: AnIntegrated Approach (eds Campanhola, C. & Pandey, S.) 75–94 (AcademicPress, 2019).
13. Bouma, J. A., Hegde, S. S. & Lasage, R. Assessing the returns to waterharvesting: a meta-analysis. Agric. Water Manag. 163, 100–109 (2016).
14. Carrillo-Reche, J., Vallejo-Marín, M. & Quilliam, R. S. Quantifying thepotential of ‘on-farm’ seed priming to increase crop performance indeveloping countries. A meta-analysis. Agron. Sustain. Dev. 38, 64 (2018).
15. Magombeyi, M. S., Taigbenu, A. E. & Barron, J. Effectiveness of agriculturalwater management technologies on rainfed cereals crop yield and runoff insemi-arid catchment: a meta-analysis. Int. J. Agric. Sustain. 16, 418–441 (2018).
16. Sileshi, G. W. et al. Nutrient use efficiency and crop yield response to thecombined application of cattle manure and inorganic fertilizer in sub-SaharanAfrica. Nutr. Cycl. Agroecosyst. 113, 181–199 (2019).
17. Tonitto, C. & Ricker-Gilbert, J. E. Nutrient management in African sorghumcropping systems: applying meta-analysis to assess yield and profitability.Agron. Sustain. Dev. 36, 10 (2016).
18. Pittelkow, C. M. et al. Productivity limits and potentials of the principles ofconservation agriculture. Nature 517, 365–368 (2015).
19. Corbeels, M., Sakyi, R., Kühne, R. & Whitbread, A. Meta-analysis of CropResponses to Conservation Agriculture in Sub-Saharan Africa CCAFS ReportNo.12 (CIRAD, 2014).
20. Rusinamhodzi, L. et al. A meta-analysis of long-term effects of conservationagriculture on maize grain yield under rain-fed conditions. Agron. Sustain.Dev. 31, 657–673 (2011).
21. van Averbeke, W., Denison, J. & Mnkeni, P. N. S. Smallholder irrigationschemes in South Africa: a review of knowledge generated by the WaterResearch Commission. Water SA 37, 797–808 (2011).
22. Nyagumbo, I. & Rurinda, J. An appraisal of policies and institutionalframeworks impacting on smallholder agricultural water management inZimbabwe. Phys. Chem. Earth 47–48, 21–32 (2012).
23. Lobell, D. B. et al. Eyes in the sky, boots on the ground: assessing satellite- and ground-based approaches to crop yield measurement and analysis. Am. J.Agric. Econ. 102, 202–219 (2020).
24. Barrett, C. B., Sherlund, S. M. & Adesina, A. A. Shadow wages, allocativeinefficiency, and labor supply in smallholder agriculture. Agric. Econ. 38, 21–34 (2008).
25. Haileslassie, A. et al. On-farm Smallholder Irrigation Performance in Ethiopia:From Water Use Efficiency to Equity and Sustainability (ILRI, 2016).
Nature SuStaiNability | VOL 3 | OctOber 2020 | 836–844 | www.nature.com/natsustain 843

106 | Sustainable solutions to end hunger
Articles Nature SuStaiNability
26. Jha, A. K. et al. Impact of irrigation method on water use efficiency andproductivity of fodder crops in Nepal. Climate 4, 4 (2016).
27. Gebregziabher, G., Namara, R. E. & Holden, S. Technical efficiency ofirrigated and rain-fed smallholder agriculture in Tigray, Ethiopia: acomparative stochastic frontier production function analysis. Q. J. Int. Agric. 51, 203–226 (2012).
28. Lal, R. Promoting ‘4 per thousand’ and ‘adapting African agriculture’ bysouth–south cooperation: conservation agriculture and sustainableintensification. Soil Tillage Res. 188, 27–34 (2019).
29. Zhang, P. et al. Food–energy–water (FEW) nexus for urban sustainability: acomprehensive review. Resour. Conserv. Recycl. 142, 215–224 (2019).
30. D’Odorico, P. et al. The global food–energy–water nexus. Rev. Geophys. 56, 456–531 (2018).
31. The State of Food and Agriculture: Women in Agriculture (FAO, 2011). 32. Care Work and Care Jobs for the Future of Decent Work (ILO, 2018). 33. World Program of the Census of Agriculture 2020: Programme, Concepts and
Definitions (FAO, 2015). 34. Fanzo, J. et al. A research vision for food systems in the 2020s: defying the
status quo. Glob. Food Sec. 26, 100397 (2020). 35. Godde, C. M., Garnett, T., Thornton, P. K., Ash, A. J. & Herrero, M. Grazing
systems expansion and intensification: drivers, dynamics, and trade-offs. Glob. Food Sec. 16, 93–105 (2018).
36. Reid, R. S., Fernández-Giménez, M. E. & Galvin, K. A. Dynamics andresilience of rangelands and pastoral peoples around the globe. Annu. Rev.Environ. Resour. 39, 217–242 (2014).
37. Brondizio, E. S., Settele, J., Díaz, S. & Ngo, H. T. (eds) Global AssessmentReport on Biodiversity and Ecosystem Services (IPBES, 2019).
38. Fabregas, R., Kremer, M. & Schilbach, F. Realizing the potential of digitaldevelopment: the case of agricultural advice. Science 366, eaay3038 (2019).
39. Paraskevopoulos, A. L. & Singels, A. Integrating soil water monitoringtechnology and weather based crop modelling to provide improved decisionsupport for sugarcane irrigation management. Comput. Electron. Agric. 105, 44–53 (2014).
40. Zinyengere, N. et al. Using seasonal climate forecasts to improve maizeproduction decision support in Zimbabwe. Agric. Meteorol. 151, 1792–1799 (2011).
41. Yadav, S. et al. Growing Rice in Eastern India: New Paradigms of RiskReduction and Improving Productivity. The Future Rice Strategy for India (Elsevier, 2017).
42. Mehrabi, Z. et al. The global divide in data-driven farming. Nat. Sustain. https://doi.org/10.1038/s41893-020-00631-0 (2020).
43. Khalil, C. A., Conforti, P., Ergin, I. & Gennari, P. Defining Small-Scale FoodProducers to Monitor Target 2.3. of the 2030 Agenda for SustainableDevelopment (FAO, 2017).
44. Lesiv, M. et al. Estimating the global distribution of field size usingcrowdsourcing. Glob. Change Biol. 25, 174–186 (2019).
45. Murakami, D. & Yamagata, Y. Estimation of gridded population and GDPscenarios with spatially explicit statistical downscaling. Sustainability 11, 2106 (2019).
46. Ramankutty, N., Evan, A. T., Monfreda, C. & Foley, J. A. Farming the planet:1. Geographic distribution of global agricultural lands in the year 2000. Glob.Biogeochem. Cycles 22. Glob. Biogeochem. Cycles 22, GB1003 (2008).
47. Managing the Risks of Extreme Events and Disasters to Advance ClimateChange Adaptation (IPCC, 2012).
48. Schneider, U., Becker, A., Meyer-Christoffer, A., Ziese, M. & Rudolf, B. Global Precipitation Analysis Products of the GPCC (GPCC, 2011).
49. Hoekstra, A. Y., Mekonnen, M. M., Chapagain, A. K., Mathews, R. E. &Richter, B. D. Global monthly water scarcity: blue water footprints versus bluewater availability. PLoS ONE 7, e32688 (2012).
50. Salmon, J. M., Friedl, M. A., Frolking, S., Wisser, D. & Douglas, E. M. Globalrain-fed, irrigated, and paddy croplands: a new high resolution map derivedfrom remote sensing, crop inventories and climate data. Int. J. Appl. EarthObs. Geoinf. 38, 321–334 (2015).
51. James, K. L., Randall, N. P. & Haddaway, N. R. A methodology for systematicmapping in environmental sciences. Environ. Evid. 5, 7 (2016).
52. Marshall, I. J. & Wallace, B. C. Toward systematic review automation: apractical guide to using machine learning tools in research synthesis. Syst. Rev. 8, 163 (2019).
53. Przybyła, P. et al. Prioritising references for systematic reviews withRobotAnalyst: a user study. Res. Synth. Methods 9, 470–488 (2018).
54. Devlin, J., Chang, M.-W., Lee, K. & Toutanova, K. BERT: Pre-training ofDeep Bidirectional Transformers for Language Understanding v.2 (CornellUniv., 2018).
55. Woodcock, P., Pullin, A. S. & Kaiser, M. J. Evaluating and improving thereliability of evidence syntheses in conservation and environmental science: amethodology. Biol. Conserv. 176, 54–62 (2014).
AcknowledgementsWe gratefully acknowledge that the funding of this research was provided by the Federal Ministry of Economic Cooperation (BMZ Germany) and the Bill & Melinda Gates OPP1210352 for the project Ceres2030: Sustainable Solutions to End Hunger.
Author contributionsV.R., J.P. and Z.M. conceived the initial idea for this manuscript. V.R., A.W., B.S.S., C.G., D.S., E.M., F.D., J.P., M.J., N.R. and Z.M. collaborated to design and write the evidence synthesis protocol and took part in data collection. In consultation with J.P. and V.R., F.D. developed and implemented the search strategy and led the literature discovery process. V.R., D.S., E.M., M.J. and N.R. designed the data extraction tools. V.R., B.S.S. and Z.M. designed and wrote the analysis code. V.R. and Z.M. led the writing of the manuscript. V.R., A.W., B.S.S., C.G., D.S., E.M., F.D., J.P., M.J., N.R. and Z.M. contributed to editing the manuscript.
Competing interestsThe authors declare no competing interests.
Additional informationSupplementary information is available for this paper at https://doi.org/10.1038/s41893-020-00623-0.
Correspondence and requests for materials should be addressed to V.R.
Reprints and permissions information is available at www.nature.com/reprints.
Publisher’s note Springer Nature remains neutral with regard to jurisdictional claims in published maps and institutional affiliations.
Open Access This article is licensed under a Creative Commons Attribution 4.0 International License, which permits use, sharing, adap-tation, distribution and reproduction in any medium or format, as long
as you give appropriate credit to the original author(s) and the source, provide a link to the Creative Commons license, and indicate if changes were made. The images or other third party material in this article are included in the article’s Creative Commons license, unless indicated otherwise in a credit line to the material. If material is not included in the article’s Creative Commons license and your intended use is not permitted by statu-tory regulation or exceeds the permitted use, you will need to obtain permission directly from the copyright holder. To view a copy of this license, visit http://creativecommons.org/licenses/by/4.0/.© The Author(s) 2020
Nature SuStaiNability | VOL 3 | OctOber 2020 | 836–844 | www.nature.com/natsustain844

Sustainable solutions to end hunger | 107
Articleshttps://doi.org/10.1038/s41893-020-00617-y
1International Food Policy Research Institute (IFPRI), Washington DC, USA. 2Inter-American Institute for Cooperation on Agriculture (IICA), Panama City, Panama. 3Center for Development Research (ZEF), Bonn, Germany. 4Group of Producing Countries from the Southern Cone (GPS), Buenos Aires, Argentina. 5Inter-American Development Bank (IADB), Washington DC, USA. 6Makerere University, Kampala, Uganda. 7Food and Agriculture Organization (FAO), Rome, Italy. 8University of Ghana, Accra, Ghana. 9Ohio State University (OSU), Columbus, OH, USA. 10International Center for Tropical Agriculture (CIAT), Cali, Colombia. ✉e-mail: [email protected]
The pressure on agricultural production systems to achieve global food security, in the context of growing demands and the degradation of natural resources, makes it necessary to rethink
current production systems towards more sustainable models.In agriculture, environmental sustainability means good stew-
ardship of the natural systems and resources that farms rely on. Among other things, this involves rotating crops and embracing diversity, planting cover crops, no-till systems (or reduced till), integrated pest management, integration between livestock and crops, agroforestry practices and precision farming. The general aim of sustainable agricultural policies is that they ensure envi-ronmental sustainability while enhancing, or at least maintaining, farm productivity.
At present, competing uses for land and water resources con-tribute to the degradation of natural resource capital, a situation that may exacerbate present-day and intergenerational con-sequences for farmers, other users and the wider population. Sustainable agricultural practices protect the ecosystem through the more efficient use of natural resources and strengthened capacity for adaptation to climate change and climate variability1. Therefore, their adoption may have significant benefits for the envi-ronment. Moreover, the adoption of sustainable practices is likely to help achieve more resilient and productive food systems and enable sustainable production, which would serve to reduce pov-erty and advance food security2,3. Sustainable agriculture therefore has the potential to directly contribute to several of the United Nations Sustainable Development Goals (SDGs) for 2030,
including those relating to poverty (SDG 1), hunger (SDG 2), decent work and economic growth (SDG 8), reducing inequali-ties (SDG 9), responsible consumption and production (SDG 12), climate action (SDG 13), life below water (SDG 14) and life on land (SDG 15).
The adoption of these sustainable practices usually requires concrete incentives, significant effort from farmers and the sup-port of governments and public–private partnerships at national and local levels. However, the decision to adopt sustainable agricul-tural practices in response to incentive programmes is not a binary process. Adoption depends on many factors: the conditions of the programme and the incentives offered, as well as the farmers’ envi-ronmental preferences, economics and cultural characteristics4,5. Agricultural market trends also affect producers’ decisions6.
This scoping review is thus motivated by the need to systemati-cally evaluate the evidence base 6 the effects of incentives offered to farmers to adopt sustainable agricultural practices. To this end, this scoping review examines nearly 18,000 papers on the various incen-tives that are offered to farmers by governments, non-governmental organizations, international organizations, development banks and other market actors such as consumers and enterprises.
Three kinds of incentives (market and non-market, regula-tions and cross-compliance, Box 1), as well as their compulsory or voluntary nature, are assessed to determine whether the type of the incentive affects farmers’ willingness to adopt. This scoping review also examines the relationship between farmer’s adoption of sustainable practices and three types of outcomes: environmental,
A scoping review on incentives for adoption of sustainable agricultural practices and their outcomesValeria Piñeiro 1 ✉, Joaquín Arias 2, Jochen Dürr3, Pablo Elverdin 4, Ana María Ibáñez5, Alison Kinengyere 6, Cristian Morales Opazo7, Nkechi Owoo8, Jessica R. Page 9, Steven D. Prager 10 and Maximo Torero7
The increasing pressure on agricultural production systems to achieve global food security and prevent environmental degra-dation necessitates a transition towards more sustainable practices. The purpose of this scoping review is to understand how the incentives offered to farmers motivate the adoption of sustainable agricultural practices and, ultimately, how and whether they result in measurable outcomes. To this end, this scoping review examines the evidence of nearly 18,000 papers on whether incentive-based programmes lead to the adoption of sustainable practices and their effect on environmental, economic and pro-ductivity outcomes. We find that independent of the incentive type, programmes linked to short-term economic benefit have a higher adoption rate than those aimed solely at providing an ecological service. In the long run, one of the strongest motivations for farmers to adopt sustainable practices is perceived benefits for either their farms, the environment or both. Beyond this, the importance of technical assistance and extension services in promoting sustainable practices emerges strongly from this scop-ing review. Finally, we find that policy instruments are more effective if their design considers the characteristics of the target population, and the associated trade-offs between economic, environmental and social outcomes.
Nature SuStaiNability | VOL 3 | OCTOBER 2020 | 809–820 | www.nature.com/natsustain 809

108 | Sustainable solutions to end hunger
Articles Nature SuStaiNability
productivity and economic. Finally, the scoping review draws conclusions on the effectiveness of incentives and the adoption of sustainable farming practices to achieve the desired outcomes. These incentive–adoption–outcome pillars, and the links between them, offer a consistent logic by which to evaluate best practices in sustainable agricultural policy.
This scoping review also considers the broader demographic, social, environmental and economic factors that may drive the observed linkages between incentive, adoption and outcome.
This scoping review finds that regardless of the incentive type, linking programmes to economic benefits (productivity or prof-itability) is essential for farmers to adopt sustainable agriculture practices in the short term6,7. In the long term, one of the strongest motivations for farmers to adopt and maintain sustainable prac-tices is perceived positive outcomes of adoption for their farm or the environment8–11. Beyond this, there are important analysis gaps in the existing literature, particularly regarding the interrelation-ships between the selected incentives, the adoption of best agricul-tural practices and outcomes. Some suggestions on the next lines of research are included in the analysis.
ResultsThe purpose of this scoping review is to understand how incentives motivate the adoption of sustainable agricultural practices and, ulti-mately, how and whether they result in measurable outcomes. This scoping review looked at the overall landscape of evidence of these instruments and their effectiveness in achieving the key outcomes. As in any scoping review, article screening against the inclusion and exclusion criteria took place in three phases: title screening, abstract screening and full-text screening (Box 2).
This resulted in 577 articles that were evaluated for relevance in terms of connecting either incentives to adoption, adoption to
measurable outcomes or both sets of links. A machine learning-based approach helped to identify and cluster common terms and topics covered by the three incentive types (Fig. 1). Programmes fell into three broad categories related to ecosystem and environmental interventions, socioeconomic interventions and technological solutions. Articles typically showcased multiple interventions, with 36% of the total programmes falling under the technical category, and 32% each falling under the ecosystem and socioeconomic categories.
To better understand the links between incentive, adoption and outcome, a stratified random sample of 99 citations were selected from the 577 articles for additional review and data extraction. Of these, six articles were excluded as they were published in a lan-guage not spoken by any of the authors of this research or because full-text versions could not be located.
The subset of 93 articles facilitated more in-depth review of the incentive types. Each article contained a link between either incen-tives and adoption or adoption and outcomes, or both. For each article, the incentive types were identified, farmers’ adoption behav-iours as described in the articles were recorded and the correspond-ing outcomes were noted as a function of the incentives. We found that market and non-market incentives tend to be the most preva-lent mechanism (Fig. 2), whereas all three incentive categories are used more or less uniformly to achieve environmental outcomes. Furthermore, profitability-related outcomes tend to require bal-anced incentive structures, whereas productivity-related outcomes tend to be more market and non-market-oriented (Fig. 2).
Given the importance of understanding when and how incen-tives drive farmers’ adoption behaviours and how the adoption of
box 1 | Incentives, definitions and categories
Incentives are instruments used by the public and private sectors to encourage farmers to protect or enhance ecosystem services beneficial to them and others (for example, water quality, soil care, forestry), while simultaneously improving the productivity (yields, labour per hectare and so on) and the competitiveness (such as cost per hectare, profitability, farm incomes) of the agri-cultural sector. These were classified into three categories.
Market-based incentives encourage behavioural change by providing economic incentives through market signals. Examples of these include prices of input and output, subsidy, compensation, income transfer and other incentives in cash or in kind to agricultural producers. Non-market incentives are a broad basket. The parties of the Paris Agreement expressed that a non-market-based mechanism can be anything, provided it is not market-based51. This includes technical support, technology transfer and fiscal measures, such as putting a price on carbon or applying taxes to improve environmental sustainability.
Regulatory measures are general rules or specific actions imposed by government agencies or private entities to enhance environmental and economic outcomes through improved practices. Examples include certifications and environmental laws and standards. In general, they are mandatory.
Cross-compliance incentives link direct payments to farmers’ compliance with basic standards concerning the environment. They also require farmers to maintain land in good agricultural and environmental condition. In this case, they are mostly voluntary. Examples of these include government subsidies that are conditional on farmers adhering to certain environmental practices.
box 2 | Abridged methods
A double-blind title and abstract screening was performed on 17,936 articles using the following inclusion and exclusion criteria: 1. Studies published in 1994 or later. 2. Studies with an explicit focus on incentives for sustainable
environmental agricultural practices. 3. Studies with an explicit focus on adoption of sustainable en-
vironmental agricultural practices. 4. Studies that explicitly connect the adoption of agricultural
practices to sustainability outcomes. 5. Studies with an explicit analysis of the impact of incentives
on income, production, productivity, profits and/or envi-ronmental sustainability.
6. Original research (qualitative and quantitative reports) and/or review of existing research including grey literature.
The resulting 1,792 articles were subjected to a second round of rapid review by abstract. This resulted in 577 articles that met the a priori inclusion criteria. A stratified random sample of 99 of these articles were selected for the next step,: full-text screening.
We performed data extraction on 93 of the studies (6 excluded for issues of availability or language). A data extraction template (available in the Supplementary Information) was developed to document the data, study type and context of each citation and all themes of interest.
Why is this method so important?Unlike a typical narrative review, a scoping review strives to capture all of the literature on a given topic and reduce authorial bias. Scoping reviews offer a unique opportunity to explore the evidence in agricultural fields to address questions relating to what is known about a topic; what can be synthesized from existing studies to develop policy or practice recommendations; and what aspects of a topic are yet to be addressed by researchers.
Nature SuStaiNability | VOL 3 | OctOber 2020 | 809–820 | www.nature.com/natsustain810

Sustainable solutions to end hunger | 109
ArticlesNature SuStaiNability
specific practices leads to the desired outcomes, additional analysis was needed. We further limited the subset of papers to only those that had a complete set of links between the incentive–adoption–outcome pillars (44 papers) (Supplementary Annex 1). The results of this exercise illustrate how many of the papers with the full logic actually addressed multiple incentive categories and outcomes (Fig. 3). This is an important finding, as it bolsters the earlier obser-vation that multipronged, integrated development interventions, both in terms of incentive structure and expected outcomes, are relatively commonplace. It is also important to note that although environmental and profitability outcomes are more or less equally supported by all three incentives, profitability outcomes are more supported by market or non-market incentives.
There is a clear general association between market and non-market incentives and environmental outcomes (Fig. 3). Nearly half of the interventions seen in the full-text review are considering market or non-market incentives and, simultane-ously, just over 40% of the outcomes had an explicit environmental focus (Fig. 4). In general terms, this illustrates that, given appro-priate design, market/non-market incentives can be successfully
paired with environmental outcomes. Similarly important, it is clear that regulatory-based incentives are either less adequately documented or generally less prevalent in the development com-munity’s menu of incentive-based approaches (left side of Fig. 4). Combined with the previous figures linking incentives to multiple outcome types (Figs. 2 and 3), there is support for the idea that development interventions tend to be moving away from simple productivity-enhancing approaches towards a more holistic style of engagement (Fig. 4 right side).
Assessment of the evidence base. For this study, the incentive–adoption–outcome logic is only valid if evidence is present in the full-text review that backs up the claims regarding the outcomes. Although an assessment of evidence is not typically carried out as part of a scoping review12,13, we opted to undertake one to under-stand when and how evidence was used to support assertions regarding inventive–adoption–outcome logic. The review team undertook a subjective assessment to label each study according to the strength of the evidence presented and the quality of the methodology used.
Payment environmental service (pes)Ecosystem service (es)
Management practice (mp)Forestry
Soil waterEnvironmental device
Conservation programme (crp)Greenhouse gas (ghg)
FertilizerCommon agricultural policy (cap mtr)
StewardshipFinancial incentive (fit)
Environmental policyForest management (fm)
IrrigationConservation practice (cp)
Land management (lm)Deforestation
Cropping
Conventional agricultural practice (cap)Environmental benefit
Soil conservation (sc)Sequestration
Farming system (fs)Water quality (wq)
Soil erosion (se)Farming practice (fp)Water resource (wrs)
Government policyEnvironmental impact (ei)Carbon sequestration (cs)
FertilityAgri environmental policy (aep)
Sustainable forestIncentive programme
Agroforestry
0 50 100 150Frequency of programme type
Categories
Ecosystem
Socioeconomic
Technology
Fig. 1 | Summary of the predominant programme types treated in the literature. All programmes that appeared in more than 20 of the 577 articles are included. Note that the machine learning approach used to tag the articles by topic distinguished terms as used in the articles.
Nature SuStaiNability | VOL 3 | OctOber 2020 | 809–820 | www.nature.com/natsustain 811
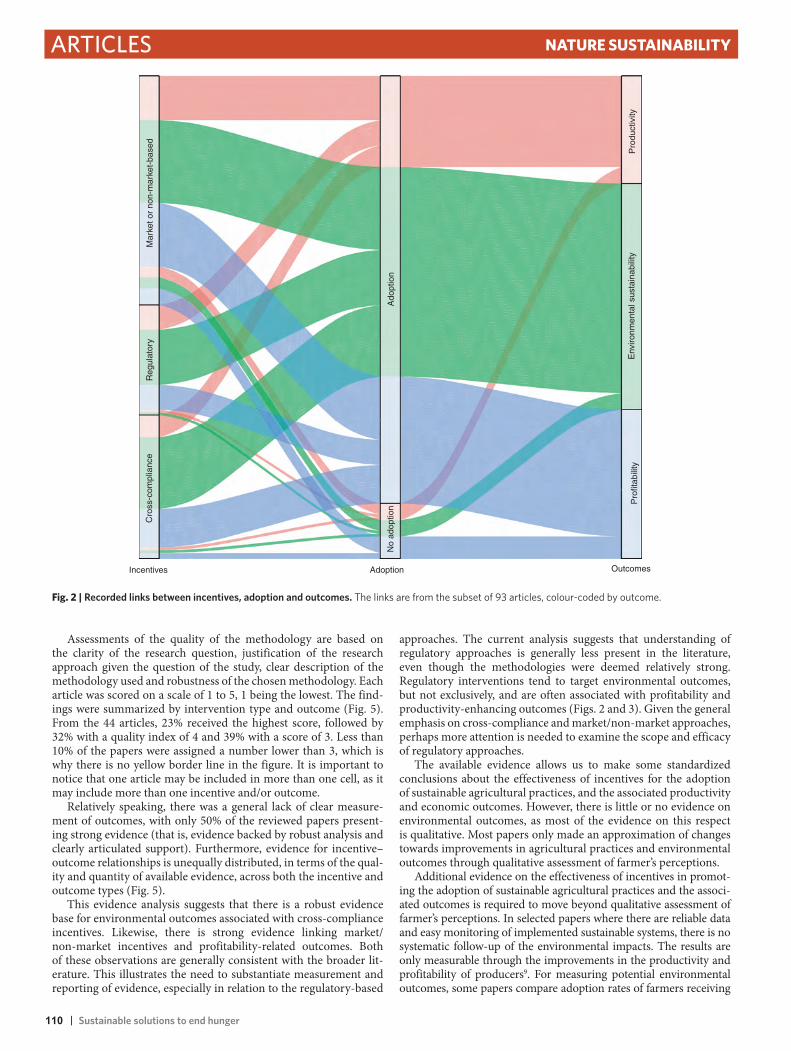
110 | Sustainable solutions to end hunger
Articles Nature SuStaiNability
Assessments of the quality of the methodology are based on the clarity of the research question, justification of the research approach given the question of the study, clear description of the methodology used and robustness of the chosen methodology. Each article was scored on a scale of 1 to 5, 1 being the lowest. The find-ings were summarized by intervention type and outcome (Fig. 5). From the 44 articles, 23% received the highest score, followed by 32% with a quality index of 4 and 39% with a score of 3. Less than 10% of the papers were assigned a number lower than 3, which is why there is no yellow border line in the figure. It is important to notice that one article may be included in more than one cell, as it may include more than one incentive and/or outcome.
Relatively speaking, there was a general lack of clear measure-ment of outcomes, with only 50% of the reviewed papers present-ing strong evidence (that is, evidence backed by robust analysis and clearly articulated support). Furthermore, evidence for incentive–outcome relationships is unequally distributed, in terms of the qual-ity and quantity of available evidence, across both the incentive and outcome types (Fig. 5).
This evidence analysis suggests that there is a robust evidence base for environmental outcomes associated with cross-compliance incentives. Likewise, there is strong evidence linking market/non-market incentives and profitability-related outcomes. Both of these observations are generally consistent with the broader lit-erature. This illustrates the need to substantiate measurement and reporting of evidence, especially in relation to the regulatory-based
approaches. The current analysis suggests that understanding of regulatory approaches is generally less present in the literature, even though the methodologies were deemed relatively strong. Regulatory interventions tend to target environmental outcomes, but not exclusively, and are often associated with profitability and productivity-enhancing outcomes (Figs. 2 and 3). Given the general emphasis on cross-compliance and market/non-market approaches, perhaps more attention is needed to examine the scope and efficacy of regulatory approaches.
The available evidence allows us to make some standardized conclusions about the effectiveness of incentives for the adoption of sustainable agricultural practices, and the associated productivity and economic outcomes. However, there is little or no evidence on environmental outcomes, as most of the evidence on this respect is qualitative. Most papers only made an approximation of changes towards improvements in agricultural practices and environmental outcomes through qualitative assessment of farmer’s perceptions.
Additional evidence on the effectiveness of incentives in promot-ing the adoption of sustainable agricultural practices and the associ-ated outcomes is required to move beyond qualitative assessment of farmer’s perceptions. In selected papers where there are reliable data and easy monitoring of implemented sustainable systems, there is no systematic follow-up of the environmental impacts. The results are only measurable through the improvements in the productivity and profitability of producers9. For measuring potential environmental outcomes, some papers compare adoption rates of farmers receiving
Mar
ket o
r no
n-m
arke
t-ba
sed
Reg
ulat
ory
Cro
ss-c
ompl
ianc
e
Incentives Adoption Outcomes
Pro
fitab
ility
Pro
duct
ivity
Env
ironm
enta
l sus
tain
abili
ty
No
adop
tion
Ado
ptio
n
Fig. 2 | Recorded links between incentives, adoption and outcomes. The links are from the subset of 93 articles, colour-coded by outcome.
Nature SuStaiNability | VOL 3 | OcTOber 2020 | 809–820 | www.nature.com/natsustain812

Sustainable solutions to end hunger | 111
ArticlesNature SuStaiNability
incentives versus non-receiving farmers8,9,12,14 or relate socioeconomic characteristics of participants versus non-participants8,15.
Most papers simply state the participation rates in terms of the percentage of potential beneficiaries and explain them using influ-encing factors. Some papers model the adoption according to dif-ferent incentive levels (such as different tax or levels of payments for
environmental services (PES))10,16–19. In those articles, no complete evidence was found connecting incentives with adoption and out-comes. Stronger identification strategies are also needed to uncover the causal effect of the chain of incentives, adoption and outcomes. We found no randomized controlled trial studies in the selected papers, which constitutes an important gap in the literature as these
12
34
56
78
910
1112
1314
1516
1718
1920
2122
2324
2526
2728
2930
3132
3334
3536
3840
4244
Title
Pro
duct
ivity
Incentives
Env
ironm
enta
l sus
tain
abili
tyP
rofit
abili
ty
Outcomes
Mar
ket o
r no
n-m
arke
t-ba
sed
Reg
ulat
ory
Cro
ss-c
ompl
ianc
e
Fig. 3 | Associations between categories of outcomes and the type of incentive used. The 44 full-text reviews are included (read from left to right). See Supplementary Annex 1 for the associated list of papers.
Nature SuStaiNability | VOL 3 | OcTOber 2020 | 809–820 | www.nature.com/natsustain 813

112 | Sustainable solutions to end hunger
Articles Nature SuStaiNability
kinds of experiments are key to more accurately testing the effec-tiveness of policy interventions, technologies and practices, taking into account socioeconomic, geographical and environmental influ-ential factors. This scoping review reveals important research gaps: methods to detect causal pathways and to quantify the connections.
Type of incentive. However, despite weaknesses and limitations in the evidence base, the evidence provided by previous programmes on what has worked and what needs to be improved is important to consider when designing future incentive programmes. Looking at the articles reviewed in this scoping review, some interesting aspects for each of the three incentive categories can be highlighted (Fig. 6).
Market and non-market-based incentives. One of the general strengths of market-based incentives is that they offer flexible adoption to promote specific behaviour changes. Examples of this include altering market prices, setting a cap or altering quantities of a particular good, improving the way a market works, or creating a market where none previously existed (for example, water trad-ing)20. However, one of the weaknesses of market-based incentives and their flexibility is that they can lead to negative social, environ-mental and economic changes that were unplanned or not in line with the intended strategic direction10. For example, subsidies may increase the adoption of intercropping and residue mulching, but these practices may crowd out adoption of zero tillage21.
However, a lack of flexibility has been linked to low adoption levels as farmers’ previous experiences of using a particular agri-cultural practice may significantly influence the types of policy instrument they will apply5. For example, promoting the use of
specific crops for the incorporation of nutrients into the soil is more likely to be adopted by farmers who already practice crop rotation21–23. This is particularly pertinent for non-market incen-tives, for which it is important to understand the interaction between a particular practice and the policy instruments designed to achieve its uptake.
Regulatory incentives. Some studies show that instruments per-ceived as inflexible or too complex, such as legal regulations, were the least preferred by farmers5. Indeed, for regulatory measures, such as forest laws or watershed management programmes, the adoption of practices depends on the effectiveness of law enforce-ment, supervision and monitoring. For this reason, the adoption of regulatory measures is often linked to accompanying measures such as information sharing, capacity building, technical assistance, training support for the local population and farmer-to-farmer communication networks that build trust and enhance understand-ing of the potential benefits of conservation practices24. Agricultural extension services, both public and private, have been shown to have a positive impact on adoption rates5,7,12,15,23,25–28. Connecting these programmes with national extension systems can result in a significant change in agricultural sustainability.
To increase their effectiveness, regulatory measures are often linked to economic incentives including forest trade quotas, cer-tification, access to rural credits or benefits in insurance markets. For example, voluntary community-based programmes are often coupled with short-term financial support to incentivize partici-pation25,29. To improve efficiency in the adoption of the promoted practices, flexible payments may be preferred as participation costs
Ince
ntiv
es
45%
30.4%
24.6%
Market ornon-market
a b
Cross-compliance
Regulatory
24.7%
32.5%
42.8%Environmentalsustainability
Profitability
Productivity
Outcom
es
Fig. 4 | Relative proportions of incentives and outcomes. a, Incentives. b, Outcomes. The proportions are expressed as the percentage of the totals across the 44 full-text reviews.
Outcomes
Profitability ProductivityEnvironmentalsustainability
Incentives
Market or non-market-based
Regulatory
Cross-compliance
Fig. 5 | Evidence map. The map shows articles reviewed by intervention and outcomes (subset of 44 articles). The sizes of the circles correspond to the number of reviews in each category. The fill colours indicate the level of evidence, with dark blue representing strong evidence and light blue representing weak evidence. The border colours indicate the quality of the methodology; red is used for methodologies that are generally strong and yellow where there are concerns over the methodologies.
Nature SuStaiNability | VOL 3 | OcTOber 2020 | 809–820 | www.nature.com/natsustain814

Sustainable solutions to end hunger | 113
ArticlesNature SuStaiNability
and expected benefits differ depending on individual farmers and geographical location16.
Cross-compliance incentives. Cross-compliance incentives help over-come the barriers that make the adoption of sustainable practices unattractive, such as large up-front adoption costs, lack of capital, restricted access to financial markets and the need to provide for the household’s short-term economic needs. They are based on the hypothesis that incentives should at least compensate for the income loss or additional costs of adopting sustainable practices; and that there should be clear monitoring processes that ensure compliance with the conditionality (the adoption of the sustainable practice).
The main cross-compliance incentives are PES or agri-environment payments. These are incentives offered to farm-ers, or landowners, in exchange for managing their land to provide some type of ecological service, including water quality, forestry, soil erosion and air pollution. In the case of resource conservation in the Ecuadorian Andes, it was shown that when conservation tech-nologies were offered in conjunction with measures that enhance the short-term profitability of agriculture (such as new crops, bio-logical barriers and improved agricultural production), the adop-tion of conservation practices increased significantly8. Similar results were found in the Nepal Knowledge Based Integrated Sustainable Agriculture and Nutrition (KISAN) project30. These two examples reflect the broader finding that in most of the reported PES case studies, socioeconomic and environmental out-comes have been positive8,15,30, especially if the PES is accompanied by technical assistance7,12.
DiscussionThe decision by farmers to adopt sustainable agricultural prac-tices in response to incentive programmes is not a binary process. Adoption is a continuum that depends on many factors: the condi-tions of the programme, the incentives offered, the environmental preferences, personal perspectives, experience and education of farmers4. Farmers’ decisions are shaped by personal opinions, such as preferences over conservation measures, beliefs about the pro-gramme and degrees of risk aversion21,31. Factors such as income levels, asset ownership, age, and access to other economic oppor-tunities also correlate with the decision to adopt, as they affect the capacity of the target population to reap benefits from the programme5–7,12,29,32–34. The decision to adopt is also affected by the bio-physical characteristics of the land plot, and the institutional and policy context. Even agricultural market trends affect producers’ decisions to adopt agricultural practices3,6. The variety of factors that contribute to the adoption of sustainable agricultural practices necessitates the consideration of context in policy design and the use of differentiated policy instruments16.
Incentives across the spectrum. Direct economic benefits, increased productivity or profitability seem to be the essential condition for the adoption of sustainable practices in the short term7. Regardless of the incentive type, adoption rates are higher when programmes offer short-term economic benefits than those solely aimed at providing a positive ecological outcome. For example, restrictive land-use-change programmes, such as those induced by climate change, which modify the incentives for engaging in agricultural production, agroforestry and other land uses have higher adoption rates when they are connected with an improvement in income13,15.
Nevertheless, and independent of the incentive type, in the long term it seems that one of the strongest motivations for farmers to adopt and maintain sustainable practices is the perceived positive outcomes of these practices for their farm or the environment8–11. For example, the greatest motivating factor for participation in a forest conservation scheme in Kenya was the ‘will to conserve’, influenced by the local communities’ concern for the degradation of their environment and their perceived dependency on natural resources11. The will to participate was based on the perceived ben-efits of conservation, especially changes in water availability, which were reinforced by the potential benefits of new income-generating activities. This suggests that incentives can lead to the adoption of sustainable practices and have positive effects on ecological services, even without direct payments. If participants perceive future bene-fits of sustainable practices, the likelihood of adoption increases15,29.
Compulsory or voluntary incentives. The likelihood of a farmer adopting the associated sustainable agricultural practice depends on whether the incentive is compulsory or voluntary5. Voluntary incen-tive programmes, such as market and non-market-based incentives or certification schemes (for example, carbon footprints, water foot-prints, organic farming), have a high degree of uncertainty as they depend on the decision of farmers to adopt sustainable practices. In general, if the economic incentives or payment levels do not offset the costs of adoption (cover opportunity costs of changing produc-tion techniques or for the most productive land uses), farmers will rarely switch to the desired practices. However, if payment levels compensate, or overcompensate, for income losses and additional costs, then the willingness of farmers to adopt is normally high.
In contrast, the uptake of sustainable agricultural practices due to compulsory incentives is fairly certain. Regulatory measures, such as legal regulations, reduce uncertainty by imposing sanctions for non-compliance. The adoption of regulatory measures depends on the effectiveness of law enforcement, supervision and monitor-ing; however, if institutions are able to enforce the sanctions, the uncertainty surrounding adoption is low or non-existent28.
The degree of uncertainty in the adoption of sustainable prac-tices is closely linked to contradictions between the preferences of farmers and society. Farmers may prefer the short-term finan-cial support and flexibility offered by voluntary incentive pro-grammes, which, being voluntary, tend to create more uncertainty in the achievement of the programme’s environmental goals. This can conflict with society’s preference for longer-term instruments, such as legal regulations, which tend to reduce uncertainty in the achievement of outcomes.
Broader contextual factors. Throughout all stages in the incentive–adoption–outcome chain, wider contextual factors play an impor-tant role. Ignorance of the practices promoted and the opportunity costs from foregone activities due to limitations on land use and restrictions on the use of some management practices may deter participation by some farmers16,29,35. Complexity, inflexibility and complicated procedures are also salient obstacles for participa-tion5,15,16. Therefore, the timescale, desired outcome and target pop-ulation must be considered in all aspects of sustainable agricultural policy, from design to implementation to assessment.
Incentives
Adoption
Factors
Outcomes
· Productivity· Profitability
· Environmentalsustainability
· Market andnon-market-
based· Regulatory
· Cross- compliance
Fig. 6 | Pillars and linkages. The diagram illustrates the pathways between the three pillars.
Nature SuStaiNability | VOL 3 | OcTOber 2020 | 809–820 | www.nature.com/natsustain 815
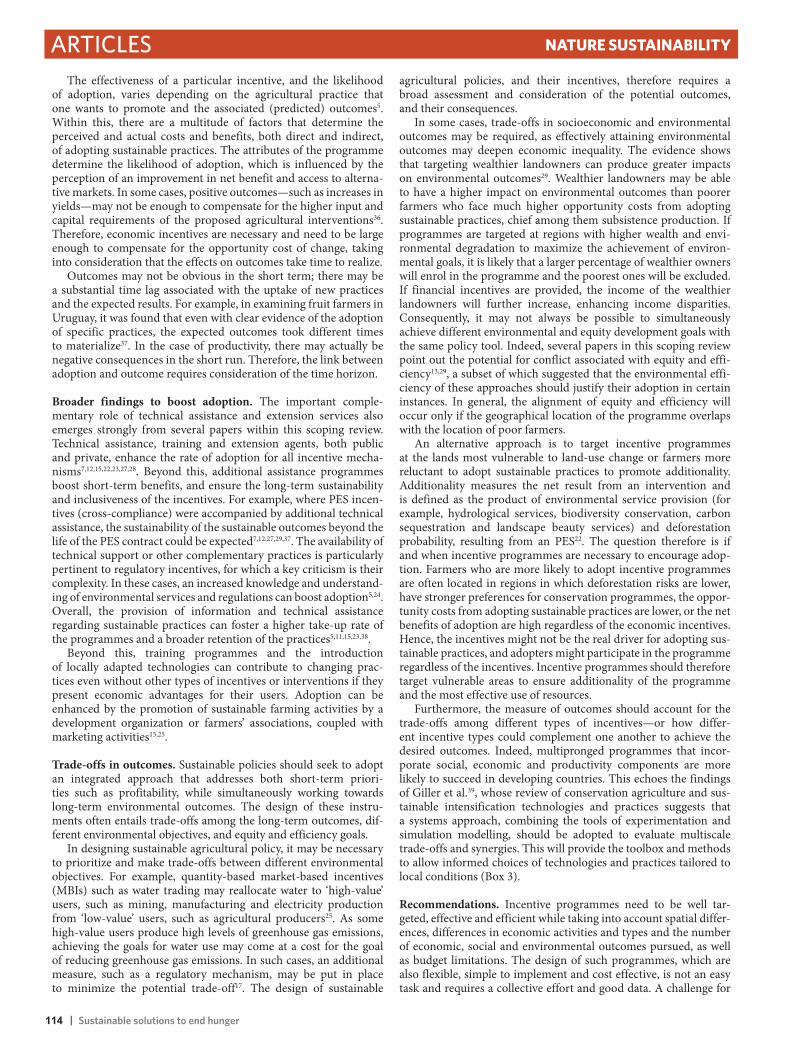
114 | Sustainable solutions to end hunger
Articles Nature SuStaiNability
The effectiveness of a particular incentive, and the likelihood of adoption, varies depending on the agricultural practice that one wants to promote and the associated (predicted) outcomes5. Within this, there are a multitude of factors that determine the perceived and actual costs and benefits, both direct and indirect, of adopting sustainable practices. The attributes of the programme determine the likelihood of adoption, which is influenced by the perception of an improvement in net benefit and access to alterna-tive markets. In some cases, positive outcomes—such as increases in yields—may not be enough to compensate for the higher input and capital requirements of the proposed agricultural interventions36. Therefore, economic incentives are necessary and need to be large enough to compensate for the opportunity cost of change, taking into consideration that the effects on outcomes take time to realize.
Outcomes may not be obvious in the short term; there may be a substantial time lag associated with the uptake of new practices and the expected results. For example, in examining fruit farmers in Uruguay, it was found that even with clear evidence of the adoption of specific practices, the expected outcomes took different times to materialize37. In the case of productivity, there may actually be negative consequences in the short run. Therefore, the link between adoption and outcome requires consideration of the time horizon.
Broader findings to boost adoption. The important comple-mentary role of technical assistance and extension services also emerges strongly from several papers within this scoping review. Technical assistance, training and extension agents, both public and private, enhance the rate of adoption for all incentive mecha-nisms7,12,15,22,23,27,28. Beyond this, additional assistance programmes boost short-term benefits, and ensure the long-term sustainability and inclusiveness of the incentives. For example, where PES incen-tives (cross-compliance) were accompanied by additional technical assistance, the sustainability of the sustainable outcomes beyond the life of the PES contract could be expected7,12,27,29,37. The availability of technical support or other complementary practices is particularly pertinent to regulatory incentives, for which a key criticism is their complexity. In these cases, an increased knowledge and understand-ing of environmental services and regulations can boost adoption5,24. Overall, the provision of information and technical assistance regarding sustainable practices can foster a higher take-up rate of the programmes and a broader retention of the practices5,11,15,23,38.
Beyond this, training programmes and the introduction of locally adapted technologies can contribute to changing prac-tices even without other types of incentives or interventions if they present economic advantages for their users. Adoption can be enhanced by the promotion of sustainable farming activities by a development organization or farmers’ associations, coupled with marketing activities15,25.
Trade-offs in outcomes. Sustainable policies should seek to adopt an integrated approach that addresses both short-term priori-ties such as profitability, while simultaneously working towards long-term environmental outcomes. The design of these instru-ments often entails trade-offs among the long-term outcomes, dif-ferent environmental objectives, and equity and efficiency goals.
In designing sustainable agricultural policy, it may be necessary to prioritize and make trade-offs between different environmental objectives. For example, quantity-based market-based incentives (MBIs) such as water trading may reallocate water to ‘high-value’ users, such as mining, manufacturing and electricity production from ‘low-value’ users, such as agricultural producers25. As some high-value users produce high levels of greenhouse gas emissions, achieving the goals for water use may come at a cost for the goal of reducing greenhouse gas emissions. In such cases, an additional measure, such as a regulatory mechanism, may be put in place to minimize the potential trade-off17. The design of sustainable
agricultural policies, and their incentives, therefore requires a broad assessment and consideration of the potential outcomes, and their consequences.
In some cases, trade-offs in socioeconomic and environmental outcomes may be required, as effectively attaining environmental outcomes may deepen economic inequality. The evidence shows that targeting wealthier landowners can produce greater impacts on environmental outcomes29. Wealthier landowners may be able to have a higher impact on environmental outcomes than poorer farmers who face much higher opportunity costs from adopting sustainable practices, chief among them subsistence production. If programmes are targeted at regions with higher wealth and envi-ronmental degradation to maximize the achievement of environ-mental goals, it is likely that a larger percentage of wealthier owners will enrol in the programme and the poorest ones will be excluded. If financial incentives are provided, the income of the wealthier landowners will further increase, enhancing income disparities. Consequently, it may not always be possible to simultaneously achieve different environmental and equity development goals with the same policy tool. Indeed, several papers in this scoping review point out the potential for conflict associated with equity and effi-ciency13,29, a subset of which suggested that the environmental effi-ciency of these approaches should justify their adoption in certain instances. In general, the alignment of equity and efficiency will occur only if the geographical location of the programme overlaps with the location of poor farmers.
An alternative approach is to target incentive programmes at the lands most vulnerable to land-use change or farmers more reluctant to adopt sustainable practices to promote additionality. Additionality measures the net result from an intervention and is defined as the product of environmental service provision (for example, hydrological services, biodiversity conservation, carbon sequestration and landscape beauty services) and deforestation probability, resulting from an PES22. The question therefore is if and when incentive programmes are necessary to encourage adop-tion. Farmers who are more likely to adopt incentive programmes are often located in regions in which deforestation risks are lower, have stronger preferences for conservation programmes, the oppor-tunity costs from adopting sustainable practices are lower, or the net benefits of adoption are high regardless of the economic incentives. Hence, the incentives might not be the real driver for adopting sus-tainable practices, and adopters might participate in the programme regardless of the incentives. Incentive programmes should therefore target vulnerable areas to ensure additionality of the programme and the most effective use of resources.
Furthermore, the measure of outcomes should account for the trade-offs among different types of incentives—or how differ-ent incentive types could complement one another to achieve the desired outcomes. Indeed, multipronged programmes that incor-porate social, economic and productivity components are more likely to succeed in developing countries. This echoes the findings of Giller et al.39, whose review of conservation agriculture and sus-tainable intensification technologies and practices suggests that a systems approach, combining the tools of experimentation and simulation modelling, should be adopted to evaluate multiscale trade-offs and synergies. This will provide the toolbox and methods to allow informed choices of technologies and practices tailored to local conditions (Box 3).
Recommendations. Incentive programmes need to be well tar-geted, effective and efficient while taking into account spatial differ-ences, differences in economic activities and types and the number of economic, social and environmental outcomes pursued, as well as budget limitations. The design of such programmes, which are also flexible, simple to implement and cost effective, is not an easy task and requires a collective effort and good data. A challenge for
Nature SuStaiNability | VOL 3 | OctOber 2020 | 809–820 | www.nature.com/natsustain816

Sustainable solutions to end hunger | 115
ArticlesNature SuStaiNability
the future is to reduce the cost and allocate more resources to the collection of detailed data. This is a condition for the estimation of environmental services such as biodiversity, carbon services (that require information on the amount of stored carbon before
and after an adopted practice) or hydrological services (that require information on site-specific soil characteristics, vegetation cover, slope, distribution and intensity of precipitation). Similarly, the qual-ity and availability of data are frequently inadequate for more pre-cise measures of the cost of participation in incentive programmes.
Beyond the specific incentives examined in this scoping review, it is still necessary to improve the general conditions influencing agricultural systems and practices for sustainable outcomes of the whole sector (Box 3). Agricultural institutions, policies and regula-tions, social protection, infrastructure and markets, relative prices, off-farm employment opportunities, structural poverty and the scarcity of asset endowments all influence the capacity and willing-ness of farmers to invest in land, water and forest conservation and to pursue sustainable practices. These are discussed in some papers as conditioning factors. Nevertheless, there is still the need to better understand the interrelationships between these factors, incentives, adoption and outcomes.
MethodsEvidence synthesis methodology and protocol pre-registration. This scoping review was prepared following guidelines from the Preferred Reporting Items for Systematic Reviews and Meta-Analyses extension for scoping reviews (PRISMA-ScR)40. The methodology for this scoping review follows the framework established in the PRISMA extension for scoping reviews, which builds on the Joanna Briggs Institute’s guidelines41 for conducting scoping reviews. Note that the current CEE Guidelines for Systematic Reviews in Environmental Management42 (version 4.2, March 2013) do not provide recommendations for the number of people who should conduct eligibility screening, although the Guidelines implicitly suggest that a single screener may be acceptable provided that an assessment of screener reliability is conducted. According to the latest CEE evidence synthesis protocols published in Environmental Evidence journal (January–July 2017), screening by a single person, subject to a check of screener reliability using a subset of articles, is the currently practiced approach in most cases42.
Scoping reviews are designed to summarize studies of varying methodological designs while highlighting key areas for future research and engagement43,44. This scoping review leveraged a data–science framework to accelerate the work within each of the individual steps, which are described below. This framework comprises five steps: identifying the research question; identifying relevant studies; study selection; extracting and charting the data; and collating, summarizing and reporting the results. The protocol used in this scoping review was registered on the Open Science Framework and is available in Supplementary Annex 2 (ref. 45).
The guiding question for this scoping review was, “What are the market, non-market, regulatory and compliance incentives or compulsory/voluntary programmes for farmers to adopt environmentally sustainable practices?”.
This study spans both developed and developing world contexts and characterizes how the incentives associated with different instruments may affect adoption given local institutional, environmental and socioeconomic factors. It was not limited by geography or country status.
The goal of this scoping review was to make recommendations about how to promote environmental practices for more sustainable, and at the same time competitive, agricultural production systems. This scoping review looks at the overall landscape of evidence of these instruments and their effectiveness in achieving higher levels of productivity, profitability and equity.
Information sources, searches and citation management. A comprehensive search strategy was developed to identify all available research pertaining to the market, non-market, regulatory and cross-compliance incentives for farmers to adopt environmentally sustainable practices. Search terms included variations of the key concepts in the research question: farmers, incentives, implementation of agricultural practices and environmental impact (see Appendix A of Supplementary Annex 2 (ref. 45) for a presentation of the search strategy in its entirety such that it may be reproduced in CAB Abstracts).
Research synthesis experts conducted searches of the following electronic databases: CAB Abstracts (access via CAB Direct); Web of Science Core Collection (access via Web of Science); Scopus (access via Elsevier); and EconLit (access via EBSCOhost). A search of grey literature sources was also conducted. The grey literature searches were conducted using custom web-scraping scripts. The search strings were tested per website before initiating web-scraping. An existing Google Chrome extension was needed to scrape dynamically generated websites.
A data science team supported much of our process. The results from the databases and the grey literature searches were combined and deduplicated using a Python script. Duplicates were detected using title, abstract and same year of publication where year of publication was a match, where title cosine similarity was greater than 85% and where an abstract’s cosine similarity greater than 80% or one of the abstracts (or both) was empty. When duplicates were found, the
box 3 | Policy recommendations
Notwithstanding the limitations and gaps found in the literature, the following is a set of tested principles to follow when design-ing interventions or policy instruments. These are based on the most solid evidence found on the effectiveness of incentives to motivate the adoption of sustainable practices that, in turn, led to better indicators of productivity, profitability and environmental sustainability of farms under different production systems and conditional factors.
Balance the incentives and outcomes. Incentives must be high enough to motivate a change in production practices. This is because productivity and profitability gains can be insufficient to compensate for the total cost of the initial capital require-ments and any unexpected costs of the proposed agricultural interventions.
Know your farmers. The likelihood of farmers adopting sustain-able agricultural practices will vary depending on their experi-ence, education, access to information and level of risk-aversion. Policymakers must be familiar with the farmers, and tailor the incentive programmes for them by incorporating the range of personal, political, institutional and biophysical factors into the design of the programme.
Keep it simple. Instruments should be simple to understand and communicate given that farmers dislike instruments that are too complex (such as some legal regulations) and are therefore less likely to adopt them. Besides, complexity makes instruments harder to communicate and more expensive to adopt or enforce.
Complement. Single interventions are less likely to succeed, hence the need to use a combination of policy instruments. For example, the provision of technical assistance and extension ser-vices contributes to the understanding of farmers and helps them adopt proposed practices.
Behavioural preferences matter. Given that people have a tendency to follow the behaviour of others, farmers’ preferences should be taken into account when designing incentives, acknowledging that they vary depending on the target population.
Be prepared for a long time horizon. The time horizon depends on the agricultural practice, the production system and the bio-logical cycle. This means the opportunity cost of time has to be considered and financial tools have to be put in place so that cash flow problems do not jeopardize the intervention.
Create an enabling environment. Incentives that make the adop-tion of sustainable practices attractive depend heavily on an enabling economic and financial environment. Beyond incen-tives, it is necessary to improve the general conditions that influ-ence agricultural systems. There are many factors that influence the capacity and willingness of farmers to invest in land, water and forest conservation and to pursue sustainable practices such as agricultural institutions, policies and regulations, social pro-tection, infrastructure and markets, prices, off-farm employ-ment opportunities and structural poverty.
Nature SuStaiNability | VOL 3 | OctOber 2020 | 809–820 | www.nature.com/natsustain 817

116 | Sustainable solutions to end hunger
Articles Nature SuStaiNability
citation priority order was Scopus, CAB Abstracts, Web of Science and then grey literature sources.
Following deduplication, each citation was analysed using a boosted machine learning model. The model added more than 30 new metadata fields that identified population, geographies, interventions, study design type and outcomes of interest. This allowed for accelerated identification of potential articles for exclusion at the title/abstract screening stage.
The combined search results and new metadata were shared with the research team using Excel spreadsheets and through the screening platform Covidence. The metadata was made available in Covidence46 in the abstract field delineated by hash-tags (###) using a global open-source converter that can translate existing bibliographic data from a .csv format to .ris format.
Study selection and eligibility criteria. The systematic review software Covidence was used for title, abstract and full-text screening decision-making. Article screening took place in three phases: title screening, abstract screening and full-text screening. At all screening stages, citations were screened for relevance against the following inclusion and exclusion criteria; reasons for exclusion were documented at the full-text screening phase.
Citations were included in this scoping review if they met all of the inclusion criteria listed in Box 2.
Exclusion criteria were the inverse of the inclusion criteria. Each citation that met all of the inclusion criteria at the title and abstract and full-text screening phases was included, and each citation that met one of the exclusion criteria at the title, abstract, or full-text screening phases was excluded.
Title/abstract screening was initiated for the 17,936 articles with two independent reviewers reviewing each citation. After the first 200 articles, due to the very large number of citations to screen and because there was a strong degree of inter-rater reliability, a rapid review, single-screener methodology was adopted for all of the remaining citations. The rapid review process comprised a title review followed by an abstract review of included citations. After this first stage, 1,792 papers were selected; of these, 1,694 were found in scholarly databases and 98 were found in grey literature sources.
The inclusion criteria were complex and nuanced, particularly the connection of the adoption of incentives to sustainability outcomes, and the degree to which a study focused on incentives or their adoption. These matters of focus and connection could not be captured by a search strategy alone, but required human judgement. This resulted in a large number of irrelevant results from the initial searches. Among the 1,215 articles that were excluded at the abstract screening phase, 442 were excluded because they did not include an explicit analysis of the impact of the incentives on income, production, productivity, profits and/or environmental sustainability and 418 were excluded because there was no explicit focus on incentives for sustainable environmental practices. For more information, the PRISMA flow diagram (Supplementary Fig. 1) shows the steps followed for the screening process and selection exercise.
Following Waffenschmidt et al., we conducted a double-blind pre-test of ten articles and then assessed inter-rater reliability using the Fleiss Kappa indicator to test for inter-rater reliability in the full-text screening47. This indicator is a statistical measure for assessing the reliability of agreement between a fixed number of raters when classifying a number of items. The measure calculates the degree of agreement in classification over that which would be expected by chance.
After calculating the indicator, we can say that the level of potential bias of a single-screener method introduced here is not significant, given that the kappa value of at least 0.61 indicates substantial agreement and we have a value of 0.7.
In the next selection round, the single -screener methodology was also used, maintaining the same inclusion/exclusion criteria. After this process, 577 citations were kept; of these, 551 were found in scholarly databases, 27 were found in grey literature sources and one was removed as a duplicate. The proportion of resources from the grey literature versus scholarly databases remained consistent throughout the screening process, with 4.48% of the resources originally identified and 4.88% of the resources eligible for full-text inclusion coming from the grey literature.
Because a very large set of citations was included for full-text screening, a semi-structured, stratified randomized sample of 99 citations was selected. Our early review process suggested that certain categories of papers (for example, regarding forestry policy) were more common than others. In an effort to capture relevant citations in less prevalent categories, we used smooth inverse document frequency and cosine distances to create a vector space representation of the contents of the titles, key words and abstracts of the 577 articles. We then clustered the vectors—each article is represented as a vector of terms and frequencies—into 20 clusters using Ward’s method for hierarchical clustering48. A threshold of 20 clusters resulted in clusters ranging in size from 5 to 300 articles. The basis of cluster composition for the smaller clusters was moderately discernible (for example, ecosystem services and water-related), whereas the basis for agglomeration of the larger clusters was not immediately evident. We then implemented a stratified random sampling process to identify the set of 99 articles from the 20 clusters as a function of cluster size. The Orange Data Mining Toolbox was used for the analysis49. Finally, 6 of these 99 articles were not included as they were written in a language not spoken by any of the authors of this research or because of their unavailability.
Data extraction. A data extraction template was developed based on Barrett et al. to document the data, study type and context of each citation, and all themes of interest: incentives, outcomes, measurements of impact and the cost of intervention50. The data extraction template was tested by the review team before use to make sure that all the necessary information for the analysis of the research question was included. Data was extracted by the reviewers using an excel worksheet including the following information:• A categorization of incentives by market, non-market, regulatory and compli-
ance incentives for farmers.• Type of outcomes covered in question of the study: environmentally sustain-
able, profitability and productivity.• Other information relevant for the analysis including characteristics of
the stakeholders, commodity (crop, pasture, aquaculture, forestry), data (cross-section, panel, survey, interviews, policy analysis), methodology (econometrics, systematic review, meta-analysis, randomized controlled tri-als), study (quantitative or qualitative).
• Questions relating to the quality of the paper, the link between incentives and adoption, measurement of the incentive, the type of outcome and its measure-ment and cost of the incentive.
The retrieval of hundreds of PDFs for full-text screening is a repetitive and time-consuming task. A Python script was created that would handle the repetitive tasks of PDF discovery, download and file renaming using Google Scholar (the code is available in GitHub). The script read the bibliographic data from an Excel spreadsheet and then executed a script to retrieve the full-text PDF. The possible returning results are ‘not found, ‘backed by a paywall’, ‘available for download’ or ‘available for request’. If the article is spotted in the search results, the download link is clicked, and the article will be auto-renamed and marked as being downloaded. This process significantly cut down the time needed to retrieve PDFs, and on average 200 PDFs were searched and retrieved in 3–4 h.
The collation, summary and report of the results. This research was based on three pillars—incentives, adoption and outcomes—in looking at the question of how the incentives farmers receive influence the adoption of good environmental practices. These three pillars are important in answering the question, but the links between them are crucial as well. The connection between the incentives and actual adoption, as well as the connection between adoption and the outcomes identified play a key role in this scoping review (Fig. 6).
Incentives were categorized as market-based and non-market-based, regulatory and cross-compliance incentives for farmers to adopt sustainable environmental practices and integrated risk management systems (crop insurance, catastrophic insurance, price options, mitigation and adaptation programmes and so on) in a voluntary or compulsory way. The outcomes were identified as practices adopted by farmers, and their impact on the multiple objectives of environmental sustainability, increased productivity and profitability.
An appraisal for quality was done for the 44 articles that passed the inclusion selection process, were part of the sample chosen and had the link between incentives and adoption, and adoption and outcomes.
The assessment was done by the authors of this research from a scale of 1 to 5, 1 being the lowest. The quality assessment was based on the clarity of the research question, justification of the research approach given the question of the study, clear description of the methodology used and robustness of the chosen methodology. However, it was not used to further exclude papers. From the 44 articles, 23% received the highest score, followed by 32% with a quality index of 4 and 39% with a 3, less than 10% of the papers were assigned a score of less than 3. The previously completed screening process was key in ensuring that articles that did not have substantive evidence were not included in this last stage.
Data availabilityThe data that support the findings of this study are available from the corresponding author on reasonable request.
Received: 20 December 2019; Accepted: 4 September 2020; Published online: 12 October 2020
References 1. Wheaton, E. & Kulshreshtha, S. Environmental sustainability of agriculture
stressed by changing extremes of drought and excess moisture: a conceptualreview. Sustainability 9, 970 (2017).
2. Herrera, H. Resilience for whom? The problem structuring process of theresilience analysis. Sustainability 9, 1196 (2017).
3. Teklewold, H., Kassie, M. & Shiferaw, B. Adoption of multiplesustainable agricultural practices in rural Ethiopia. J. Agric. Econ. 64, 597–623 (2013).
4. Barnes, A. et al. Influencing factors and incentives on the intention to adoptprecision agricultural technologies within arable farming systems. Environ. Sci. Policy 93, 66–74 (2019).
Nature SuStaiNability | VOL 3 | OctOber 2020 | 809–820 | www.nature.com/natsustain818

Sustainable solutions to end hunger | 117
ArticlesNature SuStaiNability
5. Schirmer, J., Dovers, S. & Clayton, H. Informing conservation policy designthrough an examination of landholder preferences: a case study of scatteredtree conservation in Australia. Biol. Conserv. 153, 51–63 (2012).
6. Caviglia-Harris, J. L. Sustainable agricultural practices in Rondônia, Brazil: dolocal farmer organizations affect adoption rates? Econ. Dev. Cult. Change 52, 23–49 (2003).
7. Garbach, K., Lubell, M. & DeClerck, F. A. J. Payment for ecosystem services:the roles of positive incentives and information sharing in stimulatingadoption of silvopastoral conservation practices. Agric. Ecosyst. Environ. 156, 27–36 (2012).
8. Winters, P., Crissman, C. C. & Espinosa, P. Inducing the adoption ofconservation technologies: lessons from the Ecuadorian Andes. Environ. Dev.Econ. 9, 695–719 (2004).
9. Gibbon, P. & Bolwig, S. The Economics of Certified Organic Farming inTropical Africa: A Preliminary Assessment (DIIS, 2007); https://www.econstor.eu/handle/10419/84534
10. Khanna, M., Isik, M. & Zilberman, D. Cost-effectiveness of alternative greenpayment policies for conservation technology adoption with heterogeneousland quality. Agric. Econ. 27, 157–174 (2002).
11. Himberg, N., Omoro, L., Pellikka, P. & Luukkanen, O. The benefits andconstraints of participation in forest management. The case of Taita Hills,Kenya. Fennia 187, 61–76 (2009).
12. Zapata, Á., Murgueitio, E., Mejía, C., Zuluaga, A. F. & Ibrahim, M. Effects ofpayments for environmental services in the adoption of silvopastoral systemsin cattle landscape in the middle watershed of Río La Vieja, Colombia.Agroforest. Am. 45, 8 (2007).
13. Wunder, S., Engel, S. & Pagiola, S. Taking stock: a comparative analysis ofpayments for environmental services programs in developed and developingcountries. Ecol. Econ. 65, 834–852 (2008).
14. Marenya, P., Nkonya, E., Xiong, W., Deustua, J. & Kato, E. Which policywould work better for improved soil fertility management in sub-SaharanAfrica, fertilizer subsidies or carbon credits? Agric. Syst. 110, 162–172 (2012).
15. Cole, R. J. Social and environmental impacts of payments for environmentalservices for agroforestry on small-scale farms in southern Costa Rica. Int. J.Sustain. Dev. World Ecol. 17, 208–216 (2010).
16. Wünscher, T., Engel, S. & Wunder, S. Spatial targeting of payments forenvironmental services: a tool for boosting conservation benefits. Ecol. Econ. 65, 822–833 (2008).
17. Wei, Y., Chen, D., Hu, K., Willett, I. R. & Langford, J. Policy incentives forreducing nitrate leaching from intensive agriculture in desert oases of Alxa,Inner Mongolia, China. Agric. Water Manag. 96, 1114–1119 (2009).
18. Lungarska, A. & Chakir, R. Climate-induced land use change in France:impacts of agricultural adaptation and climate change mitigation. Ecol. Econ. 147, 134–154 (2018).
19. Sheng, J., Qiu, H. & Zhang, S. Opportunity cost, income structure, andenergy structure for landholders participating in payments for ecosystemservices: evidence from Wolong National Nature Reserve, China. World Dev.117, 230–238 (2019).
20. Kiem, A. S. Drought and water policy in Australia: challenges for the futureillustrated by the issues associated with water trading and climate changeadaptation in the Murray–Darling Basin. Glob. Environ. Change 23, 1615–1626 (2013).
21. Ward, P. S., Bell, A. R., Parkhurst, G. M., Droppelmann, K. & Mapemba, L.Heterogeneous preferences and the effects of incentives in promotingconservation agriculture in Malawi. Agric. Ecosyst. Environ. 222, 67–79 (2016).
22. Weltin, M. & Zasada, I. Farmers’ choices of adopting and coupling strategiesof sustainable intensification—evidence from European farm level data. In13th European International Farming Systems Association (IFSA) Symposium,Farming Systems: Facing Uncertainties and Enhancing Opportunities 1–11(IFSA, 2018).
23. Reid, G. H. Building resilience to climate change in rain-fed agriculturalenterprises: an integrated property planning tool. Agric. Hum. Values 26, 391–397 (2009).
24. Ariti, A. T., van Vliet, J. & Verburg, P. H. Farmers’ participation in thedevelopment of land use policies for the Central Rift Valley of Ethiopia.Land Use Policy 71, 129–137 (2018).
25. Kingwell, R., John, M. & Robertson, M. A review of a community-basedapproach to combating land degradation: dryland salinity management inAustralia. Environ. Dev. Sustain. 10, 899–912 (2008).
26. Cotler Ávalos, H., Cram Heydrich, S., Martinez Trinidad, S. & Bunge, V.Conservation practices assessment in forest soils of Mexico: the case of theditches. Investig. Geográf. https://doi.org/10.14350/rig.47378 (2015).
27. Nakano, Y., Tanaka, Y. & Otsuka, K. Impact of training on the intensificationof rice farming: evidence from rainfed areas in Tanzania. Agric. Econ. 49, 193–202 (2018).
28. Santiago, T. M. O., Caviglia-Harris, J. & Pereira de Rezende, J. L. Carrots,sticks and the Brazilian Forest Code: the promising response of smalllandowners in the Amazon. J. For. Econ. 30, 38–51 (2018).
29. Bremer, L. L., Farley, K. A. & Lopez-Carr, D. What factors influenceparticipation in payment for ecosystem services programs? Anevaluation of Ecuador’s SocioPáramo program. Land Use Policy 36, 122–133 (2014).
30. Kumar, A. et al. Adoption and Diffusion of Improved Technologies andProduction Practices in Agriculture: Insights from a Donor-Led Intervention inNepal (IFPRI, 2018); https://go.nature.com/3i8xusc
31. Adhikari, R. K., Kindu, M., Pokharel, R., Castro, L. M. & Knoke, T. Financialcompensation for biodiversity conservation in Ba Be National Park ofNorthern Vietnam. J. Nat. Conserv. 35, 92–100 (2017).
32. Alix-Garcia, J. M., Sims, K. R. E. & Yañez-Pagans, P. Only one tree from eachseed? Environmental effectiveness and poverty alleviation in Mexico’spayments for ecosystem services program. Am. Econ. J. Econ. Policy 7, 1–40 (2015).
33. Vollmer-Sanders, C., Wolf, C. & Batie, S. S. Financial and environmentalconsequences of a voluntary farm environmental assurance program inMichigan. J. Soil Water Conserv. 66, 122–131 (2011).
34. Ipe, V. C. A group incentive program for farmer adoption of best practices:an application to the nitrate pollution problem in central Illinois. In AmericanAgricultural Economics Association (AAEA) 1999 Annual Meeting 25(AAEA, 1999).
35. Alves-Pinto, H. N., Hawes, J. E., Newton, P., Feltran-Barbieri, R. & Peres, C.A. Economic impacts of payments for environmental services on livelihoodsof agro-extractivist communities in the Brazilian Amazon. Ecol. Econ. 152, 378–388 (2018).
36. Ragasa, C., Lambrecht, I. & Kufoalor, D. S. Limitations of contract farming asa pro-poor strategy: the case of maize outgrower schemes in upper WestGhana. World Dev. 102, 30–56 (2018).
37. Maffioli, A., Ubfal, D., Vazquez-Bare, G. & Cerdan-Infantes, P. Improvingtechnology adoption in agriculture through extension services: evidence fromUruguay. J. Dev. Effect. 5, 64–81 (2013).
38. Green, K. M., DeWan, A., Arias, A. B. & Hayden, D. Driving adoption ofpayments for ecosystem services through social marketing, Veracruz, Mexico.Conserv. Evid. 10, 48–52 (2013).
39. Giller, K. E., Witter, E., Corbeels, M. & Tittonell, P. Conservation agricultureand smallholder farming in Africa: the heretics’ view. Field Crops Res. 114, 23–34 (2009).
40. Tricco, A. C. et al. PRISMA extension for scoping reviews(PRISMA-ScR): checklist and explanation. Ann. Intern. Med. 169, 467–473 (2018).
41. Peters, M. D. J. et al. Guidance for conducting systematic scoping reviews.Int. J. Evid. Based Healthc. 13, 141–146 (2015).
42. Guidelines for Systematic Review and Evidence Synthesis in EnvironmentalManagement (Collaboration for Environmental Evidence, 2013); https://go.nature.com/2Hyd0fD
43. Arksey, H. & O’Malley, L. Scoping studies: towards a methodologicalframework. Int. J. Soc. Res. Methodol. 8, 19–32 (2005).
44. Levac, D., Colquhoun, H. & O’Brien, K. K. Scoping studies: advancing themethodology. Implement. Sci. 5, 69 (2010).
45. Piñiero, V. et al. Market, regulatory and compliance incentives for farmers toadopt environmentally sustainable practices: a protocol for a systematic map.Open Science Framework https://osf.io/cmhuq (2019).
46. Covidence Systematic Review Software (Veritas Health Innovation);www.covidence.org
47. Waffenschmidt, S., Knelangen, M., Sieben, W., Bühn, S. & Pieper, D. Singlescreening versus conventional double screening for study selection insystematic reviews: a methodological systematic review. BMC Med. Res.Methodol. 19, 132 (2019).
48. Ward, J. H. Jr. Hierarchical grouping to optimize an objective function.J. Am. Stat. Assoc. 58, 236–244 (1963).
49. Demšar, J. et al. Orange: data mining toolbox in python. J. Mach. Learn. Res. 14, 2349–2353 (2013).
50. Barrett, C., Ghezzi-Kopel, K., Hoddinott, J., Tennant, E. & Upton, J.The state of the literature on individual and household resilience:a scoping review. Open Science Framework https://doi.org/10.17605/osf.io/5rgb7 (2019).
51. What are Market and Non-Market Mechanisms? (United Nations FrameworkConvention on Climate Change, accessed 10 August 2020); https://go.nature.com/2S7WgxO
AcknowledgementsWe thank C. E. Gonzalez for his contribution to the quantitative analysis of the document corpus and for producing the graphs presented in Figs. 1 and 2. Similarly, we thank D. Amariles for his analysis and presentation of the alluvial diagrams presented in Figs. 2 and 3, and A. M. D. Gonzalez for the data work that is represented in Figs. 4 and 5. We also acknowledge the editing contributions made by M. Eber-Rose. Finally, we thank J. Porciello, whose deep knowledge, drive and understanding made this effort possible.
Nature SuStaiNability | VOL 3 | OctOber 2020 | 809–820 | www.nature.com/natsustain 819

118 | Sustainable solutions to end hunger
Articles Nature SuStaiNability
Author contributionsJ.R.P. led the search process and contributed to title screening and writing of the methodology section. A.K. contributed to the search process. V.P. liaised with J.R.P. on the search process, coordinated the paper screening, identified the overall research question and contributed to screening at all stages and data extraction, data analysis and writing. J.A., J.D., P.E., A.M.I., C.M.O. and N.O. contributed to screening at all stages, data extraction and writing. S.D.P. contributed to screening at all stages, data extraction, data analysis and writing. M.T. contributed to screening at some stages, data extraction and writing.
Competing interestsThe authors declare no competing interests.
Additional informationSupplementary information is available for this paper at https://doi.org/10.1038/s41893-020-00617-y.
Correspondence and requests for materials should be addressed to V.P.
Reprints and permissions information is available at www.nature.com/reprints.
Publisher’s note Springer Nature remains neutral with regard to jurisdictional claims in published maps and institutional affiliations.
Open Access This article is licensed under a Creative Commons Attribution 4.0 International License, which permits use, sharing, adap-tation, distribution and reproduction in any medium or format, as long
as you give appropriate credit to the original author(s) and the source, provide a link to the Creative Commons license, and indicate if changes were made. The images or other third party material in this article are included in the article’s Creative Commons license, unless indicated otherwise in a credit line to the material. If material is not included in the article’s Creative Commons license and your intended use is not permitted by statu-tory regulation or exceeds the permitted use, you will need to obtain permission directly from the copyright holder. To view a copy of this license, visit http://creativecommons.org/licenses/by/4.0/.© The Author(s) 2020
Nature SuStaiNability | VOL 3 | OctOber 2020 | 809–820 | www.nature.com/natsustain820

Sustainable solutions to end hunger | 119
Articleshttps://doi.org/10.1038/s41893-020-00621-2
1Deptartment of Agricultural, Food, and Resource Economics, Michigan State University, East Lansing, MI, USA. 2Daniel J. Evans School of Public Policy and Governance, University of Washington, Seattle, WA, USA. 3Research and Academic Services, Carnegie Mellon University, Pittsburgh, PA, USA. 4Centre for Agriculture and Bioscience International, Delémont, Switzerland. 5World Bank, Washington, DC, USA. 6Deptartment of Global Development, Cornell University, Ithaca, NY, USA. 7Faculty of Health Sciences Library, Aga Khan University, Nairobi, Kenya. 8International Institute for Sustainable Development, Ottawa, Ontario, Canada. 9International Livestock Research Institute, Nairobi, Kenya. 10College of Agriculture and Life Sciences, Cornell University, Ithaca, NY, USA. ✉e-mail: [email protected]
The past two decades have seen tremendous growth in devel-oping regions. Urbanization has soared, diets have diversi-fied and food supply chains have expanded. This growth has
created huge markets for farmers, along with employment in vari-ous supply-chain segments1,2, including food processors, wholesal-ers and logistics firms. They are referred to as the ‘hidden middle’ because, though they constitute 40% of the average food supply chain, they are often missing from policy debates3. Their rise is important to small-scale producers because they are the farmers’ proximate interface with the market, through which farmers sell their products, receive logistics and intermediation services and buy farm inputs. The potential role of these value chain actors in assist-ing farmers to adopt sustainable practices and attain higher incomes is especially notable in light of Sustainable Development Goal 2 (SDG 2), which aims to end hunger, achieve food and nutrition security and promote sustainable agriculture by 2030. This requires that small-scale producers benefit from the growth and transforma-tion under way in food systems.
The midstream and downstream of the food output and input supply chains have emerged as a growing field of research4–6. However, this literature has largely focused on the contracting of farmers by value chain actors, and in particular the formal provi-sion of resources within contract arrangements with large proces-sors and supermarkets7–10. Yet just a very small share of small-scale
producers sell under contract directly to large firms3. Largely miss-ing from the literature is evidence on (1) whether and how much value chain actors provide resources and services to farmers when the relation does not involve a formal contract and (2) whether interactions with these enterprises benefit small-scale producers in the absence of a formal contract. These questions pertain mostly to small and medium enterprises (SMEs) as they typically do not formally contract with farmers.
Here we present the findings of a protocol-driven scoping review that explores whether transactions without formal contracts with value chain actors improve the welfare of small-scale producers in developing regions. We filtered for studies that consider supply-chain transactions by value chain actors involving small-scale producers (that is, non-credit input purchase, logistics service purchase and output sales by farmers to/from value chain actors) that are not governed by formal contracts. This yielded a set of studies largely focused on SMEs. Then we analysed whether the outcomes of these economic relations were positive for small-scale producers, as well as what explained any positive or negative outcomes (Fig. 1). See the Methods for full details and Box 1 for a summary.
A key contribution of this review is to show that, contrary to expectations, it is common for SMEs in non-contract rela-tions to undertake complementary resource provision similar to that observed among large companies in contract schemes11,12.
A scoping review of market links between value chain actors and small-scale producers in developing regionsLenis Saweda O. Liverpool-Tasie 1 ✉, Ayala Wineman2, Sarah Young 3, Justice Tambo4, Carolina Vargas1, Thomas Reardon 1, Guigonan Serge Adjognon5, Jaron Porciello 6, Nasra Gathoni7, Livia Bizikova8, Alessandra Galiè9 and Ashley Celestin10
Sustainable Development Goal 2 aims to end hunger, achieve food and nutrition security and promote sustainable agriculture by 2030. This requires that small-scale producers be included in, and benefit from, the rapid growth and transformation under way in food systems. Small-scale producers interact with various actors when they link with markets, including product traders, logistics firms, processors and retailers. The literature has explored primarily how large firms interact with farmers through formal contracts and resource provision arrangements. Although important, contracts constitute a very small share of small-holder market interactions. There has been little exploration of whether non-contract interactions between small farmers and both small- and large-scale value chain actors have affected small farmers’ livelihoods. This scoping review covers 202 studies on that topic. We find that non-contract interactions, de facto mostly with small and medium enterprises, benefit small-scale producers via similar mechanisms that the literature has previously credited to large firms. Small and medium enterprises, not just large enterprises, address idiosyncratic market failures and asset shortfalls of small-scale producers by providing them, through informal arrangements, with complementary services such as input provision, credit, information and logistics. Providing these services directly supports Sustainable Development Goal 2 by improving farmer welfare through technology adoption and greater productivity.
Nature SuStaiNability | VOL 3 | OctOber 2020 | 799–808 | www.nature.com/natsustain 799

120 | Sustainable solutions to end hunger
Articles Nature SuStaiNability
In addition, when SME value chain actors provide these services that are beyond their core activities, it is correlated with technology adoption and higher productivity among farmers. These findings are instrumental towards achieving the goals of SDG 2. Particularly in developing countries in Africa and South Asia (where small-scale producers dominate), the growth and transformation of food systems drives a proliferation of midstream SMEs which, our results show, can be a force inclusive of, and beneficial to, small-scale producers.
ResultsFigure 2a presents the distribution of the included studies by publication type. A majority of the included studies (73%) are peer-reviewed journal articles. Ten percent are working papers published in grey-literature outlets, 7% are conference papers, and book chapters and theses/dissertations each account for 5% of the included studies. Most studies were scored as being of ‘high quality’ using the criteria explained in the Methods; just 15.5% (quantita-tive) and 20% (qualitative) of the studies were scored as being of low quality, usually because the study lacked sufficient details on its methodological approach.
There has been a dramatic increase in research interest in the relationship between small-scale producers and our focal actors in the past ten years. Over 40% of our selected studies were pub-lished within the past four years and over 80% in the past ten years (Fig. 3). Across all studies, 33% are of settings in Asia, 49% in Africa and 21% in Latin America. Thus, less attention has been given to measuring the impacts of small-scale producers’ engagement with these focal actors in Asia or Latin America compared with Africa. This might reflect more funding opportunities and/or the preva-lence of small-scale agriculture in Africa.
While 77% of the included studies focused on crop production, just 18% focused on livestock production (with the remaining stud-ies having a dual focus). This reveals a gap in the literature, particu-larly given rising animal-protein consumption and the associated supply response in developing countries. More studies on livestock will be important to improve the likelihood of small-scale produc-ers’ successful participation in value chains with sustainable agri-cultural practices1,13,14. We also find more emphasis on high-value crops in 55% of the studies, compared with 39% that look at staple crops (Fig. 2b).
There is an extremely limited gender and environmental focus in the literature. Only 24 (12%) of the 202 studies include a focus on gender, and 17 (9%) focus on the extent to which marketing channels promote the adoption of environmentally sound agricul-tural practices. This demonstrates a mismatch between rhetoric and reality in policy debates (which highlight gender mainstream-ing and sustainability) and development research. Further research on gender-related issues and how SMEs in the midstream of value chains could increase farmer adoption of environmentally safe practices is needed to guide efforts to promote sustainable agricul-tural practices in line with SDG 2.
Few studies consider a primary outcome (such as income, pov-erty or food security) alongside a secondary or intermediate out-come (such as technology adoption or increased yields). This indicates that the final welfare effect of farmers’ interactions with market channels is a gap in the literature.
Non-contract SME market channels provide key services. A key finding of this review is that value chain actors across the mid-stream segments of trade, processing and logistics provide a wide set of complementary services to farmers, outside the vehicle of
IS2A. Provision of knowledge
(extension) and informationB. Provision of creditC. Provision of services (e.g.,
transportation)D. Purchase of output from
farmers
OM2A. Provision of knowledge
(extension) and informationB. Provision of creditC. Provision of services (e.g.,
storage/ripening/transportation)
D. Provision of inputs
OM1Purchasing output
A. Collective sales getsbetter prices or lowerprice variability
B. Guaranteed marketthrough a purchaseagreement
L1Selling logistics services
A. Provides access tothese services
L2A. Provision of knowledge
(extension) and informationB. Provision of creditC. Purchase of output
Input suppliers (IS)• Cooperative• Agro-dealer
Output market channels oroutput intermediaries (OM)
• Supermarket• Trader• Processor• Cooperative• Institutional
procurement• Other modern markets
Logistics (L)• Transport company• Warehouses• Cold storage
Mechanisms of improving outcomes for farmers
Market channels(focal actors)
IS1Selling inputs
Secondary outcomes• Technology adoption• Adoption of yield-increasing
practices• Adoption of practices to
improve quality• Level of commercialization
Intermediary outcomes• Yield/productivity• Price level/variability
Final outcomes (primary)• Income• Poverty• Food security
Farm-level outcomesPrimary market functions Other services
Fig. 1 | Conceptual framework of transactions. Focal actors are categorized on the basis of their ‘transactional’ role as a supplier of farm inputs (for example, chemical fertilizer: IS1) or service (for example, warehouse rental: L1) or a buyer of farm output (OM1). Focal actors can take on roles beyond their transactional role in the provision of complementary services such as transport or credit (which would be IS2, L2 or OM2 for input suppliers, logistics providers and output markets, respectively). Outcomes of the transactions for the farmer are determined by the terms and conditions of the transactional role plus any complementary services. The primary outcome (increased income or lower poverty or food security) can arise through adopting a new practice or technology (secondary outcome) that increases yields or attracts a higher price (intermediary outcome).
Nature SuStaiNability | VOL 3 | OctOber 2020 | 799–808 | www.nature.com/natsustain800
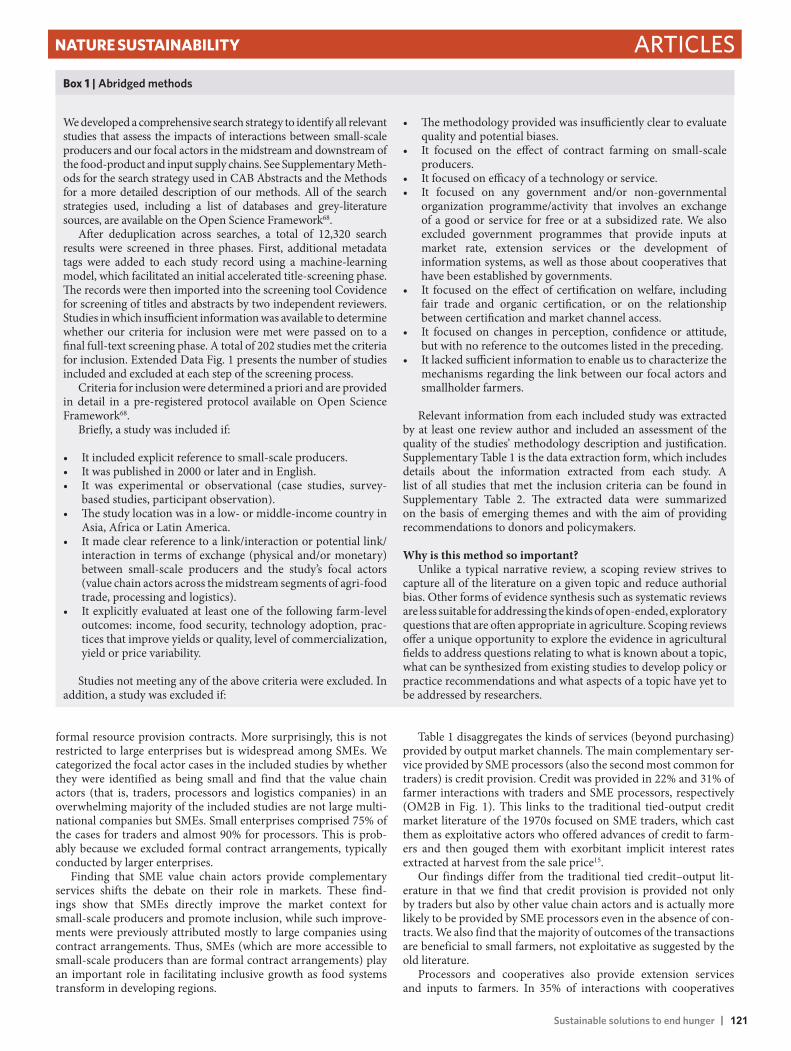
Sustainable solutions to end hunger | 121
ArticlesNature SuStaiNability
formal resource provision contracts. More surprisingly, this is not restricted to large enterprises but is widespread among SMEs. We categorized the focal actor cases in the included studies by whether they were identified as being small and find that the value chain actors (that is, traders, processors and logistics companies) in an overwhelming majority of the included studies are not large multi-national companies but SMEs. Small enterprises comprised 75% of the cases for traders and almost 90% for processors. This is prob-ably because we excluded formal contract arrangements, typically conducted by larger enterprises.
Finding that SME value chain actors provide complementary services shifts the debate on their role in markets. These find-ings show that SMEs directly improve the market context for small-scale producers and promote inclusion, while such improve-ments were previously attributed mostly to large companies using contract arrangements. Thus, SMEs (which are more accessible to small-scale producers than are formal contract arrangements) play an important role in facilitating inclusive growth as food systems transform in developing regions.
Table 1 disaggregates the kinds of services (beyond purchasing) provided by output market channels. The main complementary ser-vice provided by SME processors (also the second most common for traders) is credit provision. Credit was provided in 22% and 31% of farmer interactions with traders and SME processors, respectively (OM2B in Fig. 1). This links to the traditional tied-output credit market literature of the 1970s focused on SME traders, which cast them as exploitative actors who offered advances of credit to farm-ers and then gouged them with exorbitant implicit interest rates extracted at harvest from the sale price15.
Our findings differ from the traditional tied credit–output lit-erature in that we find that credit provision is provided not only by traders but also by other value chain actors and is actually more likely to be provided by SME processors even in the absence of con-tracts. We also find that the majority of outcomes of the transactions are beneficial to small farmers, not exploitative as suggested by the old literature.
Processors and cooperatives also provide extension services and inputs to farmers. In 35% of interactions with cooperatives
box 1 | Abridged methods
We developed a comprehensive search strategy to identify all relevant studies that assess the impacts of interactions between small-scale producers and our focal actors in the midstream and downstream of the food-product and input supply chains. See Supplementary Meth-ods for the search strategy used in CAB Abstracts and the Methods for a more detailed description of our methods. All of the search strategies used, including a list of databases and grey-literature sources, are available on the Open Science Framework68.
After deduplication across searches, a total of 12,320 search results were screened in three phases. First, additional metadata tags were added to each study record using a machine-learning model, which facilitated an initial accelerated title-screening phase. The records were then imported into the screening tool Covidence for screening of titles and abstracts by two independent reviewers. Studies in which insufficient information was available to determine whether our criteria for inclusion were met were passed on to a final full-text screening phase. A total of 202 studies met the criteria for inclusion. Extended Data Fig. 1 presents the number of studies included and excluded at each step of the screening process.
Criteria for inclusion were determined a priori and are provided in detail in a pre-registered protocol available on Open Science Framework68.
Briefly, a study was included if:
• It included explicit reference to small-scale producers.• It was published in 2000 or later and in English.• It was experimental or observational (case studies, survey-
based studies, participant observation).• The study location was in a low- or middle-income country in
Asia, Africa or Latin America.• It made clear reference to a link/interaction or potential link/
interaction in terms of exchange (physical and/or monetary)between small-scale producers and the study’s focal actors(value chain actors across the midstream segments of agri-food trade, processing and logistics).
• It explicitly evaluated at least one of the following farm-leveloutcomes: income, food security, technology adoption, prac-tices that improve yields or quality, level of commercialization, yield or price variability.
Studies not meeting any of the above criteria were excluded. Inaddition, a study was excluded if:
• The methodology provided was insufficiently clear to evaluatequality and potential biases.
• It focused on the effect of contract farming on small-scaleproducers.
• It focused on efficacy of a technology or service.• It focused on any government and/or non-governmental
organization programme/activity that involves an exchangeof a good or service for free or at a subsidized rate. We alsoexcluded government programmes that provide inputs atmarket rate, extension services or the development ofinformation systems, as well as those about cooperatives thathave been established by governments.
• It focused on the effect of certification on welfare, includingfair trade and organic certification, or on the relationshipbetween certification and market channel access.
• It focused on changes in perception, confidence or attitude,but with no reference to the outcomes listed in the preceding.
• It lacked sufficient information to enable us to characterize the mechanisms regarding the link between our focal actors andsmallholder farmers.
Relevant information from each included study was extractedby at least one review author and included an assessment of the quality of the studies’ methodology description and justification. Supplementary Table 1 is the data extraction form, which includes details about the information extracted from each study. A list of all studies that met the inclusion criteria can be found in Supplementary Table 2. The extracted data were summarized on the basis of emerging themes and with the aim of providing recommendations to donors and policymakers.
Why is this method so important?Unlike a typical narrative review, a scoping review strives to
capture all of the literature on a given topic and reduce authorial bias. Other forms of evidence synthesis such as systematic reviews are less suitable for addressing the kinds of open-ended, exploratory questions that are often appropriate in agriculture. Scoping reviews offer a unique opportunity to explore the evidence in agricultural fields to address questions relating to what is known about a topic, what can be synthesized from existing studies to develop policy or practice recommendations and what aspects of a topic have yet to be addressed by researchers.
Nature SuStaiNability | VOL 3 | OctOber 2020 | 799–808 | www.nature.com/natsustain 801
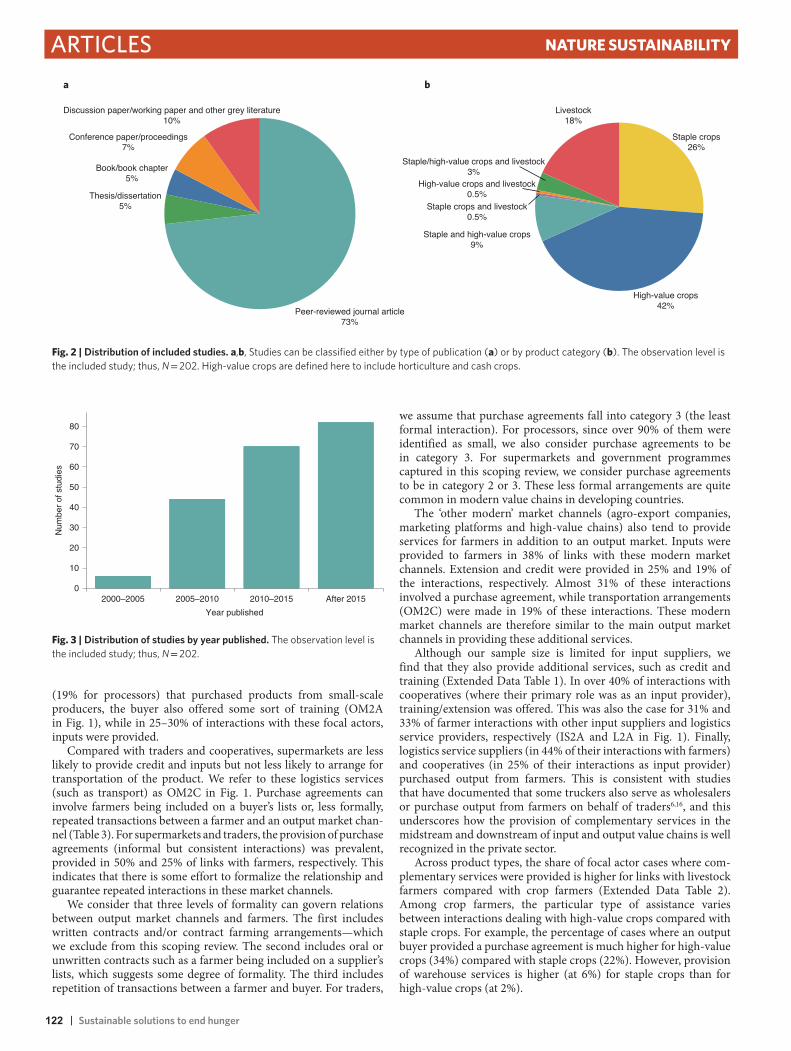
122 | Sustainable solutions to end hunger
Articles Nature SuStaiNability
(19% for processors) that purchased products from small-scale producers, the buyer also offered some sort of training (OM2A in Fig. 1), while in 25–30% of interactions with these focal actors, inputs were provided.
Compared with traders and cooperatives, supermarkets are less likely to provide credit and inputs but not less likely to arrange for transportation of the product. We refer to these logistics services (such as transport) as OM2C in Fig. 1. Purchase agreements can involve farmers being included on a buyer’s lists or, less formally, repeated transactions between a farmer and an output market chan-nel (Table 3). For supermarkets and traders, the provision of purchase agreements (informal but consistent interactions) was prevalent, provided in 50% and 25% of links with farmers, respectively. This indicates that there is some effort to formalize the relationship and guarantee repeated interactions in these market channels.
We consider that three levels of formality can govern relations between output market channels and farmers. The first includes written contracts and/or contract farming arrangements—which we exclude from this scoping review. The second includes oral or unwritten contracts such as a farmer being included on a supplier’s lists, which suggests some degree of formality. The third includes repetition of transactions between a farmer and buyer. For traders,
we assume that purchase agreements fall into category 3 (the least formal interaction). For processors, since over 90% of them were identified as small, we also consider purchase agreements to be in category 3. For supermarkets and government programmes captured in this scoping review, we consider purchase agreements to be in category 2 or 3. These less formal arrangements are quite common in modern value chains in developing countries.
The ‘other modern’ market channels (agro-export companies, marketing platforms and high-value chains) also tend to provide services for farmers in addition to an output market. Inputs were provided to farmers in 38% of links with these modern market channels. Extension and credit were provided in 25% and 19% of the interactions, respectively. Almost 31% of these interactions involved a purchase agreement, while transportation arrangements (OM2C) were made in 19% of these interactions. These modern market channels are therefore similar to the main output market channels in providing these additional services.
Although our sample size is limited for input suppliers, we find that they also provide additional services, such as credit and training (Extended Data Table 1). In over 40% of interactions with cooperatives (where their primary role was as an input provider), training/extension was offered. This was also the case for 31% and 33% of farmer interactions with other input suppliers and logistics service providers, respectively (IS2A and L2A in Fig. 1). Finally, logistics service suppliers (in 44% of their interactions with farmers) and cooperatives (in 25% of their interactions as input provider) purchased output from farmers. This is consistent with studies that have documented that some truckers also serve as wholesalers or purchase output from farmers on behalf of traders6,16, and this underscores how the provision of complementary services in the midstream and downstream of input and output value chains is well recognized in the private sector.
Across product types, the share of focal actor cases where com-plementary services were provided is higher for links with livestock farmers compared with crop farmers (Extended Data Table 2). Among crop farmers, the particular type of assistance varies between interactions dealing with high-value crops compared with staple crops. For example, the percentage of cases where an output buyer provided a purchase agreement is much higher for high-value crops (34%) compared with staple crops (22%). However, provision of warehouse services is higher (at 6%) for staple crops than for high-value crops (at 2%).
Discussion paper/working paper and other grey literature10%
a b
Conference paper/proceedings7%
Peer-reviewed journal article73%
Thesis/dissertation5%
Book/book chapter5%
Staple crops and livestock0.5%
Staple/high-value crops and livestock3%
Livestock18%
Staple crops26%
High-value crops42%
Staple and high-value crops9%
High-value crops and livestock0.5%
Fig. 2 | Distribution of included studies. a,b, Studies can be classified either by type of publication (a) or by product category (b). The observation level is the included study; thus, N = 202. High-value crops are defined here to include horticulture and cash crops.
2000–2005 2005–2010 2010–2015
Year published
After 20150
10
20
30
40
50
60
70
80
Num
ber
of s
tudi
es
Fig. 3 | Distribution of studies by year published. The observation level is the included study; thus, N = 202.
Nature SuStaiNability | VOL 3 | OctOber 2020 | 799–808 | www.nature.com/natsustain802

Sustainable solutions to end hunger | 123
ArticlesNature SuStaiNability
Government agencies provide fewer services. Contrary to what we find for non-government output market channels, we do not see much evidence of complementary service provision by govern-ment agencies. Instead, the agencies tend to focus on their primary role of buying farmers’ output (OM1). However, they are similar to supermarkets and traders in the high likelihood of using purchase agreements (50%), which we also refer to as a primary market func-tion (an OM1 activity) since it may be somewhat more consistent (guaranteed) than the spot market (Fig. 1).
Non-contract market channels improve farmers’ welfare. Another main finding of this scoping review is that a majority of the recorded interactions between small-scale producers and value chain actors are positive. Specifically, 83% of cases exhibit a positive result for at least one outcome assessed in the study. This value is 81% for output intermediaries, 96% for input suppliers (largely coopera-tives and agro-dealers) and 100% for providers of logistical services (although there are just nine cases in the latter group).
Table 2 displays the outcome patterns by geographical location and product type. It is less common for engagement between market channels and small-scale farmers to result in a positive outcome for farmers in Latin America compared with other continents. While interactions are generally positive, the share of total interactions with a positive outcome is higher for studies looking at livestock (87%) compared with crops (83%). Among crops, it is higher for staple-crop farmers (88%) than for farmers of high-value crops (83%).
Among all outcomes assessed in these studies, the study focal actors produced a positive outcome for farmers in 77% of the
cases (Extended Data Table 3). Across the three outcome catego-ries illustrated in Fig. 1, this value is 77% for primary outcomes such as income and food security, 67% for intermediary outcomes such as yield and 84% for secondary outcomes such as technology adoption. Because so many of these observations are of buyers, the values for buyers alone are very similar (at 77%, 63% and 82% for primary, intermediary and secondary outcomes, respectively). For input suppliers alone, these values are 88%, 93% and 94% (N = 64 in total).
The provision of complementary services appears to be instru-mental in fostering a positive outcome from farmers’ interactions with these input and output market channels. Table 3 presents information on the links that lead to either positive or negative/inconclusive outcomes for farmers. Among output intermediaries (columns 1 and 2), it is more common for positive outcomes to fol-low from exchanges that include arrangements for transportation, the provision of credit or inputs, and the provision of extension. For example, 12% of cases with positive impacts involve the buyers extending some sort of logistical assistance to arrange for transpor-tation of the agricultural products, while this value is just 8% for cases with negative or inconclusive impacts. This pattern is consis-tent with the mechanism (OM2 in Fig. 1) laid out in the conceptual framework. For input suppliers, a higher percentage of cases with a positive impact involve the suppliers also purchasing output from the farmers. The provision of marketing services alongside input supply (IS2D in Fig. 1) is consistent with the rise of farmer aggrega-tor services that supply farmers with inputs but also procure their outputs or link them with buyers13.
table 1 | Types of assistance provided to farmers
Type of assistance Share of links that are characterized by a given type of assistance for farmers (%)
Traders Processors Cooperatives Supermarkets Other modern channels
Governmenta Market Other buyers
Arrange for transport 12 19 9 11 19 0 6 17
Provide credit 22 31 14 7 19 0 6 17
Provide inputs 16 25 30 7 38 0 11 0
Provide extension 12 19 35 7 25 0 11 50
Purchase agreements 25 19 18 50 31 50 44 0
Storage on farm 2 0 0 0 0 0 0 0
Warehouse 4 13 5 4 0 0 0 0
Irrigation 0 0 0 4 0 0 0 0
Observations 51 16 57 28 16 12 18 6
Assistance to farmers is disaggregated by the type of buyer. Included studies were coded to tabulate the focal actor linkages captured within the study. An individual study could consider multiple focal actors (for example, traders and processors). This yielded 241 linkages or ‘focal actor cases’. Of these 241 linkages, 204 are with output buyers. Thus, N = 204. Source: authors’ calculations. aThis category includes one observation of a non-governmental organization operating as a buyer.
table 2 | Focal actor cases with positive impact (%)
All Asia Africa Latin America
Livestock farmersb
Crop farmersb
Staple-crop farmersc
High-value crop farmersc
All focal actor cases 83 87 86 76 87 83 88 83
Buyers/processors 81 85 83 75 85 80 83 82
Input suppliers 96 100d 100d 80d 100d 96 100d 94d
Logistics 100d 100d 100d 100d 100d 100d 100d 100d
Observations (all)a 241 79 115 54 55 195 89 133
The share of cases with some positive outcomes was disaggregated by location of study and product type. The 202 included studies were coded to tabulate the focal actor linkages that were captured within each study. For this table, N = 241. Source: authors’ calculations. aObservations (all) refers to the number of focal actor cases in the first row. The number of observations varies when disaggregating by type of focal actor in the rows below. bRefers to both crop-only farmers (or livestock-only farmers) and cases with farmers producing both crops and livestock. cRefers to farmers that produce only staple crops (or only high-value crops) and cases with farmers producing a mix of staple and high-value crops. Thus, some cases can be found in both columns. dThese cells contain fewer than ten observations.
Nature SuStaiNability | VOL 3 | OctOber 2020 | 799–808 | www.nature.com/natsustain 803

124 | Sustainable solutions to end hunger
Articles Nature SuStaiNability
Overall, these results shed light on a set of activities undertaken by focal actors that tend to yield additional benefits for farmers. These services appear to fill gaps in what small-scale producers require to undertake transactions, including arranging transport and providing credit and inputs, private extension, storage and warehousing, and even irrigation services. In the great majority of cases, the interaction with these midstream enterprises benefits the farmers, and this benefit tends to be greater for men than for women in the limited studies with gender considerations.
Contrary to our expectations, it is not more common for cases with positive outcomes to include informal purchase agreements compared with cases that have negative or inconclusive outcomes. The difference between positive and negative outcomes seems to derive from the complementary services that output intermediaries provide for farmers beyond buying their products. These include the provision of training, credit and logistics services. This is extremely important as it indicates that the provision of complementary ser-vices by output intermediaries tends to be key for the interaction to be positive for small-scale producers, even conditional on the exis-tence of pseudo-contracts.
Facilitators of positive outcomes. One hundred eighteen of the 202 included studies mention at least one condition that enables interac-tions with our focal actors to have a positive effect on small-scale producers. These conditions can be grouped into three broad cat-egories. (1) Complementary services and activities provided by focal actors can bolster the positive effect of the interaction with small-scale producers. These activities—IS2, OM2 and L2 in Fig. 1— refer to additional services provided by input suppliers, output mar-ket channels and logistics service providers, alongside their main role of input or output intermediation (IS1, OM1 or L1, respec-tively). (2) Positive outcomes can derive from access to infrastruc-ture. (3) A conducive policy environment can facilitate mutually beneficial interactions between farmers and the focal actors.
The provision of complementary services is a key condition sup-porting positive outcomes of small-scale producers’ interactions with focal actors. This was noted in 65% of the instances where positive enabling conditions were mentioned. The services most frequently cited were capacity building and training (extension) for farmers (mentioned in 23% of the included studies) and the provi-sion of credit (mentioned in 16%). Other important complementary
services include the availability of multistakeholder market plat-forms (mentioned in 14%) and market information (mentioned in 12%) (Extended Data Fig. 2).
The included studies demonstrate that training and capacity building can support small-scale producers as they upgrade their production to satisfy the requirements of modern market chan-nels17–21. Market information increases the speed of farm product sales while allowing farmers to bargain more effectively and obtain better prices22–24. Providing timely access to affordable credit also supports the adoption of modern technologies25,26, and platforms that facilitate interactions among stakeholders improve the perfor-mance of value chains27,28.
The availability of rural infrastructure, including irrigation, transportation, processing, storage and communications, was noted as a facilitating condition in 23% of the studies. In addition to eas-ing the provision of complementary services, access to transpor-tation (road infrastructure) enables farmers to gain better price terms from both informal and formal market channels29,30, and cold storage infrastructure, which reduces food wastage, has been found to increase producers’ sales and generate higher prices in the off season17,31,32.
A stable policy environment, characterized by enforcement of regulations and the enactment of enabling policies, was mentioned as a facilitating condition in 18% of the studies. Strong regulations can help protect farmers from exploitation by output intermediar-ies33. Furthermore, supportive marketing and trade policy reforms (liberalization of input and maize markets) have been found to lead to increased input use and crop productivity34.
Factors associated with negative outcomes. Forty-six of the 202 studies (23%) explicitly discussed challenges that impede the abil-ity of value chain actors to upgrade producers’ practices or improve their welfare. In order of importance (that is, the number of stud-ies that mentioned a factor), the main inhibitors were capacity con-straints, lack of trust between farmers and the focal actors, high transaction costs, non-inclusiveness, financial constraints and mar-ket power (Extended Data Fig. 3).
The low technical capacity of cooperatives and traders (the two major focal actors documented in the literature) limits their ability to support farmers6,35–38. Inadequate managerial and organizational skills can lead to collective action failure, and poor coordination in
table 3 | Positive or negative outcomes with different characteristics of the link (%)
Buyers Input suppliers
(1) (2) (3) (4)
Characteristic of the link Positive impact Negative or inconclusive impact Positive impact Negative or inconclusive impact
Arrange for transport 12a 8 0 0
Provide credit 19 13 29 20
Provide inputs 24 18 N/A N/A
Provide extension 20 13 39 40
Purchase agreements 37 39 0 0
Purchase output N/A N/A 8 0
Storage on farm 1 0 0 0
Warehouse 5 4 0 0
Irrigation 0.002 0 8 0
Observations 351 119 59 5
Positive or negative outcomes for farmers from value chain interactions are disaggregated by the kind of complementary service provided during the interaction. For each of the 241 linkages, outcomes (Fig. 1) were recorded for small-scale producers that the study considered. Since some studies looked at multiple outcomes (for example, income as well as poverty), this resulted in 555 records of outcomes of an interaction between a farmer and a focal actor; 534 relate specifically to output buyers or input suppliers. There were too few observations of outcomes of interactions with logistics providers to include them here. Thus, for this table, N = 534. Source: authors’ calculations. aThe percentages reported in each column can sum to more than 100. These numbers reflect the percentage of outcomes in the column that follow from a link with each characteristic.
Nature SuStaiNability | VOL 3 | OctOber 2020 | 799–808 | www.nature.com/natsustain804

Sustainable solutions to end hunger | 125
ArticlesNature SuStaiNability
fulfilling agreements with buyers can limit market opportunities for the entire group39–41.
The detected lack of trust might reflect the prevalence of infor-mal contract arrangements in the included studies. Low trust cou-pled with an unstable market environment, as well as information asymmetry due to weak institutional arrangements, creates room for opportunistic behaviour by all parties42–44. Moreover, a lack of trust between cooperative members and their leadership could result in failure to deliver on agreements28,45–48.
High transaction costs are generally driven by additional risks or monitoring costs both parties incur during the interaction24,40,49–51. Buyers fear side selling while farmers fear product rejection52–54. In addition, transaction costs and capacity constraints can be exacer-bated when infrastructure is poor and the relationship involves the poorest and most marginalized producers36–38,55–61.
Financial constraints limit buyers’ ability to provide farmers with services ex ante and thereby help them to upgrade40,62. This closely aligns with the finding that focal actors’ provision of com-plementary services was instrumental for their successful interac-tion with farmers. However, buyers’ market power can substantially reduce the benefits farmers derive from interactions with them, as they can transfer demand shocks to remote farmers with few market options63,64.
DiscussionThis review confirms that that there has been a rapid development of the midstream and downstream actors in output value chains—processors, traders and cooperatives—that buy crops and livestock products from small-scale producers. Moreover, there has also been a proliferation of value chain actors in input supply chains (agro-dealers) that supply inputs as well as services (such as train-ing and logistics arrangements) to small-scale farmers. These value chain actors and the complementary services they provide help small-scale producers upgrade their practices, raise their productiv-ity and subsequently improve their welfare.
The importance of these actors has been recognized with a rapid increase in the number of studies on these intermediar-ies in the past decade. However, the available literature is heavily tilted towards crop value chains rather than livestock, and towards high-value crops rather than staple crops. Farmer interactions with market channels and across both kinds of value chains (crop and livestock) and across crop types tend to have a positive effect on small-scale producers.
Contrary to the articulated focus by policymakers and govern-ments on gender equality and environmental sustainability, we find extremely limited emphasis on these issues in the literature. We thus note a dearth of empirical evidence on the role that SMEs in the midstream and downstream of input and output value chains can play in the adoption and dissemination of agricultural practices that will preserve the environment or increase small-scale produc-ers’ resilience to climate change. To promote the SDGs, particularly SDG 2, additional research on how value chain actors can increase farmers’ knowledge and adoption of environmentally safe practices would be valuable. Similarly, more evidence is needed on the con-ditions that allow both women and men small-scale producers to benefit from SMEs. Private-sector platforms that serve as one-stop shops for farmers to secure inputs, training, credit and a guaran-teed market are emerging in developing countries. Further studies on whether and how these platforms could support the adoption of sustainable agricultural practices in crop and animal production are necessary.
Given the study findings of abundant midstream enterprise activity that is generally supportive of small-scale producers, we question whether governments need to directly provide these ser-vices. It appears to us that direct public provision would crowd out these midstream enterprises and waste public resources. These
midstream enterprises serve as allies to governments in the provi-sion of key rural services. Thus, efforts to support their operation and their continued and expanded provision of complementary ser-vices to small-scale producers should be considered (Box 2).
These intermediaries can directly support zero hunger and improved welfare through the inclusion of small-scale producers that otherwise would have been excluded. They have the potential to expand small-scale producers’ access to knowledge and provide incen-tives to adopt sustainable agricultural practices. Thus, they can be instrumental towards achieving the objectives set forth by the United Nations’ Sustainable Development Goal of zero hunger by 2030.
MethodsA scoping review identifies trends, concepts, theories, methods and knowledge gaps across a broad range of literature65, while highlighting key areas for future research and engagement66. A scoping review comprises five steps: (1) articulating the research question, (2) searching published and grey literature for relevant studies, (3) selecting studies on the basis of pre-defined criteria, (4) extracting and charting the data and (5) collating, summarizing and reporting the results. In this review, we made use of the Preferred Reporting Items for Systematic Reviews and
box 2 | Policy recommendations
We find that midstream and downstream enterprises, even when not in formal contract relations and even when they are SME firms, are generally helpful to small-scale producers. Thus, our main recommendation is that these value chain actors be consid-ered as allies of governments (not as ‘competitors’ or ‘missing’) in the provision of key rural services. Governments and donors should facilitate their success through investments in hard and soft infrastructure. Governments should promulgate policies and regulations that reduce the SMEs’ transaction costs for both start-up and operation and that increase their capacity to man-age supply-chain risks13,70. Governments and donors should also incentivize SMEs’ continued provision of complementary ser-vices that benefit small-scale producers.
More specifically, we recommend the following: 1. Provide SMEs with incentives to offer complementary
services to small-scale producers facing market failuresand to expand their operations to reach remote farm-ers (with even higher transaction costs), with special at-tention to youth, women and disadvantaged castes andethnic groups.
2. Expand access to finance to improve SME performance. This will enhance their ability to support small-scale producerswith the relevant complementary services to enable them toupgrade their practices and improve their welfare.
3. Provide SMEs with incentives to encourage small-scale pro-ducer adoption of environmentally beneficial practices. This can support the diffusion of these technologies to safeguardfood security, both now and in the future.
4. Reduce double taxation policies and numerous redundantcertifications and registrations, known as ‘red tape,’ that con-strain SMEs.
5. Improve transport infrastructure and conditions to helptraders and logistics firms; reduce road-related corruption(via illegal roadblocks) and high fines, as well as costs ofelectricity, fuel and vehicle imports. Improve trucking regu-lations to promote safety, and ease constraints on transportinvestment. Implement policies that reduce the costs of en-ergy and equipment import and increase property rightsand the ease of registration and certification.
6. Reduce cell phone and Internet connection costs thatoften constrain SMEs, limiting their access to informationand money.
Nature SuStaiNability | VOL 3 | OctOber 2020 | 799–808 | www.nature.com/natsustain 805
126 | Sustainable solutions to end hunger
Articles Nature SuStaiNability
Meta-Analyses (PRISMA) extension for Scoping Reviews65 and guidance provided by Peters et al.67 in designing and reporting the methods. This review leverages a data science framework to accelerate the work within each of the individual steps as described in the following. A protocol for this study was developed before data collection and was registered on the Open Science Framework68.
Search methods for identifying relevant studies. We developed a comprehensive search strategy to find all relevant studies that assess the impacts of interactions between small-scale producers and our focal actors in the midstream and downstream of the food-product and input supply chains. The Supplementary Information presents the search strategy used in CAB Abstracts, and all of the search strategies used are available on the Open Science Framework68.
We searched the following electronic databases: CAB Abstracts (Clarivate Analytics), Web of Science Core Collection, Scopus, EconLit (Ebsco), Dissertations & Theses Global (ProQuest), Africa Theses and Dissertations (http://datad.aau.org/discover) and AgEcon Search (https://ageconsearch.umn.edu). In addition, over 15 sources of grey literature were searched68 using custom web-scraping scripts. The results from the databases and the grey-literature searches were combined and deduplicated. Additional studies were included through consultation with experts in this field of research and on the basis of the authors’ previous knowledge.
Study selection. The studies were then screened in three phases. In a first step, each citation was analysed using a machine-learning model that added over 30 metadata fields such as the studies’ populations, geographies, interventions and outcomes of interest. This accelerated our identification of articles for exclusion, in which records were excluded by a single screener when they clearly did not meet our criteria (for example, published before 2000, not in a low- or middle-income country or focused on a non-food product).
The remaining records were imported into Covidence (https://www.covidence.org) for title/abstract and full-text screening. In both steps, studies were screened by two independent reviewers, and conflicts were resolved by a third reviewer. Studies in which insufficient information was available to determine whether our criteria for inclusion were met were passed on to the full-text screening phase. Extended Data Fig. 1 presents the number of studies included and excluded at each step of the screening process.
Selection criteria. We included studies that assessed impacts on small-scale producers of food crops, fish, dairy and livestock in low- and middle-income countries in Africa, Asia and Latin America. Studies were included if they made a clear reference to a link or interaction between small-scale producers and the study’s focal actors in terms of a physical and/or monetary exchange. Focal actors were defined on the basis of the functional role that they play as an intermediary in the midstream and downstream of output and input supply chains (Fig. 1). Importantly, we did not include credit as an input here. We also did not include certification and its impacts on welfare effects, or contract farming between large enterprises and small farms, because they have been explored in two separate and recent systematic reviews10,69. The systematic review by Ton et al. 10 reports that contract farming may increase farmer incomes substantially, but this is largely restricted to larger farmers. Included studies measured at least one of our primary, secondary or intermediate outcomes, as shown in Fig. 1.
We focused on farmers’ output production and sale and not on their household labour supply as our focus is the farm enterprise. It is possible that value chain actors could affect labour supply and subsequently labour choices in farm enterprises, thus indirectly affecting farmer practices, but this was not part of our study.
Regarding study design, both experimental and observational studies were considered, including quantitative and qualitative work. However, studies were excluded if they lacked clear objectives or had small sample sizes and lacked a justification for this limitation. Studies using data collected before 2000 were excluded from the review, given our focus on modern marketing channels. Due to time constraints and limited expertise on the team, studies in any language other than English were also excluded from the review. We recognize this as a limitation and encourage the inclusion of this literature in future iterations on this work. For a detailed explanation of selection criteria, see the scoping review protocol in Open Science Framework68.
Data extraction and analysis. Relevant information from each included study was extracted by at least one review author. The extracted data included bibliographic information, information about the study design, sample size, producer characteristics and information about the focal actors and their interactions with producers. Information on the nature of the interactions, the outcomes measured and the effects on small-scale producers were recorded. In addition, we noted whether a study addressed issues of climate change, environmental sustainability or gender. While an assessment of study quality is not typically carried out as part of a scoping review67, we conducted a general methodological assessment on the basis of three questions related to the appropriateness of the methods used. Bibliometric data were examined to identify publishing and research trends. Journal impact factors for studies published in peer-reviewed journals were retrieved from Journal Citation Reports (Clarivate Analytics).
The quality of each study’s ‘methodology description’ and ‘methodology justification’ was assessed to be high, low or uncertain/questionable. ‘High’ meant there was a clear description of the sampling methods used (for methodology) and a clear justification of the selection of the research site(s), research design and/or methods used to collect and analyse the data used (for methodology justification). Studies that clearly did not meet this were considered to be of low quality. Studies for which the reviewer remained uncertain after applying the criteria were labelled as uncertain. Overall subjective quality assessment for each study was based on how convinced a reviewer was of the quality of the methodology and its justification from the two previous questions. Papers were ranked as low, medium or high using the following guide. If the responses to the two previous questions were both high, then it received a high assessment overall. If they were both low/uncertain, then this was a study of low/uncertain quality. If the responses were high and then low or low and then high, then this was a study of medium quality.
The extracted data were summarized on the basis of emerging themes and with the aim of providing recommendations to donors and policymakers.
Data availabilityThe data that support the findings of this study (that is, the data extracted from the 202 studies, as described in the Methods) are available from the corresponding author on request.
Received: 4 January 2020; Accepted: 8 September 2020; Published online: 12 October 2020
References 1. Tschirley, D., Reardon, T., Dolislager, M. & Snyder, J. The rise of a middle
class in East and southern Africa: implications for food systemtransformation. J. Int. Dev. 27, 628–646 (2015).
2. Seto, K. C. & Ramankutty, N. Hidden linkages between urbanization andfood systems. Science 352, 943–945 (2016).
3. Reardon, T. et al. Rapid transformation of food systems in developingregions: highlighting the role of agricultural research & innovations. Agric. Syst. 172, 47–59 (2019).
4. Sitko, N. J. & Jayne, T. S. Exploitative briefcase businessmen,parasites, and other myths and legends: assembly traders and theperformance of maize markets in eastern and southern Africa.World Dev. 54, 56–67 (2014).
5. Fung, W., Liverpool-Tasie, L. S. O., Mason, N. & Oyelere, R. U. Do croppurchase programs improve smallholder welfare? The case of Zambia’s FoodReserve Agency. Agric. Econ. 51, 519–533 (2020).
6. Hernandez-Aguilera, J. N. et al. Impacts of smallholder participation inhigh-quality coffee markets: the Relationship Coffee Model. Ideas https://ideas.repec.org/p/ags/aaea15/205650.html (2015).
7. Hernandez, R., Reardon, T. & Berdegue, J. Supermarkets, wholesalers, andtomato growers in Guatemala. Agric. Econ. 36, 281–290 (2007).
8. Bell, C., Srinivasan, T. N. & Udry, C. Rationing, spillover, and interlinking incredit markets: the case of rural Punjab. Oxf. Econ. Pap. 49, 557–585 (1997).
9. Dries, L., Germenji, E., Noev, N. & Swinnen, J. F. M. Farmers, verticalcoordination, and the restructuring of dairy supply chains in central andeastern Europe. World Dev. 37, 1742–1758 (2009).
10. Ton, G., Desiere, S., Vellema, W., Weituschat, S. & D’Haese, M. Theeffectiveness of contract farming for raising income of smallholder farmers inlow- and middle-income countries: a systematic review. Campbell Syst. Rev.13, 1–131 (2017).
11. Austin, J. E. Agroindustrial Project Analysis (Johns Hopkins Univ.Press, 1981).
12. Gow, H. R. & Swinnen, J. F. M. Up- and downstream restructuring, foreigndirect investment, and hold-up problems in agricultural transition. Eur. Rev.Agric Econ. 25, 331–350 (1998).
13. Liverpool-Tasie, L. S. O., Okuku, R., Harawa, R., Reardon, T. & Wallace, S. inThe Hidden Middle: A Quiet Revolution in the Private Sector DrivingAgricultural Transformation (ed. Reardon, T.) 146–165 (AGRA, 2019).
14. Padilla, S., Liverpool-Tasie, L. S. O. & Myers, R. J. The Effects of Feed Costsand Increased Energy Needs on Broiler Farm Productivity: A DynamicProgramming Approach Research Paper 130 (Feed the Future Innovation Labfor Food Security Policy, 2019).
15. Reardon, T. et al. The quiet revolution in Asia’s rice value chains. Ann. N. Y.Acad. Sci. 1331, 106–118 (2014).
16. Liverpool-Tasie, L. S. O., Sanou, A. & Tambo, J. T. Climate changeadaptation among poultry farmers: evidence from Nigeria. Clim. Change 157, 527–544 (2018).
17. Minten, B., Reardon, T., Singh, K. M. & Sutradhar, R. K. The new andchanging roles of cold storages in the potato supply chain in Bihar. Econ. Polit. Wkly 49, 98–108 (2014).
18. Qanti, S. R., Reardon, T. & Iswariyadi, A. Triangle of linkages amongmodernising markets, sprayer–traders, and mango-farming intensification inIndonesia. Bull. Indones. Econ. Stud. 53, 187–208 (2017).
Nature SuStaiNability | VOL 3 | OctOber 2020 | 799–808 | www.nature.com/natsustain806

Sustainable solutions to end hunger | 127
ArticlesNature SuStaiNability
19. Louw, A., Vermeulen, H., Kirsten, J. & Madevu, H. Securing small farmerparticipation in supermarket supply chains in South Africa. Dev. South. Afr. 24, 539–551 (2007).
20. Rao, E. J. & Qaim, M. Supermarkets, farm household income, and poverty:insights from Kenya. World Dev. 39, 784–796 (2011).
21. Rao, E. J., Brümmer, B. & Qaim, M. Farmer participation in supermarketchannels, production technology, and efficiency: the case of vegetables inKenya. Am. J. Agric. Econ. 94, 891–912 (2012).
22. Mutonyi, S. The effect of collective action on smallholder income and assetholdings in Kenya. World Dev. Perspect. 14, 100099 (2019).
23. Andersson, C. I., Chege, C. G., Rao, E. J. & Qaim, M. Following up onsmallholder farmers and supermarkets in Kenya. Am. J. Agric. Econ. 97, 1247–1266 (2015).
24. Oura, R. K. & Kouassi, F. N. G. The use of mobile phones as a panacea tofacilitate quick food trade rollout between markets and countrysides: a studyof Ayaou-Sran. Net. J. Agric. Sci. 3, 104–111 (2015).
25. Burke, M., Bergquist, L. F. & Miguel, E. Sell low and buy high: arbitrage andlocal price effects in Kenyan markets. Q. J. Econ. 134, 785–842 (2018).
26. Shiferaw, B., Obare, G. & Muricho, G. Rural market imperfections and therole of institutions in collective action to improve markets for the poor. Nat. Resour. Forum 32, 25–38 (2008).
27. Thiele, G. et al. Multi-stakeholder platforms for linking small farmers to valuechains: evidence from the Andes. Int. J. Agric. Sustain. 9, 423–433 (2011).
28. Kilelu, C. W., Klerkx, L. & Leeuwis, C. Supporting smallholdercommercialisation by enhancing integrated coordination in agrifood valuechains: experiences with dairy hubs in Kenya. Exp. Agric. 53, 269–287 (2017).
29. Chege, C. G., Andersson, C. I. & Qaim, M. Impacts of supermarkets on farmhousehold nutrition in Kenya. World Dev. 72, 394–407 (2015).
30. Negi, D. S., Birthal, P. S., Roy, D. & Khan, M. T. Farmers’ choice of marketchannels and producer prices in India: role of transportation andcommunication networks. Food Policy 81, 106–121 (2018).
31. Ansah, F. A., Asare, G. O. & Amodio, M. L. Fresh-cut markets andopportunities for income and nutrition security. In Proc. 1st All Africa PostHarvest Congress & Exhibition 10–13 (Univ. Nairobi, 2017).
32. Kizito, A. M. & Kato, E. Does linking farmers to markets work? Evidencefrom the World Food Programme’s Purchase for Progress satellite collectionpoints initiative in Uganda. Afr. J. Agric. Resour. Econ. 13, 169–181 (2018).
33. Elder, S. D. & Dauvergne, P. Farming for Walmart: the politics ofcorporate control and responsibility in the global South. J. Peasant Stud. 42, 1029–1046 (2015).
34. Ariga, J. & Jayne, T. S. Private Sector Responses to Public Investments andPolicy Reforms: The Case of Fertilizer and Maize Market Development inKenya Discussion Paper 00921 (IFPRI, 2009).
35. Herrmann, R., Nkonya, E. & Faße, A. Food value chain linkages andhousehold food security in Tanzania. Food Secur. 10, 827–839 (2018).
36. Forsythe, L., Posthumus, H. & Martin, A. A crop of one’s own? Women’sexperiences of cassava commercialization in Nigeria and Malawi. J. Gend.Agric. Food Secur. 1, 110–128 (2016).
37. Neven, D., Odera, M. & Reardon, T. Horticulture Farmers and DomesticSupermarkets in Kenya Staff Paper 6 (Michigan State Univ., 2006).
38. Kumar, A., Shinoj, P. & Jee, S. Do dairy co-operatives enhance milkproduction, productivity and quality? Evidences from the Indo-Gangeticplain of India. Indian J. Agric. Econ. 68, 457–468 (2013).
39. Francesconi, G. N. & Ruben, R. Impacts of Collective Action on Smallholders’Commercialisation: Evidence from Dairy in Ethiopia (European Association ofAgricultural Economists, 2007).
40. Shiferaw, B., Muricho, G., Kassie, M. & Obare, G. in Collective Action andProperty Rights for Poverty Reduction: Insights from Africa and Asia (edsMwangi, E. et al.) 110–147 (International Food Policy Research Institute, 2012).
41. Mojo, D., Fischer, C. & Degefa, T. The determinants and economic impacts ofmembership in coffee farmer cooperatives: recent evidence from ruralEthiopia. J. Rural Stud. 50, 84–94 (2017).
42. Yamano, T., Kijima, Y., Matsumoto, T. & Muto, M. in Community, Market and State in Development (eds Otsuka, K. & Kalirajan, K.) 245–261(Palgrave, 2010).
43. Trebbin, A. & Hassler, M. Farmers’ producer companies in India: a newconcept for collective action? Geogr. Helv. 69, 239–247 (2014).
44. Rutherford, D. D., Burke, H. M., Cheung, K. K. & Field, S. H. Impact of anagricultural value chain project on smallholder farmers, households, andchildren in Liberia. World Dev. 83, 70–83 (2016).
45. Hernandez-Aguilera, J. N. et al. Quality as a driver of sustainable agriculturalvalue chains: the case of the relationship coffee model. Bus. Strategy Environ.27, 179–198 (2018).
46. Blanc, J. Family farmers and major retail chains in the Brazilian organicsector: assessing new development pathways. A case study in a peri-urbandistrict of São Paulo. J. Rural Stud. 25, 322–332 (2009).
47. Abebe, G. K., Bijman, J. & Royer, A. Are middlemen facilitators or barriers toimprove smallholders’ welfare in rural economies? Empirical evidence fromEthiopia. J. Rural Stud. 43, 203–213 (2016).
48. Lu, H., Trienekens, J. H., Omta, S. W. F. & Feng, S. Guanxi networks,buyer-seller relationships, and farmers’ participation in modern vegetablemarkets in China. J. Int. Food Agribus. Mark. 22, 70–93 (2015).
49. Noma, F. Assessment of Food Reserve Policies in West Africa: CaseStudy of Benin Grain Reserve Policy Design and Impacts (Univ.Giessen, 2017).
50. Faure, G., D’Hotel, E. M., le Coq, J. F. & Saenz, F. Can Supply Chain’sCoordination Mechanisms Include Small Holders? Insight froman Empirical Work in Costa Rica (European Association of AgriculturalEconomists, 2007).
51. Jayne, T. S., Yamano, T. & Nyoro, J. Interlinked credit and farmintensification: evidence from Kenya. Agric. Econ. 31, 209–218 (2004).
52. Adjei-Nsiah, S. & Klerkx, L. Innovation platforms and institutional change:The case of small-scale palm oil processing in Ghana. Cah. Agric. 25, 65005 (2016).
53. Navarro, F. E. et al. The impacts of differentiated markets on the relationshipbetween dairy processors and smallholder farmers in the Peruvian Andes.Agric. Syst. 132, 145–156 (2015).
54. Harou, A. P., Upton, J. B., Lentz, E. C., Barrett, C. B. & Gomez, M. I.Tradeoffs or synergies? Assessing local and regional food aid procurementthrough case studies in Burkina Faso and Guatemala. World Dev. 49, 44–57 (2013).
55. Wassie, S. B., Kusakari, H. & Masahiro, S. Inclusiveness and effectiveness ofagricultural cooperatives: recent evidence from Ethiopia. Int J. Soc. Econ. 46, 614–630 (2019).
56. Chagwiza, C., Muradian, R. & Ruben, R. Cooperative membershipand dairy performance among smallholders in Ethiopia. Food Policy 59, 165–173 (2016).
57. Fischer, E. & Matin, Q. Gender, agricultural commercialization, and collectiveaction in Kenya. Food Secur. 4, 441–453 (2012).
58. Mason, N. M. & Myers, R. J. Zambian Smallholder Behavioral Responses toFood Reserve Agency Activities Policy Synthesis 49 (Food Security ResearchProject Zambia, 2011).
59. Abdelali-Martini, M., Dhehibi, B. & Aw-Hassan, A. Determinants of smallscale dairy sheep producers’ decisions to use middlemen for accessingmarkets and getting loans in dry marginal areas in Syria. Exp. Agric. 50, 438–457 (2014).
60. Singla, N., Singh, S. & Dhindsa, P. K. Fresh food supermarkets inthe Indian Punjab: organisation and impacts. J. Punjab Stud. 21, 91–111 (2014).
61. Okello, J. J., Narrod, C. A. & Roy, D. Why Market Institutions DisfavorSmallholder Farmers’ Compliance with International Food Safety Standards:Evidence from Kenya, Zambia and Ethiopia (International Association ofAgricultural Economists, 2009).
62. Madjidi, O. Sustainable Coffee Certification Programs and CoffeeCooperatives in Guatemala: A Small-Scale Producer Perspective(Royal Roads Univ., 2011).
63. Ng’eno, E. K. Dairy farmer households’ farm gate milk price heterogeneity inKericho County, Kenya. J. Dev. Agric. Econ. 9, 168–177 (2017).
64. Minten, B., Vandeplas, A. & Swinnen, J. Regulations, brokers, andinterlinkages: the institutional organization of wholesale markets in India.Econ. Polit. Wkly. 49, 98–108 (2014).
65. Tricco, A. C. et al. PRISMA extension for scoping reviews (PRISMA-ScR):checklist and explanation. Ann. Intern. Med. 169, 467–473 (2018).
66. Levac, D., Colquhoun, H. & O’Brien, K. K. Scoping studies: advancing themethodology. Implement. Sci. 5, 69 (2010).
67. Peters, M. D. J. et al. Guidance for conducting systematic scoping reviews.Int. J. Evid. Based Healthc. 13, 141–146 (2015).
68. Liverpool-Tasie, S. et al. Vibrant food systems. Open Science Framework https://osf.io/qm8vg/ (2019).
69. Oya, C., Schaefer, F., Skalidou, D., McCosker, C. & Langer, L. Effects ofcertification schemes for agricultural production on socio-economicoutcomes in low- and middle-income countries: a systematic review.Campbell Syst. Rev. 13, 1–346 (2017).
70. Reardon, T. et al. in The Hidden Middle: A Quiet Revolution in thePrivate Sector Driving Agricultural Transformation (ed. Reardon, T.) 1–12(AGRA, 2019).
AcknowledgementsWe acknowledge and appreciate financial support for this work from the Ceres2030 project. We also appreciate support from the US Department of Agriculture National Institute of Food and Agriculture and Michigan AgBioResearch, Consortium of International Agricultural Research Centers (CGIAR), World Bank, International Institute for Sustainable Development (IISD) and Centre for Agriculture and Bioscience International (CABI) with core financial support from its member countries (http://www.cabi.org/about-cabi/who-we-work-with/key-donors/). These funders were in no way involved in the study design; in the collection, analysis, or interpretation of data; in the writing of the report; or in the decision to submit the paper for publication. The contents are the responsibility of the authors and do not necessarily reflect the views
Nature SuStaiNability | VOL 3 | OctOber 2020 | 799–808 | www.nature.com/natsustain 807

128 | Sustainable solutions to end hunger
Articles Nature SuStaiNability
of any donor or donor country. Any views expressed or remaining errors are solely the responsibility of the authors.
Author contributionsS.Y. and N.G. led the search process and contributed to the title and abstract screening. S.Y. also contributed to the writing. L.S.O.L.-T. identified the overall research question and liaised with S.Y. and N.G. on the search process; coordinated the research process and paper writing; contributed to screening at all stages; contributed to the development of the data extraction framework, data extraction and data analysis; and led the writing. A.W. contributed to screening at all stages, contributed to the development of the data extraction template and to data extraction, led the data cleaning and analysis and contributed to the writing. J.T. and G.S.A. contributed to screening at all stages and contributed to data extraction, data analysis and writing. C.V. contributed to screening at all stages and developed the data extraction tool. T.R. contributed to the writing, evidence interpretation and link to the literature. L.B. and A.G. contributed to screening, data extraction and data analysis. J.P. contributed to the methodology and writing, and A.C. contributed to screening and data extraction.
Competing interestsThe authors declare no competing interests.
Additional informationExtended data is available for this paper at https://doi.org/10.1038/s41893-020-00621-2.
Supplementary information is available for this paper at https://doi.org/10.1038/s41893-020-00621-2.
Correspondence and requests for materials should be addressed to L.S.O.L.-T.
Reprints and permissions information is available at www.nature.com/reprints.
Publisher’s note Springer Nature remains neutral with regard to jurisdictional claims in published maps and institutional affiliations.
Open Access This article is licensed under a Creative Commons Attribution 4.0 International License, which permits use, sharing, adap-tation, distribution and reproduction in any medium or format, as long
as you give appropriate credit to the original author(s) and the source, provide a link to the Creative Commons license, and indicate if changes were made. The images or other third party material in this article are included in the article’s Creative Commons license, unless indicated otherwise in a credit line to the material. If material is not included in the article’s Creative Commons license and your intended use is not permitted by statu-tory regulation or exceeds the permitted use, you will need to obtain permission directly from the copyright holder. To view a copy of this license, visit http://creativecommons.org/licenses/by/4.0/.© The Author(s) 2020
Nature SuStaiNability | VOL 3 | OctOber 2020 | 799–808 | www.nature.com/natsustain808
Sustainable solutions to end hunger | 129
Articleshttps://doi.org/10.1038/s41893-020-00622-1
1Natural Resources Institute (NRI), University of Greenwich, Chatham, UK. 2Holcroft Postharvest Consulting, Lectoure, France. 3The Postharvest Education Foundation, La Pine, OR, USA. 4Department of Agricultural and Biosystems Engineering & Soil Science and Environment, University of Zimbabwe, Harare, Zimbabwe. 5Economic and Social Statistics Division, Food and Agriculture Organisation of the United Nations, Rome, Italy. 6Microeconomic, Institutional and Development Impact Division, African Development Bank, Abidjan, Cote d’Ivoire. 7Magrath Library, University of Minnesota, St. Paul, MN, USA. 8National Agricultural Library, Beltsville, MD, USA. 9Economic and Social Development Department, Food and Agriculture Organisation of the United Nations, Rome, Italy. 10Present address: RaboResearch Food and Agribusiness, Utrecht, The Netherlands. ✉e-mail: [email protected]
The global population is projected to reach 9.7 billion people by 20501. This will require a 60% increase in global food produc-tion compared with 2005–2007 levels, alongside more equi-
table access2. Additionally, over 815 million people are chronically undernourished3, especially in parts of sub-Saharan Africa (SSA) and South Asia, where 22.8% and 14.7% of the overall populations are undernourished, respectively4. Postharvest loss (PHL) of food crops, during or after harvest, is a loss of valuable food and of the inputs required to produce and distribute it5. Given its substantial scale, reducing PHL will help create more sustainable and resilient food systems, and reduce greenhouse gas emissions. PHL reduc-tion can simultaneously optimize agricultural productivity and increase the incomes of small-scale food producers and associated value-chain actors, especially women, who are traditionally respon-sible for many postharvest activities.
The causes of PHL and the stages at which they occur are numer-ous and varied depending on the supply chain, the location and a variety of other contexts. Damage or loss can occur during all post-harvest stages. For example, part of the crop may get left behind unharvested in the field, spilt during transportation or attacked by pests or microbes during storage. All of these can reduce the quantity or quality of food available and the associated income opportunities for small-scale food producers. Many of these are preventable through proper training, the adoption of appropriate
tools or technologies, effective handling practices, sound policies and marketing-related improvements.
After the food crises of the 1970s and 2007–2008, PHL reduc-tion received more attention and investment. However, due to factors such as poor coordination, inappropriate scale, a focus pre-dominantly on technologies, short-term time frames and lack of follow-up, the investment impact has been limited. Moreover, the failure to invest in proper support for training, institutionalization and services (for example, financial credit, supply chains and distri-bution networks, quality standards, and improved infrastructure) has contributed to the lack of progress5–13.
Targets have been set under Sustainable Development Goal (SDG) 12.3 to reduce losses along the supply chain14. African Union Member States have gone even further, pledging to halve posthar-vest food loss by 2025 under the Malabo Declaration15. The reduc-tion of postharvest food loss has wider implications for other SDGs related to food systems, as well as socio-economic and environmen-tal effects related to SDGs 1, 2, 5, 6, 7, 8, 9, 10, 11, 13, 14, 15 and 1716. The critical role of PHL reduction to support the attainment of SDG 2 and the need to review existing evidence were recognized during a consultative exercise coordinated by the Global Donor Platform for Rural Development and the Ceres2030 project (https://ceres2030.org/). A synthesis of the expanding body of research and development work on interventions that can help small-scale
A scoping review of interventions for crop postharvest loss reduction in sub-Saharan Africa and South AsiaTanya Stathers 1 ✉, Deirdre Holcroft2,3, Lisa Kitinoja3, Brighton M. Mvumi 4, Alicia English5,10, Oluwatoba Omotilewa6, Megan Kocher 7, Jessica Ault8 and Maximo Torero9
Reducing postharvest losses (PHLs) of food crops is a critical component of sustainably increasing agricultural productivity. Many PHL reduction interventions have been tested, but synthesized information to support evidence-based investments and policy is scarce. In this study, PHL reduction interventions for 22 crops across 57 countries in sub-Saharan Africa and South Asia from the 1970s to 2019 were systematically reviewed. Screening of the 12,907 studies identified resulted in a collection of 334 studies, which were used to synthesize the evidence and construct an online open-access database, searchable by crop, coun-try, postharvest activity and intervention type. Storage technology interventions mainly targeting farmers dominated (83% of the studies). Maize was the most studied crop (25%). India had the most studies (32%), while 25 countries had no studies. This analysis indicates an urgent need for a systematic assessment of interventions across the entire value chain over multiple seasons and sites, targeting stakeholders beyond farmers. The lack of studies on training, finance, infrastructure, policy and market interventions highlights the need for interventions beyond technologies or handling practice changes. Additionally, more studies are needed connecting the impact of PHL reductions to social, economic and environmental outcomes related to Sustainable Development Goals. This analysis provides decision makers with data for informed policy formulation and prioriti-zation of investments in PHL reduction.
Nature SuStaiNability | VOL 3 | OCTOBER 2020 | 821–835 | www.nature.com/natsustain 821

130 | Sustainable solutions to end hunger
Articles Nature SuStaiNability
producers and associated value-chain actors to reduce PHLs is vital for evidence-based decision-making.
ResultsOnly 334 of the 12,907 studies (2.6%) identified for the 22 food crops across 57 countries of SSA and South Asia met the inclusion criteria (Box 1 and Extended Data Fig. 1).
Outline of the evidence. The 334 included studies came from a wide range of sources, with the majority (85.9%) being journal papers. The earliest articles were published in 1971, and 42.2% were published in the past decade (Fig. 1a). India accounted for 32.2% of the articles, while for 25 countries there were no stud-ies that met the inclusion criteria (Fig. 1b and Extended Data Fig. 2). Studies on maize dominated (24.9%) (Fig. 1c), and, when aggregated by crop group, legumes were the least studied (7.8%) (Fig. 1d). When grouped by postharvest activity stages, studies on storage interventions for dry and fresh forms of the crops dominated, each accounting for 42.5% and 40.1% of the stud-ies, respectively (Fig. 1e). Most of the studies (91.0%) focused on postharvest interventions that small-scale producers could use to reduce losses. Studies of loss-reduction interventions for use by traders, transporters or other food-system actors were lim-ited. On-farm/field trials made up 34.1% of the studies. Surveys accounted for 8.1%, and 57.8% were research station trials. More detailed descriptive statistics of the evidence can be found in Supplementary Box 1.
Overview of postharvest interventions studied. Cereals had attracted the most study of PHL reduction interventions (43.3%), particularly maize (25.8%) (Fig. 2). Root and tuber crops followed (19.9%), principally potato in India. Next were fruits (19.2%), par-ticularly citrus and mango in India. The vegetable interventions (10.7%) focused on onion or tomato, mainly in India. Legumes had the fewest interventions studied (6.8%).
Geographically, SSA accounted for 55.0% of the interventions studied. The most interventions had been studied in India (34.6%), with a focus on potato, citrus, onion, mango, rice, wheat, banana and tomato. Within SSA, 54.9% of the interventions were on cereals, 19.9% on root and tuber crops, 11.5% on legumes, 7.5% on fruits and 6.2% on vegetables.
The PHL reduction interventions studied were aggregated using a four-tier hierarchical system, with the first tier being the interven-tion type (technology/tool/equipment, handling practice change, training/extension, finance, policy, markets, support or infrastruc-ture). The second tier was the intervention stage, grouped into typi-cal postharvest stages (such as harvesting, drying and storage), and tier 3 was the specific interventions (such as zero-energy cool cham-ber or traditional granary plus synthetic chemical; for the full list, see Supplementary Table 3). The details of each intervention were provided in tier 4 (for example, the name and application rate of the agricultural chemical or the size of the box).
The analysis of the 334 studies by intervention type (tier 1) high-lights the dominance of studies on tangible technologies, tools or equipment (88.3% of studies, 89.0% of interventions). There were far fewer studies on handling practices (14.1%, 10.5%), training (0.6%, 0.3%) and infrastructure (0.3%, 0.1%). None were on policy, finance, markets or support/organization (Fig. 3).
Measurement of PHL. PHLs are multidimensional and can be measured in different ways, both quantitatively (physical loss) and qualitatively (for example, increased damage, decay, breakage, con-tamination with toxins, reduced seed viability and deterioration in the nutrient content or economic value of a product)5,16. These losses can be assessed using a range of metrics depending on the focus of the research or intended use of the crop. For each intervention
studied, data for one quantitative and one qualitative loss metric were included depending on the evidence presented in the respec-tive study. To support the comparative efficacy analyses, the differ-ent loss measurements were aggregated into groups (Supplementary Tables 4 and 5).
PHL reduction interventions and their efficacy. Most of the inter-ventions studied were tangible technologies for reducing losses
box 1 | Overview of methods
Searches. A search strategy was developed in May 2019 and used to sequentially search CAB Abstracts, Web of Science, Scopus and 47 additional electronic database and grey literature sources. The 14,576 records identified were deduplicated, resulting in 12,786 documents for title and abstract screening. A second search was done on 30 October 2019 to ensure that the evidence-base was as current as possible, yielding 121 additional studies.
Study exclusion criteria. Studies were excluded if they:
• Did not include a PHL reduction intervention for one of the22 focal food crops
• Did not take place in SSA or South Asia• Were not relevant to PHL reduction by small-scale producers
or their associated value-chain actors• Did not include original research and sufficient details on it• Did not report the effect of an intervention on PHL, which
required comparison between different interventions,between adopters and non-adopters or between pre- andpost-adoption
• Did not test an intervention at a meaningful scale at the fieldlevel or in a real-world context
• Were not written in either English or FrenchNo date restrictions were applied.
Title and abstract screening. The titles and abstracts were auto-coded by semantic machine-learning models and prescreened using filters and a Python script to expedite the exclusion of studies not related to the focal crops or geographies. The title and abstract of each of the 12,907 studies were then screened independently by two of the postharvest researchers.
Full-text article screening. The 1,906 studies included during the title and abstract screening stage were read to determine whether to include them in the evidence-base. A flow chart of the number of studies and exclusion reasons is shown in Extended Data Fig. 1, and the included studies are listed in Supplementary Table 1.
Data extraction and synthesis. Data from the 334 included studies were extracted into an SQL database version of the coding framework (Supplementary Table 2). Meta-analyses were conducted at both the study and the intervention levels to provide an overview of what interventions have been studied by crop, country and postharvest stage, and to compare the efficacy of the different interventions in reducing PHLs. The searchable SQL database was created to facilitate interactive exploration of the data and is available at https://PHCeres2030.net/.
The systematic method that we followed aims to capture and rigorously screen all the relevant literature to fully explore, map and compare the existing evidence and to identify gaps and reduce authorial bias. The full details of the methodology are provided in the Methods, and the preregistered protocol is available at https://osf.io/6zc92/.
Nature SuStaiNability | VOL 3 | OctOber 2020 | 821–835 | www.nature.com/natsustain822

Sustainable solutions to end hunger | 131
ArticlesNature SuStaiNability
during storage, while a few studies focused on changes in handling practices or training (Fig. 3). A comparison of the loss in quantity or quality for the different interventions can provide an overview of their efficacy. Since the studies were conducted in different years, seasons, locations and contexts and using different varieties by different research teams, comparisons beyond those within a single study provide only an indication of the relative efficacy of the different interventions.
Cereals. For cereals, the focus was primarily on storage technology interventions (Fig. 3), including pesticides (both synthetic chemi-cals and botanicals), modified atmospheres, storage containers and combinations of these technologies (Supplementary Table 6). Only 11 of the 121 cereal storage studies (9%) targeted traders or other storage service providers. Six of these studied large-scale storage interventions, such as metal silos or hermetic cocoons of seven-tonne capacity or above, or large bag stacks in warehouses.
Studies on changes in handling practices focused on harvest maturity, timing or weather conditions and their combination with other postharvest handling practices. Some studies evaluated the effects of sorting or field-drying methods.
Simple tools or machines for harvesting were compared with manual practices. Drying technologies studied included different structures and heat sources, as well as protecting the crop from con-tact with the ground during sun-drying versus drying it directly on the ground. Threshing, shelling or de-husking studies compared manual methods, simple tools and mechanized threshing. Only four studies investigated different milling equipment, all on rice in Ghana, India or Bangladesh. Just one study investigated the effect of farmer training, and that was nearly 50 years ago17.
Maize. For the analysis of quantity loss for different maize stor-age interventions (tier 3), percentage weight loss data were used. For quality loss, the percentage of damaged or discoloured grains was used, although many other quality loss measurements were recorded in the maize studies (Supplementary Table 5). As the studies presented loss data from different storage durations (rang-ing from 1 to 12 months), the data for a standardized storage period of six months were used to facilitate comparison. Of the 78 studies on maize storage methods, 74 were from SSA and 4 were from South Asia (India and Nepal). The storage method included details of both the facility in which the crop was stored and the pro-tectant used. The heterogeneity between the studies and the small number of cases (that is, n = 1 or 2) for many of the interventions must be noted.
The aggregated data indicated that several air-tight/hermetic facilities, the admixture of grain with diatomaceous earth (DE) or cooking oils, and a fumigated and insecticide-sprayed bag stack kept quantity loss below 2% during six months of storage (Fig. 4a). Quantity losses ranged widely in maize grain and cobs treated with synthetic chemical protectants and stored in different facilities for six months (that is, from <1 to 27% weight loss), although means from a low n value should be interpreted with caution. Differences in the types, efficacy, stability and application rates of synthetic chemi-cals, varietal susceptibility, environmental conditions and number of occurrences of the interventions help explain the high variabil-ity. For example, the most studied intervention, ‘polypropylene bag + synthetic chemical’ (n = 21), had a weight loss of 7.2% ± 11.2%(mean ± s.d.). When the losses in quality between interventions werecompared, similar trends to those for the quantity loss data wereobserved (Fig. 4b). Because much of the grain damage was due toinsect pest attack in storage, the relationship between quantity andquality loss was expected. For example, 20% storage-insect-damaged maize grain typically equates to 5% weight loss18.
Two studies found that mass trapping, biological control agents or synthetic chemicals in traditional granaries lowered weight loss
by 13.0–57.6 percentage points, compared with the traditional prac-tice or an untreated control (Supplementary Fig. 1a,b). Treating fumigated or non-fumigated grain with a residual synthetic chemi-cal dust and storing it in sacks, or storing untreated grain in her-metic bags or metal or plastic silos, lowered weight loss by 1.3–10.1 percentage points and reduced grain damage.
One handling practice study found that selecting cobs with tightly closed husks, as opposed to open husks, reduced insect infestation from 20.0% to 1.0%. Another study found that improved admixing of protectants with grain reduced storage insect dam-age from 14.0% to 3.2%. Proper crop drying, store hygiene, store disinfestation and regular inspection led to lower losses. Cobs field-dried on plants (as opposed to heaped on the ground) and those harvested at physiological maturity (as opposed to several weeks later) experienced lower weight loss and aflatoxin levels (Supplementary Table 7).
Wheat, rice and sorghum. Storage method intervention studies on wheat, rice and sorghum tended to report the percentage of damaged grain (n = 108) rather than grain weight loss (n = 66).
During wheat storage, a range of pesticide treatments were stud-ied, including repeated fumigation and pesticide spraying of bag stacks, which kept weight loss below 2% (Extended Data Fig. 3a), as did underground pit storage in India. If products such as indus-trial filter cake dusts, silicon-rich botanical powder or synthetic chemicals were admixed with grain, or if grain was stored in sealed drums, hermetic bags, concrete bins or improved granaries, weight loss also remained below 2% at six months and grain dam-age was below 5% (Extended Data Fig. 3a,b). When storage inter-ventions were compared with the traditional practice or untreated control, the admixture of synthetic chemical or filter-cake dust or silicon-rich botanical treatments, or storage in sealed plastic con-tainers or hermetic bags, most effectively prevented grain damage (Supplementary Fig. 2a,b). All the wheat storage studies were from South Asia, except one study from Ethiopia.
Less than 2% weight loss and less than 6% damage occurred during six months of storage when paddy rice was sealed untreated in hermetic bags, metal silos or improved granaries, or when it was fumigated and stored inside a metal silo or pesticide-incorporated bag (Extended Data Fig. 3a,b). However, when paddy rice was stored untreated in jute or polypropylene sacks, traditional gra-naries or heaps on a floor, weight losses between 2.8% and 21.8% and grain damage between 16.4% and 20.3% occurred. When storage interventions were compared with the traditional prac-tice or untreated control, hermetic cocoons, metal silos, tradi-tional granaries with fumigation and rodent control, hermetic bags, and improved granaries lowered weight losses (1.8–5.3 per-centage points) and grain damage (12.7–16.4 percentage points) (Supplementary Fig. 2a,b).
Sorghum lost less than 2% weight during six months of storage when kept untreated in hermetic bags or improved underground pits, in bags following fumigation and admixture with synthetic chemicals, or in a traditional granary admixed with wood ash. Even without these interventions, weight loss was relatively low (2.1–6.9%) (Extended Data Fig. 3a). Less than 5% damage occurred when sorghum was fumigated, treated with synthetic chemicals, and stored in bags; or admixed with wood ash, synthetic chemicals or DE and stored in a traditional granary; or stored untreated in hermetic bags or an improved granary. However, untreated grain stored in bags or traditional granaries with or without botani-cal preparations sustained between 14.1% and 43.2% damage (Extended Data Fig. 3b).
Harvesting rice at the recommended time resulted in lower weight loss (0.6%) and fewer broken grains (9.4%) than either earlier or later harvesting (5.9–20.3% weight loss and 24.0–32.4% broken grains) (Supplementary Table 7). Threshing and sun or
Nature SuStaiNability | VOL 3 | OctOber 2020 | 821–835 | www.nature.com/natsustain 823

132 | Sustainable solutions to end hunger
Articles Nature SuStaiNability
2 3 3 2 13 2 1
3 3 25
3 25
1 2 3 24
6 5 63
52
15
5 6
2 3
1012
108
1210101110
15
118
18
141311
28
13
0
10
20
30
1971
1972
1973
1974
1975
1976
1977
1978
1979
1980
1981
1982
1983
1984
1985
1986
1987
1988
1989
1990
1991
1992
1993
1994
1995
1996
1997
1998
1999
2000
2001
2002
2003
2004
2005
2006
2007
2008
2009
2010
2011
2012
2013
2014
2015
2016
2017
2018
2019
Num
ber
of s
tudi
es
Distribution of included studies by publication year
108
3124 23 19 16 12 10 10 9 8 8 8 7 6 6 5 5 5 4 3 2 2 1 1 1 1 1 1 1 1 1
0
20
40
60
80
100
120
Indi
a
Nig
eria
Gha
na
Ken
ya
Pak
ista
n
Eth
iopi
a
Zim
babw
e
Ben
in
Tan
zani
a
Sri
Lank
a
Ban
glad
esh
Sou
th A
fric
a
Uga
nda
Tog
o
Nep
al
Nig
er
Bur
kina
Fas
o
Cot
e d'
Ivoi
re
Sud
an
Mal
awi
Moz
ambi
que
Mau
ritiu
s
Zam
bia
Afg
hani
stan
Cam
eroo
n
DR
C
Erit
rea
Gam
bia
Gui
nea
Mal
i
Sie
rra
Leon
e
Som
alia
Num
ber
of s
tudi
es
Distribution of included studies by country
83
3627 26 24 23 22 20 17 15 13 11 10 6 5 5 3 2 2 2 1 0
0
Yam
Groun
dnut
Papay
a
Planta
in
Pigeon
pea
Leaf
y veg
etab
le
Chickp
ea
Cabba
geBea
n
Cassa
va
Banan
a
Sweet p
otat
o
Cowpe
a
Sorgh
um
Tomat
o
Whe
at
Onion
Man
go
Citrus
fruit
Rice
Potat
o
Maiz
e (c
orn)
Stora
ge—
fresh
Handli
ng
Harve
sting
Thres
hing/
shell
ing
Mar
ket
Milli
ng
Curing
Pre-c
oolin
g
Field
dryin
g
Furth
er d
rying
Trans
port
to m
arke
t
Packa
ging
Stora
ge—
dry
20
40
60
80
100
Num
ber
of s
tudi
es
Distribution of included studies by crop
139
7360
42
26
0
20
40
60
80
100
120
140
Cereals Roots and tubers Fruits Vegetables Legumes
Num
ber
of s
tudi
es
Distribution of included studies by crop group
142 134
61
30 2614 12 8 6 6 4 4 1
020406080
100120140160
Num
ber
of s
tudi
es
Distribution of included studies by postharvest activity stage
a
b
c
d
e
Fig. 1 | Profile of the 334 PHL reduction intervention studies. a–e, The number of studies by year (a), country (b), crop (c), crop group (d) and postharvest activity stage (e).
Nature SuStaiNability | VOL 3 | OcTOber 2020 | 821–835 | www.nature.com/natsustain824
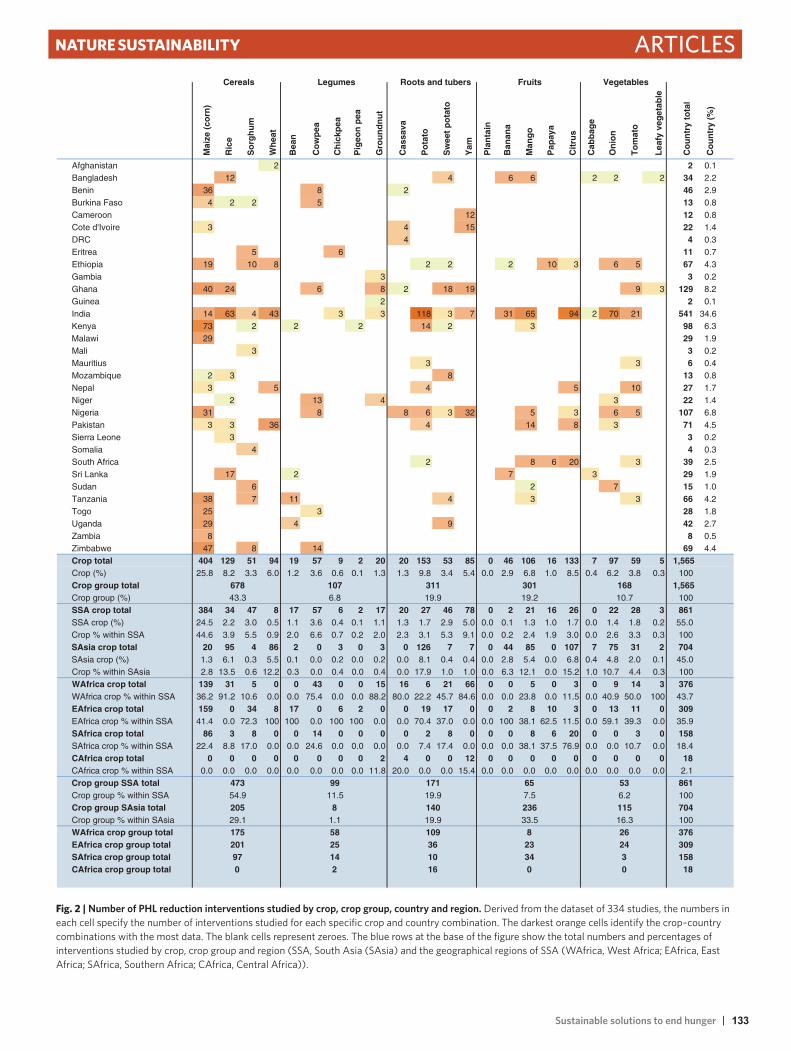
Sustainable solutions to end hunger | 133
ArticlesNature SuStaiNability
Mai
ze (
corn
)
Ric
e
So
rgh
um
Wh
eat
Bea
n
Co
wp
ea
Ch
ickp
ea
Pig
eon
pea
Gro
un
dn
ut
Cas
sava
Po
tato
Sw
eet
po
tato
Yam
Pla
nta
in
Ban
ana
Man
go
Pap
aya
Cit
rus
Cab
bag
e
On
ion
To
mat
o
Lea
fy v
eget
able
Co
un
try
tota
l
Co
un
try
(%)
Afghanistan 2 2 0.1Bangladesh 12 4 6 6 2 2 2 34 2.2Benin 36 8 2 46 2.9Burkina Faso 4 2 2 5 13 0.8Cameroon 12 12 0.8Cote d'Ivoire 3 4 15 22 1.4DRC 4 4 0.3Eritrea 5 6 11 0.7Ethiopia 19 10 8 2 2 2 10 3 6 5 67 4.3Gambia 3 3 0.2Ghana 40 24 6 8 2 18 19 9 3 129 8.2Guinea 2 2 0.1India 14 63 4 43 3 3 118 3 7 31 65 94 2 70 21 541 34.6Kenya 73 2 2 2 14 2 3 98 6.3Malawi 29 29 1.9Mali 3 3 0.2Mauritius 3 3 6 0.4Mozambique 2 3 8 13 0.8Nepal 3 5 4 5 10 27 1.7Niger 2 13 4 3 22 1.4Nigeria 31 8 8 6 3 32 5 3 6 5 107 6.8Pakistan 3 3 36 4 14 8 3 71 4.5Sierra Leone 3 3 0.2Somalia 4 4 0.3South Africa 2 8 6 20 3 39 2.5Sri Lanka 17 2 7 3 29 1.9Sudan 6 2 7 15 1.0Tanzania 38 7 11 4 3 3 66 4.2Togo 25 3 28 1.8Uganda 29 4 9 42 2.7Zambia 8 8 0.5Zimbabwe 47 8 14 69 4.4Crop total 404 129 51 94 19 57 9 2 20 20 153 53 85 0 46 106 16 133 7 97 59 5 1,565Crop (%) 25.8 8.2 3.3 6.0 1.2 3.6 0.6 0.1 1.3 1.3 9.8 3.4 5.4 0.0 2.9 6.8 1.0 8.5 0.4 6.2 3.8 0.3 100Crop group total 1,565Crop group (%) 100SSA crop total 384 34 47 8 17 57 6 2 17 20 27 46 78 0 2 21 16 26 0 22 28 3 861SSA crop (%) 24.5 2.2 3.0 0.5 1.1 3.6 0.4 0.1 1.1 1.3 1.7 2.9 5.0 0.0 0.1 1.3 1.0 1.7 0.0 1.4 1.8 0.2 55.0Crop % within SSA 44.6 3.9 5.5 0.9 2.0 6.6 0.7 0.2 2.0 2.3 3.1 5.3 9.1 0.0 0.2 2.4 1.9 3.0 0.0 2.6 3.3 0.3 100SAsia crop total 20 95 4 86 2 0 3 0 3 0 126 7 7 0 44 85 0 107 7 75 31 2 704SAsia crop (%) 1.3 6.1 0.3 5.5 0.1 0.0 0.2 0.0 0.2 0.0 8.1 0.4 0.4 0.0 2.8 5.4 0.0 6.8 0.4 4.8 2.0 0.1 45.0Crop % within SAsia 2.8 13.5 0.6 12.2 0.3 0.0 0.4 0.0 0.4 0.0 17.9 1.0 1.0 0.0 6.3 12.1 0.0 15.2 1.0 10.7 4.4 0.3 100WAfrica crop total 139 31 5 0 0 43 0 0 15 16 6 21 66 0 0 5 0 3 0 9 14 3 376WAfrica crop % within SSA 36.2 91.2 10.6 0.0 0.0 75.4 0.0 0.0 88.2 80.0 22.2 45.7 84.6 0.0 0.0 23.8 0.0 11.5 0.0 40.9 50.0 100 43.7EAfrica crop total 159 0 34 8 17 0 6 2 0 0 19 17 0 0 2 8 10 3 0 13 11 0 309EAfrica crop % within SSA 41.4 0.0 72.3 100 100 0.0 100 100 0.0 0.0 70.4 37.0 0.0 0.0 100 38.1 62.5 11.5 0.0 59.1 39.3 0.0 35.9SAfrica crop total 86 3 8 0 0 14 0 0 0 0 2 8 0 0 0 8 6 20 0 0 3 0 158SAfrica crop % within SSA 22.4 8.8 17.0 0.0 0.0 24.6 0.0 0.0 0.0 0.0 7.4 17.4 0.0 0.0 0.0 38.1 37.5 76.9 0.0 0.0 10.7 0.0 18.4CAfrica crop total 0 0 0 0 0 0 0 0 2 4 0 0 12 0 0 0 0 0 0 0 0 0 18CAfrica crop % within SSA 0.0 0.0 0.0 0.0 0.0 0.0 0.0 0.0 11.8 20.0 0.0 0.0 15.4 0.0 0.0 0.0 0.0 0.0 0.0 0.0 0.0 0.0 2.1Crop group SSA total 861Crop group % within SSA 100Crop group SAsia total 704Crop group % within SAsia 100WAfrica crop group total 376EAfrica crop group total 309SAfrica crop group total 158CAfrica crop group total 18
678 107 311 301 168
Cereals Legumes Roots and tubers Fruits Vegetables
473 99 171 65 53
43.3 6.8 19.9 19.2 10.7
205 8 140 236 11554.9 11.5 19.9 7.5 6.2
175 58 109 8 2629.1 1.1 19.9 33.5 16.3
97 14 10 34 3201 25 36 23 24
0 2 16 0 0
Fig. 2 | Number of PHL reduction interventions studied by crop, crop group, country and region. Derived from the dataset of 334 studies, the numbers in each cell specify the number of interventions studied for each specific crop and country combination. The darkest orange cells identify the crop–country combinations with the most data. The blank cells represent zeroes. The blue rows at the base of the figure show the total numbers and percentages of interventions studied by crop, crop group and region (SSA, South Asia (SAsia) and the geographical regions of SSA (WAfrica, West Africa; EAfrica, East Africa; SAfrica, Southern Africa; CAfrica, Central Africa)).
Nature SuStaiNability | VOL 3 | OCTObEr 2020 | 821–835 | www.nature.com/natsustain 825

134 | Sustainable solutions to end hunger
Articles Nature SuStaiNability
mechanical drying reduced rice weight loss, breakage and aflatoxin content compared with various field-drying and stacking combina-tions before threshing.
Legumes. There was considerably less research on legumes than on cereals. The majority of the studies (86.9%) focused on storage methods of dried legumes (Fig. 3 and Supplementary Table 6).
Intervention type (tier 1) andintervention stage (tier 2) M
aize
(co
rn)
Ric
e
So
rgh
um
Wh
eat
Bea
n
Co
wp
ea
Ch
ickp
ea
Pig
eon
pea
Gro
un
dn
ut
Cas
sava
Po
tato
Sw
eet
po
tato
Yam
Ban
ana
Man
go
Pap
aya
Cit
rus
Cab
bag
e
On
ion
To
mat
o
Lea
fy v
eget
able
Inte
rven
tio
nto
tal
Inte
rven
tio
n (
%)
Technology/tool/equipment use 362 101 51 88 15 57 9 2 12 12 141 36 70 46 91 16 131 4 85 59 5 1,393 89.0Ripening/senescence 2 3 5 0.3Harvesting 13 2 21 8 44 2.8Pre-cooling 9 13 22 1.4Packaging (perishables) 2 3 14 12 15 14 40 2 9 27 2 140 8.9Storage protectant (perishables) 6 51 7 44 5 30 6 66 27 242 15.5Storage structure or container (perishables) 1 76 9 26 15 13 10 17 2 44 26 3 242 15.5Drying 14 8 5 3 30 1.9Threshing or shelling or de-husking 5 22 27 1.7Storage method (durables) 343 55 51 88 13 57 9 2 12 630 40.3Processing 11 11 0.7
Handling practice change 40 28 6 4 5 8 10 17 15 15 2 3 12 165 10.5Handling before and/or after harvest 26 20 6 4 5 4 2 6 3 12 88 5.6Harvest 14 8 4 8 11 12 11 2 3 73 4.7Harvest and handling 4 4 0.3
Training/extension 2 3 5 0.3Expert advice 2 2 0.1Training 3 3 0.2
Infrastructure 2 2 0.1Road transport 2 2 0.1
Crop total 404 129 51 94 19 57 9 2 20 20 153 53 85 46 106 16 133 7 97 59 5 1,565 100Crop group total 1,565678 107 311 301 168
Cereals Legumes Roots and tubers Fruits Vegetables
Fig. 3 | Overview of the number of PHL reduction interventions studied by type (tier 1) and stage (tier 2) and by crop and crop group. Derived from the dataset of 334 studies, the numbers in each cell specify the number of interventions studied for each specific crop and intervention stage combination. The darkest orange cells identify the crop–intervention stage combinations with the most data. The blank cells represent zeroes. The blue cells at the base of the figure show the total number of interventions studied by crop and crop group, and in the two rightmost columns by intervention type and stage.
0 10 20 30 40
Polypropylene bag + DE (n = 2)Pesticide-incorporated polypropylene bag + DE (n = 1)
Hermetic cocoon (n = 3)Bag stack + fumigant + synthetic chemical (n = 3)
Raised platform + cobs in circle, then shelled + synthetic chemical (n = 1)Hermetic bag (n = 15)
Jerry can, plastic drum, plastic silo, bins, basins (n = 4)Bag + no protectant (n = 3)
Polypropylene bag + oil (n = 5)Fumigation + polypropylene bag + synthetic chemical (n = 1)
Fumigation + hermetic bag (n = 1)Fumigation + plastic drum, silo (n = 2)
Hermetic bag + synthetic chemical (n = 1)Pesticide-incorporated polypropylene bag (n = 4)Fumigation + pesticide-incorporated bag (n = 1)
Metal silo + fumigant (n = 1)Raised platform with cobs in circle + synthetic chemical (n = 9)
Plastic drum + synthetic chemical (n = 1)Heap on floor (n = 1)
Metal silo, drum or bin (n = 10)Traditional granary + synthetic chemical (n = 15)
Improved granary + synthetic chemical (n = 5)Fumigation + improved granary (n = 2)
Jute sack + fumigant (n = 1)Polypropylene bag + synthetic chemical (n = 21)
Fumigation + polypropylene bag (n = 2)Traditional granary + biocontrol agent (n = 2)
Polypropylene bag + botanical (n = 4)Raised platform with cobs in circle (n = 7)
Polypropylene bag + no protectant (n = 12)Improved granary (n = 5)
Warehouse + polypropylene bags (n = 1)Traditional granary + mass trapping (n = 1)
Traditional granary (n = 17)Jute sack + synthetic chemical (n = 2)
Jute sack + no protectant (n = 2)
Weight loss (%)
Grain stored untreatedTreated with synthetic chemicalTreated with an alternative
a0 20 40 60 80 100
Polypropylene bag + DE + synthetic chemical (n = 1)Pesticide-incorporated polypropylene bag + DE (n = 1)
Plastic drum + ash/sand/dust (n = 1)Fumigation + polypropylene bag + synthetic chemical (n = 1)
Plastic drum + synthetic chemical (n = 1)Hermetic cocoon (n = 3)
Jerry can, plastic drum, plastic silo, bins, basins (n = 3)Bag stack + fumigant + synthetic chemical (n = 3)
Metal silo + nitrogen (n = 1)Hermetic bag (n = 19)
Raised platform + cobs in circle, then shelled + synthetic chemical (n = 1)Polypropylene bag + DE (n = 12)
Fumigation + plastic drum, silo (n = 1)Metal silo + fumigant (n = 1)
Polypropylene bag + oil (n = 5)Store room + lime (n = 2)
Fumigation + pesticide-incorporated bag (n = 1)Raised platform with cobs in circle + synthetic chemical (n = 4)
Pesticide-incorporated polypropylene bag (n = 4)Traditional granary + synthetic chemical (n = 20)
Traditional granary + biocontrol agent (n = 2)Bag + ash/sand/dust (n = 4)
Polypropylene bag + synthetic chemical (n = 24)Metal silo, drum or bin (n = 10)
Improved granary + synthetic chemical (n = 7)Traditional granary + mass trapping (n = 1)
Fumigation + polypropylene bag (n = 1)Polypropylene bag + botanical (n = 4)
Bag + no protectant (n = 3)Fumigation + improved granary (n = 2)
Store room (n = 1)Raised platform with cobs in circle (n = 2)Warehouse + polypropylene bags (n = 1)
Polypropylene bag + no protectant (n = 20)Polypropylene bag + ash/sand/dust (n = 1)
Traditional granary (n = 17)Improved granary (n = 6)Fireplace smoke (n = 1)
Jute sack + synthetic chemical (n = 1)Jute sack + no protectant (n = 1)
Damaged or discoloured grain (%)
Grain stored untreatedTreated with synthetic chemicalTreated with an alternative
b
Fig. 4 | Comparative losses in quantity and quality of stored maize. a,b, Quantity (% weight loss) (a) and quality (% damaged or discoloured grain) (b) loss of maize stored for six months using different storage interventions. The interventions were sorted in order of efficacy. The means, 95% confidence intervals (CIs) and n values (that is, the number of times this intervention was found in the 334 studies) are presented. The loss levels are dependent on numerous factors, including the conditions during the study, which can result in high heterogeneity between studies. The loss levels for each intervention need to be interpreted with caution, particularly where the n value is low. Interventions in which the grain was stored untreated are shown as green bars. The blue bars indicate grain treated with a synthetic chemical. The grey bars indicate grain treated with an alternative method, such as DE.
Nature SuStaiNability | VOL 3 | OCTObEr 2020 | 821–835 | www.nature.com/natsustain826
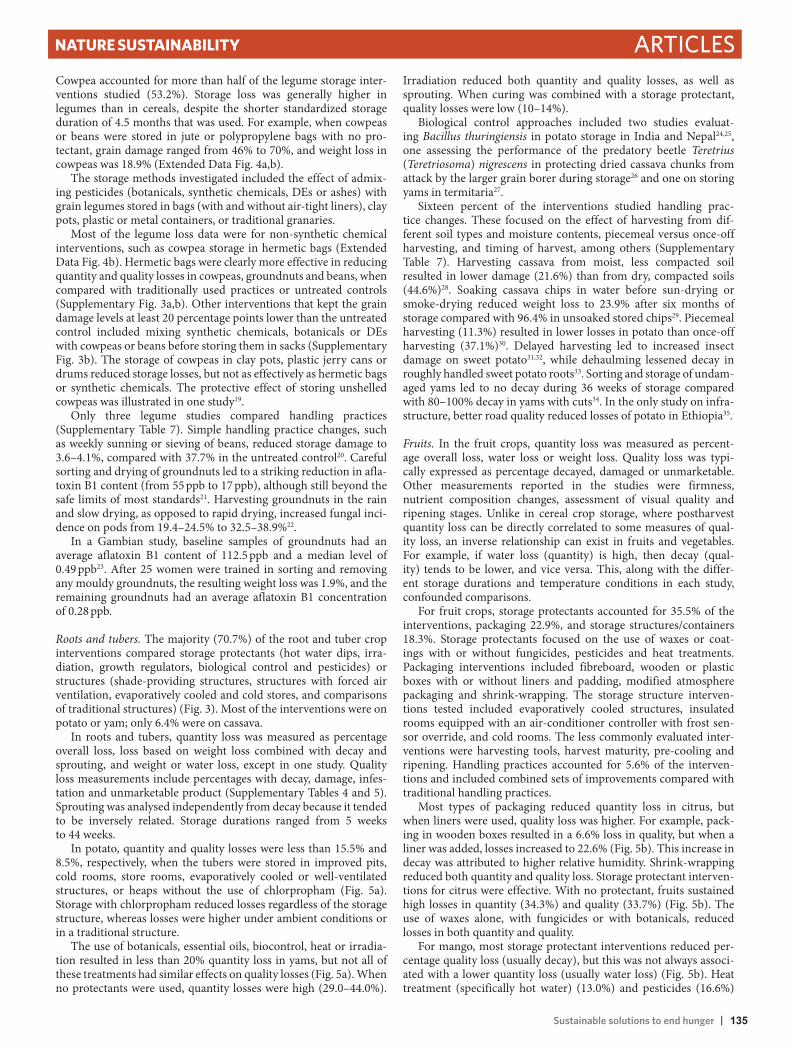
Sustainable solutions to end hunger | 135
ArticlesNature SuStaiNability
Cowpea accounted for more than half of the legume storage inter-ventions studied (53.2%). Storage loss was generally higher in legumes than in cereals, despite the shorter standardized storage duration of 4.5 months that was used. For example, when cowpeas or beans were stored in jute or polypropylene bags with no pro-tectant, grain damage ranged from 46% to 70%, and weight loss in cowpeas was 18.9% (Extended Data Fig. 4a,b).
The storage methods investigated included the effect of admix-ing pesticides (botanicals, synthetic chemicals, DEs or ashes) with grain legumes stored in bags (with and without air-tight liners), clay pots, plastic or metal containers, or traditional granaries.
Most of the legume loss data were for non-synthetic chemical interventions, such as cowpea storage in hermetic bags (Extended Data Fig. 4b). Hermetic bags were clearly more effective in reducing quantity and quality losses in cowpeas, groundnuts and beans, when compared with traditionally used practices or untreated controls (Supplementary Fig. 3a,b). Other interventions that kept the grain damage levels at least 20 percentage points lower than the untreated control included mixing synthetic chemicals, botanicals or DEs with cowpeas or beans before storing them in sacks (Supplementary Fig. 3b). The storage of cowpeas in clay pots, plastic jerry cans or drums reduced storage losses, but not as effectively as hermetic bags or synthetic chemicals. The protective effect of storing unshelled cowpeas was illustrated in one study19.
Only three legume studies compared handling practices (Supplementary Table 7). Simple handling practice changes, such as weekly sunning or sieving of beans, reduced storage damage to 3.6–4.1%, compared with 37.7% in the untreated control20. Careful sorting and drying of groundnuts led to a striking reduction in afla-toxin B1 content (from 55 ppb to 17 ppb), although still beyond the safe limits of most standards21. Harvesting groundnuts in the rain and slow drying, as opposed to rapid drying, increased fungal inci-dence on pods from 19.4–24.5% to 32.5–38.9%22.
In a Gambian study, baseline samples of groundnuts had an average aflatoxin B1 content of 112.5 ppb and a median level of 0.49 ppb23. After 25 women were trained in sorting and removing any mouldy groundnuts, the resulting weight loss was 1.9%, and the remaining groundnuts had an average aflatoxin B1 concentration of 0.28 ppb.
Roots and tubers. The majority (70.7%) of the root and tuber crop interventions compared storage protectants (hot water dips, irra-diation, growth regulators, biological control and pesticides) or structures (shade-providing structures, structures with forced air ventilation, evaporatively cooled and cold stores, and comparisons of traditional structures) (Fig. 3). Most of the interventions were on potato or yam; only 6.4% were on cassava.
In roots and tubers, quantity loss was measured as percentage overall loss, loss based on weight loss combined with decay and sprouting, and weight or water loss, except in one study. Quality loss measurements include percentages with decay, damage, infes-tation and unmarketable product (Supplementary Tables 4 and 5). Sprouting was analysed independently from decay because it tended to be inversely related. Storage durations ranged from 5 weeks to 44 weeks.
In potato, quantity and quality losses were less than 15.5% and 8.5%, respectively, when the tubers were stored in improved pits, cold rooms, store rooms, evaporatively cooled or well-ventilated structures, or heaps without the use of chlorpropham (Fig. 5a). Storage with chlorpropham reduced losses regardless of the storage structure, whereas losses were higher under ambient conditions or in a traditional structure.
The use of botanicals, essential oils, biocontrol, heat or irradia-tion resulted in less than 20% quantity loss in yams, but not all of these treatments had similar effects on quality losses (Fig. 5a). When no protectants were used, quantity losses were high (29.0–44.0%).
Irradiation reduced both quantity and quality losses, as well as sprouting. When curing was combined with a storage protectant, quality losses were low (10–14%).
Biological control approaches included two studies evaluat-ing Bacillus thuringiensis in potato storage in India and Nepal24,25, one assessing the performance of the predatory beetle Teretrius (Teretriosoma) nigrescens in protecting dried cassava chunks from attack by the larger grain borer during storage26 and one on storing yams in termitaria27.
Sixteen percent of the interventions studied handling prac-tice changes. These focused on the effect of harvesting from dif-ferent soil types and moisture contents, piecemeal versus once-off harvesting, and timing of harvest, among others (Supplementary Table 7). Harvesting cassava from moist, less compacted soil resulted in lower damage (21.6%) than from dry, compacted soils (44.6%)28. Soaking cassava chips in water before sun-drying or smoke-drying reduced weight loss to 23.9% after six months of storage compared with 96.4% in unsoaked stored chips29. Piecemeal harvesting (11.3%) resulted in lower losses in potato than once-off harvesting (37.1%)30. Delayed harvesting led to increased insect damage on sweet potato31,32, while dehaulming lessened decay in roughly handled sweet potato roots33. Sorting and storage of undam-aged yams led to no decay during 36 weeks of storage compared with 80–100% decay in yams with cuts34. In the only study on infra-structure, better road quality reduced losses of potato in Ethiopia35.
Fruits. In the fruit crops, quantity loss was measured as percent-age overall loss, water loss or weight loss. Quality loss was typi-cally expressed as percentage decayed, damaged or unmarketable. Other measurements reported in the studies were firmness, nutrient composition changes, assessment of visual quality and ripening stages. Unlike in cereal crop storage, where postharvest quantity loss can be directly correlated to some measures of qual-ity loss, an inverse relationship can exist in fruits and vegetables. For example, if water loss (quantity) is high, then decay (qual-ity) tends to be lower, and vice versa. This, along with the differ-ent storage durations and temperature conditions in each study, confounded comparisons.
For fruit crops, storage protectants accounted for 35.5% of the interventions, packaging 22.9%, and storage structures/containers 18.3%. Storage protectants focused on the use of waxes or coat-ings with or without fungicides, pesticides and heat treatments. Packaging interventions included fibreboard, wooden or plastic boxes with or without liners and padding, modified atmosphere packaging and shrink-wrapping. The storage structure interven-tions tested included evaporatively cooled structures, insulated rooms equipped with an air-conditioner controller with frost sen-sor override, and cold rooms. The less commonly evaluated inter-ventions were harvesting tools, harvest maturity, pre-cooling and ripening. Handling practices accounted for 5.6% of the interven-tions and included combined sets of improvements compared with traditional handling practices.
Most types of packaging reduced quantity loss in citrus, but when liners were used, quality loss was higher. For example, pack-ing in wooden boxes resulted in a 6.6% loss in quality, but when a liner was added, losses increased to 22.6% (Fig. 5b). This increase in decay was attributed to higher relative humidity. Shrink-wrapping reduced both quantity and quality loss. Storage protectant interven-tions for citrus were effective. With no protectant, fruits sustained high losses in quantity (34.3%) and quality (33.7%) (Fig. 5b). The use of waxes alone, with fungicides or with botanicals, reduced losses in both quantity and quality.
For mango, most storage protectant interventions reduced per-centage quality loss (usually decay), but this was not always associ-ated with a lower quantity loss (usually water loss) (Fig. 5b). Heat treatment (specifically hot water) (13.0%) and pesticides (16.6%)
Nature SuStaiNability | VOL 3 | OctOber 2020 | 821–835 | www.nature.com/natsustain 827

136 | Sustainable solutions to end hunger
Articles Nature SuStaiNability
0 20 40 60 80 100Improved pit (n = 3; n = 0)
Cold room (n = 8; n = 4)Pit + chemical (n = 3; n = 0)
Evap cooled structure + chemical (n = 1; n = 0)Shaded structure + chemical (n = 1; n = 0)
Store room or warehouse (n = 2; n = 1)Heap + chemical (n = 2; n = 0)
Evap cooled structure/container (n = 12; n = 9)Pit + ventilation (n = 1; n = 1)
Structure with forced air ventilation (n = 2; n = 1)Heap/pile/clamp (n = 13; n = 8)
Shaded structure (thatch, net etc.) (n = 6; n = 1)Pit/trench (n = 13; n = 3)
Ambient storage (n = 6; n = 6)Traditional structure (n = 1; n = 1)
Botanicals, essential oils etc. (n = 4; n = 2)Irradiation (n = 2; n = 0)
Biocontrol / Bacillus thuringiensis (n = 3; n = 3)Heat treatments (n = 1; n = 4)
Pesticide (n = 2; n = 3)Growth regulators (n = 9; n = 0)
No protectant (control) (n = 3; n = 6)Curing + irradiation (n = 0; n = 1)
Curing + irradiation + physical barrier (n = 0; n = 1)Curing + synthetic chemical (n = 0; n = 1)
Curing + physical barrier (n = 0; n = 1)Curing + irradiation + synthetic chemical (n = 0; n = 1)
Curing + no protectant (n = 0; n = 1)
Loss in quantity and quality (%)
Quantity loss (%)
Quality loss (decay, damage,infested, unmarketable) (%)
Yam
: sto
rage
pro
tect
ant
Pota
to: s
tora
ge s
truct
ure
a
0 10 20 30 40 50Plastic crates incl. RPC (n = 1; n = 0)
Modified atmosphere packaging (n = 2; n = 2)Baskets (all) (n = 1; n = 1)
Bags (n = 2; n = 1)Shrink wrap (n = 4; n = 4)
Cardboard/fibreboard cartons + liner (n = 5; n = 5)Wooden box + liner (n = 5; n = 5)
Wooden box/bulk bin (n = 4; n = 4)Not packed (n = 2; n = 1)
Baskets (all) + liner (n = 4; n = 4)Cardboard/fibreboard cartons/bulk bins (n = 7; n = 8)
Wax/coat + botanicals/essential oils (n = 5; n = 5)Botanicals, essential oils etc. (n = 3; n = 3)
Wax + fungicide (n = 19; n = 18)Wax/coating (n = 5; n = 9)
Pesticide (n = 0; n = 10)Growth regulators (n = 4; n = 4)
No protectant (control) (n = 7; n = 8)
Wax/coating (n = 2; n = 0)Heat treatments (n = 1; n = 1)
Integrated treatment (n = 0; n = 1)Fungicide + biocontrol (n = 0; n = 1)
Biocontrol / Bacillus thuringiensis (n = 0; n = 2)Wax + fungicide (n = 0; n = 1)
No protectant (control) (n = 2; n = 4)Pesticide (n = 0; n = 14)
Ash (n = 1; n = 0)
Loss in quantity and quality (%)
Quantity loss (%)
Quality loss (decay, damage,unmarketable) (%)
100
Citr
us:
stor
age
prot
ecta
ntC
itrus
:pa
ckag
ing
M
ango
:st
orag
e pr
otec
tant
b
0 10 20 30 40 50 60 70
Cold room (n = 1; n = 2)Structure with forced air ventilation (n = 3; n = 2)
Heap/pile/clamp (n = 1; n = 1)Store room or warehouse (n = 8; n = 4)
Traditional structure (n = 9; n = 9)Shaded structure (thatch, net etc.) (n = 14; n = 3)
Modified atmosphere packaging (n = 3; n = 1)Improved basket (n = 1; n = 1)
Shrink wrap (n = 2; n = 0)Plastic crates incl. RPC (n = 3; n = 2)
Plastic crates incl. RPC + liner (n = 4; n = 2)Baskets (all) (n = 3; n = 3)
Wooden box + liner (n = 6; n = 2)Wooden box (n = 3; n = 1)
Loss in quantity and quality (%)
Quantity loss (%)Quality loss (decay, damage,unmarketable) (%)
Tom
ato:
pac
kagi
ngO
nion
: sto
rage
stru
ctur
e
c
Fig. 5 | Quantity and quality losses associated with storage and packaging of roots and tubers, fruits and vegetables. a, Storage structures for potato and storage protectants in yam. b, Packaging for citrus and storage protectants in citrus and mango. c, Storage structures for onion and packaging for tomato. The mean percentage quantity loss (blue bars) and quality loss (red bars) and 95% CIs for the different interventions are listed. For each crop and intervention combination, the first n value indicates the number of examples of quantity loss data, while the second n refers to the quality loss data. The loss levels are dependent on numerous factors, including the conditions during the study, which can result in high heterogeneity between studies. The loss levels for each intervention need to be interpreted with caution, particularly where the n value is low. RPC, returnable plastic crates.
Nature SuStaiNability | VOL 3 | OCTObeR 2020 | 821–835 | www.nature.com/natsustain828
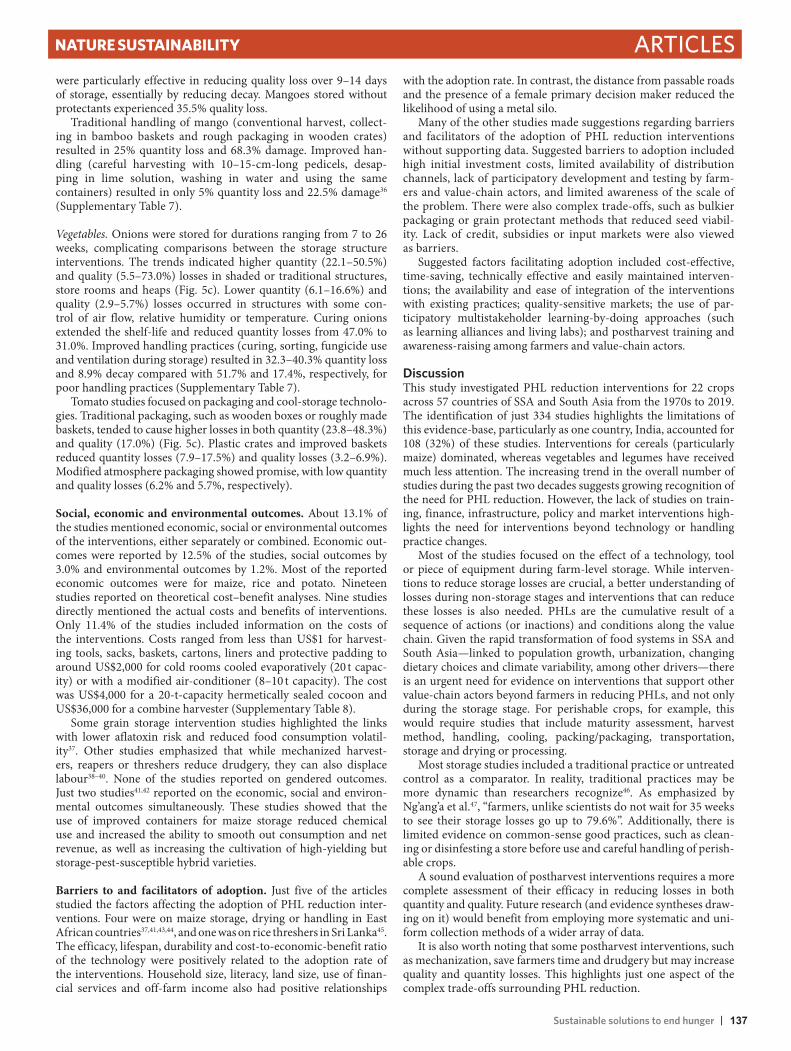
Sustainable solutions to end hunger | 137
ArticlesNature SuStaiNability
were particularly effective in reducing quality loss over 9–14 days of storage, essentially by reducing decay. Mangoes stored without protectants experienced 35.5% quality loss.
Traditional handling of mango (conventional harvest, collect-ing in bamboo baskets and rough packaging in wooden crates) resulted in 25% quantity loss and 68.3% damage. Improved han-dling (careful harvesting with 10–15-cm-long pedicels, desap-ping in lime solution, washing in water and using the same containers) resulted in only 5% quantity loss and 22.5% damage36 (Supplementary Table 7).
Vegetables. Onions were stored for durations ranging from 7 to 26 weeks, complicating comparisons between the storage structure interventions. The trends indicated higher quantity (22.1–50.5%) and quality (5.5–73.0%) losses in shaded or traditional structures, store rooms and heaps (Fig. 5c). Lower quantity (6.1–16.6%) and quality (2.9–5.7%) losses occurred in structures with some con-trol of air flow, relative humidity or temperature. Curing onions extended the shelf-life and reduced quantity losses from 47.0% to 31.0%. Improved handling practices (curing, sorting, fungicide use and ventilation during storage) resulted in 32.3–40.3% quantity loss and 8.9% decay compared with 51.7% and 17.4%, respectively, for poor handling practices (Supplementary Table 7).
Tomato studies focused on packaging and cool-storage technolo-gies. Traditional packaging, such as wooden boxes or roughly made baskets, tended to cause higher losses in both quantity (23.8–48.3%) and quality (17.0%) (Fig. 5c). Plastic crates and improved baskets reduced quantity losses (7.9–17.5%) and quality losses (3.2–6.9%). Modified atmosphere packaging showed promise, with low quantity and quality losses (6.2% and 5.7%, respectively).
Social, economic and environmental outcomes. About 13.1% of the studies mentioned economic, social or environmental outcomes of the interventions, either separately or combined. Economic out-comes were reported by 12.5% of the studies, social outcomes by 3.0% and environmental outcomes by 1.2%. Most of the reported economic outcomes were for maize, rice and potato. Nineteen studies reported on theoretical cost–benefit analyses. Nine studies directly mentioned the actual costs and benefits of interventions. Only 11.4% of the studies included information on the costs of the interventions. Costs ranged from less than US$1 for harvest-ing tools, sacks, baskets, cartons, liners and protective padding to around US$2,000 for cold rooms cooled evaporatively (20 t capac-ity) or with a modified air-conditioner (8–10 t capacity). The cost was US$4,000 for a 20-t-capacity hermetically sealed cocoon and US$36,000 for a combine harvester (Supplementary Table 8).
Some grain storage intervention studies highlighted the links with lower aflatoxin risk and reduced food consumption volatil-ity37. Other studies emphasized that while mechanized harvest-ers, reapers or threshers reduce drudgery, they can also displace labour38–40. None of the studies reported on gendered outcomes. Just two studies41,42 reported on the economic, social and environ-mental outcomes simultaneously. These studies showed that the use of improved containers for maize storage reduced chemical use and increased the ability to smooth out consumption and net revenue, as well as increasing the cultivation of high-yielding but storage-pest-susceptible hybrid varieties.
Barriers to and facilitators of adoption. Just five of the articles studied the factors affecting the adoption of PHL reduction inter-ventions. Four were on maize storage, drying or handling in East African countries37,41,43,44, and one was on rice threshers in Sri Lanka45. The efficacy, lifespan, durability and cost-to-economic-benefit ratio of the technology were positively related to the adoption rate of the interventions. Household size, literacy, land size, use of finan-cial services and off-farm income also had positive relationships
with the adoption rate. In contrast, the distance from passable roads and the presence of a female primary decision maker reduced the likelihood of using a metal silo.
Many of the other studies made suggestions regarding barriers and facilitators of the adoption of PHL reduction interventions without supporting data. Suggested barriers to adoption included high initial investment costs, limited availability of distribution channels, lack of participatory development and testing by farm-ers and value-chain actors, and limited awareness of the scale of the problem. There were also complex trade-offs, such as bulkier packaging or grain protectant methods that reduced seed viabil-ity. Lack of credit, subsidies or input markets were also viewed as barriers.
Suggested factors facilitating adoption included cost-effective, time-saving, technically effective and easily maintained interven-tions; the availability and ease of integration of the interventions with existing practices; quality-sensitive markets; the use of par-ticipatory multistakeholder learning-by-doing approaches (such as learning alliances and living labs); and postharvest training and awareness-raising among farmers and value-chain actors.
DiscussionThis study investigated PHL reduction interventions for 22 crops across 57 countries of SSA and South Asia from the 1970s to 2019. The identification of just 334 studies highlights the limitations of this evidence-base, particularly as one country, India, accounted for 108 (32%) of these studies. Interventions for cereals (particularly maize) dominated, whereas vegetables and legumes have received much less attention. The increasing trend in the overall number of studies during the past two decades suggests growing recognition of the need for PHL reduction. However, the lack of studies on train-ing, finance, infrastructure, policy and market interventions high-lights the need for interventions beyond technology or handling practice changes.
Most of the studies focused on the effect of a technology, tool or piece of equipment during farm-level storage. While interven-tions to reduce storage losses are crucial, a better understanding of losses during non-storage stages and interventions that can reduce these losses is also needed. PHLs are the cumulative result of a sequence of actions (or inactions) and conditions along the value chain. Given the rapid transformation of food systems in SSA and South Asia—linked to population growth, urbanization, changing dietary choices and climate variability, among other drivers—there is an urgent need for evidence on interventions that support other value-chain actors beyond farmers in reducing PHLs, and not only during the storage stage. For perishable crops, for example, this would require studies that include maturity assessment, harvest method, handling, cooling, packing/packaging, transportation, storage and drying or processing.
Most storage studies included a traditional practice or untreated control as a comparator. In reality, traditional practices may be more dynamic than researchers recognize46. As emphasized by Ng’ang’a et al.47, “farmers, unlike scientists do not wait for 35 weeks to see their storage losses go up to 79.6%”. Additionally, there is limited evidence on common-sense good practices, such as clean-ing or disinfesting a store before use and careful handling of perish-able crops.
A sound evaluation of postharvest interventions requires a more complete assessment of their efficacy in reducing losses in both quantity and quality. Future research (and evidence syntheses draw-ing on it) would benefit from employing more systematic and uni-form collection methods of a wider array of data.
It is also worth noting that some postharvest interventions, such as mechanization, save farmers time and drudgery but may increase quality and quantity losses. This highlights just one aspect of the complex trade-offs surrounding PHL reduction.
Nature SuStaiNability | VOL 3 | OctOber 2020 | 821–835 | www.nature.com/natsustain 829

138 | Sustainable solutions to end hunger
Articles Nature SuStaiNability
Drawing robust conclusions on the technical efficacy of many of the interventions is difficult because there are relatively few stud-ies of each intervention for each crop, and they vary in scale, dura-tion, type of loss data collected, location and context. Many studies were excluded because they used very small quantities of the crops, were conducted only in the laboratory or did not replicate the interventions. Most of the included studies involved only research-ers without any participation from farmers or other community members. Their participation could have provided experiential learning opportunities and built ownership. Even if technically effective in researcher-managed trials, such interventions may not be as effective in real life and may not be acceptable to or affordable for farmers. Additionally, more data on multiseason and multisite testing of interventions are required to provide a critical under-standing of their replicability and degree of variation. Loosening the inclusion criteria would increase the number of studies, but it would compromise the value and quality of evidence on which the synthesis was based.
Despite the systematic approach used and the recognition of the four principles (inclusive, rigorous, transparent and accessible) identified by Donnelly et al.48 for synthesizing evidence for poli-cymakers, the present evidence-base is subject to non-publication bias, as studies of less effective interventions would not have been widely shared. Furthermore, where there is no requirement for PhD or MSc theses or project reports to be registered in public databases, digital search strategies do not always identify these important sources of evidence. Several studies did not acknowl-edge all the treatment details. For example, the additional cost and effect of prior fumigation on grain storage interventions was rarely recognized. Details of the concentrations and application rates of active ingredients of protectants were not always avail-able, even though they are important for efficacy comparisons, as well as compliance with national product registration and safety regulations. Some grain storage trial durations were very short. The efficacy of the tested interventions may be different dur-ing the longer storage durations (six to ten months) required by many small-scale producers to ensure the availability of their staple grains between harvests and in response to increasingly
unpredictable climate11,41,49–54. Such issues highlight opportunities to support systems to improve PHL reduction research methods, data analyses and interpretation. Recent initiatives and funders’ forums set up to ensure value in medical research may offer pros-pects for cross-learning55.
Well-designed, multidisciplinary, measured field studies should analyse the links between reductions in different types of loss and their social, economic and environmental outcomes. This will sup-port better understanding for the development, adoption and pro-motion of PHL reduction interventions in their various forms, such as technologies, policies, training, infrastructure and combinations of these. There is also a need to understand the factors that facilitate or constrain the adoption of interventions. A small body of litera-ture exists on this, although much of it is focused on the adoption of relatively expensive interventions43,56–60. Cost, access, ease of use and reuse, cultural acceptability, one-time subsidies, willingness to pay, scale, awareness and demonstrations, and training are just some of the factors influencing the uptake of PHL reduction interventions along with technical efficacy11,46,61–73.
Notwithstanding the limited size of the evidence-base, the effi-cacy of a number of interventions in reducing PHLs was recog-nized. A summary of these notable interventions and critical gaps in the evidence-base is presented in Table 1, followed by a set of policy recommendations (Box 2). A deeper analysis of the dataset is available from the authors, and the interactive database at https://PHCeres2030.net/, which will be updated biannually, provides users with an opportunity to identify relevant studies and better tailor the data outputs to their specific needs.
This evidence-based analysis demonstrates that future PHL reduction research and investments need to be expanded to include a more diverse range of food crops, food systems actors and postharvest activity stages. Future research and investments should also cover combinations of training, finance, infrastructure, policy and market interventions that go beyond tangible technolo-gies and handling practice changes. Besides a more participatory study of the technical efficacy of interventions, there is also a need to explore social, economic and environmental outcomes, and barriers and facilitating factors to adoption to inform policy
table 1 | Summary of the PHL reduction interventions evidence-base for SSA and South Asia
Technically effective interventions Critical gaps in the evidence-base
Technologies, tools and equipment Handling practices
Cereals Maize storage: in hermetic containers or admixed with some synthetic chemicals or DEsWheat, rice or sorghum storage: in hermetic containers or underground pits, or admixed with some synthetic chemicals, botanicals or DEs
Timely harvesting, protecting crops from direct ground contact while drying
• Interventions for loss reduction in the non-storage activity stages• Any evaluation of training, policy, infrastructure,finance interventions on loss reduction• Effects of sanitation, grain cleaning and timing of activities on subsequent losses• Verified measured socio-economic or environmental outcomes of the uptakeof different PHL reduction interventionsat any scale• Factors facilitating and constraining the adoption of PHL reduction interventions• Stakeholder participation in the study of interventions to facilitate co-innovation and co-learning, and the need for more real-world scale on-farm participatory studies• Standardized loss measurement metrics• Consistency of intervention results confirmed through multiseason and multilocation studies
Legumes Storage in hermetic containers or admixed with synthetic chemicals, botanicals, DEs or edible oil
Protecting crops from direct ground contact while drying, sorting to remove mouldy grains
Roots and tubers Use of digging tools that reduce harvesting damage, use of improved storage containers, ventilated storage, evaporative cool storage, cold storage, sprout suppressants
Piecemeal harvesting, curing, sorting to remove damaged roots or tubers, avoidance of rough handling, use of maturity indices
Fruits Harvesting poles/pickers, use of improved packaging, waxing (alone or with fungicides or botanicals), hot-water treatments, evaporative cool storage, cold storage, ripening treatments
Use of maturity indices, gentle harvesting and handling, sorting to remove damaged fruits
Vegetables Use of improved packaging, evaporative cool storage, ventilated storage (onions), cold storage
Gentle handling, curing (onions)
The interventions for which sufficient evidence existed of their efficacy in reducing PHLs are listed for each crop group. These interventions were either of the technologies/tools/equipment type or of the handling practices type, and they predominantly focused on reducing losses during the crop storage stage. Critical gaps identified in the evidence base for all crop groups are listed in the final column.
Nature SuStaiNability | VOL 3 | OCTObER 2020 | 821–835 | www.nature.com/natsustain830

Sustainable solutions to end hunger | 139
ArticlesNature SuStaiNability
and guide investments that can drive PHL reduction in food systems at scale.
MethodsResearch question. The research was guided by the main question: what are the interventions that small-scale producers and associated value-chain actors in SSA and South Asian countries can adopt or adapt to reduce PHLs along food crop value chains? A secondary research question was: what are the associated barriers and facilitating factors for adoption of the interventions?
This analysis focused on SSA and South Asia, both regions with large populations of small-scale producers dependent on local food systems and where PHLs and the incidence of poverty are relatively high. Interventions applicable to small-scale food producers and/or their associated value-chain actors such as aggregators, packers, operators of driers, threshers, chippers, transporters, processors, traders, and other service providers (for example, training, extension, financial and market information services) were targeted to meet the food demands in these regions. Narrowing the focus to 22 key food crops from five crop groups (cereals—maize, rice, sorghum and wheat; legumes—beans, cowpeas, pigeon peas, chickpeas and groundnuts; roots and tubers—cassava, potato, sweet potato and yam; fruits—plantain, banana, mango, papaya and all citrus fruits including orange, lemon, lime and mandarin; and vegetables—cabbage, onion, tomato and leafy vegetable) allowed for deeper analysis. There were no prior specifications of the types of interventions, as any interventions that apply to PHL reduction in food crop value chains are relevant, including training, information, handling practices, skills, institutional changes, financial interventions, policies, postharvest infrastructure, tangible technologies and any combinations of these.
To measure the effectiveness of the interventions, comparisons included those between different interventions, between adopters and non-adopters, and between pre- and post-adoption of an intervention. The comparisons could be vis-à-vis their technical, economic, environmental or social efficacy and outcomes. Intervention efficacy was evaluated by the level of PHL that occurred as well as the reduction in PHL compared with the traditional practice or untreated control in each study.
To ensure consistency during screening, key terms such as ‘postharvest’, ‘loss’, ‘adopt’, ‘intervention’, ‘field-tested postharvest interventions’, ‘small-scale food
producers’ associated value-chain actors’ and ‘food crop value chain’ were defined. The definitions are given in Supplementary Table 9.
Search strategy. A comprehensive search strategy was developed to identify the relevant published and grey literature. The search terms included variations of the key concepts in the research question: PHLs in quantity or quality, postharvest activity stages, PHL causing factors, focal food crops and focal countries. The search strings used are shown in Supplementary Table 10a–c. The following online databases of peer-reviewed publications were sequentially searched on 27 May 2019: CAB Abstracts (date coverage, 1973–2019), Web of Science Core Collection (date coverage, 1900–2019) and Scopus. These searches returned 8,880 records, 3,570 records, and 315 records, respectively, after screening for duplicates using Zotero bibliographic software. The searches were not limited by date or language. However, the search terms were done only in English. The search strategy was pretested and refined, and it used eight benchmark articles to maximize its comprehensiveness (Supplementary Table 11). However, three of the eight benchmark articles (a 1991 Acta Horticulturae study and two grey literature reports) were not indexed and were not accessible in any of the databases searched. In addition, 47 electronic database and grey literature sources identified by the postharvest team members were searched by librarians on 24 May 2019 (Supplementary Table 12). These grey literature searches involved various combinations of the following terms: ‘post-harvest’, ‘post-harvest loss’, ‘post harvest losses’, ‘post harvest’, ‘postharvest’, ‘value chain’, ‘crops’ and ‘food’. After searching, the results were screened to ensure that ‘postharvest’ and ‘loss’ were found in each report. These searches returned 1,811 records, which were combined with those from the databases to give 14,576 records, which were deduplicated using a Python (v.3.8.0) script. Duplicates were detected using the title, abstract and year of publication, where the year of publication was a match, the title cosine similarity was greater than 85% and the abstract cosine similarity was greater than 80% (or one or both of the abstracts was missing). When this occurred, the duplicate entry was removed. CAB Abstracts was the priority source of record. In contrast to the PHL review in six SSA countries by Affognon et al.11, where grey literature physically acquired through national teams made up 57.3% of the documents, the current study’s digital search strategy captured relatively few PhD/MSc theses, working papers or project reports.
The bibliographic details for each of the resulting 12,786 peer-reviewed and grey literature documents were exported into MS Excel (v.2002) for machine
box 2 | Policy and investment recommendations
• Studies should be conducted to increase the available data onPHL reduction interventions, particularly for legumes, smallgrains, root and tuber crops, fruits, and vegetables. Notablyeffective PHL reduction interventions, along with critical gapsin the evidence-base, are presented in Table 1.
• Future studies should include the non-storage activities in thevalue chain and the key actors (such as farmers, traders, trans-porters and wholesalers), because to date the focus has beenpredominantly on tangible technical interventions to reducelosses during farmer-level storage.
• The limited evidence on PHL reduction interventions can beextrapolated to similar crops within each crop group, withparticipatory field-level studies to confirm and expand theevidence.
• The effects of training, finance, policy and infrastructureinterventions on PHL reduction need to be studied to guideinvestments.
• More evidence is needed regarding verified socio- economic and environmental outcomes of PHL reductioninterventions, because to date the focus has been on theirtechnical efficacy.
• More evidence is needed on the efficacy of PHL reductioninterventions, particularly when technologies are combinedwith interventions such as training, changes in handling prac-tices, access to finance and policies.
• Future studies would benefit from collecting a wider arrayof data using uniform and more systematic methods to cap-ture the quantitative, qualitative and socio-economic aspectsof PHLs.
• For improved postharvest management and loss reduction,there is a need for:
1. Greater efforts to raise the awareness of stakeholders ofthe ability to reduce losses and the benefits of doing so2. Recognition that all technologies have strengths andweaknesses and that due to the heterogeneity betweenhouseholds, agro-ecologies and crops, one-size-fits-all so-lutions are unlikely to be successful3. Technical solutions to be simultaneously promotedalongside good postharvest training and management tobuild understanding of why losses are occurring, how thetechnologies can best be used and the local costs and ex-pected benefits of interventions4. More study of how national policies, financial access and infrastructure investments affect PHL reduction5. Implementation of policies that support quality-sensitive markets to provide incentives for PHL reduction6. Multistakeholder postharvest platforms or institutionsto promote co-learning and co-innovation, support accessto information, and support multilocation and multisea-son studies with active participation of stakeholders alongthe commodity value chains
• Targeting of the aforementioned recommendations may beneeded depending on limitations of financial resources andinformation, and whether the main objective for reducingPHLs is improved food security and nutrition or lower envi-ronmental impacts.
Nature SuStaiNability | VOL 3 | OctOber 2020 | 821–835 | www.nature.com/natsustain 831

140 | Sustainable solutions to end hunger
Articles Nature SuStaiNability
processing before title and abstract screening by the team. A second search phase of the three online literature databases for the year 2019 was done on 30 October 2019 to ensure that the evidence-base was as current as possible. The search returned 84, 52 and 15 records from CAB Abstracts, Web of Science and Scopus, respectively. After deduplication, 121 additional studies remained for screening.
Study inclusion and exclusion criteria. The following exclusion criteria were applied to the title and abstract and the full-text review stages.• Irrelevant crop: study does not include a PHL reduction intervention for one
of the 22 focal food crops.• Irrelevant geographical area: study does not take place in the target geographi-
cal area of SSA and South Asia.• Irrelevant target actor: study is not relevant to PHL reduction by small-scale
producers or their associated value-chain actors.• Irrelevant study type: study is a review or does not contain any origi-
nal research or sufficient details on the original research to make an evidence-based decision about the intervention’s efficacy.
• Irrelevant data output: study does not report the effect of an interventionon PHL.
• Irrelevant scale of study: study reports the effect of an intervention that was not tested at the field level or in a real-world context. In other words, the inter-vention was tested only at a small scale in a laboratory or tested in the field or on-station but with a treatment replicate size too small to provide reliable data on which to base investment decision-making. In the studies of the durable crops, interventions on maize using less than 50 kg per treatment replicate were excluded, while for sorghum, rice and wheat studies, those with less than 25 kg per treatment replicate were excluded. For the five legume crops, studies with less than 10 kg per treatment replicate were excluded. Additionally, interventions were excluded where stored crops were artificially infested with insects, fungi or bacteria, or where crops were frozen before study to disinfest them. If the study had crops that had been fumigated before the intervention, the study was included. The fumigation aspect was then added to the intervention’s description. In the studies of the perishable crops, those with less than 20 kg per treatment for roots and tubers and with less than 10 kg per treatment for fruits and vegetables were excluded. For studies where the number of fruits was stated but the weight was not, we used a typical weight for that produce type to determine inclusion or exclusion. Studies that failed to state the size used in the treatments and where the size could not be inferred from the data were excluded. For some studies, in which the interventions were evaluated on a range of different grades or varieties, the results were averaged to achieve the weight expectations required for inclusion.
• Language: studies written in a language other than English or Frenchwere excluded.
• Date: no date restrictions were applied, but the searches were limited due to the coverage of the individual databases searched.
Title and abstract screening. The titles and abstracts of the search outputs were auto-coded by semantic machine-learning models and then prescreened by six team members in MS Excel using filters and a Python script to expedite the identification and exclusion of studies not related to the focal crops or geographies. The auto-coded fields—topics, countries, plant and animal products, populations, outcomes, interventions (technology, socio-economic, ecosystem, storage and mechanization) and measurements for interventions and for crops—were intended to help derive metadata from the individual citations for later sensitivity analyses and expedite the process of synthesizing the evidence. However, these fields were not found to be sufficiently accurate for this study. For example, the machine could not distinguish between countries mentioned in the title, abstract, bibliographic information or organism names (for example, Rhyzopertha dominica) and the country where the study happened, as it could not understand the context. Further training of the machine in close collaboration with expert researchers would improve the utility of the auto-coded outputs, but the rapid start-up and tight time frame of this study meant that building a more contextual base to train the machine was out of our scope.
The auto-coded search outputs were then imported into the web-based software platform Covidence for screening. Those studies identified for exclusion during the prescreening filtering (that is, wrong crop or wrong country) were then manually excluded on Covidence. For each of the 12,786 studies, the title and abstract were screened independently by two of the postharvest researchers. The eligibility criteria were used to decide which of the studies to include. Where there was uncertainty, the study was assigned to the ‘maybe’ category. If the reviewers’ independent scoring disagreed or if the study was placed in the ‘maybe’ category, a third reviewer screened the title and abstract and made the final decision. To align the scoring, the first 20 disputed studies were discussed by the screening team to develop consistency. In cases where there was insufficient information in the title or abstract to exclude the study, the study was included so that the decision could be made at the full-text-screening stage. Filters in Covidence were used to search for studies on the specific focal crops, and two or three members of the team of five postharvest researchers screened the studies for each crop group. There were many
irrelevant studies in the initial library (for example, studies on cocoa or coffee beans, silage or soil; reviews; and studies from other countries and languages), and filters were used to search for and exclude them. The titles and abstracts of the additional 121 studies from 2019 were double-screened using MS Excel, and the reasons for exclusion were recorded. The use of Covidence for the title and abstract screening enabled the records to be double-blind screened and the decision on whether to include them to be captured. However, it did not enable the reasons for exclusion to be recorded.
Full-text article screening. A total of 1,887 studies from the initial search and 19 from the 2019 updated search were selected for full-text article screening. The full texts were sourced by the librarian team members from July to December 2019. They were grouped into six batches on the basis of the timing of their acquisition. The full-text PDFs for each batch were placed in the team’s Google Drive folder, and the MS Excel list of titles and abstracts in each batch was further machine-processed to assist in identifying the perishable and durable crop studies to help divide the articles between the screening members of the team. After reading each assigned article, the screening team members recorded their decisions in their MS Excel sheet. For the excluded studies, the reason for exclusion was recorded. This information was later entered into Covidence to produce the summary data on inclusion rates and exclusion reasons (Extended Data Fig. 1). If there was uncertainty regarding the inclusion of a study, it was checked and discussed with at least one other member of the team. Fleiss’ kappa score was used to measure the level of agreement between screeners and gave a score of 0.659 for the three main screeners, who screened 83% of the 1,788 available full-text articles, indicating that the level of agreement was substantial (0.61–0.80)74.
The coding framework was developed and trialled by the researchers using four of the benchmark studies, followed by discussions and amendments before finalizing and registering the protocol on the Open Science Framework at https://osf.io/6zc92/ (Supplementary Table 2). An interactive SQL database and web app were built on the basis of the coding framework for entry of the relevant data extracted from each of the studies. This database is available for policymakers to explore the results.
Due to uncertainty regarding how many of the 12,786 records from the initial search would be included, a two-part full-text coding approach was initially planned. However, due to the time it took to obtain PDF copies of the 1,887 full texts and the short time frame available for the evidence synthesis, it was not feasible to wait for Part I screening of all the included full-text articles to be done to randomly select a sample of the included studies from across the different postharvest stages, crops and geographies. The Part II data extraction would have been conducted from this sample. After the full texts of batches 1 and 2 were screened, the inclusion rate was around 20%, so the team decided to do the Part I and II data extraction on all the included full-text studies after the screening of each batch.
The relevant data were extracted into the database using drop-down menus based on the coding framework categories. The database structure was finalized in October 2019. In hindsight, the database should have included more options for the quality loss data, as more than one set of measurements was often available (for example, percentage damage, percentage decay, percentage sprouting, percentage germination and aflatoxin content). Each included study was coded by one reviewer for Part I and II data extraction, and any uncertainties were discussed. Three of the researchers extracted the data for 88% of the studies. For the 40 studies where data were extracted by other team members, one of the three main data-extracting researchers then went through them in the database to check and standardize data capture across the 334 included studies.
In addition to its bibliographic information, the researchers extracted data for each article using a two-part coding framework (Supplementary Table 2). Part I data comprised the following: geographic locations (country, region and village), focal crops, crop form (fresh, dried, shelled or on the cob), focal postharvest activities (harvesting, handling, field drying, transport to homestead, curing, cooling, further drying, threshing/shelling, milling, packing, storing dry, storing fresh, transport to market and wholesale market), targeted postharvest actors (small-scale producers/point of production; packers and processors; service providers of harvesting, drying, milling, storage and transport; and traders, middlemen or collectors), type of study (field or on-farm trial, on-station trial or survey), study method (quantitative, qualitative, survey or mixed), study design (comparison with traditional practices, other types of intervention, non-adopters or pre- and post-adoption) and funding source. The classification of the interventions was based on a four-tier hierarchical system, with the first tier being the intervention type (technology/tool/equipment, handling practice change, training/extension, finance, policy, markets, support or infrastructure). These were further divided into a second tier, intervention stage, where the interventions were grouped into typical postharvest stages (for example, harvesting, drying and storage). Tier 3 consisted of specific interventions (for example, zero-energy cool chamber and traditional granary plus synthetic chemical) (Supplementary Table 3). Detailed descriptions of the intervention were then provided in tier 4 (for example, name and application rate of the agricultural chemical, size of the box or specific details of the traditional granary). Tier 4 was included for reference but not used in the data synthesis. In Part II, the following were captured: the PHL measurements
Nature SuStaiNability | VOL 3 | OctOber 2020 | 821–835 | www.nature.com/natsustain832

Sustainable solutions to end hunger | 141
ArticlesNature SuStaiNability
of quantity or quality; facilitators and barriers for adoption; study design, duration and scale; intervention cost; and any assessment of any social, economic or environmental outcomes associated with the interventions.
Thanks to programming expertise within the team, machine-scraped sections of the PDF files were placed in special fields in the database to support faster data extraction. However, the research team found that for accuracy and comprehension, validation still required reading of the paper and manual extraction of the required content. Moreover, the challenge in this body of literature has been that authors often use terms interchangeably, making codifying context difficult. In addition, given that this exercise in assessment is still new, building the knowledge base to train algorithms to function more accurately is a process that takes years. Given the complex and nuanced understanding required, we do not yet have machines that can sufficiently and accurately identify or automatically extract the relevant information from complicated postharvest research studies. But if leveraged correctly, this dataset can be used to build a more effective algorithm.
Data synthesis. The captured data were downloaded into MS Excel and synthesized using pivot tables. The meta-analysis was conducted at both the study level and the intervention level. A few studies covered multiple crops, multiple countries or multiple postharvest activity stages. Each study reported on at least 2 and as many as 24 interventions. For the meta-analysis, the means of the quantity and quality loss figures for the interventions (tier 3) were pooled. If n > 2, the confidence limits (95%) were calculated for these pooled means, and the data were presented within the relevant tier 1 and 2 categories. For storage method interventions for durable crops (that is, dried cereals and legumes), the quantity and quality loss data were adjusted to a standardized storage time of 6 months for cereals and 4.5 months for legumes to facilitate comparisons and represent typical storage durations for these crops in these geographical regions. The data on storage methods for perishable crops were presented without adjusting for storage time. Temperature is the most important factor affecting the storage life of perishable crops, and its effects are not linear. The wide range in treatment temperatures used in the studies (from <5 °C to >38 °C) made standardization by storage time for perishable crops inappropriate, even for ambient conditions. Multiple comparisons of the mean quantity and quality loss data for storage interventions of the durable crops were conducted. The Least Significant Difference test function in the R agricolae package75,76 was applied to the output of a one-way analysis of variance using a Holm-corrected least significant difference method to generate groups of means that do not differ significantly at P < 0.05. There were insufficient data on perishable crop interventions for further analysis.
The searchable SQL database was created to facilitate interactive data visualization, given the numerous dimensions of the challenge and the scope of the interventions. The database provides a simple way for users to filter the dataset by data fields such as crop, country and postharvest activity stage for further analysis. Users can also access the bibliographic information and intervention loss datasets for single or multiple studies. The database provides cross-tabulations and a series of graphs.
Data availabilityThe data that support the findings of this analysis are available upon request. The bibliographic details of the 334 included studies are listed in Supplementary Table 1, and the searchable database is available at https://PHCeres2030.net/.
Code availabilityThe title and abstract deduplication code is available at https://github.com/MariyaIvanina/ArticlesDeduplicator. Outputs from the model used for machine-processing of titles and abstracts in this Ceres2030 evidence-synthesis study can be provided by J. Porciello (e-mail: [email protected]) upon request.
Received: 1 March 2020; Accepted: 8 September 2020; Published online: 12 October 2020
References 1. World Population Prospects 2019 (UNDESA, 2019). 2. Alexandratos, N. & Bruinsma, J. World Agriculture Towards 2030/2050:
The 2012 Revision ESA Working Paper No. 12-03 (FAO, 2012). 3. FAO, IFAD, UNICEF, WFP & WHO The State of Food Security and
Nutrition in the World 2017: Building Resilience for Peace and Food Security(FAO, 2017); http://www.fao.org/3/a-i7695e.pdf
4. The State of Food Security and Nutrition in the World 2019: SafeguardingAgainst Economic Slowdowns and Downturns (FAO, 2019); http://www.fao.org/3/ca5162en/ca5162en.pdf
5. World Bank, NRI & FAO Missing Food: The Case of Postharvest Grain Lossesin Sub-Saharan Africa Report No., 60371-AFR (World Bank, 2011); http://siteresources.worldbank.org/INTARD/Resources/MissingFoods10_web.pdf
6. Hodges, R. J., Buzby, J. C. & Bennett, B. Postharvest losses and waste indeveloped and less developed countries: opportunities to improve resourceuse. J. Agric. Sci. 149, 37–45 (2011).
7. Kitinoja, L., Saran, S., Roy, S. K. & Kader, A. A. Postharvest technology fordeveloping countries: challenges and opportunities in research, outreach andadvocacy. J. Sci. Food Agric. 91, 597–603 (2011).
8. Mutungi, C. & Affognon, H. Gaps and Outlook for Postharvest Research andInnovation in Ghana Policy Brief No. 4(13) (ICIPE, 2013); http://hdl.handle.net/10625/52221
9. Reducing Global Food Waste and Spoilage: A Rockefeller FoundationInitiative—Assessing Resources Needed and Available to Reduce PostharvestFood Loss in Africa (Global Knowledge Initiative, 2014); https://go.nature.com/33hunKg
10. Mvumi, B. M. & Stathers, T. E. Food security challenges in sub-SaharanAfrica: the potential contribution of postharvest skills, science and technologyin closing the gap. In Proc. 11th IWCSPP (eds Arthur, F. H. et al.) 32–43(Department of Agriculture, Ministry of Agriculture and Cooperatives, 2014).
11. Affognon, H., Mutungi, C., Sanginga, P. & Borgemeister, C. Unpackingpostharvest losses in sub-Saharan Africa: a meta-analysis. World Dev. 66, 49–68 (2015).
12. Hansen, A. R., Keenan, C. & Sidhu, G. Nutritious Food Foresight: Twelve Waysto Invest in Good Food in Emerging Markets (Global Knowledge Initiative,2019); https://go.nature.com/2GkRxq1
13. Stathers, T. & Mvumi, B. M. in Preventing Food Losses and Waste to AchieveFood Security and Sustainability (ed. Yahia, E. M.) Ch. 27 (Burleigh DoddsScience, 2020).
14. United Nations Sustainable Development Goals (United Nations, 2015);https://sustainabledevelopment.un.org/topics/sustainabledevelopmentgoals#
15. African Union Malabo Declaration on Accelerated Growth and Transformationfor Shared Prosperity and Improved Livelihoods (ReSAKSS, IFPRI, 2014);https://go.nature.com/2SdnVO7
16. The State of Food and Agriculture 2019: Moving Forward on Food Loss andWaste Reduction (FAO, 2019); http://www.fao.org/3/ca6030en/ca6030en.pdf
17. Coyne, F. P. Improving the protection of stored maize from insect attack onsmall farms in Kenya. International Pest Control 8–13 (May/June 1971).
18. Holst, N., Meikle, W. G. & Markham, R. H. Grain injury models forProstephanus truncatus (Coleoptera: Bostrichidae) and Sitophilus zeamais(Coleoptera: Curculionidae) in rural maize stores in West Africa. J. Econ.Entomol. 93, 1338–1346 (2000).
19. Caswell, G. H. The development and extension of nonchemical controltechniques for stored cowpeas in Nigeria. In Proc. 1st InternationalWorking Conference on Stored-Product Entomology (eds Brady, E. U. et al.)63–67 (1975).
20. Nahdy, M. S. & Agona, A. Studies on the control of the bean bruchidsAcanthoscelides obtectus (Say) and Zabrotes subfasciatus (Boheman)(Coleoptera: Bruchidae) in the East African region CIAT African WorkshopSeries 27, 50–59 (CIAT, 1992).
21. Turner, P. C. et al. Reduction in exposure to carcinogenic aflatoxins bypostharvest intervention measures in west Africa: a community-basedintervention study. Lancet 365, 1950–1956 (2005).
22. Palanisami, A., Manickam, A. & Neelakantan, S. Fungal flora and aflatoxinproduction in relation to post-harvest practices in groundnut. Madras Agric.J. 1, 26–31 (1990).
23. Xu, Y. et al. Study of an educational hand sorting interventionfor reducing aflatoxin B1 in groundnuts in rural Gambia. J. Food Prot. 80, 44–49 (2017).
24. Lal, L. Studies on natural repellents against potato tuber moth (Phthorimaea operculella Zeller) in country stores. Potato Res. 2, 329–334 (1987).
25. Giri, Y. P. et al. Efficacy of botanicals and Bacillus thuringiensis to controlpotato tuber moth, Phthorimaea operculella (Zeller), in potato storage inNepal. In Proc. 15th Triennial Symposium of the International Society forTropical Root Crops 163–170 (ISTRC, CIP, Universidad Nacional Agraria LaMolina, 2009).
26. Hell, K., Lamboni, Y., Houndekon, T. & Alidou, G. M. Augmented release ofTeretrius nigrescens Lewis (Coleoptera: Histeridae) for the control ofProstephanus truncatus (Horn) (Coleoptera: Bostrichidae) in stored cassavachips. J. Stored Prod. Res. 3, 367–376 (2006).
27. Afolabi, J. F., Akano, D. A. & Atanda, O. O. The use of termitaria in reducinglosses in stored yams. Trop. Sci. 37, 71–74 (1997).
28. Ayemou-Allou, A. S., Tschannen, A., Allou, D. & Assa, A. Influence of threesoil physical parameters on the harvesting of cassava (Manihot esculentaCrantz) in central Cote d’Ivoire. J. Appl. Biosci. 9, 416–423 (2008).
29. Tata-Hangy, K. & Lutete, D. Observations on the effects of different methodsof processing cassava chips on chips damage due to insect attacks duringstorage. Tropicultura 15, 173–176 (1997).
30. Katundu, M., Hendriks, S., Bower, J. & Siwela, M. Can sequential harvestinghelp small holder organic farmers meet consumer expectations for organicpotatoes? Food Qual. Prefer. 4, 379–384 (2010).
31. Smit, N. E. J. M. The effect of the indigenous cultural practices of in-groundstorage and piecemeal harvesting of sweetpotato on yield and qualitylosses caused by sweetpotato weevil in Uganda. Agric. Ecosyst. Environ. 64, 191–200 (1997).
Nature SuStaiNability | VOL 3 | OctOber 2020 | 821–835 | www.nature.com/natsustain 833
142 | Sustainable solutions to end hunger
Articles Nature SuStaiNability
32. Fite, T., Getu, E. & Sori, W. Integrated management of sweetpotato weevil,Cylas puncticollis (Boheman) (Coleoptera: Curculionidae) in Eastern Ethiopia.J. Entomol. 11, 225–237 (2014).
33. Tomlins, K. I., Ndunguru, G. T., Rwiza, E. & Westby, J. Influence ofpre-harvest curing and mechanical injury on the quality and shelf-life ofsweet potato (Ipomoea batatas (L.) Lam) in East Africa. J. Hortic. Sci.Biotechnol. 77, 399–403 (2002).
34. Mozie, O. Evaluation of weight losses and rate of rotting due to mechanicalinjuries sustained during harvesting of white yam (Dioscorea rotundata) stored in the conventional barn. Trop. Root Tuber Crops Newsl. 12/13, 18–21 (1981/1982).
35. Kuyu, C. G., Yetenayet, B. T. & Gemechu, G. A. Study on post-harvestquantitative and qualitative losses of potato tubers from two different roadaccess districts of Jimma zone, South West Ethiopia. Heliyon 5, e02272 (2019).
36. Mazhar, M. S., Amin, M., Malik, A. E., Campbell, J. & Johnson, P. Improvedharvest and desapping practices affect mango fruit quality along the supplychains. Int. J. Agric. Biol. 13, 776–780 (2011).
37. Gitonga, Z., de Groote, H. & Tefera, T. Metal silo grain storagetechnology and household food security in Kenya. J. Dev. Agric. Econ. 7, 222–230 (2015).
38. Mahrouf, A. R. M. & Rafeek, M. I. M. Mechanization of paddy harvesting:the economic perspective. Ann. Sri Lanka Dep. Agric. 5, 161–172 (2003).
39. Basavarajappa, D. N., Chinnappa, B. & Sannathimmappa, H. G. Farmmachinery: the economics of paddy harvesting. Int. J. Agric. Eng. 6, 240–243 (2013).
40. Alam, M. A., Hossen, A., Islam, A. K. M. S. & Alam, M. Performanceevaluation of power-operated reapers for harvesting rice at farmers’ field.J. Bangladesh Agric. Univ. 16, 144–150 (2018).
41. Gitonga, Z. M., de Groote, H., Kassie, M. & Tefera, T. Impact of metal siloson households’ maize storage, storage losses and food security: an applicationof a propensity score matching. Food Policy 43, 44–55 (2013).
42. Omotilewa, O. J., Ricker-Gilbert, J., Ainembabazi, J. H. & Shively, G. E.Does improved storage technology promote modern input use and foodsecurity? Evidence from a randomized trial in Uganda. J. Dev. Econ. 135, 176–198 (2018).
43. Mwebaze, P. & Mugisha, J. Adoption, utilisation and economic impacts ofimproved post-harvest technologies in maize production in Kapchorwadistrict, Uganda. Int. J. Postharvest Technol. Innov. 2, 301–327 (2011).
44. Chegere, M. J. Post-harvest losses reduction by small-scale maize farmers: therole of handling practices. Food Policy 77, 103–115 (2018).
45. Prasanna, P. H. S. N., Gunaratne, L. H. P. & Withana, W. D. R. S. Economicanalysis of paddy threshing methods. Sri Lankan J. Agric. Econ. 6, 51–66 (2004).
46. Ndegwa, M. K., de Groote, H., Gitonga, Z. M. & Bruce, A. Y. Effectivenessand economics of hermetic bags for maize storage: results of a randomizedcontrolled trial in Kenya. Crop Prot. 90, 17–26 (2016).
47. Ng’ang’a, J., Mutungi, C., Imathiu, S. M. & Affognon, H. Low permeabilitytriple-layer plastic bags prevent losses of maize caused by insect in ruralon-farm stores. Food Secur. 8, 621–633 (2016).
48. Donnelly, C. A. et al. Four principles to make evidence synthesis more usefulfor policy. Nature 558, 361–364 (2018).
49. Mvumi, B. M., Giga, D. P. & Chiuswa, D. V. The maize (Zea mays L.)post-production practices of smallholder farmers in Zimbabwe: findings fromsurveys. J. Appl. Sci. South. Afr. 1, 115–130 (1995).
50. Stathers, T. E. et al. Do diatomaceous earths have potential as grainprotectants for small-holder farmers in sub-Saharan Africa? The case ofTanzania. Crop Prot. 27, 44–70 (2008).
51. Waongo, A., Yamkoulga, M., Dabire-Binso, C. L., Ba, M. N. & Sanon, A.Conservation post-recolte des cereals en zone sud-soudanienne du BurkinaFaso: perception paysanne et evaluation des stocks. Int. J. Biol. Chem. Sci. 7, 1157–1167 (2013).
52. Stathers, T., Lamboll, R. & Mvumi, B. M. Postharvest agriculture in changingclimates: its importance to African smallholder farmers. Food Secur. 5, 361–392 (2013).
53. Abass, A. B. et al. Post-harvest food losses in a maize-based farmingsystem of semi-arid savannah areas of Tanzania. J. Stored Prod. Res. 57, 49–57 (2014).
54. Baoua, I. B. et al. Grain storage and insect pests of stored grain in ruralNiger. J. Stored Prod. Res. 64, 8–12 (2015).
55. Glasziou, P. & Chalmers, I. Research waste is still a scandal—an essay by PaulGlasziou and Iain Chalmers. BMJ 363, k4645 (2018).
56. Bokusheva, R. et al. Factors determining the adoption and impact of apostharvest storage technology. Food Secur. 4, 279–293 (2012).
57. Villane, B. R. T., Shongwe, M. I., Motsa, N. M. & Shongwe, V. D. Adoption ofpostharvest technologies used by smallholder farmers in Swaziland. Afr. J.Agric. Res. 7, 4983–4995 (2012).
58. Moussa, B., Abdoulaye, T., Coulibaly, O., Baributsa, D. & Lowenberg-DeBoer,J. Adoption of on-farm hermetic storage for cowpea in West and CentralAfrica in 2012. J. Stored Prod. Res. 58, 77–86 (2014).
59. Kitinoja, L. & Barrett, D. M. Extension of small-scale postharvest horticulturetechnologies—a model training and services centre. Agriculture 5, 441–455 (2015).
60. Mujuka, E., Mburu, J., Ogutu, A. & Ambuko, J. Returns to investment inpostharvest loss reduction technologies among mango farmers in EmbuCounty, Kenya. Food Energy Secur. 00, e195 (2019).
61. Compton, J. A. F. et al. Reducing losses in small farm grain storage in thetropics. Trop. Sci. 33, 283–318 (1993).
62. Baributsa, D., Lowenberg-DeBoer, J. & Djibo, A. K. Cell phone videos forcommunicating hermetic cowpea storage skills. In Proc. 5th World CowpeaResearch Conference (eds Boukar, O. et al.) (IITA, 2010).
63. Adegbola, P. Y., Arouna, A. & Ahoyo, N. R. A. Analyse des facteurs affectantl’adoption des greniers améliorés pour le stockage du maïs au Sud-Bénin.Bull. Rech. Agron. Bénin 2, 43–50 (2011).
64. Baributsa, D. et al. Market building for post-harvest technology throughlarge-scale extension efforts. J. Stored Prod. Res. 58, 59–66 (2014).
65. de Groote, H. et al. Measuring rural consumers’ willingness to pay for qualitylabels using experimental auctions: the case of aflatoxin-free maize in Kenya.Agric. Econ. 47, 33–45 (2015).
66. Kitinoja, L. Innovative small-scale postharvest technologies forreducing losses in horticultural crops. Ethiopian J. Appl. Sci. Technol. 1, 9–15 (2013).
67. Ricker-Gilbert, J. & Jones, M. Does storage technology affect adoption ofimproved maize varieties in Africa? Insights from Malawi’s input subsidyprogram. Food Policy 50, 92–100 (2015).
68. Jones, M., Alexander, C., Olynk Widmar, N., Ricker-Gilbert, J. &Lowenberg-DeBoer, J. M. Do insect and mold damage affect maize prices inAfrica? Evidence from Malawi. Mod. Econ. 7, 1168–1185 (2016).
69. Walker, S., Jaime, R., Kagot, V. & Probst, C. Comparative effects ofhermetic and traditional storage devices on maize grain: mycotoxindevelopment, insect infestation and grain quality. J. Stored Prod. Res. 77, 34–44 (2018).
70. Dijkink, B., Broeze, J., Axmann, H. & Vollebregt, M. Hermetic Bag for theStorage of Maize: Economic Perspective in Different Sub-Saharan AfricanCountries, Food Security and Greenhouse Gas Emissions Working Paper No.291 (CGIAR Research Program on Climate Change, Agriculture and FoodSecurity, 2019).
71. Govereh, J., Muchetu, R. G., Mvumi, B. M. & Chuma, T. Analysis ofdistribution systems for supply of synthetic grain protectants to maizesmallholder farmers in Zimbabwe: implications for hermetic grain storagebag distribution. J. Stored Prod. Res. 84, 101520 (2019).
72. Omotilewa, O. J., Ricker-Gilbert, J. & Ainembabazi, J. H. Subsidies foragricultural technology adoption: evidence from a randomised experimentwith improved grain storage bags in Uganda. Am. J. Agric. Econ. 101, 753–772 (2019).
73. Darfour, B. & Rosentrater, K. A. Cost assessment of five different maize grainhandling techniques to reduce postharvest losses from insect contamination.Insects 11, 50 (2020).
74. Landis, J. R. & Koch, G. C. The measurement of observer agreement forcategorical data. Biometrics 33, 159–174 (1977).
75. R Core Team R: A Language and Environment for Statistical Computing R version 3.5.1 (R Foundation for Statistical Computing, 2018).
76. de Mendiburu, F. agricolae: Statistical procedures for agricultural research. Rpackage version 1.3-1 (2019); https://CRAN.R-project.org/package=agricolae
AcknowledgementsThis systematic analysis of the evidence-base on PHL reduction interventions was conducted without funding. The research team contributed their time to work together virtually on this study outside their main work roles and responsibilities. The Ceres2030 project (funded through the Bill and Melinda Gates Foundation) identified the need for the synthesis of the evidence on PHL reduction interventions, and we thank J. Porciello of Cornell University for supporting the research team with advice. The Ceres2030 project covered travel and accommodation costs for six of the team members to join an inception meeting in June 2019. We thank the PHL reduction community of researchers and the stakeholders they have worked with for their study of different interventions, which provided the content for this analysis. We also thank the network of libraries for providing the literature.
Author contributionsAll authors contributed to the conceptualization of the study and development of the protocol and coding framework. M.K. and J.A. implemented the literature search strategy and obtained full-text versions of the required studies. A.E. designed and programmed the interactive database to fit the coding framework. The title/abstract screening, full-text screening and data extraction were done by the following authors (with the number of studies for which each author did each task listed in parentheses): T.S. (6,089, 421, 132), D.H. (7,739, 500, 100), L.K. (4,830, 578, 62), B.M.M. (1,925, 151, 12), O.O. (3,805, 138, 10), A.E. (1,653, 0, 8) and M.T. (0, 0, 10). T.S. and D.H. cleaned, analysed and synthesized the extracted data. T.S. led the writing of the manuscript.
Nature SuStaiNability | VOL 3 | OctOber 2020 | 821–835 | www.nature.com/natsustain834
Sustainable solutions to end hunger | 143
ArticlesNature SuStaiNability
D.H. covered the results for perishable crops and handling practices and costs. All authors contributed comments and provided critical feedback using their specific expertise at several stages to shape the analysis and write the manuscript. The finaldraft benefited from notable further editing by M.T. to improve its flow and succinctness. A.E. processed and visualized the data in the database (including all the programming) with input from T.S. and D.H.
Competing interestsThe authors declare no competing interests.
Additional informationExtended data is available for this paper at https://doi.org/10.1038/s41893-020-00622-1.Supplementary information is available for this paper at https://doi.org/10.1038/s41893-020-00622-1.Correspondence and requests for materials should be addressed to T.S.
Reprints and permissions information is available at www.nature.com/reprints.Publisher’s note Springer Nature remains neutral with regard to jurisdictional claims in published maps and institutional affiliations.
Open Access This article is licensed under a Creative Commons Attribution 4.0 International License, which permits use, sharing, adap-tation, distribution and reproduction in any medium or format, as long
as you give appropriate credit to the original author(s) and the source, provide a link to the Creative Commons license, and indicate if changes were made. The images or other third party material in this article are included in the article’s Creative Commons license, unless indicated otherwise in a credit line to the material. If material is not included in the article’s Creative Commons license and your intended use is not permitted by statu-tory regulation or exceeds the permitted use, you will need to obtain permission directly from the copyright holder. To view a copy of this license, visit http://creativecommons.org/licenses/by/4.0/.© The Author(s) 2020
Nature SuStaiNability | VOL 3 | OctOber 2020 | 821–835 | www.nature.com/natsustain 835
|144 Sustainable solutions to end hunger
Articleshttps://doi.org/10.1038/s43016-020-00164-x
1International Institute for Sustainable Development, Ottawa, Ontario, Canada. 2International Food Policy Research Institute, Washington, DC, USA. 3Department of Agricultural Economics, Faculty of Life Sciences, Humboldt-Universität zu Berlin, Berlin, Germany. 4Public Systems Group, Indian Institute of Management Ahmedabad, Ahmedabad, India. 5Institute of Geography, University of Bern, Bern, Switzerland. 6Department of Cooperatives, College of Business and Economics, Wollo University, Dessie, Ethiopia. 7China Agricultural University, Beijing, China. 8Cornell University, Ithaca, NY, USA. 9University of Minnesota, Minneapolis, MN, USA. 10International Institute for Sustainable Development, Winnipeg, Manitoba, Canada. ✉e-mail: [email protected]
The adoption of the United Nations Sustainable Development Goals (SDGs) in 2015 signalled a global commitment to combat hunger and improve the well-being of small-scale
producers and the environment. Small-scale producers contrib-ute substantially to the food supply1–3, yet many experience food insecurity4. They are also highly vulnerable to climate change and environmental degradation5 with particular severity in sub-Saharan Africa (SSA) and South and East Asia6.
Farmer organizations (FOs) such as associations, cooperatives, producer organizations, self-help and women’s groups, are col-lective institutions intended to support members’ interests7,8. FOs may help small-scale producers access markets, credit and rural extension services9,10 as well as manage shared natural resources11. FOs can build farmer skills in production, marketing and leader-ship and strengthen psychological well-being12. Building on these contributions to farmers, FOs have become core elements of rural development, agricultural productivity and anti-poverty policies—especially in Africa and South Asia13,14.
Questions have arisen about the equity of FOs, including whether they serve mainly middle-class farmers, rather than the poorest and most vulnerable farmers15,16. In some contexts, FO benefits have been shown to vary depending on the crops grown, farmers’ access to resources and membership heterogeneity14,17. Experience from Kenya, Ethiopia and South Africa also indicates that FOs often depend on support from governments and other agencies18,19 and that the benefits of FOs to individual members can be limited by production volumes, infrastructure challenges and inadequate banking services, as well as limited managerial and leadership skills16,20.
More evidence on the impact of FOs is urgently needed for gov-ernments and donor organizations to identify effective interven-tions to achieve the SDGs, including target 2.1 to fight hunger, 2.3 to improve the income of smallholders and 2.4 to promote envi-ronmentally friendly agricultural practices and responses to climate change. Although several studies have reviewed the contributions of FOs towards those objectives, most have focused on a subset of FO types and/ or individual countries12,21,22. Many have not applied a systematic approach23.
Here we explore the contributions of FO membership by review-ing the scientific literature on the impacts of FOs on small-scale producers in SSA and India—both of which have a long tradition of cooperatives and other FOs24,25. More specifically, we analyse the findings of 239 studies to elicit the contributions of FOs to income, empowerment, agricultural production, food security and the envi-ronment. Details of the literature screening and eligibility criteria can be found in the Methods and in Box 1.
ResultsOverview of the included studies. The 239 studies included in this scoping review document FOs in 24 countries (Fig. 1). All studies were published between 2000 and 2019, most (192, or 80% of the total) since 2010. The majority used quantitative methodologies (53%) and involved at least 100 respondents (64%).
The reviewed studies included seven types of FOs (Fig. 2b): agricultural cooperatives, farmer associations and groups, rural self-help groups and women’s groups, dairy cooperatives, pro-ducer groups, natural resource management groups and rural financial cooperatives.
A scoping review of the contributions of farmers’ organizations to smallholder agricultureLivia Bizikova 1 ✉, Ephraim Nkonya2, Margitta Minah 3, Markus Hanisch3, Rama Mohana Rao Turaga 4, Chinwe Ifejika Speranza 5, Muthumariappan Karthikeyan 6, Lixia Tang7, Kate Ghezzi-Kopel 8, Julie Kelly 9, Ashley Casandra Celestin8 and Beth Timmers 10
Farmers’ organizations (FOs), such as associations, cooperatives, self-help and women’s groups, are common in developing countries and provide services that are widely viewed as contributing to income and productivity for small-scale producers. Here, we conducted a scoping review of the literature on FO services and their impacts on small-scale producers in sub-Saharan Africa and India. Most reviewed studies (57%) reported positive FO impacts on farmer income, but much fewer reported positive impacts on crop yield (19%) and production quality (20%). Environmental benefits, such as resilience-building and improved water quality and quantity were documented in 24% of the studies. Our analysis indicates that having access to markets through information, infrastructure, and logistical support at the centre of FO design could help integrate FOs into policy. Natural resource management should also be more widely incorporated in the services provided by FOs to mitigate risks associated with environmental degradation and climate change. Finally, farmers who are already marginalized because of poor education, land access, social status and market accessibility may require additional support systems to improve their capaci-ties, skills and resources before they are able to benefit from FO membership.
Nature Food | VOL 1 | OctOber 2020 | 620–630 | www.nature.com/natfood620

Sustainable solutions to end hunger | 145
ArticlesNature Food
We characterized the studies by FO membership and crop type, where relevant. Out of 228 studies that provided data on mem-bership, 171 studies (75%) involved FOs with open membership, unrestricted by gender, age or any other qualification. The other studies (25%) had exclusively or mostly women members (Supplementary Fig. 1.3).
Of the 238 studies that provided data on type of production, more than half (132, or 55% of the total) focused on crop pro-duction alone and included FOs working with cereals, vegetables, coffee and fruits; 24% (56 studies) focused on livestock only, and 21% (51 studies) focused on both crop and livestock production (Supplementary Figure 1.3). Agricultural cooperatives and farm-ers’ associations had the strongest focus on crop production (73% and 68% respectively). We found only limited information on other FO characteristics, such as membership costs (found for 37 studies, 15%) (Supplementary Fig. 1.4).
FO services for members. The services FOs provided to their members can be grouped into 11 categories (Fig. 2), of which the most common (129 studies, 54%) was ‘marketing services to increase product sales’ (such as connecting to specific markets to sell products, shared transport or storage of the products and the establishment of contacts between FO members and buyers). The second most common category was ‘providing access to market information’ on product prices and trends, seasonality and regional changes (111 studies, 46%). The third most common was ‘extension and educational services’, which both promote improved produc-tion and marketing practices, as well as build financial literacy (89 studies, 37%). The first and third categories were widely represented regardless of the type of FO or membership. Other services, such as linking farmers to external programmes, infrastructure develop-ment/management and policy advocacy with local/sub-national
governments, were also found in some FOs, but their frequency in the reviewed studies is low.
Most studies described FOs that provided multiple services, but 25 of the studies (4%) focused on FOs that solely provided financial services, including financial cooperatives and rural self-help and women’s groups. FOs offering multiple services typically addressed output marketing, market information and extension services and were analysed by 32% of the studies. They were mostly agricul-tural or dairy cooperatives, farmer associations and groups. Studies focused on the FOs from India show that rural self-help groups and women’s groups tended to deliver financial, extension and education services such as certification and improved production practices, financial literacy, marketing skills and skills for income genera-tion, strengthening members’ access to income, savings, credit and empowerment.
FO membership impacts. The observed FO impacts could be grouped into six categories: income, yield, production quality, envi-ronment, empowerment and food security (Fig. 3a). Of the 239 studies, 98 (41%) focused on a single measurable impact (that is ‘improved’ or ‘not improved’) in response to FO membership.
Sixty-seven per cent of the studies (161) reported only cases of improvement (in one or more impact categories) associated with FO membership; 21% (50) reported both cases of improvements and cases of non-improvements (in one or more impact categories). Finally, 12% of studies (28) reported only cases of no measurable improvement (in one or more of the impact categories studied).
Income. Changes in income are the most investigated impact, included in 174 studies (73%). Of the 239 studies, 58% identified positive impacts on income and only 15% saw no improvements at all. These income improvements were mostly delivered by FOs engaged in crop production (55%) and with no restriction on mem-bership (67%) (Fig. 3b). The proportion of studies that reported improvement in incomes is similar across FO types (Fig. 3c), except for natural resource management groups (mostly water and forest user associations), for which only a third of the studies reported positive effects. More than two-thirds of the studies analysing self-help and women’s groups reported improvement in incomes.
Among the services offered by FOs, marketing assistance for farm products and services that provide access to market informa-tion have the highest association with improvement in incomes (Fig. 3d). Extension and financial services also seem to play a posi-tive role, but natural resource management services do not seem to translate into short-term improvement in incomes. Our data, how-ever, do not indicate whether income gains are achieved through a combination of these services or whether a few services on their own have a large influence on improving incomes.
In the studies that quantified changes in income (33, or 14%), increases ranged widely from 3% to 70% over the studied period (often between 2 and 5 years). Out of our 239 studies, 7 (3%) reported inconsistent income gains characterized by fluctuations over years and seasons. Such fluctuations were attributed to external and socio-demographic factors such as commodity prices, weather and climate impacts, crop and livestock losses caused by pests and diseases, varying product quality and insufficient family labour, or illness of household members26,27. However, 25 studies (10%) men-tioned that FOs assisted famers to stabilize their income through access to reliable markets, higher bargaining power with wholesal-ers and retailers, and more stable prices through access to consistent and reliable markets. This indicates that FOs have the ability to miti-gate risks that cause fluctuations in the incomes of their members.
Production quality. After income gains, improved production quality was the next most commonly reported impact. Changes in produc-tion quality were typically measured in terms of improved quality of
Box 1 | Key definitions for the identification of relevant studies
Small-scale producers. Rural producers that meet at least two of the four following criteria: land size, labour availability (especially family members), market orientation (that is, whether production is for personal consumption or sale/barter in markets) and economic size.
Farmer organization. Formal or informal membership-based, collective action institution with the purpose of assembling and possessing established organizational structure to support members in pursuing their individual and collective interests. One essential function is to organize relations with the external world to mediate between members and others who act in their economic, institutional and political environment. This definition includes farmers’ associations, farmer cooperatives, farmer clubs, farmer groups, producer organizations and women’s groups.
FO services. Actions, strategies or activities undertaken by FOs to help small-scale producers/smallholder farmers generate more income and have better access to food and other raw materials. Typical examples are agricultural extension, education, training and other ways to work with or for farmers.
Environmental impacts. Positive or negative impacts of FO services on the environment. Positive impacts may include improved water quality, greater water availability, reduced erosion, reduced pollution, greater use of renewable energy, greater climate change resilience and lower vulnerability. Negative impacts could include water, soil and air pollution, deforestation and so on.
Livelihood impacts. Changes to the capabilities, assets (stores, resources, claims and access) and activities required for living.
Sustainable livelihood. A livelihood that can cope with and recover from stresses and shocks, maintain or enhance its capabilities and assets, and provide livelihood opportunities for the next generation; it also contributes net benefits to other livelihoods at the local and global levels and in the short and long terms. In this scoping review, income and food security are the two most important components for measuring impacts on livelihoods.
Nature Food | VOL 1 | OctOber 2020 | 620–630 | www.nature.com/natfood 621
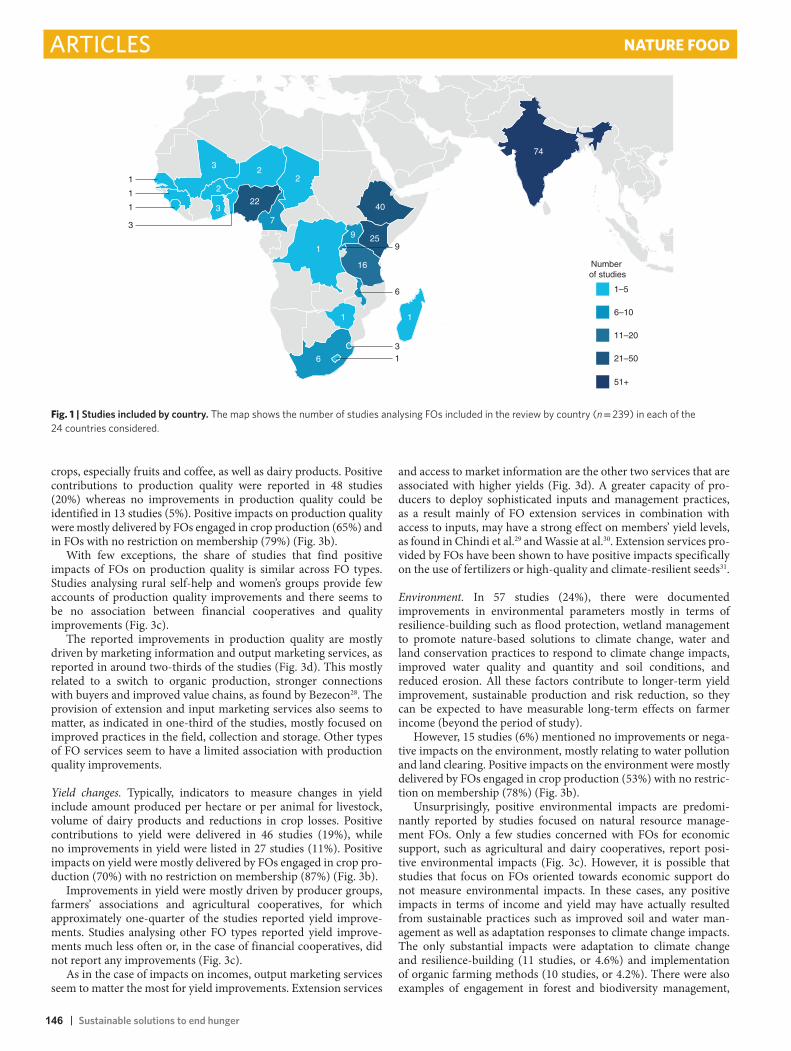
146 | Sustainable solutions to end hunger
Articles Nature Food
crops, especially fruits and coffee, as well as dairy products. Positive contributions to production quality were reported in 48 studies (20%) whereas no improvements in production quality could be identified in 13 studies (5%). Positive impacts on production quality were mostly delivered by FOs engaged in crop production (65%) and in FOs with no restriction on membership (79%) (Fig. 3b).
With few exceptions, the share of studies that find positive impacts of FOs on production quality is similar across FO types. Studies analysing rural self-help and women’s groups provide few accounts of production quality improvements and there seems to be no association between financial cooperatives and quality improvements (Fig. 3c).
The reported improvements in production quality are mostly driven by marketing information and output marketing services, as reported in around two-thirds of the studies (Fig. 3d). This mostly related to a switch to organic production, stronger connections with buyers and improved value chains, as found by Bezecon28. The provision of extension and input marketing services also seems to matter, as indicated in one-third of the studies, mostly focused on improved practices in the field, collection and storage. Other types of FO services seem to have a limited association with production quality improvements.
Yield changes. Typically, indicators to measure changes in yield include amount produced per hectare or per animal for livestock, volume of dairy products and reductions in crop losses. Positive contributions to yield were delivered in 46 studies (19%), while no improvements in yield were listed in 27 studies (11%). Positive impacts on yield were mostly delivered by FOs engaged in crop pro-duction (70%) with no restriction on membership (87%) (Fig. 3b).
Improvements in yield were mostly driven by producer groups, farmers’ associations and agricultural cooperatives, for which approximately one-quarter of the studies reported yield improve-ments. Studies analysing other FO types reported yield improve-ments much less often or, in the case of financial cooperatives, did not report any improvements (Fig. 3c).
As in the case of impacts on incomes, output marketing services seem to matter the most for yield improvements. Extension services
and access to market information are the other two services that are associated with higher yields (Fig. 3d). A greater capacity of pro-ducers to deploy sophisticated inputs and management practices, as a result mainly of FO extension services in combination with access to inputs, may have a strong effect on members’ yield levels, as found in Chindi et al.29 and Wassie at al.30. Extension services pro-vided by FOs have been shown to have positive impacts specifically on the use of fertilizers or high-quality and climate-resilient seeds31.
Environment. In 57 studies (24%), there were documented improvements in environmental parameters mostly in terms of resilience-building such as flood protection, wetland management to promote nature-based solutions to climate change, water and land conservation practices to respond to climate change impacts, improved water quality and quantity and soil conditions, and reduced erosion. All these factors contribute to longer-term yield improvement, sustainable production and risk reduction, so they can be expected to have measurable long-term effects on farmer income (beyond the period of study).
However, 15 studies (6%) mentioned no improvements or nega-tive impacts on the environment, mostly relating to water pollution and land clearing. Positive impacts on the environment were mostly delivered by FOs engaged in crop production (53%) with no restric-tion on membership (78%) (Fig. 3b).
Unsurprisingly, positive environmental impacts are predomi-nantly reported by studies focused on natural resource manage-ment FOs. Only a few studies concerned with FOs for economic support, such as agricultural and dairy cooperatives, report posi-tive environmental impacts (Fig. 3c). However, it is possible that studies that focus on FOs oriented towards economic support do not measure environmental impacts. In these cases, any positive impacts in terms of income and yield may have actually resulted from sustainable practices such as improved soil and water man-agement as well as adaptation responses to climate change impacts. The only substantial impacts were adaptation to climate change and resilience-building (11 studies, or 4.6%) and implementation of organic farming methods (10 studies, or 4.2%). There were also examples of engagement in forest and biodiversity management,
1–5
6–10
11–20
21–50
51+
Number of studies
74
40
25
16
1
7
6 1
1
1
2
9
2
223
2
3
3
1
1
1
3
6
9
Fig. 1 | Studies included by country. The map shows the number of studies analysing FOs included in the review by country (n = 239) in each of the 24 countries considered.
Nature Food | VOL 1 | OctOber 2020 | 620–630 | www.nature.com/natfood622

Sustainable solutions to end hunger | 147
ArticlesNature Food
addressing water quality and availability and the use of renewable energy. These activities were motivated by production needs such as irrigation or energy for processing and storage (for example Bekele and Ando32) or as the outcome of particular government support campaigns to improve irrigation, for example33.
Environmental improvements were delivered by specific ser-vices targeting natural resource management (mostly water, forest and pasture) as well as outcomes of market information and output marketing (Fig. 3d). In addition, studies focusing on other types of FOs that deliver extension and marketing services also reported
a
b
c
0 10 20 30 40 50 60
Services to promote access to inputs
Marketing services to increase product sales
Providing access to market information
Technology access for processing, production
Financial services
Extension and educational services
Resource management and access
Infrastructure development, management
Providing access to employment
Policy advocacy at different levels of government
Linking farmers to external programmes
Percentage of studies
0
20
40
60
80
100
Agriculturalcooperatives
(n = 67)
Farmers’associations andgroups (n = 53)
Financialcooperatives
(n = 6)
Dairycooperatives
(n = 34)
Producer groups(n = 18)
Rural self-help groups and
women’s groups (n = 35)
Naturalresource
managementgroups (n = 26)
Perc
enta
ge o
f stu
dies
Services to promote access to inputs Marketing services to increase product sales
Providing access to market information Technology access for processing, production
Financial services Extension and educational services
0102030405060708090
100
Agriculturalcooperatives
(n = 67)
Farmers’associations andgroups (n = 53)
Financialcooperatives
(n = 6)
Dairycooperatives
(n = 34)
Producer groups(n = 18)
Rural self-help groups and
women’s groups (n = 35)
Natural resourcemanagement
groups (n = 26)
Perc
enta
ge o
f stu
dies
Resource management and access Infrastructure development, managementProviding access to employmentLinking farmers to external programmes
Policy advocacy at different levels of government
Fig. 2 | Services provided by FOs. a, Representation of services in the included studies (n = 239). Most of the studies reported the delivery of multiple services, thus the sum across all the services is above 100%. b, Services with the highest representation in the studies by FO type. c, Services with the lowest representation in the studies by FO type. Most of the studies delivered multiple services, thus the sum across all the services is greater than 100%. Financial cooperatives did not provide any of these services.
Nature Food | VOL 1 | OctOber 2020 | 620–630 | www.nature.com/natfood 623

148 | Sustainable solutions to end hunger
Articles Nature Food
environmental improvements, as some of the promoted manage-ment practices aimed at better yields (such as small-scale irrigation and targeted fertilizer application) were provided by FO exten-sion services that in turn contribute to improved water quality and quantity34. Management practices promoted by such FOs, aimed at
improving yields and/or resource use efficiency (such as small-scale irrigation and targeted fertilizer application), were also found to contribute to improved water quality and quantity34.
For natural resource management groups, livelihoods were strengthened and made more resilient through improvements in the
a
b
c
d
0 10 20 30 40 50 60 70
Improved food security
No reported change in food security
Improved empowerment/social benefits
No improvment in empowerment/social benefits
Improved environment
No improvement in environment
Improved yield
No reported change in yield
Improved product quality
No reported change in product quality
Improved income
No reported change in income
Foodsecurity
Empowerment/ socialbenefits
Environment
Yield
Productionquality
Income
Percentage of studies
0
50
100
Crop Livestock Crop and livestock Both men andwomen
Women (only,mostly)
Unknownmembership
Perc
enta
ge o
f stu
dies
Improved income (n = 137) Improved production quality (n = 48) Improved yield (n = 46)Improved environment (n = 57) Improved empowerment (n = 41) Improved food security (n = 19)
0
50
100
Agriculturalcooperatives
(n = 67)
Farmers’associations andgroups (n = 53)
Financialcooperatives
(n = 6)
Dairycooperatives
(n = 34)
Producers group(n = 18)
Rural self-helpand women’sgroup (n = 35)
Natural resourcemanagement
groups (n = 26)
Improved income (n = 137) Improved production quality (n = 48) Improved yield (n = 46)
Improved environment (n = 57) Improved empowerment (n = 41) Improved food security (n = 19)
0
20
40
60
80
Inputmarketing
Outputmarketingservices
Marketinginformation
Extension Access totechnology
Financialservices
Naturalresources
management
Infrastructuredevelopment
Others
Perc
enta
ge o
f stu
dies
Perc
enta
ge o
f stu
dies
Improved income (n = 137) Improved production quality (n = 48) Improved yield (n = 46)Improved environment (n = 57) Improved empowerment (n = 41) Improved food security (n = 19)
Fig. 3 | Impact of FOs. a, Proportions of studies reporting different types of impact (as percentage of studies in that category, n = 239). b, Positive impacts by type of production and membership in the studies. c, Positive impacts by FO type. d, Positive impacts by FO services. The sum of improvements and no improvements does not add up to 100% for each impact because not all the studies analysed the respective impacts. Most (59%) of the studies delivered multiple impacts, thus the sum across all of the services is greater than 100%.
Nature Food | VOL 1 | OctOber 2020 | 620–630 | www.nature.com/natfood624
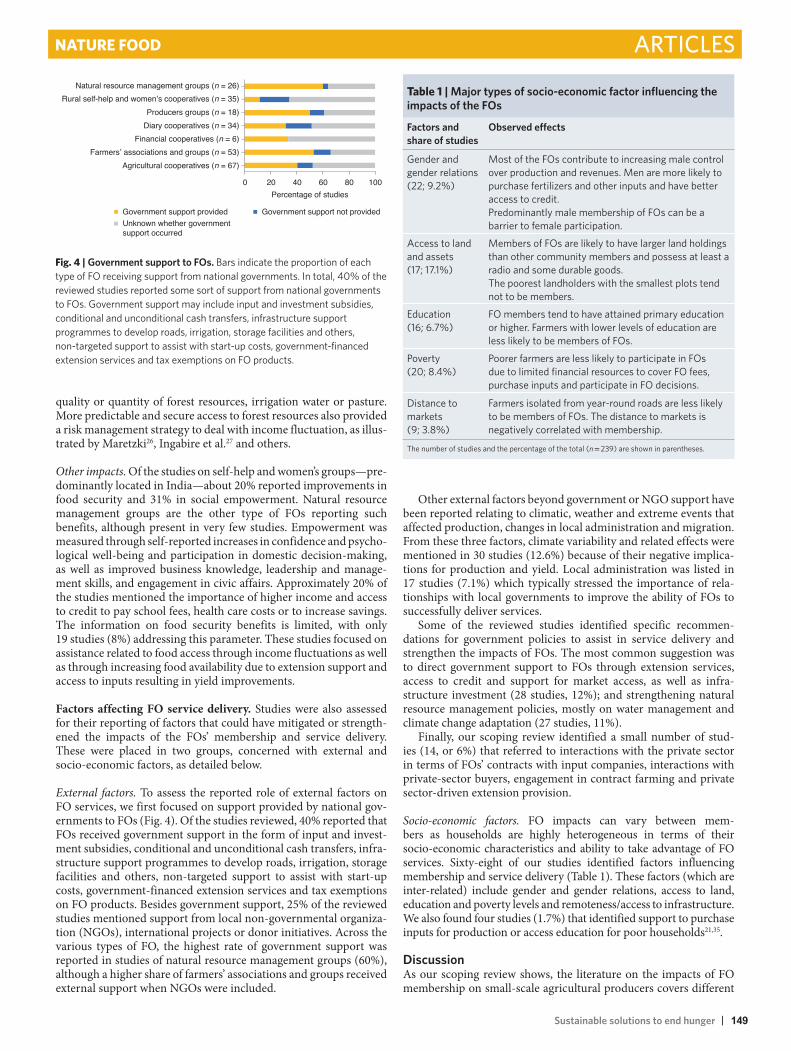
Sustainable solutions to end hunger | 149
ArticlesNature Food
quality or quantity of forest resources, irrigation water or pasture. More predictable and secure access to forest resources also provided a risk management strategy to deal with income fluctuation, as illus-trated by Maretzki26, Ingabire et al.27 and others.
Other impacts. Of the studies on self-help and women’s groups—pre-dominantly located in India—about 20% reported improvements in food security and 31% in social empowerment. Natural resource management groups are the other type of FOs reporting such benefits, although present in very few studies. Empowerment was measured through self-reported increases in confidence and psycho-logical well-being and participation in domestic decision-making, as well as improved business knowledge, leadership and manage-ment skills, and engagement in civic affairs. Approximately 20% of the studies mentioned the importance of higher income and access to credit to pay school fees, health care costs or to increase savings. The information on food security benefits is limited, with only 19 studies (8%) addressing this parameter. These studies focused on assistance related to food access through income fluctuations as well as through increasing food availability due to extension support and access to inputs resulting in yield improvements.
Factors affecting FO service delivery. Studies were also assessed for their reporting of factors that could have mitigated or strength-ened the impacts of the FOs’ membership and service delivery. These were placed in two groups, concerned with external and socio-economic factors, as detailed below.
External factors. To assess the reported role of external factors on FO services, we first focused on support provided by national gov-ernments to FOs (Fig. 4). Of the studies reviewed, 40% reported that FOs received government support in the form of input and invest-ment subsidies, conditional and unconditional cash transfers, infra-structure support programmes to develop roads, irrigation, storage facilities and others, non-targeted support to assist with start-up costs, government-financed extension services and tax exemptions on FO products. Besides government support, 25% of the reviewed studies mentioned support from local non-governmental organiza-tion (NGOs), international projects or donor initiatives. Across the various types of FO, the highest rate of government support was reported in studies of natural resource management groups (60%), although a higher share of farmers’ associations and groups received external support when NGOs were included.
Other external factors beyond government or NGO support have been reported relating to climatic, weather and extreme events that affected production, changes in local administration and migration. From these three factors, climate variability and related effects were mentioned in 30 studies (12.6%) because of their negative implica-tions for production and yield. Local administration was listed in 17 studies (7.1%) which typically stressed the importance of rela-tionships with local governments to improve the ability of FOs to successfully deliver services.
Some of the reviewed studies identified specific recommen-dations for government policies to assist in service delivery and strengthen the impacts of FOs. The most common suggestion was to direct government support to FOs through extension services, access to credit and support for market access, as well as infra-structure investment (28 studies, 12%); and strengthening natural resource management policies, mostly on water management and climate change adaptation (27 studies, 11%).
Finally, our scoping review identified a small number of stud-ies (14, or 6%) that referred to interactions with the private sector in terms of FOs’ contracts with input companies, interactions with private-sector buyers, engagement in contract farming and private sector-driven extension provision.
Socio-economic factors. FO impacts can vary between mem-bers as households are highly heterogeneous in terms of their socio-economic characteristics and ability to take advantage of FO services. Sixty-eight of our studies identified factors influencing membership and service delivery (Table 1). These factors (which are inter-related) include gender and gender relations, access to land, education and poverty levels and remoteness/access to infrastructure. We also found four studies (1.7%) that identified support to purchase inputs for production or access education for poor households21,35.
DiscussionAs our scoping review shows, the literature on the impacts of FO membership on small-scale agricultural producers covers different
0 20 40Percentage of studies
60 80 100
Agricultural cooperatives (n = 67)Farmers’ associations and groups (n = 53)
Financial cooperatives (n = 6)Diary cooperatives (n = 34)Producers groups (n = 18)
Rural self-help and women’s cooperatives (n = 35)Natural resource management groups (n = 26)
Government support provided Government support not providedUnknown whether government support occurred
Fig. 4 | Government support to FOs. Bars indicate the proportion of each type of FO receiving support from national governments. In total, 40% of the reviewed studies reported some sort of support from national governments to FOs. Government support may include input and investment subsidies, conditional and unconditional cash transfers, infrastructure support programmes to develop roads, irrigation, storage facilities and others, non-targeted support to assist with start-up costs, government-financed extension services and tax exemptions on FO products.
table 1 | Major types of socio-economic factor influencing the impacts of the FOs
Factors and share of studies
Observed effects
Gender and gender relations (22; 9.2%)
Most of the FOs contribute to increasing male control over production and revenues. Men are more likely to purchase fertilizers and other inputs and have better access to credit.Predominantly male membership of FOs can be a barrier to female participation.
Access to land and assets (17; 17.1%)
Members of FOs are likely to have larger land holdings than other community members and possess at least a radio and some durable goods.The poorest landholders with the smallest plots tend not to be members.
Education (16; 6.7%)
FO members tend to have attained primary education or higher. Farmers with lower levels of education are less likely to be members of FOs.
Poverty (20; 8.4%)
Poorer farmers are less likely to participate in FOs due to limited financial resources to cover FO fees, purchase inputs and participate in FO decisions.
Distance to markets (9; 3.8%)
Farmers isolated from year-round roads are less likely to be members of FOs. The distance to markets is negatively correlated with membership.
The number of studies and the percentage of the total (n = 239) are shown in parentheses.
Nature Food | VOL 1 | OctOber 2020 | 620–630 | www.nature.com/natfood 625

150 | Sustainable solutions to end hunger
Articles Nature Food
types of FO in multiple countries of SSA and India. Positive impacts on farmers’ income, yield and production were found, as well as some benefits for food security and the environment.
FO services and members’ incomes. Our review revealed that FO services that enhance access to markets—for example, product mar-keting and market information—have positive impacts on member income as well as yield and product quality. This is consistent with the broader literature, which argues that the diverse services that FOs provide to connect small-scale producers to markets lead to positive impacts by assisting the individual members to overcome challenges such as low quantity or quality of products and frequent supply constraints, as well as by assisting with skill development and access to inputs22. In addition, access to financial services was shown in our findings to be critical to achieve improved income23. Member access to credit will be even more crucial for FOs to respond to future challenges such as climate change impacts and risk man-agement, which require additional investments in climate-resilient crops, irrigation or insurance36.
Extension and educational services delivered by FOs have a sub-stantial presence across all types of FOs in our review and delivered positive impacts. These services addressed skill, knowledge and information deficiencies that the members faced in relation to pro-duction decisions and practices. Types of services included infor-mation about input application, farming practices and production systems; market information; health and safety; and managerial and business skills—as well as knowledge about environmental stew-ardship and sustainability. These services would ideally be bundled flexibly and responsively to meet specific and dynamic local pro-duction constraints and market opportunities. In practice, however, providing these services to individual ssmall farmers is costly; col-lectives such as FOs make extension services more cost effective and feasible23. FOs can provide the institutional infrastructure for effec-tive knowledge management, applied research and practical innova-tion to respond to diverse local production constraints or changing market conditions. Our results reinforce the value of extension ser-vices in the context of FOs and are consistent with literature find-ings that FO extension services benefit smallholders by improving financial literacy and the uptake of sustainable practices to achieve productivity and income gains36,37.
We infer from these results that policy development and pro-gramming should support FOs in the effective delivery of services that provide access to markets—both input and output—through targeted market information, infrastructure investment to improve market access mostly focused on road development, logistical sup-port and extension to improve outcomes across different forms of FOs. Smallholders would probably benefit from FO provi-sion of financial services such as consolidating and administer-ing small-scale loans, seasonal input financing or crop insurance schemes based on measurable climate parameters (such as rainfall) rather than complex, case-by-case yield calculations. This set of multiple services for extension, infrastructure, market and financial services should be central to the design of FOs.
In terms of avenues for future research, our scoping review indi-cates that the benefits provided by a given FO may differ between individual members14,38. Although we found information comparing benefits for marginalized groups (as discussed below), this aspect of the analysis warrants further research. Similarly, further investiga-tion of the positive spill-over effects39 of FOs on non-members and local communities would strengthen the case for FOs in supporting smallholder livelihoods.
Limited FO benefits for marginal producers. Reviewed studies mostly focused on those smallholder households with sufficient resources to benefit from engagement in FOs. Although the broader literature identifies several characteristics, such as farm size, gender
of the household head, education and age, that influence FO mem-bership and the heterogeneity of impacts40, our findings reveal that distance of households from markets is also an important variable hindering FO benefits. Gassner et al.41 argue for differentiating among smallholders on the basis of the availability of resources. Households engaged in small-scale farming as a livelihood may have varying income and assets, resources to reinvest in agriculture or access to better-paid non-farm jobs to transition out of farming38. Those households that are on the margin and lack resources are likely to incur higher transaction costs to access FO services39 and thus need to be supported, while possible barriers and incentives need to be carefully revisited to make FOs more accessible42.
The gender of the household head was a prominent factor; stud-ies suggest that benefits such as income, yield and production qual-ity are lower for female-headed farm households40. FOs seem to be less effective for younger, less literate and female farmers, even if they become members. In addition, women (both married and unmarried) are often constrained in their ability to take advan-tage of FO services to improve crop yield, production systems and marketing. Some studies suggest that the homogeneity of women’s self-help groups positively affected women’s likelihood of joining, as a higher proportion of female members is more appealing to other women43. In India, rural self-help groups and women’s coopera-tives show positive impacts on women’s empowerment and access to credit, but often limited impact on domestic gender relations44.
Our results on gender, combined with our results on the other characteristics of marginalization (for example, distance to market) indicate that marginalized groups of farmers are less likely to par-ticipate in or to benefit from participation in FOs. This implies that policy development and programming in Africa and India should focus on the levers that induce them to more actively engage in FOs. Marginalized small-scale farmers may require different support sys-tems to first improve their capacities, skills and resources as well as connections to infrastructure before they are able to benefit from FO membership. With regards to gender, policy development and pro-gramming should focus on improving the participation of women in FOs. One way is to mobilize women to form female-focused FOs and provide support through agricultural extension aimed at build-ing the abilities of women farmers in areas such as production tech-nology uptake and marketing45.
Limited food security benefits. This scoping review found a very low number of studies evaluating the contributions of FOs to food security compared with studies on improving income. This may also be due to our sample selection criteria, which may have resulted in studies that focused on non-marginalized small farmers for whom food security may not be a research outcome of interest.
Gains to food security attributable to FOs require additional research, as few previous studies examined this relationship. Although marginal, remote and socially disadvantaged households are the ones who typically suffer from food insecurity and who would gain most from FO participation, the studies show that mar-ginalized producers are particularly difficult to engage in FOs for the reasons discussed above. It is also worth further studying food security impacts among more prosperous farmers, as improvements in indicators such as income or yield do not always translate into better food security or nutrition if, for example, households spend additional income on non-food items46.
We suggest that a distinction be made by policymakers between food security versus income or poverty reduction when prioritizing interventions in smallholder agriculture. For marginalized farm-ers who have limited capacity to benefit from FO membership, food security challenges require different interventions. Instead of improving production systems or market access, these might instead focus on, for example, basic social protections, income sup-port, nutritional supplements or seasonal food security packs41.
Nature Food | VOL 1 | OctOber 2020 | 620–630 | www.nature.com/natfood626

Sustainable solutions to end hunger | 151
ArticlesNature Food
FO services and natural resource management. Natural resource- based FOs were able to address soil erosion, improve water avail-ability and contribute to reforestation and forest rehabilita-tion, thereby improving member resilience through access to higher-quality resources. These impacts were mostly achieved using targeted services to strengthen collective management of water, for-est and pasture. The extensive work on common pool resources has demonstrated the ability of self-organized collectives to sustain key resources47 and our results align well with this body of work. Research more specific to FOs has shown, for example, that FOs designed for collective forest, water and pasture resource manage-ment in Africa and other parts of the world48,49 have resulted in posi-tive impacts for members.
Some studies reported that climate change and weather events affected FO members’ ability to produce and sell crops due to nega-tive impacts on harvest and impacts on markets and related infra-structure. To promote sustainable agricultural practices and address climate risk, FOs should reassess whether input use, extension ser-vices, production technologies and resource management practices are consistent with sustainability and climate resilience criteria. This could lead to greater attention to sustainable production practices and more judicious natural resource management to preserve eco-system function under increased climate stress. These additional complexities will challenge FOs to devote more resources to inno-vation but they will become increasingly important to ensure the sustainability of agricultural production systems and risk-adjusted returns to farmers50.
Our findings show that fluctuations in farmers’ incomes in FOs is at least partly because of climate change-induced uncertainties, but at the same time we find that very few types of FO offer natural resource management services. The type of FOs that predominantly focus on natural resource management seem to be successful in deliver-ing positive environmental impacts. The literature also suggests that other types of FO targeting the environment may improve yields, but not report on these services51. The implication of these findings for policy development and programming is that broader ecosystem and natural resource management should be more widely incorporated in the extension services of FOs to mitigate the risk induced by envi-ronmental degradation and climate change. This may require better documentation of current practices that contribute to the environ-ment, as well as training and investment in innovation for FOs to demonstrate the benefits of new, more sustainable practices—so that they feel confident promoting such practices in agricultural systems.
Government role in supporting FOs. The literature shows that, on the one hand, governments play a substantial role in creating and supporting FOs. They can provide initial financial assistance15,16 as well as long-term support to increase asset levels that contribute to FOs’ competitiveness and investment opportunities9. Moreover, government-subsidized FOs can become a buyer of last resort for farmers to sell their products, but often at lower prices than they would receive in a market52. Product price fluctuations were a sub-stantial feature in many of the reviewed studies, so improved price stability was an important benefit of FO membership. Contrastingly, external support can also prop up weak and dysfunctional FOs and prolong inefficiencies53, with FO membership possibly represent-ing a way of insulating small-scale producers from the hardships of essential structural change53.
Given the important role of governments in creating and sup-porting FOs, as well as the potential for political interference, the data extraction criteria used here identified available information on government and/or donor support for FOs, as well as cases where FOs do not provide the details of such support.
Final remarks. Our findings suggest generally positive evidence for the ability of FOs to provide important benefits to their members,
and although only a minority of studies explicitly identify the role of government in the FOs that they study, this role was mostly a con-structive one. There is abundant support in the broader literature23 for widespread participation in FOs; governments can be more pro-active in supporting them by promoting legal frameworks for FO operation and providing access to credit and extension services to enable more widespread and effective engagement of small-scale farmers in FOs. Finally, while the contribution of government and support of NGOs can be substantial, the connections between this support and FO benefits has not been well documented in our sam-ple of studies, indicating the need for additional research to explore the supporting role of governments and other entities in FO perfor-mance. Specific investigation of FO engagement in politics and pol-icy, as well as the influence of governmental and other programmes on these FOs, would be beneficial to gain a fuller picture of FO con-tributions to members’ livelihoods and environmental sustainability.
In addition to the government and NGO support to FOs, there is a growing interest in engagement with the private sector54. The number of studies assessing the impacts of such engagement was low in our review. Future research should focus on exploring whether the nature of supporting organization (government/NGO/private players) makes much difference in the performance of FOs.
A final caveat is that the papers in our sample may be subject to publication bias, as studies reporting positive results concerning FO impacts are more likely to be published than studies reporting insig-nificant or negative results. Twenty-eight of the studies included in our review (12%) provide accounts of no measurable improve-ment in FO members’ livelihoods. However, we cannot rule out the possibility of a larger publication bias because of this preference for positive results55,56.
MethodsScoping review and protocol pre-registration. Scoping reviews do not seek to ‘synthesize’ evidence nor aggregate findings from different studies57,58, but rather provide a narrative or descriptive account of available research without focusing on the strength of evidence58. Other types of review that do require quality appraisal, such as systematic reviews, often include a lower number of studies than scoping reviews57. The outcomes of scoping reviews can include policy and practice recommendations and suggestions for areas of study that are not currently well addressed in the literature.
This scoping review was prepared following guidelines from the Preferred Reporting Items for Systematic Reviews and Meta-Analyses extension for scoping reviews (PRISMA-ScR)59. This approach comprises five steps: (1) identifying the research question (that is, “what are the services that farmer organizations provide to members, and what impacts do those services have on small-scale producers’ livelihoods and the environment?”); (2) identifying relevant studies using pre-determined definitions (see Box 1); (3) study selection; (4) extracting and charting the data; and (5) collating, summarizing and reporting the results.
Databases, search methods and citation management. A search strategy was developed and tested by the authors to identify all available publications pertaining to the research question. Search terms included variations of the key concepts in the research question (that is FOs and the geographic regions of interest). Searches included the following electronic databases: CAB Abstracts and Global Health (accessed via Web of Science); Web of Science Core Collection (accessed via Web of Science); and Scopus (accessed via Elsevier). Full search strategies used for each database, including grey literature, can be accessed in their entirety at https://osf.io/4gt3b/.
In addition to scholarly literature, the authors also conducted a comprehensive search of grey literature using custom web-scraping scripts. The authors tested search strings on each website before initiating web-scraping. An existing Google Chrome extension was needed to scrape dynamically generated websites. The authors combined and removed duplicated results from the databases and the grey literature searches using a Python script.
Eligibility criteria. A total of 239 studies were included in the review on the basis of the following inclusion criteria: (1) explicit reference to small-scale farmers, small-scale producers or smallholders; (2) explicit reference to farmer organizations, as defined in the protocol (https://osf.io/4gt3b/); (3) explicit reference to SSA, individual SSA countries or India; (4) published after the year 2000; (5) explicit reference to the impacts of FOs on livelihoods, including food security, income or the environment; (6) focus on agricultural production (crop or animal) for human and animal consumption; (7) no focus on stallholder
Nature Food | VOL 1 | OctOber 2020 | 620–630 | www.nature.com/natfood 627

152 | Sustainable solutions to end hunger
Articles Nature Food
activities in forestry, agroforestry, fisheries and aquaculture; (8) use of primary and secondary data to demonstrate contribution to outcomes; (9) published in English or French. The PRISMA flow diagram summarizes the study selection process and indicates the number of articles excluded at each phase of screening (Supplementary Fig. 1.6). The data extraction template (available in the Supplementary Information) documented the study type and various aspects of FOs and their membership.
Study selection. Studies were selected following a three-stage process. The first stage involved title screening, a process where the main elements of each study are reviewed, such as the PICo components (participants, intervention and comparator, but not outcomes) that can help identify the corpus of relevant studies60. Title screening helped to considerably reduce the workload of citation screening while maintaining high recall of relevant studies60. In this study, manual title screening was enhanced by machine learning to accelerate the process. The machine learning model provided additional metadata about each study, including the identification of a study population and study geography. The additional metadata accelerated the speed with which title screening could be conducted. The second stage consisted of uploading the remaining articles to Covidence, a systematic review software package that performs title and abstract screening to exclude articles that did not meet the inclusion criteria. Two independent authors reviewed each title and abstract, and a third independent author resolved discrepancies. In the third stage, a single reviewer performed full-text screening of papers that met all inclusion criteria and those whose eligibility could not be established during title and abstract screening. Supplementary Fig. 1.6 presents the study selection process and indicates the number of articles excluded at each phase of screening. Some of the papers presented multiple studies such as ref. 61 covering two studies from Ethiopia, ref. 62 covering studies from Kenya and Uganda, ref. 63 covering India and Ethiopia, ref. 64 covering two studies from Kenya and ref. 65 covering two studies from India. Thus, the number of studies that this review refers to (n = 239) exceeds the number of papers (N = 234) included in the review. In addition, some of the included studies used aggregated household data that did not allow us to clearly separate FOs of the same type and that, in some cases, operate in adjacent locations and/or belonged to the same umbrella organization. Because the studies often discuss services and impacts across the multiple FOs, we were not able to clearly separate these FOs in the studies; this could have led to underreporting of the total number of FOs that have been studied in the individual papers.
Data extraction and analysis. A data extraction template for scoping reviews originally developed in ref. 66 was adapted for this scoping review. The data extraction template is available in Supplementary Data 1. Extracted data included all basic citation information and each study’s location, design and methodology. We also extracted data about FOs in the studies, including their type and cost of membership, number of years in operation and focal activities of crops and livestock. These indicators were selected because of their reported potential influence on achieving impacts in the literature9,52,64. We also collected information about the services FOs provide to members, including marketing services, output marketing, market information, financial services, technology services such as education, extension, research, skills, technology access, infrastructure development and management, managing common property resources and others.
The impacts of FOs were separated into categories, detailing impacts of FOs services on livelihoods, agricultural production and the environment. As stated in Box 1, livelihood impacts include changes in income and food security. We also collected impacts that are often reported on the literature on FOs’ impacts such as improvements in yield, production quality and empowerment67–69.
Given that SDG target 2.4 concerns the linkages between agricultural production and the environment, information about the impacts of FOs on the environment was also collected. The environmental impacts were identified as the outcomes of services primarily aimed at improving the benefits to members such as income, yield or production quality (for example through access to irrigation, improved grazing land or reduced impacts of climate change on production). Environmental impacts included resilience-building and responses to climate change such as flood protection and changes in water quality and quantity, soil characteristics and erosion, land in production/set aside, biodiversity, the use of renewable energy sources/reduced used of fossil fuel-based energy and others. To specify the impacts, we also collected any quantification noted in the studies such as percentage change in income, change in yield and production quality, percentage of change in land use and others. Similarly, we documented the presence or lack thereof any external and socio-demographic factors that could potentially influence the impacts of FO services.
The data extraction also included an assessment of the quality of the methodology used in each of the included papers. We examined whether sampling methods were clearly specified and whether the sampling strategy for both qualitative and quantitative studies were suitable—in particular, if the sample selection was based on specific criteria to select the FOs’ members and non-members of the FOs and if these criteria were explicitly listed in the study.
Next, the studies were reviewed for their methodology justification based on the studies’ research design, focusing on two criteria: if the methodology used control groups and/or conducted pre- and post- assessments when assessing the FOs’ benefits to the members. Finally, we assessed whether a clear description of the method and methods used for data analysis and its appropriateness to make sure reported FO’s benefits to the members are based on data collected from the sample instead of for example based on literature. Based on these criteria, studies lacking clearly-stated methodological approaches and/or deemed inadequate were classified as low quality (Supplementary Table 1.1).
We synthesized data on FO services and their impacts on livelihood and the environment in the context of documented external and socio-demographic factors. Contextual details on the basic characteristics of FOs included in the studies, such as their geographical location, years of operation, membership type and fees can be found in Supplementary Figs. 1.3 and 1.4.
Data availabilityAll data are available from the corresponding author on reasonable request.
Code availabilityThe scripts used for literature screening/selection and data analysis are available on request from the corresponding author. The protocol for this study was registered on the Open Science Framework before study selection, and can be accessed at https://osf.io/cxrwb/.
Received: 22 March 2020; Accepted: 11 September 2020; Published online: 12 October 2020
References 1. Sustainable Development Goal 2 (Sustainable Development Knowledge
Platform, UN, 2017); https://sustainabledevelopment.un.org/sdg2 2. Ricciardia, V., Ramankuttya, N., Mehrabia, Z., Jarvisa, L. & Chookolingoa, B.
How much of the world’s food do smallholders produce? Glob. Food Secur.17, 64–72 (2018).
3. The State of Food and Agriculture 2014: Innovation in Family Farming (FAO, 2014).
4. Bacon, C. M. et al. Explaining the ‘hungry farmer paradox’: smallholders andfair trade cooperatives navigate seasonality and change in Nicaragua’s cornand coffee markets. Glob. Environ. Change 25, 133–149 (2014).
5. Habtemariam, L. T. & Kassa, J. G. & Gandorfer, M.Impact ofclimate change on farms in smallholder farming systems: yield impacts,economic implications and distributional effects. Agric. Syst. 152, 58–66 (2017).
6. IPCC: Summary for Policymakers. In Climate Change and Land:An IPCC Special Report on Climate Change, Desertification, LandDegradation, Sustainable Land Management, Food Security, and GreenhouseGas Fluxes in Terrestrial Ecosystems (eds Shukla, P. R. et al) (IPCC, inthe press).
7. Thorp, R., Stewart, F. & Heyer, A. When and how far is group formation aroute out of chronic poverty? World Dev. 33, 907–920 (2005).
8. Ifejika, S. C., Kiteme, B., Wiesmann, U. & Jörin, J. Community-based waterdevelopment projects, their effectiveness, and options for improvement:lessons from Laikipia, Kenya. Afr. Geogr. Rev. 37, 192–208 (2016).
9. Markelova, H. & Mwangi, E. Collective action for smallholdermarket access: evidence and implications for. Afr. Rev. Policy Res. 27, 621–640 (2010).
10. Sumelius, J. et al. Cooperatives As a Tool For Poverty Reductionand Promoting Business In Tanzania Discussion Paper No. 65(Univ. Helsinki, 2013).
11. Okumu, B. & Muchapondwa, E. Welfare and Environmental Impact ofIncentive Based Conservation: Evidence from Kenyan Community ForestAssociations Working Paper No. 706 (Economic Research SouthernAfrica, 2017).
12. Gugerty, M. K., Biscaye, P. & Anderson, C. L. Delivering development?Evidence on self‐help groups as development intermediaries in South Asiaand Africa. Dev. Policy Rev. 37, 129–151 (2018).
13. Malawi Poverty Reduction Strategy Paper (Government of Malawi, 2002);https://www.imf.org/External/NP/prsp/2002/mwi/01/043002.pdf
14. Bijman, J. & Wijers, G. Exploring the inclusiveness of producer cooperatives.Curr. Opin. Environ. Sustain. 41, 74–79 (2019).
15. Shiferaw, B., Hellin, J. & Muricho, G. Improving market access andagricultural productivity growth in Africa: what role for producerorganizations and collective action institutions? Food Secur. 3, 475–489 (2011).
16. Chirwa, E. W. & Kydd, J. G. Study on Farmer Organizations in SmallholderTea in Malawi (Imperial College, 2005).
17. Francesconi, G. N. & Wouterse, F. Building the managerial capitalof agricultural cooperatives in Africa. Ann. Public Coop. Econ. 90, 141–159 (2019).
Nature Food | VOL 1 | OctOber 2020 | 620–630 | www.nature.com/natfood628

Sustainable solutions to end hunger | 153
ArticlesNature Food
18. Hussi, P., Murphy, J., Lindberg, O. & Brenneman, L. The Development ofCooperatives and Other Rural Organizations: The Role of the World Bank Technical Paper. No. WTP 199 (World Bank, 1993).
19. Okem, A. E. & Nene, M. N. An examination of the success factors ofcooperative-run agricultural schemes: a case study of Intlantsi AgriculturalSecondary Co-operative Limited. Int. J. Sust. Dev. World. 7, 112–120 (2014).
20. Luviene, N., Stitely, A. & Hoyt, L. Sustainable Economic Democracy: WorkerCooperatives for the 21st Century (Community Innovators Lab, MIT, 2010).
21. Chagwiza, C., Muradian, R. & Ruben, R. Cooperative membershipand dairy performance among smallholders in Ethiopia. Food Policy 56, 165–173 (2016).
22. Bernard, T., Taffesse, A. S. & Gabre‐Madhin, E. Impact of cooperativeson smallholders’ commercialization behavior: evidence from Ethiopia.Agric. Econ. 39, 147–161 (2008).
23. Gramzow, A., Batt, P. J., Afari-Sefa, V., Petrick, M. & Roothaert, R. Linkingsmallholder vegetable producers to markets: a comparison of a vegetableproducer group and a contract-farming arrangement in the Lushoto Districtof Tanzania. J. Rural Stud. 63, 168–179 (2018).
24. Trebbin, A. & Hassler, M. Farmers’ producer companies in India: a newconcept for collective action. Environ. Plan. 44, 411–427 (2012).
25. Boadu, F. O. Cooperatives in Sub-Saharan Africa: Agricultural Law andEconomics in Sub-Saharan Africa (Academic, 2016).
26. Maretzki, A. N. Women’s NutriBusiness cooperatives in Kenya: anintegrated strategy for sustaining rural livelihoods. J Nutr. Educ. Behav. 6, 327–334 (2007).
27. Ingabire, C. et al. Towards commercial agriculture in Rwanda: understandingthe determinants of market participation among smallholder bean farmers.Afr. J. Food Agric. Nutr. Dev. 17, 12492–12508 (2017).
28. Bezencon, V. Producers and the fair trade distribution systems: what are thebenefits and problems. Sustain. Dev. 19, 60–70 (2011).
29. Chindi, A. et al. Participatory potato seed production: a breakthrough forfood security and income generation in the central highlands of Ethiopia.Open Agric. 2, 205–212 (2017).
30. Wassie, S. B., Kusakari, H. & Masahiro, S. Inclusiveness and effectiveness ofagricultural cooperatives: recent evidence from Ethiopia. Int. J. Soc. Econ. 46, 614–630 (2019).
31. Deshmukh, A. R., Deokar, D. K., Jadhav, S. S. & Nimase, R. G. Study ofpresent working, financial position, business turn-over and business gain(profit/loss) of dairy co-operation societies of Raigad district. Asian J. Anim.Sci. 4, 226–230 (2009).
32. Bekele, T. & Ango, T. G. Do interventions from participatory action researchimprove livelihood and reduce conflicts over forest resources? A case studyfrom south central Ethiopia. Small-Scale For. 14, 441–458 (2015).
33. Mojo, D., Fischer, C. & Degefa, T. Collective action and aspirations: theimpact of cooperatives on Ethiopian coffee farmers’ aspirations. Ann. PublicCoop. Econ. 87, 217–238 (2016).
34. Dirwai, T. L., Senzanje, A. & Mudhara, M. Water governance impacts onwater adequacy in smallholder irrigation schemes in KwaZulu-Natal province,South Africa. Water Policy 21, 127–146 (2019).
35. Mutonyi, S. The effect of collective action on smallholder income and assetholdings in Kenya. World Dev. Perspect. 14, 100099 (2019).
36. Wossen, T. et al. Impacts of extension access and cooperative membershipon technology adoption and household welfare. J. Rural Stud. 54, 223–233 (2017).
37. Mogues, T., Morris, M., Freinkman, L., Adubi, A. & Ehui, S. in Public Expenditures for Agricultural and Rural Development in Africa(eds Mogues, T. & Benin, S.) 68–108 (Routledge, 2012).
38. Dorward, A. Integrating contested aspirations, processes and policy:development as hanging in, stepping up and stepping out. Dev. Policy Rev. 27, 131–146 (2009).
39. Bernard, T. & Spielman, D. J. Reaching the rural poor through rural producerorganizations? A study of agricultural marketing cooperatives in Ethiopia.Food Policy 34, 60–69 (2009).
40. Abate, G. T., Francesconi, G. N. & Getnet, K. Impact of agriculturalcooperatives on smallholders’ technical efficiency: empirical evidence fromEthiopia. Ann. Public Coop. Econ. 85, 257–286 (2014).
41. Gassner, A. et al. Poverty eradication and food security through agriculturein Africa? Rethinking objectives and entry points. Outlook Agric. 48, 309–315 (2019).
42. Minah, M. & Carletti, A. M. P. Mechanisms of inclusion: evidence fromZambia’s farmer organisations. Euro. J. Dev. Res. 31, 1318–1340 (2019).
43. Dohmwirth, C. & Hanisch, M. Women and collective action: lessons from theIndian dairy cooperative sector. Commun. Dev. J. 53, 675–693 (2018).
44. Sangeetha, V., Bahal, R., Singh, P. & Venkatesh, P. Impact of NGO-ledself-help groups on the empowerment of rural women—experiences fromSouth India. Outlook Agric. 42, 59–63 (2013).
45. Meier zu Selhausen, F. What determines women’s participation in collectiveaction? Evidence from a western Ugandan coffee cooperative. Fem. Econ. 22, 130–157 (2016).
46. Javdani, M. Malawi’s agricultural input subsidy: study of a GreenRevolution-style strategy for food security. Int. J. Agric. Sustain. 10, 150–163 (2012).
47. Ostrom, E. Governing the Commons: The Evolution of Institutions forCollective Action (Cambridge Univ. Press, 1990).
48. Aarnoudse, E., Closas, A. & Lefore, N. Water User Associations: A Reviewof Approaches and Alternative Management Options for Sub-Saharan Africa No. 615-2019-850 (IWMI, 2018).
49. Fratkin, E. & Mearns, R. Sustainability and pastoral livelihoods:lessons from East African Maasai and Mongolia. Hum. Organ. 62, 112–122 (2003).
50. Lutz, C. & Tadesse, G. African farmers’ market organizations andglobal value chains: competitiveness versus inclusiveness. Rev. Soc. Econ. 75, 318–338 (2017).
51. Fayet, L. & Vermeulen, W. J. Supporting smallholders to access sustainablesupply chains: lessons from the Indian cotton supply chain. Sustain. Dev. 22, 289–310 (2014).
52. Ojermark, P. & Chabala, C. The Development of Independent Cooperatives inZambia: A Case Study (FAO,1994).
53. Nilsson, J. Organisational principles for co-operative firms. Scand. J. Manag. 17, 329–356 (2001).
54. Daum, T. & Birner, R. Agricultural mechanization in Africa: myths, realitiesand an emerging research agenda. Glob. Food Secur. https://doi.org/10.1016/j.gfs.2020.100393 (2020).
55. Ton, G., Vellema, W., Desiere, S., Weituschat, S. & D’Haese, M. Contractfarming for improving smallholder incomes: what can we learn fromeffectiveness studies. World Dev. 4, 46–64 (2018).
56. Brodeur, A., Lé, M., Sangnier, M. & Zylberberg, Y. Star Wars: the empiricsstrike back. Am. Econ. J. Appl. Econ. 8, 1–32 (2016).
57. Arksey, H. & O’Malley, L. Scoping studies: towards a methodologicalframework. Int. J. Soc. Res. Methodol. 8, 19–32 (2005).
58. Levac, D., Colquhoun, H. & O’Brien, K. K. Scoping studies: advancing themethodology. Implement. Sci. 5, 69 (2010).
59. Tricco, A. C. et al. PRISMA extension for scoping reviews(PRISMA-ScR): checklist and explanation. Ann. Intern. Med. 169, 467–473 (2018).
60. Rathbone, J. et al. Expediting citation screening using PICo-based title-onlyscreening for identifying studies in scoping searches and rapid reviews.Syst. Rev. 6, 233 (2017).
61. Francesconi, G. N. Cooperation for Competition: Linking Ethiopian Farmers toMarkets (Wageningen Univ., 2009); https://edepot.wur.nl/122089
62. Ombogoh, D. B., Tanui, J., McMullin, S., Muriuki, J. & Mowo, J. Enhancingadaptation to climate variability in the East African highlands: a case forfostering collective action among smallholder farmers in Kenya and Uganda.Clim. Dev. 10, 61–72 (2016).
63. Gender and Governance in Rural Services: Insights from India, Ghana, andEthiopia (World Bank & IFPR, 2010); http://agris.fao.org/agris-search/search.do?recordID=US2014606530
64. Sibelet, N. & Montzieux, M. Resilience factors in the coffee sectorof Kenya: from food security to product removal. Cah. Agric. 21, 179–191 (2012).
65. Kurien, V. India’s Milk Revolution: Investing in Rural Producer Organizations (World Bank, 2007); http://documents.worldbank.org/curated/en/748851468771700148/Indias-milk-revolution-investing-in-rural-producer-organizations
66. Barrett, C., Ghezzi-Kopel, K., Hoddinott, J., Tennant, E. & Upton, J.The state of the literature on individual and household resilience:a scoping review. Open Science Framework https://doi.org/10.17605/osf.io/5rgb7 (2019)
67. Grashuis, J. & Su, Y. A review of the empirical literature on farmercooperatives: performance, ownership and governance, finance, andmember attitude. Ann. Public Coop. Econ. 90, 77–102 (2019).
68. Tefera, D. A., Bijman, J. & Slingerland, M. Agricultural co-operativesin Ethiopia: evolution, functions and impact. J. Int. Dev. 29, 431–453 (2017).
69. Durach, C. F., Kurpjuweit, S. & Wagner, S. M. The impact of additivemanufacturing on supply chains. Int. J. Phys. Distrib. Logist. Manag. 47, 954–971 (2017).
AcknowledgementsWe thank the Federal Ministry of Economic Cooperation (BMZ Germany) and the Bill & Melinda Gates Foundation for funding under the project Ceres2030: Sustainable Solutions to End Hunger.
Author contributionsK.G.-K. and J.K. led the search process, contributed to title screening and writing.L.B. liaised with M.M., R.M.R.T., M.H., A.C.C. and B.T. on the search process, coordinated the paper screening, contributed to screening at all stages, developed
Nature Food | VOL 1 | OctOber 2020 | 620–630 | www.nature.com/natfood 629

154 | Sustainable solutions to end hunger
Articles Nature Food
the data extraction template and contributed to data extraction, data analysis and writing. E.N. and L.T. identified the overall research question and contributed to article screening at the abstract stage and writing. R.M.R.T., C.I.S., E.N. and M.K. supplied specific aspects of cooperatives in Africa and India and FOs focused on natural resource management expertise, and contributed to writing. L.B., M.M. and R.M.R.T. led the data analysis and the policy recommendations.
Competing interestsThe authors declare no competing interests.
Additional informationSupplementary information is available for this paper at https://doi.org/10.1038/s43016-020-00164-x.
Correspondence and requests for materials should be addressed to L.B.
Reprints and permissions information is available at www.nature.com/reprints.
Publisher’s note Springer Nature remains neutral with regard to jurisdictional claims in published maps and institutional affiliations.
© The Author(s), under exclusive licence to Springer Nature Limited 2020
Nature Food | VOL 1 | OctOber 2020 | 620–630 | www.nature.com/natfood630

Sustainable solutions to end hunger | 155
Articleshttps://doi.org/10.1038/s43016-020-00172-x
1Université Norbert Zongo, Koudougou, Burkina Faso. 2Université Thomas Sankara, Ouagadougou, Burkina Faso. 3Université Nationale d’Agriculture de Kétou, Kétou, Benin. 4Institute of Development Studies–University of Sussex, Brighton, UK. 5Centre Universitaire Polytechnique de Kaya, Kaya, Burkina Faso. 6University of Minnesota, Saint Paul, MN, USA. 7Information Training and Outreach Centre for Africa, Centurion, South Africa. ✉e-mail: [email protected]
Youth in low- and middle-income countries (LMIC) dispro-portionately experience working poverty. In 2019, about 21% of employed youth in LMIC were living on less than US$2
a day, compared with 16% of the overall working population1. In sub-Saharan Africa, nearly 70% of working youth were found to be living in poverty; in South Asia, close to 50% were living in poverty2. Issues of youth unemployment and underemployment are linked to greater likelihood of future unemployment, decreased future job satisfaction, lower income and poorer health in adulthood3. National consequences include greater costs to support public pro-grammes (such as public work programmes that provide temporary jobs) and indirect costs of lower earnings such as loss of investment in education4,5. Furthermore, youth underemployment is linked to disillusionment and the possibility of social unrest6.
The working-age population in LMIC is predicted to double in the next 35 years7 and while this presents challenges, many LMIC are currently experiencing a demographic dividend phase where there is a high ratio of working-age population to dependents. This offers unique prospects for economic development with con-comitant reductions in poverty and food insecurity. Addressing unemployment and underemployment is, therefore, a major policy priority for LMIC6, and a key sector for the creation of employment opportunities, especially in Africa and Asia, is agriculture6,8,9.
Many people in LMIC rely on agriculture for their livelihoods (32% in 2019)10, either directly, as farmers, or indirectly in sec-tors that derive their existence from agricultural production8,9,11. Agricultural development is estimated to be up to 3.2 times more effective in alleviating poverty in low-income, resource-rich coun-tries than any other sector12. Due to the close links between poverty and food insecurity13–15, agricultural development could also have
positive consequences for the alleviation of hunger, particularly for women, as their empowerment in agriculture improves households’ food security and nutrition16–18.
However, there has been a declining trend of youth participation in agriculture since 2000, mainly in favour of the service sector6,19,20, which precipitates migration from rural to urban areas. Increased educational attainment for rural youth coupled with inability to rent or own land is a driver of urban migration21. In addition, the increasing ageing farmer population in rural areas exacerbates the demographic pressure on land at the expense of the youth22.
A further constraint on youth engagement in agriculture is a lack of education in disciplines related to agriculture or skills train-ing23–25. A study among Thailand’s youth reported that 71% identi-fied knowledge of farming practices as a pre-requisite to setting up a viable farm23. In rural Ethiopia, government initiatives to increase skills and productivity, and introduce improved and modern farm-ing methods have generated interest among youth in joining the sector, and in Indonesia, vocational training was noted as increas-ing the likelihood of a successful career in agriculture26. A study in Zambia on rural youth aspirations, opinions and perceptions on agriculture documented high interest among youth in more produc-tive forms of farming, such as the use of draught animals, electricity and the increased application of fertilizers24. Such findings chal-lenge an assumption common in policy proposals that youth are not interested in agriculture25. Today, with the development of informa-tion and communication technology (ICT), young people have more opportunities to strengthen their skills and access relevant information and are therefore well positioned to understand market dynamics, and institutional and financial systems, enabling them to initiate and capitalize on processes of change in the agricultural
A systematic review of employment outcomes from youth skills training programmes in agriculture in low- and middle-income countriesW. H. Eugenie Maïga 1 ✉, Mohamed Porgo 2, Pam Zahonogo2, Cocou Jaurès Amegnaglo3, Doubahan Adeline Coulibaly2, Justin Flynn4, Windinkonté Seogo5, Salimata Traoré 2, Julia A. Kelly 6 and Gracian Chimwaza7
Engagement of youth in agriculture in low- and middle-income countries may offer opportunities to curb underemployment, urban migration, disillusionment of youth and social unrest, as well as to lift individuals and communities from poverty and hun-ger. Lack of education or skills training has been cited as a challenge to engage youth in the sector. Here we systematically inter-rogate the literature for the evaluation of skills training programmes for youth in low- and middle-income countries. Sixteen studies—nine quantitative, four qualitative and three mixed methods—from the research and grey literature documented the effects of programmes on outcomes relating to youth engagement, including job creation, income, productivity and entrepre-neurship in agriculture. Although we find that skills training programmes report positive effects on our chosen outcomes, like previous systematic reviews we find the topic to chronically lack evaluation. Given the interest that donors and policymakers have in youth engagement in agriculture, our systematic review uncovers a gap in the knowledge of their effectiveness.
Nature Food | VOL 1 | OctOber 2020 | 605–619 | www.nature.com/natfood 605

156 | Sustainable solutions to end hunger
Articles Nature Food
sector27,28. Human capital theory predicts a positive correlation between human capital accumulation and labour productivity. On that basis, skills training can be used to improve agricultural employment outcomes29. Where governments and policy inter-ventions support skills training for youth, there is a real possibil-ity for entrepreneurship, a competitive economy and ultimately national growth. But, despite the implementation of skills train-ing interventions, generally via youth employment programmes30, few specifically target agricultural skills training in LMIC and very little is known about the effectiveness of youth agricultural interventions30,31.
Here we systematically review skills-based training interventions that aim to increase youth engagement in agricultural employment in LMIC to better inform investment decisions made by donors and policymakers. The interventions include agriculture-related courses, on-the-job training, technical or vocational education and training in agriculture, as well as general skills training includ-ing entrepreneurship, financial literacy and life skills for engage-ment in agriculture. The outcomes of interest we started out with were: employment along an agricultural value chain; employment in agribusiness; engagement in contract farming; development of agricultural entrepreneurship; agricultural business performance (productivity, profit, income, marketing rate); involvement in agricultural extension service provision. After data extraction, the outcomes of interest found in the selected studies are jobs created in the agricultural sector, self-employment and entrepreneurship, provision of and employment in extension services, profit/income/earnings from an agricultural activity or job, farm productivity, and the accessibility of employment opportunities in the sector. These outcomes pertain to the categories of jobs that can be found along the agricultural value chain.
We found among the studies yielded from the systematic litera-ture search that skills training interventions reported employment in agriculture, agribusiness or agriculture-related activities, devel-opment of agricultural entrepreneurship, agricultural business performances (productivity, profit, income) and involvement in agri-cultural extension service provision for young participants. However, we also found a chronic lack of evaluation of the effectiveness of interventions designed to enhance agricultural opportunities and engagement for young people in LMIC, a finding previously shown31.
ResultsSixteen studies were identified for review based on a priori inclusion and exclusion criteria (Fig. 1) detailed in our Preferred Reporting Items for Systematic Reviews and Meta-Analyses Protocol, PRISMA-P (Supplementary Material 1, summarized in Methods and published on Open Science Framework, https://osf.io/bhegq//).
Characteristics of selected studies. A data extraction template (Supplementary Table 2) was used to document all information of interest from each of the 16 studies, overviewed in Table 1.
Eleven of the studies were based in Africa32–42 and five in Asia43–47. Twelve of the studies were published in peer-reviewed journals33–36,39–42,44–47 and the rest originated from the grey litera-ture, including one dissertation38, one report37 and two working papers32,43.
With regard to the study design, nine of the included studies were quantitative32–37,43–45, four were qualitative41,42,46,47 and three used mixed non-experimental38–40 methods. Only one study used ran-domized control trial (RCT) as a study design method of evaluation32. Quasi-experimental impact methods (difference-in-differences (DID) and propensity score matching (PSM)) and quantitative non-experimental methods (statistical and econometric methods) were used in two33,43 and six34–37,44,45 studies, respectively. Nine of the included studies relied on survey data32–37,43–45, one study used data from interviews47, one study used data from focus groups42 and the
rest of the studies used mixed sources of data38–40 (Supplementary Table 3).
Table 2 collates information from the selected studies on the basis of types of intervention and participant characteristics. Technical education/training35,41,42,46 and vocational training37,40,44,45 consti-tuted half of the interventions (four, each); youth programmes, agriculture-related courses and on-the-job training were identi-fied as interventions in three33,34,38, two39,47 and one36 of the studies, respectively, and the remainder of the studies combined two types of intervention32,43. Twelve of the interventions were implemented through public policies33–35,37–39,41–45,47; non-governmental organiza-tions (NGOs) and a mix of institutions (public and private) were each identified as implementers in two32,36 and one46 of the studies, respectively, and one study reported intervention implemented by an international institution40.
Nine of the studies solely targeted youth32–35,37,38,43,45,46, and seven targeted mixed groups of youth and others36,39–42,44,47. In fourteen studies, the participants were from all genders. In nine of the studies,
Records after duplicates removed(n = 8,340, then 4,789 after date and
geographic limiting)
Additional records identifiedthrough other sources
(n = 5,318)
Iden
tific
atio
nEl
igib
ility
Incl
uded
Scre
enin
g
Studies included in thesynthesis(n = 16)
Records identified throughdatabase searching
(n = 3,790)
Full-text articlesexcluded, with reasons
(n = 245)
Full-text articlesassessed for eligibility
(n = 261)
Records excluded(n = 4,528)
Records screened(n = 4,789)
Fig. 1 | Selection of studies for review as per the PRISMA-P protocol. Inclusion criteria were youth as the target population; inclusion of one or more outcome of interest (employment along an agricultural value chain; employment in agribusiness; engagement in contract farming; development of agricultural entrepreneurship; agricultural business performance (productivity, profit, income, marketing rate); involvement in agricultural extension service provision); agriculture sector as field of study; skills training as an intervention; publication in English or French between 1990 and 2019; original research or review of existing research or institutional reports; targets low- and middle-income country or countries as area(s) of study (see list of World Bank country classifications (Supplementary Table 1); a clear and well-accepted methodology (studies were excluded if there was no clear method on sampling, data analysis or discussion of results). Studies meeting the inclusion criteria and targeting mixed group (youth and other demographic groups) were also retained in the search strategy. A double-blind title and abstract screening were performed on 4,789 articles that were uploaded to systematic review software, Covidence, for title and abstract screening. Each article was reviewed by two independent reviewers and discrepancies were resolved by a third independent author within the team. After title and abstract screening, 261 articles remained. From title and abstract screening, 16 articles met a priori inclusion criteria.
Nature Food | VOL 1 | OctOber 2020 | 605–619 | www.nature.com/natfood606
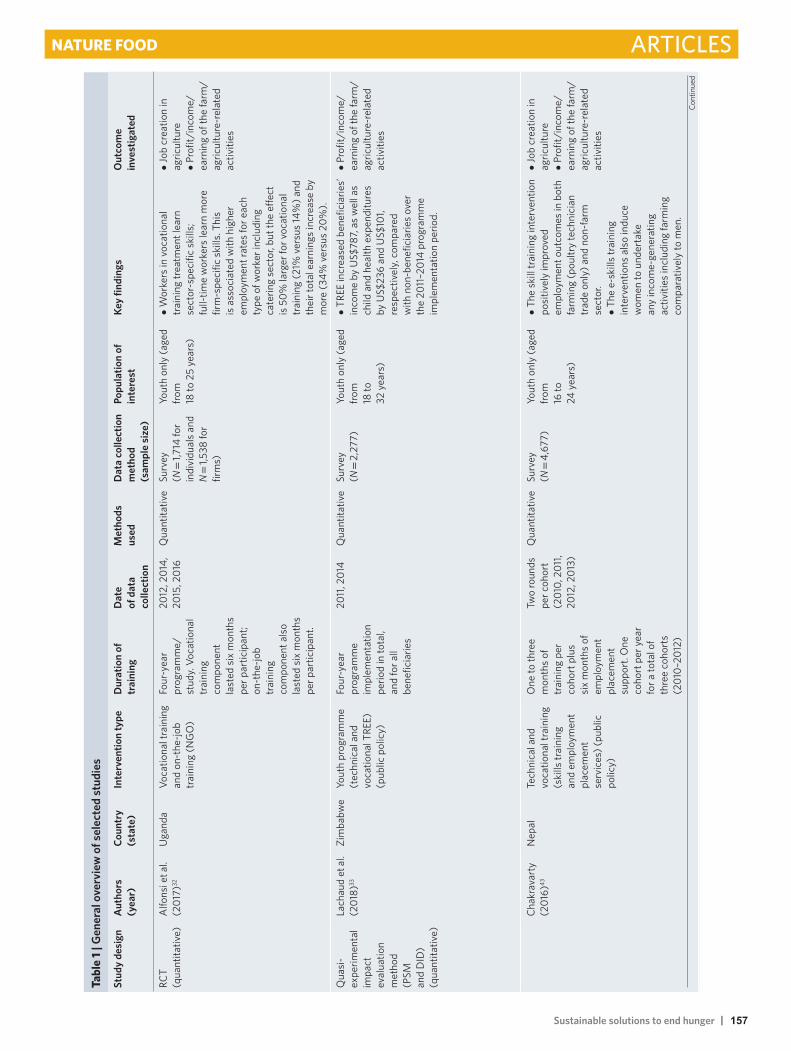
Sustainable solutions to end hunger | 157
ArticlesNature Food
tabl
e 1 |
Gen
eral
ove
rvie
w o
f sel
ecte
d st
udie
s
Stud
y de
sign
Aut
hors
(y
ear)
Coun
try
(sta
te)
Inte
rven
tion
type
Dur
atio
n of
tr
aini
ngD
ate
of d
ata
colle
ctio
n
Met
hods
us
edD
ata
colle
ctio
n m
etho
d
(sam
ple
size
)
Popu
latio
n of
in
tere
stKe
y fin
ding
sO
utco
me
in
vest
igat
ed
RCT
(qua
ntita
tive)
Alfo
nsi e
t al.
(201
7)32
Uga
nda
Voca
tiona
l tra
inin
g an
d on
-the
-job
trai
ning
(NG
O)
Four
-yea
r pr
ogra
mm
e/st
udy.
Voc
atio
nal
trai
ning
co
mpo
nent
la
sted
six
mon
ths
per p
artic
ipan
t; on
-the
-job
trai
ning
co
mpo
nent
als
o la
sted
six
mon
ths
per p
artic
ipan
t.
2012
, 201
4,
2015
, 201
6Q
uant
itativ
eSu
rvey
(N
= 1,
714
for
indi
vidu
als
and
N =
1,53
8 fo
r fir
ms)
Yout
h on
ly (a
ged
from
18
to 2
5 ye
ars)
• W
orke
rs in
voc
atio
nal
trai
ning
trea
tmen
t lea
rn
sect
or-s
peci
fic s
kills
; fu
ll-tim
e w
orke
rs le
arn
mor
e fir
m-s
peci
fic s
kills
. Thi
s is
ass
ocia
ted
with
hig
her
empl
oym
ent r
ates
for e
ach
type
of w
orke
r inc
ludi
ng
cate
ring
sect
or, b
ut th
e ef
fect
is
50%
larg
er fo
r voc
atio
nal
trai
ning
(21%
ver
sus
14%
) and
th
eir t
otal
ear
ning
s in
crea
se b
y m
ore
(34%
ver
sus
20%
).
• Jo
b cr
eatio
n in
ag
ricul
ture
• Pr
ofit/
inco
me/
earn
ing
of th
e fa
rm/
agric
ultu
re-r
elat
ed
activ
ities
Qua
si-
expe
rimen
tal
impa
ct
eval
uatio
n m
etho
d
(PSM
an
d D
ID)
(qua
ntita
tive)
Lach
aud
et a
l. (2
018)
33Zi
mba
bwe
Yout
h pr
ogra
mm
e (t
echn
ical
and
vo
catio
nal T
REE)
(p
ublic
pol
icy)
Four
-yea
r pr
ogra
mm
e im
plem
enta
tion
perio
d in
tota
l, an
d fo
r all
bene
ficia
ries
2011
, 201
4Q
uant
itativ
eSu
rvey
(N
= 2
,277
)Yo
uth
only
(age
d fro
m
18 to
32
yea
rs)
• TR
EE in
crea
sed
bene
ficia
ries’
in
com
e by
US$
787,
as
wel
l as
child
and
hea
lth e
xpen
ditu
res
by U
S$23
6 an
d U
S$10
1, re
spec
tivel
y, c
ompa
red
with
non
-ben
efic
iarie
s ov
er
the
2011
–201
4 pr
ogra
mm
e im
plem
enta
tion
perio
d.
• Pr
ofit/
inco
me/
earn
ing
of th
e fa
rm/
agric
ultu
re-r
elat
ed
activ
ities
Chak
rava
rty
(201
6)43
Nep
alTe
chni
cal a
nd
voca
tiona
l tra
inin
g (s
kills
trai
ning
an
d em
ploy
men
t pl
acem
ent
serv
ices
) (pu
blic
po
licy)
One
to th
ree
mon
ths
of
trai
ning
per
co
hort
plu
s si
x m
onth
s of
em
ploy
men
t pl
acem
ent
supp
ort.
One
co
hort
per
yea
r fo
r a to
tal o
f th
ree
coho
rts
(201
0–20
12)
Two
roun
ds
per c
ohor
t (2
010,
201
1, 20
12, 2
013)
Qua
ntita
tive
Surv
ey
(N =
4,6
77)
Yout
h on
ly (a
ged
from
16
to
24 y
ears
)
• Th
e sk
ill tr
aini
ng in
terv
entio
n po
sitiv
ely
impr
oved
em
ploy
men
t out
com
es in
bot
h fa
rmin
g (p
oultr
y te
chni
cian
tr
ade
only
) and
non
-farm
se
ctor
.•
The
e-sk
ills
trai
ning
in
terv
entio
ns a
lso
indu
ce
wom
en to
und
erta
ke
any
inco
me-
gene
ratin
g ac
tiviti
es in
clud
ing
farm
ing
com
para
tivel
y to
men
.
• Jo
b cr
eatio
n in
ag
ricul
ture
• Pr
ofit/
inco
me/
earn
ing
of th
e fa
rm/
agric
ultu
re-r
elat
ed
activ
ities
Cont
inue
d
Nature Food | VOL 1 | OctOber 2020 | 605–619 | www.nature.com/natfood 607

158 | Sustainable solutions to end hunger
Articles Nature Food
Stud
y de
sign
Aut
hors
(y
ear)
Coun
try
(sta
te)
Inte
rven
tion
type
Dur
atio
n of
tr
aini
ngD
ate
of d
ata
colle
ctio
n
Met
hods
us
edD
ata
colle
ctio
n m
etho
d
(sam
ple
size
)
Popu
latio
n of
in
tere
stKe
y fin
ding
sO
utco
me
in
vest
igat
ed
Corr
elat
iona
l (q
uant
itativ
e)Ch
eten
i (2
016)
34So
uth
Afr
ica
Yout
h pr
ogra
mm
e (p
ublic
pol
icy)
Not
spe
cifie
dN
ot
men
tione
dQ
uant
itativ
eSu
rvey
(N
= 14
0)Yo
uth
only
(age
d fro
m 15
to 3
5 ye
ars)
• Fr
om th
e lo
gist
ic re
gres
sion
: w
hen
yout
h pr
ogra
mm
es a
re
incr
ease
d by
one
uni
t (on
e pr
ogra
mm
e) y
outh
are
eig
ht
mor
e tim
es li
kely
to ta
ke
the
offe
r of p
artic
ipat
ing
in
agric
ultu
re p
rogr
amm
es.
• A
tota
l of 3
3% o
f re
spon
dent
s be
lieve
d th
at th
ey
will
be
self-
empl
oyed
.•
A to
tal o
f 18%
of
resp
onde
nts
stat
ed th
at th
ey
will
ear
n m
oney
by
selli
ng
agric
ultu
ral p
rodu
cts,
15%
be
lieve
d th
at p
artic
ipat
ion
will
lead
to a
per
man
ent j
ob,
13%
wer
e of
the
posi
tion
that
agr
icul
ture
will
alle
viat
e po
vert
y in
thei
r fam
ilies
. The
fin
ding
s of
the
surv
ey re
veal
ed
that
you
th p
erce
ive
agric
ultu
re
as a
bad
car
eer.
• W
hen
prog
ram
mes
ava
ilabl
e ar
e in
crea
sed
by a
uni
t, th
e od
ds ra
tio is
18 ti
mes
hig
her
and
ther
efor
e yo
uth
are
likel
y to
par
ticip
ate
in a
gric
ultu
ral
activ
ities
whe
n th
ey a
re m
ore
prog
ram
mes
ava
ilabl
e fo
r ag
ricul
ture
.
• En
gage
men
t/en
trep
rene
ursh
ip in
ag
ricul
ture
/con
trac
t fa
rmin
g/ag
ribus
ines
s
Sing
h et
al.
(201
0)44
Indi
aVo
catio
nal t
rain
ing
on a
gric
ultu
re a
nd
allie
d fie
lds
(pub
lic
polic
y)
Exac
t tra
inin
g du
ratio
n un
spec
ified
, but
th
e pr
ogra
mm
e la
sted
acr
oss
two
cale
ndar
ye
ars
(tha
t is,
19
98–1
999,
19
99–2
000,
20
00–2
001 a
nd
2004
–200
5)
Uns
peci
fied
Qua
ntita
tive
Surv
ey
(N =
200
)M
ixed
gro
up
(you
th a
nd
othe
rs)
• Th
e vo
catio
nal t
rain
ing
prog
ram
mes
hav
e re
sulte
d in
con
tinue
d ad
optio
n of
be
ekee
ping
and
mus
hroo
m
culti
vatio
n en
terp
rises
by
20%
and
51%
trai
ned
farm
ers,
re
spec
tivel
y.•
The
cont
inue
d ad
opte
rs o
f be
ekee
ping
and
mus
hroo
m
grow
ing
had
incr
ease
d th
eir
fam
ily in
com
e by
49%
and
24
%, r
espe
ctiv
ely.
• Pr
ofit/
inco
me/
earn
ing
of th
e fa
rm/
agric
ultu
re-r
elat
ed
activ
ities
Cont
inue
d
tabl
e 1 |
Gen
eral
ove
rvie
w o
f sel
ecte
d st
udie
s (c
ontin
ued)
Nature Food | VOL 1 | OctOber 2020 | 605–619 | www.nature.com/natfood608
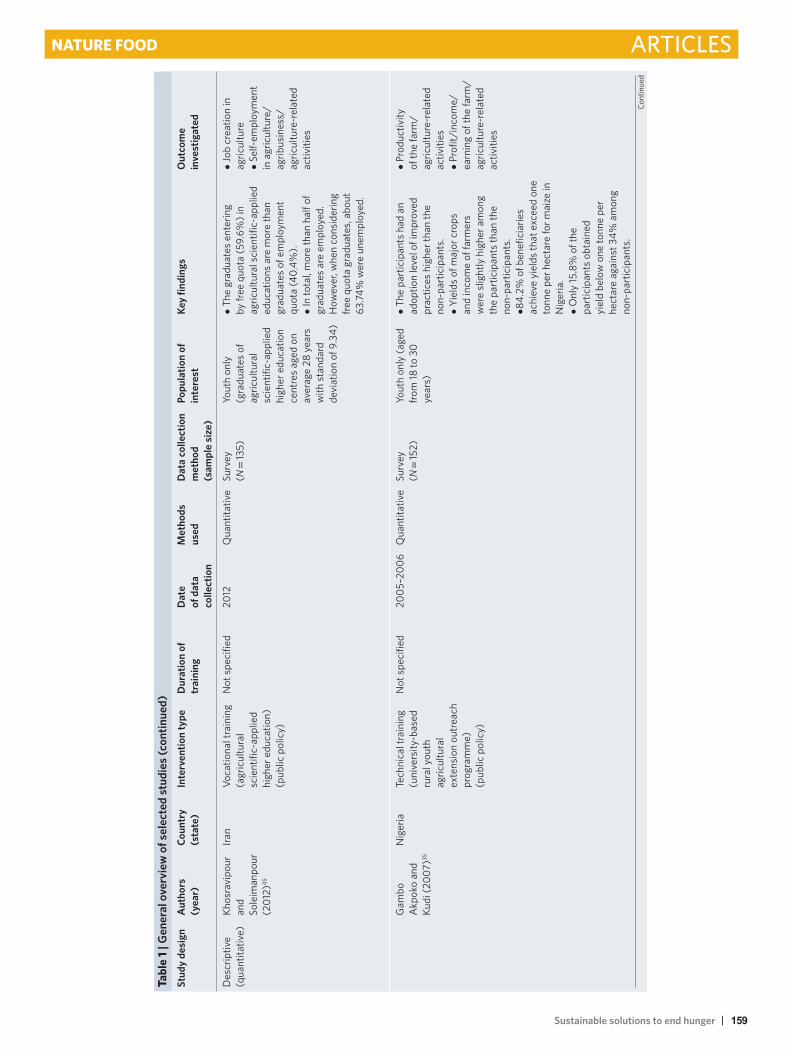
Sustainable solutions to end hunger | 159
ArticlesNature Food
Stud
y de
sign
Aut
hors
(y
ear)
Coun
try
(sta
te)
Inte
rven
tion
type
Dur
atio
n of
tr
aini
ngD
ate
of d
ata
colle
ctio
n
Met
hods
us
edD
ata
colle
ctio
n m
etho
d
(sam
ple
size
)
Popu
latio
n of
in
tere
stKe
y fin
ding
sO
utco
me
in
vest
igat
ed
Des
crip
tive
(qua
ntita
tive)
Khos
ravi
pour
an
d So
leim
anpo
ur
(201
2)45
Iran
Voca
tiona
l tra
inin
g (a
gric
ultu
ral
scie
ntifi
c-ap
plie
d hi
gher
edu
catio
n)
(pub
lic p
olic
y)
Not
spe
cifie
d20
12Q
uant
itativ
eSu
rvey
(N
= 13
5)Yo
uth
only
(g
radu
ates
of
agric
ultu
ral
scie
ntifi
c-ap
plie
d hi
gher
edu
catio
n ce
ntre
s ag
ed o
n av
erag
e 28
yea
rs
with
sta
ndar
d de
viat
ion
of 9
.34)
• Th
e gr
adua
tes
ente
ring
by fr
ee q
uota
(59.
6%) i
n ag
ricul
tura
l sci
entif
ic-a
pplie
d ed
ucat
ions
are
mor
e th
an
grad
uate
s of
em
ploy
men
t qu
ota
(40.
4%).
• In
tota
l, m
ore
than
hal
f of
grad
uate
s ar
e em
ploy
ed.
How
ever
, whe
n co
nsid
erin
g fre
e qu
ota
grad
uate
s, a
bout
63
.74%
wer
e un
empl
oyed
.
• Jo
b cr
eatio
n in
ag
ricul
ture
• Se
lf-em
ploy
men
t in
agr
icul
ture
/ag
ribus
ines
s/ag
ricul
ture
-rel
ated
ac
tiviti
es
Gam
bo
Akp
oko
and
Kudi
(200
7)35
Nig
eria
Tech
nica
l tra
inin
g (u
nive
rsity
-bas
ed
rura
l you
th
agric
ultu
ral
exte
nsio
n ou
trea
ch
prog
ram
me)
(p
ublic
pol
icy)
Not
spe
cifie
d20
05–2
006
Qua
ntita
tive
Surv
ey
(N =
152)
Yout
h on
ly (a
ged
from
18 to
30
year
s)
• Th
e pa
rtic
ipan
ts h
ad a
n ad
optio
n le
vel o
f im
prov
ed
prac
tices
hig
her t
han
the
non-
part
icip
ants
.•
Yiel
ds o
f maj
or c
rops
an
d in
com
e of
farm
ers
wer
e sl
ight
ly h
ighe
r am
ong
the
part
icip
ants
than
the
non-
part
icip
ants
.•8
4.2%
of b
enef
icia
ries
achi
eve
yiel
ds th
at e
xcee
d on
e to
nne
per h
ecta
re fo
r mai
ze in
N
iger
ia.
• O
nly
15.8
% o
f the
pa
rtic
ipan
ts o
btai
ned
yiel
d be
low
one
tonn
e pe
r he
ctar
e ag
ains
t 34%
am
ong
non-
part
icip
ants
.
• Pr
oduc
tivity
of
the
farm
/ag
ricul
ture
-rel
ated
ac
tiviti
es•
Prof
it/in
com
e/ea
rnin
g of
the
farm
/ag
ricul
ture
-rel
ated
ac
tiviti
es
Cont
inue
d
tabl
e 1 |
Gen
eral
ove
rvie
w o
f sel
ecte
d st
udie
s (c
ontin
ued)
Nature Food | VOL 1 | OctOber 2020 | 605–619 | www.nature.com/natfood 609

160 | Sustainable solutions to end hunger
Articles Nature Food
Stud
y de
sign
Aut
hors
(y
ear)
Coun
try
(sta
te)
Inte
rven
tion
type
Dur
atio
n of
tr
aini
ngD
ate
of d
ata
colle
ctio
n
Met
hods
us
edD
ata
colle
ctio
n m
etho
d
(sam
ple
size
)
Popu
latio
n of
in
tere
stKe
y fin
ding
sO
utco
me
in
vest
igat
ed
Hud
son
et a
l. (2
017)
36U
gand
a,
Tanz
ania
, Bu
rkin
a Fa
so,
Gha
na
On-
the-
job
trai
ning
th
roug
h ra
dio
prog
ram
mes
for
farm
er (N
GO
)
Prog
ram
me
inte
rven
tion
last
ed a
tota
l of
15 m
onth
s. T
his
seem
s to
hav
e be
en th
e ca
se in
al
l site
s, fo
r all
part
icip
ants
.
2015
Qua
ntita
tive
Surv
ey
(N =
1,93
1)M
ixed
gro
up
(you
th a
nd
othe
rs)
• Th
e IC
T-en
hanc
ed
part
icip
ator
y ra
dio
appr
oach
ha
s th
e po
tent
ial t
o en
hanc
e fo
od s
ecur
ity o
f sm
allh
olde
r fa
rmer
s in
sub
-Sah
aran
Afr
ica
(SSA
).•
The
part
icip
ator
y st
rate
gies
ca
n he
lp to
eng
age
audi
ence
s,
incr
ease
kno
wle
dge
of
agric
ultu
ral i
mpr
ovem
ents
and
in
nova
tions
, and
con
trib
ute
to
high
er le
vels
of a
dopt
ion
than
re
sult
from
list
enin
g al
one.
• Th
e in
tera
ctiv
ity h
as th
e po
tent
ial t
o co
ntrib
ute
to
wom
en’s
empo
wer
men
t.•
In m
ost c
ases
, sig
nific
antly
m
ore
liste
ners
ado
pted
the
agric
ultu
ral p
ract
ice
(gro
win
g or
ange
-fle
shed
pot
atoe
s)
that
was
the
focu
s of
the
part
icip
ator
y ra
dio
cam
paig
n th
an n
on-li
sten
ers.
• Se
lf-em
ploy
men
t in
agr
icul
ture
/ag
ribus
ines
s/ag
ricul
ture
-rel
ated
ac
tiviti
es
Wor
ld B
ank
(200
9)37
Gha
naVo
catio
nal
trai
ning
for y
outh
em
ploy
men
t pr
ogra
mm
e (p
ublic
po
licy)
Prog
ram
me
laun
ched
in
200
6.
Prog
ram
me
impl
emen
tatio
n is
on
a ye
arly
ba
sis
(for
eac
h co
hort
).
2006
–200
7Q
uant
itativ
eSu
rvey
(N
= 17
5,00
0)Yo
uth
only
(age
d fro
m 18
to 3
5 ye
ars)
• 92
,075
jobs
cre
ated
in
clud
ing
16,3
83 jo
bs in
ag
ribus
ines
s (1
7.8%
).
• Jo
b cr
eatio
n in
ag
ricul
ture
Cas
e st
udy
(qua
litat
ive)
or
cas
e st
udy +
de
scrip
tive
(mix
ed)
Baah
(201
4)38
Gha
naYI
AP
(ser
vice
s pr
ovid
ed u
nder
YI
AP
incl
ude
trai
ning
, ext
ensi
on
info
rmat
ion,
te
chni
cal s
uppo
rt
and
mar
ketin
g av
enue
s) (p
ublic
po
licy)
Prog
ram
me
intr
oduc
ed in
20
09. L
asts
for
two
year
s.
2014
Mix
ed
met
hods
Indi
vidu
al
inte
rvie
ws
and
surv
ey (N
= 4
4 fo
r bot
h)
Yout
h on
ly (a
ged
from
15 to
35
year
s)
• M
any
of th
e re
spon
dent
s st
ill
purs
ued
farm
ing
afte
r exi
ting
the
YIA
P. A
bout
86.
4% o
f the
re
spon
dent
s en
role
d fo
r the
YI
AP
in 2
011 s
taye
d in
farm
ing.
• Th
e m
ean
inco
me
of
GH
¢758
obt
aine
d by
be
nefic
iarie
s w
as fo
und
to b
e gr
eate
r tha
n th
e na
tiona
l mea
n an
nual
per
cap
ita in
com
e of
GH
¢734
(Gha
na L
ivin
g St
anda
rd S
urve
y, G
LSS
2008
).
• Jo
b cr
eatio
n in
ag
ricul
ture
• En
gage
men
t/en
trep
rene
ursh
ip in
ag
ricul
ture
/con
trac
t fa
rmin
g/ag
ribus
ines
s•
Prof
it/in
com
e/ea
rnin
g of
the
farm
/ag
ricul
ture
-rel
ated
ac
tiviti
es
Cont
inue
d
tabl
e 1 |
Gen
eral
ove
rvie
w o
f sel
ecte
d st
udie
s (c
ontin
ued)
Nature Food | VOL 1 | OctOber 2020 | 605–619 | www.nature.com/natfood610
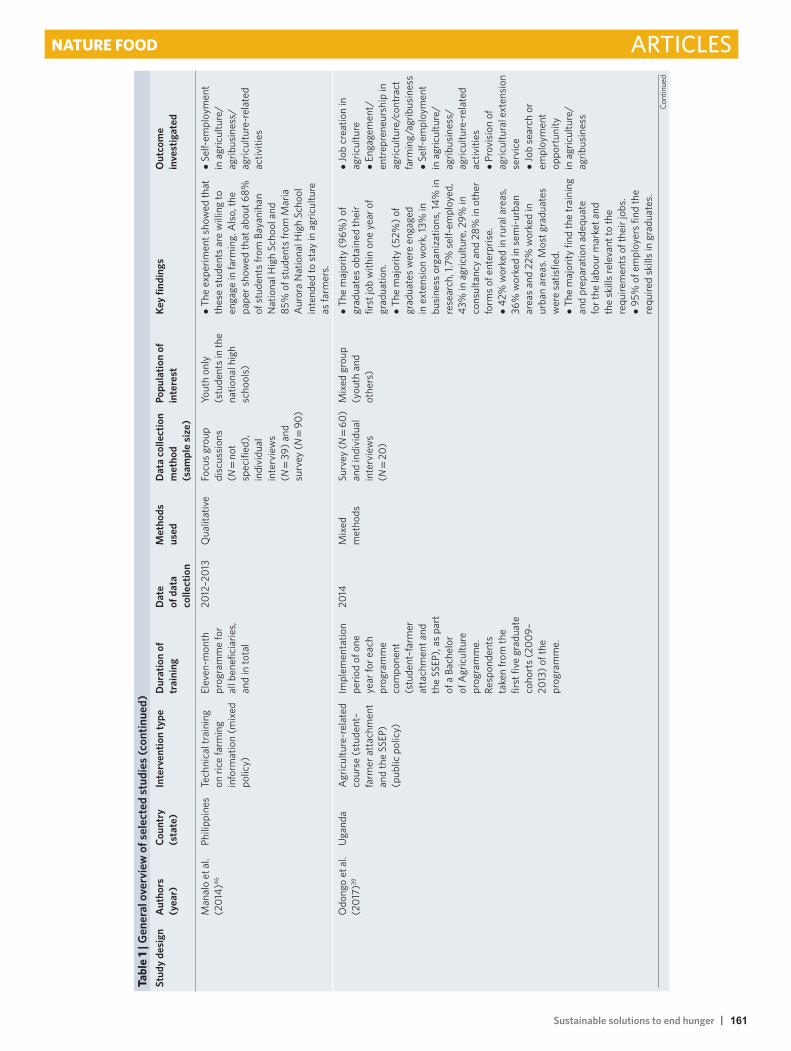
Sustainable solutions to end hunger | 161
ArticlesNature Food
Stud
y de
sign
Aut
hors
(y
ear)
Coun
try
(sta
te)
Inte
rven
tion
type
Dur
atio
n of
tr
aini
ngD
ate
of d
ata
colle
ctio
n
Met
hods
us
edD
ata
colle
ctio
n m
etho
d
(sam
ple
size
)
Popu
latio
n of
in
tere
stKe
y fin
ding
sO
utco
me
in
vest
igat
ed
Man
alo
et a
l. (2
014)
46Ph
ilipp
ines
Tech
nica
l tra
inin
g on
rice
farm
ing
info
rmat
ion
(mix
ed
polic
y)
Elev
en-m
onth
pr
ogra
mm
e fo
r al
l ben
efic
iarie
s,
and
in to
tal
2012
–201
3Q
ualit
ativ
eFo
cus
grou
p di
scus
sion
s (N
= n
ot
spec
ified
), in
divi
dual
in
terv
iew
s (N
= 3
9) a
nd
surv
ey (N
= 9
0)
Yout
h on
ly
(stu
dent
s in
the
natio
nal h
igh
scho
ols)
• Th
e ex
perim
ent s
how
ed th
at
thes
e st
uden
ts a
re w
illin
g to
en
gage
in fa
rmin
g. A
lso,
the
pape
r sho
wed
that
abo
ut 6
8%
of s
tude
nts
from
Bay
anih
an
Nat
iona
l Hig
h Sc
hool
and
85
% o
f stu
dent
s fro
m M
aria
A
uror
a N
atio
nal H
igh
Scho
ol
inte
nded
to s
tay
in a
gric
ultu
re
as fa
rmer
s.
• Se
lf-em
ploy
men
t in
agr
icul
ture
/ag
ribus
ines
s/ag
ricul
ture
-rel
ated
ac
tiviti
es
Odo
ngo
et a
l. (2
017)
39U
gand
aA
gric
ultu
re-r
elat
ed
cour
se (s
tude
nt–
farm
er a
ttac
hmen
t an
d th
e SS
EP)
(pub
lic p
olic
y)
Impl
emen
tatio
n pe
riod
of o
ne
year
for e
ach
prog
ram
me
com
pone
nt
(stu
dent
–far
mer
at
tach
men
t and
th
e SS
EP),
as p
art
of a
Bac
helo
r of
Agr
icul
ture
pr
ogra
mm
e.
Resp
onde
nts
take
n fro
m th
e fir
st fi
ve g
radu
ate
coho
rts
(200
9–20
13) o
f the
pr
ogra
mm
e.
2014
Mix
ed
met
hods
Surv
ey (N
= 6
0)
and
indi
vidu
al
inte
rvie
ws
(N =
20)
Mix
ed g
roup
(y
outh
and
ot
hers
)
• Th
e m
ajor
ity (9
6%) o
f gr
adua
tes
obta
ined
thei
r fir
st jo
b w
ithin
one
yea
r of
grad
uatio
n.•
The
maj
ority
(52%
) of
grad
uate
s w
ere
enga
ged
in e
xten
sion
wor
k, 13
% in
bu
sine
ss o
rgan
izat
ions
, 14%
in
rese
arch
, 1.7
% s
elf-
empl
oyed
, 43
% in
agr
icul
ture
, 29%
in
cons
ulta
ncy
and
28%
in o
ther
fo
rms
of e
nter
pris
e.•
42%
wor
ked
in ru
ral a
reas
, 36
% w
orke
d in
sem
i-urb
an
area
s an
d 22
% w
orke
d in
ur
ban
area
s. M
ost g
radu
ates
w
ere
satis
fied.
• Th
e m
ajor
ity fi
nd th
e tr
aini
ng
and
prep
arat
ion
adeq
uate
fo
r the
labo
ur m
arke
t and
th
e sk
ills
rele
vant
to th
e re
quire
men
ts o
f the
ir jo
bs.
• 95
% o
f em
ploy
ers
find
the
requ
ired
skill
s in
gra
duat
es.
• Jo
b cr
eatio
n in
ag
ricul
ture
• En
gage
men
t/en
trep
rene
ursh
ip in
ag
ricul
ture
/con
trac
t fa
rmin
g/ag
ribus
ines
s•
Self-
empl
oym
ent
in a
gric
ultu
re/
agrib
usin
ess/
agric
ultu
re-r
elat
ed
activ
ities
• Pr
ovis
ion
of
agric
ultu
ral e
xten
sion
se
rvic
e•
Job
sear
ch o
r em
ploy
men
t op
port
unity
in
agr
icul
ture
/ag
ribus
ines
s
Cont
inue
d
tabl
e 1 |
Gen
eral
ove
rvie
w o
f sel
ecte
d st
udie
s (c
ontin
ued)
Nature Food | VOL 1 | OctOber 2020 | 605–619 | www.nature.com/natfood 611
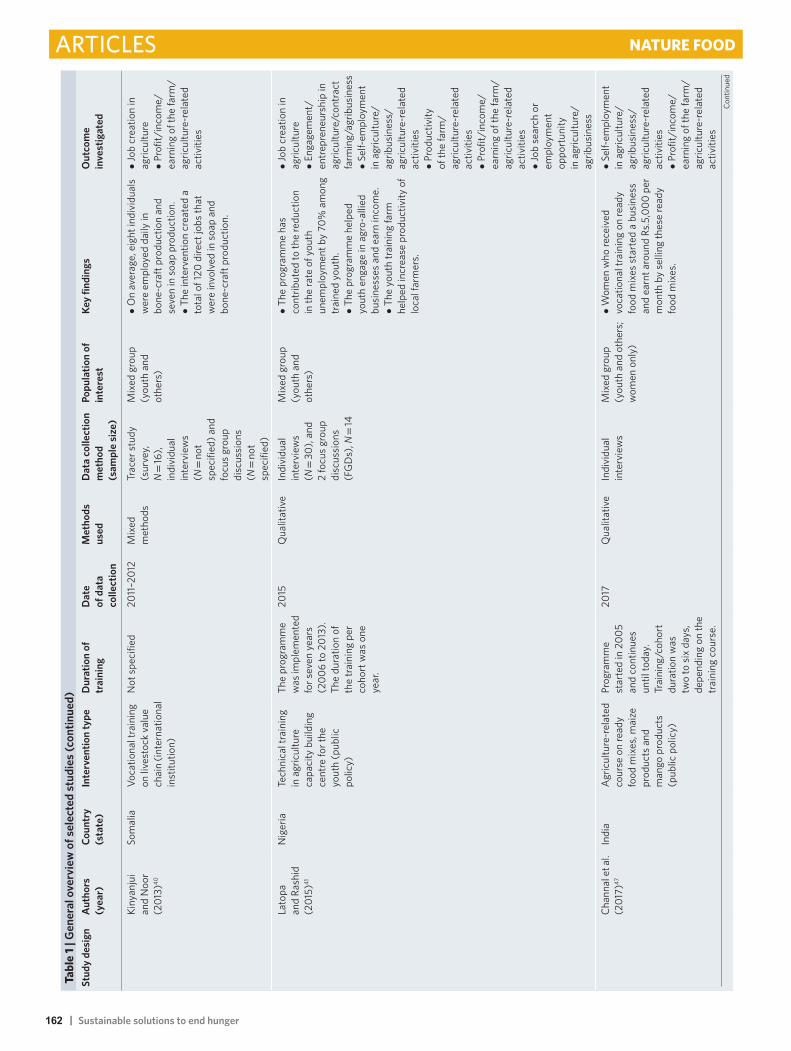
162 | Sustainable solutions to end hunger
Articles Nature Food
Stud
y de
sign
Aut
hors
(y
ear)
Coun
try
(sta
te)
Inte
rven
tion
type
Dur
atio
n of
tr
aini
ngD
ate
of d
ata
colle
ctio
n
Met
hods
us
edD
ata
colle
ctio
n m
etho
d
(sam
ple
size
)
Popu
latio
n of
in
tere
stKe
y fin
ding
sO
utco
me
in
vest
igat
ed
Kiny
anju
i an
d N
oor
(201
3)40
Som
alia
Voca
tiona
l tra
inin
g on
live
stoc
k va
lue
chai
n (in
tern
atio
nal
inst
itutio
n)
Not
spe
cifie
d20
11–2
012
Mix
ed
met
hods
Trac
er s
tudy
(s
urve
y,
N =
16),
indi
vidu
al
inte
rvie
ws
(N =
not
sp
ecifi
ed) a
nd
focu
s gr
oup
disc
ussi
ons
(N =
not
sp
ecifi
ed)
Mix
ed g
roup
(y
outh
and
ot
hers
)
• O
n av
erag
e, e
ight
indi
vidu
als
wer
e em
ploy
ed d
aily
in
bone
-cra
ft pr
oduc
tion
and
seve
n in
soa
p pr
oduc
tion.
• Th
e in
terv
entio
n cr
eate
d a
tota
l of 1
20 d
irect
jobs
that
w
ere
invo
lved
in s
oap
and
bone
-cra
ft pr
oduc
tion.
• Jo
b cr
eatio
n in
ag
ricul
ture
• Pr
ofit/
inco
me/
earn
ing
of th
e fa
rm/
agric
ultu
re-r
elat
ed
activ
ities
Lato
pa
and
Rash
id
(201
5)41
Nig
eria
Tech
nica
l tra
inin
g in
agr
icul
ture
ca
paci
ty b
uild
ing
cent
re fo
r the
yo
uth
(pub
lic
polic
y)
The
prog
ram
me
was
impl
emen
ted
for s
even
yea
rs
(200
6 to
201
3).
The
dura
tion
of
the
trai
ning
per
co
hort
was
one
ye
ar.
2015
Qua
litat
ive
Indi
vidu
al
inte
rvie
ws
(N =
30)
, and
2
focu
s gr
oup
disc
ussi
ons
(FG
Ds)
, N =
14
Mix
ed g
roup
(y
outh
and
ot
hers
)
• Th
e pr
ogra
mm
e ha
s co
ntrib
uted
to th
e re
duct
ion
in th
e ra
te o
f you
th
unem
ploy
men
t by
70%
am
ong
trai
ned
yout
h.•
The
prog
ram
me
help
ed
yout
h en
gage
in a
gro-
allie
d bu
sine
sses
and
ear
n in
com
e.•
The
yout
h tr
aini
ng fa
rm
help
ed in
crea
se p
rodu
ctiv
ity o
f lo
cal f
arm
ers.
• Jo
b cr
eatio
n in
ag
ricul
ture
• En
gage
men
t/en
trep
rene
ursh
ip in
ag
ricul
ture
/con
trac
t fa
rmin
g/ag
ribus
ines
s•
Self-
empl
oym
ent
in a
gric
ultu
re/
agrib
usin
ess/
agric
ultu
re-r
elat
ed
activ
ities
• Pr
oduc
tivity
of
the
farm
/ag
ricul
ture
-rel
ated
ac
tiviti
es•
Prof
it/in
com
e/ea
rnin
g of
the
farm
/ag
ricul
ture
-rel
ated
ac
tiviti
es•
Job
sear
ch o
r em
ploy
men
t op
port
unity
in
agr
icul
ture
/ag
ribus
ines
s
Chan
nal e
t al.
(201
7)47
Indi
aA
gric
ultu
re-r
elat
ed
cour
se o
n re
ady
food
mix
es, m
aize
pr
oduc
ts a
nd
man
go p
rodu
cts
(pub
lic p
olic
y)
Prog
ram
me
star
ted
in 2
005
and
cont
inue
s un
til to
day.
Trai
ning
/coh
ort
dura
tion
was
tw
o to
six
day
s,
depe
ndin
g on
the
trai
ning
cou
rse.
2017
Qua
litat
ive
Indi
vidu
al
inte
rvie
ws
Mix
ed g
roup
(y
outh
and
oth
ers;
w
omen
onl
y)
• W
omen
who
rece
ived
vo
catio
nal t
rain
ing
on re
ady
food
mix
es s
tart
ed a
bus
ines
s an
d ea
rnt a
roun
d Rs
.5,0
00 p
er
mon
th b
y se
lling
thes
e re
ady
food
mix
es.
• Se
lf-em
ploy
men
t in
agr
icul
ture
/ag
ribus
ines
s/ag
ricul
ture
-rel
ated
ac
tiviti
es•
Prof
it/in
com
e/ea
rnin
g of
the
farm
/ag
ricul
ture
-rel
ated
ac
tiviti
esCo
ntin
ued
tabl
e 1 |
Gen
eral
ove
rvie
w o
f sel
ecte
d st
udie
s (c
ontin
ued)
Nature Food | VOL 1 | OctOber 2020 | 605–619 | www.nature.com/natfood612

Sustainable solutions to end hunger | 163
ArticlesNature Food
Stud
y de
sign
Aut
hors
(y
ear)
Coun
try
(sta
te)
Inte
rven
tion
type
Dur
atio
n of
tr
aini
ngD
ate
of d
ata
colle
ctio
n
Met
hods
us
edD
ata
colle
ctio
n m
etho
d
(sam
ple
size
)
Popu
latio
n of
in
tere
stKe
y fin
ding
sO
utco
me
in
vest
igat
ed
Shou
lder
s et
al.
(201
1)42
Egyp
tTe
chni
cal t
rain
ing
on a
gric
ultu
ral v
alue
ch
ain
(pub
lic p
olic
y)
Thre
e-m
onth
fu
ll-tim
e in
tern
ship
s,
or s
ix-m
onth
pa
rt-t
ime
inte
rnsh
ips
2007
Qua
litat
ive
5 fo
cus
grou
p di
scus
sion
s (F
GD
s), N
= 7
5
Mix
ed g
roup
(y
outh
and
oth
ers)
• Pa
rent
s no
ted
that
thei
r ch
ildre
n br
ough
t new
kn
owle
dge
back
hom
e af
ter
thei
r int
erns
hips
.•
Stud
ents
and
par
ents
in
dica
ted
that
the
stud
ents
who
pa
rtic
ipat
ed in
the
inte
rnsh
ip
prog
ram
me
now
hav
e di
spos
able
inco
me,
whi
ch th
ey
had
neve
r had
pre
viou
sly.
• A
n in
crea
se in
col
labo
ratio
n am
ong
scho
ols,
fam
ilies
and
co
mm
uniti
es e
mer
ged
as a
th
eme
runn
ing
amon
g ea
ch o
f th
e fo
cus
grou
ps.
• Im
prov
ed re
latio
nshi
ps
betw
een
scho
ol a
nd fa
mili
es.
• Jo
b cr
eatio
n in
ag
ricul
ture
• En
gage
men
t/en
trep
rene
ursh
ip in
ag
ricul
ture
/con
trac
t fa
rmin
g/ag
ribus
ines
s•
Prof
it/in
com
e/ea
rnin
g of
the
farm
/ag
ricul
ture
-rel
ated
ac
tiviti
es•
Job
sear
ch o
r em
ploy
men
t op
port
unity
in
agr
icul
ture
/ag
ribus
ines
s
Stud
ies
wer
e id
entif
ied
for r
evie
w a
s pe
r the
PRI
SMA
-P p
roto
col.
Dat
a w
ere
extr
acte
d us
ing
a te
mpl
ate
avai
labl
e as
Sup
plem
enta
ry T
able
2. S
tudi
es a
re d
escr
ibed
her
e pr
imar
ily a
ccor
ding
to th
eir d
esig
n: q
uant
itativ
e, q
ualit
ativ
e an
d m
ixed
met
hods
. DID
and
PSM
are
als
o im
pact
ev
alua
tion
met
hods
that
use
a tr
eate
d an
d co
ntro
l gro
ups
appr
oach
to a
sses
s th
e ef
fect
iven
ess
of a
n in
terv
entio
n.
tabl
e 1 |
Gen
eral
ove
rvie
w o
f sel
ecte
d st
udie
s (c
ontin
ued)
participants were a mixed group of those already and not yet engaged in agriculture32,34,37,39,41–44,46; in five of the studies, participants were already engaged in agriculture before receiving skills training inter-ventions35–37,45,47; there was not enough information to determine whether the participants were already engaged in agriculture in two studies33,40. Six of the studies indicated that the participants resided in rural areas33–36,46,47, while participants located in urban areas and in both rural and urban areas were identified in four32,38,40,45 and five37,39,41,43,44 of the studies, respectively; there was not enough information to determine the location of the participants in one42 study. The population targeted in the studies was both educated and non-educated youth. Among the nine studies32–35,37,38,43,45,46 that focused exclusively on youth, two targeted youth with a secondary education background34,46, one45 targeted youth with a university background and six32,33,35,37,38,43 of the studies targeted youth with a mixed educational background.
Risk of bias assessment. We evaluated the risk of bias of the included studies based on a previous approach48. The domains of risk retained are (1) the sampling technique used for the study, (2) the type of intervention, (3) the choice of the area of study, (4)the population targeted, (5) the method of data collection, (6) themethod of data analysis, (7) the measurement of outcome and (8)the statistical significance of the effect. For each domain of risk,the criteria evaluated were defined and rated by their relevancefor assessing the effectiveness of the interventions. SupplementaryTable 4 summarizes the criteria of each domain of risk and itsassessment and rating.
Using this scale, 15% of our included studies are at low risk of bias, 60% at moderate risk of bias and the remaining 25% at serious risk of bias. The outcome of the risk of bias assessment of the included studies in this systematic review is presented in Table 3.
The risk of bias assessment process highlighted differences in focus, methods used and standards of evidence across the included studies. Weaknesses in study design, survey methods and method of evaluation of the impact of the interventions were common in most of the studies (with the exception of the studies ranked at low risk of bias), leading to weak results and limited generalizability.
Effects on youth employment outcomes. The youth employment outcomes of interest to this systematic review are job creation, self-employment, engagement in entrepreneurship, provision of extension services, productivity of the farm/agriculture-related activities, profits/income, and job search or employment opportu-nity in agriculture-related activities. Here we elaborate on the study design and risk of bias of all studies, and highlight the effects on outcomes of interest for a selection of low and moderate risk studies.
Job creation in agriculture. Eight studies32,38–43,45 looked at job cre-ation in agriculture as an outcome. Among those studies, three are quantitative studies32,43,45, two are qualitative studies41,42 and three are mixed-methods studies38–40.
In one quantitative study, deemed at low risk of bias (Table 3), 1,700 workers and 1,500 firms were followed over four years to com-pare the effects of offering workers vocational training and offering firms wage subsidies to train workers on-the-job (firm training) in Uganda32. The results showed that both interventions allowed participants to acquire sector-specific skills and firm-specific skills leading to higher employment rates post-training for each type of worker, but the effect was greater for vocational training com-pared with firm training (21% versus 14% post-training employ-ment rate) and their total earnings rose by more compared with the firm-training intervention (34% versus 20%). The qualitative stud-ies41,42, although not designed to assess the effectiveness of an inter-vention, highlighted a link between skills training and employment
Nature Food | VOL 1 | OctOber 2020 | 605–619 | www.nature.com/natfood 613

164 | Sustainable solutions to end hunger
Articles Nature Food
outcome. However, both studies were deemed at serious risk of bias. A mixed-methods study38 on youth programmes in Ghana showed that about 86.4% of young people still pursued maize farming a year after exiting the Youth in Agriculture Programme (YIAP). This pub-lic intervention was implemented to address youth unemployment in Ghana with the goal of getting young people to engage in the agricultural sector. The four main components of the programme were crops/block farm, livestock and poultry, fisheries/aquaculture, and agribusiness. The study focuses on evaluating the crops/block farm component. The crops cultivated under the YIAP include maize (seed and grain), sorghum, soybean, tomato and onion. This study is ranked at moderate risk of bias.
Self-employment in agriculture. Six studies36,39,41,45–47 indicated that skills training interventions resulted in self-employment in agriculture.
table 2 | Types of intervention and participant characteristics of the selected studies
Number of studies
Percentage of studies
Type of intervention
Agriculture-related courses 2 12.5
On-the-job training 1 6.25
Technical education/training 4 25
Vocational training 4 25
Youth programme 3 18.75
Technical + vocational training 1 6.25
Vocational + on-the-job training 1 6.25
Source of intervention
International institution 1 6.25
Mixed 1 6.25
NGO 2 12.5
Public policy 12 75
Type of participant
Mixed group (youth + others) 7 43.75
Only youth 9 56.25
Gender of participants
Female 1 6.25
Mixed 14 87.5
Other 1 6.25
Occupational status of participants
Participant already engaged in agriculture
5 31.25
Mixed group 9 56.25
Other 2 12.50
Location of participants
Rural 6 37.5
Urban 4 25
Mixed 5 31.25
Other 1 6.25
Educational background for studies focusing on the youth only
Secondary 2 22
University 1 11
Mixed group 6 67
Out of these studies, two studies are quantitative36,45, three are quali-tative41,46,47 and one is a mixed-methods study39.
In one quantitative study36, self-employment was stimulated by a skills training radio campaign on growing orange-fleshed sweet potatoes in Ghana, Tanzania, Burkina Faso and Uganda. A survey of the local communities where the radio campaign was run found that households that reported hearing the educational radio cam-paign in Ghana, Tanzania, Burkina Faso and Uganda were 8.9, 2.3, 1.7 and 1.1 times more likely, respectively, to engage in growing orange-fleshed sweet potatoes, than households that did not. This study is deemed at moderate risk of bias.
Engagement/entrepreneurship in agriculture. Five studies34,38,39,41,42 showed that skills training interventions encourage youth engage-ment or entrepreneurship in agriculture. Among these studies, one is quantitative34, two are qualitative41,42 and two are mixed-methods studies38,39. In the quantitative study, a youth programme includ-ing agriculture content (training in livestock production, crop pro-duction and dairy farming) in South Africa indicated that youth engagement or self-employment in agriculture is eight times higher when agricultural programmes that specifically target the youth are implemented compared with when agricultural programmes are not available. This study is deemed at moderate risk of bias. Regarding the mixed-methods studies, one study38, deemed at moderate risk of bias with youth programme (YIAP in Ghana) as intervention, showed that after exiting the programme, 86.4% of beneficiaries were still involved in farming within a year. The qualitative studies were deemed at serious risk of bias.
Productivity of the farm/agriculture. Two studies35,41 found that skills training interventions lead to higher productivity of the farms. One of the studies is quantitative35 and the other is qualitative41. In the quantitative study, estimated to be at moderate risk of bias, the National Agricultural Extension and Research Liaison Services (NAERLS) rural youth extension programmes (RUYEP) helped 84.2% of beneficiaries achieve yields that exceed one tonne per hect-are for maize in Nigeria, compared with 66% of non-participants35. The qualitative study41, outlined in Table 1, is deemed at serious risk of bias.
Profit/income earning of the farm. Ten studies32,33,35,38,40–44,47 looked at profit/income earning of the farm as an outcome. Among those studies, five are quantitative32,33,35,43,44, three are qualitative41,42,47 and two38,40 are mixed-methoda studies. In one of the quantitative stud-ies, the Training for Rural Economic Empowerment (TREE) pro-gramme increased beneficiaries’ income by US$787 compared with non-beneficiaries over the 2011–2014 programme implementation period33. This study is deemed at low risk of bias. Another quantita-tive study44, deemed at moderate risk of bias, found that the contin-ued adopters of beekeeping and mushroom growing had increased their family income by 49% and 24%, respectively. The three quali-tative studies, not described here but outlined in Table 1, are deemed at serious risk of bias41,42,47. The mixed-methods study40 showed that the creation of a company that recycled livestock by-product (bone crafts and soap production) allowed vulnerable women and youths to earn an additional US$44.6 from bone crafts and US$50.2 from soap production weekly. This study is at moderate risk of bias.
Job search or employment opportunity. Three studies39,41,42 inves-tigated the effect of skills training on this outcome. One study is a mixed-methods design39 and two41,42 are qualitative. All of these studies, not described here but outlined in Table 1, are deemed at serious risk of bias.
Provision of agricultural extension service. One study39 investigated on the effects of skills interventions on provision of agricultural
Nature Food | VOL 1 | OctOber 2020 | 605–619 | www.nature.com/natfood614

Sustainable solutions to end hunger | 165
ArticlesNature Food
extension service and found that the majority of graduates who benefited from student–farmer attachment and/or the Supervised Student Enterprise Project (SSEP) were engaged in extension work. This study, outlined in Table 1, is deemed at serious risk of bias.
Intervention type and engagement in agriculture. Agriculture- related courses. Two studies39,47 used agriculture-related courses as interventions. One of these studies is a mixed-methods study39 and the other is qualitative47. The mixed-methods study investigated several outcomes in agriculture, namely, job creation, entrepreneur-ship, self-employment, provision of agricultural extension service and job search opportunity, which were found to improve with the skills training interventions. The interventions consisted of introducing innovations in agricultural training curricula (community engagement and agri-enterprise development) at Gulu University in Uganda. The community engagement took the form of a one year (or less) placement of undergraduate students
to work with smallholder farmers and farmer groups within a 10 km radius of the university. The agri-enterprise development con-sisted of having the students design business plans; the best plans were rewarded with start-up capital. The employment rate among the graduates was 84% six months after graduation and increased to 90% after one year; less than 2% of the graduates created their own businesses. The qualitative study47 investigated two outcomes in agriculture, self-employment and income, which were found to increase after skills training on ready food mixes, maize products and mango products. The two studies are deemed to be at serious risk of bias.
Technical education/training. Four studies35,41,42,46 used technical edu-cation/training as interventions. Only one of these studies is quan-titative35; the others are qualitative41,42,46. The quantitative study35 investigated productivity and income of the farm, and found both to increase after the intervention. The NAERLS RUYEP objectives
table 3 | Risk of bias assessment
Number Authors (years)
Sampling Intervention Area of study
Population Method of data collection
Method of data analysis
Outcome Significance Total number of stars
Score (%)
Level of risk of bias
1 Alfonsi et al. (2017)32
3 1 2 2 4 5 2 2 21 91 Low
2 Lachaud et al. (2018)33
3 1 3 2 4 4 2 2 21 91 Low
3 Chakravarty (2016)43
3 1 1 2 4 4 1 2 18 78 Low
4 Cheteni (2016)34
1 2 2 2 4 3 1 2 17 74 Moderate
5 Singh et al. (2010)44
3 1 1 1 4 3 1 2 16 70 Moderate
6 Khosravipour and Soleimanpour (2012)45
3 1 2 2 3 2 1 2 16 70 Moderate
7 Gambo Akpoko and Kudi (2007)35
2 1 3 2 4 2 0 2 16 70 Moderate
8 Hudson et al. (2017)36
3 1 3 1 4 2 0 2 16 70 Moderate
9 World Bank (2009)37
1 1 1 2 3 2 1 2 13 57 Moderate
10 Baah (2014)38 1 2 2 2 4 2 1 1 15 65 Moderate
11 Manalo et al. (2014)46
1 1 3 2 4 2 0 1 14 61 Moderate
12 Odongo et al. (2017)39
1 1 1 1 4 2 0 1 11 48 Serious
13 Kinyanjui and Noor (2013)40
1 1 2 1 4 2 1 0 12 52 Moderate
14 Latopa and Rashid (2015)41
1 1 1 1 2 1 0 1 8 35 Serious
15 Channal et al. (2017)47
1 1 3 1 1 1 1 1 10 43 Serious
16 Shoulders et al. (2011)42
1 1 0 1 2 1 0 1 7 30 Serious
The evaluation of the included studies bias is based on a previous approach48. For example, for the domain of risk relating to the sampling technique, three criteria were identified: random sampling, non-random sampling and a mix of the two types of sampling. The maximum rate a study can obtain in this domain is three stars. If the study used a random sampling technique, it gets three stars; if it uses a mix of the two types of sampling, it gets two stars; and if the sampling technique is not random, it gets one star (see Supplementary Table 4 for details on the criteria used).
Nature Food | VOL 1 | OctOber 2020 | 605–619 | www.nature.com/natfood 615

166 | Sustainable solutions to end hunger
Articles Nature Food
are to provide technical advisory services to boost agricultural pro-duction and raise living standards of the youth. The results showed that the intervention allowed 84.2% of beneficiaries to achieve yields that exceed one tonne per hectare for maize in Nigeria, compared with 66% of non-participants. This study is deemed at moderate risk of bias. Among the qualitative studies, one46 looked at self-employment as an outcome and found a positive association with the intervention. The other two qualitative studies are deemed of serious risk of bias.
Youth programme. Youth programmes are programmes that target youth and train them in either specific skills (agricultural skills, ICT skills and so on) or broad skills (decision-making skills, business skills and so on) to enhance their employability. These have been used as interventions in three studies33,34,38. One of these studies is mixed methods38 and the two others are quantitative33,34. The mixed-methods study38 investigated the following outcomes in agri-culture: job creation, engagement and income; a positive association was found between youth programme and both engagement and income. The results showed that about 86.4% of young people still pursued maize farming one year after exiting the programme and the mean income of GH¢758 obtained by beneficiaries was found to be greater than the national mean annual per capita income of GH¢734. Among the two quantitative studies33,34, one investigated the income of beneficiaries33 and the other34 looked at engagement in agriculture; both found a positive effect of the intervention on their outcome. The study that investigated the income of beneficiaries as an outcome revealed that the TREE programme increased benefi-ciaries’ income by US$787 compared with non-beneficiaries over the 2011–2014 programme implementation period33. In the other study34, a youth programme including agriculture content (train-ing in livestock production, crop production and dairy farming) in South Africa indicated that youth engagement or self-employment in agriculture is eight times higher when agricultural programmes that specifically target the youth are implemented compared with when agricultural programmes are not available. Given that all three
studies are at moderate or low risk of bias, we can conclude that the findings suggest that youth programmes have the potential to influ-ence youth engagement in agriculture.
On-the-job training. Only one study36 looked at on-the-job training as an intervention. The outcome investigated is self-employment, on which the intervention had a positive effect. The results showed that households that reported listening to an educational radio campaign in Ghana, Tanzania, Burkina Faso and Uganda were 8.9, 2.3, 1.7 and 1.1 times more likely, respectively, to engage in growing orange-fleshed sweet potatoes, than households that did not. The study was deemed at moderate risk of bias.
Vocational training. Vocational training has been used as an inter-vention by four studies37,40,44,45. Among these studies, three are quan-titative37,44,45 and one is a mixed-methods study40. One quantitative study44 investigated income as an outcome, on which positive effects of the intervention were found in India. The findings indicated that vocational training programmes have resulted in continued adop-tion of beekeeping and mushroom cultivation enterprises by 20% and 51% of trained farmers, respectively, and increased their family income by 49% and 24%, respectively. The second quantitative study investigated job creation and self-employment as outcomes and found positive links with the training45. The results of the study highlighted that vocational training in agriculture in Iran resulted in employment of more than half of graduates. The third quantitative study found a positive effect of the intervention on job creation, the sole outcome it had investigated37. The study showed that vocational training for a youth employment programme in Ghana resulted in the creation of 16,383 jobs in agribusiness. All four studies are deemed at moderate risk of bias (Table 3); however, the use of descriptive methods in some of these studies preclude us from con-cluding that they are effective in improving employment outcomes for youth in the agricultural sector.
Vocational training and technical training. One study43 investigated the combination of vocational training and technical training as an intervention. The outcomes investigated are job creation and income, on which the intervention had a positive effect. The study indicated that vocational training and technical training in agricul-ture (poultry technician) resulted in an increase in employment of 34.2% among the 41 beneficiaries who were trained as poultry tech-nicians in Nepal. This study is deemed at low risk of bias, suggesting that combining vocational training and technical training may be a way of improving job prospects and income for youth in the agri-cultural sector.
Vocational training and on-the-job training. One study32 investi-gated the combination of vocational training and on-the-job train-ing as an intervention. The outcomes investigated are job creation and earnings, on which the intervention had a positive effect. The results showed that both interventions allowed participants to acquire sector-specific skills and firm-specific skills, leading to higher employment rates post-training for vocational-trained workers compared with firm-trained workers (21% versus 14% post-training employment rate) and their total earnings rose by more compared with the firm-trained workers (34% versus 20%). This study is deemed at low risk of bias.
Duration of training. Ten studies out of the 16 overviewed in Table 1 presented information on the duration of training. Eight of these have programmes that last one year or less. The remaining studies indicated a training duration between two and five years. This sug-gests that training programmes predominantly have a relatively short-term duration, which is consistent with many interventions taking the form of technical and vocational education/training.
table 4 | Inclusion and exclusion criteria
Inclusion criteria Exclusion criteria
Study includes youth as the target population
Study does not include youth as the target population
Study must focus on one of our outcomes of interest
Study does not include one of our outcomes of interest
Study targets agriculture sector as field of study
Study does not include agriculture as target field of study
Study includes skills training as an intervention
Study does not include skills training as intervention
Study published from 1990 to 2019 in English or French
Study not written in English or French and published before 1990
Study reported as original research or review of existing research or institutional reports
Study that is neither original research nor a review of existing research nor reports
Study targets low- and middle-income country or countries as area(s) of study
Study that does not target low- and middle-income countries
Study with a clear and well-accepted methodology
Study does not have a clear or well-accepted methodology
The exclusion criteria are the opposite of the inclusion criteria. Our outcomes of interest are: employment along an agricultural value chain; employment in agribusiness; engagement in contract farming; development of agricultural entrepreneurship; agricultural business performance (productivity, profit, income, marketing rate); involvement in agricultural extension service provision. By well-accepted methodology we mean studies were excluded if there was no clear method on sampling, data analysis or discussion of results. For the list of World Bank country classifications, see Supplementary Table 3. English and French were chosen given the language proficiency of the researchers.
Nature Food | VOL 1 | OctOber 2020 | 605–619 | www.nature.com/natfood616

Sustainable solutions to end hunger | 167
ArticlesNature Food
The popularity of technical and vocational/education training as a model of intervention may be due to the relatively short-term nature of the training, or due to the nature of technical and voca-tional training, which is well suited for out-of-school youth, which are found in large numbers in LMIC49.
DiscussionIssues facing youth engagement in agriculture today are relatively well documented, including educational attainment, matrimonial status, gender, household size, parental income and occupation, membership in social organization, access to ICT, land tenure sys-tem and access to state-run agricultural youth programmes50–52. This present systematic review, which focused solely on interven-tions to engage youth in agriculture, yielded a limited set of stud-ies—nine quantitative, four qualitative and three mixed-methods studies—so generalizable conclusions are difficult to draw. The risk of bias assessment yielded three studies32,33,43 deemed at low risk of bias, nine studies34–38,40,44–46 deemed at moderate risk of bias and four studies deemed at serious of risk bias39,41,42,47.
The results of our systematic review generally are in line with those found by the systematic review of Kluve et al.53 on interven-tions to improve the labour market outcomes of youth. That sys-tematic review of 107 interventions, including skills training, in 31 countries, found small positive effects for promoting entrepre-neurship and skills training—especially integrated skills training programmes—but not for employment services and subsidized employment.
Our systematic review also demonstrated that in general, skills interventions seeking to motivate youth’s engagement in agri-culture do not undergo a thorough evaluation for effectiveness, with hard outcomes related to employment. Our selected studies included case studies and qualitative methods, which are not ade-quate methods of evaluating impact and effectiveness of interven-tions. Only one study used an RCT32. The two studies relying on a quasi-experimental approach used DID and PSM methods33,43. Indeed, the results of the risk of bias assessment indicated the studies relying on RCT and quasi-experimental impact evaluation methods were at low risk of bias. However, these study designs are expensive to conduct. We found that of the studies that evaluate interventions, the majority did not use state-of-the-art impact eval-uation methods. This has been corroborated by other studies30,31, showing a chronic lack of evaluation of interventions that aim to provide agricultural skills to youth.
Training on ICT is an important aspect for attracting and retain-ing youth in the agricultural sector46. ICT offers a method of deliv-ering training to a large number of farmers, which could enhance the performance of the youth already in agriculture and attract new youth to the sector36. Radio campaigns have been shown to be effective in spurring adoption and consumption of orange-fleshed potatoes in Ghana, Tanzania, Burkina Faso and Uganda36. A study conducted in the Philippines found that ICT training helps motivate secondary school students whose parents are engaged in agriculture to work within the sector, especially when combined with offline activities such as exposure and hands-on experience as well as cre-ative and motivational actitivites46.
It is important to note that heterogeneity in gender and education are not accounted for in the analysis of the impacts of education on youth participation in agriculture. Our systematic review revealed that most of the included studies failed to address the effectiveness of targeting the population of interest—educated and uneducated youth. Illiteracy and gender heterogeneity were not addressed in the included studies. Indeed, no studies assessed the effects of train-ing interventions on illiterate youth. This calls for investigations to focus on this vulnerable group of society, which represent about 25% of youth in sub-Saharan Africa and 11% in Southern Asia54. Failing to account for such variation in the background of the youth
participants limits the ability to assess the effectiveness of skills training interventions.
The absence of robust research and lack of effective evaluation of the available data on the effectiveness of agricultural youth employ-ment interventions has notable consequences on potential invest-ment. Ultimately, the commitment of policymakers is necessary to ensure the sustainability and success of interventions to boost youth’s engagement in agriculture. It is encouraging that the majority of interventions (12 studies out of 16) studied originated from pub-lic policy, compared with three originating from non-public policy programmes (NGOs, international institution) and one from mixed policies (public and non-public policies). However, to provide a compelling basis on which to convince governments and donors to fund future interventions, as well as encourage young people to par-take in training, cost-effectiveness analysis and estimates of returns on investment in training programmes is necessary. Indeed, a 2018 stocktaking of the evidence on the effectiveness of youth employ-ment interventions in Africa found that for the agricultural sector in particular, “there is very little literature and virtually no evaluation evidence to inform policymakers about what types of interventions can improve the prospects of young people in the [agricultural] sec-tor”31. Our study supports this conclusion. Moreover, to ensure that the skills training provides long-term opportunities for youth, it is crucial to establish a periodic follow-up to assess how trainees are performing after completion of a training programme. This aspect was missing in most of the interventions reviewed in this systematic review, yet it is important to check that the youth who engage in agriculture after receiving skills training are still involved and thrive in their agriculture-related business in the long term.
In summary, there is a need to foster youth skills training pro-grammes and more importantly to evaluate more rigourously these programmes so that knowledge on good practices may be generated and transferred from one developing country to another. Estimates of returns to investment of agricultural skills training programmes are warranted as they could provide governments and donors with the evidence and cost-based analysis to continue and increase sup-port for such programmes. Interventions also need to account for heterogeneity in gender and educational background of the youth to foster sustainability in agricultural value chains, inform inclusive policy design and ultimately contribute to reducing poverty and food insecurity in LMIC.
MethodsThis systematic review was prepared following guidelines from Petticrew and Roberts55. The approach comprises five steps: identifying the research question; identifying relevant studies; study selection; extracting and charting the data; and collating, summarizing and reporting the results. The protocol for this study was registered on the Open Science Framework before study selection and can be accessed at https://osf.io/bhegq//. The guiding question for this systematic review was: What are the effects of skills training interventions on educated and non-educated youth employment outcomes in agricultural value chains, agribusiness or contract farming in LMIC? The inclusion and exclusion criteria to identify and then select the relevant studies are shown in Table 4.
Risk of bias assessment. Regarding the risk of bias assessment, each study was assessed following the criteria of the eight domains of risk of bias we considered. The maximum score a study can obtain in terms of minimizing all domains of risk of bias is 23 stars, which is 100% of the stars. A study is deemed to be at low risk of bias across all domains if its total score is in the interval 75–100%. If the total score is in the interval 50–75%, the study is said to be at moderate risk of bias across all domains. A study is at serious risk of bias if its score falls within the interval 25–50%. When the total score ranges from 0 to 25%, the study is deemed to be at critical risk of bias across all domains. See Supplementary Table 4 for details on the criteria used.
Search strategy. An exhaustive search strategy was developed and tested in CAB Abstracts to identify all available research pertaining to the effects of skills training interventions on educated and non-educated youth employment outcomes in agriculture in LMIC. Search terms were developed to address variations of the key concepts in the research question: skills training, youth, employment or
Nature Food | VOL 1 | OctOber 2020 | 605–619 | www.nature.com/natfood 617

168 | Sustainable solutions to end hunger
Articles Nature Food
engagement, and agriculture. Searches were performed on 9 May 2019 in the following electronic databases: CAB Abstracts (access via OVID); Web of Science Core Collection (access via Web of Science); EconLit (access via ProQuest); Agricola (access via OVID); and Scopus (access via Elsevier). Full search strategies for each database, including grey literature, can be accessed in their entirety at https://osf.io/xv56k/.
A comprehensive search of grey literature sources was also conducted. A list of the resources that were searched can be found at https://osf.io/xv56k/. The grey literature searches were performed using custom web-scraping scripts. The search strings were tested per website before initiating web-scraping. An existing Google Chrome extension was needed to scrape dynamically generated websites.
The results from the databases and the grey literature searches were combined and de-duplicated using a Python script. Duplicates were detected using title, abstract and same year of publication, where year of publication was a match, where title cosine similarity was greater than 85%, and where abstracts cosine similarity was greater than 80% or one of the abstracts (or both) was empty. When duplicates were found, the results from the databases and the grey literature searches were combined and duplicates were removed.
Following de-duplication, each citation was analysed using a machine-learning model. The model added more than 30 new metadata fields, such as identifying populations, geographies, interventions and outcomes of interest. This allowed for accelerated identification of potential articles for exclusion at the title/abstract screening stage.
Study selection and eligibility criteria. Systematic review software, Covidence, was used for both title/abstract and full-text screening decision-making with two independent reviewers evaluating each item. Citations were included in this study if they met all of the inclusion criteria noted above. Studies that did not meet all the inclusion criteria were excluded. Exclusion criteria were the inverse of the inclusion criteria. Each citation that met one of the exclusion criteria at the title, abstract or full-text screening phases were excluded. Studies included in the full-text screening stage were those that met all inclusion criteria and none of the exclusion criteria, or those whose eligibility could not be established during title/abstract screening. Reasons for exclusion were documented at the full-text screening phase.
The retrieval of hundreds of PDFs for full-text screening was done with a combination of automated and manual methods. For the automated method, a Python script was created that would handle the tasks of PDF discovery, download and file renaming using Google Scholar. The script read the bibliographic data from an Excel spreadsheet and then executed a script to retrieve the full-text PDF. If the article is spotted in the search results, the download link is clicked, and the article will be auto-renamed and marked as being downloaded. Manual methods were employed for those items that were not retrieved using the script.
A total of 245 records were identified for full-text screening. This screening process led to the identification of 16 studies that were considered adequate regarding the content and methodological rigour. The PRISMA flow diagram (Fig. 1) shows the steps followed during the screening process and the number of items that resulted after each step.
Data extraction. Data extraction was based on interventions and outcomes established in the research question and exclusion criteria. The data extraction focused on the outcomes of the studies, the methods used to obtain the outcomes, and the validity and reliability of those methods using a data-extraction form. To reduce risk of bias related to the extracted data, two separate researchers extracted data from each included study in the full-text review step. When disagreements occurred between researchers on data extracted from a study, a third researcher was engaged to resolve conflict by extracting data again from the study and the results were compared with those found previously. In total, 31 conflicts were solved among the 261 reviews. The critical appraisal of individual sources of evidence gave an indication of the strength of evidence provided and informed the standards followed for this systematic review.
Reporting Summary. Further information on research design is available in the Nature Research Reporting Summary linked to this article.
Data availabilityThe data that support the findings of this study are available from the corresponding author upon reasonable request.
Code availabilityThe code used in this study is available upon request.
Received: 23 December 2019; Accepted: 16 September 2020; Published online: 12 October 2020
References 1. World Employment and Social Outlook 2019: Trends for Youth (International
Labour Office, 2019).
2. World Youth Report: Youth and the 2030 Agenda for Sustainable Development(United Nations, 2018); https://www.un.org/development/desa/youth/wp-content/uploads/sites/21/2018/12/WorldYouthReport-2030Agenda.pdf
3. Kilimani, N. Youth employment in developing economies: evidence onpolicies and interventions. IDS Bull. 48, 13–32 (2017).
4. Global Employment Trends for Youth: Special Issue on the Impact of the GlobalEconomic Crisis on Youth (ILO, 2010).
5. Pieters, J. Youth Employment in LMIC (Institute of Labor Economics, 2013). 6. Yeboah, F. K. & Jayne, T. S. Africa’s evolving employment trends. J. Dev. Stud.
54, 803–832 (2018). 7. World Population Prospects 2019: Highlights ST/ESA/SER. A/423
(UN DESA, 2019). 8. Ellis, F. Rural Livelihoods and Diversity in LMIC (Oxford Univ. Press, 2000). 9. Pellegrini, L. & Tasciotti, L. Crop diversification, dietary diversity and
agricultural income: empirical evidence from eight LMIC. Can. J. Dev. Stud. 35, 211–227 (2014).
10. Employment by sex and age—ILO modelled estimates. ILOSTAT Database (International Labour Organization, accessed 14 February 2020);https://ilostat.ilo.org/data
11. Carletto, G. et al. Rural income generating activities in LMIC: re-assessing theevidence. Electron. J. Agric. Dev. Econ. 4, 146–193 (2007).
12. Christiaensen, L., Demery, L. & Kuhl, J. The (evolving) role of agriculture inpoverty reduction—an empirical perspective. J. Dev. Econ. 96, 239–254 (2011).
13. Reducing Poverty and Hunger: The Critical Role of Financing for Food,Agriculture and Rural Development (FAO, 2002).
14. Eicher, C. K. In Strategies for African Development (eds Berg, R. J. &Whitaker, J. S.) 242–275 (Univ. California Press, 1986).
15. de Alan, B. & MH, S. Linkages between poverty, food security andundernutrition: evidence from China and India. China Agric. Econ. Rev. 7, 655–667 (2015).
16. Sraboni, E., Malapit, H. J., Quisumbing, A. R. & Ahmed, A. U. Women’sempowerment in agriculture: what role for food security in Bangladesh?World Dev. 61, 11–52 (2014).
17. Sharaunga, S., Mudhara, M. & Bogale, A. Effects of ‘women empowerment’on household food security in rural KwaZulu‐Natal province. Dev. Policy Rev.34, 223–252 (2016).
18. Malapit, H. J. L. & Quisumbing, A. R. What dimensions of women’sempowerment in agriculture matter for nutrition in Ghana? Food Policy 52, 54–63 (2015).
19. Sumberg, J., Anyidoho, N. A., Leavy, J., te Lintelo, D. J. & Wellard, K.Introduction: the young people and agriculture ‘problem’ in Africa.IDS Bull. 43, 1–8 (2012).
20. Bezu, S. & Holden, S. Are rural youth in Ethiopia abandoning agriculture?World Dev. 64, 259–272 (2014).
21. Tadele, G. & Gella, A. A. Becoming a Young Farmer in Ethiopia: Processes andChallenges Working Paper 83 (Future Agricultures, 2014).
22. Lindsjö, K., Mulwafu, W., Andersson Djurfeldt, A. & Joshua, M. K.Generational dynamics of agricultural intensification in Malawi: challengesfor the youth and elderly smallholder farmers. Int. J. Agric. Sustain.https://doi.org/10.1080/14735903.2020.1721237 (2020).
23. Salvago, M. R., Phiboon, K., Faysse, N. & Nguyen, T. P. L. Young people’swillingness to farm under present and improved conditions in Thailand.Outlook Agric. 48, 282–291 (2019).
24. Daum, T. Of bulls and bulbs: aspirations, opinions and perceptions of ruraladolescents and youth in Zambia. Dev. Pract. 29, 882–897 (2018).
25. Yeboah, T. et al. Hard work and hazard: young people and agriculturalcommercialisation in Africa. J. Rural Stud. 76, 142–151 (2020).
26. Leavy, J. & Hossain, N. Who wants to farm? Youth aspirations, opportunitiesand rising food prices. IDS Working Papers https://doi.org/10.1111/j.2040-0209.2014.00439.x (2014).
27. Roser, M. & Ortiz-Ospina, E. Global education. Our World in Data https://ourworldindata.org/global-education (2016).
28. Gyimah-Brempong, K. & Kimenyi, M. S. Youth Policy and the Future ofAfrican Development (African Growth Initiative, 2013).
29. Foster, A. D. & Rosenzweig, M. R. Learning by doing and learning fromothers: human capital and technical change in agriculture. J. Political Econ. 103, 1176–1209 (1995).
30. Eichhorst, W. & Rinne, U. An Assessment of the Youth Employment Inventoryand Implications for Germany’s Development Policy (Institute of LaborEconomics, 2015).
31. Betcherman, G. & Khan, T. Jobs for Africa’s expanding youth cohort: astocktaking of employment prospects and policy interventions.IZA J. Dev. Migr. 8, 13 (2018).
32. Alfonsi, L. et al. Tackling Youth Unemployment: Evidence from a LabourMarket Experiment in Uganda (STICERD, LSE, 2017).
33. Lachaud, M. A., Bravo-Ureta, B. E., Fiala, N. & Gonzalez, S. P. The impact ofagri-business skills training in Zimbabwe: an evaluation of the Training forRural Economic Empowerment (TREE) programme. J. Dev. Effect. 10, 373–391 (2018).
Nature Food | VOL 1 | OctOber 2020 | 605–619 | www.nature.com/natfood618

Sustainable solutions to end hunger | 169
ArticlesNature Food
34. Cheteni, P. Youth participation in agriculture in the Nkonkobe DistrictMunicipality, South Africa. J. Hum. Ecol. 55, 207–213 (2016).
35. Gambo Akpoko, J. & Kudi, T. M. Impact assessment of university-based ruralyouth agricultural extension out-reach program in selected villages ofKaduna-State, Nigeria. J. Apppl. Sci. 7, 3292–3296 (2007).
36. Hudson, H. E., Leclair, M., Pelletier, B. & Sullivan, B. Using radio andinteractive ICTs to improve food security among smallholder farmers insub-Saharan Africa. Telecomm. Policy 41, 670–684 (2017).
37. Ghana—Job Creation and Skills Development: Main Report (World Bank, 2009). 38. Baah, C. Assessment of the Youth in Agriculture Programme in Ejura-
Sekyedumase District (Kwame Nkrumah Univ. Science and Technology, 2014). 39. Odongo, W., Kalule, S. W., Kule, E. K., Ndyomugyenyi, E. & Ongeng, D.
Responsiveness of agricultural training curricula in African universities tolabour market needs: the case of Gulu University in Uganda. African J. RuralDev. 2, 67–76 (2017).
40. Kinyanjui, W. & Noor, M. S. From waste to employment opportunities andwealth creation: a case study of utilization of livestock by-products inHargeisa, Somaliland. Food Nutr. Sci. 4, 1287–1292 (2013).
41. Latopa, A.-L. A. & Rashid, S. N. S. A. The impacts of integrated youthtraining farm as a capacity building center for youth agriculturalempowerment in Kwara State, Nigeria. Mediterr. J. Soc. Sci. 6, 524–532 (2015).
42. Shoulders, C. W., Barrick, R. K. & Myers, B. E. An assessment of the impactof internship programs in the agricultural technical schools of Egypt asperceived by participant groups. J. Int. Agric. Ext. Educ. 18, 18–29 (2011).
43. Chakravarty, S., Lundberg, M., Nikolov, P. & Zenker, J. The Role of TrainingPrograms for Youth Employment in Nepal: Impact Evaluation Report on theEmployment Fund (World Bank, 2016).
44. Singh, K., Peshin, R. & Saini, S. K. Evaluation of the agricultural vocationaltraining programmes conducted by the Krishi Vigyan Kendras (Farm ScienceCentres) in Indian Punjab. J. Agric. Rural Dev. Trop. Subtrop. 111, 65–77(2010).
45. Khosravipour, B. & Soleimanpour, M. R. Comparison of students’entrepreneurship spirit in agricultural scientific-applied higher educationcenters of Iran. Am. J. Agric. Environ. Sci. 12, 1012–1015 (2012).
46. Manalo, J. A. IV, Balmeo, K. P., Domingo, O. C. & Saludez, F. M. Young alliesof agricultural extension: the infomediary campaign in Aurora, Philippines.Philipp. J. Crop Sci. 39, 30–40 (2014).
47. Channal, G. P., Kotikal, Y. K. & Pattar, P. S. Empowering rural women as asuccessful entrepreneur—through Krishi Vigyan Kendra. Agric. Update 12, 498–501 (2017).
48. Sterne, J. A. et al. ROBINS-I: a tool for assessing risk of bias innon-randomised studies of interventions. BMJ 355, i4919 (2016).
49. How Does the Short-Term Training Program Contribute to Skills Developmentin Bangladesh? A Tracer Study of the Short-Term Training Graduates SouthAsia Region, Education Global Practice Discussion Paper (World Bank,2015).
50. Nnadi, F. N. & Akwiwu, C. D. Determinants of youths’ participation in ruralagriculture in Imo State, Nigeria. J. Appl. Sci. 8, 328–333 (2008).
51. Akpan, S. B., Patrick, I. V., James, S. U. & Agom, D. I. Determinants ofdecision and participation of rural youth in agricultural production: a casestudy of youth in southern region of Nigeria. Russ. J. Agric. Socio-Econ. Sci. 7, 35–48 (2015).
52. Adesugba, M. & Mavrotas, G. Youth Employment, Agricultural Transformation,and Rural Labour Dynamics in Nigeria (International Food Policy ResearchInstitute, 2016).
53. Kluve, J. et al. Interventions to Improve the Labour Market Outcomes of Youth:A Systematic Review of Training, Entrepreneurship Promotion, EmploymentServices and Subsidized Employment Interventions (The CampbellCollaboration, 2017).
54. Literacy Rates Continues to Rise from One Generation to the Next (UNESCOInstitute for Statistics, 2017).
55. Petticrew, M. & Roberts, H. Systematic Reviews in the Social Sciences:A Practical Guide (John Wiley & Sons, 2008).
AcknowledgementsWe thank J.-A. Porciello and M. Eber-Rose for helpful comments on earlier drafts of this manuscript. We gratefully acknowledge funding support from Bundesministerium für Wirtschaftliche Zusammenarbeit und Entwicklung (Federal Ministry for Economic Cooperation and Development in Germany) and The Bill and Melinda Gates Foundation as part of Ceres2030: Sustainable Solutions to End Hunger, a project administered by Cornell University, USA.
Author contributionsW.H.E.M., M.P. and P.Z. developed the research question. J.A.K. and G.C. conducted the literature search. All authors drafted the PRISMA-P protocol for this study. W.H.E.M., M.P., P.Z, C.J.A, D.A.C., J.F., W.S. and S.T. conducted the full-text reviews and drafted the paper, and all authors contributed to the writing.
Competing interestsThe authors declare no competing interests.
Additional informationSupplementary information is available for this paper at https://doi.org/10.1038/s43016-020-00172-x.
Correspondence and requests for materials should be addressed to W.H.E.M.
Reprints and permissions information is available at www.nature.com/reprints.
Publisher’s note Springer Nature remains neutral with regard to jurisdictional claims in published maps and institutional affiliations.
© The Author(s), under exclusive licence to Springer Nature Limited 2020
Nature Food | VOL 1 | OctOber 2020 | 605–619 | www.nature.com/natfood 619

170 | Sustainable solutions to end hunger
517
correspondence
Social protection to combat hungerTo the Editor — COVID-19 and the measures governments have put in place to prevent its aggravation have triggered an economic recession that will increase poverty rates and hunger. In June, the International Monetary Fund projected a 4.9% decline in global economic growth compared to 20191. A similar forecast has been generated under Ceres2030, a research project co-directed by the International Food Policy Research Institute, Cornell University and the International Institute for Sustainable Development that is calculating the cost of effective interventions to end hunger sustainably2. The estimate is that 95 million additional people, mostly from sub-Saharan Africa, will be living in extreme poverty by the end of the year3.
One of the first and most common policy responses to COVID-19 was to restrict the movement of people. For the approximately 85% of Africans who work in the informal sector, often living from day to day, the lockdown means that they are unable to put food on their families’ tables4. Senegal’s farmers and itinerant traders, for example, have been hit hard by the closing of markets, an overnight curfew and a ban on travel between regions that makes it difficult for them to sell their produce5. While initially the Senegalese government did not face major political opposition for its handling of the pandemic, recent unrest in Dakar and Touba has highlighted a dilemma shared by many countries in the region: measures taken to protect citizens’ health are damaging the livelihoods of millions who work in the informal sector, creating economic distress and adding to political tensions. Falling ill or dying from COVID-19 are not the only risks faced by the population.
Governments around the world have protected short-term income and purchasing power however they could, hoping to contain social upheaval and the number of decimated livelihoods6. Togo, for example, has recently announced the launch of an unconditional cash transfer scheme designed to support all Togolese informal workers whose incomes are disrupted by COVID-196.
Efforts like these, essential in times of crisis, are forms of social protection — that is, public or private initiatives that aid the poor and protect the vulnerable against livelihood risks. Social assistance (that is, the transfer of resources either as cash or in-kind) is a form of social protection that
restores some level of predictability and protects vulnerable households from hunger. By preventing the destocking of productive assets through distress sales, social assistance also protects investments that could contribute to food security, increased productivity and income, and more sustainable farming systems. Protection against hunger and prevention of asset depletion constitute the first two objectives of social protection.
The pandemic has laid bare the precariousness of the livelihoods of millions of people who have been unable to benefit from the opportunities created by two decades of economic growth in Africa7. Evidence reveals that the greater the inequality in the distribution of assets such as land, water, capital, finance, education and health, the more difficult it is for the poor to participate in economic growth processes8. Although responses to COVID-19 in the form of resource transfers help prevent and manage situations that adversely affect people’s well-being, they do not help households overcome their pre-existing state of vulnerability. Thus, as many countries start reducing social distancing measures related to COVID-19, they should also move towards a more sustainable set of policies to eradicate deep-rooted poverty and hunger, and pay greater attention to the third objective of social protection: the promotion of livelihoods.
Social protection favours increased productivity and higher incomes among small-scale food producers through several channels9. First, social protection payments (for example, unconditional cash transfers) reduce liquidity constraints, thus freeing household income for productive spending such as the purchase of agricultural inputs. When regular and predictable, these payments can facilitate small-scale savings or investment by acting as a collateral, enabling the beneficiaries to access credit. Second, social protection instruments can increase a household’s tolerance to risk by augmenting household wealth. With more financial reserves, household members tend to invest in their productive capacity by, for example, buying new machinery or experimenting with novel seed varieties. Third, social protection instruments may have a positive effect on food and nutrition security, which in turn will enhance labour productivity.
The positive effects of social protection programmes are not a given. In Kenya, a
recent model-based impact assessment showed that rural households receiving a cash transfer were benefiting from the increased income; the target population were households living in the greatest poverty10. But the recipients were not necessarily able to take advantage of the increased demand for goods and services that resulted from the rise in income within the community associated with the social protection programme because they lacked the necessary assets and labour hours to expand their activities. If social protection programmes were adequately designed to lift recipients out of poverty, indirect income gains for programme beneficiaries could be much larger. One way to do this is by supplementing cash or in-kind payments with training measures; a more skilled workforce would be better positioned to quickly expand its activities and increase productivity levels in response to a rise in demand, and eventually graduate from social protection programmes.
The so-called cash plus, livelihood or graduation programmes combine regular cash transfers with measures to encourage behavioural changes and/or address supply constraints. Ethiopia’s Productive Safety Net Programme, for example, has sought to promote agricultural production and productivity. Essentially, the programme combines unconditional cash or in-kind transfers to those who cannot supply labour with transfers that are conditional on supplying labour to public works. In addition, the programme includes livelihood development packages designed to build a pool of assets essential for sustained income generation and graduation from the programme. This mix of interventions has led to a reduction of the hunger period experienced by households every year by one-third (or 1.29 months per year on average)11. Yet, the programme has not enabled the graduation of its own beneficiaries, without which it may soon become too heavy of a fiscal burden to the national government. Ethiopia’s social protection programme demonstrates that desirable synergies exist, and the integration of social protection with measures to increase agricultural productivity holds the potential for making significant inroads towards the eradication of hunger.
Social protection schemes need to be multi-sectoral, broadened and institutionalized to be sufficiently redistributive and buffer the effects of
Nature Food | VOL 1 | September 2020 | 517–518 | www.nature.com/natfood

Sustainable solutions to end hunger | 171518
correspondence
economic slowdowns and downturns on food security. In particular, the engagement of agriculture ministries in the design and implementation of social protection programmes can maximize the impact of social sector expenditures on agricultural productivity — a powerful sweet spot for governments in their objective of achieving long-term poverty reduction and hunger eradication. ❐
Fleur Wouterse1, Sophia Murphy2 and Jaron Porciello 3 ✉1International Food Policy Research Institute (IFPRI), Washington, DC, USA. 2International Institute for Sustainable Development (IISD), Winnipeg, Manitoba, Canada. 3Cornell University, Department
of Global Development, Ithaca, NY, USA. ✉e-mail: [email protected]
Published online: 15 September 2020 https://doi.org/10.1038/s43016-020-00144-1
References 1. World Economic Outlook Update, June 2020: A Crisis Like No
Other, An Uncertain Recovery (IMF, 2020); https://go.nature.com/34bvYSG
2. Porciello, J., Laborde, D., Murphy, S. & Smaller, C. A Global Value Chain of Knowledge to End Hunger Sustainably (IISD, 2020); https://hdl.handle.net/1813/70166
3. Laborde, D., Bizikova, L., Lallemant, T. & Smaller, C. EndingHunger: What Would It Cost? (IISD, 2016).
4. Women and Men in the Informal Economy: A Statistical Picture 3rd edn (ILO, 2018); https://go.nature.com/3kTr8iQ
5. Senegal to ease some coronavirus curbs after protests escalate. Al Jazeera (4 June 2020); https://go.nature.com/3h8fGOa
6. Gentilini, U., Almenfi, M., Orton, I. & Dale, P. Social Protection and Jobs Responses to COVID-19: A Real-Time Review of Country Measures (World Bank, 2020); http://hdl.handle.net/10986/33635
7. McKay, A. J. Afr. Econ. 22, i49–i76 (2013). 8. The State of Food Security and Nutrition in the World 2019:
Safeguarding Against Economic Slowdowns and Downturns (FAO, 2019).
9. Wouterse, F. S. & Taffesse, A. S. Boosting Growth to End Hunger by 2025: The Role of Social Protection (IFPRI, 2018).
10. Thome, K., Filipski, M., Kagin, J., Taylor, J. E. & Davis, B. Am. J. Agric. Econ. 95, 1338–1344 (2013).
11. Berhane, G., Gilligan, D. O., Hoddinott, J., Kumar, N. & Taffesse, A. S. Econ. Dev. Cult. Change 63, 1–26 (2014).
Author contributionsF.W. drafted the manuscript. S.M. and J.P. provided critical revision of the manuscript. All authors approved the final version of the manuscript.
Competing interestsThe authors declare no competing interests.
Nature Food | VOL 1 | September 2020 | 517–518 | www.nature.com/natfood

172 176
CERES2030 AUTHORS
Maricelis Acevedo, Cornell University
Guigonan Adjognon, World Bank
Joaquin Arias, Inter-American Institute for Cooperation on Agriculture (IICA)
Jessica Ault, National Agricultural Library, USA
Isabelle Baltenweck, International Livestock Research Institute (ILRI)
Livia Bizikova, International Institute for Sustainable Development (IISD)
Ashley Celestin, Cornell University
Debbie Cherney, Cornell University
Gracian Chimwaza, Information and Training and Outreach Centre in Africa (ITOCA)
Karen Cichy, Michigan State University
Doubahan Coulibaly, University Thomas Sankara
Ruth DeFries, Columbia University
Florian Diekmann, The Ohio State University
David Laborde Debucquet, International Food Policy Research Institute (IFPRI)
Alan Duncan, The University of Edinburgh
Jochen Dürr, Center for Development Studies (ZEF), Bonn University
Mali Eber-Rose, Leeds University
Stefan Einarson Cornell University
Erin Eldermire, Cornell University
Pablo Elverdin, Group of Producing Countries from the Southern Cone (GPS)
Alicia English, The Food and Agricultural Organization of the United Nations (FAO)
Justin Flynn, Institute of Development Studies
Alessandra Galiè, International Livestock Research Institute (ILRI)
Nasra Gathoni, Aga Khan University
Kate Ghezzi-Kopel, Cornell University
Cecile Godde, Commonwealth Scientific and Industrial Research Organisation (CSIRO)
Markus Hanisch, Humboldt University
Haym Hirsh, Cornell University
Deirdre Holcroft, Holcroft Consulting
Ana Maria Ibáñez, Inter-American Development Bank (IADB)
Chinwe Ifejika-Speranza, University of Bern
Krista Issacs, Michigan State University
Maidul Islam, Cornell University
Maryia Ivanina, EPAM Systems Inc
Meha Jain, University of Michigan
Cocou Jaures Amengnaglo, National University of Agriculture, Benin
Muthumariappan Karthikeyan, Ambo University
Julia Kelly, University of Minnesota
Alison Kinengyere, Makerere University
Lisa Kitinoja, The Postharvest Education Foundation
Megan Kocher, University of Minnesota
Ricardo Labarta, International Center for Tropical Agriculture (CIAT)
Leslie Lipper, Cornell University
Lenis Saweda Liverpool-Tasie, Michigan State University
Tandi lwoga, The College of Business Education, Tanzania
Eugenie Maiga, Norbert Zongo University
Ellen McCullough, University of Georgia
Zia Mehrabi, University of British Columbia

173176
CERES2030 AUTHORS
Maricelis Acevedo, Cornell University
Guigonan Adjognon, World Bank
Joaquin Arias, Inter-American Institute for Cooperation on Agriculture (IICA)
Jessica Ault, National Agricultural Library, USA
Isabelle Baltenweck, International Livestock Research Institute (ILRI)
Livia Bizikova, International Institute for Sustainable Development (IISD)
Ashley Celestin, Cornell University
Debbie Cherney, Cornell University
Gracian Chimwaza, Information and Training and Outreach Centre in Africa (ITOCA)
Karen Cichy, Michigan State University
Doubahan Coulibaly, University Thomas Sankara
Ruth DeFries, Columbia University
Florian Diekmann, The Ohio State University
David Laborde Debucquet, International Food Policy Research Institute (IFPRI)
Alan Duncan, The University of Edinburgh
Jochen Dürr, Center for Development Studies (ZEF), Bonn University
Mali Eber-Rose, Leeds University
Stefan Einarson Cornell University
Erin Eldermire, Cornell University
Pablo Elverdin, Group of Producing Countries from the Southern Cone (GPS)
Alicia English, The Food and Agricultural Organization of the United Nations (FAO)
Justin Flynn, Institute of Development Studies
Alessandra Galiè, International Livestock Research Institute (ILRI)
Nasra Gathoni, Aga Khan University
Kate Ghezzi-Kopel, Cornell University
Cecile Godde, Commonwealth Scientific and Industrial Research Organisation (CSIRO)
Markus Hanisch, Humboldt University
Haym Hirsh, Cornell University
Deirdre Holcroft, Holcroft Consulting
Ana Maria Ibáñez, Inter-American Development Bank (IADB)
Chinwe Ifejika-Speranza, University of Bern
Krista Issacs, Michigan State University
Maidul Islam, Cornell University
Maryia Ivanina, EPAM Systems Inc
Meha Jain, University of Michigan
Cocou Jaures Amengnaglo, National University of Agriculture, Benin
Muthumariappan Karthikeyan, Ambo University
Julia Kelly, University of Minnesota
Alison Kinengyere, Makerere University
Lisa Kitinoja, The Postharvest Education Foundation
Megan Kocher, University of Minnesota
Ricardo Labarta, International Center for Tropical Agriculture (CIAT)
Leslie Lipper, Cornell University
Lenis Saweda Liverpool-Tasie, Michigan State University
Tandi lwoga, The College of Business Education, Tanzania
Eugenie Maiga, Norbert Zongo University
Ellen McCullough, University of Georgia
Zia Mehrabi, University of British Columbia
177
Sisi Meng, University of Notre Dame
Margitta Minah, Humboldt University
Rama Mohana-Turaga, Indian Institute of Management
Sophia Murphy, International Institute for Sustainable Development (IISD)
Brighton Mvumi, University of Zimbabwe
Ephraim Nkonya, International Food Policy Research Institute (IFPRI)
Oluwatoba Omotilea, The World Bank
Cristian Morales Opazo, The Food and Agricultural Organization of the United Nations (FAO)
Nkechi Owoo, University of Ghana
Jessica R. Page, The Ohio State University
Marie Parent, International Food Policy Research Institute (IFPRI)
Valeria Piñeiro, International Food Policy Research Institute (IFPRI)
Kevin Pixley, The International Maize and Wheat Improvement Center (CIMMYT)
Jaron Porciello, Cornell University
Mohamed Porgo, University Thomas Sankara
Steven D. Prager, International Center for Tropical Agriculture (CIAT)
Nicola Randall, Harper Adams University
James Rao, International Livestock Research Institute (ILRI)
Thomas Reardon, Michigan State University
Vincent Ricciardi, The World Bank
Windinkonte Seogo, Polytechnic University Center of Kaya, Burkina Faso
Balsher Sidhu, University of British Columbia
Carin Smaller, International Institute for Sustainable Development (IISD)
Divya Solomon, University of Michigan
Steve Staal, International Livestock Research Institute (ILRI)
Tanya Stathers, National Resources Institute, University of Greenwich
Justice Tambo, CABI
Lixia Tang, China Agricultural University
Nils Teufel, International Livestock Research Institute (ILRI)
Beth Timmers, International Institute for Sustainable Development (IISD)
Maximo Torero, The Food and Agricultural Organization of the United Nations (FAO)
Salimata Traore, University Thomas Sankara
Hale Ann Tufan, Cornell University
Carolina Vargas, Michigan State University
Abraham Wane, French Agricultural Research Centre for International Development (CIRAD)
Ayala Wineman, University of Washington
Fleur Wouterse, International Food Policy Research Institute (IFPRI)
Sarah Young, Carnegie Mellon University
Pam Zahonogo, University Thomas Sankara
Nkulumo Zinyengere, The World Bank

174 178
ADVISORY BOARD
Boaz Keizire, Alliance for a Green Revolution in Africa (AGRA)
Catherine Bertini, Global Alliance for Improved Nutrition (GAIN) Board and the Rockefeller Foundation
Joachim von Braun, Center for Development Research, Bonn University
Ronnie Coffman, Cornell University
Richard Florizone, International Institute for Sustainable Development (IISD)
Mario Herrero, The Commonwealth Scientific and Industrial Research Organisation (CSIRO)
Segenet Kelemu, International Centre of Insect Physiology and Ecology (icipe)
Uma Lele, Independent scholar
Leslie Lipper, Cornell University
Lindiwe Majele Sibanda, Farmer and Food Systems Champion
Will Martin, International Food Policy Research Institute (IFPRI)
Jamie Morrison, The Food and Agricultural Organization of the United Nations (FAO)
Njuguna Ndung’u, African Economic Research Council (AERC)
Martin Piñeiro, Committee on Agriculture, Argentine Council of International Relations
Prabhu Pingali, Cornell University
Nicola Randall, Harper Adams University
Ruerd Ruben, Wageningen University and Research
Maximo Torero, The Food and Agricultural Organization of the United Nations (FAO)
Paul Winters, University of Notre Dame
Li Xiaoyun, China Agricultural University

179

© 2020 The International Institute for Sustainable Development
ABOUT CERES2030Ceres2030 brings together three institutions that share a common vision: a world without hunger, where small-scale producers enjoy greater agricultural incomes and productivity, in a way that supports sustainable food systems. Our mission is to provide the donor community with a menu of policy options for directing their investments, backed by the best available evidence and economic models.
Ceres2030 partners are Cornell University, the International Food Policy Research Institute (IFPRI), and the International Institute for Sustainable Development (IISD). Funding support comes from Germany’s Federal Ministry of Economic Cooperation and Development (BMZ) and the Bill & Melinda Gates Foundation (BMGF).