sustainable payment for integrated health careimprove health care and whether these initiatives are...
TRANSCRIPT

Sustainable Payment for Integrated Health Care
Art Jones, MD and Bren Manaugh, LCSW-S, CPHQHealth Management Associates September 4, 2018

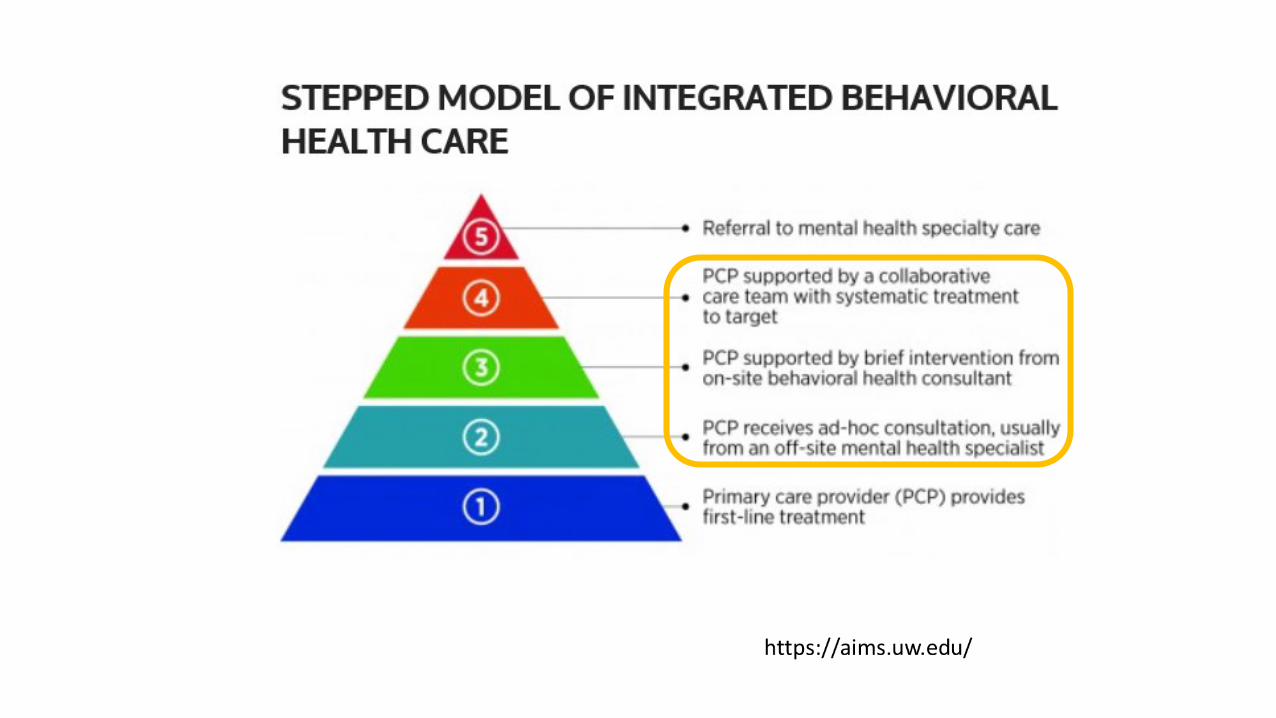
“Sweet” Spot for Integrated Care and the Collaborative Care Model
• Issues with depression and substance abuse must be pre-empted, rather than treated once advanced.
• Goal is to detect early and apply early interventions to prevent from getting more severe
NoneMild
Moderate
Severe
Target Population
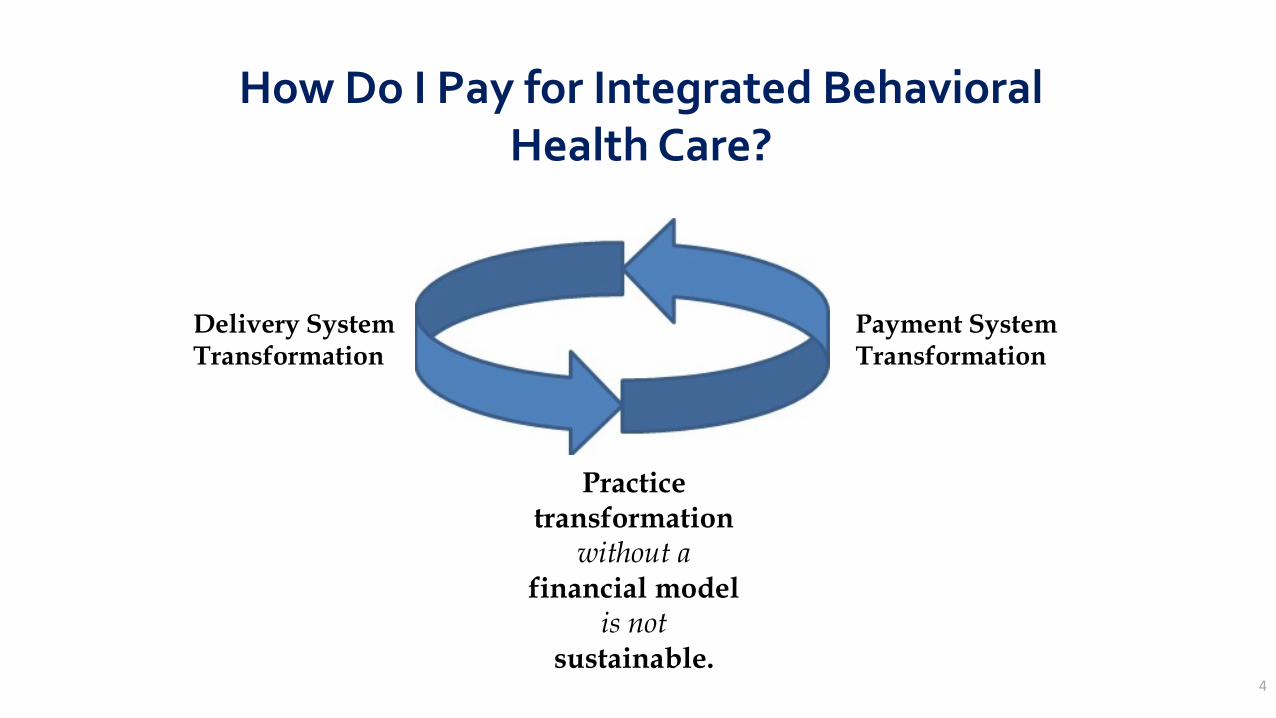
How Do I Pay for Integrated Behavioral Health Care?
Delivery System Transformation
Payment System Transformation
Practice transformation
without a financial model
is not sustainable.
4
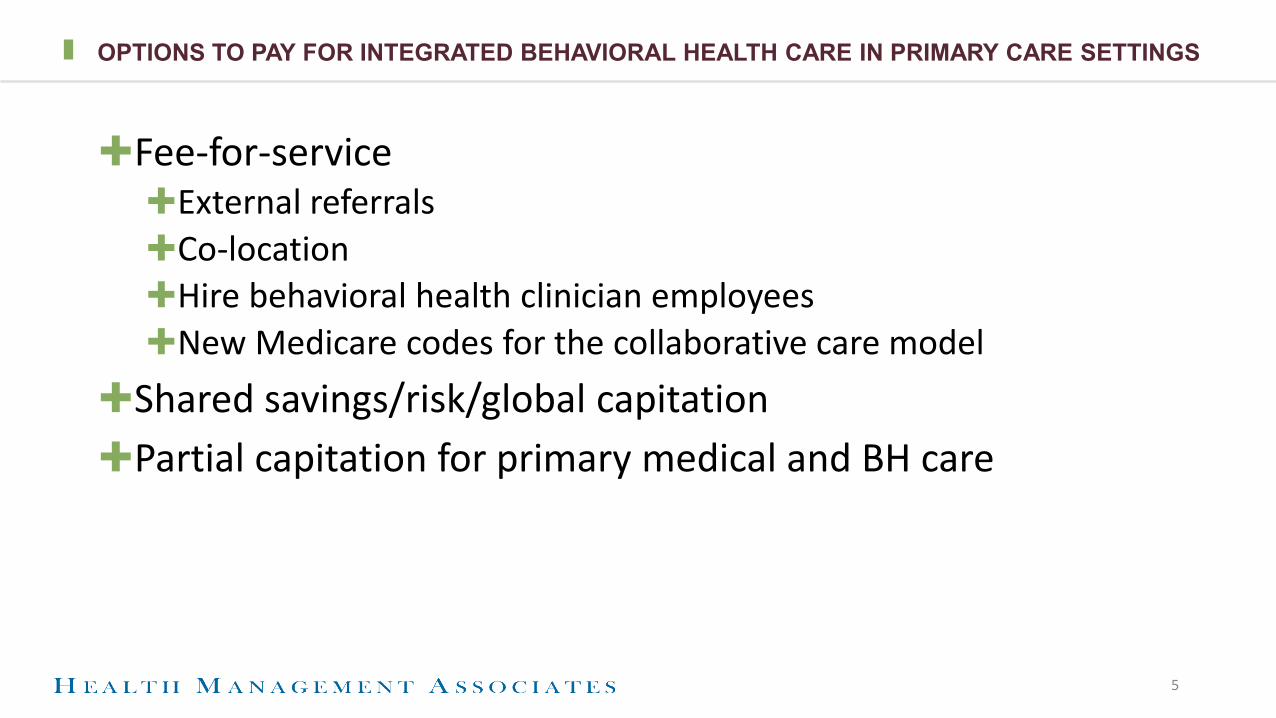
OPTIONS TO PAY FOR INTEGRATED BEHAVIORAL HEALTH CARE IN PRIMARY CARE SETTINGS
✚Fee-for-service✚External referrals✚Co-location✚Hire behavioral health clinician employees✚New Medicare codes for the collaborative care model
✚Shared savings/risk/global capitation✚Partial capitation for primary medical and BH care
5
6
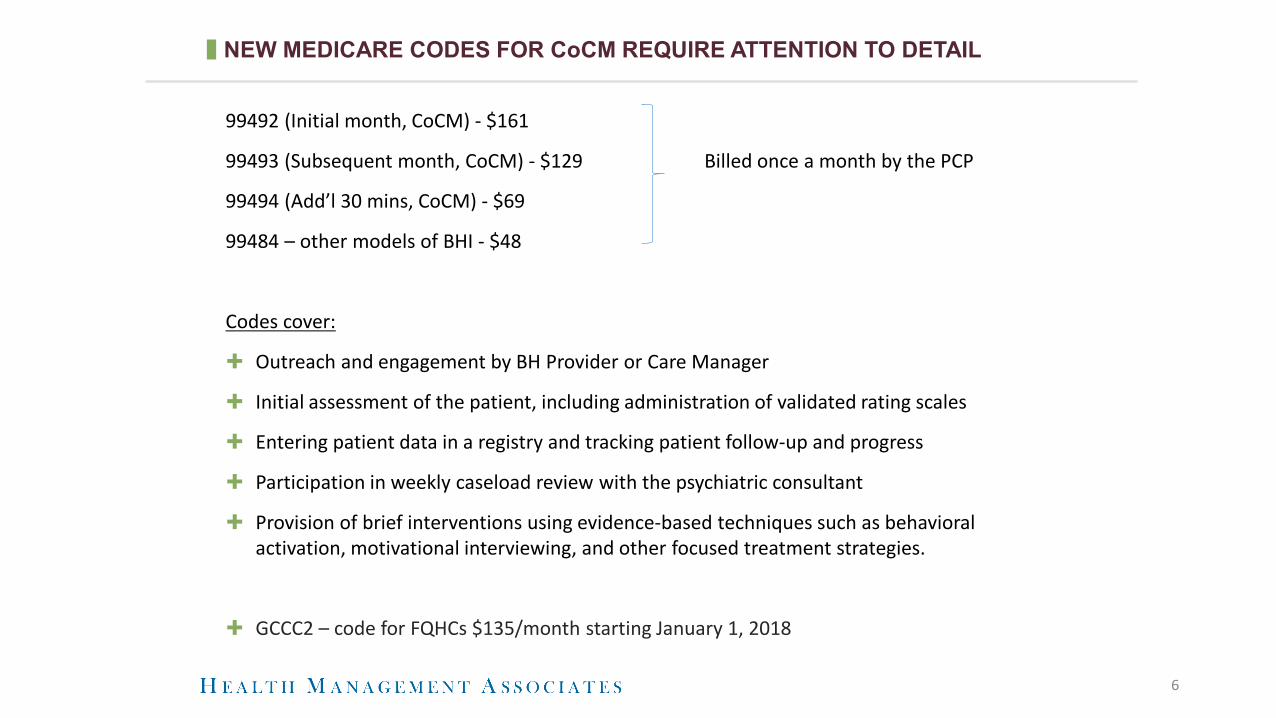
NEW MEDICARE CODES FOR CoCM REQUIRE ATTENTION TO DETAIL
99492 (Initial month, CoCM) - $161
99493 (Subsequent month, CoCM) - $129 Billed once a month by the PCP
99494 (Add’l 30 mins, CoCM) - $69
99484 – other models of BHI - $48
Codes cover:
✚ Outreach and engagement by BH Provider or Care Manager
✚ Initial assessment of the patient, including administration of validated rating scales
✚ Entering patient data in a registry and tracking patient follow-up and progress
✚ Participation in weekly caseload review with the psychiatric consultant
✚ Provision of brief interventions using evidence-based techniques such as behavioral activation, motivational interviewing, and other focused treatment strategies.
✚ GCCC2 – code for FQHCs $135/month starting January 1, 2018

7
MEDICARE CoCM BILLING MUST HAVES
✚ These codes are billed by the medical provider (primary care provider) once a month
✚Needs an initiating visit – new patients unless seen in the past year
✚Must have weekly caseload reviews with a psychiatric consultant
✚Broad consent obtained
✚ Co-pays apply
✚Must be able to show time spent – how to time stamp your work?
✚MEDICARE ONLY for now
For a helpful reference, see: http://aims.uw.edu/sites/default/files/CMS_FinalRule_2017_CheatSheet.pdf
National Perspective on Advanced Alternative Payment Methodologies for the Medicaid Population
For Public Release
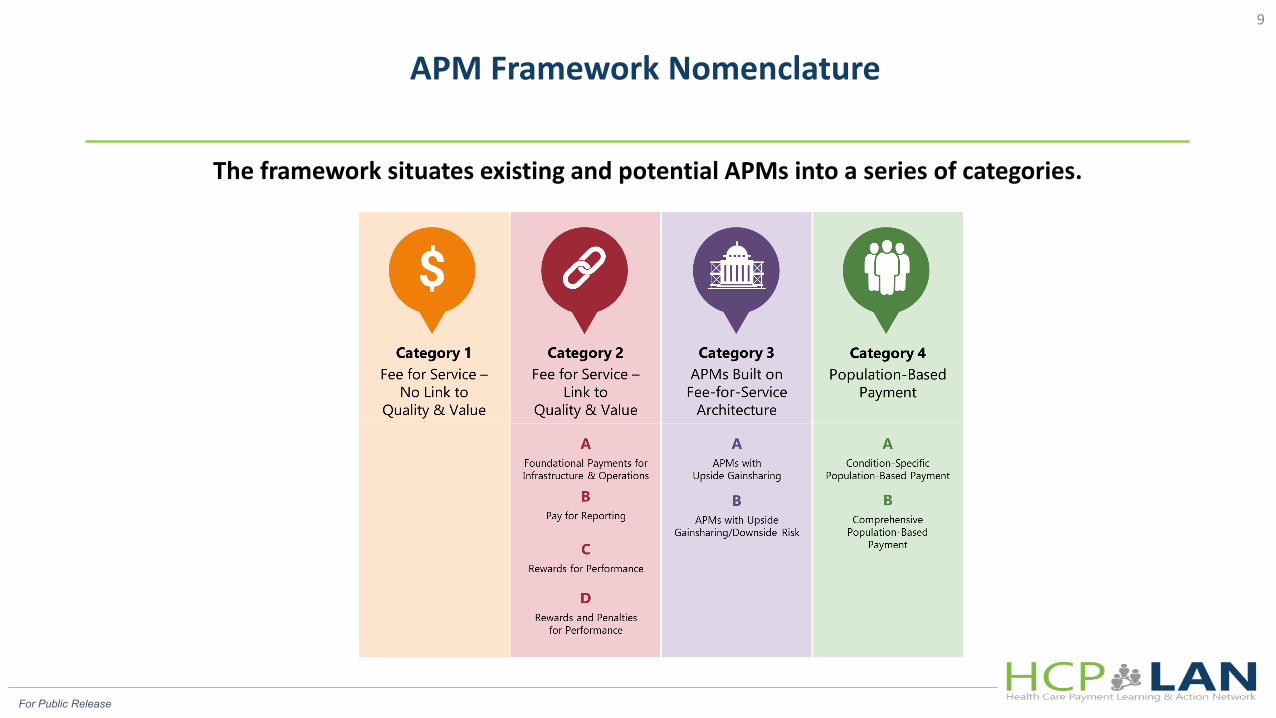
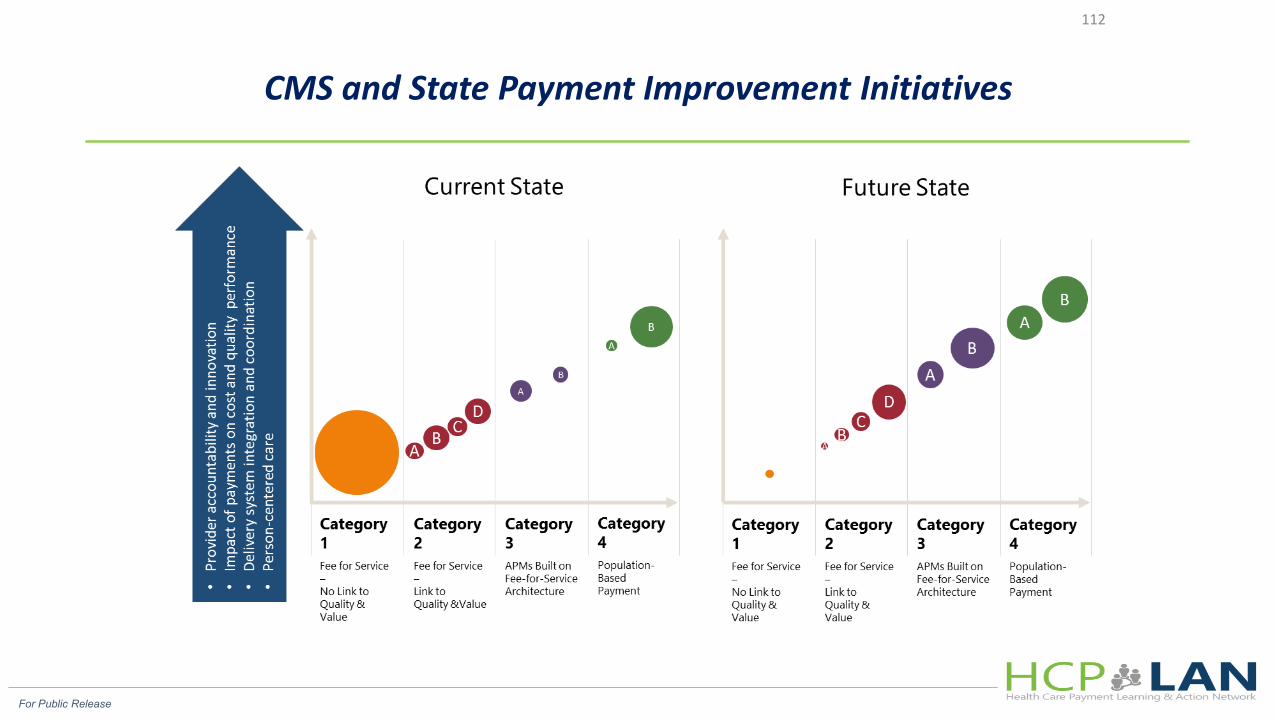
The framework situates existing and potential APMs into a series of categories.
APM Framework Nomenclature 9
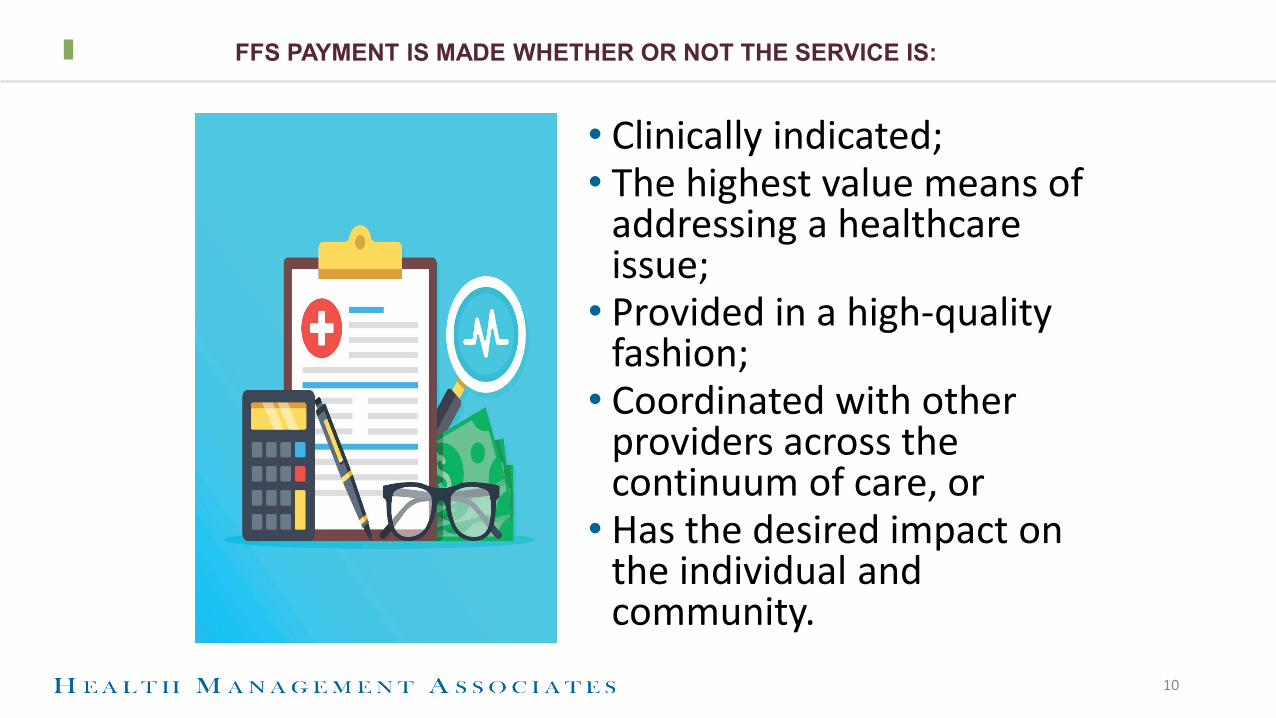
FFS PAYMENT IS MADE WHETHER OR NOT THE SERVICE IS:
• Clinically indicated;• The highest value means of
addressing a healthcare issue;
• Provided in a high-quality fashion;
• Coordinated with other providers across the continuum of care, or
• Has the desired impact on the individual and community.
10
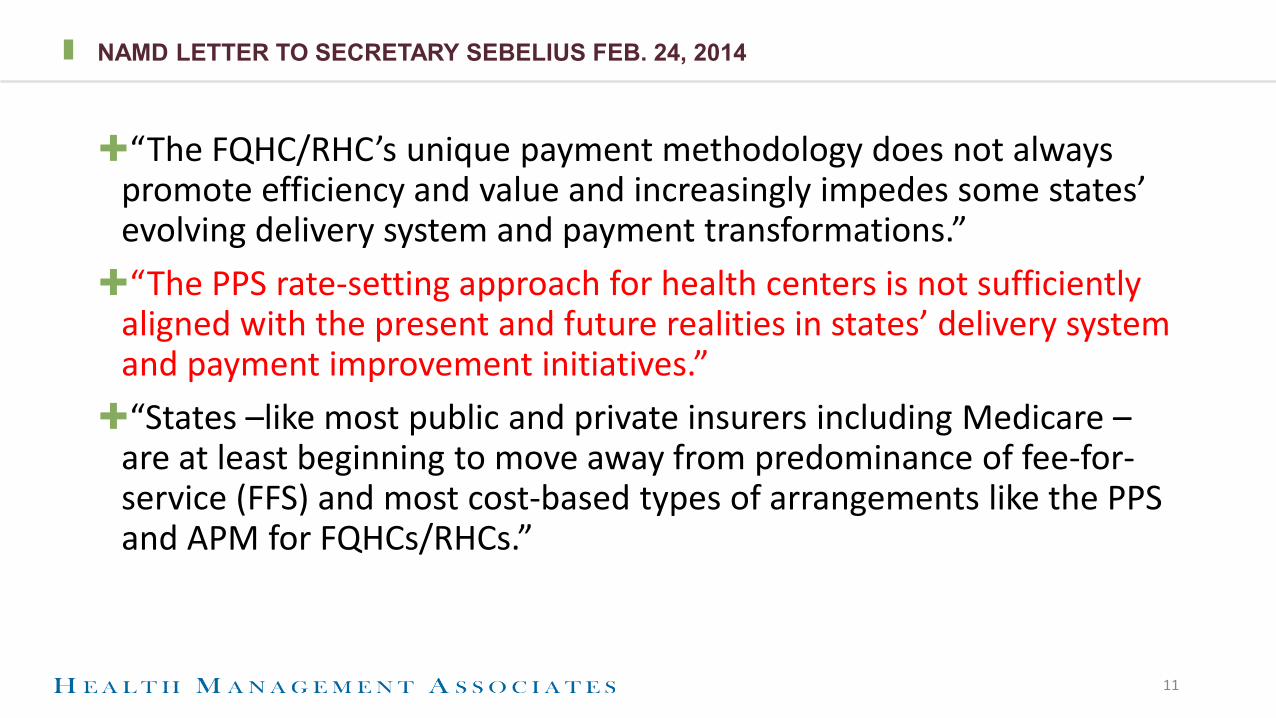
NAMD LETTER TO SECRETARY SEBELIUS FEB. 24, 2014
✚“The FQHC/RHC’s unique payment methodology does not always promote efficiency and value and increasingly impedes some states’ evolving delivery system and payment transformations.”✚“The PPS rate-setting approach for health centers is not sufficiently
aligned with the present and future realities in states’ delivery system and payment improvement initiatives.”✚“States –like most public and private insurers including Medicare –
are at least beginning to move away from predominance of fee-for-service (FFS) and most cost-based types of arrangements like the PPS and APM for FQHCs/RHCs.”
11
For Public Release
CMS and State Payment Improvement Initiatives
112
13
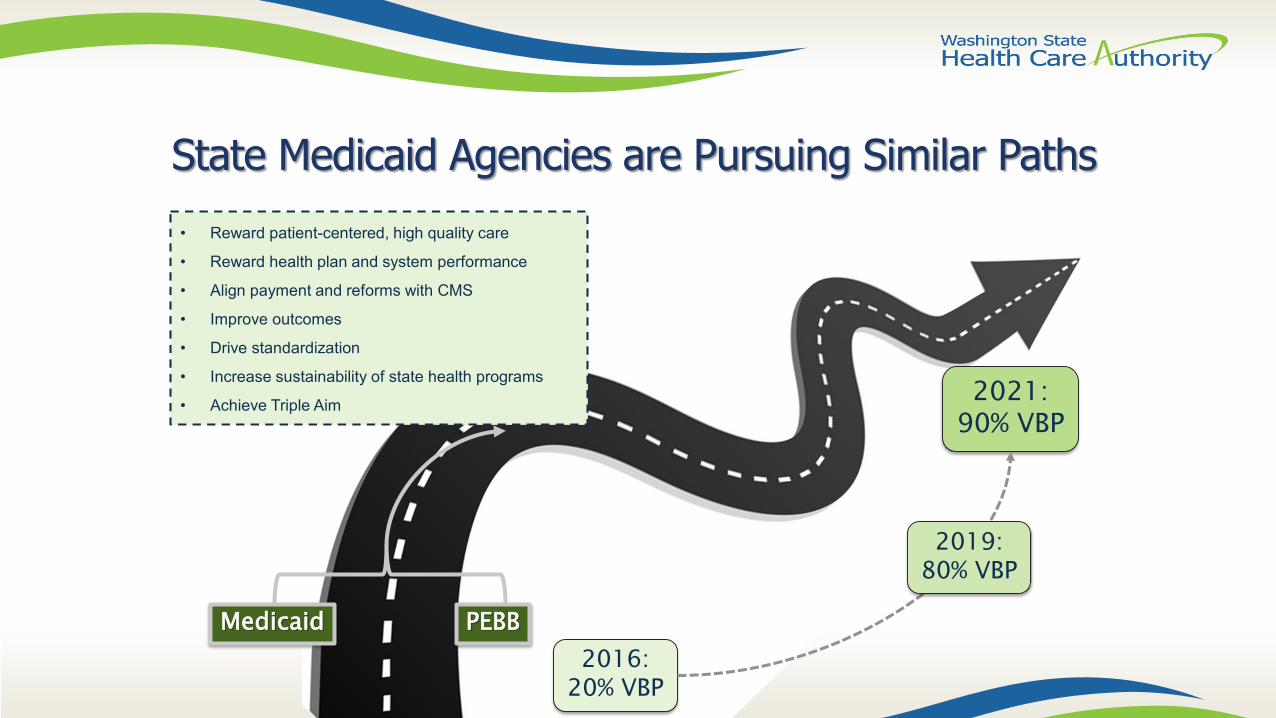
State Medicaid Agencies are Pursuing Similar Paths
Medicaid PEBB2016:
20% VBP
2021: 90% VBP
• Reward patient-centered, high quality care
• Reward health plan and system performance
• Align payment and reforms with CMS
• Improve outcomes
• Drive standardization
• Increase sustainability of state health programs
• Achieve Triple Aim
2019: 80% VBP
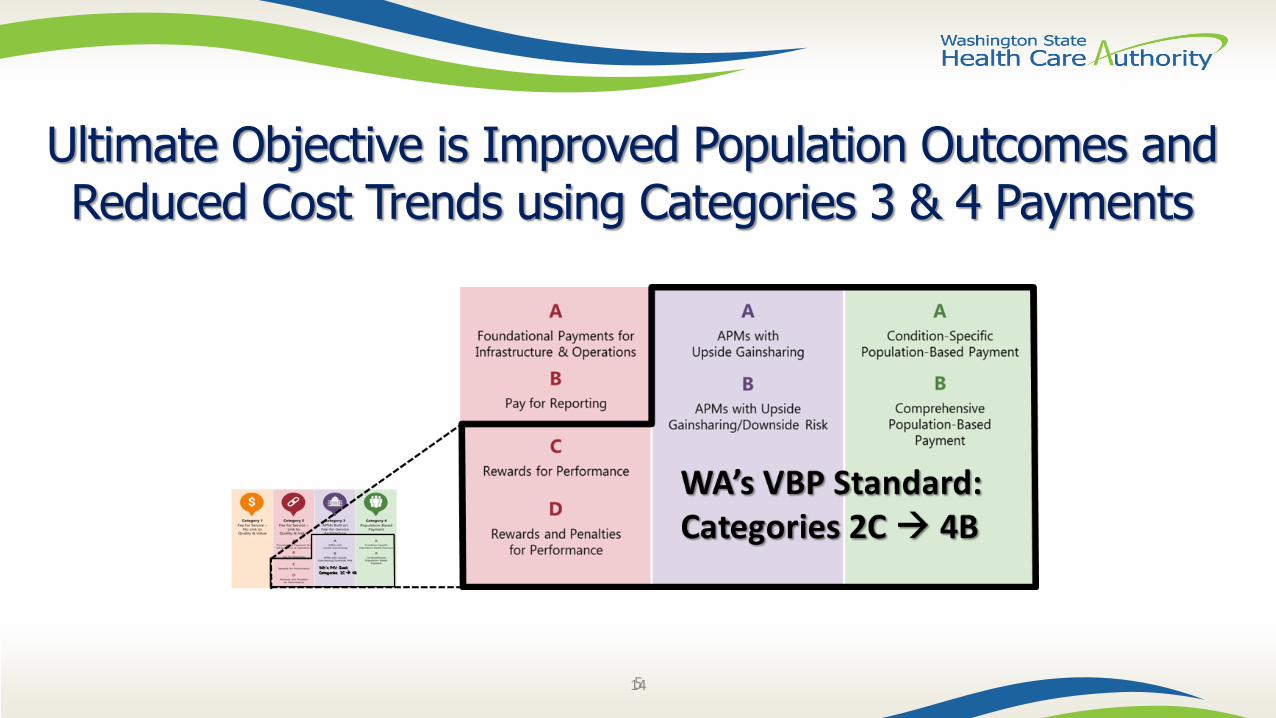
Ultimate Objective is Improved Population Outcomes and Reduced Cost Trends using Categories 3 & 4 Payments
145

State Perspective on Alternative Payment Methodologies for the Medicaid Population
16
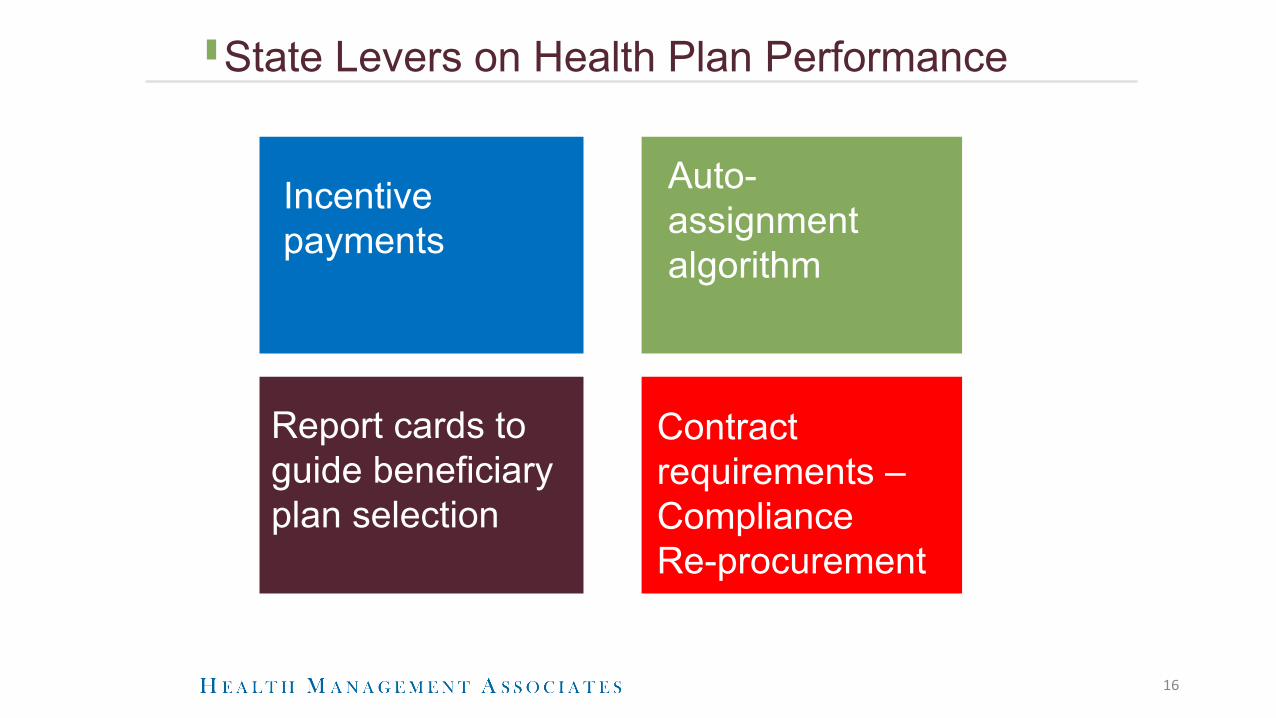
Incentive payments
Auto-assignment algorithm
Report cards to guide beneficiary plan selection
Contract requirements –ComplianceRe-procurement
State Levers on Health Plan Performance
17
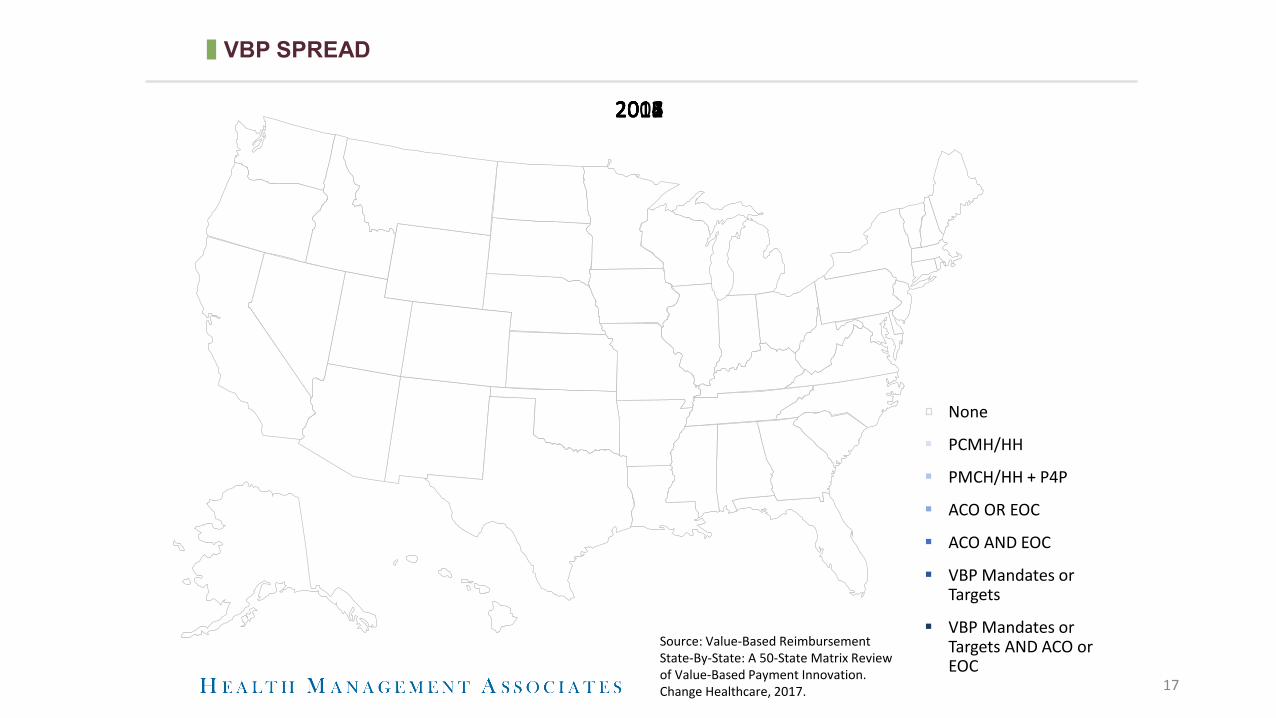
VBP SPREAD
None
PCMH/HH
PMCH/HH + P4P
ACO OR EOC
ACO AND EOC
VBP Mandates or Targets
VBP Mandates or Targets AND ACO or EOC
20082011201220132014201520162017
Source: Value-Based Reimbursement State-By-State: A 50-State Matrix Review of Value-Based Payment Innovation. Change Healthcare, 2017.

18
Texas DSRIP Years 7 & 8 Requirements+ DY’s 7-8 serve as an opportunity for providers to move
further towards sustainability of their transformed systems, including development of alternative payment models to continue services for Medicaid and low-income or uninsured individuals after the waiver ends
+ Categories 1-4 in DY’s 2-6 are transitioned to the following Category A in DY’s 7-8: Required reporting that includes progress on core activities, alternative payment model arrangements, costs and savings, and collaborative activities
Texas Environment for VBP in Medicaid
19
Texas Managed Care Contracting - Current State:+ The Respondent must develop and submit a written plan for
expansion of value-based contracting with its physician and non-physician providers that encourages innovation and collaboration, and increases quality and efficiency. Contracting and payment structures should incentivize quality outcomes, shared savings, or both resulting from the reduction of inappropriate utilization of services, i.e. inappropriate admissions and readmissions. The plan will include quality metrics required for incentives, recruitment strategies of Providers, and a proposed structure for incentive payments, shared savings, or both. Each year, the annual plan must show a measurable increase in the percent of business, providers, dollars, or other, being incentivized from the previous year
Texas Environment for VBP in Medicaid

20
Texas Managed Care Contracting Current State:+ Rider 21 – Report on Pay for Quality Measures: requires
HHSC to evaluate how MCOs use pay for quality measures to improve health care and whether these initiatives are successful. A report was due to the Legislature in October 2018 and must include recommendations for improving current pay for quality measures, areas requiring additional studies, and how the findings could be used to expand pay for quality measures into outpatient settings.
Texas Environment for VBP in Medicaid
21
Texas Managed Care Contracting Current State:+ Rider 158 – Managed Care Risk Margin: the approved budget
includes a reduction of $182.6 million based on HHSC reducing the risk margin in managed care premiums from 2.0 percent to 1.5 percent for STAR and STAR Health, and from 2.0 to 1.75 percent for STAR+PLUS and STAR Kids. An additional reduction of $11 million is included based on HHSC reducing the risk margin in CHIP managed care premiums from 2.0 percent to 1.5 percent.
Texas Environment for VBP in Medicaid
22
Texas Managed Care Contracting Current State:+ Rider 175 – Managed Care Organization Services for
Individuals with Serious Mental Illness: requires HHSC to develop performance metrics to hold MCOs accountable for care of enrollees with serious mental illness. Metrics should include performance measures for integrated care, jail and emergency department diversion, integration of care and enhanced cost control.
Texas Environment for VBP

23
Texas Managed Care Contracting Current State:+ HHSC Transformation Redesign Goals for 2018 Provides
further indication of HHSC’s move toward driving a value-based integrated managed care environment:
+ HHSC’s Redesign Goals: Design a medical P4Q program that:─ Rewards both high performance and improvement─ Promotes transformation and innovation leading to improved health
outcomes
• Capitation at-risk is three percent (first time)• STAR and CHIP At-Risk Measures
Texas Environment for VBP

24
Texas Managed Care Contracting Current State: Capitation at-risk is three percent. Three ways in which MCOs can earn or lose money:
• Performance Against Established Benchmarks*• Performance Against Self**• Bonus pool (no risk)
+ Measures and benchmarks will be reviewed every two years+ New at-risk measures will primarily come from the bonus
pool measures
*In the conceptual framework this was referred to as within year performance
**In the conceptual framework this was referred to as year-to-year improvement
Texas Environment for VBP

25
Texas Managed Care Contracting Current State:+ STAR At-Risk Measures
• Potentially Preventable Emergency Room Visits (PPV) • Appropriate Treatment for Children with Upper Respiratory Infection
(URI)• Prenatal and Postpartum Care (PPC): Timeliness of prenatal care;
Postpartum care• Six or more Well Child Visits in the First 15 months of Life (W15)• Diabetes Control - HbA1c < 8% (CDC)• High blood pressure controlled (CBP)• Diabetes Screening for People with• Schizophrenia or Bipolar Disorder who are using antipsychotics (SSD)• Cervical cancer screening (CCS)
Texas Environment for VBP
26
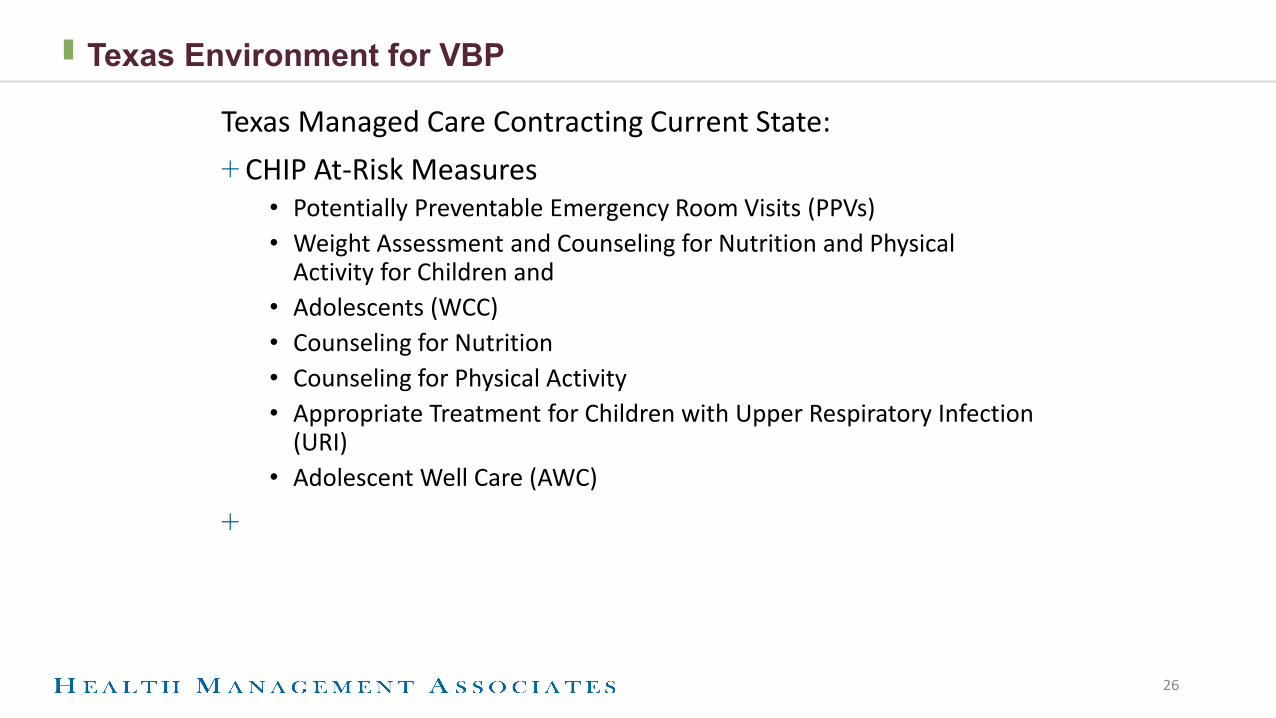
Texas Managed Care Contracting Current State:+ CHIP At-Risk Measures
• Potentially Preventable Emergency Room Visits (PPVs)• Weight Assessment and Counseling for Nutrition and Physical
Activity for Children and• Adolescents (WCC)• Counseling for Nutrition• Counseling for Physical Activity• Appropriate Treatment for Children with Upper Respiratory Infection
(URI)• Adolescent Well Care (AWC)
+
Texas Environment for VBP
27
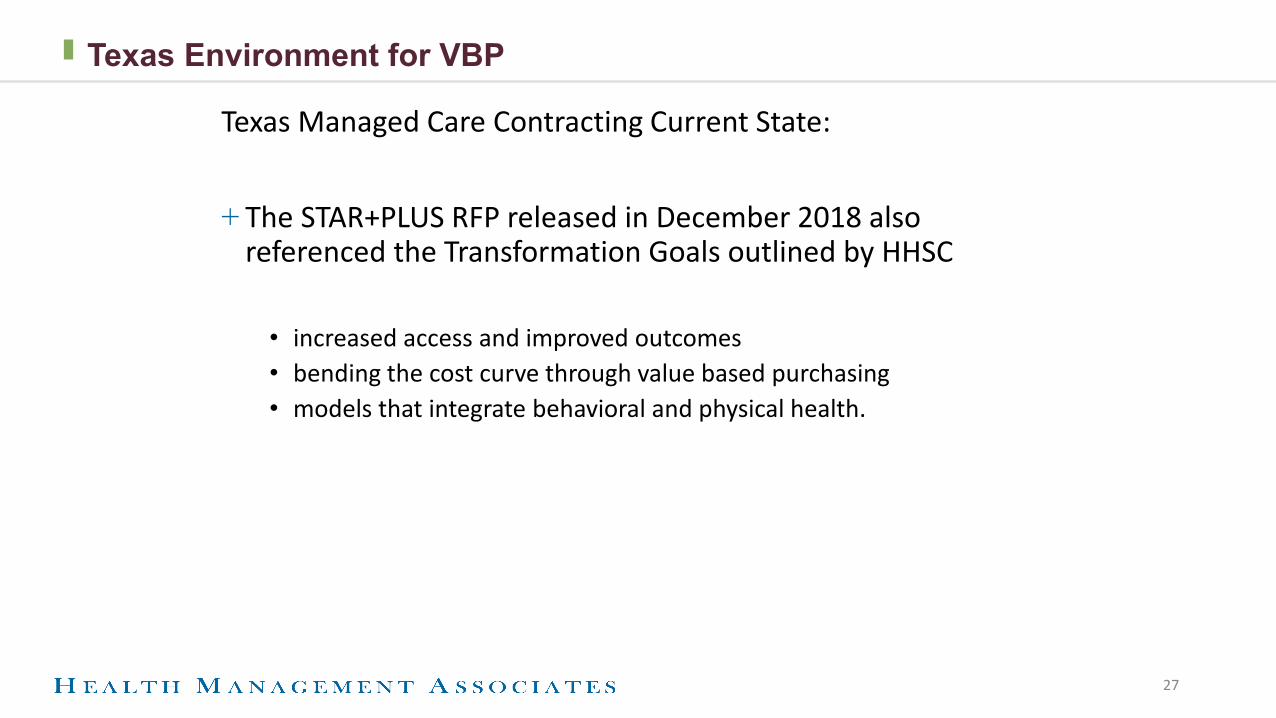
Texas Managed Care Contracting Current State:
+ The STAR+PLUS RFP released in December 2018 also referenced the Transformation Goals outlined by HHSC
• increased access and improved outcomes• bending the cost curve through value based purchasing• models that integrate behavioral and physical health.
Texas Environment for VBP
Perspective on Payment Reform in FQHCs and Primary Care for the Medicaid Population

FQHC PAYMENT REFORM MODEL
29
Fee-for-servicePPS or APM
• CM fee• PCMH• P4P• Shared savings• Partial capitation for
non-PCP services
30
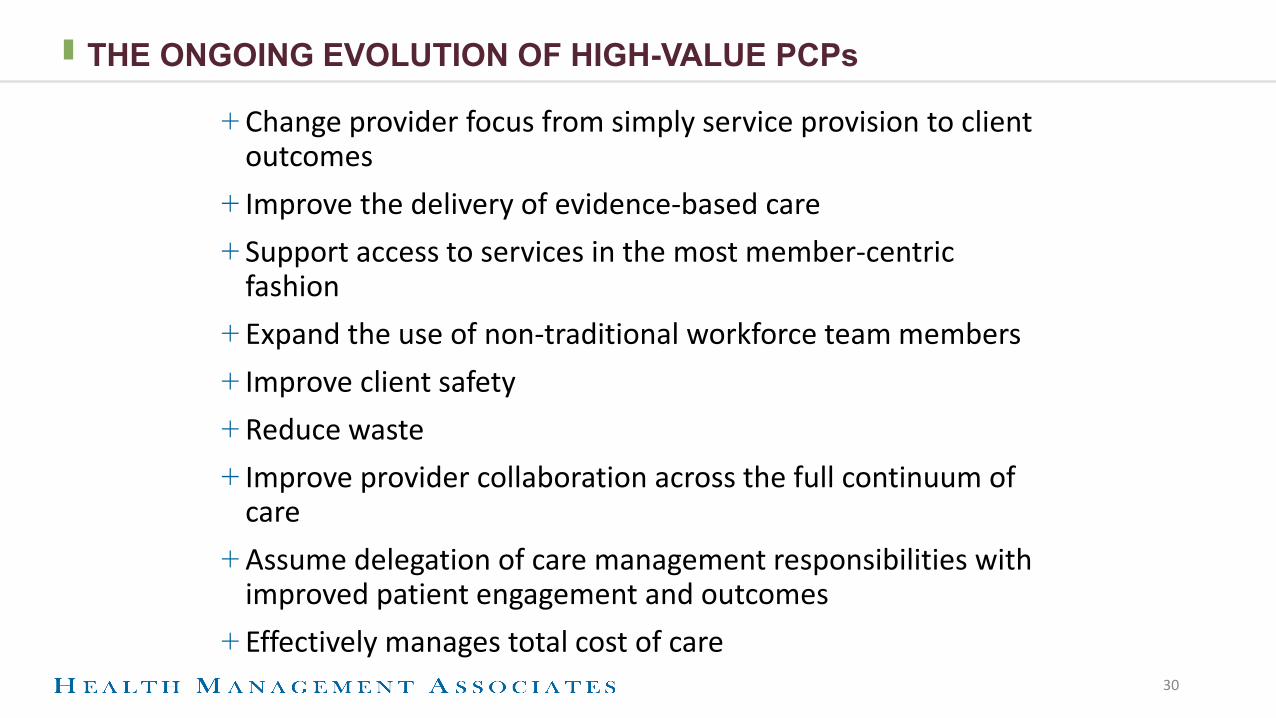
+ Change provider focus from simply service provision to client outcomes
+ Improve the delivery of evidence-based care+ Support access to services in the most member-centric
fashion+ Expand the use of non-traditional workforce team members+ Improve client safety+ Reduce waste+ Improve provider collaboration across the full continuum of
care+ Assume delegation of care management responsibilities with
improved patient engagement and outcomes + Effectively manages total cost of care
THE ONGOING EVOLUTION OF HIGH-VALUE PCPs
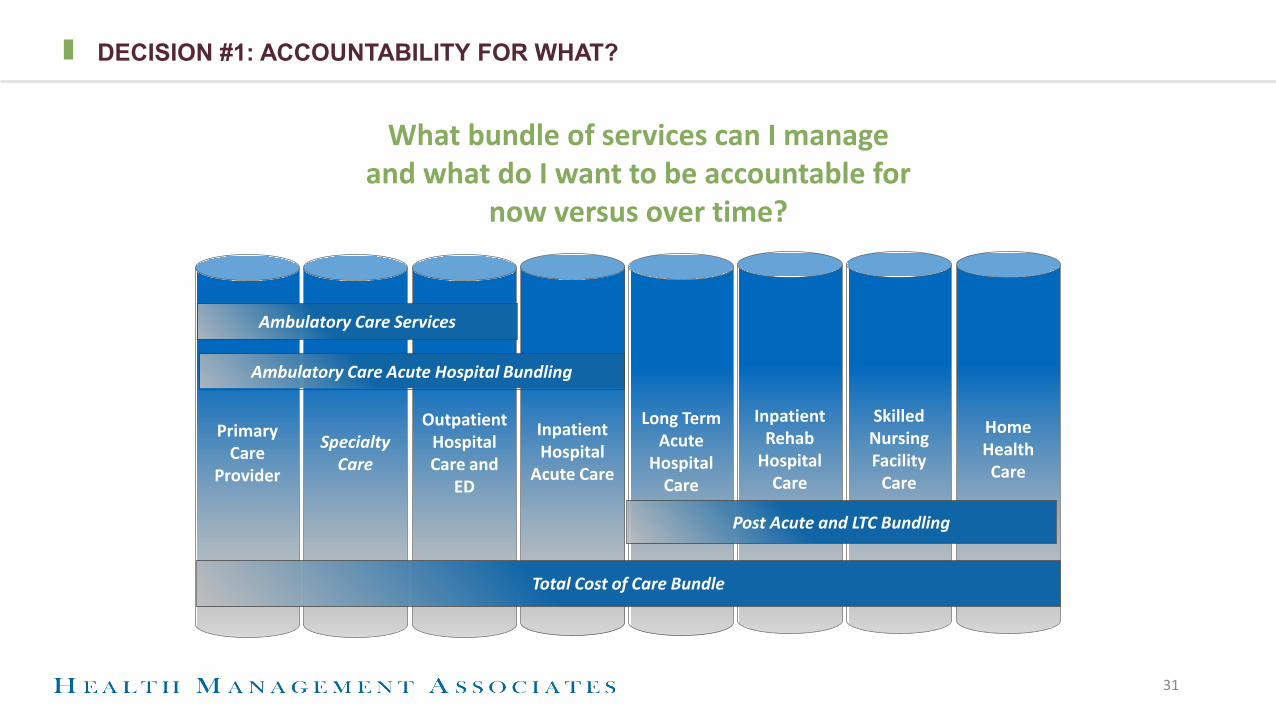
DECISION #1: ACCOUNTABILITY FOR WHAT?
31
Primary Care
Provider
Specialty Care
Outpatient Hospital Care and
ED
Inpatient Hospital
Acute Care
Long Term Acute
Hospital Care
Inpatient Rehab
Hospital Care
Skilled Nursing Facility
Care
Home Health Care
Post Acute and LTC Bundling
Total Cost of Care Bundle
Ambulatory Care Acute Hospital Bundling
Ambulatory Care Services
What bundle of services can I manage and what do I want to be accountable for
now versus over time?

DECISION #2: DEGREE OF FINANCIAL ACCOUNTABILITY
Prov
ider
Fin
anci
al R
isk
Provider Integration and Accountability
Fee For Service
Incentive Payments
Pay for Performance
(P4P)
BundledPayments
Shared Savings
Shared Risk
Partial Capitation
Full Capitation
Performance-Based Episodic Accountable Care
Cost-based Contract
32

THE QUESTIONS FQHC’S AND OTHER PCP SAFETY NET PROVIDERS ARE ASKING
✚Can’t I just keep living on the first floor (or go back to the basement)?✚Can I wait for the elevator?✚How badly can I get hurt if I fall climbing the stairs?✚Is this the only set of stairs and if so, can I skip some steps?✚Do I really have to make it to the top?✚Does the railing go to the top?✚Should I hold someone’s hand on the way up and if so, whose?
33
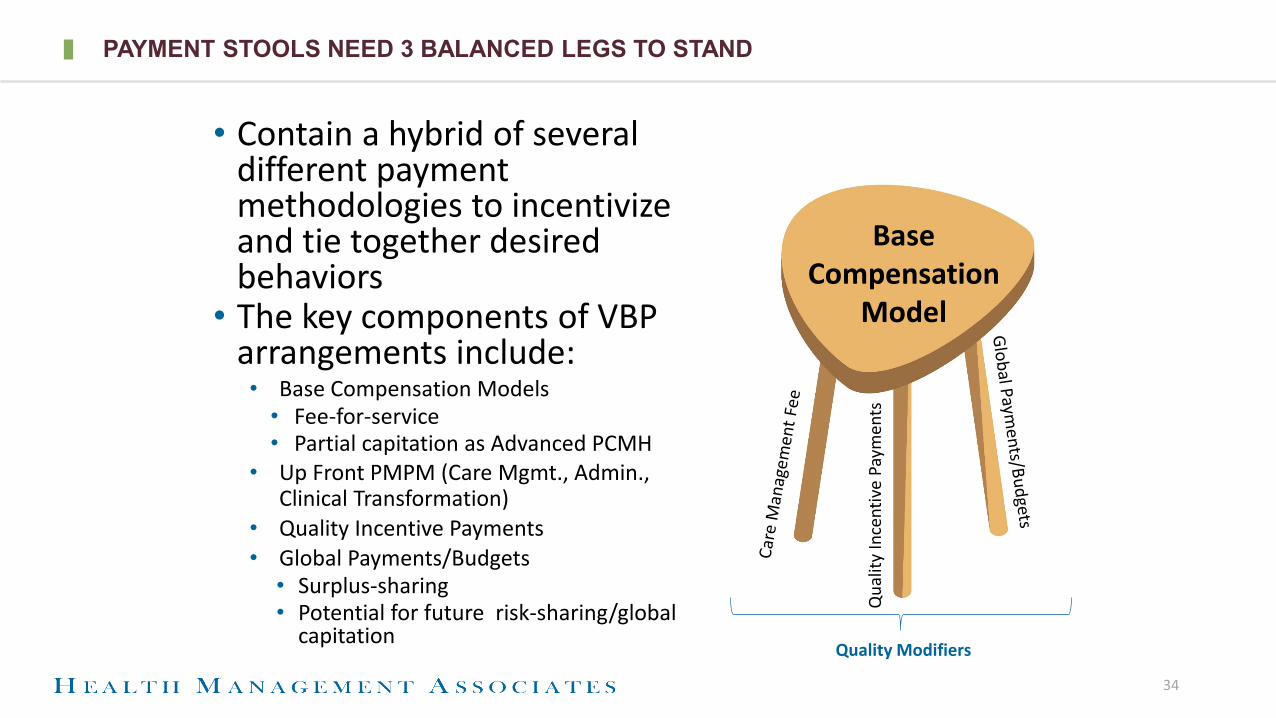
PAYMENT STOOLS NEED 3 BALANCED LEGS TO STAND
• Contain a hybrid of several different payment methodologies to incentivize and tie together desired behaviors
• The key components of VBP arrangements include:• Base Compensation Models
• Fee-for-service• Partial capitation as Advanced PCMH
• Up Front PMPM (Care Mgmt., Admin., Clinical Transformation)
• Quality Incentive Payments• Global Payments/Budgets
• Surplus-sharing• Potential for future risk-sharing/global
capitation
34
Base Compensation
Model
Qua
lity
Ince
ntiv
e Pa
ymen
ts
Quality Modifiers

AND THE SEAT CAN’T BE TOO HEAVY OR IT BREAKS DOWN
• Contain a hybrid of several different payment methodologies to incentivize and tie together desired behaviors
• The key components of VBP arrangements include:• Base Compensation Models
• Fee-for-service• Partial capitation as Advanced PCMH
• Up Front PMPM (Care Mgmt., Admin., Clinical Transformation)
• Quality Incentive Payments• Global Payments/Budgets
• Surplus-sharing• Potential for future risk-sharing/global
capitation
35
Base Compensation
Model
Qua
lity
Ince
ntiv
e Pa
ymen
ts
Quality Modifiers
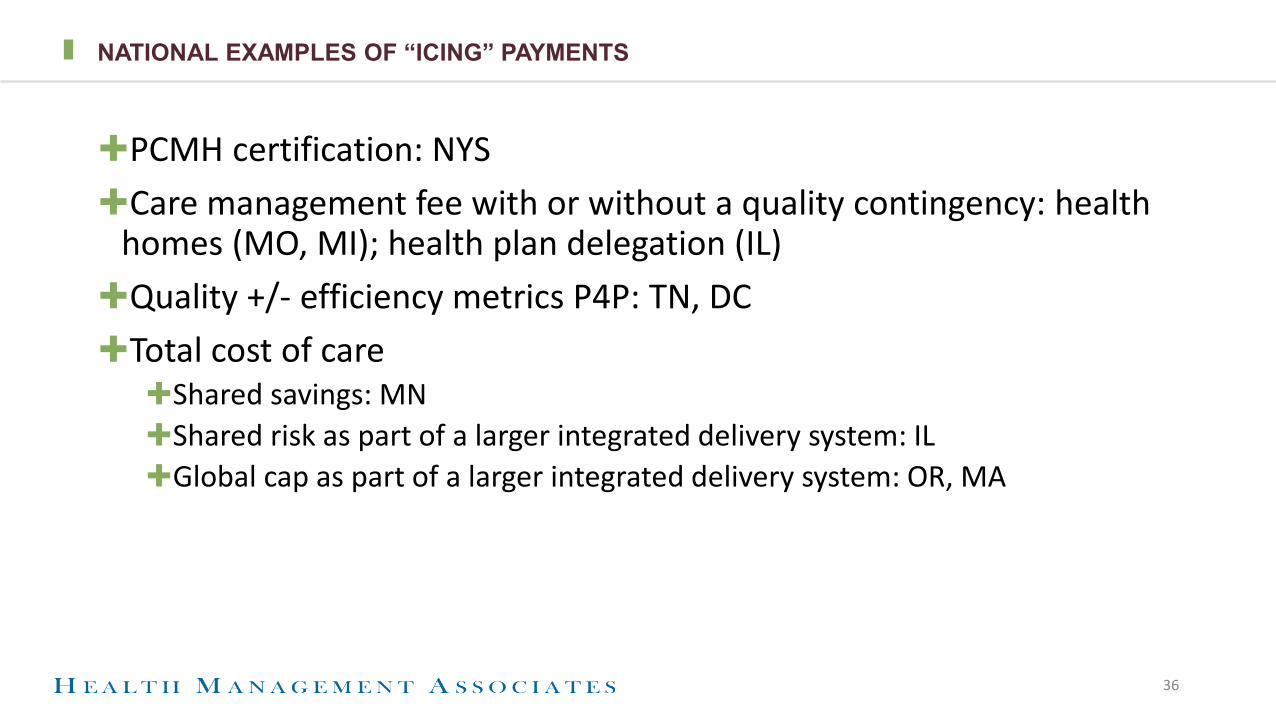
NATIONAL EXAMPLES OF “ICING” PAYMENTS
✚PCMH certification: NYS✚Care management fee with or without a quality contingency: health
homes (MO, MI); health plan delegation (IL)✚Quality +/- efficiency metrics P4P: TN, DC✚Total cost of care
✚Shared savings: MN✚Shared risk as part of a larger integrated delivery system: IL✚Global cap as part of a larger integrated delivery system: OR, MA
36

Underwriting the Collaborative Care Model through Shared Savings

• Medical Home Network (MHN) was founded in 2009 by the Comer Family Foundation with the vision to transform healthcare delivery for the Medicaid population of Greater Chicago.
• MHN ACO, LLC established in 2014, in partnership with MHN
–Wholly provider-owned entity–High performing multi-organizational
ACO –9 FQHCs and 3 Hospital systems–Unique egalitarian governance model –Enables members to drive cultural
transformation and advance an integrated, practice-level model of care
• We are passionate and committed, with proven engagement, outcomes and savings
Medical Home Network Enhances Patient Care, Drives Value & Improves Outcomes
Popu
lati
on
MedicaidMembers ACO % of Total
ACA 22,245 19%
FHP 87,586 75%
ICP 6,569 6%
Total 116,400 100%MHN ACO CountyCare Members, June 2018
38
FQHC Owners Health System Owners
Alivio Medical Center La Rabida Children’s Hospital• La Rabida Primary Care
Aunt Martha’s Health & Wellness Rush University Medical Center• Rush University Medical
Group• Rush Oak Park Physicians
GroupChicago Family Health Center
Erie Family Health Centers
Esperanza Health Centers
Friend Family Health Center Sinai Health System• Sinai Medical Group• Progress Health
Lawndale Christian Health Center
PrimeCare Community Health
PCC Community Health
Mem
ber
Org
aniz
atio
ns
MHN ACO
© Copyright 2018 MHNU Corporation, All Rights Reserved, Proprietary & Confidential
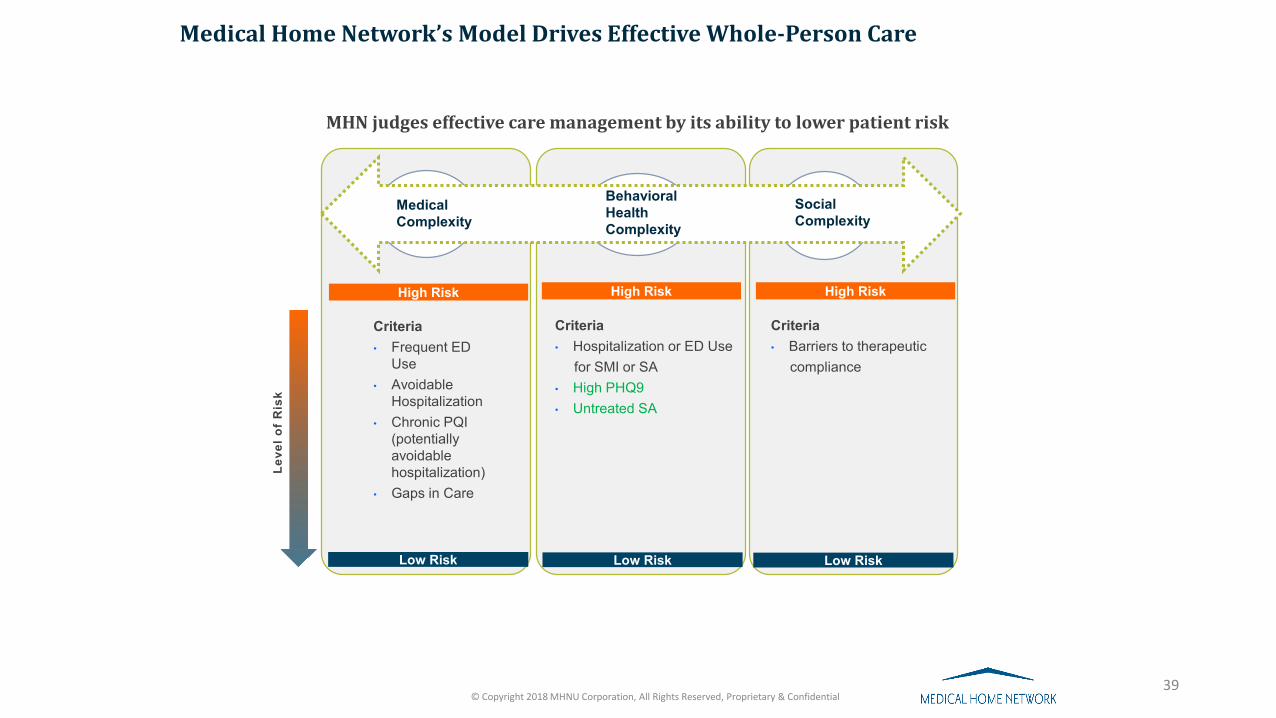
MHN judges effective care management by its ability to lower patient risk
Leve
l of
Ris
k
39
Medical Complexity
Behavioral HealthComplexity
Social Complexity
High Risk High Risk High Risk
Criteria• Frequent ED
Use• Avoidable
Hospitalization• Chronic PQI
(potentially avoidable hospitalization)
• Gaps in Care
Criteria• Hospitalization or ED Use
for SMI or SA• High PHQ9• Untreated SA
Criteria• Barriers to therapeutic
compliance
Low Risk Low RiskLow Risk
Medical Home Network’s Model Drives Effective Whole-Person Care
© Copyright 2018 MHNU Corporation, All Rights Reserved, Proprietary & Confidential
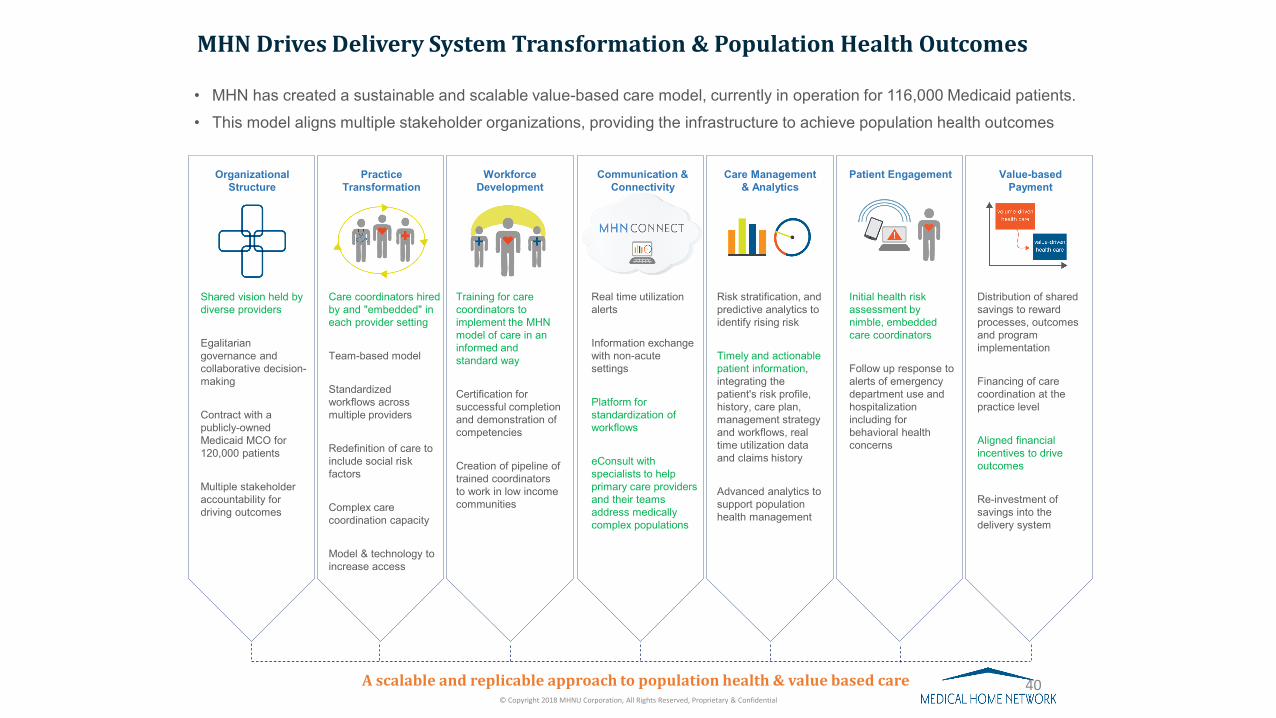
MHN Drives Delivery System Transformation & Population Health Outcomes
Organizational Structure
Shared vision held by diverse providers
Egalitarian governance and collaborative decision-making
Contract with a publicly-owned Medicaid MCO for 120,000 patients
Multiple stakeholder accountability for driving outcomes
PracticeTransformation
Care coordinators hired by and "embedded" in each provider setting
Team-based model
Standardized workflows across multiple providers
Redefinition of care to include social risk factors
Complex care coordination capacity
Model & technology to increase access
WorkforceDevelopment
Training for care coordinators to implement the MHN model of care in an informed and standard way
Certification for successful completion and demonstration of competencies
Creation of pipeline of trained coordinators to work in low income communities
Care Management& Analytics
Real time utilization alerts
Information exchange with non-acute settings
Platform for standardization of workflows
eConsult with specialists to help primary care providers and their teams address medically complex populations
Communication & Connectivity
Patient Engagement Value-based Payment
Risk stratification, and predictive analytics to identify rising risk
Timely and actionable patient information, integrating the patient's risk profile, history, care plan, management strategy and workflows, real time utilization data and claims history
Advanced analytics to support population health management
Initial health risk assessment by nimble, embedded care coordinators
Follow up response to alerts of emergency department use and hospitalization including for behavioral health concerns
Distribution of shared savings to reward processes, outcomes and program implementation
Financing of care coordination at the practice level
Aligned financial incentives to drive outcomes
Re-investment of savings into the delivery system
A scalable and replicable approach to population health & value based care
• MHN has created a sustainable and scalable value-based care model, currently in operation for 116,000 Medicaid patients.• This model aligns multiple stakeholder organizations, providing the infrastructure to achieve population health outcomes
© Copyright 2018 MHNU Corporation, All Rights Reserved, Proprietary & Confidential
40
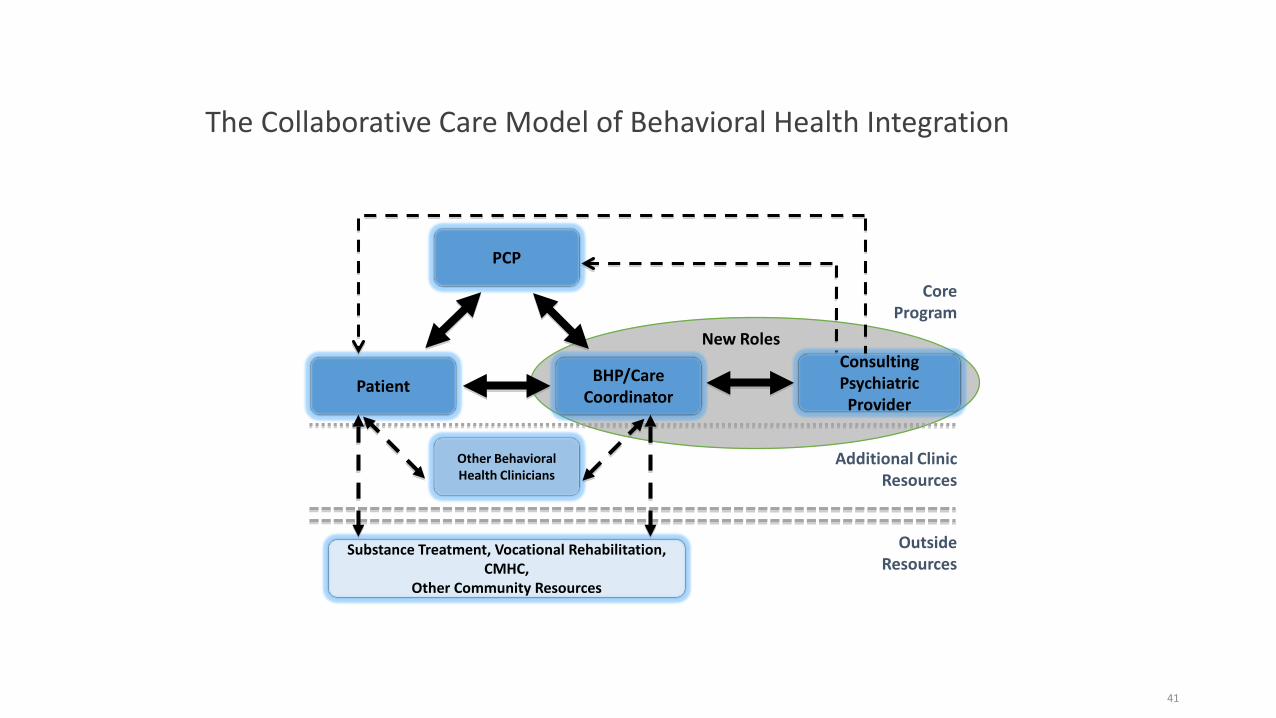
The Collaborative Care Model of Behavioral Health Integration
PCP
Patient BHP/CareCoordinator
Consulting Psychiatric Provider
Other Behavioral Health Clinicians
CoreProgram
Additional ClinicResources
OutsideResources
Substance Treatment, Vocational Rehabilitation, CMHC,
Other Community Resources
New Roles
41
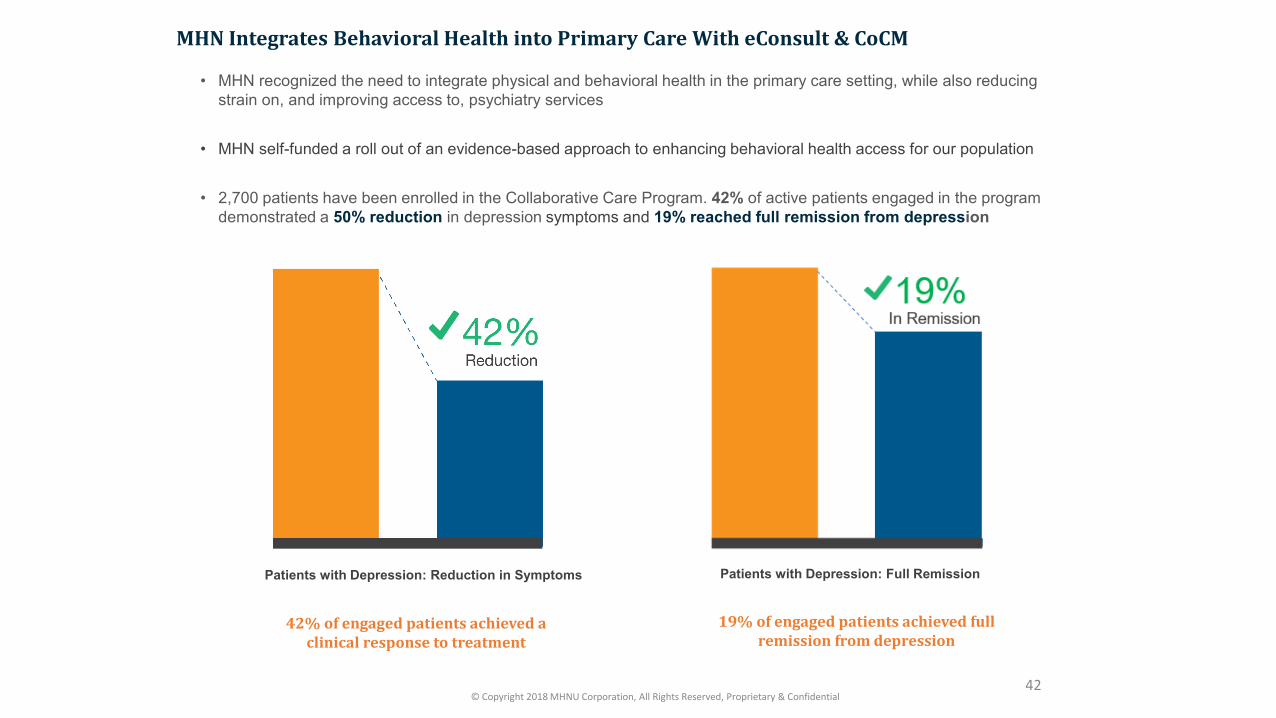
Patients with Depression: Reduction in Symptoms
• MHN recognized the need to integrate physical and behavioral health in the primary care setting, while also reducing strain on, and improving access to, psychiatry services
• MHN self-funded a roll out of an evidence-based approach to enhancing behavioral health access for our population
• 2,700 patients have been enrolled in the Collaborative Care Program. 42% of active patients engaged in the program demonstrated a 50% reduction in depression symptoms and 19% reached full remission from depression
MHN Integrates Behavioral Health into Primary Care With eConsult & CoCM
42% of engaged patients achieved a clinical response to treatment
19% of engaged patients achieved full remission from depression
Patients with Depression: Full Remission
42© Copyright 2018 MHNU Corporation, All Rights Reserved, Proprietary & Confidential
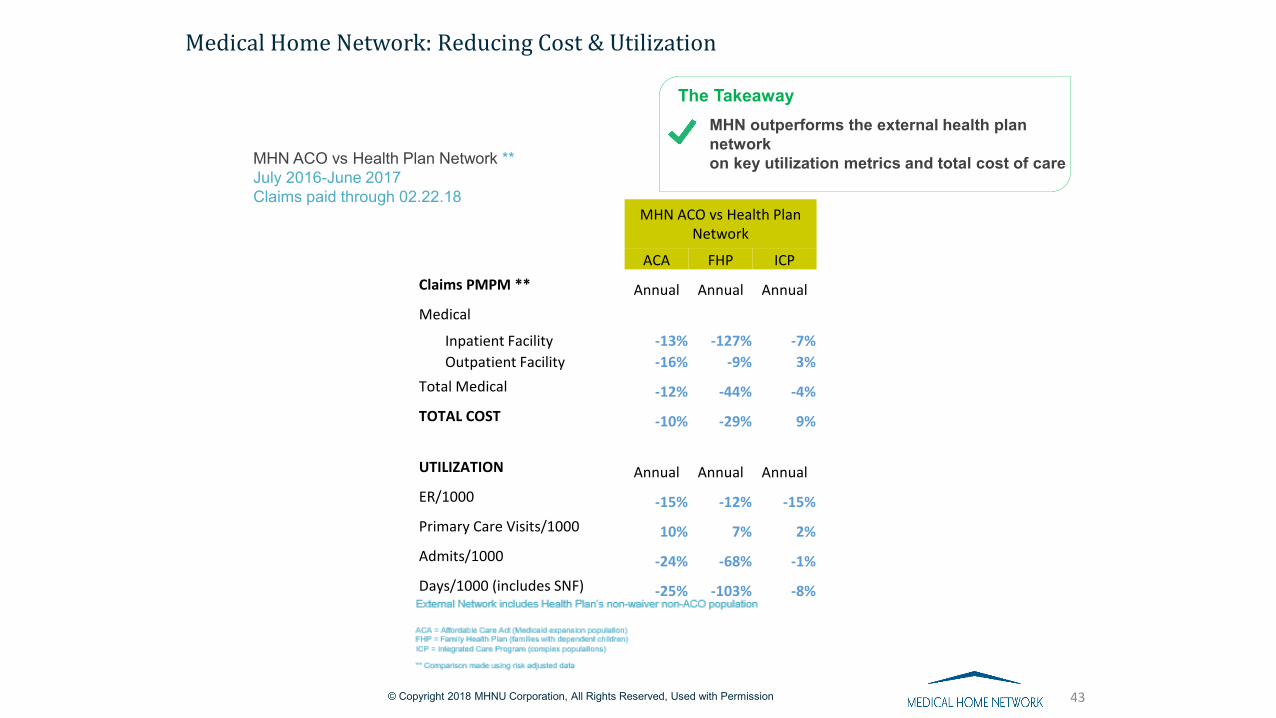
Medical Home Network: Reducing Cost & Utilization
MHN outperforms the external health plan networkon key utilization metrics and total cost of care
The Takeaway
43
MHN ACO vs Health Plan Network
ACA FHP ICPClaims PMPM ** Annual Annual AnnualMedical
Inpatient Facility -13% -127% -7%Outpatient Facility -16% -9% 3%
Total Medical -12% -44% -4%TOTAL COST -10% -29% 9%
UTILIZATION Annual Annual AnnualER/1000 -15% -12% -15%Primary Care Visits/1000 10% 7% 2%Admits/1000 -24% -68% -1%Days/1000 (includes SNF) -25% -103% -8%
MHN ACO vs Health Plan Network **July 2016-June 2017Claims paid through 02.22.18
© Copyright 2018 MHNU Corporation, All Rights Reserved, Used with Permission

Medical Home Network | © 2009 – 2016 All Rights Reserved | Used With Permission
MHN ACOX%
Earned Savings Distribution
Medical Homes/PCP Sites 50% of Pool Funding
Measures• ⬇ 30 Day All Cause Readmissions *•% 7 Day PCP Visit -IP Discharge•% 7 Day PCP Follow-Up -ER Admissions•% CTM3 Compliance Survey Completion •% New Patient Visits within 90 Days•% Care Plans with timely updates•% PHQ-2 positives with a completed PHQ-9• ⬇ ED Utilization per 1000 (FHP only) *
Surplus
Surplus Distribution60%
Risk Reserves25%
Clinical Initiatives Investment15%
Specialists & Hospitals50% of Pool Funding
Measures• ⬇ 7 Day All Cause Readmissions *• % Repeat ED visits w/in 30 days *• CTM3 Score (Value)• ≥95% System Uptime for HL7/ADT in MHNConnect Portal
• % Reduction of 24 Hour Admits *• % Specialist Visits at ACO Hospital Providers
$0 Payout
Deficit
Medical Cost of Care MLR < Contract MLRMedical Cost of Care MLR < Contract MLR
Supports: • Practice
Transformation• Collaborative
Care Model
Negotiable & Evolutionary
Care Management Capitation
At Risk P4P
Complex Care Management
Care Management PMPM
MHN DISTRIBUTION OF SHARED SAVINGS: Enabling Collaborative Delivery Redesign
Underwriting the Collaborative Care Model through Primary Care Capitation
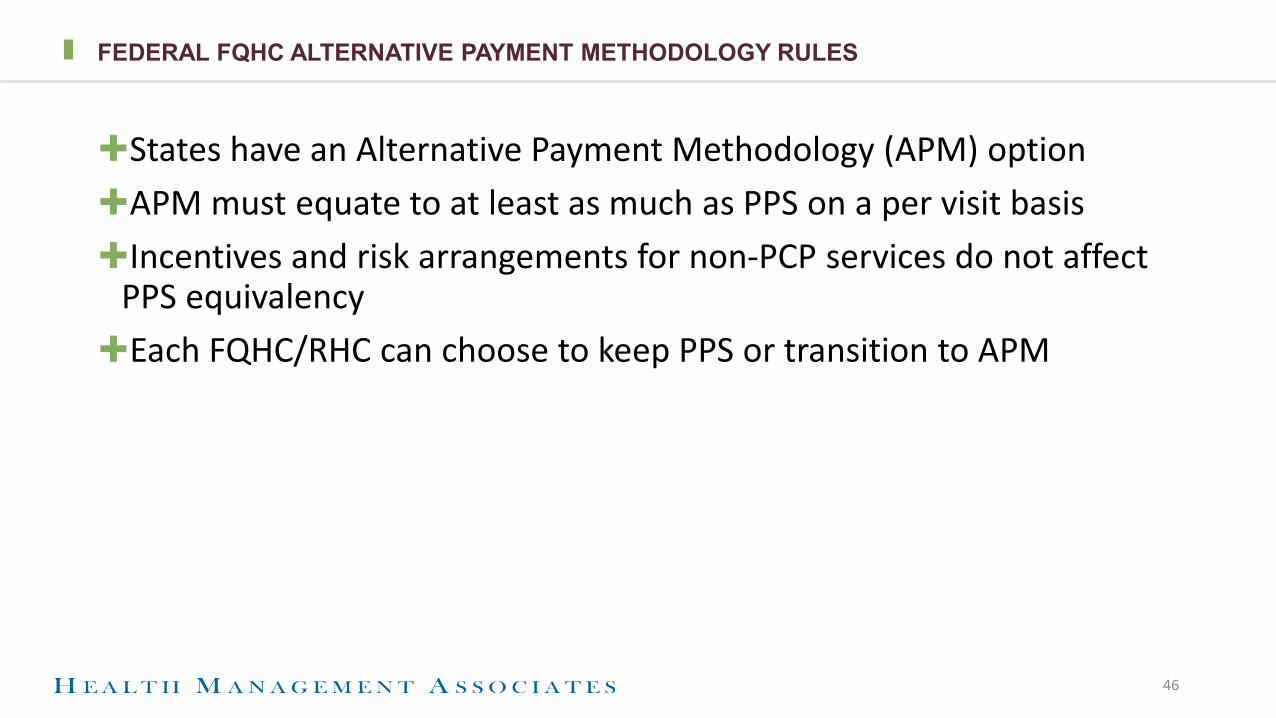
FEDERAL FQHC ALTERNATIVE PAYMENT METHODOLOGY RULES
✚States have an Alternative Payment Methodology (APM) option✚APM must equate to at least as much as PPS on a per visit basis✚Incentives and risk arrangements for non-PCP services do not affect
PPS equivalency✚Each FQHC/RHC can choose to keep PPS or transition to APM
46
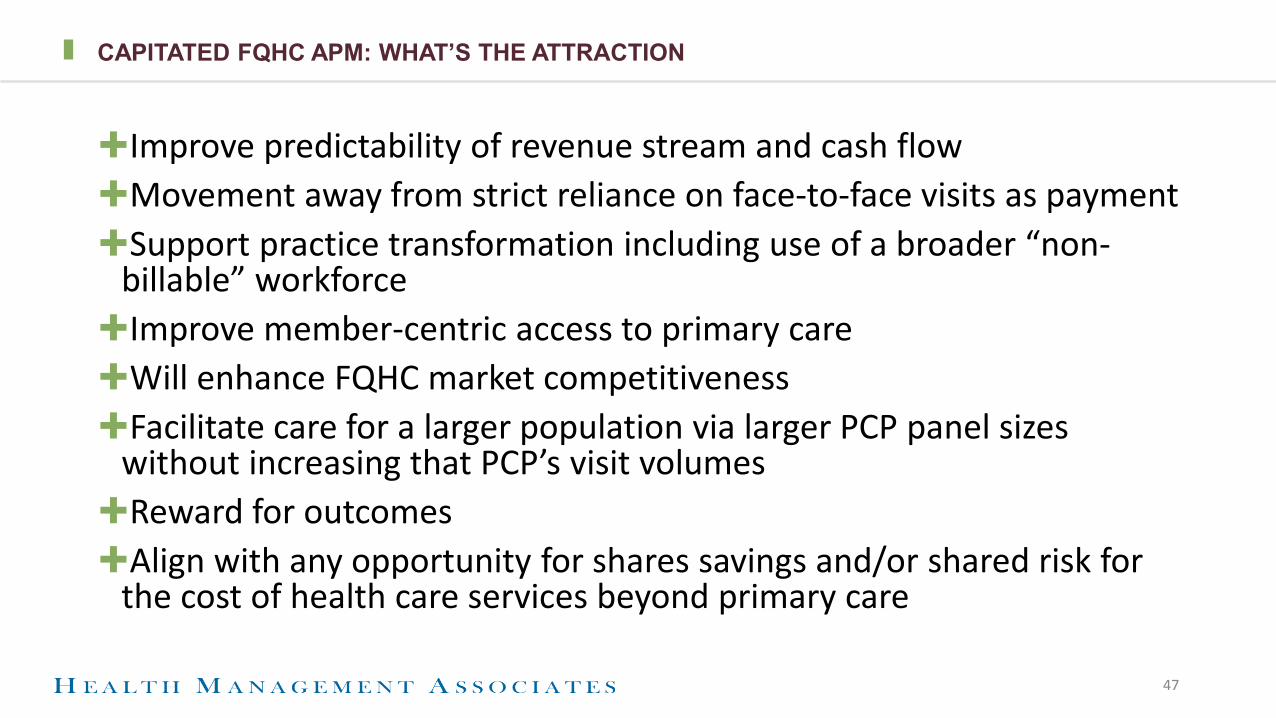
CAPITATED FQHC APM: WHAT’S THE ATTRACTION
✚Improve predictability of revenue stream and cash flow✚Movement away from strict reliance on face-to-face visits as payment✚Support practice transformation including use of a broader “non-
billable” workforce✚Improve member-centric access to primary care✚Will enhance FQHC market competitiveness ✚Facilitate care for a larger population via larger PCP panel sizes
without increasing that PCP’s visit volumes✚Reward for outcomes✚Align with any opportunity for shares savings and/or shared risk for
the cost of health care services beyond primary care
47

CAPITATED FQHC APM ELEMENTS
✚FQHCs receive no less than what they would have under PPS✚FQHCs retain the right to opt in and out of the APM ✚Wrap flow of payments from Medicaid agency directly or as pass
through the health plans✚No recoupment under the APM; reconciliation payment only if
required to assure at least PPS equivalency ✚Prospective adjustment based on performance on quality metrics
48

WASHINGTON STATE APM 4 CONSTRUCT
✚Conversion of PPS to a baseline PMPM rate✚(CY2016 PPS Rate times CY2016 Encounters) = CHC specific PMPM APM rate
✚Carry the baseline PMPM rate forward in future years
✚Trend the PMPM rate by MEI
✚Link a portion PMPM rate to quality comparable to health plan premium withhold for quality (1% of the APM rate in year one)
49

WASHINGTON STATE APM 4 CONSTRUCT
✚Tie quality improvement to subset of the State Common Measure set✚Performance will be on an individual basis✚Current year performance will be compared to prior year performance✚Health centers that demonstrate quality improvement will continue to
receive their PMPM payment✚Non-performance will result in reduced payment through prospective
adjustment, but never less than PPS
✚Upon meeting quality improvement targets, health centers retain the right to earn back the full benefit of APM in future years
50

ASSUMPTIONS FOR ILLUSTRATION PURPOSES
✚Market PCP cap $12 PMPM✚PPS $135/visit✚PCP productivity 3500 visits/yr.✚% Medicaid 50%✚Preventive visits 1 PMPY✚Reduce non-preventive, face-to-face encounters 2.5—2.2—2.0✚Total PCP visits 3.5—3.2—3.0✚Demand for PCPs willing to serve Medicaid recipients allows panel
expansion to fill resultant capacity
51

EXAMPLE: NON-PREVENTIVE PCP VISITS PROGRESSIVELY DECREASE
Per FTE PCP Baseline Year Year One Year Two
PCP Visits PMPY 3.5 3.2 3.0
PCP Panel Size 1,000 1,094 1,167
% Medicaid 50% 50% 50%
PCP MedicaidPanel Size
500 547 583
Medicaid Payment Equivalent PMPM
$ 39.37 $ 36.00 current$ 39.37 proposed
$ 33.75 current$ 39.37 proposed
PCP Panel Medicaid Rev
$236,250 $236,250 current$258,398 proposed
$236,250 current$275,625 proposed
Increase PCP Panel Revenue
$ 0 current $22,148 proposed
$ 0 current$39,375 proposed
52
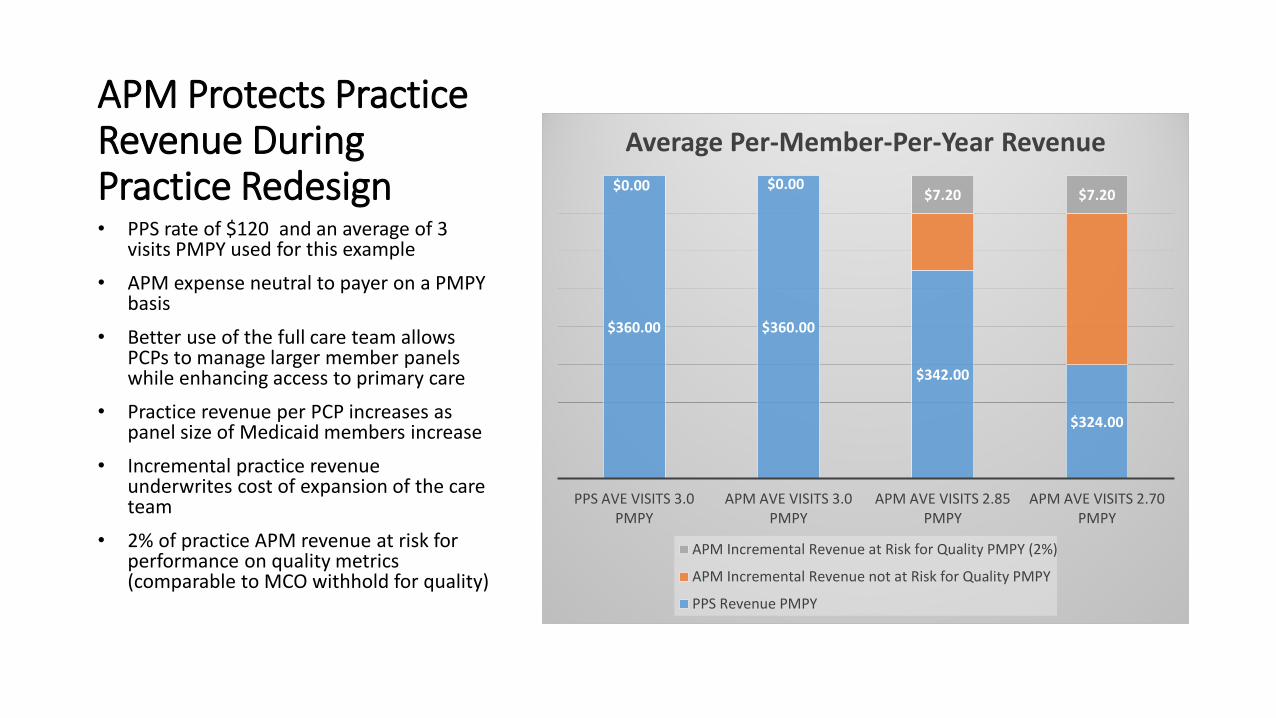
APM Protects Practice Revenue During Practice Redesign
$360.00 $360.00
$342.00
$324.00
$0.00 $0.00$7.20 $7.20
PPS AVE VISITS 3.0 PMPY
APM AVE VISITS 3.0 PMPY
APM AVE VISITS 2.85 PMPY
APM AVE VISITS 2.70 PMPY
Average Per-Member-Per-Year Revenue
APM Incremental Revenue at Risk for Quality PMPY (2%)
APM Incremental Revenue not at Risk for Quality PMPY
PPS Revenue PMPY
• PPS rate of $120 and an average of 3 visits PMPY used for this example
• APM expense neutral to payer on a PMPY basis
• Better use of the full care team allows PCPs to manage larger member panels while enhancing access to primary care
• Practice revenue per PCP increases as panel size of Medicaid members increase
• Incremental practice revenue underwrites cost of expansion of the care team
• 2% of practice APM revenue at risk for performance on quality metrics (comparable to MCO withhold for quality)
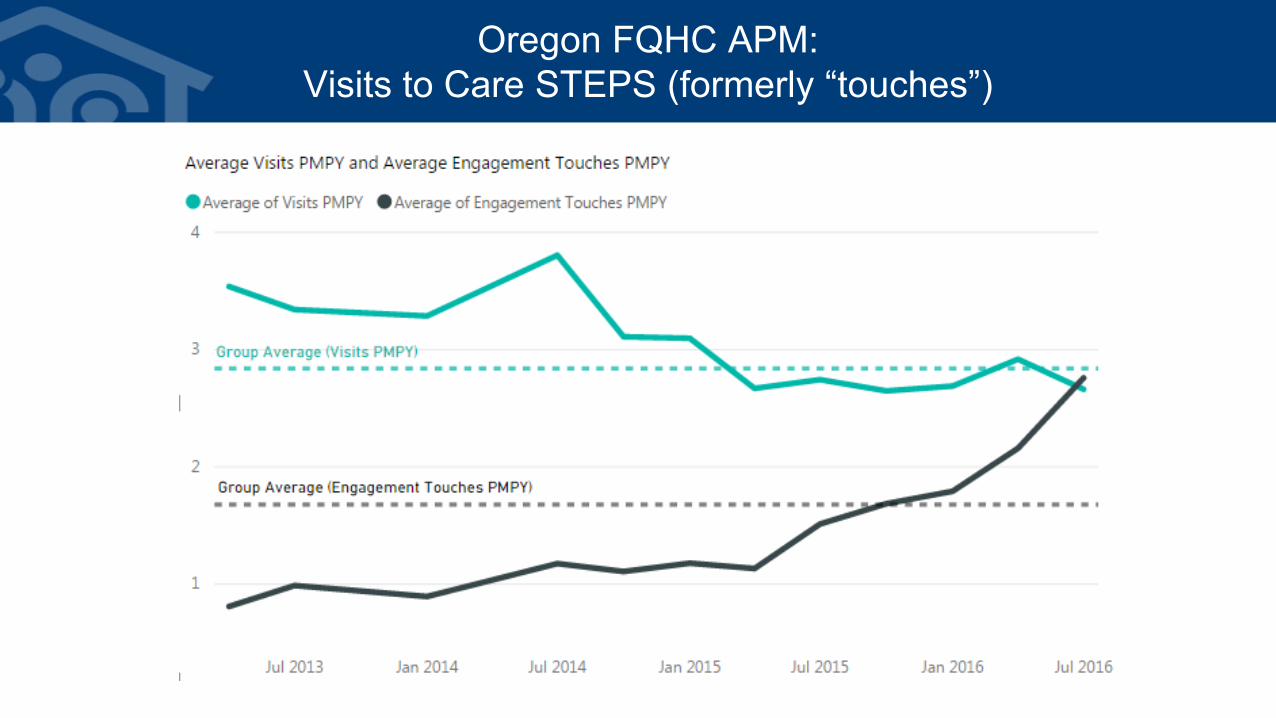
Oregon FQHC APM:Visits to Care STEPS (formerly “touches”)
54