sustainability analysis: hydrogen regional sustainability ...project id sa059 sustainability...
TRANSCRIPT
Project ID SA059
Sustainability Analysis Hydrogen Regional Sustainability (HyReS)
Marc Melaina (P.I.), Elizabeth Connelly (Presenter), Yuche Chen
National Renewable Energy Laboratory
DOE Hydrogen and Fuel Cells Program 2017 Annual Merit Review and Peer Evaluation Meeting June 6, 2017
This presentation does not contain any proprietary, confidential, or otherwise restricted information.
Overview
Timeline Barriers
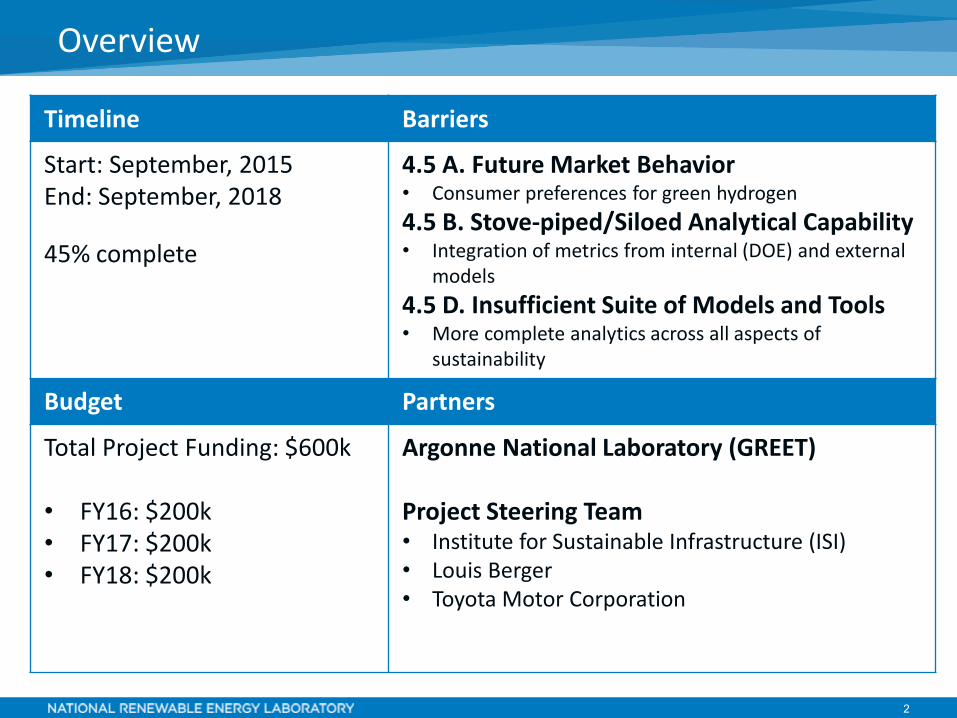
Start: September, 2015 End: September, 2018
45% complete
4.5 A. Future Market Behavior • Consumer preferences for green hydrogen 4.5 B. Stove-piped/Siloed Analytical Capability • Integration of metrics from internal (DOE) and external
models 4.5 D. Insufficient Suite of Models and Tools • More complete analytics across all aspects of
sustainability
Budget Partners
Total Project Funding: $600k
• FY16: $200k • FY17: $200k • FY18: $200k
Argonne National Laboratory (GREET)
Project Steering Team • Institute for Sustainable Infrastructure (ISI) • Louis Berger • Toyota Motor Corporation
2
FCTO Systems Analysis Framework Relevance/Impact 1
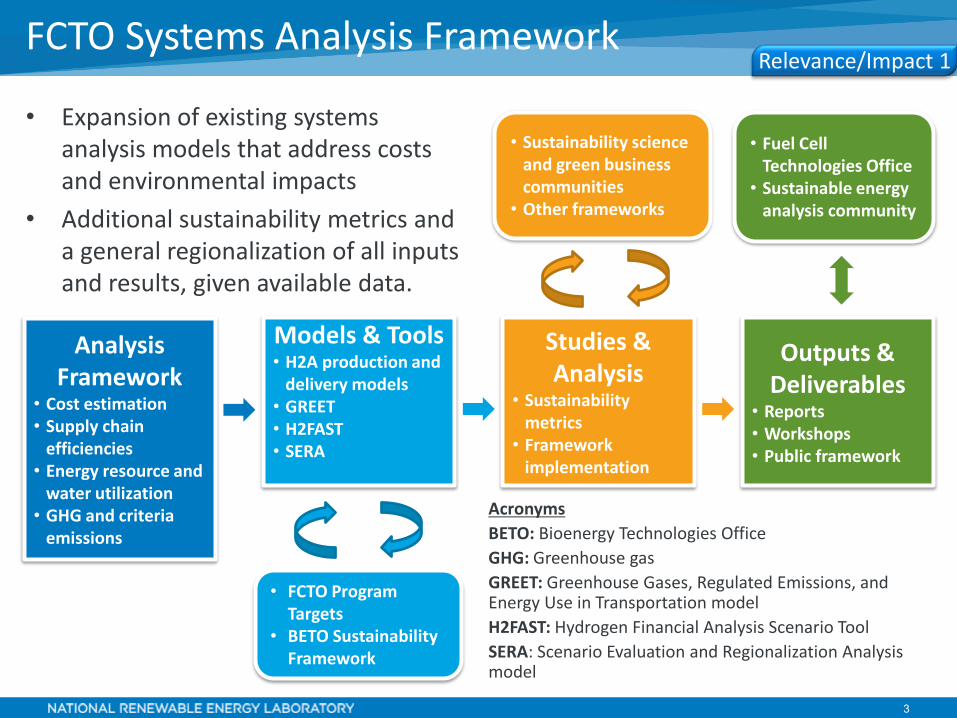
• Expansion of existing systems analysis models that address costs and environmental impacts
• Additional sustainability metrics and a general regionalization of all inputs and results, given available data.
• Sustainability science and green business communities • Other frameworks
• Fuel Cell Technologies Office • Sustainable energy
analysis community
Analysis Framework
• Cost estimation • Supply chain
efficiencies • Energy resource and
water utilization • GHG and criteria
emissions
Models & Tools • H2A production and
delivery models • GREET • H2FAST • SERA
Studies & Analysis
• Sustainability metrics • Framework
implementation
Outputs & Deliverables • Reports • Workshops • Public framework
• FCTO Program Targets • BETO Sustainability
Framework
Acronyms BETO: Bioenergy Technologies Office GHG: Greenhouse gas GREET: Greenhouse Gases, Regulated Emissions, and Energy Use in Transportation model H2FAST: Hydrogen Financial Analysis Scenario Tool SERA: Scenario Evaluation and Regionalization Analysis model
3
Analysis of environmental, economic, and social sustainabilityRelevance/Impact 2 of hydrogen supply chains
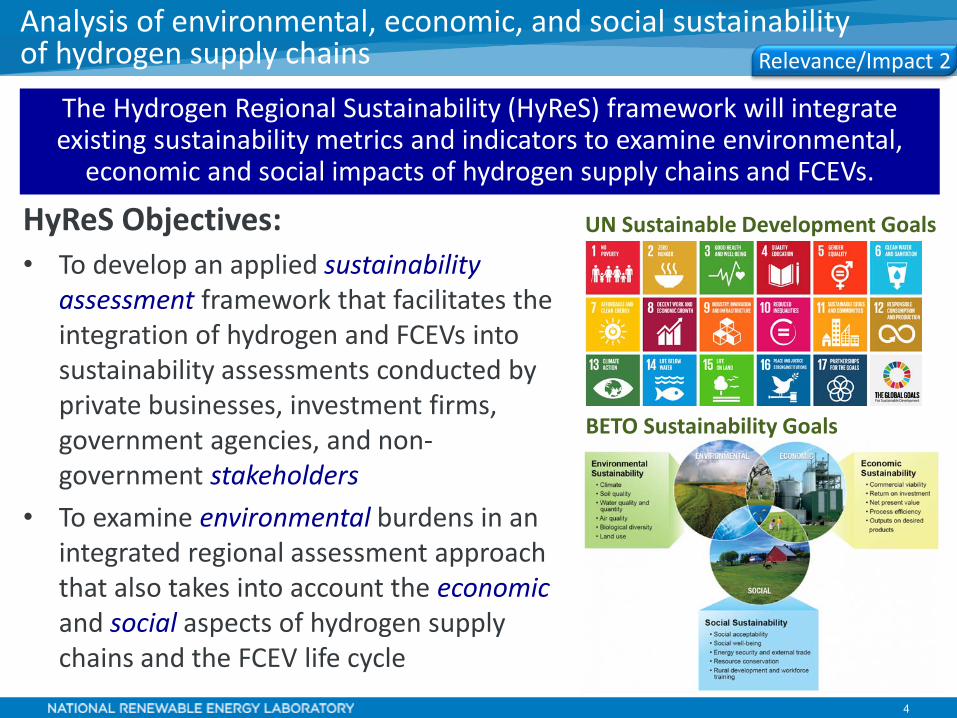
The Hydrogen Regional Sustainability (HyReS) framework will integrate existing sustainability metrics and indicators to examine environmental,
economic and social impacts of hydrogen supply chains and FCEVs.
HyReS Objectives: UN Sustainable Development Goals
• To develop an applied sustainability assessment framework that facilitates the integration of hydrogen and FCEVs into sustainability assessments conducted by private businesses, investment firms, government agencies, and non-government stakeholders
• To examine environmental burdens in an integrated regional assessment approach that also takes into account the economic and social aspects of hydrogen supply chains and the FCEV life cycle
BETO Sustainability Goals
4
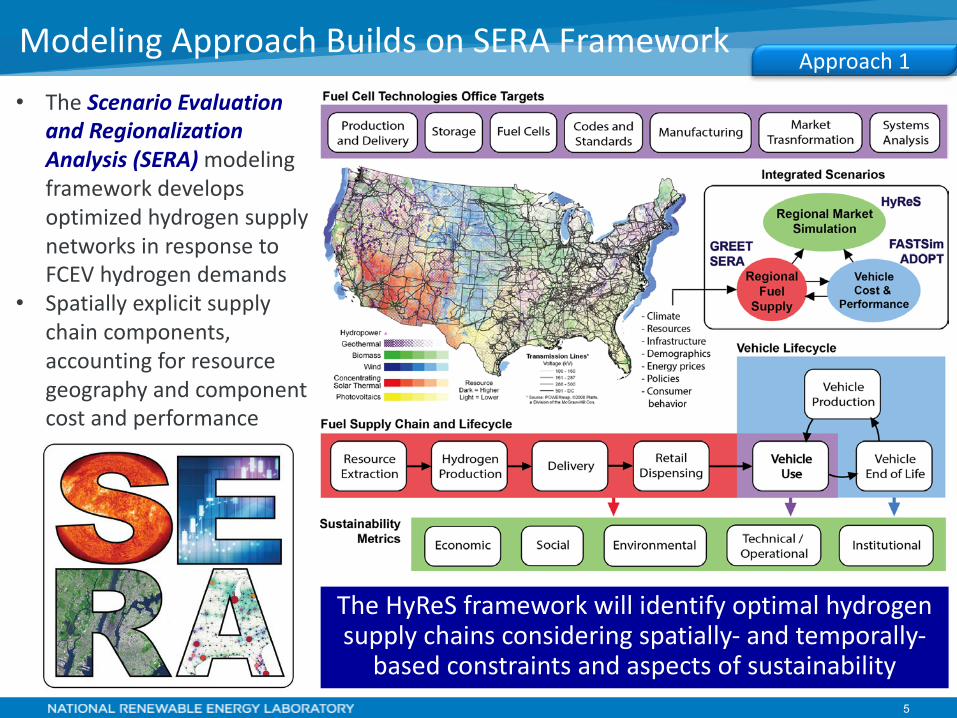
Modeling ApproachBuildsonSERA Framework Approach 1
• The Scenario Evaluation and Regionalization Analysis (SERA) modeling framework develops optimized hydrogen supply networks in response to FCEV hydrogendemands
• Spatially explicit supply chain components, accounting for resource geography andcomponent cost and performance
5
The HyReS framework will identify optimal hydrogensupply chains considering spatially- and temporally-
based constraints and aspects of sustainability
6
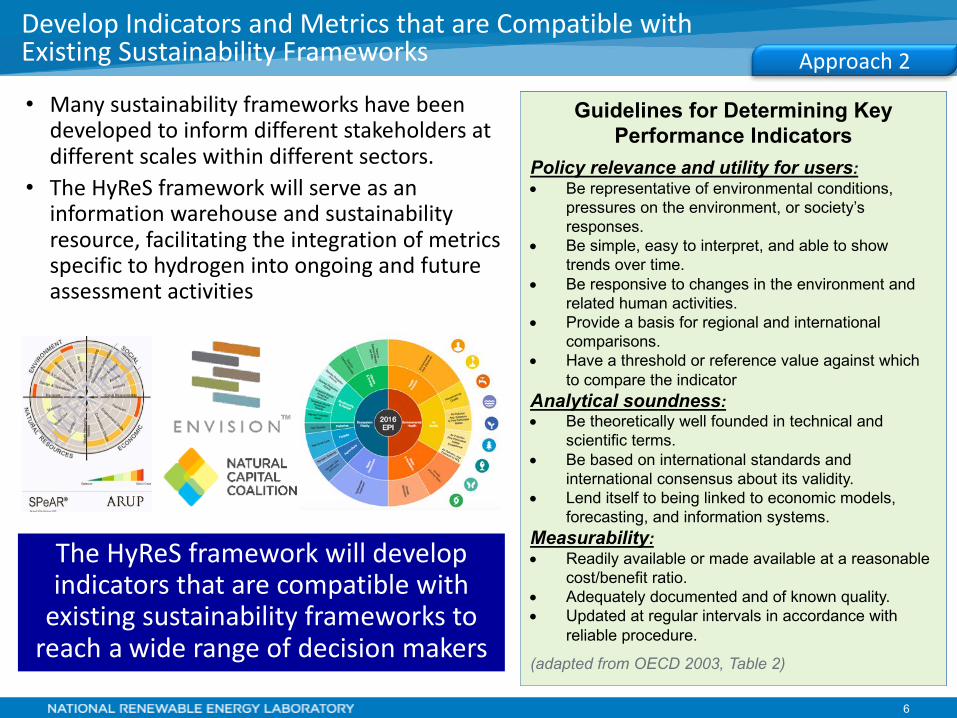
Approach 2
Develop Indicators and Metrics that are Compatible withExisting Sustainability Frameworks
Guidelines for Determining Key Performance Indicators
Policy relevance and utility for users: • Be representative of environmental conditions,
pressures on the environment, or society’s responses.
• Be simple, easy to interpret, and able to show trends over time.
• Be responsive to changes in the environment and related human activities.
• Provide a basis for regional and international comparisons.
• Have a threshold or reference value against which to compare the indicator
Analytical soundness: • Be theoretically well founded in technical and
scientific terms. • Be based on international standards and
international consensus about its validity. • Lend itself to being linked to economic models,
forecasting, and information systems. Measurability: • Readily available or made available at a reasonable
cost/benefit ratio. • Adequately documented and of known quality. • Updated at regular intervals in accordance with
reliable procedure.
(adapted from OECD 2003, Table 2)
TheHyReS framework will developindicatorsthat are compatible with existing sustainability frameworks to
reach a widerangeofdecision makers
• Many sustainability frameworks have been developed to inform different stakeholders at different scales within different sectors.
• The HyReS framework will serve as aninformationwarehouse andsustainability resource, facilitating the integration of metricsspecific to hydrogeninto ongoing andfuture assessment activities
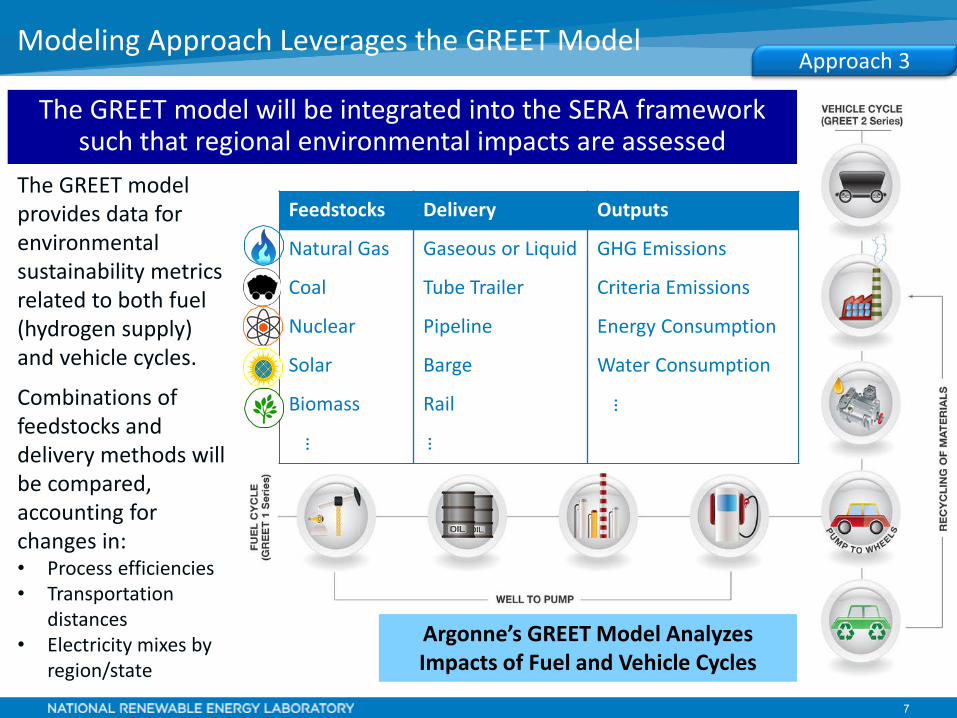
Modeling Approach Leverages the GREET Model Approach 3
The GREET model will be integrated into the SERA framework such that regional environmental impacts are assessed
The GREET model provides data for environmental sustainability metrics related to both fuel (hydrogen supply) and vehicle cycles.
Combinations of feedstocks and delivery methods will be compared, accounting for changes in: • Process efficiencies • Transportation
distances • Electricity mixes by
region/state
Feedstocks Delivery Outputs
Natural Gas Gaseous or Liquid GHG Emissions
Coal Tube Trailer Criteria Emissions
Nuclear Pipeline Energy Consumption
Solar Barge Water Consumption
Biomass Rail …
…
…
Argonne’s GREET Model Analyzes Impacts of Fuel and Vehicle Cycles
7
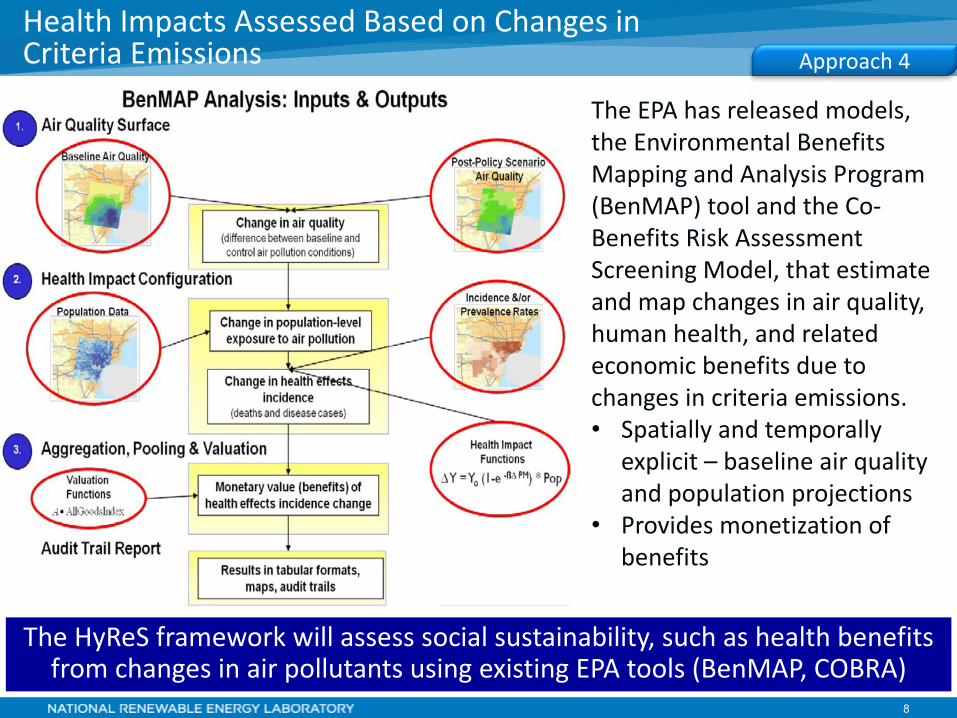
Health ImpactsAssessed Based on Changesin Criteria Emissions Approach 4
The EPA has released models, the Environmental Benefits Mapping and Analysis Program (BenMAP) tool and the Co-Benefits Risk Assessment Screening Model, that estimate and map changes in air quality, human health, and related economic benefits due to changes in criteria emissions. • Spatially and temporally
explicit – baseline air quality and population projections
• Provides monetization of benefits
8
The HyReSframework will assesssocial sustainability, such ashealth benefits from changesin air pollutantsusingexisting EPA tools(BenMAP, COBRA)
9
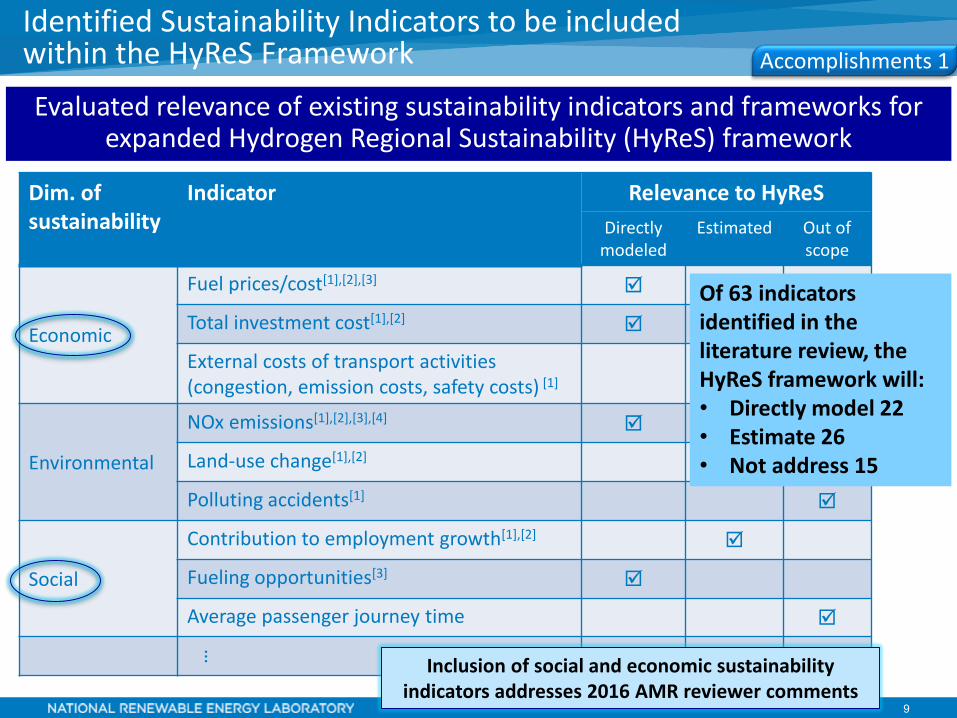
Identified Sustainability Indicators to be included within the HyReS FrameworkEvaluated relevance of existing sustainability indicators and frameworks for
expanded Hydrogen Regional Sustainability (HyReS) framework
Dim. of sustainability
Indicator Relevance to HyReSDirectly
modeledEstimated Out of
scope
Economic
Fuel prices/cost[1],[2],[3]
Total investment cost[1],[2]
External costs of transport activities (congestion, emission costs, safety costs) [1]
Environmental
NOx emissions[1],[2],[3],[4]
Land-use change[1],[2]
Polluting accidents[1]
Social
Contribution to employment growth[1],[2]
Fueling opportunities[3]
Average passenger journey time
…
Accomplishments 1
Of 63 indicators identified in the literature review, the HyReS framework will: • Directly model 22 • Estimate 26• Not address 15
Inclusion of social and economic sustainability indicators addresses 2016 AMR reviewer comments
10
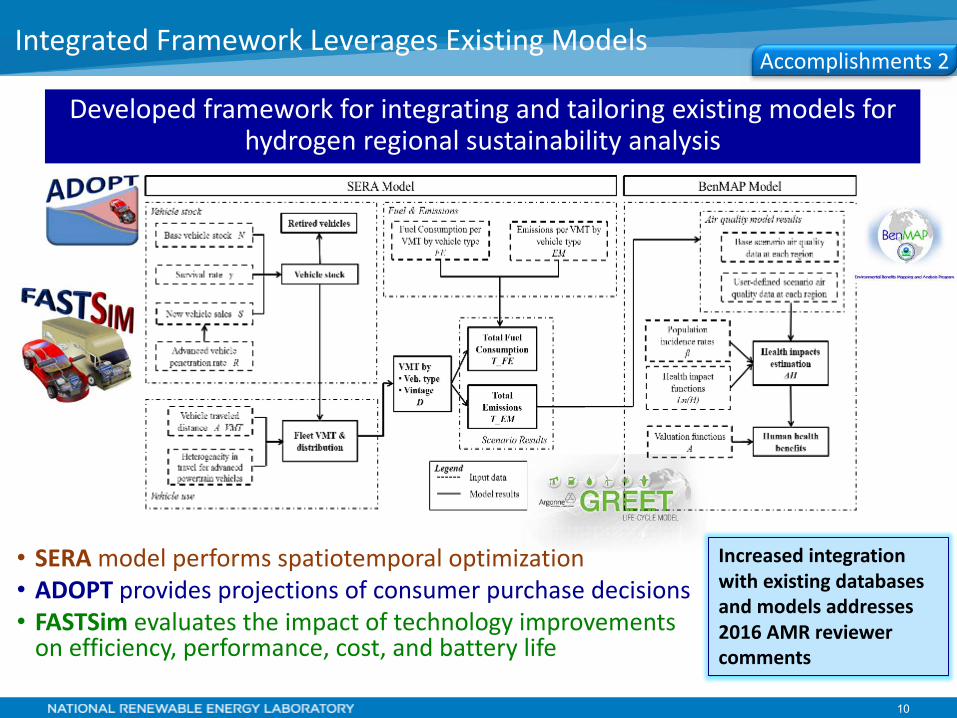
• SERA modelperformsspatiotemporaloptimization• ADOPT providesprojectionsofconsumerpurchasedecisions• FASTSim evaluatestheimpactoftechnologyimprovements
onefficiency,performance,cost,andbatterylife
IntegratedFrameworkLeveragesExistingModelsAccomplishments2
Developedframeworkforintegratingandtailoringexistingmodelsforhydrogenregionalsustainabilityanalysis
Increasedintegrationwithexistingdatabasesandmodelsaddresses2016AMRreviewercomments
11
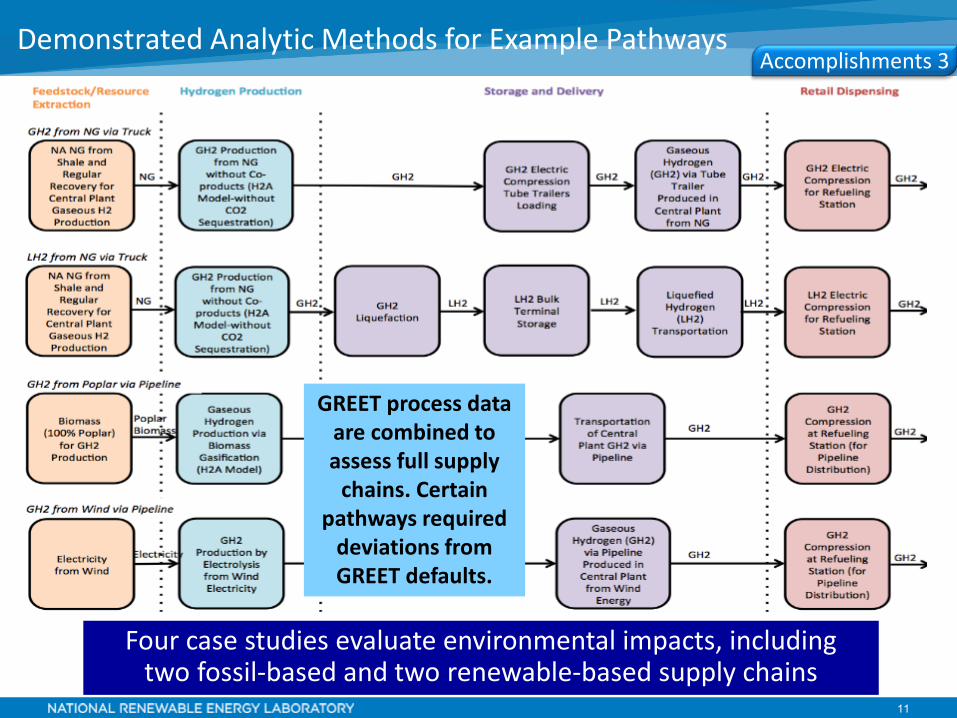
Demonstrated Analytic Methods for Example PathwaysAccomplishments 3
GREET process data are combined to assess full supply
chains. Certain pathways required
deviations from GREET defaults.
Four case studies evaluate environmental impacts, including two fossil-based and two renewable-based supply chains
12
-100,000200,000300,000400,000500,000600,000700,000
GH2fromNGviaTruck
LH2fromNGviaTruck
GH2fromPoplarviaPipeline
GH2fromWindviaPipeline
cm3H2
0/MMBtuH2
VehicleCycle OperaKon WTP
-
50,000
100,000
150,000
200,000
250,000
GH2fromNGviaTruck
LH2fromNGviaTruck
GH2fromPoplarviaPipeline
GH2fromWindviaPipeline
gCO
2e/M
MBtuH2
VehicleCycle OperaHon WTP
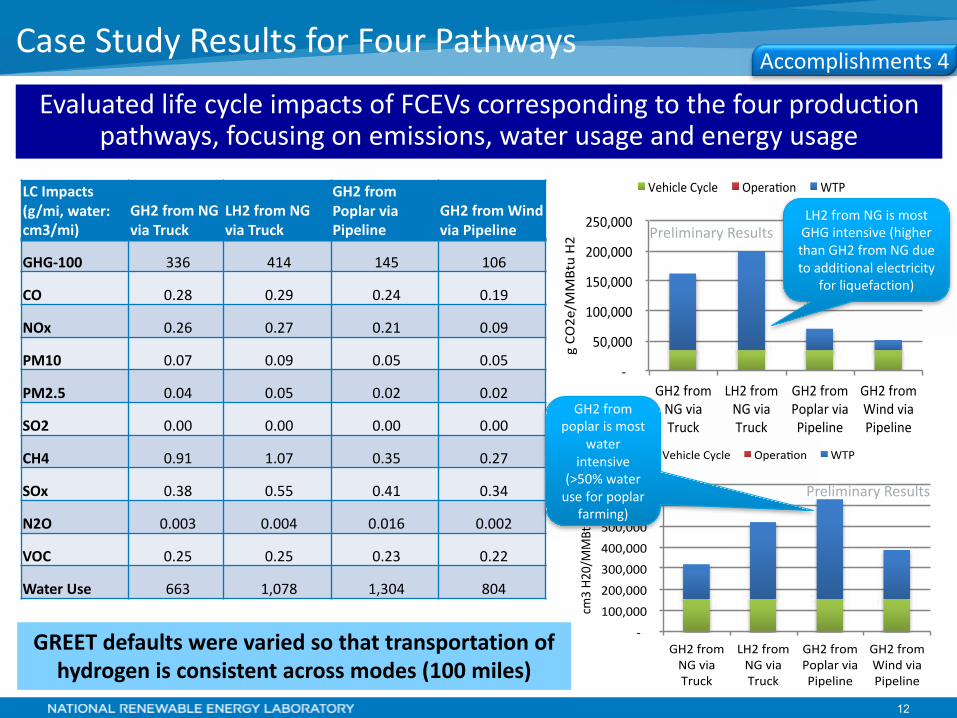
CaseStudyResultsforFourPathways
LCImpacts(g/mi,water:cm3/mi)
GH2fromNGviaTruck
LH2fromNGviaTruck
GH2fromPoplarviaPipeline
GH2fromWindviaPipeline
GHG-100 336 414 145 106
CO 0.28 0.29 0.24 0.19
NOx 0.26 0.27 0.21 0.09
PM10 0.07 0.09 0.05 0.05
PM2.5 0.04 0.05 0.02 0.02
SO2 0.00 0.00 0.00 0.00
CH4 0.91 1.07 0.35 0.27
SOx 0.38 0.55 0.41 0.34
N2O 0.003 0.004 0.016 0.002
VOC 0.25 0.25 0.23 0.22
Water Use 663 1,078 1,304 804
Accomplishments4
EvaluatedlifecycleimpactsofFCEVscorrespondingtothefourproductionpathways,focusingonemissions,waterusageandenergyusage
GREETdefaultswerevariedsothattransportationofhydrogenisconsistentacrossmodes(100miles)
LH2fromNGismostGHGintensive(higherthanGH2fromNGduetoadditionalelectricity
forliquefaction)
GH2frompoplarismost
waterintensive
(>50%wateruseforpoplar
farming)
PreliminaryResults
PreliminaryResults
13
Regionalization of Electricity Mix
0%
10%
20%
30%
40%
50%
60%
70%
80%
90%
100%
WV KY WY IN MO UT OH ND NM WI NE CO KS AR MI MT MD TN IL TX OK IA NC AZ GA AL PA MN SC VA LA FL MS NV DE MA NH OR WA NY AK CT NJ CA HI ID ME RI SD VT
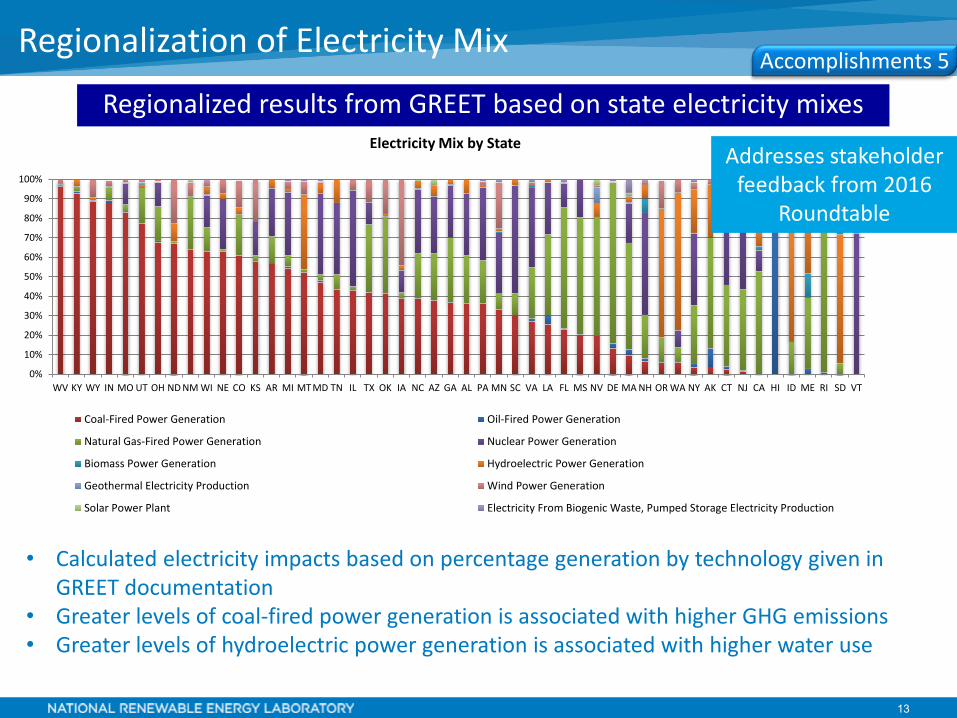
Electricity Mix by State
Coal-Fired Power Generation Oil-Fired Power Generation
Natural Gas-Fired Power Generation Nuclear Power Generation
Biomass Power Generation Hydroelectric Power Generation
Geothermal Electricity Production Wind Power Generation
Solar Power Plant Electricity From Biogenic Waste, Pumped Storage Electricity Production
Addresses stakeholder feedback from 2016
Roundtable
Accomplishments 5
Regionalized results from GREET based on state electricity mixes
• Calculated electricity impacts based on percentage generation by technology given in GREET documentation
• Greater levels of coal-fired power generation is associated with higher GHG emissions• Greater levels of hydroelectric power generation is associated with higher water use
14
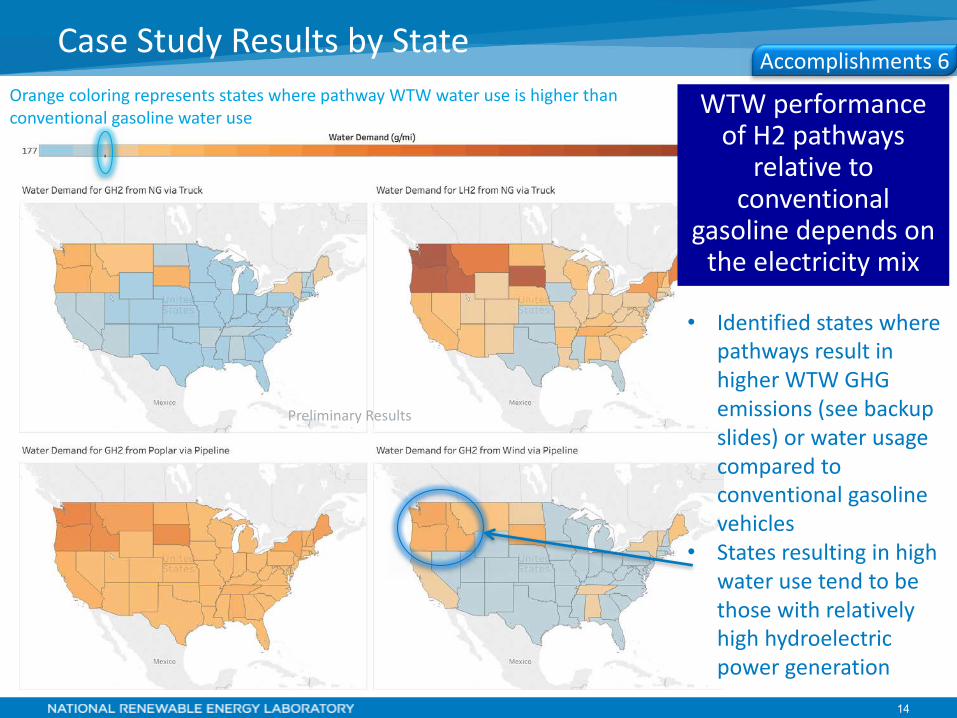
CaseStudyResultsbyStateAccomplishments6
• IdentifiedstateswherepathwaysresultinhigherWTWGHGemissions(seebackupslides)orwaterusagecomparedtoconventionalgasolinevehicles
• Statesresultinginhighwaterusetendtobethosewithrelativelyhighhydroelectricpowergeneration
WTWperformanceofH2pathways
relativetoconventional
gasolinedependsontheelectricitymix
OrangecoloringrepresentsstateswherepathwayWTWwateruseishigherthanconventionalgasolinewateruse
PreliminaryResults
15
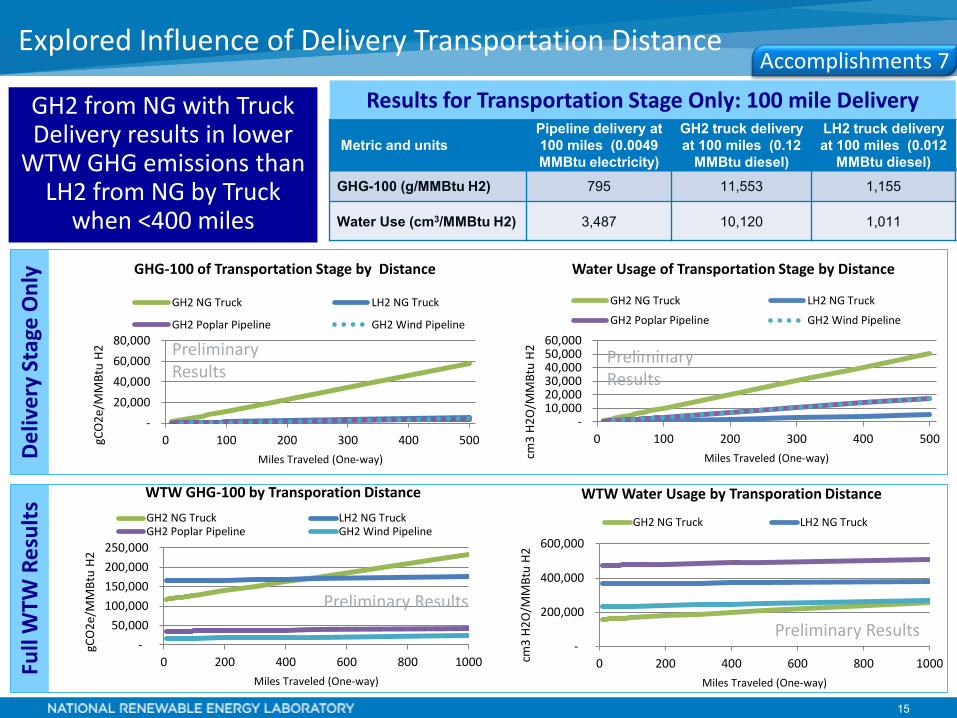
Metric and unitsPipeline delivery at 100 miles (0.0049 MMBtu electricity)
GH2 truck delivery at 100 miles (0.12
MMBtu diesel)
LH2 truck delivery at 100 miles (0.012
MMBtu diesel)GHG-100 (g/MMBtu H2) 795 11,553 1,155
Water Use (cm3/MMBtu H2) 3,487 10,120 1,011
Explored Influence of Delivery Transportation DistanceAccomplishments 7
- 50,000
100,000 150,000 200,000 250,000
0 200 400 600 800 1000
gCO
2e/M
MBt
u H2
Miles Traveled (One-way)
WTW GHG-100 by Transporation DistanceGH2 NG Truck LH2 NG TruckGH2 Poplar Pipeline GH2 Wind Pipeline
-
200,000
400,000
600,000
0 200 400 600 800 1000cm3
H2O
/MM
Btu
H2
Miles Traveled (One-way)
WTW Water Usage by Transporation Distance
GH2 NG Truck LH2 NG Truck
- 20,000 40,000 60,000 80,000
0 100 200 300 400 500gCO
2e/M
MBt
u H2
Miles Traveled (One-way)
GHG-100 of Transportation Stage by Distance
GH2 NG Truck LH2 NG Truck
GH2 Poplar Pipeline GH2 Wind Pipeline
- 10,000 20,000 30,000 40,000 50,000 60,000
0 100 200 300 400 500
cm3
H2O
/MM
Btu
H2
Miles Traveled (One-way)
Water Usage of Transportation Stage by Distance
GH2 NG Truck LH2 NG Truck
GH2 Poplar Pipeline GH2 Wind Pipeline
GH2 from NG with Truck Delivery results in lower
WTW GHG emissions than LH2 from NG by Truck
when <400 miles
Results for Transportation Stage Only: 100 mile Delivery
Preliminary Results
Preliminary Results
Preliminary Results
Preliminary Results
Del
iver
y St
age
Onl
y Fu
ll W
TW R
esul
ts
16
$(10,000)$-
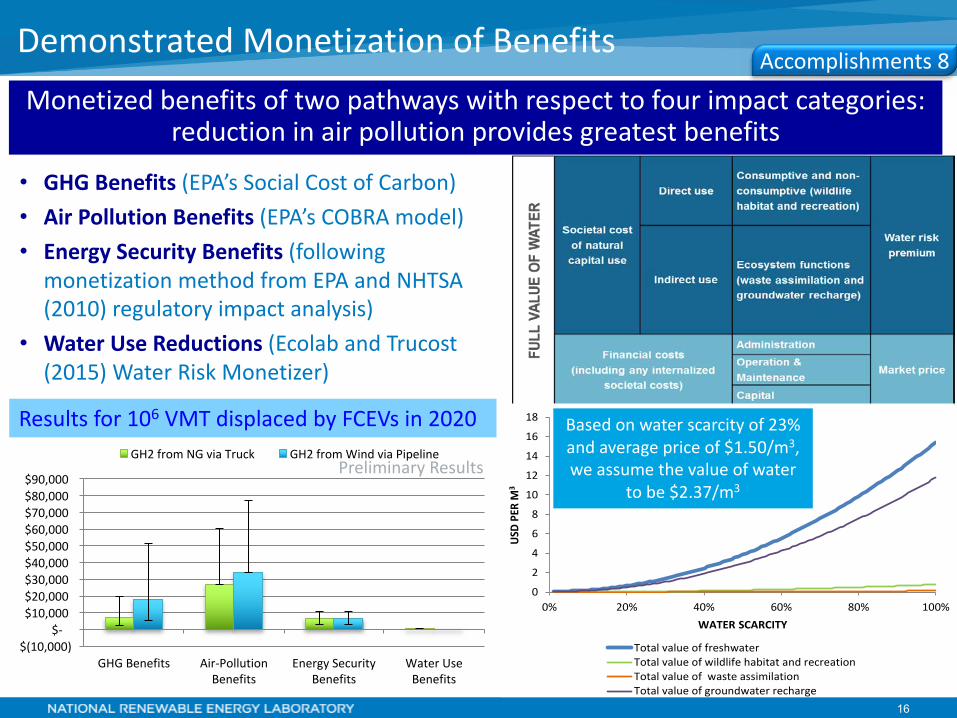
$10,000$20,000$30,000$40,000$50,000$60,000$70,000$80,000$90,000
GHGBenefits Air-PollutionBenefits
EnergySecurityBenefits
WaterUseBenefits
GH2fromNGviaTruck GH2fromWindviaPipeline
• GHGBenefits(EPA’sSocialCostofCarbon)• AirPollutionBenefits(EPA’sCOBRAmodel)• EnergySecurityBenefits(following
monetizationmethodfromEPAandNHTSA(2010)regulatoryimpactanalysis)
• WaterUseReductions(EcolabandTrucost(2015)WaterRiskMonetizer)
DemonstratedMonetizationofBenefits
Accomplishments8
Monetizedbenefitsoftwopathwayswithrespecttofourimpactcategories:reductioninairpollutionprovidesgreatestbenefits
0
2
4
6
8
10
12
14
16
18
0% 20% 40% 60% 80% 100%
USD
PER
M3
WATER SCARCITY
Total value of freshwaterTotal value of wildlife habitat and recreationTotal value of waste assimilationTotal value of groundwater recharge
Basedonwaterscarcityof23%andaveragepriceof$1.50/m3,weassumethevalueofwater
tobe$2.37/m3PreliminaryResults
Resultsfor106 VMTdisplacedbyFCEVsin2020
17
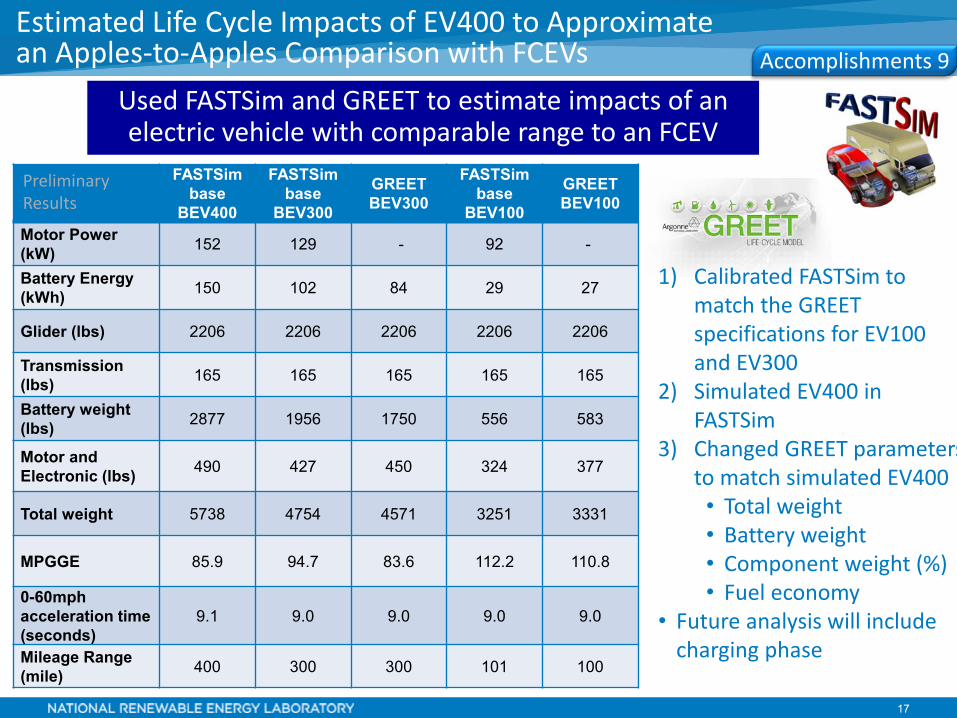
FASTSim base
BEV400
FASTSim base
BEV300
GREET BEV300
FASTSim base
BEV100
GREET BEV100
Motor Power (kW) 152 129 - 92 -
Battery Energy (kWh) 150 102 84 29 27
Glider (lbs) 2206 2206 2206 2206 2206
Transmission (lbs) 165 165 165 165 165
Battery weight (lbs) 2877 1956 1750 556 583
Motor and Electronic (lbs) 490 427 450 324 377
Total weight 5738 4754 4571 3251 3331
MPGGE 85.9 94.7 83.6 112.2 110.8
0-60mph acceleration time (seconds)
9.1 9.0 9.0 9.0 9.0
Mileage Range (mile) 400 300 300 101 100
Estimated Life Cycle Impacts of EV400 to Approximate an Apples-to-Apples Comparison with FCEVs Accomplishments 9
Used FASTSim and GREET to estimate impacts of an electric vehicle with comparable range to an FCEV
1) Calibrated FASTSim to match the GREET specifications for EV100 and EV300
2) Simulated EV400 in FASTSim
3) Changed GREET parameters to match simulated EV400• Total weight• Battery weight• Component weight (%)• Fuel economy
• Future analysis will include charging phase
Preliminary Results
18
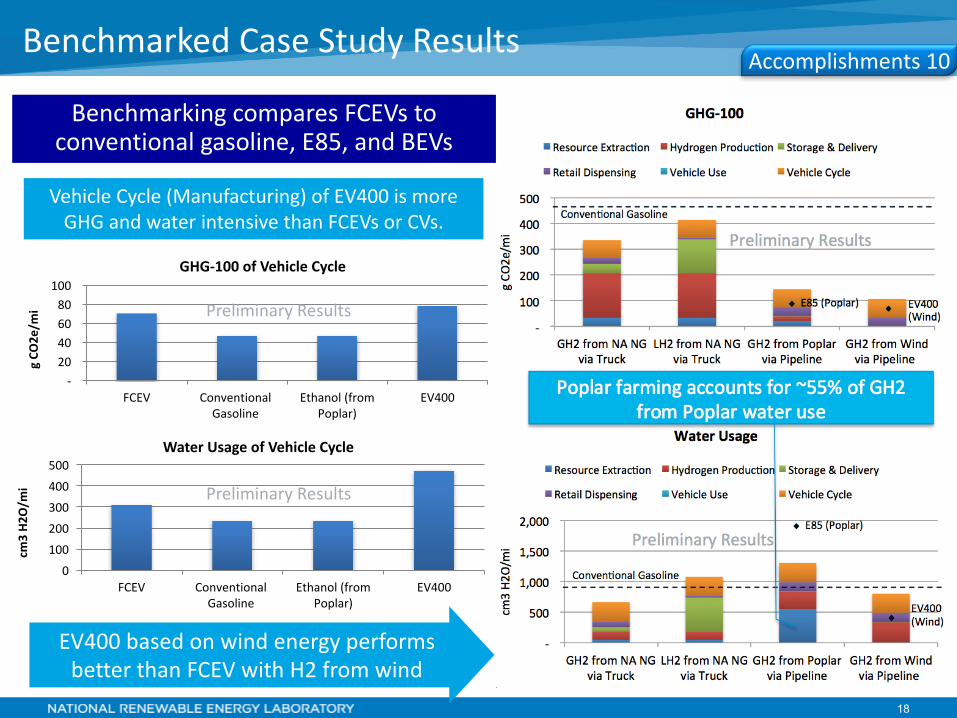
BenchmarkedCaseStudyResultsAccomplishments10
-20406080
100
FCEV ConventionalGasoline
Ethanol(fromPoplar)
EV400
gCO
2e/m
i
GHG-100ofVehicleCycle
0100200300400500
FCEV ConventionalGasoline
Ethanol(fromPoplar)
EV400
cm3
H2O
/mi
WaterUsageofVehicleCycle
VehicleCycle(Manufacturing)ofEV400ismoreGHGandwaterintensivethanFCEVsorCVs.
BenchmarkingcomparesFCEVstoconventionalgasoline,E85,andBEVs
EV400basedonwindenergyperformsbetterthanFCEVwithH2fromwind
PreliminaryResults
PreliminaryResults
19
• ArgonneNationalLaboratoryo GREETModel
• ProjectSteeringTeam:o ArgonneNationalLaboratoryo InstituteforSustainableInfrastructure(ISI)o LouisBergero ToyotaMotorCorporation
CollaborationCollaboration1
20
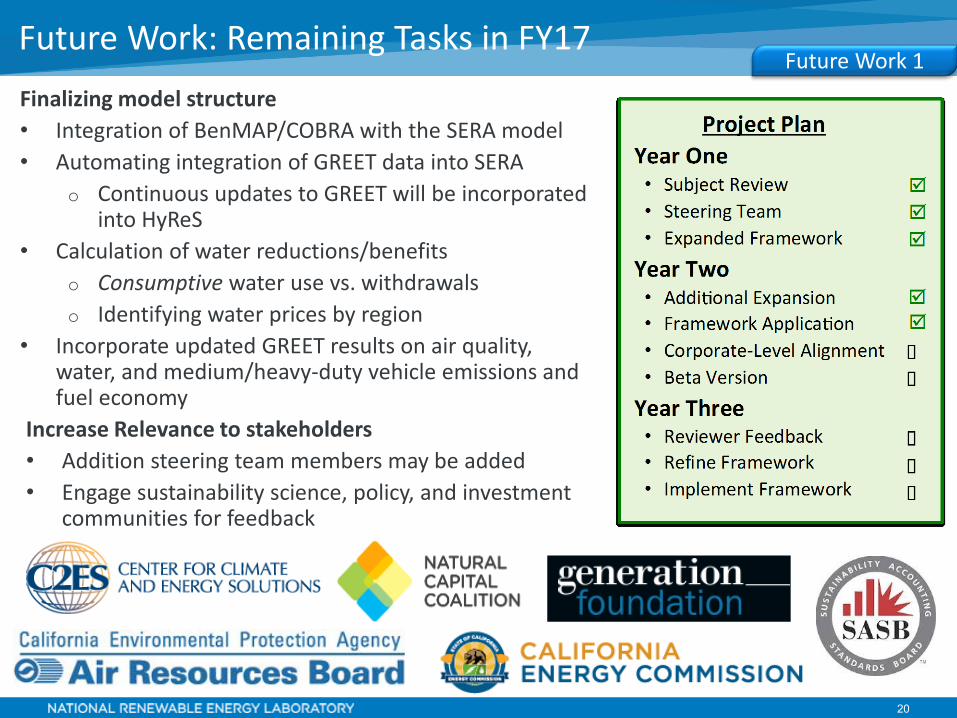
Finalizing model structure• Integration of BenMAP/COBRA with the SERA model• Automating integration of GREET data into SERA
o Continuous updates to GREET will be incorporated into HyReS
• Calculation of water reductions/benefitso Consumptive water use vs. withdrawalso Identifying water prices by region
• Incorporate updated GREET results on air quality, water, and medium/heavy-duty vehicle emissions and fuel economy
Increase Relevance to stakeholders• Addition steering team members may be added• Engage sustainability science, policy, and investment
communities for feedback
Future Work: Remaining Tasks in FY17Future Work 1

21
Relevanceofsustainabilityinmarketgrowth• Californiastatepolicieswillaccelerateadoption
ofFCEVs,BEVs,andPHEVs• HyReSwillbefullyintegratedwiththevehicle
adoptioncapabilitiesofADOPTandhydrogensupplyandfinancingcapabilitiesofSERA/H2FAST
• HyReSwillthenbeabletoinformbroaderdiscussionsaboutsustainabilityimpactsofspecificstateandfederalpolicymechanisms
CompleteintegrationwithSERA/ADOPTMarketSimulationCapabilities FutureWork2
MarketsimulationcapabilitieswillenableHyReStocontributetobroaderdiscussionsaroundZEVadoption
https://www.arb.ca.gov/msprog/zevprog/zevprog.htm
22
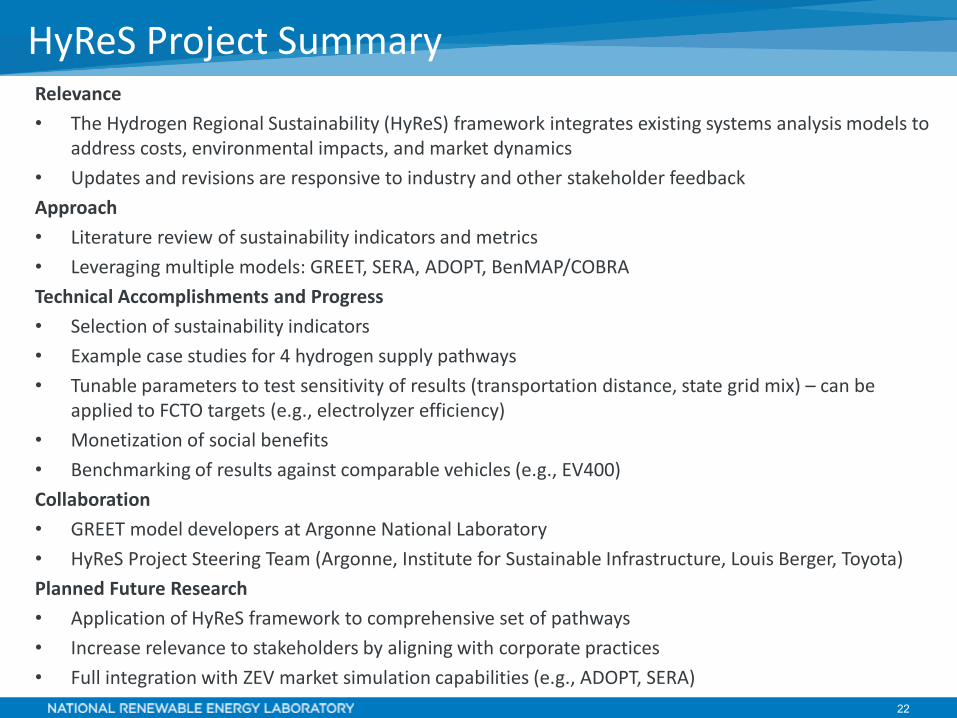
Relevance• The Hydrogen Regional Sustainability (HyReS) framework integrates existing systems analysis models to
address costs, environmental impacts, and market dynamics• Updates and revisions are responsive to industry and other stakeholder feedbackApproach• Literature review of sustainability indicators and metrics• Leveraging multiple models: GREET, SERA, ADOPT, BenMAP/COBRATechnical Accomplishments and Progress• Selection of sustainability indicators• Example case studies for 4 hydrogen supply pathways• Tunable parameters to test sensitivity of results (transportation distance, state grid mix) – can be
applied to FCTO targets (e.g., electrolyzer efficiency) • Monetization of social benefits• Benchmarking of results against comparable vehicles (e.g., EV400)Collaboration• GREET model developers at Argonne National Laboratory• HyReS Project Steering Team (Argonne, Institute for Sustainable Infrastructure, Louis Berger, Toyota)Planned Future Research• Application of HyReS framework to comprehensive set of pathways• Increase relevance to stakeholders by aligning with corporate practices• Full integration with ZEV market simulation capabilities (e.g., ADOPT, SERA)
HyReS Project Summary


Technical Back-Up Slides
25
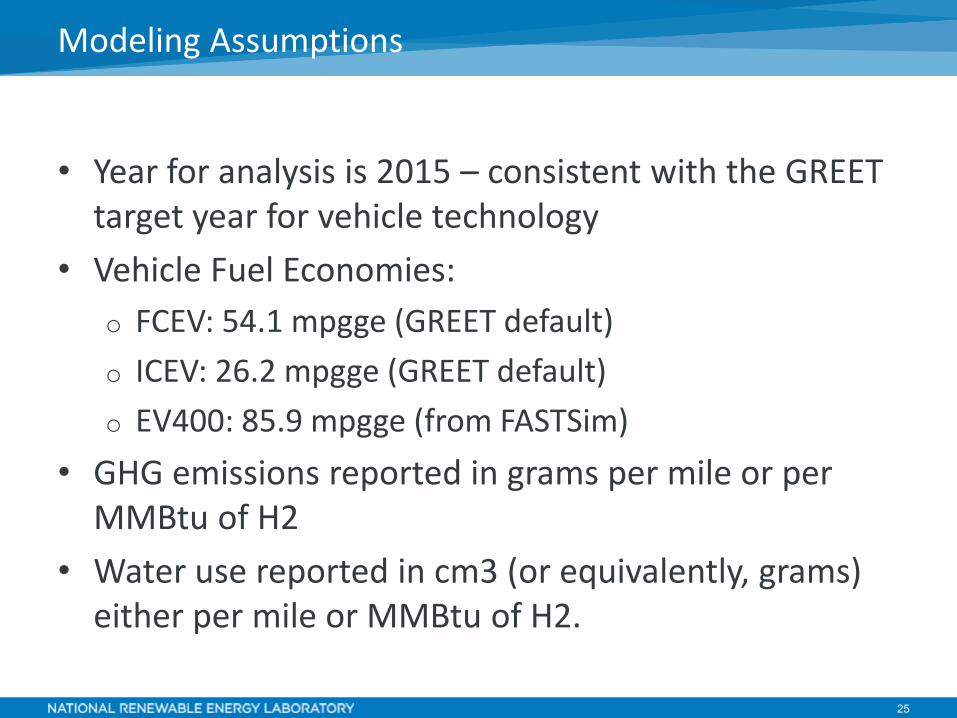
• Year for analysis is 2015 – consistent with the GREET target year for vehicle technology
• Vehicle Fuel Economies:o FCEV: 54.1 mpgge (GREET default)o ICEV: 26.2 mpgge (GREET default)o EV400: 85.9 mpgge (from FASTSim)
• GHG emissions reported in grams per mile or per MMBtu of H2
• Water use reported in cm3 (or equivalently, grams) either per mile or MMBtu of H2.
Modeling Assumptions
26
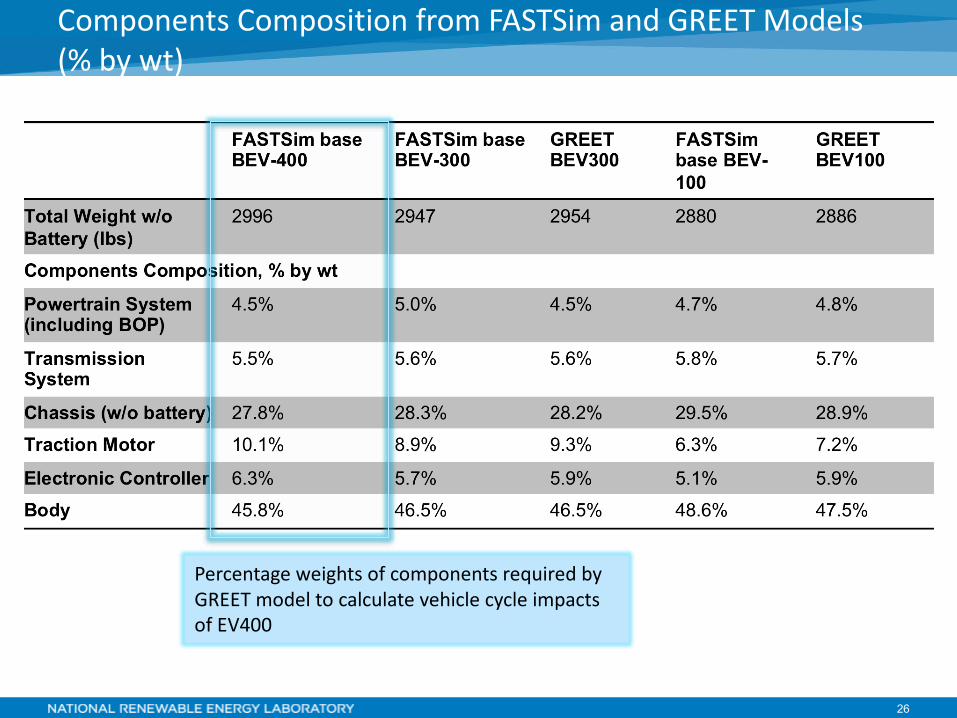
ComponentsCompositionfromFASTSim andGREETModels(%bywt)
PercentageweightsofcomponentsrequiredbyGREETmodeltocalculatevehiclecycleimpactsofEV400
27
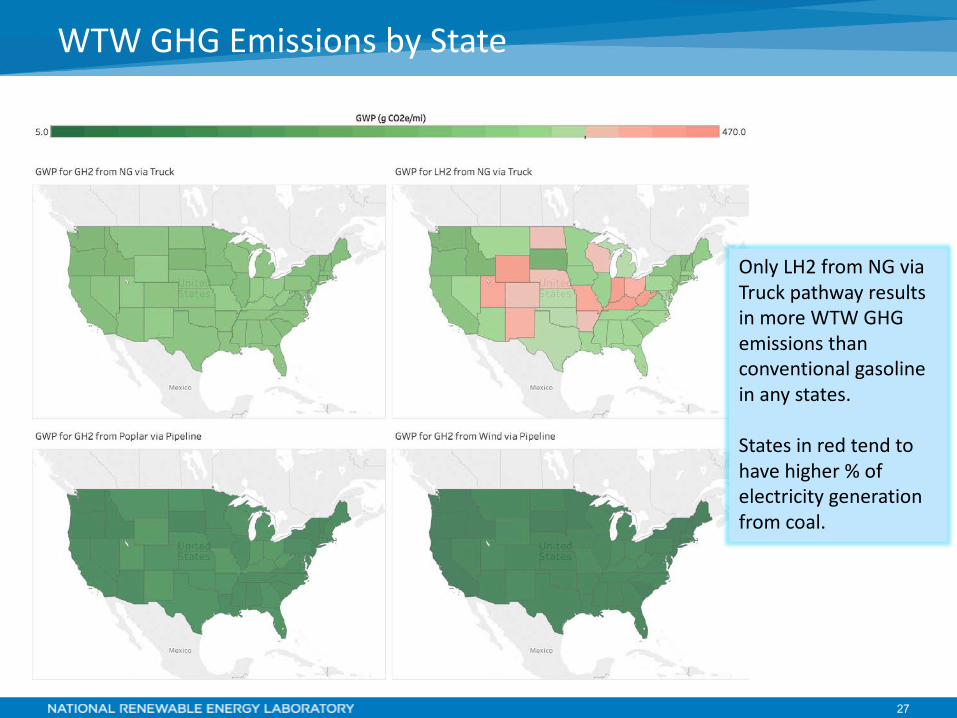
WTWGHGEmissionsbyState
OnlyLH2fromNGviaTruckpathwayresultsinmoreWTWGHGemissionsthanconventionalgasolineinanystates.
Statesinredtendtohavehigher%ofelectricitygenerationfromcoal.
28
• ADOPT: Automotive Deployment Options Projection Tool• BETO: Bioenergy Technologies Office• (B)EV: (Battery) Electric Vehicle• COBRA: Co-Benefits Risk Assessment Screening Model• FASTSim: Future Automotive Systems Technology Simulator• FCEV: Fuel Cell Electric Vehicle• FCTO: Fuel Cells Technologies Office• GH2: Gaseous Hydrogen• GHG: Greenhouse gas• GREET: Greenhouse Gases, Regulated Emissions, and Energy Use in
Transportation model• H2A: Hydrogen Analysis• H2FAST: Hydrogen Financial Analysis Scenario Tool• ICEV: Internal Combustion Engine Vehicle• LH2: Liquid Hydrogen• NG: Natural Gas• SERA: Scenario Evaluation and Regionalization Analysis models• WTP: Well-to-Pump• WTW: Well-to-Wheels
Acronymns
29
[1] Dobranskyte-Niskota, A., A. Perujo, and M. Pregl (2007). Indicators to Assess Sustainability of Transport Activities, EUR 23041 EN, European Commission, Joint Research Centre, Institute for Environment and Sustainability, available online: http://publications.jrc.ec.europa.eu/repository/bitstream/111111111/10416/1/indicators%20report_green%20template.pdf
[2] Wang, J. J., Jing, Y. Y., Zhang, C. F., & Zhao, J. H. (2009). “Review on multi-criteria decision analysis aid in sustainable energy decision-making.” Renewable and Sustainable Energy Reviews, 13(9), 2263-2278.
[3] Mitropoulos, L., & Prevedouros, P. (2014). “Multicriterion Sustainability Assessment in Transportation: Private Cars, Carsharing, and Transit Buses.” Transportation Research Record: Journal of the Transportation Research Board, (2403), 52-61.
[4] Vaidyanathan, S. and Langer, T. (2011). “Rating the Environmental Impacts of Motor Vehicles: ACEES’d Green Book Methodology, 2011 Edition.” American Council for an Energy-Efficient Economy. Available from http://aceee.org/research-report/t111
References (for Indicators on Slide 9)