surya nepal private limited - itc portal
TRANSCRIPT

286
SURYA NEPAL PRIVATE LIMITED
DIRECTORS REPORT
Your Directors are pleased to submit their Report and the Audited Accounts of your Company for the year ended 32nd Asadh, 2075 (16th July, 2018).
SOCIO ECONOMIC AND REGULATORY ENVIRONMENT
The year witnessed Nepal’s transition to federalism with the successful formation of governments at the federal, provincial and local level. Such an empowered structure of governance is expected to lend political stability and augurs well for the development of the country. Reforms and policies that enhance the ease of doing business and attract both domestic and foreign investment will be critical to bolstering economic growth going forward.
Towards this, the new federal government and the sub-national governments have promised to promote the country as an attractive investment location. The new Government continues to focus on policies & programs towards attaining the stability, development and prosperity in line with its motto of creating “Prosperous Nepal, Happy Nepalis.” The Government has set an ambitious real GDP growth target of 8% per annum along with a target to double per capita income in five years and to transform Nepal to the status of a middle-income country by 2030.
The economy of Nepal grew at a healthy pace during the year under review. Real GDP growth for the year under review is estimated at 5.9% against an average growth of 4.3% during the last decade (2065-2075). The annual average inflation during the year was contained at 4.2% (4.5% in the previous year). However, increasing fuel prices, higher taxes and increased cost of imports due to the recent strengthening of the US Dollar are expected to exert inflationary pressures going forward.
On the external front, merchandise imports increased sharply during the year to 41.3% of GDP as against 37.5% of GDP in the previous year on the back of increase in imports of petroleum products, vehicles and spare parts etc. While workers’ remittances grew faster at 8.6% during the year against 4.6% in the previous year, the same declined to 25.1% of GDP compared to 26.3% in the previous year. Consequently, the Current Account Deficit increased significantly to 8.2% of GDP versus 0.4% in the previous fiscal. The successful implementation of recent measures announced by the Government to increase Foreign Direct Investment (FDI) flows into the country and promote industries contributing to exports and import substitution is expected to go a long way in containing the rising pressures on the external account and ensuring the macroeconomic stability of the country.
During the year, the governments at all levels initiated the process of formulating new laws as per the Constitution. Various regulations such as the Consumer Protection Act, Industrial Enterprises Rules and Contribution based Social Security Rules etc. are in the process of being notified. The National Intellectual Property Policy, 2017 was also announced towards ensuring protection and promotion of intellectual property rights in the country. Revamping the current law on intellectual property rights in line with the new Policy as aforementioned will be critical in realising the government’s stated objectives. Further reforms towards promotion and protection of investments in the country would be crucial to spur private investments, both domestic and foreign.
Unlike most countries where tobacco and cigarettes are synonymous, the larger share of tobacco consumption in Nepal is in the form of Smokeless Tobacco (SLT) products like khaini, gutka, snuff and betel-quid with tobacco (“Paan”). Despite its low share in total tobacco consumption, the legal cigarette industry occupies an important place in Nepal’s economy. The legal cigarette industry:
• provides direct/indirect employment to an estimated 1 lakh people and supports the livelihoods of more than 4 lakh farmers, farm workers, retailers and others engaged in cultivation and trade of tobacco products.
• contributes around 10% of the total excise duty collection of the Government and around 83% of the excise duty collection from the tobacco sector.
• is amongst only a handful of industries in which Nepal has sufficient domestic manufacturing capacity and contributes significantly towards building country’s manufacturing competitiveness and industrial productivity.
• is one of the major contributors to the manufacturing sector GDP of the country.
However, a skewed focus on cigarettes has resulted in a punitive and discriminatory taxation policy. The Health Risk Tax, introduced with effect from mid-Jestha, 2075, is a case in point. It is pertinent to note that the Health Risk Tax on cigarettes is 14 times higher as compared to smokeless tobacco products (on a per Kg of tobacco basis). The introduction of Health Risk Tax, coupled with increase in excise duty announced in the Budget for 2075-76, has resulted in an unprecedented increase in tax incidence on cigarettes of upto 87%. The tax burden on cigarettes has been exacerbated by the increase in customs duty announced during the
year on import of certain raw materials for the tobacco industry. This has further increased the operating pressure on the legal cigarette industry.
The consumption of cigarettes is highly price elastic. With a large number of cigarette consumers also consuming relatively lower priced Smokeless Tobacco Products like Khaini, Gutkha etc., the steep increase in tax incidence on cigarettes as aforementioned will encourage the shift to cheaper/ revenue inefficient and largely tax evaded tobacco products. The risk of such shift in consumption has also been identified in the WHO Study on Economics of Tobacco in Nepal. The report states that “With increased pricing on Cigarettes, people may switch to smokeless tobacco products. In order to prevent this switching……………. it is necessary to increase taxes on these products.”
An analysis of the WHO Report on Global Tobacco Epidemic, 2017 reveals that cigarette taxes in Nepal are amongst the highest in world (as a % of per capita GDP required to purchase 2000 cigarettes of most popular brand). Excessively high rates of taxes levied in cigarettes create a lucrative arbitrage for counterfeiters and smugglers. The Interpol, in its Trafficking and Counterfeiting Casebook, states that “It would be hard to find a more ideal candidate for counterfeiting and illicit trade than cigarettes. The product is small, lightweight and profitable for illicit trade because the sale price is many times the cost of manufacture, mostly due to high levels of local tax in most countries”. It may be noted that illegal trade taken as a whole ranks as the fourth biggest tobacco ‘company’ in the world.
Steep increase in duties on cigarettes, which are already subject to punitive and discriminatory taxation; will not only severely impact the legal cigarette industry and provide fillip to the illicit trade but also sub-optimise the revenue potential of the tobacco sector. The most effective ways to check the menace of illicit trade of cigarettes while pursuing health and revenue objectives are non-discriminatory & equitable taxation across tobacco products and moderation in cigarette taxation.
In addition to the punitive and discriminatory taxation regime, the legal cigarette industry is also subject to a harsh regulatory framework in Nepal. The provisions of the Tobacco Products Control and Regulation Act (TOPCA) require cigarette packages to carry Graphic Health Warnings (GHW) covering at least 75% of the total surface area of the packet. Unlike the global trend of regulatory requirement of printing the health warning on the principal display area (front and back of the package), regulations in Nepal require printing of health warnings covering 75% of the entire surface area of the package.
In this context, it is pertinent to note that the global average size of pictorial warnings is only about 30% coverage of the principal display area. In fact, the three countries that account for about 51% of the world’s cigarette consumption, viz. USA, Japan and China have not adopted pictorial/graphical health warnings and have prescribed only text-based warnings on cigarette packages.
Despite this, the Ministry of Health issued two new Directives in Kartik’71 (November 2014) and Poush’71 (January 2015) which, inter alia, require manufacturers to print multiple pictorial warnings and warning messages on at least 90% of the total surface area of the cigarette packet- the largest in the world. The pictures and warning messages, provided in the proposed Directive are even more egregious, gruesome and exaggerated than the existing GHW and seem to be designed to shock, as opposed to factually inform, the consumer.
The existing 75% GHW already impedes the legal cigarette industry from providing comprehensive brand information on the cigarette packet, thereby preventing cigarette consumers from making fully informed choices across brands. It is apprehended that a further increase in size of GHW to 90% will have the following unintended consequences:
• commoditization of the product due to practically no space being available on the cigarette packet for providing brand information. As a result of this, price will become the most significant determinant for consumer choice.
• further fillip to growth of smuggled international brands that do not carry statutory GHW as well as spawning of manufacture of counterfeit look-alike products of dubious quality. These duty evaded cigarettes can be offered to consumers at prices far lower to duty paid cigarettes. The growth of illicit cigarettes will also depress the demand for domestic tobacco thereby adversely impacting the earnings of Nepali tobacco farmers and farm workers as well as lakhs of people who are dependent directly/indirectly on the legal cigarette industry for their livelihood.
• substantially lower tax revenue to the exchequer.
It has been experienced internationally that extreme regulations do not reduce demand for tobacco, but merely shift it from the legal to illegal tobacco products of suspect quality, thereby undermining public health objectives.
As stated in previous years, your Company, along with other stakeholders like farmers, retailers etc. has made recommendations to the Ministry

287
SURYA NEPAL PRIVATE LIMITED
of Health to keep the implementation of the new Directives on 90% GHW in abeyance. Your Company, during the year under review, filed a comprehensive writ in the Supreme Court of Nepal challenging the constitutionality of the new Directive requiring to print 90% GHW. Concurrently, in line with the direction from the Ministry of Industry – the implementing agency under TOPCA, your Company continues to print 75% GHW on cigarette packages manufactured by it.
To actualize the full revenue potential of tobacco, the need of the hour is to have a balanced, pragmatic, evidence based and non-discriminatory regulatory and taxation framework that addresses the agenda of all stakeholders including farmers, retailers, manufacturers and the government. Towards this, your Company continues to remain engaged with policy makers/regulators.
COMPANY PERFORMANCE
Your Company posted Gross Revenue from sale of products of NRs. 3,337 (` 2,086) crore for the year ended 32nd Asadh, 2075 against NRs. 2,971 (` 1,857) crore during the previous year. Profit before taxation increased to NRs. 1,353 (` 846) crore from NRs. 1,130 (` 706) crore during the previous year. Profit for the year (after Tax expense and allocation towards Corporate Social Responsibility) stood at NRs. 918 (` 574) crore against NRs. 783 (` 489) crore in previous year. Total Comprehensive Income for the year stood at NRs. 915 (` 572) crore against NRs. 784 (` 490) crore in the previous year. Earnings per share for the year stood at NRs. 455 (` 284) [Previous year NRs. 357 (` 223)]. Net cash flows from operations aggregated NRs. 866 (` 541) crore compared to NRs. 743 (` 464) crore in the previous year.
CONTRIBUTION TO THE EXCHEQUER
Your Company continues to be one of the largest contributors to the Exchequer, accounting for about 3% of the total revenues of the Government. For the year under review, your Company contributed NRs. 1,929 (` 1,206) crore by way of Excise Duty, Excise Sticker charges, VAT, Customs Duty, Dividend Distribution Tax, Income Tax and Contribution to National Level Welfare Fund [Previous Year: NRs. 1,661 (` 1,038) crore]. Your Company’s Excise Duty contribution to the exchequer constitutes about 10% of the Government’s total Excise revenue while its VAT & Income Tax contribution constitute nearly 2% of the Government’s total VAT & Income Tax revenue.
DIVIDEND
The Board of Directors declared an Interim Dividend of NRs. 75 (` 47) per Ordinary Share for the year ended 32nd Asadh, 2075. The total outflow on this account will amount to NRs. 151 (` 94) crore. Your Board has also recommended a Final Dividend of NRs. 378 (` 236) per Ordinary Share, which if approved, will take the total Dividend for the year to NRs. 453 (` 283) per Ordinary Share.
All dividends have been paid within the prescribed period and there are no unclaimed dividends lying with your Company.
FAST MOVING CONSUMER GOODS (FMCG) BUSINESSES
• CIGARETTES
During the year, your Company reinforced its market standing leveraging a strong portfolio of offerings, superior product quality and, a deep and wide distribution network. The Business launched several differentiated and innovative offerings during the year including Surya 24 Carat Arctic Burst and Shikhar Ice Rush which have received positive response. The relentless focus on developing world-class products anchored on innovation and benchmarked international quality standards is a key source of sustainable competitive advantage for your Company. The Product & Packaging Development Agreement entered into by your Company with ITC Limited (ITC) has been instrumental towards gaining such distinct competitive advantage. Considering the continuous need of services in the area of product and packaging development and expertise of ITC in this domain, the said Agreement has been extended for a further period of five years.
The manufacturing systems of your Company continued to set benchmarks in Sustainability, Responsiveness, Quality and Productivity in its pursuit of achieving operating excellence. The Business also continued to strengthen its quality processes and hygiene standards and introduced new metrics for monitoring such areas.
Your Company continues to invest in contemporary technologies with a view to providing products of international quality to consumers. Towards this end, it is deeply satisfying to report that during the year, your Company developed capabilities of manufacturing capsule cigarettes and cigarette packets with print registered inner frame.
Leaf Tobacco
Your Company continued to partner with tobacco farmers in Nepal to enable higher productivity and quality enhancement at the farm level through the induction of best practices for sustainable agriculture. The adoption of these and other inputs provided by your Company
has led to a consistent improvement in quality of domestic grades of tobacco, thereby improving usage and marketability of the crop, and enhancing returns for the farmer.
• OTHER FMCG PRODUCTS
AGARBATTI
During the year, your Company sustained the growth momentum in the Agarbatti category, and continued to strengthen its market standing driven by a robust portfolio of offerings catering to all consumer segments. The Business focused on growing consumer franchise by ensuring superior availability and visibility of its products in trade channels, backed by brand investments and consumer activation programs. The supply chain was successfully scaled up to cater to the increased demand while ensuring continuous improvements in product quality.
In keeping with its commitment to augmenting societal capital, your Company continues to strengthen its relationships with Small and Medium Enterprises, which provide employment opportunities to economically deprived sections of society.
SAFETY MATCHES
During the year, your Company enhanced its market standing and leadership position in the Safety Matches industry in both wax and wooden segments. The Business continued to focus on increased availability across markets leveraging the strong Trade Marketing and Distribution capabilities of your Company, along with cost optimization initiatives. The supply chain, continues to deliver superior quality.
APPAREL
Your Company’s offering, John Players, is a leading brand in the premium segment of the branded menswear segment and has presence across markets through Exclusive Branded Outlets, Departmental Chains and Multi-Brand Outlets. The apparel business offers a diverse range of products spanning Formal Wear, Casual Wear and Denims that cater to the quality conscious and discerning consumer.
However, the performance of the Business continues to be constrained by the significant increase in cheap imports which are largely tax evaded. Against this backdrop, your Company is restructuring the Business by rationalizing the supply chain and distribution presence.
BRANDED PACKAGED FOOD PRODUCTS
During the year, your Company successfully launched a portfolio of products in the Confectionery space, with offerings in the Hard Boiled Candy, Éclairs, Jelly and Toffee segments under the ‘Toffichoo’ and ‘mint-o’ trademarks, across major geographies of the country. Based on the positive response from consumers, the Business has initiated work towards setting up a state-of-the-art confectionery manufacturing facility at Biratnagar. Upon its commissioning, the facility will create employment opportunities and facilitate the development of small and medium enterprises through local sourcing of raw materials.
ENVIRONMENT HEALTH AND SAFETY
Your Company adopted various initiatives to remain a benchmark manufacturing facility in the country and continued to reinforce high standards of environment, occupational health and safety through institutionalization of best practices. During the year, Simara Factory was ranked No.1 in the national competition for “Environment Friendly Industry Award” organized by Ministry of Forest and Environment. The unit was further acknowledged and felicitated by Birgunj Chamber of Commerce & Industries for winning the national level award.
TAX MATTERS
As reported in earlier years, during the financial year 2009-10 the Full Bench of the Hon’ble Supreme Court passed an Order dated 29th October, 2009 in favour of your Company in respect of certain Excise and Income Tax litigation related to tax demands on the basis of alleged theoretical production.
The Inland Revenue Department, citing the judgments passed in favour of your Company by the Hon’ble Supreme Court, on 11th February, 2011 and 12th August, 2013 decided the following administrative review petitions in favour of your Company:
• Dropping VAT demand – NRs. 19.01 (` 11.88) crore for the financial years 2058-59 (2001-02) and 2064-65 (2007-08).
• Dropping Income Tax demand – NRs. 4.91 (` 3.07) crore for the financial year 2062-63 (2005-06).
All other pending Show Cause Notices (SCNs) and demands related to Excise, Income tax and VAT received from time to time on the issue of theoretical production are based on similar untenable contention by the Revenue authorities that your Company could have produced more

288
SURYA NEPAL PRIVATE LIMITED
cigarettes than it has actually produced in a given year, based on an input-output ratio allegedly submitted by your Company in the year 2047-48 (1990-91) and that your Company is liable to pay taxes on such theoretically produced cigarettes. The allegations made by the Department are despite the fact that your Company’s cigarette factory has always been under ‘physical control’ procedures of the Revenue authorities and all the cigarettes that are produced are duly accounted for and certified by the said authorities. No fresh demand has been received during the year on this account and the cumulative pending demand on your Company on account of theoretical production stands at NRs. 68.97 (` 43.11) crore, as detailed below, and are under appeal before the Hon’ble Supreme Court.
• Demand of Excise Duty – NRs. 27.80 (` 17.38) crore.
• Demand of VAT – NRs. 17.49 (` 10.93) crore.
• Demand of Income Tax – NRs. 23.68 (` 14.80) crore.
Your Company is advised by eminent counsel that the allegations made by the Department have no legal or factual basis and that the Demand Notices served on your Company are not sustainable, particularly in the light of the favorable Order dated 29th October, 2009 of the Hon’ble Supreme Court. The subsequent decisions of the Hon’ble Supreme Court and the Inland Revenue Department have further reinforced this position. Accordingly, your Company does not recognise any liability in this behalf.
RISK MANAGEMENT
Your Company continues to follow a systems-based approach to risk management. The Corporate Governance Policy of your Company lays down the structure, roles and responsibilities of the key entities in the governance process and also mandates periodic review of key areas of operations. The Corporate Governance Policy is backed by a robust internal control system consisting of the following key elements:
• Organizational Policies for key areas of operations e.g. financial policies and procedures, IT Policy etc.
• Comprehensive standard operating procedures (SOPs) across areas of operations which ensure appropriate segregation of duties, tiered approval mechanisms and maintenance of supporting records.
• Maintenance of Books of Accounts through use of Organisation wide ERP (SAP) with appropriate transactional controls built in.
• An independent, periodic risk based internal audit across functions and businesses.
Your Company continues to focus on regular reviews and continuous improvement of the policies and processes across the areas of operations so as to ensure that various risks associated with your Company’s Business and operations are adequately addressed and appropriate risk mitigation plans are put in place.
CORPORATE SOCIAL RESPONSIBILITY (CSR) INITIATIVES
Your Company, as a responsible corporate citizen, places immense emphasis on contributing towards building the societal, environmental and economic capital of the nation. Towards this end, your Company pursues an integrated CSR strategy spanning areas such as environmental preservation, social empowerment, promoting and improving education in public schools.
As a part of the ongoing interventions in this area, your Company continues to:
• provide assistance to farmers in agro-forestry, agri-infrastructure and vermicomposting in villages situated in the economic vicinity of its operating locations.
• provide training and development to farmers towards improvement in productivity and other income generating activities.
• support the animal husbandry sector by providing extension services covering animal breeding, health and nutrition in order to drive yield improvement and higher returns for underprivileged farmers.
During the year under review, your Company also entered into an agreement with “Teach for Nepal (TFN)”, an NGO for providing quality teachers in public schools through the TFN Teaching Fellowship program. More than 2000 students in rural part of Parsa District will benefit from this initiative.
Such initiatives, being consistent with the CSR guidelines enunciated by Nepal Rastra Bank for banks and financial institutions, will continue to be pursued, in the absence of any prescribed guidelines notified by the Government.
In accordance with the provisions of the Industrial Enterprises Act, 2073, your Company has allocated 1% of its annual profit towards discharging CSR activities. The allocated funds will be spent on the basis of annual plan and programs as mandated by law.
EMPLOYMENT GENERATION
Your Company is one of the largest employers in the private sector and plays a very significant role in providing livelihoods, directly and indirectly, to around 4 lakh people involved in this sector comprising farmers, farm workers and others involved in manufacturing, distribution and sales. Further, your Company’s Agarbatti and Matches businesses provide employment opportunities to economically disadvantaged sections of society, especially women. Your Company’s strategy of diversifying its business portfolio also complements its role of a responsible corporate citizen by creating enablers for generating employment opportunities as well as sustainable economic surplus for the nation.
EMPLOYEES
Employee relations continued to be cordial and the terms and conditions of employment offered by your Company remains one of the best in the country. Post the year under review, Long Term Agreements were concluded successfully with the unionized workforce at both Simara and Seratar factories.
Your Directors place on record their sincere appreciation of the contribution made by the employees during the year under review.
DIRECTORS
The Holding Company, ITC Limited, nominated Mr. R K Singhi (in place of Mr. B B Chatterjee) and Mr. Supratim Dutta (in place of Mr. A K Mukerji) as Company’s Non–executive directors with effect from 4th February, 2018 and 18th July, 2018 respectively, consequent to their retirement from the services of that company.
Your Directors would like to place on record their sincere appreciation for the services rendered by Mr. B B Chatterjee and Mr. A K Mukerji as Directors of the Company.
There was no other change in the composition of the Board of Directors.
The details of shares held in your Company by your Directors as on 32nd Asadh, 2075 are annexed to this Report (Annexure I). Your Directors have confirmed that none of them or their close relatives has any direct involvement or any personal interest in any transaction of sale or purchase or any kind of contract or arrangement connected with the business of your Company. No amounts are due to your Company from any of the Directors, the Managing Director or their close relatives.
The details of payments made during the year to your Directors, the Managing Director and other officials are also annexed to this Report (Annexure II).
Further, details of Management expenses for the year 2074-75 are annexed to this Report (Annexure III).
AUDITORS
M/s. N Amatya & Company, Chartered Accountants, Kathmandu, Nepal and M/s. T R Upadhya & Co, Chartered Accountants, Kathmandu, Nepal, auditors of your Company, retire at the ensuing Annual General Meeting and being eligible, offer themselves for re-appointment.
FUTURE OUTLOOK
Your Company continues to explore and pursue opportunities for profitable and sustainable growth and looks forward to the future with optimism and confidence and stands committed to creating a brighter future for all stakeholders.
On behalf of the Board
Date: 24th September, 2018 Sanjiv Puri B Sumant A K Poddar(8th Ashwin, 2075) Chairman Director Managing Director
Annexure I
Sl. No. Name of Director Number of Ordinary Shares of NRs. 100 (` 62.50) each held singly and / or jointly as on 32nd Asadh 2075
(16th July 2018)
1. S Puri Nil
2. A K Mukerji (ceased w.e.f. 18th July, 2018)
Nil
3. R K Singhi Nil
4. B Sumant Nil
5. S R Pandey 67,212
6. S SJB Rana 600
7. A K Poddar Nil

289
SURYA NEPAL PRIVATE LIMITED
Annexure II
THE AMOUNT OF REMUNERATION, ALLOWANCE AND FACILITIES PAID TO DIRECTOR, MANAGING DIRECTOR, CHIEF EXECUTIVE AND COMPANY OFFICIALS
During the financial year 2074/75, the following amounts have been paid to the Directors:
• Board Meeting Fee - NRs. 70,588 (` 44,118)
• Incidental expenses - NRs. 11,765 (` 7,353)
Payment to / on behalf of the Managing Director for the financial year 2074/75:
• Salary – NRs. 14,901,286 (` 9,313,304)
• Allowances – NRs. 3,821,735 (` 2,388,584)
In addition to the above, the Managing Director has been provided the following as per his terms of appointment:
• Furnished accommodation with necessary security at residence.
• Entrance fees and annual subscription charges for two clubs.
• Personal accident insurance.
• Company car with driver and telephone at residence.
• Fuel for generator and reimbursement of water tanker charges for residence.
Payment to / on behalf of Company officials for the financial year 2074/75:
• Salary – NRs. 25,909,329 (` 16,193,331)
• Allowances – NRs. 10,950,260 (` 6,843,913)
In addition to the above, some of the Company officials, as applicable, have been provided the following as per their terms of appointment:
• Furnished accommodation with necessary security at residence.
• Entrance fees and annual subscription charges for clubs as applicable.
• Personal accident insurance.
• Company car with driver and telephone at residence.
• Fuel for generator and reimbursement of water tanker charges for residence.
The Managing Director and some other employees of the company have been granted stock options under the Employee Stock Option Scheme of the Holding Company (ITC Limited). Such options are granted at ‘market price’ [within the meaning of Securities and Exchange Board of India (Share Based Employee Benefit) Regulations, 2014]. Since such options are not tradeable, no benefit is conferred upon the employee at the time of grant of options. The Company, however, has recorded employee benefits expense by way of share based payments to employees, in accordance with NFRS 2 out of which NRs. 23,177,936 (` 14,486,210) is attributable to Managing Director and NRs. 22,690,055 (` 14,181,284) is attributable to other officials.
Annexure III
MANAGEMENT EXPENSES
The expenses incurred by your Company for its management and administration for the financial year 2074/75 comprising rent, electricity, fuel & water, rates & taxes, insurance premium, repairs & improvements, safety & pollution control cost, maintenance, travel & conveyance, postage, telephone, fax, bank charges, legal fees, printing & stationery, consultancy charges, professional service charges & other fees, information technology services, business entertainment expenses, board meeting fees, donations, books & periodicals and miscellaneous expenses amounted to NRs. 1,311,918,326 (` 819,948,954).

290
SURYA NEPAL PRIVATE LIMITED
Report on the Financial Statements
We have audited the accompanying financial statements of Surya Nepal Private Limited, which comprise the Statement of Financial Position as at 32nd Asadh 2075 (16th July 2018), the Statement of Profit or Loss and Other Comprehensive Income, Statement of Changes in Equity and Statement of Cash Flows for the year then ended, and a summary of significant accounting policies and other explanatory information.
Management’s responsibility for the financial statements
Management is responsible for the preparation and fair presentation of these financial statements in accordance with Nepal Financial Reporting Standards, and for such internal control as management determines is necessary to enable the preparation of financial statements that are free from material misstatement, whether due to fraud or error.
Auditors’ responsibility
Our responsibility is to express an opinion on these financial statements based on our audit. We conducted our audit in accordance with Nepal Standards on Auditing. Those standards require that we comply with ethical requirements and plan and perform the audit to obtain reasonable assurance about whether the financial statements are free from material misstatement. An audit involves performing procedures to obtain audit evidence about the amounts and disclosures in the financial statements. The procedures selected depend on our judgement, including the assessment of the risks of material misstatement of the financial statements, whether due to fraud or error. In making those risk assessments, we consider internal control relevant to the entity’s preparation and fair presentation of the financial statements in order to design audit procedures that are appropriate in the circumstances, but not for the purpose of expressing an opinion on the effectiveness of the entity’s internal control. An audit also includes evaluating the appropriateness of accounting policies used and the reasonableness of accounting estimates made by management, as well
as evaluating the overall presentation of the financial statements.
We believe that the audit evidence we have obtained is sufficient and appropriate to provide a basis for our audit opinion.
Opinion
In our opinion, the financial statements give a true and fair view of the financial position of Surya Nepal Private Limited as at 32nd Asadh 2075 (16th July 2018), and of its financial performance and its cash flows for the year then ended in accordance with Nepal Financial Reporting Standards.
Report on the Requirements of the Company Act, 2063
We have obtained information and explanations asked for, which, to the best of our knowledge and belief, were necessary for the purpose of our audit. In our opinion, the statement of financial position, the statement of profit or loss and other comprehensive income, statement of changes in equity and the statement of cash flows have been prepared in accordance with the requirements of the Company Act, 2063 and are in agreement with the books of account of the Company and proper books of account as required by law have been kept by the Company.
To the best of our information and according to explanations given to us and from our examination of the books of account of the Company necessary for the purpose of our audit, we have not come across cases where Board of Directors or any employees of the Company have acted contrary to the provisions of law relating to the accounts or committed any misappropriation or caused loss or damage to the Company, relating to the accounts, in the Company.
Nem Lal Amatya Shashi Satyal Partner Partner
Date: 8th Ashwin, 2075 (24th September, 2018) N. Amatya & Co. T R Upadhya & Co. Place: Kolkata Chartered Accountants Chartered Accountants
AUDITOR’S REPORT TO THE SHAREHOLDERS OF SURYA NEPAL PRIVATE LIMITED
291
SURYA NEPAL PRIVATE LIMITED
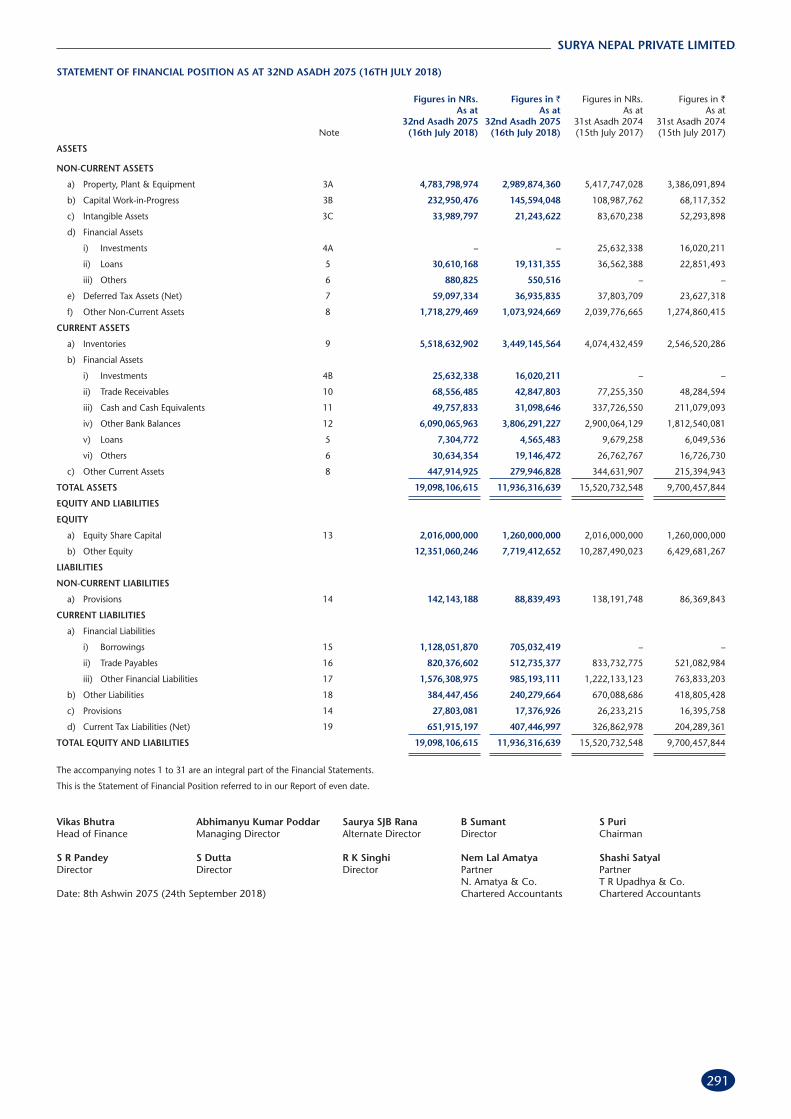
STATEMENT OF FINANCIAL POSITION AS AT 32ND ASADH 2075 (16TH JULY 2018)
Figures in NRs. Figures in ` Figures in NRs. Figures in ` As at As at As at As at 32nd Asadh 2075 32nd Asadh 2075 31st Asadh 2074 31st Asadh 2074 Note (16th July 2018) (16th July 2018) (15th July 2017) (15th July 2017)
ASSETS
NON-CURRENT ASSETS
a) Property, Plant & Equipment 3A 4,783,798,974 2,989,874,360 5,417,747,028 3,386,091,894
b) Capital Work-in-Progress 3B 232,950,476 145,594,048 108,987,762 68,117,352
c) Intangible Assets 3C 33,989,797 21,243,622 83,670,238 52,293,898
d) Financial Assets
i) Investments 4A – – 25,632,338 16,020,211
ii) Loans 5 30,610,168 19,131,355 36,562,388 22,851,493
iii) Others 6 880,825 550,516 – –
e) Deferred Tax Assets (Net) 7 59,097,334 36,935,835 37,803,709 23,627,318
f) Other Non-Current Assets 8 1,718,279,469 1,073,924,669 2,039,776,665 1,274,860,415
CURRENT ASSETS
a) Inventories 9 5,518,632,902 3,449,145,564 4,074,432,459 2,546,520,286
b) Financial Assets
i) Investments 4B 25,632,338 16,020,211 – –
ii) Trade Receivables 10 68,556,485 42,847,803 77,255,350 48,284,594
iii) Cash and Cash Equivalents 11 49,757,833 31,098,646 337,726,550 211,079,093
iv) Other Bank Balances 12 6,090,065,963 3,806,291,227 2,900,064,129 1,812,540,081
v) Loans 5 7,304,772 4,565,483 9,679,258 6,049,536
vi) Others 6 30,634,354 19,146,472 26,762,767 16,726,730
c) Other Current Assets 8 447,914,925 279,946,828 344,631,907 215,394,943
TOTAL ASSETS 19,098,106,615 11,936,316,639 15,520,732,548 9,700,457,844
EQUITY AND LIABILITIES
EQUITY
a) Equity Share Capital 13 2,016,000,000 1,260,000,000 2,016,000,000 1,260,000,000
b) Other Equity 12,351,060,246 7,719,412,652 10,287,490,023 6,429,681,267
LIABILITIES
NON-CURRENT LIABILITIES
a) Provisions 14 142,143,188 88,839,493 138,191,748 86,369,843
CURRENT LIABILITIES
a) Financial Liabilities
i) Borrowings 15 1,128,051,870 705,032,419 – –
ii) Trade Payables 16 820,376,602 512,735,377 833,732,775 521,082,984
iii) Other Financial Liabilities 17 1,576,308,975 985,193,111 1,222,133,123 763,833,203
b) Other Liabilities 18 384,447,456 240,279,664 670,088,686 418,805,428
c) Provisions 14 27,803,081 17,376,926 26,233,215 16,395,758
d) Current Tax Liabilities (Net) 19 651,915,197 407,446,997 326,862,978 204,289,361
TOTAL EQUITY AND LIABILITIES 19,098,106,615 11,936,316,639 15,520,732,548 9,700,457,844
The accompanying notes 1 to 31 are an integral part of the Financial Statements.
This is the Statement of Financial Position referred to in our Report of even date. Vikas Bhutra Abhimanyu Kumar Poddar Saurya SJB Rana B Sumant S Puri Head of Finance Managing Director Alternate Director Director Chairman S R Pandey S Dutta R K Singhi Nem Lal Amatya Shashi Satyal Director Director Director Partner Partner N. Amatya & Co. T R Upadhya & Co.Date: 8th Ashwin 2075 (24th September 2018) Chartered Accountants Chartered Accountants

292
SURYA NEPAL PRIVATE LIMITED
STATEMENT OF PROFIT OR LOSS AND OTHER COMPREHENSIVE INCOME FOR THE YEAR ENDED 32ND ASADH 2075 (16TH JULY 2018)
Figures in NRs. Figures in ` Figures in NRs. Figures in `
For the year ended For the year ended For the year ended For the year ended 32nd Asadh 2075 32nd Asadh 2075 31st Asadh 2074 31st Asadh 2074 Note (16th July 2018) (16th July 2018) (15th July 2017) (15th July 2017)
Gross Revenue from sale of products 20 33,369,581,646 20,855,988,529 29,714,590,472 18,571,619,045
Less: Duties 21 9,167,629,398 5,729,768,375 8,007,654,184 5,004,783,865
Net Revenue from sale of products 24,201,952,248 15,126,220,154 21,706,936,288 13,566,835,180
Other Operating Revenue 22 25,666,152 16,041,344 26,282,857 16,426,786
Net Revenue from operations 24,227,618,400 15,142,261,498 21,733,219,145 13,583,261,966
Raw Materials Consumed, etc. 23 5,910,419,573 3,694,012,233 5,648,091,265 3,530,057,040
Employee Benefits Expenses 24 2,089,130,077 1,305,706,299 1,797,740,936 1,123,588,085
Manufacturing, Admin, Selling Expenses etc. 25 2,316,627,948 1,447,892,471 2,263,025,738 1,414,391,087
Operating Profit 13,911,440,802 8,694,650,495 12,024,361,206 7,515,225,754
Other Income 26 385,332,472 240,832,796 131,512,053 82,195,034
Finance Cost 27 22,939,999 14,337,499 8,045,311 5,028,319
Depreciation and Amortization Expenses 742,297,943 463,936,215 851,642,098 532,276,312
Profit before Tax 13,531,535,332 8,457,209,577 11,296,185,850 7,060,116,157
Tax Expense 28 4,260,892,788 2,663,057,992 3,388,202,262 2,117,626,414
Corporate Social Responsibility 93,489,394 58,430,871 78,296,867 48,935,542
Profit for the year 9,177,153,150 5,735,720,714 7,829,686,721 4,893,554,201
Other Comprehensive Income
(i) Items that will not be reclassified to profit or loss:
– Remeasurements of defined benefit plans 29 (a) (39,061,325) (24,413,328) 19,690,861 12,306,789
(ii) Income tax relating to items that will not be
reclassified to profit or loss 28 11,718,398 7,323,999 (5,907,258) (3,692,036)
Other Comprehensive Income (27,342,927) (17,089,329) 13,783,603 8,614,753
Total Comprehensive Income for the year 9,149,810,223 5,718,631,385 7,843,470,324 4,902,168,954
The accompanying notes 1 to 31 are an integral part of the Financial Statements.
This is the Statement of Profit or Loss and Other Comprehensive Income referred to in our Report of even date.
Vikas Bhutra Abhimanyu Kumar Poddar Saurya SJB Rana B Sumant S Puri Head of Finance Managing Director Alternate Director Director Chairman S R Pandey S Dutta R K Singhi Nem Lal Amatya Shashi Satyal Director Director Director Partner Partner N. Amatya & Co. T R Upadhya & Co.Date: 8th Ashwin 2075 (24th September 2018) Chartered Accountants Chartered Accountants
293
SURYA NEPAL PRIVATE LIMITEDST
ATE
MEN
T O
F C
HA
NG
ES IN
EQ
UIT
Y F
OR
TH
E Y
EAR
EN
DED
32N
D A
SAD
H 2
075
(16T
H JU
LY 2
018
A. E
qui
ty S
har
e C
apit
al
Figu
res
in N
Rs.
Figu
res
in `
Bala
nce
at t
he b
egin
ning
of
the
rep
ortin
g ye
ar
Cha
nges
in e
qui
ty s
hare
ca
pita
l dur
ing
the
year
B
alan
ce a
t th
e en
d of
th
e re
por
ting
year
B
alan
ce a
t th
e be
ginn
ing
of t
he r
epor
ting
year
C
hang
es in
eq
uity
sha
re
cap
ital d
urin
g th
e ye
ar
Bal
ance
at
the
end
of
the
rep
ortin
g ye
ar
For
the
year
end
ed 3
1st
Asa
dh 2
074
(15t
h Ju
ly 2
017)
2,0
16,0
00,0
00
– 2
,016
,000
,000
1
,260
,000
,000
–
1,2
60,0
00,0
00
For
the
year
end
ed 3
2nd
Asa
dh 2
075
(16t
h Ju
ly 2
018)
2,0
16,0
00,0
00
– 2
,016
,000
,000
1
,260
,000
,000
–
1,2
60,0
00,0
00
B. O
ther
Equ
ity
Figu
res
in N
Rs.
Fig
ures
in `
Rese
rves
and
Sur
plus
Item
s of O
ther
Co
mpr
ehen
sive
Inco
me
Tota
l
Rese
rves
and
Sur
plus
Item
s of O
ther
Co
mpr
ehen
sive
Inco
me
Tota
l G
ener
al
Rese
rve
Sto
ck O
ptio
n Pa
ymen
t Re
serv
e
Em
ploy
ees’
Hou
s-in
g Re
serv
e Re
tain
ed E
arni
ngs
Rem
easu
rem
ent
of N
et D
efine
d Be
nefit
Pla
n
Gen
eral
Re
serv
e
Sto
ck O
ptio
n Pa
ymen
t Re
serv
e
Em
ploy
ees’
Hou
sing
Rese
rve
Reta
ined
Ear
ning
s
Rem
easu
re-
men
t of N
et
Defi
ned
Bene
fit
Plan
Ba
lanc
e as
at 3
1st A
sadh
207
3 (1
5th
July
201
6) 4
4,68
7,08
4 6
4,09
1,31
7 2,
377,
211,
775
6,0
61,9
18,8
29
(32,
117,
989)
8,5
15,7
91,0
16
27,
929,
428
40,
057,
073
1,4
85,7
57,3
59
3,7
88,6
99,2
68
(20,
073,
742)
5,3
22,3
69,3
86
Profi
t for
the
year
––
– 7
,829
,686
,721
–
7,8
29,6
86,7
21
––
– 4
,893
,554
,201
–
4,8
93,5
54,2
01
Oth
er C
ompr
ehen
sive
Inco
me
(net
of
tax)
––
––
13,
783,
603
13,
783,
603
––
––
8,6
14,7
53
8,6
14,7
53
Tota
l Com
preh
ensiv
e In
com
e fo
r th
e ye
ar–
––
7,8
29,6
86,7
21
13,
783,
603
7,8
43,4
70,3
24
––
– 4
,893
,554
,201
8
,614
,753
4
,902
,168
,954
Reim
burs
emen
t of v
alue
of s
hare
ba
sed
paym
ent
– (6
4,09
1,31
7)–
––
(64,
091,
317)
–(4
0,05
7,07
3)–
––
(40,
057,
073)
Tran
sferre
d to
Em
ploy
ees'
Hou
sing
Rese
rve
––
6,24
,098
,666
(624
,098
,666
)–
––
– 3
90,0
61,6
66
(390
,061
,666
)–
–
Inte
rim D
ivid
end
––
– (7
56,0
00,0
00)
– (7
56,0
00,0
00)
––
– (4
72,5
00,0
00)
– (4
72,5
00,0
00)
Fina
l Div
iden
d–
––
(5,2
51,6
80,0
00)
– (5
,251
,680
,000
)–
––
(3,2
82,3
00,0
00)
– (3
,282
,300
,000
)Tr
ansfe
rred
to R
eser
ve 6
4,09
1,31
7 –
– (6
4,09
1,31
7)–
– 4
0,05
7,07
3 –
– (4
0,05
7,07
3)–
–To
tal
64,
091,
317
( 64,
091,
317
)6,
24,0
98,6
66 1
,133
,816
,738
1
3,78
3,60
3 1
,771
,699
,007
4
0,05
7,07
3 (4
0,05
7,07
3)
390
,061
,666
7
08,6
35,4
62
8,6
14,7
53
1,1
07,3
11,8
81
Bala
nce
as a
t 31s
t Asa
dh 2
074
(15t
h Ju
ly 2
017)
108
,778
,401
–
3,00
1,31
0,44
1 7
,195
,735
,567
(1
8,33
4,38
6) 1
0,28
7,49
0,02
3 6
7,98
6,50
1 –
1,8
75,8
19,0
25
4,4
97,3
34,7
30
(11,
458,
989)
6,4
29,6
81,2
67
Profi
t for
the
year
––
– 9
,177
,153
,150
–
9,1
77,1
53,1
50
––
– 5
,735
,720
,714
–
5,7
35,7
20,7
14
Oth
er C
ompr
ehen
sive
Inco
me
(net
of
tax)
––
––
(27,
342,
927)
(27,
342,
927)
––
––
(17,
089,
329)
(17,
089,
329)
Tota
l Com
preh
ensiv
e In
com
e fo
r th
e ye
ar–
––
9,1
77,1
53,1
50
(27,
342,
927)
9,1
49,8
10,2
23
––
– 5
,735
,720
,714
(1
7,08
9,32
9) 5
,718
,631
,385
Inte
rim D
ivid
end
––
– (1
,219
,680
,000
)–
(1,2
19,6
80,0
00)
––
– (7
62,3
00,0
00)
- (7
62,3
00,0
00)
Fina
l Div
iden
d–
––
(5,8
66,5
60,0
00)
– (5
,866
,560
,000
)–
––
(3,6
66,6
00,0
00)
- (3
,666
,600
,000
)To
tal
––
– 2
,090
,913
,150
(2
7,34
2,92
7) 2
,063
,570
,223
–
– –
1,3
06,8
20,7
14
(17,
089,
329)
1,2
89,7
31,3
85
Bala
nce
as a
t 32n
d As
adh
2075
(1
6th
July
201
8) 1
08,7
78,4
01–
3,00
1,31
0,44
1 9
,286
,648
,717
(4
5,67
7,31
3) 1
2,35
1,06
0,24
6 6
7,98
6,50
1 –
1,8
75,8
19,0
25
5,8
04,1
55,4
44
(28,
548,
318)
7,7
19,4
12,6
52

294
SURYA NEPAL PRIVATE LIMITED
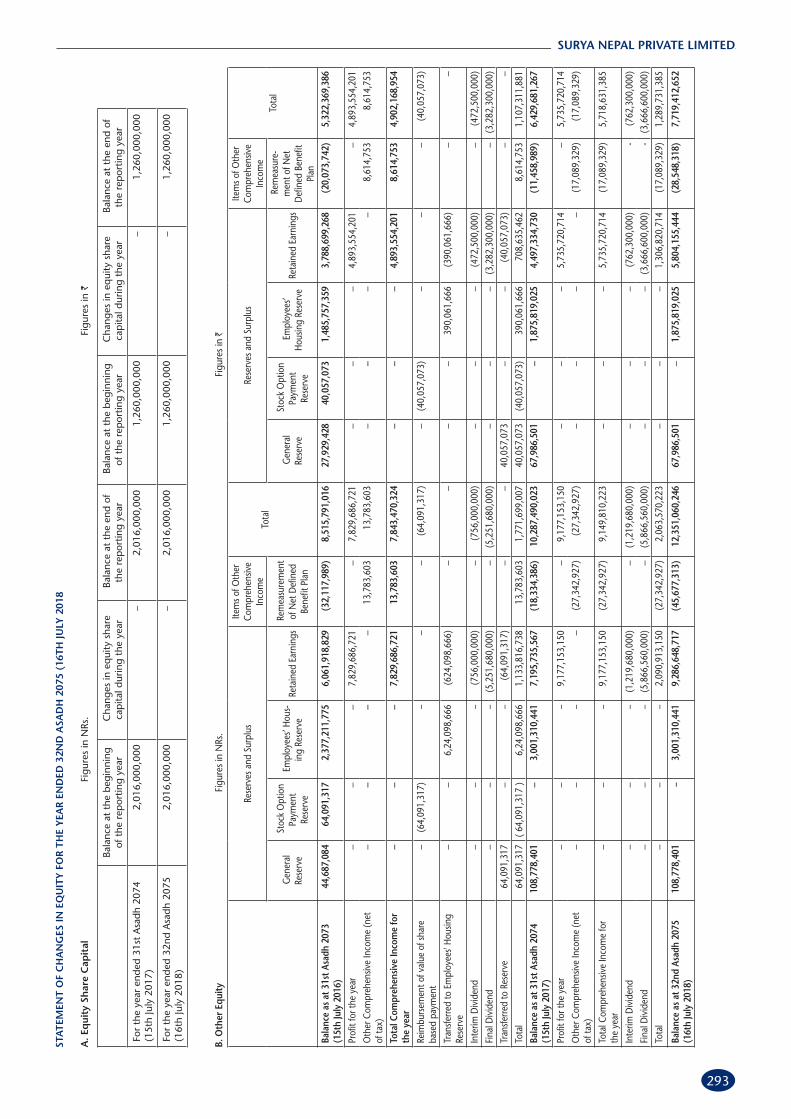
For t
he y
ear e
nded
32n
d As
adh
2075
(16t
h Ju
ly 2
018)
, the
Boa
rd o
f Dire
ctor
s of
the
Com
pany
at i
ts m
eetin
g he
ld o
n 8t
h As
hwin
207
5 (2
4th
Sept
embe
r 201
8) h
ave:
a) d
ecla
red
inte
rim d
ivid
end
of N
Rs. 7
5.00
(` 4
6.86
) per
sha
re, a
mou
ntin
g to
NRs
. 1,5
12,0
00,0
00 (`
945
,000
,000
) and
b) re
com
men
ded
final
div
iden
d of
NRs
. 378
.00
(` 2
36.2
5) p
er s
hare
am
ount
ing
to N
Rs. 7
,620
,480
,000
(` 4
,762
,800
,000
).
Gen
eral
Res
erve
: The
rese
rve
is an
out
com
e of
app
ropr
iatio
n fro
m o
ne c
ompo
nent
of e
quity
to a
noth
er, n
eith
er b
eing
an
item
of o
ther
com
preh
ensiv
e in
com
e. It
can
be
dist
ribut
ed /
util
ized
by
the
Com
pany
.
Stoc
k O
ptio
n Pa
ymen
t Re
serv
e: R
epre
sent
s fa
ir va
lue
of e
quity
set
tled
shar
e ba
sed
paym
ent
in r
espe
ct o
f em
ploy
ees
seco
nded
by
the
Hol
ding
Com
pany
(IT
C L
imite
d) a
t th
e re
ques
t of
the
Com
pany
, who
hav
e be
en g
rant
ed s
tock
opt
ion
by IT
C
Lim
ited
and
reim
burs
emen
t of w
hich
is s
ough
t by
ITC
Lim
ited.
Empl
oyee
s’ H
ousi
ng R
eser
ve: R
eser
ve re
pres
ents
the
amou
nts
set a
side
for p
rovi
ding
em
ploy
ees’
hou
sing
as p
er th
e pr
ovisi
ons
of th
e La
bour
Act
, 204
8, w
hich
has
sin
ce b
een
repl
aced
by
the
Labo
ur A
ct, 2
074.
Reta
ined
Ear
ning
s: T
his
rese
rve
repr
esen
ts th
e cu
mul
ativ
e pr
ofits
of t
he C
ompa
ny a
nd c
an b
e di
strib
uted
/ u
tiliz
ed b
y th
e C
ompa
ny.
The
acco
mpa
nyin
g no
tes
1 to
31
are
an in
tegr
al p
art o
f the
Fin
anci
al S
tate
men
ts.
This
is th
e St
atem
ent o
f Cha
nges
in E
quity
refe
rred
to in
our
Rep
ort o
f eve
n da
te.
Vik
as B
hut
ra
Ab
him
anyu
Kum
ar P
od
dar
Sa
urya
SJB
Ran
a B
Sum
ant
S Pu
ri
Hea
d of
Fin
ance
M
anag
ing
Dire
ctor
A
ltern
ate
Dire
ctor
D
irect
or
Cha
irman
S R
Pan
dey
S
Dut
ta
R K
Sin
gh
i N
em L
al A
mat
ya
Shas
hi S
atya
l D
irect
or
Dire
ctor
D
irect
or
Part
ner
Part
ner
N
. Am
atya
& C
o.
T R
Up
adhy
a &
Co.
Dat
e: 8
th A
shw
in 2
075
(24t
h Se
pte
mbe
r 20
18)
Cha
rter
ed A
ccou
ntan
ts
Cha
rter
ed A
ccou
ntan
ts
STA
TEM
ENT
OF
CH
AN
GES
IN E
QU
ITY
FO
R T
HE
YEA
R E
ND
ED 3
2ND
ASA
DH
207
5 (1
6TH
JULY
201
8 (C
on
td.)

295
SURYA NEPAL PRIVATE LIMITED
STATEMENT OF CASH FLOWS FOR THE YEAR ENDED 32ND ASADH 2075 (16TH JULY 2018)
Figures in NRs. Figures in ` Figures in NRs. Figures in `
For the year ended For the year ended For the year ended For the year ended 32nd Asadh 2075 32nd Asadh 2075 31st Asadh 2074 31st Asadh 2074 (16th July 2018) (16th July 2018) (15th July 2017) (15th July 2017)
A Cash Flow From Operating Activities Profit Before Tax 13,531,535,332 8,457,209,577 11,296,185,850 7,060,116,157
Adjustments for : Depreciation and amortization expenses 742,297,943 463,936,215 851,642,098 532,276,312
Finance Cost 22,939,999 14,337,499 8,045,311 5,028,319
Interest from Investments (1,470,625) (919,141) (1,470,625) (919,141)
Interest on Short Term/Call Deposits (379,436,878) (237,148,049) (125,249,219) (78,280,762)
Foreign currency translations and transactions - Net (1,178,423) (736,514) 96,969 60,606
Loss/(Gain) on sale of property, plant and equipment - Net (19,632,108) (12,270,068) 1,144,703 715,439
Liability no longer required written back (11,100,615) (6,937,884) – –
Doubtful and bad advances (11,010) (6,881) (9,416) (5,885)
Operating Profit Before Working Capital Changes 13,883,943,615 8,677,464,754 12,030,385,671 7,518,991,045
Adjustments for : Trade Receivables, Loans, Advances and Other Assets 257,978,538 161,236,586 (595,991,548) (372,494,718)
Inventories (1,444,200,443) (902,625,277) (574,585,128) (359,115,705)
Trade Payables, Other Liabilities and Provisions (82,943,094) (51,839,434) (18,549,147) (11,593,217)
Cash Generated From Operation 12,614,778,616 7,884,236,629 10,841,259,848 6,775,787,405
Income Tax Paid (3,945,415,796) (2,465,884,867) (3,406,809,515) (2,129,255,947)
Corporate Social Responsibility Paid (9,615,486) (6,009,679) (5,280,982) (3,300,614)
Net Cash From Operating Activities (A) 8,659,747,334 5,412,342,083 7,429,169,351 4,643,230,844
B Cash Flow From Investing Activities Purchase of property, plant and equipment (178,872,335) (111,795,209) (101,373,936) (63,358,710)
Disposal of property, plant and equipment 22,901,273 14,313,296 3,753,384 2,345,865
Investment in Bank Deposits
(Original Maturity more than 3 months) (6,090,000,000) (3,806,250,000) (2,900,000,000) (1,812,500,000)
Redemption/ Maturity of Bank Deposits
(Original Maturity more than 3 months) 2,900,000,000 1,812,500,000 – –
Interest Received 377,167,708 235,729,818 102,473,275 64,045,797
Net Cash Used in Investing Activities (B) (2,968,803,354) (1,855,502,095) (2,895,147,277) (1,809,467,048)
C Cash Flow From Financing Activities Interest Paid (21,252,465) (13,282,791) (8,045,311) (5,028,319)
Dividends Paid (7,086,240,000) (4,428,900,000) (6,007,680,000) (3,754,800,000)
Net Cash Used in Financing Activities (C) (7,107,492,465) (4,442,182,791) (6,015,725,311) (3,759,828,319)
Net Increase/(Decrease) in Cash & Cash Equivalents (A+B+C) (1,416,548,485) (885,342,803) (1,481,703,237) (926,064,523)
Opening Cash and Cash Equivalents 335,083,264 209,427,040 1,816,786,501 1,135,491,563
Closing Cash and Cash Equivalents (1,081,465,221) (675,915,763) 335,083,264 209,427,040
Notes: 1 The above Statement of Cash Flows has been prepared under the “Indirect Method” as set out in NAS - 7 “Statement of Cash Flows ”. 2 Cash and Cash Equivalents: Cash and Cash Equivalents as above (1,081,465,221) (675,915,763) 335,083,264 209,427,040
Unrealised gain/(Loss) on foreign currency cash and cash equivalents 3,171,184 1,981,990 2,643,286 1,652,053
Current Borrowings (Note 15) 1,128,051,870 705,032,419 – –
Cash and Cash Equivalents (Note 11) 49,757,833 31,098,646 337,726,550 211,079,093
The accompanying notes 1 to 31 are an integral part of the Financial Statements.
This is the Statement of Cash Flows referred to in our Report of even date.
Vikas Bhutra Abhimanyu Kumar Poddar Saurya SJB Rana B Sumant S Puri Head of Finance Managing Director Alternate Director Director Chairman
S R Pandey S Dutta R K Singhi Nem Lal Amatya Shashi Satyal Director Director Director Partner Partner N. Amatya & Co. T R Upadhya & Co.Date: 8th Ashwin 2075 (24th September 2018) Chartered Accountants Chartered Accountants

296
SURYA NEPAL PRIVATE LIMITED
NOTES TO THE FINANCIAL STATEMENTS
1. SIGNIFICANT ACCOUNTING POLICIES
Statement of Compliance
These financial statements have been prepared in accordance with requirements of Company Act, 2063 of Nepal and applicable Nepal Financial Reporting Standards (NFRS) and the relevant presentation requirements thereof. The Company adopted NFRS from 1st Shrawan, 2073 (16th July, 2016).
Basis of Preparation
These financial statements are prepared in accordance with the historical cost convention, except for certain items that are measured at fair values, as explained in the accounting policies.
Fair Value is the price that would be received to sell an asset or paid to transfer a liability in an orderly transaction between market participants at the measurement date, regardless of whether that price is directly observable or estimated using another valuation technique. In estimating the fair value of an asset or a liability, the Company takes into account the characteristics of the asset or liability if market participants would take those characteristics into account when pricing the asset or liability at the measurement date. Fair value for measurement and/or disclosure purposes in these financial statements is determined on such a basis, except for share-based payment transactions that are within the scope of NFRS 2 – Share Based Payment, leasing transactions that are within the scope of NAS 17 - Leases, and measurements that have some similarities to fair value but are not fair value, such as net realisable value in NAS 2 – Inventories or value in use in NAS 36 - Impairment of Assets.
The preparation of financial statements in conformity with NFRS requires management to make judgements, estimates and assumptions that affect the application of the accounting policies and the reported amounts of assets and liabilities, the disclosure of contingent assets and liabilities at the date of the financial statements, and the reported amounts of revenues and expenses during the year. Actual results could differ from those estimates. The estimates and underlying assumptions are reviewed on an ongoing basis. Revisions to accounting estimates are recognised in the period in which the estimate is revised if the revision affects only that period; they are recognised in the period of the revision and future periods if the revision affects both current and future periods.
Operating Cycle
All assets and liabilities have been classified as current or non-current as per the Company’s normal operating cycle and other criteria set out in NAS 1 - Presentation of Financial Statements based on the nature of products and the time between the acquisition of assets for processing and their realisation in cash and cash equivalents.
Property, Plant & Equipment – Tangible Assets
Property, plant & equipment are stated at cost of acquisition or construction less accumulated depreciation and impairment, if any.
Cost is inclusive of inward freight, duties and taxes and incidental expenses related to acquisition. In respect of major projects involving construction, related pre-operational expenses form part of the value of assets capitalised. Expenses capitalised also include applicable borrowing costs for qualifying assets, if any. All upgradation / enhancements are charged off as revenue expenditure unless they bring similar significant additional benefits.
An item of property, plant and equipment is derecognised upon disposal or when no future economic benefits are expected to arise from the continued use of asset. Any gain or loss arising on the disposal or retirement of an item of property, plant and equipment is determined as the difference between the sales proceeds and the carrying amount of the asset and is recognised in the Statement of Profit or Loss and Other Comprehensive Income.
Depreciation of these assets commences when the assets are ready for their intended use which is generally on commissioning. Items of Property, Plant and Equipment are depreciated in a manner that amortises the cost (or other amount substituted for cost) of the assets after commissioning, less its residual value, over their useful lives on a straight line basis. Land is not depreciated.
The estimated useful lives of property, plant and equipment of the Company are as follows:
Buildings 3 – 60 Years
Plant and Equipment 9 – 15 Years
Furniture and Fixtures 10 Years
Vehicles 6 – 10 Years
Office Equipment 5 Years
Computers 3 – 6 Year
Property, plant and equipment’s residual values and useful lives are reviewed at each Statement of Financial Position date and changes, if any, are treated as changes in accounting estimate.
Intangible Assets
Intangible Assets that the Company controls and from which it expects future economic benefits are capitalised upon acquisition and measured at cost comprising the purchase price (including import duties and non-refundable taxes) and directly attributable costs to prepare the asset for its intended use.
The useful life of an intangible asset is considered finite where the rights to such assets are limited to a specified period of time by contract or law (e.g., licences) or the likelihood of technical, technological obsolescence (e.g., computer software). If, there are no such limitations, the useful life is taken to be indefinite.
Intangible assets that have finite lives are amortized over their estimated useful lives by the straight line method unless it is practical to reliably determine the pattern of benefits arising from the asset. An intangible asset with an indefinite useful life is not amortized.
Software is amortised over a period of five years.
All intangible assets are tested for impairment. Amortization expenses and impairment losses and reversal of impairment losses are taken to the Statement of Profit or Loss and Other Comprehensive Income. Thus, after initial recognition, an intangible asset is carried at its cost less accumulated amortization and / or impairment losses.
The useful lives of intangible assets are reviewed annually to determine if a reset of such useful life is required for assets with finite lives and to confirm that business circumstances continue to support an indefinite useful life assessment for assets so classified. Based on such review, the useful life may change or the useful life assessment may change from indefinite to finite. The impact of such changes is accounted for as a change in accounting estimate.
Impairment of Assets
Impairment loss, if any, is provided to the extent the carrying amount of assets or cash generating units exceed their recoverable amount.
Recoverable amount is higher of an asset’s net selling price and its value in use. Value in use is the present value of estimated future cash flows expected to arise from the continuing use of an asset or cash generating unit and from its disposal at the end of its useful life.
Impairment losses recognised in prior years are reversed when there is an indication that the impairment losses recognised no longer exist or have decreased. Such reversals are recognised as an increase in carrying amounts of assets to the extent that it does not exceed the carrying amounts that would have been determined (net of amortisation or depreciation) had no impairment loss been recognised in previous years.
Inventories
Inventories are stated at lower of cost and net realisable value. The cost is calculated on weighted average method. Cost comprises expenditure incurred in the normal course of business in bringing such inventories to its present location and condition and includes, where applicable, appropriate overheads based on normal level of activity. Net realisable value is the estimated selling price less estimated costs for completion and sale.
Obsolete, slow moving and defective inventories are identified from time to time and, where necessary, a provision is made for such inventories.

297
SURYA NEPAL PRIVATE LIMITED
NOTES TO THE FINANCIAL STATEMENTS (CONTD.)
Foreign Currency Transactions
The functional and presentation currency of the Company is Nepalese Rupee.
Transactions in foreign currency are accounted for at the exchange rate prevailing on the transaction date. Gains/Losses arising on settlement as also on translation of monetary items are recognized in the Statement of Profit or Loss and Other Comprehensive Income.
Derivatives
The Company uses derivative financial instruments, such as forward exchange contracts to hedge its foreign currency risks. Derivatives are initially recognised at fair value and are subsequently remeasured to their fair value at the end of each reporting period. The resulting gains/losses are recognised in the Statement of Profit or Loss and Other Comprehensive Income.
Financial instrument, Financial assets and Financial liabilities
Financial assets and financial liabilities are recognized when the Company becomes a party to the contractual provisions of the relevant instrument and are initially measured at fair value. Transaction costs that are directly attributable to the acquisition or issue of financial assets and financial liabilities (other than financial assets and financial liabilities measured at fair value through profit or loss) are added to or deducted from the fair value on initial recognition of financial assets or financial liabilities. Purchase or sale of financial assets that require delivery of assets within a time frame established by regulation or convention in the market place (regular way trades) are recognised on the trade date, i.e., the date when the Company commits to purchase or sell the asset.
Financial assets
Recognition: Financial assets include Investments, Trade receivables, Advances, Security Deposits, Cash and cash equivalents. Such assets are initially recognised at transaction price when the Company becomes party to contractual obligations. The transaction price includes transaction costs unless the asset is being fair valued through the Statement of Profit or Loss and Other Comprehensive Income.
Classification: Management determines the classification of an asset at initial recognition depending on the purpose for which the assets were acquired. The subsequent measurement of financial assets depends on such classification.
Financial assets are classified as those measured at:
(a) amortised cost, where the financial assets are held solely for collection of cash flows arising from payments of principal and/ or interest.
(b) fair value through other comprehensive income (FVTOCI), where the financial assets are held not only for collection of cash flows arising from payments of principal and interest but also from the sale of such assets. Such assets are subsequently measured at fair value, with unrealised gains and losses arising from changes in the fair value being recognised in other comprehensive income.
(c) fair value through profit or loss (FVTPL), where the assets are managed in accordance with an approved investment strategy that triggers purchase and sale decisions based on the fair value of such assets. Such assets are subsequently measured at fair value, with unrealised gains and losses arising from changes in the fair value being recognised in the Statement of Profit or Loss and Other Comprehensive in the period in which they arise.
Trade receivables, Advances, Security Deposits, Cash and cash equivalents etc. are classified for measurement at amortised cost while investments may fall under any of the aforesaid classes.
Impairment: The Company assesses at each reporting date whether a financial asset (or a group of financial assets) such as investments, trade receivables, advances and security deposits held at amortised cost and financial assets that are measured at fair value through other comprehensive income are tested for impairment based on evidence or information that is available without undue cost or effort. Expected credit losses are assessed and loss allowances recognised if the credit quality of the financial asset has deteriorated significantly since initial recognition.
Reclassification: When and only when the business model is changed, the Company shall reclassify all affected financial assets prospectively from the reclassification date as subsequently measured at amortised cost, fair value through other comprehensive income, fair value through profit or loss without restating the previously recognised gains, losses or interest and in terms of the reclassification principles laid down in the NFRS relating to Financial Instruments.
De-recognition: Financial assets are derecognised when the right to receive cash flows from the assets has expired, or has been transferred, and the Company has transferred substantially all of the risks and rewards of ownership. Concomitantly, if the asset is one that is measured at:
(a) amortised cost, the gain or loss is recognised in the Statement of Profit or Loss and Other Comprehensive Income;
(b) fair value through other comprehensive income, the cumulative fair value adjustments previously taken to reserves are reclassified to the Statement of Profit or Loss and Other Comprehensive Income unless the asset represents an equity investment in which case the cumulative fair value adjustments previously taken to reserves is reclassified within equity.
Income Recognition: Interest income is recognised in the Statement of Profit or Loss and Other Comprehensive Income using the effective interest method.
Financial Liabilities
Borrowings, trade payables and other financial liabilities are initially recognised at the value of the respective contractual obligations. They are subsequently measured at amortised cost. Any discount or premium on redemption / settlement is recognised in the Statement of Profit or Loss and Other Comprehensive Income as finance cost over the life of the liability using the effective interest method and adjusted to the liability figure disclosed in the Statement of Financial Position.
Financial liabilities are derecognised when the liability is extinguished, that is, when the contractual obligation is discharged, cancelled and on expiry.
Offsetting Financial Instruments
Financial assets and liabilities are offset and the net amount is included in the Statement of Financial Position where there is a legally enforceable right to offset the recognised amounts and there is an intention to settle on a net basis or realise the asset and settle the liability simultaneously.
Revenue
Revenue is measured at the fair value of the consideration received or receivable for goods supplied, net of returns and discounts to customers. Revenue from the sale of goods includes excise duty, health risk tax and sticker charges payable by the Company but excludes amounts collected on behalf of third parties, such as value added tax.
Revenue from the sales of goods is recognised when significant risks and rewards of ownership have been transferred to the customer, which is mainly upon delivery, the amount of revenue can be measured reliably and recovery of the consideration is probable.
Dividend Distribution
Dividends paid is recognised in the period in which the interim dividends are approved by the Board of Directors, or in respect of the final dividend when approved by shareholders.
Employee Benefits
The Company provides for both defined benefit and defined contribution schemes.
Contribution to defined contribution schemes (Provident Fund and Gratuity for certain employees) are charged as expense based on the amount of contribution required to be made as and when services are rendered by the employee.
The Company also provides for defined benefits in the form of Gratuity and other retirement benefits in respect of certain employees. The cost of providing benefits under the defined benefit obligation is calculated by independent actuary using the projected unit credit method.

298
SURYA NEPAL PRIVATE LIMITED
NOTES TO THE FINANCIAL STATEMENTS (CONTD.)
Service costs and net interest expense or income is reflected in the Statement of Profit or Loss and Other Comprehensive Income. Gain or Loss on account of remeasurements are recognised immediately through other comprehensive income in the period in which they occur. Gratuity is funded and deposited with the designated funds as per applicable laws, towards meeting the Gratuity obligation. Other retirement benefits are unfunded.
The employees of the Company are entitled to compensated leave for which the Company records the liability based on actuarial valuation computed using projected unit credit method. These benefits are unfunded.
Employee Share Based Compensation
The cost of options granted under the ITC Employee Stock Option Scheme to employees of ITC Limited (“ITC”) seconded to the Company at its request is measured at the fair value of the options as on the grant date. The fair value of awards at grant date is calculated using the Black Scholes Option Pricing Model. The cost of stock options is recognized in the Statement of Profit or Loss and Other Comprehensive Income with a corresponding payable, when such reimbursement is sought by ITC.
Leases
Leases are recognised as a finance lease wherever the terms of the lease transfer substantially all the risks and rewards of ownership to the lessee. All other leases are classified as operating leases.
Company as a Lessee
Rentals payable under operating leases are charged to the Statement of Profit or Loss and Other Comprehensive Income on a straight-line basis over the term of the relevant lease.
Taxes on Income
Taxes on income comprises current taxes and deferred taxes. Current tax in the Statement of Profit or Loss and Other Comprehensive Income is provided as the amount of tax payable in respect of taxable income for the period using tax rates and tax laws enacted during the period, together with any adjustment to tax payable in respect of previous years.
Deferred tax is recognized on temporary differences between the carrying amounts of assets and liabilities and the amounts used for taxation purposes (tax base), at the tax rates and tax laws enacted or substantively enacted by the end of the reporting period.
Deferred tax assets are recognized for the future tax consequences to the extent it is probable that future taxable profits will be available against which the deductible temporary differences can be utilised.
Income tax, in so far as it relates to items disclosed under other comprehensive income or equity, are disclosed separately under other comprehensive income or equity, as applicable.
Deferred tax assets and liabilities are offset when there is legally enforceable right to offset current tax assets and liabilities and when the deferred tax balances relate to the same taxation authority. Current tax assets and tax liabilities are offset where the entity has a legally enforceable right to offset and intends either to settle on net basis, or to realize the asset and settle the liability simultaneously.
Claims
Claims against the Company not acknowledged as debts are disclosed after a careful evaluation of the facts and legal aspects of the matter involved.
Provisions
Provisions are recognised when, as a result of a past event, the Company has a legal or constructive obligation; it is probable that an outflow of resources will be required to settle the obligation; and the amount can be reliably estimated. The amount so recognised is a best estimate of the consideration required to settle the obligation at the reporting date, taking into account the risks and uncertainties surrounding the obligation.
In an event when the time value of money is material, the provision is carried at the present value of the cash flows estimated to settle the obligation.
2. Use of Estimates
The preparation of financial statements in conformity with generally accepted accounting principles requires management to make estimates and assumptions that affect the reported amounts of assets and liabilities and the disclosure of contingent liabilities at the date of the financial statements and the results of operations during the reporting period end. Although these estimates are based upon management’s best knowledge of current events and actions, actual results could differ from those estimates. The estimates and underlying assumptions are reviewed on an ongoing basis. Revisions to accounting estimates are recognised in the period in which the estimate is revised if the revision affects only that period or in the period of the revision and future periods if the revision affects both current and future periods.
Key sources of estimation uncertainty
The following are the key assumptions concerning the future, and other key sources of estimation uncertainty at the end of the reporting period that may have a significant risk of causing a material adjustment to the carrying amounts of assets and liabilities within the next financial year.
A. Useful lives of property, plant and equipment and intangible assets:
As described in the significant accounting policies, the Company reviews the estimated useful lives of property, plant and equipment and intangible assets at the end of each reporting period.
B. Actuarial Valuation:
The determination of Company’s liability towards defined benefit obligation to employees is made through independent actuarial valuation including determination of amounts to be recognised in the Statement of Profit or Loss and in Other Comprehensive Income. Such valuation depend upon assumptions determined after taking into account inflation, seniority, promotion and other relevant factors such as supply and demand factors in the employment market. Information about such valuation is provided in notes to the financial statements.
C. Claims, Provisions and Contingent Liabilities:
The Company has ongoing litigations with various regulatory authorities. Where an outflow of funds is believed to be probable and a reliable estimate of the outcome of the dispute can be made based on management’s assessment of specific circumstances of each dispute and relevant external advice, management provides for its best estimate of the liability. Such accruals are by nature complex and can take number of years to resolve and can involve estimation uncertainty. Information about such litigations is provided in notes to the financial statements.

299
SURYA NEPAL PRIVATE LIMITEDN
OTE
S TO
TH
E FI
NA
NC
IAL
STA
TEM
ENTS
(C
on
td.)
Parti
cular
s G
ross
Bloc
k D
epre
ciatio
n an
d Am
ortiz
atio
n N
et B
lock
As a
t 31
.03.
2073
(15.
07.2
016)
Add
ition
sW
ithdr
awals
/ Ad
justm
ents
As a
t 31
.03.
2074
(15.
07.2
017)
Addi
tions
With
draw
als/
Adju
stmen
ts A
s at
32.0
3.20
75(1
6.07
.201
8)
Upt
o 11
.03.
2073
(1
5.07
.201
6)
For t
he
Year
*W
ithdr
awals
/ Ad
justm
ents
As a
t 31
.03.
2074
(15.
07.2
017)
For t
heYe
arW
ithdr
awals
/ Ad
justm
ents
As a
t 32
.03.
2075
(15.
07.2
018)
As a
t 32
.03.
2075
(16.
07.2
018)
As a
t 31
.03.
2074
(15.
07.2
017)
3A. P
rope
rty, P
lant
and
Equ
ipm
ent
Land
& La
nd D
evelo
pmen
t 3
05,1
47,8
56
- -
305
,147
,856
-
- 3
05,1
47,8
56
- -
- -
- -
- 3
05,1
47,8
56
305
,147
,856
Bui
ldin
gs
1,8
91,1
56,6
24
6,7
86,1
89
- 1
,897
,942
,813
9
,960
,027
-
1,9
07,9
02,8
40
470
,599
,159
1
67,4
59,3
50
- 6
38,0
58,5
09
80,
215,
076
- 7
18,2
73,5
85
1,1
89,6
29,2
55
1,2
59,8
84,3
04
Plan
t and
Mac
hine
ry
7,2
73,4
51,3
44
263
,753
,334
-
7,5
37,2
04,6
78
31,
176,
457
125
,830
,982
7
,442
,550
,153
3
,297
,539
,300
5
66,4
84,0
94
- 3
,864
,023
,394
5
65,4
03,0
18
125
,830
,387
4
,303
,596
,025
3
,138
,954
,128
3
,673
,181
,284
Furn
iture
and
Fixtu
res
99,
195,
850
2,7
70,7
86
9,0
92,5
17
92,
874,
119
1,2
98,0
19
4,3
22,1
73
89,
849,
965
46,
874,
399
8,1
26,2
11
5,9
49,7
75
49,
050,
835
7,7
68,9
91
3,8
90,2
47
52,
929,
579
36,
920,
386
43,
823,
284
Veh
icles
1
49,9
93,2
96
27,
622,
357
5,7
52,7
53
171
,862
,900
-
38,
893,
567
132
,969
,333
7
2,84
0,56
8 3
1,85
1,08
0 4
,963
,121
9
9,72
8,52
7 2
1,40
9,64
6 3
6,07
1,12
9 8
5,06
7,04
4 4
7,90
2,28
9 7
2,13
4,37
3
Com
pute
rs 1
64,1
21,2
00
524
,300
3
1,04
6,55
1 1
33,5
98,9
49
7,9
37,2
58
2,4
75,5
88
139
,060
,619
1
32,2
27,1
22
18,
123,
690
31,
046,
268
119
,304
,544
8
,975
,818
2
,475
,586
1
25,8
04,7
76
13,
255,
843
14,
294,
405
Offi
ce Eq
uipm
ent
104
,235
,813
3
,005
,442
3
,788
,511
1
03,4
52,7
44
11,
566,
852
704
,955
1
14,3
14,6
41
47,
077,
071
9,9
17,2
32
2,8
23,0
81
54,
171,
222
8,8
44,9
53
690
,751
6
2,32
5,42
4 5
1,98
9,21
7 4
9,28
1,52
2
Tot
al
9,9
87,3
01,9
83
304
,462
,408
4
9,68
0,33
2 1
0,24
2,08
4,05
9 6
1,93
8,61
3 1
72,2
27,2
65
10,
131,
795,
407
4,0
67,1
57,6
19
801
,961
,657
4
4,78
2,24
5 4
,824
,337
,031
6
92,6
17,5
02
168
,958
,100
5
,347
,996
,433
4
,783
,798
,974
5
,417
,747
,028
3B. C
apita
l Wor
k-in
-Pro
gres
s 3
26,2
22,8
15
59,
141,
177
276
,376
,230
1
08,9
87,7
62
185
,681
,975
6
1,71
9,26
1 2
32,9
50,4
76
– –
––
––
– 2
32,9
50,4
76
108
,987
,762
3C. I
ntan
gibl
e As
sets
Capi
talis
ed S
oftw
are
289
,032
,926
-
- 2
89,0
32,9
26
- -
289
,032
,926
1
55,6
82,2
47
49,
680,
441
– 2
05,3
62,6
88
49,
680,
441
– 2
55,0
43,1
29
33,
989,
797
83,
670,
238
Gran
d To
tal
10,6
02,5
57,7
24 3
63,6
03,5
85 3
26,0
56,5
62
10,6
40,1
04,7
4724
7,62
0,58
8 2
33,9
46,5
2610
,653
,778
,809
4,2
22,8
39,8
6685
1,64
2,09
8 4
4,78
2,24
55,
029,
699,
719
742,
297,
943
168
,958
,100
5,6
03,0
39,5
62 5
,050
,739
,247
5,61
0,40
5,02
8
[ Am
ount
in N
Rs ]

300
SURYA NEPAL PRIVATE LIMITEDN
OTE
S TO
TH
E FI
NA
NC
IAL
STA
TEM
ENTS
(C
on
td.)
Parti
cular
s G
ross
Bloc
k D
epre
ciatio
n an
d Am
ortiz
atio
n N
et B
lock
As a
t 31
.03.
2073
(15.
07.2
016)
Add
ition
sW
ithdr
awals
/ Ad
justm
ents
As a
t 31
.03.
2074
(15.
07.2
017)
Addi
tions
With
draw
als/
Adju
stmen
ts A
s at
32.0
3.20
75(1
6.07
.201
8)
Upt
o 31
.03.
2073
(1
5.07
.201
6)
For t
he
Year
*W
ithdr
awals
/ Ad
justm
ents
As a
t 31
.03.
2074
(15.
07.2
017)
For t
heYe
arW
ithdr
awals
/ Ad
justm
ents
Upto
32.0
3.20
75(1
6.07
.201
8)
As a
t 32
.03.
2075
(16.
07.2
018)
As a
t 31
.03.
2074
(15.
07.2
017)
3A. P
rope
rty, P
lant
and
Equ
ipm
ent
Land
& La
nd D
evelo
pmen
t 1
90,7
17,4
10
– –
190
,717
,410
–
– 1
90,7
17,4
10
––
––
––
– 1
90,7
17,4
10
190
,717
,410
Bui
ldin
gs
1,1
81,9
72,8
90
4,2
41,3
68
– 1
,186
,214
,258
6
,225
,017
–
1,1
92,4
39,2
75
294
,124
,474
1
04,6
62,0
94
– 3
98,7
86,5
68
50,
134,
423
– 4
48,9
20,9
91
743
,518
,284
7
87,4
27,6
90
Plan
t and
Mac
hine
ry
4,5
45,9
07,0
91
164
,845
,834
–
4,7
10,7
52,9
25
19,
485,
286
78,
644,
364
4,6
51,5
93,8
47
2,0
60,9
62,0
63
354
,052
,559
–
2,4
15,0
14,6
22
353
,376
,886
7
8,64
3,99
2 2
,689
,747
,516
1
,961
,846
,331
2
,295
,738
,303
Furn
iture
and
Fixtu
res
61,
997,
406
1,7
31,7
41
5,6
82,8
23
58,
046,
324
811
,262
2
,701
,358
5
6,15
6,22
8 2
9,29
6,49
9 5
,078
,882
3
,718
,609
3
0,65
6,77
2 4
,855
,619
2
,431
,404
3
3,08
0,98
7 2
3,07
5,24
1 2
7,38
9,55
2
Veh
icles
9
3,74
5,81
0 1
7,26
3,97
3 3
,595
,471
1
07,4
14,3
12
- 2
4,30
8,47
9 8
3,10
5,83
3 4
5,52
5,35
5 1
9,90
6,92
5 3
,101
,951
6
2,33
0,32
9 1
3,38
1,02
9 2
2,54
4,45
6 5
3,16
6,90
2 2
9,93
8,93
1 4
5,08
3,98
3
Com
pute
rs 1
02,5
75,7
50
327
,688
1
9,40
4,09
4 8
3,49
9,34
4 4
,960
,786
1
,547
,243
8
6,91
2,88
7 8
2,64
1,95
2 1
1,32
7,30
6 1
9,40
3,91
8 7
4,56
5,34
0 5
,609
,886
1
,547
,241
7
8,62
7,98
5 8
,284
,902
8
,934
,004
Offi
ce Eq
uipm
ent
65,
147,
383
1,8
78,4
01
2,3
67,8
19
64,
657,
965
7,2
29,2
83
440
,597
7
1,44
6,65
1 2
9,42
3,16
9 6
,198
,270
1
,764
,426
3
3,85
7,01
3 5
,528
,096
4
31,7
19
38,
953,
390
32,
493,
261
30,
800,
952
Tot
al
6,2
42,0
63,7
40
190
,289
,005
3
1,05
0,20
7 6
,401
,302
,538
3
8,71
1,63
4 1
07,6
42,0
41
6,3
32,3
72,1
31
2,5
41,9
73,5
12
501
,226
,036
2
7,98
8,90
4 3
,015
,210
,644
4
32,8
85,9
39
105
,598
,812
3
,342
,497
,771
2
,989
,874
,360
3
,386
,091
,894
3B. C
apita
l Wor
k-in
-Pro
gres
s 2
03,8
89,2
60
36,
963,
236
172
,735
,144
6
8,11
7,35
2 1
16,0
51,2
34
38,
574,
538
145
,594
,048
–
––
––
––
145
,594
,048
6
8,11
7,35
2
3C. I
ntan
gibl
e As
sets
Capi
talis
ed S
oftw
are
180
,645
,579
–
– 1
80,6
45,5
79
––
180
,645
,579
9
7,30
1,40
5 3
1,05
0,27
6 –
128
,351
,681
3
1,05
0,27
6 –
159
,401
,957
2
1,24
3,62
2 5
2,29
3,89
8
Gran
d To
tal
6,6
26,5
98,5
79
227
,252
,241
2
03,7
85,3
51
6,6
50,0
65,4
69
154
,762
,868
1
46,2
16,5
79
6,6
58,6
11,7
58
2,6
39,2
74,9
17
532
,276
,312
2
7,98
8,90
4 3
,143
,562
,325
4
63,9
36,2
15
105
,598
,812
3
,501
,899
,728
3
,156
,712
,030
3
,506
,503
,144
1. T
he am
ount
of e
xpen
ditu
res r
ecog
nise
d in
the c
arry
ing
amou
nt o
f pro
perty
, plan
t and
equi
pmen
t in
the c
ourse
of c
onstr
uctio
n is
NRs.
7,88
,324
(` 4
,92,
703)
[207
3/74
- NR
s. 41
,95,
252
(` 2
6,22
,033
)].
2. T
he am
ortiz
atio
n ex
pens
e of i
ntan
gibl
e asse
ts ha
ve b
een
inclu
ded
unde
r ‘De
prec
iatio
n an
d Am
ortiz
atio
n ex
pens
e’ in
the S
tate
men
t of P
rofit
or L
oss a
nd O
ther
Com
preh
ensiv
e Inc
ome.
[ Am
ount
in `
]

301
SURYA NEPAL PRIVATE LIMITED
Figures in NRs. Figures in ` Figures in NRs. Figures in ` As at As at As at As at 32nd Asadh 2075 32nd Asadh 2075 31st Asadh 2074 31st Asadh 2074 (16th July 2018) (16th July 2018) (15th July 2017) (15th July 2017)
4A. NON-CURRENT INVESTMENTS
INVESTMENT IN GOVERNMENT OR TRUST SECURITIES
(at amortized cost)
Investment in Promissory Note issued by Nepal Government
6.5% Bikash Rinpatra, 2075 - Unquoted – – 25,632,338 16,020,211
Total – – 25,632,338 16,020,211
4B. CURRENT INVESTMENTS
Current Portion of Non-Current Investment
INVESTMENT IN GOVERNMENT OR TRUST SECURITIES
(at amortized cost)
Investment in Promissory Note issued by Nepal Government
6.5% Bikash Rinpatra, 2075 - Unquoted 25,632,338 16,020,211 – –
Total 25,632,338 16,020,211 – –
5. LOANS NON-CURRENT Employee Loans 30,610,168 19,131,355 36,562,388 22,851,493
Total 30,610,168 19,131,355 36,562,388 22,851,493
CURRENT Employee Loans 7,304,772 4,565,483 9,679,258 6,049,536
Total 7,304,772 4,565,483 9,679,258 6,049,536
6. OTHER FINANCIAL ASSETS NON-CURRENT Deposits 880,825 550,516 - -
Total 880,825 550,516 - -
CURRENT Interest Accrued on – Investments 193,397 120,873 193,397 120,873 – Call and Other Deposit with Banks 27,982,997 17,489,373 24,245,945 15,153,716 – Commercial Advances 8,100 5,063 5,357 3,348
Derivative instruments not designated as hedging instruments 1,130,019 706,262 624,276 390,173
Deposits – – 880,825 550,516
Recoverable from Holding Company 1,319,841 824,901 812,967 508,104
Total 30,634,354 19,146,472 26,762,767 16,726,730
7. DEFERRED TAX ASSETS /(LIABILITIES) (NET)
Deferred Tax Assets 74,704,105 46,690,066 74,078,975 46,299,359 Less: Deferred Tax Liabilities 15,606,771 9,754,231 36,275,266 22,672,041
Deferred Tax Assets / (Liabilities) (Net) 59,097,334 36,935,835 37,803,709 23,627,318
Movement in Deferred Tax Assets / (Liabilities) Balances Figures in NRs. Figures in ` Figures in NRs. Figures in ` Figures in NRs. Figures in ` Figures in NRs. Figures in ` 2074/75 Opening Balance Opening Balance Recognized in Recognized in Recognized in OCI Recognized in OCI Closing Balance Closing Balance
Profit or Loss Profit or Loss
Deferred Tax Assets in relation to:
On Provision for Retirement and Other Employee Benefits 49,327,490 30,829,682 (8,690,805) (5,431,753) 11,718,398 7,323,999 52,355,083 32,721,928
On Provision for Doubtful Advances 614,255 383,909 (3,303) (2,064) – – 610,952 381,845
On Provision for Inventories 24,137,230 15,085,768 (2,399,160) (1,499,475) – – 21,738,070 13,586,293
Total Deferred Tax Assets 74,078,975 46,299,359 (11,093,268) (6,933,292) 11,718,398 7,323,999 74,704,105 46,690,066 Deferred Tax Liabilities in relation to:
On Overheads Allocation on Finished Goods 33,717,626 21,073,516 3,172,951 1,983,094 – – 36,890,577 23,056,610
On Fiscal Allowances on Property, Plant and Equipment etc. 2,492,173 1,557,608 (23,972,060) (14,982,538) – – (21,479,887) (13,424,930)
Other Timing Difference 65,467 40,917 130,614 81,634 – – 196,081 122,551
Total Deferred Tax Liabilities 36,275,266 22,672,041 (20,668,495) (12,917,810) – – 15,606,771 9,754,231
Deferred Tax Assets / (Liabilities) - Net 37,803,709 23,627,318 9,575,227 5,984,518 11,718,398 7,323,999 59,097,334 36,935,835
2073/74 Opening Balance Opening Balance Recognized in Recognized in Recognized in OCI Recognized in OCI Closing Balance Closing Balance
Deferred Tax Assets in relation to: Profit or Loss Profit or Loss
On Provision for Retirement and Other Employee Benefits 62,948,187 39,342,617 (7,713,439) (4,820,899) (5,907,258) (3,692,036) 49,327,490 30,829,682 On Provision for Doubtful Advances 617,080 385,675 (2,825) (1,766) – – 614,255 383,909 On Provision for Inventories 22,230,319 13,893,949 1,906,911 1,191,819 – – 24,137,230 15,085,768
Total Deferred Tax Assets 85,795,586 53,622,241 (5,809,353) (3,630,846) (5,907,258) (3,692,036) 74,078,975 46,299,359 Deferred Tax Liabilities in relation to: On Overheads Allocation on Finished Goods 25,213,271 15,758,294 8,504,355 5,315,222 – – 33,717,626 21,073,516 On fiscal allowances on Property, Plant and Equipment etc. 34,944,520 21,840,325 (32,452,347) (20,282,717) – – 2,492,173 1,557,608 Other Timing Difference – – 65,467 40,917 – – 65,467 40,917
Total Deferred Tax Liabilities 60,157,791 37,598,619 (23,882,525) (14,926,578) – – 36,275,266 22,672,041
Deferred Tax Assets / (Liabilities) - Net 25,637,795 16,023,622 18,073,172 11,295,732 (5,907,258) (3,692,036) 37,803,709 23,627,318
The Company has tax losses of NRs. 369,907,653 (` 231,192,283) [2073/74 - NRs. 492,459,190 (` 307,786,994)] for which no deferred tax assets have been recognised. These losses will expire between financial year 2075/76 to 2081/82.
NOTES TO THE FINANCIAL STATEMENTS (CONTD.)

302
SURYA NEPAL PRIVATE LIMITED
Figures in NRs. Figures in ` Figures in NRs. Figures in ` As at As at As at As at 32nd Asadh 2075 32nd Asadh 2075 31st Asadh 2074 31st Asadh 2074 (16th July 2018) (16th July 2018) (15th July 2017) (15th July 2017)8. OTHER ASSETS
NON-CURRENT Capital Advances 23,016,429 14,385,268 – –
Advances other than Capital Advances – Commercial Advances to Holding Company 1,637,454,548 1,023,409,093 1,984,190,173 1,240,118,858
– Security Deposits – With Statutory Authorities 57,679,892 36,049,933 55,465,892 34,666,183 – Others 128,600 80,375 120,600 75,374 Total 1,718,279,469 1,073,924,669 2,039,776,665 1,274,860,415
CURRENT Commercial Advances
– Green Leaf bought from Tobacco Farmers (net of loan disbursed by Bank) 4,666,929 2,916,831 4,045,883 2,528,677 – Other Goods and Services 3,297,950 2,061,219 7,542,339 4,713,962 Advance with Statutory Authorities 58,211,378 36,382,111 12,606,720 7,879,200 Deposit with Statutory Authorities 264,473,271 165,295,794 203,662,716 127,289,198 Employee Advances 1,366,527 854,079 2,130,313 1,331,446 Unexpired Expenses 116,352,693 72,720,433 116,216,594 72,635,371 Margin Money Deposit 1,616,990 1,010,619 509,165 318,228 Less: Allowance for doubtful advances and deposits (2,070,813) (1,294,258) (2,081,823) (1,301,139) Total 447,914,925 279,946,828 344,631,907 215,394,943
9. INVENTORIES
(At lower of cost and net realisable value)
Raw Materials (including in-transit) 1,905,043,544 1,190,652,215 1,784,803,416 1,115,502,135
Stock-In-Process 90,338,369 56,461,481 126,632,567 79,145,354
Finished Goods 3,246,131,584 2,028,832,240 1,895,846,674 1,184,904,171
Stores and Supplies (including in-transit) 277,119,405 173,199,628 267,149,802 166,968,626
Total 5,518,632,902 3,449,145,564 4,074,432,459 2,546,520,286
The above includes goods in transit as under
Raw Materials 100,611,326 62,882,079 49,019,149 30,636,968
Stores and Supplies 3,187,351 1,992,094 4,091,559 2,557,224
Total 103,798,677 64,874,173 53,110,708 33,194,192
The cost of inventories recognised as an expense includes NRs. 4,885,957 (` 3,053,723) [during 2073/74: NRs. Nil (` Nil)] in respect of write-downs of inventory to net realisable value and has been reduced by NRs. Nil (` Nil) [during 2073/74: NRs. 364,841 (` 228,026)] in respect of the reversal of such write-downs. Previous write downs have been reversed as a result of increased sales prices.
10. TRADE RECEIVABLES (CURRENT)
Secured, considered good 3,580,779 2,237,987 814,651 509,157
Unsecured, considered good 64,975,706 40,609,816 76,440,699 47,775,437
Doubtful 339,012 211,883 339,012 211,883
Less: Allowance for doubtful receivables (339,012) (211,883) (339,012) (211,883)
Total 68,556,485 42,847,803 77,255,350 48,284,594
11. CASH AND CASH EQUIVALENTS*
Cash on Hand 55,825 34,891 60,325 37,703
Balances with Banks
Current Accounts 25,256,003 15,785,002 6,733,895 4,208,684
Short Term - Call Deposits 24,446,005 15,278,753 330,932,330 206,832,706
Total 49,757,833 31,098,646 337,726,550 211,079,093
* Cash and cash equivalents include cash on hand, cheques on hand, cash at bank and deposits with banks with original maturity of 3 months or less.
12. OTHER BANK BALANCES
In Deposit Accounts * 6,090,000,000 3,806,250,000 2,900,000,000 1,812,500,000
Earmarked Balance (Savings Account - Provident Fund) 65,963 41,227 64,129 40,081
Total 6,090,065,963 3,806,291,227 2,900,064,129 1,812,540,081
* Represents deposits with original maturity of more than 3 months having remaining maturity of less than 12 months from the Statement of Financial Position date.
NOTES TO THE FINANCIAL STATEMENTS (CONTD.)

303
SURYA NEPAL PRIVATE LIMITED
NOTES TO THE FINANCIAL STATEMENTS (CONTD.)
Figures in NRs. Figures in ` Figures in NRs. Figures in ` As at As at As at As at 32nd Asadh 2075 32nd Asadh 2075 31st Asadh 2074 31st Asadh 2074 (16th July 2018) (16th July 2018) (15th July 2017) (15th July 2017)13. EQUITY SHARE CAPITAL
Authorised 65,000,000 Ordinary Shares of NRs. 100/- (` 62.50) each 6,500,000,000 4,062,500,000 6,500,000,000 4,062,500,000
Issued, Subscribed & Paid up 20,160,000 Ordinary Shares of NRs.100/- (` 62.50) each, fully paid 2,016,000,000 1,260,000,000 2,016,000,000 1,260,000,000 2,016,000,000 1,260,000,000 2,016,000,000 1,260,000,000
Out of the above:1. 16,800,000 Ordinary Shares were issued as fully paid up bonus shares in 2065-66 (2008-09). 2. 2,800,000 Ordinary Shares were issued as fully paid up bonus shares in 2060-61 (2003-04). 3. 280,000 Ordinary Shares were issued as fully paid up bonus shares in 2052-53 (1995-96). 4. 11,894,400 Ordinary Shares are held by the Holding Company, ITC Limited. Reconciliation of number of Shares outstanding: Number of Shares
At the beginning of the year 20,160,000 20,160,000
At the end of the year 20,160,000 20,160,000
Rights, preferences and restrictions attached to the Ordinary Shares The Ordinary Shares of the Company, having par value of NRs. 100.00 (` 62.50) per share, rank pari passu in all respects including voting rights and entitlement to dividend.
14. PROVISIONS NON-CURRENT
Provision for Retirement and Other Employee Benefits [Refer Note 29] Retirement Benefits 72,444,430 45,277,769 78,101,846 48,813,654
Other Benefits 69,698,758 43,561,724 60,089,902 37,556,189
Total 142,143,188 88,839,493 138,191,748 86,369,843 CURRENT
Provision for Retirement and Other Employee Benefits Retirement Benefits 18,711,107 11,694,442 13,457,533 8,410,958
Other Benefits 9,091,974 5,682,484 12,775,682 7,984,800
Total 27,803,081 17,376,926 26,233,215 16,395,758
15. BORROWINGS (CURRENT) Secured Overdrafts / Other Demand Loans from Banks* 1,128,051,870 705,032,419 – –
Total 1,128,051,870 705,032,419 – –
* Overdrafts / Other Demand Loans from Banks are secured by hypothecation of Property, Plant and Equipment, Investment, Inventories and Trade Receivables, both present and future.
16. TRADE PAYABLES (CURRENT)
Trade Payables for Goods and Services – Holding Company 491,859,094 307,411,934 435,347,986 272,092,491 – Others 328,517,508 205,323,443 398,384,789 248,990,493
Total 820,376,602 512,735,377 833,732,775 521,082,984
17. OTHER FINANCIAL LIABILITIES (CURRENT)
Payable for Property, Plant and Equipment 24,708,628 15,442,893 4,517,542 2,823,464 Retention Money – For Property, Plant and Equipment 15,689,283 9,805,802 5,834,948 3,646,843 – Others 2,174,269 1,358,918 2,552,853 1,595,533 Payable for Employee Benefits 21,560,049 13,475,031 16,478,024 10,298,765 Provision for Employee’s Bonus under The Bonus Act, 2030 – Distribution by Company 113,535,309 70,959,568 108,580,583 67,862,864 – Deposit with Welfare Funds established under The Labour Act 972,978,032 608,111,270 754,044,817 471,278,011 – Deposit with National Level Welfare Fund established by Govt. of Nepal 416,990,585 260,619,116 323,162,065 201,976,291 Security Deposits from Customers 6,150,000 3,843,750 6,050,000 3,781,250 Interest Accrued but not due on current borrowings 1,687,534 1,054,709 – – Others (derivatives not designated as hedging instrument) 835,286 522,054 912,291 570,182
Total 1,576,308,975 985,193,111 1,222,133,123 763,833,203
18. OTHER LIABILITIES (CURRENT) Advances received from Customers 33,463,090 20,914,431 432,757,642 270,473,526 Statutory Liabilities 137,973,224 86,233,265 130,360,034 81,475,021 Provision for Corporate Social responsibility 156,889,793 98,056,121 73,015,885 45,634,928 Others 56,121,349 35,075,847 33,955,125 21,221,953
Total 384,447,456 240,279,664 670,088,686 418,805,428
19. CURRENT TAX LIABILITIES (NET) Provision for Income Tax 4,363,427,753 2,727,142,346 3,499,236,151 2,187,022,594 Less: Advance Tax paid / Withholding Tax deducted (3,711,512,556) (2,319,695,349) (3,172,373,173) (1,982,733,233)
Total 651,915,197 407,446,997 326,862,978 204,289,361

304
SURYA NEPAL PRIVATE LIMITED
NOTES TO THE FINANCIAL STATEMENTS (CONTD.)
Figures in NRs. Figures in ` Figures in NRs. Figures in ` For the Year For the Year For the Year For the Year 32nd Asadh 2075 32nd Asadh 2075 31st Asadh 2074 31st Asadh 2074 (16th July 2018) (16th July 2018) (15th July 2017) (15th July 2017)
20. GROSS REVENUE FROM SALE OF PRODUCTS FMCG – Cigarettes 32,828,122,208 20,517,576,380 29,259,997,900 18,287,498,688 – Branded Packaged Food Products 82,290,347 51,431,467 9,593,802 5,996,126 – Others (Apparel, Safety Matches, Agarbattis) 459,169,091 286,980,682 444,998,770 278,124,231
Total 33,369,581,646 20,855,988,529 29,714,590,472 18,571,619,045
21. DUTIES Excise Duty 8,936,700,140 5,585,437,588 7,872,105,603 4,920,066,002 Health Risk Tax 90,027,700 56,267,313 – – Sticker Charges 140,901,558 88,063,474 135,548,581 84,717,863
Total 9,167,629,398 5,729,768,375 8,007,654,184 5,004,783,865
22. OTHER OPERATING REVENUE Liability no longer required written back 11,100,615 6,937,884 – – Provision for doubtful advance/debts written back 11,010 6,881 9,416 5,885 Miscellaneous Income 14,554,527 9,096,579 26,273,441 16,420,901
Total 25,666,152 16,041,344 26,282,857 16,426,786
23. RAW MATERIALS CONSUMED ETC. Leaf and Casing Materials 3,045,185,002 1,903,240,626 2,911,851,119 1,819,906,949 Wrapping Materials 2,492,904,791 1,558,065,494 2,424,942,202 1,515,588,876 Fabrics, Trims etc. 9,812,558 6,132,849 15,184,516 9,490,323 Purchases and Contract Manufacturing Charges 398,954,146 249,346,341 323,378,117 202,111,323 5,946,856,497 3,716,785,310 5,675,355,954 3,547,097,471 Allocation of overheads etc. on Finished Goods (manufactured)
Opening 167,419,148 104,636,968 140,154,459 87,596,537 Closing (203,856,072) (127,410,045) (167,419,148) (104,636,968)
Total 5,910,419,573 3,694,012,233 5,648,091,265 3,530,057,040
24. EMPLOYEE BENEFITS EXPENSES Salaries, Wages & Allowances 512,886,993 320,554,371 479,281,291 299,550,807 Contribution to Provident and Other Funds 21,800,317 13,625,198 16,365,370 10,228,356 Provision for Retirement Benefits {Refer (I) of Note 29.a} (32,383,907) (20,239,942) 39,369,902 24,606,188 Cost of Stock Option Reimbursable 57,193,032 35,745,645 51,838,452 32,399,033 Labour & Staff Welfare 26,129,716 16,331,073 25,098,456 15,686,535 Provision for Employees’ Bonus 1,503,503,926 939,689,954 1,185,787,465 741,117,166 Total 2,089,130,077 1,305,706,299 1,797,740,936 1,123,588,085
25. MANUFACTURING, ADMIN, SELLING EXPENSES ETC. Hired Machine Expenses 66,206,724 41,379,203 86,798,703 54,249,189 Rent 60,852,317 38,032,698 73,748,267 46,092,667 Electricity, Fuel & Water 108,140,294 67,587,684 118,175,602 73,859,751 Rates & Taxes 104,911,836 65,569,898 11,473,268 7,170,793 Insurance Premium 94,790,996 59,244,373 95,345,951 59,591,219 Repairs & Improvements - Depreciable Assets 169,986,697 106,241,686 185,101,372 115,688,358 Maintenance - Owned Properties 6,409,517 4,005,948 6,245,452 3,903,408 Maintenance - Other Properties 6,431,495 4,019,684 17,130,939 10,706,837 Safety & Pollution Control Cost 36,847,296 23,029,560 30,848,438 19,280,274 Consumption of Stores & Spare Parts * 43,749,909 27,343,693 49,833,152 31,145,720 Freight and Handling charges 75,404,915 47,128,072 74,956,775 46,847,984 Product & Packaging Development - Tools / Accessories 18,583,275 11,614,547 57,755,173 36,096,983 Product Development & License Fees 603,664,632 377,290,395 549,911,810 343,694,881 Advertising 6,626,726 4,141,704 4,262,827 2,664,267 Market Research 19,638,195 12,273,872 23,717,890 14,823,681 Retail Accessories 34,356,922 21,473,076 28,920,180 18,075,113 Trade Distribution Expenses 134,766,294 84,228,934 114,389,710 71,493,569 Information Technology Services 100,877,721 63,048,576 132,590,330 82,868,956 Travel & Conveyance 77,142,270 48,213,919 78,286,098 48,928,811 Training & Recruitment Expenses 3,258,358 2,036,474 3,577,912 2,236,195 Postage, Telephone, Fax etc. 5,955,088 3,721,930 5,851,840 3,657,400 Bank Charges and Commission 5,261,969 3,288,731 8,025,786 5,016,116 Audit Fees 925,000 578,125 925,000 578,125 Legal Fees 5,190,700 3,244,188 1,783,800 1,114,875 Printing & Stationery 6,560,319 4,100,199 5,972,209 3,732,631 Consultancy Charges 404,480,912 252,800,570 365,064,704 228,165,440 Professional Service Charges & Other Fees 106,694,541 66,684,088 106,495,479 66,559,674 Business Entertainment Expenses 7,192,352 4,495,220 7,130,879 4,456,799 Promotion & Sponsorship 16,413,250 10,258,281 12,546,009 7,841,256 Board Meeting Fees 70,588 44,118 70,588 44,118 Donations 787,500 492,188 561,750 351,094 Books & Periodicals 192,914 120,571 381,836 238,648 Membership Fee 747,530 467,206 414,755 259,222 Loss / (gain) on Property, Plant & Equipment Sold / Discarded (Net) (19,632,108) (12,270,068) 1,144,703 715,439 Miscellaneous Expenses {Refer (v) of Note 30} 3,141,004 1,963,128 3,586,551 2,241,594
Total 2,316,627,948 1,447,892,471 2,263,025,738 1,414,391,087
* Includes writeback of provision for obsolescence of spares NRs. 7,997,201 (` 4,998,251) [provision created in 2073/74 - NRs. 6,356,370 (` 3,972,731)].
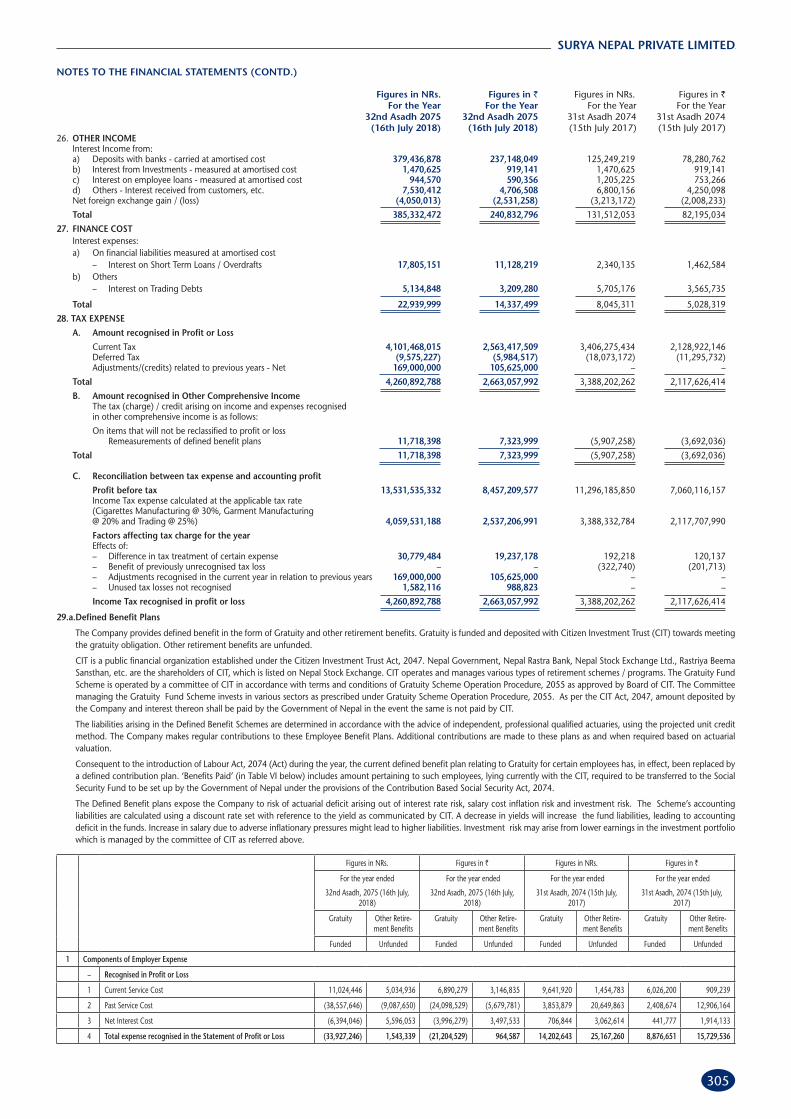
305
SURYA NEPAL PRIVATE LIMITED
Figures in NRs. Figures in ` Figures in NRs. Figures in ` For the Year For the Year For the Year For the Year 32nd Asadh 2075 32nd Asadh 2075 31st Asadh 2074 31st Asadh 2074 (16th July 2018) (16th July 2018) (15th July 2017) (15th July 2017)26. OTHER INCOME Interest Income from: a) Deposits with banks - carried at amortised cost 379,436,878 237,148,049 125,249,219 78,280,762 b) Interest from Investments - measured at amortised cost 1,470,625 919,141 1,470,625 919,141 c) Interest on employee loans - measured at amortised cost 944,570 590,356 1,205,225 753,266 d) Others - Interest received from customers, etc. 7,530,412 4,706,508 6,800,156 4,250,098 Net foreign exchange gain / (loss) (4,050,013) (2,531,258) (3,213,172) (2,008,233)
Total 385,332,472 240,832,796 131,512,053 82,195,034
27. FINANCE COST Interest expenses: a) On financial liabilities measured at amortised cost
– Interest on Short Term Loans / Overdrafts 17,805,151 11,128,219 2,340,135 1,462,584 b) Others
– Interest on Trading Debts 5,134,848 3,209,280 5,705,176 3,565,735
Total 22,939,999 14,337,499 8,045,311 5,028,319
28. TAX EXPENSE
A. Amount recognised in Profit or Loss
Current Tax 4,101,468,015 2,563,417,509 3,406,275,434 2,128,922,146 Deferred Tax (9,575,227) (5,984,517) (18,073,172) (11,295,732) Adjustments/(credits) related to previous years - Net 169,000,000 105,625,000 – –
Total 4,260,892,788 2,663,057,992 3,388,202,262 2,117,626,414
B. Amount recognised in Other Comprehensive Income The tax (charge) / credit arising on income and expenses recognised
in other comprehensive income is as follows:
On items that will not be reclassified to profit or loss Remeasurements of defined benefit plans 11,718,398 7,323,999 (5,907,258) (3,692,036)
Total 11,718,398 7,323,999 (5,907,258) (3,692,036) C. Reconciliation between tax expense and accounting profit
Profit before tax 13,531,535,332 8,457,209,577 11,296,185,850 7,060,116,157 Income Tax expense calculated at the applicable tax rate (Cigarettes Manufacturing @ 30%, Garment Manufacturing @ 20% and Trading @ 25%) 4,059,531,188 2,537,206,991 3,388,332,784 2,117,707,990
Factors affecting tax charge for the year Effects of: – Difference in tax treatment of certain expense 30,779,484 19,237,178 192,218 120,137
– Benefit of previously unrecognised tax loss – – (322,740) (201,713) – Adjustments recognised in the current year in relation to previous years 169,000,000 105,625,000 – – – Unused tax losses not recognised 1,582,116 988,823 – –
Income Tax recognised in profit or loss 4,260,892,788 2,663,057,992 3,388,202,262 2,117,626,414
29.a.Defined Benefit Plans
The Company provides defined benefit in the form of Gratuity and other retirement benefits. Gratuity is funded and deposited with Citizen Investment Trust (CIT) towards meeting the gratuity obligation. Other retirement benefits are unfunded.
CIT is a public financial organization established under the Citizen Investment Trust Act, 2047. Nepal Government, Nepal Rastra Bank, Nepal Stock Exchange Ltd., Rastriya Beema Sansthan, etc. are the shareholders of CIT, which is listed on Nepal Stock Exchange. CIT operates and manages various types of retirement schemes / programs. The Gratuity Fund Scheme is operated by a committee of CIT in accordance with terms and conditions of Gratuity Scheme Operation Procedure, 2055 as approved by Board of CIT. The Committee managing the Gratuity Fund Scheme invests in various sectors as prescribed under Gratuity Scheme Operation Procedure, 2055. As per the CIT Act, 2047, amount deposited by the Company and interest thereon shall be paid by the Government of Nepal in the event the same is not paid by CIT.
The liabilities arising in the Defined Benefit Schemes are determined in accordance with the advice of independent, professional qualified actuaries, using the projected unit credit method. The Company makes regular contributions to these Employee Benefit Plans. Additional contributions are made to these plans as and when required based on actuarial valuation.
Consequent to the introduction of Labour Act, 2074 (Act) during the year, the current defined benefit plan relating to Gratuity for certain employees has, in effect, been replaced by a defined contribution plan. ‘Benefits Paid’ (in Table VI below) includes amount pertaining to such employees, lying currently with the CIT, required to be transferred to the Social Security Fund to be set up by the Government of Nepal under the provisions of the Contribution Based Social Security Act, 2074.
The Defined Benefit plans expose the Company to risk of actuarial deficit arising out of interest rate risk, salary cost inflation risk and investment risk. The Scheme’s accounting liabilities are calculated using a discount rate set with reference to the yield as communicated by CIT. A decrease in yields will increase the fund liabilities, leading to accounting deficit in the funds. Increase in salary due to adverse inflationary pressures might lead to higher liabilities. Investment risk may arise from lower earnings in the investment portfolio which is managed by the committee of CIT as referred above.
Figures in NRs. Figures in ` Figures in NRs. Figures in `
For the year ended
32nd Asadh, 2075 (16th July, 2018)
For the year ended
32nd Asadh, 2075 (16th July, 2018)
For the year ended
31st Asadh, 2074 (15th July, 2017)
For the year ended
31st Asadh, 2074 (15th July, 2017)
Gratuity Other Retire-ment Benefits
Gratuity Other Retire-ment Benefits
Gratuity Other Retire-ment Benefits
Gratuity Other Retire-ment Benefits
Funded Unfunded Funded Unfunded Funded Unfunded Funded Unfunded
1 Components of Employer Expense
– Recognised in Profit or Loss
1 Current Service Cost 11,024,446 5,034,936 6,890,279 3,146,835 9,641,920 1,454,783 6,026,200 909,239
2 Past Service Cost (38,557,646) (9,087,650) (24,098,529) (5,679,781) 3,853,879 20,649,863 2,408,674 12,906,164
3 Net Interest Cost (6,394,046) 5,596,053 (3,996,279) 3,497,533 706,844 3,062,614 441,777 1,914,133
4 Total expense recognised in the Statement of Profit or Loss (33,927,246) 1,543,339 (21,204,529) 964,587 14,202,643 25,167,260 8,876,651 15,729,536
NOTES TO THE FINANCIAL STATEMENTS (CONTD.)
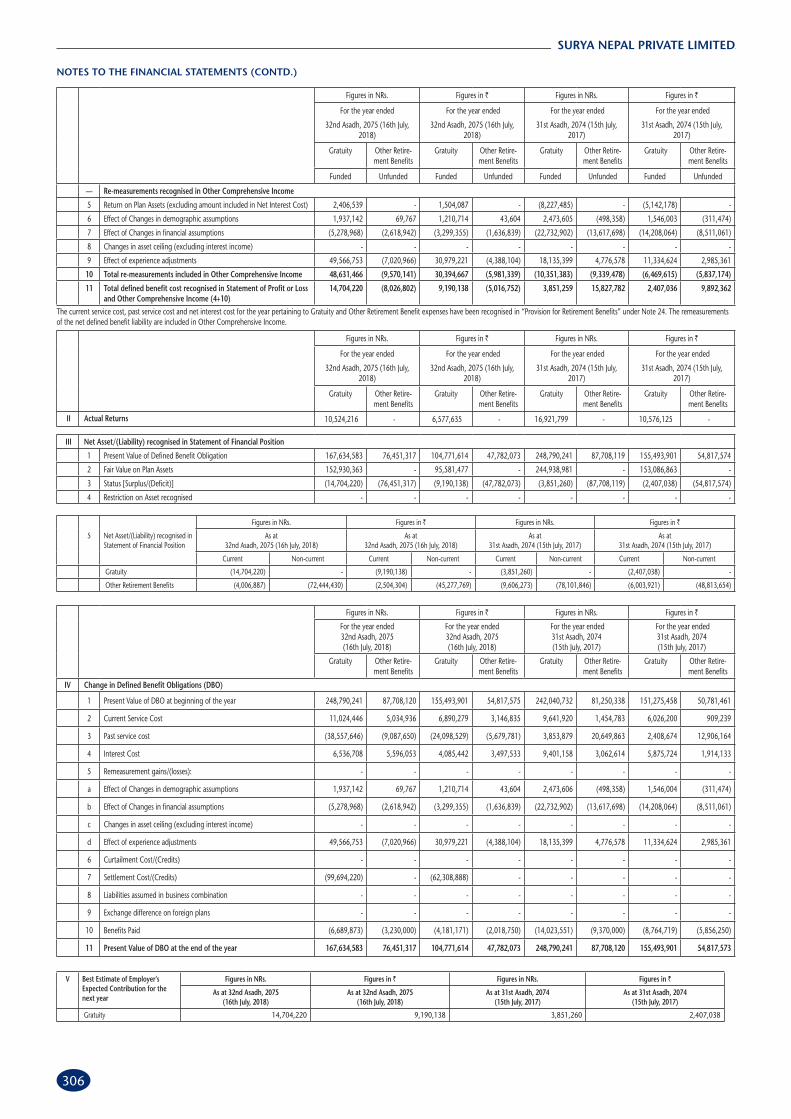
306
SURYA NEPAL PRIVATE LIMITED
NOTES TO THE FINANCIAL STATEMENTS (CONTD.)
Figures in NRs. Figures in ` Figures in NRs. Figures in `
For the year ended
32nd Asadh, 2075 (16th July, 2018)
For the year ended
32nd Asadh, 2075 (16th July, 2018)
For the year ended
31st Asadh, 2074 (15th July, 2017)
For the year ended
31st Asadh, 2074 (15th July, 2017)
Gratuity Other Retire-ment Benefits
Gratuity Other Retire-ment Benefits
Gratuity Other Retire-ment Benefits
Gratuity Other Retire-ment Benefits
Funded Unfunded Funded Unfunded Funded Unfunded Funded Unfunded
— Re-measurements recognised in Other Comprehensive Income
5 Return on Plan Assets (excluding amount included in Net Interest Cost) 2,406,539 - 1,504,087 - (8,227,485) - (5,142,178) -
6 Effect of Changes in demographic assumptions 1,937,142 69,767 1,210,714 43,604 2,473,605 (498,358) 1,546,003 (311,474)
7 Effect of Changes in financial assumptions (5,278,968) (2,618,942) (3,299,355) (1,636,839) (22,732,902) (13,617,698) (14,208,064) (8,511,061)
8 Changes in asset ceiling (excluding interest income) - - - - - - - -
9 Effect of experience adjustments 49,566,753 (7,020,966) 30,979,221 (4,388,104) 18,135,399 4,776,578 11,334,624 2,985,361
10 Total re-measurements included in Other Comprehensive Income 48,631,466 (9,570,141) 30,394,667 (5,981,339) (10,351,383) (9,339,478) (6,469,615) (5,837,174)
11 Total defined benefit cost recognised in Statement of Profit or Loss and Other Comprehensive Income (4+10)
14,704,220 (8,026,802) 9,190,138 (5,016,752) 3,851,259 15,827,782 2,407,036 9,892,362
The current service cost, past service cost and net interest cost for the year pertaining to Gratuity and Other Retirement Benefit expenses have been recognised in “Provision for Retirement Benefits” under Note 24. The remeasurements of the net defined benefit liability are included in Other Comprehensive Income.
Figures in NRs. Figures in ` Figures in NRs. Figures in `
For the year ended
32nd Asadh, 2075 (16th July, 2018)
For the year ended
32nd Asadh, 2075 (16th July, 2018)
For the year ended
31st Asadh, 2074 (15th July, 2017)
For the year ended
31st Asadh, 2074 (15th July, 2017)
Gratuity Other Retire-ment Benefits
Gratuity Other Retire-ment Benefits
Gratuity Other Retire-ment Benefits
Gratuity Other Retire-ment Benefits
II Actual Returns 10,524,216 - 6,577,635 - 16,921,799 - 10,576,125 -
III Net Asset/(Liability) recognised in Statement of Financial Position
1 Present Value of Defined Benefit Obligation 167,634,583 76,451,317 104,771,614 47,782,073 248,790,241 87,708,119 155,493,901 54,817,574
2 Fair Value on Plan Assets 152,930,363 - 95,581,477 - 244,938,981 - 153,086,863 -
3 Status [Surplus/(Deficit)] (14,704,220) (76,451,317) (9,190,138) (47,782,073) (3,851,260) (87,708,119) (2,407,038) (54,817,574)
4 Restriction on Asset recognised - - - - - - - -
Figures in NRs. Figures in ` Figures in NRs. Figures in `
For the year ended32nd Asadh, 2075 (16th July, 2018)
For the year ended32nd Asadh, 2075 (16th July, 2018)
For the year ended 31st Asadh, 2074 (15th July, 2017)
For the year ended 31st Asadh, 2074 (15th July, 2017)
Gratuity Other Retire-ment Benefits
Gratuity Other Retire-ment Benefits
Gratuity Other Retire-ment Benefits
Gratuity Other Retire-ment Benefits
IV Change in Defined Benefit Obligations (DBO)
1 Present Value of DBO at beginning of the year 248,790,241 87,708,120 155,493,901 54,817,575 242,040,732 81,250,338 151,275,458 50,781,461
2 Current Service Cost 11,024,446 5,034,936 6,890,279 3,146,835 9,641,920 1,454,783 6,026,200 909,239
3 Past service cost (38,557,646) (9,087,650) (24,098,529) (5,679,781) 3,853,879 20,649,863 2,408,674 12,906,164
4 Interest Cost 6,536,708 5,596,053 4,085,442 3,497,533 9,401,158 3,062,614 5,875,724 1,914,133
5 Remeasurement gains/(losses): - - - - - - - -
a Effect of Changes in demographic assumptions 1,937,142 69,767 1,210,714 43,604 2,473,606 (498,358) 1,546,004 (311,474)
b Effect of Changes in financial assumptions (5,278,968) (2,618,942) (3,299,355) (1,636,839) (22,732,902) (13,617,698) (14,208,064) (8,511,061)
c Changes in asset ceiling (excluding interest income) - - - - - - - -
d Effect of experience adjustments 49,566,753 (7,020,966) 30,979,221 (4,388,104) 18,135,399 4,776,578 11,334,624 2,985,361
6 Curtailment Cost/(Credits) - - - - - - - -
7 Settlement Cost/(Credits) (99,694,220) - (62,308,888) - - - - -
8 Liabilities assumed in business combination - - - - - - - -
9 Exchange difference on foreign plans - - - - - - - -
10 Benefits Paid (6,689,873) (3,230,000) (4,181,171) (2,018,750) (14,023,551) (9,370,000) (8,764,719) (5,856,250)
11 Present Value of DBO at the end of the year 167,634,583 76,451,317 104,771,614 47,782,073 248,790,241 87,708,120 155,493,901 54,817,573
5 Net Asset/(Liability) recognised in Statement of Financial Position
Figures in NRs. Figures in ` Figures in NRs. Figures in `
As at 32nd Asadh, 2075 (16h July, 2018)
As at 32nd Asadh, 2075 (16h July, 2018)
As at 31st Asadh, 2074 (15th July, 2017)
As at 31st Asadh, 2074 (15th July, 2017)
Current Non-current Current Non-current Current Non-current Current Non-current
Gratuity (14,704,220) - (9,190,138) - (3,851,260) - (2,407,038) -
Other Retirement Benefits (4,006,887) (72,444,430) (2,504,304) (45,277,769) (9,606,273) (78,101,846) (6,003,921) (48,813,654)
V Best Estimate of Employer’s Expected Contribution for the next year
Figures in NRs. Figures in ` Figures in NRs. Figures in `
As at 32nd Asadh, 2075 (16th July, 2018)
As at 32nd Asadh, 2075 (16th July, 2018)
As at 31st Asadh, 2074 (15th July, 2017)
As at 31st Asadh, 2074 (15th July, 2017)
Gratuity 14,704,220 9,190,138 3,851,260 2,407,038

307
SURYA NEPAL PRIVATE LIMITED
Figures in NRs. Figures in ` Figures in NRs. Figures in `
DBO as at 32nd Asadh, 2075 (16th July, 2018)
DBO as at 32nd Asadh, 2075 (16th July, 2018)
DBO as at 31st Asadh, 2074 (15th July, 2017)
DBO as at 31st Asadh, 2074 (15th July, 2017)
1 Discount rate +100 basis points 228,761,662 142,976,039 316,083,307 197,552,067
2 Discount rate -100 basis points 261,290,888 163,306,805 359,696,831 224,810,519
3 Salary Increase Rate +1% 255,649,101 159,780,688 352,369,842 220,231,151
4 Salary Increase Rate -1% 233,618,369 146,011,480 322,245,830 201,403,644 Maturity Analysis Of The Benefit Payments
1 Year 1 44,561,496 27,850,935 41,435,936 25,897,460
2 Year 2 12,988,836 8,118,023 30,474,000 19,046,250
3 Year 3 28,915,897 18,072,436 21,004,778 13,127,986
4 Year 4 22,489,413 14,055,883 32,814,913 20,509,321
5 Year 5 16,706,531 10,441,582 39,533,210 24,708,256
6 Next 5 Years 104,242,691 65,151,682 139,273,951 87,046,219
b. Amounts towards Defined Contribution Plans have been recognised under “Contribution to Provident and Other Funds” in Note 24.
NOTES TO THE FINANCIAL STATEMENTS (Contd.)
Figures in NRs. Figures in ` Figures in NRs. Figures in `
For the year ended32nd Asadh, 2075 (16th July, 2018)
For the year ended32nd Asadh, 2075 (16th July, 2018)
For the year ended 31st Asadh, 2074 (15th July, 2017)
For the year ended 31st Asadh, 2074 (15th July, 2017)
Gratuity Other Retire-ment Benefits
Gratuity Other Retire-ment Benefits
Gratuity Other Retire-ment Benefits
Gratuity Other Retire-ment Benefits
VI Change in Fair Value of Assets
1 Plan Assets at beginning of the year 244,938,981 - 153,086,863 - 189,776,749 - 118,610,468 -
2 Asset acquired in Business Combination - - - - - - - -
3 Interest Income 12,930,754 - 8,081,721 - 8,694,315 - 5,433,947 -
4 Remeasurement Gains/(Losses)on plan assets (2,406,539) - (1,504,087) - 8,227,485 - 5,142,178 -
5 Actual Company Contributions 3,851,260 3,230,000 2,407,038 2,018,750 52,263,983 9,370,000 32,664,989 5,856,250
6 Benefits Paid (106,384,093) (3,230,000) (66,490,058) (2,018,750) (14,023,551) (9,370,000) (8,764,719) (5,856,250)
7 Plan Assets at the end of the year 152,930,363 - 95,581,477 - 244,938,981 - 153,086,863 -
VII Actuarial Assumptions As at 32nd Asadh, 2075 (16th July, 2018)
As at 31st Asadh, 2074 (15th July, 2017)
Discount Rate (%) Discount Rate (%)
Gratuity 7.00% 6.50%
Other Retirement Benefits 7.00% 6.50%
The estimates of future salary increases, considered in actuarial valuations take account of inflation, seniority, promotion and other relevant factors such as supply and demand factors in the employment market.
VIII Major Category of Plan Assets as a % of the Total Plan Assets As at
32nd Asadh, 2075 (16th July, 2018)
As at 31st Asadh, 2074 (15th July, 2017)
1 Citizen Investment Trust Managed Funds* 100% 100%
* In the absence of detailed information regarding plan assets which is funded with Citizen Investment Trust, the composition of each major category of plan assets, the percentage or amount for each category to the fair value of plan assets has not been disclosed.
Figures in NRs. Figures in ` Figures in NRs. Figures in `
For the year ended
32nd Asadh, 2075 (16th July, 2018)
For the year ended
32nd Asadh, 2075 (16th July, 2018)
For the year ended
31st Asadh, 2074 (15th July, 2017)
For the year ended
31st Asadh, 2074 (15th July, 2017)
Gratuity Other Retirement Benefits
Gratuity Other Retirement Benefits
Gratuity Other Retirement Benefits
Gratuity Other Retirement Benefits
X Net Asset / (Liability) recognized in Statement of Financial Position (including experience adjustment impact)
1 Present Value of Defined Benefit Obligation 167,634,583 76,451,317 104,771,614 47,782,073 248,790,241 87,708,119 155,493,901 54,817,574
2 Fair Value on Plan Assets 152,930,363 - 95,581,477 - 244,938,981 - 153,086,863 -
3 Status [Surplus/(Deficit)] (14,704,220) (76,451,317) (9,190,138) (47,782,073) (3,851,260) (87,708,119) (2,407,038) (54,817,574)
4 Experience Adjustment of Plan Assets [ Gain / (loss) ] (2,406,539) - (1,504,087) - 8,227,485 - 5,142,178 -
5 Experience Adjustment of Obligation [ (Gain) / Loss ] 49,566,753 (7,020,966) 30,979,221 (4,388,104) 18,135,399 4,776,578 11,334,624 2,985,361
IX Basis used to determine the Expected Rate of Return on Plan Assets
The expected rate of return on plan assets is based on discount rate set with reference to the yield as communicated by CIT.
XI Sensitivity Analysis
The Sensitivity Analysis below has been determined based on reasonably possible change of the respective assumptions occurring at the end of the reporting period, while holding all other assumptions constant. These sensitivities show the hypothetical impact of a change in each of the listed assumptions in isolation. While each of these sensitivities holds all other assumptions constant, in practice such assumptions rarely change in isolation and the asset value changes may offset the impact to some extent. For presenting the sensitivities, the present value of the Defined Benefit Obligation has been calculated using the projected unit credit method at the end of the reporting period, which is the same as that applied in calculating the Defined Benefit Obligation presented above. There was no change in the methods and assumptions used in the preparation of the Sensitivity Analysis from previous year.

308
SURYA NEPAL PRIVATE LIMITED
NOTES TO THE FINANCIAL STATEMENTS (Contd.)
30. Additional Notes to the Financial Statements
(i) These financial statements were authorised for issue by the Board of Directors on 8th Ashwin 2075 (24th September 2018).
(ii) Cost of inventory recognized as expense during the year amount to NRs. 7,301,927,094 (` 4,563,704,434) [2073/74 – NRs. 7,106,074,538 (` 4,441,296,586)].
(iii) Estimated amount of contracts remaining to be executed on capital account and not provided for NRs. 319,304,103 (` 199,565,064) [2073/74 - NRs. 312,053,970 (` 195,033,731)].
(iv) Remuneration to Managing Director :
Particulars For the year ended32nd Asadh 2075 (16th July 2018)
In NRs.
For the year ended32nd Asadh 2075 (16th July
2018) In `
For the year ended31st Asadh 2074 (15th July 2017)
In NRs.
For the year ended31st Asadh 2074 (15th July 2017)
In `
Salary & Allowances 18,723,021 11,701,888 15,048,970 9,405,606
Other Benefits * 2,461,724 1,538,578 2,245,201 1,403,251
Post Employment Benefits ** ** ** **
Total 21,184,745 13,240,466 17,294,171 10,808,857
Note:
The Managing Director and some other employees of the company have been granted stock options under the Employee Stock Option Scheme of the Holding Compa-ny (ITC Limited). Such options are granted at ‘market price’ [within the meaning of Securities and Exchange Board of India (Share Based Employee Benefit) Regulations, 2014]. Since such options are not tradable, no benefit is conferred upon the employee at the time of grant of options. The Company, however has recorded employee benefits expense by way of share based payments to employees, in accordance with NFRS 2, at NRs 57,193,032 (` 35,745,645) for the year ended 32nd Asadh 2075 [2073/74 – NRs. 51,838,452 ((` 32,399,033)], out of which NRs. 23,177,936 (` 14,486,210) [2073/74 – NRs. 19,714,877 (` 12,321,798)] is attributable to Managing Director. During the year, 25,300 options (2073/74 – 17,600 options) were granted to the Managing Director.
* Other Benefits includes amounts incurred/reimbursed by the Company towards Residential Rent & Maintenance, Fuel & Driver Salary for Vehicle, Vehicle Repairs & Maintenance etc.
** Post employment benefits are actuarially determined on overall basis for all employees.
(v) Miscellaneous Expenses include reimbursement of expenses to statutory auditors amounting to NRs. 156,525 (` 97,828) [2073-74 - NRs. 131,850 (` 82,406)].
(vi) Related Party Disclosures
Nature of relationship and name of the related parties:
1. Holding Company
ITC Limited, India
2. Fellow Subsidiary Companies
a) Srinivasa Resorts Limited, India
b) Fortune Park Hotels Limited, India
c) Bay Islands Hotels Limited, India
d) WelcomHotels Lanka (Private) Limited, Sri Lanka
e) Landbase India Limited, India
f) Russell Credit Limited, India and its subsidiary
Greenacre Holdings Limited, India
g) Technico Pty Limited, Australia and its subsidiaries
Technico Technologies Inc., Canada
Technico Asia Holdings Pty Limited, Australia and its subsidiary
Technico Horticultural (Kunming) Co. Limited, China
h) Technico Agri Sciences Limited, India
i) Wimco Limited, India
j) Pavan Poplar Limited, India
k) Prag Agro Farm Limited, India
l) ITC Infotech India Limited, India and its subsidiaries
ITC Infotech Limited, UK
ITC Infotech (USA), Inc. and its subsidiary
Indivate Inc., USA
m) Gold Flake Corporation Limited, India
n) ITC Investments & Holdings Limited, India and its subsidiary
MRR Trading & Investment Company Limited, India
o) North East Nutrients Private Limited, India
The above list does not include ITC Global Holdings Pte. Limited, Singapore which ceased to be a subsidiary of Holding Company pursuant to its dissolution by High Court of the Republic of Singapore vide order dated 10th July, 2018.
3. Associate of Holding Company
a) Gujarat Hotels Limited, India
b) International Travel House Limited, India
– being associates of the Holding Company, and
c) Tobacco Manufacturers (India) Limited, UK
– of which the Holding Company is an associate
4. Associates of Holding Company’s subsidiaries
a) Russell Investments Limited, India

309
SURYA NEPAL PRIVATE LIMITED
b) Divya Management Limited, India
c) Antrang Finance Limited, India
– being associates of Russell Credit Limited, India and
d) ATC Limited, India
– being associate of Gold Flake Corporation Limited, India
5. Joint Venture of Holding Company
a) Maharaja Heritage Resorts Limited, India
b) Espirit Hotels Private Limited, India
c) Logix Developers Private Limited, India
6. Joint Venture of Holding Company’s Subsidiary
a) ITC Essentra Limited, India
– being joint venture of Gold Flake Corporation Limited, India
7. Key Management Personnel:
S Puri Chairman & Non-Executive Director
S Kaul Alternate Director to Mr. S Puri
B Sumant Non-Executive Director
A K Mukerji Non-Executive Director (ceased w.e.f. 18th July 2018)
S Dutta Non-Executive Director (w.e.f. 18th July 2018)
B B Chatterjee Non-Executive Director (ceased w.e.f. 4th February 2018)
R K Singhi Non-Executive Director (w.e.f. 4th February 2018)
S R Pandey Non-Executive Director
S SJB Rana Non-Executive Director
Saurya SJB Rana Alternate Director to Mr. S. SJB Rana
Abhimanyu Kumar Poddar Managing Director
Disclosure of transactions between the Company and related parties and the status of outstanding balances as at 32nd Asadh, 2075 (16th July, 2018):
Related Party Transactions Summary
For the year ended 32nd Asadh, 2075 (16th July, 2018) In NRs. For the year ended 31st Asadh, 2074 (15th July, 2017) In NRs.
Holding Company Fellow Subsidiaries Key Management Personnel*
Holding Company
Fellow Subsidiaries Key Management Personnel*
Purchase of Goods/ Services 5,213,144,127 60,211,053 – 5,062,789,364 70,674,773 –
Sitting Fees/ Incidental Expenses to Other Directors – – 82,353 – – 94,118
Cost of Stock Option Reimbursable 57,193,032 – – 51,838,452 – –
Machine Hire Charges 59,797,396 – – 73,788,674 – –
Dividend Payments 4,180,881,600 – – 3,544,531,200 – –
Expenses recovered 4,273,790 – – 716,258 – –
Expenses reimbursed 770,975 – – 1,632,323 – –
Advances Given 2,132,642,792 – – 3,254,259,275 – -Outstanding Balances
- Advances / Other Receivables 1,638,774,389 – – 1,985,003,140 – - - Creditors / Payables 491,859,094 21,649,863 – 435,347,986 52,100,937 -
Related Party Transactions SummaryFor the year ended 32nd Asadh, 2075 (16th July, 2018) In ` For the year ended 31st Asadh, 2074 (15th July, 2017) In `
Holding Company Fellow Subsidiaries Key Management Personnel*
Holding Company Fellow Subsidiaries Key Management Personnel*
Purchase of Goods/ Services 3,258,215,079 37,631,908 – 3,164,243,353 44,171,733 –
Sitting Fees/ Incidental Expenses to Other Directors
– – 51,471 – – 58,824
Cost of Stock Option Reimbursable 35,745,645 – – 32,399,033 – –
Machine Hire Charges 37,373,373 – – 46,117,921 – –
Dividend Payments 2,613,051,000 – – 2,215,332,000 – –
Expenses recovered 2,671,119 – – 447,661 – –
Expenses reimbursed 481,859 – – 1,020,202 – –
Advances Given 1,332,901,745 – – 2,033,912,047 – -Outstanding Balances
- Advances / Other Receivables 1,024,233,993 – – 1,240,626,963 – - - Creditors / Payables 307,411,934 13,531,164 – 272,092,491 32,563,086 -
* also refer to Note 30 (iv).
NOTES TO THE FINANCIAL STATEMENTS (Contd.)

310
SURYA NEPAL PRIVATE LIMITED
NOTES TO THE FINANCIAL STATEMENTS (Contd.)
Related Party Transactions Summary
For the year ended 32nd Asadh, 2075 (16th July, 2018) In NRs. For the year ended 31st Asadh, 2074 (15th July, 2017) In NRs.
Associate of Holding Company Joint Venture of Holding Company’s Subsidiary
Associate of Holding Company Joint Venture of Holding Company’s Subsidiary
Purchase of Goods/ Services 3,684,925 921,289 3,256,401 824,942
Outstanding Balances
- Creditors / Payables 7,407 – 10,267 –
Related Party Transactions Summary
For the year ended 32nd Asadh, 2075 (16th July, 2018) In ` For the year ended 31st Asadh, 2074 (15th July, 2017) In `
Associate of Holding Company Joint Venture of Holding Company’s Subsidiary
Associate of Holding Company Joint Venture of Holding Company’s Subsidiary
Purchase of Goods/ Services 2,303,078 575,806 2,035,251 515,589
Outstanding Balances
- Creditors / Payables 4,629 – 6,417 –
(vii) Contingent liabilities:
A Claims against the Company not acknowledged as debts:
a) Demands raised by Revenue Authorities on theoretical production of cigarettes:
Excise, Income Tax and Value Added Tax (VAT) authorities issued Show Cause Notices (SCNs) and raised demands to recover taxes for different years on the-oretical production of cigarettes. The basis for all these SCNs and demands is an untenable contention by the Revenue Authorities that the Company could have produced more cigarettes than it has actually produced in a given year, by applying an input-output ratio allegedly submitted by the Company in the year 2047-48 (1990-91) and, that, the Company is liable to pay taxes on such cigarettes that could have been theoretically produced and sold. This, despite the fact that the Company’s cigarette factory was under ‘physical control’ of the Excise authorities and cigarettes produced are duly accounted for and certified as such by the Revenue Authorities.
The above basis of theoretical production has been rejected by the Supreme Court of Nepal vide its orders dated 29th October 2009 and 1st April 2010. In the said order of the Supreme Court of Nepal dated 1st April 2010, the Excise demands {(for the financial years 2055-56 to 2059-60 (1998-99 to 2002-03)} and Income Tax demands {for the financial year 2058-59 (2001-02)} were set aside. Citing the aforesaid decisions of the Supreme Court of Nepal, the Inland Revenue Department, on 11th February 2011 and 12th August 2013 decided the following administrative review petitions in favour of the Company relating to theoretical production:
(i) Value Added Tax - NRs. 190,142,762 (` 118,839,226) for the financial years 2058-59 and 2064-65 (2001-02 and 2007-08).
(ii) Income Tax - NRs. 49,070,474 (` 30,669,046) for the financial year 2062-63 (2005-06).
The Company’s counsel appearing in the matter has opined that the verdict of the Supreme Court of Nepal dated 29th October 2009, which was delivered by a Full Bench of the Court, will add substantial strength to Company’s case in all the other matters relating to the issue of theoretical production.
Following is the status of pending demands and Show Cause Notices received from the Revenue Authorities based on similar untenable contention:
Excise Demands and Show Cause Notice
1. Excise demand letter dated 22nd February 2008 for NRs. 149,515,509 (` 93,447,193) relating to the financial years 2060-61 to 2062-63 (2003-04 to 2005-06). The Company’s writ petition, challenging the demand, has been admitted by the Supreme Court of Nepal on 2nd April 2008 and it has issued Show Cause Notices to the respondents.
2. Excise demand letter dated 30th November 2008 for NRs. 128,510,757 (` 80,319,223) relating to the financial year 2063-64 (2006-07). The Company’s writ petition, challenging the demand, has been admitted by the Supreme Court of Nepal on 6th January 2009 and it has issued Show Cause Notices to the respondents.
3. Show Cause Notice dated 19th January 2010 seeking to demand NRs. 196,537,807 (` 122,836,129) by way of Excise Duty for the financial year 2064-65 (2007-08). Company’s writ petition challenging the Notice was admitted by the Supreme Court of Nepal. On 7th March 2010, Supreme Court of Nepal issued interim order directing Inland Revenue Department not to raise demand, pending final disposal of the writ petition.
VAT Demands
4. VAT demand letter dated 8th August 2007 for NRs. 57,238,860 (` 35,774,288) relating to the financial year 2059-60 (2002-03). The Company’s writ petition, challenging the demand, has been admitted by the Supreme Court of Nepal on 12th September 2007 and it has issued Show Cause Notices to the respondents.
5. VAT demand letter dated 5th August 2008 for NRs. 10,718,107 (` 6,698,817) relating to the financial year 2060-61 (2003-04). The Company’s writ petition, challenging the demand, has been admitted by the Supreme Court of Nepal on 5th September 2008 and it has issued Show Cause Notices to the respondents.
6. VAT demand letter dated 10th July 2009, for NRs. 106,966,056 (`66,853,785) relating to the financial years 2061-62 to 2063-64 (2004-05 to 2006-07). The Company’s writ petition, challenging the demand, has been admitted by the Supreme Court of Nepal on 9th August 2009 and it has issued Show Cause Notices to the respondents.
Income Tax Demands
7. Income Tax demand letter dated 12th August 2007 for NRs. 196,092,971 (` 122,558,107) relating to the financial year 2059-60 (2002-03). The Com-pany’s writ petition, challenging the demand, has been admitted by the Supreme Court of Nepal on 12th September 2007 and it has issued Show Cause Notices to the respondents.

311
SURYA NEPAL PRIVATE LIMITED
NOTES TO THE FINANCIAL STATEMENTS (Contd.)
8. Income Tax demand letter dated 15th September 2008 for the financial year 2060-61 (2003-04). Out of total demand of NRs. 22,536,944 (` 14,085,590),
the basis of the demand for NRs. 19,139,653 (` 11,962,283) is on theoretical production. The Company’s writ petition, challenging the demand, has
been admitted by the Supreme Court of Nepal on 8th December 2008 and it has issued Show Cause Notices to the respondents.
9. Income Tax demand letter dated 16th October 2009 for the financial year 2061-62 (2004-05). Out of a total demand of NRs. 22,626,609 (` 14,141,631),
the basis of the demand for NRs. 21,565,409 (` 13,478,381) is on theoretical production. The Company filed an administrative review petition before
the Director General, Inland Revenue Department on 18th December 2009. The Director General without dealing with the issues raised by the Company,
summarily dismissed the petition by an order dated 2nd March 2010. The Company thereafter filed an appeal before the Revenue Tribunal, on 17th June
2010. The Revenue Tribunal, vide its order dated 9th July 2012 (received by the Company on 2nd November 2012), directed Director General, Inland
Revenue Department to reassess the case. The Director General appealed to the Supreme Court of Nepal for admission of the case against the decision
of the Revenue Tribunal. The Supreme Court admitted the case on 11th March 2016. The matter has been heard on 12th February 2018 and order is
reserved.
The Management considers that all the demands and show cause notice listed above have no legal or factual basis. Accordingly, the Management is of
the view that there is no liability that is likely to arise, particularly in the light of the decisions in favour of the Company by the Supreme Court of Nepal
and the Inland Revenue Department.
b) Other demands raised on account of:
1. Income Taxes for various assessment years amounting to NRs. 275,972,010 (` 172,482,506) [2073/74 - NRs. 305,122,168 (` 190,701,355)] (net of
provision made for the above assessment years) including interest on claims, where applicable, estimated to be NRs. 54,789,780 (` 34,243,613) [2073/74
- NRs. 158,466,607 (` 99,041,629)] against which the Company has filed appeals with the appropriate authorities/Courts.
2. Value Added Tax matters under dispute, pertaining to various financial years amounting to NRs. 32,752,830 (` 20,470,519) [2073/74 - NRs. 28,772,109
(` 17,982,568)] including interest on claims, where applicable, estimated to be NRs. 6,895,973 (` 4,309,983) [2073-74 - NRs. 5,551,856 (` 3,469,910)]
which are under appeal / reassessment.
(viii) The Company’s significant leasing arrangements are in respect of operating leases for building premises (residential, office, godowns, etc.). These leasing arrange-
ments which are not non-cancellable range between 1 year and 3 years generally, or longer, and are usually renewable by mutual consent on mutually agreeable
terms. The aggregate lease rentals payable are charged as ‘Rent’ under Note 25 - Manufacturing, Selling and Administrative Expenses, etc.
(ix) Some of the employee(s) of the Company seconded from the Holding Company (ITC Limited), have been granted stock options under the ITC Employees Stock
Option Scheme (ITC ESOS). These options vest over a period of three years from the date of grant and are exercisable within a period of five years from the date of
vesting. Each option entitles the holder thereof to apply for and be allotted ten Ordinary Shares of ITC of Indian Rupee 1 each inter alia upon payment of exercise
price.
These options have been granted at ‘market price’ within the meaning of Securities and Exchange Board of India (Share Based Employee Benefit) Regulations,
2014. The fair value of the options granted is determined by ITC, using the Black Scholes Option Pricing Model, for all the options covered under the ITC ESOS as
a whole.
The Company has recognized the cost of options granted, as stated above, under the ITC Employee Stock Option Scheme (ITC ESOS) (equity - settled) in
accordance with NFRS 2 – Share Based Payment and the Company’s share of the cost of fair value of such options has been accounted for based on the advice /
on-charge by ITC. Accordingly, an amount of NRs. 57,193,032 (` 35,745,645) [2073/74 – NRs. 51,838,452 (` 32,399,033)] (Refer Note 24) which represents the
on-charge from ITC has been recognized as employee benefits expense with a corresponding payable, when such reimbursement is sought by ITC.
The details of such options granted by ITC and status of the outstanding options is as under:
Particulars 2074/75 (2017/18) 2073/74 (2016/17)
No. of Options No. of Options
Outstanding at the beginning of the year 373,733 220,040
Add: Granted during the year 63,490 48,450
Add: Corporate Action: Bonus by ITC - 128,429
Add / (Less): Movement due to transfer of employees within group (33,290) 36,820
Less: Exercised during the year 44,830 60,006
Outstanding at the end of the year 359,103 373,733
Options exercisable at the end of the year 242,345 247,303
(x) Figures have been rounded off to the nearest Nepalese Rupee.
31. Financial Instruments and Related Disclosures
1. Capital Management
The primary objective of the company’s capital management is to maximize the shareholder value. The Company aims at maintaining a strong capital base and augments its internal generations with a judicious use of borrowing facilities to fund spikes in working capital that arise from time to time as well as requirements to finance business growth. The Company monitors the return on capital employed based own asset turnover and profitability ratio.
The Company is not subject to any capital adequacy norms under regulations presently in force.

312
SURYA NEPAL PRIVATE LIMITED
NOTES TO THE FINANCIAL STATEMENTS (Contd.)
Parti
cular
sN
ote
Amou
nt in
NRs
.Am
ount
in `
Amou
nt in
NRs
.Am
ount
in `
As a
t 32n
d As
adh
2075
(1
6th
July
201
8)As
at 3
2nd
Asad
h 20
75
(16t
h Ju
ly 2
018)
As a
t 31s
t Asa
dh 2
074
(1
5th
July
201
7)As
at 3
1st A
sadh
207
4 (1
5th
July
201
7)Ca
rryin
g Va
lue
Fair
Valu
eCa
rryin
g Va
lue
Fair
Valu
eCa
rryin
g Va
lue
Fair
Valu
eCa
rryin
g Va
lue
Fair
Valu
e
A. F
inan
cial a
sset
s
a) M
easu
red
at a
mor
tised
cos
t
i) Ca
sh a
nd C
ash
Equi
valen
ts11
49,
757,
833
49,
757,
833
31,
098,
646
31,
098,
646
337
,726
,550
3
37,7
26,5
50
211
,079
,093
2
11,0
79,0
93
ii) O
ther
Ban
k Ba
lance
s12
6,0
90,0
65,9
63
6,0
90,0
65,9
63
3,8
06,2
91,2
27
3,8
06,2
91,2
27
2,9
00,0
64,1
29
2,9
00,0
64,1
29
1,8
12,5
40,0
81
1,8
12,5
40,0
81
iii) In
vestm
ents
4A, 4
B 2
5,63
2,33
8 2
2,62
5,00
0 1
6,02
0,21
1 1
4,14
0,62
5 2
5,63
2,33
8 2
3,25
3,41
9 1
6,02
0,21
1 1
4,53
3,38
7 iv)
Loa
ns
5 3
7,91
4,94
0 2
6,39
7,92
2 2
3,69
6,83
8 1
6,49
8,70
1 4
6,24
1,64
6 3
0,75
1,62
2 2
8,90
1,02
9 1
9,21
9,76
4 v)
Tra
de R
eceiv
ables
10 6
8,55
6,48
5 6
8,55
6,48
5 4
2,84
7,80
3 4
2,84
7,80
3 7
7,25
5,35
0 7
7,25
5,35
0 4
8,28
4,59
4 4
8,28
4,59
4 vi)
Oth
er F
inan
cial a
sset
s6
30,
385,
160
30,
176,
593
18,
990,
726
18,
860,
371
26,
138,
491
26,
138,
491
16,
336,
557
16,
336,
557
Sub
- tot
al 6
,302
,312
,719
6
,287
,579
,796
3
,938
,945
,451
3
,929
,737
,373
3
,413
,058
,504
3
,395
,189
,561
2
,133
,161
,565
2
,121
,993
,476
b)
Der
ivat
ives
mea
sure
d at
fair
valu
e
i) De
rivat
ive in
strum
ents
not
desig
nate
d as
he
dgin
g in
strum
ents
6 1
,130
,019
1
,130
,019
7
06,2
62
706
,262
6
24,2
76
624
,276
3
90,1
73
390
,173
Sub
- tot
al 1
,130
,019
1
,130
,019
7
06,2
62
706
,262
6
24,2
76
624
,276
3
90,1
73
390
,173
T
otal
fina
ncia
l ass
ets
6,3
03,4
42,7
38
6,2
88,7
09,8
15
3,9
39,6
51,7
13
3,9
30,4
43,6
35
3,4
13,6
82,7
80
3,3
95,8
13,8
37
2,1
33,5
51,7
38
2,1
22,3
83,6
49
B. F
inan
cial l
iabi
litie
s
a) M
easu
red
at a
mor
tised
cos
t
i) Bo
rrow
ings
15 1
,128
,051
,870
1
,128
,051
,870
7
05,0
32,4
19
705
,032
,419
-
- -
- ii)
Tra
de P
ayab
les16
820
,376
,602
8
20,3
76,6
02
512
,735
,377
5
12,7
35,3
77
833
,732
,775
8
33,7
32,7
75
521
,082
,984
5
21,0
82,9
84
iii) O
ther
fina
ncial
liab
ilities
17 1
,575
,473
,689
1
,575
,473
,689
9
84,6
71,0
57
984
,671
,057
1
,221
,220
,832
1
,221
,220
,832
7
63,2
63,0
21
763
,263
,021
Su
b - t
otal
3,5
23,9
02,1
61
3,5
23,9
02,1
61
2,2
02,4
38,8
53
2,2
02,4
38,8
53
2,0
54,9
53,6
07
2,0
54,9
53,6
07
1,2
84,3
46,0
05
1,2
84,3
46,0
05
b) D
eriv
ativ
es m
easu
red
at fa
ir va
lue
i) De
rivat
ive in
strum
ents
not
desig
nate
d as
he
dgin
g in
strum
ents
17 8
35,2
86
835
,286
5
22,0
54
522
,054
9
12,2
91
912
,291
5
70,1
82
570
,182
Sub
- tot
al 8
35,2
86
835
,286
5
22,0
54
522
,054
9
12,2
91
912
,291
5
70,1
82
570
,182
To
tal fi
nanc
ial l
iabi
litie
s 3
,524
,737
,447
3
,524
,737
,447
2
,202
,960
,907
2
,202
,960
,907
2
,055
,865
,898
2
,055
,865
,898
1
,284
,916
,187
1
,284
,916
,187
2.
Cate
gorie
s of F
inan
cial I
nstr
umen
ts

313
SURYA NEPAL PRIVATE LIMITED
3. Financial risk management objectives
The Company’s activities expose it to a variety of financial risks, including market risk, credit risk and liquidity risk. The Company continues to focus on a system-based approach to risk management. The Company’s financial risk management process seeks to enable the early identification, evaluation and effective management of key risks facing the business. Backed by strong internal control systems, the current Risk Management framework is based on comprehensive internal policies and procedures across areas of operations. The Company has a process of regular reviews / audits for monitoring of such risks.
a) Market risk
Market risk comprises of foreign currency risk and interest rate risk.
i. Foreign currency risk
The Company undertakes transactions denominated in foreign currency (mainly US Dollar, Euro and GBP) which are subject to the risk of exchange rate fluctuations. Financial assets and liabilities denominated in foreign currency (other than Indian Rupee) are subject to reinstatement risks.
The carrying amounts of foreign currency denominated financial assets and liabilities including derivatives contracts are as follows:
(Amount in NRs.)
As at 32nd Asadh, 2075 (16th July 2018) USD EURO GBP Total
Financial Assets 8,920,415 – – 8,920,415
Financial Liabilities 48,150,002 – – 48,150,002
(Amount in `)
As at 32nd Asadh, 2075 (16th July 2018) USD EURO GBP Total
Financial Assets 5,575,259 – – 5,575,259
Financial Liabilities 30,093,751 – – 30,093,751
(Amount in NRs.)
As at 31st Asadh, 2074 (15th July 2017) USD EURO GBP Total
Financial Assets 8,358,420 – – 8,358,420
Financial Liabilities 54,203,455 565,497 14,685 54,783,637
(Amount in `)
As at 31st Asadh, 2074 (15th July 2017) USD EURO GBP Total
Financial Assets 5,224,013 – – 5,224,013
Financial Liabilities 33,877,159 353,436 9,178 34,239,773
The Company uses derivatives, such as forward exchange contracts, to manage the business risk arising out of the underlying foreign currency transactions, which serves as an economic hedge. Such forward exchange contracts that were outstanding on respective reporting dates are as follows:
(Amount in Foreign Currency)
Currency Cross Currency As at 32nd Asadh, 2075
(16th July 2018)
Buy
As at 31st Asadh, 2074
(15th July 2017)
Buy
US Dollar NRs 898,825 845,340
Euro NRs 20,782 245,818
GBP NRs 1,910 -
Hedges of Foreign currency risk and derivative financial instruments
The Company uses derivatives to hedge its exposure to changes in movement in foreign currency. Where such derivatives are not designated under hedge accounting and changes in the fair value of such hedges are recognised in the Statement of Profit or Loss and Other Comprehensive Income. The counter parties in these derivative instruments are highly rated commercial banks and the Company considers the risk of non-performance by such counter parties as not material.
Foreign currency sensitivity
As the foreign currency risk on the Statement of Financial Position date is not significant, no sensitivity disclosures have been made.
ii. Interest rate risk
The objectives of the Company’s interest rate risk management processes are to lessen the impact of adverse interest rate movements on its statement of profit or loss and other comprehensive income and cash flows and to minimise counter party risks.
The Company is exposed to interest rate risk primarily with respect to its short terms borrowings from banks to fund spikes in working capital that arise from time to time. Such risks arise primarily due to changes in money supply within the economy and/or liquidity in banking system. In view of the short term nature of such borrowings, impact of such interest rate risk is insignificant.
The Company’s investments are predominantly held in Fixed Deposits. Such deposits are held with highly rated commercial banks and have a short term tenure and are not subject to interest rate volatility. The Company ensures optimisation of cash through fund planning and robust cash management practices.
Counter party risk is managed by operating with highly rated commercial banks.
b) Liquidity risk
The Company manages its liquidity risk by ensuring that it will always have sufficient liquidity to meet its liabilities when due. The Company’s investment decisions relating to deployment of surplus liquidity are guided by the tenets of safety, liquidity and return. The Company also maintains adequate credit lines with the commercial banks to fund spikes in working capital that arise from time to time.
NOTES TO THE FINANCIAL STATEMENTS (Contd.)

314
SURYA NEPAL PRIVATE LIMITED
NOTES TO THE FINANCIAL STATEMENTS (Contd.)
The Company’s Current assets aggregate to NRs. 12,238,499,572 (` 7,649,062,234) [2073/74 – NRs. 7,770,552,420 (` 4,856,595,263)] including Cash and cash equivalents and Other bank balances of NRs. 6,139,823,796 (` 3,837,389,873) [2073/74 – NRs. 3,237,790,679 (` 2,023,619,174)] against an aggregate Current liability (excluding borrowings) of NRs. 3,460,851,311 (` 2,163,032,075) [2073/74 – NRs. 3,079,050,777 (` 1,924,406,734)] on the reporting date.
Further, while the Company’s total equity stands at NRs. 14,367,060,246 (` 8,979,412,652) [2073/74 – NRs. 12,303,490,023 (` 7,689,681,267)], it has borrowings of NRs. 1,128,051,870 (` 705,032,419) [2073/74 – NRs. Nil (` Nil)]. In such circumstances, liquidity risk or the risk that the Company may not be able to settle or meet its obligations as they become due does not exist.
c) Credit risk
The Company’s short term surpluses are deployed in fixed and call deposits with highly rated commercial banks. The investment in fixed and call deposits stood at NRs. 6,114,446,005 (` 3,821,528,753) [2073/74 – NRs. 3,230,932,330 (` 2,019,332,706)] at amortised cost. The commercial banks for placement of such deposits are short listed and exposure limits are determined on the basis of their credit rating, financial statements and other relevant information which are periodically reviewed.
The Company has policy of dealing on cash terms, to the extent practicable. Credit is extended in business interest in accordance with guidelines which takes into account various factors such as market feedback, past trading patterns, etc. The Company during the course of its operations deals with a large number of customers limiting the risk of credit concentration. The Company’s exposure to trade receivables on the reporting date, net of expected loss provisions stood at NRs. 68,556,485 (` 42,847,803) [2073/74 – NRs. 77,255,350 (` 48,284,594)]. The Company’s historical experience of collecting receivables and the level of default indicate that the credit risk is low. Loss allowances are recognized, where considered appropriate by the Management. The movement of the expected loss provision (allowance for bad and doubtful loans and receivables etc.) made by the Company are as under:
(Amount in NRs.)
Particulars Expected Loss Provision
32nd Asadh 2075 (16th July 2018) 31st Asadh 2074 (15th July 2017)
Opening Balance 2,420,835 2,430,251
Add: Provisions Made - Net (11,010) (9,416)
Less: Utilisation for impairment / de-recognition - -
Closing Balance 2,409,825 2,420,835
(Amount in `)
Particulars Expected Loss Provision
32nd Asadh 2075 (16th July 2018) 31st Asadh 2074 (15th July 2017)
Opening Balance 1,513,022 1,518,907
Add: Provisions Made - Net (6,881) (5,885)
Less: Utilisation for impairment / de-recognition - -
Closing Balance 1,506,141 1,513,022
4. Fair value measurement
The following table presents the fair value hierarchy of financial assets and liabilities measured at fair value on a recurring basis:
ParticularsFair Value Hierarchy
(Level)
Amount in NRs. Amount in ` Amount in NRs. Amount in `
Fair Value Fair Value Fair Value Fair Value
As at32nd Asadh 2075(16th July 2018)
As at32nd Asadh 2075(16th July 2018)
As at31st Asadh 2074(15th July 2017)
As at31st Asadh 2074(15th July 2017)
A. Financial Assets
a) Measured at amortised cost
i) Investment in Government Bonds 2 22,625,000 14,140,625 23,253,419 14,533,387
ii) Loans* 3 19,093,150 11,933,219 21,072,364 13,170,228
iii) Other Financial Assets* 3 672,258 420,161 - -
Sub-Total 42,390,408 26,494,005 44,325,783 27,703,615
b) Derivatives measured at fair value
i) Derivative instruments not designated as hedging instruments
2 1,130,019 706,262 624,276 390,173
Sub-Total 1,130,019 706,262 624,276 390,173
Total financial assets 43,520,427 27,200,267 44,950,059 28,093,788
B. Financial liabilities
a) Derivatives measured at fair value
i) Derivative instruments not designated as hedging instruments
2 835,286 522,054 912,291 570,182
Total financial liabilities 835,286 522,054 912,291 570,182
* Represents Fair Value of Non-current Financial Instruments.

315
SURYA NEPAL PRIVATE LIMITED
Vikas Bhutra Abhimanyu Kumar Poddar Saurya SJB Rana B Sumant S Puri Head of Finance Managing Director Alternate Director Director Chairman S R Pandey S Dutta R K Singhi Nem Lal Amatya Shashi Satyal Director Director Director Partner Partner N. Amatya & Co. T R Upadhya & Co.Date: : 8th Ashwin 2075 (24th September 2018) Chartered Accountants Chartered Accountants
NOTES TO THE FINANCIAL STATEMENTS (Contd.)
Fair value hierarchy
Fair value of the financial instruments is classified in various fair value hierarchies based on the following three levels:
Level 1: Quoted prices (unadjusted) in active market for identical assets or liabilities.
Level 2: Inputs other than quoted price including within level 1 that are observable for the asset or liability, either directly (i.e. as prices) or indirectly (i.e. derived from prices). The fair value of financial instruments that are not traded in an active market is determined using market approach and valuation techniques which maximize the use of observable market data and rely as little as possible on entity-specific estimates. If significant inputs required to fair value an instrument are observable, the instrument is included in Level 2.
Derivatives are valued using valuation techniques with market observable inputs such as foreign exchange spot rates and forward rates at the end of the reporting period.
Level 3: Inputs for the assets or liabilities that are not based on observable market data (unobservable inputs).
The fair value of trade receivables, trade payables and other current financial assets and liabilities is considered to be equal to the carrying amounts of these items due to their short term nature. Where such items are Non-current in nature, the same has been classified as Level 3 and fair value is determined using discounted cash flow basis.
There has been no change in the valuation methodology for Level 3 inputs during the year. The Company has not classified any material financial instruments under Level 3 of the fair value hierarchy. There were no transfers between Level 1 and Level 2 during the year.