survival and population growth of a long-lived threatened snake
TRANSCRIPT
ORIGINAL ARTICLE
Survival and population growth of a long-lived threatened snakespecies, Drymarchon couperi (Eastern Indigo Snake)
Natalie L. Hyslop • Dirk J. Stevenson • John N. Macey •
Lawrence D. Carlile • Chris L. Jenkins •
Jeffrey A. Hostetler • Madan K. Oli
Received: 6 June 2010 / Accepted: 27 September 2011
� The Society of Population Ecology and Springer 2011
Abstract Demographic data provide a basis for under-
standing the life history and ecology of species, factors
which are vital for informing conservation efforts;
however, little is known regarding the population ecology
of most snake species, including the threatened Eastern
Indigo Snake (Drymarchon couperi). We used 11 years
(1999–2009) of capture-mark-recapture (CMR) and
2.5 years (2003–2005) of radiotelemetry data from south-
eastern Georgia, USA, in a CMR modeling framework to
estimate apparent survival, capture and transition proba-
bilities, and evaluate factors influencing these parameters.
The model-averaged estimate of overall apparent annual
survival probability was 0.700 (±0.030 SE) and is com-
parable to that obtained from known fate analysis (radio-
telemetry) at the same site. Body size positively influenced
survival, regardless of sex. Capture probability differed
seasonally by sex, suggesting lower capture probability for
females in fall and males in winter. There was no evidence
for effect of precipitation or site-specific differences
in survival. Model averaged estimate of annual adult
survival estimated using multistate CMR models was
0.738 ± 0.030 and 0.515 ± 0.189 for subadults. We esti-
mated population growth rate (k) and elasticity (propor-
tional sensitivity) of k to vital rates using a stage-structured
matrix population model. Population growth rate ranged
from 0.96 to 1.03 depending on the value of the probability
of transitioning from subadult to adult stage. The k was
proportionally most sensitive to changes in adult survival
rate, followed by subadult survival. Our results suggest that
protecting adult snakes and their habitats would result in
the highest likelihood of long-term population stability and
growth.
Keywords AIC � Capture-mark-recapture (CMR)
models � Elasticity analysis � Multistate CMR models �Sensitivity analysis � Stage-based matrix population model
Introduction
Detailed and reliable demographic data provide a basis for
understanding the life history and ecology of a species,
factors which are vital for informing conservation efforts
(Dodd 1987, 1993; Stanford and King 2004). Demographic
analyses also allow the determination of influential life
history variables on population growth, and the pattern of
these influences. These data, however, are often difficult to
obtain for certain taxa, including most snake species
(Parker and Plummer 1987). This is in part because of the
lack of interest historically in the group (Dodd 1993), their
secretive and cryptic nature (Fitch 1987), long periods of
inactivity, and often relatively low densities (Parker and
Plummer 1987). Snakes, however, may constitute impor-
tant components of ecosystems, in terms of local biomass,
and as predators (Godley 1980; Fitch 1999).
Electronic supplementary material The online version of thisarticle (doi:10.1007/s10144-011-0292-3) contains supplementarymaterial, which is available to authorized users.
N. L. Hyslop (&) � J. A. Hostetler � M. K. Oli
Department of Wildlife Ecology and Conservation,
University of Florida, 324 Newins-Ziegler Hall,
Gainesville, FL 32611, USA
e-mail: [email protected]
D. J. Stevenson � C. L. Jenkins
The Orianne Society, 579 Highway 441 South,
Clayton, GA 30525, USA
D. J. Stevenson � J. N. Macey � L. D. Carlile
Fort Stewart Directorate of Public Works Fish and Wildlife
Branch, United States Army, Ft. Stewart, GA 31314, USA
123
Popul Ecol
DOI 10.1007/s10144-011-0292-3
Drymarchon couperi (Eastern Indigo Snake), federally
listed as threatened since 1978 (United States Fish and
Wildlife Service 1978), has been the focus of recent
research and conservation efforts across its range in the
southeastern United States. A large, up to 2.63 m (Conant
and Collins 1998), nonvenomous colubrid, D. couperi is a
diurnal, active-foraging species that preys on a wide array
of vertebrates, especially other snakes (Stevenson et al.
2010). Breeding occurs from October to March (Groves
1960; Speake et al. 1978; Steiner et al. 1983), a period when
the snakes are primarily associated with sandhill habitats.
Gestation lasts 100–150 days (Smith 1987; O’Connor
1991) and a single clutch of 4–12 relatively large eggs
(37–89 g) is laid in May and June (Moulis 1976; Steiner
et al. 1983; Moler 1985; Speake et al. 1987) which hatch
after approximately 3 months (Groves 1960; Smith 1987).
Drymarchon couperi exhibits male-biased sexual size
dimorphism, annual reproduction, and a delayed age at
sexual maturity [(3–4 years) Speake et al. 1978; Stevenson
et al. 2009]. Throughout much of its range, the species is
closely associated with xeric sand ridge communities
(sandhills), especially during the fall-winter breeding sea-
son where D. couperi is often found in association with the
burrows of Gopherus polyphemus [(Gopher Tortoise)
Speake et al. 1978; Landers and Speake 1980; Speake and
McGlincy 1981]. Tortoise burrows are used as protection
from environmental extremes, fire, and predators (Speake
et al. 1978; Landers and Speake 1980; Speake and McGl-
incy 1981; Hyslop et al. 2009a). Additionally, foraging,
nesting, ecdysis and potentially mating may occur in or near
the burrows (Landers and Speake 1980; Stevenson et al.
2009; Hyslop et al. 2009a). Intact longleaf pine (Pinus
palustris) and wiregrass (Aristida stricta) sandhills used by
D. couperi have experienced precipitous declines, with less
than 3% of their pre-European colonization area remaining
(Landers et al. 1995; Frost 2006). Conservation and resto-
ration of these varied habitats requires detailed knowledge
of the ecology of multiple species reliant on these systems.
Despite the conservation importance of D. couperi,
multiple radiotelemetry studies (Speake et al. 1978; Moler
1985; Smith 1987; Breininger et al. 2004; Dodd and
Barichivich 2007; Hyslop 2007; Hyslop et al. 2009a), and
mark-recapture efforts (Layne and Steiner 1996; Stevenson
et al. 2003), little is known regarding demographic
parameters or population trends of D. couperi (Breininger
et al. 2004) primarily because of difficulties in obtaining
adequate sample sizes. Since Federal listing of D. couperi,
there is evidence of ongoing declines which are largely
attributable to declining tortoise populations and habitat
alteration caused primarily by development, fire suppres-
sion, commercial forestry practices, and agriculture (Uni-
ted States Fish and Wildlife Service 1978, 2008; Stevenson
2006). Here, we use 11-year capture-mark-recapture
(CMR) and 2.5 years of radiotelemetry data collected in
southeastern Georgia in a CMR modeling approach to
estimate demographic parameters and to evaluate factors
influencing these parameters. Our specific objectives were
to: (1) estimate adult and subadult apparent survival and
transition probability for D. couperi at two adjacent study
sites in southeastern Georgia; (2) test hypotheses regarding
the influence of intrinsic (sex, body size, year, season) and
extrinsic factors (precipitation, site of capture) on demo-
graphic parameters; and (3) estimate population growth
rate, and evaluate the proportional sensitivity of population
growth rate to demographic parameters.
Methods
Study area
Data for this study were collected by surveying annually for
snakes at tortoise burrows on xeric sandhills at Fort Stewart
Military Instillation (FSMI; 113,064 ha total area) and
adjacent private lands located in the Coastal Plain of south-
eastern Georgia, USA. Because of differences in land use and
habitat management histories, xeric sandhill communities on
both Fort Stewart and private land study sites varied with
respect to vegetation, and included: intact, mature longleaf
pine–turkey oak–wiregrass habitat; young (5–15 years) to
medium (16–40 years) age slash (Pinus elliottii) or loblolly
(Pinus taeda) pine plantations; recently restored (i.e., for-
merly in slash or loblolly pine plantations that were clearcut)
longleaf pine–wiregrass habitats. Fire-maintained (i.e.,
open-canopied) and fire-suppressed (i.e., more close-cano-
pied) examples of both the first and second types above were
present on both Fort Stewart and private land sites. Xeric
sandhills at both sites were interspersed with mesic pine
flatwoods, mixed pine–oak forests, bottomland hardwood
habitats, and wetlands (including isolated depressional
wetlands, blackwater creek swamps, seepage-influenced bay
swamps, and impoundments; Wharton 1978). Recent (1990–
present) habitat management practices at the Fort Stewart
sites (i.e., prescribed burns, selective thinning, longleaf pine
planting, wiregrass seeding, and control of xerophytic oaks
via herbicide application) have promoted or enhanced open-
canopied longleaf pine habitats. Management activities on
private land included some of the same methods as Fort
Stewart, but many areas were fire-suppressed and not
actively managed, or managed for timber production, pri-
marily loblolly pine and slash pine, and game species [i.e.,
Odocoileus virginianus (white-tailed deer), Meleagris gal-
lopavo (wild turkey), and Colinus virginianus (northern
bobwhite)].
Although both study sites consisted of multiple isolated
sandhills where snake surveys were conducted, for the
Popul Ecol
123
purpose of analysis, we consider the areas within the study
sites contiguous due to the ability of the snakes to travel
between these discrete areas (Hyslop 2007). Further details
of habitats and land use are available elsewhere (Stevenson
et al. 2003, 2009; Hyslop 2007).
Data collection
Systematic CMR studies of D. couperi were conducted
annually from 1999 to 2009 over 11 consecutive field
seasons at both Fort Stewart and private lands from
October through March (Stevenson et al. 2009) at eight
sandhills (6 on FSMI; 2 on private lands) that ranged in
size from 15 to 307 ha (x = 136 ha). The survey period
corresponded to the period when snakes showed their
lowest average movement distance per day (except Octo-
ber), smallest seasonal home ranges, and highest use of
sandhill habitats and tortoise burrows annually (Diemer
and Speake 1983; Hyslop 2007; Hyslop et al. 2009a),
allowing for more reliable capture of individuals than
during warmer months. CMR data were collected by two
research groups, one on Fort Stewart from 1999 to 2009
(Stevenson et al. 2003, 2009) and the other on private lands
from 2003 to 2009 (M. Wallace, personal communication).
In addition, a radiotelemetry study was conducted from
2003 to 2005 at both study sites (n = 32 individuals;
Hyslop et al. 2009a). CMR surveys were conducted between 5
and 50 days per year and snakes were primarily captured
by hand. Large snake traps along drift fences were also
installed at both sites from 2003 to 2004, resulting in five
subadult and one adult D. couperi capture (Hyslop et al.
2009b). At capture, snakes were sexed, weighed, measured
[snout-vent length (SVL)], and marked with a passive
integrated transponder (PIT) for individual identification
(Stevenson et al. 2003, 2009). Snakes were typically pro-
cessed on-site, or in the laboratory before being released
(maximum 24–72 h later) at site of capture. Further details
regarding field methods are available in Stevenson et al.
(2009).
Estimation of, and factors influencing, demographic
parameters
For CMR analysis, captures were delineated into two,
3-month sampling occasions: October through December
and January through March, roughly equivalent to fall and
winter, respectively. The two sampling occasions were
followed by a 6 month period when snakes were not
actively sampled because of annual dispersal from and
reduced use of upland sandhill habitats where the snakes
overwintered (Hyslop 2007; Hyslop et al. 2009a). Years
were delineated from 1 June of year t to 31 May of year
t ? 1 (hereafter, ‘‘sampling year’’).
To estimate demographic parameters and factors influ-
encing these parameters, we first used Cormack–Jolly–
Seber (CJS; Cormack 1964; Jolly 1965; Seber 1965)
models to estimate overall apparent survival (/) and to
examine hypotheses regarding effects of factors on survival
and capture probability (q). Secondly, we used multistate
CMR to obtain estimate of subadult and adult survival
along with transition probability from subadult to adult
stage. Sample size limitations precluded hypothesis testing
using the multistate modeling approach.
We first tested for the influence of monitoring method
(telemetry or CMR) on snake survival using CJS, but found
no evidence that apparent survival differed between snakes
monitored by different methods. Since the number of
snakes monitored by telemetry was small (n = 32) and no
differences were detected in survival, we pooled snakes for
further analysis. We also tested for effects of standardized
body size and compared this to effects of unstandardized
body size using CJS models. The slope parameter (b) for
both models was positive and estimated 95% CIs did not
span zero; however, the model including the effect of
unstandardized body size was 1.5 times more likely than
the model including standardized body size. We therefore
retained unstandardized body size for further modeling
efforts.
The data were insufficient to support a fully time-
dependent CJS model; we therefore constructed the most
parameterized model with B2 inestimable parameters for
bootstrap goodness of fit testing (Shine and Bonnet 2009)
using Program MARK (500 iterations; White and Burnham
1999). This model included an additive effect of time
(year) and grouping variable (sex) for survival; and an
interactive effect of year and sex for capture probability.
The estimated c was 0.822, indicating no lack of fit or
overdispersion of data; thus, no quasilikelihood or variance
inflation factor correction was necessary.
We examined a priori hypotheses regarding the influ-
ence of year, season, sex, and body size (SVL). We pre-
dicted that apparent survival would be positively
influenced by body size, with larger individuals experi-
encing higher survival, regardless of sex, because of size
and experience-related advantages. Patterns found in snake
survival suggest generally that larger adults have a higher
survival probability than smaller adults (Jayne and Bennett
1990; Blouin-Demers et al. 2002). We also expected that
survival would vary seasonally, with lower probability of
survival in winter compared to fall, in part because of
lower temperatures and also because snakes in winter were
commonly observed with lower body mass and varying
degrees of infection by a vesicular skin disease (T.M.
Norton, unpublished data). We predicted that survival
would be lower for females because of increased energetic
needs for reproduction, increased exposure during
Popul Ecol
123
gestation (Shine and Bonnet 2009; Hyslop et al. 2009a),
and because the species exhibits male-biased sexual size
dimorphism (Layne and Steiner 1996; Stevenson et al.
2009) potentially leading to size-based survival advanta-
ges. Although we did not have a biological reason to sus-
pect changes in overall apparent survival over the course of
the study, we did consider that experience-based
improvement in snake detection by observers could posi-
tively influence capture probability over time. We used an
information-theoretic approach, based on Akaike Infor-
mation Criterion corrected for small sample size (AICc),
for model comparison and statistical inferences concerning
the effects of covariates on apparent survival and capture
probabilities (Akaike 1973; Burnham and Anderson 2002;
Williams et al. 2002).
To examine effects of extrinsic factors on survival we
examined the effects of measures of precipitation and site
of capture on survival using the top CJS model as the base
model for testing. There were several years with total
annual rainfall that deviated substantially from the previous
24-year average coinciding with a protracted drought
experienced in southeastern Georgia. From 1985 to 2009
average annual rainfall, as calculated per sampling year,
was 119.4 cm (±5.39 SE). Between 1999 and 2009, four
sampling years had significantly lower rainfall totals than
the average for the proceeding 24 years (dry; x = 81.3 cm/
sampling year ± 6.75). We expected lower survival in
sampling years characterized by dry conditions or years
following dry conditions because of expected effects on
prey availability (e.g., snakes, amphibians, small mam-
mals; Stevenson et al. 2010).
For all models, capture probability for the telemetry
group was constrained to 1 because of the reliability of
resighting these individuals. The unequal sampling regime
(i.e., 2, 3-month sampling occasions separated by 1,
6-month period) was incorporated into model design. We
calculated model-averaged estimates of survival and cap-
ture probability to account for uncertainty in model
selection using reduced model sets with the parameter of
interest (Burnham and Anderson 2002). We implemented
CJS models in Program MARK v. 6.1 (White and Burnham
1999) using RMark interface v. 1.9.1 (Laake and Rexstad
2007). Results are average ± SE.
Estimation of population growth rate (k) and sensitivity
of k to demographic parameters
We used a female only, post-breeding census stage-struc-
tured matrix population model (Caswell 2001) for demo-
graphic analyses. We used a 1-year projection interval and
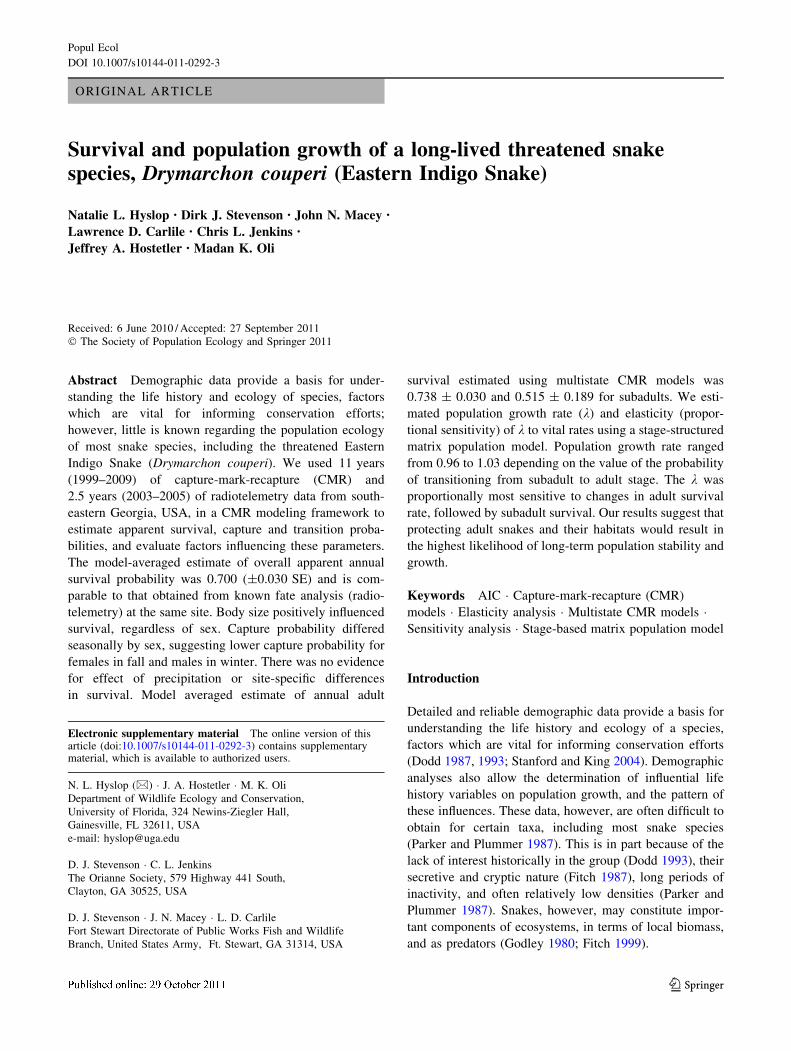
three stages based on the life history of the species (Fig. 1).
The first stage represented hatchlings (ca. 0–3 months of
age) and juveniles (ca. 4–12 months) and stage duration
was constrained to 1 year. We combined hatchlings and
juveniles into one stage because of the paucity of infor-
mation on these stages. Stage two included non-breeding
subadults B120 cm SVL likely in their second and third
years. Stage three represented adult females [120 cm
SVL. The population projection matrix (A) took the form:
A ¼0 P2w2m3 P3m3
PhPj P2 1 � w2ð Þ 0
0 P2w2 P3
24
35
where wi is the transition probability from stage i to stage
i ? 1 conditional on survival, Pi is the survival rate of
stage i, and mi is the fecundity of stage i. Survival for stage
one was estimated as the product of hatchling survival
(Ph/3 months) and juvenile survival (Pj/9 months;
P1 = Ph 9 Pj; Table 1).
We used multistate CMR analysis (Brownie et al. 1993;
Nichols and Kendall 1995; Williams et al. 2002) to esti-
mate P2 (apparent survival probability for subadults), P3
(apparent survival probability for adults), and W (proba-
bility of transitioning from subadult to adult state, condi-
tional on survival). Drymarchon couperi reach maturation
at approximately 110 cm SVL regardless of sex (Speake
et al. 1978; Layne and Steiner 1996; Stevenson et al. 2009).
Because of some uncertainty in this value and the low
sample size of subadults, we used 120 cm to delineate
subadults from adults. Sampling occasions and data struc-
ture were similar to that used for CJS analysis. We allowed
apparent survival probability to be state-specific, and fixed
capture probability to vary by sex and season as in the top
ranked CJS model. We set transition probabilities from
adult to subadult state to 0 and from adult to adult state to
1. The multistate CMR analyses were implemented in
Program MARK v. 6.1 (White and Burnham 1999) using
RMark interface v. 1.9.1 (Laake and Rexstad 2007).
Data on reproductive parameters of free-ranging
D. couperi, however, are sparse. Therefore, we used data
summarized from studies of captive snakes, field observa-
tions, and published accounts (Smith 1987; Speake et al.
1 32
P1 P2 P3
G1 G2
F3
F2
Fig. 1 Life cycle graph for female Drymarchon couperi. Numbersrepresent stages in the life cycle: 1 first year, 2 subadult [B120 cm
snout-vent length (SVL)]; 3 adult ([120 cm SVL). Arrows indicate
the probability of surviving and remaining in the same stage (P),
probability of surviving and growing to next stage (G), and fertility
(F)
Popul Ecol
123

1987; Breininger et al. 2004; Stevenson et al. 2009) to pro-
vide reasonable starting estimates of reproductive parame-
ters. Drymarchon couperi is oviparous; wild females lay a
single clutch of 4–12 relatively large eggs (x = 9) from April
to June which hatch after approximately 3 months (Moulis
1976; Steiner et al. 1983; Moler 1985; Speake et al. 1987;
F. Antonio, personal communication; J. Godwin, personal
communication). Sexual maturity may be reached in
2–4 years (Speake et al. 1987; Stevenson et al. 2009;
F. Antonio, personal communication) and females are
potentially capable of annual reproduction (Speake et al.
1987; Hyslop et al. 2009c). Longevity estimates from wild
populations are [10 years (Stevenson et al. 2009), with
[25 years reported in captive individuals (Bowler 1977;
J. Godwin, personal communication).
Hatchling and juvenile survival estimates were derived
from a telemetry study on captive-reared hatchling and
juvenile D. couperi (Smith 1987). Although stage two
individuals were pre-reproductive, some of the individuals
survived and grew to stage three during the projection
interval; thus, fertility rate for stage two was calculated as
P2w2m3. We estimated the fertility of stage three as the
product of survival and fecundity rates for this stage.
Fecundity was estimated as the product of average clutch
size divided by 2 (assuming a 1:1 hatchling sex ratio;
Moulis 1976; Parker and Plummer 1987), nest survival,
hatching rate, and probability that a female would breed in
a given year (breeding probability). We found no data on
hatching rate (proportion of eggs that successfully hatch) or
nest survival (probability that a nest survives until hatch-
ing) in natural habitats; thus, we used a range of values for
these parameters based on our knowledge of snake ecology
and data from captive breeding programs. Hatching rate
and clutch size were estimated from several captive
breeding programs where gravid snakes were taken from
the wild and eggs were reared in captivity (Speake et al.
1987; J. Godwin, personal communication; R. Redmond,
personal communication). For hatching rate, we reduced
our estimate by 0.1 from that reported to provide a more
conservative estimate for wild individuals. Estimated val-
ues of demographic parameters are presented in Table 1.
Most subadult snakes in our sample were likely
1.25–2.5 years in age when initially marked and in their
second or third winters. This relative lack of smaller su-
badults in the sample likely biased our estimate of w2 high.
Therefore, we ran models with a range of w2 values
between 0.5 and 0.99 for comparative purposes.
We estimated the asymptotic population growth rate (k)
as the dominant eigenvalue of the population projection
matrix (Caswell 2001). Elasticity, or proportional sensi-
tivity, of k (de Kroon et al. 2000) to entries of the popu-
lation projection matrix and to lower-level vital rates (i.e.,
hatchling survival, clutch size, breeding probability) was
calculated using methods described in detail by Caswell
(2001). Because we did not have estimates of variance for
all demographic parameters, we were unable to calculate
variance for k in a reasonable manner. We used Matlab
(version 7.9.0, Mathworks, Inc., Natick, MA, USA) for all
matrix model calculations.
Results
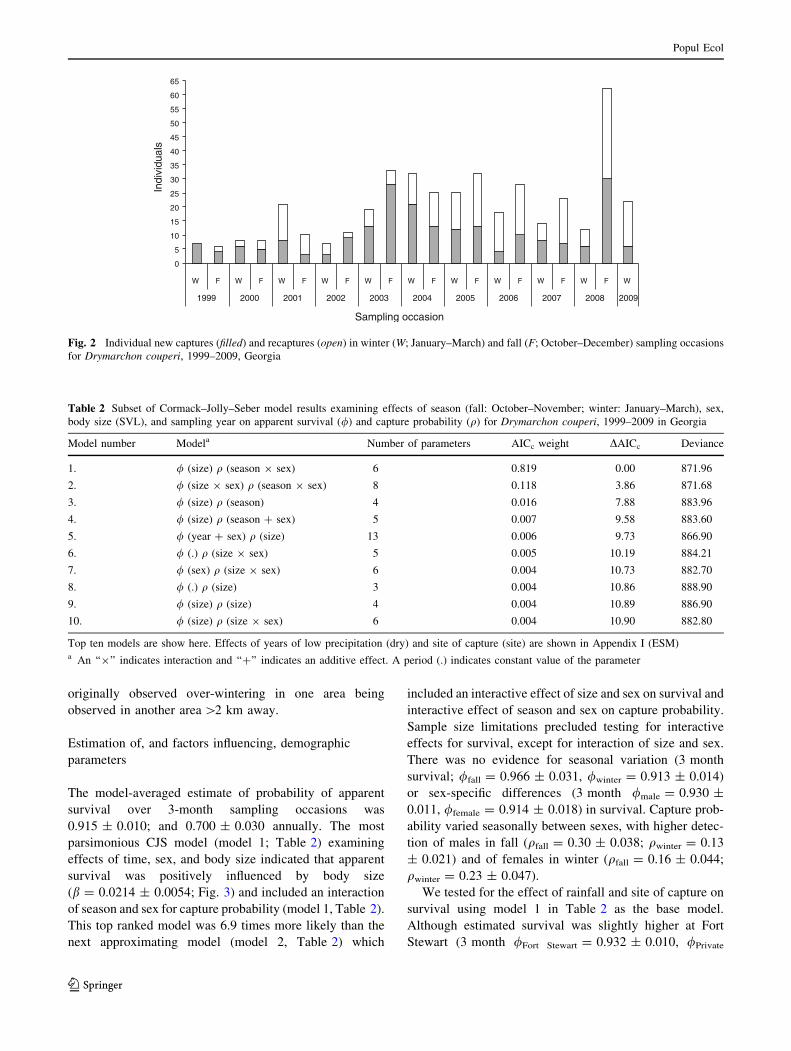
From October 1999 to March 2009, there were 278 cap-
tures of 132 individuals (94 males, 38 females; 2.5:1 sex
ratio) at Fort Stewart. On the private lands, there were 159
captures of 92 individuals (61 Males, 31 females; 2:1 sex
ratio) between January 2003 and March 2009 (Fig. 2;
M. Wallace, personal communication). Average female
SVL was 139.9 cm (±1.91) and 155.9 cm (±2.14) for
males. The data set included 33 subadults ranging from 50
to 120 cm SVL, and 191 adults ranging from 121 to
197 cm. There were 123 individuals with only one capture
(including 24 subadults); however, there was little bio-
logical evidence to suggest that snakes caught only once
were necessarily transient. From the CMR and telemetry
data, there were only four instances (all males) of a snake
Table 1 Average vital rates and transition probabilities (±SE where
available) for Drymarchon couperi used in deterministic matrix pop-
ulation model
Rate Estimate (SE) Lower Upper
Hatchling survivala (Ph) 0.49 0.05 0.90
Juvenile survivalb (Pj) 0.59 0.05 0.90
Subadult survivalc (Ps) 0.52 (0.20) 0.16 0.85
Adult survivalc (Pa) 0.74 (0.03) 0.52 0.89
Clutch size 4.75 3.00 6.00
Nest survival 0.75 0.25 0.95
Hatching rate 0.75 0.25 0.95
Breeding probability 0.75 0.50 0.95
Transition from stage 1–2 (w1) 1.00 1.00 1.00
Transition from stage 2–3 (w2) 0.99 (0.01) 0.50 1.00
Upper and lower values were used in simulations. Subadult and adult
survival and transition from stage two to three were estimated from
multistate CMR analysis presented here (standard errors in parenthe-
ses). Hatchling and juvenile survival were estimated from a telemetry
study on free-ranging, captive reared individuals (Smith 1987). Clutch
size and hatching rate were estimated from captive breeding efforts
where wild females were brought to captivity and laid eggs. We
estimated breeding probability from field observations and informa-
tion from captive programs suggesting annual breeding is likely in the
species. See text for further detailsa Hatchling survival over 3 month periodb Juvenile survival over 9 month periodc Annual survival
Popul Ecol
123
originally observed over-wintering in one area being
observed in another area [2 km away.
Estimation of, and factors influencing, demographic
parameters
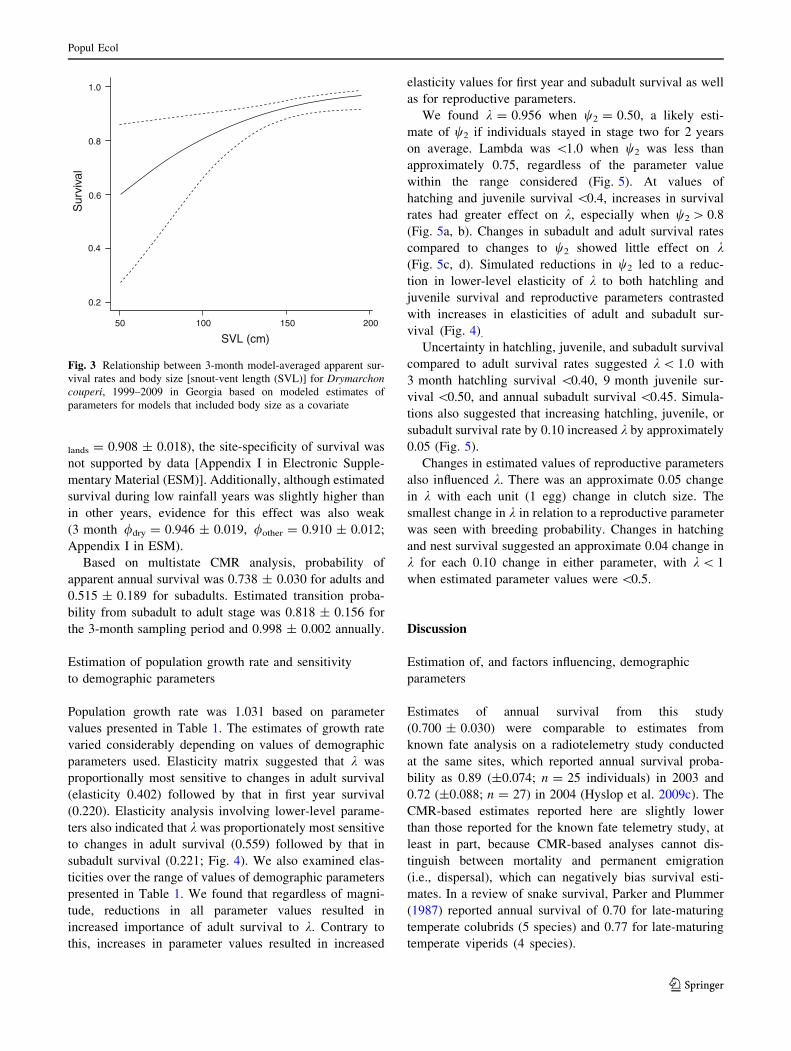
The model-averaged estimate of probability of apparent
survival over 3-month sampling occasions was
0.915 ± 0.010; and 0.700 ± 0.030 annually. The most
parsimonious CJS model (model 1; Table 2) examining
effects of time, sex, and body size indicated that apparent
survival was positively influenced by body size
(b = 0.0214 ± 0.0054; Fig. 3) and included an interaction
of season and sex for capture probability (model 1, Table 2).
This top ranked model was 6.9 times more likely than the
next approximating model (model 2, Table 2) which
included an interactive effect of size and sex on survival and
interactive effect of season and sex on capture probability.
Sample size limitations precluded testing for interactive
effects for survival, except for interaction of size and sex.
There was no evidence for seasonal variation (3 month
survival; /fall = 0.966 ± 0.031, /winter = 0.913 ± 0.014)
or sex-specific differences (3 month /male = 0.930 ±
0.011, /female = 0.914 ± 0.018) in survival. Capture prob-
ability varied seasonally between sexes, with higher detec-
tion of males in fall (qfall = 0.30 ± 0.038; qwinter = 0.13
± 0.021) and of females in winter (qfall = 0.16 ± 0.044;
qwinter = 0.23 ± 0.047).
We tested for the effect of rainfall and site of capture on
survival using model 1 in Table 2 as the base model.
Although estimated survival was slightly higher at Fort
Stewart (3 month /Fort Stewart = 0.932 ± 0.010, /Private
0
5
10
15
20
25
30
35
40
45
50
55
60
65
W F W F W F W F W F W F W F W F W F W F W
1999 2000 2001 2002 2003 2004 2005 2006 2007 2008 2009
Indi
vidu
als
Sampling occasion
Fig. 2 Individual new captures (filled) and recaptures (open) in winter (W; January–March) and fall (F; October–December) sampling occasions
for Drymarchon couperi, 1999–2009, Georgia
Table 2 Subset of Cormack–Jolly–Seber model results examining effects of season (fall: October–November; winter: January–March), sex,
body size (SVL), and sampling year on apparent survival (/) and capture probability (q) for Drymarchon couperi, 1999–2009 in Georgia
Model number Modela Number of parameters AICc weight DAICc Deviance
1. / (size) q (season 9 sex) 6 0.819 0.00 871.96
2. / (size 9 sex) q (season 9 sex) 8 0.118 3.86 871.68
3. / (size) q (season) 4 0.016 7.88 883.96
4. / (size) q (season ? sex) 5 0.007 9.58 883.60
5. / (year ? sex) q (size) 13 0.006 9.73 866.90
6. / (.) q (size 9 sex) 5 0.005 10.19 884.21
7. / (sex) q (size 9 sex) 6 0.004 10.73 882.70
8. / (.) q (size) 3 0.004 10.86 888.90
9. / (size) q (size) 4 0.004 10.89 886.90
10. / (size) q (size 9 sex) 6 0.004 10.90 882.80
Top ten models are show here. Effects of years of low precipitation (dry) and site of capture (site) are shown in Appendix I (ESM)a An ‘‘9’’ indicates interaction and ‘‘?’’ indicates an additive effect. A period (.) indicates constant value of the parameter
Popul Ecol
123
lands = 0.908 ± 0.018), the site-specificity of survival was
not supported by data [Appendix I in Electronic Supple-
mentary Material (ESM)]. Additionally, although estimated
survival during low rainfall years was slightly higher than
in other years, evidence for this effect was also weak
(3 month /dry = 0.946 ± 0.019, /other = 0.910 ± 0.012;
Appendix I in ESM).
Based on multistate CMR analysis, probability of
apparent annual survival was 0.738 ± 0.030 for adults and
0.515 ± 0.189 for subadults. Estimated transition proba-
bility from subadult to adult stage was 0.818 ± 0.156 for
the 3-month sampling period and 0.998 ± 0.002 annually.
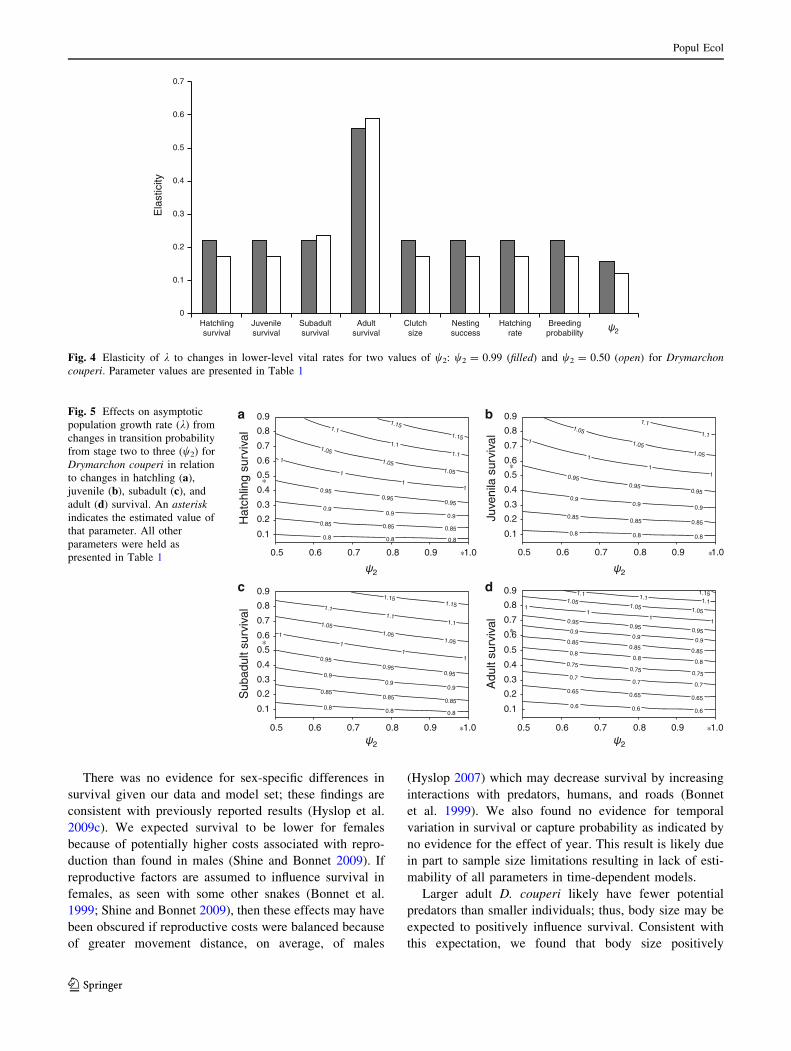
Estimation of population growth rate and sensitivity
to demographic parameters
Population growth rate was 1.031 based on parameter
values presented in Table 1. The estimates of growth rate
varied considerably depending on values of demographic
parameters used. Elasticity matrix suggested that k was
proportionally most sensitive to changes in adult survival
(elasticity 0.402) followed by that in first year survival
(0.220). Elasticity analysis involving lower-level parame-
ters also indicated that k was proportionately most sensitive
to changes in adult survival (0.559) followed by that in
subadult survival (0.221; Fig. 4). We also examined elas-
ticities over the range of values of demographic parameters
presented in Table 1. We found that regardless of magni-
tude, reductions in all parameter values resulted in
increased importance of adult survival to k. Contrary to
this, increases in parameter values resulted in increased
elasticity values for first year and subadult survival as well
as for reproductive parameters.
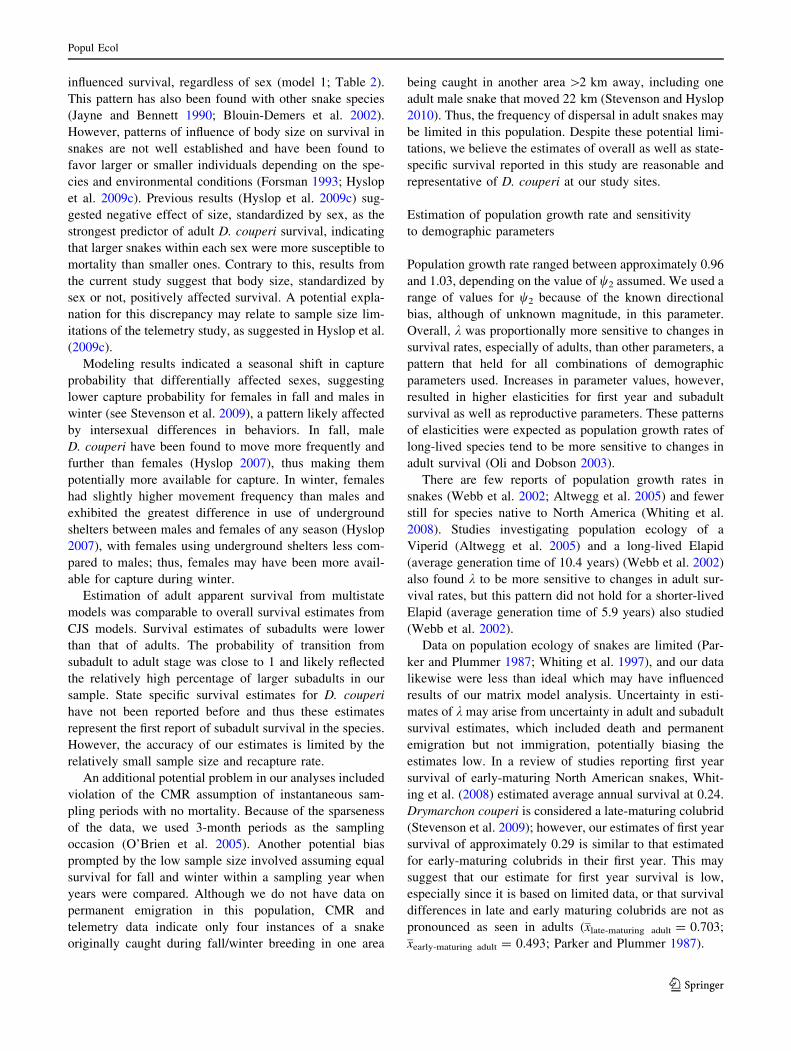
We found k = 0.956 when w2 = 0.50, a likely esti-
mate of w2 if individuals stayed in stage two for 2 years
on average. Lambda was \1.0 when w2 was less than
approximately 0.75, regardless of the parameter value
within the range considered (Fig. 5). At values of
hatching and juvenile survival \0.4, increases in survival
rates had greater effect on k, especially when w2 [ 0.8
(Fig. 5a, b). Changes in subadult and adult survival rates
compared to changes to w2 showed little effect on k(Fig. 5c, d). Simulated reductions in w2 led to a reduc-
tion in lower-level elasticity of k to both hatchling and
juvenile survival and reproductive parameters contrasted
with increases in elasticities of adult and subadult sur-
vival (Fig. 4).
Uncertainty in hatchling, juvenile, and subadult survival
compared to adult survival rates suggested k\ 1.0 with
3 month hatchling survival \0.40, 9 month juvenile sur-
vival \0.50, and annual subadult survival \0.45. Simula-
tions also suggested that increasing hatchling, juvenile, or
subadult survival rate by 0.10 increased k by approximately
0.05 (Fig. 5).
Changes in estimated values of reproductive parameters
also influenced k. There was an approximate 0.05 change
in k with each unit (1 egg) change in clutch size. The
smallest change in k in relation to a reproductive parameter
was seen with breeding probability. Changes in hatching
and nest survival suggested an approximate 0.04 change in
k for each 0.10 change in either parameter, with k\ 1
when estimated parameter values were \0.5.
Discussion
Estimation of, and factors influencing, demographic
parameters
Estimates of annual survival from this study
(0.700 ± 0.030) were comparable to estimates from
known fate analysis on a radiotelemetry study conducted
at the same sites, which reported annual survival proba-
bility as 0.89 (±0.074; n = 25 individuals) in 2003 and
0.72 (±0.088; n = 27) in 2004 (Hyslop et al. 2009c). The
CMR-based estimates reported here are slightly lower
than those reported for the known fate telemetry study, at
least in part, because CMR-based analyses cannot dis-
tinguish between mortality and permanent emigration
(i.e., dispersal), which can negatively bias survival esti-
mates. In a review of snake survival, Parker and Plummer
(1987) reported annual survival of 0.70 for late-maturing
temperate colubrids (5 species) and 0.77 for late-maturing
temperate viperids (4 species).
200 150 100 50
0.6
0.2
0.4
0.8
1.0 S
urvi
val
SVL (cm)
Fig. 3 Relationship between 3-month model-averaged apparent sur-
vival rates and body size [snout-vent length (SVL)] for Drymarchoncouperi, 1999–2009 in Georgia based on modeled estimates of
parameters for models that included body size as a covariate
Popul Ecol
123
There was no evidence for sex-specific differences in
survival given our data and model set; these findings are
consistent with previously reported results (Hyslop et al.
2009c). We expected survival to be lower for females
because of potentially higher costs associated with repro-
duction than found in males (Shine and Bonnet 2009). If
reproductive factors are assumed to influence survival in
females, as seen with some other snakes (Bonnet et al.
1999; Shine and Bonnet 2009), then these effects may have
been obscured if reproductive costs were balanced because
of greater movement distance, on average, of males
(Hyslop 2007) which may decrease survival by increasing
interactions with predators, humans, and roads (Bonnet
et al. 1999). We also found no evidence for temporal
variation in survival or capture probability as indicated by
no evidence for the effect of year. This result is likely due
in part to sample size limitations resulting in lack of esti-
mability of all parameters in time-dependent models.
Larger adult D. couperi likely have fewer potential
predators than smaller individuals; thus, body size may be
expected to positively influence survival. Consistent with
this expectation, we found that body size positively
0
0.1
0.2
0.3
0.4
0.5
0.6
0.7
Hatchlingsurvival
Juvenilesurvival
Subadultsurvival
Adultsurvival
Clutchsize
Nestingsuccess
Hatchingrate
Breedingprobability
Ela
stic
ity
Fig. 4 Elasticity of k to changes in lower-level vital rates for two values of w2: w2 = 0.99 (filled) and w2 = 0.50 (open) for Drymarchoncouperi. Parameter values are presented in Table 1
1.11.1
1.1
11
1
1
0.8 0.8 0.8
0.850.85 0.85
0.90.9
0.9
0.950.95
0.95
1.051.05
1.05
1.151.15
0.5
0.6
0.7
0.8
0.9
0.4
0.3
0.2
0.1
0.5 0.6 0.7 0.8 0.9 1.0
c
∗
∗
Sub
adul
t sur
viva
l
0.850.85
0.80.8
0.8
0.85 0.9
0.90.9
0.95
0.950.95
1.11.1
1.1
11
1
1
0.6 0.6 0.6
0.65 0.65 0.65
0.70.7 0.7
0.750.75 0.75
1.051.05 1.05
1.15
Adu
lt su
rviv
al
d
∗
∗
∗
1.1
1.1
1.1
1
11
1
0.8 0.8 0.8
0.85 0.85 0.85
0.90.9 0.9
0.950.95
0.95
1.05
1.051.05
1.15
1.15
Hat
chlin
g su
rviv
al
a
∗
1.1
1.1
1
11
1
0.8 0.8 0.8
0.850.85 0.85
0.90.9 0.9
0.950.95
0.95
1.05
1.051.05
Juve
nila
sur
viva
l
b
∗
∗0.5
0.6
0.7
0.8
0.9
0.4
0.3
0.2
0.1
0.5
0.6
0.7
0.8
0.9
0.4
0.3
0.2
0.1
0.5
0.6
0.7
0.8
0.9
0.4
0.3
0.2
0.1
0.5 0.6 0.7 0.8 0.9 1.0
0.5 0.6 0.7 0.8 0.9 1.00.5 0.6 0.7 0.8 0.9 1.0
Fig. 5 Effects on asymptotic
population growth rate (k) from
changes in transition probability
from stage two to three (w2) for
Drymarchon couperi in relation
to changes in hatchling (a),
juvenile (b), subadult (c), and
adult (d) survival. An asteriskindicates the estimated value of
that parameter. All other
parameters were held as
presented in Table 1
Popul Ecol
123
influenced survival, regardless of sex (model 1; Table 2).
This pattern has also been found with other snake species
(Jayne and Bennett 1990; Blouin-Demers et al. 2002).
However, patterns of influence of body size on survival in
snakes are not well established and have been found to
favor larger or smaller individuals depending on the spe-
cies and environmental conditions (Forsman 1993; Hyslop
et al. 2009c). Previous results (Hyslop et al. 2009c) sug-
gested negative effect of size, standardized by sex, as the
strongest predictor of adult D. couperi survival, indicating
that larger snakes within each sex were more susceptible to
mortality than smaller ones. Contrary to this, results from
the current study suggest that body size, standardized by
sex or not, positively affected survival. A potential expla-
nation for this discrepancy may relate to sample size lim-
itations of the telemetry study, as suggested in Hyslop et al.
(2009c).
Modeling results indicated a seasonal shift in capture
probability that differentially affected sexes, suggesting
lower capture probability for females in fall and males in
winter (see Stevenson et al. 2009), a pattern likely affected
by intersexual differences in behaviors. In fall, male
D. couperi have been found to move more frequently and
further than females (Hyslop 2007), thus making them
potentially more available for capture. In winter, females
had slightly higher movement frequency than males and
exhibited the greatest difference in use of underground
shelters between males and females of any season (Hyslop
2007), with females using underground shelters less com-
pared to males; thus, females may have been more avail-
able for capture during winter.
Estimation of adult apparent survival from multistate
models was comparable to overall survival estimates from
CJS models. Survival estimates of subadults were lower
than that of adults. The probability of transition from
subadult to adult stage was close to 1 and likely reflected
the relatively high percentage of larger subadults in our
sample. State specific survival estimates for D. couperi
have not been reported before and thus these estimates
represent the first report of subadult survival in the species.
However, the accuracy of our estimates is limited by the
relatively small sample size and recapture rate.
An additional potential problem in our analyses included
violation of the CMR assumption of instantaneous sam-
pling periods with no mortality. Because of the sparseness
of the data, we used 3-month periods as the sampling
occasion (O’Brien et al. 2005). Another potential bias
prompted by the low sample size involved assuming equal
survival for fall and winter within a sampling year when
years were compared. Although we do not have data on
permanent emigration in this population, CMR and
telemetry data indicate only four instances of a snake
originally caught during fall/winter breeding in one area
being caught in another area [2 km away, including one
adult male snake that moved 22 km (Stevenson and Hyslop
2010). Thus, the frequency of dispersal in adult snakes may
be limited in this population. Despite these potential limi-
tations, we believe the estimates of overall as well as state-
specific survival reported in this study are reasonable and
representative of D. couperi at our study sites.
Estimation of population growth rate and sensitivity
to demographic parameters
Population growth rate ranged between approximately 0.96
and 1.03, depending on the value of w2 assumed. We used a
range of values for w2 because of the known directional
bias, although of unknown magnitude, in this parameter.
Overall, k was proportionally more sensitive to changes in
survival rates, especially of adults, than other parameters, a
pattern that held for all combinations of demographic
parameters used. Increases in parameter values, however,
resulted in higher elasticities for first year and subadult
survival as well as reproductive parameters. These patterns
of elasticities were expected as population growth rates of
long-lived species tend to be more sensitive to changes in
adult survival (Oli and Dobson 2003).
There are few reports of population growth rates in
snakes (Webb et al. 2002; Altwegg et al. 2005) and fewer
still for species native to North America (Whiting et al.
2008). Studies investigating population ecology of a
Viperid (Altwegg et al. 2005) and a long-lived Elapid
(average generation time of 10.4 years) (Webb et al. 2002)
also found k to be more sensitive to changes in adult sur-
vival rates, but this pattern did not hold for a shorter-lived
Elapid (average generation time of 5.9 years) also studied
(Webb et al. 2002).
Data on population ecology of snakes are limited (Par-
ker and Plummer 1987; Whiting et al. 1997), and our data
likewise were less than ideal which may have influenced
results of our matrix model analysis. Uncertainty in esti-
mates of k may arise from uncertainty in adult and subadult
survival estimates, which included death and permanent
emigration but not immigration, potentially biasing the
estimates low. In a review of studies reporting first year
survival of early-maturing North American snakes, Whit-
ing et al. (2008) estimated average annual survival at 0.24.
Drymarchon couperi is considered a late-maturing colubrid
(Stevenson et al. 2009); however, our estimates of first year
survival of approximately 0.29 is similar to that estimated
for early-maturing colubrids in their first year. This may
suggest that our estimate for first year survival is low,
especially since it is based on limited data, or that survival
differences in late and early maturing colubrids are not as
pronounced as seen in adults (xlate-maturing adult = 0.703;
xearly-maturing adult = 0.493; Parker and Plummer 1987).
Popul Ecol
123
Regarding degree of certainly in our estimates of repro-
ductive parameters, we had relatively high confidence in our
estimate of clutch size because it was largely generated from
reports of females that were wild-caught as gravid to lay eggs
in captivity. Our estimate of nest and hatching success had
the least support from empirical field data and information
from captive programs could not be reliably used because of
a lack of correlation to natural conditions. Unfortunately, it is
unclear how hatching rates reported for captive breeding
efforts relate to those in the wild. If captive conditions reflect
ideal natural conditions, then captive hatching success may
reflect an upper most value for this parameter; however,
differences in breeding programs may result in lower
hatching success than the range of values found naturally.
Uncertainties in values of some demographic parameters
could have potentially influenced estimates of population
growth rate and elasticities. Thus, our results of matrix model
analyses should be interpreted with caution.
Future monitoring efforts should be designed to improve
estimates of hatchling, juvenile, and subadult survival, to
which k was proportionally most sensitive, as well as more
robust estimates of w2. In addition, future modeling efforts
may consider up to five life history stages, including
hatchling, juvenile, subadult, adult, and larger adults. There
is some evidence that larger adult females may have
greater reproductive output in terms of number of eggs laid
per clutch (Smith 1987; J. Godwin, personal communica-
tion). It is also important to focus future efforts on gener-
ating field-based estimates of reproductive parameters,
especially given the lack of data from natural populations
regarding these parameters.
Conservation implications
Estimation of demographic parameters such as survival
rates in free-ranging animal populations can aid in deci-
sions regarding allocation of resources by informing large-
scale modeling efforts such as population viability analysis
and extinction threshold modeling (e.g., Fahrig 2001;
Breininger et al. 2004; Rhodes et al. 2008). The results of
the analyses presented here are an important first step.
However, because of uncertainty regarding many of the
estimated parameters in the matrix population model, our
results should be interpreted with caution. Nonetheless, the
results of sensitivity and uncertainty analyses to identify
parameters that have the largest effect on k should help
future conservation and research efforts.
The growth rate of our study population was propor-
tionately most sensitive to changes in adult survival which
is likely influenced by over-wintering habitat (xeric sand-
hills with tortoise burrows) and also to a significant extent
by adjacent habitats, particularly lowland and wetland
habitats which snakes have been found to use extensively
in warmer months, especially for foraging (Hyslop 2007).
Fort Stewart and many adjacent private lands may repre-
sent relatively ideal conditions for D. couperi because of
the paucity of paved roads, extremely large area, the
presence of high-quality, fire-managed longleaf pine–
wiregrass habitats that support sizeable tortoise popula-
tions, and extensive wetland habitats interspersed with
sandhill uplands. Therefore, estimates of demographic
parameters from the Fort Stewart and private lands popu-
lation may be particularly valuable as a benchmark with
which to compare estimates from other populations.
Estimates of population growth rate and elasticity of
growth rates to demographic variable are important for
conservation and management decisions (Caswell 2001;
Williams et al. 2002; Stahl and Oli 2006), but these were
not previously available for D. couperi. Our results indi-
cated survival of adult snakes as the most influential on k.
Although not unexpected for a long-lived species, this
result has important conservation implications regarding
the allocation of resources for the protection of adults and
transitioning subadults in a population. As discussed in
Stevenson et al. (2009) and Hyslop (2007), this might be
best accomplished by continuance or adoption of upland
restoration and management focused on fostering open-
canopied habitat supporting G. polyphemus populations
and maintaining connectivity between these sites and
adjacent wetland habitats (Hyslop et al. 2009a).
Acknowledgments We gratefully acknowledge M. Wallace,
R. Moulis, J. Waters, and R. Redmond for the use of their CMR data in
these analyses. We thank The Orianne Society for providing funding
for data analysis and manuscript preparation. Additional support
was generously provided by J. Jensen, R. J. Cooper, J. M. Meyers,
T. Norton, V. Rolland, K. McCarthy, Georgia Department of Natural
Resources, USGS Patuxent, and the biologists and managers at Fort
Stewart. K. Yamamura, L. Crespin, and an anonymous reviewer
provided many helpful comments for which we are grateful. We also
thank all of those who helped in the field throughout the years.
References
Akaike H (1973) Information theory and an extension of the
maximum likelihood principle. In: Petrov BN, Csaki F (eds)
Second International Symposium of Information Theory. Aka-
demiai Kiado, Budapest, pp 267–281
Altwegg R, Dummermuth S, Anholt BR, Flatt T (2005) Winter
weather affects asp viper Vipera aspis population dynamics
through susceptible juveniles. Oikos 110:55–66
Blouin-Demers G, Prior KA, Weatherhead PJ (2002) Comparative
demography of black rat snakes (Elaphe obsoleta) in Ontario and
Maryland. J Zool 256:1–10
Bonnet X, Guy N, Shine R (1999) The dangers of leaving home:
dispersal and mortality in snakes. Biol Conserv 89:39–50
Bowler KJ (1977) Longevity of reptiles and amphibians in North
American collections. Herpetological Circular 6. Society for the
Study of Amphibians and Reptiles, Lawrence
Popul Ecol
123
Breininger DR, Legare ML, Smith RB (2004) Eastern Indigo Snakes
(Drymarchon couperi) in Florida. In: Akcakaya HR, Burgman
MA, Kindvall O, Wood C, Sjogren-Gulve P, Hatfield J,
McCarthy M (eds) Species conservation and management: case
studies. Oxford University Press, New York, pp 299–311
Brownie C, Hines JE, Nichols JD, Pollock KH, Hestbeck JB (1993)
Capture-recapture studies for multiple strata including non-
Markovian transitions. Biometrics 49:1173–1187
Burnham KP, Anderson DR (2002) Model selection and multimodel
inference: a practical information-theoretical approach, 2nd edn.
Springer, New York
Caswell H (2001) Matrix population models: construction, analysis,
and interpretation. Sinauer Associates, Sunderland
Conant JR, Collins JT (1998) A field guide to reptiles and amphibians:
eastern and central North America. Houghton Mifflin Company,
Boston
Cormack RM (1964) Estimates of survival from the sighting of
marked animals. Biometrika 51:429–438
de Kroon HJ, van Groenendael J, Ehrlen J (2000) Elasticities: a
review of methods and model limitations. Ecology 81:607–618
Diemer JE, Speake DW (1983) The distribution of the eastern indigo
snake, Drymarchon corais couperi, in Georgia. J Herpetol
17:256–264
Dodd CK Jr (1987) Status, conservation, and management. In: Seigel
RA, Collins JT, Novak SS (eds) Snakes: ecology and evolution-
ary biology. MacMillan, New York, pp 478–513
Dodd CK Jr (1993) Strategies for snake conservation. In: Seigel RA,
Collins JT (eds) Snakes: ecology and behavior. McGraw-Hill,
Inc., New York, pp 363–393
Dodd CK Jr, Barichivich WJ (2007) Movements of large snakes
(Drymarchon, Masticophis) in north-central Florida. Fla Sci
70:83–94
Fahrig L (2001) How much habitat is enough? Biol Conserv
100:65–74
Fitch HS (1987) Collecting and life-history techniques. In: Seigel RA,
Collins JT, Novak SS (eds) Snakes: ecology and evolutionary
biology. MacMillan, New York, pp 143–164
Fitch HS (1999) A Kansas snake community: composition and
changes over 50 Years. Krieger, Malabar
Forsman A (1993) Survival in relation to body size and growth rates
in the adder, Vipera berus. J Anim Ecol 62:647–655
Frost C (2006) History and future of the longleaf pine ecosystem. In: Jose
S, Jokela EJ, Miller DL (eds) The longleaf pine ecosystem: ecology,
silviculture, and restoration. Springer, New York, pp 9–42
Godley JS (1980) Foraging ecology of the striped swamp snake,
Regina alleni, in southern Florida. Ecol Monogr 50:411–436
Groves F (1960) The eggs and young of Drymarchon corais couperi.Copeia 1960:51–53
Hyslop NL (2007) Movements, habitat use, and survival of the
threatened Eastern Indigo Snake (Drymarchon couperi) in Geor-
gia. PhD dissertation, The University of Georgia, Athens, p 132
Hyslop NL, Cooper RJ, Meyers JM (2009a) Seasonal shifts in shelter
and microhabitat use of the threatened Eastern Indigo Snake
(Drymarchon couperi) in Georgia. Copeia 2009:460–466
Hyslop NL, Meyers JM, Cooper RJ, Stevenson DJ (2009b) Indigo
Snake capture methods: effectiveness of two survey techniques
for Drymarchon couperi in Georgia. Fla Sci 72:93–100
Hyslop NL, Meyers JM, Cooper RJ, Norton TM (2009c) Survival of
radio-implanted Eastern Indigo Snakes (Drymarchon couperi) in
relation to body size and sex. Herpetologica 65:199–206
Jayne BC, Bennett AF (1990) Selection on locomotor performance
capacity in a natural population of garter snakes. Evolution
44:1204–1229
Jolly GM (1965) Explicit estimates from capture-recapture data with
both death and immigration-stochastic model. Biometrika
52:225–247
Laake JL, Rexstad E (2007) RMark—an alternative approach to
building linear models. Appendix C. In: Cooch EG, White GC
(eds) Program MARK: a gentle introduction. http://www.phidot.
org/software/mark/docs/book/
Landers JL, Speake DW (1980) Management needs of sandhill
reptiles in southern Georgia. Proc Annu Conf Southeast Assoc
Fish Wildl Agencies 34:515–529
Landers JL, Van Lear DH, Boyer WD (1995) The longleaf pine
forests of the Southeast: requiem or renaissance. J For 93:39–44
Layne JN, Steiner TM (1996) Eastern indigo snake (Drymarchoncorais couperi): summary of research conducted on Archbold
Biological Station. US Fish and Wildlife Service, Jackson
Moler PE (1985) Home range and seasonal activity of the eastern
indigo snake, Drymarchon corais couperi, in northern Florida.
Final performance report. Study E-1-06, III-A-5. Florida Game
and Fresh Water Fish Commission, Tallahassee
Moulis RA (1976) Autecology of the eastern indigo snake Drymar-chon corais couperi. Bull NY Herpetol Soc 12:14–23
Nichols JD, Kendall WL (1995) The use of multi-state capture-
recapture models to address questions in evolutionary ecology.
J Appl Stat 22:835–846
O’Brien S, Robert B, Tiandry H (2005) Consequences of violating the
recapture duration assumption of mark-recapture models: a test
using simulated and empirical data from an endangered tortoise
population. J Appl Ecol 42:1096–1104
O’Connor PF (1991) Captive propagation and post-copulatory plugs
of the eastern indigo snake, Drymarchon corais couperi.Vivarium 3:32–35
Oli MK, Dobson FS (2003) The relative importance of life-history
variables to population growth rate in mammals: Cole’s predic-
tion revisited. Am Nat 161:422–440
Parker WS, Plummer MV (1987) Population ecology. In: Seigel RA,
Collins JT, Novak SS (eds) Snakes: ecology and evolutionary
biology. MacMillan, New York, pp 253–301
Rhodes JR, Callaghan JG, McAlpine CA, de Jong C, Bowen ME,
Mitchell DL, Lunney D, Possingham HP (2008) Regional
variation in habitat-occupancy thresholds: a warning for conser-
vation planning. J Appl Ecol 45:549–557
Seber GAF (1965) A note on multiple-recapture census. Biometrika
52:249–259
Shine R, Bonnet X (2009) Reproductive biology, population viability
and options for field management. In: Mullin SJ, Seigel RA (eds)
Snakes: ecology and conservation. Cornell University Press,
Ithaca, pp 172–200
Smith CR (1987) Ecology of juvenile and gravid eastern indigo
snakes in north Florida. MS thesis, Auburn University, Auburn,
p 129
Speake DW, McGlincy JA (1981) Response of eastern indigo snakes
to gassing their dens. Proc Annu Conf Southeast Assoc Fish
Wildl Agencies 35:135–138
Speake DW, McGlincy JA, Colvin TR (1978) Ecology and manage-
ment of the eastern indigo snake in Georgia: a progress report.
In: Odum RR, Landers JL (eds) Rare and endangered wildlife
symposium. Georgia Department of Natural Resources, Game
and Fish Division Technical Bulletin WL 4. Social Circle,
Georgia, pp 64–73
Speake DW, McGlincy JA, Smith C (1987) Captive breeding and
experimental reintroduction of the eastern indigo snake. In:
Odum RR, Riddleberger K, Ozier J (eds) Third southeast
nongame and endangered wildlife symposium. Georgia Depart-
ment of Natural Resources, Game and Fish Division, pp 84–88
Stahl JT, Oli MK (2006) Relative importance of avian life-history
variables to population growth rate. Ecol Model 198:23–39
Stanford KM, King RB (2004) Growth, survival, and reproduction in
a northern Illinois population of the Plains Gartersnake, Tham-nophis radix. Copeia 2004:465–478
Popul Ecol
123

Steiner TM, Bass OL Jr, Kushlan JA (1983) Status of the eastern
indigo snake in southern Florida National Parks and vicinity.
South Florida research center report SFRC-83/01. Everglades
National Park, Homestead
Stevenson DJ (2006) Distribution and status of the eastern indigo
snake (Drymarchon couperi) in Georgia: 2006. Unpublished
report to the Georgia Department of Natural Resources Nongame
and Endangered Wildlife Program, Forsyth, pp 10 and
appendices
Stevenson DJ, Hyslop NL (2010) Drymarchon couperi (Eastern
Indigo Snake). Long-distance interpopulation movement. Her-
petol Rev 41:91–92
Stevenson DJ, Dyer KJ, Willis-Stevenson BA (2003) Survey and
monitoring of the Eastern Indigo Snake in Georgia. Southeast
Nat 2:393–408
Stevenson DJ, Enge KM, Carlile L, Dyer KJ, Norton TM, Hyslop NL,
Kiltie RA (2009) An Eastern Indigo Snake (Drymarchoncouperi) mark-recapture study in southeastern Georgia. Herpetol
Conserv Biol 4:30–42
Stevenson DJ, Bolt MR, Smith DJ, Enge KM, Hyslop NL, Norton
TM, Dyer KJ (2010) Prey records for the Eastern Indigo Snake
(Drymarchon couperi). Southeast Nat 9:1–18
United States Fish and Wildlife Service (1978) Endangered and
threatened wildlife and plants: listing of the eastern indigo snake
as a threatened species. Fed Regist 43:4026–4028
United States Fish and Wildlife Service (2008) Eastern Indigo Snake
(Drymarchon couperi) 5-year review: summary and evaluation.
Mississippi Ecological Services Field Office, Jackson, pp 30
Webb JK, Brook BW, Shine R (2002) What makes a species
vulnerable to extinction? Comparative life-history traits of two
sympatric snakes. Ecol Res 17:59–67
Wharton CH (1978) The natural environment of Georgia. Georgia
Department of Natural Resources, Atlanta
White GC, Burnham KP (1999) Program MARK: survival estimation
from populations of marked animals. Bird Study 46:S120–S138
Whiting MJ, Dixon JR, Greene BD (1997) Spatial ecology of the
Concho water snake (Nerodia harteri paucimaculata) in a large
lake system. J Herpetol 31:327–335
Whiting MJ, Dixon JR, Greene BD, Mueller JM, Thornton OW Jr,
Hatfield JS, Nichols JD, Hines JE (2008) Population dynamics of
the Concho water snake in rivers and reservoirs. Copeia
2008:438–445
Williams BK, Nichols JD, Conroy MJ (2002) Analysis and manage-
ment of animal populations. Academic Press, San Diego
Popul Ecol
123