survey on homeless persons (centres) · cial work with homeless people in spain,” which studies...
TRANSCRIPT

Survey on
Homeless
Persons
(Centres)
Madrid, April 28th 2004
INE
. In
stit
uto
Nac
ion
al d
e E
stad
ísti
ca

3
Summary
I. Introduction 5
I.1 Scope and limits of the research 5
I.2 Development if the research 6
II. Network of centres 9
II.1 Territorial distribution 9
II.2 Centres by type of centre & management 11
II.3 Services offered 14
II.4 Orientation of the centres 16
II.5 Access to the centres 19
III. Accommodation and catering services 21
III.1 Accommodation services 21
III.2 Catering services 29
IV. Resources 35
IV.1 Human resources 35
IV.2 Financial resources 41
V. Users of the centres 46
V.1 Number of the network users 46
V.2 Characteristics of the users 49
V.3 Definition of homeless person 50
INE
. In
stit
uto
Nac
ion
al d
e E
stad
ísti
ca

4
Annexe 1: Bibliography 51
Annexe 2: Questionnaire 53
Annexe 3: Charts 63
INE
. In
stit
uto
Nac
ion
al d
e E
stad
ísti
ca

5
I. Introduction
I.1 SCOPE AND LIMITS OF THE RESEARCH
The study on homeless people, regardless of the definition used, can tackle avast range of different aspects. Firstly, it is a priority to ascertain the number ofpeople without a home. Nevertheless, there are also other aspects or questionstied to their vital circumstances, which are of significant interest, like, for exam-ple: their social-demographic profile, their living conditions, their life story.
Since the late eighties, methodological frameworks have been developed, espe-cially in the United States (Rossi, 1989; Burt and Cohen, 1989; Burt, 1996), to al-low for reasonable approximations. In Europe the situation is not as satisfactorydue to several reasons, such as: lower incidence of the problem, society was un-aware of the gravity of the problem, and official institutions were uninvolved inmeasuring the problem. However, the situation changed during the nineties: onthe one hard thanks to work performed by Avramov for FEANTSA (EuropeanFederation of National Organisations working with the Homeless), during themiddle of the decade and their subsequent annual reports, and, on the otherhand, thanks to the inclusion of questions related to homeless people in theEurobarometer since 1993.
Nevertheless, since 2002 there has been a growing interest within the context ofthe EU through its statistical office (EUROSTAT) to start working on formalising amethodological framework (definitions and investigation methods) that wouldallow the study on homeless people to be tackled in a consistent and harmo-nised manner.
In Spain we must especially highlight Cabrera’s (1999) project with Cáritas, “So-cial work with homeless people in Spain,” which studies the network of welfarecentres that provide services to said people, the number of users and the socio-logical characteristics of the group. It is also worth mentioning Muñoz and Váz-quez’s work on the psychosocial aspects of homeless people, which takes a dif-ferent approach to the former.
The investigation that the INE has carried out for the first time within the sphereof an official statistic is a survey that sheds light, at least partially, on homelesspeople.
The objective of the investigation has been two-fold: to ascertain the number ofusers of the centres which, throughout the whole of Spain, render services tohomeless people and, secondly, to ascertain the main characteristics of said wel-fare network.
It is clear that we have not intended to study the profile or the living conditionsof homeless people, their life history or come to an understanding of the factorsthat have a bearing on the appearance of the problem.
INE
. In
stit
uto
Nac
ion
al d
e E
stad
ísti
ca

6
In view of the goals to achieve, the focus of our work lies, therefore, more alongthe lines of the work carried out a few years ago by Cabrera.
Finally, it is important to note that this survey emerges with the vocation ofregularly, perhaps annually, performing a follow-up of the network of centresand users.
We are dealing, in any case, with one part of a more global project that in thefuture will include the surveying of people.
I.2. THE DEVELOPMENT OF THE RESEARCH
As a consequence of the meeting held in March 2002 in Luxembourg by theGroup of Experts on Statistics on Homeless People, constituted within the coreof the European Union Statistical Office (EUROSTAT), with the participation of anINE representative, it was decided to explore the possibility of compiling statisti-cal information in Spain, following the conceptual and methodological guide-lines envisaged by the Group of Experts.
Under this context, a first meeting took place in May 2002 with personnel fromthe General Directorate for Social Action, Minors and the Family, answerable tothe Ministry for Labour and Social Affairs, with the purpose of exchanging opin-ions and obtaining first hand information both on the regulations governing so-cial work in Spain and the administrative sources susceptible of being used forstatistical purposes.
As a result of the aforementioned meeting, it was confirmed that the Ministry forLabour and Social Affairs did not have a centralised register of centres thatcould, potentially, provide services to homeless people. On the other hand, italso showed that the devices existing within the Ministry for Labour and SocialAffairs to monitor the management of social services had two main inconven-iences for our objectives: it was not implemented throughout the whole of thenational territory (some autonomous communities had not put it into practice)and, moreover, the instruments designed clearly focused on aspects more spe-cifically linked to management, which limited their potential interest.
1. The directory: its compilation.
Faced with the aforementioned situation, and taking into account that there hadbeen a standstill in the work of the EUROSTAT's Group of Experts, the decisionwas taken to elaborate a national directory of centres that render services tohomeless people.
Considering the lack of agreement existing on the definition of homeless people(situation that still persists), it was decided to include in the directory those cen-tres that offered homeless people accommodation, catering and other types ofservices (training, education, welfare).
INE
. In
stit
uto
Nac
ion
al d
e E
stad
ísti
ca

7
These centres have in common the fact that they enable the establishment of apersonal contact with their users and consequently, the possibility of carryingout interviews, in that the users remain inside for a few hours. We have excludedfrom the directory those centres that solely render information services, shelteror orientation.
These criteria were employed to compile the directory using two sources of in-formation: a) the regional ministries of the autonomous communities competentin the field of social services and b) the directory provided by Cáritas- PontificalUniversity of Comillas.
Based on the information provided by the autonomous communities (which waspartial in the cases of Baleares, País Vasco, Extremadura and Aragón), com-pleted with data stemming from the directory of Cáritas- University of Comillas,a provisional version of the directory was obtained in June of 2003. Said versionwas contrasted by the provincial INE delegations after contacting the territorialSocial Affairs departments, town councils from municipalities with more than20,000 inhabitants and well-established NGOs. As a consequence of said task,the directory of centres was obtained in September 2003, containing 752 entries.
2. The survey by mail: design, questionnaire. Its realisation.
The investigation had to include all centres that render services to homelesspeople, with a dual purpose: on the one hand, to reveal the characteristics of thecentres, which would bring us closer to obtaining a better awareness of the wel-fare network and, on the other, to estimate the number of users of these centres.
Furthermore, and in a subsidiary manner, carrying out the Survey would allowus to contrast and perfect the directory of centres. For financial reasons it wasdecided to perform the investigation by mail, addressing those responsible forthe centres.
The survey project, with the questionnaire that was to be used, was consultedwith the Ministry for Labour and Social Affairs and submitted to external expertsfor consideration, such as Pedro Cabrera of the Pontifical University of Comillas.
For the compilation of the questionnaire, national and international experienceson the matter were taken into account, like the Survey of Service Users carriedout in France by the INED in 1995, the National Survey for Care Providers toHomeless People and Users carried out in the USA between October 1995 andNovember 1996 by the Census Office, and the Centre Survey carried out by Cári-tas under the direction of Pedro Cabrera in 1999.
The questionnaire used in the Survey has different sections:
a) identification data
b) general characteristics of the centre
c) specific characteristics of the centres that offer accommodation services
d) specific characteristics of the centres that offer catering services
INE
. In
stit
uto
Nac
ion
al d
e E
stad
ísti
ca

8
e) definition of a homeless person (to ascertain the level of conformity of thoseresponsible for the centres with the draft definition being handled by Eurostat'sGroup of Experts).
Without aiming to be exhaustive, we can state that in section b) information isrequested on the services offered by the centres, the population attended to, theorientation of the centre, access to the centre, sources of financing, total expen-diture and personnel employed in the centre in the year 2002.
In section c) information is requested on the annual period of activity and theclosing periods of the centre, the normal opening hours of the centre, as well ason the capacity and average occupancy during the year 2002 and on November5th 2003, as the most immediate reference date. Moreover, in cases of collectiveaccommodation some complementary information was requested.
Similarly, in section d) information is obtained on the place where the service isrendered, the type of service rendered, the annual period of activity and theclosing periods, the normal opening hours of the centre, as well as on the capac-ity and average occupancy during the year 2002 and on November 5th 2003. Thequestionnaire of the Survey is attached as Annexe II.
Information was collected by mail between the November 8th 2002 and March 5th
2003, although given the tardiness of the process, a telephone reminder andsupport mechanism was established since mid-January 2003, with the purposeof expediting the process and improving the collection rate.
The final collection rate has been of 88% of the initial directory, with 555 ques-tionnaires having been processed, after removing directory deletions arisen as aresult of diverse reasons, such as for example, centres that no longer attend tothe homeless, definite closure of the centres, or centres included in other cen-tres.
After performing the collection process, the following step was the filtering andupdating of the initial directory, passing from 752 to 619 entries.
The SPSS program has been used to process and tabulate the information. Theanalysis of the results and the drafting of the Final Report of the Survey havebeen performed throughout the second fortnight of the months of March andApril 2003.
INE
. In
stit
uto
Nac
ion
al d
e E
stad
ísti
ca
9
II The network of centres
II.1 TERRITORIAL DISTRIBUTION
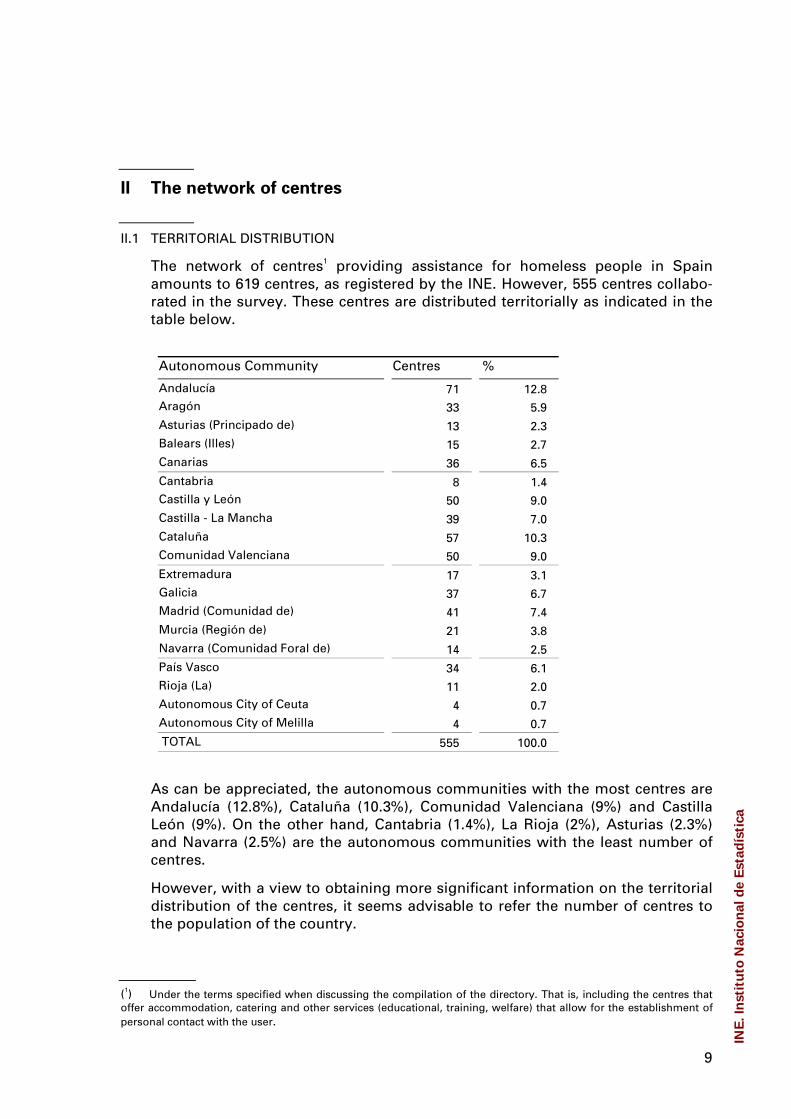
The network of centres1 providing assistance for homeless people in Spainamounts to 619 centres, as registered by the INE. However, 555 centres collabo-rated in the survey. These centres are distributed territorially as indicated in thetable below.
Autonomous Community Centres %
Andalucía 71 12.8Aragón 33 5.9Asturias (Principado de) 13 2.3Balears (Illes) 15 2.7Canarias 36 6.5Cantabria 8 1.4Castilla y León 50 9.0Castilla - La Mancha 39 7.0Cataluña 57 10.3Comunidad Valenciana 50 9.0Extremadura 17 3.1Galicia 37 6.7Madrid (Comunidad de) 41 7.4Murcia (Región de) 21 3.8Navarra (Comunidad Foral de) 14 2.5País Vasco 34 6.1Rioja (La) 11 2.0Autonomous City of Ceuta 4 0.7Autonomous City of Melilla 4 0.7TOTAL 555 100.0
As can be appreciated, the autonomous communities with the most centres areAndalucía (12.8%), Cataluña (10.3%), Comunidad Valenciana (9%) and CastillaLeón (9%). On the other hand, Cantabria (1.4%), La Rioja (2%), Asturias (2.3%)and Navarra (2.5%) are the autonomous communities with the least number ofcentres.
However, with a view to obtaining more significant information on the territorialdistribution of the centres, it seems advisable to refer the number of centres tothe population of the country.
(1) Under the terms specified when discussing the compilation of the directory. That is, including the centres thatoffer accommodation, catering and other services (educational, training, welfare) that allow for the establishment ofpersonal contact with the user.
INE
. In
stit
uto
Nac
ion
al d
e E
stad
ísti
ca
10
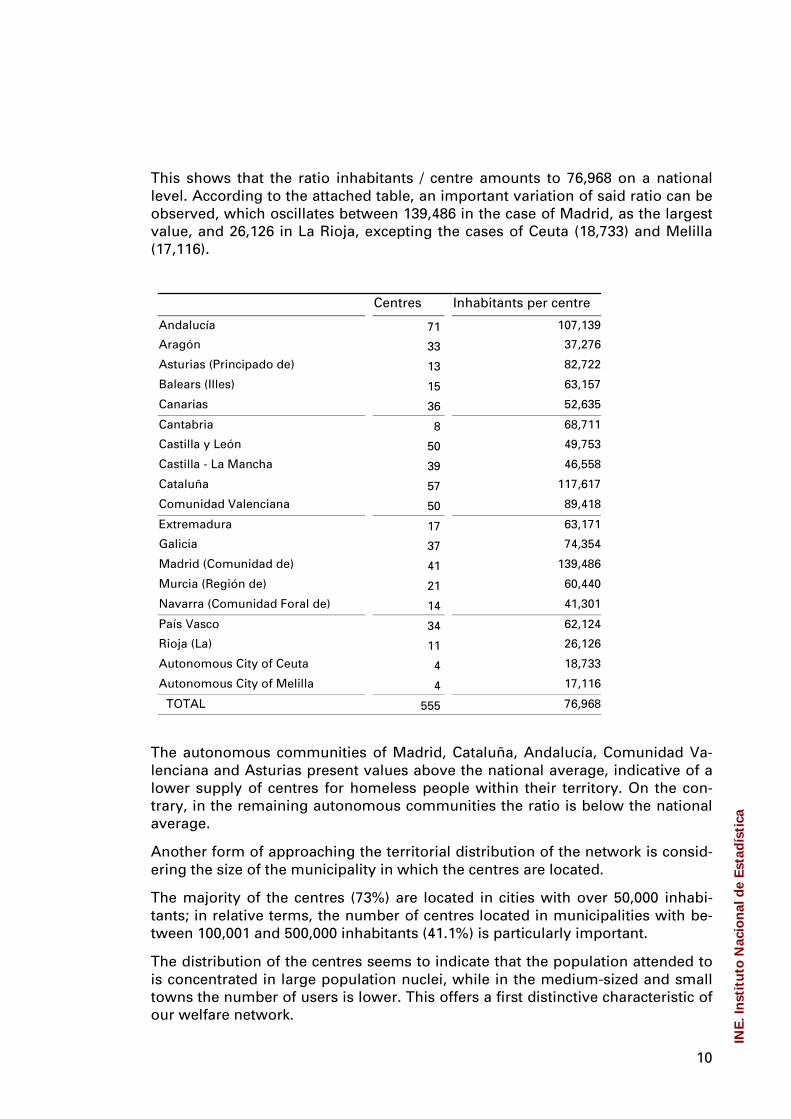
This shows that the ratio inhabitants / centre amounts to 76,968 on a nationallevel. According to the attached table, an important variation of said ratio can beobserved, which oscillates between 139,486 in the case of Madrid, as the largestvalue, and 26,126 in La Rioja, excepting the cases of Ceuta (18,733) and Melilla(17,116).
Centres Inhabitants per centre
Andalucía 71 107,139
Aragón 33 37,276
Asturias (Principado de) 13 82,722
Balears (Illes) 15 63,157
Canarias 36 52,635
Cantabria 8 68,711
Castilla y León 50 49,753
Castilla - La Mancha 39 46,558
Cataluña 57 117,617
Comunidad Valenciana 50 89,418
Extremadura 17 63,171
Galicia 37 74,354
Madrid (Comunidad de) 41 139,486
Murcia (Región de) 21 60,440
Navarra (Comunidad Foral de) 14 41,301
País Vasco 34 62,124
Rioja (La) 11 26,126
Autonomous City of Ceuta 4 18,733
Autonomous City of Melilla 4 17,116
TOTAL 555 76,968
The autonomous communities of Madrid, Cataluña, Andalucía, Comunidad Va-lenciana and Asturias present values above the national average, indicative of alower supply of centres for homeless people within their territory. On the con-trary, in the remaining autonomous communities the ratio is below the nationalaverage.
Another form of approaching the territorial distribution of the network is consid-ering the size of the municipality in which the centres are located.
The majority of the centres (73%) are located in cities with over 50,000 inhabi-tants; in relative terms, the number of centres located in municipalities with be-tween 100,001 and 500,000 inhabitants (41.1%) is particularly important.
The distribution of the centres seems to indicate that the population attended tois concentrated in large population nuclei, while in the medium-sized and smalltowns the number of users is lower. This offers a first distinctive characteristic ofour welfare network.
INE
. In
stit
uto
Nac
ion
al d
e E
stad
ísti
ca
11
Size of the municipality Centres %
Less than 5000 inhabitants 18 3.2Between 5,000 and 20,000 67 12.1Between 20,001 and 50,000 65 11.7Between 50,001 and 100,000 64 11.5Between 100001 and 500,000 228 41.1More than 500,000 113 20.4
Total 555 100.0
On analysing the distribution of the centres according to the size of the munici-pality and the autonomous community where they are located, and taking as areference the distribution existing on a national level, we observe that in theautonomous communities of Aragón (57.5%), Castilla León (46.2%) and to alesser extent La Rioja (27.3%), there is a predominance of centres located in mu-nicipalities with less than 20,000 inhabitants.
On the contrary, in Madrid (90.3%), Canarias (88.9%), País Vasco (88.2%), and toa lesser extent Cantabria (75.0%), Cataluña (72.0%), Comunidad Valenciana(72.0%) and Andalucía (71.9%) the centres are preferably located in municipali-ties with over 100,000 inhabitants (Chart 1).
II.2 CENTRES ACCORDING TO TYPE OF CENTRE AND MANAGEMENT
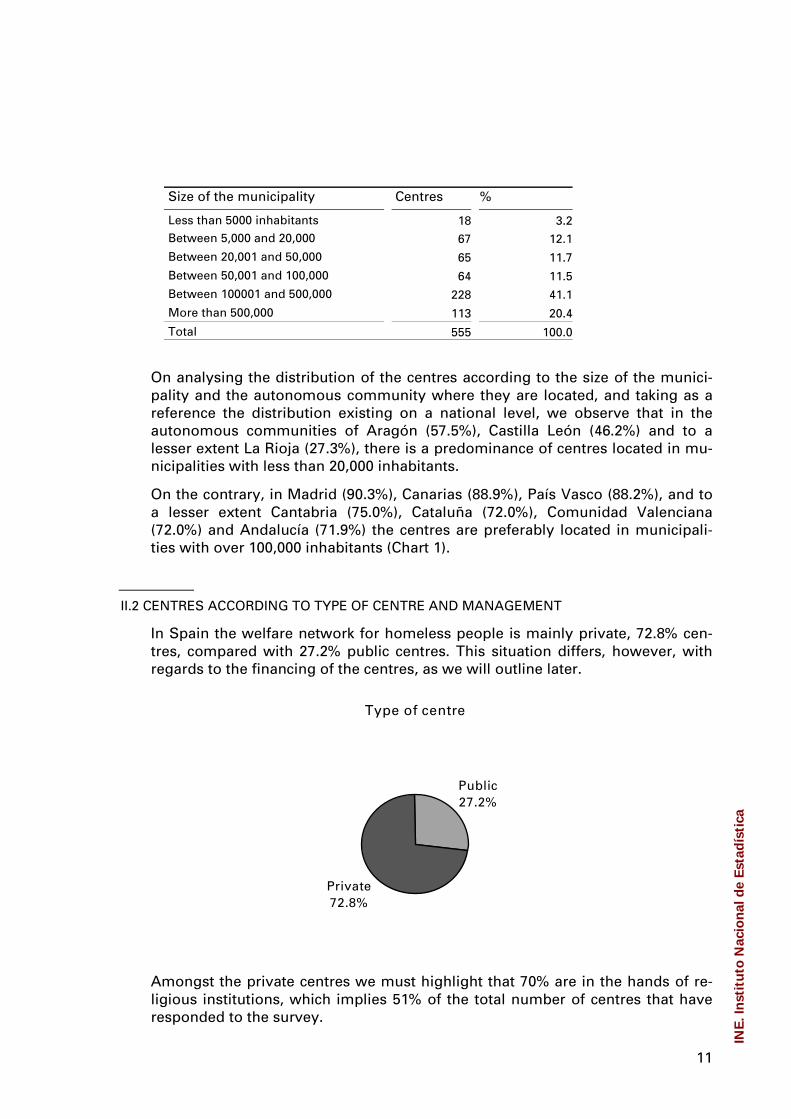
In Spain the welfare network for homeless people is mainly private, 72.8% cen-tres, compared with 27.2% public centres. This situation differs, however, withregards to the financing of the centres, as we will outline later.
Type of centre
Public27.2%
Private72.8%
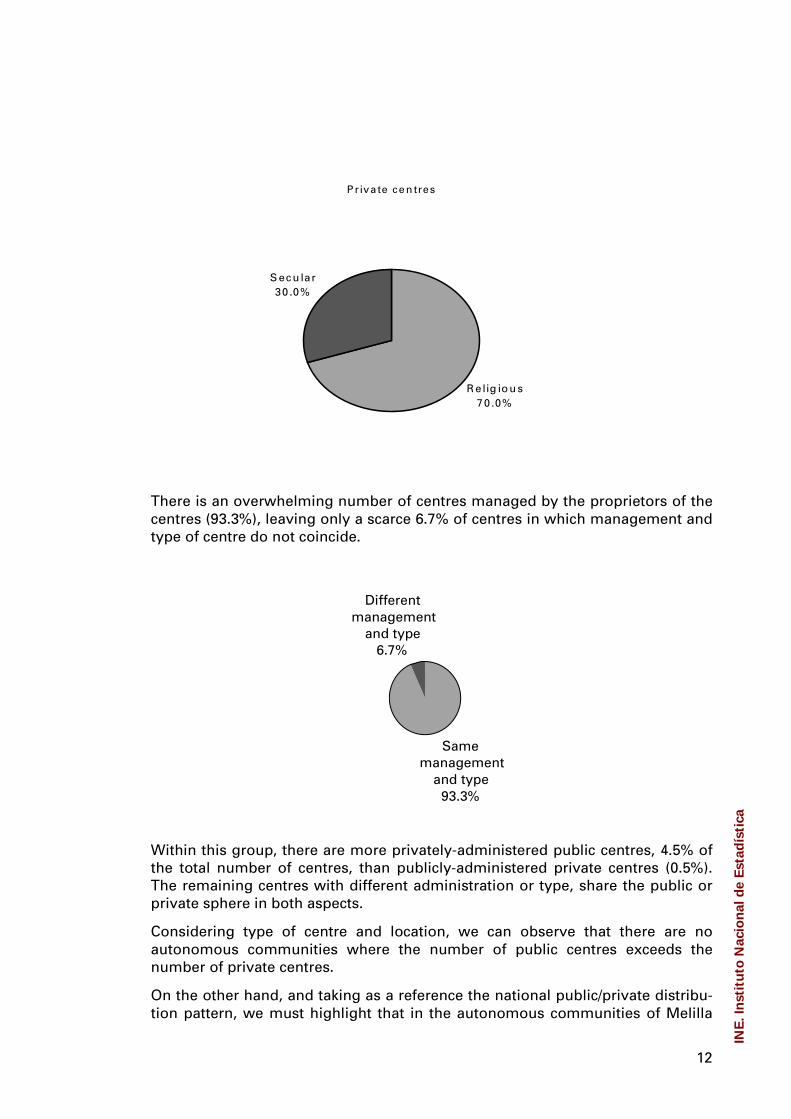
Amongst the private centres we must highlight that 70% are in the hands of re-ligious institutions, which implies 51% of the total number of centres that haveresponded to the survey.
INE
. In
stit
uto
Nac
ion
al d
e E
stad
ísti
ca
12
P riva te cen tres
S ecu lar30 .0%
R elig iou s70 .0%
There is an overwhelming number of centres managed by the proprietors of thecentres (93.3%), leaving only a scarce 6.7% of centres in which management andtype of centre do not coincide.
Samemanagement
and type93.3%
Differentmanagement
and type6.7%
Within this group, there are more privately-administered public centres, 4.5% ofthe total number of centres, than publicly-administered private centres (0.5%).The remaining centres with different administration or type, share the public orprivate sphere in both aspects.
Considering type of centre and location, we can observe that there are noautonomous communities where the number of public centres exceeds thenumber of private centres.
On the other hand, and taking as a reference the national public/private distribu-tion pattern, we must highlight that in the autonomous communities of Melilla
INE
. In
stit
uto
Nac
ion
al d
e E
stad
ísti
ca

13
(50%), La Rioja (45.5%), and Castilla La Mancha (43.6%), the weight of public cen-tres is clearly above the national average.
On the contrary, in Murcia (95.2%), Canarias (94.4%) and Extremadura (88.2%)the weight of the private sector is clearly relevant.
Autonomous Community Type
Public PrivateCentres % Centres %
Andalucía 20 28.2 51 71.8Aragón 11 33.3 22 66.7Asturias (Principado de) 3 23.1 10 76.9Balears (Illes) 5 33.3 10 66.7Canarias 2 5.6 34 94.4Cantabria 3 37.5 5 62.5Castilla y León 12 24.0 38 76.0Castilla-La Mancha 17 43.6 22 56.4Cataluña 19 33.3 38 66.7Comunidad Valenciana 15 30.0 35 70.0Extremadura 2 11.8 15 88.2Galicia 12 32.4 25 67.6Madrid (Comunidad de) 9 22.0 32 78.0Murcia (Región de) 1 4.8 20 95.2Navarra (Comunidad Foral de) 3 21.4 11 78.6País Vasco 9 26.5 25 73.5Rioja (La) 5 45.5 6 54.5Autonomous City of Ceuta 1 25.0 3 75.0Autonomous City of Melilla 2 50.0 2 50.0TOTAL 151 27.2 404 72.8
Considering the size of the municipalities where the centres are located, we canobserve that, even though in all cases the majority are private centres, the rela-tive weight of the public centres is greater in municipalities with less than 50,000inhabitants.
Type
Public PrivateCentres % Centres %
Less than 5000 inhabitants 7 38.9 11 61.1
Between 5001 and 20000 25 37.3 42 62.7
Between 20001 and 50000 22 33.8 43 66.2Between 50001 and 100000 19 29.7 45 70.3Between 100001 and 500000 58 25.4 170 74.6Over 500000 20 17.7 93 82.3TOTAL 151 27.2 404 72.8
INE
. In
stit
uto
Nac
ion
al d
e E
stad
ísti
ca
14
On the contrary, in municipalities with over 100,000 inhabitants, the relativeweight of private centres is much greater, making up 83.2% of the centres in cit-ies with over 500,000 inhabitants.
II.3 SERVICES OFFERED
The rendering of services is the manner in which the social action performed bythe centres is materialised. We understand this term to have a broad meaning,covering much more than just material assistance, to consider all types of activi-ties (educational, training, welfare, ...).
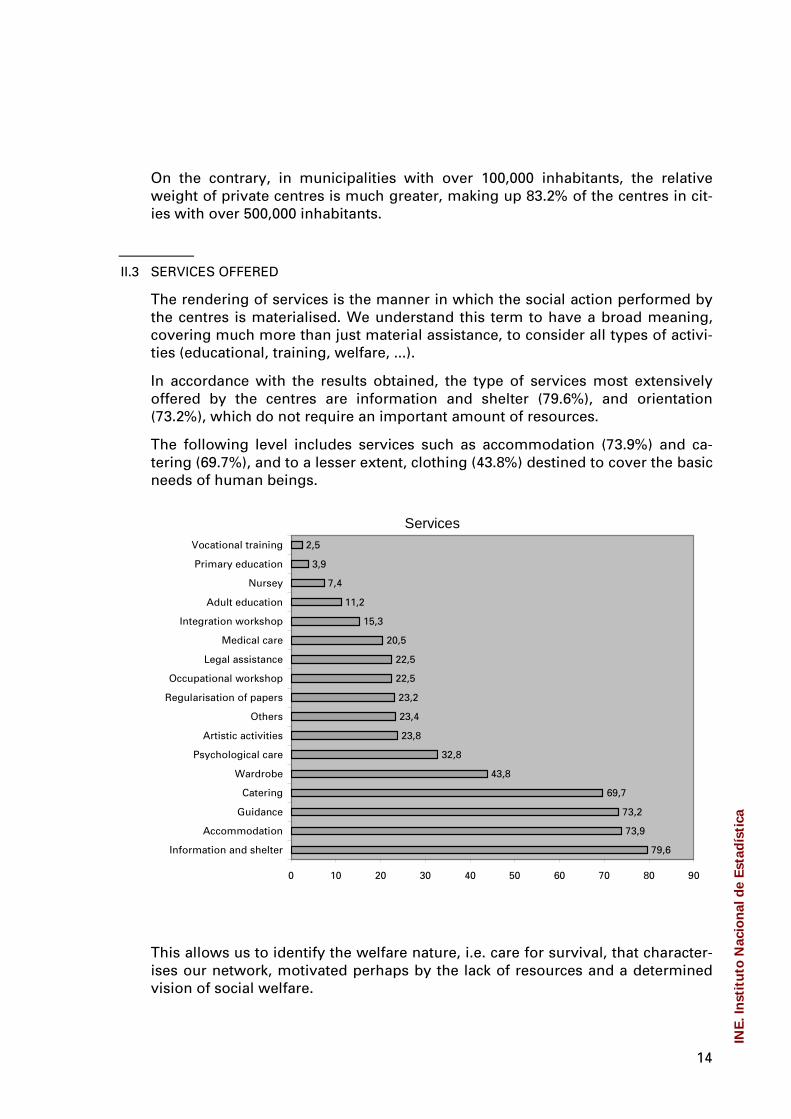
In accordance with the results obtained, the type of services most extensivelyoffered by the centres are information and shelter (79.6%), and orientation(73.2%), which do not require an important amount of resources.
The following level includes services such as accommodation (73.9%) and ca-tering (69.7%), and to a lesser extent, clothing (43.8%) destined to cover the basicneeds of human beings.
Services
79,6
73,9
73,2
69,7
43,8
32,8
23,8
23,4
23,2
22,5
22,5
20,5
15,3
11,2
7,4
3,9
2,5
0 10 20 30 40 50 60 70 80 90
Information and shelter
Accommodation
Guidance
Catering
Wardrobe
Psychological care
Artistic activities
Others
Regularisation of papers
Occupational workshop
Legal assistance
Medical care
Integration workshop
Adult education
Nursey
Primary education
Vocational training
This allows us to identify the welfare nature, i.e. care for survival, that character-ises our network, motivated perhaps by the lack of resources and a determinedvision of social welfare.
INE
. In
stit
uto
Nac
ion
al d
e E
stad
ísti
ca
15
The remaining services are offered by a very small nucleus of centres. The mostimportant are psychological attention (32.8%) and medical care (20.5%), in thepsycho-sanitary sector, and also legal aid (22.5%) and the regularisation ofdocumentation (23.2%), which gives notice of the growing weight of immigrantsin our society and their harsh living conditions.
Other types of services, linked to the reintegration of these persons in the labourmarket, like occupational workshops (22.5%) or reintegration workshops (15.3%),have a modest presence in the centres, as a demonstration of the weak integra-tion and reinsertion vision sustained in the field of social work.
Finally, we wish to highlight the very low number of centres (7.4%) offering childday-care services, which could be indicative of the individual nature that charac-terises attention in centres.
On analysing the services offered by centres from a territorial perspective, weobserve differences among the autonomous communities that do not overthrowthe general vision offered (Chart 2).
Thus, in the case of accommodation there are major differences between LaRioja (100% of the centres offer this service) or Ceuta (100%) on the one hand,and Canarias (63.9%), País Vasco (61.8%) and Madrid (61%) on the other.
As regards the rendering of catering services, the variations oscillate betweenMurcia (52.4% of the centres) and La Rioja (54.5%), and the situation registeredin Cantabria (87.5%), Baleares (86.7%) and, in particular, Ceuta and Melilla,where all the centres offer this service.
As regards psychological attention there are very notable differences betweenAsturias (7.7%) and Aragón (18.2%), with a lower proportion of centres that offersaid service, and on the other hand, Extremadura (52.9%), Melilla (50.0%) andComunidad Valenciana (48.0%), where the higher values are registered.
Likewise, as regards medical care, significant differences are observed amongstthe centres depending on their location. In País Vasco only 8.8% of the centresoffer this service, while in Ceuta (50.0%), Melilla (50.0%) and Extremadura(41.2%) it is much more frequent.
With regards to social welfare services from the point of view of reintegration,e.g. reintegration workshops or occupational workshops, we can clearly observethe difference in centre profiles according to their location. Thus, in Galicia only2.7% of centres offer occupational workshops and 5.4% of centres have reinser-tion workshops, which seems to indicate that the centres have a more welfare-based profile, while in Murcia (52.4% and 42.9% respectively) or Castilla- LaMancha (30.8% and 25.6%) the majority of centres have a reintegration-basedapproach.
Considering the size of the municipality where the centres are located, we canalso observe a difference between centres in cities with more than 100,000 in-habitants and those located in small nuclei (less than 20,000 inhabitants), asshown in chart 3.
INE
. In
stit
uto
Nac
ion
al d
e E
stad
ísti
ca

16
In the more urban environments, we observe that, in relative terms, a lowernumber of centres offer accommodation services and clothing, while a greaterpercentage of centres offer services like reintegration workshops and psycho-logical assistance.
This could indicate that centres located in larger cities are more aware of work-ing on reintegration than centres located in small towns, which are more con-cerned about welfare.
On analysing the services offered by the centres according to the type of centre,we can observe some differences between the public and private centres (Chart 4).
The number of private centres offering services which include occupationalworkshops and reintegration workshops is clearly greater.
Moreover, we can observe that psychological assistance and medical care arealso more frequent in private centres. The same occurs with other services withan educational nature, like adult education and artistic activities, or a welfare na-ture, like clothing.
Finally, we can highlight that legal aid and assistance with the regularisation ofdocumentation and administrative tasks are also more frequent in private centres.
II.4 ORIENTATION OF THE CENTRES
In accordance with the type of population attended to (and bearing in mind thatthe different population types are not exclusive categories), we can observe thatthe majority of centres attend to men (86.7%) and women (80.9%), while 48.1%of centres consider the possibility of attending to couples, and only 30.5% of thecentres attend to children (minors without legal tutors are attended to by othertypes of centres).
86,780,9
48,1
30,5
0
10
20
30
40
50
60
70
80
90
100
Males Females Couples Children
INE
. In
stit
uto
Nac
ion
al d
e E
stad
ísti
ca

17
This indicates that most centres focus on providing assistance to homeless indi-viduals (male or female), with few centres considering both couples or adultsaccompanied by a child.
On analysing the profile of the centres from a territorial perspective, we can ob-serve differences which, nevertheless, merely clarify the general conclusion(Chart 5).
Data confirms that most of the assistance offered in the centres of all theautonomous communities is directed at men and women. In the case of males,the situation varies between Asturias and Baleares where they are accepted bythe totality of the centres and Cantabria, where only 50% of the centres acceptmales. With regards to women the differences are lower, given that the extremevalues are 90.0% in the case of La Rioja and 69.7% in Aragón.
Assistance provided to couples in all communities is considerably lower, al-though significant differences appear in Asturias (69.2% of the centres) andAragón (60.0%) on the one hand, and Cantabria (25%) or Navarra (28.6%) on theother.
In relation to child care, we can observe strong disparities, perhaps produced byan erroneous interpretation of the question in not considering the child accom-panying the adult as a person who has been attended.
From the perspective of the size of the municipality where the centre is located,we can observe that the proportion of centres that admit couples is greater insmaller and medium sized towns, clearly decreasing in the large cities.
Likewise, in large cities we observe that the number of centres in relative termsthat attend to men and women is lower in the smaller population nuclei (Chart 6).
On the other hand, we observe that attention to couples is higher in public cen-tres (58.3%) than in private centres (44.3%). The same occurs with regards to at-tention to women (89.4% as against 77.7%) (Chart 7).
− Orientation towards specific types of population groups
53.9% of the centres that have responded to the survey state they primarily focuson a certain type of population group, which could reveal a certain degree ofspecialisation in the assistance offered.
INE
. In
stit
uto
Nac
ion
al d
e E
stad
ísti
ca
18
33,4
40,8
43,1
26,8
58,2
37,8
0,0 10,0 20,0 30,0 40,0 50,0 60,0 70,0
Former prisoners
Drug addicts
Alcoholics
Battered women
Immigrants
Others
%
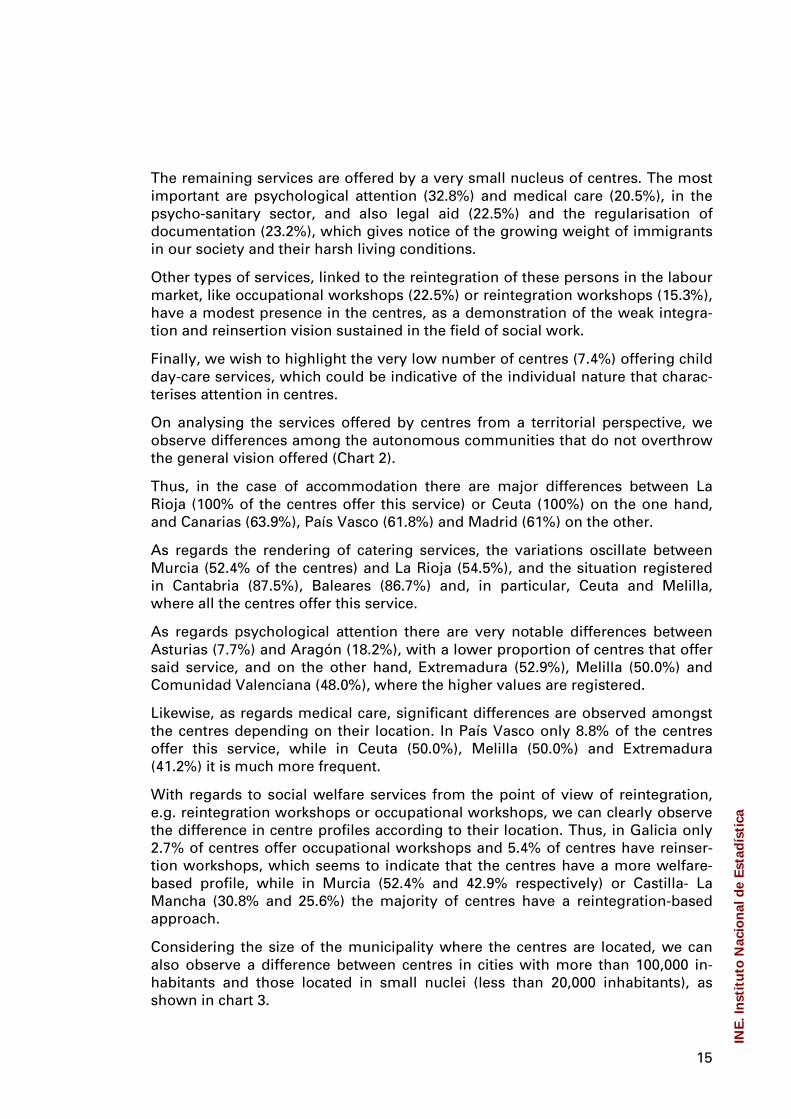
Amongst the 299 centres that have declared that they have a main orientation,the groups mostly attended to are: immigrants (58.2% of centres), alcoholics(43.1%), drug addicts (40.8%), former prisoners (33.4%) and battered women(26.8%).
If we examine the primary orientation of the centres according to the autono-mous community where they are located, we observe that in Castilla y León(57.9%), Asturias (57.1%), Aragón (46.2%), Baleares (45.5%) and País Vasco (45%)greater attention is offered to former prisoners (Chart 8)
With regards to drug addicts, the network of centres of Asturias (85.7% of thecentres), Extremadura (66.7%) and País Vasco (65%) are more oriented to thispopulation group.
The network of centres of Asturias (85.7 of the centres), País Vasco (70%),Aragón (69.2%) and Navarra (66.7%) are particularly oriented to people with al-cohol problems.
In the aforementioned autonomous communities there is a predominance there-fore of welfare networks oriented towards classical marginalisation (former pris-oners, drug addicts, alcoholics) as the focal point of their attention.
In relation with battered women, greater attention is offered in Galicia (66.7% ofthe centres), Comunidad Valenciana (41.4%) and Cantabria (40%).
On the other hand, providing immigrants with assistance is the priority objectivein the network of centres of Cantabria (100% of the centres), Ceuta (100%), Mur-cia (92.9%) and Castilla La Mancha (92.3%).
Upon examining whether the orientation of the centres towards certain popula-tion groups is influenced by the size of the municipality where the centre is lo-cated, we observe that there are no significant differences with respect to what isreferred to as the traditional exclusion approach (former prisoners, drug addicts,alcoholics) (Chart 9).
INE
. In
stit
uto
Nac
ion
al d
e E
stad
ísti
ca

19
However, in the case of battered women, there seems to be greater attention inthe centres located in municipalities of between 50,001−100,000 inhabitants, pos-sibly due to a greater detection of these types of problems in these municipalities.
In the case of immigration, we can observe a greater prevalence of this type ofattention in small and medium sized towns/cities (between 20,000 and 100,000inhabitants).
II.5 ACCESS TO THE CENTRES
Considering how users access the centres, we can point out that the majority ofcentres (62.2%) are free access centres, that is, that people do not need to go toany other institution to be attended to in same.
62,2%
58,2%
28,3%
17,5%
32,4%
24,3%
26,3%
Free access
From social services
From other centres
From prisons
From hospitals
From ER
Others
Referral by social services is the second most important form of access; there isa less significant number of former prisoners, with around 25% of centres at-tending to people stemming from the emergency services, hospitals or othercentres. This shows that the assistance system is very open and that homelessindividuals can access it easily.
If we analyse the forms of accessing centres according to the territorial locationof same, we observe important disparities between the centres in differentautonomous communities (Chart 10).
Thus, on observing the percentage of free access centres, large differences ap-pear between the cases of Canarias (77.8%), Andalucía (76.1%) and Baleares(73.3%) where the largest values are obtained, while in La Rioja (27.3%), Comu-nidad Valenciana (46.0%) and Cataluña (49.1%) the lowest values are registered.
With regards to referrals from social services, a strong variability is also ob-served between the different autonomous communities. Thus, while in Baleares(86.7%), Cataluña (77.2%), and Navarra (71.4%) this form of accessing the centres
INE
. In
stit
uto
Nac
ion
al d
e E
stad
ísti
ca

20
clearly reaches higher values, in La Rioja (36.4%) and Castilla y León (38%) inparticular, it is a form of access with relatively lower importance.
With regards to accessing these centres "from other centres," it is more frequentin centres located in País Vasco (52.9%), Navarra (50%) and Extremadura(47.1%), while the lowest values are obtained in La Rioja (9.1%), Murcia (9.5%)and Cataluña (12.3%).
Persons coming from prisons acquire greater relative importance in the cases ofNavarra (35.7%), Baleares (33.3%) and Extremadura (29,4%), and are less fre-quent in the cases of Castilla-La Mancha (5.1%), Canarias (8.3%) and La Rioja(9.1%).
Likewise, in the case of hospital referrals as a form of accessing these centres,the difference is significant between the cases of Extremadura (58.8%) andBaleares (53.3%) and Navarra (42.9%), on the one hand, and the values regis-tered in La Rioja (9.1%), Murcia (9.5%) and Cantabria (12.5%), on the other.
These obvious disparities may be due to both the different admission policiesimplemented by the centres and to a greater or lesser degree of coordination inthe attention rendered.
In this sense, we could say that high free access figures could be indicative of agreater presence of centres with minimal requirements.
Similarly, the existence of a high number of referrals from social services and,secondly, from other centres as well as from prisons, hospitals and emergencyrooms, would indicate a greater degree of co-ordination in actions carried out bythe network of centres (Cataluña, Baleares, Navarra, País Vasco, Comunidad Va-lenciana).
On the other hand, on analysing the forms of accessing the centres according tothe size of the municipalities where they are located, we can observe that thesmaller the municipality, the greater the free access, and the lower the relevanceof access from social services and from other centres, as was to be expected.
Referrals from other centres as a form of access appears in centres located incities with over 100,000 inhabitants.
Nevertheless, it is worth noting the difference observed with regards to free ac-cess: while in the municipalities with over 500,000 inhabitants, half (49.6%) of thecentres are free access centres, this proportion is greater in the remaining mu-nicipalities, which could be due to the greater difficulty in accessing centres inlarge cities (Chart 11).
From the perspective of the type of centre, we can observe that there are norelevant differences with respect to the most frequent forms of accessing publicand private centres (Chart 12).
However, we can highlight a greater incidence of referral from other centres as aform of accessing private centres, possibly due to a greater interrelation betweenthese types of centres.
INE
. In
stit
uto
Nac
ion
al d
e E
stad
ísti
ca

21
On the other hand, in public centres we observe that referral from social serv-ices, as well as from emergency centres, is more frequent than in private centres.
III Accommodation and catering services
Accommodation and catering have been studied in greater detail since theseservices are essential for homeless people, given that they provide the minimumrequirements for a decent life, as is food and a place to sleep.
Apart from this, the centres that provide these services are to a large extentthose that take care of homeless people. Hereunder is a list of the general char-acteristics of these services.
III.1 ACCOMMODATION SERVICES
Of the centres that collaborate in the survey, 73.8% (410 centres) offer accom-modation. During the year 2002, of these 410 centres, nine did not offer vacan-cies due to various reasons, and on November 5th 2003 all of them offered atleast one accommodation vacancy.
In the accommodation network studied, the average number of vacancies offeredduring 2002 has been 11,316 vacancies. On November 5th 2003, there were12,139 vacancies, implying an increase of 7.3% with respect to the average figurefor the previous year.
Vacancies available in November 2003 were distributed among 1,580 vacanciesoffered in shelter apartments, 486 in bed & breakfasts and 10,073 vacancies inhostels and group accommodation.
In relation with the occupancy level of the centres, the average number of vacan-cies occupied during 2002 was of 9,416 vacancies, which implies that 82.3% ofthe network was occupied. In November of 2003, 9,784 vacancies were occupied(3.9% more than the average for 2002), 80.3% of the network's capacity.
− Type and territorial location
With regard to the type of centre, we observe that 71.0% of the centres that offeraccommodation are private. In relation with the number of vacancies offered,58% of the total were in private centres, which implies that the average size ofprivate centres is smaller.
INE
. In
stit
uto
Nac
ion
al d
e E
stad
ísti
ca

22
T yp e o f cen tre o fferin g acco m m od atio n
Priva te cen tres71.0%
Pub lic cen tres29 .0%
With the object of studying the density of the network it is useful to consider the ra-tio number of inhabitants per vacancy. The ratio is a good indicator of the assistanceprovided, to the extent that the lower the value the better the level of assistance of-fered. Said ratio is of 3,519 inhabitants per vacancy on a national level.
The autonomous cities of Ceuta and Melilla, and the autonomous communitiesof La Rioja and Canarias have less population per vacancy. In the case of the twoautonomous cities it is necessary to take into account the specific situation moti-vated by the intensity of the migration which explains the large number of va-cancies available.
The autonomous communities that present higher values of inhabitants per va-cancy are Cataluña, Andalucía, Castilla-La Mancha, Asturias, Galicia, Extre-madura. Madrid, Navarra, Comunidad Valenciana, País Vasco and Cantabria arewithin the national average.
No. of vacancies on 5-11-03 Inhabitants per vacancy
Andalucía 1,446 5,261Aragón 470 2,617Asturias (Principado de) 237 4,538Balears (Illes) 330 2,871Canarias 941 2,014
Cantabria 171 3,215Castilla y León 692 3,595Castilla-La Mancha 520 3,492Cataluña 1,227 5,464Comunidad Valenciana 1,225 3,650
Extremadura 264 4,068Galicia 636 4,326Madrid (Comunidad de) 1,456 3,928Murcia (Región de) 519 2,446Navarra (Comunidad Foral de) 149 3,881
País Vasco 613 3,446Rioja (La) 188 1,529Autonomous City of Ceuta 511 147Autonomous City of Melilla 544 126
TOTAL 12,139 3,519
INE
. In
stit
uto
Nac
ion
al d
e E
stad
ísti
ca

23
On studying the distribution of the accommodation vacancies offered on 5-11-2003 according to the size of the municipalities where the centres are located, weobserve that the majority (83.8%) are offered in cities with more than 50,000 in-habitants and 68.2% of the total in cities with more than 100,000 inhabitants. Thenumber of vacancies in municipalities with less than 20,000 inhabitants is of8.4% of the total number of vacancies offered on a national level.
This shows that homelessness is mainly an urban phenomenon, centred in pro-vincial capitals and large cities, and with less incidence in municipalities withless than 50,000 inhabitants.
Size of the municipality No. of vacancies on5-11-03
%
Less than 5000 inhabitants 311 2.6
between 5001 and 20000 704 5.8
between 20001 and 50000 949 7.8
between 50001 and 100000 1893 15.6
between 100001 and 500000 4868 40.1
over 500000 3414 28.1
TOTAL 12,139 100.0
From the point of view of the type of centre, we can observe that the private cen-tres offer 7,043 vacancies (58.0 % of the total) while 5,096 are offered by the pub-lic centres (42.0%).
Vacancies offered 5-11-2003
Private58.0%
Public42.0%
After studying accommodation services from the perspective of the vacanciesoffered and the size of the centres, we will now focus our attention on studyingthe manner in which these centres offer their services.
INE
. In
stit
uto
Nac
ion
al d
e E
stad
ísti
ca
24
− Periods of activity
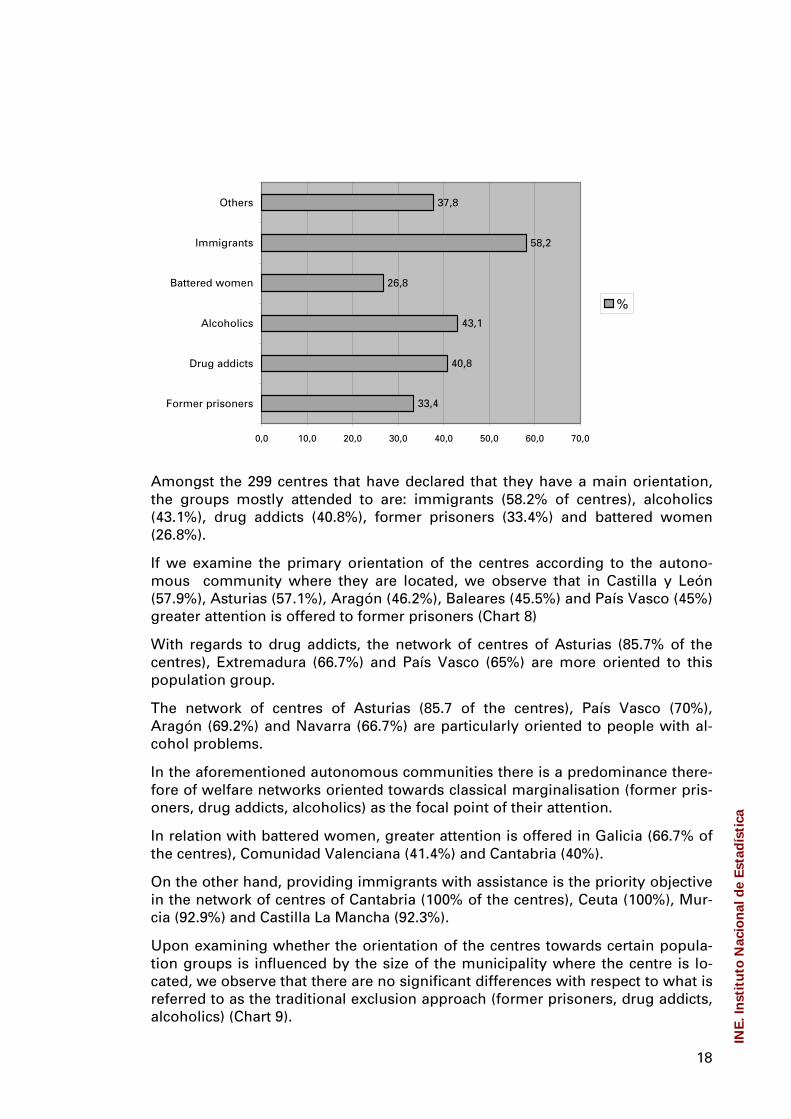
From the perspective of the annual opening period of the centres, the majorityare permanent and do not close seasonally or during the holiday period.Moreover, 8.3% of the centres close for a period equal to or less than 31 days,1.7% of the centres for a period of between 1 and 2 months, and 4.1% for morethan 2 months.
Centres %
Permanent 352 85.9
Closes 31 days or less 34 8.3
Closes between 32 and 60 days 7 1.7
Closes more than 60 days 17 4.1
This data allows us to affirm that the network essentially has a permanent nature.
With respects to the opening hours, the network of centres offering accommoda-tion for the homeless has, from Monday to Friday, 159 centres (38.8% of the cen-tres that offer accommodation) that open twenty four hours a day to attend topeople in this situation. We are mainly dealing with low requirement centres thatusually offer accommodation in apartments.
36.1% of the centres are open between twelve and twenty-four hours, and 25.1%open less than twelve hours a day during said days. (Chart 13). The situationduring weekends is practically the same, which shows that generally the ac-commodation network enjoys long opening hours.
− Group accommodation
Group accommodation centres, which amount to 74.1% of all the centres thatoffer accommodation, offered, in terms of a daily average, 10,070 vacanciesduring 2002 and 10,739 vacancies in November 2003. This implies 89% and88.5% respectively of the total number of vacancies offered.
The centres are distributed according to the average number of vacancies of-fered in 2002 in the following manner:
INE
. In
stit
uto
Nac
ion
al d
e E
stad
ísti
ca

25
Centres by num ber of vacancies
from 1 to 1026.3%
No vacancies1.3%
from 51 to 100 9.2%
O ver 1004.6%
from 11 to 5058.6%
As can be observed, the centres with less than 50 vacancies amount to over 80%of the total, while those with more than 100 vacancies do not reach 5%.
With regards to the type of centre, there is a clear predominance of private cen-tres (67.8%).
Upon studying the duration of the stay, as can be observed in the graph, only28.3% of these are short stays (between six days and one month), 44.7% involveemergency services (between one and five days) and 61.2% are long stays (morethan one month).
Proportion of centres offering group accommodation by type of stay
44,7%
28,3%
61,2%
0 10 20 30 40 50 60 70
Emergency stay
Short stay
Long stay
Most types of stays are long-term stays, which have a more integrating characterthan the other types. Private centres offer a greater proportion of long-term stays(Chart 14).
Emergency centres are more frequent in smaller towns, perhaps motivated be-cause the homeless person is considered more of a non-resident and thereforesomebody who needs to be aided in an emergency.
INE
. In
stit
uto
Nac
ion
al d
e E
stad
ísti
ca
26
In large cities the weight of the emergency centres decreases with respect to theother strata. Short stays have a greater weight in the cities with over 100,000 in-habitants, where emergency stays are not considered sufficient for a person tobe able to obtain accommodation on their own, or alternatively, enter a reinte-gration project (Chart 15)
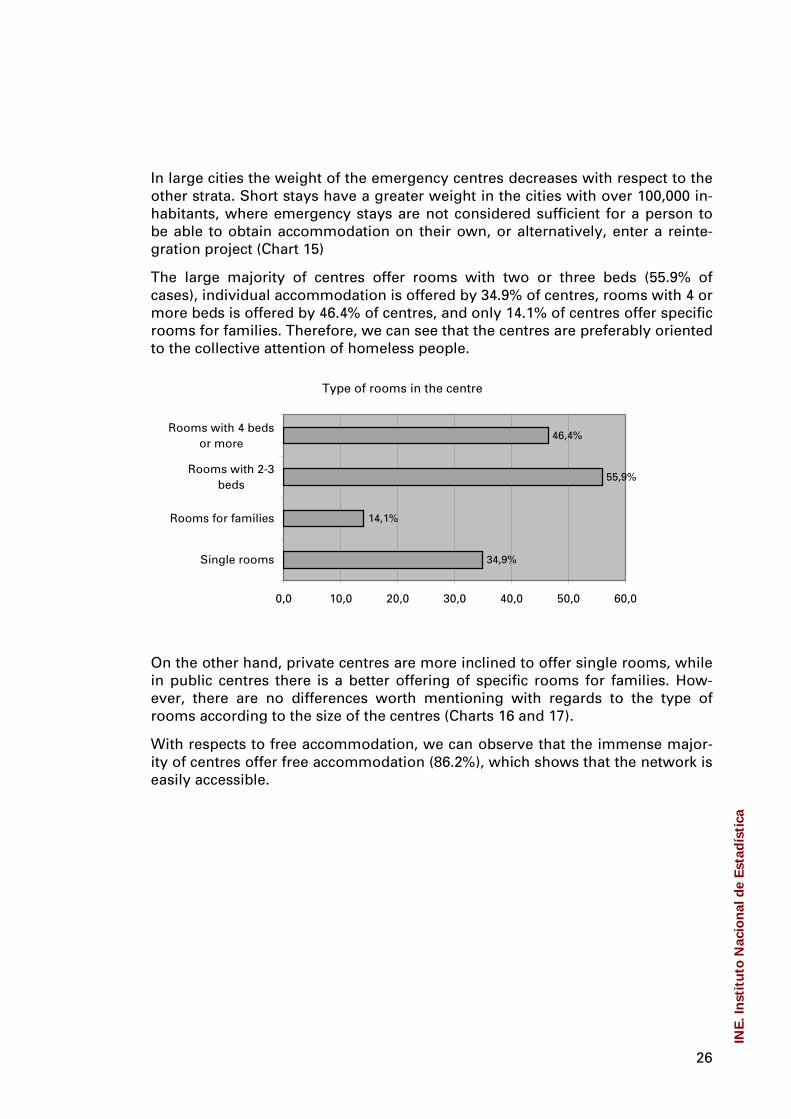
The large majority of centres offer rooms with two or three beds (55.9% ofcases), individual accommodation is offered by 34.9% of centres, rooms with 4 ormore beds is offered by 46.4% of centres, and only 14.1% of centres offer specificrooms for families. Therefore, we can see that the centres are preferably orientedto the collective attention of homeless people.
Type of rooms in the centre
46,4%
55,9%
14,1%
34,9%
0,0 10,0 20,0 30,0 40,0 50,0 60,0
Single rooms
Rooms for families
Rooms with 2-3beds
Rooms with 4 bedsor more
On the other hand, private centres are more inclined to offer single rooms, whilein public centres there is a better offering of specific rooms for families. How-ever, there are no differences worth mentioning with regards to the type ofrooms according to the size of the centres (Charts 16 and 17).
With respects to free accommodation, we can observe that the immense major-ity of centres offer free accommodation (86.2%), which shows that the network iseasily accessible.
INE
. In
stit
uto
Nac
ion
al d
e E
stad
ísti
ca

27
Centres offering free accommodation
Non-response3.0%
No10.9%
Yes
86.2%
In the public sector 93.8% of the centres are free of charge, while in the privatesector this figure amounts to 82.7%. The difference, although minimal, shows agreater tendency of free accommodation in public centres (Chart 18).
At the same time, over half of the centres offering accommodation do not con-sider it necessary to require work or compensation for staying at the centre,while 14.5% do consider it necessary. This confirms the network is easily ac-cessed.
Centres that require work or consideration of some kind
No50,3%
Non-response35,2%
Yes14,5%
No significant differences are appreciated to this end according to the public orprivate nature of the centres (Chart 19).
There are no relevant differences according to the size of the centres (Chart 20).
INE
. In
stit
uto
Nac
ion
al d
e E
stad
ísti
ca
28
Finally, we have only touched upon some aspects (possibility of receiving corre-spondence and use of a luggage room) related to the privacy of the individualwhile at the centre.
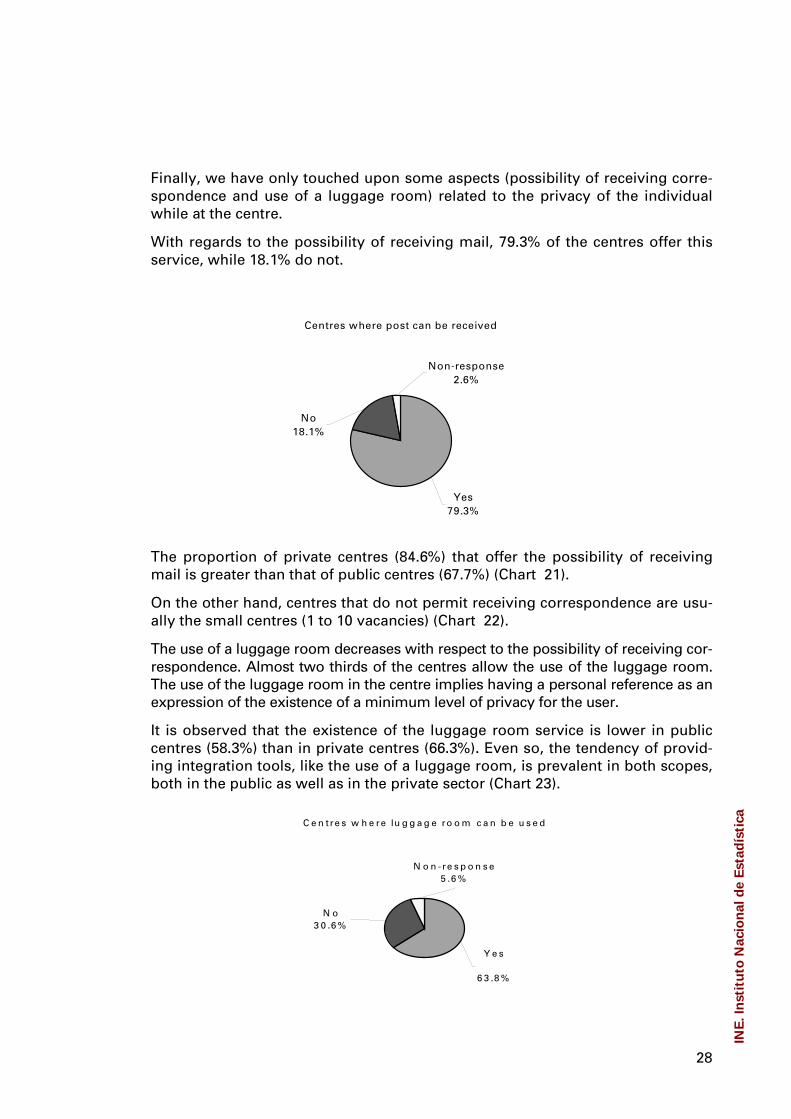
With regards to the possibility of receiving mail, 79.3% of the centres offer thisservice, while 18.1% do not.
Centres where post can be received
No18.1%
Non-response 2.6%
Yes79.3%
The proportion of private centres (84.6%) that offer the possibility of receivingmail is greater than that of public centres (67.7%) (Chart 21).
On the other hand, centres that do not permit receiving correspondence are usu-ally the small centres (1 to 10 vacancies) (Chart 22).
The use of a luggage room decreases with respect to the possibility of receiving cor-respondence. Almost two thirds of the centres allow the use of the luggage room.The use of the luggage room in the centre implies having a personal reference as anexpression of the existence of a minimum level of privacy for the user.
It is observed that the existence of the luggage room service is lower in publiccentres (58.3%) than in private centres (66.3%). Even so, the tendency of provid-ing integration tools, like the use of a luggage room, is prevalent in both scopes,both in the public as well as in the private sector (Chart 23).
C e n tre s w h e re lu g g a g e ro o m c a n b e u s e d
N o n -re s p o n s e5 .6 %
N o3 0 .6 %
Y e s
6 3 .8 %
INE
. In
stit
uto
Nac
ion
al d
e E
stad
ísti
ca
29
III.2 CATERING SERVICES
Amongst the centres that have collaborated in the survey, there are 387 that of-fer catering services and, in turn, 298 of these also offer accommodation. Ofthese 298, 84.2% of centres provide catering services to a minimum of ninety percent of the persons staying in same. This elevated proportion indicates that ac-commodation and catering services are significantly interrelated.
The average number of services offered daily in 2002 amounted to 37,657, andthe services offered on November 5th 2003 amounted to 39,086, which implies a3.8% increase with respect to the daily average for the previous year.
With the purpose of studying the density of the network, we have calculated theratio number of inhabitants per centre. The number of inhabitants per centreamounted to 111,533 for the year 2002, while it increased to 113,609 on Novem-ber 5th 2003. This increase in the number of inhabitants per centre is due to theclosure of some dining-room services from one year to the other.
As regards the type of centre, 25.8% of the centres that offered catering in 2002were public, while private centres amounted to 74.2%.
With regards to the number of services rendered, public centres provided 35.6%of the services in 2002, while the private centres offered 64.4%.
Nevertheless, we can observe that the proportion daily number of services percentre is greater in public centres than in the private centres, due to the fact thatpublic centres are larger (Chart 24).
By autonomous communities, considerable differences can be observed be-tween Ceuta and Melilla (due to their singular characteristics), Madrid, Murciaand Andalucía which are situated above the national average, and on the otherhand, Aragón, Castilla y León, Navarra and Castilla−La Mancha which are situ-ated well below the national average (Chart 25)
From the perspective of the size of the municipality, we can observe that the av-erage number of services offered daily by the centre is much lower in the centreslocated in municipalities with less then 50,000 inhabitants, while in those locatedin large municipalities this ratio is four times greater (Chart 26).
− Forms of the service
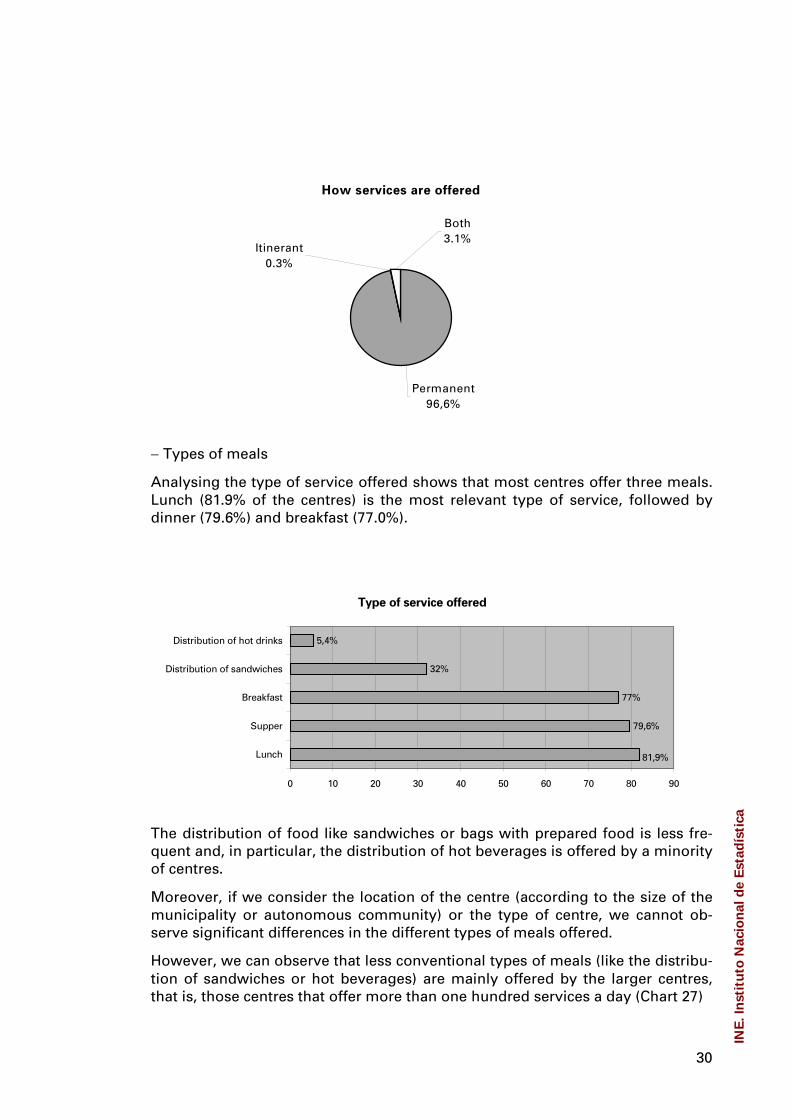
With respects to the form of offering the service, catering in a permanent loca-tion is the norm, given 96.6% of the centres offer it in this manner. 0.3% provideitinerant catering, and 3.1% of the centres offer it in both forms. So we can de-duce that, in nearly all cases, the users must go to the centre that offers theservice.
Since most centres offer the service in a permanent location, it is not considerednecessary to study the different forms of offering the service according to othercentre parameters (type of centre, location).
INE
. In
stit
uto
Nac
ion
al d
e E
stad
ísti
ca
30
How services are offered
Itinerant0.3%
Both3.1%
Permanent96,6%
− Types of meals
Analysing the type of service offered shows that most centres offer three meals.Lunch (81.9% of the centres) is the most relevant type of service, followed bydinner (79.6%) and breakfast (77.0%).
Type of service offered
81,9%
79,6%
77%
32%
5,4%
0 10 20 30 40 50 60 70 80 90
Lunch
Supper
Breakfast
Distribution of sandwiches
Distribution of hot drinks
The distribution of food like sandwiches or bags with prepared food is less fre-quent and, in particular, the distribution of hot beverages is offered by a minorityof centres.
Moreover, if we consider the location of the centre (according to the size of themunicipality or autonomous community) or the type of centre, we cannot ob-serve significant differences in the different types of meals offered.
However, we can observe that less conventional types of meals (like the distribu-tion of sandwiches or hot beverages) are mainly offered by the larger centres,that is, those centres that offer more than one hundred services a day (Chart 27)
INE
. In
stit
uto
Nac
ion
al d
e E
stad
ísti
ca

31
− Periods of activity
As regards the period of activity, most centres (86.1%) offer continuous servicesthroughout the whole of the year; centres that close for any period of time are aminority (13.9%). Therefore, the activity of the centres is mainly permanent, andallows the user to easily access to the network.
Centres by closing period
Closed for more than 60 days
2.8%
Closed for 31 days or less9.3%
Closed between 32 & 60 days
1.8%
Permanent86.1%
If we take into account the size of the municipality where the centre is located,the proportion of permanent centres in municipalities with over 50,000 inhabi-tants is greater, while centres with some kind of closing period are more fre-quent in small municipalities, in particular in the centres located in municipalitiesof between 20,000 and 50,000 inhabitants (Chart 28).
− Opening hours
Considering the centres opening hours, some have adapted to conventionalopening hours that would allow for the realisation of some sort of work on be-half of the users and, consequently, greater social integration.
The survey considers "adapted" centres as those centres that remain open, for atleast half an hour, within the following time intervals 7:30 to 10:00 for breakfast,13:00 to 15:30 for lunch, and 19:30 to 22:30 for dinner. Over 72% of the centresare adapted to the dinner time slot, and over 76% to the lunch time slot, whilemuch less are adapted to the breakfast time slot.
INE
. In
stit
uto
Nac
ion
al d
e E
stad
ísti
ca
32
Breakfast7.30 − 10.00
Lunch13.00 − 15.00
Supper19.30 − 22.30
Centres % Centres % Centres %
Adapted 258 66.7 296 76.5 279 72.1
Not adapted 129 33.3 91 23.5 108 27.9
The fact that the proportion of centres adapted to conventional time slots regis-ters relatively high values seems to indicate that the users of the centres maycarry out activities during normal hours.
If we take into account the size of the municipality where the centre is located(Chart 29), we can observe that for the strata of less than 20,000 inhabitants, thelunch and dinner time slots are more adapted than in the rest of the strata. Incentres located in cities with between 50,000 to 100,000 inhabitants, we can alsoobserve an adaptation to the conventional time slots that is above the nationalaverage.
It is worth mentioning that in cities with over 100,000 inhabitants the proportionof centres adapted to the lunch and dinner time slots is lower, which hinders thereintegration possibilities of the users of the centres.
− Centres according to vacancies and services offered
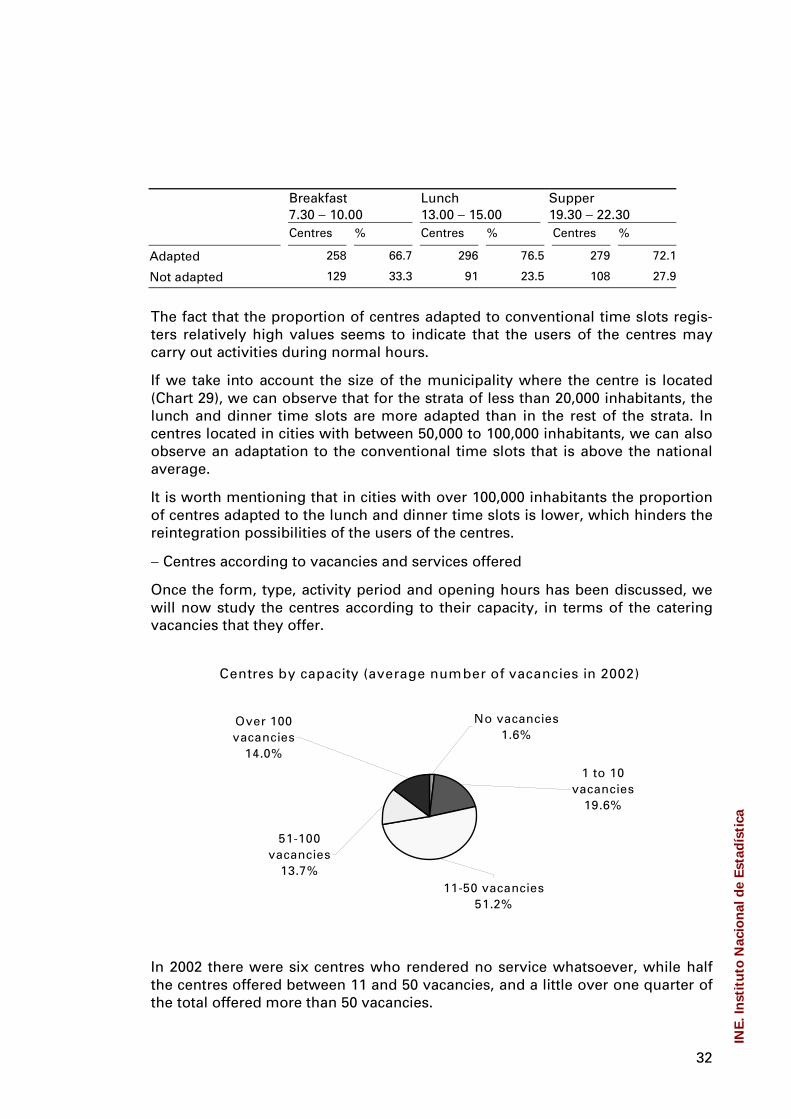
Once the form, type, activity period and opening hours has been discussed, wewill now study the centres according to their capacity, in terms of the cateringvacancies that they offer.
Centres by capacity (average number of vacancies in 2002)
11-50 vacancies51.2%
No vacancies1.6%
1 to 10 vacancies
19.6%
Over 100 vacancies
14.0%
51-100 vacancies
13.7%
In 2002 there were six centres who rendered no service whatsoever, while halfthe centres offered between 11 and 50 vacancies, and a little over one quarter ofthe total offered more than 50 vacancies.
INE
. In
stit
uto
Nac
ion
al d
e E
stad
ísti
ca
33
On the other hand, considering the capacity of the centres according to the typeof centre, there are no major differences with regards to the proportion of pub-lic/private centres among the different sizes considered. There is a greater inci-dence of private centres amongst smaller centres (between one and ten vacan-cies) (Chart 30).
During 2002, as we can observe in the graph, 236 centres offered the three tradi-tional meals, and of the rest, 70 offered two meals and 77 offered only one typeof meal, distributed in the manner detailed in the graph. It is worth highlightingthat more than two thirds of the centres that offered only one type of mealserved lunch. In those centres that offered two types of meals, more than halfopted for the combination breakfast and dinner, which, eventually, could belinked to accommodation.
In November 2003, centres continue using the same format for catering servicesas in 2002.
With regards to the type of services rendered, we observe that lunch is the serv-ice that is offered the most by the centres, followed by dinner and to a lesser ex-tent, breakfast.
The average number of services offered daily per centre has increased from 98.3in 2002 to 104.0 on November 5th 2003, which implies almost six more servicesper centre.
If we analyse the evolution by the type of service, we observe that it goes from33.4 breakfasts in 2002 to 34.3 served on November 5th 2003. In relation tolunches, the increase has been from 51.6 in 2002 to 55.7 in November 2003, ex-periencing the greatest growth. Lastly, dinners have increased from 36.3 dinnersoffered in 2002 to 38.1 as at the reference date of 2003 (Chart 31).
On the other hand, when analysing whether the public or private nature of thecentre influences the type of service offered, we see that private initiatives offertwo thirds of the meal services, reducing its relative weight in dinners and break-fasts.
Moreover, in public centres the number of breakfasts, lunches and dinners pro-vided is much more even than in private centres, where the number of lunches isnotably superior to that of breakfasts and dinners. This may be due to the assis-tance provided at lunchtime to other disadvantaged groups (Chart 32).
INE
. In
stit
uto
Nac
ion
al d
e E
stad
ísti
ca
34
IV Resources
IV.I HUMAN RESOURCES
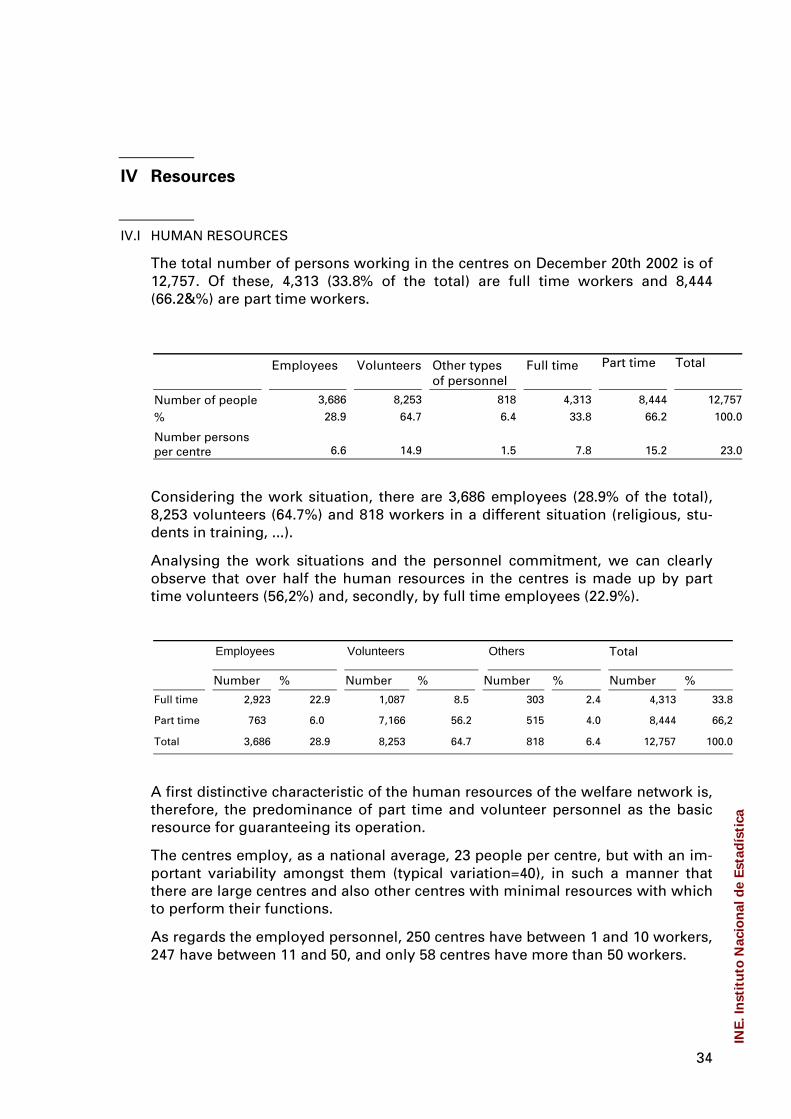
The total number of persons working in the centres on December 20th 2002 is of12,757. Of these, 4,313 (33.8% of the total) are full time workers and 8,444(66.2&%) are part time workers.
Employees Volunteers Other typesof personnel
Full time Part time Total
Number of people 3,686 8,253 818 4,313 8,444 12,757
% 28.9 64.7 6.4 33.8 66.2 100.0
Number personsper centre 6.6 14.9 1.5 7.8 15.2 23.0
Considering the work situation, there are 3,686 employees (28.9% of the total),8,253 volunteers (64.7%) and 818 workers in a different situation (religious, stu-dents in training, ...).
Analysing the work situations and the personnel commitment, we can clearlyobserve that over half the human resources in the centres is made up by parttime volunteers (56,2%) and, secondly, by full time employees (22.9%).
Employees Volunteers Others Total
Number % Number % Number % Number %
Full time 2,923 22.9 1,087 8.5 303 2.4 4,313 33.8
Part time 763 6.0 7,166 56.2 515 4.0 8,444 66,2
Total 3,686 28.9 8,253 64.7 818 6.4 12,757 100.0
A first distinctive characteristic of the human resources of the welfare network is,therefore, the predominance of part time and volunteer personnel as the basicresource for guaranteeing its operation.
The centres employ, as a national average, 23 people per centre, but with an im-portant variability amongst them (typical variation=40), in such a manner thatthere are large centres and also other centres with minimal resources with whichto perform their functions.
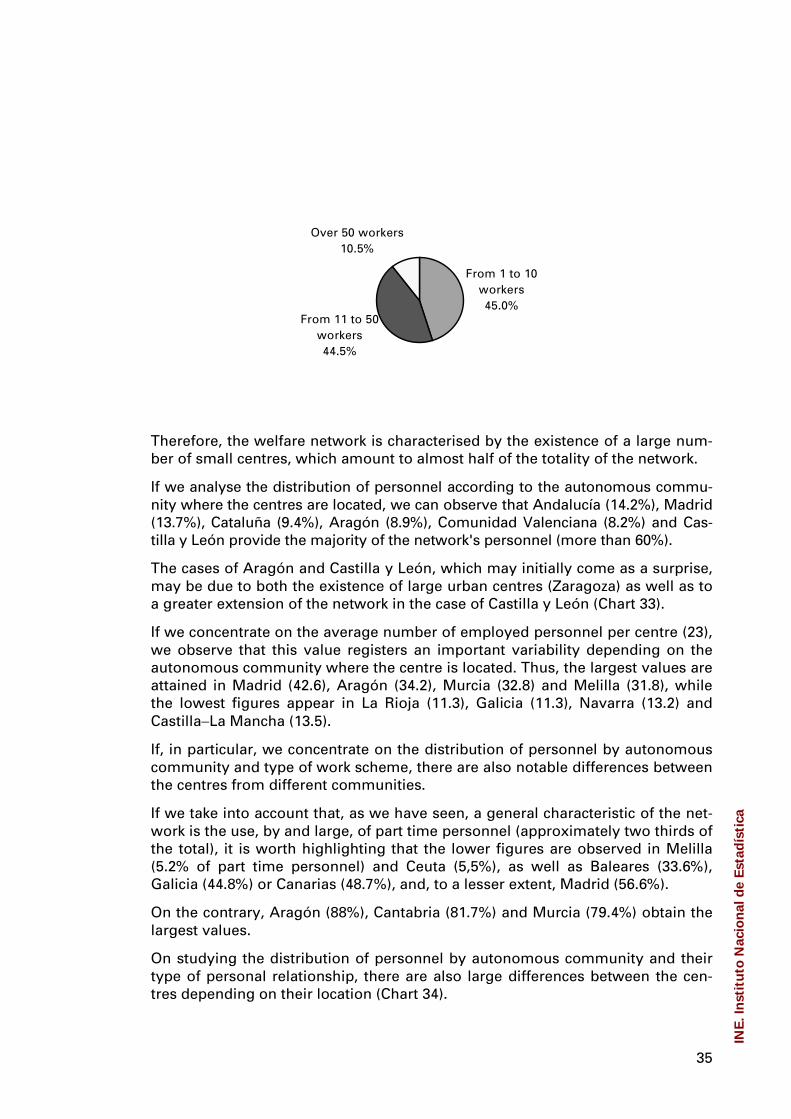
As regards the employed personnel, 250 centres have between 1 and 10 workers,247 have between 11 and 50, and only 58 centres have more than 50 workers.
INE
. In
stit
uto
Nac
ion
al d
e E
stad
ísti
ca
35
From 1 to 10 workers45.0%
From 11 to 50 workers 44.5%
Over 50 workers10.5%
Therefore, the welfare network is characterised by the existence of a large num-ber of small centres, which amount to almost half of the totality of the network.
If we analyse the distribution of personnel according to the autonomous commu-nity where the centres are located, we can observe that Andalucía (14.2%), Madrid(13.7%), Cataluña (9.4%), Aragón (8.9%), Comunidad Valenciana (8.2%) and Cas-tilla y León provide the majority of the network's personnel (more than 60%).
The cases of Aragón and Castilla y León, which may initially come as a surprise,may be due to both the existence of large urban centres (Zaragoza) as well as toa greater extension of the network in the case of Castilla y León (Chart 33).
If we concentrate on the average number of employed personnel per centre (23),we observe that this value registers an important variability depending on theautonomous community where the centre is located. Thus, the largest values areattained in Madrid (42.6), Aragón (34.2), Murcia (32.8) and Melilla (31.8), whilethe lowest figures appear in La Rioja (11.3), Galicia (11.3), Navarra (13.2) andCastilla−La Mancha (13.5).
If, in particular, we concentrate on the distribution of personnel by autonomouscommunity and type of work scheme, there are also notable differences betweenthe centres from different communities.
If we take into account that, as we have seen, a general characteristic of the net-work is the use, by and large, of part time personnel (approximately two thirds ofthe total), it is worth highlighting that the lower figures are observed in Melilla(5.2% of part time personnel) and Ceuta (5,5%), as well as Baleares (33.6%),Galicia (44.8%) or Canarias (48.7%), and, to a lesser extent, Madrid (56.6%).
On the contrary, Aragón (88%), Cantabria (81.7%) and Murcia (79.4%) obtain thelargest values.
On studying the distribution of personnel by autonomous community and theirtype of personal relationship, there are also large differences between the cen-tres depending on their location (Chart 34).
INE
. In
stit
uto
Nac
ion
al d
e E
stad
ísti
ca

36
Thus, we observe employee figures which are much higher than the national av-erage in Melilla (89.6%) and Ceuta (84.3%). Moreover, we can highlight the casesof Baleares (75.4%) and, to a lesser extent, La Rioja (52.4%), Canarias (50.8%) andGalicia (44.1%), which could be indicative of a greater level of professionalizationin the care given.
From the perspective of the size of the municipality where the centres are lo-cated, we appreciate slight differences in personnel according to the type of workscheme (Chart 35).
In particular, the centres located in cities with between 50,000 and 100,000 in-habitants present the largest proportions of full time personnel.
On the other hand, we also note a greater proportion of employees in the centreslocated in said types of cities (39.5% are employees), and, to a lesser extent, inthe centres located in cities of between 100,000 and 500,000 inhabitants (33.2%)(Chart 36)
However, notable differences are observed when considering the type of centre.In public centres, most of the personnel are employees (65.3%) while volunteersamount to a more modest (28.7%). In private centres the tendency is inverted,volunteers account for the majority of the personnel (72.6%), while employeesmake up a small part (20.9%).
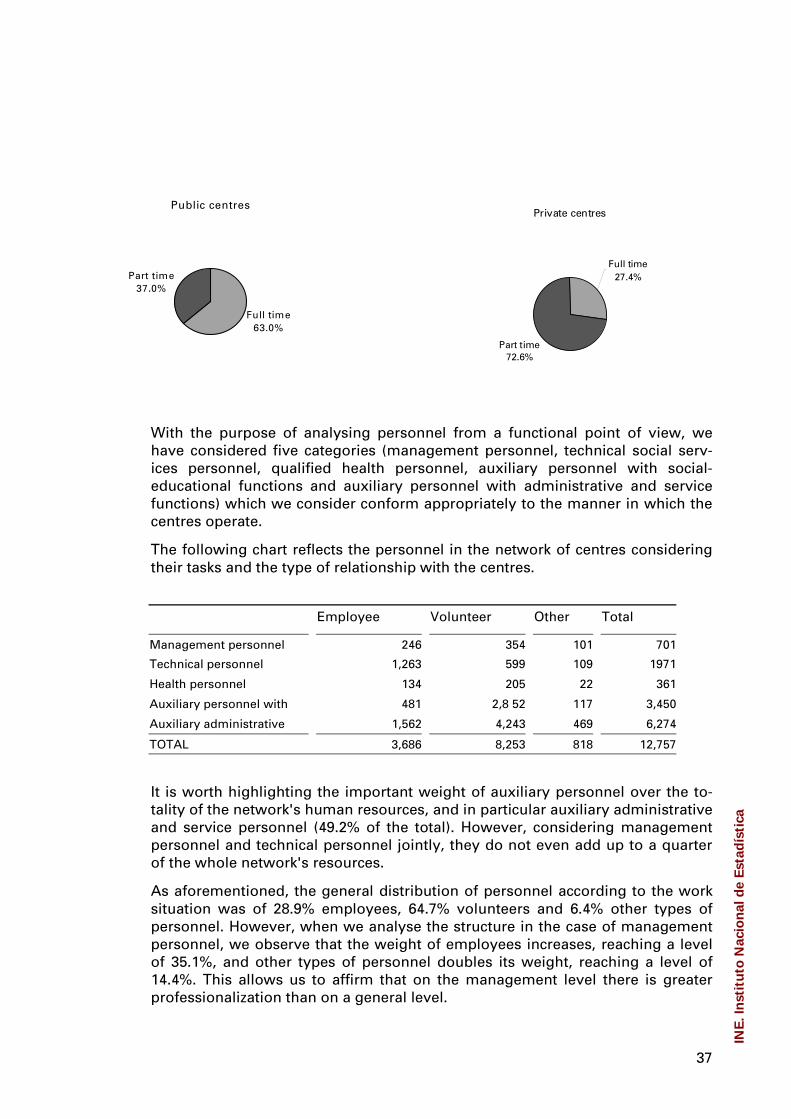
Similarly, this also occurs if we take into account the type of work scheme. Inpublic centres, most of the personnel are full time staff (63.0%). On the contrary,in private centres part time staff clearly makes up the majority (72.6%), whichindicates the duality of the network.
On the one hand, there is a network of private centres with more personnel (25.9people per centre) but with much less professional management (more volun-teers and on a part time basis), and on the other, a small public network, fre-quently acting in a subsidiary manner to the private network, on average muchsmaller (15.2 occupied personnel per centre) and with a much more profession-alised management (more full time employees).
Public Centres
Total employees
65.3%
Total Others6.0%
Total Volunteers
28.8%
Private Centres
Total Voluntteers
72.6%
Total Employees
20.9%
Total Others6.5%
INE
. In
stit
uto
Nac
ion
al d
e E
stad
ísti
ca
37
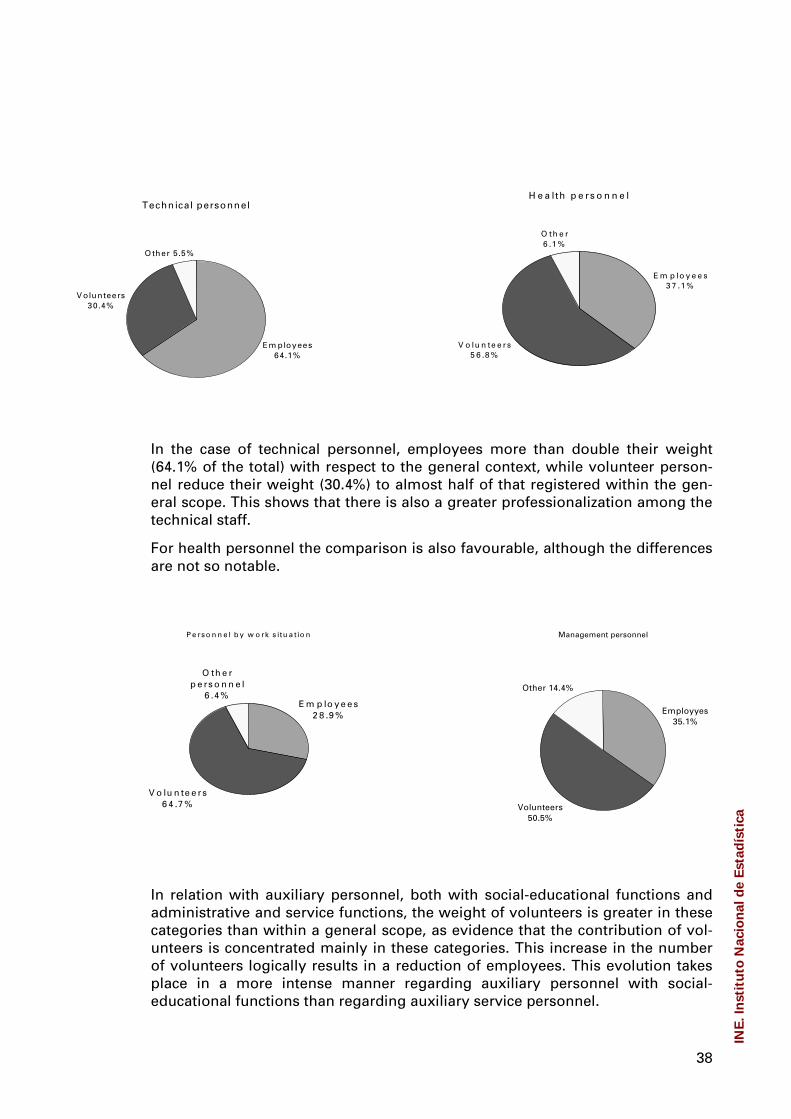
With the purpose of analysing personnel from a functional point of view, wehave considered five categories (management personnel, technical social serv-ices personnel, qualified health personnel, auxiliary personnel with social-educational functions and auxiliary personnel with administrative and servicefunctions) which we consider conform appropriately to the manner in which thecentres operate.
The following chart reflects the personnel in the network of centres consideringtheir tasks and the type of relationship with the centres.
Employee Volunteer Other Total
Management personnel 246 354 101 701
Technical personnel 1,263 599 109 1971
Health personnel 134 205 22 361
Auxiliary personnel withf
481 2,8 52 117 3,450
Auxiliary administrative 1,562 4,243 469 6,274
TOTAL 3,686 8,253 818 12,757
It is worth highlighting the important weight of auxiliary personnel over the to-tality of the network's human resources, and in particular auxiliary administrativeand service personnel (49.2% of the total). However, considering managementpersonnel and technical personnel jointly, they do not even add up to a quarterof the whole network's resources.
As aforementioned, the general distribution of personnel according to the worksituation was of 28.9% employees, 64.7% volunteers and 6.4% other types ofpersonnel. However, when we analyse the structure in the case of managementpersonnel, we observe that the weight of employees increases, reaching a levelof 35.1%, and other types of personnel doubles its weight, reaching a level of14.4%. This allows us to affirm that on the management level there is greaterprofessionalization than on a general level.
Public centres
Full time 63.0%
Part time 37.0%
Private centres
Part time 72.6%
Full time 27.4%
INE
. In
stit
uto
Nac
ion
al d
e E
stad
ísti
ca
38
In the case of technical personnel, employees more than double their weight(64.1% of the total) with respect to the general context, while volunteer person-nel reduce their weight (30.4%) to almost half of that registered within the gen-eral scope. This shows that there is also a greater professionalization among thetechnical staff.
For health personnel the comparison is also favourable, although the differencesare not so notable.
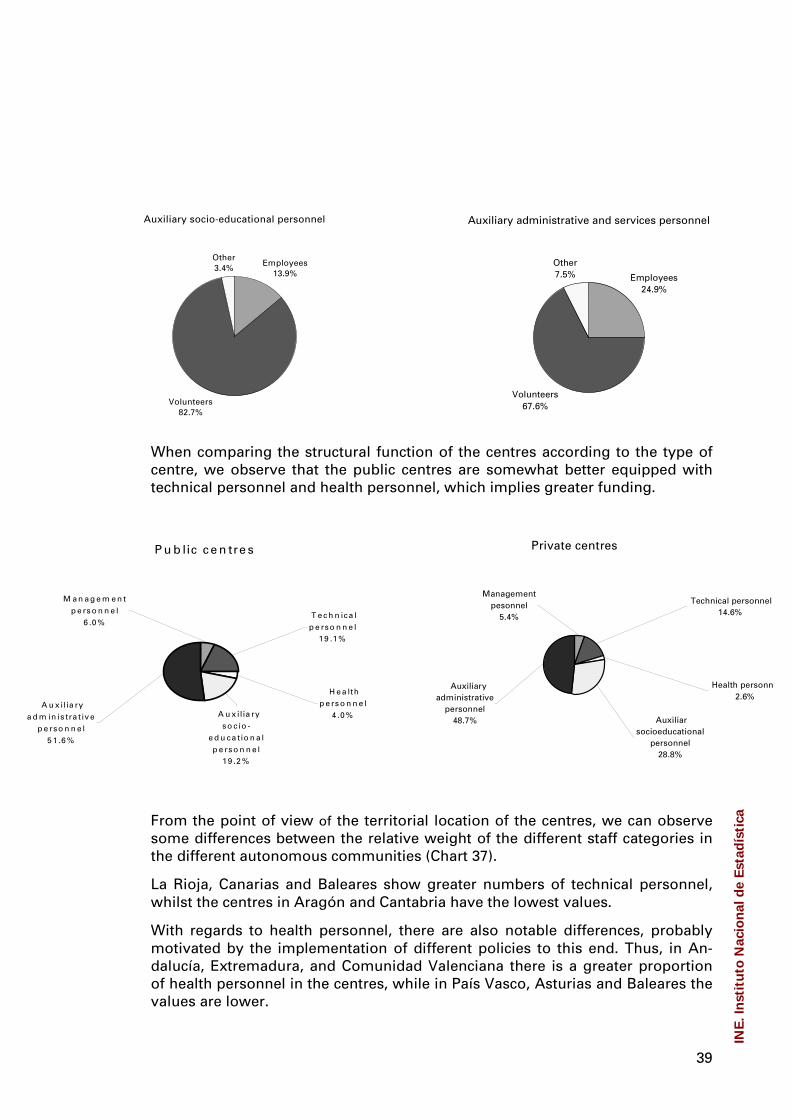
In relation with auxiliary personnel, both with social-educational functions andadministrative and service functions, the weight of volunteers is greater in thesecategories than within a general scope, as evidence that the contribution of vol-unteers is concentrated mainly in these categories. This increase in the numberof volunteers logically results in a reduction of employees. This evolution takesplace in a more intense manner regarding auxiliary personnel with social-educational functions than regarding auxiliary service personnel.
P e rso n n e l b y w o rk s itu a tio n
V o lu n te e rs6 4 .7 %
E m p lo y e e s2 8 .9 %
O th e r p e rs o n n e l
6 .4 %
Management personnel
Volunteers50.5%
Employyes35.1%
Other 14.4%
Technical personnel
Em ployees64.1%
V olunteers30.4%
O ther 5.5%
H e a lth p e rs o n n e l
E m p lo y e e s3 7 .1 %
V o lu n te e rs5 6 .8 %
O th e r6 .1 %
INE
. In
stit
uto
Nac
ion
al d
e E
stad
ísti
ca
39
When comparing the structural function of the centres according to the type ofcentre, we observe that the public centres are somewhat better equipped withtechnical personnel and health personnel, which implies greater funding.
From the point of view of the territorial location of the centres, we can observesome differences between the relative weight of the different staff categories inthe different autonomous communities (Chart 37).
La Rioja, Canarias and Baleares show greater numbers of technical personnel,whilst the centres in Aragón and Cantabria have the lowest values.
With regards to health personnel, there are also notable differences, probablymotivated by the implementation of different policies to this end. Thus, in An-dalucía, Extremadura, and Comunidad Valenciana there is a greater proportionof health personnel in the centres, while in País Vasco, Asturias and Baleares thevalues are lower.
Auxiliary socio-educational personnel
Volunteers82.7%
Employees13.9%
Other3.4%
Auxiliary administrative and services personnel
Volunteers67.6%
Employees24.9%
Other7.5%
Private centres
Auxiliary administrative
personnel48.7% Auxiliar
socioeducational personnel
28.8%
Health personn2.6%
Technical personnel14.6%
Management pesonnel
5.4%
P u b lic c e n tre s
A u x ilia ry a d m in is tra t iv e
p e rso n n e l5 1 .6 %
A u x ilia ry so c io -
e d u ca tio n a l p e rso n n e l
1 9 .2 %
H e a lth p e rs o n n e l
4 .0 %
T e c h n ica l p e rso n n e l
1 9 .1 %
M a n a g e m e n t p e rs o n n e l
6 .0 %
INE
. In
stit
uto
Nac
ion
al d
e E
stad
ísti
ca

40
In Murcia, País Vasco and Navarra there are very high values of auxiliary per-sonnel with social-educational functions.
Finally, in Asturias, Aragón and Cantabria greater proportions of auxiliary andservice personnel are attained.
With respect to the size of the municipality where the centres are located (Chart38), the structure of the personnel from a functional point of view shows thatcentres located in cities with between 100,000 and 500,000 inhabitants are thebest equipped with technical and health personnel, probably due to the inclusionin this strata of centres in provincial capitals and the most important cities whichhave a greater presence of public administrations and the most active associa-tions in the sector.
IV.2 FINANCIAL RESOURCES
In accordance with the information provided by the centres that have collabo-rated in the survey, the volume of annual expenditure in 2002 amounted to118.44 million euros, which implies an average expenditure of 213,416 euros percentre.
Considering expenditure per centre, almost half the centres of the network(48.8% of the total) have expenditure under 100,000 euros, that is, centres withlimited resources that mainly provide first aid care. 40.9% of the centres had ex-penditures of between 100,000 and 500,000 euros. The largest centres with morediversified services and a budget over half a million euros only amount to 10.3%of the total.
Centres %
Less than or equal to 100,000€ 271 48.8Between 100,001 and 500,000€ 227 40.9Between 500,001 and 1,000,000€ 41 7.4Over 1,000,000€ 16 2.9Total 555 100.0
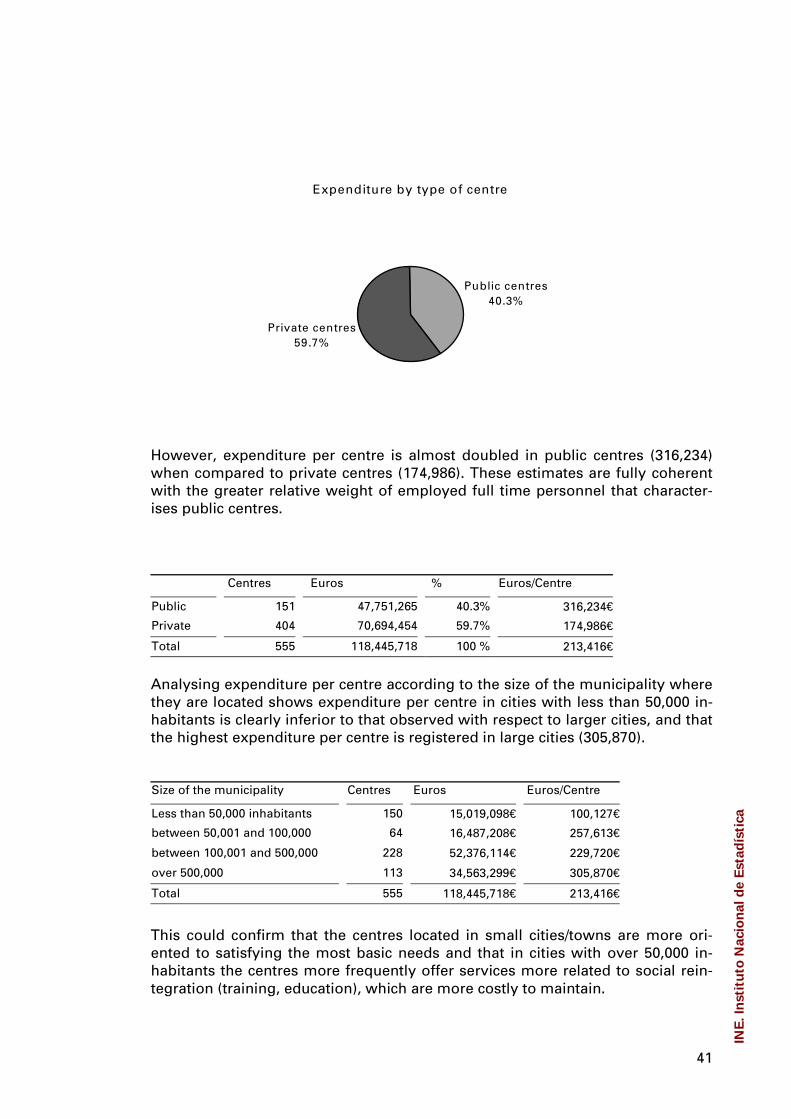
Considering the type of centre, notable differences are observed between thefinancial resources available for the public and private centres. Total expendi-tures of the public centres amount to 47.75 million euros, which implies 40.3% oftotal expenditures. On the other hand, the expenditure of private centresamounts to 70.69 millions euros, which implies 59.75% of total expenditure
INE
. In
stit
uto
Nac
ion
al d
e E
stad
ísti
ca
41
Expenditure by type of centre
Private centres59.7%
Public centres40.3%
However, expenditure per centre is almost doubled in public centres (316,234)when compared to private centres (174,986). These estimates are fully coherentwith the greater relative weight of employed full time personnel that character-ises public centres.
Centres Euros % Euros/Centre
Public 151 47,751,265 40.3% 316,234€
Private 404 70,694,454 59.7% 174,986€
Total 555 118,445,718 100 % 213,416€
Analysing expenditure per centre according to the size of the municipality wherethey are located shows expenditure per centre in cities with less than 50,000 in-habitants is clearly inferior to that observed with respect to larger cities, and thatthe highest expenditure per centre is registered in large cities (305,870).
Size of the municipality Centres Euros Euros/Centre
Less than 50,000 inhabitants 150 15,019,098€ 100,127€
between 50,001 and 100,000 64 16,487,208€ 257,613€
between 100,001 and 500,000 228 52,376,114€ 229,720€
over 500,000 113 34,563,299€ 305,870€
Total 555 118,445,718€ 213,416€
This could confirm that the centres located in small cities/towns are more ori-ented to satisfying the most basic needs and that in cities with over 50,000 in-habitants the centres more frequently offer services more related to social rein-tegration (training, education), which are more costly to maintain.
INE
. In
stit
uto
Nac
ion
al d
e E
stad
ísti
ca

42
From the perspective of the territorial location of the centres, notable differencescan be observed in the expenditure per centre according to the autonomouscommunity where the centre is located, until reaching the proportion of four toone in the most extreme cases.
Faced with such a notable difference and taking into account the small numberof centres located in some autonomous communities, we have preferred not tomake these results public because we understand that they are not sufficientlyconsistent.
How are the centres financed?
In accordance with the possible sources of finance∗, it is observed that 40.2% ofthe centres have one sole source of financing, 47.0% have one main source offinancing (that is, which contributes more than half of total funds) and 12.8%have non-predominant financing, that is, stemming from different sources, with-out majority contributions from any of them.
This means almost 90% of the centres have a source of financing which mayhave a bearing on the management and orientation of the centres.
Centres by source of financing
M ain source of financing
47.0%
Single source of financing
40.2%
No m ain financing
12.8%
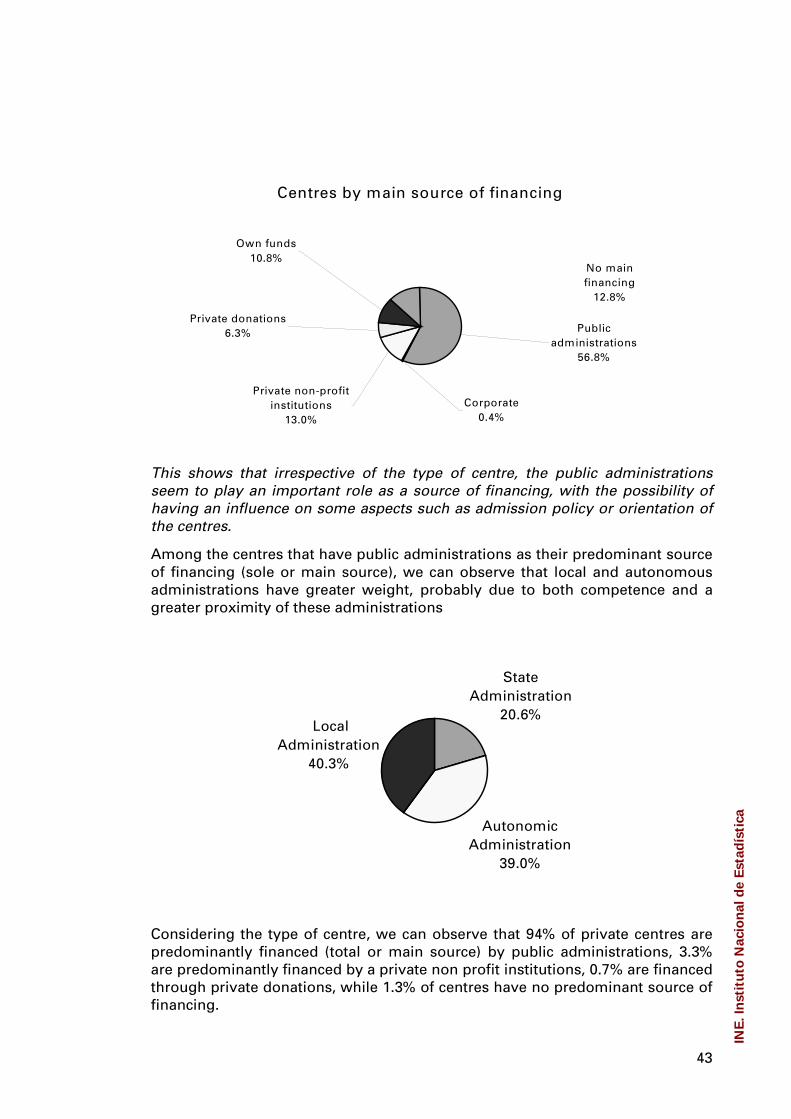
On the other hand, analysing the different types of predominant financing (Chart39) shows that 56.8% of the centres have the public administration as their soleor main source of financing, 13.0% of the centres have private non profit institu-tions as their sole or main source of financing, 10.8% of centres are financedsolely or mainly through their own funds, 6.3% through private donations and0.4% by companies.
(*) The questionnaire of the survey considered as possible sources of finance the public administrations (state,autonomous and local), companies, private non-profit institutions (associations, foundations, the Catholic church,other religious entities), private donations and their own funds.
INE
. In
stit
uto
Nac
ion
al d
e E
stad
ísti
ca
43
Centres by main source of financing
Public administrations
56.8%
No main financing
12.8%
Own funds10.8%
Private donations6.3%
Corporate0.4%
Private non-profit institutions
13.0%
This shows that irrespective of the type of centre, the public administrationsseem to play an important role as a source of financing, with the possibility ofhaving an influence on some aspects such as admission policy or orientation ofthe centres.
Among the centres that have public administrations as their predominant sourceof financing (sole or main source), we can observe that local and autonomousadministrations have greater weight, probably due to both competence and agreater proximity of these administrations
Autonomic Administration
39.0%
LocalAdministration
40.3%
State Administration
20.6%
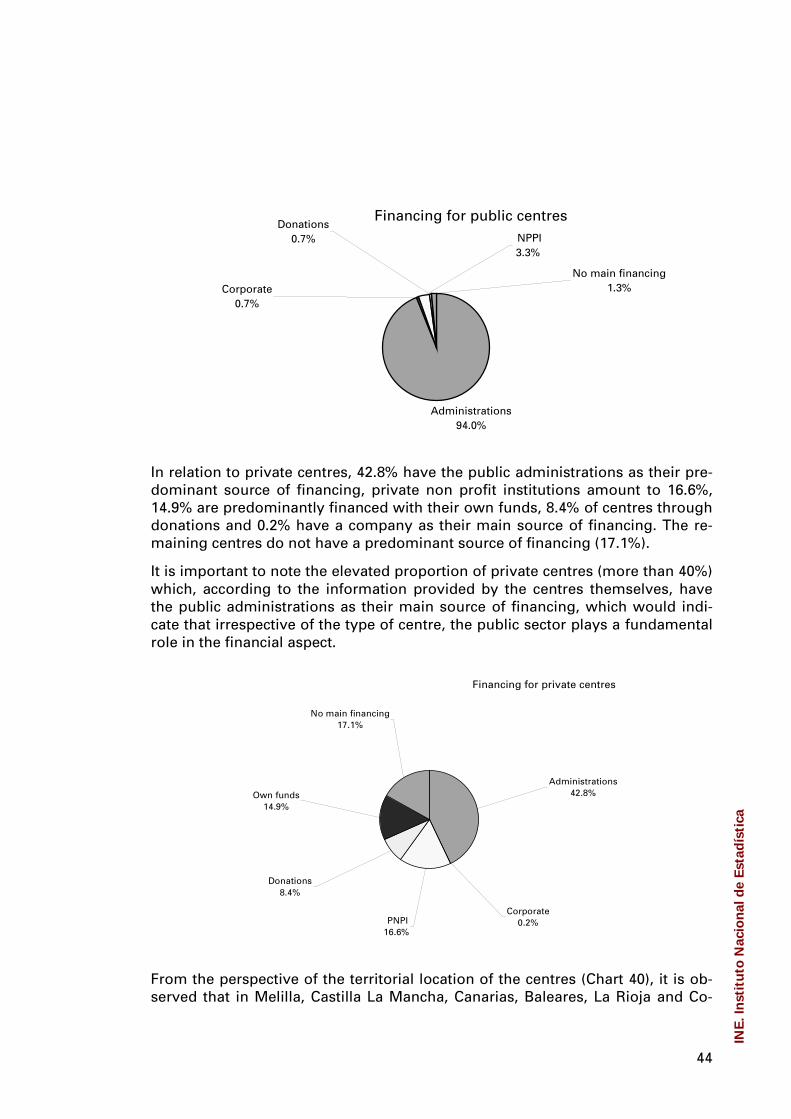
Considering the type of centre, we can observe that 94% of private centres arepredominantly financed (total or main source) by public administrations, 3.3%are predominantly financed by a private non profit institutions, 0.7% are financedthrough private donations, while 1.3% of centres have no predominant source offinancing.
INE
. In
stit
uto
Nac
ion
al d
e E
stad
ísti
ca
44
Financing for public centres NPPI3.3%
Donations0.7%
Corporate0.7%
No main financing1.3%
Administrations94.0%
In relation to private centres, 42.8% have the public administrations as their pre-dominant source of financing, private non profit institutions amount to 16.6%,14.9% are predominantly financed with their own funds, 8.4% of centres throughdonations and 0.2% have a company as their main source of financing. The re-maining centres do not have a predominant source of financing (17.1%).
It is important to note the elevated proportion of private centres (more than 40%)which, according to the information provided by the centres themselves, havethe public administrations as their main source of financing, which would indi-cate that irrespective of the type of centre, the public sector plays a fundamentalrole in the financial aspect.
Financing for private centres
Administrations42.8%
Corporate0.2% PNPI
16.6%
Donations8.4%
Own funds14.9%
No main financing 17.1%
From the perspective of the territorial location of the centres (Chart 40), it is ob-served that in Melilla, Castilla La Mancha, Canarias, Baleares, La Rioja and Co-
INE
. In
stit
uto
Nac
ion
al d
e E
stad
ísti
ca

45
munidad Valenciana the proportion of centres financed predominantly (totally ormainly) by the public administrations clearly exceeds the national average.
In Navarra, Aragón and Cantabria the proportion of centres financed predomi-nantly by private non profit institutions is greater.
The centres predominantly financed through donations are more frequent inMadrid, Andalucía and Galicia.
Lastly, in Navarra, Ceuta and Castilla y León financing with their own fundsseems to have greater importance than in other autonomous communities.
If we analyse the predominant source of financing according to the volume ofexpenditure of the centres (Chart 41) it can be observed that the public admini-strations are the predominant sources of financing (sole or main source) for allthe centres, irrespective of the volume of expenditures of the centres.
In the smaller centres (with an expenditure volume equal to or below 100,000euros) it is more frequent for the predominant source of financing to be a privatenon profit institution.
Amongst the larger centres (with more than 1 million euros of expenditure) theproportion of centres who have their own funds as the predominant source offinancing is greater.
Finally, it is important to note that there is no significant difference in the propor-tion of centres without a main source of financing amongst the centres with alower volume of expenditure. Amongst the larger centres, the existence of a pre-dominant source of financing is more common (93.7% of the centres).
V Users of the centres
V.1 NUMBER OF NETWORK USERS
1. Users of centres offering accommodation.
We have already discussed the major difficulty of estimating the number ofhomeless people, which initially depends on the definition adopted. In accor-dance with our approach, the survey offers a reliable estimate of the users of thewelfare network that offers accommodation, which constitutes the minimumnumber of homeless people. Nevertheless, it would be necessary to add thosepeople that have had no contact with the centres (people who sleep in places notdesigned to be lived in, squatters, people living in shacks ...).
Of the 555 centres that have responded, there are 410 centres that render ac-commodation services. This implies 73.9% of the total. Of these, 298 centres of-fer accommodation and catering services, that is, 53.7% of the total.
As inferred from the survey, the average number of vacancies offered daily dur-ing the year 2002 by said centres amounted to 11,316 and 12,139 on November
INE
. In
stit
uto
Nac
ion
al d
e E
stad
ísti
ca

46
5th 2003, thus implying an increase of 7.3% with regards to the average value for2002.
The average number of vacancies offered daily per centre during the year 2002would be 27.6 and the same statistic referred to the 5th of November 2003, in-creases to 29.6.
If we consider that the network detected (as a result of the collection of the sur-vey data and the subsequent work performed to set up the final directory of cen-tres) amounts to 619 centres, and that for the centres that have not responded tothe survey we know how many offer accommodation services and their capacityon November 5th 2003. The total number of centres that offer accommodationwould be 445.
The total number of accommodation vacancies would be of 13,439 as on No-vember 5th 2003 and of 12,585 in 2002 (we have assumed that the centres thathave not responded to the survey and for which we know their capacity as onNovember 5th have experienced the same increase in capacity as the centresthat have responded to the survey).
If we compare this with the 5,526 accommodation vacancies facilitated by theMinistry for Labour and Social Affairs in 1994, and with the 9,765 vacancies esti-mated by Cabrera in 1999, the figure of 13,439 vacancies on November 5thseems coherent. In any case, it seems rather scarce for a country of the size ofSpain with an official population of 42.7 million on January 1st 2003.
On the other hand, as is inferred from the survey, the level of use of the accom-modation network is high. The average number of vacancies occupied during2002 is of 9,416 (implying an occupation rate of 82.3%) and of 9,784 vacancies inNovember of 2003 (which is equivalent to an 80.3% occupation rate).
Although the level of occupancy is conditioned, amongst other factors, by theadmission policy and the management of the services provided, two characteris-tics are observed: a greater level of occupancy of the centres situated in the largeurban areas and, on the other hand, a certain seasonal character, with highervalues in winter than in summer.
If we assume that for the centres that have not responded to the survey the levelof occupancy is the same as for the centres that have collaborated, the averagenumber of occupied vacancies in 2002 would be of 10,308 and of 10,791 in No-vember of 2003.
In some way, the occupied accommodation vacancies would represent theminimum number of people attended to by the welfare network and, therefore,the number of homeless people in Spain.
Although this is not an issue that has been studied at length, within an interna-tional scope it is accepted that the ratio between homeless people without lodg-ing and homeless people with lodging may be of 1:2 (Burt and Cohen, 1989) or1:1 (Whright, 1998). This would allow us to estimate, under the full occupancyhypothesis, the number of homeless people, which could be in the vicinity of19,000-25,000 persons in 2002 or of 20,000-27,000 persons in November 2003.
INE
. In
stit
uto
Nac
ion
al d
e E
stad
ísti
ca
47
If we carry out the correction derived from the occupation level (82.3% in 2002and 80.3% as on November 5th 2003) provided by the survey, we obtain 15,600-20,600 in 2002 and 16,000-21,500 in 2003 as an approximation of the number ofhomeless people.
2. Users of the centres offering catering services.
Of the 555 centres that have responded, 410 centres render accommodationservices, which implies 73.9% of the total; of these, as highlighted above, 298centres offer accommodation and catering services (53.7% of the total number ofcentres).
As is inferred from the survey, the average number of vacancies offered dailyduring the year 2002 by said centres amounted to 21,256 and 21,389 on November5th 2003, which implies a slight increase of 0.6%. The average number of vacan-cies per centre was estimated at 54.9 in 2002 and at 55.3 on November 5th 2003.
If we consider that the network that has been detected amounts to 619 centresand that, for the centres that have not responded to the survey we know from thesubsequent work performed to compile the final directory how many centres of-fer catering services, as well as their capacity on November 5th 2003, the totalnumber of centres that offer meals would be 415.
The total number of catering vacancies would be of 22,853 on November 5th2003 and of 22,716 in 2002.
From the use of the network perspective, the average number of services provideddaily (breakfast, lunch and dinner) during the year 2002 amounts, according to thesurvey, to 37,657 (9,839 breakfasts, 16,678 lunches and 11,140 dinners).
The services rendered on November 5th 2003 amounted to 39,086 (10,024 break-fasts, 17,647 lunches and 11,415 dinners), which implies an increase of 3.8%(1.9%, 5.8% and 2.5% respectively) with regards to the average values from thepreceding year.
It is worth highlighting, in the two temporal references considered, that thenumber of breakfasts offered is closer to the number of overnight stays than tothe number of dinners. Lunch is the most provided meal by those offering ca-tering services, which could be due to the fact that it is considered the most im-portant meal of the day and, on the other hand, to the existence of a group ofusers of lunchtime catering services who have a place to sleep at night, even ifthey live in a precarious situation.
This would indicate that the group of users of accommodation services is morerestricted than the group of users of the catering services..
If we consider the complementary information on the centres that have not re-sponded to the survey, but for which we have information regarding how manyoffer catering services, as well as their capacity on November 5th 2003 (866 pla-zas) and, moreover, we also assume that the occupancy rate is the same as thatof the centres that have replied, we would obtain the total number of servicesrendered on November 5th 2003 to be 41,454 (10,664 breakfasts, 18,731 lunches,
INE
. In
stit
uto
Nac
ion
al d
e E
stad
ísti
ca

48
12,059 dinners). If we assume that the variation between the average values of2002 and November of 2003 is the same as that reflected in the survey, the aver-age number of services rendered in 2002 would amount to 39,936 (10,423 break-fasts, 17,652 lunches, 11,861 dinners).
If we can consider the number of users of the accommodation services to obtainan idea of the minimum number of homeless people, perhaps it may be feasibleto "improve" that first approximation, assuming that one part of the differencebetween the people who eat at lunchtime in centres offering catering servicesand those that sleep in centres offering accommodation, are homeless peoplethat do not use the welfare network (in the broadest sense, that is hostels, bed &breakfasts and apartments) for sleeping.
Unfortunately, there are no studies that allow us to be more precise in our esti-mate, although if we assumed that half of this difference were homeless peopleand the other half were people in a more or less precarious situation, this wouldlead, in our case, to an estimate of around 18,500 homeless people (on Novem-ber 5th 2003) and of 17,600 people for 2002, as an annual average. These esti-mates do not differ substantially from what we have obtained from the accom-modation data.
V.2 CHARACTERISTICS OF THE NETWORK USERS
Although, as stated in the introduction, the objective of the survey was not tostudy the socio-demographic profile and the living conditions of the people thatuse these services, we can deduce, nevertheless, some characteristics of thetypical user to which the welfare network is oriented.
The user of the centres is, preferably, one person (male or female); the numberof couples or adults with children seen as potential users of the network is nota-bly lower.
On the other hand, it seems that immigrants (58.2%), alcoholics (43.1%), drugaddicts (40.8%) and, to a lesser extent, former prisoners (33.4%) and batteredwomen (26.8%), are the population groups that those responsible for the centresconsider as the most frequent users.
However, those people who live or lived for a lengthy period of their lives in aninstitution (hospital, reformatory,...) or who have even been socialised in institu-tions, do not seem to constitute the most frequent users of these services.
Although we are unaware of the average duration of the stays of the users, tak-ing into account the self-classification of the network of centres (emergency,short stays or long stays), we can come to an understanding of the profile of theuser from this perspective. Thus, the majority of centres admit stays superior toone month (61.2%) and, to a lesser extent, attend to emergency situations(44.7%) or short stays −between one week and one month− (28.3%).
This lack of information on the profile of the user shows the need for occasionallycarrying out –four or five years– a specific survey for the users of the network.
INE
. In
stit
uto
Nac
ion
al d
e E
stad
ísti
ca

49
V.3 DEFINITION OF HOMELESS PERSON
One of the greatest difficulties, if not the greatest, that appears when attemptingto study social exclusion in-depth and, particularly, the most extreme situation ofsame, like the lack of a home, is that of adopting the definition of a homelessperson.
The discussions and debates on the issue are very intense and there are differentperceptions existing. This gives rise to the proposal of more or less broad defini-tions (based on living conditions, on mobility or lack of a permanent dwelling, orsocial problems). Within a European context, the situation is very disparate:some countries have a legal and official definition (United Kingdom, Finland,Sweden), whilst in others there is no definition whatsoever, as occurs in Spain.
Thus, taking into account the Spanish participation in the Group of Experts onHomeless People Statistics, which is debating the methodological frameworkthat will serve as a reference in obtaining a consistent and harmonised approxi-mation on an EU level, it was decided to include in the survey questionnaire car-ried out at the centres, a question relative to the definition of a homeless person.
Concretely, those responsible for the centres were asked their opinion on thedraft definition that was being handled by the Group of Experts at that time, andwhich is transcribed below:
"A homeless person is somebody who does not have access to accommodationthat may be reasonably lived in, both in cases where the accommodation is le-gally their property or it is rented; provided by institutions; provided by employ-ers; or occupied free of charge under a contractual agreement or an agreementof another type.
Consequently, they are forced to sleep:
1. In the street.
2. In buildings which are commonly considered not to offer the necessary condi-tions for human habitability (privacy, hygiene, space).
3. In emergency homes provided by the public sector or charities.
4. In long term residences provided by the public sector, or charities (non-emergency centres, shelters for battered women, deportation centres for asylumseekers or illegal immigrants).
5. In boarding houses.
6. In other short term accommodation (duration less than one month).
7.Squatting.
Note.
This definition does not consider persons living in the following types of ac-commodation:
INE
. In
stit
uto
Nac
ion
al d
e E
stad
ísti
ca
50
• Hospitals; mental health centres; old people's homes.
• Prisons; reformatories.
• Student residences; boarding schools.
• Orphanages adoption homes.
• Barracks; military missions.
• Moored ships.
• Mobile homes (circuses).
• Au-pairs; domestic service; hotel personnel who live in the hotel.
• Tourists staying in hotels.
• Subsidised accommodation (for low income)."
Of the 555 centres that collaborated in the survey, the majority of the centresmanifested their conformity with the definition proposed (78.7%), 20% expressedtheir disagreement and 1.3% did not respond. Of the 111 centres that expressedtheir disagreement, the majority (more than 70%) proposed an alternative defini-tion, expressed in the following terms:
“A homeless person is an individual who cannot access or maintain adequateaccommodation, adapted to his/her personal, permanent situation and whichprovides a stable framework for coexistence, be it due to economic, social orpersonal reasons that prevent him/her from living autonomously"1.
(1) At the time of the compilation of this Report, a meeting of the EUROSTAT Group of Experts has been held, inwhich this question has been debated once again, provisionally adopting a new working definition.
INE
. In
stit
uto
Nac
ion
al d
e E
stad
ísti
ca

Annexe 1
Bibliography
INE
. In
stit
uto
Nac
ion
al d
e E
stad
ísti
ca

52
Avramov, Dragana, (Ed.) (1999) “Coping with Homelessness: Issues to be Tack-led and best Practices in Europe”. Aldershot Ashgate Pub.
Burt, Martha et al.(1996) “Practical Methods for Counting the Homeless”: AManual for State and Local Jurisdictions. 2nd Ed. Washington D.C.: The UrbanInstitute Press.
Cabrera Cabrera, Pedro José (2000) “La acción social con personas sin hogar enEspaña”. Madrid. Cáritas Española-Universidad Pontificia de Comillas.
Edgar, Bill; Doherty, Joe ; Meert, Henk (2003) “Review of Statistics onHomelessness in Europe. Brussels”. FEANTSA.
Insee (2001) “Enquête auprès des personnes fréquentant les servicesd’hébergement ou les distributions de repas chauds”. (Different documents andarticles. Coordinated by Cécile Brousse)
Interagency Council on the homeless (1999) Homelessness: “Programs and thePeople They Serve. Findings of the National Survey of Homelessness AssistanceProviders and Clients”. (Different documents compiled by different researchers,including the Technical Report among others).
Muñoz, Manuel; Vazquez, Carmelo ; Vazquez, Juan José (2003). “Los limites de laexclusión”. Madrid. Ediciones Témpora. Fundación Caja Madrid.
Tezanos, José Félix (1998). “Tendencias en exclusión social en las sociedadestecnológicas”. “El caso español”. Madrid: Fundación Sistema.
INE
. In
stit
uto
Nac
ion
al d
e E
stad
ísti
ca

Annexe 2
Questionnaire
INE
. In
stit
uto
Nac
ion
al d
e E
stad
ísti
ca

Naturaleza, características y finalidad
Secreto Estadístico
Esta encuesta se dirige a los centros que prestan servicio a las personas sin hogar. Su finalidad es conocer las característicasgenerales del funcionamiento y organización de los centros, así como de los servicios que prestan.
Serán objeto de protección y quedarán amparados por el , los datos personales que obtengan los serviciosestadísticos, tanto directamente de los informantes como a través de fuentes administrativas (art. 13.1 de la Ley de la FunciónEstadística Pública de 9 de mayo de 1989 (LFEP)).Todo el personal estadístico tendrá la obligación de preservar el secreto estadístico(art. 17.1 de la LFEP).
La Ley 4/1990 establece la que se soliciten para la elaboración de esta Estadística.Los servicios estadísticos podrán solicitar datos de todas las personas físicas y jurídicas nacionales y extranjeras, residentes enEspaña (art. 10.1 de la LFEP).Todas las personas físicas y jurídicas que suministren datos, tanto si su colaboración es obligatoria como voluntaria,
a las preguntas ordenadas en la debida forma por parte de los serviciosestadísticos (art. 10.2 de la LFEP).
de las obligaciones establecidas en esta Ley, en relación con las estadísticas para fines estatales,de acuerdo con lo dispuesto en las normas contenidas en el presenteTítulo (art. 48.1 de la LFEP).Las infracciones muy graves serán sancionadas con multas de 3.005,07 a 30.050,61 euros. Las infracciones graves seránsancionadas con multas de 300,51 a 3.005,06 euros. Las infracciones leves se sancionarán con multas de 60,10 a 300,51 euros (art.51.1, 51,2 y 51.3 de la LFEP)
Legislación Estadística de cumplimentación obligatoria
secreto estadístico
obligación de facilitar los datos
debencontestar de forma veraz, exacta, completa y dentro del plazo
El incumplimiento será sancionado
Obligación de facilitar los datos
Encuesta sobre las personas sin hogar
(Centros)
A. Datos de identificación
Entidad encargada de la gestión
Mod. EPSH-Cen.
Modificaciones en la identificación. (Cumplimentar sólo los apartados sujetos a variación)
Nombre del centro
Dirección
Código postal Municipio Provincia
Teléfono E-mail Nombre del titular
Por favor, cumplimente en primer lugar este apartado
Persona de contacto a quién dirigirseIN
E. I
nst
itu
to N
acio
nal
de
Est
adís
tica
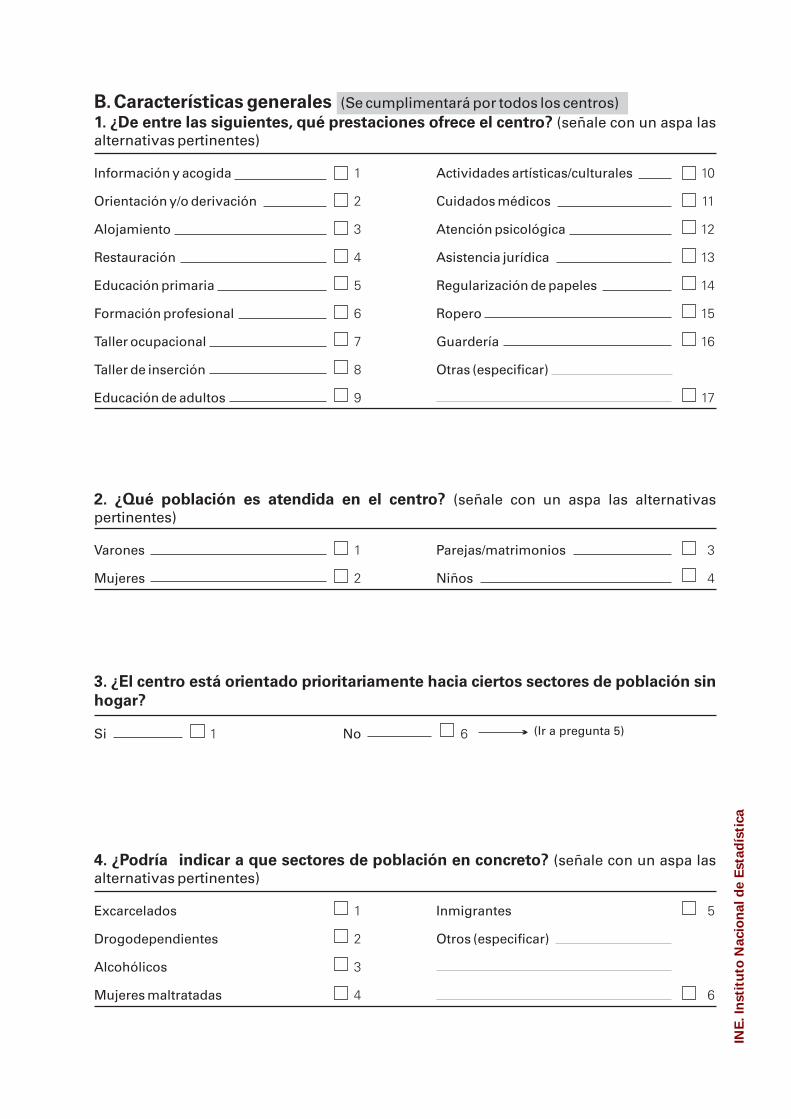
B. Características generales (Se cumplimentará por todos los centros)1. ¿De entre las siguientes, qué prestaciones ofrece el centro? (señale con un aspa lasalternativas pertinentes)
Información y acogida Actividades artísticas/culturales
Orientación y/o derivación Cuidados médicos
Alojamiento Atención psicológica
Restauración Asistencia jurídica
Educación primaria Regularización de papeles
Formación profesional Ropero
Taller ocupacional Guardería
Taller de inserción Otras (especificar)
Educación de adultos
1 10
2 11
3 12
4 13
5 14
6 15
7 16
8
9 17
2. ¿Qué población es atendida en el centro? (señale con un aspa las alternativaspertinentes)
Varones Parejas/matrimonios
Mujeres Niños
1 3
2 4
3. ¿El centro está orientado prioritariamente hacia ciertos sectores de población sin
hogar?
Si No1 6 (Ir a pregunta 5)
4. ¿Podría indicar a que sectores de población en concreto? (señale con un aspa lasalternativas pertinentes)
Excarcelados
Drogodependientes
Alcohólicos
1
2
3
Inmigrantes
Otros (especificar)
Mujeres maltratadas
5
4 6
INE
. In
stit
uto
Nac
ion
al d
e E
stad
ísti
ca
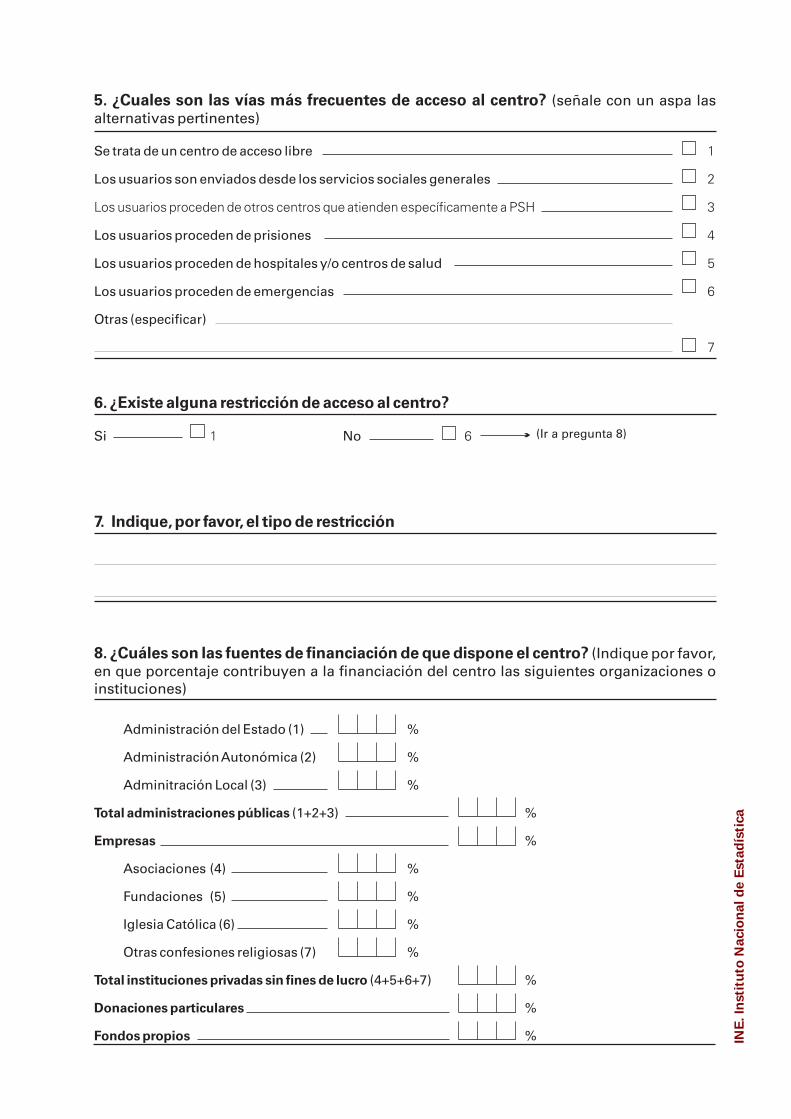
5. ¿Cuales son las vías más frecuentes de acceso al centro? (señale con un aspa lasalternativas pertinentes)
Se trata de un centro de acceso libre
Los usuarios son enviados desde los servicios sociales generales
Los usuarios proceden de prisiones
Los usuarios proceden de hospitales y/o centros de salud
Los usuarios proceden de emergencias
Otras (especificar)
1
2
Los usuarios proceden de otros centros que atienden específicamente a PSH 3
4
5
6
7
6. ¿Existe alguna restricción de acceso al centro?
Si No1 6 (Ir a pregunta 8)
7. Indique, por favor, el tipo de restricción
8. ¿Cuáles son las fuentes de financiación de que dispone el centro? (Indique por favor,en que porcentaje contribuyen a la financiación del centro las siguientes organizaciones oinstituciones)
Administración del Estado (1) %
AdministraciónAutonómica (2) %
Adminitración Local (3) %
(1+2+3) %
%
Asociaciones (4) %
Fundaciones (5) %
Iglesia Católica (6) %
Otras confesiones religiosas (7) %
(4+5+6+7) %
%
%
Total administraciones públicas
Empresas
Total instituciones privadas sin fines de lucro
Donaciones particulares
Fondos propios INE
. In
stit
uto
Nac
ion
al d
e E
stad
ísti
ca
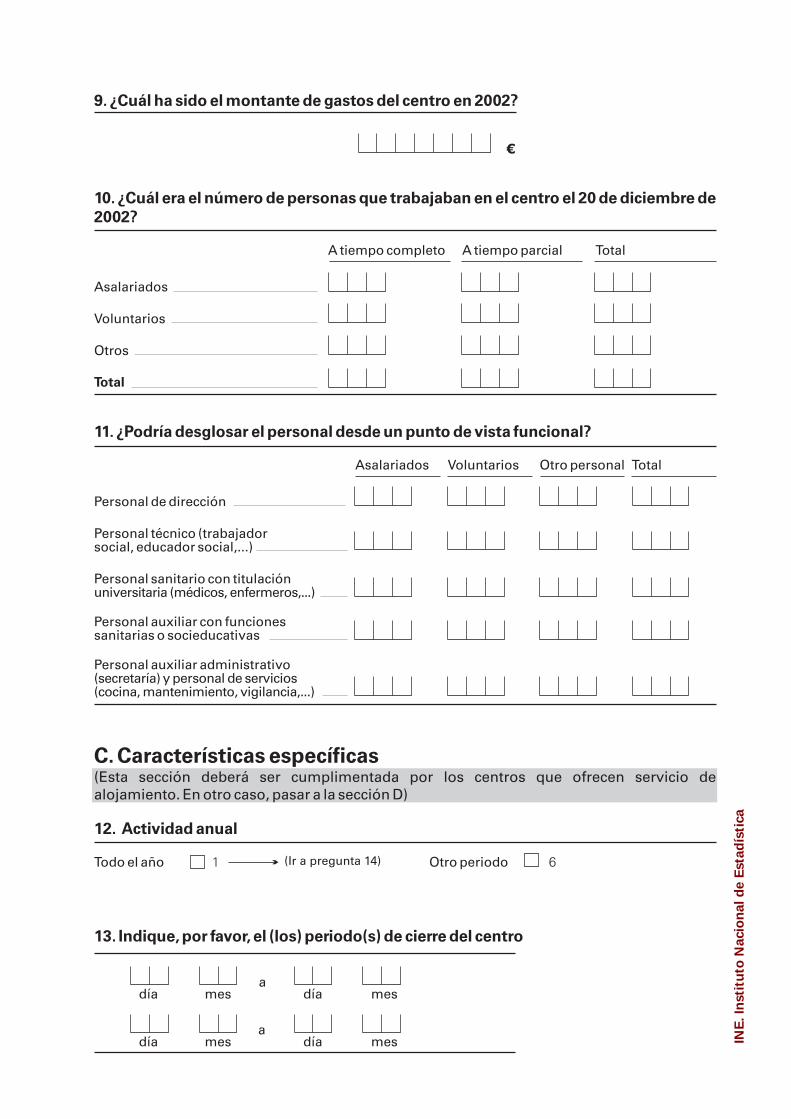
9. ¿Cuál ha sido el montante de gastos del centro en 2002?
€
10. ¿Cuál era el número de personas que trabajaban en el centro el 20 de diciembre de
2002?
A tiempo completo A tiempo parcial Total
Asalariados
Voluntarios
Otros
Total
11. ¿Podría desglosar el personal desde un punto de vista funcional?
Asalariados Voluntarios Otro personal Total
Personal de dirección
Personal técnico (trabajadorsocial, educador social,...)
Personal sanitario con titulaciónuniversitaria (médicos, enfermeros,...)
Personal auxiliar con funcionessanitarias o socieducativas
Personal auxiliar administrativo(secretaría) y personal de servicios(cocina, mantenimiento, vigilancia,...)
C. Características específicas(Esta sección deberá ser cumplimentada por los centros que ofrecen servicio dealojamiento. En otro caso, pasar a la sección D)
12. Actividad anual
Todo el año Otro periodo1 6(Ir a pregunta 14)
13. Indique, por favor, el (los) periodo(s) de cierre del centro
adía mes día mes
día mes día mesa
INE
. In
stit
uto
Nac
ion
al d
e E
stad
ísti
ca
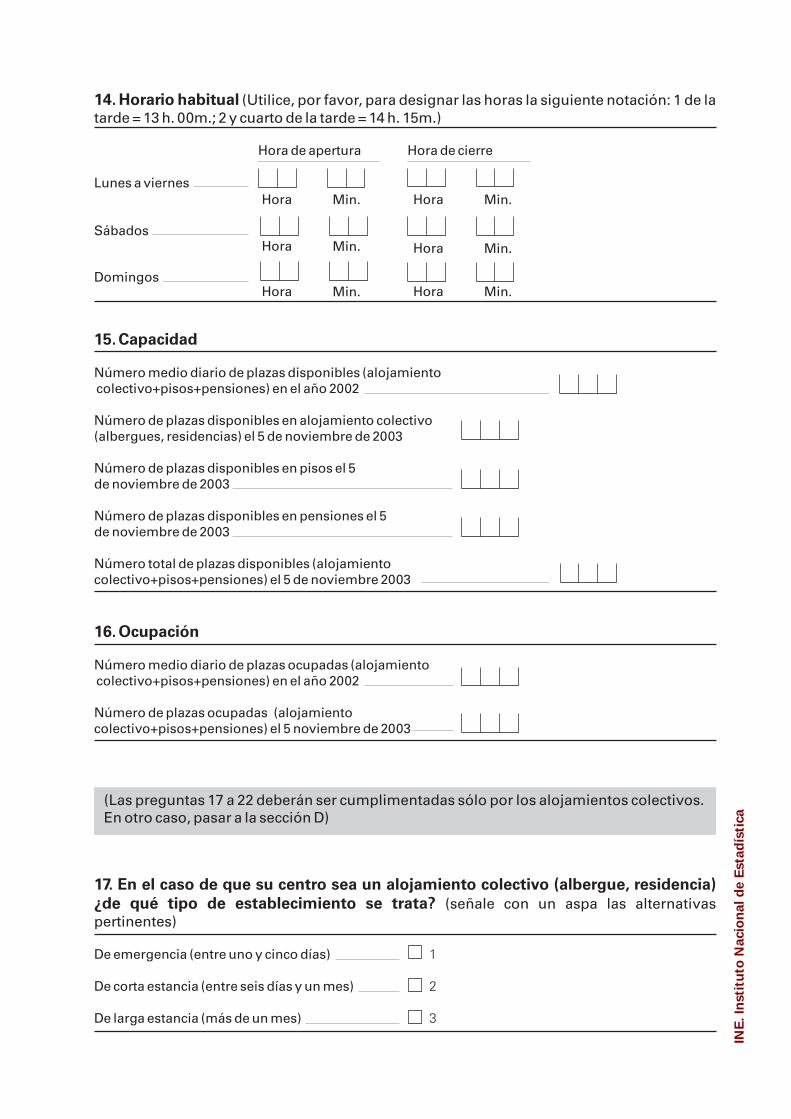
14. Horario habitual (Utilice, por favor, para designar las horas la siguiente notación: 1 de latarde = 13 h. 00m.; 2 y cuarto de la tarde = 14 h. 15m.)
Hora de apertura Hora de cierre
Lunes a viernes
Sábados
Domingos
Hora Min.
Hora Min.
Hora Min.
Hora Min.
Hora Min.
Hora Min.
15. Capacidad
Número medio diario de plazas disponiblescolectivo+pisos+pensiones) en el año 2002
Número de plazas disponibles en alojamiento colectivo(albergues, residencias) el 5 de noviembre de 2003
Número de plazas disponibles en pisos el 5de noviembre de 2003
Número total de plazas disponibles (alojamientocolectivo+pisos+pensiones) el 5 de noviembre 2003
(alojamiento
Número de plazas disponibles en pensiones el 5de noviembre de 2003
16. Ocupación
Número medio diario de plazas ocupadascolectivo+pisos+pensiones) en el año 2002
Número de plazas ocupadas
(alojamiento
(alojamientocolectivo+pisos+pensiones) el 5 noviembre de 2003
(Las preguntas 17 a 22 deberán ser cumplimentadas sólo por los alojamientos colectivos.En otro caso, pasar a la sección D)
17. En el caso de que su centro sea un alojamiento colectivo (albergue, residencia)
¿de qué tipo de establecimiento se trata? (señale con un aspa las alternativaspertinentes)
De emergencia (entre uno y cinco días)
De corta estancia (entre seis días y un mes)
De larga estancia (más de un mes)
1
2
3
INE
. In
stit
uto
Nac
ion
al d
e E
stad
ísti
ca
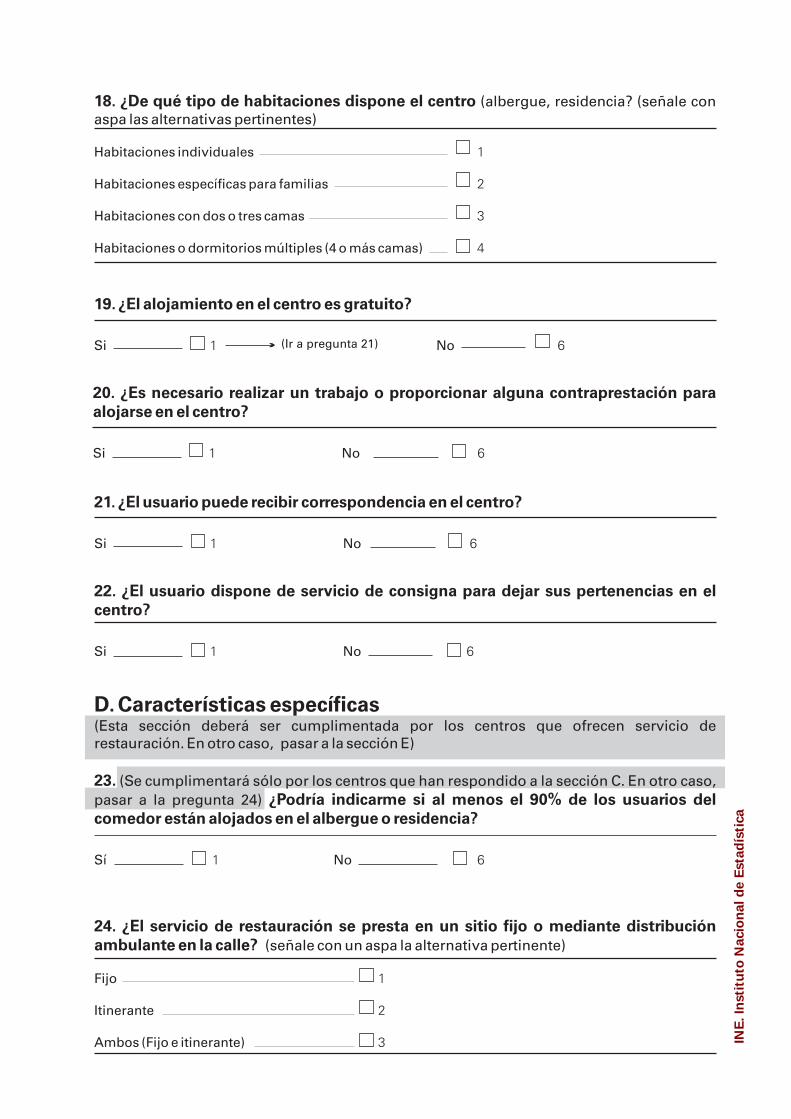
18. ¿De qué tipo de habitaciones dispone el centro (albergue, residencia? (señale conaspa las alternativas pertinentes)
Habitaciones individuales
Habitaciones específicas para familias
Habitaciones con dos o tres camas
Habitaciones o dormitorios múltiples (4 o más camas)
1
2
3
4
19. ¿El alojamiento en el centro es gratuito?
Si No1 6(Ir a pregunta 21)
20. ¿Es necesario realizar un trabajo o proporcionar alguna contraprestación para
alojarse en el centro?
Si No1 6
21. ¿El usuario puede recibir correspondencia en el centro?
Si No1 6
22. ¿El usuario dispone de servicio de consigna para dejar sus pertenencias en el
centro?
Si No1 6
D. Características específicas(Esta sección deberá ser cumplimentada por los centros que ofrecen servicio derestauración. En otro caso, pasar a la sección E)
23.
¿Podría indicarme si al menos el 90% de los usuarios del
comedor están alojados en el albergue o residencia?
(Se cumplimentará sólo por los centros que han respondido a la sección C. En otro caso,pasar a la pregunta 24)
Sí No1 6
24. ¿El servicio de restauración se presta en un sitio fijo o mediante distribución
ambulante en la calle? (señale con un aspa la alternativa pertinente)
Fijo
Itinerante
Ambos (Fijo e itinerante)
1
2
3 INE
. In
stit
uto
Nac
ion
al d
e E
stad
ísti
ca

25. ¿Que tipo de servicio presta? (señale con un aspa la alternativa pertinente)
Comida
Cena
Desayuno
Distribución de bocadillos o bolsas de alimentos
Distribución de sopa o bebidas calientes
1
2
3
4
5
26.Actividad anual
Todo el año Otro periodo1 6(Ir a pregunta 28)
27. Indique, por favor, el (los) periodo (s) de cierre del centro
día mes
día mes
día mes
día mes
a
a
28. Horario habitual (Utilice, por favor, para designar las horas la siguiente notación: 1 de latarde = 13 h. 00m.; 2 y cuarto de la tarde = 14 h. 15m.)
Desayuno
Comida
Hora de apertura Hora de cierre
Lunes a viernes
Sábados
Domingos
Lunes a viernes
Sábados
Domingos
Lunes a viernes
Sábados
Domingos
Cena
Hora Min.
Hora Min.
Hora Min.
Hora Min.
Hora Min.
Hora Min.
Hora Min.
Hora Min.
Hora Min.
Hora Min.
Hora Min.
Hora Min.
Hora Min.
Hora Min.
Hora Min.
Hora Min.
Hora Min.
Hora Min.
INE
. In
stit
uto
Nac
ion
al d
e E
stad
ísti
ca

29. Capacidad
Número medio diario de plazas de comedor disponibles en el año 2002
Número de plazas de comedor disponibles el 5 noviembre de 2003
30. Ocupación
Número medio diario de servicios(desayunos+comidas+cenas) prestados en el año 2002
Desayunos
Comidas
CenasNúmero de servicios (desayunos+comidas+cenas)prestados el 5 de noviembre de 2003
Desayunos
Comidas
Cenas
E. (Se cumplimentará por todos los centros)Definición de persona sin hogar
31. ¿En su opinión, le parece adecuada la siguiente definición de persona sin hogar?
Si No1 6
Definición
"
1.2.
3.4.
5.6.7.
NOTA.
Una persona sin hogar es alguien que no tiene acceso a un alojamiento que puede razonablemente ser habitado, tanto siel alojamiento es legalmente de su propiedad como si es alquilado; proporcionado por instituciones; proporcionado porempleadores; u ocupado de forma gratuita bajo un acuerdo contractual o de otro tipo.
En consecuencia están obligados a dormir:En la calle.En edificios que comúnmente se considera que no reúnen condiciones para la habitabilidad humana (privacidad;
higiene; espacio).En residencias de emergencia proporcionadas por el sector público u organizaciones benéficas.En residencias de larga estancia proporcionadas por el sector público, o organizaciones benéficas (centros de no-
emergencia, refugios para mujeres maltratadas, centros de deportación para solicitantes de asilo o inmigrantes ilegales).En pensiones.En otros alojamientos de corta estancia (duración menor a un mes).En casas ocupadas.
Se excluyen las personas que viven en las siguientes clases de alojamiento:Hospitales; casa de salud mental; centros para personas mayores.Prisiones; reformatorios.Residencias de estudiantes; internados.Orfelinatos; casas de adopción.Cuarteles; misiones militares.Barcos amarrados.Casa móviles (circos).Au-pairs; servicio doméstico; personal de hotel que vive en el propio hotel.Turistas alojados en hoteles.Alojamientos subvencionados (bajos ingresos).
32. ¿Que modificaciones o sugerencias propondría a la misma?
INE
. In
stit
uto
Nac
ion
al d
e E
stad
ísti
ca

Annexe 3
Charts
INE
. In
stit
uto
Nac
ion
al d
e E
stad
ísti
ca

63
Chart 1
Centres by autonomous communities and size of the munici-
pality where centre is located (Continues)
Less than 5,000inhabitants
Between 5,001 and20,000
Between 20,001 and50000
Centres % Centres % Centres %
Andalucía 0 0.0 3 4.2 10 14.1
Aragón 1 3.0 18 54.5 2 6.1
Asturias (Principado de) 0 0.0 1 7.7 2 15.4
Balears (Illes) 0 0.0 0 0.0 6 40.0
Canarias 1 2.8 1 2.8 1 2.8
Cantabria 0 0.0 1 12.5 0 0.0
Castilla León 4 8.0 7 14.0 6 12.0
Castilla−La Mancha 6 15.4 12 30.8 7 17.9
Cataluña 0 0.0 9 15.8 5 8.8
Comunidad Valenciana 0 0.0 2 4.0 8 16.0
Extremadura 2 11.8 1 5.9 4 23.5
Galicia 0 0.0 5 13.5 2 5.4
Madrid (Comunidad de) 0 0.0 0 0.0 4 9.8
Murcia (Región de) 0 0.0 1 4.8 6 28.6
Navarra (Comunidad Foral de) 2 14.3 1 7.1 2 14.3
País Vasco 1 2.9 3 8.8 0 0.0
Rioja (La) 1 9.1 2 18.2 0 0.0
Autonomous City of Ceuta 0 0.0 0 0.0 0 0.0
Autonomous City of Melilla 0 0.0 0 0.0 0 0.0
TOTAL 18 3.2 67 12.1 65 11.7
INE
. In
stit
uto
Nac
ion
al d
e E
stad
ísti
ca

64
Chart 1
Centres by autonomous communities and size of the municipality
where centre is located (Conclusion)
Between 50001and 100000
Between 100001and 500000
Over 500000 Total
Centres % Centres % Centres % Centres %
Andalucía 7 9.9 33 46.5 18 25.4 71 100.0
Aragón 0 0.0 0 0.0 12 36.4 33 100.0
Asturias (Principado de) 1 7.7 9 69.2 0 0.0 13 100.0
Balears (Illes) 0 0.0 9 60.0 0 0.0 15 100.0
Canarias 1 2.8 32 88.9 0 0.0 36 100.0
Cantabria 1 12.5 6 75.0 0 0.0 8 100.0
Castilla León 10 20.0 23 46.0 0 0.0 50 100.0
Castilla−La Mancha 11 28.2 3 7.7 0 0.0 39 100.0
Cataluña 2 3.5 14 24.6 27 47.4 57 100.0
Comunidad Valenciana 4 8.0 15 30.0 21 42.0 50 100.0
Extremadura 4 23.5 6 35.3 0 0.0 17 100.0
Galicia 13 35.1 17 45.9 0 0.0 37 100.0
Madrid (Comunidad de) 0 0.0 2 4.9 35 85.4 41 100.0
Murcia (Región de) 2 9.5 12 57.1 0 0.0 21 100.0
Navarra (Comunidad Foral de) 0 0.0 9 64.3 0 0.0 14 100.0
País Vasco 0 0.0 30 88.2 0 0.0 34 100.0
Rioja (La) 0 0.0 8 72.7 0 0.0 11 100.0
Autonomous City of Ceuta 4 100.0 0 0.0 0 0.0 4 100.0
Autonomous City of Melilla 4 100.0 0 0.0 0 0.0 4 100.0
TOTAL 64 11.5 228 41.1 113 20.4 555 100.0
INE
. In
stit
uto
Nac
ion
al d
e E
stad
ísti
ca

65
Chart 2
Proportion of centres that offer the service by autonomous
community (Continues)
Informationand shelter
Orientation Accommodation Catering Primaryeducation
VocationalTraining
% % % % % %Andalucía 85.9 78.9 67.6 80.3 2.8 4.2
Aragón 69.7 66.7 72.7 60.6 0.0 0.0
Asturias (Principado de) 92.3 84.6 69.2 69.2 0.0 0.0
Balears (Illes) 93.3 93.3 73.3 86.7 0.0 0.0
Canarias 77.8 77.8 63.9 66.7 11.1 2.8
Cantabria 100.0 87.5 87.5 87.5 0.0 0.0
Castilla León 90.0 80.0 80.0 62.0 4.0 8.0
Castilla−La Mancha 76.9 74.4 92.3 56.4 7.7 7.7
Cataluña 59.6 56.1 77.2 82.5 1.8 1.8
Comunidad Valenciana 80.0 68.0 76.0 66.0 0.0 0.0
Extremadura 76.5 76.5 64.7 70.6 5.9 0.0
Galicia 83.8 64.9 75.7 67.6 2.7 0.0
Madrid (Comunidad de) 63.4 61.0 61.0 75.6 0.0 0.0
Murcia (Región de) 95.2 90.5 81.0 52.4 14.3 4.8
Navarra (Comunidad Foral de) 92.9 71.4 71.4 64.3 14.3 0.0
País Vasco 82.4 88.2 61.8 64.7 5.9 2.9
Rioja (La) 90.9 63.6 100.0 54.5 9.1 0.0
Autonomous City of Ceuta 75.0 50.0 100.0 100.0 0.0 0.0
Autonomous City of Melilla 75.0 75.0 75.0 100.0 0.0 0.0
TOTAL 79.6 73.2 73.9 69.7 4.0 2.5
INE
. In
stit
uto
Nac
ion
al d
e E
stad
ísti
ca
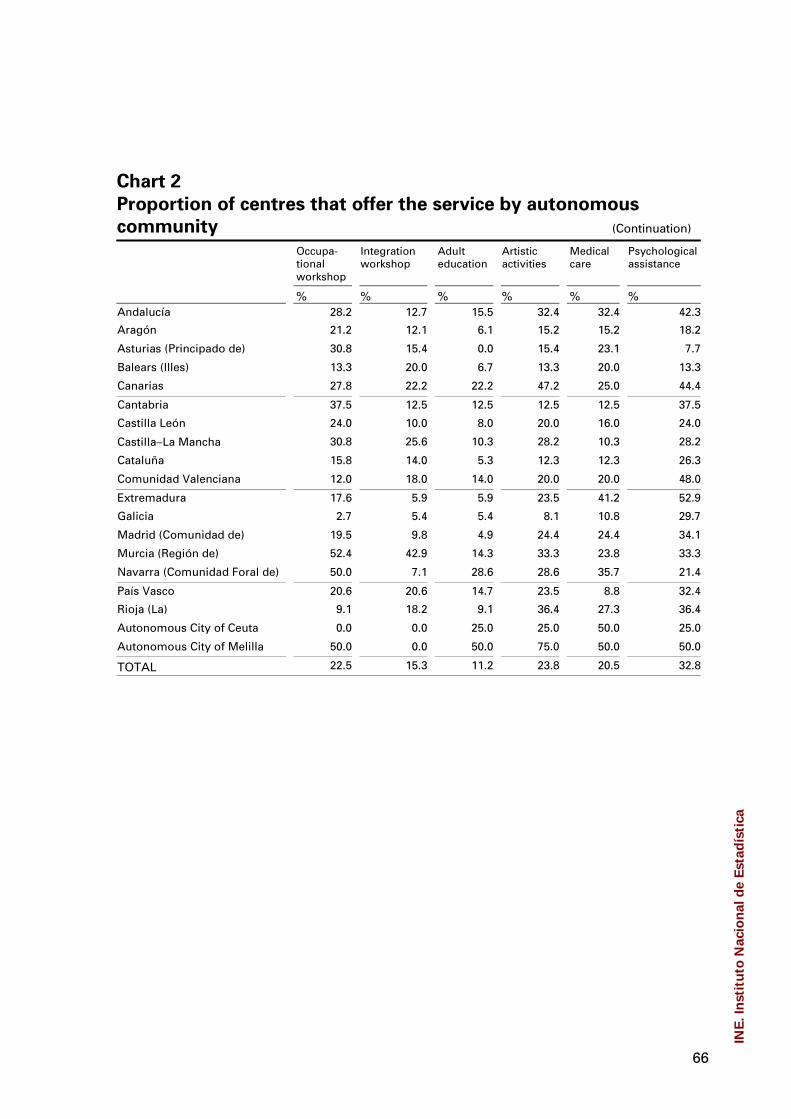
66
Chart 2
Proportion of centres that offer the service by autonomous
community (Continuation)
Occupa-tionalworkshop
Integrationworkshop
Adulteducation
Artisticactivities
Medicalcare
Psychologicalassistance
% % % % % %Andalucía 28.2 12.7 15.5 32.4 32.4 42.3
Aragón 21.2 12.1 6.1 15.2 15.2 18.2
Asturias (Principado de) 30.8 15.4 0.0 15.4 23.1 7.7
Balears (Illes) 13.3 20.0 6.7 13.3 20.0 13.3
Canarias 27.8 22.2 22.2 47.2 25.0 44.4
Cantabria 37.5 12.5 12.5 12.5 12.5 37.5
Castilla León 24.0 10.0 8.0 20.0 16.0 24.0
Castilla−La Mancha 30.8 25.6 10.3 28.2 10.3 28.2
Cataluña 15.8 14.0 5.3 12.3 12.3 26.3
Comunidad Valenciana 12.0 18.0 14.0 20.0 20.0 48.0
Extremadura 17.6 5.9 5.9 23.5 41.2 52.9
Galicia 2.7 5.4 5.4 8.1 10.8 29.7
Madrid (Comunidad de) 19.5 9.8 4.9 24.4 24.4 34.1
Murcia (Región de) 52.4 42.9 14.3 33.3 23.8 33.3
Navarra (Comunidad Foral de) 50.0 7.1 28.6 28.6 35.7 21.4
País Vasco 20.6 20.6 14.7 23.5 8.8 32.4
Rioja (La) 9.1 18.2 9.1 36.4 27.3 36.4
Autonomous City of Ceuta 0.0 0.0 25.0 25.0 50.0 25.0
Autonomous City of Melilla 50.0 0.0 50.0 75.0 50.0 50.0
TOTAL 22.5 15.3 11.2 23.8 20.5 32.8
INE
. In
stit
uto
Nac
ion
al d
e E
stad
ísti
ca
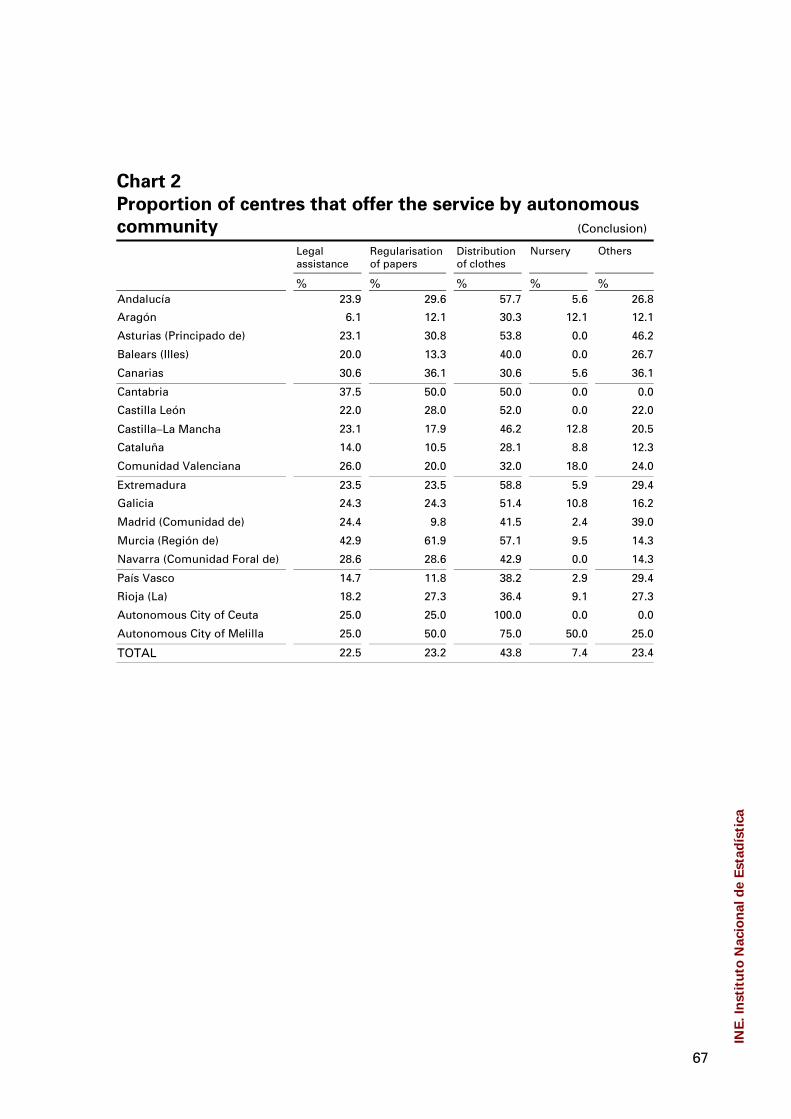
67
Chart 2
Proportion of centres that offer the service by autonomous
community (Conclusion)
Legalassistance
Regularisationof papers
Distributionof clothes
Nursery Others
% % % % %Andalucía 23.9 29.6 57.7 5.6 26.8
Aragón 6.1 12.1 30.3 12.1 12.1
Asturias (Principado de) 23.1 30.8 53.8 0.0 46.2
Balears (Illes) 20.0 13.3 40.0 0.0 26.7
Canarias 30.6 36.1 30.6 5.6 36.1
Cantabria 37.5 50.0 50.0 0.0 0.0
Castilla León 22.0 28.0 52.0 0.0 22.0
Castilla−La Mancha 23.1 17.9 46.2 12.8 20.5
Cataluña 14.0 10.5 28.1 8.8 12.3
Comunidad Valenciana 26.0 20.0 32.0 18.0 24.0
Extremadura 23.5 23.5 58.8 5.9 29.4
Galicia 24.3 24.3 51.4 10.8 16.2
Madrid (Comunidad de) 24.4 9.8 41.5 2.4 39.0
Murcia (Región de) 42.9 61.9 57.1 9.5 14.3
Navarra (Comunidad Foral de) 28.6 28.6 42.9 0.0 14.3
País Vasco 14.7 11.8 38.2 2.9 29.4
Rioja (La) 18.2 27.3 36.4 9.1 27.3
Autonomous City of Ceuta 25.0 25.0 100.0 0.0 0.0
Autonomous City of Melilla 25.0 50.0 75.0 50.0 25.0
TOTAL 22.5 23.2 43.8 7.4 23.4
INE
. In
stit
uto
Nac
ion
al d
e E
stad
ísti
ca
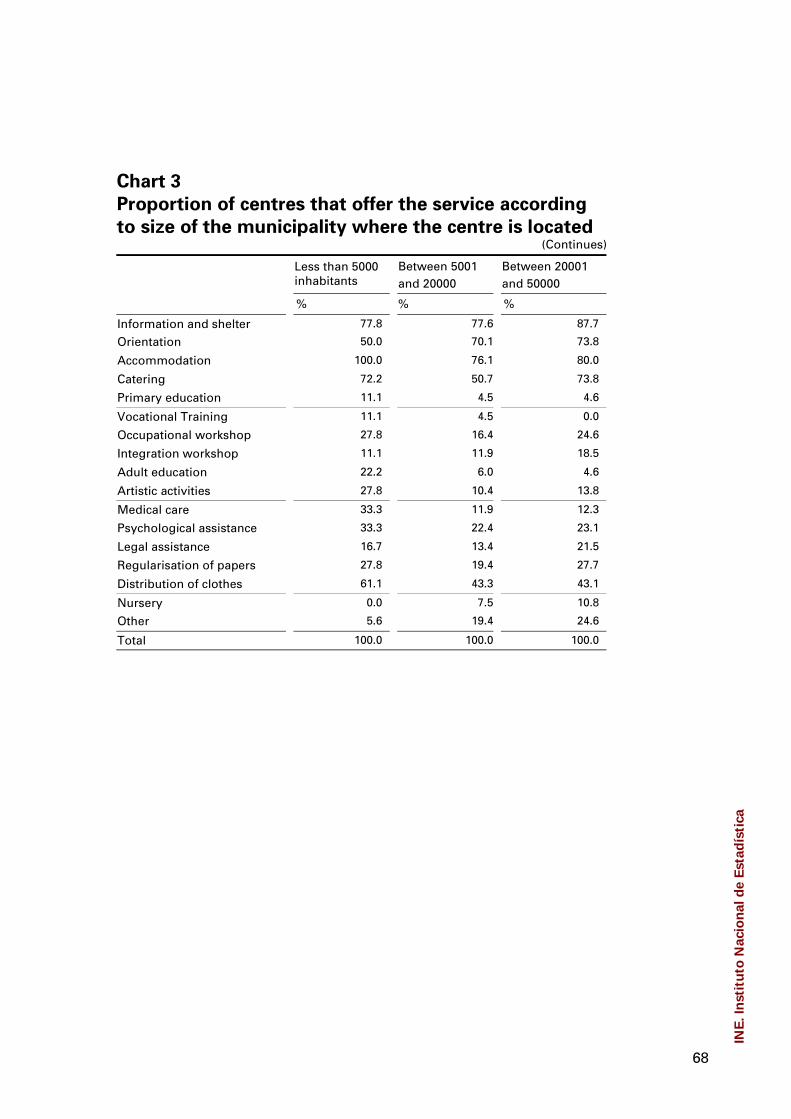
68
Chart 3
Proportion of centres that offer the service according
to size of the municipality where the centre is located(Continues)
Less than 5000inhabitants
Between 5001and 20000
Between 20001and 50000
% % %
Information and shelter 77.8 77.6 87.7
Orientation 50.0 70.1 73.8
Accommodation 100.0 76.1 80.0
Catering 72.2 50.7 73.8
Primary education 11.1 4.5 4.6
Vocational Training 11.1 4.5 0.0
Occupational workshop 27.8 16.4 24.6
Integration workshop 11.1 11.9 18.5
Adult education 22.2 6.0 4.6
Artistic activities 27.8 10.4 13.8
Medical care 33.3 11.9 12.3
Psychological assistance 33.3 22.4 23.1
Legal assistance 16.7 13.4 21.5
Regularisation of papers 27.8 19.4 27.7
Distribution of clothes 61.1 43.3 43.1
Nursery 0.0 7.5 10.8
Other 5.6 19.4 24.6
Total 100.0 100.0 100.0
INE
. In
stit
uto
Nac
ion
al d
e E
stad
ísti
ca
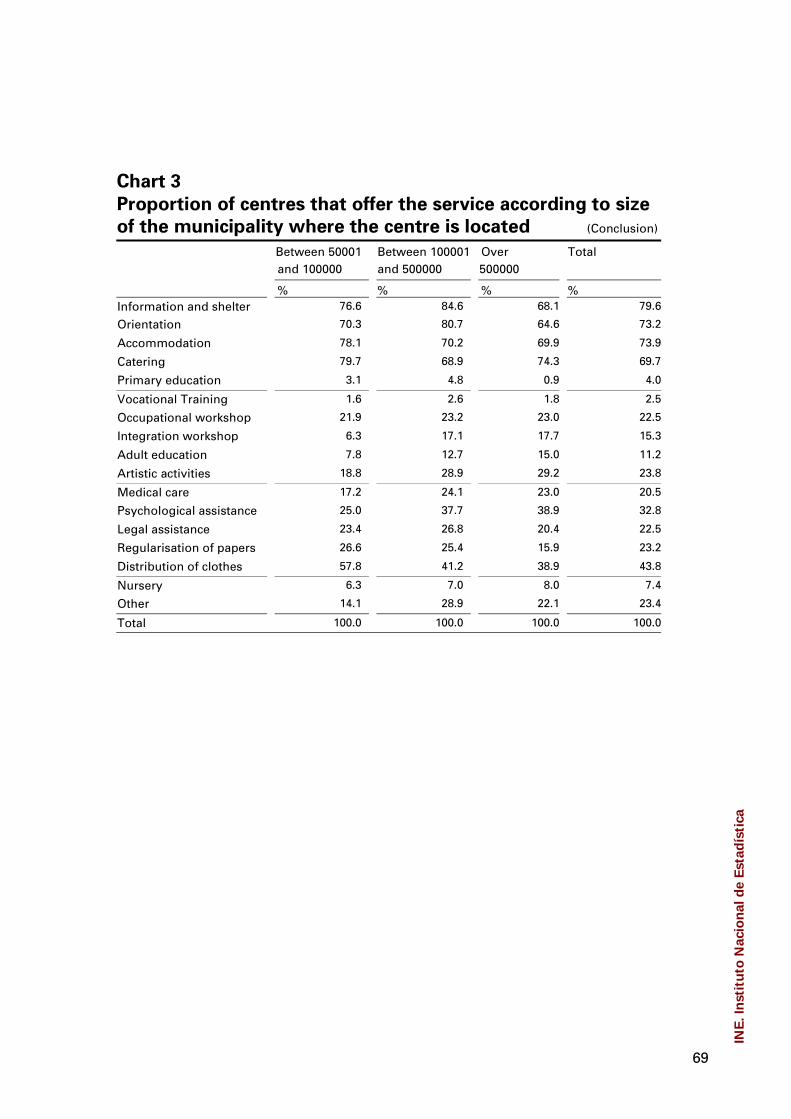
69
Chart 3
Proportion of centres that offer the service according to size
of the municipality where the centre is located (Conclusion)
Between 50001and 100000
Between 100001and 500000
Over500000
Total
% % % %Information and shelter 76.6 84.6 68.1 79.6
Orientation 70.3 80.7 64.6 73.2
Accommodation 78.1 70.2 69.9 73.9
Catering 79.7 68.9 74.3 69.7
Primary education 3.1 4.8 0.9 4.0
Vocational Training 1.6 2.6 1.8 2.5
Occupational workshop 21.9 23.2 23.0 22.5
Integration workshop 6.3 17.1 17.7 15.3
Adult education 7.8 12.7 15.0 11.2
Artistic activities 18.8 28.9 29.2 23.8
Medical care 17.2 24.1 23.0 20.5
Psychological assistance 25.0 37.7 38.9 32.8
Legal assistance 23.4 26.8 20.4 22.5
Regularisation of papers 26.6 25.4 15.9 23.2
Distribution of clothes 57.8 41.2 38.9 43.8
Nursery 6.3 7.0 8.0 7.4
Other 14.1 28.9 22.1 23.4
Total 100.0 100.0 100.0 100.0
INE
. In
stit
uto
Nac
ion
al d
e E
stad
ísti
ca

70
Chart 4
Centres that offer the service by type of centre
Type of centre
Public Private Total
Centres % Centres % Centres %
Information and shelter 119 78.8 323 80.0 442 79.6
Orientation 108 71.5 298 73.8 406 73.2
Accommodation 119 78.8 291 72.0 410 73.9
Catering 101 66.9 286 70.8 387 69.7
Primary education 2 1.3 20 5.0 22 4.0
Vocational Training 2 1.3 12 3.0 14 2.5
Occupational workshop 17 11.3 108 26.7 125 22.5
Integration workshop 17 11.3 68 16.8 85 15.3
Adult education 3 2.0 59 14.6 62 11.2
Artistic activities 27 17.9 105 26.0 132 23.8
Medical care 24 15.9 90 22.3 114 20.5
Psychological assistance 43 28.5 139 34.4 182 32.8
Legal assistance 24 15.9 101 25.0 125 22.5
Regularisation of papers 18 11.9 111 27.5 129 23.2
Distribution of clothes 47 31.1 196 48.5 243 43.8
Nursery 9 6.0 32 7.9 41 7.4
Other 32 21.2 98 24.3 130 23.4
Total 151 27.2 404 72.8 555 100.0
INE
. In
stit
uto
Nac
ion
al d
e E
stad
ísti
ca
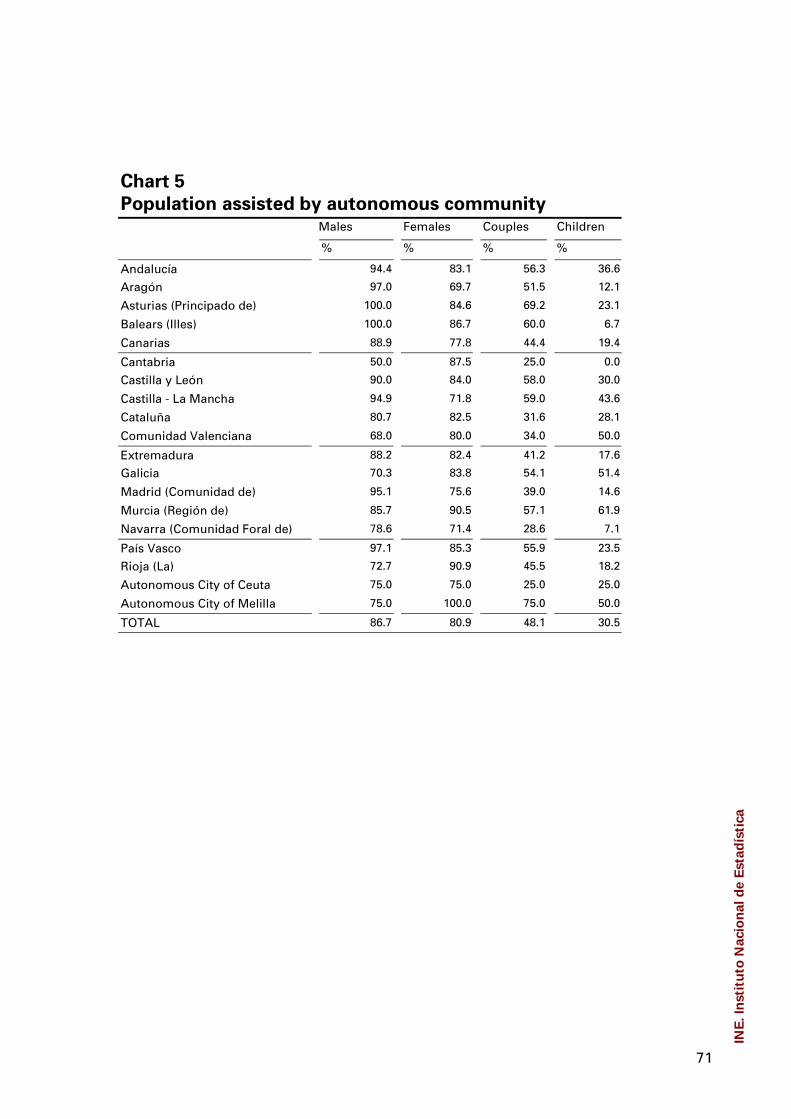
71
Chart 5
Population assisted by autonomous communityMales Females Couples Children
% % % %
Andalucía 94.4 83.1 56.3 36.6
Aragón 97.0 69.7 51.5 12.1
Asturias (Principado de) 100.0 84.6 69.2 23.1
Balears (Illes) 100.0 86.7 60.0 6.7
Canarias 88.9 77.8 44.4 19.4
Cantabria 50.0 87.5 25.0 0.0
Castilla y León 90.0 84.0 58.0 30.0
Castilla - La Mancha 94.9 71.8 59.0 43.6
Cataluña 80.7 82.5 31.6 28.1
Comunidad Valenciana 68.0 80.0 34.0 50.0
Extremadura 88.2 82.4 41.2 17.6
Galicia 70.3 83.8 54.1 51.4
Madrid (Comunidad de) 95.1 75.6 39.0 14.6
Murcia (Región de) 85.7 90.5 57.1 61.9
Navarra (Comunidad Foral de) 78.6 71.4 28.6 7.1
País Vasco 97.1 85.3 55.9 23.5
Rioja (La) 72.7 90.9 45.5 18.2
Autonomous City of Ceuta 75.0 75.0 25.0 25.0
Autonomous City of Melilla 75.0 100.0 75.0 50.0
TOTAL 86.7 80.9 48.1 30.5
INE
. In
stit
uto
Nac
ion
al d
e E
stad
ísti
ca

72
Chart 6
Population assisted by size of the municipality
where the centre is located (Continues)
Less than 5000inhabitants
Between 5001and 20000
Between 20001and 50000
% % %
Males 100.0 98.5 87.7
Females 77.8 85.1 84.6
Couples 55.6 64.2 60.0
Children 33.3 29.9 44.6
Total 100.0 100.0 100.0
(Conclusion)
Between 50001and 100000
Between 100001and 500000
Over500000
Total
% % % %
Males 87.5 85.1 79.6 86.7
Females 81.3 81.6 75.2 80.9
Couples 57.8 46.5 28.3 48.1
Children 37.5 28.1 23.0 30.5
Total 100.0 100.0 100.0 100.0
Chart 7
Population assisted according to type of centre
Public Private Total
% % %
Males 89.4 85.6 86.7
Females 89.4 77.7 80.9
Couples 58.3 44.3 48.1
Children 37.1 28.0 30.5
Total 100.0 100.0 100.0
INE
. In
stit
uto
Nac
ion
al d
e E
stad
ísti
ca

73
Chart 8
Population assisted by autonomous community (Continues)
Formerprisoners
Drugaddicts
Alcoholics Batteredwomen
% % %
Andalucía 41.3 58.7 54.3 19.6Aragón 46.2 38.5 69.2 30.8
Asturias (Principado de) 57.1 85.7 85.7 14.3
Balears (Illes) 45.5 54.5 54.5 18.2
Canarias 17.6 35.3 23.5 5.9
Cantabria 20.0 40.0 60.0 40.0Castilla y León 57.9 42.1 47.4 31.6
Castilla - La Mancha 15.4 15.4 30.8 30.8
Cataluña 25.8 25.8 41.9 29.0
Comunidad Valenciana 20.7 20.7 20.7 41.4
Extremadura 22.2 66.7 44.4 11.1Galicia 33.3 28.6 28.6 66.7
Madrid (Comunidad de) 37.5 45.8 37.5 8.3
Murcia (Región de) 21.4 35.7 28.6 28.6
Navarra (Comunidad Foral de) 33.3 33.3 66.7 16.7
País Vasco 45.0 65.0 70.0 20.0Rioja (La) 12.5 12.5 0.0 25.0
Autonomous City of Ceuta 33.3 33.3 66.7 0.0
Autonomous City of Melilla 33.3 33.3 33.3 66.7
TOTAL 33.4 40.8 43.1 26,8
(Conclusion)
Immigrants Others Total
% % Centres %
Andalucía 63.0 37.0 46 100Aragón 61.5 30.8 13 100
Asturias (Principado de) 57.1 28.6 7 100
Balears (Illes) 54.5 9.1 11 100
Canarias 35.3 47.1 17 100
Cantabria 100.0 40.0 5 100Castilla y León 68.4 42.1 19 100
Castilla - La Mancha 92.3 30.8 13 100
Cataluña 58.1 45.2 31 100
Comunidad Valenciana 51.7 24.1 29 100
Extremadura 33.3 55.6 9 100Galicia 42.9 33.3 21 100
Madrid (Comunidad de) 54.2 45.8 24 100
Murcia (Región de) 92.9 21.4 14 100
Navarra (Comunidad Foral de) 16.7 50.0 6 100
País Vasco 55.0 60.0 20 100Rioja (La) 37.5 62.5 8 100
Autonomous City of Ceuta 100.0 0.0 3 100
Autonomous City of Melilla 66.7 0.0 3 100
TOTAL 58.2 37.8 299 100
INE
. In
stit
uto
Nac
ion
al d
e E
stad
ísti
ca
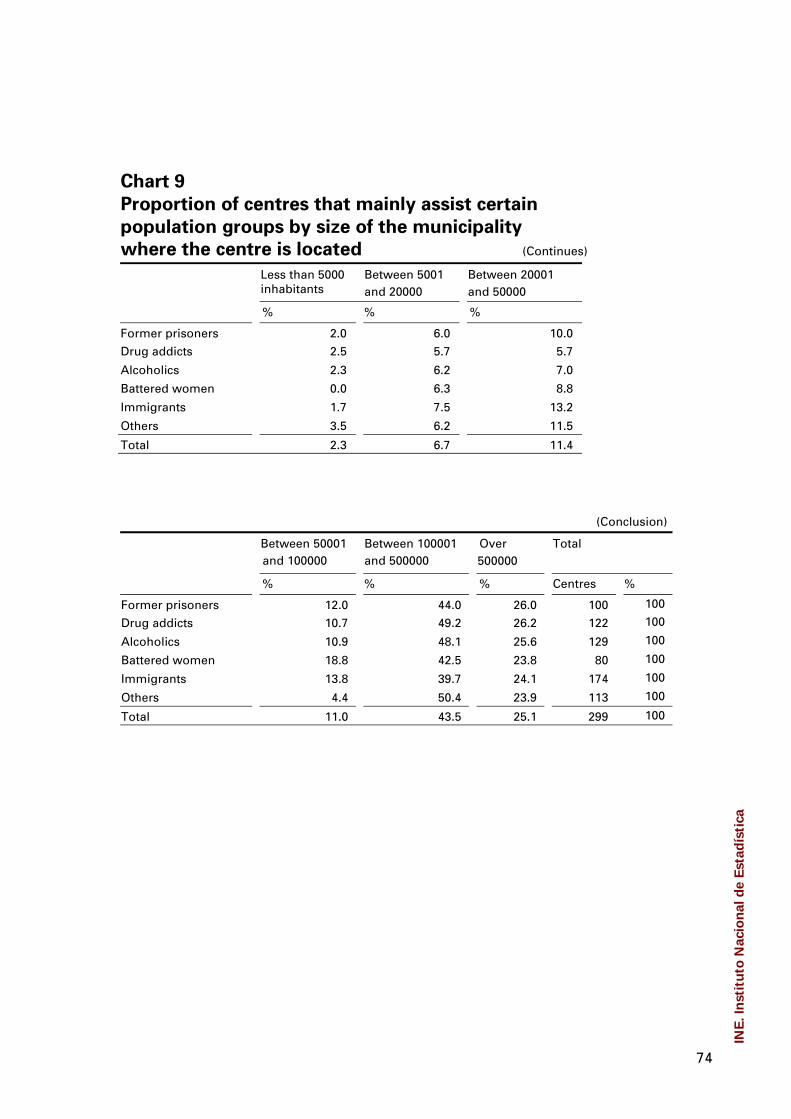
74
Chart 9
Proportion of centres that mainly assist certain
population groups by size of the municipality
where the centre is located (Continues)
Less than 5000inhabitants
Between 5001and 20000
Between 20001and 50000
% % %
Former prisoners 2.0 6.0 10.0
Drug addicts 2.5 5.7 5.7
Alcoholics 2.3 6.2 7.0
Battered women 0.0 6.3 8.8
Immigrants 1.7 7.5 13.2
Others 3.5 6.2 11.5
Total 2.3 6.7 11.4
(Conclusion)
Between 50001and 100000
Between 100001and 500000
Over500000
Total
% % % Centres %
Former prisoners 12.0 44.0 26.0 100 100
Drug addicts 10.7 49.2 26.2 122 100
Alcoholics 10.9 48.1 25.6 129 100
Battered women 18.8 42.5 23.8 80 100
Immigrants 13.8 39.7 24.1 174 100
Others 4.4 50.4 23.9 113 100
Total 11.0 43.5 25.1 299 100
INE
. In
stit
uto
Nac
ion
al d
e E
stad
ísti
ca
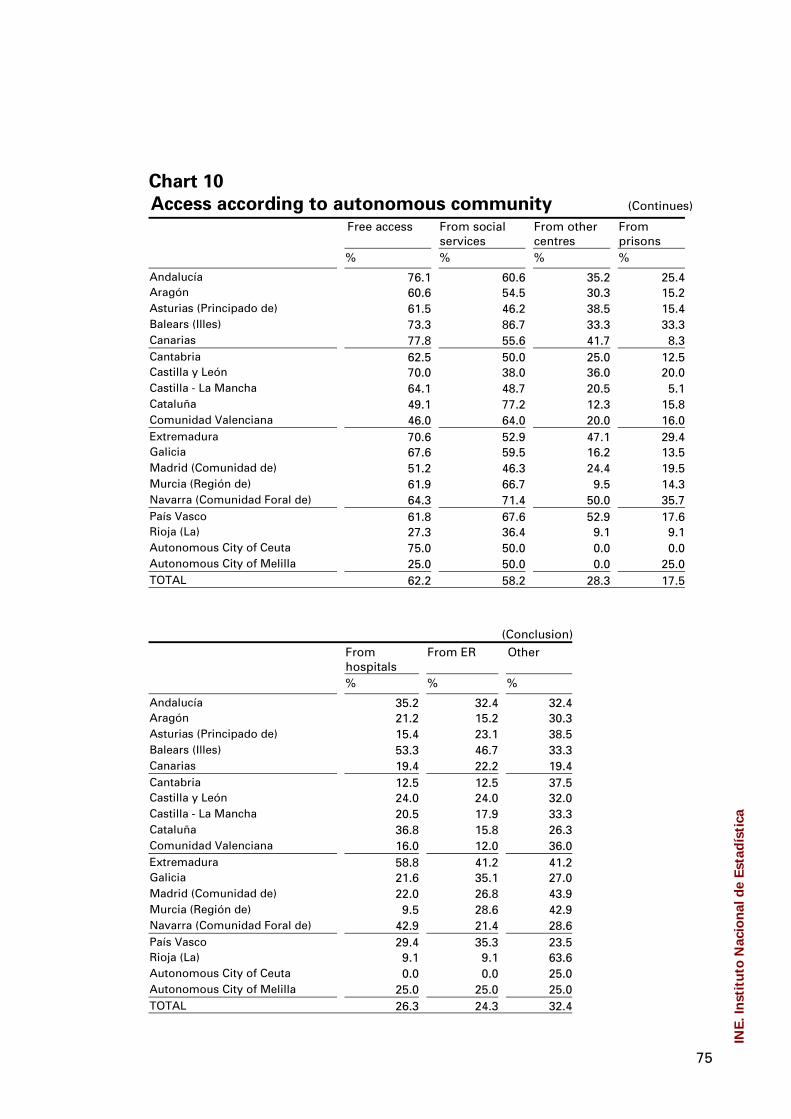
75
Chart 10
Access according to autonomous community (Continues)
Free access From socialservices
From othercentres
Fromprisons
% % % %
Andalucía 76.1 60.6 35.2 25.4Aragón 60.6 54.5 30.3 15.2Asturias (Principado de) 61.5 46.2 38.5 15.4Balears (Illes) 73.3 86.7 33.3 33.3Canarias 77.8 55.6 41.7 8.3Cantabria 62.5 50.0 25.0 12.5Castilla y León 70.0 38.0 36.0 20.0Castilla - La Mancha 64.1 48.7 20.5 5.1Cataluña 49.1 77.2 12.3 15.8Comunidad Valenciana 46.0 64.0 20.0 16.0Extremadura 70.6 52.9 47.1 29.4Galicia 67.6 59.5 16.2 13.5Madrid (Comunidad de) 51.2 46.3 24.4 19.5Murcia (Región de) 61.9 66.7 9.5 14.3Navarra (Comunidad Foral de) 64.3 71.4 50.0 35.7País Vasco 61.8 67.6 52.9 17.6Rioja (La) 27.3 36.4 9.1 9.1Autonomous City of Ceuta 75.0 50.0 0.0 0.0Autonomous City of Melilla 25.0 50.0 0.0 25.0TOTAL 62.2 58.2 28.3 17.5
(Conclusion)Fromhospitals
From ER Other
% % %
Andalucía 35.2 32.4 32.4Aragón 21.2 15.2 30.3Asturias (Principado de) 15.4 23.1 38.5Balears (Illes) 53.3 46.7 33.3Canarias 19.4 22.2 19.4Cantabria 12.5 12.5 37.5Castilla y León 24.0 24.0 32.0Castilla - La Mancha 20.5 17.9 33.3Cataluña 36.8 15.8 26.3Comunidad Valenciana 16.0 12.0 36.0Extremadura 58.8 41.2 41.2Galicia 21.6 35.1 27.0Madrid (Comunidad de) 22.0 26.8 43.9Murcia (Región de) 9.5 28.6 42.9Navarra (Comunidad Foral de) 42.9 21.4 28.6País Vasco 29.4 35.3 23.5Rioja (La) 9.1 9.1 63.6Autonomous City of Ceuta 0.0 0.0 25.0Autonomous City of Melilla 25.0 25.0 25.0TOTAL 26.3 24.3 32.4
INE
. In
stit
uto
Nac
ion
al d
e E
stad
ísti
ca

76
Chart 11
Access by size of the municipality where the centre is located (Continues)
Less than 5,000inhabitants
Between 5,001and 20,000
Between 20,001and 50,000
% % %
Free access 61.1 67.2 61.5From social services 27.8 47.8 61.5
From other centres 16.7 10.4 21.5
From prisons 11.1 7.5 10.8
From hospitals 22.2 10.4 24.6
From ER 16.7 11.9 24.6
Other 27.8 26.9 36.9
Total 100.0 100.0 100.0
(Conclusion)
Between 50,001and 100,000
Between 100,001and 500,000
Over500,000
Total
% % % Centres
Free access 70.3 64.9 49.6 62.2From social services 50.0 64.0 60.2 58.2
From other centres 23.4 34.2 35.4 28.3
From prisons 14.1 20.6 23.9 17.5
From hospitals 25.0 29.4 31.9 26.3
From ER 28.1 27.6 23.9 24.3
Other 28.1 30.7 39.8 32.4
Total 100.0 100.0 100.0 100.0
Chart 12
Access by type of centre
Public Private Total
% % %
Free access 60.3 62.9 62.2From social services 60.9 57.2 58.2
From other centres 20.5 31.2 28.3
From prisons 15.2 18.3 17.5
From hospitals 25.2 26.7 26.3
From ER 26.5 23.5 24.3
Other 30.5 33.2 32.4
INE
. In
stit
uto
Nac
ion
al d
e E
stad
ísti
ca

77
Chart 13
Centres according to opening hours
Less than12 hours
Between 12 and24 hours
All day Total
Centres % Centres % Centres % Centres %
Monday to Friday 103 25.1 148 36.1 159 38.8 410 100.0
Saturdays 111 27.1 139 33.9 160 39.0 410 100.0
Sundays 112 27.3 139 33.9 159 38.8 410 100.0
Chart 14
Centres with group accommodation by type of stay
Public % Private % Centres
Emergency 63 73 53.7 136
Short stay 33 53 61.6 86
Long stay 43 143 76.9 186
Centres with group accommodation 96 208 68.4 304
Chart 15
Group accommodation centres by type of stay
Emergency Short stay Long stay Total
Centres % Centres % Centres % Centres %
Less than 5,000 inhabitants 11 8.1 0 0.0 5 2.7 16 5.3
between 5,001 and 20,000 31 22.8 4 4.7 10 5.4 43 14.1
between 20,001 and 50,000 18 13.2 11 12.8 13 7.0 36 11.8
between 50,001 and 100,000 16 11.8 12 14.0 21 11.3 37 12.2
between 100,001 and 500,000 47 34.6 40 46.5 87 46.8 115 37.8
over 500,000 13 9.6 19 22.1 50 26.9 57 18.8
Total 136 100.0 86 100.0 186 100.0 304 100.0
INE
. In
stit
uto
Nac
ion
al d
e E
stad
ísti
ca
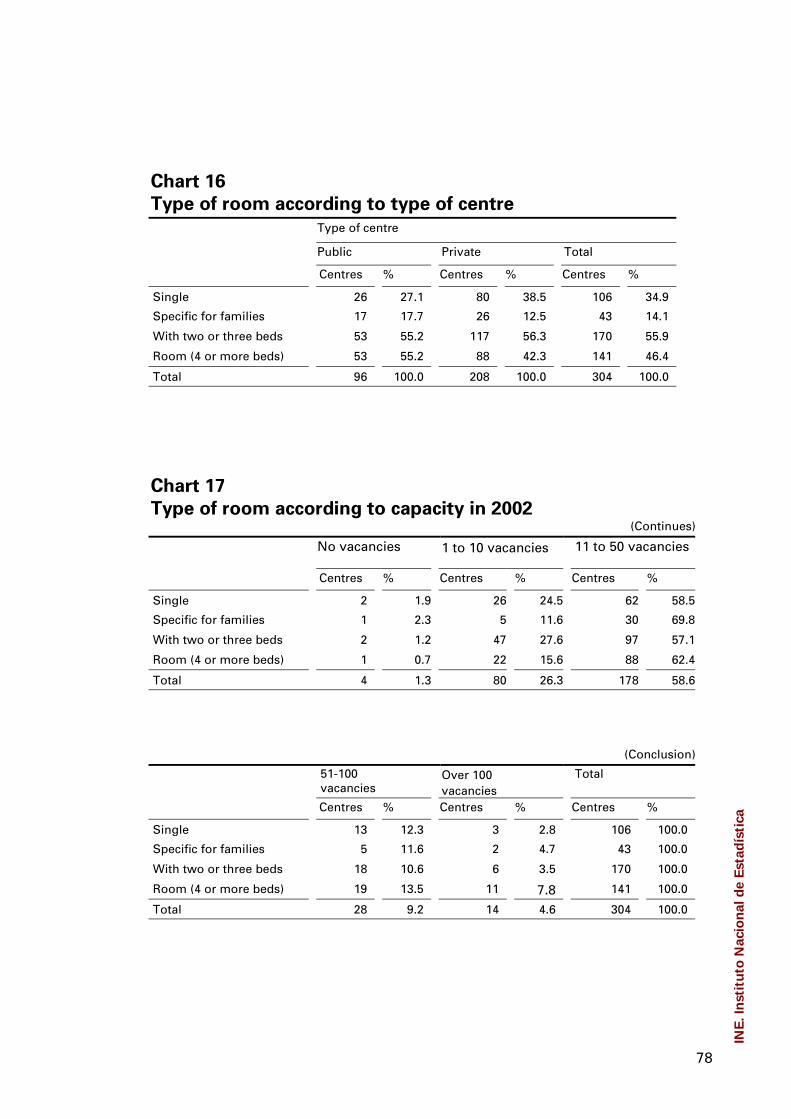
78
Chart 16
Type of room according to type of centre
Type of centre
Public Private Total
Centres % Centres % Centres %
Single 26 27.1 80 38.5 106 34.9
Specific for families 17 17.7 26 12.5 43 14.1
With two or three beds 53 55.2 117 56.3 170 55.9
Room (4 or more beds) 53 55.2 88 42.3 141 46.4
Total 96 100.0 208 100.0 304 100.0
Chart 17
Type of room according to capacity in 2002(Continues)
No vacancies 1 to 10 vacancies 11 to 50 vacancies
Centres % Centres % Centres %
Single 2 1.9 26 24.5 62 58.5
Specific for families 1 2.3 5 11.6 30 69.8
With two or three beds 2 1.2 47 27.6 97 57.1
Room (4 or more beds) 1 0.7 22 15.6 88 62.4
Total 4 1.3 80 26.3 178 58.6
(Conclusion)
51-100vacancies
Over 100vacancies
Total
Centres % Centres % Centres %
Single 13 12.3 3 2.8 106 100.0
Specific for families 5 11.6 2 4.7 43 100.0
With two or three beds 18 10.6 6 3.5 170 100.0
Room (4 or more beds) 19 13.5 11 7.8 141 100.0
Total 28 9.2 14 4.6 304 100.0
INE
. In
stit
uto
Nac
ion
al d
e E
stad
ísti
ca

79
Chart 18
Free accommodation according to type of centre
Type of centre
Public Private Total
Centres % Centres % Centres %
Yes 90 93.8 172 82.7 262 86.2
No 5 5.2 28 13.5 33 10.1
Non response 1 1.0 8 3.8 9 3.3
Total 96 100.0 208 100.0 304 100.0
Chart 19
Performance of task or consideration by type of centre
Type of centre
Public Private Total
Centres % Centres % Centres %
Yes 9 9.4 35 16.8 44 14.5
No 51 53.1 102 49.0 153 50.3
Non response 36 37.5 71 34.2 107 35.2
Total 96 100.0 208 100.0 304 100.0
INE
. In
stit
uto
Nac
ion
al d
e E
stad
ísti
ca
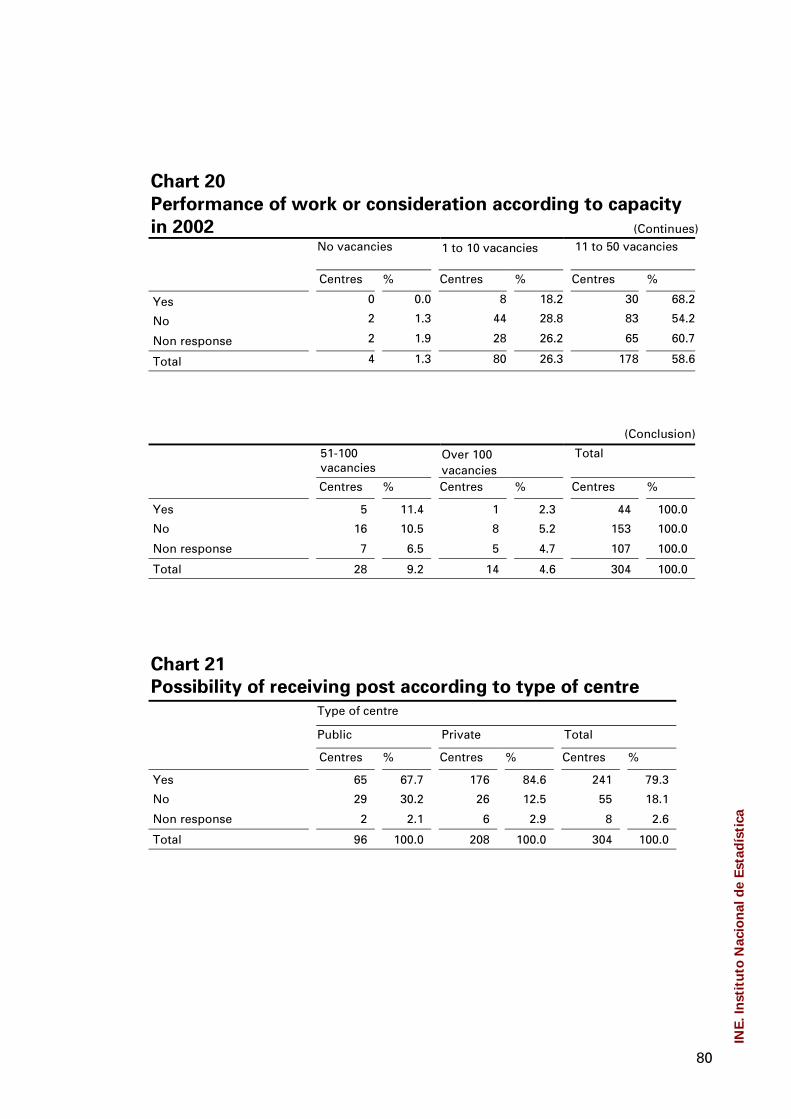
80
Chart 20
Performance of work or consideration according to capacity
in 2002 (Continues)No vacancies 1 to 10 vacancies 11 to 50 vacancies
Centres % Centres % Centres %
Yes 0 0.0 8 18.2 30 68.2
No 2 1.3 44 28.8 83 54.2
Non response 2 1.9 28 26.2 65 60.7
Total 4 1.3 80 26.3 178 58.6
(Conclusion)
51-100vacancies
Over 100vacancies
Total
Centres % Centres % Centres %
Yes 5 11.4 1 2.3 44 100.0
No 16 10.5 8 5.2 153 100.0
Non response 7 6.5 5 4.7 107 100.0
Total 28 9.2 14 4.6 304 100.0
Chart 21
Possibility of receiving post according to type of centre
Type of centre
Public Private Total
Centres % Centres % Centres %
Yes 65 67.7 176 84.6 241 79.3
No 29 30.2 26 12.5 55 18.1
Non response 2 2.1 6 2.9 8 2.6
Total 96 100.0 208 100.0 304 100.0
INE
. In
stit
uto
Nac
ion
al d
e E
stad
ísti
ca

81
Chart 22
Possibility of receiving post according to capacity in 2002(Continues)
No vacancies 1 to 10 vacancies 11 to 50 vacancies
Centres % Centres % Centres %
Yes 4 1.7 41 17.0 155 64.3
No 0 0.0 36 65.5 19 34.5
Non response 0 0.0 3 37.5 4 50.0
Total 4 1.3 80 26.3 178 58.6
(Conclusion)
51-100vacancies
Over 100vacancies
Total
Centres % Centres % Centres %
Yes 28 11.6 13 5.4 241 100.0No 0 0.0 0 0.0 55 100.0
Non response 0 0.0 1 12.5 8 100.0
Total 28 9.2 14 4.6 304 100.0
Chart 23
Use of luggage room according to type of centre
Type of centre
Public Private Total
Centres % Centres % Centres %
Yes 56 58.3 138 66.3 194 63.8
No 37 38.5 56 26.9 93 30.6
Non response 3 3.2 14 6.8 17 5.6
Total 96 100.0 208 100.0 304 100.0
Chart 24
Centres and average daily catering services by type of centre
in 2002
Centres % Average numberof daily services
% Average number ofdaily services / Centro
Public 99 25.8 13,421 35.6 135.6
Private 284 74.2 24,236 64.4 85.3
Total 383 100.0 37,657 100.0 98.3
INE
. In
stit
uto
Nac
ion
al d
e E
stad
ísti
ca
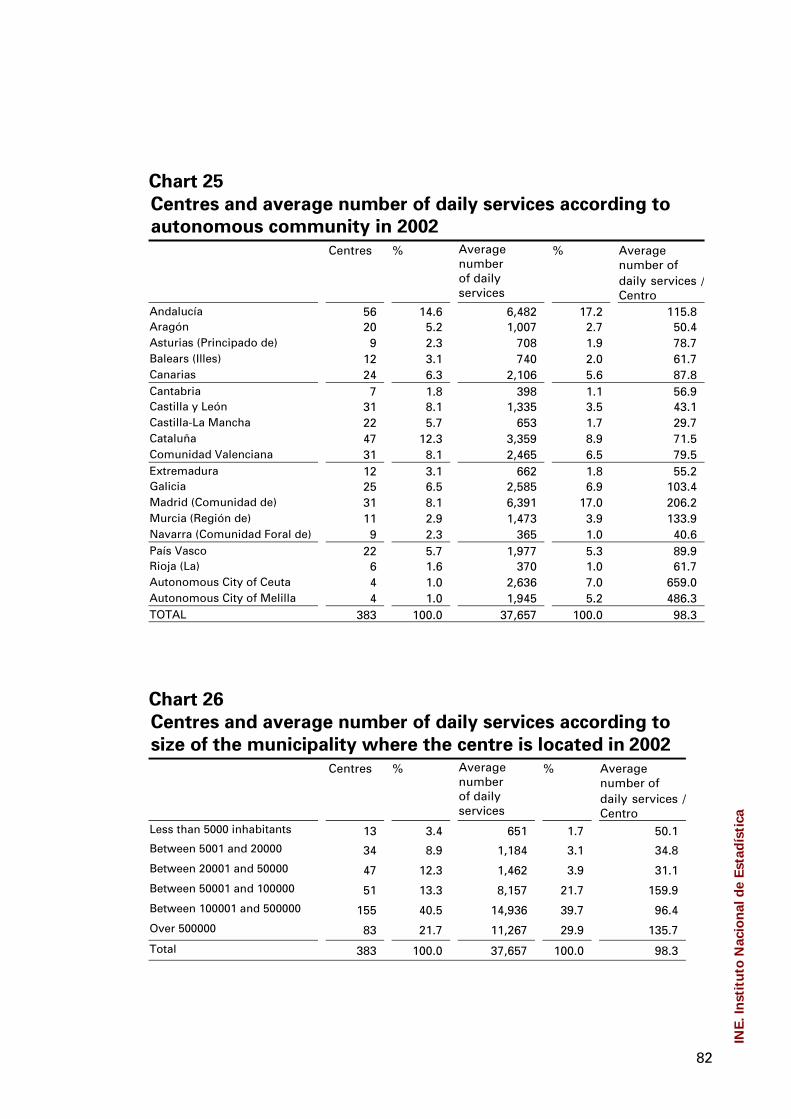
82
Chart 25
Centres and average number of daily services according to
autonomous community in 2002
Centres % Averagenumberof dailyservices
% Averagenumber ofdaily services /Centro
Andalucía 56 14.6 6,482 17.2 115.8Aragón 20 5.2 1,007 2.7 50.4Asturias (Principado de) 9 2.3 708 1.9 78.7Balears (Illes) 12 3.1 740 2.0 61.7Canarias 24 6.3 2,106 5.6 87.8Cantabria 7 1.8 398 1.1 56.9Castilla y León 31 8.1 1,335 3.5 43.1Castilla-La Mancha 22 5.7 653 1.7 29.7Cataluña 47 12.3 3,359 8.9 71.5Comunidad Valenciana 31 8.1 2,465 6.5 79.5Extremadura 12 3.1 662 1.8 55.2Galicia 25 6.5 2,585 6.9 103.4Madrid (Comunidad de) 31 8.1 6,391 17.0 206.2Murcia (Región de) 11 2.9 1,473 3.9 133.9Navarra (Comunidad Foral de) 9 2.3 365 1.0 40.6País Vasco 22 5.7 1,977 5.3 89.9Rioja (La) 6 1.6 370 1.0 61.7Autonomous City of Ceuta 4 1.0 2,636 7.0 659.0Autonomous City of Melilla 4 1.0 1,945 5.2 486.3TOTAL 383 100.0 37,657 100.0 98.3
Chart 26
Centres and average number of daily services according to
size of the municipality where the centre is located in 2002
Centres % Averagenumberof dailyservices
% Averagenumber ofdaily services /Centro
Less than 5000 inhabitants 13 3.4 651 1.7 50.1Between 5001 and 20000 34 8.9 1,184 3.1 34.8Between 20001 and 50000 47 12.3 1,462 3.9 31.1Between 50001 and 100000 51 13.3 8,157 21.7 159.9Between 100001 and 500000 155 40.5 14,936 39.7 96.4Over 500000 83 21.7 11,267 29.9 135.7
Total 383 100.0 37,657 100.0 98.3
INE
. In
stit
uto
Nac
ion
al d
e E
stad
ísti
ca

83
Chart 27
Catering activity according to type of meal and number
of services rendered (Contin-ues)
Without services 1 to 10 services 11-50 services
Centres % Centres % Centres %
Lunch 3 0.9 27 8.5 134 42.3
Dinner 4 1.3 38 12.3 132 42.9
Breakfast 4 1.3 28 9.4 137 46.0
Distribution of sandwiches 0 0.0 13 10.5 40 32.3
Distribution of hot drinks 0 0.0 3 14.3 6 28.6
Total 4 1.0 42 10.9 163 42.1
(Conclusion)
51-100 services Over 100 services TotalCentres % Centres % Centres %
Lunch 58 18.3 95 30.0 317 100.0
Dinner 55 17.9 79 25.6 308 100.0
Breakfast 56 18.8 73 24.5 298 100.0
Distribution of sandwiches 21 16.9 50 40.3 124 100.0
Distribution of hot drinks 2 9.5 10 47.6 21 100.0
Total 69 17.8 109 28.2 387 100.0
INE
. In
stit
uto
Nac
ion
al d
e E
stad
ísti
ca
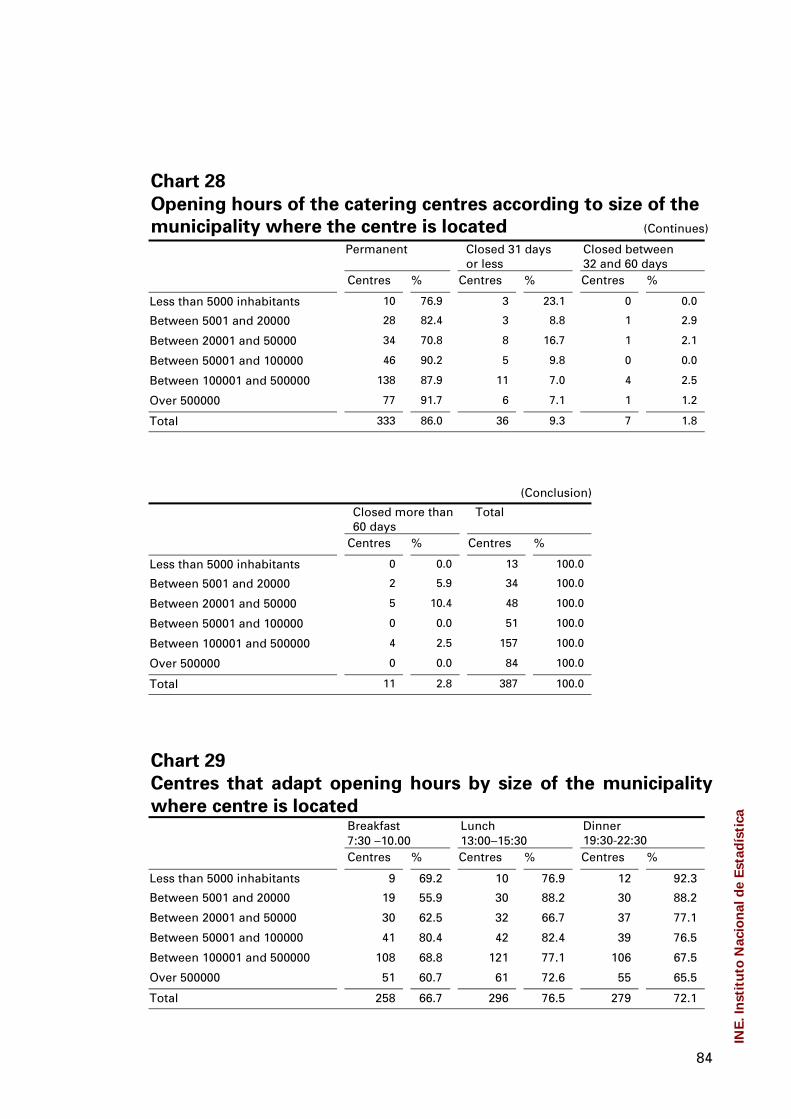
84
Chart 28
Opening hours of the catering centres according to size of the
municipality where the centre is located (Continues)
Permanent Closed 31 daysor less
Closed between32 and 60 days
Centres % Centres % Centres %
Less than 5000 inhabitants 10 76.9 3 23.1 0 0.0
Between 5001 and 20000 28 82.4 3 8.8 1 2.9
Between 20001 and 50000 34 70.8 8 16.7 1 2.1
Between 50001 and 100000 46 90.2 5 9.8 0 0.0
Between 100001 and 500000 138 87.9 11 7.0 4 2.5
Over 500000 77 91.7 6 7.1 1 1.2
Total 333 86.0 36 9.3 7 1.8
(Conclusion)
Closed more than60 days
Total
Centres % Centres %
Less than 5000 inhabitants 0 0.0 13 100.0
Between 5001 and 20000 2 5.9 34 100.0
Between 20001 and 50000 5 10.4 48 100.0
Between 50001 and 100000 0 0.0 51 100.0
Between 100001 and 500000 4 2.5 157 100.0
Over 500000 0 0.0 84 100.0
Total 11 2.8 387 100.0
Chart 29
Centres that adapt opening hours by size of the municipality
where centre is locatedBreakfast7:30 −10.00
Lunch13:00−15:30
Dinner19:30-22:30
Centres % Centres % Centres %
Less than 5000 inhabitants 9 69.2 10 76.9 12 92.3
Between 5001 and 20000 19 55.9 30 88.2 30 88.2
Between 20001 and 50000 30 62.5 32 66.7 37 77.1
Between 50001 and 100000 41 80.4 42 82.4 39 76.5
Between 100001 and 500000 108 68.8 121 77.1 106 67.5
Over 500000 51 60.7 61 72.6 55 65.5
Total 258 66.7 296 76.5 279 72.1
INE
. In
stit
uto
Nac
ion
al d
e E
stad
ísti
ca
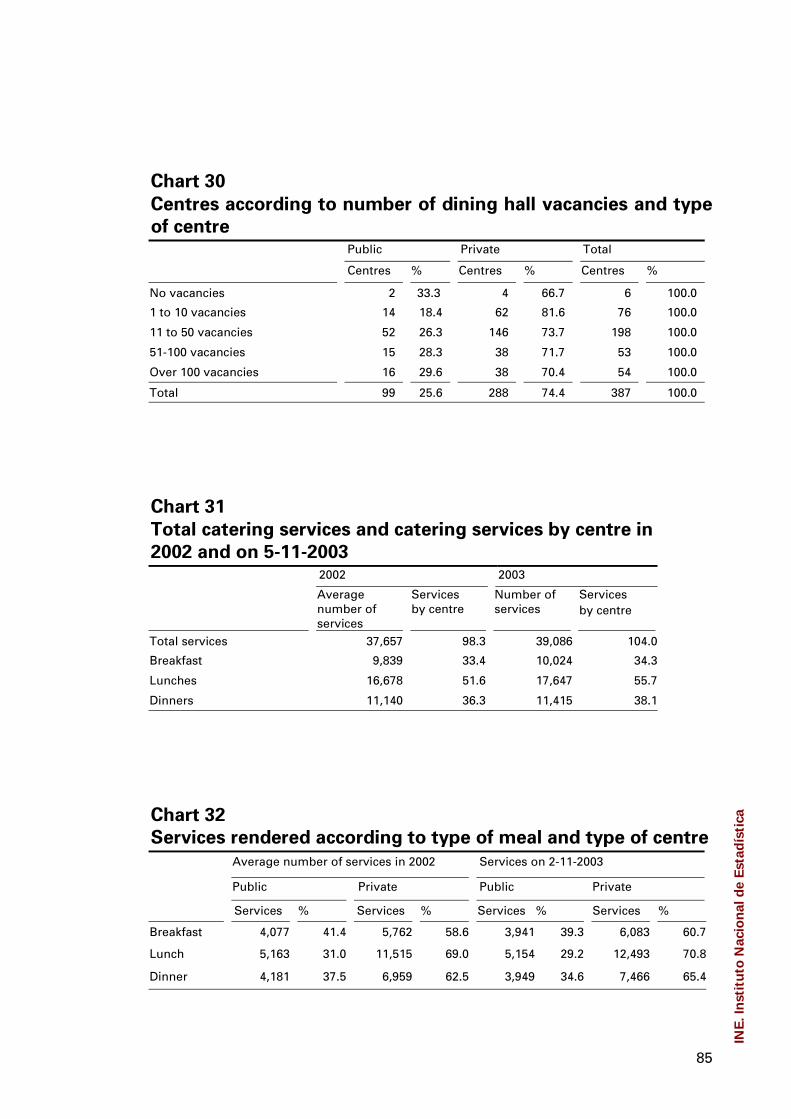
85
Chart 30
Centres according to number of dining hall vacancies and type
of centrePublic Private Total
Centres % Centres % Centres %
No vacancies 2 33.3 4 66.7 6 100.0
1 to 10 vacancies 14 18.4 62 81.6 76 100.0
11 to 50 vacancies 52 26.3 146 73.7 198 100.0
51-100 vacancies 15 28.3 38 71.7 53 100.0
Over 100 vacancies 16 29.6 38 70.4 54 100.0
Total 99 25.6 288 74.4 387 100.0
Chart 31
Total catering services and catering services by centre in
2002 and on 5-11-20032002 2003
Averagenumber ofservices
Servicesby centre
Number ofservices
Servicesby centre
Total services 37,657 98.3 39,086 104.0
Breakfast 9,839 33.4 10,024 34.3
Lunches 16,678 51.6 17,647 55.7
Dinners 11,140 36.3 11,415 38.1
Chart 32
Services rendered according to type of meal and type of centre
Average number of services in 2002 Services on 2-11-2003
Public Private Public Private
Services % Services % Services % Services %
Breakfast 4,077 41.4 5,762 58.6 3,941 39.3 6,083 60.7
Lunch 5,163 31.0 11,515 69.0 5,154 29.2 12,493 70.8
Dinner 4,181 37.5 6,959 62.5 3,949 34.6 7,466 65.4
INE
. In
stit
uto
Nac
ion
al d
e E
stad
ísti
ca
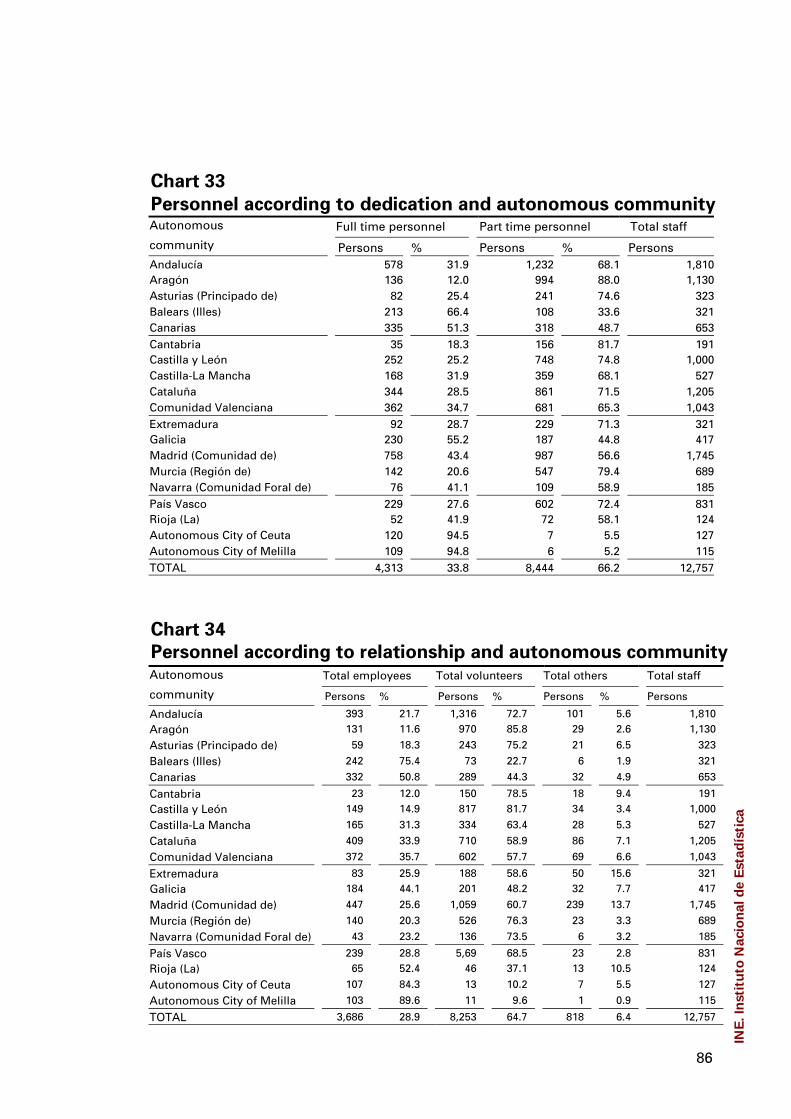
86
Chart 33
Personnel according to dedication and autonomous communityAutonomous Full time personnel Part time personnel Total staff
community Persons % Persons % PersonsAndalucía 578 31.9 1,232 68.1 1,810Aragón 136 12.0 994 88.0 1,130Asturias (Principado de) 82 25.4 241 74.6 323Balears (Illes) 213 66.4 108 33.6 321Canarias 335 51.3 318 48.7 653Cantabria 35 18.3 156 81.7 191Castilla y León 252 25.2 748 74.8 1,000Castilla-La Mancha 168 31.9 359 68.1 527Cataluña 344 28.5 861 71.5 1,205Comunidad Valenciana 362 34.7 681 65.3 1,043Extremadura 92 28.7 229 71.3 321Galicia 230 55.2 187 44.8 417Madrid (Comunidad de) 758 43.4 987 56.6 1,745Murcia (Región de) 142 20.6 547 79.4 689Navarra (Comunidad Foral de) 76 41.1 109 58.9 185País Vasco 229 27.6 602 72.4 831Rioja (La) 52 41.9 72 58.1 124Autonomous City of Ceuta 120 94.5 7 5.5 127Autonomous City of Melilla 109 94.8 6 5.2 115TOTAL 4,313 33.8 8,444 66.2 12,757
Chart 34
Personnel according to relationship and autonomous communityAutonomous Total employees Total volunteers Total others Total staff
community Persons % Persons % Persons % Persons
Andalucía 393 21.7 1,316 72.7 101 5.6 1,810Aragón 131 11.6 970 85.8 29 2.6 1,130
Asturias (Principado de) 59 18.3 243 75.2 21 6.5 323
Balears (Illes) 242 75.4 73 22.7 6 1.9 321
Canarias 332 50.8 289 44.3 32 4.9 653
Cantabria 23 12.0 150 78.5 18 9.4 191Castilla y León 149 14.9 817 81.7 34 3.4 1,000
Castilla-La Mancha 165 31.3 334 63.4 28 5.3 527
Cataluña 409 33.9 710 58.9 86 7.1 1,205
Comunidad Valenciana 372 35.7 602 57.7 69 6.6 1,043
Extremadura 83 25.9 188 58.6 50 15.6 321Galicia 184 44.1 201 48.2 32 7.7 417
Madrid (Comunidad de) 447 25.6 1,059 60.7 239 13.7 1,745
Murcia (Región de) 140 20.3 526 76.3 23 3.3 689
Navarra (Comunidad Foral de) 43 23.2 136 73.5 6 3.2 185
País Vasco 239 28.8 5,69 68.5 23 2.8 831Rioja (La) 65 52.4 46 37.1 13 10.5 124
Autonomous City of Ceuta 107 84.3 13 10.2 7 5.5 127
Autonomous City of Melilla 103 89.6 11 9.6 1 0.9 115
TOTAL 3,686 28.9 8,253 64.7 818 6.4 12,757
INE
. In
stit
uto
Nac
ion
al d
e E
stad
ísti
ca
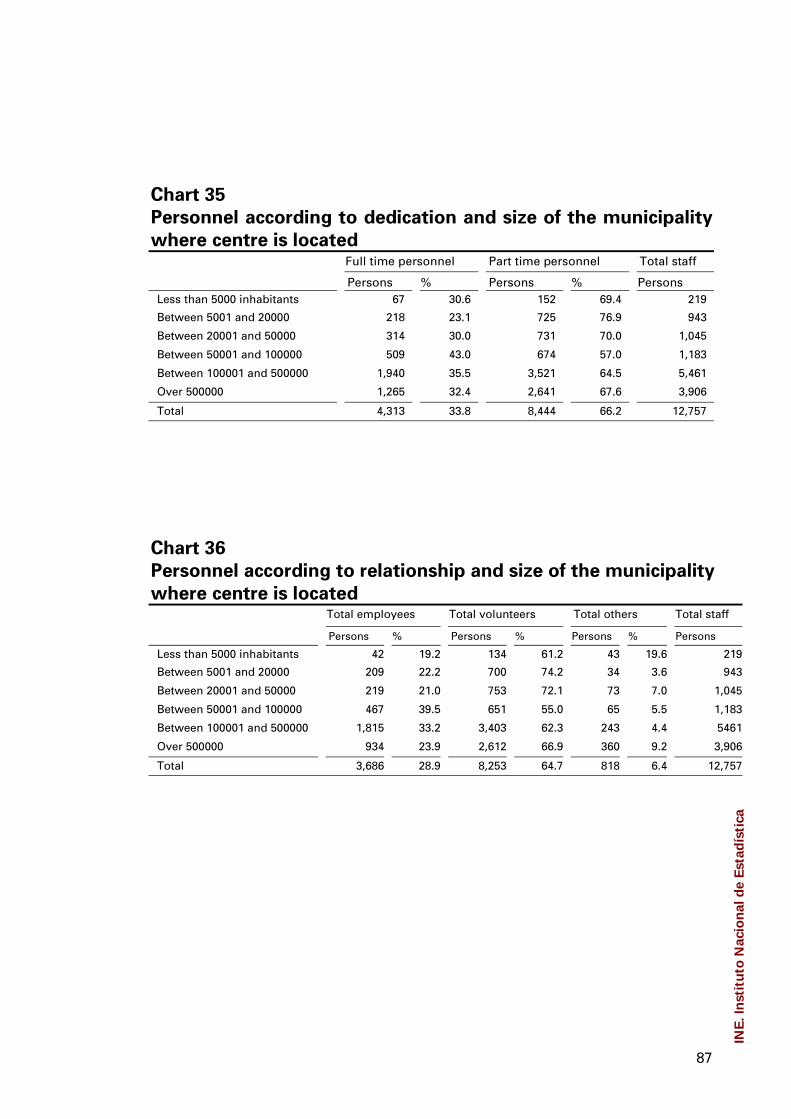
87
Chart 35
Personnel according to dedication and size of the municipality
where centre is locatedFull time personnel Part time personnel Total staff
Persons % Persons % PersonsLess than 5000 inhabitants 67 30.6 152 69.4 219
Between 5001 and 20000 218 23.1 725 76.9 943
Between 20001 and 50000 314 30.0 731 70.0 1,045
Between 50001 and 100000 509 43.0 674 57.0 1,183
Between 100001 and 500000 1,940 35.5 3,521 64.5 5,461
Over 500000 1,265 32.4 2,641 67.6 3,906
Total 4,313 33.8 8,444 66.2 12,757
Chart 36
Personnel according to relationship and size of the municipality
where centre is locatedTotal employees Total volunteers Total others Total staff
Persons % Persons % Persons % Persons
Less than 5000 inhabitants 42 19.2 134 61.2 43 19.6 219
Between 5001 and 20000 209 22.2 700 74.2 34 3.6 943
Between 20001 and 50000 219 21.0 753 72.1 73 7.0 1,045
Between 50001 and 100000 467 39.5 651 55.0 65 5.5 1,183
Between 100001 and 500000 1,815 33.2 3,403 62.3 243 4.4 5461
Over 500000 934 23.9 2,612 66.9 360 9.2 3,906
Total 3,686 28.9 8,253 64.7 818 6.4 12,757
INE
. In
stit
uto
Nac
ion
al d
e E
stad
ísti
ca

88
Chart 37
Personnel according to task and autonomous community (Continues)Autonomous Management
personnelTechnicalpersonnel
Healthpersonnel
Community Persons % Persons % Persons %Andalucía 111 6.1 294 16.2 103 5.7Aragón 42 3.7 53 4.7 30 2.7Asturias (Principado de) 12 3.7 38 11.8 3 0.9Balears (Illes) 12 3.7 91 28.3 3 0.9Canarias 28 4.3 187 28.6 8 1.2
Cantabria 9 4.7 13 6.8 6 3.1Castilla y León 67 6.7 224 22.4 14 1.4Castilla-La Mancha 53 10.1 121 23.0 18 3.4Cataluña 61 5.1 172 14.3 41 3.4Comunidad Valenciana 54 5.2 219 21.0 42 4.0
Extremadura 26 8.1 36 11.2 15 4.7Galicia 57 13.7 45 10.8 8 1.9Madrid (Comunidad de) 54 3.1 175 10.0 34 1.9Murcia (Región de) 45 6.5 87 12.6 10 1.5Navarra (Comunidad Foral de) 10 5.4 24 13.0 6 3.2
País Vasco 38 4.6 128 15.4 5 0,6Rioja (La) 8 6.5 39 31.5 5 4,0Autonomous City of Ceuta 4 3.1 18 14.2 6 4,7Autonomous City of Melilla 10 8.7 7 6.1 4 3,5TOTAL 701 5.5 1,971 15.5 361 2,8
(Conclusion)Autonomous Aux. personnel
performing social-educational tasks
Auxiliary administra-tive and servicepersonnel
Total
Community Persons % Persons % PersonsAndalucía 334 18.5 968 53.5 1,810Aragón 248 21.9 757 67.0 1,130Asturias (Principado de) 37 11.5 233 72.1 323Balears (Illes) 31 9.7 184 57.3 321Canarias 104 15.9 326 49.9 653
Cantabria 37 19.4 126 66.0 191Castilla y León 307 30.7 388 38.8 1,000Castilla-La Mancha 157 29.8 178 33.8 527Cataluña 427 35.4 504 41.8 1,205Comunidad Valenciana 237 22.7 491 47.1 1,043
Extremadura 84 26.2 160 49.8 321Galicia 101 24.2 206 49.4 417Madrid (Comunidad de) 414 23.7 1,068 61.2 1,745Murcia (Región de) 371 53.8 176 25.5 689Navarra (Comunidad Foral de) 95 51.4 50 27.0 185
País Vasco 388 46.7 272 32.7 831Rioja (La) 31 25.0 41 33.1 124Autonomous City of Ceuta 35 27.6 64 50.4 127Autonomous City of Melilla 12 10.4 82 71.3 115
TOTAL 3,450 27.0 6,274 49.2 12,757
INE
. In
stit
uto
Nac
ion
al d
e E
stad
ísti
ca

89
Chart 38
Personnel according to task and size of the municipality where
centre is located (Continues)Managementpersonnel
Technicalpersonnel
Healthpersonnel
Persons % Persons % Persons %Less than 5000 inhabitants 16 7.3 50 22.8 3 1.4Between 5001 and 20000 107 11.3 85 9.0 24 2.5
Between 20001 and 50000 77 7.4 132 12.6 28 2.7
Between 50001 and 100000 101 8.5 135 11.4 27 2.3
Between 100001 and 500000 249 4.6 1,111 20.3 179 3.3
Over 500000 151 3.9 458 11.7 100 2.6
Total 701 5.5 1,971 15.5 361 2.8
(Conclusion) Aux. personnelperforming social-educational tasks
Auxiliary administra-tive and servicepersonnel
Total
Persons % Persons % PersonsLess than 5000 inhabitants 21 9.6 129 58.9 219Between 5001 and 20000 261 27.7 466 49.4 943
Between 20001 and 50000 236 22.6 572 54.7 1,045
Between 50001 and 100000 286 24.2 634 53.6 1,183
Between 100001 and 500000 1,570 28.7 2,352 43.1 5,461
Over 500000 1,076 27.5 2,121 54.3 3,906
Total 3,450 27.0 6,274 49.2 12,757
Chart 39
Centres according to type of main financing source (Continues)
Total publicadministrations
Companies Total private non-profit institutions
Single source of finance 157 28.3%%%
0 0.0%%
38 6.8%
Main source of finance 158 28.5% 2 0.4% 34 6.1%
No main source of finance
(Conclusion)
Private donations Own funds Total
Single source of finance 11 2.0% 17 3.1% 223 40.2%
Main source of finance 24 4.3% 43 7.7% 261 47.0%
No main source of finance 71 12.8%
INE
. In
stit
uto
Nac
ion
al d
e E
stad
ísti
ca

90
Chart 40
Proportion of centres according to type of main financing
source and autonomous community (Continues)
Autonomous Administrations Corporate Private non-profitinstitutions
Community % % %Andalucía 49.3 0.0 16.9Aragón 48.5 0.0 30.3Asturias (Principado de) 46.2 7.7 15.4Balears (Illes) 73.3 0.0 6.7Canarias 86.1 0.0 2.8Cantabria 25.0 0.0 25.0Castilla y León 44.0 0.0 16.0Castilla-La Mancha 87.2 0.0 2.6Cataluña 47.4 0.0 14.0Comunidad Valenciana 68.0 2.0 10.0Extremadura 47.1 0.0 17.6Galicia 48.6 0.0 13.5Madrid (Comunidad de) 43.9 0.0 7.3Murcia (Región de) 61.9 0.0 9.5Navarra (Comunidad Foral de) 28.6 0.0 42.9País Vasco 67.6 0.0 8.8Rioja (La) 72.7 0.0 0.0Autonomous City of Ceuta 25.0 0.0 0.0Autonomous City of Melilla 100.0 0.0 0.0TOTAL 56.8 0.4 13.0
(Conclusion)
Autonomous Gifts Own funds No main source.
Community % % %Andalucía 11.3 11.3 11.3Aragón 3.0 12.1 6.1Asturias (Principado de) 0.0 15.4 15.4Balears (Illes) 6.7 13.3 0.0Canarias 2.8 0.0 8.3Cantabria 0.0 0.0 50.0Castilla y León 2.0 24.0 14.0Castilla-La Mancha 0.0 5.1 5.1Cataluña 8.8 12.3 17.5Comunidad Valenciana 4.0 2.0 14.0Extremadura 5.9 17.6 11.8Galicia 10.8 13.5 13.5Madrid (Comunidad de) 14.6 14.6 19.5Murcia (Región de) 4.8 9.5 14.3Navarra (Comunidad Foral de) 0.0 28.6 0.0País Vasco 8.8 2.9 11.8Rioja (La) 9.1 0.0 18.2Autonomous City of Ceuta 0.0 25.0 50.0Autonomous City of Melilla 0.0 0.0 0.0TOTAL 6.3 10.8 12.8
INE
. In
stit
uto
Nac
ion
al d
e E
stad
ísti
ca

91
Chart 41
Proportion of centres according to main financing source and
volume of expenditureMain financing source Less than
or equal to100,000€
Between100,001 and500,000€
Between500,001 and1,000,000€
Over1,000,000 €
Total
Administrations 50.2 62.6 65.9 62.5 56.8
Corporate 0.7 0.0 0.0 0.0 0.4
Private non-profit institutions 19.6 7.0 4.9 6.3 13.0
Donations 5.5 6.6 9.8 6.3 6.3
Own funds 12.9 8.8 4.9 18.8 10.8
No main source 11.1 15.0 14.6 6.3 12.8
INE
. In
stit
uto
Nac
ion
al d
e E
stad
ísti
ca