santa clara county 2017 homeless census … 1: methodology ... 2017 santa clara county homeless...
TRANSCRIPT

REPORT PRODUCED BY ASR
SANTA CLARA COUNTYHOMELESS CENSUS & SURVEYcomprehensive report2017
2 |2017 Santa Clara County Homeless Census & Survey
ABOUT THE RESEARCHER
Applied Survey Research (ASR) is a social research firm dedicated to helping people build
better communities by collecting meaningful data, facilitating information-based planning,
and developing custom strategies. The firm was founded on the principle that community
improvement, initiative sustainability, and program success are closely tied to assessment
needs, evaluation of community goals, and development of appropriate responses.
HOUSING INSTABILITY RESEARCH DEPARTMENT (HIRD)
Vice President: Peter Connery
Department Director: Samantha Green
Project Lead: John Connery
Department Coordinator: Christina Connery
Research Analysts: Connie Chu, Marissa Jaross, Paige Combs, Jenna Gallant, Audra Eads,
Heather Hazen
Graphic Design and Layout: Michelle Luedtke and Molly Stene
LOCATIONS
Central Coast:
55 Penny Lane, Suite 101
Watsonville, CA 95076
tel 831-728-1356
Bay Area:
1871 The Alameda, Suite 180
San José, CA 95126
tel 408-247-8319
www.appliedsurveyresearch.org

2017 Santa Clara County Homeless Census & Survey | 3
Table of Contents TABLE OF FIGURES ...................................................................................................... 4
ACKNOWLEDGEMENTS .............................................................................................. 6
INTRODUCTION........................................................................................................... 7
Project Overview and Goals .................................................................................... 8
Federal Definition of Homelessness for Point-in-Time Counts ............................. 9
POINT-IN-TIME CENSUS ........................................................................................... 10
Number and Characteristics of Homeless Persons in Santa Clara County ........... 11
Total Number of Unsheltered and Sheltered Homeless Persons by Jurisdiction . 12
HOMELESS SURVEY FINDINGS ................................................................................ 15
Survey Demographics ............................................................................................ 16
Living Accommodations ....................................................................................... 20
Duration and Recurrence of Homelessness ......................................................... 23
Primary Cause of Homelessness ........................................................................... 25
Services and Assistance ........................................................................................ 27
Employment and Income ..................................................................................... 29
Health ................................................................................................................... 30
Domestic/Partner Violence or Abuse .................................................................... 31
Criminal Justice System ....................................................................................... 32
HUD DEFINED SUBPOPULATIONS ........................................................................... 33
Chronically Homeless Individuals ........................................................................ 33
Veterans ................................................................................................................ 39
Families with Children .......................................................................................... 44
Unaccompanied Homeless Children and Transition-Age Youth ......................... 49
CONCLUSION ............................................................................................................. 55
APPENDIX 1: METHODOLOGY ................................................................................. 56
Street Count Methodology .................................................................................... 56
Shelter Count Methodology .................................................................................. 59
Survey Methodology ............................................................................................. 60
APPENDIX 2: DEFINITIONS & ABBREVIATIONS .................................................... 62
APPENDIX 3: SURVEY QUESTIONS .......................................................................... 64
..................................................................................................................................... 65

Table of Figures
4 |2017 Santa Clara County Homeless Census & Survey
Table of Figures Point-in-Time Census……………………………………………………………………………………11
Figure 1. Total Number of Homeless Individuals Enumerated During the Point-In-Time
Homeless Census with Trend, Santa Clara County .................................................... 11
Figure 2. Total Number of Homeless Individuals Enumerated During the Point-In-Time
Homeless Census, Sheltered vs. Unsheltered ............................................................. 11
Figure 3. Total Homeless Census Population by Shelter Status ................................................. 12
Figure 4. Total Number of Homeless Persons by Jurisdiction and Shelter Status..................... 12
Figure 5. Total Homeless Census Population by Gender............................................................ 13
Figure 6. Total Homeless Census Population by Race ................................................................ 14
Figure 7. Total Homeless Census Population by Hispanic/Non-Hispanic ................................ 14
Homeless Survey Findings……….….……………………………..…………………………………16
Figure 8. Survey Respondents by Age ......................................................................................... 16
Figure 9. Gender by Age of Survey Respondents ........................................................................ 16
Figure 10. Sexual Orientation and LGBTQ Identity ..................................................................... 17
Figure 11. Hispanic or Latino Ethnicity........................................................................................ 17
Figure 12. Race .............................................................................................................................. 18
Figure 13. History of Foster Care .................................................................................................. 19
Figure 14. Place of Residence at Time of Housing Loss .............................................................. 20
Figure 15. Living Arrangements Immediately Prior to Becoming Homeless ............................... 21
Figure 16. Usual Places to Sleep at Night .................................................................................... 22
Figure 17. First Time Homeless (Respondents Answering “Yes”) .............................................. 23
Figure 18. Age at First Experience of Homelessness ................................................................... 23
Figure 19. Length of Current Episode of Homelessness .............................................................. 24
Figure 20. Primary Cause of Homelessness ................................................................................. 25
Figure 21. Obstacles to Obtaining Permanent Housing .............................................................. 26
Figure 22. Government Assistance Received ............................................................................... 27
Figure 23. Reasons for Not Receiving Government Assistance ................................................... 28
Figure 24. Services or Assistance ................................................................................................. 28
Figure 25. Employment and Monthly Income ............................................................................. 29
Figure 26. Health Conditions ....................................................................................................... 30
Figure 27. History of Domestic Violence ...................................................................................... 31
Figure 28. Spent a Night in Jail or Prison in the Last 12 Months ................................................ 32

2017 Santa Clara County Homeless Census & Survey | 5
HUD Defined Subpopulations…………….…………………………………………………………34
Figure 29. Total Number of Chronically Homeless Individuals Enumerated During the Point-In-
Time Homeless Census with Trend ........................................................................... 34
Figure 30. Chronic Homeless Census Population by Shelter Status ........................................... 35
Figure 31. Total Chronic Homeless Census Population by Gender ............................................. 35
Figure 32. Race Among Persons Experiencing Chronic Homelessness ...................................... 36
Figure 33. Primary Cause of Homelessness, Chronic and Non-Chronic Comparison ................ 37
Figure 34. Health Conditions, Chronic and Non-Chronic Comparison ...................................... 37
Figure 35. Total Number of Homeless Veterans Enumerated During the Point-In-Time
Homeless Census with Trend .................................................................................... 39
Figure 36. Homeless Veteran Census Population by Shelter Status ............................................ 40
Figure 37. Total Homeless Veteran Census Population by Gender ............................................. 40
Figure 38. Race Among Homeless Veterans ................................................................................. 41
Figure 39. Primary Cause of Homelessness, Veteran and Non-Veteran Comparison ................ 42
Figure 40. Health Conditions, Veteran and Non-Veteran Comparison....................................... 42
Figure 41. Total Number of Homeless Families with Children Enumerated During the Point-In-
Time Homeless Census, with Trend .......................................................................... 44
Figure 42. Percentage of Individuals in Homeless Families with Children, by Shelter Status ... 45
Figure 43. Individuals in Homeless Families with Children, Census Population by Race .......... 45
Figure 44. Individuals in Homeless Families with Children, Census Population by
Hispanic/Non-Hispanic ............................................................................................. 45
Figure 45. Primary Cause of Homelessness, Families with Children and Non-Families with
Children Comparison ................................................................................................. 47
Figure 46. Health Conditions, Families with Children and Non-Families with Children
Comparison ................................................................................................................ 47
Figure 47. Total Number of Unaccompanied Homeless Children and Transition-Age Youth
Enumerated During the Point-In-Time Homeless Census, with Trend .................... 50
Figure 48. Unaccompanied Homeless Children and Transition-Age Youth Population Estimates
.................................................................................................................................... 50
Figure 49. Unaccompanied Homeless Children and Transition-Age Youth Census Population by
Shelter Status ............................................................................................................. 50
Figure 50. Unaccompanied Homeless Children and Transition-Age Youth Census Population by
Region ......................................................................................................................... 51
Figure 51. Unaccompanied Homeless Children and Transition-Age Youth Census Population by
Gender ......................................................................................................................... 51
Figure 53. Primary Cause of Homelessness, Unaccompanied Children and Transition-Age Youth
and Adults Over Age 24 Comparison ......................................................................... 53
Figure 54. Health Conditions, Unaccompanied Children and Transition-Age Youth and Adults
Over Age 24 Comparison ........................................................................................... 53
Figure 55. History of Foster Care, Unaccompanied Children and Transition-Age Youth........... 54
Acknowledgements
6 |2017 Santa Clara County Homeless Census & Survey
Acknowledgements The 2017 Santa Clara County Census & Survey planning team would like to thank the many
individuals and agencies who contributed to this project. The participation of community
volunteers and partner agencies is critical to the success of the count. Hundreds of
community volunteers, city and county employees, and local community-based organizations
assisted with all aspects of the count, from the initial planning meetings, to the night of the
count, to the publication of this report.
ASR would like to give special thanks to the individuals experiencing homelessness who acted
as surveyors and guides during the count. Without their dedication and knowledge, the Santa
Clara County Census and Survey would not be able to conduct these efforts. They provide
access and knowledge about the community that is unobtainable without their support. These
individuals took time from their day to participate in this effort and we owe them thanks.
PROJECT PLANNING COMMITTEE
Chris Malcom, Erin Stanton, Leila Qureishi, Michelle Covert, Vanessa Beretta
POINT-IN-TIME JURISDICTIONAL FUNDERS
City of Campbell
City of Cupertino
City of Gilroy
City of Los Altos
Town of Los Altos Hills
Town of Los Gatos
City of Milpitas
City of Monte Sereno
City of Morgan Hill
City of Mountain View
City of Palo Alto
City of San José
City of Saratoga
City of Santa Clara
City of Sunnyvale
County of Santa Clara
OTHER ACKNOWLEDGEMENTS
The following organizations were involved in the planning and data reporting process: Abode,
Bill Wilson Center, Bitfocus, Destination:Home, City of San Jose, City of Sunnyvale, County
Office of Supportive Housing, Diocese of San José, Gardner Family Health Network, HACSC,
HomeFirst, Housing Choices Coalition, PATH, Sacred Heart Community Services, Santa
Clara University, SCCOE, and St. Joseph’s Family Center.
The following locations acted as deployment centers and we are very thankful for their
participation and support during the count: Bill Wilson Drop-In Center, Emmanuel House,
Salvation Army, Gilroy Compassion Center, City Team Ministries, Southside Community
Center, West Valley Community Services, and Opportunity Health Center.

Introduction
2017 Santa Clara County Homeless Census & Survey | 7
Introduction Every two years, during the last ten days of January, communities across the country conduct
comprehensive counts of the local population experiencing homelessness. These counts
measure the prevalence of homelessness in each community, and collect information on
individuals and families residing in emergency shelters and transitional housing, as well as
people sleeping on the streets, in cars, in abandoned properties, or in other places not meant
for human habitation.
The biennial Point-in-Time Census is the only source of nationwide data on sheltered and
unsheltered homelessness, and is required by the U.S. Department of Housing and Urban
Development (HUD) of all jurisdictions receiving federal funding to provide housing and
services for individuals and families experiencing homelessness.
Continuums of Care report the findings of their local Point-in-Time Census in their annual
funding application to HUD, which ultimately help the federal government better understand
the nature and extent of homelessness nationwide. Count data also help to inform
communities’ local strategic planning, capacity building, and advocacy campaigns to prevent
and end homelessness.
The Santa Clara County Continuum of Care (SCC CoC) worked in conjunction with Applied
Survey Research (ASR) to conduct the 2017 Santa Clara County Homeless Census and Survey.
ASR is a social research firm with extensive experience in homeless enumeration and needs
assessment. ASR has partnered with the county since 2007, maintaining the same
methodology and thus ensuring as much consistency as possible, from one year to the next.
The Homeless Census and Survey has two primary components: a point-in-time enumeration
of unsheltered individuals and families experiencing homelessness and a comprehensive
survey sampling of people experiencing homelessness.
The 2017 census was a comprehensive community effort. With the support of approximately
132 individuals with lived experience of homelessness, 215 community volunteers, staff from
various city and county departments, and law enforcement, the entire county was canvassed
between the hours of 5:30 a.m. and noon on January 24 and 25, 2017. Because of the size of
Santa Clara County, the count is spread over two days, with interstate 880 serving as the
dividing line between day 1 and day 2. This resulted in a peer-informed visual count of
unsheltered homeless individuals and families residing on the streets, in vehicles, makeshift
shelters, encampments and other places not meant for human habitation. Shelters and
facilities reported the number of homeless individuals and families who occupied their
facilities on the night of January 24, 2017.
The SCC CoC also conducted a specialized count of unaccompanied children and transition-
age youth under the age of 25 years old. This dedicated count is part of a nationwide effort,
established and recommended by HUD, to improve our understanding of the scope of youth
homelessness. Trained youth enumerators who are currently or recently have experienced

Introduction
8 |2017 Santa Clara County Homeless Census & Survey
homelessness conducted the count in targeted areas where young people experiencing
homelessness were known to congregate.1 This is an important year for national data on
young people experiencing homelessness, as HUD will use 2017 youth count results as a
baseline for measuring progress toward ending youth homelessness by 2020.
In the weeks following the street count, an in-depth survey was administered to 587
unsheltered and sheltered homeless individuals. The survey gathered basic demographic
details as well as information on service needs and utilization.
This report provides data regarding the number and characteristics of people experiencing
homelessness in the Santa Clara CoC on two nights in January. Special attention is given to
specific subpopulations, including chronically homeless individuals, veterans, families,
unaccompanied children under the age of 18, and transition-age youth between the ages of 18
and 24.
To better understand the dynamics of homelessness over time, results from previous years
(including 2013 and 2015) are provided where available and applicable.
PROJECT OVERVIEW AND GOALS
In order for the 2017 Santa Clara County Census and Survey to best reflect the experience and
expertise of the community, ASR held regular planning meetings with city and county
officials. These officials were drawn from city and county departments with experience in
issues facing the population experiencing homelessness and many had participated in past
counts. These individuals comprised the 2017 Planning Committee, and were instrumental to
ensuring the 2017 Santa Clara County Homeless Census and Survey reflected the needs and
concerns of the community.
The 2017 Planning Committee worked towards several important project goals:
To preserve current federal funding for homeless services and to enhance the ability
to raise new funds;
To improve the ability of policy makers and service providers to plan and implement
services that meet the needs of the local homeless population;
To measure changes in the numbers and characteristics of the homeless population
since the 2015 Santa Clara County Homeless Census and Survey, and to track
progress toward ending homelessness;
To increase public awareness of overall homeless issues and generate support for
constructive solutions; and
To assess the status of specific subpopulations, including veterans, families,
unaccompanied children, transition-age youth, and those who are chronically
homeless.
This report is intended to assist service providers, policy makers, funders, and local, state,
and federal government in gaining a better understanding of the population currently
Significant deduplication efforts were made in 2017 to ensure unaccompanied children and youth were not captured in
both the youth and general street count efforts. For more information on these efforts and the overall count
methodology, please see Appendix 1.
Introduction
2017 Santa Clara County Homeless Census & Survey | 9
experiencing homelessness, measuring the impact of current policies and programming, and
planning for the future.
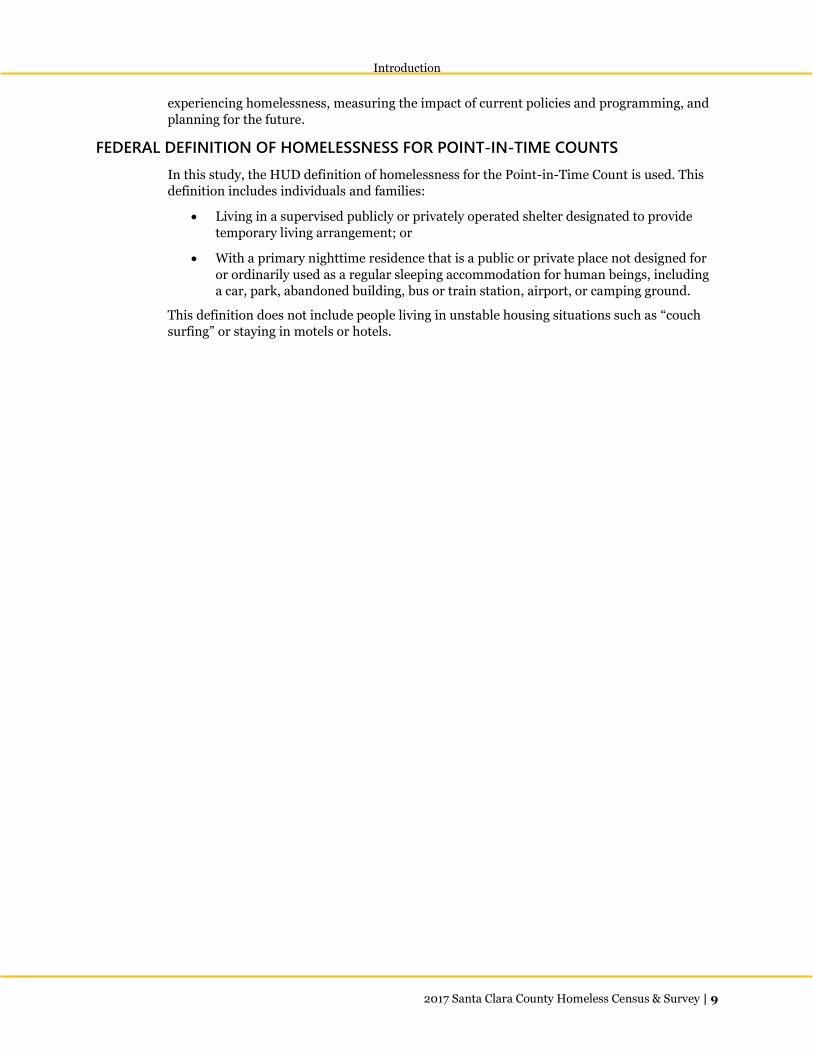
FEDERAL DEFINITION OF HOMELESSNESS FOR POINT-IN-TIME COUNTS
In this study, the HUD definition of homelessness for the Point-in-Time Count is used. This
definition includes individuals and families:
Living in a supervised publicly or privately operated shelter designated to provide
temporary living arrangement; or
With a primary nighttime residence that is a public or private place not designed for
or ordinarily used as a regular sleeping accommodation for human beings, including
a car, park, abandoned building, bus or train station, airport, or camping ground.
This definition does not include people living in unstable housing situations such as “couch
surfing” or staying in motels or hotels.

Point-In-Time Census
10 |2017 Santa Clara County Homeless Census & Survey
Point-In-Time Census The 2017 Santa Clara County Homeless Census and Survey included a complete enumeration
of all unsheltered and sheltered homeless persons. The general street count was conducted on
January 24 and 25, 2017 from approximately 5:30 a.m. to noon and covered all of the 1,307
square miles of Santa Clara County. The shelter count was conducted on the night of January
24, 2017, and included all individuals staying in: emergency shelters, transitional housing
facilities for the homeless, and domestic violence shelters. The general street count and
shelter count methodology were similar to those used in 2015, with some moderate
improvements.
The methodology used for the 2017 Santa Clara County Homeless Census and Survey is
commonly described as a “blitz count” since it is conducted by a large team over a very short
period of time. In Santa Clara County the result of this method is an observation based count
of individuals and families who appear to be homeless. The count is then followed by an in-
person representative survey used to profile and estimate the condition and characteristics of
the local homeless population. Information collected from the survey is used to fulfill HUD
reporting requirements, and to inform local service delivery and strategic planning efforts.
In a continuing effort to improve data on the extent of youth homelessness, Santa Clara
County also conducted a dedicated youth count similar to the one conducted in 2015. The
dedicated youth count methodology was improved in 2017 to better ensure that
unaccompanied children and transition-age youth were not double counted in both the
general street and youth, to involve youth input and knowledge from the very beginning, and
to make sure that more area was covered. For more information regarding the dedicated
youth count, deduplication, and project methodology, please see Appendix 1.

Point-In-Time Census
2017 Santa Clara County Homeless Census & Survey | 11
26% 74%
NUMBER AND CHARACTERISTICS OF HOMELESS PERSONS IN SANTA CLARA
COUNTY
The 2017 Santa Clara County Homeless Census and Survey found a total of 7,394 individuals
experiencing homelessness on the night January 24th and 25th. This represents an increase of
13% since 2015.
FIGURE 1. TOTAL NUMBER OF HOMELESS INDIVIDUALS ENUMERATED DURING THE POINT-IN-TIME
HOMELESS CENSUS WITH TREND, SANTA CLARA COUNTY
Source: Applied Survey Research. (2007-2017). Santa Clara County Homeless Census and Survey.
FIGURE 2. TOTAL NUMBER OF HOMELESS INDIVIDUALS ENUMERATED DURING THE POINT-IN-TIME
HOMELESS CENSUS, SHELTERED VS. UNSHELTERED
Source: Applied Survey Research. (2017). Santa Clara County Homeless Census and Survey.
7,202 7,086 7,067 7,631
6,556 7,394
0
10,000
2007 2009 2011 2013 2015 2017
Total Homeless Population: 7,394

Point-In-Time Census
12 |2017 Santa Clara County Homeless Census & Survey
FIGURE 3. TOTAL HOMELESS CENSUS POPULATION BY SHELTER STATUS
2009 2011 2013 2015 2017
‘15-‘17 %
CHANGE
Sheltered 2,103 1,898 1,957 1,929 1,946 1%
Unsheltered 4,983 5,169 5,674 4,627 5,448 17%
Total 7,086 7,067 7,631 6,556 7,394 13%
Source: Applied Survey Research. (2009-2017). Santa Clara County Homeless Census and Survey.
TOTAL NUMBER OF UNSHELTERED AND SHELTERED HOMELESS PERSONS BY JURISDICTION
FIGURE 4. TOTAL NUMBER OF HOMELESS PERSONS BY JURISDICTION AND SHELTER STATUS
UNSHELTERED SHELTERED TOTAL
JURISDICTION 2015 2017 2015 2017 2015 2017
‘15-‘17 % CHANGE
Total Incorporated 4,204 5,259 1,817 1,775 6,021 7,034 17%
City of Campbell 53 94 0 0 53 94 77%
City of Cupertino 50 127 23 0 73 127 74%
City of Gilroy 179 295 260 427 439 722 64%
City of Los Altos 18 6 0 0 18 6 *
Town of Los Gatos 1 52 0 0 1 52 *
City of Milpitas 122 66 0 0 122 66 -46%
City of Monte
Sereno 1 0 0 0 1 0
*
City of Morgan Hill 81 388 0 0 81 388 379%
City of Mountain
View 271 411 5 5 276 416
51%
City of Palo Alto 203 256 16 20 219 276 26%
City of San José 2,810 3,231 1,253 1,119 4,063 4,350 7%
City of Santa Clara 150 199 227 73 377 272 -28%
City of Saratoga 10 12 0 0 10 12 *
City of Sunnyvale 255 122 33 131 288 253 -12%
Total
Unincorporated 423 189 77 113 500 302 -40%
Confidential
Locations NA NA 35 58 35 58 66%
Total 4,627 5,448 1,929 1,946 6,556 7,394 13%
Source: Applied Survey Research. (2015-2017). Santa Clara County Homeless Census and Survey.
*Note: Percentage change was not calculated for jurisdictions with less than 50 individuals.
70%
30%
2009
73%
27%
2011
74%
26%
2013
71%
29%
2015
74%
26%
2017
Unsheltered
Sheltered

Point-In-Time Census
2017 Santa Clara County Homeless Census & Survey | 13
FIGURE 5. TOTAL HOMELESS CENSUS POPULATION BY GENDER
Source: Applied Survey Research. (2017). Santa Clara County Homeless Census and Survey.
28%
72%
2015
33%
67%
2017
Female Male
2017
FEMALE MALE TRANS-GENDER TOTAL
Sheltered
Persons in family
households
450 329 0 779
Persons in non-
family households
282 881 4 1,167
Unsheltered
Persons in family
households 153 143 0 296
Persons in non-
family households
1,519 3,620 13 5,152
Total 2,404 4,973 17 7,394

Point-In-Time Census
14 |2017 Santa Clara County Homeless Census & Survey
FIGURE 6. TOTAL HOMELESS CENSUS POPULATION BY RACE
2015 n=6,556; 2017 n= 7,394
Source: Applied Survey Research. (2015-2017). Santa Clara County Homeless Census and Survey.
U.S. Census Bureau. (January 2017). American Community Survey 2015 1-Year Estimates, Table DP05: ACS
Demographic and Housing Estimates. Retrieved from http://factfinder2.census.gov
Note: Multiple response question. Percentages may not add up to 100 due to rounding.
FIGURE 7. TOTAL HOMELESS CENSUS POPULATION BY HISPANIC/NON-HISPANIC
2015 N=6,556; 2017 N=7,394
Source: Applied Survey Research. (2015-2017). Santa Clara County Homeless Census and Survey.
42%
1%
30%18%
3% 7%
48%
0% 5% 3%
34%
1%
47%
20%13% 14%
3% 3%
0%
100%
White Native Hawaiian
or Pacific Islander
Multi-Race Black or African
American
Asian American Indian
or Alaska Native
2015 Homeless Census Population
2015 Santa Clara County General Population
2017 Homeless Census Population
38
%60
%
2%
2015
44%
56%
2017
Hispanic
Non-Hispanic
Don't Know/ Refuse

Homeless Survey Findings
2017 Santa Clara County Homeless Census & Survey | 15
Homeless Survey Findings The methodology used for the 2017 Santa Clara County Homeless Census is described by
HUD as a “blitz count and survey” in that it is conducted by numerous people over a very
short period of time in an effort to avoid duplicate enumeration. The census is followed by a
face-to-face representative survey. Importantly, the survey sample is then used to profile and
estimate the condition and characteristics of the county’s homeless population and
subpopulations for the purposes of HUD reporting and local service delivery and strategic
planning. The results of the “blitz” census, combined with the survey, are used to provide
estimates of the number of people affected by a given experience, while the survey provides
the foundational data elements for the characteristics discussed in the following section of the
report.
This section provides an overview of the findings generated from the survey component of the
2017 Santa Clara County Homeless Census and Survey. Surveys were administered to a
sample of homeless individuals in the weeks following the census. This effort resulted in 587
complete and unique surveys. Based on a Point-in-Time Count of 7,394 homeless persons,
with a randomized survey sampling process, these 587 valid surveys represent a confidence
interval of +/- 4% with a 95% confidence level when generalizing the results of the survey to
the estimated population of homeless individuals in Santa Clara County. In other words, if the
survey were conducted again, we can be confident that the results would be within four
percentage points of the current results.
In order to respect respondent privacy and to ensure the safety and comfort of those who
participated, respondents were not required to complete all survey questions. Missing values
are intentionally omitted from the survey results. Therefore, the total number of respondents
for each question will not always equal the total number of surveys conducted.

Homeless Survey Findings
16 |2017 Santa Clara County Homeless Census & Survey
SURVEY DEMOGRAPHICS
In order to gain a more comprehensive understanding of the experiences of individuals and
families experiencing homelessness in Santa Clara, respondents were asked basic
demographic questions including age, gender, sexual orientation, and race/ethnicity.
AGE OF SURVEY RESPONDENTS
Eight percent (8%) of survey respondents were under the age of 25 at the time of the survey.
Twenty-three percent (23%) were between the ages of 25 and 40, 61% were between the ages
of 41 and 60, and 9% were 61 years or older.
FIGURE 8. SURVEY RESPONDENTS BY AGE
Age Group 2015 2017
Less than 18 Years 1% <1%
18-24 Years 12% 7%
25-30 Years 7% 7%
31-40 Years 20% 16%
41-50 Years 25% 27%
51-60 Years 26% 34%
61 Years or More 9% 9%
2015 n: 952; 2017 n: 587
Source: Applied Survey Research. (2015-2017). Santa Clara County Homeless Census and Survey.
GENDER AND AGE
Over one-third of survey respondents (34%) identified as female, 64% as male, and 1% as
transgender. One percent did not identify as male, female, or transgender. Among the female
population, 3% indicated that they were currently pregnant.
More than half (54%) of survey respondents indicated they were men and between the age of
25 and 60, followed by women in the same age group (28%).
FIGURE 9. GENDER BY AGE OF SURVEY RESPONDENTS
Gender 0-24 25-60
61 and
Older
Male 5% 54% 5%
Female 2% 28% 3%
Transgender 1% 1% 0%
Other 1% 0% 0% 2017 n: 586
Source: Applied Survey Research. (2017). Santa Clara County Homeless Census and Survey.

Homeless Survey Findings
2017 Santa Clara County Homeless Census & Survey | 17
SEXUAL ORIENTATION
While there are limited data available on the number of lesbian, gay, bisexual, transgender,
and queer (LGBTQ) individuals experiencing homelessness, nationwide data available
suggest LGBTQ individuals experience homelessness at higher rates, especially those under
the age of 25. Twenty-nine percent (29%) of homeless survey respondents identified as
LGBTQ in 2017. Of those respondents, 76% identified as bisexual, 9% lesbian, 7% gay, 7%
transgender, and 5% identified with another gender or sexual orientation.
FIGURE 10. SEXUAL ORIENTATION AND LGBTQ IDENTITY
Breakout of Respondents Answering Yes % n
Gay 7% 12
Lesbian 9% 16
Bisexual 76% 130
Transgender 7% 12
Queer 1% 1
Other 5% 9
LGBTQ 2017 n= 587; Breakout n=172 respondents offering 180 responses
Source: Applied Survey Research. (2017). Santa Clara County Homeless Census and Survey.
Note: Multiple response question. Percentages may not add up to 100.
RACE/ETHNICITY
The U.S. Department of Housing and Urban Development (HUD) gathers data on race and
ethnicity in two separate questions, similar to the U.S. Census. When asked if they identified
as Hispanic or Latino, more than half (58%) of homeless survey respondents reported they
did not identify as Hispanic or Latino. In comparison to the general population of Santa Clara
County, a higher percentage of homeless respondents identified as Hispanic or Latino (42%
compared to 27%).
FIGURE 11. HISPANIC OR LATINO ETHNICITY
2017 n = 577
Source: Applied Survey Research. (2017). Santa Clara County Homeless Census and Survey.
U.S. Count Bureau. (April 2015). American Community Survey 2015 1-Year Estimates. Table DP05: ACS
Demographic and Housing Estimates. Retrieved from https://factfinder.census.gov.
Note: Percentages may not add up to 100 due to rounding.
27%
73%
42%
58%
0%
100%
Hispanic/Latino Not Hispanic/Latino
2015 Santa Clara County General Population 2017 Homeless Survey Population
29%
71%
LGBTQ Status
Yes No

Homeless Survey Findings
18 |2017 Santa Clara County Homeless Census & Survey
In regards to racial identity, differences between the general population and those
experiencing homelessness were more distinct. A much higher proportion of homeless survey
respondents identified as Black or African-American (16% compared to 3%), whereas a very
small percentage of the homeless survey population identified as Asian when compared to the
general population (4% compared to 34%).
FIGURE 12. RACE
2017 n = 521
Source: Applied Survey Research. (2017). Santa Clara County Homeless Census and Survey.
U.S. Count Bureau. (April 2015). American Community Survey 2015 1-Year Estimates. Table DP05: ACS
Demographic and Housing Estimates. Retrieved from https://factfinder.census.gov.
Note: Percentages may not add up to 100 due to rounding.
48%
5%1% <3%
34%
<1%
42%
24%
3%
16%
4%
3%
0%
100%
White Other Native Hawaiian
or Pacific Islander
Black or African
American
Asian American Indian
or Alaska Native
2015 Santa Clara General Population 2017 Homeless Survey Population

Homeless Survey Findings
2017 Santa Clara County Homeless Census & Survey | 19
HISTORY OF FOSTER CARE
It has been estimated that one in five former foster youth experience homelessness within
four years of exiting the foster care system.2 In the State of California, foster youth are now
eligible to receive services beyond age 18. Transitional housing and supportive services for
youth between 18-24 are provided with the hope that these additional supports, implemented
in 2012, will assist foster youth with the transition to independence and prevent them from
becoming homeless.
In 2017, 12% of respondents reported a history of foster care, lower than in 2015 (16%). The
percentage of youth under the age of 25 who had been in foster care was much higher than
adults over the age of 25 (45% compared to 10%).
FIGURE 13. HISTORY OF FOSTER CARE
2017 n: 566
Source: Applied Survey Research. (2015-2017). Santa Clara County Homeless Census and Survey.
12% 88%

Homeless Survey Findings
20 |2017 Santa Clara County Homeless Census & Survey
LIVING ACCOMMODATIONS
Where individuals lived prior to experiencing homelessness and where they have lived since
impacts the way they seek services, as well as their ability to access support from friends or
family. Previous circumstances can also point to gaps in the system of care, and reveal
opportunities for systemic improvement and homeless prevention.
Survey respondents reported many different living accommodations prior to becoming
homeless, although most lived in or around Santa Clara County with friends or family, or on
their own in a home or apartment.
PLACE OF RESIDENCE
Knowing where individuals were living before they most recently lost their housing informs
discussions regarding how local the homeless population is to the region. This information
can also influence changes to available support systems if the Continuum of Care finds
increasing numbers of individuals living locally before experiencing homelessness.
Eighty-three percent (83%) of respondents reported living in Santa Clara County at the time
they most recently became homeless, similar to 2015 (84%). Among these respondents, over
half (61%) had lived in Santa Clara County for 10 or more years; five percent (5%) had lived in
Santa Clara for less than one year.
Four percent (4%) of respondents reported living out of state at the time they lost their
housing, and 13% reported living in another county in California.
FIGURE 14. PLACE OF RESIDENCE AT TIME OF HOUSING LOSS
2017 n=580
Source: Applied Survey Research. (2017). Santa Clara County Homeless Census and Survey.

Homeless Survey Findings
2017 Santa Clara County Homeless Census & Survey | 21
PRIOR LIVING ARRANGEMENTS
Similar to previous place of residence, the type of living arrangements of individuals were in
prior to experiencing homelessness provides a look into what types of homeless prevention
services might be offered to help individuals maintain their housing.
Forty-two percent (42%) of survey respondents reported living in a home owned or rented by
themselves or their partner prior to becoming homeless, slightly higher than 2015 (39%).
Thirty-five percent (35%) reported living with friends or relatives, similar to 2015. Six percent
(6%) reported they were living jail or prison, and four percent (4%) were staying in a
subsidized housing or permanent supportive housing unit. Three percent (3%) of respondents
reported they were in a hospital or treatment facility immediately prior to becoming
homeless.
FIGURE 15. LIVING ARRANGEMENTS IMMEDIATELY PRIOR TO BECOMING HOMELESS
2011 n= 1,004; 2013 n= 811; 2015 n= 886; 2017 n= 575
Source: Applied Survey Research. (2011-2017). Santa Clara County Homeless Census and Survey.
39% 37%
7% 2%
48%
26%
10%3%
39% 35%
6% 6%
42%35%
6% 4%
0%
100%
A Home Owned or Rented
by You or Your Partner
With Friends/Relatives Jail/Prison Subsidized or Permanent
Supportive Housing
2011 2013 2015 2017

Homeless Survey Findings
22 |2017 Santa Clara County Homeless Census & Survey
CURRENT LIVING ARRANGEMENTS
While basic information on where individuals were observed during the general street count
effort is collected, survey respondents are also asked about their usual nighttime
accommodations. Understanding the types of places individuals experiencing homelessness
are sleeping can help inform local outreach efforts.
Thirty-six percent (36%) reported staying in a public shelter (emergency shelter, transitional
housing facility, or an alternative shelter environment). Over one-third (35%) of survey
respondents reported currently living outdoors, either on the streets, in parks, or in
encampment areas. Fourteen percent (14%) reported sleeping in public buildings, foyers,
hallways, or other indoor locations not meant for human habitation, 8% were staying in a
hotel or motel, and 8% were staying in a vehicle.
FIGURE 16. USUAL PLACES TO SLEEP AT NIGHT
2011 n= 1,012; 2013 n= 850; 2015 n= 926; 2017 n= 587
Source: Applied Survey Research. (2011-2017). Santa Clara County Homeless Census and Survey.
Note: 2013 response option specified that motel/hotel was paid for by an agency.
27%34%
15%8% 11%
33%42%
9% 5% 10%
34% 36%
15%7% 8%
36% 35%
14% 8% 8%
0%
100%
Emergency,
Transitional, or Other
Shelter
Outdoors/ Streets/
Parks/ Encampments
A Structure or Indoor
Area Not Normally
Used for Sleeping
Motel/Hotel Vehicle
(Car/ Van/ RV/
Camper)
2011 2013 2015 2017

Homeless Survey Findings
2017 Santa Clara County Homeless Census & Survey | 23
DURATION AND RECURRENCE OF HOMELESSNESS
Many individuals who experience homelessness will several episodes over time. As some
relapse and fall out of stable housing, it becomes important to keep track of the number of
times they experience literal homelessness.
Unstable living conditions, poverty, housing scarcity, and many other issues often lead to
individuals returning to homelessness. For many, the experience of homelessness is part of a
long and recurring history of housing instability. More than half (60%) of 2017 survey
respondents reported they had experienced homelessness previously.
FIGURE 17. FIRST TIME HOMELESS (RESPONDENTS ANSWERING “YES”)
2011 n= 1,009; 2013 n= 855; 2015 n= 937; 2017 n= 585
Source: Applied Survey Research. (2009-2017). Santa Clara County Homeless Census and Survey.
In an effort to better understand the experiences and age distribution of those experiencing
homelessness, respondents were asked how old they were the first time they experienced
homelessness. In response, 7% of respondents reported that they were under the age of 18,
18% reported they were between the ages of 18 and 24, and 75% reported they were 25 or
older.
FIGURE 18. AGE AT FIRST EXPERIENCE OF HOMELESSNESS
2015 n: 913; 2017 n; 557
Source: Applied Survey Research. (2015-2017). Santa Clara County Homeless Census and Survey.
48% 46%
33%41%
0%
100%
2011 2013 2015 2017
12%
24%
64%
2015
7%
18%
75%
2017
0-17 Years Old
18-24 Years Old
25 Years or Older

Homeless Survey Findings
24 |2017 Santa Clara County Homeless Census & Survey
DURATION OF HOMELESSNESS
When asked how long they had been homeless, over two-thirds (64%) of survey respondents
reported they had been homeless for a year or more. These findings are similar to 2015, when
63% of respondents reported they had been homeless for a year or more.
FIGURE 19. LENGTH OF CURRENT EPISODE OF HOMELESSNESS
2011 n= 992; 2013 n= 836; 2015 n= 911; 2017 n= 585
Source: Applied Survey Research. (2013-2017). Santa Clara County Homeless Census and Survey.
6%
7%
14%
15%
12%
47%
4%
5%
12%
13%
10%
56%
4%
3%
7%
14%
9%
63%
1%
2%
6%
14%
13%
64%
0% 100%
7 Days or Less
8-30 Days
1-3 Months
4-6 Months
7-11 Months
1 Year or More
2017 2015 2013 2011

Homeless Survey Findings
2017 Santa Clara County Homeless Census & Survey | 25
PRIMARY CAUSE OF HOMELESSNESS
The primary cause of an individual’s inability to obtain or retain housing is difficult to
pinpoint, as it is often the result of multiple and compounding causes.
Over a third (37%) of survey respondents reported job loss as the primary cause of their
homelessness, while twenty percent (20%) cited drug or alcohol use. Sixteen percent (16%) of
respondents indicated eviction as the primary cause of their homeless, a much higher rate
than in previous years. Fourteen percent (14%) of respondents reported a divorce or
separation as the primary cause of their homelessness.
FIGURE 20. PRIMARY CAUSE OF HOMELESSNESS
2011 n: 997; 2013 n= 818 respondents offering 1,029; 2015 n= 920 respondents offering 1,326 responses;
2017 n= 580 respondents offering 793 responses.
Source: Applied Survey Research. (2011-2017). Santa Clara County Homeless Census and Survey.
27%20%
6% 10%5%
40%
17%
5% 9% 12%
31%20%
15% 13% 10%
37%
20%14% 13% 16%
0%
100%
Lost Job Alcohol or Drug Use Divorce/ Separation/
Breakup
Argument/ Family or
Friend Asked You to
Leave
Eviction
2011 2013 2015 2017

Homeless Survey Findings
26 |2017 Santa Clara County Homeless Census & Survey
OBSTACLES TO OBTAINING PERMANENT HOUSING
Many who are experiencing homelessness face significant barriers in obtaining permanent
housing. These barriers can range from housing affordability and availability to accessing the
economic and social supports (e.g. increased income, rental assistance, case management)
needed to access and maintain permanent housing. An inability to secure adequate housing
can lead to an inability to address other basic needs, such as healthcare and adequate
nutrition.
Survey respondents were asked what prevented them from obtaining housing. The majority
(62%) reported that they could not afford rent. Over one half (56%) reported a lack of job or
income, followed by 23% who reported that they had no money for moving costs, and 20%
who reported bad credit as an obstacle to obtaining permanent housing.
FIGURE 21. OBSTACLES TO OBTAINING PERMANENT HOUSING
2011 n= 999 respondents offering 2,412 responses; 2013 n= 774 respondents offering 1,831 responses; 2015 n= 896
respondents offering 3,012 responses; 2017 n= 571 respondents offering 1,382
Source: Applied Survey Research. (2011-2017). Santa Clara County Homeless Census and Survey.
Note: Multiple response question. Percentages may not add up to 100.
69%
56%
29%17%
22%
65%54%
30%21% 17%
68%57%
37%27% 27%
62%56%
23% 20%13%
0%
100%
Can't Afford Rent No Job/ Income No Money for
Moving Costs
Bad Credit Transportation
2011 2013 2015 2017

Homeless Survey Findings
2017 Santa Clara County Homeless Census & Survey | 27
43%33% 36%
8%
39%24%
37%
9%
40%29% 26% 27%
14%
59%
36%24%
38%
9%
0%
100%
Food Stamps General
Assistance/Relief
Not Receiving Any
Form of Government
Assistance
Medi-cal/Medicare* SSI/SSDI/Disability
2011 2013 2015 2017
SERVICES AND ASSISTANCE
Santa Clara County provides services and assistance to those currently experiencing
homelessness through federal and local programs. Government assistance and homeless
services work to enable individuals and families to obtain income and support. However,
many eligible individuals and families do not apply for services; many believe that they do not
qualify for assistance. Connecting homeless individuals and families to these support services
creates a bridge to mainstream support services and prevents future housing instability.
GOVERNMENT ASSISTANCE
There are a variety of forms of government assistance available to individuals experiencing
homelessness. However, knowledge of services available, understanding of eligibility
requirements, and perceived stigma of receiving governmental assistance can all impact the
rate at which eligible individuals access these benefits.
Nearly two thirds (76%) of survey respondents in 2017 reported they were receiving some
form of government assistance.
FIGURE 22. GOVERNMENT ASSISTANCE RECEIVED
2011 n= 989 respondents offering 1,316 responses; 2013 n= 811 respondents offering 1,004 responses; 2015 n= 883
respondents offering 1,363 responses; 2017 n= 557 respondents offering 1,011 responses
Source: Applied Survey Research. (2011-2017). Santa Clara County Homeless Census and Survey.
Note: Multiple response question. Percentages may not add up to 100.
* Medi-Cal/Medicare was added as a response option in 2015.

Homeless Survey Findings
28 |2017 Santa Clara County Homeless Census & Survey
21%29%
23% 18%24%
10%23% 19%
10% 15%25% 24% 19% 16% 18%
9%17%
39%
11% 14%
0%
100%
No Permanent
Address
Don't Think I'm
Eligible
Don't Want
Government
Assistance*
Have No
Identification
Never Applied
2011 2013 2015 2017
Of those who reported they were not receiving any form of government support, the greatest
percentage reported they did want government assistance (39%), at a rate much higher than
similar respondents in 2015 (19%). Seventeen percent (17%) did not think they were eligible
(a decrease from 24% in 2015).
FIGURE 23. REASONS FOR NOT RECEIVING GOVERNMENT ASSISTANCE
2011 n= 341 respondents offering 630 responses; 2013 n= 289 respondents offering 382 responses; 2015 n= 206
respondents offering 335 responses; 2017 n= 133 respondents offering 164
Source: Applied Survey Research. (2011-2017). Santa Clara County Homeless Census and Survey.
Note: Multiple response question. Percentages may not add up to 100.
*In 2013 the response option changed from “do not need” to “do not want,” which was an option in 2011.
SERVICES AND PROGRAMS
In addition to government assistance, there are numerous community-based services and
programs available to individuals experiencing homelessness. These services range from day
shelters and meal programs to job training and healthcare.
The majority of respondents reported using meal services (80%). Forty-one percent (41%) of
respondents reported utilizing bus pass services, while approximately one in five respondents
reported using religious based services. In 2017, two new options were offered to
respondents; twenty-eight percent (28%) of respondents reported using community drop in
centers, while 10% reported using job training/employment services.
FIGURE 24. SERVICES OR ASSISTANCE
2015 n= 875 respondents offering 1,960 responses; 2017 n= 570 respondents offering 1,247
Source: Applied Survey Research. (2015-2017). Santa Clara County Homeless Census and Survey.
Note: Multiple response question. Percentages may not add up to 100.
* Community drop in center and job training/employment services response were added in 2017
65%
36%
17%
80%
41%
18%28%
10%
0%
100%
Meal Services Bus Passes Religious Based
Services
Community Drop in
Center*
Job
Training/Employment
Services*
2015 2017

Homeless Survey Findings
2017 Santa Clara County Homeless Census & Survey | 29
EMPLOYMENT AND INCOME
While the majority of survey respondents reported being unemployed, a number reported
part-time or full-time work; many were receiving an income, either public or private. Despite
some income, data suggest that employment and income were not enough to meet basic
needs.
The unemployment rate in Santa Clara County in January 2017 was at 3.6%, slightly down
from 4.7% during the same period in 2015.3 It is important to recognize that the
unemployment rate represents only those who are unemployed and actively seeking
employment. It does not represent all joblessness, nor does it address the types of available
employment. The unemployment rate among homeless survey respondents was 92%, an
increase from 81% in 2015. Fifty-five percent (55%) of unemployed respondents indicated
that they were currently looking for work, 23% indicated they were currently unable to work,
and nearly a quarter (22%) of respondents were currently not looking for work
Income from all sources varied between those with regular employment and those who were
unemployed. Over one-third (37%) of unemployed respondents reported an income of $99 or
less per month, in comparison to 7% of those who were employed. Unemployed income is
typically from government services, benefits, recycling, or panhandling. Overall income for
those with employment was higher than those without. For example, 40% of employed
respondents reported making $750 or more per month, compared to 16% of unemployed
respondents.
FIGURE 25. EMPLOYMENT AND MONTHLY INCOME
2017 EMPLOYED 2017 UNEMPLOYED
% n % n
$0-$99 7 3 37 186
$100-$449 26 11 39 199
$450-$749 28 12 9 44
$750-$1,099 14 6 10 51
$1,100-$1,499 14 6 4 20
$1,500-$3,000 12 5 2 8
More than $3,000 0 0 <1% 2
2017 employment status n: 560; Income employed n: 43; Income unemployed n: 510
Source: Applied Survey Research. (2015-2017). Santa Clara County Homeless Census and Survey.
Note: Respondents were challenged by this income question and the low response for employed income is subject to
a high margin of error.
State of California Employment Development Department. (2017). Unemployment Rates (Labor Force). Retrieved 2017
from http://www.labormarketinfo.edd.ca.gov
19%
81%
2015
8%
92%
2017
Employed
Unemployed

Homeless Survey Findings
30 |2017 Santa Clara County Homeless Census & Survey
HEALTH
The average life expectancy for individuals experiencing homelessness is 25 years less than
those in stable housing. Without regular access to healthcare and without safe and stable
housing, individuals experience preventable illness and often endure longer hospitalizations.
It is estimated that those experiencing homelessness stay four days (or 36%) longer per
hospital admission than non-homeless patients.4 Drug or alcohol abuse among survey
respondents was higher in 2017 than in 2015 (48% compared to 38%). Similarly, chronic
health problems were cited more frequently in 2017 than in 2015 (27% and 22%,
respectively).
FIGURE 26. HEALTH CONDITIONS
2015 n: 880-902; 2017 n: 548-570
Source: Applied Survey Research. (2015-2017). Santa Clara County Homeless Census and Survey.
Note: Multiple response question. Percentages may not add up to 100.
Sharon A. Salit, M. E. (1998). Hospitalization Costs Associated with Homelessness in New York City . New England Journal
of Medicine, 338, 1734-1740.
38% 39%30% 25% 22%
12%1%
48%38%
31%22% 27%
9%2%
0%
100%
Drug or
Alcohol Abuse
Psychiatric or
Emotional
Conditions
Physical
Disability
Post-Traumatic
Stress Disorder
(PTSD)
Chronic Health
Problems
Traumatic Brain
Injury
AIDS/HIV
Related
2015 2017

Homeless Survey Findings
2017 Santa Clara County Homeless Census & Survey | 31
DOMESTIC/PARTNER VIOLENCE OR ABUSE
Histories of domestic violence and partner abuse are prevalent among individuals
experiencing homelessness, and can be a primary cause of homelessness for many. Survivors
often lack many of the financial resources required for housing due to a limited employment
history or dependable income. Three percent (3%) of all survey respondents reported
currently experiencing domestic/partner violence or abuse. When asked about experiences
throughout their lifetime, 21% reported domestic/partner violence or abuse, a lower
percentage of respondents than in 2015 (27%).
Domestic violence varied by gender, with 7% of female respondents reporting current
experiences of domestic violence, compared to less than 1% of male respondents. Looking at
domestic violence across the lifetime, 35% of female and 13% of male respondents reported
previous experiences of domestic violence.
FIGURE 27. HISTORY OF DOMESTIC VIOLENCE
2017 n=575
Source: Applied Survey Research. (2017). Santa Clara County Homeless Census and Survey.
21% 79%

Homeless Survey Findings
32 |2017 Santa Clara County Homeless Census & Survey
CRIMINAL JUSTICE SYSTEM
Homelessness and incarceration are often correlative. Individuals without stable housing are
at greater risk of criminal justice system involvement, particularly those with mental health
issues, veterans, and youth. Individuals with past incarceration face significant barriers to
exiting homelessness due to stigmatization, and policies that affect both their ability to gain
employment and access housing opportunities.5
INCARCERATION
When asked if they had spent a night in jail or prison in the last 12 months, approximately
one in four (26%) survey respondents reported that they had, similar to 2015 findings (30%).
Sixteen percent (16%) of respondents reported being on probation or parole at the time of the
survey. Eight percent (8%) of respondents indicated they had accessed re-entry services.
FIGURE 28. SPENT A NIGHT IN JAIL OR PRISON IN THE LAST 12 MONTHS
2015 n= 903; 2017 n= 573
Source: Applied Survey Research. (2015-2017). Santa Clara County Homeless Census and Survey.
Greenberg, GA, Rosenheck, RA. (2008). Jail Incarceration, Homelessness, and Mental Health: A National Study. Psychiatr
Serv, 2008 Feb;59(2): 170-7.
30%
70%
2015
26%
74%
2017
Yes No

HUD Defined Subpopulations
2017 Santa Clara County Homeless Census & Survey | 33
HUD Defined Subpopulations Opening Doors: Federal Strategic Plan to Prevent and End Homelessness outlines national
objectives and evaluative measures for ending homelessness in the United States. In order to
adequately address the diversity within the population experiencing homelessness, the federal
government identifies four subpopulations with particular challenges or needs. These four
subpopulations include: individuals experiencing chronic homelessness, veterans, families,
and unaccompanied children and transition-age youth. Consequently, these subpopulations
represent important reportable indicators for measuring local progress toward ending
homelessness.
The following sections examine each of these four subpopulations, identifying the number
and characteristics of individuals included in the 2017 Santa Clara County Homeless Census
and Survey.
Of the 587 surveys completed in 2017, the results represent 257 chronically homeless
individuals, 49 homeless veterans, 19 individuals in homeless families,6 42 unaccompanied
children and transition-age youth. Surveys were completed in unsheltered environments,
shelters, and transitional housing settings.
CHRONICALLY HOMELESS INDIVIDUALS
The Department of Housing and Urban Development defines a chronically homeless
individual as someone who has experienced homelessness for a year or longer, or who has
experienced at least four episodes of homelessness in the last three years, and also has a long-
term disabling condition. This definition applies to individuals as well as heads of household
who meet the definition.
The chronically homeless population represents one of the most vulnerable populations on
the street; the mortality rate for those experiencing chronic homelessness is four to nine
times higher than the general population.7 Data from communities across the country show
that public costs incurred by those experiencing extended periods of homelessness include
emergency room visits, interactions with law enforcement, incarceration, and regular access
6 Homeless families are somewhat underrepresented in Santa Clara’s Homeless Survey data due sample execution issues.
The majority of homeless families in Santa Clara are currently residing in shelters and transitional housing facilities. In
2017, shelter staff reported difficulties completing surveys of families, due to a variety of reasons.
7 United States Interagency Council on Homelessness. (2010). Supplemental Document to the Federal Strategic Plan to
Prevent and End Homelessness: June 2010. Retrieved 2017 from
https://www.usich.gov/resources/uploads/asset_library/BkgrdPap_ChronicHomelessness.pdf

HUD Defined Subpopulations
34 |2017 Santa Clara County Homeless Census & Survey
to social supports and homeless services. These combined costs are often significantly higher
than the cost of providing individuals with permanent housing and supportive services.
The U.S. Department of Housing and Urban Development reported that roughly 22% of the
national homeless population, or 77,486 individuals, was chronically homeless in 2016.8
Chronic homelessness has been on the decline in recent years, as communities across the
country increase the capacity of their permanent supportive housing programs and prioritize
those with the greatest barriers to housing stability. While the national decrease in chronic
homelessness seems promising, federal budget constraints limit the amount of money
available to support housing programs and services. As a result, Opening Doors, which began
with a plan to end chronic homelessness by 2016, has extended the goal to 2017.9
CHRONICALLY HOMELESS INDIVIDUALS
There were a total of 2,097 individuals experiencing chronic homelessness, the lowest total
since 2013. Individuals experiencing chronic homelessness made up 28% of the total
homeless population.
FIGURE 29. TOTAL NUMBER OF CHRONICALLY HOMELESS INDIVIDUALS ENUMERATED DURING THE
POINT-IN-TIME HOMELESS CENSUS WITH TREND
Source: Applied Survey Research. (2009-2017). Santa Clara County Homeless Census and Survey.
8 Department of Housing and Urban Development. (2016). Annual Assessment Report to Congress. Retrieved 2017 from
https://www.hudexchange.info/resources/documents/2016-AHAR-Part-1.pdf
9 Cavallaro, E. (2017). Ending Chronic Homelessness, Now in 2017. National Alliance to End Homelessness. Retrieved 2017
from http://www.endhomelessness.org
979
2,520 2,518 2,169 2,097
0
3,000
2009 2011 2013 2015 2017

HUD Defined Subpopulations
2017 Santa Clara County Homeless Census & Survey | 35
FIGURE 30. CHRONIC HOMELESS CENSUS POPULATION BY SHELTER STATUS
2013 n= 2,518; 2015 n= 2,169; 2017 n= 2,097
Source: Applied Survey Research. (2013-2017). Santa Clara County Homeless Census and Survey.
FIGURE 31. TOTAL CHRONIC HOMELESS CENSUS POPULATION BY GENDER
2013 n= 2,518; 2015 n= 2,169; 2017 n= 2,097
Source: Applied Survey Research. (2013-2017). Santa Clara County Homeless Census and Survey.
90%
10%
2013
92%
8%
2015
86%
14%
2017
Unsheltered
Sheltered
22%
77%
<1%
2013
38%
61%
<1%
2015
32%
68%
< 1%
2017
Female
Male
Transgender

HUD Defined Subpopulations
36 |2017 Santa Clara County Homeless Census & Survey
DEMOGRAPHICS OF CHRONICALLY HOMELESS SURVEY RESPONDENTS
The majority of chronically homeless survey respondents identified as male (68%), and at a
slightly higher rate than the non-chronically homeless population (61%). A similar percentage
of chronically homeless respondents identified as Hispanic or Latino compared to non-
chronically homeless respondents (42% and 43%, respectively). Eight percent (8%) of
chronically homeless respondents identified as veterans, similar to the non-chronic
population.
FIGURE 32. RACE AMONG PERSONS EXPERIENCING CHRONIC HOMELESSNESS
Chronic n= 225
Source: Applied Survey Research. (2017). Santa Clara County Homeless Census and Survey.
Note: Percentages may not add up to 100 due to rounding.
49%
14%
5%
18%
4%
10%
White
Black or African American
Asian
American Indian or Alaska
Native
Native Hawaiian or Pacific
Islander
Other

HUD Defined Subpopulations
2017 Santa Clara County Homeless Census & Survey | 37
PRIMARY CAUSE OF HOMELESSNESS AMONG THOSE EXPERIENCING CHRONIC HOMELESSNESS
Over one-third (37%) of chronically homeless survey respondents stated job loss as the
primary cause of their homelessness, similar to 35% of respondents in 2015. Eleven percent
(11%) of chronically homeless respondents cited an argument with a family member as the
primary cause of their homelessness, compared to 15% of non-chronically homeless survey
respondents.
FIGURE 33. PRIMARY CAUSE OF HOMELESSNESS, CHRONIC AND NON-CHRONIC COMPARISON
Chronic Survey Population= 257 respondents offering 391 responses; Non-Chronic Survey Population= 323
respondents offering 402 responses
Source: Applied Survey Research. (2017). Santa Clara County Homeless Census and Survey.
Note: Multiple response question. Percentages may not add up to 100.
HEALTH CONDITIONS AMONG THOSE EXPERIENCING CHRONIC HOMELESSNESS
The definition of chronic homelessness requires a disabling condition, and many respondents
reported experiencing multiple physical or mental health conditions. Sixty-nine percent
(69%) of chronically homeless survey respondents reported alcohol or substance use, 50%
reported an emotional or psychiatric health condition, and 42% reported a physical disability.
In general, higher rates of health conditions were reported among those who were chronically
homeless compared to their non-chronically homeless counterparts.
FIGURE 34. HEALTH CONDITIONS, CHRONIC AND NON-CHRONIC COMPARISON
Chronic Survey Population: 239-255; Non-Chronic Survey Population: 309-318
Source: Applied Survey Research. (2017). Santa Clara County Homeless Census and Survey.
Note: Multiple response question. Percentages may not add up to 100.
29%37%
16% 11% 14%13%
36%
16% 15% 13%
0%
100%
Alcohol or Drug Use Lost Job Eviction Argument with a
family member
Divorce/ Separation/
Breakup
2017 Chronic Survey Population 2017 Non-Chronic Survey Population
69%
50%42%
26%34%
12%2%
32% 27%22% 19% 21%
7% 2%
0%
100%
Drug or
Alcohol Abuse
Psychiatric or
Emotional
Conditions
Physical
Disability
Post-Traumatic
Stress Disorder
(PTSD)
Chronic Health
Problems
Traumatic Brain
Injury
AIDS/HIV
Related
2017 Chronic Survey Population 2017 Non-Chronic Survey Population

HUD Defined Subpopulations
38 |2017 Santa Clara County Homeless Census & Survey
ACCESS TO SERVICES AMONG THOSE EXPERIENCING CHRONIC HOMELESSNESS
A lower percentage (10%) of chronically homeless respondents reported they were not using
any local homeless services such as food and shelter services, compared to 17% of those who
were not chronically homeless.
Sixteen percent (16%) of chronically homeless respondents reported they were not using
government assistance, a decrease from 26% in 2015. Sixty-three percent (63%) reported
receiving CalFresh (food stamps), 42% received Medi-Cal/Medicare, and 38% received
General Assistance (GA).
Of chronically homeless respondents who were not receiving government services, nearly half
(46%) reported that they did not want government assistance. Twenty percent (20%)
reported never having applied.
INCARCERATION AMONG THOSE EXPERIENCING CHRONIC HOMELESSNESS
A similar percentage of chronic and non-chronic homeless respondents (26% and 27%,
respectively) reported they had spent one or more nights in jail or prison in the 12 months
prior to the survey. Seventeen percent (17%) of chronically homeless survey respondents
reported being on probation or parole at the time of the survey, similar to the non-chronic
population (15%).

HUD Defined Subpopulations
2017 Santa Clara County Homeless Census & Survey | 39
VETERANS
Many U.S. veterans experience conditions that place them at increased risk for homelessness.
Veterans experience higher rates of post-traumatic stress disorder (PTSD), traumatic brain
injury (TBI), sexual assault, and substance abuse. Veterans experiencing homelessness are
more likely to live on the street than in shelters, and often remain on the street for extended
periods of time.
The U.S. Department of Veterans Affairs (VA) provides a broad range of benefits and services
to veterans of the U.S. Armed Forces. These benefits can involve different forms of financial
assistance, including monthly cash payments to disabled veterans, health care, education, and
housing benefits. In addition to these supports, the VA and HUD partner to provide
additional housing and support services to veterans’ currently experiencing homelessness or
at risk of experiencing homelessness.
Between 2009 and 2016, there has been a 48% decrease in the number of homeless veterans
nationwide. According to data collected during the national 2016 Point-in-Time Count,
39,471 veterans experienced homelessness across the country on a single night in January
2016.10
HOMELESS VETERAN STATUS
There were 660 veterans identified during the 2017 Santa Clara County Homeless Census, the
lowest number among the six cycles of the census.
FIGURE 35. TOTAL NUMBER OF HOMELESS VETERANS ENUMERATED DURING THE POINT-IN-TIME
HOMELESS CENSUS WITH TREND
Source: Applied Survey Research. (2009-2017). Santa Clara County Homeless Census and Survey.
10 Department of Housing and Urban Development. (2017). Annual Assessment Report to Congress. Retrieved 2017 from
https://www.hudexchange.info/resources/documents/2014-AHAR-Part1.pdf
866
667 718 703 660
0
1,000
2009 2011 2013 2015 2017

HUD Defined Subpopulations
40 |2017 Santa Clara County Homeless Census & Survey
FIGURE 36. HOMELESS VETERAN CENSUS POPULATION BY SHELTER STATUS
2013 n= 718; 2015 n= 703; 2017 n= 660
Source: Applied Survey Research. (2013-2017). Santa Clara County Homeless Census and Survey.
FIGURE 37. TOTAL HOMELESS VETERAN CENSUS POPULATION BY GENDER
2015 n= 703; 2017 n= 660
Source: Applied Survey Research. (2015-2017). Santa Clara County Homeless Census and Survey.
81%
19%
2013
63%
37%
2015
68%
32%
2017
Unsheltered
Sheltered
12%
88%
2015
11%
89%
2017
Female Male

HUD Defined Subpopulations
2017 Santa Clara County Homeless Census & Survey | 41
DEMOGRAPHICS OF HOMELESS VETERANS
The majority of veteran homeless individuals identified as male (88%), higher than the non-
veteran homeless population (62%). A similar percentage of veteran homeless respondents
identified as Hispanic or Latino compared to non-veteran homeless respondents (43% and
42%, respectively).
FIGURE 38. RACE AMONG HOMELESS VETERANS
Veteran n= 44
Source: Applied Survey Research. (2017). Santa Clara County Homeless Census and Survey.
Note: Percentages may not add up to 100 due to rounding.
55%
16%
5%
16%
<1%
8%
White
Black or African American
Asian
American Indian or Alaska
Native
Native Hawaiian or Pacific
Islander
Other

HUD Defined Subpopulations
42 |2017 Santa Clara County Homeless Census & Survey
PRIMARY CAUSE OF HOMELESSNESS AMONG THOSE HOMELESS VETERANS
The most frequently cited cause of homelessness among veterans job loss, representing 23%
of veteran survey respondents. Twenty-one percent (21%) reported divorce, separation or
breakup as the primary cause of their homelessness, a notably higher rate when compared to
the non-veteran population (13%). Alternatively, 8% of veteran respondents cited eviction as
a primary cause of their homelessness, lower than the 17% of non-veteran survey population.
FIGURE 39. PRIMARY CAUSE OF HOMELESSNESS, VETERAN AND NON-VETERAN COMPARISON
Veterans Survey Population n= 48 respondents offering 59 responses; Non-Veteran Survey Population n= 532
respondents offering 734 responses
Source: Applied Survey Research. (2017). Santa Clara County Homeless Census and Survey.
Note: Multiple response question. Percentages may not add up to 100.
DISABLING CONDITIONS AMONG HOMELESS VETERANS
Forty-one percent (41%) of both veteran survey respondents and non-veteran survey
respondents both reported having one or more disabling conditions.
FIGURE 40. HEALTH CONDITIONS, VETERAN AND NON-VETERAN COMPARISON
Veterans Survey Population n= 45-47; Non-Veteran Survey Population n= 503-524
Source: Applied Survey Research. (2017). Santa Clara County Homeless Census and Survey.
Note: Multiple response question. Percentages may not add up to 100.
19% 23%
6% 8%
21%20%
38%
5%17% 13%
0%
100%
Alcohol or Drug Use Lost Job Mental health issues Eviction Divorce/ Separation/
Breakup
Veterans Survey Population Non-Veterans Survey Population
65%
37% 37%43%
30%20%
2%
47%38%
30%20%
27%
8%2%
0%
100%
Drug or
Alcohol Abuse
Psychiatric or
Emotional
Conditions
Physical
Disability
Post-Traumatic
Stress Disorder
(PTSD)
Chronic Health
Problems
Traumatic Brain
Injury
AIDS/HIV
Related
Veterans Survey Population Non-Veterans Survey Population

HUD Defined Subpopulations
2017 Santa Clara County Homeless Census & Survey | 43
ACCESS TO SERVICES AMONG VETERANS
Overall, the number of veterans connected to any form of government assistance was higher
than the non-veteran population, 84% compared to 75%.
When asked about the specific services they are receiving, the most frequent responses were
Food/Stamps/SNAP/WIC/CalFresh (41%) and General Assistance (23%). Twenty-seven
percent (27%) of veteran survey respondents reported using a veteran specific benefit.
INCARCERATION AMONG HOMELESS VETERANS
Among those who are incarcerated, veterans are more likely than non-veterans to be first
time offenders, to have committed a violent offense, and to have longer prison sentences.
Veterans who are incarcerated may also face the loss of various VA benefits during this time.11
A higher percentage of veterans (35%) reported having spent a night in jail in the last 12
months when compared to non-veterans (26%).
11 Military Benefits. (2014). Incarcerated Veterans. Retrieved 2014 from http://www.military.com/benefits/veteran -
benefits/incarcerated-veterans.html.

HUD Defined Subpopulations
44 |2017 Santa Clara County Homeless Census & Survey
FAMILIES WITH CHILDREN
National data from 2016 suggest that 35% of all persons experiencing homelessness are
persons in families. Very few families experiencing homelessness are unsheltered, as public
shelters serve 90% of homeless families in the United States; this is a significantly higher
proportion of the population compared to other subpopulations, including unaccompanied
children and transition-age youth. Data on families experiencing homelessness suggest that
they are not much different from families in poverty.
The risk of homelessness is highest among households headed by single women and families
with children under the age of six.12 Children in families experiencing homelessness have
increased incidence of illness and are more likely to have emotional and behavioral problems
than children with consistent living accommodations.13
HOMELESS FAMILIES WITH CHILDREN
There were a total of 294 families with children experiencing homelessness in 2017, a higher
number than 2015, but a lower number than 2013. There were a total of 1,075 individuals
living in these families. Twenty-eight percent of families were unsheltered, an increase from
previous years. The greatly increased inclusion of data from McKinney-Vento representatives
from the many participating school districts is one possible reason for this shift.
2017 saw the largest increase in participation in the history of the Census from local school
representatives, thanks to the County Office of Education (COE). McKinney-Vento
representatives have unparalleled access into families experiencing homelessness, a
population that is difficult to enumerate without their help. While not all districts
participated, far more participated than in past years, providing increased access to a
frequently overlooked population. McKinney-Vento representatives also gather data on
families that do not meet the federal definition of homelessness used in this count, or where it
cannot be determined whether they meet the definition. These families are frequently staying
in unconverted garages, hotels or motels, or other areas on private property that enumeration
teams are unable to access.
FIGURE 41. TOTAL NUMBER OF HOMELESS FAMILIES WITH CHILDREN ENUMERATED DURING THE
POINT-IN-TIME HOMELESS CENSUS, WITH TREND
Source: Applied Survey Research. (2013-2017). Santa Clara County Homeless Census and Survey.
U. S. Department of Health and Human Services. (2007). Characteristics and Dynamics of Homeless Families with
Children. Retrieved 2015 from http://aspe.hhs.gov/
13 U.S. Interagency Council on Homelessness. (2015). Opening Doors. Retrieved 2015 from http://www.usich.gov/
349 266 294
1,067
908
1,075
0
1,200
2013 2015 2017
Families Individual Family Members

HUD Defined Subpopulations
2017 Santa Clara County Homeless Census & Survey | 45
63%
27%
2015
67%
33%
2017
Hispanic
Non-Hispanic
FIGURE 42. PERCENTAGE OF INDIVIDUALS IN HOMELESS FAMILIES WITH CHILDREN, BY SHELTER
STATUS
2013 n=1,067; 2015 n=908; 2017 n=1,075
Source: Applied Survey Research. (2013-2017). Santa Clara County Homeless Census and Survey.
FIGURE 43. INDIVIDUALS IN HOMELESS FAMILIES WITH CHILDREN, CENSUS POPULATION BY RACE
2015 n=908; 2017 n= 1075
Source: Applied Survey Research. (2017). Santa Clara County Homeless Census and Survey.
U.S. Census Bureau. (May 2016). American Community Survey 2014 1-Year Estimates. Table DP05: ACS
Demographic and Housing Estimates. Retrieved from http://factfinder2.census.gov.
Note: Multiple response question. Percentages may not add up to 100 due to rounding.
FIGURE 44. INDIVIDUALS IN HOMELESS FAMILIES WITH CHILDREN, CENSUS POPULATION BY
HISPANIC/NON-HISPANIC
2015 n=908; 2017 n=1,075
Source: Applied Survey Research. (2015-2017). Santa Clara County Homeless Census and Survey.
5%
95%
2013
7%
93%
2015
28%
72%
2017
Unsheltered
Sheltered
63%
1%
14% 13%3% 6%
48%
0% 5% 3%
34%
1%
64%
2%
17%11%
<1% 4%
0%
100%
White Native Hawaiian
or Pacific Islander
Multi-race Black or African
American
Asian American Indian
or Alaska Native
2015 Homeless Census Population 2015 Santa Clara County General Population
2017 Homeless Family Census Population

HUD Defined Subpopulations
46 |2017 Santa Clara County Homeless Census & Survey
DEMOGRAPHICS OF HOMELESS FAMILIES WITH CHILDREN
A small number of individuals in homeless families with children participated in the Santa
Clara County Survey, a total of 19 respondents.14 Seventy-four percent (74%) of survey
respondents in families identified as female, a higher percentage than survey respondents not
in families (33%).
DOMESTIC VIOLENCE AMONG FAMILIES EXPERIENCING HOMELESSNESS
Thirty-three percent (33%) of individuals in families with children reported experiencing
domestic violence in the past, and 6% reported they were currently experiencing domestic
violence at the time of the survey.
Caution should be used when interpreting these data due to small number of surveys conducted with homeless
individuals in families with children

HUD Defined Subpopulations
2017 Santa Clara County Homeless Census & Survey | 47
PRIMARY CAUSE OF HOMELESSNESS AMONG HOMELESS FAMILIES WITH CHILDREN
Sixteen percent (16%) of survey respondents in families with children reported family or
domestic violence as the primary cause of their homelessness, higher than non-family
homeless respondents. Divorce, breakup and separation was also a much more common
response among homeless families with children than non-families experiencing
homelessness (26% compared to 13%).
FIGURE 45. PRIMARY CAUSE OF HOMELESSNESS, FAMILIES WITH CHILDREN AND NON-FAMILIES
WITH CHILDREN COMPARISON
Family Survey Population n= 19 respondents offering 37 responses; Non-Family Survey Population n= 561
respondents offering 756 responses
Source: Applied Survey Research. (2017). Santa Clara County Homeless Census and Survey.
Note: Multiple response question. Percentages may not add up to 100.
HEALTH CONDITIONS AMONG HOMELESS FAMILIES WITH CHILDREN
Among homeless families with children, a psychiatric or emotional condition was the most
frequent health condition cited (53%). Alcohol or drug abuse was less common among
homeless families than among all other survey respondents (37% and 49%, respectively).
FIGURE 46. HEALTH CONDITIONS, FAMILIES WITH CHILDREN AND NON-FAMILIES WITH CHILDREN
COMPARISON
Family Survey Population n= 18-19; Non-Family Population n= 529-551
Source: Applied Survey Research. (2017). Santa Clara County Homeless Census and Survey.
Note: Multiple response question. Percentages may not add up to 100.
16% 16%26% 26%
16%20% 16% 13%
37%
3%
0%
100%
Alcohol or Drug Use Eviction Divorce/ Separation/
Breakup
Lost Job Family/ Domestic
Violence
Families with Children Survey Population Non-Families with Children Survey Population
37%
53%
33%
16% 21%11% 5%
49%37%
31%22% 27%
9%2%
0%
100%
Drug or
Alcohol Abuse
Psychiatric or
Emotional
Conditions
Physical
Disability
Post-Traumatic
Stress Disorder
(PTSD)
Chronic Health
Problems
Traumatic Brain
Injury
AIDS/HIV
Related
Families with Children Survey Population Non-Families with Children Survey Population

HUD Defined Subpopulations
48 |2017 Santa Clara County Homeless Census & Survey
RECURRENCE AND LENGTH OF HOMELESSNESS AMONG FAMILIES WITH CHILDREN
Forty-seven percent (47%) of individuals in families with children reported experiencing
homelessness for the first time, compared to 40% of non-family survey respondents. Seventy-
seven percent of families had been experiencing homelessness for more than 6 months and
42% reported they were living in a home owned or rented by themselves or a partner prior to
becoming homeless. Twenty-six percent had been staying with friends or family before
experiencing homelessness, while 15% were staying in a hotel or motel.
GOVERNMENT ASSISTANCE FOR HOMELESS FAMILIES WITH CHILDREN
More than 94% of respondents reported receiving some form of government assistance.
Approximately three-quarters reported that they were receiving CalFresh (food stamps)
(72%) and receiving Medi-Cal/MediCare (72%).

HUD Defined Subpopulations
2017 Santa Clara County Homeless Census & Survey | 49
UNACCOMPANIED HOMELESS CHILDREN AND TRANSITION-AGE YOUTH
Due to the often hidden nature of youth homelessness, there are limited data available on
unaccompanied children and transition-age youth experiencing homelessness. Although
largely considered an undercount, current federal estimates suggest there are 35,686
unaccompanied children and transition-age youth on the streets and in public shelters across
the country.15 Young people experiencing homelessness have a harder time accessing services,
including shelter, medical care, and employment due to the stigma of their housing situation,
lack of knowledge of available resources, and a dearth of services targeted to young people.16
In 2012, the U.S. Interagency Council on Homelessness amended the federal strategic plan to
end homelessness to include specific strategies and supports to address the needs of
unaccompanied homeless children and transition-age youth. As part of this effort, the U.S.
Department of Housing and Urban Development placed increased focus on gathering data on
unaccompanied homeless children and youth during the Point-in-Time Census.
Santa Clara County implemented a dedicated youth census and survey in 2013 to improve
data on unaccompanied children and youth in the county. These efforts were replicated in
2015. In 2017, efforts at enumerating unaccompanied youth and transition-age youth were
expanded. This led to an increase in the number of enumeration teams, better training and
preparation for those teams, increased participation from program staff, and expanded
coverage of the areas youth frequent in Santa Clara County.
The following section provides an overview of the findings on unaccompanied children and
youth identified in the Santa Clara County’s general point-in-time census, as well as in the
specific youth census.
UNACCOMPANIED CHILDREN AND TRANSITION-AGE YOUTH
Homelessness among children and transition-age youth is a difficult problem to identify.
Unaccompanied children and transition-age youth are less likely to be found among the adult
population experiencing homelessness, preferring locations and times of day that make
traditional efforts at enumeration difficult. Accordingly, a separate youth count effort was put
in place, relying on knowledge gathered from youth currently experiencing homelessness as
well as their participation in the count itself.
In 2017, the youth census effort, combined with the general count, identified 2,530
unaccompanied children and transition-age youth experiencing homelessness. This
represents an increase of slightly more than 175% since 2015, and is nearly twice the amount
of the next largest total identified (1,063 in 2013). Some caution must be used when
interpreting this increase. While youth homelessness is on the rise nationally, the improved
youth census effort represents a significant percentage of the overall increase in homelessness
in Santa Clara County.
15 Department of Housing and Urban Development. (2016). Annual Assessment Report to Congress. Retrieved 2017 from
https://www.hudexchange.info/resources/documents/2016-AHAR-Part-1.pdf
16 National Coalition for the Homeless. (2011). Homeless Youth Fact Sheet. Retrieved 2011 from
http://www.nationalhomeless.org.
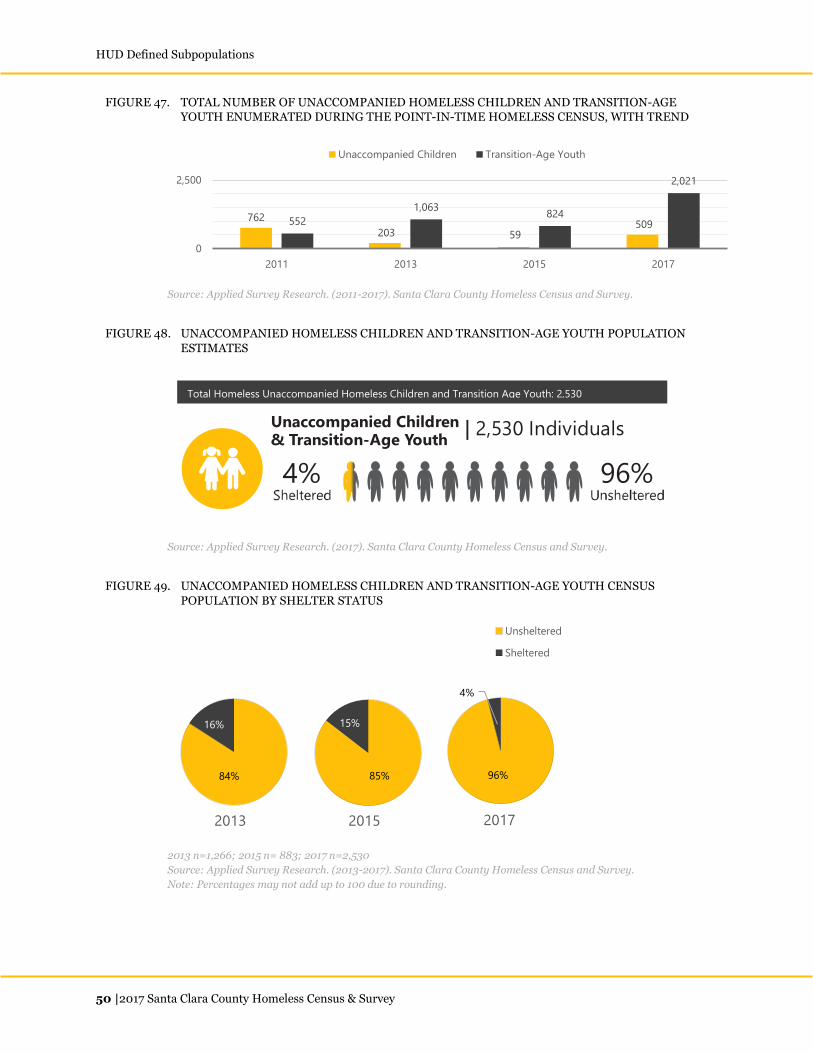
HUD Defined Subpopulations
50 |2017 Santa Clara County Homeless Census & Survey
FIGURE 47. TOTAL NUMBER OF UNACCOMPANIED HOMELESS CHILDREN AND TRANSITION-AGE YOUTH ENUMERATED DURING THE POINT-IN-TIME HOMELESS CENSUS, WITH TREND
Source: Applied Survey Research. (2011-2017). Santa Clara County Homeless Census and Survey.
FIGURE 48. UNACCOMPANIED HOMELESS CHILDREN AND TRANSITION-AGE YOUTH POPULATION
ESTIMATES
Source: Applied Survey Research. (2017). Santa Clara County Homeless Census and Survey.
FIGURE 49. UNACCOMPANIED HOMELESS CHILDREN AND TRANSITION-AGE YOUTH CENSUS
POPULATION BY SHELTER STATUS
2013 n=1,266; 2015 n= 883; 2017 n=2,530
Source: Applied Survey Research. (2013-2017). Santa Clara County Homeless Census and Survey.
Note: Percentages may not add up to 100 due to rounding.
762
203 59 509 552
1,063824
2,021
0
2,500
2011 2013 2015 2017
Unaccompanied Children Transition-Age Youth
84%
16%
2013
85%
15%
2015
96%
4%
2017
Unsheltered
Sheltered
Veterans | 660 Individuals
32% 68%
Families | 294 Families with 1,075 members
72% 28%
Unaccompanied Children& Transition-Age Youth
4% 96%
Chronically Homeless | 2,097 Individuals
14% 86%
| 2,530 Individuals
Total Homeless Unaccompanied Homeless Children and Transition Age Youth: 2,530
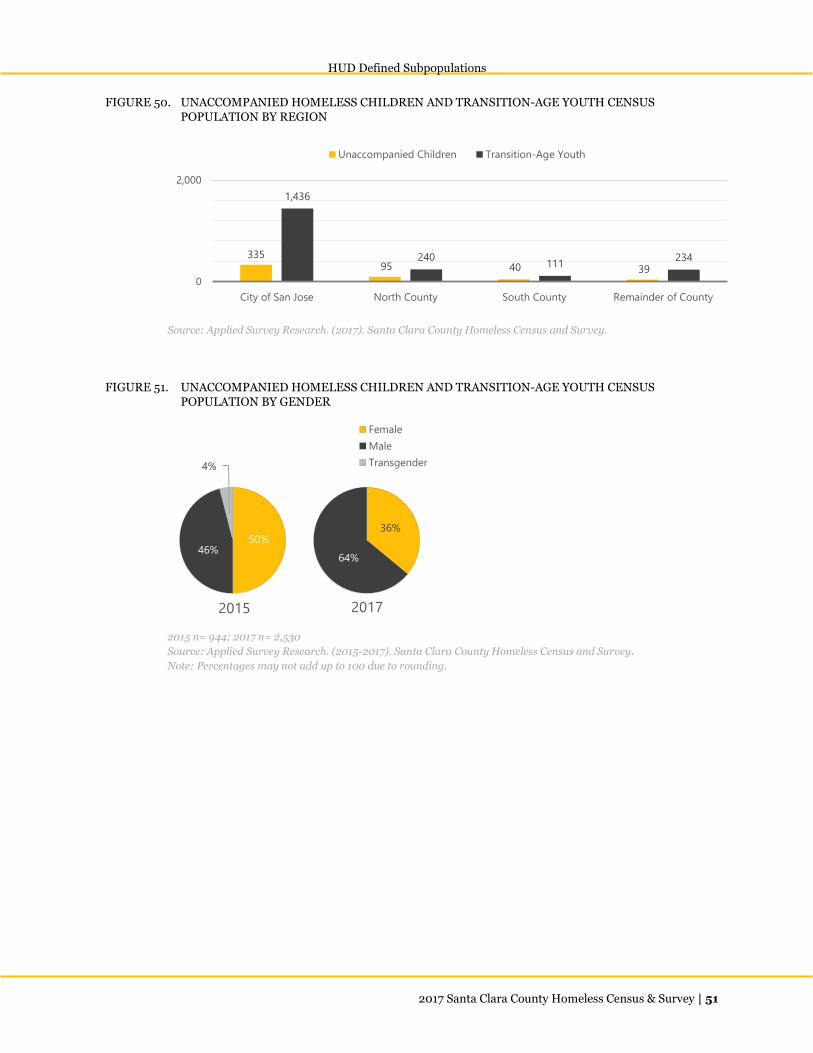
HUD Defined Subpopulations
2017 Santa Clara County Homeless Census & Survey | 51
FIGURE 50. UNACCOMPANIED HOMELESS CHILDREN AND TRANSITION-AGE YOUTH CENSUS POPULATION BY REGION
Source: Applied Survey Research. (2017). Santa Clara County Homeless Census and Survey.
FIGURE 51. UNACCOMPANIED HOMELESS CHILDREN AND TRANSITION-AGE YOUTH CENSUS POPULATION BY GENDER
2015 n= 944; 2017 n= 2,530
Source: Applied Survey Research. (2015-2017). Santa Clara County Homeless Census and Survey.
Note: Percentages may not add up to 100 due to rounding.
33595 40 39
1,436
240111
234
0
2,000
City of San Jose North County South County Remainder of County
Unaccompanied Children Transition-Age Youth
50%46%
4%
2015
36%
64%
2017
Female
Male
Transgender

HUD Defined Subpopulations
52 |2017 Santa Clara County Homeless Census & Survey
DEMOGRAPHICS OF UNACCOMPANIED HOMELESS CHILDREN AND TRANSITION-AGE YOUTH
Nearly two-thirds (62%) of youth survey respondents under the age of 25 identified as male,
similar to the general population (64%). Five percent (5%) indicated that they do not identify
as male, female, or transgender.
Forty-one percent (41%) of youth respondents identified as Hispanic or Latino, similar to
42% of respondents 25 years and over. The highest reported race among youth respondents
was White (37%), although this was a significantly lower percentage compared to the adult
survey population (47%).
FIGURE 52. RACE AMONG UNACCOMPANIED HOMELESS CHILDREN AND TRANSITION-AGE YOUTH
Unaccompanied Children and Transition-Age Youth n= 2,530
Source: Applied Survey Research. (2017). Santa Clara County Homeless Census and Survey.
Note: Percentages may not add up to 100 due to rounding.
37%
14%4%
17%
4%
24%
White
Black or African American
Asian
American Indian or Alaska
Native
Native Hawaiian or Pacific
Islander
Multiple Races

HUD Defined Subpopulations
2017 Santa Clara County Homeless Census & Survey | 53
PRIMARY CAUSE OF HOMELESSNESS AMONG UNACCOMPANIED HOMELESS CHILDREN AND TRANSITION-
AGE YOUTH
Homeless youth survey respondents reported some differences in cause of homelessness
compared to respondents age 25 years and over. Unaccompanied homeless children and
transition-age youth were more likely to cite family violence, an argument with a family
member, and aging out of foster care as the primary cause of their homelessness.
FIGURE 53. PRIMARY CAUSE OF HOMELESSNESS, UNACCOMPANIED CHILDREN AND TRANSITION-AGE
YOUTH AND ADULTS OVER AGE 24 COMPARISON
Unaccompanied Children and Transition-Age Youth Survey Population n: 40 respondents offering 48 responses;
Adults Over Age 24 Survey Population n:540 respondents offering 745 responses
Source: Applied Survey Research. (2017). Santa Clara County Homeless Census and Survey.
Note: Multiple response question. Percentages may not add up to 100.
HEALTH CONDITIONS AMONG UNACCOMPANIED HOMELESS CHILDREN AND TRANSITION-AGE YOUTH
Though better than the general homeless population, health is still an issue for homeless
youth. Homeless youth still struggled with psychiatric or emotional conditions (22%) as well
as experiencing PTSD (20%).
FIGURE 54. HEALTH CONDITIONS, UNACCOMPANIED CHILDREN AND TRANSITION-AGE YOUTH AND
ADULTS OVER AGE 24 COMPARISON
Unaccompanied Children and Transition-Age Youth Survey Population n: 40-42; Adults Over Age 24 Survey
Population n: 508-529
Source: Applied Survey Research. (2017). Santa Clara County Homeless Census and Survey.
Note: Multiple response question. Percentages may not add up to 100.
13% 13% 13% 15% 18%21%
1%
38%
3%13%
0%
100%
Alcohol or Drug Use Aging Out of Foster
Care
Lost Job Family violence Argument with
Family Member
Unaccompanied Children and Transition-Age Youth Survey Population
Adults Over Age 24 Survey Population
7%
22%10%
20%7% 5% 0%
52%39%
32%22%
28%
10%2%
0%
100%
Drug or
Alcohol Abuse
Psychiatric or
Emotional
Conditions
Physical
Disability
Post-Traumatic
Stress Disorder
(PTSD)
Chronic Health
Problems
Traumatic Brain
Injury
AIDS/HIV
Related
Unaccompanied Children and Transition-Age Youth Survey Population
Adults Over Age 24 Survey Population

HUD Defined Subpopulations
54 |2017 Santa Clara County Homeless Census & Survey
SERVICES AND SOCIAL SUPPORT NETWORKS AMONG UNACCOMPANIED CHILDREN AND TRANSITION-AGE
YOUTH
Forty-nine percent (49%) of youth survey respondents reported not currently receiving any
government assistance, compared to 23% of adult homeless survey respondents. Similarly,
youth respondents indicated they were less likely than adult respondents to access any type of
services or assistance; seventy-seven percent (77%) of youth respondents reported receiving
services compared to eighty-seven percent (87%) of adult respondents.
FOSTER CARE AMONG UNACCOMPANIED HOMELESS CHILDREN AND TRANSITION-AGE YOUTH
Nearly half (45%) of youth respondents reported they had been in the foster care system, and
13% of all youth respondents cited aging out of foster care as the primary cause of their
homelessness.
FIGURE 55. HISTORY OF FOSTER CARE, UNACCOMPANIED CHILDREN AND TRANSITION-AGE YOUTH
Unaccompanied Children and Transition-Age Youth Survey Population n=42
Source: Applied Survey Research. (2017). Santa Clara County Homeless Census and Survey.
45% 55%

Conclusion
2017 Santa Clara County Homeless Census & Survey | 55
Conclusion Between 2015 and 2017, Santa Clara County and its provider partners have made significant
investments and reforms to meet the needs of people experiencing homelessness, moving
more people off of the streets and into housing. However, point-in-time data indicate an
increased number of individuals experiencing homelessness when compared to 2015. There
can be many reasons for the increase, including macroeconomic concerns and difficulties
finding locations to live. Additionally, it is worthwhile to compare the increase in Santa Clara
County’s population to nearby counties, as well as to similarly sized counties across the
country.
One large component of the increase stemmed from the numbers of unaccompanied children
and transition-age youth experiencing homelessness enumerated in this year’s count.
Homelessness among youth is a different phenomenon than homelessness among adults, and
the ability of communities to understand the actual scope of the issue has lagged behind
traditional methods of measuring homelessness. As that understanding has improved, so too
have methods of enumeration, leading to youth being enumerated when they would have
been missed in past years. Recognizing the increased prevalence of youth homelessness
nationwide, HUD has declared that 2017 will be the baseline number of youth homelessness
for comparison in future years, and hopes to drive more funding and support towards ending
youth homelessness.
There have been a number of accomplishments and improvements from 2015. Veterans
experiencing homelessness and chronically homeless individuals have benefited from
increased outreach and program efforts and have seen their numbers decrease. The data from
the 2017 Santa Clara County Homeless Census and Survey can help educate the public,
service providers, and policymakers on how to best serve the homeless population and help
ensure that homelessness is a rare, brief, and one-time event. Numerous studies show that
prevention, Housing First initiatives, and supportive services are the first steps in ending
homelessness, and Santa Clara County is working diligently to develop these systems of
change while addressing the interim needs of people currently unhoused.

Appendix 1: Methodology
56 |2017 Santa Clara County Homeless Census & Survey
Appendix 1: Methodology OVERVIEW
The purpose of the 2017 Santa Clara County Homeless Census and Survey is to produce a
point-in-time estimate of people who experience homelessness in Santa Clara County, a
region that covers approximately 1,304 square miles. The results of the street count were
combined with the results from the shelter count to produce the total estimated number of
persons experiencing homelessness in Santa Clara County on any given night. The subsequent
survey was used to gain a more comprehensive understanding of the experiences and
demographics of those enumerated on the night of the count. A more detailed description of
the methodology follows.
COMPONENTS OF THE HOMELESS CENSUS METHOD
The 2017 Santa Clara County Homeless Census and Survey methodology had three primary
components:
The general street count between the hours of 5:30am to noon on January 24th and
25th – an enumeration of unsheltered homeless individuals
The youth street count between the hours of 3 pm and 8 pm – a targeted enumeration
of unsheltered youth under the age of 25 on the 24th
The shelter count was conducted on the night of the 24th, the evening before the 24th
– an enumeration of sheltered homeless individuals staying in emergency shelter or
transitional housing programs
The unsheltered and sheltered homeless counts were coordinated to occur within the same
time period in order to minimize potential duplicate counting of homeless persons. The youth
count does not take place at the same time as the adult count, leading to the importance of de-
duplication efforts. Whenever youth teams and general teams presented data on youth in the
same census tracts, youth data was prioritized.
STREET COUNT METHODOLOGY
DEFINITION
For the purposes of this study, the HUD definition of unsheltered homelessness for Point-in-
Time Counts is used. This definition includes individuals and families with a primary
nighttime residence that is a public or private place not designed for or ordinarily used as a
regular sleeping accommodation for human beings, including a car, park, abandoned
building, bus or train station, airport, or camping ground. HUD’s definition of homelessness
does not include those living in “double-up” or “couch surfing” situations, those staying with
friends/family on a temporary basis, those who are happened to be staying a hotel or motel
for the night, those in jail, or those admitted into a hospital.

Appendix 1: Methodology
2017 Santa Clara County Homeless Census & Survey | 57
RESEARCH DESIGN
The methodology used for the 2017 Santa Clara County Homeless Census and Survey is
commonly described as a “blitz count and survey” since it is conducted by a large team over a
very short period of time. As this method is conducted in Santa Clara County, the result is an
observation based count of individuals and families who appear to be homeless. The count is
then followed by an in-person representative survey, the results of which are used to profile
and estimate the condition and characteristics of the local homeless population. Information
collected from the survey is used to fulfill HUD reporting requirements, and to inform local
service delivery and strategic planning efforts.
Continuing the same methodology from past efforts in Santa Clara County is an important
part of the count methodology, and allows for relevant comparisons across the many years of
the count. Accordingly, there were few changes to the methodology in 2017. Under
advisement of the Planning Committee, a start time 30 minutes earlier than in 2015 was
adopted. Five focus groups were held with individuals experiencing homelessness, so that
“hot spots” could be identified and noted on maps for teams on count day.
VOLUNTEER AND GUIDE RECRUITMENT
Many individuals who live and/or work in Santa Clara County turned out to support efforts to
enumerate the local population experiencing homelessness. More than 215 community
volunteers and city and county staff participated in the 2017 general street count. The
volunteer recruitment effort was led by the Planning Committee and was greatly aided by
numerous shelters and day programs from throughout the county. Extensive outreach efforts
were conducted, targeting local non-profits that serve the homeless and local volunteer
programs, as well as other individuals who may be interested in participating in the count.
The Planning Committee sent a press release informing the community about the count and
making an appeal for volunteer participation approximately two weeks before the count.
Volunteers registered to participate, and received additional details on the count via a
dedicated email account monitored and staffed by Applied Survey Research (ASR) support
staff.
To recruit guides, shelters and day programs from throughout the county were asked to
identify individuals experiencing homelessness with considerable knowledge of where to find
individuals experiencing homelessness on the street, how to find encampments, how to
identify if vehicles were being used as sleeping locations, and how to identify situations where
safety was a concern. Additionally, shelter and program staff were asked to recommend
guides who were reliable and interested in the process. All guides were paid for their time,
earning $15 per hour worked, including a mandatory one-hour training that was held in the
days before the count.
STREET COUNT TEAMS
Teams were typically comprised of at least two individuals, one volunteer from the
community and one guide who was generally an individual currently experiencing
homelessness. Each team was assigned 1-4 census tracts as their assignment, depending on
the size of the tracts. Teams were responsible for covering all areas that are accessible by the
public, including parks, streets, business fronts, and wherever the guide believed there may
be individuals experiencing homelessness. Teams were encouraged to have their community
volunteer drive their vehicle, while the guide acted as a navigator and enumerator during the
process. All teams were given a brief refresher training before heading out into the field.
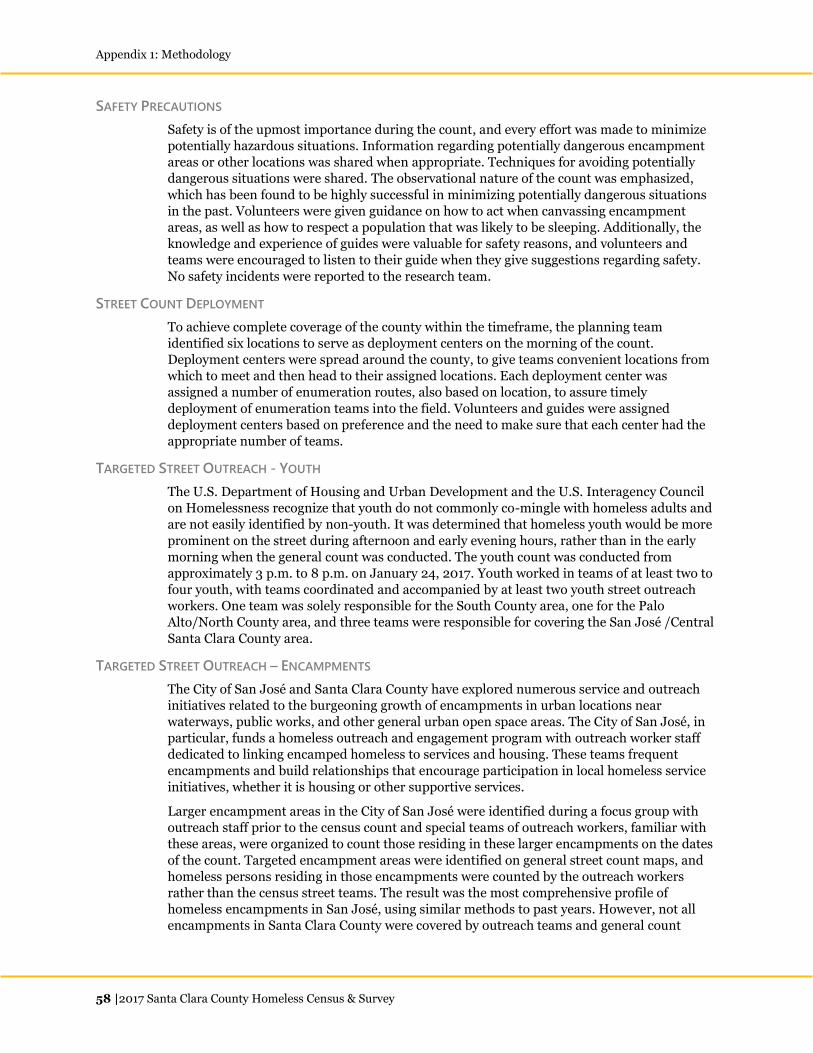
Appendix 1: Methodology
58 |2017 Santa Clara County Homeless Census & Survey
SAFETY PRECAUTIONS
Safety is of the upmost importance during the count, and every effort was made to minimize
potentially hazardous situations. Information regarding potentially dangerous encampment
areas or other locations was shared when appropriate. Techniques for avoiding potentially
dangerous situations were shared. The observational nature of the count was emphasized,
which has been found to be highly successful in minimizing potentially dangerous situations
in the past. Volunteers were given guidance on how to act when canvassing encampment
areas, as well as how to respect a population that was likely to be sleeping. Additionally, the
knowledge and experience of guides were valuable for safety reasons, and volunteers and
teams were encouraged to listen to their guide when they give suggestions regarding safety.
No safety incidents were reported to the research team.
STREET COUNT DEPLOYMENT
To achieve complete coverage of the county within the timeframe, the planning team
identified six locations to serve as deployment centers on the morning of the count.
Deployment centers were spread around the county, to give teams convenient locations from
which to meet and then head to their assigned locations. Each deployment center was
assigned a number of enumeration routes, also based on location, to assure timely
deployment of enumeration teams into the field. Volunteers and guides were assigned
deployment centers based on preference and the need to make sure that each center had the
appropriate number of teams.
TARGETED STREET OUTREACH - YOUTH
The U.S. Department of Housing and Urban Development and the U.S. Interagency Council
on Homelessness recognize that youth do not commonly co-mingle with homeless adults and
are not easily identified by non-youth. It was determined that homeless youth would be more
prominent on the street during afternoon and early evening hours, rather than in the early
morning when the general count was conducted. The youth count was conducted from
approximately 3 p.m. to 8 p.m. on January 24, 2017. Youth worked in teams of at least two to
four youth, with teams coordinated and accompanied by at least two youth street outreach
workers. One team was solely responsible for the South County area, one for the Palo
Alto/North County area, and three teams were responsible for covering the San José /Central
Santa Clara County area.
TARGETED STREET OUTREACH – ENCAMPMENTS
The City of San José and Santa Clara County have explored numerous service and outreach
initiatives related to the burgeoning growth of encampments in urban locations near
waterways, public works, and other general urban open space areas. The City of San José, in
particular, funds a homeless outreach and engagement program with outreach worker staff
dedicated to linking encamped homeless to services and housing. These teams frequent
encampments and build relationships that encourage participation in local homeless service
initiatives, whether it is housing or other supportive services.
Larger encampment areas in the City of San José were identified during a focus group with
outreach staff prior to the census count and special teams of outreach workers, familiar with
these areas, were organized to count those residing in these larger encampments on the dates
of the count. Targeted encampment areas were identified on general street count maps, and
homeless persons residing in those encampments were counted by the outreach workers
rather than the census street teams. The result was the most comprehensive profile of
homeless encampments in San José, using similar methods to past years. However, not all
encampments in Santa Clara County were covered by outreach teams and general count
Appendix 1: Methodology
2017 Santa Clara County Homeless Census & Survey | 59
teams, when outside the areas covered by outreach teams, would enumerate when
appropriate.
TARGETED STREET OUTREACH - VEHICLES
Identifying individuals residing in vehicles is difficult during the morning hours of the census
count. By the time the sun rises, those residing in vehicles have often moved on to more
remote locations or have found places where they blend in. North Santa Clara County
recognized the need for targeted outreach and provided a dedicated outreach worker to
enumerate vehicles prior to sunrise.
CENSUS UNDERCOUNT
For a variety of reasons, individuals experiencing homelessness generally do not want to be
located, and make concerted efforts to avoid detection. Regardless of how successful outreach
efforts are, an undercount of those experiencing homelessness will persist at varying levels,
especially of hard-to-reach subpopulations such as unsheltered families, undocumented
individuals, and unaccompanied children and youth.
The methods employed in a non-intrusive visual homeless enumeration, while academically
sound, have inherent biases and shortcomings. Even with the assistance of dedicated
homeless service providers and individuals with lived experience, the methodology cannot
guarantee 100% accuracy. Many factors may contribute to missed opportunities, including:
It is difficult to identify persons who may be sleeping in vans, cars, recreational
vehicles, abandoned buildings, or structures unfit for human habitation.
Individuals residing in isolated rural areas that are difficult to access or otherwise
identify for the purposes of the count.
Individuals whose physical appearance differs from traditional visual cues associated
with people experiencing homelessness can be mistaken for housed individuals. This
is especially true of unaccompanied children and youth, who often “hide in plain
sight” and present similarly to their housed peers.
Families with children experiencing homelessness often seek opportunities to stay on
private property, rather than sleep on the streets, in vehicles, or makeshift shelters.
By counting the minimum number of individuals experiencing homelessness during a given
point-in-time, the count methodology is conservative and therefore most likely results in an
undercount of certain unsheltered individuals. A margin of error on the final count is not
available, though the data presented is to be considered a minimum estimate. However, this
conservative approach is necessary to preserve the integrity of the data collected. Even though
the census is most likely an undercount of the population experiencing homelessness, the
methodology employed is the most comprehensive approach available and provides
invaluable data for local and federal service agencies.
SHELTER COUNT METHODOLOGY
GOAL
The goal of the shelter count was to gain an accurate count of the number of homeless
persons who were being temporarily housed in shelters across Santa Clara County.
DATA COLLECTION
To collect data on individuals staying in shelters on the night of January 24th, ASR worked
with BitFocus, the HMIS system administrators for Santa Clara County. BitFocus collected
data on all emergency shelters, transitional housing programs, and Safe Havens operating in
Appendix 1: Methodology
60 |2017 Santa Clara County Homeless Census & Survey
the county. Data was collected on household status, age, gender, race and ethnicity, veteran
status, chronic status, and if individuals had certain health conditions. There were a small,
limited number of shelters that do not participate in the HMIS system. To gather their data,
ASR collected the same data using a web-based system of reporting.
EFFORTS TO INCLUDE SCHOOL DISTRICT DATA
Significant efforts were made to include data from all school districts within Santa Clara
County. ASR and partners from the county met with district representatives to prepare them
for the count and train them in data collection procedures. District representatives were
trained to call all families that met the HUD definition of homelessness and ask where they
had been staying on the night of the count. That information was then included in the
appropriate census tract. Twelve out of thirty-two school districts were included, a large
increase from past years. Other districts were not able to participate due to a heavy workload.
SURVEY METHODOLOGY
PLANNING AND IMPLEMENTATION
The survey of 587 homeless persons was conducted in order to yield qualitative data about the
homeless community in Santa Clara County. These data are used for the McKinney-Vento
Continuum of Care Homeless Assistance funding application, and are important for future
program development and planning. The survey elicited information such as gender, family
status, military service, length and recurrence of homelessness, usual nighttime
accommodations, causes of homelessness, and access to services through open-ended, closed-
ended, and multiple response questions. The survey data bring greater perspective to current
issues of homelessness and to the provision and delivery of services.
Surveys were conducted by homeless workers and shelter staff who were trained by Applied
Survey Research. Training sessions led potential interviewers through a comprehensive
orientation that included project background information and detailed instruction on
respondent eligibility, interviewing protocol, and confidentiality. Homeless survey workers
were compensated at a rate of $7 per completed survey.
It was determined that survey data would be more easily collected if an incentive gift was
offered to respondents in appreciation for their time and participation. Socks were given as an
incentive for participating in the 2017 Homeless Survey. The socks were easy to obtain and
distribute, were thought to have wide appeal, and could be provided within the project
budget. This approach enabled surveys to be conducted at any time during the day. The gift
proved to be successful, and was widely accepted among survey respondents.
SURVEY SAMPLING
Based on a point-in-time estimate of 7,394 homeless persons, with a randomized survey
sampling process, the 587 valid surveys represent a confidence interval of +/- 4% with a 95%
confidence level when generalizing the results of the survey to the estimated population of
homeless individuals in Santa Clara County.
The 2017 survey continued the practice from 2007, 2009, 2011, 2013 and 2015 of a survey
that was an integration of previous approaches and was administered in shelter/transitional
housing facilities and on the street. Individuals residing in emergency shelters were reached
through street surveys during the day when emergency shelters were closed.
Strategic attempts were made to reach individuals in various geographic locations and of
various subset groups such as homeless youth, minority ethnic groups, military veterans,
domestic violence victims, and families. One way to increase the participation of these groups
was to recruit peer survey workers. Like past surveys, the 2017 survey also prioritized a peer-

Appendix 1: Methodology
2017 Santa Clara County Homeless Census & Survey | 61
to-peer approach to data collection by increasing the number of currently homeless
surveyors.
In order to increase randomization of sample respondents, survey workers were trained to
employ an “every third encounter” survey approach. Survey workers were instructed to
approach every third person they encountered whom they considered to be an eligible survey
respondent. If the person declined to take the survey, the survey worker could approach the
next eligible person they encountered. After completing a survey, the randomized approach
was resumed. It is important to recognize that while efforts are made to randomize the
respondents, it is not a random sample methodology.
DATA COLLECTION
Care was taken by interviewers to ensure that respondents felt comfortable regardless of the
street or shelter location where the survey occurred. During the interviews, respondents were
encouraged to be candid in their responses and were informed that these responses would be
framed as general findings, would be kept confidential, and would not be traceable to any one
individual.
DATA ANALYSIS
To avoid potential duplication of respondents, the survey requested respondents’ initials and
date of birth, so that duplication could be avoided without compromising the respondents’
anonymity. Upon completion of the survey effort, an extensive verification process was
conducted to eliminate duplicates. This process examined respondents’ date of birth, initials,
gender, ethnicity, and length of homelessness, and consistencies in patterns of responses to
other questions on the survey.
SURVEY ADMINISTRATION DETAILS
• The 2017 Santa Clara County Homeless Survey was administered by the trained survey team
in the weeks following the count.
• In all, the survey team collected 587 unique surveys
SURVEY CHALLENGES AND LIMITATIONS
The 2017 Santa Clara County Homeless Survey did not include an equal representation of all
homeless experiences. For example, a lesser number of surveys were conducted among
transitional housing residents than in previous years. There may be some variance in the data
that the homeless individuals self-reported. However, using a peer interviewing methodology
is believed to allow the respondents to be more candid with their answers and may help
reduce the uneasiness of revealing personal information. Further, service providers and city
and county staff members recommended individuals who would be the best to conduct
interviews and they received comprehensive training about how to conduct interviews.
Surveys that were considered incomplete or containing false responses were not accepted.
There were a few challenges in collecting surveys and survey data throughout Santa Clara
County. First and foremost was the weather and its impact. The series of storms that
impacted Santa Clara County and the Bay Area during the survey period caused a variety of
difficulties related to data collection. Surveyors repeatedly mentioned difficulties finding
enough respondents because many were not in their normal sleeping locations due to weather
related movement. Staff members at participating shelters and programs frequently
mentioned the added difficulties that the inclement weather contributed, specifically dealing
with the large influx of families experiencing homelessness after flooding drove dozens of
families to seek shelter, necessitating the creation of a temporary shelter for families that had
to be staffed by shelter staff.

62 |2017 Santa Clara County Homeless Census & Survey
Appendix 2: Definitions &
Abbreviations

2017 Santa Clara County Homeless Census & Survey | 63

Appendix 3: Survey Questions
64 |2017 Santa Clara County Homeless Census & Survey
Appendix 3: Survey Questions

2017 Santa Clara County Homeless Census & Survey | 65
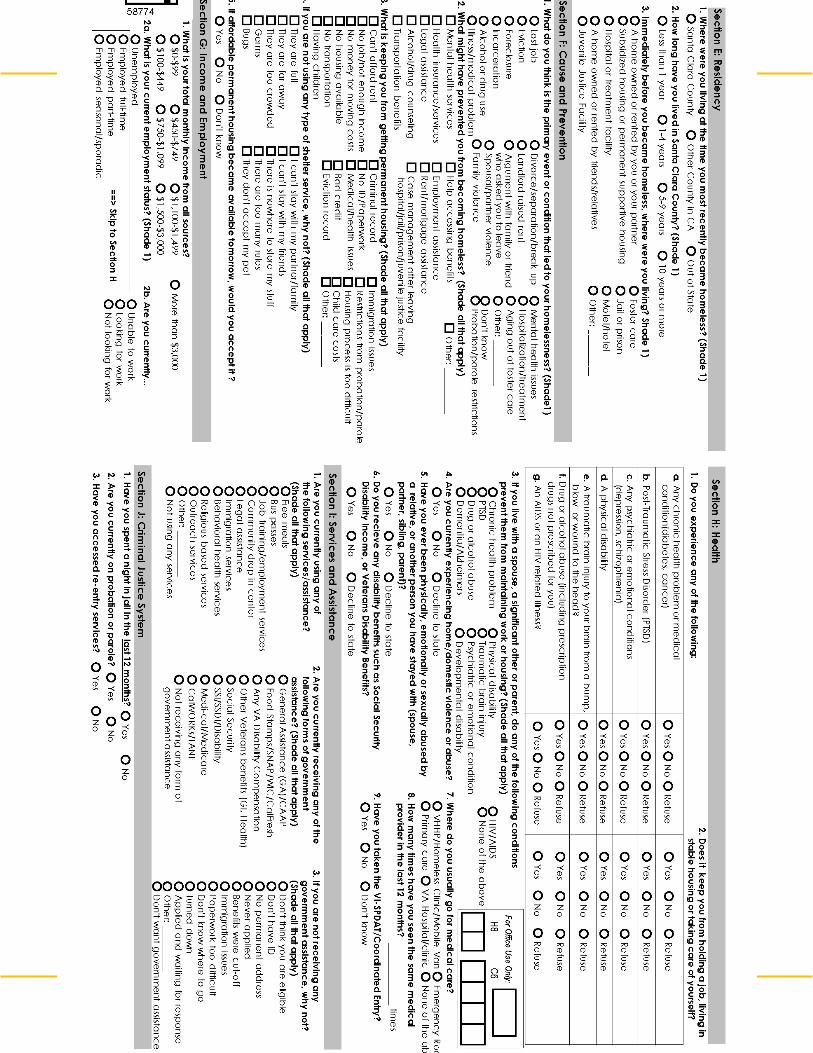
66 |2017 Santa Clara County Homeless Census & Survey

SANTA CLARA COUNTYHOMELESS CENSUS & SURVEYcomprehensive report2017