survey of whole house programs in midwestern...
TRANSCRIPT

Survey of Whole House Programs in Midwestern Climates U. McGeough, W. Baker, J. Peters, and A. Beitel Partnership for Advanced Residential Retrofit
November 2012

NOTICE
This report was prepared as an account of work sponsored by an agency of the United States government. Neither the United States government nor any agency thereof, nor any of their employees, subcontractors, or affiliated partners makes any warranty, express or implied, or assumes any legal liability or responsibility for the accuracy, completeness, or usefulness of any information, apparatus, product, or process disclosed, or represents that its use would not infringe privately owned rights. Reference herein to any specific commercial product, process, or service by trade name, trademark, manufacturer, or otherwise does not necessarily constitute or imply its endorsement, recommendation, or favoring by the United States government or any agency thereof. The views and opinions of authors expressed herein do not necessarily state or reflect those of the United States government or any agency thereof.
Available electronically at http://www.osti.gov/bridge
Available for a processing fee to U.S. Department of Energy and its contractors, in paper, from:
U.S. Department of Energy Office of Scientific and Technical Information
P.O. Box 62 Oak Ridge, TN 37831-0062
phone: 865.576.8401 fax: 865.576.5728
email: mailto:[email protected]
Available for sale to the public, in paper, from:
U.S. Department of Commerce National Technical Information Service
5285 Port Royal Road Springfield, VA 22161 phone: 800.553.6847
fax: 703.605.6900 email: [email protected]
online ordering: http://www.ntis.gov/ordering.htm
Printed on paper containing at least 50% wastepaper, including 20% postconsumer waste

iii
Survey of Whole House Programs in Midwestern Climates
Prepared for:
The National Renewable Energy Laboratory
On behalf of the U.S. Department of Energy’s Building America Program
Office of Energy Efficiency and Renewable Energy
15013 Denver West Parkway
Golden, CO 80401
NREL Contract No. DE-AC36-08GO28308
Prepared by:
U. McGeough, W. Baker, J. Peters, and A. Beitel
Partnership for Advanced Residential Retrofit
Des Plaines, IL 60018
NREL Technical Monitor: Stacey Rothgeb
Prepared under Subcontract No. KNDJ-0-40346-00
November 2012

iv
Acknowledgments The research team is grateful for the assistance of the following individuals and organizations in conducting this research and developing this report:
Andrew Isaacs, Kentucky Home Performance
Bill Von der Linde, A-Tec, Black Hills Energy, Black Hills’ Home Performance with ENERGY STAR
Carter Dedolph, WECC Wisconsin- Focus on Energy Home Performance with ENERGY STAR
Chris Duffrin, Neighborhood Energy Connection, Xcel Energy’s Home Performance with ENERGY STAR
Dave Canny and Jeff Gleeson, Pacific Gas and Electric
Glenda Abney, Missouri Botanical Garden’s Earthways Center, St. Louis Regional Home Performance with ENERGY STAR
James Miller, AEP Ohio In-Home Energy Programs
Jensen Adams, Kansas City Area Home Performance with ENERGY STAR
Jim Jerozal, Nicor’s Gas Energy Efficiency Program
Joe Marco, GoodCents, Dominion East Ohio’s Home Performance with ENERGY STAR
Marjorie Isaacson, Center for Neighborhood Technology
Nick Lovier, Ameren Illinois’ Act on Energy
Paul Racher and Jack Laverty, Columbia Gas of Ohio’s Home Performance Solutions
Peter Ludwig, Center for Neighborhood Technology
Rudy Chahine, Consumers Energy Home Performance with ENERGY STAR

v
Contents List of Figures ........................................................................................................................................... vii
List of Tables ............................................................................................................................................. vii
Definitions ................................................................................................................................................. viii
Executive Summary ................................................................................................................................... ix
1 Introduction and Background ............................................................................................................. 1
1.1 Motivation for Research ......................................................................................................1 1.2 Scope of Programs Researched ............................................................................................1
2 Experimental Methods ......................................................................................................................... 2
2.1 Web Research ......................................................................................................................2 2.2 Survey Monkey ....................................................................................................................3 2.3 Evaluation, Measurement, and Verification Reports ...........................................................3 2.4 Preliminary Regulatory Research ........................................................................................4 2.5 “Deep Dive” Interviews .......................................................................................................4 2.6 Literature Review.................................................................................................................4
2.6.1 Summary of Key Literature Findings ......................................................................4 2.6.2 Comparing National Reports to Current Research ..................................................6
3 Results ................................................................................................................................................... 8
3.1 Qualitative Program Descriptions ........................................................................................8 3.1.1 Energy Upgrade California ......................................................................................9 3.1.2 Ameren’s Act on Energy Home Energy Performance (Illinois) ..............................9 3.1.3 Nicor Gas Energy Efficiency Program (Illinois) .....................................................9 3.1.4 Chicagoland Natural Gas Savings Program (Illinois) ............................................10 3.1.5 Black Hills Energy Home Performance with ENERGY STAR (Iowa) ................10 3.1.6 Kentucky Home Performance ................................................................................11 3.1.7 Greater Cincinnati Energy Alliance (Ohio and Kentucky) ....................................11 3.1.8 Consumers Energy Home Performance with ENERGY STAR (Michigan) .........11 3.1.9 Kansas City Area Home Performance with ENERGY STAR (Missouri) .............12 3.1.10 St. Louis Regional Home Performance with ENERGY STAR
(Missouri/Illinois) ..................................................................................................12 3.1.11 Xcel Energy’s Home Performance with ENERGY STAR (Minnesota) ...............12 3.1.12 Columbia Gas of Ohio’s Home Performance Solutions ........................................13 3.1.13 Dominion East Ohio’s Home Performance with ENERGY STAR .......................13 3.1.14 AEP Ohio In-Home Energy Program ....................................................................13 3.1.15 Focus on Energy Home Performance with ENERGY STAR (Wisconsin) ...........14
3.2 Quantitative Program Data ................................................................................................14 3.2.1 Longevity ...............................................................................................................14 3.2.2 Program Budgets ....................................................................................................15

vi
3.2.3 Program Participation and Conversion Rates ........................................................16 3.2.4 Program-Level Energy Savings .............................................................................17
3.3 General Trends from Research ..........................................................................................19 4 Discussion and Recommendations .................................................................................................. 20
4.1 General Observations about Whole-Home Programs ........................................................20 4.2 Specific Observations and Recommendations ...................................................................20
4.2.1 Sponsoring Organization .......................................................................................20 4.2.2 Customer Targeting and Marketing .......................................................................21 4.2.3 Measure Packages and Incentive Structure ............................................................23 4.2.4 Audit Approach and Safety Testing .......................................................................28 4.2.5 Program Diagnostics To Identify Energy Savings Opportunities..........................29 4.2.6 Contractor Role ......................................................................................................30 4.2.7 Program Budget, Energy Savings, Participation, and Conversion ........................32 4.2.8 Customer Satisfaction ............................................................................................35 4.2.9 Program Evaluation ...............................................................................................35 4.2.10 Common Metrics ...................................................................................................35
5 Conclusions ........................................................................................................................................ 37
5.1 Program Design Lessons Learned .....................................................................................37 5.2 Areas for Further Study .....................................................................................................39
References ................................................................................................................................................. 41
Bibliography .............................................................................................................................................. 42
Appendix A. Web Research Questions ................................................................................................... 43
Appendix B. Survey Monkey Questions ................................................................................................. 44
Appendix C. Deep Dive Questions .......................................................................................................... 45
Appendix D. Summary and Compilation of Deep Dive Interview Questions and Answers .............. 48
Appendix E. Summary of Evaluation, Measurement, and Verification Reports ................................. 59

vii
List of Figures Figure 1. Year of inception for whole-home programs ......................................................................... 15
This figure was created by PARR.
List of Tables Table 1. Current Program Budgets, $ (approximate, 2010–2011) ........................................................ 16
Table 2. Current Program Participation (Retrofits) and Conversion Rates (%) (2010–2011) ............ 17
Table 3. Program-Level Energy Savings (2010–2011) ........................................................................... 18
Table 4. Summary of Program Incentives .............................................................................................. 24
Table 5. Contractor Training, Certification, and Other Requirements ................................................. 31
Table 6. Program Budgets and Participation ......................................................................................... 33
Table 7. Program Budgets and Energy Savings .................................................................................... 34
Unless otherwise noted, all tables were created by PARR.

viii
Definitions AFUE Annual fuel utilization rate
ARRA American Recovery and Reinvestment Act
BPI Building Performance Institute
BHE Black Hills Energy
CAZ Combustion appliance zone
CFL Compact fluorescent light
cfm Cubic feet per minute
CHA Comprehensive home assessment
ComEd Commonwealth Edison Company
ECM Electronically commutated motor
EF Energy factor
EM&V Evaluation, measurement, and verification
HPwES Home Performance with Energy Star
HVAC Heating, ventilation, and air conditioning
IPL Interstate Power and Light
PARR Partnership for Advanced Residential Retrofit
PG&E Pacific Gas and Electric
PY
QA
Program Year
Quality assurance
QC Quality control
REM/Rate Licensed residential energy analysis software

ix
Executive Summary Researchers investigated existing single family whole-home energy efficiency programs in cold climates to better understand program design and the outcomes of energy savings and customer participation. Focusing on programs in the Midwest, researchers obtained data from the Internet; surveys; regulatory filings; evaluation, measurement and verification reports; in-depth phone interviews with whole-home program administrators (typically utilities); and literature. Programs ranged in maturity from well-established to recently launched; most have operated for fewer than three years. Researchers sought information about program design elements such as requirements for customer and contractor participation, processes for inclusion in the program, testing and inspections, completing and tracking retrofits, and calculating incentives. The report presents information about various program design and structure and aggregated program trends and observations and provides recommendations for future cold weather climate whole-home program design and implementation. Information is limited to that which is publicly available. Confidential information is summarized only in aggregate form, with the identity of individual programs masked. The report also identifies areas where further research is needed to understand and maximize the effectiveness of cold climate whole-home programs, particularly regarding actual program savings and cost effectiveness, information that is important to understand before scaling up whole-home programs in cold climates.
This study makes several recommendations to whole-home program designers and implementers for improving the cost effectiveness and reach of whole-home programs. Recommendations cover customer targeting, audits, customer incentive design, metrics design and tracking, health and safety, contractor selection, implementation, and savings validation. Recommendations were developed by reviewing general program trends and through observations made by whole-home program administrators.
This study extends knowledge about whole-home programs in several ways:
• It includes information on outcomes, whereas prior recent studies characterize program designs without presenting data on program savings impacts.1
• It focuses on cold climate whole-home programs, whereas prior studies have not focused on specific climates.
• It presents recommendations for further analysis that should be completed before cold climate whole-home programs are expanded.
A key objective of many whole-home programs is to achieve cost-effective, moderate (15–30% per home bill savings) or deep (more than 30% per home) savings, yet the data needed to assess
1 Driving Demand for Home Energy Improvements: Motivating Residential Customers to Invest in Comprehensive Upgrades That Eliminate Energy Waste, Avoid High Bills, and Spur the Economy, Fuller et al. (2010); Residential Energy Efficiency Retrofit Programs in the U.S. (LeBaron and Rinaldi 2010).

x
whether the objective is met are lacking. Additional research is needed to validate savings claimed from whole-home programs, to determine which program designs are cost effective, and to assess which program design elements are necessary to achieve moderate or deep savings from whole-home retrofit programs.

1
1 Introduction and Background
1.1 Motivation for Research The U.S. Department of Energy’s Building America program conducts research to improve the efficiency of new and existing homes with the overall goal of developing integrated systems solutions that take advantage of economies of scale. The Building America team, Partnership for Advanced Residential Retrofit (PARR), focuses on improving the performance of existing homes in the cold climate of the Midwest. As a part of both Building America and PARR’s mandate, this project surveys whole-home energy efficiency programs in cold Midwestern climates to understand their structure, processes, costs, and energy savings. Comparing existing programs can help researchers and program designers and administrators understand what constitutes an effective whole-home program for the Midwest. For this study, researchers defined a whole-home program to be one that fosters, through a mix of financial incentives and program strategies, the installation of multiple energy savings measures in homes to improve overall energy efficiency of the entire home. This information, including analysis of audit systems, contractor requirements, measure packages, and financial incentives, can inform the ongoing growth and development of whole-home programs.
PARR views this report as important for understanding whole-home programs in cold weather climates and for identifying additional research that should be conducted before programs are scaled up. From this foundation, PARR can design and conduct research targeted at the most pressing gaps, while sharing best practices among practitioners. PARR will continue to work with several programs to improve whole-home programs in the Midwest using lessons learned and best practices identified in the study. Moreover, PARR will use the data to develop regionally appropriate whole-home energy efficiency packages that represent both climatic and programmatic realities.
1.2 Scope of Programs Researched Research was focused on home performance programs in the Midwest. States initially reviewed included Illinois, Indiana, Iowa, Kentucky, Kansas, Michigan, Minnesota, Missouri, Nebraska, North Dakota, Ohio, South Dakota, and Wisconsin. The list was narrowed to eight Midwestern states and expanded to include California. The team added California because it felt that the state’s mature programs may offer useful lessons to apply to Midwestern programs. California has rapidly and effectively launched its programs, includes cold climate zones typical of the Midwest, and has experienced program administrators. Any state from the initial list was eliminated if it had no whole-home performance program or if its programs were in such an early stage of development that little to no information was available for analysis.
To select programs for inclusion, the research team focused on programs that were designed for single family home retrofit and which did not impose income qualifications on its participants. Although the criteria further narrowed the list of available programs for analysis, it was important for effectively analyzing programs that are sufficiently similar to provide meaningful comparisons and draw effective conclusions.

2
2 Experimental Methods
2.1 Web Research The project team developed a list of questions and data queries to be answered through utility websites (see Appendix A). These initial questions were used to guide the review of utilities in California, Kansas, Kentucky, Illinois, Indiana, Iowa, Michigan, Minnesota, Missouri, and Ohio. Data from initial Web research were collected and summarized in a spreadsheet and also in narrative form. The project team identified whole-home programs offered in these states and gathered data from a total of 26 programs listed below. The programs were distributed across states as follows, with number of programs in parenthesis following the state name: California (1), Illinois (4), Indiana (2), Iowa (3), Kansas (2), Kentucky (2), Michigan (4), Minnesota (2), Missouri (2), Ohio (3),Wisconsin (1). Programs were either statewide or regional. Some programs were operated by utilities while others were operated by other entities, such as not-for-profit organizations spanning multiple agencies.
Of the 26 programs initially identified, 15 were selected for further study. Programs were eliminated from the initial list for the following reasons: program focused on low income, commercial, or multifamily customers; stage of program development was too early for garnering adequate information; or program did not apply to comprehensive residential retrofits. While improving energy efficiency for commercial, multifamily, and low-income customers is important, the structures of such programs differ in significant ways from those in the current study, and, for low-income programs, the program may not be required to be cost effective, which is critical for the sustainability of other residential programs. The 15 programs highlighted in bold italics below were studied further:
• California: Energy Upgrade California
• Illinois: Ameren Illinois’ Act on Energy
• Illinois: Nicor’s Gas Energy Efficiency Program
• Illinois: Chicagoland’s Natural Gas Savings Program
• Illinois: City of Chicago Green Permit and Green Homes Program
• Indiana: Indianapolis Green Building Incentive Program
• Indiana: Indiana Housing and Community Development Authority (IHCDA) Home Energy Conservation Program
• Iowa: Black Hills Energy, Black Hills’ Home Performance with ENERGY STAR®
• Iowa: Mid American Energy’s Energy Advantage Program
• Iowa: Alliant Energy’s energy efficiency programs
• Kansas: Efficiency Kansas
• Kansas: How $Smart? program

3
• Kentucky: Kentucky Home Performance
• Kentucky/Ohio: Greater Cincinnati Energy Alliance
• Michigan: Consumers Energy Home Performance with ENERGY STAR
• Michigan: DTE Energy's Your Energy Savings
• Michigan: Michigan Saves
• Michigan: Efficiency United
• Missouri: Kansas City Area Home Performance with ENERGY STAR
• Missouri: Missouri/Illinois St. Louis Regional Home Performance with ENERGY STAR
• Minnesota: Xcel Energy’s Home Performance with ENERGY STAR
• Minnesota: Alliant Energy Home Energy Audit
• Ohio: Columbia Gas of Ohio’s Home Performance Solutions
• Ohio: Dominion East Ohio’s Home Performance with ENERGY STAR
• Ohio: AEP Ohio In-Home Energy Programs
• Wisconsin: Focus on Energy Home Performance with ENERGY STAR
2.2 Survey Monkey To gather information that was not available online, the project team developed a survey using surveymonkey.com, and delivered this to key utility program contacts identified in the Web-based research (see Appendix B). The goal of this short survey (14 questions) was to fill in gaps left by the online research and to maximize the response rate by making the questions reasonable to answer in a short period of time. The survey was sent to 17 available contacts at utilities and other entities. Topics addressed by the survey included budget, participation targets/actual, savings goals, audit requirements, and quality assurance (QA) efforts, among others. Thirteen responses were received.
2.3 Evaluation, Measurement, and Verification Reports The research team reviewed and analyzed evaluation, measurement, and verification (EM&V) reports for utility programs, where available. In general, EM&V reports provide an objective, third-party review of the programs and give unbiased information about program participation, cost effectiveness, energy savings, and other program attributes. EM&V reports were available from Wisconsin’s Focus on Energy Home Performance with ENERGY STAR (HPwES) program and Ameren Illinois’ Act on Energy program. Annual reports for Iowa’s Black Hills Energy HPwES program are available for review from the Iowa Utilities Board; however, these are not third-party evaluations. Other programs have not yet developed evaluation results, primarily because they are too new or evaluation reports are not publicly available. Available EM&V reports are summarized in Appendix E.

4
2.4 Preliminary Regulatory Research The team searched filings on state public utility commission databases in Iowa, Indiana, Michigan, Minnesota, Missouri, and Ohio for information about utility energy efficiency plans and whole-home performance programs. These states all had programs that had been running sufficiently long that related program filings were possible. As noted above, annual reports for energy efficiency plans were found on Iowa Utilities Board site. However, there were no useful reports available from the Ohio, Minnesota or Missouri databases. Michigan had potentially useful information, but it was not accessible due to broken links and lack of response to inquiries. Thus, very limited information was available through this search of program filings.
2.5 “Deep Dive” Interviews The project team also conducted phone interviews with all 15 utility program representatives. Questions for these interviews were developed collectively by members of the research team (see Appendix C). The questions addressed program structures and processes, customer targeting, cost effectiveness, program challenges and successes, as well as confirmation of information received through earlier research. After initial introductory contact, interview times were set and questions were sent to participants in advance of the meeting. Ten out of the 15 program contacts agreed to participate in these interviews, which were conducted in early October.
2.6 Literature Review The project team also conducted a background literature review. Material for this review came from a variety of state and national sources but was limited in scope. Most reports focused on features that do not pertain directly to the issues addressed by this study, particularly green jobs creation. Two recent reports take a comprehensive approach to examining whole-home energy improvement programs and are particularly relevant to the current research. These studies, their key points, and the bearing they have on the current study are discussed below.
2.6.1 Summary of Key Literature Findings In their report, Driving Demand for Home Energy Improvements: Motivating Residential Customers to Invest in Comprehensive Upgrades That Eliminate Energy Waste, Avoid High Bills, and Spur the Economy, Fuller et al. (2010), address the challenge of motivating customers to make energy efficiency improvements to their homes. The study identifies several key strategies for developing participation in comprehensive home energy improvement programs:
• Engage trusted messengers in the outreach effort. For example, forming local leadership committees and engaging leaders from different social networks within the community can be an effective way to reach out. The researchers suggest recruiting local opinion leaders and trusted local organizations to work with the program. Maximizing local control over the project, using personal contact, and communicating success stories through these trusted messengers are effective for encouraging participation.
• Partner with contractors. Most high volume programs work closely with contractors, and have developed a program that the contractors want to sell. It is also very effective to employ training and incentives for the contractors.

5
• Carefully identify your target audience by focusing efforts on early adopters—demographic groups that demonstrate interest in home energy improvements.
• Target customers by appealing to shared values. For example, programs can target those who have expressed interest in community economic development, environmental stewardship, or who understand the importance of home energy improvements for creating jobs, reducing pollution, or increasing national security—the message can vary depending on who the program is trying to reach.
• Sell something that customers want, which can translate into using different messages for each market. Creative use of incentives can also be effective, and increasing comfort, health, and self-reliance can all be motivators.
• Use the right words and framework for selling an idea. For example, the terms audit and retrofit have been found to be less effective that terminology such as home improvement or remodeling, which have more positive connotations.
• Use pilot programs before full-scale launch. Pilot programs permit experimentation with different strategies. Ideally, this experimentation is measured and evaluated—including all aspects of the cost to implement—to determine which strategies are successful.
Overall, the themes in this report emphasize the communication and marketing of whole-home programs. Our research focused on many other elements of program design, with marketing analysis focused on customer targeting. However, many of the recommendations in Fuller et al. (2010) are consistent with observations made in the process of researching Midwestern programs for this report, as discussed in detail later.
A second report, Residential Energy Efficiency Retrofit Programs in the U.S. (LeBaron and Rinaldi 2010), provides an overview of programs that support whole-home energy efficiency retrofits by examining basic data about a number of characteristics, including geographic distribution, program sponsors, information about audits and auditors, financing and incentives, and other key program design elements. Only programs that included an audit and active support for whole-house retrofits through financial incentives and/or education were included for the purpose of the study. Reviewing programs across the country, the study found a broad geographic distribution of programs, with the largest number and variety found in the South. Most programs (90%) were utility sponsored, with others offered by municipalities or nonprofit organizations. However, researchers found extensive collaboration among these entities in many programs. The study also examined required auditor qualifications, types of audits offered, and whether the audit is conducted by the contractor or a third party. Many programs offer consumers a range of audit options, and most have third-party auditors.
Financial incentives were examined, including rebates and cash incentives, loans, and billing options. Except for financing on the customer’s utility bill, which was rare, the researchers found many different financial incentives structured in various ways. This report acknowledges that participation data is not readily available in public documents, so limited results are included for audits and/or retrofits completed by these programs. Data on retrofits for HPwES programs were

6
available through the U.S. Environmental Protection Agency, and some information was gathered in interviews. Participation numbers vary widely in the national study, ranging from about 50 to over 6,000 retrofits in 2009. The study concluded by noting the breadth and diversity of whole-home retrofit programs. The report sets out to provide a benchmark for future research and analysis of national home energy performance programs, and recognizes the need for development of a clear best practices framework.
Both studies were valuable in cataloguing and qualitatively describing whole home program design throughout the country, but both lacked data about actual savings from the whole home programs studied as determined through end use billing analysis. Given that the primary purpose of whole home programs is to save energy, the lack of data on actual energy savings from whole home programs is troubling.
2.6.2 Comparing National Reports to Current Research The recent national reports (Fuller et al. 2010; LeBaron and Rinaldi 2010) share similar research questions, findings, and recommendations to the current study, and allow some comparison between whole-home programs in the Midwest and national trends in whole-home program design and implementation. However, while both of these reports include similar analysis and information that is similar to the current study, the scope and approach are somewhat different. These differences are significant and point to the important role of this study in better understanding the current state of whole-home programs not just in the Midwest, but nationally. The key difference between previous recent whole home program survey studies and this study is the lack of study and reporting on energy savings from whole home programs. This study sought to assess savings from whole home programs.
Trends in national whole-home programs are, in many respects, consistent with trends seen in the Midwest. As was the case in the Midwest, most national programs were also utility-sponsored. Nationally, the portion of utility-based programs was about 90%, while about 67% of Midwest programs are utility-administered. All programs included in this study offer some financial incentive or rebate, whereas 86% of programs surveyed nationally included this component. Of national programs, 30% were HPwES, while about half of the Midwest programs studied were approved HPwES programs. The commonality between national and Midwest programs indicates the significant role of utility sponsorship and financial incentives in achieving whole-home savings.
The two national studies focus on characterizing whole-home program design elements rather than savings. Fuller et al. (2010) do not address program savings; rather, they present a descriptive—and useful—discussion of effective ways to design whole-home programs in order to generate customer participation. Although Fuller et al. (2010) report findings on customer participation, the report does not address energy savings as a result of these programs. Thus, in the two recent, national studies about whole-home programs, there are no data on energy savings achieved by the programs. Without energy savings data, the claim that whole-home programs can achieve cost-effective moderate or deep savings, particularly with increased codes and efficiency standards for key measures such as lighting and furnaces, is not supported and needs to be validated. To address this issue, the current study collected data on program savings. This

7
studies’ conclusions about savings from whole home programs, however, has limitations because the savings reported in this study are based on audit results and engineering estimates rather than actual savings determined by end use billing analysis. A further study characterizing actual savings from whole home programs is important before whole home programs are scaled up to ensure that the predicted savings are actually realized.

8
3 Results
As described in the Experimental Methods section, the project team conducted in-depth research with whole- home program managers through surveys and, most importantly, in extensive personal interviews. However, information from program managers was provided to the research team on condition that it remains confidential. Thus, although substantial program-specific data were collected, they are not attributed directly to specific programs in this report. Instead, PARR summarized the data in order to reflect the range of program design elements and program results accurately without violating requests for confidentiality. Although PARR acknowledges that including the detailed, program-specific data would be useful, it believes that the approach taken in the report comprehensively reflects the key findings of the research. 3.1 Qualitative Program Descriptions2 Nine states are represented in the 15 programs that were researched in depth; eight from the Midwest. One utility from California was also included because it includes cold climate zones, and it has been effective in quickly recruiting participants and carrying out retrofits. Thus, the team anticipated that understanding Pacific Gas and Electric’s (PG&E) program would provide lessons that could help similar programs in the Midwest grow and improve. The programs listed below are briefly summarized in this section (and in Table 2) with an overview of qualitative details, such as eligibility, measures, incentives, mechanisms, and longevity of program. Appendix D aggregates the data by topic area and constitutes an exhaustive compilation of the information gathered.
• California: Energy Upgrade California
• Illinois: Ameren Illinois’ Act on Energy
• Illinois: Nicor’s Gas Energy Efficiency Program
• Illinois: Chicagoland’s Natural Gas Savings Program
• Iowa: Black Hills Energy, Black Hills’ Home Performance with ENERGY STAR
• Kentucky: Kentucky Home Performance
• Kentucky/Ohio: Greater Cincinnati Energy Alliance
• Michigan: Consumers Energy Home Performance with ENERGY STAR
• Missouri: Kansas City Area Home Performance with ENERGY STAR
• Missouri: Missouri/Illinois St. Louis Regional Home Performance with ENERGY STAR
• Minnesota: Xcel Energy’s Home Performance with ENERGY STAR
2 Program data were current when collected in June through October 2011; however, programs change frequently, so current measures and/or incentives may vary.

9
• Ohio: Columbia Gas of Ohio’s Home Performance Solutions
• Ohio: Dominion East Ohio’s Home Performance with ENERGY STAR
• Ohio: AEP Ohio In-Home Energy Programs
• Wisconsin: Focus on Energy Home Performance with ENERGY STAR
3.1.1 Energy Upgrade California Energy Upgrade California is sponsored by investor owned utilities across the state, including: Southern California Edison, Pacific Gas and Electric (PG&E), San Diego Gas and Electric, and Southern California Gas Company. Our research focused on PG&E because its northern California service territory includes the state’s coldest climate zone that most closely resembles the cold climate of the Midwest.
Energy Upgrade California offers a Basic Upgrade (prescriptive) and an Advanced Upgrade (performance) option. Rebates of $1,000 are available for the Basic Upgrade, while up to $4,000 is available for the Advanced Upgrade. The Basic Upgrade consists of mostly prescriptive measures, which must include: air sealing, attic insulation, duct test and seal, pipe wrap of domestic water heater, low-flow showerhead with, or in addition to, thermostatic valve control, and a combustion safety test. The Advanced Upgrade is the Basic Upgrade with the additions of wall insulation, proper sizing of hot water system and heating and cooling system, energy efficient windows, cool roofs, and other permanently affixed measures. The program is currently targeting a 40% reduction in home energy consumption for maximum incentives, and it includes partial incentives for achieving further energy reduction.
3.1.2 Ameren’s Act on Energy Home Energy Performance (Illinois) Ameren’s Home Energy Performance program is available to all Ameren customers in Illinois, regardless of income. The program started in January 2009. The cost of the audit is subsidized; a $25 co-pay is required. Incentives for air/duct sealing, attic insulation, and wall insulation can reach up to $1,200, $1,400, and $2,400, respectively, based on air leakage, measured in cubic feet per minute (cfm), or square footage. To be approved, these incentives must be installed in accordance with strict guidelines. In homes in which air sealing or duct sealing is performed or exterior wall insulation is installed as part of the retrofit, the program requires a combustion safety test and before and after retrofit. Self-installed measures do not qualify for incentives.
3.1.3 Nicor Gas Energy Efficiency Program (Illinois) Nicor Gas offered a pilot home retrofit program that operated from May 2010 to May 2011. Nicor Gas now offers a joint home retrofit program with Commonwealth Edison Company that launched in August 2011. The data in this report are based on the Nicor Gas pilot home retrofit program. The home energy audit comes with free direct install measures (low-flow water saving devices and up to 10 compact fluorescent llights [CFLs]). The program pays 50% of costs to weatherize, up to a cap of $1,250/retrofit. The program is available to single family homeowners who are jointly served by both Nicor Gas and ComEd. Assessment focuses on changes and upgrades that can improve the energy efficiency and comfort of the home and weatherization improvements that qualify for incentives.

10
3.1.4 Chicagoland Natural Gas Savings Program (Illinois) The Chicagoland Natural Gas Savings Program had two pilot programs: a whole-home program and an air sealing program. The Whole Home Scale-Up Project was designed to assess the feasibility and scalability of whole-home retrofits in the North Shore Gas (NSG) and Peoples Gas and Light service territories. The program was a collaborative effort between ComEd, the Department of Commerce and Economic Opportunity, Center for Neighborhood Technology, the Chicago Historic Bungalow Association, Delta Institute, Community and Economic Development Association, and others. The goals were to: identify the right energy savings target for the local housing stock; develop a model for co-funding and collaborating on efficiency using separate gas and electric funding sources; and identify barriers to large-scale residential retrofits of territory housing stock and propose solutions. The program provided retrofits to 81 homes (78 in Peoples Gas and Light’s territory) to test program concepts and to develop actionable recommendations and tools to facilitate whole-home retrofits, including a list of costs and benefits of individual measures based on common housing types and vintages. Expected per home savings, based on site-specific audits, is 30%.
The Air Sealing Pilot Program seeks to increase the practice of home air-sealing as a strategy to improve the overall energy efficiency of single family homes and multifamily up to two units built prior to 1980. In addition to properly sealing these units against infiltration losses, the program also tried to increase awareness of the impact of air sealing on comfort, and to cross-promote other energy efficiency measures. To participate, customers were required to use a program-approved contractor to perform air sealing measures. The program also conducted pre and post testing for radon levels and required customers to have a carbon monoxide detector. End-use billing analysis results for 181 homes will be available in late spring 2012.
Both programs are no longer active. They closed when funding ended on June 30, 2011.
3.1.5 Black Hills Energy Home Performance with ENERGY STAR (Iowa) This program is a pilot program located in the community of Council Bluffs, Iowa, and consists of a test-in evaluation/audit and a test-out evaluation/audit. The audit fee is $100, though many audit components are free including: building envelope and exposed duct system inspections; appliance inspections including the refrigerator and freezer; combustion appliance inspection and diagnostic testing; gas leakage testing; and moisture inspection. Customers are given a prioritized, comprehensive list of recommendations.
Rebates are available for: insulating the ceiling to R-38 or greater (70% of the cost up to $750); Insulating the foundation to R-13 or greater (70% of the cost up to $750); insulating the wall to R-11 or greater (70% of the cost up to $750); controlling infiltration with weather stripping, caulking, etc. (70% of the cost up to $200); replacing doors ($25/door for R-5 to R-10; $50/door for R-11). If the homeowner completes three of the top five recommendations within six months of the test-in evaluation/audit, they may qualify for the $200 HPwES bonus incentive on top of Black Hills Energy's rebates.

11
3.1.6 Kentucky Home Performance The Kentucky Home Performance (KYHP) program is run by a special purpose nonprofit organization funded by a one-time American Recovery and Reinvestment Act (ARRA) grant. KYHP is a statewide program with over 23 participating utility providers. The program operates various pilot projects with several organizations, including an on-bill pilot with Mountain Association for Community Economic Development and initiatives with Greater Cincinnati Energy Alliance, Tennessee Valley Authority, Oak Ridge National Laboratory. KYHP started in January 2010 and officially launched in November 2011. The program is available throughout the state of Kentucky and in four counties in southern Ohio.
The program has certain requirements, including a diagnostic test-in audit, air sealing, and insulating to certain R values, test out and QA. If insulation is added, air sealing must be done. If current ceiling insulation does not meet R-19, it must be added to R-38. If current floor insulation is not R-11, it must be made to R-19. A carbon monoxide detector must be installed. Other improvements eligible for rebates or financing include ENERGY STAR windows, doors, air source heat pumps, ACs, boilers, furnaces, water heaters, programmable thermostats, and closed-loop geothermal heat pumps, and lighting.
KYHP provides $150 toward the whole house energy evaluation and either a 20% rebate up to $2,000 or below market rate loan of 3.99% up to $20k with maximum term of 10 years.
3.1.7 Greater Cincinnati Energy Alliance (Ohio and Kentucky) The Greater Cincinnati Energy Alliance is a special purpose nonprofit organization and Better Buildings grantee. The territory covers Southern Ohio and part of Kentucky.
Comprehensive energy assessments cost $50, though this is reimbursable after completing some energy improvement measures. After all recommended insulation and air sealing measures are complete, rebates of up to 35% are available toward any audit-recommended energy saving measures, including high-efficiency heating and AC upgrades. The program also offers unsecured home energy loans at 6.99% interest rate, for a term of up to 10 years based on equipment installed. Loan customers are not eligible for the 35% incentive, but they receive an additional 15% incentive. For a limited time, Northern Kentucky customers can take advantage of a 3.99% interest rate, in partnership with Kentucky Home Performance (ending August 31, 2012).
3.1.8 Consumers Energy Home Performance with ENERGY STAR (Michigan) Consumers Energy’s Home Performance with ENERGY STAR program started in January 2011. The program offers two options: a $50 home energy survey or a comprehensive home assessment (CHA) that offers rebates up to $3,500. The survey investigates air sealing, duct leakage, insulation, lighting and appliances, health, safety and durability, furnace or boiler, AC and water heating, and it includes direct installs of CFLs and faucet aerators. The CHA includes an actionable profile of the customer’s home, which the homeowner can use to determine scope. The CHA includes diagnostic test-in, work scope, work, test-out, combustion air zone testing, health and safety, and QA.

12
The program provides rebates for meeting performance metrics (e.g., air leakage and duct leakage reductions) at various levels.. Incentives are also available for installing attic, wall, basement, crawlspace, floor insulation, high efficiency mechanical systems and water heaters, and certain windows. Electric or electric and gas customers are eligible for the program. In total, incentives are capped at $3,535 for Consumers Energy gas and electric customers and $790 for electric-only customers.
3.1.9 Kansas City Area Home Performance with ENERGY STAR (Missouri) This program is implemented by the Metropolitan Energy Center, and was previously overseen by the Missouri Department of Natural Resources at the statewide level. The program is open to single family homeowners in Kansas City Power and Light (electric) or Missouri Gas Energy (gas) territories.
To participate in the program, homeowners must receive a home energy assessment and complete one of the following: bring attic insulation to R-38, install wall/floor insulation, conduct air sealing and/or duct sealing, or install ENERGY STAR windows having a U factor of 0.30 and solar heat gain coefficient of 0.30. The rebate may be awarded in the form of a bill credit. The total rebate amount is divided and paid evenly between the two utilities, with each contributing a maximum of $600, for a capped rebate level of $1,200. Customers of only one of the utilities receive that utility’s portion of the rebate.
3.1.10 St. Louis Regional Home Performance with ENERGY STAR (Missouri/Illinois)
The St. Louis Regional HPwES program is run by the Missouri Botanical Garden’s EarthWays Center. This program does not provide any incentives, but makes recommendations based on a whole-home approach. A diagnostic energy audit, work scope, implementation, test-out, and QA are required parts of the program. Quality control (QC) is coordinated through the EarthWays Center. There are no set prices, but audits tend to be in the $300 to $800 range. This is one of the longest running programs in the Midwest, having begun in 2003. These programs have provided some rebates: for Energize Missouri Homes, $1.6M was available for rebates; St. Louis County SAVES has $10.4M in low-interest loans is available.
3.1.11 Xcel Energy’s Home Performance with ENERGY STAR (Minnesota) Xcel Energy’s HPwES program began in 2007. To be eligible, customers must receive natural gas and electricity from Xcel and must complete either a standard audit or standard audit with infrared thermography, and customers implement, at a minimum, three required measures (air sealing, R-44 attic insulation, and CFLs) and two optional energy efficiency improvements. Optional items include upgrading to air conditioning with a seasonal energy efficiency ratio of14.5, 15, or 16–16; ENERGY STAR washer/dryer/refrigerator; electronically commutated motor (ECM) fan; a furnace with an annual fuel utilization efficiency (AFUE) of 90%, 92%, 94%, or 96% or a 84% AFUE Boiler; occupancy sensors; programmable thermostat; wall insulation; tankless water heater 0.82 energy factor (EF); tankless water heater 0.67–0.80 EF; and refrigerator recycling.

13
The program pays 20% of installed costs (labor and materials) for air sealing up to $60, and 20% of installed costs up to $350 for R-44 insulation, and provides $40 for CFL rebates. Total rebates are capped at $1,200. The program charges $60 for a standard audit and $100 for a standard audit with infrared camera.
3.1.12 Columbia Gas of Ohio’s Home Performance Solutions The Home Performance Solutions program started in September 2009 and is available in all of the 61 Ohio counties served by Columbia Gas. Demand for the program has been high, with available spots for 2011 filled, and a waiting list in place for 2012. There is no income qualification, but there is a discounted audit rate for income qualified customers. A home energy audit is required to participate in the program. Audits cost $50 ($20 for income-eligible customers). Columbia Gas of Ohio reimburses the audit fee and provides rebates for any qualified efficiency improvement. Rebates of up to 70% of installed costs are available; the program reimburses customers at the rate of $0.40/ft2 for wall insulation, $0.30–$.50/ft2 for attic insulation, $40/h for air sealing, and $200 for replacement a natural gas furnace or boiler with a high efficiency unit.
3.1.13 Dominion East Ohio’s Home Performance with ENERGY STAR Dominion’s HPwES program started in October 2010 and is available to residential customers of Dominion East Ohio. To qualify for the rebates, customers must use a GoodCents Building Performance Institute (BPI)-certified auditor and a participating contractor must install the improvements. Home performance assessments cost $50. If combustion appliance zone (CAZ) tests identify potential threats in the home, recommended repairs must be completed.
Financial incentives are available through the program for attic insulation ($0.30/ft2), wall insulation ($0.30/ft2), floor insulation ($0.30/ft2), duct insulation ($0.30/ft2), attic access insulation ($30), air or duct sealing ($40/h). Other rebates are available for ENERGY STAR replacement windows and doors, fans, thermostats, high efficiency mechanical systems and water heaters, and water heater insulation.
3.1.14 AEP Ohio In-Home Energy Program The AEP Ohio In-Home Energy Program, which started in December 2010, is available to all AEP customers. There are two different audit levels, energy assessment and energy audit. The assessment, which costs $25, includes direct install of CFLs, programmable thermostats, low-flow showerheads, pipe wrap, and includes a report with a prioritized list of methods for further reducing energy bills. Rebates are available for installing energy efficiency measures. The comprehensive, four-hour audit also includes a direct install component. Auditors analyze all major systems, conduct blower door, combustion, and equipment efficiency tests, and create a detailed report with a prioritized list of efficiency improvements. Rebates or financial incentives are available for the following approved energy-saving measures: comprehensive audit, pin-based CFL fixtures, CFL torchieres, wall insulation, air sealing, window film, ENERGY STAR windows, attic insulation, shower flow control device, ENERGY STAR ceiling fan, heat pump programmable thermostat, duct sealing, refrigerant charge and airflow tune up, replacement of old heating, ventilating, and air conditioning (HVAC) blower motor with ECM, ENERGY

14
STAR central air conditioning replacement, ENERGY STAR heat pump replacement, and a complete system bonus.
3.1.15 Focus on Energy Home Performance with ENERGY STAR (Wisconsin) The Focus on Energy Home Performance with ENERGY STAR program began in October 2001 as a public-private partnership of the Wisconsin Public Service Commission, utilities, and other organizations. Natural gas or electricity customers of participating utilities are eligible for this program. In order to qualify for incentives, customers must have a third-party HPwES evaluation that evaluates air tightness/leakage, moisture and ventilation, combustion safety and carbon monoxide, insulation and building shell testing and focuses on how to solve problems such as drafts. Recommendations are provided to the homeowner, who must implement at least one recommendation to be eligible for rebates. The program also requires a post-retrofit inspection. There are no mandatory measures; instead, the customer decides which recommendations to implement.
Customers in a participating utility territory can receive individual measure incentives by providing applicable documentation on completed installations (a bonus incentive may be added if certain measures are completed). Providers (e.g., air sealing contractors) can also receive incentives. Homeowners who reside in the Wisconsin Public Service utility territory receive additional incentives if projects are completed within 6 months of the preliminary evaluation.
3.2 Quantitative Program Data The following sections detail whole-home programs to illustrate the wide variation on many key program metrics. Program managers provided information through surveys or in interviews with the understanding that the information would be confidential, unless it was already publicly available. This necessarily restricted the researchers ability to link program information to specific data. As the figures and tables demonstrate, data were not always reported in uniform units, time periods, or formats. However, the data illustrate program trends and indicate areas of additional research that could lead to improved whole-home program design and implementation. The following sections focus on reporting research results. Interpretation of these results and resulting recommendations are detailed in Section 4.2.
3.2.1 Longevity At the time of the survey, programs were operational from a few months to about ten years. As Figure 1. Year of inception illustrates, most whole-home programs in the Midwest are relatively new. Eleven of the 14 programs with a known start date are less than five years old. The oldest program began in 2001, two others were launched in 2003, and the rest started in 2007 or more recently. Ten of the 14 programs started less than three years ago, and seven began in 2010 or 2011, so have been in operation for less than two years. The recent spike in programs may be related to the release of ARRA funds in 2009 that supported energy efficiency programs, among many other initiatives.

15
Figure 1. Year of inception for whole-home programs
The short life of most of these programs is significant. Program managers consistently report that whole-home programs cannot be launched and reach maturity in one year’s time. Effective programs must develop trade allies who can audit, perform diagnostics, and recommend retrofit packages tailored to specific homes. Inspectors must be trained to recognize if recommended measures are installed and operating properly and to provide feedback to auditors and installation contractors. Programs must build customer demand by educating customers and communities about unfamiliar measures such as air sealing. These tasks associated with developing market capacity and creating market demand are a multiyear process. Once a program is ready for impact evaluation (determining energy savings attributed to the program), evaluation studies typically take a year for design, data collection, and reporting. Given that initial launch through evaluation of early impact is at least a three-year cycle, and that 10 of the 14 existing whole-home programs studied are less than three years old, the absence of impact assessment data is not surprising. Indeed, given the large number of programs that are at a similar stage of early program maturity, it would be productive to work with current program administrators to develop common assessments and data collection procedures. This would permit meaningful program cross-comparisons to determine which program design and implementation features lead to cost-effective whole-home programs with robust customer participation. Useful data to collect across programs is discussed in Section 4.2.10.
3.2.2 Program Budgets Annual budgets for the surveyed whole-home programs differ by two orders of magnitude. Table 1 documents the widely varying program budgets. The lowest budget identified was about $100,000, while the largest annual allocation was $10M. Nine of the 11 programs have annual budgets over $1M/yr; the remaining are funded at less than $1M/yr. In most cases, larger budgets were found in utility-sponsored programs than in those managed by a not-for-profit organization. This is not surprising, given the greater resources at utilities’ disposal. However, there are a few programs with large budgets that were supported by ARRA funds. ARRA funding allocations
0
1
2
3
4
5
6
7
# of
Pro
gram
s
Years Programs Started
2001
2003
2007
2009
2010
2011

16
will expire early in 2012, and the question of how to provide ongoing support was of great concern to program managers running nonprofit-based programs. The average annual funding commitment is $3.5M, while the median is $2.5M.
The data in Table 1, in combination with the fact that multiyear initiatives are required to develop market capacity and build customer demand, indicate that whole-home programs require substantial (multimillion dollar) and sustained funding commitments.
Table 1. Current Program Budgets, $ (approximate, 2010–2011)
100,000 Average: $3,504,545
Median: $2,500,000 750,000
1,000,000 1,000,000 2,200,000 2,500,000 2,600,000
2,900,000
5,700 ,000
9,800,000
10,000,000
3.2.3 Program Participation and Conversion Rates The number of participants in whole-home programs varies widely across the programs surveyed. Further, the programs define participation differently. Current annual program participation in each program, defined as completed retrofits, ranges from 68 to 2,224. Not surprisingly, the programs with the greatest longevity reported the highest participation rate, which supports the observation that whole-home programs require ongoing, multiyear funding commitments. Conversion rates, defined as the number of customers participating in audits or assessments who subsequently proceed with a retrofit, also vary widely. Five programs did not track this metric explicitly; the method for calculating conversion rate was not consistent between all programs. In interviews, program managers often approximated conversion rates. Again, this was especially true in young programs where data were not yet available or being monitored closely. Conversion rates in programs tracking the data ranged from less than 10% to 65%. Most reported conversion rates of 30% or more. Table 2 shows the number of retrofits, along with the associated program conversion rate.

17
Table 2. Current Program Participation (Retrofits) and Conversion Rates (%) (2010–2011)
Retrofits Conversion Rate 81 NA
83 (2010); 200 (2011) NA 68 (2010); 336 (2011) 1.7%; 9.3%
413 30% 640 61% 969 >50% 1300 NA 1500 NA 2224 65%
3.2.4 Program-Level Energy Savings Not all programs surveyed reported energy savings, and energy savings were not reported in common units. Also, with one exception, reported savings were not based on actual savings as determined by end-use billing analysis. Instead, for all but one program, described below, reported savings were based on forecasted savings, either “deemed” savings or savings determined by audit software. Some programs tracked only gas savings; other only electric, and some reported percent savings reduction at the whole-home level. Table 3, which presents program-level energy savings in standard electricity and natural gas usage units, demonstrates the wide range of savings achieved by programs to date. Where participation numbers were available, per home savings are included in Table 3, but this was not possible for all programs.
One program performed end use billing analysis on 141 homes one year after retrofits were completed. The program’s measure package focused on gas measures, including direct install measures (low-flow showerheads and faucet aerators), air sealing for all homes, and attic insulation for most homes unless the pre-existing attic insulation was greater than R-11. The forecasted savings for this program, based on TREAT modeling of typical housing building stock in the program area, was per home savings of 367 therms/home for attic insulation, 243 therms/home for air sealing and 51 therms/home for the direct install package. The end use billing analysis of the 141 homes reported an actual average per home savings of 97 therms/home, far lower than what was expected based on the modeling.

18
Table 3. Program-Level Energy Savings (2010–2011)
Program-Wide Energy Savings
(kWh)
Savings per Home (kWh)
Program-Wide Energy Savings
(Therms)
Savings per Home
(Therms) 987,400
(7/1/10–11/1/11) NA 67,371 NA
159,334 386 1,021,239 459 620,555 279 1,094,747 16,099
3,371 42 308,100 481 2,208,050 NA
4,429,000 NA
NA NA 13,677 97

19
3.3 General Trends from Research Information from Web research and follow up surveys and interviews with whole-home program administrators revealed common trends for whole-home programs in the Midwest, as follows:
• Midwestern whole-home programs are emerging, not well established. Ten of the 14 programs started in the past three years. Programs range in age from a few months to ten years, and seven have been operating for less than two years. The authors believe that the program newness presents a valuable opportunity to work with whole-home programs to establish common tracking metrics and data collection to allow for more meaningful program comparisons.
• Whole-home programs require substantial and sustained funding commitments. Whole-home programs are being funded at substantial levels averaging $2.5M per year. Program budgets range from approximately $100,000 to $10M. The authors of this study believe that smaller funding levels are unlikely to be sufficient to develop a trained, sophisticated contractor network and to generate the customer demand needed to achieve energy savings.
• Utility support is key to whole-home program success. The most stable and reliable funding source for whole-home programs are utility ratepayers. Absent utility support, whole-home programs are unlikely to be successful given the substantial and sustained funding needed over time for success.
• Whole-home program participation is low; building participation requires a multiyear commitment. The greatest annual participation currently is less than 3,000 participants, and the average participation is closer to 1,000. Participation is greater in programs that have been established for several years. However, even in the longest-running program (10 years), participation is only around 2,000 customers. Thus, at their current level of maturity and impact, whole-home programs in the Midwest are still niche programs that do not impact large numbers of customers. It is an open question whether this is an optimal level from a utility perspective, or whether participation would increase with greater funding.
• Program and per dwelling savings from whole-home programs are uncertain and must be further studied. With one exception, none of the whole-home programs report actual energy savings. All are based on either “deemed” savings, engineering estimates, or savings estimated from energy audit tools. While program level savings estimates are generally available, per home savings numbers are not as widely available. To obtain actual savings, post-retrofit end-use billing analysis must be performed. Several whole-home retrofit administrators expressed interest in having the PARR team perform end-use billing analysis on completed retrofits to determine actual savings.

20
4 Discussion and Recommendations
4.1 General Observations about Whole-Home Programs Early program results from Midwestern whole-home programs demonstrate the key program design elements and features that are necessary for long-term program success and cost effectiveness. Key program attributes for emerging whole-home program success include:
• Multiyear and substantive (multimillion dollar) utility funding and support
• Customer targeting of high energy users in defined geographic locations
• Marketing approaches that inform customers about whole-home programs and educate them about the value of whole-home improvements for saving money and improving comfort.
• End-use billing analysis is needed to determine actual, rather than just forecast, savings from whole-home programs.
In undertaking this research, the authors hoped to find program evaluation data, either third-party or program-based, describing program outcomes, and serving as a basis for measuring program efficacy. Instead, the study revealed that such evaluation data do not exist for these programs. Thus, the recommendations developed in this report were not informed by actual savings. Instead, these recommendations are based on:
• High level program trends and observations
• Program manager insights and observations elicited in interviews
• The authors’ experience and perspective.
Before significantly expanding whole-home programs in the Midwest, it is important to assess the value of whole-home programs meaningfully. Before expanding whole home programs, the following questions should be answered;
• What are the actual, rather than forecasted, savings from whole home programs? • Are whole home programs cost-effective? • How do whole home programs compare, based on customer satisfaction, cost-
effectiveness, to other residential efficiency programs?
4.2 Specific Observations and Recommendations 4.2.1 Sponsoring Organization Most whole-home performance programs surveyed were sponsored by investor-owned utilities, which developed these programs as a component of broad energy efficiency plans. Out of the 15 programs surveyed, 10 were developed as an element of the utility’s portfolio of residential energy efficiency measures; the remaining five were operated under the auspices of a nonprofit organization—some of which were funded through time-limited ARRA funds. Most utility programs were governed by regulatory directives mandating that reductions in energy use be

21
achieved through improvements in energy efficiency. However, these regulatory directives did not, except in one case, require implementing a comprehensive home performance approach to achieve these energy savings. Rather, adopting the whole-home performance approach was a decision made at the utility’s discretion.
4.2.1.1 Recommendations Because whole-home programs require multiyear, multimillion dollar funding commitments to build program participation and generate energy savings, utility support and funding is necessary for whole-home program success. Time- and budget-limited funding sources will not produce the market capacity and customer demand needed to sustain and grow a whole-home program.
4.2.2 Customer Targeting and Marketing 4.2.2.1 Customer Targeting Several programs target customers to achieve higher savings or to reduce program costs. Program targeting strategies include:
• High energy use customers. Whole-home programs have high fixed costs compared to a traditional rebate program because they typically require an energy audit. Thus, some programs target high energy users to reduce overall cost per unit energy saved and to achieve more overall energy savings. These targeted programs can help high energy consumers achieve gas and electric savings.
• Older homes. If program implementers do not have access to utility bill information to identify high energy use, the age of homes can be used as a proxy for targeting program participation.
• Customers limited to a specific geographic area. Whole-home programs require considerable new market capacity, including trained auditors and contractors who can install or work together to install multiple measures (as opposed to the single measures that have been the focus of most utility rebate programs). Emerging programs have restricted participation to specific geographic areas to reduce travel time and to rely on a pool of trained auditors and contractors who can work together to achieve comprehensive retrofits.
4.2.2.2 Recommendations Targeting participation to high energy use homes, older homes, and limited geographic areas will lead to increased program cost effectiveness and product quality. We recommend the following customer and geographic targeting methods for new or emerging whole-home programs:
• Homeowners with excessive energy usage
• Older homes, which may have been constructed before updates in energy codes and may also be due for aesthetic updates, maintenance, or other improvements
• Homeowners and census tracts with enough disposable income to afford the several hundred to several thousand dollar cost of a whole-home retrofit unless program or other funds are available to provide greater subsidies or incentives to homeowners to pay for the comprehensive retrofits

22
• Suburban or urban populated areas with sufficient population density to minimize auditor and contractor travel time and to allow effective coordination.
4.2.2.3 Customer Marketing: Program administrators are using several different approaches to generate customer demand, as follows:
• Community-based outreach. Community-based organizations are trusted sources of information for residential customers. Furthermore, many have low-cost marketing channels, such as emails and newsletters, to promote whole-home programs. Respondents described other community events, including home shows, farmers’ markets, state and county fairs, that relied on community leaders to promote whole-home programs. One particularly successful community-based approach was described by a utility which performed an audit for a local reporter, who documented the experience in the local daily newspaper. Phone and Web inquiries to the program skyrocketed after the story was published. One program implementer compared the cost per participant of promoting its whole-home program using community-based organizations with direct mail and found the community-based outreach to be one tenth the cost of the traditional direct mail approach. Given that whole-home programs are new and can be difficult to describe and sell, local community-based organizations that are trusted and have existing, low-cost marketing channels can be effective at promoting whole-home approaches.
• Traditional outreach campaigns. Whole-home program administrators also described traditional energy efficiency outreach strategies to promote whole-home approaches, including bill inserts, direct mail, and radio and television spots. Traditional outreach campaigns, particularly direct mail and radio and television advertising, can be expensive and may not trigger action given that customers don’t simply need to know that the whole-home program is available, but they also need to understand the process and the benefits. Although traditional outreach is excellent for raising awareness, it is limited for providing the education that whole-home programs require.
4.2.2.4 Recommendations Consider the following channels and messages for new whole-home programs:
• Community-based organizations and leaders. Customers need to learn and be persuaded about the value and benefits of whole-home retrofits, so community-based organizations and leaders— trusted sources of information that often have existing low-cost marketing channels—may be better positioned and more effective at marketing whole-home programs than the more expensive traditional marketing and outreach channels, which are more useful for advertising than educating. This recommendation is consistent with those found in the report titled Driving Demand for Home Energy Improvements: Motivating Residential Customers to Invest in Comprehensive Upgrades That Eliminate Energy Waste, Avoid High Bills, and Spur the Economy, Fuller et al. (2010),

23
• Messaging. To generate demand, customers need to learn what whole-home retrofits are and the benefits they provide, including saving money and increasing comfort. Fuller et al. (2010) discusses effective language for communicating this message.
4.2.3 Measure Packages and Incentive Structure Financial incentives for participating in whole-home performance programs are available to some extent in all the programs examined. These incentives take different formats. Some programs offer free or subsidized audits and free direct install measures such as CFLs, low-flow showerheads and faucet aerators. Others offer rebates for installed measures, and some provide access to low-interest loans to finance retrofits. However, most incentives are structured as a portion of the project cost. The way these financial incentives are structured in relation to retrofit measures varies considerably among programs. Thus, it is difficult to generalize broadly about this program design element.
In Table 4, shown below, program incentives for common categories are summarized. As this table illustrates, there is no single approach to designing measure packages and associated financial rewards for whole-home performance programs. Some programs take a simple approach, with an overall cap in percentage and dollars on the incentive, which may be applied to any of a number of measures. Other programs prescribe exactly which measures must be installed in order to receive any incentive. Between these prescriptive and flexible approaches lie several hybrid approaches. In these cases, a balance between customer choice and program-established measures is achieved. For example in one program, customers must install attic insulation and conduct air sealing but can elect other measures. Some programs allow customers to choose any measures from those recommended in an audit report. Some programs have a detailed menu of eligible measures, each with an accompanying financial incentive.

24
Table 4. Summary of Program Incentives
Program Audit Rebate
Air/Duct Sealing
Attic Insulation
Wall Insulation Required/Notes
Energy Upgrade California- PG&E
Incorporated under basic
upgrade
Incorporated under basic
upgrade
Incorporated under basic
upgrade
Incorporated under
advanced upgrade
Basic ($1,000) Requires: Air sealing, attic insulation, duct test and seal, pipe wrap of domestic hot water heater, low-flow showerhead with, or in
addition to, thermostatic valve control or thermostatic flow restriction device, combustion safety test. Advanced (up to $4,000): Requires
Basic level measures, plus: Wall insulation, proper sizing of hot water system and heating and cooling system, energy efficient windows, cool roofs, and
other permanently affixed measures. Nicor’s Gas
Energy Efficiency Program
Measures must be identified on audit report/50% of costs of weatherization improvements up to $1,250
Ameren Illinois’ Act on Energy Up to $1,200 Up to $1,400 Up to $2,400 Efficiency guidelines must be met to qualify for
incentives
Kentucky Home Performance
$150 (whole-house energy
evaluation)
Up to 20% (air sealing is
mandatory)
Up to 20% (must be done up to R-38 if does not meet
R-19)
Air sealing, attic and floor insulation up to certain level required. 20% rebates on approved measures
up to $2,000. Utilities may add other rebates. 3.99% loan up to $20,000. If current floor
insulation is not R-11, it must be made to R-19. CO detector must be installed. Other improvements include ENERGY STAR windows, doors, air source heat pumps, air conditioners, boilers,
furnaces, water heaters, programmable thermostats, and closed-loop geothermal, and lighting.

25
Program Audit Rebate
Air/Duct Sealing
Attic Insulation
Wall Insulation Required/Notes
Consumers Energy HPwES3
$400/$100 (with three measures installed)
$225/350/400 or $45/70/1154 (air) $50/125/125 or
$15/35/15 (duct)5
$400/400/706 $275/275/507; $400/400/708
Customer choice/detailed list of incentives, including crawl space, floor, rim joist insulation, mechanical systems and water heating. Incentives are capped at $3,525 for Consumers Energy gas
and combination customers and $790 for Consumers Energy electric only customers.
Kansas City Area HPwES
$400/unit;$200/unit9
$10/% cfm reduction up to 40% (air); $5/% cfm reduction up to 40% (duct)10
Up to $500 Up to $600
Customer choice/rebates also available for floor insulation, ENERGY STAR windows and doors.
Maximum rebate $1,200. Customers can qualify for a $600 rebate from Kansas City Power and Light
and a separate $600 rebate from Missouri Gas Energy, may be given as bill credit.
Xcel Energy’s HPwES 20% up to $60 20%, up to
$350 (R-44) 20% up to $400
Air sealing/weather stripping, attic insulation, and CFL’s required; must pick two additional measures
from list, ranging in scope from programmable thermostats to new furnace or air conditioning.
Total rebate up to $1200
Dominion East Ohio’s HPwES
Home Performance Assessment costs $50
$40/h
$0.30/ft2 (attic access
insulation. $30)
$0.30/ft2
To qualify for incentives, customer must use Good Cents and make repairs recommended for safety
issues/also: floor insulation $0.30/ft2, duct insulation $0.30/ft2, $5 per ENERGY STAR window, $30 per R-4 or greater door, $15 for
3 Higher rebates (first group of numbers) for gas and electric or gas only customer; lower rebate (second set of numbers) for electric only customer. 4 For 20%, 30%, and 40% reduction respectively. 5 For 15% reduction, 30% reduction, or duct insulation and/or replacement (insulate minimum of 25 ft.) 6 R-30 or less existing; install to R-49, minimum of 500 ft 7 Above grade wall insulation, minimum of 500 ft 8 Basement wall insulation 9 Single family/multifamily 10 Minimum starting reduction is 10%

26
Program Audit Rebate
Air/Duct Sealing
Attic Insulation
Wall Insulation Required/Notes
ENERGY STAR fans. $300 for gas furnace AFUE 90%, $350 for gas furnace AFUE 92%, $400 for
AFUE 94%, $250 for gas boiler AFUE 85%, $300 for gas boiler AFUE 90%, $30 per thermostat (2
max). $100 for gas water heater 0.67 EF, $150 for tankless 0.82 EF, $125 for condensing gas water
heater 0.80 EF or greater, $10 water tank insulation.
Columbia Gas of Ohio’s Home Performance
Solutions
$40/h $0.30 to $0.50/ ft2 insulated
$0.40/ft2 insulated
Customer choice/rebates of up to 70% are available, rebates increase as more measures
installed. Also, high-efficiency heating system $200 for replacement with natural gas furnace 92%
AFUE, or natural gas boiler 90% AFUE.
AEP Ohio In-Home Energy
Programs11 $100/$75 $200/$50 (air)
$150/$50 (duct) $200/$90 $200/$90
Customer choice/detailed list of incentives, including CFLs, windows, mechanical systems,
water heating. A complete system bonus of $150 is paid for installation of a high efficiency furnace with ECM blower and either of the following: a)
ENERGY STAR central air-conditioning unit or b) ENERGY STAR heat pump unit. Also paid for
installation a heat pump with electric backup heat and an air handler with ECM blower.
Focus on Energy’s $75/$125/$17512 $100 $100/$200/$1
00/$5013 Customer choice/detailed list of incentives, including foundation insulation, mechanical
11 Higher amount is for all electric or electric heat, and lower amount is for central AC with non-electric heat. 12 For 400, 1000, 1600 cfm reduction, respectively.

27
Program Audit Rebate
Air/Duct Sealing
Attic Insulation
Wall Insulation Required/Notes
HPwES (Wisconsin)
systems, water heating. Performance bonus of $300 for completing three recommended shell insulation
measures or two recommended shell insulation measures and a major mechanical measure in
addition to air sealing if applicable
Black Hills Energy HPwES
(Iowa)
70% up to
$750 (for R-38 or higher)
70% up to $750 (for R-11 or higher)
Customer choice/also: insulation (foundation) R-13 or greater—70% of the cost up to $750; Infiltration Control: Weather-stripping, caulking, etc. —70%
of the cost up to $200; Doors, R-5 to R-10: $25/door; Doors, R-11 or greater: $50/door.
Complete three of the top five recommendations within 6 mo. of the test-in evaluation/audit,
schedule your test-out evaluation/audit, and qualify for the $200 HPwES bonus
Chicagoland’s Natural Gas
Savings Program
$125 co-pay 85% up to $750 85% up to $850 Audit includes direct install measures
13 For knee-wall, sidewall cavity, sidewall rigid foam R3 or R4, and sidewall rigid foam R5 or greater, respectively.

28
Certain program-specific observations were made about the structuring of measure packages and financial incentives. One manager of a program that has two levels of participation noted that a prescriptive approach can unnecessarily restrict participation, particularly when the minimum standards for retrofits are set very high. In such a case, participation is limited to a small set of highly motivated customers. In that program, the utility found that, in many cases, customers had already implemented many measures equivalent to the first tier prescriptive program, and were only interested in participating in the higher level performance tier. Another program manager noted that the level of attic insulation required by the program ruled out many homes (e.g., due to space limitations), even though a lower level of insulation would be cost and energy efficient. (A program modification that alters this requirement has been filed and will go into effect during the next program year.) Several programs experimented with structures that provide increasing rebate levels for increasing performance. One manager commented that the program’s “laundry list” of measures was too extensive and felt that eliminating some items, thereby simplifying the list, would help simplify program participation and redirect funds to commonly implemented measures.
In summary, program incentive structures can be categorized in three main groups:
• Prescriptive. Fixed incentives are provided for specific measures installed
• Percentage of project cost. Incentives are offered based on the cost of the project
• Incentives based on forecasted savings. Incentives are calculated based on predicted energy savings.
4.2.3.1 Recommendations To drive deep energy savings:
• Tie incentives to realized energy savings, with higher financial incentives for greater savings.
• Follow a systemic, whole-home approach. Simply tying incentives to certain measures does not necessarily drive customers to choose greater savings.
4.2.4 Audit Approach and Safety Testing Most Midwestern whole-home programs require audits. Sometimes called evaluations or assessments, audits generally are the first step in a whole-home program, and are generally a required entry point for installing measures and collecting financial rewards and incentives. A well-designed audit process, conducted by a skilled auditor, can serve a valuable consumer education role, but it can also cost several hundred dollars and, in lieu of heavy subsidies, can be a barrier to customer participation. Furthermore, current program experience indicates that only about a third or less of audits lead to the installation of retrofits. Some program managers cite the audit process as the customer’s key motivator for carrying out retrofits. On the other hand, given the cost and time of comprehensive audits, a few managers are de-emphasizing assessments in favor of identifying prescriptive packages that achieve whole-home savings. Some programs offer different audit levels, from a quick and simple low-cost assessment to a comprehensive audit that usually runs three to four hours.

29
Program managers highly value safety training and certification of auditors. All programs conduct some level of safety training, and most require auditors to be certified by the BPI. In addition, audit procedures with rigorous evaluation and testing procedures are the norm in the programs reviewed. However, safety focuses on combustion appliance safety (carbon monoxide safety) and not safety associated with radon, and the possibility of increasing radon levels through reducing air infiltration. Managers recognize that BPI credentials and diagnostic testing is important to ensure safety and to avoid exacerbating existing conditions such as elevated carbon monoxide and creating unsafe post-retrofit conditions. Of all the programs examined, only one required radon testing, and in that case, three out of 81 homes investigated showed elevated radon levels after air sealing measures were implemented.
Finally, it is important to note that the audit tools generally overpredict savings. One program used the REM/Rate audit tool, and, based on preliminary end-use billing analysis, overpredicted savings by about double. Similarly, an evaluation of Wisconsin’s Focus on Energy HPwES program demonstrated that audits overpredicted savings significantly. There, years of overpredicted modeled savings led to a dramatic reduction in deemed savings for specific insulation measures (Schauer, 2010). The most significant reduction in savings was for sidewall insulation, where the revised natural gas savings were about half of the predicted value, and the revised electricity savings were 29% of the predicted amount.
4.2.4.1 Recommendations and Observations Audit Tools: Most audits cost several hundred dollars and overpredict savings. We recommend that program administrators validate savings with end-use billing analysis, and reduce savings estimates presented to customers and claimed program savings, if necessary. To reduce the cost and time of comprehensive audits, programs should consider developing a “prescriptive” set of measures for customers to select.
Safety Testing: Current Midwestern programs recognize the importance of BPI certification and practices to ensure that whole-home retrofits are not performed if there are preexisting, unsafe conditions, such as gas leaks or elevated carbon monoxide levels. Requiring BPI certification and diagnostic testing is sound, safe practice and should continue. Furthermore, program managers should carefully consider whether to require, or at least inform residents about, radon testing before incentivizing building envelope measure retrofits that reduce air infiltration, which may contribute to radon accumulation in the living space.
4.2.5 Program Diagnostics To Identify Energy Savings Opportunities Program diagnostics to identify energy savings opportunities, such as blower door tests, and infrared camera imaging, are common whole-home program features. The use of infrared camera imaging is increasing, and is likely to be an effective tool in educating customers simply and graphically about home air leakage. Some programs conduct one or more of these tests as part of the audit process, and some test after retrofit. Some programs require blower doors and/or infrared imaging for every house; others do it less frequently. Diagnostic tests are used for two main reasons: to educate customers about the leakiness which leads to energy (and money) loss and to evaluate whether air sealing contractors effectively reduced infiltration.
30
Because of a potential conflict of interest when the retrofit contractor also conducts blower door testing, one pilot program compared contractor-performed blower doors with test results from an independent contractor. In this pilot program, the Program Administrator reported to PARR in an interview that blower door tests were performed on all homes before and after retrofit by an independent contractor and by the retrofit contractor. In all cases, the retrofit contractor blower door results showed a significantly greater reduction in leakiness than did the independent contractor.
4.2.5.1 Recommendations Evaluate the use of preretrofit and postretrofit blower door testing to determine if it is essential for achieving effective air sealing. Testing is costly, and contractor-performed blower door results may not always be reliable. Programs should consider spot checking contractor results, and establishing consequences if contractors fail to accurately report blower door results on an ongoing basis.
4.2.6 Contractor Role There are two basic models for contractor participation in whole-home performance programs. In the general contractor model, contractors are chosen through a request for proposal process in which only select contractors can participate. Alternately, an open market approach can be used whereby any contractor can participate as long as they meet general program requirements.
Regardless of the approach, contractor development is consistently identified as a challenging, as well as an integral, component of whole-home program development. In the words of one manager, these programs are “building an industry from the ground up.” Contractor involvement in whole-home programs is absolutely essential to efficacy and success, but for many program managers, working directly with contractors is a new experience that has required tremendous learning. Some programs form close, collaborative relationships with contractors, and these programs require extensive training, approval and oversight in exchange for participation in the program. Some programs have a small number of contractors and large number of jobs, and some programs have an opposite setup, although in such cases typically not all enrolled contractors are actively involved in the program. Program managers encourage contractors to bring customers to the program, and the most successful contractors have taken an active role in developing business with customers and recruiting participants.
Only one of the programs negotiated costs directly with contractors in order to provide a set price to consumers; in all other cases, the market set the price for services, although the rebate levels and caps set by the utilities or other sponsoring organizations for the programs influence those prices.
There is no universal standard to which contractors or auditors are held in terms of certifications and qualifications, although contractor training is taken seriously by all program sponsors. Varying levels of training are required for participating contractors and, in all cases, requirements for basic good business practices, licenses, and other legal obligations must be followed. Table 5 summarizes the certification requirements for contractors. Without evaluation data, it is unclear whether these different requirements result in different program performance.

31
Quality assurance is being conducted in some programs but not all, and the form this takes varies, too. Some managers claim that every job is evaluated for quality; in some cases this happens through an inspection before homeowners are given rebates. Others check a certain portion of jobs performed by every contractor, conduct random inspections of some jobs, or initially evaluate a specified number of jobs and a random percentage after. The HPwES protocol requires an inspection process that includes a sampling rate set at a minimum of 5% (1 in every 20 jobs) for all participating contractors. Regardless of the approach, QA is a key measure that will ultimately drive customer satisfaction and, consequently, program growth and success.
Table 5. Contractor Training, Certification, and Other Requirements
Program Contractor Requirements
Energy Upgrade California PG&E
Basic upgrade package: contractors must attend a two-hour orientation about the program and a free, three-day building science
basic training about the building envelope elements. Advanced upgrade package: may have BPI accreditation, or at a minimum
employ staff that holds a BPI Building Analyst certification. Must attend a two-hour orientation on the program. Must have: a valid California contractor’s license appropriate to the scope of work,
appropriate bonding, completion of mandatory orientation session workshops, obtain insurance to utility minimums, a signed contractor participation agreement, and building permits on all work as required
by local jurisdiction requirements. Nicor’s Gas Energy Efficiency
Program Work must be supervised by staff members who are BPI certified in Building Envelope or otherwise approved by the program manager.
Ameren Illinois’ Act on Energy Work must be supervised by staff members who are BPI certified in Building Envelope or otherwise approved by the program manager.
Kentucky Home Performance BPI Building Analyst certification Consumers Energy HPwES BPI
Kansas City Area HPwES Supports BPI Building Analyst, Residential Energy Services Network rater, and MEC's own energy auditor standard
St. Louis HPwES BPI Combustion Standards, Building Analyst and Envelope Xcel Energy’s HPwES None
Columbia Gas of Ohio’s Home Performance Solutions BPI
AEP Ohio In-Home Energy Programs BPI
Dominion East Ohio’s HPwES BPI Focus on Energy HPwES
(Wisconsin) None
Chicagoland’s Natural Gas Savings Program BPI
4.2.6.1 Recommendations Compare the two contractor models to determine which approach produces higher quality, lower cost jobs for customers.

32
With respect to QA/QC of contractor performance, evaluate the HPwES protocol to determine whether it is sufficient to accurately assess contractor compliance with program standards.
In designing programs, program managers need to consider the following issues when establishing contractor requirements:
• Insurance
• Business license(s)
• Years in business
• Requisite certification (BPI minimum)
• Criteria for remaining in program (e.g., job quality, customer satisfaction, number of jobs performed each year).
4.2.7 Program Budget, Energy Savings, Participation, and Conversion Program budget, energy savings, participation levels, and conversion rates are the core metrics of whole-home programs. These metrics indicate, on the most basic level, the level of resources devoted to the whole-home energy performance program and the program results. Although these metrics are critical for meaningfully evaluating whole-home programs, comprehensive data are not available. Sections 3.2.2, 3.2.3, and 3.2.4 outline data that is available for these metrics. Below, the data are interpreted
Looking at program budget per participant, a wide range is found. Because budgets were not analyzed in sufficient detail to compare costs for marketing, education, audits, and retrofits, it is not possible to accurately determine a cost-per-job metric. However, general conclusions about the relationship between budget and customer involvement can be drawn. Some of the variance in participation and conversion rates could reasonably be attributed to budget variation, although it is not universally true that higher budgets result in higher numbers of customers getting audits and retrofits. Similarly, higher budgets are not universally correlated with higher conversion rates. Program longevity (documented in Section 3.2.1) appears to be influential, as longer-running programs report high participation numbers and conversion rates. Many program managers reported that external influences other than budgets have influenced program outcomes. For example, in the newest programs, customer education and awareness has consumed a lot of resources and time, and participation growth is slow. Conversely, long-running programs benefit from customer familiarity, referrals by word of mouth, and less need for marketing and education. The launch of recent programs coincided with a sharp economic downturn; some managers cited the economy as a possible cause of low participation or conversion rates. Although improving efficiency can save customers money, the initial outlay can be a barrier. Overall, devoting significant resources to programs appears to be important, but it cannot replace time in developing the market for whole-home retrofits.

33
Table 6. Program Budgets and Participation
Budget Participation $/Participant
~$100,000 ~1,500 jobs (which includes both audits and retrofits) (2010, predict same for 2011) NA
$398K (2010); $750K for 2011 83 jobs (2010); estimate 200 jobs in 2011
$4,795/job (2010) $3,750/job (2011)
~$1M (1st yr) 1,373 audits; 413 retrofits $728/audit or $2,421/retrofit
$2M (2010); $2.5M (2011);
$7M (2012)
Audit/projects: 2,987/68 (2010) 2,210/336 (2011)
$1,131/audit or $7,440/job (2011)
$2.2M (2010) 3,396 assessments; 2,224 post-tests (2010) $648/assessment or
$989/post-test conducted
$2.9M (2011) 3,500 assessments; 340 audits; 2,991 rebates $828/assessment ~$17M (2009-
2011); ~$5.7M/yr
~11,700 audits (2009-2011) $487/audit
$6.2M (3 yr); $2.06M/yr 969 (1 yr) $2,125/participant
$9.8M (a)3,600 surveys; (b)1,100 CHAs; (c) 640 jobs a) $2,722/survey or b) $8,909/CHA or
c) $15,312/job ~$10M (2011) 1,300 retrofits $7,690/retrofit
When comparing program budgets to realized energy savings, there are again significant limitations to the analysis, as budgets were not parsed by line item. Furthermore, not all programs report energy savings yet, and those that do rely on modeled estimates. Within those analytical constraints, however, several observations can be made. The cost per kWh saved ranges from $0.27 to $1.83, which is a much narrower range than the cost per therm of natural gas saved, which ranges from $0.50 to $31.81. Again, the lowest costs seen per unit of energy saved are found in longer running programs. This could be due to the large costs involved in starting a program and developing the market and the contractor network to support it. One pilot program with a prescriptive approach showed low costs for gas savings, which could be attributed to the prescriptive nature of the program. By eliminating customer choice, a program can, ideally, identify and implement only the highest savings measures.

34
Table 7. Program Budgets and Energy Savings
Budget Program Savings in First Year $/kWh saved
$/therm saved
~$1M (1st yr) 159,334 therms Not Available $6.28
$2M (2010); $2.5M (2011);
$7M (2012)
1,094.8 MWh (electric only - 2010) $1.83 NA
$6.2M (3 yr) $2.06M/yr
From 7/1/10-11/1/11: 29% (987.4 MWh;
6.56 × 106 ft3/67,371 therms $1.51 $22.26
$2.2M (2010) 1,021 MWh; 620,555 therms (2010) $1.07 $1.77
$2.9M (2011) 4,429 MWh $0.65 NA
~$17M (2009-2011) 215 × 106 ft3 (since start)/ 2.21 × 10⁶ therms NA $7.70
$9.8M Estimating ~30,000 × 103 ft3, not final/308,100 therms NA $31.81
~$10M (2011) 30% (kWh/therm #s coming later in year) NA NA
Conversion rates are closely tracked in some programs and not followed in others. Definitions are not entirely consistent even across programs that monitor this measure, as it depends on how customers move from one stage of a program to the next, and how many stages are involved. For example, one program has two different audit/assessment levels and an implementation component. Another challenge to monitoring conversion rates is how implementation is tracked. Some programs count the number of rebates issued, which may be on a per-measure basis. Others with more prescriptive structures, in which a defined array of measures are specified, count completion of these measures, or a set package of measures. Thus, a program that tracks individual retrofit measures separately (measures which correspond to a single audit) may yield an artificially high conversion rate.
Energy savings estimates at tend to be derived from broad-based goals from state programs, or from measure-specific databases. These modeled savings provide a starting point but can, in some cases, deviate considerably from actual savings. An accurate assessment of energy savings is essential to a substantive evaluation of a whole-home performance program, but many programs do not have the data to make this assessment. Several utilities discussed their intent to conduct end-use billing analysis at some point, but only two (Chicagoland and Columbia Gas) had initiated this process. As discussed earlier, modeled energy savings sometimes had to be modified extensively, as original estimates were significantly higher than demonstrated savings

35
(see Review of Historic Energy Savings from the Home Performance with ENERGY STAR Program, September 23, 2010).
4.2.7.1 Recommendations Deemed savings and savings from on-site audits need to be validated using end-use billing analysis. While only two programs currently employ this method for verifying savings, the following utilities or programs have expressed interest: PG&E, Consumers Energy, Xcel, Nicor, Kentucky Home Performance, and Kansas City HPwES.
Program costs per participant of energy savings vary widely. Furthermore, budget information applies to different program activities (e.g., audit, survey, retrofit, etc.), and sometimes applies to both gas and electric energy savings, so it is difficult with the current level of data to draw meaningful conclusions. There remains a need to evaluate what budget amounts lead to maximum participation and maximum energy savings.
4.2.8 Customer Satisfaction Customer satisfaction is highly valued but not consistently or systematically measured. The majority of programs have carried out some type of customer satisfaction surveys using phone surveys, survey cards, and direct inspections. These surveys have reached varying percentages of the customer population. From a participation and customer relations perspective, customer satisfaction is a key component of a successful program, just as it is to any successful business. Anecdotally, customer satisfaction with existing whole-home programs is high. Several managers claimed that complaints or dissatisfaction had been minimal. Others noted that those who had been served by the program were happy, but those who were still on a waiting list were less satisfied. Some program managers have begun conducting customer surveys to assess satisfaction and, in some cases, to better understand customer motivation for involvement. A few programs required a customer sign off on work completed, and this is cited as a surrogate for customer satisfaction. Recommendations
Systematic customer surveys should be conducted and results analyzed for improving program design.
4.2.9 Program Evaluation To date, there has been little systematic quantitative program evaluation. Yet, evaluation is important for assessing program effectiveness, both in terms of cost effectiveness and energy savings. A few programs have been established sufficiently long to have EM&V reports (see Appendix E for a summary), but many have not. Where such evaluation has occurred, the programs have been found to be cost effective.
4.2.9.1 Recommendations Comprehensive, third-party evaluation reports should be developed and made publicly available for all programs
4.2.10 Common Metrics As noted earlier, Midwest whole-home programs are emerging and not yet well established. This constitutes an opportunity as well as a challenge. Researchers can work with these programs to

36
establish common tracking metrics and data collection requirements in order to better understand and compare programs.
4.2.10.1 Recommendations Program managers should consider establishing metrics for the following program elements and cooperate to track these data and program metrics:
• Program savings (kW, kWh, therms); per home savings (kW, kWh, therms); and per home savings reduction (percent of home energy use reduction)
• Program cost effectiveness from a societal (total resource cost test) and utility (utility cost test or program administrator cost test) cost-effectiveness perspective
• Program conversion rates (number of audits that lead to retrofits)
• Customer satisfaction
• Program participation (audits, retrofits)
• Program budget (overall program cost; cost per participant).

37
5 Conclusions
In general, this study has revealed great variation in the design elements and protocols followed by whole-home programs in the Midwest, making comparisons difficult. Furthermore, 10 of the 14 programs reviewed have been in existence for three years or less, and arguably have not matured into fully functional, smoothly running programs. This further makes it difficult to assess performance and to draw conclusions about best practices for the Midwest’s whole-home programs. However, this research is unique in its effort to extract key baseline data for Midwestern whole-home programs, to identify guidelines for effective program development, and to determine critical research needs before expansion of programs is undertaken. Results are summarized in the following sections.
5.1 Program Design Lessons Learned The recommendations developed throughout this report illustrate the primary lessons learned about whole-home energy performance programs during this research project. These are summarized as follows:
Initially, programs should target the following customers:
• Homeowners with high energy usage
• Older homes, which may have been constructed before updates in energy codes and may also be due for updates and improvements
• Homeowners with high disposable income
• High income areas and neighborhoods
• Densely populated areas with some of the above characteristics
• Areas where skilled contractors are available.
In the area of incentives:
• Incentives should be tied to energy savings, with higher financial incentives for greater savings, in order to reinforce, for customers, the systemic, whole-home approach.
• In the area of metrics:
Programs should consider establishing metrics for the following program elements: a) Program savings (kW, kWh, therms), per home savings (kW, kWh, therms), per home savings reduction (percent of home energy use reduction); b) Program cost-effectiveness from a societal (total resource cost test) and utility cost effectiveness (utility cost test or program administrator cost test); c) Program conversion rates (number of audits that lead to retrofits); d) Customer satisfaction; e) Program participation (audits, retrofits); and f) Program budget (overall program cost; cost per participant).

38
In the area of audits:
• Better validation of audit tools is essential, so that predicted savings correlate to real savings.
• Better understanding of the true value and purpose of audits is needed. Need to evaluate whether experienced contractors and effective program literature can identify the best energy savings opportunities for the contractor and educate the homeowner about energy savings approaches as effectively, and at a lower cost, than audits.
In the area of safety:
• Radon is an issue of concern in many areas of the Midwest; thus, radon must be appropriately addressed. Program administrators may wish to consider requiring preretrofit and postretrofit radon testing in conjunction with air sealing to confirm that radon levels are not elevated before or after air sealing. Air sealing should not be performed in homes with elevated radon until the high radon is mitigated. Once a home is air sealed, radon testing should be conducted to confirm that air sealing has not raised radon to unacceptable levels.
• Combustion safety testing must happen before and after retrofit to ensure customer safety.
In the area of implementation:
• The role of before- and after-retrofit blower door testing should be evaluated to determine whether it is essential in order to achieve effective air sealing. It is costly, and the significance of its role has not been established.
• The two contractor models need to be tested to determine which approach produces higher quality, lower cost jobs for customers. In the general contractor model, contractors are chosen through a request for proposal process in which only select contractors can participate. Alternately, an open market approach means any contractor can participate as long as they meet general program requirements.
In the area of contractor selection:
• Program managers need to evaluate whether the HPwES QA/QC protocol that requires inspecting a minimum of 5% of jobs for all participating contractors is sufficient to ensure savings
• Program managers need to consider the following issues when establishing contractor requirements: insurance; business license(s); years in business; requisite certification (BPI certified); requirements to remain in program (e.g., job quality, customer satisfaction, number of jobs performed/year)

39
In the area of validation:
• Deemed savings need to be validated using end-use billing analysis
• Need to evaluate what budget amounts lead to maximum energy savings and participation
• Systematic surveys of customers should be conducted and results analyzed for purposes of improving program design
• Comprehensive, third-party evaluation reports should be developed for all programs and made publicly available.
5.2 Areas for Further Study Further research is needed in order to understand actual, rather than just forecast, savings from whole-home programs, and whether moderate (15–30% savings per home) or deep (more than 30% savings) are cost-effective from a societal (total resource cost test) and utility (utility cost test or program administrator cost test) perspective. A key objective of whole-home programs is to drive deeper cost-effective energy savings. However, current research does not answer the question of whether whole-home programs are achieving moderate or deep savings, nor whether current savings are cost-effective. Before whole-home programs are scaled up in the cold climates, actual savings should be validated, and program cost-effectiveness using actual program costs and savings data determined.
The research team recommends further study of the following questions:
• What level of energy savings (program and per home) do programs achieve? Current energy savings claims in cold weather climates are based on audits, which significantly overpredict savings, or on engineering estimates. End-use billing analysis of actual savings should be conducted. Such analysis should become a required element of program evaluations.
• Which budget and program design elements are critical to energy savings, or provide other measureable program value? To increase program cost-effectiveness, a more detailed understanding of how much different program elements (such as audits and diagnostics tests such as blower door tests) cost and how much they contribute to energy savings is needed. Through this research effort, participants have expressed their interest in meeting and sharing information about their program design elements and costs.
• Are whole-home programs cost effective? The long term viability of whole-home programs depends on their cost effectiveness. Most whole-home programs are administered by utilities, and most utilities need to demonstrate cost-effectiveness at the program level to receive regulatory approval to offer programs. Program cost effectiveness using actual, rather than forecasted, program costs and savings needs to be completed.
Many program administrators who provided information for this study expressed interest in working further with PARR to help answer the research questions described above and to collaboratively develop best practices for cold weather climate whole-home programs. In

40
addition, several program administrators are willing to share customer data to allow PARR to conduct end-use billing analysis. Further study, as described above, will help determine whether and how cold weather climate whole-home programs can cost effectively achieve moderate and deep savings.

41
References Fuller, M.C., Kunkel, C., Zimring, M., Hoffman, I., Soroye, K.L., and Goldman, C. (2010). Driving Demand for Home Energy Improvements: Motivating residential customers to invest in comprehensive upgrades that eliminate energy waste, avoid high bills, and spur the economy. LBNL 3960E. Berkeley, California: Lawrence Berkeley National Laboratory. http://eetd.lbl.gov/ea/emp/reports/lbnl-3960e-web.pdf.
LeBaron, R. and Rinaldi, K.S. (2010). Residential Energy Efficiency Retrofit Programs in the U.S. Washington, D.C.: The National Home Performance Council. http://www.nhpci.org/images/NHPC_WHRetrofitReport_201012.pdf.
Schauer, L. (September 23, 2010) Review of Historic Energy Savings from the Home Performance with ENERGY STAR Program . Work performed by Tetra Tech for the Public Service Commission of Wisconsin. http://www.focusonenergy.com/files/Document_Management_System/Evaluation/reviewofhistoricenergysavingsfromhpwes_evaluationreport.pdf

42
Bibliography Chen, H. (2010). Green and Healthy Jobs, Silver Spring, Maryland: The Center for Construction Research and Training, http://www.cpwr.com/pdfs/Green-Healthy%20Jobs%20fnl%20for%20posting.pdf.
Conservation Services Group (December 15, 2010). Contractors as Allies in Home Performance Programs, Webinar delivered by Regulatory Assistance Project online on December 15, 2010.. http%3A%2F%2Fwww.raponline.org%2Fdocs%2FRAP_Dyen_WholeHouseRetrofitWebinar_ContractorsAsAllies_2010_12_15.pdf&ei=LO0WUKy8G5GZqQHP34HABg&usg=AFQjCNE7Yt9HXWajPUyDSkao8VLT8Pc9Hw
Goldstein, B. (2010). Workforce Guidelines for Home Energy Upgrades, Washington, D.C.: U.S. Department of Energy. http://apps1.eere.energy.gov/buildings/publications/pdfs/building_america/ns/eemtg032011_plenary5_workforce_guidelines.pdf (draft).
Lee, D.(September 2010) Delivering Whole House Solutions—Federal Efforts, Presented at the Consortium for Energy Efficiency (CEE) Industry Partners Meeting, September 15-17, 2010.http://www.cee1.org/cee/mtg/09-10mtg/Presentations/ThuGen_Delivering_Lee.pdf
Redman, E. (2010). The Home Performance Industry Perspective on Training and Workforce Development, Washington, D.C.: Home Performance Resource Center. http://www.sbnphiladelphia.org/images/uploads/green_jobs_in_the_residential_energy_efficiency_industry.pdf
White, S., Dresser, L. and Rogers, J. (2010). Greener Skills: How Credentials Create Value in the Clean Energy Economy, Madison, Wisconsin: Center on Wisconsin Strategy. http://www.cows.org/pdf/rp-greenerskills.pdf.

43
Appendix A. Web Research Questions Internet research on whole-home energy efficiency programs was conducted to gather information on the following topics:
• What type of organization is the main sponsor? • Program name • Program sponsor – name and principal contact information (address, phone, email,
website) • Program implementer – name and principal contact information (address, phone, email,
website) • Program territory • Customer eligibility requirements • Target audience • Income qualifier? • Eligible measures: prescriptive? performance? • Incentive levels • Program labeling • Program standards • What components are required? (walk through audit/ diagnostic/ combustion safety/
radon testing) • Contractor eligibility requirements. How are contractors selected to participate in the
program? • Energy auditor requirements • Standard retrofit pricing • Quality assurance • Complaint resolution • Financing • Contractor participation agreement • Is there a publicly available EM&V report?

44
Appendix B. Survey Monkey Questions The research team conducted a survey of program contacts using surveymonkey.com. The survey included the following questions:
Your name
Your program name
When did your program begin?
What are your participation goals?
What is your program's overall annual budget (in each of the past three years)?
What kind of participation rate are you realizing in your territory, by year for the past three years?
How is participation incentivized?
Does the program have specific energy savings goals? If so, what are they? Please list for the last three years.
How many contractors are enrolled in your program? Of these, how many actively participate? Again, if possible, please list for the last three years.
What type of audit is required or provided through your program? Who performs this audit?
How does your program conduct quality assurance?
What is the conversion rate between audit and retrofit work, for each of the past three years? How do you define conversion rate?
Does your program have publicly available evaluation reports? If so, please provide a link to evaluations.
How satisfied are customers with your program? How do you measure this?
What are your two most significant program challenges?
Do you coordinate or co-deliver the program with any other utilities or other organizations? Please provide a brief description.

45
Appendix C. Deep Dive Questions For individual phone interviews, program contacts were asked the questions listed below regarding their whole-home program. They were sent the questions before the actual interview time. In some cases, additional team members participated in the phone interviews.
1. Confirm information gathered to date, including:
• Start date of program
• Annual budget, savings, participation for past three years, if exists
• Program metrics, particularly customer satisfaction
2. Policy Framework
• Is there a regulatory directive that encourages comprehensive upgrades?
• Was the program design filed?
• Please provide copy of regulatory filing
3. Program Process
• What audit tool is used?
• Pre and post diagnostics performed? (CAZ, infrared, blower door – percentage of homes tested)
• Does program test for radon?
• Required trade ally training, qualifications
• Work Orders
• Who develops? Auditor, contractor?
• How detailed?
• A few samples
• Do you have written program policy and procedures manuals?
4. Customer Targeting
• Is the program targeted to certain customers or geographic areas?

46
• How were these targeting approaches determined?
• How were they marketed to?
5. Conversion rate
• How do define conversion rate?
• What is your program conversion rate?
• What do think causes customers to install measures after audits?
• What would you change about the program to get more participation?
6. Program Pricing
• Audit cost
• To customer
• To Program Administrator
• Installation cost
• To customer
• To Program Administrator
• How are prices set/established? (by market or by the program?)
7. Expected savings by measure and home
• Forecasted measure level savings
• Per home savings
• How were the savings derived?
• Are expected savings documented in a Technical Reference Manual?
8. Measure Packages
• Who selects which measures get installed? Customer or program?
• What are most common measures installed?

47
• Do you have a recommended measure package? What is it?
9. Home Performance with ENERGY STAR Brand
• Is program branded with HPwES brand? If so, has this been useful?
• If not, why not?
10. Cost-Effectiveness
• Do you measure the program cost-effectiveness?
• Do you have a goal you need to meet?
• Is the program cost-effective?
11. EM&V Reports:
• Confirm EM&V done to date
• Target Date of next EM&V
• Do you have any plans to do end-use billing analysis?
• Would you be interested in PARR performing end-use billing analysis (confidential and at no cost to program, PARR would want to share aggregated results)
12. Open-Ended Questions
• Program successes
• Program challenge
13. Program Future
• Do you plan to continue/grow the program?
• What changes do you plan to make to the program?

48
Appendix D. Summary and Compilation of Deep Dive Interview Questions and Answers
Summary and Compilation of Deep Dive Interview Questions and Answers
1. Confirm information gathered to date, including:
• Start date of program - Programs surveyed started at the times shown below:
Year No. of Programs
2001 1
2003 2
2007 1
2009 3
2010 6
2011 1
OR:
10/2001
2003
2003
2007
1/2009
9/2009
2009
1/2010

49
5/2010
Mid 2010
8/2010
10/2010
12/2010
1/2011
• Annual budget – Budgets varied considerably, as shown in this list:
~$100,000 (variable)
$398,000(2010); $750,000 (2011)
Variable, now close to $1M
~$1M
$2M (2010); $2.5M (2011); $7M (2012)
$2.2M
$6.2M over 3 years
$2.9M
~$17M (from 2009-2011)
$9.8M
~$10M
• Participation – This can be defined as taking part in an audit or assessment, or having retrofits done.

50
Audits Retrofits
NA 81
NA 83 (2010)
200 (2011)
2987 (2010)
2210 (2011)
68 (2010)
336 (2011)
1373 413
1100 640
NA 969
NA 1,300
NA 1,500
3396 2,224
3500 assessments/ 340 audits 2,991 (rebates)
~11,700 (2009-2011)
• Energy Savings – Where available, energy savings from different whole-home programs are as shown.
Savings
kWh Therms
30% 30%
159,334
1,094,747
3,371

51
987,400 (7/1/10-11/1/11) 67,371
308,100
1,800,000
1,000,000
2,208,050
4,429,000
1,021,239 620,555
• Customer Satisfaction – In general, customer satisfaction measurements have been variable. Because many programs are new, they do not yet have a formal assessment of customer satisfaction, but it is under development.
Approach No. of Programs
No customer satisfaction measures 4
Informal/anecdotal assessment 2
Survey under development 2
Formal survey (by phone, written, other) 5
2. Policy Framework
• Is there a regulatory directive that encourages comprehensive upgrades? In the Midwest programs, there are no regulatory directives that encourage comprehensive whole-home upgrades. PG&E is subject to a regulatory directive encouraging comprehensive upgrades.
• Was the program design filed? – Of nine program managers interviewed, five had filed program designs. Programs managed by nonprofits were not required to file program designs with public utility commissions, and some programs that had conducted only preliminary pilots also did not file program designs.
3. Program Process

52
• What audit tool is used? In the Midwest, the following audit tools were identified as being used:
• TREAT, REM/Rate, Beacon, Green Energy Compass, contractors’ proprietary audit tool, in one case, in-house basic software tool is used.
• Pre and post diagnostics performed? (CAZ, infrared, blower door – percentage of homes tested) – All program managers interviewed said they perform pre and post diagnostics on every home retrofitted. All of these programs conducted blower door testing. Four conduct infrared testing and combustion safety testing also; one program said they sometimes use infrared testing.
• Does program test for radon? – Only one program out of the 15 researched tested for radon.
• Required trade ally training, qualifications – Required training and certification varies for different programs and are presented in detail in Table 2 of this report. In addition to particular certification programs, contractors are required to meet state professional licensing, insurance and bonding requirements, and several programs have specific additional training for their contractors. Certification requirements are summarized as follows:
Required Certification # of Programs
BPI (Building Envelope, Building Analyst; at minimum, must be supervised by staff with this certification)
10
Residential Energy Services Network 2
• Work Orders
Several different approaches are taken for developing. Four programs stated that auditors develop work orders that customers can take to a contractor; three programs described a program where either an auditor or a contractor is responsible for developing work orders, and one program specified that this is contractor developed. In some cases, the audit process provides a general idea of work that can be done, in other cases, the audit provides very detailed and specific recommendations to be followed up by a contractor agreement.
• Do you have written program policy and procedures manuals? - Seven of the managers interviewed stated that their programs had specific policy and procedures manuals or other written agreements that contractors must adhere to.
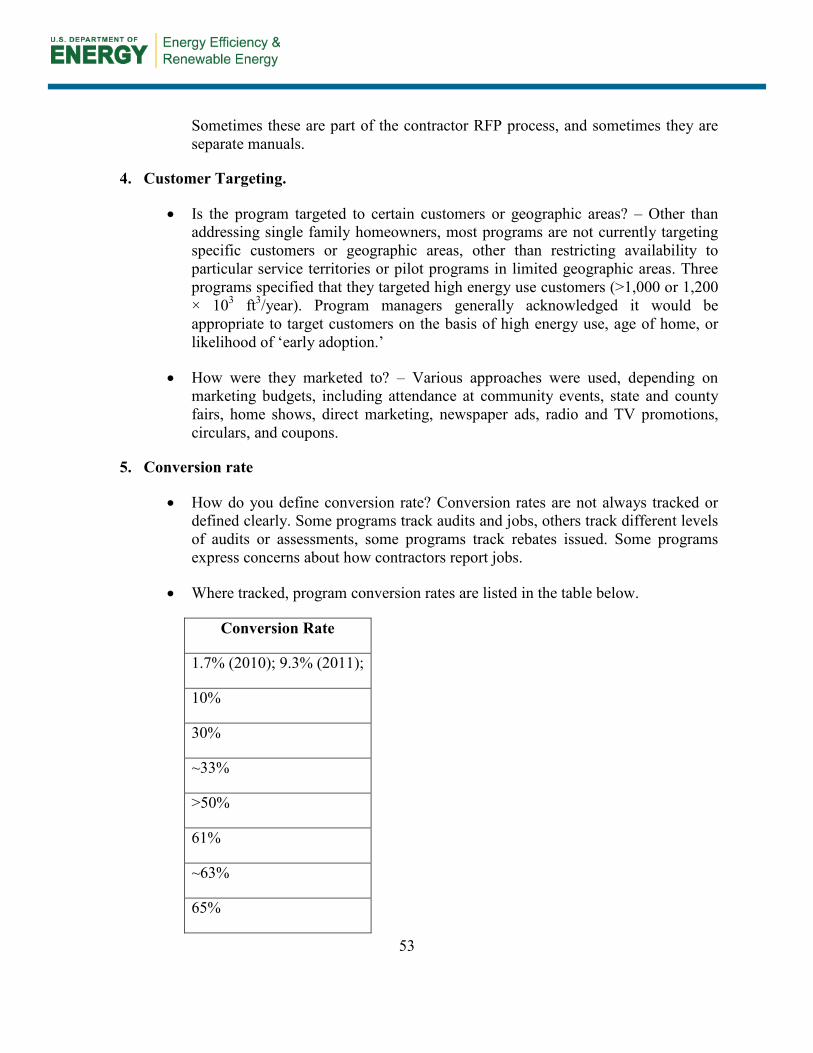
53
Sometimes these are part of the contractor RFP process, and sometimes they are separate manuals.
4. Customer Targeting.
• Is the program targeted to certain customers or geographic areas? – Other than addressing single family homeowners, most programs are not currently targeting specific customers or geographic areas, other than restricting availability to particular service territories or pilot programs in limited geographic areas. Three programs specified that they targeted high energy use customers (>1,000 or 1,200 × 103 ft3/year). Program managers generally acknowledged it would be appropriate to target customers on the basis of high energy use, age of home, or likelihood of ‘early adoption.’
• How were they marketed to? – Various approaches were used, depending on marketing budgets, including attendance at community events, state and county fairs, home shows, direct marketing, newspaper ads, radio and TV promotions, circulars, and coupons.
5. Conversion rate
• How do you define conversion rate? Conversion rates are not always tracked or defined clearly. Some programs track audits and jobs, others track different levels of audits or assessments, some programs track rebates issued. Some programs express concerns about how contractors report jobs.
• Where tracked, program conversion rates are listed in the table below.
Conversion Rate
1.7% (2010); 9.3% (2011);
10%
30%
~33%
>50%
61%
~63%
65%

54
• What do think causes customers to install measures after audits? – Program managers cited a variety of factors that persuaded customers to install measures. These are rebates, energy savings, environmental benefit, home comfort. Many believe that financial incentives are the most powerful motivator.
• What would you change about the program to get more participation? – Several answers were provided to this question, including lowering the complexity of the rebate system and adding more financial incentives. Several did not see any need for change, and thought the program only needed more time to be effective.
6. Program Pricing
• Audit cost – Audit fees for customers vary by program, ranging from $25–$99 when fees are paid directly to the program. When comprehensive audits are set at market rates, they range more broadly from $100–$500. Several managers commented that the rates charged are influenced by the rebate amounts available for audits in a given program. Costs to program administrators depend on the rebate offered, if any, and were not always shared with the research team. Audit rebates available are listed in Table 1.
• Installation cost – Except in one case where prices are negotiated with contractors in advance, the installation cost is contractor dependent. The cost to customers and Program Administrators of installing measures is rebate and measure dependent. A detailed list of financial incentives provided by programs is in Table 1. These financial incentives offset costs for customers and increase costs for the program.
• How are prices set/established? (By market or by the program?) – Prices are almost exclusively set by the market. Only one manager surveyed oversaw a program where prices had been negotiated in advance with contractors. While installation costs are set by the market, several program managers pointed out that available rebates help drive those prices.
7. Expected savings by measure and home
• Forecasted measure level savings – Various software programs were cited as the source for forecasted measure level savings, such as REM/Rate, proprietary models from vendors (e.g. Conservation Services Group, ClearResults), EnergyPro, Compass.
• Per home savings –In one case, the program aims for 300 therms/home energy savings, and in another, the goal was 28 × 103 ft3/home, but they’ve seen actual

55
values range from 19 to 31 × 103 ft3/home, averaging ~25 × 103 ft3. Otherwise, savings are estimated on a per measure basis.
• How were the savings derived? – Savings are derived from modeling software used in audit process as noted above.
• Are expected savings documented in a Technical Reference Manual (TRM)? – Some program managers noted that expected savings are derived or checked against different state databases where available, such as the Ohio TRM or the Michigan MEMV, a Michigan database that estimates savings measure by measure. Programs not in Ohio or Michigan did not reference a TRM.
8. Measure Packages
• Who selects which measures get installed? Customer or program? Where programs have a prescriptive element, this constitutes the recommended measures. Otherwise, it is at the customer’s discretion. Of the programs researched in this study, six had certain required measures, or required customers to choose several from a restricted list. The remaining programs allowed customers complete free choice of measures to install.
• What are most common measures installed? Program managers cited the following measures as most frequently installed under their programs.
• Direct install measures, where part of audit (e.g. CFLs, programmable thermostats, water heater insulation0
• Attic and wall insulation
• Air and duct sealing
• Windows
• HVAC systems
• Do you have a recommended measure package? What is it?- This is program dependent and described at length in program summaries in section 3.1 of this report. Where programs have a prescriptive element, this constitutes the recommended measures. Otherwise, it is at the customer’s discretion.
9. Home Performance with ENERGY STAR Brand
• Is program branded with HPwES brand?

56
HPwES Program NOT HPwES
7 8
• Of the HPwES programs, only one program manager did not believe that the branding was useful, as financial incentives were the primary motivator to customers. Others felt the branding was useful once customers understood what it meant, because of the national recognition and credibility it provided. One manager stated that it would be more useful if it specified clearer metrics for participation.
• Two of the program managers associated with non-HPwES programs specified that they were working toward the goal of becoming affiliated with the program.
10. Cost Effectiveness
• Do you measure the program cost-effectiveness?- Most programs had not yet analyzed cost-effectiveness, and some are not required to measure. Responses are shown below:
Cost Effectiveness Measure # of Programs
0.2 – Portfolio required to meet, not program 1
Benefit-to-cost ratio is 1.4 1
Not measured yet; Total resource cost (TRC) must = 1.0 1
Not available 4
6:1 leverage 1
Not measured 1
Not cost effective yet, no exact numbers 2
Currently evaluating. 1
Measured for whole portfolio only, but cost-effective 1
11. EM&V Reports:

57
• Confirm EM&V done to date – Only three of the programs researched had completed any form of EM&V report to date. Firm dates for reports from other programs are not available.
• Do you have any plans to do end-use billing analysis? – One utility is currently conducting such billing analysis. Four others said they would be likely to at some point.
• Would you be interested in PARR performing end-use billing analysis (confidential and at no cost to program, PARR would want to share aggregated results). Six program managers indicated interest in discussing this further.
12. Open-Ended Questions
• Program successes – A variety of successes and challenges were cited by program managers, as follows;
• Developing good relationships with contractors
• Job creation
• High customer satisfaction
• High energy savings
• Direct install measures very effective
• Collaboration with utilities, contractors, other entities
• Program challenges –
• Building contractor capacity, support and willingness to participate in the program
• Launching a ‘new industry’
• Developing customer demand
• Maintaining quality of contractor work
• Developing contractor network
• Educating customers
• Data tracking

58
• Maintaining sufficient funding to keep providing rebates
• Effective goal-setting
• Data tracking has been hard, behind on projected goals; competing with low cost audits from other utilities difficult
13. Program Future
• Do you plan to continue/grow the program? - All program managers interviewed intended to continue their programs, although some were concerned about how to sustain funding for the program.
• What changes do you plan to make to the program? – In general, program managers indicated satisfaction with their programs. All managers acknowledged that there is a learning process involved, and they expected their programs would continue to evolve to reflect this. One program manager cited specific requests for changes to the program that had been filed with the utility commission in order to improve the reach of the program. Others expressed the view that time was the primary component needed in order for their programs to become more effective and that comprehensive home retrofit programs take a sustained multiyear funding commitment to mature and become successful.

59
Appendix E. Summary of Evaluation, Measurement, and Verification Reports
Evaluation, Measurement and Verification (EM&V) Reports for Midwestern Utilities’ Whole-Home Performance Programs
Summary of Reports by State
Updated September 19, 2011
Wisconsin – Focus on Energy
Report(s) Referenced and/or Reviewed
• Goldberg, M. et al. (November 24, 2009) Focus on Energy Evaluation – Benefit-Cost Analysis – CY09 Evaluation Report. Work performed by PA Consulting Group for the Public Service Commission of Wisconsin. http://www.focusonenergy.com/files/Document_Management_System/Evaluation/bcanalysiscy09_evaluationreport.pdf
• Schauer, L. (February 4, 2010) Home Performance with ENERGY STAR Participant Survey Analysis and Recommended Supply-side Research Approach. Work performed by PA Consulting Group for the Public Service Commission of Wisconsin. http://www.focusonenergy.com/files/Document_Management_System/Evaluation/hpwespartsurveyanalysisandrecommendedsupplysideresearchapproach_evaluationreport.pdf
• Schauer, L. (April 16, 2010) Home Performance with ENERGY STAR Insulation Supply-side Study Results and Integration with Participant Findings. Work performed by PA Consulting Group for the Public Service Commission of Wisconsin. http://www.focusonenergy.com/files/Document_Management_System/Evaluation/hpwessupplysideandcustomerintegrationreport_evaluationreport.pdf
• Schauer, L. (September 23, 2010) Review of Historic Energy Savings from the Home Performance with ENERGY STAR Program . Work performed by Tetra Tech for the Public Service Commission of Wisconsin. http://www.focusonenergy.com/files/Document_Management_System/Evaluation/reviewofhistoricenergysavingsfromhpwes_evaluationreport.pdf
• Schauer, L. et al. (April 10, 2011) Focus on Energy Evaluation – Annual Report 2010. Work performed by Tetra Tech for the Public Service Commission of Wisconsin.

60
http://www.focusonenergy.com/files/Document_Management_System/Evaluation/annualreport2010_evaluationreport.pdf
• Talerico, T. and Winch, R (October 8, 2007). Home Performance with Energy Star Program Net Analysis. Work performed by Glacier Consulting Group for the Public Service Commission of Wisconsin.
Program Description
Wisconsin’s Focus on Energy has included the centerpiece Home Performance with Energy Star program since Focus on Energy’s beginning in 2001. This program originally included building shell (‘envelope’) measures, as well as HVAC and water heating measures. However, in 2007, heating and cooling measures were pulled off into a separate Efficient Heating and Cooling Initiative (EHCI), and the focus of HPwES turned to insulation, air sealing, and other building shell approaches. For purposes of analyzing performance, Focus on Energy specified a calendar year rather than a program period as the valid period, and also specified that whole home would be defined to exclude participants who only implemented HVAC measures, and would also exclude measures that did not include a pre- or post-assessment or rating. Many of the evaluation reports available focus on the entire portfolio of residential and business programs offered by Focus on Energy. Thus, extracting the specific information about HPwES in order to evaluate that program from these reports is sometimes difficult. However, certain data and conclusions are available, as described below.
Program Impact
Cost effectiveness – Both simple and expanded tests of cost-effectiveness were used. Simple test is comparable to total resource cost or societal cost tests used in other states. Benefits are avoided costs of documented direct energy savings and market effects savings. Costs are program spending (excluding incentive payments), and customer incremental costs. Expanded test includes non-energy societal benefits.
Overall b/c ratio for simple test for the HPwES program is 1.4 with net benefits of $37.5M. For the expanded test, the projected net present value of 10 yr of residential program operations over a 25-yr horizon is a net benefit of $795M, with a benefit to cost ratio of 2.4. (Goldberg et al 2009)
As with other residential programs in Focus, documented energy savings (on the benefit side), and participant incremental costs (on the cost side) dominate the b/c ratio for HPwES. The evaluation report evaluates the program annually and compares costs and benefits in FY2002 compared to FY 2011. Total program costs (includes program costs and incremental costs are $6.8M in FY02 compared to total benefits (documented energy savings in the comparison periods) of $0.6M, and in FY11, total costs are $4.1M, with total benefits rising to $7.9M. (Goldberg et al 2009)

61
Energy Impacts – A review report (Schauer September 2010) evaluates energy savings trends for the HPwES program from 2001–2009. As shown in the chart below, average therms savings values per participant increased from 2001 through 2005, then decreased through 2009. The average kWh savings per participant peaked in 2002 and decreased thereafter. This results from a recommended reduction in the deemed savings for insulation measures that was applied in FY2005 and forward. A sampling of these changes is shown in the second table below. (Schauer September 2010) In some cases these reductions were quite significant and resulted in substantial changes in savings for individual measures. (Schauer September 2010)
HPwES Participant Count and Energy Savings
Year Participants kWh Saved (Total)
kWh Saved (per participant)
Therms Saved (Total)
Therms Saved (per participant)
2001 39 36,112 926 13,386 343
2002 188 215,579 1147 81,105 431
2003 633 678,376 1072 305,157 482
2004 955 934,577 979 444,292 465
2005 769 776,221 1009 389,109 506
2006 1017 750,197 738 462,319 455
2007 861 354,890 412 265,839 309
2008 981 441,635 450 308,797 315
2009 1,843 809,112 439 588,188 319
Changes in Deemed Energy Savings for Insulation Measures (4)
Measure Previous Therms
Revised Therms
Previous kWh
Revised kWh
Attic Insulation 121 100 328 160
Sidewall insulation 411 225 1,113 326

62
Floor Insulation 96 79 259 126
Sill Box Insulation 48 39 110 53
Interior Foundation Insulation 257 140 590 172
Exterior Foundation Insulation 89 49 204 59
In this review memo, measures are tracked individually and reported in a chart that documents “Verified Gross” energy savings in kWh, kW, and therms. Building shell measures comprise the majority of energy savings, ranging from 63.8% of kWh savings, to 75% of therms savings, to 88% of kW savings. Specifically, nearly all kWh savings result from insulation up through 2007, when water heating measures begin to increase. Nearly one quarter of therms savings claimed by the program result from air sealing measures.
More recently, the Focus on Energy 2010 Annual Report reviews overall savings in its various residential and business programs. For calendar year 2010, HPwES exceeded its overall program net savings targets in kWh, kW, and therms saved. However, a detailed, program-specific analysis was not conducted, and the report (Schauer et al 2011) does not specify per home savings or number of participants. Specifically, these savings were as follows:
kWh kW Therms
Net Savings Target
Net Savings Achieved
% of 2010 Target
Net Savings Target
Net Savings Achieved
% of 2010 Target
Net Savings Target
Net Savings Achieved
% of 2010 Target
654,000
1,021,239
156 240 410 171 396,000
620,555 157
Participation – Participation in the HPwES program has increased steadily since the program’s inception in 2001. In that first year, 39 participants were counted, rising to 1,017 in 2006 and 1843 in 2009 after a slight drop off in 2007 and 2008.
Net-to-gross – A significant amount of research has been conducted on the net-to-gross ratios for the Focus on Energy programs, especially programs like HPwES which rely on consultants and contractors to promote energy efficiency to households. An analysis prepared in 2007 (Talerico and Winch 2007) suggested a net-to-gross ratio of 62% for attic insulation and 50% for sidewall insulation. However, program implementers believe that in fact Focus on Energy had considerable influence, and further study was

63
conducted. A later report (Schauer April 2010) recommended that the net-to-gross ratios be adjusted to 65% and 73%, respectively, reflecting closer analysis of customer, consultant, and contractor behavior.

64
Process Observations/Findings
This is a long-running, successful program with high participation rates and good energy savings. However, the 2010 Evaluation report did not include process evaluation activities for the HPwES program in 2010. Program metrics were similarly not assessed in 2010.
Illinois - Ameren
Report(s) Referenced and/or Reviewed
• Cadmus Group, Inc (October 23, 2009) Residential Program Portfolio Program Year (PY) 1. Work performed by the Cadmus Group, Inc., for Ameren Utilities Illinois. http://ilsag.org/yahoo_site_admin/assets/docs/APPX_2_Cadmus_Residential_Portfolio_EMV_Final.6173513.pdf
• Huang, R. et al (November 2010). Home Energy Performance Electric Program Evaluation—PY2. Work performed by the Cadmus Group, Inc., for Ameren Utilities Illinois. http://ilsag.org/evaluation_documents
Program Description
The Home Energy Performance (HEP) program is a home diagnostic and improvement program offered to Ameren Illinois’ residential customers for a $25 fee. Conservation Services GroupEnergy Advisors conduct an HEP audit of participant homes, which includes installing instant savings measures such as compact fluorescent lights (CFLs) and domestic hot water measures (faucet aerators, low-flow showerheads, and water heater pipe insulation). Throughout the HEP audit, energy advisors educate the homeowner on savings possible through shell measures such as: air sealing and wall, attic, and duct sealing. Energy advisors also recommend HEP program allies (Ameren Illinois-approved insulation contractors) that offer incentives and can install shell measures.
Program Impact
Cost effectiveness – No cost effectiveness or benefit –cost analysis information was provided in the publicly available evaluation reports.
Energy Impacts – As described in the paragraph above, participation varies for different measures. Many participants install lighting measures, domestic hot water systems are moderately popular, and very few participants choose to install shell measures. For this reason, calculating per participant energy savings across all measures is not necessarily representative of the program’s results. The program evaluations instead look at total energy savings, and energy savings across particular measures.

65
Program Year 2 Gross Savings for HEP Electric Program
Measure
Annual Gross Savings
# Installed Realized per Unit (kWh)
Realized Total (kWh)
Realized Total (kW)
Faucet Aerators 180 30 5,400 0.67
Low-Flow Showerheads 460 240 110,400 13.75
Hot Water Pipe Insulation 226 51 11,526 1.44
Domestic Hot Water Subtotal at 356 Home with Electric
Water Heat 866 127,326 15.86
Air Sealing 5 2246 11,229 4.53
Ceiling Insulation (R-7 to R-38) 0 1640 - -
Ceiling Insulation (R-11 to R-38) 4 1021 4,084 1.65
R-11 Wall Insulation 2 6088 12,177 4.91
Shell Measure Subtotal at 6 Homes with Electric Heat 11 27,490 11.09
CFL 60w to 15w 14,591 38 554,458 31.05
CFL 75w to 20w 3,861 47 181,467 10.16
CFL 100w to 23w 3,091 66 204,006 11.42
Lighting Subtotal Installed at 2,782 Homes 21,543 939,931 52.64
Electric Program Total 22,420 1,094,747 79.59
Participation – Participation has increased substantially in the second year of the program, across all measures. In PY1, no shell measures were installed, despite a target of 135 insulation measures. This may have been due to the recession, insufficient incentives, and/or too few contractors certified by BPI. (1) In PY2, lighting measures were installed at 2,782 homes; domestic hot water systems were installed at 356 homes, and shell measures were installed in 6 homes. (A total of 68 homes had shell measures

66
installed, but the other homes heated with gas. Gas is covered in a separate report, which is not yet publicly available.)
PY1 Participants
PY2 Participants
Home Energy Audits in Total 769 2,987
Domestic Hot Water Measures Installed in Homes with Electric Water Heaters 283 866
Shell Measures Installed in Homes with Electric Heat 0 11
CFLs in Total 4,100 21,543
Net-to-gross – In PY 1, a net-to-gross ratio of 76% was assumed as the default; however, in PY2 a net-to-gross ratio of 69% (on average across measures) was calculated, based on a participant survey.
Process Observations/Findings
Most participants are satisfied with the program. However, the shell measure installation rate was only 1.2 percent in PY2 and, despite a target of 135 insulation measures, none were installed in PY1. Participants indicated the main reason they did not pursue recommended shell measures was the cost of the installation. Participants also mentioned that energy advisors often did not recommend any shell measures, as their homes already had good insulation. Over 30% of participants who installed insulation did so without an audit. One contributing factor may have been the presence of a federal tax credit. Program evaluators also observed that incentives need more explanation, as these were not well understood by participants, and invoices do not always clearly identify the measures installed. (Huang 2011)
Iowa – Black Hills
Report(s) Referenced and/or Reviewed
• Black Hills Energy. (May 2011) Natural Gas Energy Efficiency Programs Annual Report 2010. Prepared for the Iowa Utilities Board.
Program Description
Black Hills Energy (BHE) has a two-tiered residential audit program, with HPWES component being piloted in the community of Council Bluffs in 2010. Both audits provide customers with

67
recommendations about methods for reducing energy consumption in their homes. Audit recommendations may include:
• Suggested behavioral changes; • Suggestions about implementing low-cost, easy-to-install energy-saving equipment; and • Suggestions about repairing, upgrading, or replacing larger, relatively expensive
equipment or systems.
The HPwES audit is a more comprehensive audit than the traditional residential audit, with a test-in and test-out component. Each customer within the Council Bluffs area receives this more comprehensive audit, although to be considered a HPwES test-in participant, the customer must receive a blower door test in addition to the audit.
Free audit participants were offered outlet gaskets, faucet aerators, pipe insulation, low-flow showerheads, low-cost infiltration measures, and water heater blankets at no cost. On average, a participating customer receives about $30 worth of measures during the audit. In addition, BHE distributes a leave-behind packet, which includes information on available programs and incentives. BHE also conducts hundreds of follow-up phone calls to customers who have not completed recommendations following the audit.
Program Impact
Cost Effectiveness and Energy Impacts - The table below summarizes overall budget and energy impacts for the entire residential audit program. BHE covered the free audit’s entire cost as well as costs of low-cost measures distributed during the free audit (a total value equivalent to approximately $180 per home). For those opting for an HPwES audit, BHE provided a $200 reimbursement per participant upon successful completion of the test-out audit. This amount offset the participants’ required $100 during the test-in audit to cover blower-door test costs. The average cost for HPwES participants was estimated at $500.

68
Budget or Goal Actual Percent Budget or Goal Achieved
Participation 2,674 2,049 77%
Expenditures $416,345 $355,329 85%
Energy Target (103ft3) 11,984 4,200 35%
Demand Impacts (103ft3/day)
132 13 10%
Savings per participant were lower than the target, and this was believed to be due to the difference between assumed versus actual measures installed. Fewer participants received infiltration control measures than expected, and this lowered overall savings. Benefit/Cost ratios for the entire residential audit program were calculated to be: Societal Cost Test
0.95
Utility Cost Test 0.79
Ratepayer 0.42
Participant 702.58
Participation
In 2010, free audit participation was projected at 2,674 participants; actual participation was 2,049, including test-in audits conducted through the HPwES pilot. Only three customers received the test-out audit in 2010. Observations

69
BHE worked with Alliant Energy and MidAmerican Energy with the aim of ensuring uniform audit protocols. This small HPwES program only included three participants who fully participated, including the test-out audit; thus it is difficult to draw many conclusions from this limited information.
Iowa - Interstate Power and Light (Alliant Energy)
Report(s) Referenced and/or Reviewed
• Interstate Power and Light (Alliant) (May 2011) 2010 Annual Report of the Energy Efficiency Plan of Interstate Power and Light (Alliant). Prepared for the Iowa Utilities Board. http://alliantenergy.com/wcm/groups/wcm_internet/@int/documents/ document/029077.pdf
Program Description
Interstate Power and Light (IPL) began to offer the HPwES for existing homes in three pilot communities in 2010. This program’s principal objective is to encourage a more comprehensive, whole-house approach to improving energy efficiency and comfort in existing homes. The program’s design was guided by the principal objective of maximizing savings achievable from each participating home (on average, according to the Environmental Protection Agency, should be about 20%) instead of merely promoting individual energy efficiency measures and equipment. The following is an overview of the program design:
1. Customers enroll in the program and pay a $99 fee in order to cover a portion of the initial audit.
2. A third-party auditor performs a whole-house energy audit that includes a blower door test, thermography scan, and air flow and temperature evaluation along with free installed measures. The audit establishes current baseline of energy usage and identifies areas for improvement.
3. The customer selects at least three improvement measures from the list of recommendations to complete. The measures qualify for any existing rebates that would apply.
4. Once improvement measures are complete, the third-party auditor comes back to perform a post-completion audit. This audit will verify energy savings.
5. Following the post-completion audit, customers may receive an additional incentive if they achieve as least a 50% overall kWh and therm savings compared to the baseline audit.

70
In the spring of 2010, IPL launched its HPwES pilots in the communities of Lisbon, Mount Vernon, and Grinnell. All three of these communities are served by IPL for natural gas and electricity. This makes for a more comprehensive program for customers, since IPL can address both the heating and cooling side of customers’ energy needs.
Program Impact
The reports available did not separately document all the energy impacts and cost effectiveness information for the small pilot programs that constituted HPwES in its inaugural year, but it counts the launching of this program as a success, and overall, energy efficiency programs were deemed cost effective and exceeded program goals. The electric program benefit-cost ratio is 2.53 and the natural gas program ratio is 2.47, as measured by the societal test. The total plan (electric and natural gas) benefit-cost ratio is 2.53 and societal net benefits are $633M. However, the HPwES program is not cost effective in the pilot year.
Participation
Following the program rollout, 20 customers completed the test-in phase of the program; one customer followed the program through to the test out phase in 2010. Customers are actively engaged in the test-in process, at times even assisting with the data gathering and testing procedures. IPL offered multiple audit options for customers to choose from (online audits, HPwES, home energy audits, and the Home Energy Savers program), and implemented screening protocol to help ensure customers participate in the audit program best equipped to meet their needs.
Observations
The biggest challenge with IPL’s HPwES program is encouraging homeowners to follow through on recommended measures. Proactive phone calls reminding customers of findings and recommendations has resulted in limited success in the short term.

DOE/GO-102012-3522 ▪ November 2012 Printed with a renewable-source ink on paper containing at least 50% wastepaper, including 10% post-consumer waste.