m&v 2.0 and ommercial whole uilding programs the army we
TRANSCRIPT
2017 International Energy Program Evaluation Conference, Baltimore, MD
M&V 2.0 and Commercial Whole Building Programs The Army We Wish We Had
Paula Gruendling – California Public Utilities Commission Peter Jacobs – BuildingMetrics Inc
Amit Kanungo – DNV-GL Alex Wortman – Pacific Gas and Electric
David Jump – KW Engineering
ABSTRACT
In 2012, the California Public Utilities Commission (CPUC) stressed the need for its regulated utilities to focus on interventions that leveraged comprehensive building approaches to achieve deep energy savings in commercial buildings. In 2015, California passed Assembly Bill 802 (Williams) directing the CPUC and IOUs to develop programs based on all estimated energy savings and energy usage reductions, taking into consideration the overall reduction in normalized metered energy consumption (NMEC). Methods for quantifying whole building savings such as billing analysis and calibrated simulation have been available for quite some time. Lack of data and high cost have prevented widespread program deployment; however new tools and big data innovation have created new opportunities. The Commercial Whole Building Demonstration is a twelve building “proof of concept” designed to test quantification of gross savings from two International Performance Measurement & Verification Protocols (IPMVP) methods: Option C Whole Building and Option D Calibrated Simulation.
The objective of this paper is to present the findings and lessons learned from implementation to date and results from the first building to complete the post-reporting period. Ultimately, the study will inform a framework to leverage embedded M&V to ideally reduce time and cost of ex-post evaluation and to facilitate deployment of whole building approaches for commercial buildings. For now, this paper shares the considerations between the army we wish we had and what we have right now.
Introduction
Even though whole building evaluation methods have been around since the 1990s and California successfully finished rolling out its Advanced Metering Infrastructure (AMI) in 2012, regulated utilities have not widely leveraged these resources to innovate program design and implementation, nor have the evaluation methods been updated based on use of the time-granular energy use data AMI provides. (Kupser et al 2016) This is in part due to the established regulatory framework being more suitable for deemed/calculated programs and the observance of code or standard practice baseline and in part due to potential limitations or challenges for scaled deployment, especially in the less homogenous populations. (Franconi et al 2017)
Advancements in metering, data communications, and analysis methods have led to more widespread development of energy management and information systems (EMIS); which have focused mostly on quantifying operational savings. These systems provide multiple features, including providing building managers with rapid feedback on energy performance, benchmarking and comparison with similar buildings, and in some instances measurement and verification (M&V) of energy savings for projects installed within the building. (Kramer et. al. 2013) Some of these tools can automate the quantification of whole-building energy savings relative to a projected baseline based on historical performance adjusted by certain parameters such as weather conditions and operating schedule.

2017 International Energy Program Evaluation Conference, Baltimore, MD
(Granderson et al 2017) In 2015, the CPUC provided an interpretation of normalized metered energy consumption (NMEC) to guide overall program implementation.1
M&V based on time-granular data and advanced analytics is referred to as “M&V 2.0” by the industry, and may be fully or semi-automated. (Granderson et al 2017) In this paper, the use of time-granular energy use data and advanced energy modeling algorithms that produce savings based on NMEC will be referred to as M&V 2. 0. M&V 2.0’s potential benefits include improved accuracy of saving estimations, rapid feedback on building performance, and automation of analysis. These benefits are being considered by regulators to determine their proper role in ratepayer funded efficiency programs. (Franconi et al 2017)
This paper intends to present and discuss regulatory questions so that the dialogue regarding M&V 2.0 whole building approaches continues to move beyond the technical feasibility and into the consideration of an appropriate regulatory framework for scaled implementation. This paper is structured as follows: background, regulatory needs, main takeaways and next steps, and conclusions.
Background
In 2012, the California Public Utilities Commission (CPUC) stressed the need for its regulated utilities to focus on interventions that leveraged comprehensive building approaches to achieve deep energy savings in commercial buildings. (CPUC 2012) In 2015, California passed Assembly Bill 802 (Williams) directing the CPUC and IOUs to develop programs based on all estimated energy savings and energy usage reductions, taking into consideration the overall reduction in NMEC. The Commercial Whole Building Demonstration (CWBD) was conceived as a twelve building proof of concept designed to test the viability of a whole building approach to incentivizing deep energy savings from retrofit, operational and behavioral measures. (PG&E 2013; Carrillo 2016)2 The program design set a savings target of 15% of pre-retrofit consumption.
In 2015, the utility administering the CWBD, CPUC staff, evaluators and technical consultants (joint team) agreed to conduct a study (Study) based on four of the twelve participant buildings. This Study remains ongoing and results are expected in Q3 2017. From a regulatory standpoint, the main objectives of the Study were:
• Provide an opportunity for regulatory input on data collection and M&V approaches featured in the CWBD.
• Inform the development of rules and procedures to implement M&V 2.0 in whole building commercial programs.
• Establish the technical validity of pre/post analytics for measurement and verification.
• Compare the results from traditional building energy simulation models to the results from M&V 2.0 approaches.
• Critically assess the ability of the program to deliver deep energy savings. At the time of writing, one building in the Study had completed the post-reporting period with
complete savings calculation analysis. The joint team also performed partial savings analysis, data collection review and informal interview with participants from all four buildings in the Study. This paper
1In broad terms, NMEC is defined for the purposes of California programs as changes in consumption as measured by a device designed to quantify electricity and natural gas usage over time and adjusted by external factors that may influence energy use trends. (CPUC 2015) 2 The CWBD concept was proposed in the Pacific Gas and Electric 2013-2014 Energy Efficiency Commercial Program Implementation Plans, approved by CPUC Decision 12-11-015 (CPUC 2012). PG&E worked with CPUC staff in the development of the CWBD through a series of internal meetings between 2013 and 2015.
2017 International Energy Program Evaluation Conference, Baltimore, MD
is based on the work to date. A report containing all results of the Study will be released to the public at completion. The utility is also conducting an impact evaluability study on all the twelve buildings with input from CPUC staff.3
Commercial Whole Building Demonstration
CWBD participants were recruited based on their preferred building characteristics and willingness to participate. Participants should be interested in 15% or more energy savings and willing to document activities and provide updates to utility consultants. Additional eligibility requirements included availability of twelve months of stable historical energy use, steady-state operations, and facility area 30,000 sf or larger with tenant level utility interval meters. The CWBD also engaged two EMIS vendors with M&V 2.0 capabilities, as well as a consultant to run two public domain M&V 2.0 modeling methods. To assess the energy consumption prediction capabilities of these M&V 2.0 tools, the tools were pre-tested on a population of buildings. The intent of the test was to measure the predictive ability of each tool considered for the CWBD.4 Once this analysis was complete, the twelve enrolled project sites were also tested using the chosen tools.
The CWBD was designed to test quantification of gross savings from two International Performance Measurement & Verification Protocols (IPMVP) methods: Option C Whole Building and Option D Calibrated Simulation. Additionally, the joint team wanted to determine if the pre/post analysis based on NMEC could determine energy savings at the whole building level with a sufficient degree of accuracy and confidence.
Option C Whole Building. This method involves the use of utility meters, whole-facility meters, or submeters to assess the energy performance of a facility. It makes routine, or expected, adjustments to energy use based on parameters expected to influence use, such as ambient weather or production rate. It uses techniques such as simple comparison, regression analysis or more advanced methods to describe the relationship between energy use and its influencing parameters (EVO 2014). The CWBD used measured whole building energy use in short‐time intervals, such as 15‐minute, hourly, or daily, for a twelve month period along with measured influencing parameter data, such as weather, building schedule, or occupancy, to develop empirical models that describe how baseline energy use varies based on these parameters. The baseline is then projected into the future using the public or proprietary modeling algorithms to obtain the counterfactual ‘what baseline use would have been absent the efficiency measures.’ The post-implementation energy consumption is then subtracted from the counterfactual baseline to determine savings.
The advantages of the Option C approach are that it requires only a few streams of data to develop the models. These are the energy use and selected independent variables, usually weather and operating schedule depending on the selected model requirements and site-specific drivers of energy consumption5. Developing the baseline model and calculating savings is a straightforward process to implement given the appropriate M&V 2.0 tools. It applies only to buildings with predictable energy usage patterns. The method may be standardized and made transparent for all projects, which can reduce program administration costs and improve project throughput. When implemented with data from whole building
3Final Research Plan For Evaluability Review And Early M&V of The Pacific Gas And Electric Company Commercial Whole Building Demonstration, available at: https://pda.energydataweb.com/api/downloads/1784/CWB%20EE%20final%20research%20plan%202017-06-02.pdf 4 The CWBD implementers tested the suitability of the models following the methods developed in Price, et. al., 2013 5 Buildings that are process load dominant may also require production data as an independent variable.

2017 International Energy Program Evaluation Conference, Baltimore, MD
meters, this approach calculates the complete energy savings impacts from energy efficiency measures (EEMs) affecting equipment downstream of the meter, including interactive effects between equipment and systems.
The disadvantages of Option C are that it will not provide impacts for the individual EEMs or quantify code or standard practice baselines. Also, depending on the building performance, it will not be able to identify changes in consumption not related to the EEMs. The CWBD used two open source models, two proprietary models and one blend of all of the open source and proprietary models.6
Option D Calibrated Simulation involves the use of computer simulation software to predict
facility energy consumption pre and post implementation of EEMs. The simulation model must be calibrated to utility meter data so its prediction best matches actual metered data (EVO, 2014). Acceptable simulation software must be able to accurately model the energy flows in a building. At a minimum, it must be able to accept hourly weather data files including ambient weather conditions (dry-bulb, relative humidity, etc.) and solar parameters. It must be able to reasonably model the building geometry, shading, equipment specifications and envelope characteristics, floor plans, and zoning. It must conduct the simulation on an hourly or sub hourly basis, and be able to output energy use values at monthly or hourly intervals in order to facilitate the calibration process, whether it is at an equipment or system level, and/or at the whole building level, depending on project requirements. It must also provide as an output energy use by each end use category. The CWBD used a well-known publicly available simulation tool for the calibrated simulation.
The advantage of the calibrated simulation approach is that it allows estimation of individual measure savings as well as verifying savings at the whole building level. It also allows estimation of baseline-to-code savings and above-code savings.
The disadvantages of the calibrated simulation approach are that it requires an extensive set of data, often more data than used in typical retrofit isolation (IPMVP Option A or B) or whole building billing analysis (Option C) approaches. Data and information describing the entire building, facility systems, and operations are necessary to produce an accurate model. Modeling requires highly experienced and skilled personnel to create, run, and calibrate the models to actual building and system energy use and the impacts of the installed EEMs. Technical reviewers must also be skilled with simulation software. Developing and calibrating the models adequately can be quite labor intensive, and cost more relative to other analysis approaches.
Regulatory Needs
From a technical standpoint, it is arguable that M&V 2.0 at the whole-building level has reached a tipping point: there are many public and proprietary analytical solutions available in the market; at least in California, AMI has been completely rolled out and is capable of providing data down to 15 minute interval and consumption analysis methods have been around since the 1990s.
Regulators however have to ensure a minimum amount of certainty of results. In other words, regulators need to ensure that savings are real and can be attributed to the measures implemented to properly account for benefits to ratepayers and grid impacts. To reiterate, this paper deals with regulatory questions related to scaling commercial whole building programs based on M&V 2.0. Other sectors, end
6 In addition to the two open source and two proprietary originally planned tools, CWBD also used a machine learning approach referred to as ensemble modeling to “blend” the two open source models and two proprietary results to build a fifth model. Aggregating results of multiple models is a common practice in machine learning, and the approach often leads to significant error reductions providing a more accurate result than individual models. Background on the ensemble modeling approach used by the CWBD can be found in Wolpert (1992).
2017 International Energy Program Evaluation Conference, Baltimore, MD
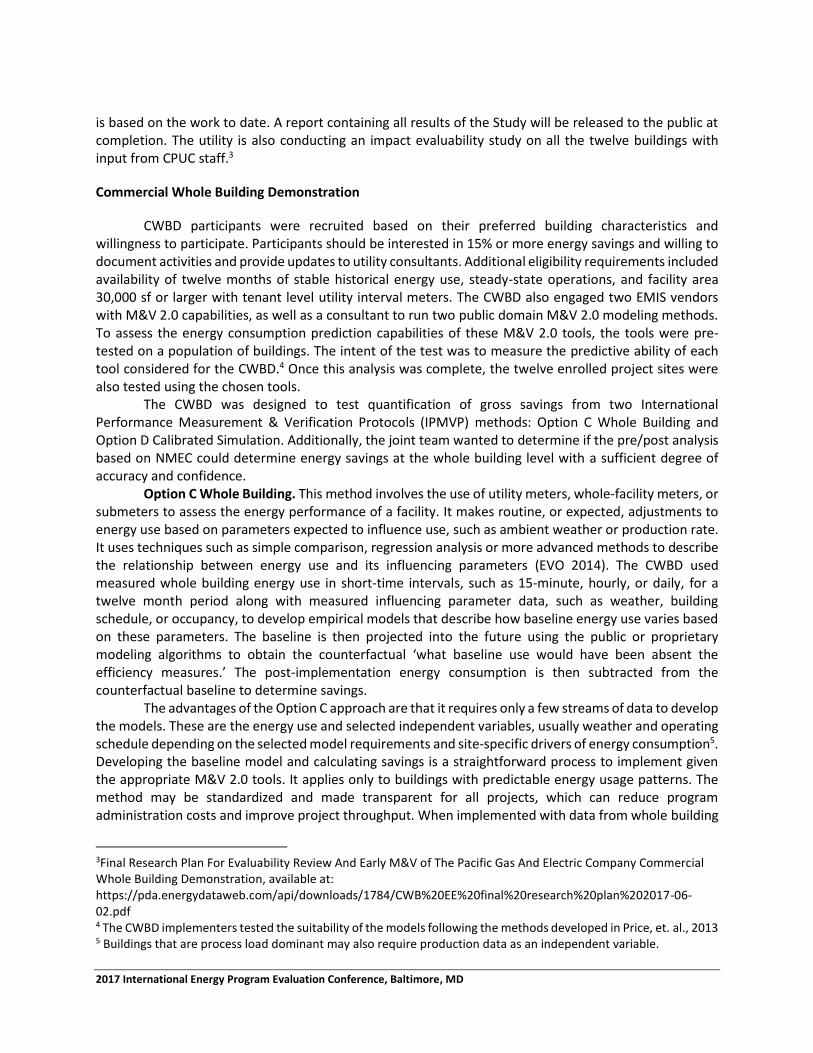
uses, or approaches will have other advantages or challenges. Table 1 summarizes the commercial whole building M&V 2.0 regulatory dilemma:
Table 1. Expected commercial whole building M&V 2.0 regulatory dilemma
Areas of concern What we expect/Why What we have/Why
Outcomes Timely and accurate determination of gross and net impacts
Why: Leverage emerging tools and big data; protect ratepayer funds, cost-effectiveness; grid impacts
Only gross impacts; complex after the fact EM&V
Why: Emerging methods unverified; lack of appropriate control groups for commercial buildings
Regulatory needs Simplification and cost reduction due to automation of M&V
Why: Protect ratepayer funds, improve feedback between implementation and results
Difficult choice between simple and reliable
Why: Emerging methods unverified; lack of adequate regulatory framework
Scalability Ability to apply reliable M&V 2.0 method broadly and at less cost
Why: Protect ratepayer funds, explore opportunities for multi-measure, deeper energy savings including behavior and operational.
Costly M&V methods that limit scalability
Why: Unknown applicability of M&V 2.0 to commercial sector, high upfront costs for deep savings measures, lack of universal implementation framework
This section will discuss each of these needs.
Outcomes
One of the main concerns from the regulatory viewpoint is the ability to quantify the impacts of the EEMs to determine ratepayer benefits:
• Can the analytical tool(s) accurately calculate gross savings so savings can be attributed to the EEMs and not other unrelated changes?
• How to determine net savings so program benefits can be determined? Gross savings. Research to date has shown that M&V 2.0 analytical tools can, in most cases,
accurately project the baseline usage based on pre-intervention energy usage and with uncertainty within commonly acceptable parameters. (Granderson et al 2015) However, M&V 2.0 tools are not able to address uncertainty due to changes in the common energy usage patterns in buildings such as changes in occupancy or equipment. These changes in energy consumption that are not due to changes in independent variables in the baseline model or to the EEMs installed are known as non-routine events (NREs). (ibid 2015; Granderson et al 2017, EVO 2016)
This issue was evident in the first, and only building at time of writing, to complete the post-reporting period. This was a commercial office building that installed multiple retrofit and retro-commissioning measures estimated to save approximately 15% of the facility’s electric consumption.
A unique element distinguishing the review of this site was that prior to the EEMs installation being completed, there was a large equipment shift at the facility. This equipment shift included the permanent removal of load from the CWBD site, and was unrelated to the CWBD. In addition to this load shift the building also replaced an old roof top package unit with a higher capacity unit and added a few electric car chargers, which were not related to the CWBD program. Ideally, these load changes would
2017 International Energy Program Evaluation Conference, Baltimore, MD
not have occurred during the CWBD project. Recall that a condition of participating in the CWBD was a request of stable state during monitoring. However, the joint team was aware that CWBD could be exposed to these types of facility changes (either permanent or temporary), as business will have to continue their day-to-day activities despite the program.
The resulting load changes were deemed as NREs. The timing of the NREs was particularly challenging. Prior to the project construction and coincidental NREs, the building showed stable and predictable energy consumption during the baseline period. The NREs occurred before the start of the reporting period and were not identified as a reporting period anomaly by any of the Option C analytical tools. The whole building savings as well as individual measure savings were subsequently quantified using the Option D analysis, resulting in Option C not being adequate to quantify gross savings for this facility.
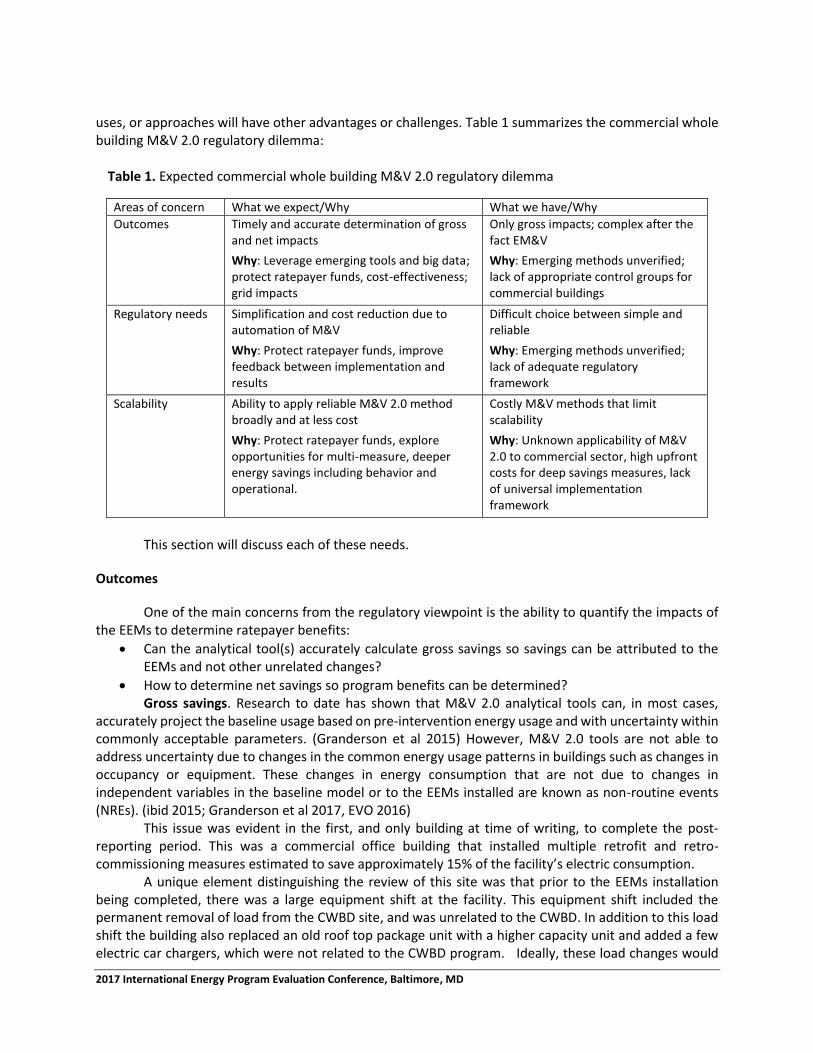
Table 2 shows the results of the seven analyses run. The building consumption prior to the project was on the order of 5.2 million kWh per year. Under the Option D approach, which appropriately handled the NRE, the project achieved savings of approximately 11% of the pre-retrofit consumption, slightly below the 15% savings target.
Table 2. Savings Results
Model Type IPMVP Option
Model Electric Savings (kWh)
NRMSE1 cvRMSE1
Statistical Model
Option C
Proprietary 1 1,443,117 6.59% N/A
Open Source 2B2 1,438,759 N/A 3.16%
Open Source 2A 1,429,834 16.50% N/A
Open Source 1 1,428,032 20.10% N/A
Proprietary 2 1,426,089 6.75% N/A
Blended 1,304,848. 7.09% N/A
Engineering Model
Option D eQuest 574,0003 N/A 5.7%
1Root mean squared error (RMSE) measures the difference between a value predicted by the model and the observed value. Non-dimensional forms of the RMSE enables comparison between different units. Two approaches create a non-dimensional form: the normalized RMSE (NRMSE) normalizes the RMSE to the range of the observed data and the cvRMSE normalizes the RMSE to the mean of the observed data. These are commonly acceptable metrics to evaluate accuracy of predictive tools. (Granderson et al 2015) 2Two versions of OS 2 were run: a version original to the start of CWBD, and an updated version. 3Results account for and adjustment due to a NRE(s) at the facility
The five Option C tools results differed by 11% and were close to three times the Option D savings, but this does not mean that the Option C models were necessarily inaccurate. The joint team believes it to be quite the opposite. As stated earlier, the Option C models are predicting consumption at the site by analyzing historical energy consumption prior to installation of the CWBD project to determine a baseline projection. However, modeling tools could not adjust for the NREs in this situation.
The statistical models respective predictive accuracy was good – as measured by NRMSE. The joint team desired a NRMSE or cvRMSE of 15% or less, but would consider accepting a value greater than 15% if the project yielded large energy savings. For the proprietary and blended models Option C (shown in Table 2) the NRMSE is under 10%. The open source models showed NRMSE higher than 15%. In other
2017 International Energy Program Evaluation Conference, Baltimore, MD
words, most the Option C models did well at predicting the building’s energy use and establishing a baseline. 7
However, the additional engineering effort that occurred as part of Option D found that this site did have a NRE, which caused significant reductions in the site impacts and resulting in Option C not being an adequate way of calculating gross savings. Regulators need assurance that the necessary checks will be in place to make sure that performance is monitored and that the appropriate data is collected to allow for adjustments. This may require ongoing tracking of predicted and actual energy consumption during the reporting period to identify potential NREs by a qualified engineer, and engagement with the customer to identify and quantify the impacts of NREs. Depending on the nature of the NRE, it may be necessary to install monitoring equipment or use facility EMIS to obtain an acceptable estimate of the NRE impact. NREs that occur between the end of the baseline period and before the start of the performance period are particularly problematic, and will require special vigilance on the part of the program implementation team. All these checks may increase necessary resources for program implementation.
Net Savings. It was out of the scope of the CWBD to test approaches to determine net savings. Most research to date has focused on M&V 2.0’s ability to calculate gross savings when applying Option C. Net savings will have to be calculated either by using traditional methods such as net-to-gross surveys or, if attempting to leverage other M&V 2.0 enabled methods such as experimental or quasi-experimental design. (Franconi 2017) However, the feasibility of experimental or quasi-experimental design in commercial buildings is questionable. Due to the diversity of buildings (types, uses, sizes), it may be difficult, if not impossible, to obtain an adequate number of participants similar enough for the experiment to be valid. Vine et al (2014) also point to whether or not the results obtained in an experiment can be generalized to a broader set of circumstances as a threat to viability of such methods. There may be large enough groups in small and medium commercial sub-sectors where M&V 2.0 for net savings can work, but then results would only be applicable to that sub-sector.
Other Regulatory Needs
Traditionally, energy efficiency impact evaluations are lengthy, costly and provide results well after the project has been completed. The anticipated benefits of whole building approaches based on M&V 2.0 are the potential simplification and cost reduction of M&V, which in turn should simplify and streamline ex-post evaluation.8 (Granderson et al 2017) However the success of this approach depends on having appropriate tools, modeling skills and adequate data collection to accurately predict the baseline consumption and calculate impact of EEMs and enough transparency to enable regulators/evaluators to replicate results. In order to approve a program, regulators will have to determine that the program is reasonably designed to achieve the objectives it set out to achieve.
Programs that leverage M&V 2.0 also have to develop reasonable M&V procedures to ensure the program employs adequate tools, is collecting the right amount of data to support savings calculation and understands the skill level necessary to carry out the tasks. The joint team agreed, based on the CWBD experience, that scaled program implementation would benefit from a set of regulatory guidelines to inform overall Option C program design: model fitness and uncertainty, handling of NREs and proprietary tools to name a few.
7 While the open source NRMSE is above the study team’s desired NRMSE, the statistic is within the observed industry standard error of 20% and preformed reasonably predicting the building’s energy use and establishing a baseline. The joint team did not reach a conclusion on acceptability of open source models given savings. 8 It is out of the scope of this paper to comment on how M&V 2.0 may simplify ex-post evaluation.

2017 International Energy Program Evaluation Conference, Baltimore, MD
Adequacy of M&V 2.0 analytical tools for predicting baseline. To determine adequacy of tools it is necessary to determine model fitness and uncertainty at the site and program level. Most importantly, while designing the program, it is important to consider some of the following questions:
• How to choose the appropriate baseline modeling tools for the program?
• How to determine tools fit, or how well the tools project baseline for the targeted population?
• What is the acceptable level of precision and uncertainty?
• How to define the appropriate independent variables? Research to date has dealt with some of these questions and general protocols do exist to guide
some of the decisions. However, applicability of existing guidance from ASHRAE or other protocols to meet regulatory needs still needs to be assessed. For instance, the California Evaluation Framework deals with sampling uncertainty (Evaluators’ Protocols, 2006). However, whether M&V 2.0 should enable valuation of savings based on the population of buildings, not on samples, is a policy consideration that needs further discussion. ASHRAE Guideline 14 does offer guidance for uncertainty calculation at the project level, but acceptability of that guidance for regulatory use is yet to be decided in the case of California, especially the metrics and minimum required thresholds of uncertainty parameters.
Non-routine events (NREs). M&V 2.0 approaches calculate differences in consumption based on a few streams of data like meter readings and weather. However, even if buildings are selected based on their historical consumption patterns and there is reasonable expectation that drastic changes will be avoided during the performance measurement, it is impossible to expect that no changes will ever occur, therefore there needs to be a protocol to identify and quantify NREs and reduce uncertainty of results.
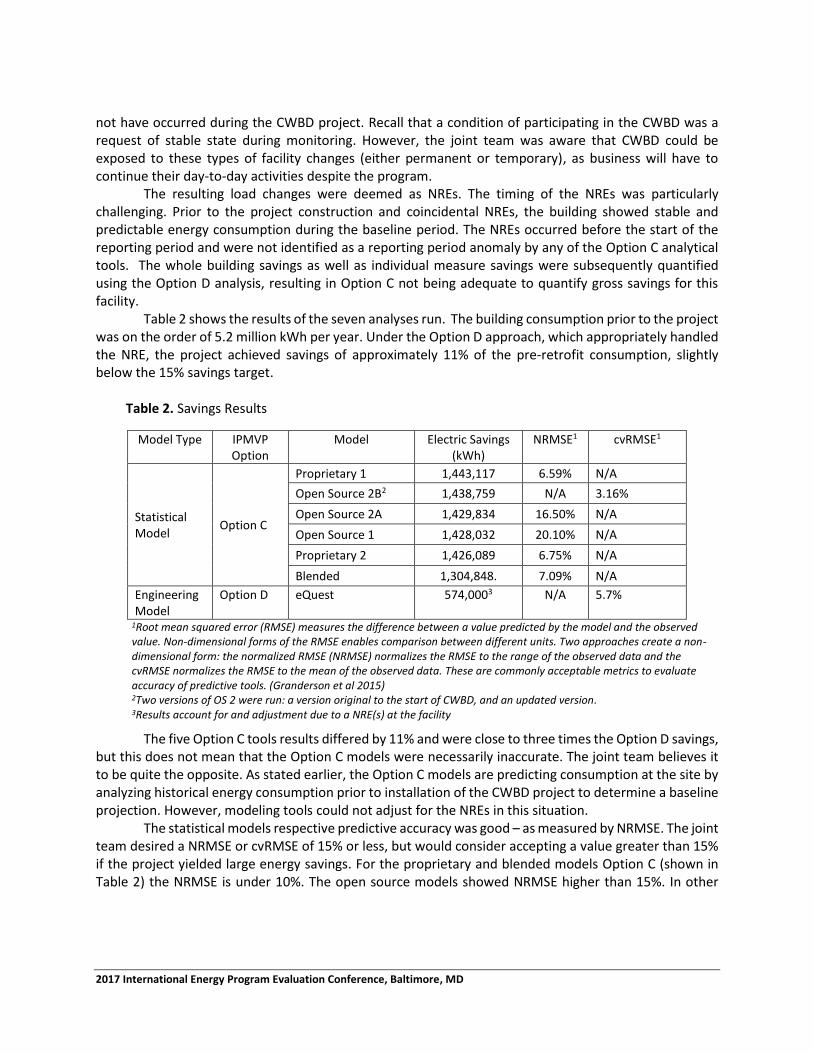
The CWBD based identification and quantification of NREs on a comparison of Option C and Option D, but that may not be the most adequate or desired method given the complexity and resources necessary to develop calibrated simulations. The study did not examine alternate methods of estimating the impact of NRE events. More work is needed to develop reliable methods to estimate the presence and impact of non-routine events. There may be instances that Option D will be necessary, but the expectation is that there should be simpler ways of doing it. For instance, a framework for identifying and assessing the impact on savings from NREs may begin by characterizing how they affect building energy use. As summarized on table 3, NREs can be either a permanent or a temporary change in a building load, as well as having a constant or variable impact on the load.
Table 3. Classification of non-routine events and examples
Type of NRE Example
Constant Load Change Addition of a Data Center
Variable Load Change Addition of Lab Equipment
Permanent Load Change Lighting Retrofit
Temporary Load Change Equipment Malfunction
In addition, there needs to be guidance on how big or how long a change in load will constitute a
NRE therefore needing special attention. Regardless of the method chosen, there may still be uncertainty in the estimate of the NRE adjustment. Guidance on how to incorporate the uncertainty in the NRE adjustment into the overall model uncertainty is also required.
Transparency. Evaluators need to be able to replicate the methods used to quantify savings to verify results. That includes evaluators and regulators having access to models and algorithms. This is not a problem when dealing with open source models, but it becomes problematic when proprietary models are used. Companies developing M&V 2.0 analytical tools are interested in protecting their intellectual property (IP), but regulators need to protect public interest and ensure the validity of savings.

2017 International Energy Program Evaluation Conference, Baltimore, MD
Results for this first building were not consistent among Option C tools, predictability metrics pointing to a better fit for proprietary and blended models. It is impossible to tell if one tool will be adequate to consistently project the baseline in a population of buildings and therefore it is advisable to have choices. Limiting participation in ratepayer-funded programs to only public available tools may not be in the interest of developing the industry. Furthermore, proprietary software often contains additional features of interest to building owners outside of the embedded M&V capability.
Researchers have developed ways to determine the performance of proprietary models based on assessing how the analytical tool baseline projection compares with actual energy consumption for certain metrics after a defined training period. (Granderson et al 2015) This is a promising approach that could lead to a certification process. Other alternatives include the development of standard protocols (Franconi et al. 2017), or perhaps requiring that proprietary models share their algorithm if requesting public funds. Eventually, regulators may want ex-post evaluation to be able to replicate savings calculations so there needs to be clear definition of proprietary tools approval and necessary disclosures.
Scalability
The previous sections identified outstanding questions relating to the feasibility of tools and appropriate level of data collection to accurately quantify savings and handle NREs. It is possible that most of these questions can be addressed by the development of guidance and regulatory framework. However, the question still remaining has to do with feasibility for scaling such programs given the level of engagement, cost (both to participant and implementer) and inherent uncertainties due to long lead times.
The commercial sector is not as homogeneous as the residential sector where variation in site results can be washed out in a population analysis, even if only for gross-savings determination. As it is harder, if not impossible depending on size and characteristics, to find a representative group of non-participants, results must still be scrutinized at project level with special attention to NREs. This points to current limitations for M&V 2.0 in the commercial sector in general and large commercial in specific, especially if attempting to achieve economies of scale through full automation.
The need for detailed enough data collection and follow up demands a certain level of interaction with participants not only during implementation but also during post-implementation monitoring, most importantly to identify and handle NREs. That results in a two-way street: ongoing review of billing data by program implementers to identify potential NREs and customer cooperation to characterize the needed adjustments. It is reasonable to expect that this higher level of interaction will have some impact on implementation costs.
Finally, programs targeting multi-measure, deep savings involve a large financial commitment from participants even after the payment of incentives as well as potential disruptions to activities.9 Most participants interviewed for the Study were happy with the project outcomes but did point that the CWBD implementers offered ample support. They also pointed to the advantage of being able to consider upgrades to the facility as a whole instead of piecemeal. This is encouraging; however this level of engagement may prove difficult in a scaled program. Nevertheless, these are not findings from a formal process evaluation.
The CWBD program screened customers using fairly stringent criteria to ensure accomplishment of the program objectives. Based on performance requirements, and necessary participant level of engagement (twelve month performance, cost, potential disruption to activities) is possible that only a fraction of commercial buildings in the population may qualify or be willing to participate in such
9 While this is a whole building intervention issue in general, facilitating whole building deep savings approaches is one of the main advantages of Option C M&V 2.0.

2017 International Energy Program Evaluation Conference, Baltimore, MD
programs. This requires special targeting and perhaps even a pre-targeting screen of suitable buildings as well as identification of deep savings opportunities, including behavioral and operational, to take full advantage of M&V 2.0 and Option C.
Main Takeaways and Next Steps
The CWBD proved an excellent opportunity for regulatory staff, utility, evaluators and technical consultants to get their feet wet with the M&V 2.0 commercial whole building framework. Some of the main takeaways are summarized in table 4 below:
Table 4. Main Takeaways and Next Steps
Area of concern Takeaways Next Steps
Outcomes Gross savings M&V 2.0 tools can predict baseline usage in buildings with predictable usage patterns
Enlist suitable buildings
NREs introduce uncertainty and may render Option C inadequate
Determine the impact on program costs of need for manual identification and handling of NREs
Continue development/ assessment of M&V 2.0 tools for improved handling of NREs
Net savings M&V 2.0 not currently adequate in commercial sector
M&V 2.0 not able to replace traditional methods
Continue development/ assessment of M&V 2.0 tools in commercial sector to determine program benefits
Traditional methods still necessary
Regulatory needs
Tool baseline prediction
Frameworks do exist but adequacy still uncertain and may not be universally acceptable
Need to develop acceptable metrics to determine model fitness and uncertainty
Non-routine events
No universal framework to identify and handle NREs
Determine identification/ characterization framework
Identify quantification methods
Identify acceptable level of uncertainty for NREs at project and program level
Develop suitable data collection plan guidance
Transparency Both open source and proprietary options available with varying levels of fitness and accuracy
Industry fluid and developing fast
Lack of assurance of transparency
Discuss and adopt policy to ensure necessary transparency but still allowing industry to evolve
Open discussion necessary of benefits and tradeoffs
Scalability Implementation may be costly
Participation uncertain due to financial impact and participation commitment
M&V 2.0 has potential to enable multi-measure, deep savings
Develop targeting strategies
Investigate ways to minimize implementation impact on participants
Continue development and assessment of tools to move towards greater automation capabilities
2017 International Energy Program Evaluation Conference, Baltimore, MD
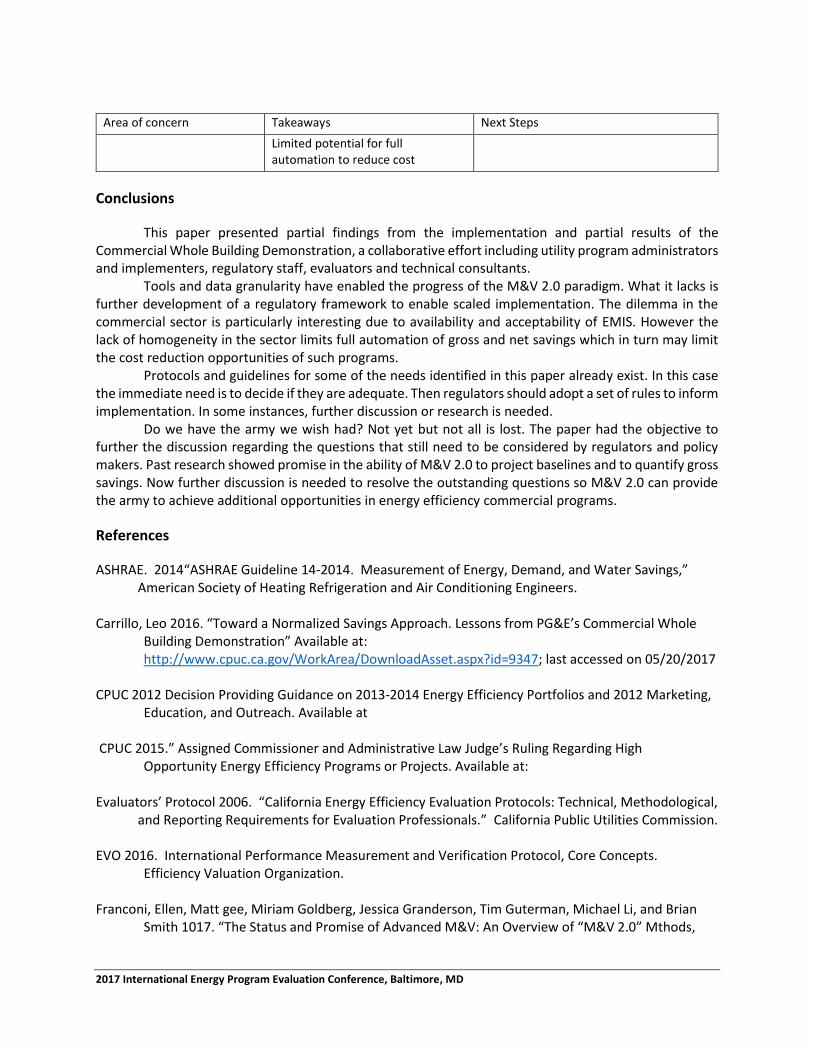
Area of concern Takeaways Next Steps
Limited potential for full automation to reduce cost
Conclusions
This paper presented partial findings from the implementation and partial results of the Commercial Whole Building Demonstration, a collaborative effort including utility program administrators and implementers, regulatory staff, evaluators and technical consultants.
Tools and data granularity have enabled the progress of the M&V 2.0 paradigm. What it lacks is further development of a regulatory framework to enable scaled implementation. The dilemma in the commercial sector is particularly interesting due to availability and acceptability of EMIS. However the lack of homogeneity in the sector limits full automation of gross and net savings which in turn may limit the cost reduction opportunities of such programs.
Protocols and guidelines for some of the needs identified in this paper already exist. In this case the immediate need is to decide if they are adequate. Then regulators should adopt a set of rules to inform implementation. In some instances, further discussion or research is needed.
Do we have the army we wish had? Not yet but not all is lost. The paper had the objective to further the discussion regarding the questions that still need to be considered by regulators and policy makers. Past research showed promise in the ability of M&V 2.0 to project baselines and to quantify gross savings. Now further discussion is needed to resolve the outstanding questions so M&V 2.0 can provide the army to achieve additional opportunities in energy efficiency commercial programs.
References
ASHRAE. 2014“ASHRAE Guideline 14-2014. Measurement of Energy, Demand, and Water Savings,” American Society of Heating Refrigeration and Air Conditioning Engineers.
Carrillo, Leo 2016. “Toward a Normalized Savings Approach. Lessons from PG&E’s Commercial Whole
Building Demonstration” Available at: http://www.cpuc.ca.gov/WorkArea/DownloadAsset.aspx?id=9347; last accessed on 05/20/2017
CPUC 2012 Decision Providing Guidance on 2013-2014 Energy Efficiency Portfolios and 2012 Marketing,
Education, and Outreach. Available at
CPUC 2015.” Assigned Commissioner and Administrative Law Judge’s Ruling Regarding High Opportunity Energy Efficiency Programs or Projects. Available at:
Evaluators’ Protocol 2006. “California Energy Efficiency Evaluation Protocols: Technical, Methodological, and Reporting Requirements for Evaluation Professionals.” California Public Utilities Commission.
EVO 2016. International Performance Measurement and Verification Protocol, Core Concepts.
Efficiency Valuation Organization. Franconi, Ellen, Matt gee, Miriam Goldberg, Jessica Granderson, Tim Guterman, Michael Li, and Brian
Smith 1017. “The Status and Promise of Advanced M&V: An Overview of “M&V 2.0” Mthods,

2017 International Energy Program Evaluation Conference, Baltimore, MD
Tools, and Applications”. Rocky Mountain Institute and Lawrence Berkeley National Laboratory. LBNL report number ##LBNL-1007125
Granderson, Jessica, Phillip N. Price, David Jump, Nathan Addy, Michael Sohn 2015. “Automated
Measurement and Verification: Performance of Public Domain Whole-Building Electric Baseline Models”. Applied Energy, Volume 144, Pages 106-103
Granderson, Jessica, Samir Touzani, Claudine Custodio, Michael D. Sohn, David Jump, Samuel Fernandes
2016. “Accuracy of Automated Measurement and Verification (M&V) Techniques for Energy Savings in Commercial Buildings” Applied Energy, Volume 173, Pages 296-308
Granderson, Jessica, Samir Touzani, Samuel Fernandes, Cody Taylor 2017. “Application of Automated
Measurement and Verification to Utility Energy Efficiency Program Data”. Energy and Buildings, Volume 142, Pages 191-199.
Kramer, Hannah; James Russel, Eliot Crowe and Joan Effinger 2013 “Inventory of Commercial Energy
Management and Information Systems (EMIS) for M&V Applications: Final Report”, Northwest Energy Efficiency Alliance.
Kupser, Jason, Sophia Francois, Joshua Rego, Peter Steele-Mosley, Toben Galvin, Craig McDonald 2016.
“M&V 2.0: Hype vs Reality”, American Council for an Energy-Efficient Economy Summer Study PG&E 2013. Pacific Gas and Electric Company 2013-2014 Energy Efficiency Portfolio Program
Implementation Plan Statewide Program Commercial Program, available at; http://eestats.cpuc.ca.gov/EEGA2010Files/PGE/PIP/2013/Clean/13-14_PGE2101_Commercial_PIP_5-29-13-CLEAN.pdf (Panel 1); last accessed 05/20/2017
Price, Phillip N., Jessica Granderson, Michael Sohn, Nathan Addy, David Jump, and Leo Carrillo 2013.
“Commercial Building Energy Baseline Modeling Software: Performance Metrics and Method Testing with Open Source Models and Implications for Proprietary Software Testing, Final Report,” PG&E Emerging Technology Program, ET Project No. ET12PGE5312.
Wolpert, David 1992. “Stacked Generalization” Neural Networks, Volume 5, Issue 2, Pages 241-259