surveillance of primary intracranial and central nervous ... · appendix e for example, survival...
TRANSCRIPT

National Program of Cancer Registries Training Materials
2 0 0 4
Appendix E Surveillance of Primary Intracranial and Central Nervous System Tumors Recommendations from the Brain Tumor Working Group National Coordinating Council for Cancer Surveillance
APPENDIX E SURVEILLANCE OF PRIMARY INTRACRANIAL AND CENTRAL
NERVOUS SYSTEM TUMORS
RECOMMENDATIONS FROM THE BRAIN TUMOR WORKING GROUP
September 1998
Brain Tumor Working Group
National Coordinating Council for Cancer Surveillance
Endash
DATA COLLECTION
OF PRIMARY
CENTRAL NERVOUS
SYSTEM TUMORS
This report was prepared by the Brain Tumor Working Group of the National CoordinatingCouncil for Cancer Surveillance and edited by Robert R German MPH Brooke Steele DOand Gayle Clutter RT CTR The Brain Tumor Working Group was comprised of thefollowing people listed alphabetically
Sally A Bushhouse DVM PhD Director Minnesota Cancer Surveillance System
Rosemarie Clive LPN CTR Cancer Department Director American College of Surgeons
Gayle Clutter RT CTR Former President National Cancer Registrars Association Program Analyst Centers for Disease Control and Prevention
Faith Davis PhD Professor and Director Div Epi Biostat Sch Public Health University of Illinois at Chicago Director Central Brain Tumor Registry of the United States
Robert R German MPH Epidemiologist National Program of Cancer Registries Centers for Disease Control and Prevention
Susan Gershman PhD Director Massachusetts Cancer Registry
James G Gurney PhD Department of Pediatrics Division of EpidemiologyClinical Research University of Minnesota
Holly L Howe PhD President North American Association of Central Cancer Registries Director Illinois State Cancer Registry
Sarah H Landis MPH Epidemiologist American Cancer Society
Edward R Laws Jr MD FACS Professor of Neurosurgery Professor of Medicine University of Virginia Charlottesville
Herman R Menck MBA Clinical Information Manager National Cancer Data Base American College of Surgeons
Constance Percy MSPH Statistician Surveillance Epidemiology and End Results Program National Cancer Institute
Jerri Linn Phillips MA CTR Research Analyst National Cancer Data Base American College of Surgeons
Lynn Ries MS Health Statistician Surveillance Epidemiology and End ResultsProgramNational Cancer Institute
Brooke Steele DO Medical Epidemiologist National Program of Cancer Registries Centers for Disease Control and Prevention
Tanya S Surawicz MPH Research Associate Central Brain Tumor Registry of the United States
Endash
APPENDIX E Preface
This report on Surveillance of Primary Intracranial and Central Nervous System Tumors was
prepared for the National Coordinating Council for Cancer Surveillance (NCCCS) by an
appointed Working Group of experts in brain tumor epidemiology and in cancer registration and
representatives of several public and private organizations involved in cancer surveillance in the
United States The Working Group described the clinical and epidemiologic significance of benign
and malignant intracranial and central nervous system (CNS) tumors reviewed the current status
of nonmalignant brain tumor surveillance among cancer registries in the United States analyzed
data for brain and other CNS tumors as well as non-CNS intracranial tumors and assessed the
feasibility of routine collection of data for nonmalignant brain tumors
Based on its review analysis and assessment the Working Group prepared a report with
recommendations for the NCCCS regarding data collection of all primary intracranial and CNS
tumors (see Executive Summary) The NCCCS discussed the report and recommendations at its
September 9 1998 meeting The Council voted to accept two recommendations of the Working
Group (1) to derive a standard definition for all primary intracranial and CNS tumors and (2) to
develop a standard site and histology definition for tabulating and estimating rates of these
tumors The NCCCS deferred further consideration and action on the two remaining Working
Group recommendations
National Coordinating Council for Cancer Surveillance
September 1998
Endash
DATA COLLECTION
OF PRIMARY
CENTRAL NERVOUS
SYSTEM TUMORS
EXECUTIVE SUMMARY
The National Coordinating Council for Cancer Surveillance established the Brain Tumor
Working Group (BTWG) to examine current reporting practices for brain tumors among cancer
registries in the United States This anatomic site was selected for a special review because much
morbidity and mortality is associated with both malignant and nonmalignant brain tumors The
BTWG determined that the review should encompass the brain and other parts of the central
nervous system (CNS) as well as non-CNS intracranial tumors Four reporting sources -- the
Central Brain Tumor Registry of the United States (CBTRUS) the Minnesota Cancer
Surveillance System (MCSS) the National Cancer Data Base (NCDB) and the Surveillance
Epidemiology and End Results (SEER) Program -- contributed data to the BTWG for analysis
The major findings are highlighted in this summary and recommendations regarding the
collection of data for primary intracranial and CNS tumors are provided
More than 28000 new cases of primary malignant and benign brain tumors were
diagnosed nationwide in 19951 Approximately 12000 people died of invasive brain tumors and
947 died of benign brain tumors during that year2 There were also 131 deaths due to tumors of
uncertain behavior and 2788 deaths due to tumors of unspecified behavior reported for those
sites From 1979-1995 mortality rates have remained relatively stable for invasive benign and
unspecified tumors (Fig 1) The NCDB which reports hospital registry data recently reported
5-year survival rates for patients diagnosed with brain tumors from 1985-1988 and from
1990-19923 Five years after diagnosis approximately 22 percent of patients with malignant
tumors and 72 of patients with nonmalignant tumors were alive The clinical outcome of both
malignant and nonmalignant tumors however may also depend on factors unrelated to behavior
Page 4
Endash
APPENDIX E For example survival rates are generally higher for benign meningiomas than for malignant
meningiomas (Fig 2) but treatment of meningiomas may be limited by their location Favorably
situated lesions (eg lateral sphenoid wing) are usually amenable to complete removal whereas
basal meningiomas are more difficult to fully and safely excise4
Only 15 state registries (Appendix A) collected data for benign intracranial and CNS
tumors in 1997 Three SEER areas also collect information about these tumors but they do not
currently report it Comparison of the data by cancer registries however is made difficult by the
lack of standard site groupings and histology groupings for the coding systems (ie International
Classification of Diseases for Oncology World Health Organization) that most of them use
Nonmalignant tumors constituted a significant percentage of the primary intracranial and
CNS tumors reported by the data sources For CBTRUS from 1990-1993 approximately 46
percent of the tumors reported for these sites were nonmalignant (Fig 3) Fifty-one percent of the
primary intracranial and CNS tumors reported by MCSS from 1989-1994 were nonmalignant and
NCDB reported more than 33 percent as nonmalignant during that period
Histologically much variation occurs among nonmalignant primary intracranial and CNS
tumors While the majority of malignant tumors reported by all of the sources were of
neuroepithelial origin (Table 1) most of the nonmalignant tumors were in the meninges
For registries that consider making nonmalignant intracranial and CNS tumors reportable
a twofold increase in the overall number of CNS cases could be expected In addition to the
increased costs associated with the increased workload registries should also be aware that
additional training of registrars new registry manuals modifications of case finding methods
modifications in the registries database and data processing software and revisions in legislation
Page 5
Endash
DATA COLLECTION
OF PRIMARY
CENTRAL NERVOUS
SYSTEM TUMORS
and regulations would be needed A mandate to report would be required to ensure high quality
surveillance
Based on its findings the BTWG has prepared four recommendations regarding data
collection for primary intracranial and CNS tumors
1 We recommend that the following standard definition be used for collecting precise
data for all primary intracranial and CNS tumors
Primary intracranial and CNS tumors are all primary tumors occurring in the
following sites irrespective of histologic type or behavior brain meninges
spinal cord cauda equina cranial nerves and other parts of the CNS pituitary
gland pineal gland and craniopharyngeal duct (see Appendix B)
2 We recommend the development of a standard site and histology definition for
tabulating estimates of these tumors to allow comparability of information across
registries Pathologists the North American Association of Central Cancer Registries
(NAACCR) the Commission on Cancer (COC) the Surveillance Epidemiology and
End Results (SEER) Program the National Program of Cancer Registries (NPCR)
and the International Agency for Research on Cancer (IARC) need to be involved in
developing this standard
3 We recommend collection of data for primary intracranial and extracranial CNS
tumors by all registries hospital- and population-based This effort will necessitate a
change in the COC requirements and will increase costs to the hospital-based
programs Federal funding should be allocated to supplement the additional transition
and ongoing data collection costs that will be incurred by central registries Before
Page 6
Endash
APPENDIX E additional data collection is implemented a pilot study should be conducted in
multiple states to assess the procedures and quality control functions needed as well as
the costs of collecting data on these tumors
4 We recommend that the appropriate government and professional organizations be
involved in carrying out the development and implementation of special training
programs and curricula for central registry hospital registry and laboratory personnel
as well as the development of computerized edit-checking procedures Training for
reporting and tabulating primary intracranial and CNS tumors should be offered on a
regular basis
Page 7
Endash
DATA COLLECTION
OF PRIMARY
CENTRAL NERVOUS
SYSTEM TUMORS
REFERENCES
1 CBTRUS (1996) First annual report 1995 Central Brain Tumor Registry of the United StatesChicago Illinois
2 National Center for Health Statistics public use mortality files for 1979-19953 Surawicz TS Davis F et al Brain tumor survival results from the National Cancer Data Base
(Accepted for publication in Journal of Neuro-Oncology)4 Thapar K Laws ER Tumors of the central nervous system In Murphy GP Lawrence W Jr
Lenhard RE Jr eds Textbook of clinical oncology ed 2 Atlanta American Cancer Society1995378-410
Page 10
Endash0
APPENDIX E
INTRODUCTION
Because nonmalignant brain tumors often can have a malignant clinical course leading to
substantial long-term morbidity and high risk for death the distinction between
histopathologically-defined malignancies versus nonmalignancies is tenuous from both a clinical
and an epidemiologic standpoint Likewise because nonmalignancies have not been systematically
or consistently included in most population-based cancer surveillance systems the public health
community has little information to offer on either incidence or mortality patterns and trends of
nonmalignant brain tumors in the United States (US) Additionally there have been virtually no
analytic epidemiology research studies conducted that would help identify factors that influence
the risk for nonmalignant brain tumor occurrence Thus despite their clinical importance both the
public health surveillance mission and the etiologic research mission of cancer prevention and
control are compromised by the exclusion of nonmalignant brain tumors in registry systems
Recognizing this challenge the National Coordinating Council for Cancer Surveillance (NCCCS)
established a Brain Tumor Working Group (BTWG) during its semi-annual meeting in January
1997 The purpose of BTWG was to review the status of the surveillance of brain tumors in the
US and examine the feasibility of collecting data for nonmalignant brain tumors Upon
completion of the project recommendations regarding surveillance of both malignant and
nonmalignant (ie benign or uncertain behavior) brain tumors would be presented at a special
meeting of the NCCCS This report describes data collection by US registries for primary
intracranial and central nervous system (CNS) tumors It includes data from several registries to
demonstrate variability in current reporting practices
BACKGROUND
Classification
Historically cancer registries have used the International Classification of Diseases (ICD)
system which describes tumors by their location (topography) and behavior (benign versus
malignant)1 to code neoplasms Tumor nomenclature describing histology was developed by
pathologists and incorporated into the International Classification of Diseases for Oncology (ICD-
O) system as a morphology code in 19762 and revised in a second edition (ICD-O-2)3 However
Page 11
Endash
DATA COLLECTION
OF PRIMARY
CENTRAL NERVOUS
SYSTEM TUMORS
Endash
not all of the morphology codes in the current ICD-O classification used by cancer registries are
consistent with the recent World Health Organization (WHO) brain tumor codes34 The recent
WHO brain tumor classification has new terms that are not included in ICD-O-2 however a new
third edition to ICD-O may include these terms ICD-O-2 also includes terms which are not
categorized by WHO
The CNS environment also contributes to the difficulty in characterizing tumors that
involve this site In contrast to tumors arising in other organ systems the terms benign and
malignant are only relative distinctions for CNS neoplasms Depending on location
histologically benign CNS tumors can result in similar or worse outcomes compared with
malignant tumors For these and other reasons classic oncologic concepts predicated on
histologic grade nodal status and staging strategies are not entirely applicable to tumors of the
CNS5
When the BTWG discussed whether to consider anatomic sites other than the brain for
this report the unique features of the CNS and the morbidity and mortality associated with non-
CNS intracranial tumors were closely examined For the sake of simplicity in reporting and
analyzing data for all of these sites the designation of primary intracranial and CNS tumors was
suggested This designation proposed by Walker et al6 is used by the Central Brain Tumor
Registry of the United States (CBTRUS) and includes the brain cerebral meninges cranial
nerves pituitary gland craniopharyngeal duct pineal gland spinal cord cauda equina and spinal
meninges The intracranial sites are the brain cerebral meninges cranial nerves and other
intracranial parts of the CNS the craniopharyngeal duct and the pineal and pituitary glands The
extracranial sites are the spinal cord cauda equina and spinal meninges The BTWG also included
lymphomas in the histology groupings for these sites The topography codes for the sites are in
Appendix B and the histology groupings are listed in Appendix C In this report no distinctions
are made between different age groups for intracranial and CNS tumors
Incidence
The age-adjusted incidence rate for malignant brain and other CNS tumors in the US
for 1991-1995 was 61 per 100000 person years7 Approximately 17400 new cases will be
diagnosed in 19988 The incidence of nonmalignant brain and other CNS tumors is difficult to
Page 12
APPENDIX E ascertain because few cancer registries collect or report these data However CBTRUS
reported an incidence rate for all primary brain and CNS tumors including the pituitary and
pineal glands of 118 per 100000 for 1990-19939 the organization also estimated that 28600
new cases of primary malignant and benign brain tumors were diagnosed nationwide in
199510 For both men and women rates for malignant and nonmalignant brain tumors decline
after a peak in childhood (younger than 10 years) increase after age 25 and stabilize after age
75 overall rates are higher for males11
Although the Surveillance Epidemiology and End Results (SEER) Program reported
a 28 percent decrease in the incidence of invasive brain and other nervous system cancer from
1991 to19957 within the last decade there have been many reports of dramatic increases in the
incidence of brain tumors12-21 particularly among children2223 and the elderly121617 Some
consider the increased rates as histology-specific14 and indicative of a true shift in incidence13
Other studies have concluded that many of the new cases are an artifact of changing
diagnostic procedures1617 In the US the discussion regarding the increased incidence of brain
tumors has been limited to rates for malignant tumors Standard reporting practices would aid
in the interpretation of time trends
Molecular studies24-26 have demonstrated that some low grade or benign intracranial
tumor subtypes transform to malignant tumors To understand the factors that might
contribute to this transformation and whether incidence rates for both malignant and
nonmalignant intracranial tumors are affected the full spectrum of the disease needs to be
observed
Mortality
Brain tumors regardless of behavior are the second leading cause of death from
neurological disease27 In 1995 malignant brain tumors accounted for 12062 deaths and
947 deaths were due to benign brain tumors Another 131 deaths were reported for brain
tumors of uncertain behavior and 2788 persons died of brain tumors for which the behavior
was unspecified28 The estimated number of deaths in 1998 due to malignant brain and other
CNS tumors is 133008 Increased mortality rates for malignant brain tumors particularly
among the elderly have been reported One study concluded that the increases were largely
Page 13
Endash
DATA COLLECTION
OF PRIMARY
CENTRAL NERVOUS
SYSTEM TUMORS
Endash
related to better diagnostic technology and the introduction of support programs such as
Medicare that facilitate diagnostic procedures in the elderly17 Another study attributed the
rising primary malignant brain tumor mortality to differential survival and its effect on the
surviving gene pool in an aging population28
Survival
Prognosis for CNS tumors depends on at least four variables tumor histopathology
anatomic location patient age and neurologic status5 According to a recent analysis using
SEER data from 1973-1991 overall survival rates for malignant brain tumors and rates for
patients with three specific histological types -- astrocytoma medulloblastoma and
oligodendroglioma -- improved29 Few data are available for survival rates for nonmalignant
primary intracranial and CNS tumors However Surawicz et al used data from the National
Cancer Data Base (NCDB) a joint project of the Commission on Cancer (COC) of the
American College of Surgeons (ACoS) and the American Cancer Society to examine survival
rates for patients diagnosed from 1985-1988 and from 1990-1992 with malignant or benign
brain tumors30 NCDB collects data from hospital tumor registries Based on the records of
more than 60000 patients the authors found a 216 percent 5-year survival rate for patients
with malignant tumors and a 724 percent rate for those with benign tumors The most
favorable prognosis was associated with neurilemmomas pilocytic astrocytomas and
meningiomas In contrast microgliomas lymphomas malignant gliomas and anaplastic
astrocytomas were associated with a poor outcome Surawicz et al also found variations in
survival for some tumors depending on location For example survival rates for
glioblastomas which generally have a poor prognosis improved if the tumors were located in
the cerebellum similarly astrocytomas and anaplastic astrocytomas were associated with a
better outcome if the tumors were in the ventricles or the cerebellum
Risk Factors
Although malignant and nonmalignant intracranial and CNS tumors have undergone
considerable study etiologic and pathophysiologic details concerning their genesis remain
obscure Definite genetic predispositions for the development of brain tumors have been
identified however population-based studies suggest that no more than 4 percent of these
Page 14
APPENDIX E tumors can be attributed to heredity 31 Several environmental carcinogens may be associated
with brain tumors including ionizing radiation11 electromagnetic fields32 and pesticides33
sustained exposure to vinyl chlorides polycyclic hydrocarbons and nitrosoureas has been
implicated as well5 Also the presence of the Epstein-Barr virus contained in the DNA of
primary lymphoma suggests that a viral etiology for human brain tumors cannot be entirely
ignored5 Accurate and complete data are necessary to develop hypotheses to identify the
causes of intracranial and CNS tumors The heterogeneity of brain tumors may mask the
identification of causes when histology-specific studies are limited by the number of available
cases
Surveillance
Population-based cancer registries generally provide incidence rates and trends for
cancer surveillance purposes and support related clinical and epidemiological research To
receive accreditation from the COC hospital cancer registries are required to report only
in situ and primary malignant tumors for all sites including the brain and other CNS sites34
Because data collection for nonmalignant intracranial and CNS tumors is not standardized at
either the central tumors can be attributed to heredity or hospital registry level collecting data
for all primary intracranial tumors is a challenge
In 1997 CBTRUS conducted a state survey (Appendix A) of benign brain and other
CNS tumor collection35 This survey gathered information from 64 member registries of the
North American Association of Central Cancer Registries (NAACCR) representing 48 states
All 64 of the registries collected data for primary malignant brain and other CNS tumors
however only 15 state registries collected data for nonmalignant (ie benign) tumors at the
time of the survey Seven state registries had stopped collecting data for benign brain and
other CNS tumors three collected the data passively one had started to collect the data in
1997 and one planned to start in 1998The majority of the registries surveyed indicated that
the requirements of their brain and other CNS tumor data collection had not been altered in
the past 5 years
Page 15
Endash
DATA COLLECTION
OF PRIMARY
CENTRAL NERVOUS
SYSTEM TUMORS
Endash
METHODS
To analyze available data on issues related to the collection of data for primary
intracranial and CNS tumors the BTWG examined surveillance data from CBTRUS the
Minnesota Cancer Surveillance System (MCSS) NCDB and SEER (Table 1) The NCDB
includes cases from all 50 states the District of Columbia and Puerto Rico however it is not
population-based CBTRUS MCSS and the SEER Program are population-based registries
that cover selected areas of the US Three SEER areas collect information for benign and
uncertain (ie nonmalignant) brain tumors but they do not report it Currently however
there are no standard definitions for the collection of site and type among the areas CBTRUS
MCSS and NCDB collect information on both malignant and nonmalignant primary brain
tumors Because the accessioning of nonmalignant cases for NCDB is not required by COC
only 59 percent of the hospitals that submitted any data to NCDB on intracranialCNS cases
diagnosed during 1989-1994 submitted nonmalignant cases The NCDB data reported here
are restricted to those hospitals that reported at least one nonmalignant case as these cases
were thought to contribute most toward the purpose of this report Also although MCSS
collects data for both malignant and nonmalignant tumors it does so for microscopically-
confirmed cases only This registry performs 100-percent case finding audits in all pathology
laboratories in Minnesota
Data inclusion criteria were developed as specified in Appendix B and all four of the
resources (ie CBTRUS MCSS NCDB SEER) developed subsets of their currently
available data according to the agreed-upon inclusion criteria Frequencies and proportions
were computed to reflect variations in factors other than site and the resulting contrasts
across these registries broadly reflect data collection practices For example the primary
difference in brain and CNS definition between SEER and CBTRUS lies in reporting by
behavior with the latter including all nonmalignant tumors As such differences in
proportions between these two registries approximately reflect the magnitude of nonmalignant
brain and CNS tumors Similarly the primary difference in brain and CNS definition between
MCSS and CBTRUS is that the former requires microscopic confirmation of all tumors and
the latter includes clinically and radiologically diagnosed tumors Another important difference
Page 16
APPENDIX E between MCSS and CBTRUS is that MCSS uses a more active method for case finding
Therefore differences in proportions reported reflect the interaction between the magnitude of
nonmicroscopically diagnosed tumors and the magnitude of incomplete case finding of certain
tumor types in CBTRUS Finally the primary difference between NCDB and CBTRUS is that
the former is a hospital-based reporting system and the latter is a population-based reporting
system Therefore differences in proportions may largely reflect referral biases inherent in
hospital reporting systems While other data collection practices may influence information in
these data resources these data bases were selected to highlight the variation in current
information on primary brain and CNS tumors that arises without a standard definition
Frequencies were computed using ICD-O codes for topography (ie location)
behavior diagnostic confirmation histology and selected combinations of behavior and
topography codes Topography was broadly defined into two main categories with
subcategories as shown in Appendix B Intracranial tumors included tumors located in the
brain and other CNS regions (including the cranial nerves) in the meninges and in the
pituitary and pineal glands Extracranial tumors included those located in the spinal cord and
spinal meninges The distinction between intracranial and extracranial tumors was removed for
Table 7 by collapsing brain and spinal meninges into one category and combining the pituitary
and pineal glands into one group (as these regions have endocrine functions) to allow for
adequate numbers within categories of behavior For Table 10 the intracranial and extracranial
distinction was maintained however the pituitary and pineal glands were collapsed into one
category and the spinal cord and spinal meninges were collapsed into the extracranial
category
Behavior was coded using ICD-O categories 0 for benign 1 for uncertain and 3 for
malignant with the first two of these categories collapsed into a nonmalignant category
Microscopic confirmation is based on the SEER definition and grouped into positive
microscopic confirmation radiography without microscopy clinical and unknown These
categories were further grouped as microscopically confirmed and as not microscopically
confirmed for the analysis in Table 3
Page 17
Endash
DATA COLLECTION
OF PRIMARY
CENTRAL NERVOUS
SYSTEM TUMORS
Endash
CBTRUS developed preliminary histology groupings with the aim of improved clinical
relevance ICD-O morphology codes which are used by cancer registries were grouped
based on WHO categories for brain tumors The details of these groupings are shown in
Appendix C
RESULTS
Percentages of Primary Intracranial and CNS Tumors by Tumor Location and by
Microscopic Confirmation
Intracranial tumors comprise more than 94 percent of primary intracranial and CNS
tumors and between 50 and 92 percent of primary intracranial and CNS tumors occur in the
brain (Table 2) The data in this report also show that a slightly greater percentage of
malignant intracranial tumors including malignant brain tumors are microscopically
confirmed compared with corresponding tumors of benign or uncertain behavior (Table 3)
However regardless of tumor behavior the percentages of extracranial CNS tumors that are
microscopically confirmed are higher than the percentages of intracranial tumors that are
confirmed by pathologists (Table 3) Few primary intracranial and CNS tumors are not
microscopically confirmed approximately 11 percent of diagnoses are based only on a clinical
or radiographical (without microscopy) assessment (Table 4)
Percentages of Malignant and of Nonmalignant Intracranial and CNS Tumors by Location
The relative distribution of nonmalignant intracranial and CNS tumors varies by
primary site While greater than 90 percent of malignant intracranial and CNS tumors occur
in the brain (Table 5) only 9 to 26 percent of the nonmalignant tumors occur as parenchymal
tumors (Table 6) Nonmalignant tumors comprised a significant portion of the primary
intracranial and CNS tumors reported by the sources The ratios of nonmalignant to primary
malignant intracranial and CNS tumors reported by CBTRUS MCSS and NCDB were 09
10 and 05 respectively (Table 7)
Percentages of Malignant and of Nonmalignant Intracranial and CNS Tumors by Histology
Among the malignant primary intracranial and CNS tumors neuroepithelial (ie
astrocytic) tumors represent 83 to 90 percent of the cases depending on the data source
Page 18
APPENDIX E lymphomashemopoietic tumors 6 to 11 percent tumors of the meninges 1 to 2 percent and
tumors of cranial and spinal nerves 02 percent (Table 8) For nonmalignant primary
intracranial and CNS tumors tumors of the meninges represent 48 to 59 percent of the cases
tumors of the sellar region (including pituitary tumors and craniopharyngiomas) 21 to 26
percent tumors of cranial and spinal nerves 11 to 20 percent and neuroepithelial tumors 4 to
5 percent (Table 9)
Percentages of Primary Intracranial and CNS Tumors by Method of Case Finding (MCSS)
Case finding audits by the MCSS occur on an annual basis in all pathology laboratories in
Minnesota and include the review of surgerypathology cytology autopsy and hematology
records These audits enable the registry to ensure that there is complete reporting of cases of
malignant and nonmalignant tumors In tables 10 through 13 data from MCSS on primary
intracranial and CNS tumors are presented by method of case finding The two methods of case
finding are routine reporting and special efforts A case was found by routine reporting if one
or more reports received before the close-out date for a given diagnosis year was initiated by a
hospital or nonhospital facility In contrast a case was found by special efforts if all reports of that
case received before the close-out date were requested as a result of pathology laboratory audits
The data in Table 10 indicate that routine reporting of nonmalignant tumors was less complete
compared with reporting for malignant tumors The percentages of intracranial tumor cases that
were found by special efforts have varied from year to year but the trend suggests that routine
reporting may be improving (Table 11) The greatest improvement has been in the coverage of
nonbrain parenchymal tumors (ie pituitarypineal and other intracranial) The small numbers of
autopsy-only tumors were more likely to be found by special case finding efforts than by other
methods of microscopic confirmation (data not shown)
Most hospitals in Minnesota have cancer registries through which their tumor cases are
reported However some of the cases that are seen at hospitals with registries are reported only
through pathology laboratories affiliated with the hospitals Approximately 80 percent
(14511776) of the cases of nonmalignant intracranial tumors in the MCSS data base were
reported by hospitals with registries (Table 12) eighty-five percent (12261451) of these cases
were reported by the hospitals registries (Table 13)The remaining 15 percent (2251451) of the
Page 19
Endash
DATA COLLECTION
OF PRIMARY
CENTRAL NERVOUS
SYSTEM TUMORS
Endash0
cases were reported through the pathology laboratories affiliated with the hospitals with registries
(ie they were not accessioned by the registries) (Table 13) The percentages of cases of
nonmalignant tumors that were reported only by the pathology laboratories at facilities having
cancer registries can be viewed as a measure of how frequently the registries failed to accession
the cases Of the 225 nonaccessioned tumors half would have been missed without the MCSS
case finding audits of pathology laboratories (Table 13)
Percentages of Hospital Cancer Registries That Accessioned Malignant and Nonmalignant
Intracranial and CNS Tumors (NCDB)
Based on data from NCDB more than 1500 hospitals accessioned cases with either
malignant or nonmalignant intracranial and CNS tumors and approximately 800 hospitals
accessioned extracranial cases Cases with tumors that involved the cranial or spinal meninges or
the pituitary gland were more likely to be reported by hospitals that accessioned nonmalignant
primary intracranial and CNS tumors than by hospitals that accessioned only malignant tumors
(Table 14)
DISCUSSION
The findings for this report indicate that collection and reporting of incidence data for
primary malignant intracranial and other CNS tumors are well standardized However substantial
variation exists in the processes of collecting and reporting nonmalignant tumor data One
obstacle is that not all hospitals have cancer registries Another problem is that not all hospitals
with registries accession cases of nonmalignant tumors Data from Minnesota (Table 13) suggest
that approximately 85 percent of cases of nonmalignant intracranial tumors are accessioned by
hospital registries However nonaccessioned CNS cases are less likely to be routinely reported to
the central registry (Table 13) These differences in collection and reporting practices among the
registries make it difficult to assess the burden of primary intracranial and CNS tumors
Terminology for describing intracranial and CNS tumors is also not standardized For
example although the pituitary gland and pineal glands are not technically part of the CNS
tumors that involve these organs are often included in the term CNS tumors On the other hand
some consider the eye to be intracranial however CNS tumors generally do not include the
Page 20
APPENDIX E eyes Although the World Health Organization (WHO) has published a list of histologic
groupings at present no single comprehensive list of histologic groupings exists for intracranial
and CNS tumors Since the International Classification of Childhood Cancer (ICCC) is based on
histologic type rather than site certain benign histologies of sites other than brainCNS (eg non-
CNS ependymomas) would not be included in the BTWGs primary intracranial and CNS
histology groupings (Appendix D) Thus the variation in incidence estimates of primary
intracranial and CNS tumors may be attributable in part to the variation in the definitions of
these tumors In addition differences in cancer registry training and procedures may contribute to
nonreporting and inconsistent reporting of the tumors
The BTWG discussed the feasibility of conducting a random sampling procedure as an
alternative to complete enumeration and ongoing surveillance of nonmalignant brain tumors It
was agreed that this technique would not be valid or feasible for the following reasons
1 If a random sample of incident brain tumors were desired a complete list would be
needed first (a sampling frame is required)
2 If a survey method were used to identify brain tumors in the general population (eg
random digit dialing or other general population survey techniques) the information
needed could not be obtained for several reasons
- Either a prohibitively large numbers of individuals would have to be surveyed or
else only a very small number of brain tumors could be identified given the rarity
and sometimes short survival time
- The brain tumors identified would not be representative of all brain tumors that
occur because people who had survived their brain tumors would be more
likely to be identified
- The incidence rate would still not be known since cross-sectional surveys only
identify disease prevalence
3 If a sample of hospitals were selected to contribute data the tumors included would not
represent the entire spectrum of brain tumors because those that were diagnosed and
treated outside of the hospital setting would be excluded
Page 21
Endash
DATA COLLECTION
OF PRIMARY
CENTRAL NERVOUS
SYSTEM TUMORS
Endash
An alternative approach to sampling and the least troublesome would be to conduct
population-based surveillance only in certain geographic areas of the country If one assumes that
the etiology of brain tumors does not differ from one area of the country to another then the
scientific validity of studies based on this type of sampling would not be a problem However
given the rarity of some types of brain tumors sufficient numbers for study may not be available
unless the vast majority of the nations population were covered by population-based data
collection Also geographic areas without population-based surveillance would have no data to
use for assessing local trends or variations in brain tumor occurrence
In the absence of standard tumor registration procedures and training special case finding
efforts by central registries may be necessary to ensure that complete data are collected for
nonmalignant intracranial and CNS tumors Data from MCSS (Table 10) which has a legal
requirement for reporting nonmalignant intracranial tumors and performs 100 percent case finding
audits in all laboratories indicate that only 80 percent of nonmalignant tumors were routinely
reported In contrast routine reporting accounted for more than 95 percent of malignant
intracranial and CNS tumors Nonmalignant cases in Minnesota that were not accessioned by
hospital registries had a 50 percent chance of being routinely reported to the central registry
however these were only microscopically confirmed cases
Completeness of reporting is critical to cancer registries Accurate case counts are
necessary to assess the burden of cancer to guide cancer control program planning to prioritize
the allocation of health resources and to facilitate epidemiologic research Most central cancer
registries have state laws that mandate reporting of cases by physicians and by hospitals
laboratories and other facilities that provide screening diagnostic or therapeutic services
Complete reporting of nonmalignant intracranial and CNS tumors would be greatly
improved if reporting requirements of the COC central cancer registries SEER and the
National Program of Cancer Registries (NPCR) were changed to require the collection of
information for these tumors However this requirement would have many implications
including an increase in work load as well as associated costs for reporting facilities An estimated
14 percent of all new cancer cases diagnosed in 1998 will involve invasive brain and other
nervous system tumors7 since the numbers of benign and invasive brain and other CNS tumors
Page 22
Endash
APPENDIX E diagnosed annually are similar facilities that presently do not accession nonmalignant cases could
expect an approximately 14 percent increase in the total number of CNS cases collected by the
registry Some estimates of the percentage of brain tumors have been lower (05 percent)36 and
others have been higher (9 percent)37 therefore the extent to which the workload would be
affected may vary The data in this report suggest that if reporting of nonmalignant intracranial
and CNS tumors were required the total number of cases of tumors for these anatomic sites
would double for facilities that presently report only malignant tumors This is consistent with the
findings of Davis et al36 who reported that the incorporation of benign brain tumors into the
cancer-reporting systems of four central registries increased the overall incidence of brain cancer
by 49 percent Forty percent (913) of the hospital registries that submitted data to the NCDB did
not report nonmalignant brain tumors These registries could expect up to a 50 percent increase in
the number of intracranial and CNS tumors reported nonregistry facilities which represent
approximately 20 percent of cases reported to central cancer registries could expect a similar
increase Also central cancer registries that currently do not require reporting of nonmalignant
intracranial and CNS tumors could expect increases in their workloads as a result of the
additional time spent on processing and quality control procedures and training The lack of
standard definitions and collection and reporting guidelines would make these tasks more time-
consuming as well
For some central cancer registries that want to expand their reporting requirements to
include nonmalignant intracranial and CNS tumors a change in current legislation andor
regulations may be needed These changes could involve several months of lead time if public
hearings or other legal procedures are necessary In other states the reporting of these tumors is
not required in either their legislation or regulations in these situations hospitals have been asked
to voluntarily report the cases For example in Massachusetts the reporting of benign brain
tumors is not required by law but hospitals have been reporting these cases since 1982 However
the completeness of data reported on a voluntary basis is difficult to assess For public health
surveillance systems a mandate to report is the basic requirement of a comprehensive higher
quality system
DATA COLLECTION
OF PRIMARY
CENTRAL NERVOUS
SYSTEM TUMORS
If COC SEER NPCR and central cancer registries changed their reporting requirements
to include nonmalignant intracranial and CNS tumors the registry manuals disseminated by these
programs and registries would also need to be modified to include new definitions of reportable
diagnoses All reporting facilities would have to be notified of the new requirements To ensure
complete reporting from registries additional training of registrars should be expected Case
finding methods may need to be modified in order to identify the new cases and sources of
information Central cancer registries would also need to increase their case finding audits The
inclusion of nonmalignant tumors would also necessitate changes to other data items such as
sequence number Hospital and central cancer registries would need to consider adding WHO
brain tumor grade as an additional data item
Finally the software used by reporting facilities and by central registries would need to be
modified to accept nonmalignant morphology and behavior codes Also edits programs would
need to be modified to include these additions and to accept a nonmalignant sequence numbering
procedure
Before reporting requirements for primary intracranial and CNS tumors could be changed
feasibility studies would have to be conducted to determine whether such changes should be
recommended Two SEER special studies are under way to evaluate the impact of requiring the
collection of benign brain tumors on case finding cost quality control and training However
additional studies may be required
Page 24
Endash
APPENDIX E
RECOMMENDATIONS OF THE BRAIN TUMOR WORKING GROUP
1 We recommend the following standard definition for collecting precise data for all primary
intracranial and central nervous system tumors
Primary intracranial and central nervous (CNS) tumors are primary tumors occurring in
the following sites irrespective of histologic type or behavior brain meninges spinal
cord cauda equina cranial nerves and other parts of the CNS pituitary gland pineal
gland and craniopharyngeal duct (see Appendix B)
2 We recommend the development of a standard site and histology definition for tabulating
estimates of these tumors to allow comparability of information across registries Pathologists
the North American Association of Central Cancer Registries (NAACCR) the Commission
on Cancer (COC) the Surveillance Epidemiology and End Results (SEER) Program the
National Program of Cancer Registries (NPCR) and the International Agency for Research
on Cancer (IARC) need to be involved in developing this standard
3 We recommend collection of data for primary intracranial and extracranial CNS tumors by all
registries hospital- and central-based This effort will necessitate a change in the COC
requirements and will increase costs to the hospital-based programs Federal funding should be
allocated to supplement the additional transition and ongoing data collections costs that will be
incurred by central registries Before additional data collection is implemented we recommend
a pilot study should be conducted to assess the procedures and quality control functions
needed as well as the costs of collecting data for these tumors
4 We recommend that the appropriate government and professional organizations be involved in
carrying out the development and implementation of special training programs and curricula for
central registry hospital registry and laboratory personnel as well as the development of
computerized edit-checking procedures Training for reporting and tabulating primary
intracranial and CNS tumors should be offered on a regular basis
Page 25
Endash
DATA COLLECTION
OF PRIMARY
CENTRAL NERVOUS
SYSTEM TUMORS
Endash
REFERENCES
1 Davis F Preston-Martin S Epidemiology of brain tumors In Bigner DD McLendon RE Bruner JM eds Russell and Rubinsteins pathology of tumors of the nervous system ed 6 London Arnold Publishing 19965-45
2 World Health Organization (WHO) (1976) International classification of diseases foroncology ed 1 Geneva World Health Organization
3 World Health Organization (WHO) (1990) International classification of diseases foroncology ed 2 Geneva World Health Organization
4 Kleihues P Burger PC Scheithauer BW The new WHO classification of brain tumorsBrain Pathol 19933255-268
5 Thapar K Laws ER Tumors of the central nervous system In Murphy GP Lawrence WJr Lenhard RE Jr eds Textbook of clinical oncology ed 2 Atlanta American CancerSociety 1995378-410
6 Walker AE Robins M Weinfield FD Epidemiology of brain tumors the national survey ofintracranial neoplasms Neurol 198535219-226
7 Ries LAG Kosary CL Hankey BF Miller BA Edwards BK (eds) SEER Cancer StatisticsReview 1973-1995 National Cancer Institute Bethesda MD 1998
8 Cancer Facts amp Figures - 1998 American Cancer Society Atlanta Georgia 19989 Davis FG Bruner JM Surawicz TS The rationale for standardized registration and reporting
of brain and central nervous system tumors in population-based cancer registriesNeuroepidemiol 199716308-316
10CBTRUS (1996) First annual report 1995 Central Brain Tumor Registry of the UnitedStates Chicago Illinois
11 Preston-Martin S Epidemiology of primary CNS neoplasms Neurol Clinics 199614273-290
12 Greig NH Ries LG Yancik R Rapoport SI Increasing annual incidence of primary malignantbrain tumors in the elderly J Natl Cancer Inst 1991 831621-1624
13 Mao Y Desmeules M Semenciw RM Hill G Gaudette L Wigle DT Increasing brain cancerrates in Canada Can Med Assoc J 19911451583-1591
14 Frelick R Huang P Topham A Brain and central nervous system tumors Delaware 1980 to1989 Del Med J 199264571-573
15 Davis DL Ahlbom A Hoel D Percy C Is brain cancer mortality increasing in industrialcountries Am J Ind Med 199119421-431
16 Helseth A Increasing incidence of primary central nervous system tumors in the elderly Realincrease or improved detection J Natl Cancer Inst 1993851871-1872
17 Modan B Wagener D Feldman JJ Rosenberg HM Feinleib M Increased mortality frombrain tumors A combined outcome of diagnostic technology and change of attitude towardthe elderly Am J Epidemiol 19921351349-1357
18 Polednak AP Time trends in the incidence of brain and central nervous system cancers inConnecticut J Natl Cancer Inst 1991831679-1681
19 Boyle P Maissonneuve P Saracci R Muir CS Is the increase in incidence of primarymalignant brain tumors real J Natl Cancer Inst 1990201594-1596
Page 26
APPENDIX E 20 Preston-Martin S Descriptive epidemiology of primary tumors of the brain cranial nerves
and spinal meninges in Los Angeles County Neuroepidemiol 19898283-29521 Helseth A Mork SJ Neoplasms of the central nervous system in Norway Epidemiological
characteristics of intracranial gliomas according to histology APMIS 97 1989547-55522 Gurney JG Davis S Severson RK Fang J-Y Ross JA Robison LL Trends in cancer
incidence among children in the United States Cancer 199678532-54123 Gurney JG Ross JA Wall DA Bleyer WA Severson RK Robison LL Infant cancer in the
US histology-specific incidence trends 1973-1992 J Pediatr Hem Onc 199719428-43224 Nishio S Takeshita I Morioka T Fukui M Primary intracranial squamous cell carcinomas
report of two cases Neurosurgery 199537329-33225 Freilich RJ Thompson SJ Walker RW Rosenblum MK Adenocarcinomatous transformation
of intracranial germ cell tumors Am J Surg Pathol 199519537-54426Yuan S Miller DW Barnett GH Hahn JF Williams BR Identification and characterization of
human beta 2-chimaerin association with malignant transformation in astrocytoma CancerResearch 1995 553456-3461
27 Preston-Martin S Mack WJ Neoplasms of the nervous system In Schoenfeld D Fraumeni JFJr eds Cancer epidemiology and prevention ed 2 New York Oxford University Press19961231-1281
28 Riggs JE Rising primary malignant brain tumor mortality in the elderly A manifestation ofdifferential survival Arch of Neurol 199552571-575
29 Davis FG Freels S Grutsch J Barlas S Brem S Survival rates in patients with primarymalignant brain tumors stratified by patient age and tumor histological type an analysisbased on Surveillance Epidemiology and End Results (SEER) data 1973-1991J Neurosurg 1998881-10
30 Surawicz TS Davis F Freels S Laws ER Menck HR Brain tumor survival results from theNational Cancer Data Base (Accepted for publication in J Neuro-Oncol)
31 Bondy ML Lustbader ED Buffler PA Schull WJ Hardy RJ Strong LC Geneticepidemiology of childhood brain tumors Genet Epidemiol 19918253-267
32 Preston-Martin S Monroe K Lee P Bernstein L Kelsey J Henderson S Forrester DHenderson B Spinal meningiomas in women in Los Angeles County Investigation of anetiologic hypothesis Cancer Epidemiol Biomarkers Prev 19954333-339
33 Davis JR Brownson RC Garcia R Bentz BJ Turner A Family pesticide use and childhoodbrain cancer Arch Environ Contam Toxicol 19932487-92
34 Commission on Cancer General principles and coding In Standards of the Commission on Cancer vol II Registry Operations and Data Standards American College of SurgeonsChicago Illinois 1996
35 Central Brain Tumor Registry of the United States (CBTRUS) 1997 State Survey of BenignBrain Tumor Collection Chicago Illinois 1997
36 Davis FG Malinski N Haenszel W Chang J Flannery J Gershman S Dibble R Bigner DDPrimary brain tumor incidence rates in the four United States regions 1985-1989 A pilotstudy Neuroepidemiol 199615103-112
37 Schoenberg BS Christine BW Whisnant JP The descriptive epidemiology of primaryintracranial neoplasms the Connecticut experience Am J Epidemiol 1976104499-510
Page 27
Endash
DATA COLLECTION
OF PRIMARY
CENTRAL NERVOUS
SYSTEM TUMORS
TAB
LE 1
C
OM
PAR
ISO
N O
F R
EGIS
TRIE
S SU
PPLY
ING
DA
TA O
N P
RIM
AR
Y I
NTR
AC
RA
NIA
L A
ND
CEN
TRA
L N
ERV
OU
S SY
STEM
TU
MO
RS
IN T
HE
UN
ITED
STA
TES
Cen
tral B
rain
Tum
or R
egis
try o
fth
e U
nite
d St
ates
(CBT
RUS)
Min
neso
ta C
ance
rSu
rvei
llanc
e Sy
stem
(MC
SS)
ACo
SN
a tio
nal C
ance
r Dat
a B
ase
(NCD
B)
Surv
eilla
nce
Epid
emio
logy
and
End
Res
ults
Pro
gram
(SEE
R)
Purp
ose
ldquoCB
TRU
S ce
ntra
lizes
pop
ulat
ion-
base
d in
cide
nce
data
on
all b
rain
tum
ors a
nd u
ses o
ther
exi
stin
gda
ta re
sour
ces t
o ch
arac
teriz
e th
ein
cide
nce
mor
talit
y a
nd su
rviv
alof
pat
ient
s with
bra
in tu
mor
s rdquo
The
MC
SS c
olle
cts i
nfor
mat
ion
onal
l can
cers
dia
gnos
ed si
nce
1988
amon
g M
inne
sota
resi
dent
s Th
e M
CSS
is p
opul
atio
n-ba
sed
path
olog
y-ba
sed
and
is a
n ac
tive
syste
m
ldquoThe
goa
l of t
he N
CD
B is
to p
rese
nt a
n an
nual
sum
mar
y of
pat
ient
car
e fo
r cas
es o
f can
cer
diag
nose
d an
d tre
ated
at h
ospi
tals
thro
ugho
utth
e co
untry
rdquo
ldquoA c
ontin
uing
pro
ject
of th
e N
CI
the
SEER
prog
ram
col
lect
sca
ncer
dat
a on
aro
utin
e ba
sis f
rom
desi
gnat
ed p
opul
atio
n-ba
sed
canc
er re
gist
ries
in v
ario
us a
reas
of t
heco
untry
Targ
et p
opul
atio
n Th
e po
pula
tions
cov
ered
by
regi
strie
s in
Ari
zona
Col
orad
oC
onne
ctic
ut D
elaw
are
Idah
oM
aine
Mas
sach
uset
ts
Min
neso
ta M
issou
ri M
onta
na
Nor
th C
arol
ina
and
Uta
h
The
CB
TRU
S po
pula
tion
repr
esen
ts a
non
rand
om 1
5pe
rcen
t sam
ple
of th
e U
S
popu
latio
n
The
popu
latio
n of
Min
neso
ta
The
popu
latio
ns tr
eate
d at
par
ticip
atin
gho
spita
ls in
the
50 st
ates
the
Dist
rict
of
Col
umbi
a a
nd P
uert
o R
ico
NC
DB
is n
ot a
pop
ulat
ion-
base
d re
gist
ry
At
pres
ent
it is
est
imat
ed to
cov
er a
ppro
xim
atel
y57
per
cent
of t
otal
cas
es n
atio
nwid
e
The
popu
latio
nsco
vere
d by
the
state
regi
strie
s in
Con
nect
icut
Haw
aii
Iow
a N
ew M
exic
o
and
Uta
h a
s wel
l as
the
regi
onal
regi
strie
sin
Atla
nta
Geo
rgia
D
etro
it M
ichi
gan
San
Fran
cisc
o-O
akla
nd C
alifo
rnia
an
d Se
attle
-Pug
etSo
und
Was
hing
ton
The
SEER
pop
ulat
ion
repr
esen
ts a
nonr
ando
m 1
4 pe
rcen
tsa
mpl
e of
the
US
po
pula
tion
Page
28
Endash
APPENDIX E
Cen
tral B
rain
Tum
or R
egis
try o
fth
e U
nite
d St
ates
(CBT
RUS)
Min
neso
ta C
ance
rSu
rvei
llanc
e Sy
stem
(MC
SS)
ACo
SN
a tio
nal C
ance
r Dat
a B
ase
(NCD
B)
Surv
eilla
nce
Epid
emio
logy
and
End
Res
ults
Pro
gram
(SEE
R)
Type
of
prim
ary
intra
cran
ial
and
cent
ral n
ervo
us sy
stem
tum
ors r
epor
ted
Dat
a on
new
ly-d
iagn
osed
cas
es o
fbe
nign
and
mal
igna
nt p
rimar
ybr
ain
tum
ors b
ased
on
ICD
-Oco
des
Dat
a on
new
ly-d
iagn
osed
m
i cro
scop
ical
ly-c
onfir
med
tum
ors
of th
e ce
ntra
l ner
vous
syste
m
incl
udin
g pi
tuita
ry a
nd p
inea
lgl
ands
Hos
pita
ls v
olun
taril
y su
bmit
full
anal
ytic
canc
er re
gist
ry c
asel
oads
with
dat
a ite
ms a
ndco
des d
efin
ed b
y th
e C
omm
issio
n on
Can
cer
(CO
C) f
or h
ospi
tal c
ance
r reg
istri
es
Mos
tpa
rtici
patin
g ho
spita
ls h
ave
prog
ram
sap
prov
ed b
y C
OC
or a
re e
stab
lishi
ng p
rogr
amap
prov
al
NC
DB
cal
ls fo
r dat
a do
not
lim
itca
ses b
y m
alig
nant
beh
avio
r bu
t acc
essi
onin
gof
non
-mal
igna
nt c
ases
is n
ot re
quire
d fo
rpr
ogra
m a
ppro
val
Fifty
-nin
e pe
rcen
t of t
heho
spita
ls th
at su
bmitt
ed a
ny in
tracr
ania
lCN
Sca
ses d
iagn
osed
dur
ing
1989
-199
4 su
bmitt
edat
leas
t one
non
mal
igna
nt c
ase
The
NC
DB
data
in th
is re
port
are
limite
d to
the
case
ssu
bmitt
ed b
y th
ese
hosp
itals
(82
perc
ent o
f all
intra
cran
ial a
nd e
xtra
cran
ial c
entra
l ner
vous
syste
m c
ases
on
file)
Tren
ds in
the
inci
denc
e m
orta
lity
and
patie
nt su
rviv
al o
fbr
ain
tum
ors i
n th
eU
S H
owev
er S
EER
does
not
col
lect
info
rmat
ion
on b
enig
nan
d un
certa
in b
rain
tum
ors
Oth
er c
omm
ents
D
uplic
ate
canc
er re
gist
ratio
ns c
anno
t be
iden
tifie
d by
the
parti
cipa
ting
regi
strie
s
The
MC
SS p
erfo
rms 1
00 p
erce
ntca
se fi
ndin
g au
dits
in a
ll pa
thol
ogy
labo
rato
ries o
n an
ann
ual b
asis
Th
eref
ore
the
data
from
the
MC
SSm
ight
be
cons
ider
ed a
ldquobe
st-ca
sesc
enar
iordquo
in te
rms o
f com
plet
enes
sof
repo
rting
for m
icro
scop
ical
ly-
conf
irmed
tum
ors
Rep
ort d
uplic
atio
n fo
r 198
9-19
94 in
tracr
ania
lan
d ex
tracr
ania
l cen
tral n
ervo
us sy
stem
repo
rts w
as 6
7 p
erce
nt
How
ever
the
NC
DB
data
in T
able
s 2 th
roug
h 9
are
base
d on
undu
plic
ated
repo
rts
Page
29
Endash
DATA COLLECTION
OF PRIMARY
CENTRAL NERVOUS
SYSTEM TUMORS
TABLE 2 NUMBER AND PERCENT OF PRIMARY INTRACRANIAL AND CENTRAL NERVOUS SYSTEM TUMORS BY TUMOR LOCATION
Locationa CBTRUSb
Number () MCSSc
Number () NCDBd
Number () SEERe
Number ()
Intracranial 13084 (947) 3600 (936) 66322 (955) 10196 (969)
Brain 7999 (579) 1924 (500) 48527 (699) 9721 (924)
Meninges 2719 (197) 838 (218) 9365 (135) 139 (13)
Pituitarycraniopharygealduct
1491 (108) 530 (138) 4958 (71) 30 (03)
Pineal 74 (05) 21 (05) 477 (07) 80 (08)
Other central nervous systemincluding cranial nerves
801 (58) 287 (75) 2995 (43) 226 (22)
Extracranial 730 (53) 245 (64) 3137 (45) 322 (31)
Spinal cord 497 (36) 47 (38) 2395 (34) 313 (30)
Spinal meninges 233 (17) 98 (25) 742 (11) 9 (01)
TOTAL 13814 (100) 3845 (100) 69459 (100) 10518 (100)
Note Reported data are incident cases from 1989-1994 except for CBTRUS data which are from 1990-1993
aRefer to the sites in Appendix BbCentral Brain Tumor Registry of the United States cMinnesota Cancer Surveillance System (microscopically confirmed cases only)dNational Cancer Data Base (limited to cases reported by hospitals that accessioned nonmalignant cases) eSurvival Epidemiology and End results Program (malignant cases only)
Page 30
Endash0
TABL
E 3
RO
W P
ERCE
NT
DIS
TRIB
UTI
ON
OF
PRIM
ARY
INTR
ACR
AN
IAL
AN
D C
ENTR
AL
NER
VO
US
SYST
EM T
UM
ORS
BY
TU
MO
R B
EHA
VIO
RA
ND
MIC
ROSC
OPI
C C
ON
FIRM
ATI
ON
Loca
tiona
CB
TRU
Sb M
CSSc
NC
DB
d SE
ERe
Tota
l Pe
rcen
tM
icro
Co
nfirm
ed
Perc
ent
Not
Mic
ro
Conf
irmed
Tota
l Pe
rcen
tM
icro
Co
nfirm
ed
Perc
ent
Not
Mic
ro
Conf
irmed
Tota
l Pe
rcen
tM
icro
Co
nfirm
ed
Perc
ent
Not
Mic
ro
Conf
irmed
Tota
l Pe
rcen
tM
icro
Co
nfirm
ed
Perc
ent
Not
Mic
ro
Conf
irmed
Intra
cran
ial
130
84
867
13
3
360
0 10
0 N
A
663
22
887
11
3
101
96
871
12
9
Mal
igna
nt
717
1 89
2
108
1
824
100
NA
44
801
91
3
87
101
96
871
12
9
Beni
gn a
ndu n
certa
in
591
3 83
5
165
1
776
100
NA
21
521
83
2
168
N
A
NA
N
A
Bra
in
799
9 88
2
118
1
924
100
NA
48
527
90
2
98
972
1 87
3
127
Mal
igna
nt
686
2 89
6
104
1
746
100
NA
42
622
91
5
85
972
1 87
3
127
Beni
gnan
dun
certa
in
113
7 80
6
194
17
8 10
0 N
A
590
5 80
6
194
N
A
NA
N
A
Extra
cran
ial
730
962
3
8 24
5 10
0 N
A
313
7 96
0
40
322
957
4
3
Mal
igna
nt
242
934
6
6 60
10
0 N
A
148
3 96
6
34
322
957
4
3
Beni
gn a
ndu n
certa
in
488
975
2
5 18
5 10
0 N
A
165
4 95
5
45
NA
N
A
NA
TOTA
Lf 13
814
87
2
128
3
845
100
NA
69
459
89
0
110
10
518
87
4
126
Mal
igna
nt
741
3 89
4
106
1
884
100
NA
46
284
91
5
85
105
18
874
12
6
Beni
gn a
ndu n
certa
in
640
1 84
6
154
1
961
100
NA
23
175
84
1
159
N
A
NA
N
A
Not
e R
epor
ted
data
are
inci
dent
cas
es fr
om 1
989-
1994
exc
ept f
or C
BTR
US
data
whi
ch a
re fr
om 1
990-
1993
a Refe
r to
the
site
code
s in
App
endi
x B
b Cent
ral B
rain
Tum
or R
egist
ry o
f the
Uni
ted
Stat
es
c Min
neso
ta C
ance
r Sur
veill
ance
Sys
tem
(mic
rosc
opic
ally
con
firm
ed c
ases
onl
y)
d Nat
iona
l Can
cer D
ata
Base
(lim
ited
to c
ases
repo
rted
by h
ospi
tals
that
acc
essio
ned
nonm
alig
nant
cas
es)
e Surv
eilla
nce
Epi
dem
iolo
gy a
nd E
nd R
esul
ts Pr
ogra
m (m
alig
nant
cas
es o
nly)
f In
clud
es in
tracr
ania
l and
ext
racr
ania
l cas
es
NA
= N
ot a
pplic
able
Page
31
APPENDIX E
Endash
DATA COLLECTION
OF PRIMARY
CENTRAL NERVOUS
SYSTEM TUMORS
TABLE 4 NUMBER AND PERCENT OF PRIMARY INTRACRANIAL AND CENTRAL NERVOUS SYSTEM TUMORS BY DIAGNOSTIC CONFIRMATION
DiagnosticConfirmation
CBTRUSa
Number () MCSSb
Number () NCDBc
Number () SEERd
Number ()
Positive microscopy
12087 (875) 3845 (100) 61818 (890) 9188 (874)
Radiographywithout microscopy
1306 (95) NA 6759 (97) 1015 (97)
Clinical 204 (15) NA 484 (07) 98 (09)
Unknown 217 (15) NA 398 (06) 217 (21)
TOTAL 13814 (100) 3845 (100) 69459 (100) 10518 (100)
Note Reported data are incident cases from 1989-1994 except for CBTRUS data which are from 1990-1993
aCentral Brain Tumor Registry of the United Statesb Minnesota Cancer Surveillance System (microscopically confirmed cases only) cNational Cancer Data Base (limited to cases reported by hospitals that accessioned nonmalignant cases)dSurveillance Epidemiology and End Results Program (malignant cases only)NA = Not applicable
Page 32
Endash
Page 32
TABLE 4 NUMBER AND PERCENT OF PRIMARY INTRACRANIAL AND CENTRALNERVOUS SYSTEM TUMORS BY DIAGNOSTIC CONFIRMATION
DiagnosticConfirmation
CBTRUSa
Number ()MCSSb
Number ()NCDBc
Number ()SEERd
Number ()
Positivemicroscopy
12087 (875) 3845 (100) 61818 (890) 9188 (874)
Radiographywithout microscopy
1306 (95) NA 6759 (97) 1015 (97)
Clinical 204 (15) NA 484 (07) 98 (09)
Unknown 217 (15) NA 398 (06) 217 (21)
TOTAL 13814 (100) 3845 (100) 69459 (100) 10518 (100)
Note Reported data are incident cases from 1989-1994 except for CBTRUS data which are from 1990-1993
aCentral Brain Tumor Registry of the United Statesb Minnesota Cancer Surveillance System (microscopically confirmed cases only)cNational Cancer Data Base (limited to cases reported by hospitals that accessioned nonmalignant cases)dSurveillance Epidemiology and End Results Program (malignant cases only)NA = Not applicable
APPENDIX E
TABLE 5 NUMBER AND PERCENT OF MALIGNANT PRIMARY INTRACRANIAL AND CENTRAL SYSTEM TUMORS BY TUMOR LOCATION
Locationa CBTRUSb
Number () MCSSc
Number () NCDBd
Number () SEERe
Number ()
Intracranial 7171 (977) 1824 (968) 44801 (968) 10196 (969)
Brain 6862 (926) 1746 (927) 42622 (921) 9721 (924)
Meninges 98 (13) 23 (12) 581 (13) 139 (13)
Pituitarycraniopharyngealduct
37 (05) 13 (07) 189 (04) 30 (03)
Pineal 58 (08) 20 (11) 378 (08) 80 (08)
Other central nervous systemincluding cranial nerves
116 (16) 22 (12) 1031 (22) 226 (21)
Extracranial 242 (33) 60 (32) 1483 (32) 322 (31)
Spinal cord 234 (32) 60 (32) 1410 (30) 313 (30)
Spinal meninges 8 (01) 0 73 (02) 9 (01)
TOTAL 7413 (100) 1884 (100) 46284 (100) 10518 (100)
Note Reported data are incident cases from 1989-1994 except for CBTRUS data which are from 1990-1993
aRefer to the site codes in Appendix BbCentral Brain Tumor Registry of the United States cMinnesota Cancer Surveillance System (microscopically confirmed cases only)dNational Cancer Data Base (limited to cases reported by hospitals that accessioned nonmalignant cases) eSurvival Epidemiology and End Results Program (malignant cases only)
Page 33
Endash
DATA COLLECTION
OF PRIMARY
CENTRAL NERVOUS
SYSTEM TUMORS
TABLE 6 NUMBER AND PERCENT OF PRIMARY INTRACRANIAL AND CENTRAL NERVOUS SYSTEM TUMORS OF BENIGN AND UNCERTAIN BEHAVIOR BY TUMOR LOCATION
Locationa CBTRUSb
Number () MCSSc
Number () NCDBd
Number () SEERe
Number ()
Intracranial 5913 (924) 1776 (906) 21521 (929) NA
Brain 1137 (178) 178 (91) 5905 (255) NA
Meninges 2621 (409) 815 (416) 8784 (379) NA
Pituitarycraniopharyngealduct
1454 (227) 517 (264) 4769 (206) NA
Pineal 16 (02) 1 (lt01) 99 (04) NA
Other central nervous systemincluding cranial nerves
685 (107) 265 (135) 1964 (85) NA
Extracranial 488 (76) 185 (94) 1654 (71) NA
Spinal cord 263 (41) 87 (44) 985 (42) NA
Spinal meninges 225 (35) 98 (50) 669 (29) NA
TOTAL 6401 (100) 1961 (100) 23175 (100) NA
Note Reported data are incident cases from 1989-1994 except for CBTRUS data which are from 1990-1993
aRefer to the site codes in Appendix BbCentral Brain Tumor Registry of the United States cMinnesota Cancer Surveillance System (microscopically confirmed cases only)dNational Cancer Data Base (limited to cases reported by hospitals that accessioned nonmalignant cases) eSurveillance Epidemiology and End Results Program (malignant cases only)NA = Not applicable
Page 34
Endash
APPENDIX E TABLE 7 NUMBER AND PERCENT OF PRIMARY INTRACRANIAL AND CENTRAL
NERVOUS SYSTEM TUMORS BY TUMOR BEHAVIOR AND LOCATION
BehaviorTumor Locationa
CBTRUSb
Number () MCSSc
Number () NCDBd
Number () SEERe
Number ()
Malignant 7413 (537) 1884 (490) 46284 (666) 10518 (100)
Brain 6862 (497) 1746 (454) 42622 (614) 9721 (924)
Meninges 98 (07) 23 (06) 581 (08) 139 (13)
Pituitarycraniopharyn-geal ductpineal
95 (07) 33 (09) 567 (08) 110 (11)
Other central nervous system includingcranial nerves
116 (08) 22 (06) 1031 (15) 226 (22)
Spinal cord 242 (18) 60 (16) 1483 (21) 322 (31)
Benign 5794 (419) 1787 (465) 20694 (298) NA
Brain 803 (58) 99 (26) 4491 (65) NA
Meninges 2565 (186) 807 (210) 8613 (124) NA
Pituitarycraniopharyn-geal ductpineal
1322 (96) 458 (119) 4330 (62) NA
Other central nervous system includingcranial nerves
678 (49) 263 (68) 1911 (28) NA
Spinal cord 426 (31) 160 (42) 1349 (19) NA
Uncertain 607 (44) 174 (45) 2481 (36) NA
Brain 334 (24) 79 (21) 1414 (20) NA
Meninges 56 (04) 8 (02) 171 (02) NA
Pituitarycraniopharyn-geal ductpineal
148 (11) 60 (16) 538 (08) NA
Other central nervous system includingcranial nerves
7 (01) 2 (01) 53 (01) NA
Spinal cord 62 (05) 25 (07) 305 (04) NA
TOTAL 13814 (100) 3845 (100) 69459 (100) 10518 (100)
Note Reported data are incident cases from 1989-1994 except for CBTRUS data which are from 1990-1993 NA=Not applicableaRefer to the site codes in Appendix B bCentral Brain Tumor Registry of the United States cMinnesota Cancer Surveillance System (microscopically confirmed cases only)dNational Cancer Data Base (limited to cases reported byhospitals that accessioned nonmalignant cases eSurvival Epidemiology and End Results Program (malignant cases only)
Page 35
Endash
DATA COLLECTION
OF PRIMARY
CENTRAL NERVOUS
SYSTEM TUMORS
TABLE 8 NUMBER AND PERCENT OF MALIGNANT PRIMARY INTRACRANIAL AND
CENTRAL NERVOUS SYSTEM TUMORS BY HISTOLOGY GROUPINGS
WHO Histologya
Groupings CBTRUSb
Number () MCSSc
Number () NCDBd
Number () SEERe
Number ()
Neuroepithelial 6477 (874) 1689 (896) 39701 (858) 8676 (825)
Tumors of cranial and spinal nerves
12 (02) 3 (02) 108 (02) 25 (02)
Tumors of meninges
137 (18) 25 (13) 994 (21) 194 (18)
LymphomasHemopoietic
473 (64) 121 (64) 3492 (75) 1099 (105)
Germ cell 70 (09) 20 (11) 403 (09) 97 (09)
Cysts and tumor-like lesions
0 0 0 0
Tumors of sellar region
20 (03) 11 (06) 100 (02) 6 (01)
Local extensions 29 (04) 11 (06) 166 (04) 38 (04)
Unclassifiedunassigned tumorsf
195 (26) 4 (02) 1320 (29) 383 (36)
TOTAL 7413 (100) 1884 (100) 46284 (100) 10518 (100)
Note Reported data are incident cases from 1989-1994 except for CBTRUS data which are from 1990-1993
aRefer to the World Health Organization (WHO) histology groupings in Appendix CbCentral Brain Tumor Registry of the United States cMinnesota Cancer Surveillance System (microscopically confirmed cases only)dNational Cancer Data Base (limited to cases reported by hospitals that accessioned nonmalignant cases) f For MCSS unclassifiedunassigned tumors include one malignant and four nonmalignant histologies which were
not listed in the CBTRUS classification scheme For NCDB unclassifiedunassigned tumors include 319 cases(less than one half percent) which had histologies not assigned by CBTRUS to any other category For SEERunclassifiedunassigned tumors include all malignant histologies occurring in the brainCNS which could not beclassified in one of the above categories based on their 4-digit histologic type
Page 36
Endash
APPENDIX E
TABLE 9 NUMBER AND PERCENT OF PRIMARY INTRACRANIAL AND CENTRAL NERVOUS SYSTEM TUMORS OF BENIGN AND UNCERTAIN BEHAVIOR
BY HISTOLOGY GROUPINGS
WHO Histologya
Groupings CBTRUSb
Number () MCSSc
Number () NCDBd
Number () SEERe
Number ()
Neuroepithelial 275 (43) 91 (46) 1064 (46) NA
Tumors of cranial and spinal nerves
980 (153) 397 (202) 2618 (113) NA
Tumors of meninges
3509 (548) 941 (480) 13667 (590) NA
LymphomasHemopoietic
3 (lt01) 0 7 (lt01) NA
Germ cell 4 (lt01) 1 (01) 25 (01) NA
Cysts and tumor-like lesions
15 (02) 3 (02) 34 (01) NA
Tumors of sellar region
1444 (226) 510 (260) 4749 (205) NA
Local extensions 0 0 0 NA
Unclassifiedunassigned tumorsf
171 (27) 18 (09) 1011 (44) NA
TOTAL 6401 (100) 1961 (100) 23175 (100) NA
Note Reported data are incident cases from 1989-1994 except for CBTRUS which is 1990-1993
aRefer to the World Health Organization (WHO) histology groupings in Appendix CbCentral Brain Tumor Registry of the United States c Minnesota Cancer Surveillance System (microscopically confirmed cases only) dNational Cancer Data Base (limited to cases reported by hospitals that accessioned nonmalignant cases) eSurvival Epidemiology and End Results Program (malignant cases only)dFor MCSS unclassifiedunassigned tumors include one malignant and four nonmalignant histologies which werenot listed in the CBTRUS classification scheme For NCDB unclassifiedunassigned tumors include 319 cases(less than one half percent) which had histologies not assigned by CBTRUS to any other category For SEERunclassifiedunassigned tumors include all malignant histologies occurring in the brainCNS which could not beclassified in one of the above categories based on their 4-digit histologic typeNA = Not applicable
Page 37
Endash
DATA COLLECTION
OF PRIMARY
CENTRAL NERVOUS
SYSTEM TUMORS
TABLE 10 METHOD OF CASE FINDING FOR PRIMARY INTRACRANIAL AND CENTRAL NERVOUS SYSTEM TUMORS BY TUMOR BEHAVIOR AND LOCATION MINNESOTA 1989-1994
Behavior Tumor Locationa
Number of Cases
Percent Found byRoutine
Reporting
Percent Found by Special Efforts
Malignant Brain Cerebral meninges
Pituitarycranio duct pineal Other intracranial
18841746 23 33
22
961 965 957 939
864
39 35 43 61
136 Extracranial 60 883 117 Benign Brain
1787 99
788 838
212 162
Cerebral meninges Pituitarycranio duct
pineal Other intracranial
807 458
263
843 740
779
157 260
221 Extracranial 160 631 369 Uncertain 174 856 144 Brain 79 823 177 Cerebral meninges Pituitarycraniopharyn- geal ductpineal Other intracranial
8 60
2
875 850
1000
125 150
00 Extracranial 25 960 40
TOTAL 3845 876 124
aRefer to the site codes in Appendix B
Page 38
Endash
1989 1990 1991 1992 1993 1994
TOTAL
APPENDIX E TABLE 11 METHOD OF CASE FINDING FOR INTRACRANIALa TUMORS BY DIAGNOSIS YEAR MINNESOTA 1989-1994
DiagnosisYear
Number of
Cases
Percent Found byRoutine
Reporting
Percent Found by
Special Efforts
571 837 163 616 865 135 586 913 87 602 899 101
633 872 128 592 929 71
3600 886 114
aIncludes the brain cerebral meninges pituitary gland pineal gland and otherintracranial tumors (refer to the site codes in Appendix B)
Page 39
Endash
DATA COLLECTION
OF PRIMARY
CENTRAL NERVOUS
SYSTEM TUMORS
TABLE 12 METHOD OF CASE FINDING FOR NONMALIGNANT INTRACRANIALa TUMORS BY TYPE OF FACILITY MINNESOTA 1989-1994
Type of Facility Number of Tumors Percent Found byRoutine
Reporting
Percent Found by Special Efforts
Registry at facility No registry at facility
1451325
859 569
141 431
TOTAL 1776 806 194
aIncludes tumors with benign or uncertain behavior that involve the brain cerebral meningespituitary gland pineal gland or other intracranial sites (refer to the site codes in Appendix B)
TABLE 13 REPORTING METHOD AND SOURCE OF CASE FINDING FOR NON- MALIGNANT INTRACRANIALa TUMORS DIAGNOSED IN HOSPITALS WITH A TUMOR REGISTRY MINNESOTA 1989-1994
Reporting Method Number of Tumors Percent Found byRoutine
Reporting
Percent Found by
Special Efforts
Registry-reportedLaboratory-reported
1226225
925 502
75 498
TOTAL 1451 859 141
aIncludes tumors with benign or uncertain behavior that involve the brain cerebral meningespituitary gland pineal gland or other intracranial sites (refer to the site codes in Appendix B)
Page 40
Endash0
APPENDIX E TABLE 14 HOSPITAL REGISTRY ACCESSIONING OF MALIGNANT AND NON-
MALIGNANT PRIMARY INTRACRANIAL AND CENTRAL NERVOUS SYSTEM TUMORS NCDB 1989-1994
TUMOR Totalb
BEHAVIOR Malignant c Nonmalignantd
Tumor Locationa HospitalsReporting
Number ()
Hospitals Reporting
Number ()
Hospitals Reporting
Number ()
Intracranial 1542 (100) 1526 (100) 900 (99)
Brain 1527 (99) 1519 (gt99) 754 (83)
Meninges 740 (48) 390 (26) 613 (67)
Pituitaryglandcraniopharyn-
geal duct
602 (39) 168 (11) 538 (59)
Pineal gland 319 (21) 277 (18) 79 (9)
Other central nervous system including cranial
nerves
648 (42) 545 (36) 299 (33)
Extracranial 812 (53) 708 (46) 410 (45)
Spinal cord 760 (49) 692 (45) 311 (34)
Spinal meninges 299 (19) 72 (5) 258 (28)
TOTAL Hospitals 1542 (100) 1526 (100) 913 (100)
Note The number of hospitals in each of the second third and fourth columns is the number that submittedreports to the NCDB for any intracranial and central nervous system tumors for the respective malignancystatus Not all hospitals submitted reports for each year during the study period (1989-1994)
aRefer to the site codes in Appendix B bBehavior codes = 0 1 3 cBehavior code = 3 dBehavior codes = 0 1
Page 41
Endash
DATA COLLECTION
OF PRIMARY
CENTRAL NERVOUS
SYSTEM TUMORS
Texas Cancer Registry
1997 CBTRUS State Survey of Benign Brain Tumor Data Collection
State Collection Status
Currently Collecting Benign Tumor Data1 Arizona Cancer Registry since 1981 2 Colorado Central Cancer Registry since 1988 3 Connecticut Tumor Registry since 1965 4 Idaho Cancer Data Registry since 1970 5 Maine Cancer Registry since 1983 6 Massachusetts Cancer Registry since 1982 7 Minnesota Cancer Surveillance System since 1988 8 Montana Central Tumor Registry since 1979 9 New York State Cancer Registry since 1988
10 North Carolina Central Cancer Registry since 1990 11 Utah Cancer Registry since 1966 12 Virginia Cancer Registry since 1994 13 Delaware State Cancer Registry14 Washington State Cancer Registry since 1992 15 passive collection 1979-1994
active collection since 1995
Stopped or Passive Collection of Benign Tumor Data1 New Jersey State Cancer Registry stopped 1979-1995 2 Kansas Cancer Registry stopped 1969-1995 3 New Hampshire State Cancer Registry stopped 1986-1991 4 District of Columbia Cancer Registry stopped 1997 5 Wyoming Cancer Surveillance Program stopped 111996 6 Louisiana Tumor Registry stopped 1992 (passive collection) 7 Illinois State Cancer Registry stopped 111996 8 Missouri Cancer Registry passive collection since 1984 9 South Carolina Central Cancer Registry passive collection since 1996
Beginning Collection of Benign Tumor Data1 North Dakota Cancer Registry began collection 1997 2 Rhode Island Cancer Registry began collection 1998
Page 42
Endash
APPENDIX E
Codes for Primary Intracranial and Central Nervous System Tumors
Note For this report the designation of ldquoprimary intracranial and central nervous system tumorsrdquo includes thefollowing primary tumors of central nervous system sites as well as tumors of the pituitary and pinealglands All histology types within the topography codes are included in the designation of ldquoprimaryintracranial and CNS tumors The source for the topography codes is Percy C Van Holten V Muir Ceds International Classification of Diseases for Oncology Second Edition Geneva World Health Organization 1990
Intracranial tumors
Brain C710 Cerebrum C711 Frontal lobe C712 Temporal lobe C713 Parietal lobe C714 Occipital lobe C715 Ventricle NOSC716 Cerebellum NOS C717 Brain stem C718 Overlapping lesion of brain C719 Brain NOS
Meninges C700 Cerebral meninges C709 Meninges NOS
a
Cranial Nerves and other intracranial parts of the central nervous systemC722 Olfactory nerve C723 Optic nerve C724 Acoustic nerve C725 Cranial nerve NOS C728 Overlapping lesion of brain and central nervous system C729 Nervous system NOS
Other endrocrine glands and related structures C751 Pituitary gland C752 Craniopharyngeal duct C753 Pineal gland
Extracranial tumors
Spinal cord C720 Spinal cord C721 Cauda equina
Meninges C701 Spinal meninges
aNOS=Not Otherwise Specified
Page 43
Endash
DATA COLLECTION
OF PRIMARY
CENTRAL NERVOUS
SYSTEM TUMORS
Brain Tumor Histology Groupings
The following histology groupings were used for the primary intracranial and central nervoussystem tumors The source for the histology groupings is Central Brain Tumor Registry ofthe United States (CBTRUS) 1996 Statistics Report Table 4
WHOa HISTOLOGY GROUPINGS ICD-Ob MORPHOLOGY CODE
Diffuse astrocytoma (protoplasma fibrillary) 9410 9420 Anaplastic astrocytoma 9401 9411 Glioblastoma 9440 9441 9442 Pilocytic astrocytoma 9421 Unique astrocytoma variants 9383 9384 9424 Oligodendroglioma 9450 Anaplastic oligodendroglioma 9451 9460 Ependymomaanaplastic ependymoma 9391 9392 9393 Ependymoma variants 9394 Mixed glioma 9382 Astrocytoma NOSc 9400 Glioma malignant NOS 9380 Choroid plexus 9390 Neuroepithelial 9381 9423 9430 Benign neuronalglial neuronal and mixed 86801 8693 9490 9505 9506 Malignant neruonalglial neuronal and mixed 86803 9364 9490 9500 Pineal parenchymal 9360 9361 9362 Embryonalprimitivemedulloblastoma 8963 9470 9471 9472
9473 9501 9502 9503 9510
TUMORS OF NEUROEPITHELIAL TISSUE
TUMORS OF CRANIAL AND SPINAL NERVES Nerve sheath benign and malignant 9540 9550 9560 9570
TUMORS OF THE MENINGES Meningioma 9530 9531 9532 9533 9534 9537 9538 Other mesenchymal benign and malignant 8800 8801 8802 8803 8810 8830 8850 88618900
8910 8990 9133 9150 9240 9480 9481 9536 9539 Hemangioblastoma 9161 9535
LYMPHOMAS AND HEMOPOIETIC NEOPLASMS Lymphoma 9590 9591 9593 9594 9595 9630 9650 9652
9663 9670 9671 9672 9674 9675 9680 9681 9682 9684 9685 9686 9687 9690 9691 96939695 9696 9698 9702 9714 9723 9731 9766 9970
GERM CELL TUMORS Germ cell 8020 9060 9064 9070 9071 9080 9084 9085 9100
CYSTS AND TUMOR-LIKE LESIONS Cysts and heterotopias 9084
TUMORS OF THE SELLAR REGION Pituitary 8040 8l40 8l46 8260 8270 8271 8280
8281 8290 8300 8330 8323 8333 Craniopharyngioma 9350
Page 44
Endash
APPENDIX E
LOCAL EXTENSIONS FROM REGIONAL TUMORS Chordomachondrosarcoma 9370
UNCLASSIFIED TUMORS Hemangioma 9120 9121 9130 9131 Neoplasm benign 80000 8010 Neoplasm uncertain behavior 80001 80011 Neoplasm malignant 80003 80013 8002 8003 All other 8720 9580
aWHO = World Health OrganizationbICD-O = International Classification of Diseases for Oncology Second Edition 1990 cNOS=Not Otherwise Specified
Page 45
Endash
DATA COLLECTION
OF PRIMARY
CENTRAL NERVOUS
SYSTEM TUMORS
Endash
International Classification of Childhood Cancer (ICCC)
Diagnostic Group
ICD-Oa codes
Morphology Topography
I LEUKAEMIA
(a) Lymphoid leukaemia 9820-9827 9850
(b) Acute non-lymphocytic leukaemia 9840 9841 9861 9864 9866 9867 98919894 9910
(c) Chronic myeloid leukaemia 9863 9868
(d) Other specified leukaemias 9830 9842 9860 9862 9870-9890 9892 98939900 9930-9941
(e) Unspecified leukaemias 9800-9804
II LYMPHOMAS AND OTHER RETICULOENDOTHELIAL NEOPLASMS
(a) Hodgkinrsquos disease 9650-9667
(b) Non-Hodgkinrsquos lymphoma 9591-9595 9670-9686 9690-9714 9723
(c) Burkittrsquos lymphoma 9687
(d) Miscellaneous lymphoreticular neoplasms 9720 9731-9764
(e) Unspecified lymphomas 9590
III CENTRAL NERVOUS SYSTEM (CNS) ANDMISCELLANEOUS INTRACRANIAL AND
INTRASPINAL NEOPLASMSb
(a) Ependymomac 9383 9390-9394
(b) Astrocytoma 9380 C723
9381 9400-9441
(c) Primitive neuroectodermal tumours 9470-9473
(d) Other gliomasd 9380 C700-C722C724-C729
9382 9384
9442-9460 9481
APPENDIX E
Diagnostic Group
ICD-Oa codes
Morphology Topogragphy
III CNS AND MISCELLANEOUS INTRACRANIAL AND INTRASPINAL
NEOPLASMSb Continued
(e) Miscellaneous intracranial and intraspinalneoplasmsc
8270-8281 8300 9350-9362 9480 95059530-9539
(f) Unspecified intracranial and intraspinalneoplasmsc
8000-8004 C700-C729C751-C753
IV SYMPATHETIC NERVOUS SYSTEM TUMOURS
(a) Neuroblastoma and ganglioneuroblastoma 9490 9500
(b) Other sympathetic nervous system tumours 8680 8693-8710 9501-9504 9520-9523
aInternational Classification of Diseases for Oncology Second Edition World Health Organization 1990bGroup III excludes all lymphomas See group II cBehaviour codes 0 and 1 are included dBehaviour code 1 is included
Page 47
Endash
Comments and recommendations are welcome Should questions arise on how to use these
materials or for more information please contact
Centers for Disease Control and Prevention National Program of Cancer Registries
4770 Buford Hwy NE Mail Stop K-53
Atlanta GA 30042-3717
Voice Information System 1 (888) 842-6355 bull Fax (770) 488-4760
cancerinfocdcgov bull httpwwwcdcgovcancer
All materials are in the public domain and may be reproduced or copied without permission citation
to source however is appreciated
BACK COVER
(WHITE)
Spine(WHITE)
DATA COLLECTION OF PRIMARY CEN
TRAL NERVOUS SYSTEM
TUM
ORS 2004
National Program of Cancer Registries Training M
aterials

DATA COLLECTION
OF PRIMARY
CENTRAL NERVOUS
SYSTEM TUMORS
This report was prepared by the Brain Tumor Working Group of the National CoordinatingCouncil for Cancer Surveillance and edited by Robert R German MPH Brooke Steele DOand Gayle Clutter RT CTR The Brain Tumor Working Group was comprised of thefollowing people listed alphabetically
Sally A Bushhouse DVM PhD Director Minnesota Cancer Surveillance System
Rosemarie Clive LPN CTR Cancer Department Director American College of Surgeons
Gayle Clutter RT CTR Former President National Cancer Registrars Association Program Analyst Centers for Disease Control and Prevention
Faith Davis PhD Professor and Director Div Epi Biostat Sch Public Health University of Illinois at Chicago Director Central Brain Tumor Registry of the United States
Robert R German MPH Epidemiologist National Program of Cancer Registries Centers for Disease Control and Prevention
Susan Gershman PhD Director Massachusetts Cancer Registry
James G Gurney PhD Department of Pediatrics Division of EpidemiologyClinical Research University of Minnesota
Holly L Howe PhD President North American Association of Central Cancer Registries Director Illinois State Cancer Registry
Sarah H Landis MPH Epidemiologist American Cancer Society
Edward R Laws Jr MD FACS Professor of Neurosurgery Professor of Medicine University of Virginia Charlottesville
Herman R Menck MBA Clinical Information Manager National Cancer Data Base American College of Surgeons
Constance Percy MSPH Statistician Surveillance Epidemiology and End Results Program National Cancer Institute
Jerri Linn Phillips MA CTR Research Analyst National Cancer Data Base American College of Surgeons
Lynn Ries MS Health Statistician Surveillance Epidemiology and End ResultsProgramNational Cancer Institute
Brooke Steele DO Medical Epidemiologist National Program of Cancer Registries Centers for Disease Control and Prevention
Tanya S Surawicz MPH Research Associate Central Brain Tumor Registry of the United States
Endash
APPENDIX E Preface
This report on Surveillance of Primary Intracranial and Central Nervous System Tumors was
prepared for the National Coordinating Council for Cancer Surveillance (NCCCS) by an
appointed Working Group of experts in brain tumor epidemiology and in cancer registration and
representatives of several public and private organizations involved in cancer surveillance in the
United States The Working Group described the clinical and epidemiologic significance of benign
and malignant intracranial and central nervous system (CNS) tumors reviewed the current status
of nonmalignant brain tumor surveillance among cancer registries in the United States analyzed
data for brain and other CNS tumors as well as non-CNS intracranial tumors and assessed the
feasibility of routine collection of data for nonmalignant brain tumors
Based on its review analysis and assessment the Working Group prepared a report with
recommendations for the NCCCS regarding data collection of all primary intracranial and CNS
tumors (see Executive Summary) The NCCCS discussed the report and recommendations at its
September 9 1998 meeting The Council voted to accept two recommendations of the Working
Group (1) to derive a standard definition for all primary intracranial and CNS tumors and (2) to
develop a standard site and histology definition for tabulating and estimating rates of these
tumors The NCCCS deferred further consideration and action on the two remaining Working
Group recommendations
National Coordinating Council for Cancer Surveillance
September 1998
Endash
DATA COLLECTION
OF PRIMARY
CENTRAL NERVOUS
SYSTEM TUMORS
EXECUTIVE SUMMARY
The National Coordinating Council for Cancer Surveillance established the Brain Tumor
Working Group (BTWG) to examine current reporting practices for brain tumors among cancer
registries in the United States This anatomic site was selected for a special review because much
morbidity and mortality is associated with both malignant and nonmalignant brain tumors The
BTWG determined that the review should encompass the brain and other parts of the central
nervous system (CNS) as well as non-CNS intracranial tumors Four reporting sources -- the
Central Brain Tumor Registry of the United States (CBTRUS) the Minnesota Cancer
Surveillance System (MCSS) the National Cancer Data Base (NCDB) and the Surveillance
Epidemiology and End Results (SEER) Program -- contributed data to the BTWG for analysis
The major findings are highlighted in this summary and recommendations regarding the
collection of data for primary intracranial and CNS tumors are provided
More than 28000 new cases of primary malignant and benign brain tumors were
diagnosed nationwide in 19951 Approximately 12000 people died of invasive brain tumors and
947 died of benign brain tumors during that year2 There were also 131 deaths due to tumors of
uncertain behavior and 2788 deaths due to tumors of unspecified behavior reported for those
sites From 1979-1995 mortality rates have remained relatively stable for invasive benign and
unspecified tumors (Fig 1) The NCDB which reports hospital registry data recently reported
5-year survival rates for patients diagnosed with brain tumors from 1985-1988 and from
1990-19923 Five years after diagnosis approximately 22 percent of patients with malignant
tumors and 72 of patients with nonmalignant tumors were alive The clinical outcome of both
malignant and nonmalignant tumors however may also depend on factors unrelated to behavior
Page 4
Endash
APPENDIX E For example survival rates are generally higher for benign meningiomas than for malignant
meningiomas (Fig 2) but treatment of meningiomas may be limited by their location Favorably
situated lesions (eg lateral sphenoid wing) are usually amenable to complete removal whereas
basal meningiomas are more difficult to fully and safely excise4
Only 15 state registries (Appendix A) collected data for benign intracranial and CNS
tumors in 1997 Three SEER areas also collect information about these tumors but they do not
currently report it Comparison of the data by cancer registries however is made difficult by the
lack of standard site groupings and histology groupings for the coding systems (ie International
Classification of Diseases for Oncology World Health Organization) that most of them use
Nonmalignant tumors constituted a significant percentage of the primary intracranial and
CNS tumors reported by the data sources For CBTRUS from 1990-1993 approximately 46
percent of the tumors reported for these sites were nonmalignant (Fig 3) Fifty-one percent of the
primary intracranial and CNS tumors reported by MCSS from 1989-1994 were nonmalignant and
NCDB reported more than 33 percent as nonmalignant during that period
Histologically much variation occurs among nonmalignant primary intracranial and CNS
tumors While the majority of malignant tumors reported by all of the sources were of
neuroepithelial origin (Table 1) most of the nonmalignant tumors were in the meninges
For registries that consider making nonmalignant intracranial and CNS tumors reportable
a twofold increase in the overall number of CNS cases could be expected In addition to the
increased costs associated with the increased workload registries should also be aware that
additional training of registrars new registry manuals modifications of case finding methods
modifications in the registries database and data processing software and revisions in legislation
Page 5
Endash
DATA COLLECTION
OF PRIMARY
CENTRAL NERVOUS
SYSTEM TUMORS
and regulations would be needed A mandate to report would be required to ensure high quality
surveillance
Based on its findings the BTWG has prepared four recommendations regarding data
collection for primary intracranial and CNS tumors
1 We recommend that the following standard definition be used for collecting precise
data for all primary intracranial and CNS tumors
Primary intracranial and CNS tumors are all primary tumors occurring in the
following sites irrespective of histologic type or behavior brain meninges
spinal cord cauda equina cranial nerves and other parts of the CNS pituitary
gland pineal gland and craniopharyngeal duct (see Appendix B)
2 We recommend the development of a standard site and histology definition for
tabulating estimates of these tumors to allow comparability of information across
registries Pathologists the North American Association of Central Cancer Registries
(NAACCR) the Commission on Cancer (COC) the Surveillance Epidemiology and
End Results (SEER) Program the National Program of Cancer Registries (NPCR)
and the International Agency for Research on Cancer (IARC) need to be involved in
developing this standard
3 We recommend collection of data for primary intracranial and extracranial CNS
tumors by all registries hospital- and population-based This effort will necessitate a
change in the COC requirements and will increase costs to the hospital-based
programs Federal funding should be allocated to supplement the additional transition
and ongoing data collection costs that will be incurred by central registries Before
Page 6
Endash
APPENDIX E additional data collection is implemented a pilot study should be conducted in
multiple states to assess the procedures and quality control functions needed as well as
the costs of collecting data on these tumors
4 We recommend that the appropriate government and professional organizations be
involved in carrying out the development and implementation of special training
programs and curricula for central registry hospital registry and laboratory personnel
as well as the development of computerized edit-checking procedures Training for
reporting and tabulating primary intracranial and CNS tumors should be offered on a
regular basis
Page 7
Endash
DATA COLLECTION
OF PRIMARY
CENTRAL NERVOUS
SYSTEM TUMORS
REFERENCES
1 CBTRUS (1996) First annual report 1995 Central Brain Tumor Registry of the United StatesChicago Illinois
2 National Center for Health Statistics public use mortality files for 1979-19953 Surawicz TS Davis F et al Brain tumor survival results from the National Cancer Data Base
(Accepted for publication in Journal of Neuro-Oncology)4 Thapar K Laws ER Tumors of the central nervous system In Murphy GP Lawrence W Jr
Lenhard RE Jr eds Textbook of clinical oncology ed 2 Atlanta American Cancer Society1995378-410
Page 10
Endash0
APPENDIX E
INTRODUCTION
Because nonmalignant brain tumors often can have a malignant clinical course leading to
substantial long-term morbidity and high risk for death the distinction between
histopathologically-defined malignancies versus nonmalignancies is tenuous from both a clinical
and an epidemiologic standpoint Likewise because nonmalignancies have not been systematically
or consistently included in most population-based cancer surveillance systems the public health
community has little information to offer on either incidence or mortality patterns and trends of
nonmalignant brain tumors in the United States (US) Additionally there have been virtually no
analytic epidemiology research studies conducted that would help identify factors that influence
the risk for nonmalignant brain tumor occurrence Thus despite their clinical importance both the
public health surveillance mission and the etiologic research mission of cancer prevention and
control are compromised by the exclusion of nonmalignant brain tumors in registry systems
Recognizing this challenge the National Coordinating Council for Cancer Surveillance (NCCCS)
established a Brain Tumor Working Group (BTWG) during its semi-annual meeting in January
1997 The purpose of BTWG was to review the status of the surveillance of brain tumors in the
US and examine the feasibility of collecting data for nonmalignant brain tumors Upon
completion of the project recommendations regarding surveillance of both malignant and
nonmalignant (ie benign or uncertain behavior) brain tumors would be presented at a special
meeting of the NCCCS This report describes data collection by US registries for primary
intracranial and central nervous system (CNS) tumors It includes data from several registries to
demonstrate variability in current reporting practices
BACKGROUND
Classification
Historically cancer registries have used the International Classification of Diseases (ICD)
system which describes tumors by their location (topography) and behavior (benign versus
malignant)1 to code neoplasms Tumor nomenclature describing histology was developed by
pathologists and incorporated into the International Classification of Diseases for Oncology (ICD-
O) system as a morphology code in 19762 and revised in a second edition (ICD-O-2)3 However
Page 11
Endash
DATA COLLECTION
OF PRIMARY
CENTRAL NERVOUS
SYSTEM TUMORS
Endash
not all of the morphology codes in the current ICD-O classification used by cancer registries are
consistent with the recent World Health Organization (WHO) brain tumor codes34 The recent
WHO brain tumor classification has new terms that are not included in ICD-O-2 however a new
third edition to ICD-O may include these terms ICD-O-2 also includes terms which are not
categorized by WHO
The CNS environment also contributes to the difficulty in characterizing tumors that
involve this site In contrast to tumors arising in other organ systems the terms benign and
malignant are only relative distinctions for CNS neoplasms Depending on location
histologically benign CNS tumors can result in similar or worse outcomes compared with
malignant tumors For these and other reasons classic oncologic concepts predicated on
histologic grade nodal status and staging strategies are not entirely applicable to tumors of the
CNS5
When the BTWG discussed whether to consider anatomic sites other than the brain for
this report the unique features of the CNS and the morbidity and mortality associated with non-
CNS intracranial tumors were closely examined For the sake of simplicity in reporting and
analyzing data for all of these sites the designation of primary intracranial and CNS tumors was
suggested This designation proposed by Walker et al6 is used by the Central Brain Tumor
Registry of the United States (CBTRUS) and includes the brain cerebral meninges cranial
nerves pituitary gland craniopharyngeal duct pineal gland spinal cord cauda equina and spinal
meninges The intracranial sites are the brain cerebral meninges cranial nerves and other
intracranial parts of the CNS the craniopharyngeal duct and the pineal and pituitary glands The
extracranial sites are the spinal cord cauda equina and spinal meninges The BTWG also included
lymphomas in the histology groupings for these sites The topography codes for the sites are in
Appendix B and the histology groupings are listed in Appendix C In this report no distinctions
are made between different age groups for intracranial and CNS tumors
Incidence
The age-adjusted incidence rate for malignant brain and other CNS tumors in the US
for 1991-1995 was 61 per 100000 person years7 Approximately 17400 new cases will be
diagnosed in 19988 The incidence of nonmalignant brain and other CNS tumors is difficult to
Page 12
APPENDIX E ascertain because few cancer registries collect or report these data However CBTRUS
reported an incidence rate for all primary brain and CNS tumors including the pituitary and
pineal glands of 118 per 100000 for 1990-19939 the organization also estimated that 28600
new cases of primary malignant and benign brain tumors were diagnosed nationwide in
199510 For both men and women rates for malignant and nonmalignant brain tumors decline
after a peak in childhood (younger than 10 years) increase after age 25 and stabilize after age
75 overall rates are higher for males11
Although the Surveillance Epidemiology and End Results (SEER) Program reported
a 28 percent decrease in the incidence of invasive brain and other nervous system cancer from
1991 to19957 within the last decade there have been many reports of dramatic increases in the
incidence of brain tumors12-21 particularly among children2223 and the elderly121617 Some
consider the increased rates as histology-specific14 and indicative of a true shift in incidence13
Other studies have concluded that many of the new cases are an artifact of changing
diagnostic procedures1617 In the US the discussion regarding the increased incidence of brain
tumors has been limited to rates for malignant tumors Standard reporting practices would aid
in the interpretation of time trends
Molecular studies24-26 have demonstrated that some low grade or benign intracranial
tumor subtypes transform to malignant tumors To understand the factors that might
contribute to this transformation and whether incidence rates for both malignant and
nonmalignant intracranial tumors are affected the full spectrum of the disease needs to be
observed
Mortality
Brain tumors regardless of behavior are the second leading cause of death from
neurological disease27 In 1995 malignant brain tumors accounted for 12062 deaths and
947 deaths were due to benign brain tumors Another 131 deaths were reported for brain
tumors of uncertain behavior and 2788 persons died of brain tumors for which the behavior
was unspecified28 The estimated number of deaths in 1998 due to malignant brain and other
CNS tumors is 133008 Increased mortality rates for malignant brain tumors particularly
among the elderly have been reported One study concluded that the increases were largely
Page 13
Endash
DATA COLLECTION
OF PRIMARY
CENTRAL NERVOUS
SYSTEM TUMORS
Endash
related to better diagnostic technology and the introduction of support programs such as
Medicare that facilitate diagnostic procedures in the elderly17 Another study attributed the
rising primary malignant brain tumor mortality to differential survival and its effect on the
surviving gene pool in an aging population28
Survival
Prognosis for CNS tumors depends on at least four variables tumor histopathology
anatomic location patient age and neurologic status5 According to a recent analysis using
SEER data from 1973-1991 overall survival rates for malignant brain tumors and rates for
patients with three specific histological types -- astrocytoma medulloblastoma and
oligodendroglioma -- improved29 Few data are available for survival rates for nonmalignant
primary intracranial and CNS tumors However Surawicz et al used data from the National
Cancer Data Base (NCDB) a joint project of the Commission on Cancer (COC) of the
American College of Surgeons (ACoS) and the American Cancer Society to examine survival
rates for patients diagnosed from 1985-1988 and from 1990-1992 with malignant or benign
brain tumors30 NCDB collects data from hospital tumor registries Based on the records of
more than 60000 patients the authors found a 216 percent 5-year survival rate for patients
with malignant tumors and a 724 percent rate for those with benign tumors The most
favorable prognosis was associated with neurilemmomas pilocytic astrocytomas and
meningiomas In contrast microgliomas lymphomas malignant gliomas and anaplastic
astrocytomas were associated with a poor outcome Surawicz et al also found variations in
survival for some tumors depending on location For example survival rates for
glioblastomas which generally have a poor prognosis improved if the tumors were located in
the cerebellum similarly astrocytomas and anaplastic astrocytomas were associated with a
better outcome if the tumors were in the ventricles or the cerebellum
Risk Factors
Although malignant and nonmalignant intracranial and CNS tumors have undergone
considerable study etiologic and pathophysiologic details concerning their genesis remain
obscure Definite genetic predispositions for the development of brain tumors have been
identified however population-based studies suggest that no more than 4 percent of these
Page 14
APPENDIX E tumors can be attributed to heredity 31 Several environmental carcinogens may be associated
with brain tumors including ionizing radiation11 electromagnetic fields32 and pesticides33
sustained exposure to vinyl chlorides polycyclic hydrocarbons and nitrosoureas has been
implicated as well5 Also the presence of the Epstein-Barr virus contained in the DNA of
primary lymphoma suggests that a viral etiology for human brain tumors cannot be entirely
ignored5 Accurate and complete data are necessary to develop hypotheses to identify the
causes of intracranial and CNS tumors The heterogeneity of brain tumors may mask the
identification of causes when histology-specific studies are limited by the number of available
cases
Surveillance
Population-based cancer registries generally provide incidence rates and trends for
cancer surveillance purposes and support related clinical and epidemiological research To
receive accreditation from the COC hospital cancer registries are required to report only
in situ and primary malignant tumors for all sites including the brain and other CNS sites34
Because data collection for nonmalignant intracranial and CNS tumors is not standardized at
either the central tumors can be attributed to heredity or hospital registry level collecting data
for all primary intracranial tumors is a challenge
In 1997 CBTRUS conducted a state survey (Appendix A) of benign brain and other
CNS tumor collection35 This survey gathered information from 64 member registries of the
North American Association of Central Cancer Registries (NAACCR) representing 48 states
All 64 of the registries collected data for primary malignant brain and other CNS tumors
however only 15 state registries collected data for nonmalignant (ie benign) tumors at the
time of the survey Seven state registries had stopped collecting data for benign brain and
other CNS tumors three collected the data passively one had started to collect the data in
1997 and one planned to start in 1998The majority of the registries surveyed indicated that
the requirements of their brain and other CNS tumor data collection had not been altered in
the past 5 years
Page 15
Endash
DATA COLLECTION
OF PRIMARY
CENTRAL NERVOUS
SYSTEM TUMORS
Endash
METHODS
To analyze available data on issues related to the collection of data for primary
intracranial and CNS tumors the BTWG examined surveillance data from CBTRUS the
Minnesota Cancer Surveillance System (MCSS) NCDB and SEER (Table 1) The NCDB
includes cases from all 50 states the District of Columbia and Puerto Rico however it is not
population-based CBTRUS MCSS and the SEER Program are population-based registries
that cover selected areas of the US Three SEER areas collect information for benign and
uncertain (ie nonmalignant) brain tumors but they do not report it Currently however
there are no standard definitions for the collection of site and type among the areas CBTRUS
MCSS and NCDB collect information on both malignant and nonmalignant primary brain
tumors Because the accessioning of nonmalignant cases for NCDB is not required by COC
only 59 percent of the hospitals that submitted any data to NCDB on intracranialCNS cases
diagnosed during 1989-1994 submitted nonmalignant cases The NCDB data reported here
are restricted to those hospitals that reported at least one nonmalignant case as these cases
were thought to contribute most toward the purpose of this report Also although MCSS
collects data for both malignant and nonmalignant tumors it does so for microscopically-
confirmed cases only This registry performs 100-percent case finding audits in all pathology
laboratories in Minnesota
Data inclusion criteria were developed as specified in Appendix B and all four of the
resources (ie CBTRUS MCSS NCDB SEER) developed subsets of their currently
available data according to the agreed-upon inclusion criteria Frequencies and proportions
were computed to reflect variations in factors other than site and the resulting contrasts
across these registries broadly reflect data collection practices For example the primary
difference in brain and CNS definition between SEER and CBTRUS lies in reporting by
behavior with the latter including all nonmalignant tumors As such differences in
proportions between these two registries approximately reflect the magnitude of nonmalignant
brain and CNS tumors Similarly the primary difference in brain and CNS definition between
MCSS and CBTRUS is that the former requires microscopic confirmation of all tumors and
the latter includes clinically and radiologically diagnosed tumors Another important difference
Page 16
APPENDIX E between MCSS and CBTRUS is that MCSS uses a more active method for case finding
Therefore differences in proportions reported reflect the interaction between the magnitude of
nonmicroscopically diagnosed tumors and the magnitude of incomplete case finding of certain
tumor types in CBTRUS Finally the primary difference between NCDB and CBTRUS is that
the former is a hospital-based reporting system and the latter is a population-based reporting
system Therefore differences in proportions may largely reflect referral biases inherent in
hospital reporting systems While other data collection practices may influence information in
these data resources these data bases were selected to highlight the variation in current
information on primary brain and CNS tumors that arises without a standard definition
Frequencies were computed using ICD-O codes for topography (ie location)
behavior diagnostic confirmation histology and selected combinations of behavior and
topography codes Topography was broadly defined into two main categories with
subcategories as shown in Appendix B Intracranial tumors included tumors located in the
brain and other CNS regions (including the cranial nerves) in the meninges and in the
pituitary and pineal glands Extracranial tumors included those located in the spinal cord and
spinal meninges The distinction between intracranial and extracranial tumors was removed for
Table 7 by collapsing brain and spinal meninges into one category and combining the pituitary
and pineal glands into one group (as these regions have endocrine functions) to allow for
adequate numbers within categories of behavior For Table 10 the intracranial and extracranial
distinction was maintained however the pituitary and pineal glands were collapsed into one
category and the spinal cord and spinal meninges were collapsed into the extracranial
category
Behavior was coded using ICD-O categories 0 for benign 1 for uncertain and 3 for
malignant with the first two of these categories collapsed into a nonmalignant category
Microscopic confirmation is based on the SEER definition and grouped into positive
microscopic confirmation radiography without microscopy clinical and unknown These
categories were further grouped as microscopically confirmed and as not microscopically
confirmed for the analysis in Table 3
Page 17
Endash
DATA COLLECTION
OF PRIMARY
CENTRAL NERVOUS
SYSTEM TUMORS
Endash
CBTRUS developed preliminary histology groupings with the aim of improved clinical
relevance ICD-O morphology codes which are used by cancer registries were grouped
based on WHO categories for brain tumors The details of these groupings are shown in
Appendix C
RESULTS
Percentages of Primary Intracranial and CNS Tumors by Tumor Location and by
Microscopic Confirmation
Intracranial tumors comprise more than 94 percent of primary intracranial and CNS
tumors and between 50 and 92 percent of primary intracranial and CNS tumors occur in the
brain (Table 2) The data in this report also show that a slightly greater percentage of
malignant intracranial tumors including malignant brain tumors are microscopically
confirmed compared with corresponding tumors of benign or uncertain behavior (Table 3)
However regardless of tumor behavior the percentages of extracranial CNS tumors that are
microscopically confirmed are higher than the percentages of intracranial tumors that are
confirmed by pathologists (Table 3) Few primary intracranial and CNS tumors are not
microscopically confirmed approximately 11 percent of diagnoses are based only on a clinical
or radiographical (without microscopy) assessment (Table 4)
Percentages of Malignant and of Nonmalignant Intracranial and CNS Tumors by Location
The relative distribution of nonmalignant intracranial and CNS tumors varies by
primary site While greater than 90 percent of malignant intracranial and CNS tumors occur
in the brain (Table 5) only 9 to 26 percent of the nonmalignant tumors occur as parenchymal
tumors (Table 6) Nonmalignant tumors comprised a significant portion of the primary
intracranial and CNS tumors reported by the sources The ratios of nonmalignant to primary
malignant intracranial and CNS tumors reported by CBTRUS MCSS and NCDB were 09
10 and 05 respectively (Table 7)
Percentages of Malignant and of Nonmalignant Intracranial and CNS Tumors by Histology
Among the malignant primary intracranial and CNS tumors neuroepithelial (ie
astrocytic) tumors represent 83 to 90 percent of the cases depending on the data source
Page 18
APPENDIX E lymphomashemopoietic tumors 6 to 11 percent tumors of the meninges 1 to 2 percent and
tumors of cranial and spinal nerves 02 percent (Table 8) For nonmalignant primary
intracranial and CNS tumors tumors of the meninges represent 48 to 59 percent of the cases
tumors of the sellar region (including pituitary tumors and craniopharyngiomas) 21 to 26
percent tumors of cranial and spinal nerves 11 to 20 percent and neuroepithelial tumors 4 to
5 percent (Table 9)
Percentages of Primary Intracranial and CNS Tumors by Method of Case Finding (MCSS)
Case finding audits by the MCSS occur on an annual basis in all pathology laboratories in
Minnesota and include the review of surgerypathology cytology autopsy and hematology
records These audits enable the registry to ensure that there is complete reporting of cases of
malignant and nonmalignant tumors In tables 10 through 13 data from MCSS on primary
intracranial and CNS tumors are presented by method of case finding The two methods of case
finding are routine reporting and special efforts A case was found by routine reporting if one
or more reports received before the close-out date for a given diagnosis year was initiated by a
hospital or nonhospital facility In contrast a case was found by special efforts if all reports of that
case received before the close-out date were requested as a result of pathology laboratory audits
The data in Table 10 indicate that routine reporting of nonmalignant tumors was less complete
compared with reporting for malignant tumors The percentages of intracranial tumor cases that
were found by special efforts have varied from year to year but the trend suggests that routine
reporting may be improving (Table 11) The greatest improvement has been in the coverage of
nonbrain parenchymal tumors (ie pituitarypineal and other intracranial) The small numbers of
autopsy-only tumors were more likely to be found by special case finding efforts than by other
methods of microscopic confirmation (data not shown)
Most hospitals in Minnesota have cancer registries through which their tumor cases are
reported However some of the cases that are seen at hospitals with registries are reported only
through pathology laboratories affiliated with the hospitals Approximately 80 percent
(14511776) of the cases of nonmalignant intracranial tumors in the MCSS data base were
reported by hospitals with registries (Table 12) eighty-five percent (12261451) of these cases
were reported by the hospitals registries (Table 13)The remaining 15 percent (2251451) of the
Page 19
Endash
DATA COLLECTION
OF PRIMARY
CENTRAL NERVOUS
SYSTEM TUMORS
Endash0
cases were reported through the pathology laboratories affiliated with the hospitals with registries
(ie they were not accessioned by the registries) (Table 13) The percentages of cases of
nonmalignant tumors that were reported only by the pathology laboratories at facilities having
cancer registries can be viewed as a measure of how frequently the registries failed to accession
the cases Of the 225 nonaccessioned tumors half would have been missed without the MCSS
case finding audits of pathology laboratories (Table 13)
Percentages of Hospital Cancer Registries That Accessioned Malignant and Nonmalignant
Intracranial and CNS Tumors (NCDB)
Based on data from NCDB more than 1500 hospitals accessioned cases with either
malignant or nonmalignant intracranial and CNS tumors and approximately 800 hospitals
accessioned extracranial cases Cases with tumors that involved the cranial or spinal meninges or
the pituitary gland were more likely to be reported by hospitals that accessioned nonmalignant
primary intracranial and CNS tumors than by hospitals that accessioned only malignant tumors
(Table 14)
DISCUSSION
The findings for this report indicate that collection and reporting of incidence data for
primary malignant intracranial and other CNS tumors are well standardized However substantial
variation exists in the processes of collecting and reporting nonmalignant tumor data One
obstacle is that not all hospitals have cancer registries Another problem is that not all hospitals
with registries accession cases of nonmalignant tumors Data from Minnesota (Table 13) suggest
that approximately 85 percent of cases of nonmalignant intracranial tumors are accessioned by
hospital registries However nonaccessioned CNS cases are less likely to be routinely reported to
the central registry (Table 13) These differences in collection and reporting practices among the
registries make it difficult to assess the burden of primary intracranial and CNS tumors
Terminology for describing intracranial and CNS tumors is also not standardized For
example although the pituitary gland and pineal glands are not technically part of the CNS
tumors that involve these organs are often included in the term CNS tumors On the other hand
some consider the eye to be intracranial however CNS tumors generally do not include the
Page 20
APPENDIX E eyes Although the World Health Organization (WHO) has published a list of histologic
groupings at present no single comprehensive list of histologic groupings exists for intracranial
and CNS tumors Since the International Classification of Childhood Cancer (ICCC) is based on
histologic type rather than site certain benign histologies of sites other than brainCNS (eg non-
CNS ependymomas) would not be included in the BTWGs primary intracranial and CNS
histology groupings (Appendix D) Thus the variation in incidence estimates of primary
intracranial and CNS tumors may be attributable in part to the variation in the definitions of
these tumors In addition differences in cancer registry training and procedures may contribute to
nonreporting and inconsistent reporting of the tumors
The BTWG discussed the feasibility of conducting a random sampling procedure as an
alternative to complete enumeration and ongoing surveillance of nonmalignant brain tumors It
was agreed that this technique would not be valid or feasible for the following reasons
1 If a random sample of incident brain tumors were desired a complete list would be
needed first (a sampling frame is required)
2 If a survey method were used to identify brain tumors in the general population (eg
random digit dialing or other general population survey techniques) the information
needed could not be obtained for several reasons
- Either a prohibitively large numbers of individuals would have to be surveyed or
else only a very small number of brain tumors could be identified given the rarity
and sometimes short survival time
- The brain tumors identified would not be representative of all brain tumors that
occur because people who had survived their brain tumors would be more
likely to be identified
- The incidence rate would still not be known since cross-sectional surveys only
identify disease prevalence
3 If a sample of hospitals were selected to contribute data the tumors included would not
represent the entire spectrum of brain tumors because those that were diagnosed and
treated outside of the hospital setting would be excluded
Page 21
Endash
DATA COLLECTION
OF PRIMARY
CENTRAL NERVOUS
SYSTEM TUMORS
Endash
An alternative approach to sampling and the least troublesome would be to conduct
population-based surveillance only in certain geographic areas of the country If one assumes that
the etiology of brain tumors does not differ from one area of the country to another then the
scientific validity of studies based on this type of sampling would not be a problem However
given the rarity of some types of brain tumors sufficient numbers for study may not be available
unless the vast majority of the nations population were covered by population-based data
collection Also geographic areas without population-based surveillance would have no data to
use for assessing local trends or variations in brain tumor occurrence
In the absence of standard tumor registration procedures and training special case finding
efforts by central registries may be necessary to ensure that complete data are collected for
nonmalignant intracranial and CNS tumors Data from MCSS (Table 10) which has a legal
requirement for reporting nonmalignant intracranial tumors and performs 100 percent case finding
audits in all laboratories indicate that only 80 percent of nonmalignant tumors were routinely
reported In contrast routine reporting accounted for more than 95 percent of malignant
intracranial and CNS tumors Nonmalignant cases in Minnesota that were not accessioned by
hospital registries had a 50 percent chance of being routinely reported to the central registry
however these were only microscopically confirmed cases
Completeness of reporting is critical to cancer registries Accurate case counts are
necessary to assess the burden of cancer to guide cancer control program planning to prioritize
the allocation of health resources and to facilitate epidemiologic research Most central cancer
registries have state laws that mandate reporting of cases by physicians and by hospitals
laboratories and other facilities that provide screening diagnostic or therapeutic services
Complete reporting of nonmalignant intracranial and CNS tumors would be greatly
improved if reporting requirements of the COC central cancer registries SEER and the
National Program of Cancer Registries (NPCR) were changed to require the collection of
information for these tumors However this requirement would have many implications
including an increase in work load as well as associated costs for reporting facilities An estimated
14 percent of all new cancer cases diagnosed in 1998 will involve invasive brain and other
nervous system tumors7 since the numbers of benign and invasive brain and other CNS tumors
Page 22
Endash
APPENDIX E diagnosed annually are similar facilities that presently do not accession nonmalignant cases could
expect an approximately 14 percent increase in the total number of CNS cases collected by the
registry Some estimates of the percentage of brain tumors have been lower (05 percent)36 and
others have been higher (9 percent)37 therefore the extent to which the workload would be
affected may vary The data in this report suggest that if reporting of nonmalignant intracranial
and CNS tumors were required the total number of cases of tumors for these anatomic sites
would double for facilities that presently report only malignant tumors This is consistent with the
findings of Davis et al36 who reported that the incorporation of benign brain tumors into the
cancer-reporting systems of four central registries increased the overall incidence of brain cancer
by 49 percent Forty percent (913) of the hospital registries that submitted data to the NCDB did
not report nonmalignant brain tumors These registries could expect up to a 50 percent increase in
the number of intracranial and CNS tumors reported nonregistry facilities which represent
approximately 20 percent of cases reported to central cancer registries could expect a similar
increase Also central cancer registries that currently do not require reporting of nonmalignant
intracranial and CNS tumors could expect increases in their workloads as a result of the
additional time spent on processing and quality control procedures and training The lack of
standard definitions and collection and reporting guidelines would make these tasks more time-
consuming as well
For some central cancer registries that want to expand their reporting requirements to
include nonmalignant intracranial and CNS tumors a change in current legislation andor
regulations may be needed These changes could involve several months of lead time if public
hearings or other legal procedures are necessary In other states the reporting of these tumors is
not required in either their legislation or regulations in these situations hospitals have been asked
to voluntarily report the cases For example in Massachusetts the reporting of benign brain
tumors is not required by law but hospitals have been reporting these cases since 1982 However
the completeness of data reported on a voluntary basis is difficult to assess For public health
surveillance systems a mandate to report is the basic requirement of a comprehensive higher
quality system
DATA COLLECTION
OF PRIMARY
CENTRAL NERVOUS
SYSTEM TUMORS
If COC SEER NPCR and central cancer registries changed their reporting requirements
to include nonmalignant intracranial and CNS tumors the registry manuals disseminated by these
programs and registries would also need to be modified to include new definitions of reportable
diagnoses All reporting facilities would have to be notified of the new requirements To ensure
complete reporting from registries additional training of registrars should be expected Case
finding methods may need to be modified in order to identify the new cases and sources of
information Central cancer registries would also need to increase their case finding audits The
inclusion of nonmalignant tumors would also necessitate changes to other data items such as
sequence number Hospital and central cancer registries would need to consider adding WHO
brain tumor grade as an additional data item
Finally the software used by reporting facilities and by central registries would need to be
modified to accept nonmalignant morphology and behavior codes Also edits programs would
need to be modified to include these additions and to accept a nonmalignant sequence numbering
procedure
Before reporting requirements for primary intracranial and CNS tumors could be changed
feasibility studies would have to be conducted to determine whether such changes should be
recommended Two SEER special studies are under way to evaluate the impact of requiring the
collection of benign brain tumors on case finding cost quality control and training However
additional studies may be required
Page 24
Endash
APPENDIX E
RECOMMENDATIONS OF THE BRAIN TUMOR WORKING GROUP
1 We recommend the following standard definition for collecting precise data for all primary
intracranial and central nervous system tumors
Primary intracranial and central nervous (CNS) tumors are primary tumors occurring in
the following sites irrespective of histologic type or behavior brain meninges spinal
cord cauda equina cranial nerves and other parts of the CNS pituitary gland pineal
gland and craniopharyngeal duct (see Appendix B)
2 We recommend the development of a standard site and histology definition for tabulating
estimates of these tumors to allow comparability of information across registries Pathologists
the North American Association of Central Cancer Registries (NAACCR) the Commission
on Cancer (COC) the Surveillance Epidemiology and End Results (SEER) Program the
National Program of Cancer Registries (NPCR) and the International Agency for Research
on Cancer (IARC) need to be involved in developing this standard
3 We recommend collection of data for primary intracranial and extracranial CNS tumors by all
registries hospital- and central-based This effort will necessitate a change in the COC
requirements and will increase costs to the hospital-based programs Federal funding should be
allocated to supplement the additional transition and ongoing data collections costs that will be
incurred by central registries Before additional data collection is implemented we recommend
a pilot study should be conducted to assess the procedures and quality control functions
needed as well as the costs of collecting data for these tumors
4 We recommend that the appropriate government and professional organizations be involved in
carrying out the development and implementation of special training programs and curricula for
central registry hospital registry and laboratory personnel as well as the development of
computerized edit-checking procedures Training for reporting and tabulating primary
intracranial and CNS tumors should be offered on a regular basis
Page 25
Endash
DATA COLLECTION
OF PRIMARY
CENTRAL NERVOUS
SYSTEM TUMORS
Endash
REFERENCES
1 Davis F Preston-Martin S Epidemiology of brain tumors In Bigner DD McLendon RE Bruner JM eds Russell and Rubinsteins pathology of tumors of the nervous system ed 6 London Arnold Publishing 19965-45
2 World Health Organization (WHO) (1976) International classification of diseases foroncology ed 1 Geneva World Health Organization
3 World Health Organization (WHO) (1990) International classification of diseases foroncology ed 2 Geneva World Health Organization
4 Kleihues P Burger PC Scheithauer BW The new WHO classification of brain tumorsBrain Pathol 19933255-268
5 Thapar K Laws ER Tumors of the central nervous system In Murphy GP Lawrence WJr Lenhard RE Jr eds Textbook of clinical oncology ed 2 Atlanta American CancerSociety 1995378-410
6 Walker AE Robins M Weinfield FD Epidemiology of brain tumors the national survey ofintracranial neoplasms Neurol 198535219-226
7 Ries LAG Kosary CL Hankey BF Miller BA Edwards BK (eds) SEER Cancer StatisticsReview 1973-1995 National Cancer Institute Bethesda MD 1998
8 Cancer Facts amp Figures - 1998 American Cancer Society Atlanta Georgia 19989 Davis FG Bruner JM Surawicz TS The rationale for standardized registration and reporting
of brain and central nervous system tumors in population-based cancer registriesNeuroepidemiol 199716308-316
10CBTRUS (1996) First annual report 1995 Central Brain Tumor Registry of the UnitedStates Chicago Illinois
11 Preston-Martin S Epidemiology of primary CNS neoplasms Neurol Clinics 199614273-290
12 Greig NH Ries LG Yancik R Rapoport SI Increasing annual incidence of primary malignantbrain tumors in the elderly J Natl Cancer Inst 1991 831621-1624
13 Mao Y Desmeules M Semenciw RM Hill G Gaudette L Wigle DT Increasing brain cancerrates in Canada Can Med Assoc J 19911451583-1591
14 Frelick R Huang P Topham A Brain and central nervous system tumors Delaware 1980 to1989 Del Med J 199264571-573
15 Davis DL Ahlbom A Hoel D Percy C Is brain cancer mortality increasing in industrialcountries Am J Ind Med 199119421-431
16 Helseth A Increasing incidence of primary central nervous system tumors in the elderly Realincrease or improved detection J Natl Cancer Inst 1993851871-1872
17 Modan B Wagener D Feldman JJ Rosenberg HM Feinleib M Increased mortality frombrain tumors A combined outcome of diagnostic technology and change of attitude towardthe elderly Am J Epidemiol 19921351349-1357
18 Polednak AP Time trends in the incidence of brain and central nervous system cancers inConnecticut J Natl Cancer Inst 1991831679-1681
19 Boyle P Maissonneuve P Saracci R Muir CS Is the increase in incidence of primarymalignant brain tumors real J Natl Cancer Inst 1990201594-1596
Page 26
APPENDIX E 20 Preston-Martin S Descriptive epidemiology of primary tumors of the brain cranial nerves
and spinal meninges in Los Angeles County Neuroepidemiol 19898283-29521 Helseth A Mork SJ Neoplasms of the central nervous system in Norway Epidemiological
characteristics of intracranial gliomas according to histology APMIS 97 1989547-55522 Gurney JG Davis S Severson RK Fang J-Y Ross JA Robison LL Trends in cancer
incidence among children in the United States Cancer 199678532-54123 Gurney JG Ross JA Wall DA Bleyer WA Severson RK Robison LL Infant cancer in the
US histology-specific incidence trends 1973-1992 J Pediatr Hem Onc 199719428-43224 Nishio S Takeshita I Morioka T Fukui M Primary intracranial squamous cell carcinomas
report of two cases Neurosurgery 199537329-33225 Freilich RJ Thompson SJ Walker RW Rosenblum MK Adenocarcinomatous transformation
of intracranial germ cell tumors Am J Surg Pathol 199519537-54426Yuan S Miller DW Barnett GH Hahn JF Williams BR Identification and characterization of
human beta 2-chimaerin association with malignant transformation in astrocytoma CancerResearch 1995 553456-3461
27 Preston-Martin S Mack WJ Neoplasms of the nervous system In Schoenfeld D Fraumeni JFJr eds Cancer epidemiology and prevention ed 2 New York Oxford University Press19961231-1281
28 Riggs JE Rising primary malignant brain tumor mortality in the elderly A manifestation ofdifferential survival Arch of Neurol 199552571-575
29 Davis FG Freels S Grutsch J Barlas S Brem S Survival rates in patients with primarymalignant brain tumors stratified by patient age and tumor histological type an analysisbased on Surveillance Epidemiology and End Results (SEER) data 1973-1991J Neurosurg 1998881-10
30 Surawicz TS Davis F Freels S Laws ER Menck HR Brain tumor survival results from theNational Cancer Data Base (Accepted for publication in J Neuro-Oncol)
31 Bondy ML Lustbader ED Buffler PA Schull WJ Hardy RJ Strong LC Geneticepidemiology of childhood brain tumors Genet Epidemiol 19918253-267
32 Preston-Martin S Monroe K Lee P Bernstein L Kelsey J Henderson S Forrester DHenderson B Spinal meningiomas in women in Los Angeles County Investigation of anetiologic hypothesis Cancer Epidemiol Biomarkers Prev 19954333-339
33 Davis JR Brownson RC Garcia R Bentz BJ Turner A Family pesticide use and childhoodbrain cancer Arch Environ Contam Toxicol 19932487-92
34 Commission on Cancer General principles and coding In Standards of the Commission on Cancer vol II Registry Operations and Data Standards American College of SurgeonsChicago Illinois 1996
35 Central Brain Tumor Registry of the United States (CBTRUS) 1997 State Survey of BenignBrain Tumor Collection Chicago Illinois 1997
36 Davis FG Malinski N Haenszel W Chang J Flannery J Gershman S Dibble R Bigner DDPrimary brain tumor incidence rates in the four United States regions 1985-1989 A pilotstudy Neuroepidemiol 199615103-112
37 Schoenberg BS Christine BW Whisnant JP The descriptive epidemiology of primaryintracranial neoplasms the Connecticut experience Am J Epidemiol 1976104499-510
Page 27
Endash
DATA COLLECTION
OF PRIMARY
CENTRAL NERVOUS
SYSTEM TUMORS
TAB
LE 1
C
OM
PAR
ISO
N O
F R
EGIS
TRIE
S SU
PPLY
ING
DA
TA O
N P
RIM
AR
Y I
NTR
AC
RA
NIA
L A
ND
CEN
TRA
L N
ERV
OU
S SY
STEM
TU
MO
RS
IN T
HE
UN
ITED
STA
TES
Cen
tral B
rain
Tum
or R
egis
try o
fth
e U
nite
d St
ates
(CBT
RUS)
Min
neso
ta C
ance
rSu
rvei
llanc
e Sy
stem
(MC
SS)
ACo
SN
a tio
nal C
ance
r Dat
a B
ase
(NCD
B)
Surv
eilla
nce
Epid
emio
logy
and
End
Res
ults
Pro
gram
(SEE
R)
Purp
ose
ldquoCB
TRU
S ce
ntra
lizes
pop
ulat
ion-
base
d in
cide
nce
data
on
all b
rain
tum
ors a
nd u
ses o
ther
exi
stin
gda
ta re
sour
ces t
o ch
arac
teriz
e th
ein
cide
nce
mor
talit
y a
nd su
rviv
alof
pat
ient
s with
bra
in tu
mor
s rdquo
The
MC
SS c
olle
cts i
nfor
mat
ion
onal
l can
cers
dia
gnos
ed si
nce
1988
amon
g M
inne
sota
resi
dent
s Th
e M
CSS
is p
opul
atio
n-ba
sed
path
olog
y-ba
sed
and
is a
n ac
tive
syste
m
ldquoThe
goa
l of t
he N
CD
B is
to p
rese
nt a
n an
nual
sum
mar
y of
pat
ient
car
e fo
r cas
es o
f can
cer
diag
nose
d an
d tre
ated
at h
ospi
tals
thro
ugho
utth
e co
untry
rdquo
ldquoA c
ontin
uing
pro
ject
of th
e N
CI
the
SEER
prog
ram
col
lect
sca
ncer
dat
a on
aro
utin
e ba
sis f
rom
desi
gnat
ed p
opul
atio
n-ba
sed
canc
er re
gist
ries
in v
ario
us a
reas
of t
heco
untry
Targ
et p
opul
atio
n Th
e po
pula
tions
cov
ered
by
regi
strie
s in
Ari
zona
Col
orad
oC
onne
ctic
ut D
elaw
are
Idah
oM
aine
Mas
sach
uset
ts
Min
neso
ta M
issou
ri M
onta
na
Nor
th C
arol
ina
and
Uta
h
The
CB
TRU
S po
pula
tion
repr
esen
ts a
non
rand
om 1
5pe
rcen
t sam
ple
of th
e U
S
popu
latio
n
The
popu
latio
n of
Min
neso
ta
The
popu
latio
ns tr
eate
d at
par
ticip
atin
gho
spita
ls in
the
50 st
ates
the
Dist
rict
of
Col
umbi
a a
nd P
uert
o R
ico
NC
DB
is n
ot a
pop
ulat
ion-
base
d re
gist
ry
At
pres
ent
it is
est
imat
ed to
cov
er a
ppro
xim
atel
y57
per
cent
of t
otal
cas
es n
atio
nwid
e
The
popu
latio
nsco
vere
d by
the
state
regi
strie
s in
Con
nect
icut
Haw
aii
Iow
a N
ew M
exic
o
and
Uta
h a
s wel
l as
the
regi
onal
regi
strie
sin
Atla
nta
Geo
rgia
D
etro
it M
ichi
gan
San
Fran
cisc
o-O
akla
nd C
alifo
rnia
an
d Se
attle
-Pug
etSo
und
Was
hing
ton
The
SEER
pop
ulat
ion
repr
esen
ts a
nonr
ando
m 1
4 pe
rcen
tsa
mpl
e of
the
US
po
pula
tion
Page
28
Endash
APPENDIX E
Cen
tral B
rain
Tum
or R
egis
try o
fth
e U
nite
d St
ates
(CBT
RUS)
Min
neso
ta C
ance
rSu
rvei
llanc
e Sy
stem
(MC
SS)
ACo
SN
a tio
nal C
ance
r Dat
a B
ase
(NCD
B)
Surv
eilla
nce
Epid
emio
logy
and
End
Res
ults
Pro
gram
(SEE
R)
Type
of
prim
ary
intra
cran
ial
and
cent
ral n
ervo
us sy
stem
tum
ors r
epor
ted
Dat
a on
new
ly-d
iagn
osed
cas
es o
fbe
nign
and
mal
igna
nt p
rimar
ybr
ain
tum
ors b
ased
on
ICD
-Oco
des
Dat
a on
new
ly-d
iagn
osed
m
i cro
scop
ical
ly-c
onfir
med
tum
ors
of th
e ce
ntra
l ner
vous
syste
m
incl
udin
g pi
tuita
ry a
nd p
inea
lgl
ands
Hos
pita
ls v
olun
taril
y su
bmit
full
anal
ytic
canc
er re
gist
ry c
asel
oads
with
dat
a ite
ms a
ndco
des d
efin
ed b
y th
e C
omm
issio
n on
Can
cer
(CO
C) f
or h
ospi
tal c
ance
r reg
istri
es
Mos
tpa
rtici
patin
g ho
spita
ls h
ave
prog
ram
sap
prov
ed b
y C
OC
or a
re e
stab
lishi
ng p
rogr
amap
prov
al
NC
DB
cal
ls fo
r dat
a do
not
lim
itca
ses b
y m
alig
nant
beh
avio
r bu
t acc
essi
onin
gof
non
-mal
igna
nt c
ases
is n
ot re
quire
d fo
rpr
ogra
m a
ppro
val
Fifty
-nin
e pe
rcen
t of t
heho
spita
ls th
at su
bmitt
ed a
ny in
tracr
ania
lCN
Sca
ses d
iagn
osed
dur
ing
1989
-199
4 su
bmitt
edat
leas
t one
non
mal
igna
nt c
ase
The
NC
DB
data
in th
is re
port
are
limite
d to
the
case
ssu
bmitt
ed b
y th
ese
hosp
itals
(82
perc
ent o
f all
intra
cran
ial a
nd e
xtra
cran
ial c
entra
l ner
vous
syste
m c
ases
on
file)
Tren
ds in
the
inci
denc
e m
orta
lity
and
patie
nt su
rviv
al o
fbr
ain
tum
ors i
n th
eU
S H
owev
er S
EER
does
not
col
lect
info
rmat
ion
on b
enig
nan
d un
certa
in b
rain
tum
ors
Oth
er c
omm
ents
D
uplic
ate
canc
er re
gist
ratio
ns c
anno
t be
iden
tifie
d by
the
parti
cipa
ting
regi
strie
s
The
MC
SS p
erfo
rms 1
00 p
erce
ntca
se fi
ndin
g au
dits
in a
ll pa
thol
ogy
labo
rato
ries o
n an
ann
ual b
asis
Th
eref
ore
the
data
from
the
MC
SSm
ight
be
cons
ider
ed a
ldquobe
st-ca
sesc
enar
iordquo
in te
rms o
f com
plet
enes
sof
repo
rting
for m
icro
scop
ical
ly-
conf
irmed
tum
ors
Rep
ort d
uplic
atio
n fo
r 198
9-19
94 in
tracr
ania
lan
d ex
tracr
ania
l cen
tral n
ervo
us sy
stem
repo
rts w
as 6
7 p
erce
nt
How
ever
the
NC
DB
data
in T
able
s 2 th
roug
h 9
are
base
d on
undu
plic
ated
repo
rts
Page
29
Endash
DATA COLLECTION
OF PRIMARY
CENTRAL NERVOUS
SYSTEM TUMORS
TABLE 2 NUMBER AND PERCENT OF PRIMARY INTRACRANIAL AND CENTRAL NERVOUS SYSTEM TUMORS BY TUMOR LOCATION
Locationa CBTRUSb
Number () MCSSc
Number () NCDBd
Number () SEERe
Number ()
Intracranial 13084 (947) 3600 (936) 66322 (955) 10196 (969)
Brain 7999 (579) 1924 (500) 48527 (699) 9721 (924)
Meninges 2719 (197) 838 (218) 9365 (135) 139 (13)
Pituitarycraniopharygealduct
1491 (108) 530 (138) 4958 (71) 30 (03)
Pineal 74 (05) 21 (05) 477 (07) 80 (08)
Other central nervous systemincluding cranial nerves
801 (58) 287 (75) 2995 (43) 226 (22)
Extracranial 730 (53) 245 (64) 3137 (45) 322 (31)
Spinal cord 497 (36) 47 (38) 2395 (34) 313 (30)
Spinal meninges 233 (17) 98 (25) 742 (11) 9 (01)
TOTAL 13814 (100) 3845 (100) 69459 (100) 10518 (100)
Note Reported data are incident cases from 1989-1994 except for CBTRUS data which are from 1990-1993
aRefer to the sites in Appendix BbCentral Brain Tumor Registry of the United States cMinnesota Cancer Surveillance System (microscopically confirmed cases only)dNational Cancer Data Base (limited to cases reported by hospitals that accessioned nonmalignant cases) eSurvival Epidemiology and End results Program (malignant cases only)
Page 30
Endash0
TABL
E 3
RO
W P
ERCE
NT
DIS
TRIB
UTI
ON
OF
PRIM
ARY
INTR
ACR
AN
IAL
AN
D C
ENTR
AL
NER
VO
US
SYST
EM T
UM
ORS
BY
TU
MO
R B
EHA
VIO
RA
ND
MIC
ROSC
OPI
C C
ON
FIRM
ATI
ON
Loca
tiona
CB
TRU
Sb M
CSSc
NC
DB
d SE
ERe
Tota
l Pe
rcen
tM
icro
Co
nfirm
ed
Perc
ent
Not
Mic
ro
Conf
irmed
Tota
l Pe
rcen
tM
icro
Co
nfirm
ed
Perc
ent
Not
Mic
ro
Conf
irmed
Tota
l Pe
rcen
tM
icro
Co
nfirm
ed
Perc
ent
Not
Mic
ro
Conf
irmed
Tota
l Pe
rcen
tM
icro
Co
nfirm
ed
Perc
ent
Not
Mic
ro
Conf
irmed
Intra
cran
ial
130
84
867
13
3
360
0 10
0 N
A
663
22
887
11
3
101
96
871
12
9
Mal
igna
nt
717
1 89
2
108
1
824
100
NA
44
801
91
3
87
101
96
871
12
9
Beni
gn a
ndu n
certa
in
591
3 83
5
165
1
776
100
NA
21
521
83
2
168
N
A
NA
N
A
Bra
in
799
9 88
2
118
1
924
100
NA
48
527
90
2
98
972
1 87
3
127
Mal
igna
nt
686
2 89
6
104
1
746
100
NA
42
622
91
5
85
972
1 87
3
127
Beni
gnan
dun
certa
in
113
7 80
6
194
17
8 10
0 N
A
590
5 80
6
194
N
A
NA
N
A
Extra
cran
ial
730
962
3
8 24
5 10
0 N
A
313
7 96
0
40
322
957
4
3
Mal
igna
nt
242
934
6
6 60
10
0 N
A
148
3 96
6
34
322
957
4
3
Beni
gn a
ndu n
certa
in
488
975
2
5 18
5 10
0 N
A
165
4 95
5
45
NA
N
A
NA
TOTA
Lf 13
814
87
2
128
3
845
100
NA
69
459
89
0
110
10
518
87
4
126
Mal
igna
nt
741
3 89
4
106
1
884
100
NA
46
284
91
5
85
105
18
874
12
6
Beni
gn a
ndu n
certa
in
640
1 84
6
154
1
961
100
NA
23
175
84
1
159
N
A
NA
N
A
Not
e R
epor
ted
data
are
inci
dent
cas
es fr
om 1
989-
1994
exc
ept f
or C
BTR
US
data
whi
ch a
re fr
om 1
990-
1993
a Refe
r to
the
site
code
s in
App
endi
x B
b Cent
ral B
rain
Tum
or R
egist
ry o
f the
Uni
ted
Stat
es
c Min
neso
ta C
ance
r Sur
veill
ance
Sys
tem
(mic
rosc
opic
ally
con
firm
ed c
ases
onl
y)
d Nat
iona
l Can
cer D
ata
Base
(lim
ited
to c
ases
repo
rted
by h
ospi
tals
that
acc
essio
ned
nonm
alig
nant
cas
es)
e Surv
eilla
nce
Epi
dem
iolo
gy a
nd E
nd R
esul
ts Pr
ogra
m (m
alig
nant
cas
es o
nly)
f In
clud
es in
tracr
ania
l and
ext
racr
ania
l cas
es
NA
= N
ot a
pplic
able
Page
31
APPENDIX E
Endash
DATA COLLECTION
OF PRIMARY
CENTRAL NERVOUS
SYSTEM TUMORS
TABLE 4 NUMBER AND PERCENT OF PRIMARY INTRACRANIAL AND CENTRAL NERVOUS SYSTEM TUMORS BY DIAGNOSTIC CONFIRMATION
DiagnosticConfirmation
CBTRUSa
Number () MCSSb
Number () NCDBc
Number () SEERd
Number ()
Positive microscopy
12087 (875) 3845 (100) 61818 (890) 9188 (874)
Radiographywithout microscopy
1306 (95) NA 6759 (97) 1015 (97)
Clinical 204 (15) NA 484 (07) 98 (09)
Unknown 217 (15) NA 398 (06) 217 (21)
TOTAL 13814 (100) 3845 (100) 69459 (100) 10518 (100)
Note Reported data are incident cases from 1989-1994 except for CBTRUS data which are from 1990-1993
aCentral Brain Tumor Registry of the United Statesb Minnesota Cancer Surveillance System (microscopically confirmed cases only) cNational Cancer Data Base (limited to cases reported by hospitals that accessioned nonmalignant cases)dSurveillance Epidemiology and End Results Program (malignant cases only)NA = Not applicable
Page 32
Endash
Page 32
TABLE 4 NUMBER AND PERCENT OF PRIMARY INTRACRANIAL AND CENTRALNERVOUS SYSTEM TUMORS BY DIAGNOSTIC CONFIRMATION
DiagnosticConfirmation
CBTRUSa
Number ()MCSSb
Number ()NCDBc
Number ()SEERd
Number ()
Positivemicroscopy
12087 (875) 3845 (100) 61818 (890) 9188 (874)
Radiographywithout microscopy
1306 (95) NA 6759 (97) 1015 (97)
Clinical 204 (15) NA 484 (07) 98 (09)
Unknown 217 (15) NA 398 (06) 217 (21)
TOTAL 13814 (100) 3845 (100) 69459 (100) 10518 (100)
Note Reported data are incident cases from 1989-1994 except for CBTRUS data which are from 1990-1993
aCentral Brain Tumor Registry of the United Statesb Minnesota Cancer Surveillance System (microscopically confirmed cases only)cNational Cancer Data Base (limited to cases reported by hospitals that accessioned nonmalignant cases)dSurveillance Epidemiology and End Results Program (malignant cases only)NA = Not applicable
APPENDIX E
TABLE 5 NUMBER AND PERCENT OF MALIGNANT PRIMARY INTRACRANIAL AND CENTRAL SYSTEM TUMORS BY TUMOR LOCATION
Locationa CBTRUSb
Number () MCSSc
Number () NCDBd
Number () SEERe
Number ()
Intracranial 7171 (977) 1824 (968) 44801 (968) 10196 (969)
Brain 6862 (926) 1746 (927) 42622 (921) 9721 (924)
Meninges 98 (13) 23 (12) 581 (13) 139 (13)
Pituitarycraniopharyngealduct
37 (05) 13 (07) 189 (04) 30 (03)
Pineal 58 (08) 20 (11) 378 (08) 80 (08)
Other central nervous systemincluding cranial nerves
116 (16) 22 (12) 1031 (22) 226 (21)
Extracranial 242 (33) 60 (32) 1483 (32) 322 (31)
Spinal cord 234 (32) 60 (32) 1410 (30) 313 (30)
Spinal meninges 8 (01) 0 73 (02) 9 (01)
TOTAL 7413 (100) 1884 (100) 46284 (100) 10518 (100)
Note Reported data are incident cases from 1989-1994 except for CBTRUS data which are from 1990-1993
aRefer to the site codes in Appendix BbCentral Brain Tumor Registry of the United States cMinnesota Cancer Surveillance System (microscopically confirmed cases only)dNational Cancer Data Base (limited to cases reported by hospitals that accessioned nonmalignant cases) eSurvival Epidemiology and End Results Program (malignant cases only)
Page 33
Endash
DATA COLLECTION
OF PRIMARY
CENTRAL NERVOUS
SYSTEM TUMORS
TABLE 6 NUMBER AND PERCENT OF PRIMARY INTRACRANIAL AND CENTRAL NERVOUS SYSTEM TUMORS OF BENIGN AND UNCERTAIN BEHAVIOR BY TUMOR LOCATION
Locationa CBTRUSb
Number () MCSSc
Number () NCDBd
Number () SEERe
Number ()
Intracranial 5913 (924) 1776 (906) 21521 (929) NA
Brain 1137 (178) 178 (91) 5905 (255) NA
Meninges 2621 (409) 815 (416) 8784 (379) NA
Pituitarycraniopharyngealduct
1454 (227) 517 (264) 4769 (206) NA
Pineal 16 (02) 1 (lt01) 99 (04) NA
Other central nervous systemincluding cranial nerves
685 (107) 265 (135) 1964 (85) NA
Extracranial 488 (76) 185 (94) 1654 (71) NA
Spinal cord 263 (41) 87 (44) 985 (42) NA
Spinal meninges 225 (35) 98 (50) 669 (29) NA
TOTAL 6401 (100) 1961 (100) 23175 (100) NA
Note Reported data are incident cases from 1989-1994 except for CBTRUS data which are from 1990-1993
aRefer to the site codes in Appendix BbCentral Brain Tumor Registry of the United States cMinnesota Cancer Surveillance System (microscopically confirmed cases only)dNational Cancer Data Base (limited to cases reported by hospitals that accessioned nonmalignant cases) eSurveillance Epidemiology and End Results Program (malignant cases only)NA = Not applicable
Page 34
Endash
APPENDIX E TABLE 7 NUMBER AND PERCENT OF PRIMARY INTRACRANIAL AND CENTRAL
NERVOUS SYSTEM TUMORS BY TUMOR BEHAVIOR AND LOCATION
BehaviorTumor Locationa
CBTRUSb
Number () MCSSc
Number () NCDBd
Number () SEERe
Number ()
Malignant 7413 (537) 1884 (490) 46284 (666) 10518 (100)
Brain 6862 (497) 1746 (454) 42622 (614) 9721 (924)
Meninges 98 (07) 23 (06) 581 (08) 139 (13)
Pituitarycraniopharyn-geal ductpineal
95 (07) 33 (09) 567 (08) 110 (11)
Other central nervous system includingcranial nerves
116 (08) 22 (06) 1031 (15) 226 (22)
Spinal cord 242 (18) 60 (16) 1483 (21) 322 (31)
Benign 5794 (419) 1787 (465) 20694 (298) NA
Brain 803 (58) 99 (26) 4491 (65) NA
Meninges 2565 (186) 807 (210) 8613 (124) NA
Pituitarycraniopharyn-geal ductpineal
1322 (96) 458 (119) 4330 (62) NA
Other central nervous system includingcranial nerves
678 (49) 263 (68) 1911 (28) NA
Spinal cord 426 (31) 160 (42) 1349 (19) NA
Uncertain 607 (44) 174 (45) 2481 (36) NA
Brain 334 (24) 79 (21) 1414 (20) NA
Meninges 56 (04) 8 (02) 171 (02) NA
Pituitarycraniopharyn-geal ductpineal
148 (11) 60 (16) 538 (08) NA
Other central nervous system includingcranial nerves
7 (01) 2 (01) 53 (01) NA
Spinal cord 62 (05) 25 (07) 305 (04) NA
TOTAL 13814 (100) 3845 (100) 69459 (100) 10518 (100)
Note Reported data are incident cases from 1989-1994 except for CBTRUS data which are from 1990-1993 NA=Not applicableaRefer to the site codes in Appendix B bCentral Brain Tumor Registry of the United States cMinnesota Cancer Surveillance System (microscopically confirmed cases only)dNational Cancer Data Base (limited to cases reported byhospitals that accessioned nonmalignant cases eSurvival Epidemiology and End Results Program (malignant cases only)
Page 35
Endash
DATA COLLECTION
OF PRIMARY
CENTRAL NERVOUS
SYSTEM TUMORS
TABLE 8 NUMBER AND PERCENT OF MALIGNANT PRIMARY INTRACRANIAL AND
CENTRAL NERVOUS SYSTEM TUMORS BY HISTOLOGY GROUPINGS
WHO Histologya
Groupings CBTRUSb
Number () MCSSc
Number () NCDBd
Number () SEERe
Number ()
Neuroepithelial 6477 (874) 1689 (896) 39701 (858) 8676 (825)
Tumors of cranial and spinal nerves
12 (02) 3 (02) 108 (02) 25 (02)
Tumors of meninges
137 (18) 25 (13) 994 (21) 194 (18)
LymphomasHemopoietic
473 (64) 121 (64) 3492 (75) 1099 (105)
Germ cell 70 (09) 20 (11) 403 (09) 97 (09)
Cysts and tumor-like lesions
0 0 0 0
Tumors of sellar region
20 (03) 11 (06) 100 (02) 6 (01)
Local extensions 29 (04) 11 (06) 166 (04) 38 (04)
Unclassifiedunassigned tumorsf
195 (26) 4 (02) 1320 (29) 383 (36)
TOTAL 7413 (100) 1884 (100) 46284 (100) 10518 (100)
Note Reported data are incident cases from 1989-1994 except for CBTRUS data which are from 1990-1993
aRefer to the World Health Organization (WHO) histology groupings in Appendix CbCentral Brain Tumor Registry of the United States cMinnesota Cancer Surveillance System (microscopically confirmed cases only)dNational Cancer Data Base (limited to cases reported by hospitals that accessioned nonmalignant cases) f For MCSS unclassifiedunassigned tumors include one malignant and four nonmalignant histologies which were
not listed in the CBTRUS classification scheme For NCDB unclassifiedunassigned tumors include 319 cases(less than one half percent) which had histologies not assigned by CBTRUS to any other category For SEERunclassifiedunassigned tumors include all malignant histologies occurring in the brainCNS which could not beclassified in one of the above categories based on their 4-digit histologic type
Page 36
Endash
APPENDIX E
TABLE 9 NUMBER AND PERCENT OF PRIMARY INTRACRANIAL AND CENTRAL NERVOUS SYSTEM TUMORS OF BENIGN AND UNCERTAIN BEHAVIOR
BY HISTOLOGY GROUPINGS
WHO Histologya
Groupings CBTRUSb
Number () MCSSc
Number () NCDBd
Number () SEERe
Number ()
Neuroepithelial 275 (43) 91 (46) 1064 (46) NA
Tumors of cranial and spinal nerves
980 (153) 397 (202) 2618 (113) NA
Tumors of meninges
3509 (548) 941 (480) 13667 (590) NA
LymphomasHemopoietic
3 (lt01) 0 7 (lt01) NA
Germ cell 4 (lt01) 1 (01) 25 (01) NA
Cysts and tumor-like lesions
15 (02) 3 (02) 34 (01) NA
Tumors of sellar region
1444 (226) 510 (260) 4749 (205) NA
Local extensions 0 0 0 NA
Unclassifiedunassigned tumorsf
171 (27) 18 (09) 1011 (44) NA
TOTAL 6401 (100) 1961 (100) 23175 (100) NA
Note Reported data are incident cases from 1989-1994 except for CBTRUS which is 1990-1993
aRefer to the World Health Organization (WHO) histology groupings in Appendix CbCentral Brain Tumor Registry of the United States c Minnesota Cancer Surveillance System (microscopically confirmed cases only) dNational Cancer Data Base (limited to cases reported by hospitals that accessioned nonmalignant cases) eSurvival Epidemiology and End Results Program (malignant cases only)dFor MCSS unclassifiedunassigned tumors include one malignant and four nonmalignant histologies which werenot listed in the CBTRUS classification scheme For NCDB unclassifiedunassigned tumors include 319 cases(less than one half percent) which had histologies not assigned by CBTRUS to any other category For SEERunclassifiedunassigned tumors include all malignant histologies occurring in the brainCNS which could not beclassified in one of the above categories based on their 4-digit histologic typeNA = Not applicable
Page 37
Endash
DATA COLLECTION
OF PRIMARY
CENTRAL NERVOUS
SYSTEM TUMORS
TABLE 10 METHOD OF CASE FINDING FOR PRIMARY INTRACRANIAL AND CENTRAL NERVOUS SYSTEM TUMORS BY TUMOR BEHAVIOR AND LOCATION MINNESOTA 1989-1994
Behavior Tumor Locationa
Number of Cases
Percent Found byRoutine
Reporting
Percent Found by Special Efforts
Malignant Brain Cerebral meninges
Pituitarycranio duct pineal Other intracranial
18841746 23 33
22
961 965 957 939
864
39 35 43 61
136 Extracranial 60 883 117 Benign Brain
1787 99
788 838
212 162
Cerebral meninges Pituitarycranio duct
pineal Other intracranial
807 458
263
843 740
779
157 260
221 Extracranial 160 631 369 Uncertain 174 856 144 Brain 79 823 177 Cerebral meninges Pituitarycraniopharyn- geal ductpineal Other intracranial
8 60
2
875 850
1000
125 150
00 Extracranial 25 960 40
TOTAL 3845 876 124
aRefer to the site codes in Appendix B
Page 38
Endash
1989 1990 1991 1992 1993 1994
TOTAL
APPENDIX E TABLE 11 METHOD OF CASE FINDING FOR INTRACRANIALa TUMORS BY DIAGNOSIS YEAR MINNESOTA 1989-1994
DiagnosisYear
Number of
Cases
Percent Found byRoutine
Reporting
Percent Found by
Special Efforts
571 837 163 616 865 135 586 913 87 602 899 101
633 872 128 592 929 71
3600 886 114
aIncludes the brain cerebral meninges pituitary gland pineal gland and otherintracranial tumors (refer to the site codes in Appendix B)
Page 39
Endash
DATA COLLECTION
OF PRIMARY
CENTRAL NERVOUS
SYSTEM TUMORS
TABLE 12 METHOD OF CASE FINDING FOR NONMALIGNANT INTRACRANIALa TUMORS BY TYPE OF FACILITY MINNESOTA 1989-1994
Type of Facility Number of Tumors Percent Found byRoutine
Reporting
Percent Found by Special Efforts
Registry at facility No registry at facility
1451325
859 569
141 431
TOTAL 1776 806 194
aIncludes tumors with benign or uncertain behavior that involve the brain cerebral meningespituitary gland pineal gland or other intracranial sites (refer to the site codes in Appendix B)
TABLE 13 REPORTING METHOD AND SOURCE OF CASE FINDING FOR NON- MALIGNANT INTRACRANIALa TUMORS DIAGNOSED IN HOSPITALS WITH A TUMOR REGISTRY MINNESOTA 1989-1994
Reporting Method Number of Tumors Percent Found byRoutine
Reporting
Percent Found by
Special Efforts
Registry-reportedLaboratory-reported
1226225
925 502
75 498
TOTAL 1451 859 141
aIncludes tumors with benign or uncertain behavior that involve the brain cerebral meningespituitary gland pineal gland or other intracranial sites (refer to the site codes in Appendix B)
Page 40
Endash0
APPENDIX E TABLE 14 HOSPITAL REGISTRY ACCESSIONING OF MALIGNANT AND NON-
MALIGNANT PRIMARY INTRACRANIAL AND CENTRAL NERVOUS SYSTEM TUMORS NCDB 1989-1994
TUMOR Totalb
BEHAVIOR Malignant c Nonmalignantd
Tumor Locationa HospitalsReporting
Number ()
Hospitals Reporting
Number ()
Hospitals Reporting
Number ()
Intracranial 1542 (100) 1526 (100) 900 (99)
Brain 1527 (99) 1519 (gt99) 754 (83)
Meninges 740 (48) 390 (26) 613 (67)
Pituitaryglandcraniopharyn-
geal duct
602 (39) 168 (11) 538 (59)
Pineal gland 319 (21) 277 (18) 79 (9)
Other central nervous system including cranial
nerves
648 (42) 545 (36) 299 (33)
Extracranial 812 (53) 708 (46) 410 (45)
Spinal cord 760 (49) 692 (45) 311 (34)
Spinal meninges 299 (19) 72 (5) 258 (28)
TOTAL Hospitals 1542 (100) 1526 (100) 913 (100)
Note The number of hospitals in each of the second third and fourth columns is the number that submittedreports to the NCDB for any intracranial and central nervous system tumors for the respective malignancystatus Not all hospitals submitted reports for each year during the study period (1989-1994)
aRefer to the site codes in Appendix B bBehavior codes = 0 1 3 cBehavior code = 3 dBehavior codes = 0 1
Page 41
Endash
DATA COLLECTION
OF PRIMARY
CENTRAL NERVOUS
SYSTEM TUMORS
Texas Cancer Registry
1997 CBTRUS State Survey of Benign Brain Tumor Data Collection
State Collection Status
Currently Collecting Benign Tumor Data1 Arizona Cancer Registry since 1981 2 Colorado Central Cancer Registry since 1988 3 Connecticut Tumor Registry since 1965 4 Idaho Cancer Data Registry since 1970 5 Maine Cancer Registry since 1983 6 Massachusetts Cancer Registry since 1982 7 Minnesota Cancer Surveillance System since 1988 8 Montana Central Tumor Registry since 1979 9 New York State Cancer Registry since 1988
10 North Carolina Central Cancer Registry since 1990 11 Utah Cancer Registry since 1966 12 Virginia Cancer Registry since 1994 13 Delaware State Cancer Registry14 Washington State Cancer Registry since 1992 15 passive collection 1979-1994
active collection since 1995
Stopped or Passive Collection of Benign Tumor Data1 New Jersey State Cancer Registry stopped 1979-1995 2 Kansas Cancer Registry stopped 1969-1995 3 New Hampshire State Cancer Registry stopped 1986-1991 4 District of Columbia Cancer Registry stopped 1997 5 Wyoming Cancer Surveillance Program stopped 111996 6 Louisiana Tumor Registry stopped 1992 (passive collection) 7 Illinois State Cancer Registry stopped 111996 8 Missouri Cancer Registry passive collection since 1984 9 South Carolina Central Cancer Registry passive collection since 1996
Beginning Collection of Benign Tumor Data1 North Dakota Cancer Registry began collection 1997 2 Rhode Island Cancer Registry began collection 1998
Page 42
Endash
APPENDIX E
Codes for Primary Intracranial and Central Nervous System Tumors
Note For this report the designation of ldquoprimary intracranial and central nervous system tumorsrdquo includes thefollowing primary tumors of central nervous system sites as well as tumors of the pituitary and pinealglands All histology types within the topography codes are included in the designation of ldquoprimaryintracranial and CNS tumors The source for the topography codes is Percy C Van Holten V Muir Ceds International Classification of Diseases for Oncology Second Edition Geneva World Health Organization 1990
Intracranial tumors
Brain C710 Cerebrum C711 Frontal lobe C712 Temporal lobe C713 Parietal lobe C714 Occipital lobe C715 Ventricle NOSC716 Cerebellum NOS C717 Brain stem C718 Overlapping lesion of brain C719 Brain NOS
Meninges C700 Cerebral meninges C709 Meninges NOS
a
Cranial Nerves and other intracranial parts of the central nervous systemC722 Olfactory nerve C723 Optic nerve C724 Acoustic nerve C725 Cranial nerve NOS C728 Overlapping lesion of brain and central nervous system C729 Nervous system NOS
Other endrocrine glands and related structures C751 Pituitary gland C752 Craniopharyngeal duct C753 Pineal gland
Extracranial tumors
Spinal cord C720 Spinal cord C721 Cauda equina
Meninges C701 Spinal meninges
aNOS=Not Otherwise Specified
Page 43
Endash
DATA COLLECTION
OF PRIMARY
CENTRAL NERVOUS
SYSTEM TUMORS
Brain Tumor Histology Groupings
The following histology groupings were used for the primary intracranial and central nervoussystem tumors The source for the histology groupings is Central Brain Tumor Registry ofthe United States (CBTRUS) 1996 Statistics Report Table 4
WHOa HISTOLOGY GROUPINGS ICD-Ob MORPHOLOGY CODE
Diffuse astrocytoma (protoplasma fibrillary) 9410 9420 Anaplastic astrocytoma 9401 9411 Glioblastoma 9440 9441 9442 Pilocytic astrocytoma 9421 Unique astrocytoma variants 9383 9384 9424 Oligodendroglioma 9450 Anaplastic oligodendroglioma 9451 9460 Ependymomaanaplastic ependymoma 9391 9392 9393 Ependymoma variants 9394 Mixed glioma 9382 Astrocytoma NOSc 9400 Glioma malignant NOS 9380 Choroid plexus 9390 Neuroepithelial 9381 9423 9430 Benign neuronalglial neuronal and mixed 86801 8693 9490 9505 9506 Malignant neruonalglial neuronal and mixed 86803 9364 9490 9500 Pineal parenchymal 9360 9361 9362 Embryonalprimitivemedulloblastoma 8963 9470 9471 9472
9473 9501 9502 9503 9510
TUMORS OF NEUROEPITHELIAL TISSUE
TUMORS OF CRANIAL AND SPINAL NERVES Nerve sheath benign and malignant 9540 9550 9560 9570
TUMORS OF THE MENINGES Meningioma 9530 9531 9532 9533 9534 9537 9538 Other mesenchymal benign and malignant 8800 8801 8802 8803 8810 8830 8850 88618900
8910 8990 9133 9150 9240 9480 9481 9536 9539 Hemangioblastoma 9161 9535
LYMPHOMAS AND HEMOPOIETIC NEOPLASMS Lymphoma 9590 9591 9593 9594 9595 9630 9650 9652
9663 9670 9671 9672 9674 9675 9680 9681 9682 9684 9685 9686 9687 9690 9691 96939695 9696 9698 9702 9714 9723 9731 9766 9970
GERM CELL TUMORS Germ cell 8020 9060 9064 9070 9071 9080 9084 9085 9100
CYSTS AND TUMOR-LIKE LESIONS Cysts and heterotopias 9084
TUMORS OF THE SELLAR REGION Pituitary 8040 8l40 8l46 8260 8270 8271 8280
8281 8290 8300 8330 8323 8333 Craniopharyngioma 9350
Page 44
Endash
APPENDIX E
LOCAL EXTENSIONS FROM REGIONAL TUMORS Chordomachondrosarcoma 9370
UNCLASSIFIED TUMORS Hemangioma 9120 9121 9130 9131 Neoplasm benign 80000 8010 Neoplasm uncertain behavior 80001 80011 Neoplasm malignant 80003 80013 8002 8003 All other 8720 9580
aWHO = World Health OrganizationbICD-O = International Classification of Diseases for Oncology Second Edition 1990 cNOS=Not Otherwise Specified
Page 45
Endash
DATA COLLECTION
OF PRIMARY
CENTRAL NERVOUS
SYSTEM TUMORS
Endash
International Classification of Childhood Cancer (ICCC)
Diagnostic Group
ICD-Oa codes
Morphology Topography
I LEUKAEMIA
(a) Lymphoid leukaemia 9820-9827 9850
(b) Acute non-lymphocytic leukaemia 9840 9841 9861 9864 9866 9867 98919894 9910
(c) Chronic myeloid leukaemia 9863 9868
(d) Other specified leukaemias 9830 9842 9860 9862 9870-9890 9892 98939900 9930-9941
(e) Unspecified leukaemias 9800-9804
II LYMPHOMAS AND OTHER RETICULOENDOTHELIAL NEOPLASMS
(a) Hodgkinrsquos disease 9650-9667
(b) Non-Hodgkinrsquos lymphoma 9591-9595 9670-9686 9690-9714 9723
(c) Burkittrsquos lymphoma 9687
(d) Miscellaneous lymphoreticular neoplasms 9720 9731-9764
(e) Unspecified lymphomas 9590
III CENTRAL NERVOUS SYSTEM (CNS) ANDMISCELLANEOUS INTRACRANIAL AND
INTRASPINAL NEOPLASMSb
(a) Ependymomac 9383 9390-9394
(b) Astrocytoma 9380 C723
9381 9400-9441
(c) Primitive neuroectodermal tumours 9470-9473
(d) Other gliomasd 9380 C700-C722C724-C729
9382 9384
9442-9460 9481
APPENDIX E
Diagnostic Group
ICD-Oa codes
Morphology Topogragphy
III CNS AND MISCELLANEOUS INTRACRANIAL AND INTRASPINAL
NEOPLASMSb Continued
(e) Miscellaneous intracranial and intraspinalneoplasmsc
8270-8281 8300 9350-9362 9480 95059530-9539
(f) Unspecified intracranial and intraspinalneoplasmsc
8000-8004 C700-C729C751-C753
IV SYMPATHETIC NERVOUS SYSTEM TUMOURS
(a) Neuroblastoma and ganglioneuroblastoma 9490 9500
(b) Other sympathetic nervous system tumours 8680 8693-8710 9501-9504 9520-9523
aInternational Classification of Diseases for Oncology Second Edition World Health Organization 1990bGroup III excludes all lymphomas See group II cBehaviour codes 0 and 1 are included dBehaviour code 1 is included
Page 47
Endash
Comments and recommendations are welcome Should questions arise on how to use these
materials or for more information please contact
Centers for Disease Control and Prevention National Program of Cancer Registries
4770 Buford Hwy NE Mail Stop K-53
Atlanta GA 30042-3717
Voice Information System 1 (888) 842-6355 bull Fax (770) 488-4760
cancerinfocdcgov bull httpwwwcdcgovcancer
All materials are in the public domain and may be reproduced or copied without permission citation
to source however is appreciated
BACK COVER
(WHITE)
Spine(WHITE)
DATA COLLECTION OF PRIMARY CEN
TRAL NERVOUS SYSTEM
TUM
ORS 2004
National Program of Cancer Registries Training M
aterials
DATA COLLECTION
OF PRIMARY
CENTRAL NERVOUS
SYSTEM TUMORS
EXECUTIVE SUMMARY
The National Coordinating Council for Cancer Surveillance established the Brain Tumor
Working Group (BTWG) to examine current reporting practices for brain tumors among cancer
registries in the United States This anatomic site was selected for a special review because much
morbidity and mortality is associated with both malignant and nonmalignant brain tumors The
BTWG determined that the review should encompass the brain and other parts of the central
nervous system (CNS) as well as non-CNS intracranial tumors Four reporting sources -- the
Central Brain Tumor Registry of the United States (CBTRUS) the Minnesota Cancer
Surveillance System (MCSS) the National Cancer Data Base (NCDB) and the Surveillance
Epidemiology and End Results (SEER) Program -- contributed data to the BTWG for analysis
The major findings are highlighted in this summary and recommendations regarding the
collection of data for primary intracranial and CNS tumors are provided
More than 28000 new cases of primary malignant and benign brain tumors were
diagnosed nationwide in 19951 Approximately 12000 people died of invasive brain tumors and
947 died of benign brain tumors during that year2 There were also 131 deaths due to tumors of
uncertain behavior and 2788 deaths due to tumors of unspecified behavior reported for those
sites From 1979-1995 mortality rates have remained relatively stable for invasive benign and
unspecified tumors (Fig 1) The NCDB which reports hospital registry data recently reported
5-year survival rates for patients diagnosed with brain tumors from 1985-1988 and from
1990-19923 Five years after diagnosis approximately 22 percent of patients with malignant
tumors and 72 of patients with nonmalignant tumors were alive The clinical outcome of both
malignant and nonmalignant tumors however may also depend on factors unrelated to behavior
Page 4
Endash
APPENDIX E For example survival rates are generally higher for benign meningiomas than for malignant
meningiomas (Fig 2) but treatment of meningiomas may be limited by their location Favorably
situated lesions (eg lateral sphenoid wing) are usually amenable to complete removal whereas
basal meningiomas are more difficult to fully and safely excise4
Only 15 state registries (Appendix A) collected data for benign intracranial and CNS
tumors in 1997 Three SEER areas also collect information about these tumors but they do not
currently report it Comparison of the data by cancer registries however is made difficult by the
lack of standard site groupings and histology groupings for the coding systems (ie International
Classification of Diseases for Oncology World Health Organization) that most of them use
Nonmalignant tumors constituted a significant percentage of the primary intracranial and
CNS tumors reported by the data sources For CBTRUS from 1990-1993 approximately 46
percent of the tumors reported for these sites were nonmalignant (Fig 3) Fifty-one percent of the
primary intracranial and CNS tumors reported by MCSS from 1989-1994 were nonmalignant and
NCDB reported more than 33 percent as nonmalignant during that period
Histologically much variation occurs among nonmalignant primary intracranial and CNS
tumors While the majority of malignant tumors reported by all of the sources were of
neuroepithelial origin (Table 1) most of the nonmalignant tumors were in the meninges
For registries that consider making nonmalignant intracranial and CNS tumors reportable
a twofold increase in the overall number of CNS cases could be expected In addition to the
increased costs associated with the increased workload registries should also be aware that
additional training of registrars new registry manuals modifications of case finding methods
modifications in the registries database and data processing software and revisions in legislation
Page 5
Endash
DATA COLLECTION
OF PRIMARY
CENTRAL NERVOUS
SYSTEM TUMORS
and regulations would be needed A mandate to report would be required to ensure high quality
surveillance
Based on its findings the BTWG has prepared four recommendations regarding data
collection for primary intracranial and CNS tumors
1 We recommend that the following standard definition be used for collecting precise
data for all primary intracranial and CNS tumors
Primary intracranial and CNS tumors are all primary tumors occurring in the
following sites irrespective of histologic type or behavior brain meninges
spinal cord cauda equina cranial nerves and other parts of the CNS pituitary
gland pineal gland and craniopharyngeal duct (see Appendix B)
2 We recommend the development of a standard site and histology definition for
tabulating estimates of these tumors to allow comparability of information across
registries Pathologists the North American Association of Central Cancer Registries
(NAACCR) the Commission on Cancer (COC) the Surveillance Epidemiology and
End Results (SEER) Program the National Program of Cancer Registries (NPCR)
and the International Agency for Research on Cancer (IARC) need to be involved in
developing this standard
3 We recommend collection of data for primary intracranial and extracranial CNS
tumors by all registries hospital- and population-based This effort will necessitate a
change in the COC requirements and will increase costs to the hospital-based
programs Federal funding should be allocated to supplement the additional transition
and ongoing data collection costs that will be incurred by central registries Before
Page 6
Endash
APPENDIX E additional data collection is implemented a pilot study should be conducted in
multiple states to assess the procedures and quality control functions needed as well as
the costs of collecting data on these tumors
4 We recommend that the appropriate government and professional organizations be
involved in carrying out the development and implementation of special training
programs and curricula for central registry hospital registry and laboratory personnel
as well as the development of computerized edit-checking procedures Training for
reporting and tabulating primary intracranial and CNS tumors should be offered on a
regular basis
Page 7
Endash
DATA COLLECTION
OF PRIMARY
CENTRAL NERVOUS
SYSTEM TUMORS
REFERENCES
1 CBTRUS (1996) First annual report 1995 Central Brain Tumor Registry of the United StatesChicago Illinois
2 National Center for Health Statistics public use mortality files for 1979-19953 Surawicz TS Davis F et al Brain tumor survival results from the National Cancer Data Base
(Accepted for publication in Journal of Neuro-Oncology)4 Thapar K Laws ER Tumors of the central nervous system In Murphy GP Lawrence W Jr
Lenhard RE Jr eds Textbook of clinical oncology ed 2 Atlanta American Cancer Society1995378-410
Page 10
Endash0
APPENDIX E
INTRODUCTION
Because nonmalignant brain tumors often can have a malignant clinical course leading to
substantial long-term morbidity and high risk for death the distinction between
histopathologically-defined malignancies versus nonmalignancies is tenuous from both a clinical
and an epidemiologic standpoint Likewise because nonmalignancies have not been systematically
or consistently included in most population-based cancer surveillance systems the public health
community has little information to offer on either incidence or mortality patterns and trends of
nonmalignant brain tumors in the United States (US) Additionally there have been virtually no
analytic epidemiology research studies conducted that would help identify factors that influence
the risk for nonmalignant brain tumor occurrence Thus despite their clinical importance both the
public health surveillance mission and the etiologic research mission of cancer prevention and
control are compromised by the exclusion of nonmalignant brain tumors in registry systems
Recognizing this challenge the National Coordinating Council for Cancer Surveillance (NCCCS)
established a Brain Tumor Working Group (BTWG) during its semi-annual meeting in January
1997 The purpose of BTWG was to review the status of the surveillance of brain tumors in the
US and examine the feasibility of collecting data for nonmalignant brain tumors Upon
completion of the project recommendations regarding surveillance of both malignant and
nonmalignant (ie benign or uncertain behavior) brain tumors would be presented at a special
meeting of the NCCCS This report describes data collection by US registries for primary
intracranial and central nervous system (CNS) tumors It includes data from several registries to
demonstrate variability in current reporting practices
BACKGROUND
Classification
Historically cancer registries have used the International Classification of Diseases (ICD)
system which describes tumors by their location (topography) and behavior (benign versus
malignant)1 to code neoplasms Tumor nomenclature describing histology was developed by
pathologists and incorporated into the International Classification of Diseases for Oncology (ICD-
O) system as a morphology code in 19762 and revised in a second edition (ICD-O-2)3 However
Page 11
Endash
DATA COLLECTION
OF PRIMARY
CENTRAL NERVOUS
SYSTEM TUMORS
Endash
not all of the morphology codes in the current ICD-O classification used by cancer registries are
consistent with the recent World Health Organization (WHO) brain tumor codes34 The recent
WHO brain tumor classification has new terms that are not included in ICD-O-2 however a new
third edition to ICD-O may include these terms ICD-O-2 also includes terms which are not
categorized by WHO
The CNS environment also contributes to the difficulty in characterizing tumors that
involve this site In contrast to tumors arising in other organ systems the terms benign and
malignant are only relative distinctions for CNS neoplasms Depending on location
histologically benign CNS tumors can result in similar or worse outcomes compared with
malignant tumors For these and other reasons classic oncologic concepts predicated on
histologic grade nodal status and staging strategies are not entirely applicable to tumors of the
CNS5
When the BTWG discussed whether to consider anatomic sites other than the brain for
this report the unique features of the CNS and the morbidity and mortality associated with non-
CNS intracranial tumors were closely examined For the sake of simplicity in reporting and
analyzing data for all of these sites the designation of primary intracranial and CNS tumors was
suggested This designation proposed by Walker et al6 is used by the Central Brain Tumor
Registry of the United States (CBTRUS) and includes the brain cerebral meninges cranial
nerves pituitary gland craniopharyngeal duct pineal gland spinal cord cauda equina and spinal
meninges The intracranial sites are the brain cerebral meninges cranial nerves and other
intracranial parts of the CNS the craniopharyngeal duct and the pineal and pituitary glands The
extracranial sites are the spinal cord cauda equina and spinal meninges The BTWG also included
lymphomas in the histology groupings for these sites The topography codes for the sites are in
Appendix B and the histology groupings are listed in Appendix C In this report no distinctions
are made between different age groups for intracranial and CNS tumors
Incidence
The age-adjusted incidence rate for malignant brain and other CNS tumors in the US
for 1991-1995 was 61 per 100000 person years7 Approximately 17400 new cases will be
diagnosed in 19988 The incidence of nonmalignant brain and other CNS tumors is difficult to
Page 12
APPENDIX E ascertain because few cancer registries collect or report these data However CBTRUS
reported an incidence rate for all primary brain and CNS tumors including the pituitary and
pineal glands of 118 per 100000 for 1990-19939 the organization also estimated that 28600
new cases of primary malignant and benign brain tumors were diagnosed nationwide in
199510 For both men and women rates for malignant and nonmalignant brain tumors decline
after a peak in childhood (younger than 10 years) increase after age 25 and stabilize after age
75 overall rates are higher for males11
Although the Surveillance Epidemiology and End Results (SEER) Program reported
a 28 percent decrease in the incidence of invasive brain and other nervous system cancer from
1991 to19957 within the last decade there have been many reports of dramatic increases in the
incidence of brain tumors12-21 particularly among children2223 and the elderly121617 Some
consider the increased rates as histology-specific14 and indicative of a true shift in incidence13
Other studies have concluded that many of the new cases are an artifact of changing
diagnostic procedures1617 In the US the discussion regarding the increased incidence of brain
tumors has been limited to rates for malignant tumors Standard reporting practices would aid
in the interpretation of time trends
Molecular studies24-26 have demonstrated that some low grade or benign intracranial
tumor subtypes transform to malignant tumors To understand the factors that might
contribute to this transformation and whether incidence rates for both malignant and
nonmalignant intracranial tumors are affected the full spectrum of the disease needs to be
observed
Mortality
Brain tumors regardless of behavior are the second leading cause of death from
neurological disease27 In 1995 malignant brain tumors accounted for 12062 deaths and
947 deaths were due to benign brain tumors Another 131 deaths were reported for brain
tumors of uncertain behavior and 2788 persons died of brain tumors for which the behavior
was unspecified28 The estimated number of deaths in 1998 due to malignant brain and other
CNS tumors is 133008 Increased mortality rates for malignant brain tumors particularly
among the elderly have been reported One study concluded that the increases were largely
Page 13
Endash
DATA COLLECTION
OF PRIMARY
CENTRAL NERVOUS
SYSTEM TUMORS
Endash
related to better diagnostic technology and the introduction of support programs such as
Medicare that facilitate diagnostic procedures in the elderly17 Another study attributed the
rising primary malignant brain tumor mortality to differential survival and its effect on the
surviving gene pool in an aging population28
Survival
Prognosis for CNS tumors depends on at least four variables tumor histopathology
anatomic location patient age and neurologic status5 According to a recent analysis using
SEER data from 1973-1991 overall survival rates for malignant brain tumors and rates for
patients with three specific histological types -- astrocytoma medulloblastoma and
oligodendroglioma -- improved29 Few data are available for survival rates for nonmalignant
primary intracranial and CNS tumors However Surawicz et al used data from the National
Cancer Data Base (NCDB) a joint project of the Commission on Cancer (COC) of the
American College of Surgeons (ACoS) and the American Cancer Society to examine survival
rates for patients diagnosed from 1985-1988 and from 1990-1992 with malignant or benign
brain tumors30 NCDB collects data from hospital tumor registries Based on the records of
more than 60000 patients the authors found a 216 percent 5-year survival rate for patients
with malignant tumors and a 724 percent rate for those with benign tumors The most
favorable prognosis was associated with neurilemmomas pilocytic astrocytomas and
meningiomas In contrast microgliomas lymphomas malignant gliomas and anaplastic
astrocytomas were associated with a poor outcome Surawicz et al also found variations in
survival for some tumors depending on location For example survival rates for
glioblastomas which generally have a poor prognosis improved if the tumors were located in
the cerebellum similarly astrocytomas and anaplastic astrocytomas were associated with a
better outcome if the tumors were in the ventricles or the cerebellum
Risk Factors
Although malignant and nonmalignant intracranial and CNS tumors have undergone
considerable study etiologic and pathophysiologic details concerning their genesis remain
obscure Definite genetic predispositions for the development of brain tumors have been
identified however population-based studies suggest that no more than 4 percent of these
Page 14
APPENDIX E tumors can be attributed to heredity 31 Several environmental carcinogens may be associated
with brain tumors including ionizing radiation11 electromagnetic fields32 and pesticides33
sustained exposure to vinyl chlorides polycyclic hydrocarbons and nitrosoureas has been
implicated as well5 Also the presence of the Epstein-Barr virus contained in the DNA of
primary lymphoma suggests that a viral etiology for human brain tumors cannot be entirely
ignored5 Accurate and complete data are necessary to develop hypotheses to identify the
causes of intracranial and CNS tumors The heterogeneity of brain tumors may mask the
identification of causes when histology-specific studies are limited by the number of available
cases
Surveillance
Population-based cancer registries generally provide incidence rates and trends for
cancer surveillance purposes and support related clinical and epidemiological research To
receive accreditation from the COC hospital cancer registries are required to report only
in situ and primary malignant tumors for all sites including the brain and other CNS sites34
Because data collection for nonmalignant intracranial and CNS tumors is not standardized at
either the central tumors can be attributed to heredity or hospital registry level collecting data
for all primary intracranial tumors is a challenge
In 1997 CBTRUS conducted a state survey (Appendix A) of benign brain and other
CNS tumor collection35 This survey gathered information from 64 member registries of the
North American Association of Central Cancer Registries (NAACCR) representing 48 states
All 64 of the registries collected data for primary malignant brain and other CNS tumors
however only 15 state registries collected data for nonmalignant (ie benign) tumors at the
time of the survey Seven state registries had stopped collecting data for benign brain and
other CNS tumors three collected the data passively one had started to collect the data in
1997 and one planned to start in 1998The majority of the registries surveyed indicated that
the requirements of their brain and other CNS tumor data collection had not been altered in
the past 5 years
Page 15
Endash
DATA COLLECTION
OF PRIMARY
CENTRAL NERVOUS
SYSTEM TUMORS
Endash
METHODS
To analyze available data on issues related to the collection of data for primary
intracranial and CNS tumors the BTWG examined surveillance data from CBTRUS the
Minnesota Cancer Surveillance System (MCSS) NCDB and SEER (Table 1) The NCDB
includes cases from all 50 states the District of Columbia and Puerto Rico however it is not
population-based CBTRUS MCSS and the SEER Program are population-based registries
that cover selected areas of the US Three SEER areas collect information for benign and
uncertain (ie nonmalignant) brain tumors but they do not report it Currently however
there are no standard definitions for the collection of site and type among the areas CBTRUS
MCSS and NCDB collect information on both malignant and nonmalignant primary brain
tumors Because the accessioning of nonmalignant cases for NCDB is not required by COC
only 59 percent of the hospitals that submitted any data to NCDB on intracranialCNS cases
diagnosed during 1989-1994 submitted nonmalignant cases The NCDB data reported here
are restricted to those hospitals that reported at least one nonmalignant case as these cases
were thought to contribute most toward the purpose of this report Also although MCSS
collects data for both malignant and nonmalignant tumors it does so for microscopically-
confirmed cases only This registry performs 100-percent case finding audits in all pathology
laboratories in Minnesota
Data inclusion criteria were developed as specified in Appendix B and all four of the
resources (ie CBTRUS MCSS NCDB SEER) developed subsets of their currently
available data according to the agreed-upon inclusion criteria Frequencies and proportions
were computed to reflect variations in factors other than site and the resulting contrasts
across these registries broadly reflect data collection practices For example the primary
difference in brain and CNS definition between SEER and CBTRUS lies in reporting by
behavior with the latter including all nonmalignant tumors As such differences in
proportions between these two registries approximately reflect the magnitude of nonmalignant
brain and CNS tumors Similarly the primary difference in brain and CNS definition between
MCSS and CBTRUS is that the former requires microscopic confirmation of all tumors and
the latter includes clinically and radiologically diagnosed tumors Another important difference
Page 16
APPENDIX E between MCSS and CBTRUS is that MCSS uses a more active method for case finding
Therefore differences in proportions reported reflect the interaction between the magnitude of
nonmicroscopically diagnosed tumors and the magnitude of incomplete case finding of certain
tumor types in CBTRUS Finally the primary difference between NCDB and CBTRUS is that
the former is a hospital-based reporting system and the latter is a population-based reporting
system Therefore differences in proportions may largely reflect referral biases inherent in
hospital reporting systems While other data collection practices may influence information in
these data resources these data bases were selected to highlight the variation in current
information on primary brain and CNS tumors that arises without a standard definition
Frequencies were computed using ICD-O codes for topography (ie location)
behavior diagnostic confirmation histology and selected combinations of behavior and
topography codes Topography was broadly defined into two main categories with
subcategories as shown in Appendix B Intracranial tumors included tumors located in the
brain and other CNS regions (including the cranial nerves) in the meninges and in the
pituitary and pineal glands Extracranial tumors included those located in the spinal cord and
spinal meninges The distinction between intracranial and extracranial tumors was removed for
Table 7 by collapsing brain and spinal meninges into one category and combining the pituitary
and pineal glands into one group (as these regions have endocrine functions) to allow for
adequate numbers within categories of behavior For Table 10 the intracranial and extracranial
distinction was maintained however the pituitary and pineal glands were collapsed into one
category and the spinal cord and spinal meninges were collapsed into the extracranial
category
Behavior was coded using ICD-O categories 0 for benign 1 for uncertain and 3 for
malignant with the first two of these categories collapsed into a nonmalignant category
Microscopic confirmation is based on the SEER definition and grouped into positive
microscopic confirmation radiography without microscopy clinical and unknown These
categories were further grouped as microscopically confirmed and as not microscopically
confirmed for the analysis in Table 3
Page 17
Endash
DATA COLLECTION
OF PRIMARY
CENTRAL NERVOUS
SYSTEM TUMORS
Endash
CBTRUS developed preliminary histology groupings with the aim of improved clinical
relevance ICD-O morphology codes which are used by cancer registries were grouped
based on WHO categories for brain tumors The details of these groupings are shown in
Appendix C
RESULTS
Percentages of Primary Intracranial and CNS Tumors by Tumor Location and by
Microscopic Confirmation
Intracranial tumors comprise more than 94 percent of primary intracranial and CNS
tumors and between 50 and 92 percent of primary intracranial and CNS tumors occur in the
brain (Table 2) The data in this report also show that a slightly greater percentage of
malignant intracranial tumors including malignant brain tumors are microscopically
confirmed compared with corresponding tumors of benign or uncertain behavior (Table 3)
However regardless of tumor behavior the percentages of extracranial CNS tumors that are
microscopically confirmed are higher than the percentages of intracranial tumors that are
confirmed by pathologists (Table 3) Few primary intracranial and CNS tumors are not
microscopically confirmed approximately 11 percent of diagnoses are based only on a clinical
or radiographical (without microscopy) assessment (Table 4)
Percentages of Malignant and of Nonmalignant Intracranial and CNS Tumors by Location
The relative distribution of nonmalignant intracranial and CNS tumors varies by
primary site While greater than 90 percent of malignant intracranial and CNS tumors occur
in the brain (Table 5) only 9 to 26 percent of the nonmalignant tumors occur as parenchymal
tumors (Table 6) Nonmalignant tumors comprised a significant portion of the primary
intracranial and CNS tumors reported by the sources The ratios of nonmalignant to primary
malignant intracranial and CNS tumors reported by CBTRUS MCSS and NCDB were 09
10 and 05 respectively (Table 7)
Percentages of Malignant and of Nonmalignant Intracranial and CNS Tumors by Histology
Among the malignant primary intracranial and CNS tumors neuroepithelial (ie
astrocytic) tumors represent 83 to 90 percent of the cases depending on the data source
Page 18
APPENDIX E lymphomashemopoietic tumors 6 to 11 percent tumors of the meninges 1 to 2 percent and
tumors of cranial and spinal nerves 02 percent (Table 8) For nonmalignant primary
intracranial and CNS tumors tumors of the meninges represent 48 to 59 percent of the cases
tumors of the sellar region (including pituitary tumors and craniopharyngiomas) 21 to 26
percent tumors of cranial and spinal nerves 11 to 20 percent and neuroepithelial tumors 4 to
5 percent (Table 9)
Percentages of Primary Intracranial and CNS Tumors by Method of Case Finding (MCSS)
Case finding audits by the MCSS occur on an annual basis in all pathology laboratories in
Minnesota and include the review of surgerypathology cytology autopsy and hematology
records These audits enable the registry to ensure that there is complete reporting of cases of
malignant and nonmalignant tumors In tables 10 through 13 data from MCSS on primary
intracranial and CNS tumors are presented by method of case finding The two methods of case
finding are routine reporting and special efforts A case was found by routine reporting if one
or more reports received before the close-out date for a given diagnosis year was initiated by a
hospital or nonhospital facility In contrast a case was found by special efforts if all reports of that
case received before the close-out date were requested as a result of pathology laboratory audits
The data in Table 10 indicate that routine reporting of nonmalignant tumors was less complete
compared with reporting for malignant tumors The percentages of intracranial tumor cases that
were found by special efforts have varied from year to year but the trend suggests that routine
reporting may be improving (Table 11) The greatest improvement has been in the coverage of
nonbrain parenchymal tumors (ie pituitarypineal and other intracranial) The small numbers of
autopsy-only tumors were more likely to be found by special case finding efforts than by other
methods of microscopic confirmation (data not shown)
Most hospitals in Minnesota have cancer registries through which their tumor cases are
reported However some of the cases that are seen at hospitals with registries are reported only
through pathology laboratories affiliated with the hospitals Approximately 80 percent
(14511776) of the cases of nonmalignant intracranial tumors in the MCSS data base were
reported by hospitals with registries (Table 12) eighty-five percent (12261451) of these cases
were reported by the hospitals registries (Table 13)The remaining 15 percent (2251451) of the
Page 19
Endash
DATA COLLECTION
OF PRIMARY
CENTRAL NERVOUS
SYSTEM TUMORS
Endash0
cases were reported through the pathology laboratories affiliated with the hospitals with registries
(ie they were not accessioned by the registries) (Table 13) The percentages of cases of
nonmalignant tumors that were reported only by the pathology laboratories at facilities having
cancer registries can be viewed as a measure of how frequently the registries failed to accession
the cases Of the 225 nonaccessioned tumors half would have been missed without the MCSS
case finding audits of pathology laboratories (Table 13)
Percentages of Hospital Cancer Registries That Accessioned Malignant and Nonmalignant
Intracranial and CNS Tumors (NCDB)
Based on data from NCDB more than 1500 hospitals accessioned cases with either
malignant or nonmalignant intracranial and CNS tumors and approximately 800 hospitals
accessioned extracranial cases Cases with tumors that involved the cranial or spinal meninges or
the pituitary gland were more likely to be reported by hospitals that accessioned nonmalignant
primary intracranial and CNS tumors than by hospitals that accessioned only malignant tumors
(Table 14)
DISCUSSION
The findings for this report indicate that collection and reporting of incidence data for
primary malignant intracranial and other CNS tumors are well standardized However substantial
variation exists in the processes of collecting and reporting nonmalignant tumor data One
obstacle is that not all hospitals have cancer registries Another problem is that not all hospitals
with registries accession cases of nonmalignant tumors Data from Minnesota (Table 13) suggest
that approximately 85 percent of cases of nonmalignant intracranial tumors are accessioned by
hospital registries However nonaccessioned CNS cases are less likely to be routinely reported to
the central registry (Table 13) These differences in collection and reporting practices among the
registries make it difficult to assess the burden of primary intracranial and CNS tumors
Terminology for describing intracranial and CNS tumors is also not standardized For
example although the pituitary gland and pineal glands are not technically part of the CNS
tumors that involve these organs are often included in the term CNS tumors On the other hand
some consider the eye to be intracranial however CNS tumors generally do not include the
Page 20
APPENDIX E eyes Although the World Health Organization (WHO) has published a list of histologic
groupings at present no single comprehensive list of histologic groupings exists for intracranial
and CNS tumors Since the International Classification of Childhood Cancer (ICCC) is based on
histologic type rather than site certain benign histologies of sites other than brainCNS (eg non-
CNS ependymomas) would not be included in the BTWGs primary intracranial and CNS
histology groupings (Appendix D) Thus the variation in incidence estimates of primary
intracranial and CNS tumors may be attributable in part to the variation in the definitions of
these tumors In addition differences in cancer registry training and procedures may contribute to
nonreporting and inconsistent reporting of the tumors
The BTWG discussed the feasibility of conducting a random sampling procedure as an
alternative to complete enumeration and ongoing surveillance of nonmalignant brain tumors It
was agreed that this technique would not be valid or feasible for the following reasons
1 If a random sample of incident brain tumors were desired a complete list would be
needed first (a sampling frame is required)
2 If a survey method were used to identify brain tumors in the general population (eg
random digit dialing or other general population survey techniques) the information
needed could not be obtained for several reasons
- Either a prohibitively large numbers of individuals would have to be surveyed or
else only a very small number of brain tumors could be identified given the rarity
and sometimes short survival time
- The brain tumors identified would not be representative of all brain tumors that
occur because people who had survived their brain tumors would be more
likely to be identified
- The incidence rate would still not be known since cross-sectional surveys only
identify disease prevalence
3 If a sample of hospitals were selected to contribute data the tumors included would not
represent the entire spectrum of brain tumors because those that were diagnosed and
treated outside of the hospital setting would be excluded
Page 21
Endash
DATA COLLECTION
OF PRIMARY
CENTRAL NERVOUS
SYSTEM TUMORS
Endash
An alternative approach to sampling and the least troublesome would be to conduct
population-based surveillance only in certain geographic areas of the country If one assumes that
the etiology of brain tumors does not differ from one area of the country to another then the
scientific validity of studies based on this type of sampling would not be a problem However
given the rarity of some types of brain tumors sufficient numbers for study may not be available
unless the vast majority of the nations population were covered by population-based data
collection Also geographic areas without population-based surveillance would have no data to
use for assessing local trends or variations in brain tumor occurrence
In the absence of standard tumor registration procedures and training special case finding
efforts by central registries may be necessary to ensure that complete data are collected for
nonmalignant intracranial and CNS tumors Data from MCSS (Table 10) which has a legal
requirement for reporting nonmalignant intracranial tumors and performs 100 percent case finding
audits in all laboratories indicate that only 80 percent of nonmalignant tumors were routinely
reported In contrast routine reporting accounted for more than 95 percent of malignant
intracranial and CNS tumors Nonmalignant cases in Minnesota that were not accessioned by
hospital registries had a 50 percent chance of being routinely reported to the central registry
however these were only microscopically confirmed cases
Completeness of reporting is critical to cancer registries Accurate case counts are
necessary to assess the burden of cancer to guide cancer control program planning to prioritize
the allocation of health resources and to facilitate epidemiologic research Most central cancer
registries have state laws that mandate reporting of cases by physicians and by hospitals
laboratories and other facilities that provide screening diagnostic or therapeutic services
Complete reporting of nonmalignant intracranial and CNS tumors would be greatly
improved if reporting requirements of the COC central cancer registries SEER and the
National Program of Cancer Registries (NPCR) were changed to require the collection of
information for these tumors However this requirement would have many implications
including an increase in work load as well as associated costs for reporting facilities An estimated
14 percent of all new cancer cases diagnosed in 1998 will involve invasive brain and other
nervous system tumors7 since the numbers of benign and invasive brain and other CNS tumors
Page 22
Endash
APPENDIX E diagnosed annually are similar facilities that presently do not accession nonmalignant cases could
expect an approximately 14 percent increase in the total number of CNS cases collected by the
registry Some estimates of the percentage of brain tumors have been lower (05 percent)36 and
others have been higher (9 percent)37 therefore the extent to which the workload would be
affected may vary The data in this report suggest that if reporting of nonmalignant intracranial
and CNS tumors were required the total number of cases of tumors for these anatomic sites
would double for facilities that presently report only malignant tumors This is consistent with the
findings of Davis et al36 who reported that the incorporation of benign brain tumors into the
cancer-reporting systems of four central registries increased the overall incidence of brain cancer
by 49 percent Forty percent (913) of the hospital registries that submitted data to the NCDB did
not report nonmalignant brain tumors These registries could expect up to a 50 percent increase in
the number of intracranial and CNS tumors reported nonregistry facilities which represent
approximately 20 percent of cases reported to central cancer registries could expect a similar
increase Also central cancer registries that currently do not require reporting of nonmalignant
intracranial and CNS tumors could expect increases in their workloads as a result of the
additional time spent on processing and quality control procedures and training The lack of
standard definitions and collection and reporting guidelines would make these tasks more time-
consuming as well
For some central cancer registries that want to expand their reporting requirements to
include nonmalignant intracranial and CNS tumors a change in current legislation andor
regulations may be needed These changes could involve several months of lead time if public
hearings or other legal procedures are necessary In other states the reporting of these tumors is
not required in either their legislation or regulations in these situations hospitals have been asked
to voluntarily report the cases For example in Massachusetts the reporting of benign brain
tumors is not required by law but hospitals have been reporting these cases since 1982 However
the completeness of data reported on a voluntary basis is difficult to assess For public health
surveillance systems a mandate to report is the basic requirement of a comprehensive higher
quality system
DATA COLLECTION
OF PRIMARY
CENTRAL NERVOUS
SYSTEM TUMORS
If COC SEER NPCR and central cancer registries changed their reporting requirements
to include nonmalignant intracranial and CNS tumors the registry manuals disseminated by these
programs and registries would also need to be modified to include new definitions of reportable
diagnoses All reporting facilities would have to be notified of the new requirements To ensure
complete reporting from registries additional training of registrars should be expected Case
finding methods may need to be modified in order to identify the new cases and sources of
information Central cancer registries would also need to increase their case finding audits The
inclusion of nonmalignant tumors would also necessitate changes to other data items such as
sequence number Hospital and central cancer registries would need to consider adding WHO
brain tumor grade as an additional data item
Finally the software used by reporting facilities and by central registries would need to be
modified to accept nonmalignant morphology and behavior codes Also edits programs would
need to be modified to include these additions and to accept a nonmalignant sequence numbering
procedure
Before reporting requirements for primary intracranial and CNS tumors could be changed
feasibility studies would have to be conducted to determine whether such changes should be
recommended Two SEER special studies are under way to evaluate the impact of requiring the
collection of benign brain tumors on case finding cost quality control and training However
additional studies may be required
Page 24
Endash
APPENDIX E
RECOMMENDATIONS OF THE BRAIN TUMOR WORKING GROUP
1 We recommend the following standard definition for collecting precise data for all primary
intracranial and central nervous system tumors
Primary intracranial and central nervous (CNS) tumors are primary tumors occurring in
the following sites irrespective of histologic type or behavior brain meninges spinal
cord cauda equina cranial nerves and other parts of the CNS pituitary gland pineal
gland and craniopharyngeal duct (see Appendix B)
2 We recommend the development of a standard site and histology definition for tabulating
estimates of these tumors to allow comparability of information across registries Pathologists
the North American Association of Central Cancer Registries (NAACCR) the Commission
on Cancer (COC) the Surveillance Epidemiology and End Results (SEER) Program the
National Program of Cancer Registries (NPCR) and the International Agency for Research
on Cancer (IARC) need to be involved in developing this standard
3 We recommend collection of data for primary intracranial and extracranial CNS tumors by all
registries hospital- and central-based This effort will necessitate a change in the COC
requirements and will increase costs to the hospital-based programs Federal funding should be
allocated to supplement the additional transition and ongoing data collections costs that will be
incurred by central registries Before additional data collection is implemented we recommend
a pilot study should be conducted to assess the procedures and quality control functions
needed as well as the costs of collecting data for these tumors
4 We recommend that the appropriate government and professional organizations be involved in
carrying out the development and implementation of special training programs and curricula for
central registry hospital registry and laboratory personnel as well as the development of
computerized edit-checking procedures Training for reporting and tabulating primary
intracranial and CNS tumors should be offered on a regular basis
Page 25
Endash
DATA COLLECTION
OF PRIMARY
CENTRAL NERVOUS
SYSTEM TUMORS
Endash
REFERENCES
1 Davis F Preston-Martin S Epidemiology of brain tumors In Bigner DD McLendon RE Bruner JM eds Russell and Rubinsteins pathology of tumors of the nervous system ed 6 London Arnold Publishing 19965-45
2 World Health Organization (WHO) (1976) International classification of diseases foroncology ed 1 Geneva World Health Organization
3 World Health Organization (WHO) (1990) International classification of diseases foroncology ed 2 Geneva World Health Organization
4 Kleihues P Burger PC Scheithauer BW The new WHO classification of brain tumorsBrain Pathol 19933255-268
5 Thapar K Laws ER Tumors of the central nervous system In Murphy GP Lawrence WJr Lenhard RE Jr eds Textbook of clinical oncology ed 2 Atlanta American CancerSociety 1995378-410
6 Walker AE Robins M Weinfield FD Epidemiology of brain tumors the national survey ofintracranial neoplasms Neurol 198535219-226
7 Ries LAG Kosary CL Hankey BF Miller BA Edwards BK (eds) SEER Cancer StatisticsReview 1973-1995 National Cancer Institute Bethesda MD 1998
8 Cancer Facts amp Figures - 1998 American Cancer Society Atlanta Georgia 19989 Davis FG Bruner JM Surawicz TS The rationale for standardized registration and reporting
of brain and central nervous system tumors in population-based cancer registriesNeuroepidemiol 199716308-316
10CBTRUS (1996) First annual report 1995 Central Brain Tumor Registry of the UnitedStates Chicago Illinois
11 Preston-Martin S Epidemiology of primary CNS neoplasms Neurol Clinics 199614273-290
12 Greig NH Ries LG Yancik R Rapoport SI Increasing annual incidence of primary malignantbrain tumors in the elderly J Natl Cancer Inst 1991 831621-1624
13 Mao Y Desmeules M Semenciw RM Hill G Gaudette L Wigle DT Increasing brain cancerrates in Canada Can Med Assoc J 19911451583-1591
14 Frelick R Huang P Topham A Brain and central nervous system tumors Delaware 1980 to1989 Del Med J 199264571-573
15 Davis DL Ahlbom A Hoel D Percy C Is brain cancer mortality increasing in industrialcountries Am J Ind Med 199119421-431
16 Helseth A Increasing incidence of primary central nervous system tumors in the elderly Realincrease or improved detection J Natl Cancer Inst 1993851871-1872
17 Modan B Wagener D Feldman JJ Rosenberg HM Feinleib M Increased mortality frombrain tumors A combined outcome of diagnostic technology and change of attitude towardthe elderly Am J Epidemiol 19921351349-1357
18 Polednak AP Time trends in the incidence of brain and central nervous system cancers inConnecticut J Natl Cancer Inst 1991831679-1681
19 Boyle P Maissonneuve P Saracci R Muir CS Is the increase in incidence of primarymalignant brain tumors real J Natl Cancer Inst 1990201594-1596
Page 26
APPENDIX E 20 Preston-Martin S Descriptive epidemiology of primary tumors of the brain cranial nerves
and spinal meninges in Los Angeles County Neuroepidemiol 19898283-29521 Helseth A Mork SJ Neoplasms of the central nervous system in Norway Epidemiological
characteristics of intracranial gliomas according to histology APMIS 97 1989547-55522 Gurney JG Davis S Severson RK Fang J-Y Ross JA Robison LL Trends in cancer
incidence among children in the United States Cancer 199678532-54123 Gurney JG Ross JA Wall DA Bleyer WA Severson RK Robison LL Infant cancer in the
US histology-specific incidence trends 1973-1992 J Pediatr Hem Onc 199719428-43224 Nishio S Takeshita I Morioka T Fukui M Primary intracranial squamous cell carcinomas
report of two cases Neurosurgery 199537329-33225 Freilich RJ Thompson SJ Walker RW Rosenblum MK Adenocarcinomatous transformation
of intracranial germ cell tumors Am J Surg Pathol 199519537-54426Yuan S Miller DW Barnett GH Hahn JF Williams BR Identification and characterization of
human beta 2-chimaerin association with malignant transformation in astrocytoma CancerResearch 1995 553456-3461
27 Preston-Martin S Mack WJ Neoplasms of the nervous system In Schoenfeld D Fraumeni JFJr eds Cancer epidemiology and prevention ed 2 New York Oxford University Press19961231-1281
28 Riggs JE Rising primary malignant brain tumor mortality in the elderly A manifestation ofdifferential survival Arch of Neurol 199552571-575
29 Davis FG Freels S Grutsch J Barlas S Brem S Survival rates in patients with primarymalignant brain tumors stratified by patient age and tumor histological type an analysisbased on Surveillance Epidemiology and End Results (SEER) data 1973-1991J Neurosurg 1998881-10
30 Surawicz TS Davis F Freels S Laws ER Menck HR Brain tumor survival results from theNational Cancer Data Base (Accepted for publication in J Neuro-Oncol)
31 Bondy ML Lustbader ED Buffler PA Schull WJ Hardy RJ Strong LC Geneticepidemiology of childhood brain tumors Genet Epidemiol 19918253-267
32 Preston-Martin S Monroe K Lee P Bernstein L Kelsey J Henderson S Forrester DHenderson B Spinal meningiomas in women in Los Angeles County Investigation of anetiologic hypothesis Cancer Epidemiol Biomarkers Prev 19954333-339
33 Davis JR Brownson RC Garcia R Bentz BJ Turner A Family pesticide use and childhoodbrain cancer Arch Environ Contam Toxicol 19932487-92
34 Commission on Cancer General principles and coding In Standards of the Commission on Cancer vol II Registry Operations and Data Standards American College of SurgeonsChicago Illinois 1996
35 Central Brain Tumor Registry of the United States (CBTRUS) 1997 State Survey of BenignBrain Tumor Collection Chicago Illinois 1997
36 Davis FG Malinski N Haenszel W Chang J Flannery J Gershman S Dibble R Bigner DDPrimary brain tumor incidence rates in the four United States regions 1985-1989 A pilotstudy Neuroepidemiol 199615103-112
37 Schoenberg BS Christine BW Whisnant JP The descriptive epidemiology of primaryintracranial neoplasms the Connecticut experience Am J Epidemiol 1976104499-510
Page 27
Endash
DATA COLLECTION
OF PRIMARY
CENTRAL NERVOUS
SYSTEM TUMORS
TAB
LE 1
C
OM
PAR
ISO
N O
F R
EGIS
TRIE
S SU
PPLY
ING
DA
TA O
N P
RIM
AR
Y I
NTR
AC
RA
NIA
L A
ND
CEN
TRA
L N
ERV
OU
S SY
STEM
TU
MO
RS
IN T
HE
UN
ITED
STA
TES
Cen
tral B
rain
Tum
or R
egis
try o
fth
e U
nite
d St
ates
(CBT
RUS)
Min
neso
ta C
ance
rSu
rvei
llanc
e Sy
stem
(MC
SS)
ACo
SN
a tio
nal C
ance
r Dat
a B
ase
(NCD
B)
Surv
eilla
nce
Epid
emio
logy
and
End
Res
ults
Pro
gram
(SEE
R)
Purp
ose
ldquoCB
TRU
S ce
ntra
lizes
pop
ulat
ion-
base
d in
cide
nce
data
on
all b
rain
tum
ors a
nd u
ses o
ther
exi
stin
gda
ta re
sour
ces t
o ch
arac
teriz
e th
ein
cide
nce
mor
talit
y a
nd su
rviv
alof
pat
ient
s with
bra
in tu
mor
s rdquo
The
MC
SS c
olle
cts i
nfor
mat
ion
onal
l can
cers
dia
gnos
ed si
nce
1988
amon
g M
inne
sota
resi
dent
s Th
e M
CSS
is p
opul
atio
n-ba
sed
path
olog
y-ba
sed
and
is a
n ac
tive
syste
m
ldquoThe
goa
l of t
he N
CD
B is
to p
rese
nt a
n an
nual
sum
mar
y of
pat
ient
car
e fo
r cas
es o
f can
cer
diag
nose
d an
d tre
ated
at h
ospi
tals
thro
ugho
utth
e co
untry
rdquo
ldquoA c
ontin
uing
pro
ject
of th
e N
CI
the
SEER
prog
ram
col
lect
sca
ncer
dat
a on
aro
utin
e ba
sis f
rom
desi
gnat
ed p
opul
atio
n-ba
sed
canc
er re
gist
ries
in v
ario
us a
reas
of t
heco
untry
Targ
et p
opul
atio
n Th
e po
pula
tions
cov
ered
by
regi
strie
s in
Ari
zona
Col
orad
oC
onne
ctic
ut D
elaw
are
Idah
oM
aine
Mas
sach
uset
ts
Min
neso
ta M
issou
ri M
onta
na
Nor
th C
arol
ina
and
Uta
h
The
CB
TRU
S po
pula
tion
repr
esen
ts a
non
rand
om 1
5pe
rcen
t sam
ple
of th
e U
S
popu
latio
n
The
popu
latio
n of
Min
neso
ta
The
popu
latio
ns tr
eate
d at
par
ticip
atin
gho
spita
ls in
the
50 st
ates
the
Dist
rict
of
Col
umbi
a a
nd P
uert
o R
ico
NC
DB
is n
ot a
pop
ulat
ion-
base
d re
gist
ry
At
pres
ent
it is
est
imat
ed to
cov
er a
ppro
xim
atel
y57
per
cent
of t
otal
cas
es n
atio
nwid
e
The
popu
latio
nsco
vere
d by
the
state
regi
strie
s in
Con
nect
icut
Haw
aii
Iow
a N
ew M
exic
o
and
Uta
h a
s wel
l as
the
regi
onal
regi
strie
sin
Atla
nta
Geo
rgia
D
etro
it M
ichi
gan
San
Fran
cisc
o-O
akla
nd C
alifo
rnia
an
d Se
attle
-Pug
etSo
und
Was
hing
ton
The
SEER
pop
ulat
ion
repr
esen
ts a
nonr
ando
m 1
4 pe
rcen
tsa
mpl
e of
the
US
po
pula
tion
Page
28
Endash
APPENDIX E
Cen
tral B
rain
Tum
or R
egis
try o
fth
e U
nite
d St
ates
(CBT
RUS)
Min
neso
ta C
ance
rSu
rvei
llanc
e Sy
stem
(MC
SS)
ACo
SN
a tio
nal C
ance
r Dat
a B
ase
(NCD
B)
Surv
eilla
nce
Epid
emio
logy
and
End
Res
ults
Pro
gram
(SEE
R)
Type
of
prim
ary
intra
cran
ial
and
cent
ral n
ervo
us sy
stem
tum
ors r
epor
ted
Dat
a on
new
ly-d
iagn
osed
cas
es o
fbe
nign
and
mal
igna
nt p
rimar
ybr
ain
tum
ors b
ased
on
ICD
-Oco
des
Dat
a on
new
ly-d
iagn
osed
m
i cro
scop
ical
ly-c
onfir
med
tum
ors
of th
e ce
ntra
l ner
vous
syste
m
incl
udin
g pi
tuita
ry a
nd p
inea
lgl
ands
Hos
pita
ls v
olun
taril
y su
bmit
full
anal
ytic
canc
er re
gist
ry c
asel
oads
with
dat
a ite
ms a
ndco
des d
efin
ed b
y th
e C
omm
issio
n on
Can
cer
(CO
C) f
or h
ospi
tal c
ance
r reg
istri
es
Mos
tpa
rtici
patin
g ho
spita
ls h
ave
prog
ram
sap
prov
ed b
y C
OC
or a
re e
stab
lishi
ng p
rogr
amap
prov
al
NC
DB
cal
ls fo
r dat
a do
not
lim
itca
ses b
y m
alig
nant
beh
avio
r bu
t acc
essi
onin
gof
non
-mal
igna
nt c
ases
is n
ot re
quire
d fo
rpr
ogra
m a
ppro
val
Fifty
-nin
e pe
rcen
t of t
heho
spita
ls th
at su
bmitt
ed a
ny in
tracr
ania
lCN
Sca
ses d
iagn
osed
dur
ing
1989
-199
4 su
bmitt
edat
leas
t one
non
mal
igna
nt c
ase
The
NC
DB
data
in th
is re
port
are
limite
d to
the
case
ssu
bmitt
ed b
y th
ese
hosp
itals
(82
perc
ent o
f all
intra
cran
ial a
nd e
xtra
cran
ial c
entra
l ner
vous
syste
m c
ases
on
file)
Tren
ds in
the
inci
denc
e m
orta
lity
and
patie
nt su
rviv
al o
fbr
ain
tum
ors i
n th
eU
S H
owev
er S
EER
does
not
col
lect
info
rmat
ion
on b
enig
nan
d un
certa
in b
rain
tum
ors
Oth
er c
omm
ents
D
uplic
ate
canc
er re
gist
ratio
ns c
anno
t be
iden
tifie
d by
the
parti
cipa
ting
regi
strie
s
The
MC
SS p
erfo
rms 1
00 p
erce
ntca
se fi
ndin
g au
dits
in a
ll pa
thol
ogy
labo
rato
ries o
n an
ann
ual b
asis
Th
eref
ore
the
data
from
the
MC
SSm
ight
be
cons
ider
ed a
ldquobe
st-ca
sesc
enar
iordquo
in te
rms o
f com
plet
enes
sof
repo
rting
for m
icro
scop
ical
ly-
conf
irmed
tum
ors
Rep
ort d
uplic
atio
n fo
r 198
9-19
94 in
tracr
ania
lan
d ex
tracr
ania
l cen
tral n
ervo
us sy
stem
repo
rts w
as 6
7 p
erce
nt
How
ever
the
NC
DB
data
in T
able
s 2 th
roug
h 9
are
base
d on
undu
plic
ated
repo
rts
Page
29
Endash
DATA COLLECTION
OF PRIMARY
CENTRAL NERVOUS
SYSTEM TUMORS
TABLE 2 NUMBER AND PERCENT OF PRIMARY INTRACRANIAL AND CENTRAL NERVOUS SYSTEM TUMORS BY TUMOR LOCATION
Locationa CBTRUSb
Number () MCSSc
Number () NCDBd
Number () SEERe
Number ()
Intracranial 13084 (947) 3600 (936) 66322 (955) 10196 (969)
Brain 7999 (579) 1924 (500) 48527 (699) 9721 (924)
Meninges 2719 (197) 838 (218) 9365 (135) 139 (13)
Pituitarycraniopharygealduct
1491 (108) 530 (138) 4958 (71) 30 (03)
Pineal 74 (05) 21 (05) 477 (07) 80 (08)
Other central nervous systemincluding cranial nerves
801 (58) 287 (75) 2995 (43) 226 (22)
Extracranial 730 (53) 245 (64) 3137 (45) 322 (31)
Spinal cord 497 (36) 47 (38) 2395 (34) 313 (30)
Spinal meninges 233 (17) 98 (25) 742 (11) 9 (01)
TOTAL 13814 (100) 3845 (100) 69459 (100) 10518 (100)
Note Reported data are incident cases from 1989-1994 except for CBTRUS data which are from 1990-1993
aRefer to the sites in Appendix BbCentral Brain Tumor Registry of the United States cMinnesota Cancer Surveillance System (microscopically confirmed cases only)dNational Cancer Data Base (limited to cases reported by hospitals that accessioned nonmalignant cases) eSurvival Epidemiology and End results Program (malignant cases only)
Page 30
Endash0
TABL
E 3
RO
W P
ERCE
NT
DIS
TRIB
UTI
ON
OF
PRIM
ARY
INTR
ACR
AN
IAL
AN
D C
ENTR
AL
NER
VO
US
SYST
EM T
UM
ORS
BY
TU
MO
R B
EHA
VIO
RA
ND
MIC
ROSC
OPI
C C
ON
FIRM
ATI
ON
Loca
tiona
CB
TRU
Sb M
CSSc
NC
DB
d SE
ERe
Tota
l Pe
rcen
tM
icro
Co
nfirm
ed
Perc
ent
Not
Mic
ro
Conf
irmed
Tota
l Pe
rcen
tM
icro
Co
nfirm
ed
Perc
ent
Not
Mic
ro
Conf
irmed
Tota
l Pe
rcen
tM
icro
Co
nfirm
ed
Perc
ent
Not
Mic
ro
Conf
irmed
Tota
l Pe
rcen
tM
icro
Co
nfirm
ed
Perc
ent
Not
Mic
ro
Conf
irmed
Intra
cran
ial
130
84
867
13
3
360
0 10
0 N
A
663
22
887
11
3
101
96
871
12
9
Mal
igna
nt
717
1 89
2
108
1
824
100
NA
44
801
91
3
87
101
96
871
12
9
Beni
gn a
ndu n
certa
in
591
3 83
5
165
1
776
100
NA
21
521
83
2
168
N
A
NA
N
A
Bra
in
799
9 88
2
118
1
924
100
NA
48
527
90
2
98
972
1 87
3
127
Mal
igna
nt
686
2 89
6
104
1
746
100
NA
42
622
91
5
85
972
1 87
3
127
Beni
gnan
dun
certa
in
113
7 80
6
194
17
8 10
0 N
A
590
5 80
6
194
N
A
NA
N
A
Extra
cran
ial
730
962
3
8 24
5 10
0 N
A
313
7 96
0
40
322
957
4
3
Mal
igna
nt
242
934
6
6 60
10
0 N
A
148
3 96
6
34
322
957
4
3
Beni
gn a
ndu n
certa
in
488
975
2
5 18
5 10
0 N
A
165
4 95
5
45
NA
N
A
NA
TOTA
Lf 13
814
87
2
128
3
845
100
NA
69
459
89
0
110
10
518
87
4
126
Mal
igna
nt
741
3 89
4
106
1
884
100
NA
46
284
91
5
85
105
18
874
12
6
Beni
gn a
ndu n
certa
in
640
1 84
6
154
1
961
100
NA
23
175
84
1
159
N
A
NA
N
A
Not
e R
epor
ted
data
are
inci
dent
cas
es fr
om 1
989-
1994
exc
ept f
or C
BTR
US
data
whi
ch a
re fr
om 1
990-
1993
a Refe
r to
the
site
code
s in
App
endi
x B
b Cent
ral B
rain
Tum
or R
egist
ry o
f the
Uni
ted
Stat
es
c Min
neso
ta C
ance
r Sur
veill
ance
Sys
tem
(mic
rosc
opic
ally
con
firm
ed c
ases
onl
y)
d Nat
iona
l Can
cer D
ata
Base
(lim
ited
to c
ases
repo
rted
by h
ospi
tals
that
acc
essio
ned
nonm
alig
nant
cas
es)
e Surv
eilla
nce
Epi
dem
iolo
gy a
nd E
nd R
esul
ts Pr
ogra
m (m
alig
nant
cas
es o
nly)
f In
clud
es in
tracr
ania
l and
ext
racr
ania
l cas
es
NA
= N
ot a
pplic
able
Page
31
APPENDIX E
Endash
DATA COLLECTION
OF PRIMARY
CENTRAL NERVOUS
SYSTEM TUMORS
TABLE 4 NUMBER AND PERCENT OF PRIMARY INTRACRANIAL AND CENTRAL NERVOUS SYSTEM TUMORS BY DIAGNOSTIC CONFIRMATION
DiagnosticConfirmation
CBTRUSa
Number () MCSSb
Number () NCDBc
Number () SEERd
Number ()
Positive microscopy
12087 (875) 3845 (100) 61818 (890) 9188 (874)
Radiographywithout microscopy
1306 (95) NA 6759 (97) 1015 (97)
Clinical 204 (15) NA 484 (07) 98 (09)
Unknown 217 (15) NA 398 (06) 217 (21)
TOTAL 13814 (100) 3845 (100) 69459 (100) 10518 (100)
Note Reported data are incident cases from 1989-1994 except for CBTRUS data which are from 1990-1993
aCentral Brain Tumor Registry of the United Statesb Minnesota Cancer Surveillance System (microscopically confirmed cases only) cNational Cancer Data Base (limited to cases reported by hospitals that accessioned nonmalignant cases)dSurveillance Epidemiology and End Results Program (malignant cases only)NA = Not applicable
Page 32
Endash
Page 32
TABLE 4 NUMBER AND PERCENT OF PRIMARY INTRACRANIAL AND CENTRALNERVOUS SYSTEM TUMORS BY DIAGNOSTIC CONFIRMATION
DiagnosticConfirmation
CBTRUSa
Number ()MCSSb
Number ()NCDBc
Number ()SEERd
Number ()
Positivemicroscopy
12087 (875) 3845 (100) 61818 (890) 9188 (874)
Radiographywithout microscopy
1306 (95) NA 6759 (97) 1015 (97)
Clinical 204 (15) NA 484 (07) 98 (09)
Unknown 217 (15) NA 398 (06) 217 (21)
TOTAL 13814 (100) 3845 (100) 69459 (100) 10518 (100)
Note Reported data are incident cases from 1989-1994 except for CBTRUS data which are from 1990-1993
aCentral Brain Tumor Registry of the United Statesb Minnesota Cancer Surveillance System (microscopically confirmed cases only)cNational Cancer Data Base (limited to cases reported by hospitals that accessioned nonmalignant cases)dSurveillance Epidemiology and End Results Program (malignant cases only)NA = Not applicable
APPENDIX E
TABLE 5 NUMBER AND PERCENT OF MALIGNANT PRIMARY INTRACRANIAL AND CENTRAL SYSTEM TUMORS BY TUMOR LOCATION
Locationa CBTRUSb
Number () MCSSc
Number () NCDBd
Number () SEERe
Number ()
Intracranial 7171 (977) 1824 (968) 44801 (968) 10196 (969)
Brain 6862 (926) 1746 (927) 42622 (921) 9721 (924)
Meninges 98 (13) 23 (12) 581 (13) 139 (13)
Pituitarycraniopharyngealduct
37 (05) 13 (07) 189 (04) 30 (03)
Pineal 58 (08) 20 (11) 378 (08) 80 (08)
Other central nervous systemincluding cranial nerves
116 (16) 22 (12) 1031 (22) 226 (21)
Extracranial 242 (33) 60 (32) 1483 (32) 322 (31)
Spinal cord 234 (32) 60 (32) 1410 (30) 313 (30)
Spinal meninges 8 (01) 0 73 (02) 9 (01)
TOTAL 7413 (100) 1884 (100) 46284 (100) 10518 (100)
Note Reported data are incident cases from 1989-1994 except for CBTRUS data which are from 1990-1993
aRefer to the site codes in Appendix BbCentral Brain Tumor Registry of the United States cMinnesota Cancer Surveillance System (microscopically confirmed cases only)dNational Cancer Data Base (limited to cases reported by hospitals that accessioned nonmalignant cases) eSurvival Epidemiology and End Results Program (malignant cases only)
Page 33
Endash
DATA COLLECTION
OF PRIMARY
CENTRAL NERVOUS
SYSTEM TUMORS
TABLE 6 NUMBER AND PERCENT OF PRIMARY INTRACRANIAL AND CENTRAL NERVOUS SYSTEM TUMORS OF BENIGN AND UNCERTAIN BEHAVIOR BY TUMOR LOCATION
Locationa CBTRUSb
Number () MCSSc
Number () NCDBd
Number () SEERe
Number ()
Intracranial 5913 (924) 1776 (906) 21521 (929) NA
Brain 1137 (178) 178 (91) 5905 (255) NA
Meninges 2621 (409) 815 (416) 8784 (379) NA
Pituitarycraniopharyngealduct
1454 (227) 517 (264) 4769 (206) NA
Pineal 16 (02) 1 (lt01) 99 (04) NA
Other central nervous systemincluding cranial nerves
685 (107) 265 (135) 1964 (85) NA
Extracranial 488 (76) 185 (94) 1654 (71) NA
Spinal cord 263 (41) 87 (44) 985 (42) NA
Spinal meninges 225 (35) 98 (50) 669 (29) NA
TOTAL 6401 (100) 1961 (100) 23175 (100) NA
Note Reported data are incident cases from 1989-1994 except for CBTRUS data which are from 1990-1993
aRefer to the site codes in Appendix BbCentral Brain Tumor Registry of the United States cMinnesota Cancer Surveillance System (microscopically confirmed cases only)dNational Cancer Data Base (limited to cases reported by hospitals that accessioned nonmalignant cases) eSurveillance Epidemiology and End Results Program (malignant cases only)NA = Not applicable
Page 34
Endash
APPENDIX E TABLE 7 NUMBER AND PERCENT OF PRIMARY INTRACRANIAL AND CENTRAL
NERVOUS SYSTEM TUMORS BY TUMOR BEHAVIOR AND LOCATION
BehaviorTumor Locationa
CBTRUSb
Number () MCSSc
Number () NCDBd
Number () SEERe
Number ()
Malignant 7413 (537) 1884 (490) 46284 (666) 10518 (100)
Brain 6862 (497) 1746 (454) 42622 (614) 9721 (924)
Meninges 98 (07) 23 (06) 581 (08) 139 (13)
Pituitarycraniopharyn-geal ductpineal
95 (07) 33 (09) 567 (08) 110 (11)
Other central nervous system includingcranial nerves
116 (08) 22 (06) 1031 (15) 226 (22)
Spinal cord 242 (18) 60 (16) 1483 (21) 322 (31)
Benign 5794 (419) 1787 (465) 20694 (298) NA
Brain 803 (58) 99 (26) 4491 (65) NA
Meninges 2565 (186) 807 (210) 8613 (124) NA
Pituitarycraniopharyn-geal ductpineal
1322 (96) 458 (119) 4330 (62) NA
Other central nervous system includingcranial nerves
678 (49) 263 (68) 1911 (28) NA
Spinal cord 426 (31) 160 (42) 1349 (19) NA
Uncertain 607 (44) 174 (45) 2481 (36) NA
Brain 334 (24) 79 (21) 1414 (20) NA
Meninges 56 (04) 8 (02) 171 (02) NA
Pituitarycraniopharyn-geal ductpineal
148 (11) 60 (16) 538 (08) NA
Other central nervous system includingcranial nerves
7 (01) 2 (01) 53 (01) NA
Spinal cord 62 (05) 25 (07) 305 (04) NA
TOTAL 13814 (100) 3845 (100) 69459 (100) 10518 (100)
Note Reported data are incident cases from 1989-1994 except for CBTRUS data which are from 1990-1993 NA=Not applicableaRefer to the site codes in Appendix B bCentral Brain Tumor Registry of the United States cMinnesota Cancer Surveillance System (microscopically confirmed cases only)dNational Cancer Data Base (limited to cases reported byhospitals that accessioned nonmalignant cases eSurvival Epidemiology and End Results Program (malignant cases only)
Page 35
Endash
DATA COLLECTION
OF PRIMARY
CENTRAL NERVOUS
SYSTEM TUMORS
TABLE 8 NUMBER AND PERCENT OF MALIGNANT PRIMARY INTRACRANIAL AND
CENTRAL NERVOUS SYSTEM TUMORS BY HISTOLOGY GROUPINGS
WHO Histologya
Groupings CBTRUSb
Number () MCSSc
Number () NCDBd
Number () SEERe
Number ()
Neuroepithelial 6477 (874) 1689 (896) 39701 (858) 8676 (825)
Tumors of cranial and spinal nerves
12 (02) 3 (02) 108 (02) 25 (02)
Tumors of meninges
137 (18) 25 (13) 994 (21) 194 (18)
LymphomasHemopoietic
473 (64) 121 (64) 3492 (75) 1099 (105)
Germ cell 70 (09) 20 (11) 403 (09) 97 (09)
Cysts and tumor-like lesions
0 0 0 0
Tumors of sellar region
20 (03) 11 (06) 100 (02) 6 (01)
Local extensions 29 (04) 11 (06) 166 (04) 38 (04)
Unclassifiedunassigned tumorsf
195 (26) 4 (02) 1320 (29) 383 (36)
TOTAL 7413 (100) 1884 (100) 46284 (100) 10518 (100)
Note Reported data are incident cases from 1989-1994 except for CBTRUS data which are from 1990-1993
aRefer to the World Health Organization (WHO) histology groupings in Appendix CbCentral Brain Tumor Registry of the United States cMinnesota Cancer Surveillance System (microscopically confirmed cases only)dNational Cancer Data Base (limited to cases reported by hospitals that accessioned nonmalignant cases) f For MCSS unclassifiedunassigned tumors include one malignant and four nonmalignant histologies which were
not listed in the CBTRUS classification scheme For NCDB unclassifiedunassigned tumors include 319 cases(less than one half percent) which had histologies not assigned by CBTRUS to any other category For SEERunclassifiedunassigned tumors include all malignant histologies occurring in the brainCNS which could not beclassified in one of the above categories based on their 4-digit histologic type
Page 36
Endash
APPENDIX E
TABLE 9 NUMBER AND PERCENT OF PRIMARY INTRACRANIAL AND CENTRAL NERVOUS SYSTEM TUMORS OF BENIGN AND UNCERTAIN BEHAVIOR
BY HISTOLOGY GROUPINGS
WHO Histologya
Groupings CBTRUSb
Number () MCSSc
Number () NCDBd
Number () SEERe
Number ()
Neuroepithelial 275 (43) 91 (46) 1064 (46) NA
Tumors of cranial and spinal nerves
980 (153) 397 (202) 2618 (113) NA
Tumors of meninges
3509 (548) 941 (480) 13667 (590) NA
LymphomasHemopoietic
3 (lt01) 0 7 (lt01) NA
Germ cell 4 (lt01) 1 (01) 25 (01) NA
Cysts and tumor-like lesions
15 (02) 3 (02) 34 (01) NA
Tumors of sellar region
1444 (226) 510 (260) 4749 (205) NA
Local extensions 0 0 0 NA
Unclassifiedunassigned tumorsf
171 (27) 18 (09) 1011 (44) NA
TOTAL 6401 (100) 1961 (100) 23175 (100) NA
Note Reported data are incident cases from 1989-1994 except for CBTRUS which is 1990-1993
aRefer to the World Health Organization (WHO) histology groupings in Appendix CbCentral Brain Tumor Registry of the United States c Minnesota Cancer Surveillance System (microscopically confirmed cases only) dNational Cancer Data Base (limited to cases reported by hospitals that accessioned nonmalignant cases) eSurvival Epidemiology and End Results Program (malignant cases only)dFor MCSS unclassifiedunassigned tumors include one malignant and four nonmalignant histologies which werenot listed in the CBTRUS classification scheme For NCDB unclassifiedunassigned tumors include 319 cases(less than one half percent) which had histologies not assigned by CBTRUS to any other category For SEERunclassifiedunassigned tumors include all malignant histologies occurring in the brainCNS which could not beclassified in one of the above categories based on their 4-digit histologic typeNA = Not applicable
Page 37
Endash
DATA COLLECTION
OF PRIMARY
CENTRAL NERVOUS
SYSTEM TUMORS
TABLE 10 METHOD OF CASE FINDING FOR PRIMARY INTRACRANIAL AND CENTRAL NERVOUS SYSTEM TUMORS BY TUMOR BEHAVIOR AND LOCATION MINNESOTA 1989-1994
Behavior Tumor Locationa
Number of Cases
Percent Found byRoutine
Reporting
Percent Found by Special Efforts
Malignant Brain Cerebral meninges
Pituitarycranio duct pineal Other intracranial
18841746 23 33
22
961 965 957 939
864
39 35 43 61
136 Extracranial 60 883 117 Benign Brain
1787 99
788 838
212 162
Cerebral meninges Pituitarycranio duct
pineal Other intracranial
807 458
263
843 740
779
157 260
221 Extracranial 160 631 369 Uncertain 174 856 144 Brain 79 823 177 Cerebral meninges Pituitarycraniopharyn- geal ductpineal Other intracranial
8 60
2
875 850
1000
125 150
00 Extracranial 25 960 40
TOTAL 3845 876 124
aRefer to the site codes in Appendix B
Page 38
Endash
1989 1990 1991 1992 1993 1994
TOTAL
APPENDIX E TABLE 11 METHOD OF CASE FINDING FOR INTRACRANIALa TUMORS BY DIAGNOSIS YEAR MINNESOTA 1989-1994
DiagnosisYear
Number of
Cases
Percent Found byRoutine
Reporting
Percent Found by
Special Efforts
571 837 163 616 865 135 586 913 87 602 899 101
633 872 128 592 929 71
3600 886 114
aIncludes the brain cerebral meninges pituitary gland pineal gland and otherintracranial tumors (refer to the site codes in Appendix B)
Page 39
Endash
DATA COLLECTION
OF PRIMARY
CENTRAL NERVOUS
SYSTEM TUMORS
TABLE 12 METHOD OF CASE FINDING FOR NONMALIGNANT INTRACRANIALa TUMORS BY TYPE OF FACILITY MINNESOTA 1989-1994
Type of Facility Number of Tumors Percent Found byRoutine
Reporting
Percent Found by Special Efforts
Registry at facility No registry at facility
1451325
859 569
141 431
TOTAL 1776 806 194
aIncludes tumors with benign or uncertain behavior that involve the brain cerebral meningespituitary gland pineal gland or other intracranial sites (refer to the site codes in Appendix B)
TABLE 13 REPORTING METHOD AND SOURCE OF CASE FINDING FOR NON- MALIGNANT INTRACRANIALa TUMORS DIAGNOSED IN HOSPITALS WITH A TUMOR REGISTRY MINNESOTA 1989-1994
Reporting Method Number of Tumors Percent Found byRoutine
Reporting
Percent Found by
Special Efforts
Registry-reportedLaboratory-reported
1226225
925 502
75 498
TOTAL 1451 859 141
aIncludes tumors with benign or uncertain behavior that involve the brain cerebral meningespituitary gland pineal gland or other intracranial sites (refer to the site codes in Appendix B)
Page 40
Endash0
APPENDIX E TABLE 14 HOSPITAL REGISTRY ACCESSIONING OF MALIGNANT AND NON-
MALIGNANT PRIMARY INTRACRANIAL AND CENTRAL NERVOUS SYSTEM TUMORS NCDB 1989-1994
TUMOR Totalb
BEHAVIOR Malignant c Nonmalignantd
Tumor Locationa HospitalsReporting
Number ()
Hospitals Reporting
Number ()
Hospitals Reporting
Number ()
Intracranial 1542 (100) 1526 (100) 900 (99)
Brain 1527 (99) 1519 (gt99) 754 (83)
Meninges 740 (48) 390 (26) 613 (67)
Pituitaryglandcraniopharyn-
geal duct
602 (39) 168 (11) 538 (59)
Pineal gland 319 (21) 277 (18) 79 (9)
Other central nervous system including cranial
nerves
648 (42) 545 (36) 299 (33)
Extracranial 812 (53) 708 (46) 410 (45)
Spinal cord 760 (49) 692 (45) 311 (34)
Spinal meninges 299 (19) 72 (5) 258 (28)
TOTAL Hospitals 1542 (100) 1526 (100) 913 (100)
Note The number of hospitals in each of the second third and fourth columns is the number that submittedreports to the NCDB for any intracranial and central nervous system tumors for the respective malignancystatus Not all hospitals submitted reports for each year during the study period (1989-1994)
aRefer to the site codes in Appendix B bBehavior codes = 0 1 3 cBehavior code = 3 dBehavior codes = 0 1
Page 41
Endash
DATA COLLECTION
OF PRIMARY
CENTRAL NERVOUS
SYSTEM TUMORS
Texas Cancer Registry
1997 CBTRUS State Survey of Benign Brain Tumor Data Collection
State Collection Status
Currently Collecting Benign Tumor Data1 Arizona Cancer Registry since 1981 2 Colorado Central Cancer Registry since 1988 3 Connecticut Tumor Registry since 1965 4 Idaho Cancer Data Registry since 1970 5 Maine Cancer Registry since 1983 6 Massachusetts Cancer Registry since 1982 7 Minnesota Cancer Surveillance System since 1988 8 Montana Central Tumor Registry since 1979 9 New York State Cancer Registry since 1988
10 North Carolina Central Cancer Registry since 1990 11 Utah Cancer Registry since 1966 12 Virginia Cancer Registry since 1994 13 Delaware State Cancer Registry14 Washington State Cancer Registry since 1992 15 passive collection 1979-1994
active collection since 1995
Stopped or Passive Collection of Benign Tumor Data1 New Jersey State Cancer Registry stopped 1979-1995 2 Kansas Cancer Registry stopped 1969-1995 3 New Hampshire State Cancer Registry stopped 1986-1991 4 District of Columbia Cancer Registry stopped 1997 5 Wyoming Cancer Surveillance Program stopped 111996 6 Louisiana Tumor Registry stopped 1992 (passive collection) 7 Illinois State Cancer Registry stopped 111996 8 Missouri Cancer Registry passive collection since 1984 9 South Carolina Central Cancer Registry passive collection since 1996
Beginning Collection of Benign Tumor Data1 North Dakota Cancer Registry began collection 1997 2 Rhode Island Cancer Registry began collection 1998
Page 42
Endash
APPENDIX E
Codes for Primary Intracranial and Central Nervous System Tumors
Note For this report the designation of ldquoprimary intracranial and central nervous system tumorsrdquo includes thefollowing primary tumors of central nervous system sites as well as tumors of the pituitary and pinealglands All histology types within the topography codes are included in the designation of ldquoprimaryintracranial and CNS tumors The source for the topography codes is Percy C Van Holten V Muir Ceds International Classification of Diseases for Oncology Second Edition Geneva World Health Organization 1990
Intracranial tumors
Brain C710 Cerebrum C711 Frontal lobe C712 Temporal lobe C713 Parietal lobe C714 Occipital lobe C715 Ventricle NOSC716 Cerebellum NOS C717 Brain stem C718 Overlapping lesion of brain C719 Brain NOS
Meninges C700 Cerebral meninges C709 Meninges NOS
a
Cranial Nerves and other intracranial parts of the central nervous systemC722 Olfactory nerve C723 Optic nerve C724 Acoustic nerve C725 Cranial nerve NOS C728 Overlapping lesion of brain and central nervous system C729 Nervous system NOS
Other endrocrine glands and related structures C751 Pituitary gland C752 Craniopharyngeal duct C753 Pineal gland
Extracranial tumors
Spinal cord C720 Spinal cord C721 Cauda equina
Meninges C701 Spinal meninges
aNOS=Not Otherwise Specified
Page 43
Endash
DATA COLLECTION
OF PRIMARY
CENTRAL NERVOUS
SYSTEM TUMORS
Brain Tumor Histology Groupings
The following histology groupings were used for the primary intracranial and central nervoussystem tumors The source for the histology groupings is Central Brain Tumor Registry ofthe United States (CBTRUS) 1996 Statistics Report Table 4
WHOa HISTOLOGY GROUPINGS ICD-Ob MORPHOLOGY CODE
Diffuse astrocytoma (protoplasma fibrillary) 9410 9420 Anaplastic astrocytoma 9401 9411 Glioblastoma 9440 9441 9442 Pilocytic astrocytoma 9421 Unique astrocytoma variants 9383 9384 9424 Oligodendroglioma 9450 Anaplastic oligodendroglioma 9451 9460 Ependymomaanaplastic ependymoma 9391 9392 9393 Ependymoma variants 9394 Mixed glioma 9382 Astrocytoma NOSc 9400 Glioma malignant NOS 9380 Choroid plexus 9390 Neuroepithelial 9381 9423 9430 Benign neuronalglial neuronal and mixed 86801 8693 9490 9505 9506 Malignant neruonalglial neuronal and mixed 86803 9364 9490 9500 Pineal parenchymal 9360 9361 9362 Embryonalprimitivemedulloblastoma 8963 9470 9471 9472
9473 9501 9502 9503 9510
TUMORS OF NEUROEPITHELIAL TISSUE
TUMORS OF CRANIAL AND SPINAL NERVES Nerve sheath benign and malignant 9540 9550 9560 9570
TUMORS OF THE MENINGES Meningioma 9530 9531 9532 9533 9534 9537 9538 Other mesenchymal benign and malignant 8800 8801 8802 8803 8810 8830 8850 88618900
8910 8990 9133 9150 9240 9480 9481 9536 9539 Hemangioblastoma 9161 9535
LYMPHOMAS AND HEMOPOIETIC NEOPLASMS Lymphoma 9590 9591 9593 9594 9595 9630 9650 9652
9663 9670 9671 9672 9674 9675 9680 9681 9682 9684 9685 9686 9687 9690 9691 96939695 9696 9698 9702 9714 9723 9731 9766 9970
GERM CELL TUMORS Germ cell 8020 9060 9064 9070 9071 9080 9084 9085 9100
CYSTS AND TUMOR-LIKE LESIONS Cysts and heterotopias 9084
TUMORS OF THE SELLAR REGION Pituitary 8040 8l40 8l46 8260 8270 8271 8280
8281 8290 8300 8330 8323 8333 Craniopharyngioma 9350
Page 44
Endash
APPENDIX E
LOCAL EXTENSIONS FROM REGIONAL TUMORS Chordomachondrosarcoma 9370
UNCLASSIFIED TUMORS Hemangioma 9120 9121 9130 9131 Neoplasm benign 80000 8010 Neoplasm uncertain behavior 80001 80011 Neoplasm malignant 80003 80013 8002 8003 All other 8720 9580
aWHO = World Health OrganizationbICD-O = International Classification of Diseases for Oncology Second Edition 1990 cNOS=Not Otherwise Specified
Page 45
Endash
DATA COLLECTION
OF PRIMARY
CENTRAL NERVOUS
SYSTEM TUMORS
Endash
International Classification of Childhood Cancer (ICCC)
Diagnostic Group
ICD-Oa codes
Morphology Topography
I LEUKAEMIA
(a) Lymphoid leukaemia 9820-9827 9850
(b) Acute non-lymphocytic leukaemia 9840 9841 9861 9864 9866 9867 98919894 9910
(c) Chronic myeloid leukaemia 9863 9868
(d) Other specified leukaemias 9830 9842 9860 9862 9870-9890 9892 98939900 9930-9941
(e) Unspecified leukaemias 9800-9804
II LYMPHOMAS AND OTHER RETICULOENDOTHELIAL NEOPLASMS
(a) Hodgkinrsquos disease 9650-9667
(b) Non-Hodgkinrsquos lymphoma 9591-9595 9670-9686 9690-9714 9723
(c) Burkittrsquos lymphoma 9687
(d) Miscellaneous lymphoreticular neoplasms 9720 9731-9764
(e) Unspecified lymphomas 9590
III CENTRAL NERVOUS SYSTEM (CNS) ANDMISCELLANEOUS INTRACRANIAL AND
INTRASPINAL NEOPLASMSb
(a) Ependymomac 9383 9390-9394
(b) Astrocytoma 9380 C723
9381 9400-9441
(c) Primitive neuroectodermal tumours 9470-9473
(d) Other gliomasd 9380 C700-C722C724-C729
9382 9384
9442-9460 9481
APPENDIX E
Diagnostic Group
ICD-Oa codes
Morphology Topogragphy
III CNS AND MISCELLANEOUS INTRACRANIAL AND INTRASPINAL
NEOPLASMSb Continued
(e) Miscellaneous intracranial and intraspinalneoplasmsc
8270-8281 8300 9350-9362 9480 95059530-9539
(f) Unspecified intracranial and intraspinalneoplasmsc
8000-8004 C700-C729C751-C753
IV SYMPATHETIC NERVOUS SYSTEM TUMOURS
(a) Neuroblastoma and ganglioneuroblastoma 9490 9500
(b) Other sympathetic nervous system tumours 8680 8693-8710 9501-9504 9520-9523
aInternational Classification of Diseases for Oncology Second Edition World Health Organization 1990bGroup III excludes all lymphomas See group II cBehaviour codes 0 and 1 are included dBehaviour code 1 is included
Page 47
Endash
Comments and recommendations are welcome Should questions arise on how to use these
materials or for more information please contact
Centers for Disease Control and Prevention National Program of Cancer Registries
4770 Buford Hwy NE Mail Stop K-53
Atlanta GA 30042-3717
Voice Information System 1 (888) 842-6355 bull Fax (770) 488-4760
cancerinfocdcgov bull httpwwwcdcgovcancer
All materials are in the public domain and may be reproduced or copied without permission citation
to source however is appreciated
BACK COVER
(WHITE)
Spine(WHITE)
DATA COLLECTION OF PRIMARY CEN
TRAL NERVOUS SYSTEM
TUM
ORS 2004
National Program of Cancer Registries Training M
aterials
DATA COLLECTION
OF PRIMARY
CENTRAL NERVOUS
SYSTEM TUMORS
and regulations would be needed A mandate to report would be required to ensure high quality
surveillance
Based on its findings the BTWG has prepared four recommendations regarding data
collection for primary intracranial and CNS tumors
1 We recommend that the following standard definition be used for collecting precise
data for all primary intracranial and CNS tumors
Primary intracranial and CNS tumors are all primary tumors occurring in the
following sites irrespective of histologic type or behavior brain meninges
spinal cord cauda equina cranial nerves and other parts of the CNS pituitary
gland pineal gland and craniopharyngeal duct (see Appendix B)
2 We recommend the development of a standard site and histology definition for
tabulating estimates of these tumors to allow comparability of information across
registries Pathologists the North American Association of Central Cancer Registries
(NAACCR) the Commission on Cancer (COC) the Surveillance Epidemiology and
End Results (SEER) Program the National Program of Cancer Registries (NPCR)
and the International Agency for Research on Cancer (IARC) need to be involved in
developing this standard
3 We recommend collection of data for primary intracranial and extracranial CNS
tumors by all registries hospital- and population-based This effort will necessitate a
change in the COC requirements and will increase costs to the hospital-based
programs Federal funding should be allocated to supplement the additional transition
and ongoing data collection costs that will be incurred by central registries Before
Page 6
Endash
APPENDIX E additional data collection is implemented a pilot study should be conducted in
multiple states to assess the procedures and quality control functions needed as well as
the costs of collecting data on these tumors
4 We recommend that the appropriate government and professional organizations be
involved in carrying out the development and implementation of special training
programs and curricula for central registry hospital registry and laboratory personnel
as well as the development of computerized edit-checking procedures Training for
reporting and tabulating primary intracranial and CNS tumors should be offered on a
regular basis
Page 7
Endash
DATA COLLECTION
OF PRIMARY
CENTRAL NERVOUS
SYSTEM TUMORS
REFERENCES
1 CBTRUS (1996) First annual report 1995 Central Brain Tumor Registry of the United StatesChicago Illinois
2 National Center for Health Statistics public use mortality files for 1979-19953 Surawicz TS Davis F et al Brain tumor survival results from the National Cancer Data Base
(Accepted for publication in Journal of Neuro-Oncology)4 Thapar K Laws ER Tumors of the central nervous system In Murphy GP Lawrence W Jr
Lenhard RE Jr eds Textbook of clinical oncology ed 2 Atlanta American Cancer Society1995378-410
Page 10
Endash0
APPENDIX E
INTRODUCTION
Because nonmalignant brain tumors often can have a malignant clinical course leading to
substantial long-term morbidity and high risk for death the distinction between
histopathologically-defined malignancies versus nonmalignancies is tenuous from both a clinical
and an epidemiologic standpoint Likewise because nonmalignancies have not been systematically
or consistently included in most population-based cancer surveillance systems the public health
community has little information to offer on either incidence or mortality patterns and trends of
nonmalignant brain tumors in the United States (US) Additionally there have been virtually no
analytic epidemiology research studies conducted that would help identify factors that influence
the risk for nonmalignant brain tumor occurrence Thus despite their clinical importance both the
public health surveillance mission and the etiologic research mission of cancer prevention and
control are compromised by the exclusion of nonmalignant brain tumors in registry systems
Recognizing this challenge the National Coordinating Council for Cancer Surveillance (NCCCS)
established a Brain Tumor Working Group (BTWG) during its semi-annual meeting in January
1997 The purpose of BTWG was to review the status of the surveillance of brain tumors in the
US and examine the feasibility of collecting data for nonmalignant brain tumors Upon
completion of the project recommendations regarding surveillance of both malignant and
nonmalignant (ie benign or uncertain behavior) brain tumors would be presented at a special
meeting of the NCCCS This report describes data collection by US registries for primary
intracranial and central nervous system (CNS) tumors It includes data from several registries to
demonstrate variability in current reporting practices
BACKGROUND
Classification
Historically cancer registries have used the International Classification of Diseases (ICD)
system which describes tumors by their location (topography) and behavior (benign versus
malignant)1 to code neoplasms Tumor nomenclature describing histology was developed by
pathologists and incorporated into the International Classification of Diseases for Oncology (ICD-
O) system as a morphology code in 19762 and revised in a second edition (ICD-O-2)3 However
Page 11
Endash
DATA COLLECTION
OF PRIMARY
CENTRAL NERVOUS
SYSTEM TUMORS
Endash
not all of the morphology codes in the current ICD-O classification used by cancer registries are
consistent with the recent World Health Organization (WHO) brain tumor codes34 The recent
WHO brain tumor classification has new terms that are not included in ICD-O-2 however a new
third edition to ICD-O may include these terms ICD-O-2 also includes terms which are not
categorized by WHO
The CNS environment also contributes to the difficulty in characterizing tumors that
involve this site In contrast to tumors arising in other organ systems the terms benign and
malignant are only relative distinctions for CNS neoplasms Depending on location
histologically benign CNS tumors can result in similar or worse outcomes compared with
malignant tumors For these and other reasons classic oncologic concepts predicated on
histologic grade nodal status and staging strategies are not entirely applicable to tumors of the
CNS5
When the BTWG discussed whether to consider anatomic sites other than the brain for
this report the unique features of the CNS and the morbidity and mortality associated with non-
CNS intracranial tumors were closely examined For the sake of simplicity in reporting and
analyzing data for all of these sites the designation of primary intracranial and CNS tumors was
suggested This designation proposed by Walker et al6 is used by the Central Brain Tumor
Registry of the United States (CBTRUS) and includes the brain cerebral meninges cranial
nerves pituitary gland craniopharyngeal duct pineal gland spinal cord cauda equina and spinal
meninges The intracranial sites are the brain cerebral meninges cranial nerves and other
intracranial parts of the CNS the craniopharyngeal duct and the pineal and pituitary glands The
extracranial sites are the spinal cord cauda equina and spinal meninges The BTWG also included
lymphomas in the histology groupings for these sites The topography codes for the sites are in
Appendix B and the histology groupings are listed in Appendix C In this report no distinctions
are made between different age groups for intracranial and CNS tumors
Incidence
The age-adjusted incidence rate for malignant brain and other CNS tumors in the US
for 1991-1995 was 61 per 100000 person years7 Approximately 17400 new cases will be
diagnosed in 19988 The incidence of nonmalignant brain and other CNS tumors is difficult to
Page 12
APPENDIX E ascertain because few cancer registries collect or report these data However CBTRUS
reported an incidence rate for all primary brain and CNS tumors including the pituitary and
pineal glands of 118 per 100000 for 1990-19939 the organization also estimated that 28600
new cases of primary malignant and benign brain tumors were diagnosed nationwide in
199510 For both men and women rates for malignant and nonmalignant brain tumors decline
after a peak in childhood (younger than 10 years) increase after age 25 and stabilize after age
75 overall rates are higher for males11
Although the Surveillance Epidemiology and End Results (SEER) Program reported
a 28 percent decrease in the incidence of invasive brain and other nervous system cancer from
1991 to19957 within the last decade there have been many reports of dramatic increases in the
incidence of brain tumors12-21 particularly among children2223 and the elderly121617 Some
consider the increased rates as histology-specific14 and indicative of a true shift in incidence13
Other studies have concluded that many of the new cases are an artifact of changing
diagnostic procedures1617 In the US the discussion regarding the increased incidence of brain
tumors has been limited to rates for malignant tumors Standard reporting practices would aid
in the interpretation of time trends
Molecular studies24-26 have demonstrated that some low grade or benign intracranial
tumor subtypes transform to malignant tumors To understand the factors that might
contribute to this transformation and whether incidence rates for both malignant and
nonmalignant intracranial tumors are affected the full spectrum of the disease needs to be
observed
Mortality
Brain tumors regardless of behavior are the second leading cause of death from
neurological disease27 In 1995 malignant brain tumors accounted for 12062 deaths and
947 deaths were due to benign brain tumors Another 131 deaths were reported for brain
tumors of uncertain behavior and 2788 persons died of brain tumors for which the behavior
was unspecified28 The estimated number of deaths in 1998 due to malignant brain and other
CNS tumors is 133008 Increased mortality rates for malignant brain tumors particularly
among the elderly have been reported One study concluded that the increases were largely
Page 13
Endash
DATA COLLECTION
OF PRIMARY
CENTRAL NERVOUS
SYSTEM TUMORS
Endash
related to better diagnostic technology and the introduction of support programs such as
Medicare that facilitate diagnostic procedures in the elderly17 Another study attributed the
rising primary malignant brain tumor mortality to differential survival and its effect on the
surviving gene pool in an aging population28
Survival
Prognosis for CNS tumors depends on at least four variables tumor histopathology
anatomic location patient age and neurologic status5 According to a recent analysis using
SEER data from 1973-1991 overall survival rates for malignant brain tumors and rates for
patients with three specific histological types -- astrocytoma medulloblastoma and
oligodendroglioma -- improved29 Few data are available for survival rates for nonmalignant
primary intracranial and CNS tumors However Surawicz et al used data from the National
Cancer Data Base (NCDB) a joint project of the Commission on Cancer (COC) of the
American College of Surgeons (ACoS) and the American Cancer Society to examine survival
rates for patients diagnosed from 1985-1988 and from 1990-1992 with malignant or benign
brain tumors30 NCDB collects data from hospital tumor registries Based on the records of
more than 60000 patients the authors found a 216 percent 5-year survival rate for patients
with malignant tumors and a 724 percent rate for those with benign tumors The most
favorable prognosis was associated with neurilemmomas pilocytic astrocytomas and
meningiomas In contrast microgliomas lymphomas malignant gliomas and anaplastic
astrocytomas were associated with a poor outcome Surawicz et al also found variations in
survival for some tumors depending on location For example survival rates for
glioblastomas which generally have a poor prognosis improved if the tumors were located in
the cerebellum similarly astrocytomas and anaplastic astrocytomas were associated with a
better outcome if the tumors were in the ventricles or the cerebellum
Risk Factors
Although malignant and nonmalignant intracranial and CNS tumors have undergone
considerable study etiologic and pathophysiologic details concerning their genesis remain
obscure Definite genetic predispositions for the development of brain tumors have been
identified however population-based studies suggest that no more than 4 percent of these
Page 14
APPENDIX E tumors can be attributed to heredity 31 Several environmental carcinogens may be associated
with brain tumors including ionizing radiation11 electromagnetic fields32 and pesticides33
sustained exposure to vinyl chlorides polycyclic hydrocarbons and nitrosoureas has been
implicated as well5 Also the presence of the Epstein-Barr virus contained in the DNA of
primary lymphoma suggests that a viral etiology for human brain tumors cannot be entirely
ignored5 Accurate and complete data are necessary to develop hypotheses to identify the
causes of intracranial and CNS tumors The heterogeneity of brain tumors may mask the
identification of causes when histology-specific studies are limited by the number of available
cases
Surveillance
Population-based cancer registries generally provide incidence rates and trends for
cancer surveillance purposes and support related clinical and epidemiological research To
receive accreditation from the COC hospital cancer registries are required to report only
in situ and primary malignant tumors for all sites including the brain and other CNS sites34
Because data collection for nonmalignant intracranial and CNS tumors is not standardized at
either the central tumors can be attributed to heredity or hospital registry level collecting data
for all primary intracranial tumors is a challenge
In 1997 CBTRUS conducted a state survey (Appendix A) of benign brain and other
CNS tumor collection35 This survey gathered information from 64 member registries of the
North American Association of Central Cancer Registries (NAACCR) representing 48 states
All 64 of the registries collected data for primary malignant brain and other CNS tumors
however only 15 state registries collected data for nonmalignant (ie benign) tumors at the
time of the survey Seven state registries had stopped collecting data for benign brain and
other CNS tumors three collected the data passively one had started to collect the data in
1997 and one planned to start in 1998The majority of the registries surveyed indicated that
the requirements of their brain and other CNS tumor data collection had not been altered in
the past 5 years
Page 15
Endash
DATA COLLECTION
OF PRIMARY
CENTRAL NERVOUS
SYSTEM TUMORS
Endash
METHODS
To analyze available data on issues related to the collection of data for primary
intracranial and CNS tumors the BTWG examined surveillance data from CBTRUS the
Minnesota Cancer Surveillance System (MCSS) NCDB and SEER (Table 1) The NCDB
includes cases from all 50 states the District of Columbia and Puerto Rico however it is not
population-based CBTRUS MCSS and the SEER Program are population-based registries
that cover selected areas of the US Three SEER areas collect information for benign and
uncertain (ie nonmalignant) brain tumors but they do not report it Currently however
there are no standard definitions for the collection of site and type among the areas CBTRUS
MCSS and NCDB collect information on both malignant and nonmalignant primary brain
tumors Because the accessioning of nonmalignant cases for NCDB is not required by COC
only 59 percent of the hospitals that submitted any data to NCDB on intracranialCNS cases
diagnosed during 1989-1994 submitted nonmalignant cases The NCDB data reported here
are restricted to those hospitals that reported at least one nonmalignant case as these cases
were thought to contribute most toward the purpose of this report Also although MCSS
collects data for both malignant and nonmalignant tumors it does so for microscopically-
confirmed cases only This registry performs 100-percent case finding audits in all pathology
laboratories in Minnesota
Data inclusion criteria were developed as specified in Appendix B and all four of the
resources (ie CBTRUS MCSS NCDB SEER) developed subsets of their currently
available data according to the agreed-upon inclusion criteria Frequencies and proportions
were computed to reflect variations in factors other than site and the resulting contrasts
across these registries broadly reflect data collection practices For example the primary
difference in brain and CNS definition between SEER and CBTRUS lies in reporting by
behavior with the latter including all nonmalignant tumors As such differences in
proportions between these two registries approximately reflect the magnitude of nonmalignant
brain and CNS tumors Similarly the primary difference in brain and CNS definition between
MCSS and CBTRUS is that the former requires microscopic confirmation of all tumors and
the latter includes clinically and radiologically diagnosed tumors Another important difference
Page 16
APPENDIX E between MCSS and CBTRUS is that MCSS uses a more active method for case finding
Therefore differences in proportions reported reflect the interaction between the magnitude of
nonmicroscopically diagnosed tumors and the magnitude of incomplete case finding of certain
tumor types in CBTRUS Finally the primary difference between NCDB and CBTRUS is that
the former is a hospital-based reporting system and the latter is a population-based reporting
system Therefore differences in proportions may largely reflect referral biases inherent in
hospital reporting systems While other data collection practices may influence information in
these data resources these data bases were selected to highlight the variation in current
information on primary brain and CNS tumors that arises without a standard definition
Frequencies were computed using ICD-O codes for topography (ie location)
behavior diagnostic confirmation histology and selected combinations of behavior and
topography codes Topography was broadly defined into two main categories with
subcategories as shown in Appendix B Intracranial tumors included tumors located in the
brain and other CNS regions (including the cranial nerves) in the meninges and in the
pituitary and pineal glands Extracranial tumors included those located in the spinal cord and
spinal meninges The distinction between intracranial and extracranial tumors was removed for
Table 7 by collapsing brain and spinal meninges into one category and combining the pituitary
and pineal glands into one group (as these regions have endocrine functions) to allow for
adequate numbers within categories of behavior For Table 10 the intracranial and extracranial
distinction was maintained however the pituitary and pineal glands were collapsed into one
category and the spinal cord and spinal meninges were collapsed into the extracranial
category
Behavior was coded using ICD-O categories 0 for benign 1 for uncertain and 3 for
malignant with the first two of these categories collapsed into a nonmalignant category
Microscopic confirmation is based on the SEER definition and grouped into positive
microscopic confirmation radiography without microscopy clinical and unknown These
categories were further grouped as microscopically confirmed and as not microscopically
confirmed for the analysis in Table 3
Page 17
Endash
DATA COLLECTION
OF PRIMARY
CENTRAL NERVOUS
SYSTEM TUMORS
Endash
CBTRUS developed preliminary histology groupings with the aim of improved clinical
relevance ICD-O morphology codes which are used by cancer registries were grouped
based on WHO categories for brain tumors The details of these groupings are shown in
Appendix C
RESULTS
Percentages of Primary Intracranial and CNS Tumors by Tumor Location and by
Microscopic Confirmation
Intracranial tumors comprise more than 94 percent of primary intracranial and CNS
tumors and between 50 and 92 percent of primary intracranial and CNS tumors occur in the
brain (Table 2) The data in this report also show that a slightly greater percentage of
malignant intracranial tumors including malignant brain tumors are microscopically
confirmed compared with corresponding tumors of benign or uncertain behavior (Table 3)
However regardless of tumor behavior the percentages of extracranial CNS tumors that are
microscopically confirmed are higher than the percentages of intracranial tumors that are
confirmed by pathologists (Table 3) Few primary intracranial and CNS tumors are not
microscopically confirmed approximately 11 percent of diagnoses are based only on a clinical
or radiographical (without microscopy) assessment (Table 4)
Percentages of Malignant and of Nonmalignant Intracranial and CNS Tumors by Location
The relative distribution of nonmalignant intracranial and CNS tumors varies by
primary site While greater than 90 percent of malignant intracranial and CNS tumors occur
in the brain (Table 5) only 9 to 26 percent of the nonmalignant tumors occur as parenchymal
tumors (Table 6) Nonmalignant tumors comprised a significant portion of the primary
intracranial and CNS tumors reported by the sources The ratios of nonmalignant to primary
malignant intracranial and CNS tumors reported by CBTRUS MCSS and NCDB were 09
10 and 05 respectively (Table 7)
Percentages of Malignant and of Nonmalignant Intracranial and CNS Tumors by Histology
Among the malignant primary intracranial and CNS tumors neuroepithelial (ie
astrocytic) tumors represent 83 to 90 percent of the cases depending on the data source
Page 18
APPENDIX E lymphomashemopoietic tumors 6 to 11 percent tumors of the meninges 1 to 2 percent and
tumors of cranial and spinal nerves 02 percent (Table 8) For nonmalignant primary
intracranial and CNS tumors tumors of the meninges represent 48 to 59 percent of the cases
tumors of the sellar region (including pituitary tumors and craniopharyngiomas) 21 to 26
percent tumors of cranial and spinal nerves 11 to 20 percent and neuroepithelial tumors 4 to
5 percent (Table 9)
Percentages of Primary Intracranial and CNS Tumors by Method of Case Finding (MCSS)
Case finding audits by the MCSS occur on an annual basis in all pathology laboratories in
Minnesota and include the review of surgerypathology cytology autopsy and hematology
records These audits enable the registry to ensure that there is complete reporting of cases of
malignant and nonmalignant tumors In tables 10 through 13 data from MCSS on primary
intracranial and CNS tumors are presented by method of case finding The two methods of case
finding are routine reporting and special efforts A case was found by routine reporting if one
or more reports received before the close-out date for a given diagnosis year was initiated by a
hospital or nonhospital facility In contrast a case was found by special efforts if all reports of that
case received before the close-out date were requested as a result of pathology laboratory audits
The data in Table 10 indicate that routine reporting of nonmalignant tumors was less complete
compared with reporting for malignant tumors The percentages of intracranial tumor cases that
were found by special efforts have varied from year to year but the trend suggests that routine
reporting may be improving (Table 11) The greatest improvement has been in the coverage of
nonbrain parenchymal tumors (ie pituitarypineal and other intracranial) The small numbers of
autopsy-only tumors were more likely to be found by special case finding efforts than by other
methods of microscopic confirmation (data not shown)
Most hospitals in Minnesota have cancer registries through which their tumor cases are
reported However some of the cases that are seen at hospitals with registries are reported only
through pathology laboratories affiliated with the hospitals Approximately 80 percent
(14511776) of the cases of nonmalignant intracranial tumors in the MCSS data base were
reported by hospitals with registries (Table 12) eighty-five percent (12261451) of these cases
were reported by the hospitals registries (Table 13)The remaining 15 percent (2251451) of the
Page 19
Endash
DATA COLLECTION
OF PRIMARY
CENTRAL NERVOUS
SYSTEM TUMORS
Endash0
cases were reported through the pathology laboratories affiliated with the hospitals with registries
(ie they were not accessioned by the registries) (Table 13) The percentages of cases of
nonmalignant tumors that were reported only by the pathology laboratories at facilities having
cancer registries can be viewed as a measure of how frequently the registries failed to accession
the cases Of the 225 nonaccessioned tumors half would have been missed without the MCSS
case finding audits of pathology laboratories (Table 13)
Percentages of Hospital Cancer Registries That Accessioned Malignant and Nonmalignant
Intracranial and CNS Tumors (NCDB)
Based on data from NCDB more than 1500 hospitals accessioned cases with either
malignant or nonmalignant intracranial and CNS tumors and approximately 800 hospitals
accessioned extracranial cases Cases with tumors that involved the cranial or spinal meninges or
the pituitary gland were more likely to be reported by hospitals that accessioned nonmalignant
primary intracranial and CNS tumors than by hospitals that accessioned only malignant tumors
(Table 14)
DISCUSSION
The findings for this report indicate that collection and reporting of incidence data for
primary malignant intracranial and other CNS tumors are well standardized However substantial
variation exists in the processes of collecting and reporting nonmalignant tumor data One
obstacle is that not all hospitals have cancer registries Another problem is that not all hospitals
with registries accession cases of nonmalignant tumors Data from Minnesota (Table 13) suggest
that approximately 85 percent of cases of nonmalignant intracranial tumors are accessioned by
hospital registries However nonaccessioned CNS cases are less likely to be routinely reported to
the central registry (Table 13) These differences in collection and reporting practices among the
registries make it difficult to assess the burden of primary intracranial and CNS tumors
Terminology for describing intracranial and CNS tumors is also not standardized For
example although the pituitary gland and pineal glands are not technically part of the CNS
tumors that involve these organs are often included in the term CNS tumors On the other hand
some consider the eye to be intracranial however CNS tumors generally do not include the
Page 20
APPENDIX E eyes Although the World Health Organization (WHO) has published a list of histologic
groupings at present no single comprehensive list of histologic groupings exists for intracranial
and CNS tumors Since the International Classification of Childhood Cancer (ICCC) is based on
histologic type rather than site certain benign histologies of sites other than brainCNS (eg non-
CNS ependymomas) would not be included in the BTWGs primary intracranial and CNS
histology groupings (Appendix D) Thus the variation in incidence estimates of primary
intracranial and CNS tumors may be attributable in part to the variation in the definitions of
these tumors In addition differences in cancer registry training and procedures may contribute to
nonreporting and inconsistent reporting of the tumors
The BTWG discussed the feasibility of conducting a random sampling procedure as an
alternative to complete enumeration and ongoing surveillance of nonmalignant brain tumors It
was agreed that this technique would not be valid or feasible for the following reasons
1 If a random sample of incident brain tumors were desired a complete list would be
needed first (a sampling frame is required)
2 If a survey method were used to identify brain tumors in the general population (eg
random digit dialing or other general population survey techniques) the information
needed could not be obtained for several reasons
- Either a prohibitively large numbers of individuals would have to be surveyed or
else only a very small number of brain tumors could be identified given the rarity
and sometimes short survival time
- The brain tumors identified would not be representative of all brain tumors that
occur because people who had survived their brain tumors would be more
likely to be identified
- The incidence rate would still not be known since cross-sectional surveys only
identify disease prevalence
3 If a sample of hospitals were selected to contribute data the tumors included would not
represent the entire spectrum of brain tumors because those that were diagnosed and
treated outside of the hospital setting would be excluded
Page 21
Endash
DATA COLLECTION
OF PRIMARY
CENTRAL NERVOUS
SYSTEM TUMORS
Endash
An alternative approach to sampling and the least troublesome would be to conduct
population-based surveillance only in certain geographic areas of the country If one assumes that
the etiology of brain tumors does not differ from one area of the country to another then the
scientific validity of studies based on this type of sampling would not be a problem However
given the rarity of some types of brain tumors sufficient numbers for study may not be available
unless the vast majority of the nations population were covered by population-based data
collection Also geographic areas without population-based surveillance would have no data to
use for assessing local trends or variations in brain tumor occurrence
In the absence of standard tumor registration procedures and training special case finding
efforts by central registries may be necessary to ensure that complete data are collected for
nonmalignant intracranial and CNS tumors Data from MCSS (Table 10) which has a legal
requirement for reporting nonmalignant intracranial tumors and performs 100 percent case finding
audits in all laboratories indicate that only 80 percent of nonmalignant tumors were routinely
reported In contrast routine reporting accounted for more than 95 percent of malignant
intracranial and CNS tumors Nonmalignant cases in Minnesota that were not accessioned by
hospital registries had a 50 percent chance of being routinely reported to the central registry
however these were only microscopically confirmed cases
Completeness of reporting is critical to cancer registries Accurate case counts are
necessary to assess the burden of cancer to guide cancer control program planning to prioritize
the allocation of health resources and to facilitate epidemiologic research Most central cancer
registries have state laws that mandate reporting of cases by physicians and by hospitals
laboratories and other facilities that provide screening diagnostic or therapeutic services
Complete reporting of nonmalignant intracranial and CNS tumors would be greatly
improved if reporting requirements of the COC central cancer registries SEER and the
National Program of Cancer Registries (NPCR) were changed to require the collection of
information for these tumors However this requirement would have many implications
including an increase in work load as well as associated costs for reporting facilities An estimated
14 percent of all new cancer cases diagnosed in 1998 will involve invasive brain and other
nervous system tumors7 since the numbers of benign and invasive brain and other CNS tumors
Page 22
Endash
APPENDIX E diagnosed annually are similar facilities that presently do not accession nonmalignant cases could
expect an approximately 14 percent increase in the total number of CNS cases collected by the
registry Some estimates of the percentage of brain tumors have been lower (05 percent)36 and
others have been higher (9 percent)37 therefore the extent to which the workload would be
affected may vary The data in this report suggest that if reporting of nonmalignant intracranial
and CNS tumors were required the total number of cases of tumors for these anatomic sites
would double for facilities that presently report only malignant tumors This is consistent with the
findings of Davis et al36 who reported that the incorporation of benign brain tumors into the
cancer-reporting systems of four central registries increased the overall incidence of brain cancer
by 49 percent Forty percent (913) of the hospital registries that submitted data to the NCDB did
not report nonmalignant brain tumors These registries could expect up to a 50 percent increase in
the number of intracranial and CNS tumors reported nonregistry facilities which represent
approximately 20 percent of cases reported to central cancer registries could expect a similar
increase Also central cancer registries that currently do not require reporting of nonmalignant
intracranial and CNS tumors could expect increases in their workloads as a result of the
additional time spent on processing and quality control procedures and training The lack of
standard definitions and collection and reporting guidelines would make these tasks more time-
consuming as well
For some central cancer registries that want to expand their reporting requirements to
include nonmalignant intracranial and CNS tumors a change in current legislation andor
regulations may be needed These changes could involve several months of lead time if public
hearings or other legal procedures are necessary In other states the reporting of these tumors is
not required in either their legislation or regulations in these situations hospitals have been asked
to voluntarily report the cases For example in Massachusetts the reporting of benign brain
tumors is not required by law but hospitals have been reporting these cases since 1982 However
the completeness of data reported on a voluntary basis is difficult to assess For public health
surveillance systems a mandate to report is the basic requirement of a comprehensive higher
quality system
DATA COLLECTION
OF PRIMARY
CENTRAL NERVOUS
SYSTEM TUMORS
If COC SEER NPCR and central cancer registries changed their reporting requirements
to include nonmalignant intracranial and CNS tumors the registry manuals disseminated by these
programs and registries would also need to be modified to include new definitions of reportable
diagnoses All reporting facilities would have to be notified of the new requirements To ensure
complete reporting from registries additional training of registrars should be expected Case
finding methods may need to be modified in order to identify the new cases and sources of
information Central cancer registries would also need to increase their case finding audits The
inclusion of nonmalignant tumors would also necessitate changes to other data items such as
sequence number Hospital and central cancer registries would need to consider adding WHO
brain tumor grade as an additional data item
Finally the software used by reporting facilities and by central registries would need to be
modified to accept nonmalignant morphology and behavior codes Also edits programs would
need to be modified to include these additions and to accept a nonmalignant sequence numbering
procedure
Before reporting requirements for primary intracranial and CNS tumors could be changed
feasibility studies would have to be conducted to determine whether such changes should be
recommended Two SEER special studies are under way to evaluate the impact of requiring the
collection of benign brain tumors on case finding cost quality control and training However
additional studies may be required
Page 24
Endash
APPENDIX E
RECOMMENDATIONS OF THE BRAIN TUMOR WORKING GROUP
1 We recommend the following standard definition for collecting precise data for all primary
intracranial and central nervous system tumors
Primary intracranial and central nervous (CNS) tumors are primary tumors occurring in
the following sites irrespective of histologic type or behavior brain meninges spinal
cord cauda equina cranial nerves and other parts of the CNS pituitary gland pineal
gland and craniopharyngeal duct (see Appendix B)
2 We recommend the development of a standard site and histology definition for tabulating
estimates of these tumors to allow comparability of information across registries Pathologists
the North American Association of Central Cancer Registries (NAACCR) the Commission
on Cancer (COC) the Surveillance Epidemiology and End Results (SEER) Program the
National Program of Cancer Registries (NPCR) and the International Agency for Research
on Cancer (IARC) need to be involved in developing this standard
3 We recommend collection of data for primary intracranial and extracranial CNS tumors by all
registries hospital- and central-based This effort will necessitate a change in the COC
requirements and will increase costs to the hospital-based programs Federal funding should be
allocated to supplement the additional transition and ongoing data collections costs that will be
incurred by central registries Before additional data collection is implemented we recommend
a pilot study should be conducted to assess the procedures and quality control functions
needed as well as the costs of collecting data for these tumors
4 We recommend that the appropriate government and professional organizations be involved in
carrying out the development and implementation of special training programs and curricula for
central registry hospital registry and laboratory personnel as well as the development of
computerized edit-checking procedures Training for reporting and tabulating primary
intracranial and CNS tumors should be offered on a regular basis
Page 25
Endash
DATA COLLECTION
OF PRIMARY
CENTRAL NERVOUS
SYSTEM TUMORS
Endash
REFERENCES
1 Davis F Preston-Martin S Epidemiology of brain tumors In Bigner DD McLendon RE Bruner JM eds Russell and Rubinsteins pathology of tumors of the nervous system ed 6 London Arnold Publishing 19965-45
2 World Health Organization (WHO) (1976) International classification of diseases foroncology ed 1 Geneva World Health Organization
3 World Health Organization (WHO) (1990) International classification of diseases foroncology ed 2 Geneva World Health Organization
4 Kleihues P Burger PC Scheithauer BW The new WHO classification of brain tumorsBrain Pathol 19933255-268
5 Thapar K Laws ER Tumors of the central nervous system In Murphy GP Lawrence WJr Lenhard RE Jr eds Textbook of clinical oncology ed 2 Atlanta American CancerSociety 1995378-410
6 Walker AE Robins M Weinfield FD Epidemiology of brain tumors the national survey ofintracranial neoplasms Neurol 198535219-226
7 Ries LAG Kosary CL Hankey BF Miller BA Edwards BK (eds) SEER Cancer StatisticsReview 1973-1995 National Cancer Institute Bethesda MD 1998
8 Cancer Facts amp Figures - 1998 American Cancer Society Atlanta Georgia 19989 Davis FG Bruner JM Surawicz TS The rationale for standardized registration and reporting
of brain and central nervous system tumors in population-based cancer registriesNeuroepidemiol 199716308-316
10CBTRUS (1996) First annual report 1995 Central Brain Tumor Registry of the UnitedStates Chicago Illinois
11 Preston-Martin S Epidemiology of primary CNS neoplasms Neurol Clinics 199614273-290
12 Greig NH Ries LG Yancik R Rapoport SI Increasing annual incidence of primary malignantbrain tumors in the elderly J Natl Cancer Inst 1991 831621-1624
13 Mao Y Desmeules M Semenciw RM Hill G Gaudette L Wigle DT Increasing brain cancerrates in Canada Can Med Assoc J 19911451583-1591
14 Frelick R Huang P Topham A Brain and central nervous system tumors Delaware 1980 to1989 Del Med J 199264571-573
15 Davis DL Ahlbom A Hoel D Percy C Is brain cancer mortality increasing in industrialcountries Am J Ind Med 199119421-431
16 Helseth A Increasing incidence of primary central nervous system tumors in the elderly Realincrease or improved detection J Natl Cancer Inst 1993851871-1872
17 Modan B Wagener D Feldman JJ Rosenberg HM Feinleib M Increased mortality frombrain tumors A combined outcome of diagnostic technology and change of attitude towardthe elderly Am J Epidemiol 19921351349-1357
18 Polednak AP Time trends in the incidence of brain and central nervous system cancers inConnecticut J Natl Cancer Inst 1991831679-1681
19 Boyle P Maissonneuve P Saracci R Muir CS Is the increase in incidence of primarymalignant brain tumors real J Natl Cancer Inst 1990201594-1596
Page 26
APPENDIX E 20 Preston-Martin S Descriptive epidemiology of primary tumors of the brain cranial nerves
and spinal meninges in Los Angeles County Neuroepidemiol 19898283-29521 Helseth A Mork SJ Neoplasms of the central nervous system in Norway Epidemiological
characteristics of intracranial gliomas according to histology APMIS 97 1989547-55522 Gurney JG Davis S Severson RK Fang J-Y Ross JA Robison LL Trends in cancer
incidence among children in the United States Cancer 199678532-54123 Gurney JG Ross JA Wall DA Bleyer WA Severson RK Robison LL Infant cancer in the
US histology-specific incidence trends 1973-1992 J Pediatr Hem Onc 199719428-43224 Nishio S Takeshita I Morioka T Fukui M Primary intracranial squamous cell carcinomas
report of two cases Neurosurgery 199537329-33225 Freilich RJ Thompson SJ Walker RW Rosenblum MK Adenocarcinomatous transformation
of intracranial germ cell tumors Am J Surg Pathol 199519537-54426Yuan S Miller DW Barnett GH Hahn JF Williams BR Identification and characterization of
human beta 2-chimaerin association with malignant transformation in astrocytoma CancerResearch 1995 553456-3461
27 Preston-Martin S Mack WJ Neoplasms of the nervous system In Schoenfeld D Fraumeni JFJr eds Cancer epidemiology and prevention ed 2 New York Oxford University Press19961231-1281
28 Riggs JE Rising primary malignant brain tumor mortality in the elderly A manifestation ofdifferential survival Arch of Neurol 199552571-575
29 Davis FG Freels S Grutsch J Barlas S Brem S Survival rates in patients with primarymalignant brain tumors stratified by patient age and tumor histological type an analysisbased on Surveillance Epidemiology and End Results (SEER) data 1973-1991J Neurosurg 1998881-10
30 Surawicz TS Davis F Freels S Laws ER Menck HR Brain tumor survival results from theNational Cancer Data Base (Accepted for publication in J Neuro-Oncol)
31 Bondy ML Lustbader ED Buffler PA Schull WJ Hardy RJ Strong LC Geneticepidemiology of childhood brain tumors Genet Epidemiol 19918253-267
32 Preston-Martin S Monroe K Lee P Bernstein L Kelsey J Henderson S Forrester DHenderson B Spinal meningiomas in women in Los Angeles County Investigation of anetiologic hypothesis Cancer Epidemiol Biomarkers Prev 19954333-339
33 Davis JR Brownson RC Garcia R Bentz BJ Turner A Family pesticide use and childhoodbrain cancer Arch Environ Contam Toxicol 19932487-92
34 Commission on Cancer General principles and coding In Standards of the Commission on Cancer vol II Registry Operations and Data Standards American College of SurgeonsChicago Illinois 1996
35 Central Brain Tumor Registry of the United States (CBTRUS) 1997 State Survey of BenignBrain Tumor Collection Chicago Illinois 1997
36 Davis FG Malinski N Haenszel W Chang J Flannery J Gershman S Dibble R Bigner DDPrimary brain tumor incidence rates in the four United States regions 1985-1989 A pilotstudy Neuroepidemiol 199615103-112
37 Schoenberg BS Christine BW Whisnant JP The descriptive epidemiology of primaryintracranial neoplasms the Connecticut experience Am J Epidemiol 1976104499-510
Page 27
Endash
DATA COLLECTION
OF PRIMARY
CENTRAL NERVOUS
SYSTEM TUMORS
TAB
LE 1
C
OM
PAR
ISO
N O
F R
EGIS
TRIE
S SU
PPLY
ING
DA
TA O
N P
RIM
AR
Y I
NTR
AC
RA
NIA
L A
ND
CEN
TRA
L N
ERV
OU
S SY
STEM
TU
MO
RS
IN T
HE
UN
ITED
STA
TES
Cen
tral B
rain
Tum
or R
egis
try o
fth
e U
nite
d St
ates
(CBT
RUS)
Min
neso
ta C
ance
rSu
rvei
llanc
e Sy
stem
(MC
SS)
ACo
SN
a tio
nal C
ance
r Dat
a B
ase
(NCD
B)
Surv
eilla
nce
Epid
emio
logy
and
End
Res
ults
Pro
gram
(SEE
R)
Purp
ose
ldquoCB
TRU
S ce
ntra
lizes
pop
ulat
ion-
base
d in
cide
nce
data
on
all b
rain
tum
ors a
nd u
ses o
ther
exi
stin
gda
ta re
sour
ces t
o ch
arac
teriz
e th
ein
cide
nce
mor
talit
y a
nd su
rviv
alof
pat
ient
s with
bra
in tu
mor
s rdquo
The
MC
SS c
olle
cts i
nfor
mat
ion
onal
l can
cers
dia
gnos
ed si
nce
1988
amon
g M
inne
sota
resi
dent
s Th
e M
CSS
is p
opul
atio
n-ba
sed
path
olog
y-ba
sed
and
is a
n ac
tive
syste
m
ldquoThe
goa
l of t
he N
CD
B is
to p
rese
nt a
n an
nual
sum
mar
y of
pat
ient
car
e fo
r cas
es o
f can
cer
diag
nose
d an
d tre
ated
at h
ospi
tals
thro
ugho
utth
e co
untry
rdquo
ldquoA c
ontin
uing
pro
ject
of th
e N
CI
the
SEER
prog
ram
col
lect
sca
ncer
dat
a on
aro
utin
e ba
sis f
rom
desi
gnat
ed p
opul
atio
n-ba
sed
canc
er re
gist
ries
in v
ario
us a
reas
of t
heco
untry
Targ
et p
opul
atio
n Th
e po
pula
tions
cov
ered
by
regi
strie
s in
Ari
zona
Col
orad
oC
onne
ctic
ut D
elaw
are
Idah
oM
aine
Mas
sach
uset
ts
Min
neso
ta M
issou
ri M
onta
na
Nor
th C
arol
ina
and
Uta
h
The
CB
TRU
S po
pula
tion
repr
esen
ts a
non
rand
om 1
5pe
rcen
t sam
ple
of th
e U
S
popu
latio
n
The
popu
latio
n of
Min
neso
ta
The
popu
latio
ns tr
eate
d at
par
ticip
atin
gho
spita
ls in
the
50 st
ates
the
Dist
rict
of
Col
umbi
a a
nd P
uert
o R
ico
NC
DB
is n
ot a
pop
ulat
ion-
base
d re
gist
ry
At
pres
ent
it is
est
imat
ed to
cov
er a
ppro
xim
atel
y57
per
cent
of t
otal
cas
es n
atio
nwid
e
The
popu
latio
nsco
vere
d by
the
state
regi
strie
s in
Con
nect
icut
Haw
aii
Iow
a N
ew M
exic
o
and
Uta
h a
s wel
l as
the
regi
onal
regi
strie
sin
Atla
nta
Geo
rgia
D
etro
it M
ichi
gan
San
Fran
cisc
o-O
akla
nd C
alifo
rnia
an
d Se
attle
-Pug
etSo
und
Was
hing
ton
The
SEER
pop
ulat
ion
repr
esen
ts a
nonr
ando
m 1
4 pe
rcen
tsa
mpl
e of
the
US
po
pula
tion
Page
28
Endash
APPENDIX E
Cen
tral B
rain
Tum
or R
egis
try o
fth
e U
nite
d St
ates
(CBT
RUS)
Min
neso
ta C
ance
rSu
rvei
llanc
e Sy
stem
(MC
SS)
ACo
SN
a tio
nal C
ance
r Dat
a B
ase
(NCD
B)
Surv
eilla
nce
Epid
emio
logy
and
End
Res
ults
Pro
gram
(SEE
R)
Type
of
prim
ary
intra
cran
ial
and
cent
ral n
ervo
us sy
stem
tum
ors r
epor
ted
Dat
a on
new
ly-d
iagn
osed
cas
es o
fbe
nign
and
mal
igna
nt p
rimar
ybr
ain
tum
ors b
ased
on
ICD
-Oco
des
Dat
a on
new
ly-d
iagn
osed
m
i cro
scop
ical
ly-c
onfir
med
tum
ors
of th
e ce
ntra
l ner
vous
syste
m
incl
udin
g pi
tuita
ry a
nd p
inea
lgl
ands
Hos
pita
ls v
olun
taril
y su
bmit
full
anal
ytic
canc
er re
gist
ry c
asel
oads
with
dat
a ite
ms a
ndco
des d
efin
ed b
y th
e C
omm
issio
n on
Can
cer
(CO
C) f
or h
ospi
tal c
ance
r reg
istri
es
Mos
tpa
rtici
patin
g ho
spita
ls h
ave
prog
ram
sap
prov
ed b
y C
OC
or a
re e
stab
lishi
ng p
rogr
amap
prov
al
NC
DB
cal
ls fo
r dat
a do
not
lim
itca
ses b
y m
alig
nant
beh
avio
r bu
t acc
essi
onin
gof
non
-mal
igna
nt c
ases
is n
ot re
quire
d fo
rpr
ogra
m a
ppro
val
Fifty
-nin
e pe
rcen
t of t
heho
spita
ls th
at su
bmitt
ed a
ny in
tracr
ania
lCN
Sca
ses d
iagn
osed
dur
ing
1989
-199
4 su
bmitt
edat
leas
t one
non
mal
igna
nt c
ase
The
NC
DB
data
in th
is re
port
are
limite
d to
the
case
ssu
bmitt
ed b
y th
ese
hosp
itals
(82
perc
ent o
f all
intra
cran
ial a
nd e
xtra
cran
ial c
entra
l ner
vous
syste
m c
ases
on
file)
Tren
ds in
the
inci
denc
e m
orta
lity
and
patie
nt su
rviv
al o
fbr
ain
tum
ors i
n th
eU
S H
owev
er S
EER
does
not
col
lect
info
rmat
ion
on b
enig
nan
d un
certa
in b
rain
tum
ors
Oth
er c
omm
ents
D
uplic
ate
canc
er re
gist
ratio
ns c
anno
t be
iden
tifie
d by
the
parti
cipa
ting
regi
strie
s
The
MC
SS p
erfo
rms 1
00 p
erce
ntca
se fi
ndin
g au
dits
in a
ll pa
thol
ogy
labo
rato
ries o
n an
ann
ual b
asis
Th
eref
ore
the
data
from
the
MC
SSm
ight
be
cons
ider
ed a
ldquobe
st-ca
sesc
enar
iordquo
in te
rms o
f com
plet
enes
sof
repo
rting
for m
icro
scop
ical
ly-
conf
irmed
tum
ors
Rep
ort d
uplic
atio
n fo
r 198
9-19
94 in
tracr
ania
lan
d ex
tracr
ania
l cen
tral n
ervo
us sy
stem
repo
rts w
as 6
7 p
erce
nt
How
ever
the
NC
DB
data
in T
able
s 2 th
roug
h 9
are
base
d on
undu
plic
ated
repo
rts
Page
29
Endash
DATA COLLECTION
OF PRIMARY
CENTRAL NERVOUS
SYSTEM TUMORS
TABLE 2 NUMBER AND PERCENT OF PRIMARY INTRACRANIAL AND CENTRAL NERVOUS SYSTEM TUMORS BY TUMOR LOCATION
Locationa CBTRUSb
Number () MCSSc
Number () NCDBd
Number () SEERe
Number ()
Intracranial 13084 (947) 3600 (936) 66322 (955) 10196 (969)
Brain 7999 (579) 1924 (500) 48527 (699) 9721 (924)
Meninges 2719 (197) 838 (218) 9365 (135) 139 (13)
Pituitarycraniopharygealduct
1491 (108) 530 (138) 4958 (71) 30 (03)
Pineal 74 (05) 21 (05) 477 (07) 80 (08)
Other central nervous systemincluding cranial nerves
801 (58) 287 (75) 2995 (43) 226 (22)
Extracranial 730 (53) 245 (64) 3137 (45) 322 (31)
Spinal cord 497 (36) 47 (38) 2395 (34) 313 (30)
Spinal meninges 233 (17) 98 (25) 742 (11) 9 (01)
TOTAL 13814 (100) 3845 (100) 69459 (100) 10518 (100)
Note Reported data are incident cases from 1989-1994 except for CBTRUS data which are from 1990-1993
aRefer to the sites in Appendix BbCentral Brain Tumor Registry of the United States cMinnesota Cancer Surveillance System (microscopically confirmed cases only)dNational Cancer Data Base (limited to cases reported by hospitals that accessioned nonmalignant cases) eSurvival Epidemiology and End results Program (malignant cases only)
Page 30
Endash0
TABL
E 3
RO
W P
ERCE
NT
DIS
TRIB
UTI
ON
OF
PRIM
ARY
INTR
ACR
AN
IAL
AN
D C
ENTR
AL
NER
VO
US
SYST
EM T
UM
ORS
BY
TU
MO
R B
EHA
VIO
RA
ND
MIC
ROSC
OPI
C C
ON
FIRM
ATI
ON
Loca
tiona
CB
TRU
Sb M
CSSc
NC
DB
d SE
ERe
Tota
l Pe
rcen
tM
icro
Co
nfirm
ed
Perc
ent
Not
Mic
ro
Conf
irmed
Tota
l Pe
rcen
tM
icro
Co
nfirm
ed
Perc
ent
Not
Mic
ro
Conf
irmed
Tota
l Pe
rcen
tM
icro
Co
nfirm
ed
Perc
ent
Not
Mic
ro
Conf
irmed
Tota
l Pe
rcen
tM
icro
Co
nfirm
ed
Perc
ent
Not
Mic
ro
Conf
irmed
Intra
cran
ial
130
84
867
13
3
360
0 10
0 N
A
663
22
887
11
3
101
96
871
12
9
Mal
igna
nt
717
1 89
2
108
1
824
100
NA
44
801
91
3
87
101
96
871
12
9
Beni
gn a
ndu n
certa
in
591
3 83
5
165
1
776
100
NA
21
521
83
2
168
N
A
NA
N
A
Bra
in
799
9 88
2
118
1
924
100
NA
48
527
90
2
98
972
1 87
3
127
Mal
igna
nt
686
2 89
6
104
1
746
100
NA
42
622
91
5
85
972
1 87
3
127
Beni
gnan
dun
certa
in
113
7 80
6
194
17
8 10
0 N
A
590
5 80
6
194
N
A
NA
N
A
Extra
cran
ial
730
962
3
8 24
5 10
0 N
A
313
7 96
0
40
322
957
4
3
Mal
igna
nt
242
934
6
6 60
10
0 N
A
148
3 96
6
34
322
957
4
3
Beni
gn a
ndu n
certa
in
488
975
2
5 18
5 10
0 N
A
165
4 95
5
45
NA
N
A
NA
TOTA
Lf 13
814
87
2
128
3
845
100
NA
69
459
89
0
110
10
518
87
4
126
Mal
igna
nt
741
3 89
4
106
1
884
100
NA
46
284
91
5
85
105
18
874
12
6
Beni
gn a
ndu n
certa
in
640
1 84
6
154
1
961
100
NA
23
175
84
1
159
N
A
NA
N
A
Not
e R
epor
ted
data
are
inci
dent
cas
es fr
om 1
989-
1994
exc
ept f
or C
BTR
US
data
whi
ch a
re fr
om 1
990-
1993
a Refe
r to
the
site
code
s in
App
endi
x B
b Cent
ral B
rain
Tum
or R
egist
ry o
f the
Uni
ted
Stat
es
c Min
neso
ta C
ance
r Sur
veill
ance
Sys
tem
(mic
rosc
opic
ally
con
firm
ed c
ases
onl
y)
d Nat
iona
l Can
cer D
ata
Base
(lim
ited
to c
ases
repo
rted
by h
ospi
tals
that
acc
essio
ned
nonm
alig
nant
cas
es)
e Surv
eilla
nce
Epi
dem
iolo
gy a
nd E
nd R
esul
ts Pr
ogra
m (m
alig
nant
cas
es o
nly)
f In
clud
es in
tracr
ania
l and
ext
racr
ania
l cas
es
NA
= N
ot a
pplic
able
Page
31
APPENDIX E
Endash
DATA COLLECTION
OF PRIMARY
CENTRAL NERVOUS
SYSTEM TUMORS
TABLE 4 NUMBER AND PERCENT OF PRIMARY INTRACRANIAL AND CENTRAL NERVOUS SYSTEM TUMORS BY DIAGNOSTIC CONFIRMATION
DiagnosticConfirmation
CBTRUSa
Number () MCSSb
Number () NCDBc
Number () SEERd
Number ()
Positive microscopy
12087 (875) 3845 (100) 61818 (890) 9188 (874)
Radiographywithout microscopy
1306 (95) NA 6759 (97) 1015 (97)
Clinical 204 (15) NA 484 (07) 98 (09)
Unknown 217 (15) NA 398 (06) 217 (21)
TOTAL 13814 (100) 3845 (100) 69459 (100) 10518 (100)
Note Reported data are incident cases from 1989-1994 except for CBTRUS data which are from 1990-1993
aCentral Brain Tumor Registry of the United Statesb Minnesota Cancer Surveillance System (microscopically confirmed cases only) cNational Cancer Data Base (limited to cases reported by hospitals that accessioned nonmalignant cases)dSurveillance Epidemiology and End Results Program (malignant cases only)NA = Not applicable
Page 32
Endash
Page 32
TABLE 4 NUMBER AND PERCENT OF PRIMARY INTRACRANIAL AND CENTRALNERVOUS SYSTEM TUMORS BY DIAGNOSTIC CONFIRMATION
DiagnosticConfirmation
CBTRUSa
Number ()MCSSb
Number ()NCDBc
Number ()SEERd
Number ()
Positivemicroscopy
12087 (875) 3845 (100) 61818 (890) 9188 (874)
Radiographywithout microscopy
1306 (95) NA 6759 (97) 1015 (97)
Clinical 204 (15) NA 484 (07) 98 (09)
Unknown 217 (15) NA 398 (06) 217 (21)
TOTAL 13814 (100) 3845 (100) 69459 (100) 10518 (100)
Note Reported data are incident cases from 1989-1994 except for CBTRUS data which are from 1990-1993
aCentral Brain Tumor Registry of the United Statesb Minnesota Cancer Surveillance System (microscopically confirmed cases only)cNational Cancer Data Base (limited to cases reported by hospitals that accessioned nonmalignant cases)dSurveillance Epidemiology and End Results Program (malignant cases only)NA = Not applicable
APPENDIX E
TABLE 5 NUMBER AND PERCENT OF MALIGNANT PRIMARY INTRACRANIAL AND CENTRAL SYSTEM TUMORS BY TUMOR LOCATION
Locationa CBTRUSb
Number () MCSSc
Number () NCDBd
Number () SEERe
Number ()
Intracranial 7171 (977) 1824 (968) 44801 (968) 10196 (969)
Brain 6862 (926) 1746 (927) 42622 (921) 9721 (924)
Meninges 98 (13) 23 (12) 581 (13) 139 (13)
Pituitarycraniopharyngealduct
37 (05) 13 (07) 189 (04) 30 (03)
Pineal 58 (08) 20 (11) 378 (08) 80 (08)
Other central nervous systemincluding cranial nerves
116 (16) 22 (12) 1031 (22) 226 (21)
Extracranial 242 (33) 60 (32) 1483 (32) 322 (31)
Spinal cord 234 (32) 60 (32) 1410 (30) 313 (30)
Spinal meninges 8 (01) 0 73 (02) 9 (01)
TOTAL 7413 (100) 1884 (100) 46284 (100) 10518 (100)
Note Reported data are incident cases from 1989-1994 except for CBTRUS data which are from 1990-1993
aRefer to the site codes in Appendix BbCentral Brain Tumor Registry of the United States cMinnesota Cancer Surveillance System (microscopically confirmed cases only)dNational Cancer Data Base (limited to cases reported by hospitals that accessioned nonmalignant cases) eSurvival Epidemiology and End Results Program (malignant cases only)
Page 33
Endash
DATA COLLECTION
OF PRIMARY
CENTRAL NERVOUS
SYSTEM TUMORS
TABLE 6 NUMBER AND PERCENT OF PRIMARY INTRACRANIAL AND CENTRAL NERVOUS SYSTEM TUMORS OF BENIGN AND UNCERTAIN BEHAVIOR BY TUMOR LOCATION
Locationa CBTRUSb
Number () MCSSc
Number () NCDBd
Number () SEERe
Number ()
Intracranial 5913 (924) 1776 (906) 21521 (929) NA
Brain 1137 (178) 178 (91) 5905 (255) NA
Meninges 2621 (409) 815 (416) 8784 (379) NA
Pituitarycraniopharyngealduct
1454 (227) 517 (264) 4769 (206) NA
Pineal 16 (02) 1 (lt01) 99 (04) NA
Other central nervous systemincluding cranial nerves
685 (107) 265 (135) 1964 (85) NA
Extracranial 488 (76) 185 (94) 1654 (71) NA
Spinal cord 263 (41) 87 (44) 985 (42) NA
Spinal meninges 225 (35) 98 (50) 669 (29) NA
TOTAL 6401 (100) 1961 (100) 23175 (100) NA
Note Reported data are incident cases from 1989-1994 except for CBTRUS data which are from 1990-1993
aRefer to the site codes in Appendix BbCentral Brain Tumor Registry of the United States cMinnesota Cancer Surveillance System (microscopically confirmed cases only)dNational Cancer Data Base (limited to cases reported by hospitals that accessioned nonmalignant cases) eSurveillance Epidemiology and End Results Program (malignant cases only)NA = Not applicable
Page 34
Endash
APPENDIX E TABLE 7 NUMBER AND PERCENT OF PRIMARY INTRACRANIAL AND CENTRAL
NERVOUS SYSTEM TUMORS BY TUMOR BEHAVIOR AND LOCATION
BehaviorTumor Locationa
CBTRUSb
Number () MCSSc
Number () NCDBd
Number () SEERe
Number ()
Malignant 7413 (537) 1884 (490) 46284 (666) 10518 (100)
Brain 6862 (497) 1746 (454) 42622 (614) 9721 (924)
Meninges 98 (07) 23 (06) 581 (08) 139 (13)
Pituitarycraniopharyn-geal ductpineal
95 (07) 33 (09) 567 (08) 110 (11)
Other central nervous system includingcranial nerves
116 (08) 22 (06) 1031 (15) 226 (22)
Spinal cord 242 (18) 60 (16) 1483 (21) 322 (31)
Benign 5794 (419) 1787 (465) 20694 (298) NA
Brain 803 (58) 99 (26) 4491 (65) NA
Meninges 2565 (186) 807 (210) 8613 (124) NA
Pituitarycraniopharyn-geal ductpineal
1322 (96) 458 (119) 4330 (62) NA
Other central nervous system includingcranial nerves
678 (49) 263 (68) 1911 (28) NA
Spinal cord 426 (31) 160 (42) 1349 (19) NA
Uncertain 607 (44) 174 (45) 2481 (36) NA
Brain 334 (24) 79 (21) 1414 (20) NA
Meninges 56 (04) 8 (02) 171 (02) NA
Pituitarycraniopharyn-geal ductpineal
148 (11) 60 (16) 538 (08) NA
Other central nervous system includingcranial nerves
7 (01) 2 (01) 53 (01) NA
Spinal cord 62 (05) 25 (07) 305 (04) NA
TOTAL 13814 (100) 3845 (100) 69459 (100) 10518 (100)
Note Reported data are incident cases from 1989-1994 except for CBTRUS data which are from 1990-1993 NA=Not applicableaRefer to the site codes in Appendix B bCentral Brain Tumor Registry of the United States cMinnesota Cancer Surveillance System (microscopically confirmed cases only)dNational Cancer Data Base (limited to cases reported byhospitals that accessioned nonmalignant cases eSurvival Epidemiology and End Results Program (malignant cases only)
Page 35
Endash
DATA COLLECTION
OF PRIMARY
CENTRAL NERVOUS
SYSTEM TUMORS
TABLE 8 NUMBER AND PERCENT OF MALIGNANT PRIMARY INTRACRANIAL AND
CENTRAL NERVOUS SYSTEM TUMORS BY HISTOLOGY GROUPINGS
WHO Histologya
Groupings CBTRUSb
Number () MCSSc
Number () NCDBd
Number () SEERe
Number ()
Neuroepithelial 6477 (874) 1689 (896) 39701 (858) 8676 (825)
Tumors of cranial and spinal nerves
12 (02) 3 (02) 108 (02) 25 (02)
Tumors of meninges
137 (18) 25 (13) 994 (21) 194 (18)
LymphomasHemopoietic
473 (64) 121 (64) 3492 (75) 1099 (105)
Germ cell 70 (09) 20 (11) 403 (09) 97 (09)
Cysts and tumor-like lesions
0 0 0 0
Tumors of sellar region
20 (03) 11 (06) 100 (02) 6 (01)
Local extensions 29 (04) 11 (06) 166 (04) 38 (04)
Unclassifiedunassigned tumorsf
195 (26) 4 (02) 1320 (29) 383 (36)
TOTAL 7413 (100) 1884 (100) 46284 (100) 10518 (100)
Note Reported data are incident cases from 1989-1994 except for CBTRUS data which are from 1990-1993
aRefer to the World Health Organization (WHO) histology groupings in Appendix CbCentral Brain Tumor Registry of the United States cMinnesota Cancer Surveillance System (microscopically confirmed cases only)dNational Cancer Data Base (limited to cases reported by hospitals that accessioned nonmalignant cases) f For MCSS unclassifiedunassigned tumors include one malignant and four nonmalignant histologies which were
not listed in the CBTRUS classification scheme For NCDB unclassifiedunassigned tumors include 319 cases(less than one half percent) which had histologies not assigned by CBTRUS to any other category For SEERunclassifiedunassigned tumors include all malignant histologies occurring in the brainCNS which could not beclassified in one of the above categories based on their 4-digit histologic type
Page 36
Endash
APPENDIX E
TABLE 9 NUMBER AND PERCENT OF PRIMARY INTRACRANIAL AND CENTRAL NERVOUS SYSTEM TUMORS OF BENIGN AND UNCERTAIN BEHAVIOR
BY HISTOLOGY GROUPINGS
WHO Histologya
Groupings CBTRUSb
Number () MCSSc
Number () NCDBd
Number () SEERe
Number ()
Neuroepithelial 275 (43) 91 (46) 1064 (46) NA
Tumors of cranial and spinal nerves
980 (153) 397 (202) 2618 (113) NA
Tumors of meninges
3509 (548) 941 (480) 13667 (590) NA
LymphomasHemopoietic
3 (lt01) 0 7 (lt01) NA
Germ cell 4 (lt01) 1 (01) 25 (01) NA
Cysts and tumor-like lesions
15 (02) 3 (02) 34 (01) NA
Tumors of sellar region
1444 (226) 510 (260) 4749 (205) NA
Local extensions 0 0 0 NA
Unclassifiedunassigned tumorsf
171 (27) 18 (09) 1011 (44) NA
TOTAL 6401 (100) 1961 (100) 23175 (100) NA
Note Reported data are incident cases from 1989-1994 except for CBTRUS which is 1990-1993
aRefer to the World Health Organization (WHO) histology groupings in Appendix CbCentral Brain Tumor Registry of the United States c Minnesota Cancer Surveillance System (microscopically confirmed cases only) dNational Cancer Data Base (limited to cases reported by hospitals that accessioned nonmalignant cases) eSurvival Epidemiology and End Results Program (malignant cases only)dFor MCSS unclassifiedunassigned tumors include one malignant and four nonmalignant histologies which werenot listed in the CBTRUS classification scheme For NCDB unclassifiedunassigned tumors include 319 cases(less than one half percent) which had histologies not assigned by CBTRUS to any other category For SEERunclassifiedunassigned tumors include all malignant histologies occurring in the brainCNS which could not beclassified in one of the above categories based on their 4-digit histologic typeNA = Not applicable
Page 37
Endash
DATA COLLECTION
OF PRIMARY
CENTRAL NERVOUS
SYSTEM TUMORS
TABLE 10 METHOD OF CASE FINDING FOR PRIMARY INTRACRANIAL AND CENTRAL NERVOUS SYSTEM TUMORS BY TUMOR BEHAVIOR AND LOCATION MINNESOTA 1989-1994
Behavior Tumor Locationa
Number of Cases
Percent Found byRoutine
Reporting
Percent Found by Special Efforts
Malignant Brain Cerebral meninges
Pituitarycranio duct pineal Other intracranial
18841746 23 33
22
961 965 957 939
864
39 35 43 61
136 Extracranial 60 883 117 Benign Brain
1787 99
788 838
212 162
Cerebral meninges Pituitarycranio duct
pineal Other intracranial
807 458
263
843 740
779
157 260
221 Extracranial 160 631 369 Uncertain 174 856 144 Brain 79 823 177 Cerebral meninges Pituitarycraniopharyn- geal ductpineal Other intracranial
8 60
2
875 850
1000
125 150
00 Extracranial 25 960 40
TOTAL 3845 876 124
aRefer to the site codes in Appendix B
Page 38
Endash
1989 1990 1991 1992 1993 1994
TOTAL
APPENDIX E TABLE 11 METHOD OF CASE FINDING FOR INTRACRANIALa TUMORS BY DIAGNOSIS YEAR MINNESOTA 1989-1994
DiagnosisYear
Number of
Cases
Percent Found byRoutine
Reporting
Percent Found by
Special Efforts
571 837 163 616 865 135 586 913 87 602 899 101
633 872 128 592 929 71
3600 886 114
aIncludes the brain cerebral meninges pituitary gland pineal gland and otherintracranial tumors (refer to the site codes in Appendix B)
Page 39
Endash
DATA COLLECTION
OF PRIMARY
CENTRAL NERVOUS
SYSTEM TUMORS
TABLE 12 METHOD OF CASE FINDING FOR NONMALIGNANT INTRACRANIALa TUMORS BY TYPE OF FACILITY MINNESOTA 1989-1994
Type of Facility Number of Tumors Percent Found byRoutine
Reporting
Percent Found by Special Efforts
Registry at facility No registry at facility
1451325
859 569
141 431
TOTAL 1776 806 194
aIncludes tumors with benign or uncertain behavior that involve the brain cerebral meningespituitary gland pineal gland or other intracranial sites (refer to the site codes in Appendix B)
TABLE 13 REPORTING METHOD AND SOURCE OF CASE FINDING FOR NON- MALIGNANT INTRACRANIALa TUMORS DIAGNOSED IN HOSPITALS WITH A TUMOR REGISTRY MINNESOTA 1989-1994
Reporting Method Number of Tumors Percent Found byRoutine
Reporting
Percent Found by
Special Efforts
Registry-reportedLaboratory-reported
1226225
925 502
75 498
TOTAL 1451 859 141
aIncludes tumors with benign or uncertain behavior that involve the brain cerebral meningespituitary gland pineal gland or other intracranial sites (refer to the site codes in Appendix B)
Page 40
Endash0
APPENDIX E TABLE 14 HOSPITAL REGISTRY ACCESSIONING OF MALIGNANT AND NON-
MALIGNANT PRIMARY INTRACRANIAL AND CENTRAL NERVOUS SYSTEM TUMORS NCDB 1989-1994
TUMOR Totalb
BEHAVIOR Malignant c Nonmalignantd
Tumor Locationa HospitalsReporting
Number ()
Hospitals Reporting
Number ()
Hospitals Reporting
Number ()
Intracranial 1542 (100) 1526 (100) 900 (99)
Brain 1527 (99) 1519 (gt99) 754 (83)
Meninges 740 (48) 390 (26) 613 (67)
Pituitaryglandcraniopharyn-
geal duct
602 (39) 168 (11) 538 (59)
Pineal gland 319 (21) 277 (18) 79 (9)
Other central nervous system including cranial
nerves
648 (42) 545 (36) 299 (33)
Extracranial 812 (53) 708 (46) 410 (45)
Spinal cord 760 (49) 692 (45) 311 (34)
Spinal meninges 299 (19) 72 (5) 258 (28)
TOTAL Hospitals 1542 (100) 1526 (100) 913 (100)
Note The number of hospitals in each of the second third and fourth columns is the number that submittedreports to the NCDB for any intracranial and central nervous system tumors for the respective malignancystatus Not all hospitals submitted reports for each year during the study period (1989-1994)
aRefer to the site codes in Appendix B bBehavior codes = 0 1 3 cBehavior code = 3 dBehavior codes = 0 1
Page 41
Endash
DATA COLLECTION
OF PRIMARY
CENTRAL NERVOUS
SYSTEM TUMORS
Texas Cancer Registry
1997 CBTRUS State Survey of Benign Brain Tumor Data Collection
State Collection Status
Currently Collecting Benign Tumor Data1 Arizona Cancer Registry since 1981 2 Colorado Central Cancer Registry since 1988 3 Connecticut Tumor Registry since 1965 4 Idaho Cancer Data Registry since 1970 5 Maine Cancer Registry since 1983 6 Massachusetts Cancer Registry since 1982 7 Minnesota Cancer Surveillance System since 1988 8 Montana Central Tumor Registry since 1979 9 New York State Cancer Registry since 1988
10 North Carolina Central Cancer Registry since 1990 11 Utah Cancer Registry since 1966 12 Virginia Cancer Registry since 1994 13 Delaware State Cancer Registry14 Washington State Cancer Registry since 1992 15 passive collection 1979-1994
active collection since 1995
Stopped or Passive Collection of Benign Tumor Data1 New Jersey State Cancer Registry stopped 1979-1995 2 Kansas Cancer Registry stopped 1969-1995 3 New Hampshire State Cancer Registry stopped 1986-1991 4 District of Columbia Cancer Registry stopped 1997 5 Wyoming Cancer Surveillance Program stopped 111996 6 Louisiana Tumor Registry stopped 1992 (passive collection) 7 Illinois State Cancer Registry stopped 111996 8 Missouri Cancer Registry passive collection since 1984 9 South Carolina Central Cancer Registry passive collection since 1996
Beginning Collection of Benign Tumor Data1 North Dakota Cancer Registry began collection 1997 2 Rhode Island Cancer Registry began collection 1998
Page 42
Endash
APPENDIX E
Codes for Primary Intracranial and Central Nervous System Tumors
Note For this report the designation of ldquoprimary intracranial and central nervous system tumorsrdquo includes thefollowing primary tumors of central nervous system sites as well as tumors of the pituitary and pinealglands All histology types within the topography codes are included in the designation of ldquoprimaryintracranial and CNS tumors The source for the topography codes is Percy C Van Holten V Muir Ceds International Classification of Diseases for Oncology Second Edition Geneva World Health Organization 1990
Intracranial tumors
Brain C710 Cerebrum C711 Frontal lobe C712 Temporal lobe C713 Parietal lobe C714 Occipital lobe C715 Ventricle NOSC716 Cerebellum NOS C717 Brain stem C718 Overlapping lesion of brain C719 Brain NOS
Meninges C700 Cerebral meninges C709 Meninges NOS
a
Cranial Nerves and other intracranial parts of the central nervous systemC722 Olfactory nerve C723 Optic nerve C724 Acoustic nerve C725 Cranial nerve NOS C728 Overlapping lesion of brain and central nervous system C729 Nervous system NOS
Other endrocrine glands and related structures C751 Pituitary gland C752 Craniopharyngeal duct C753 Pineal gland
Extracranial tumors
Spinal cord C720 Spinal cord C721 Cauda equina
Meninges C701 Spinal meninges
aNOS=Not Otherwise Specified
Page 43
Endash
DATA COLLECTION
OF PRIMARY
CENTRAL NERVOUS
SYSTEM TUMORS
Brain Tumor Histology Groupings
The following histology groupings were used for the primary intracranial and central nervoussystem tumors The source for the histology groupings is Central Brain Tumor Registry ofthe United States (CBTRUS) 1996 Statistics Report Table 4
WHOa HISTOLOGY GROUPINGS ICD-Ob MORPHOLOGY CODE
Diffuse astrocytoma (protoplasma fibrillary) 9410 9420 Anaplastic astrocytoma 9401 9411 Glioblastoma 9440 9441 9442 Pilocytic astrocytoma 9421 Unique astrocytoma variants 9383 9384 9424 Oligodendroglioma 9450 Anaplastic oligodendroglioma 9451 9460 Ependymomaanaplastic ependymoma 9391 9392 9393 Ependymoma variants 9394 Mixed glioma 9382 Astrocytoma NOSc 9400 Glioma malignant NOS 9380 Choroid plexus 9390 Neuroepithelial 9381 9423 9430 Benign neuronalglial neuronal and mixed 86801 8693 9490 9505 9506 Malignant neruonalglial neuronal and mixed 86803 9364 9490 9500 Pineal parenchymal 9360 9361 9362 Embryonalprimitivemedulloblastoma 8963 9470 9471 9472
9473 9501 9502 9503 9510
TUMORS OF NEUROEPITHELIAL TISSUE
TUMORS OF CRANIAL AND SPINAL NERVES Nerve sheath benign and malignant 9540 9550 9560 9570
TUMORS OF THE MENINGES Meningioma 9530 9531 9532 9533 9534 9537 9538 Other mesenchymal benign and malignant 8800 8801 8802 8803 8810 8830 8850 88618900
8910 8990 9133 9150 9240 9480 9481 9536 9539 Hemangioblastoma 9161 9535
LYMPHOMAS AND HEMOPOIETIC NEOPLASMS Lymphoma 9590 9591 9593 9594 9595 9630 9650 9652
9663 9670 9671 9672 9674 9675 9680 9681 9682 9684 9685 9686 9687 9690 9691 96939695 9696 9698 9702 9714 9723 9731 9766 9970
GERM CELL TUMORS Germ cell 8020 9060 9064 9070 9071 9080 9084 9085 9100
CYSTS AND TUMOR-LIKE LESIONS Cysts and heterotopias 9084
TUMORS OF THE SELLAR REGION Pituitary 8040 8l40 8l46 8260 8270 8271 8280
8281 8290 8300 8330 8323 8333 Craniopharyngioma 9350
Page 44
Endash
APPENDIX E
LOCAL EXTENSIONS FROM REGIONAL TUMORS Chordomachondrosarcoma 9370
UNCLASSIFIED TUMORS Hemangioma 9120 9121 9130 9131 Neoplasm benign 80000 8010 Neoplasm uncertain behavior 80001 80011 Neoplasm malignant 80003 80013 8002 8003 All other 8720 9580
aWHO = World Health OrganizationbICD-O = International Classification of Diseases for Oncology Second Edition 1990 cNOS=Not Otherwise Specified
Page 45
Endash
DATA COLLECTION
OF PRIMARY
CENTRAL NERVOUS
SYSTEM TUMORS
Endash
International Classification of Childhood Cancer (ICCC)
Diagnostic Group
ICD-Oa codes
Morphology Topography
I LEUKAEMIA
(a) Lymphoid leukaemia 9820-9827 9850
(b) Acute non-lymphocytic leukaemia 9840 9841 9861 9864 9866 9867 98919894 9910
(c) Chronic myeloid leukaemia 9863 9868
(d) Other specified leukaemias 9830 9842 9860 9862 9870-9890 9892 98939900 9930-9941
(e) Unspecified leukaemias 9800-9804
II LYMPHOMAS AND OTHER RETICULOENDOTHELIAL NEOPLASMS
(a) Hodgkinrsquos disease 9650-9667
(b) Non-Hodgkinrsquos lymphoma 9591-9595 9670-9686 9690-9714 9723
(c) Burkittrsquos lymphoma 9687
(d) Miscellaneous lymphoreticular neoplasms 9720 9731-9764
(e) Unspecified lymphomas 9590
III CENTRAL NERVOUS SYSTEM (CNS) ANDMISCELLANEOUS INTRACRANIAL AND
INTRASPINAL NEOPLASMSb
(a) Ependymomac 9383 9390-9394
(b) Astrocytoma 9380 C723
9381 9400-9441
(c) Primitive neuroectodermal tumours 9470-9473
(d) Other gliomasd 9380 C700-C722C724-C729
9382 9384
9442-9460 9481
APPENDIX E
Diagnostic Group
ICD-Oa codes
Morphology Topogragphy
III CNS AND MISCELLANEOUS INTRACRANIAL AND INTRASPINAL
NEOPLASMSb Continued
(e) Miscellaneous intracranial and intraspinalneoplasmsc
8270-8281 8300 9350-9362 9480 95059530-9539
(f) Unspecified intracranial and intraspinalneoplasmsc
8000-8004 C700-C729C751-C753
IV SYMPATHETIC NERVOUS SYSTEM TUMOURS
(a) Neuroblastoma and ganglioneuroblastoma 9490 9500
(b) Other sympathetic nervous system tumours 8680 8693-8710 9501-9504 9520-9523
aInternational Classification of Diseases for Oncology Second Edition World Health Organization 1990bGroup III excludes all lymphomas See group II cBehaviour codes 0 and 1 are included dBehaviour code 1 is included
Page 47
Endash
Comments and recommendations are welcome Should questions arise on how to use these
materials or for more information please contact
Centers for Disease Control and Prevention National Program of Cancer Registries
4770 Buford Hwy NE Mail Stop K-53
Atlanta GA 30042-3717
Voice Information System 1 (888) 842-6355 bull Fax (770) 488-4760
cancerinfocdcgov bull httpwwwcdcgovcancer
All materials are in the public domain and may be reproduced or copied without permission citation
to source however is appreciated
BACK COVER
(WHITE)
Spine(WHITE)
DATA COLLECTION OF PRIMARY CEN
TRAL NERVOUS SYSTEM
TUM
ORS 2004
National Program of Cancer Registries Training M
aterials

DATA COLLECTION
OF PRIMARY
CENTRAL NERVOUS
SYSTEM TUMORS
REFERENCES
1 CBTRUS (1996) First annual report 1995 Central Brain Tumor Registry of the United StatesChicago Illinois
2 National Center for Health Statistics public use mortality files for 1979-19953 Surawicz TS Davis F et al Brain tumor survival results from the National Cancer Data Base
(Accepted for publication in Journal of Neuro-Oncology)4 Thapar K Laws ER Tumors of the central nervous system In Murphy GP Lawrence W Jr
Lenhard RE Jr eds Textbook of clinical oncology ed 2 Atlanta American Cancer Society1995378-410
Page 10
Endash0
APPENDIX E
INTRODUCTION
Because nonmalignant brain tumors often can have a malignant clinical course leading to
substantial long-term morbidity and high risk for death the distinction between
histopathologically-defined malignancies versus nonmalignancies is tenuous from both a clinical
and an epidemiologic standpoint Likewise because nonmalignancies have not been systematically
or consistently included in most population-based cancer surveillance systems the public health
community has little information to offer on either incidence or mortality patterns and trends of
nonmalignant brain tumors in the United States (US) Additionally there have been virtually no
analytic epidemiology research studies conducted that would help identify factors that influence
the risk for nonmalignant brain tumor occurrence Thus despite their clinical importance both the
public health surveillance mission and the etiologic research mission of cancer prevention and
control are compromised by the exclusion of nonmalignant brain tumors in registry systems
Recognizing this challenge the National Coordinating Council for Cancer Surveillance (NCCCS)
established a Brain Tumor Working Group (BTWG) during its semi-annual meeting in January
1997 The purpose of BTWG was to review the status of the surveillance of brain tumors in the
US and examine the feasibility of collecting data for nonmalignant brain tumors Upon
completion of the project recommendations regarding surveillance of both malignant and
nonmalignant (ie benign or uncertain behavior) brain tumors would be presented at a special
meeting of the NCCCS This report describes data collection by US registries for primary
intracranial and central nervous system (CNS) tumors It includes data from several registries to
demonstrate variability in current reporting practices
BACKGROUND
Classification
Historically cancer registries have used the International Classification of Diseases (ICD)
system which describes tumors by their location (topography) and behavior (benign versus
malignant)1 to code neoplasms Tumor nomenclature describing histology was developed by
pathologists and incorporated into the International Classification of Diseases for Oncology (ICD-
O) system as a morphology code in 19762 and revised in a second edition (ICD-O-2)3 However
Page 11
Endash
DATA COLLECTION
OF PRIMARY
CENTRAL NERVOUS
SYSTEM TUMORS
Endash
not all of the morphology codes in the current ICD-O classification used by cancer registries are
consistent with the recent World Health Organization (WHO) brain tumor codes34 The recent
WHO brain tumor classification has new terms that are not included in ICD-O-2 however a new
third edition to ICD-O may include these terms ICD-O-2 also includes terms which are not
categorized by WHO
The CNS environment also contributes to the difficulty in characterizing tumors that
involve this site In contrast to tumors arising in other organ systems the terms benign and
malignant are only relative distinctions for CNS neoplasms Depending on location
histologically benign CNS tumors can result in similar or worse outcomes compared with
malignant tumors For these and other reasons classic oncologic concepts predicated on
histologic grade nodal status and staging strategies are not entirely applicable to tumors of the
CNS5
When the BTWG discussed whether to consider anatomic sites other than the brain for
this report the unique features of the CNS and the morbidity and mortality associated with non-
CNS intracranial tumors were closely examined For the sake of simplicity in reporting and
analyzing data for all of these sites the designation of primary intracranial and CNS tumors was
suggested This designation proposed by Walker et al6 is used by the Central Brain Tumor
Registry of the United States (CBTRUS) and includes the brain cerebral meninges cranial
nerves pituitary gland craniopharyngeal duct pineal gland spinal cord cauda equina and spinal
meninges The intracranial sites are the brain cerebral meninges cranial nerves and other
intracranial parts of the CNS the craniopharyngeal duct and the pineal and pituitary glands The
extracranial sites are the spinal cord cauda equina and spinal meninges The BTWG also included
lymphomas in the histology groupings for these sites The topography codes for the sites are in
Appendix B and the histology groupings are listed in Appendix C In this report no distinctions
are made between different age groups for intracranial and CNS tumors
Incidence
The age-adjusted incidence rate for malignant brain and other CNS tumors in the US
for 1991-1995 was 61 per 100000 person years7 Approximately 17400 new cases will be
diagnosed in 19988 The incidence of nonmalignant brain and other CNS tumors is difficult to
Page 12
APPENDIX E ascertain because few cancer registries collect or report these data However CBTRUS
reported an incidence rate for all primary brain and CNS tumors including the pituitary and
pineal glands of 118 per 100000 for 1990-19939 the organization also estimated that 28600
new cases of primary malignant and benign brain tumors were diagnosed nationwide in
199510 For both men and women rates for malignant and nonmalignant brain tumors decline
after a peak in childhood (younger than 10 years) increase after age 25 and stabilize after age
75 overall rates are higher for males11
Although the Surveillance Epidemiology and End Results (SEER) Program reported
a 28 percent decrease in the incidence of invasive brain and other nervous system cancer from
1991 to19957 within the last decade there have been many reports of dramatic increases in the
incidence of brain tumors12-21 particularly among children2223 and the elderly121617 Some
consider the increased rates as histology-specific14 and indicative of a true shift in incidence13
Other studies have concluded that many of the new cases are an artifact of changing
diagnostic procedures1617 In the US the discussion regarding the increased incidence of brain
tumors has been limited to rates for malignant tumors Standard reporting practices would aid
in the interpretation of time trends
Molecular studies24-26 have demonstrated that some low grade or benign intracranial
tumor subtypes transform to malignant tumors To understand the factors that might
contribute to this transformation and whether incidence rates for both malignant and
nonmalignant intracranial tumors are affected the full spectrum of the disease needs to be
observed
Mortality
Brain tumors regardless of behavior are the second leading cause of death from
neurological disease27 In 1995 malignant brain tumors accounted for 12062 deaths and
947 deaths were due to benign brain tumors Another 131 deaths were reported for brain
tumors of uncertain behavior and 2788 persons died of brain tumors for which the behavior
was unspecified28 The estimated number of deaths in 1998 due to malignant brain and other
CNS tumors is 133008 Increased mortality rates for malignant brain tumors particularly
among the elderly have been reported One study concluded that the increases were largely
Page 13
Endash
DATA COLLECTION
OF PRIMARY
CENTRAL NERVOUS
SYSTEM TUMORS
Endash
related to better diagnostic technology and the introduction of support programs such as
Medicare that facilitate diagnostic procedures in the elderly17 Another study attributed the
rising primary malignant brain tumor mortality to differential survival and its effect on the
surviving gene pool in an aging population28
Survival
Prognosis for CNS tumors depends on at least four variables tumor histopathology
anatomic location patient age and neurologic status5 According to a recent analysis using
SEER data from 1973-1991 overall survival rates for malignant brain tumors and rates for
patients with three specific histological types -- astrocytoma medulloblastoma and
oligodendroglioma -- improved29 Few data are available for survival rates for nonmalignant
primary intracranial and CNS tumors However Surawicz et al used data from the National
Cancer Data Base (NCDB) a joint project of the Commission on Cancer (COC) of the
American College of Surgeons (ACoS) and the American Cancer Society to examine survival
rates for patients diagnosed from 1985-1988 and from 1990-1992 with malignant or benign
brain tumors30 NCDB collects data from hospital tumor registries Based on the records of
more than 60000 patients the authors found a 216 percent 5-year survival rate for patients
with malignant tumors and a 724 percent rate for those with benign tumors The most
favorable prognosis was associated with neurilemmomas pilocytic astrocytomas and
meningiomas In contrast microgliomas lymphomas malignant gliomas and anaplastic
astrocytomas were associated with a poor outcome Surawicz et al also found variations in
survival for some tumors depending on location For example survival rates for
glioblastomas which generally have a poor prognosis improved if the tumors were located in
the cerebellum similarly astrocytomas and anaplastic astrocytomas were associated with a
better outcome if the tumors were in the ventricles or the cerebellum
Risk Factors
Although malignant and nonmalignant intracranial and CNS tumors have undergone
considerable study etiologic and pathophysiologic details concerning their genesis remain
obscure Definite genetic predispositions for the development of brain tumors have been
identified however population-based studies suggest that no more than 4 percent of these
Page 14
APPENDIX E tumors can be attributed to heredity 31 Several environmental carcinogens may be associated
with brain tumors including ionizing radiation11 electromagnetic fields32 and pesticides33
sustained exposure to vinyl chlorides polycyclic hydrocarbons and nitrosoureas has been
implicated as well5 Also the presence of the Epstein-Barr virus contained in the DNA of
primary lymphoma suggests that a viral etiology for human brain tumors cannot be entirely
ignored5 Accurate and complete data are necessary to develop hypotheses to identify the
causes of intracranial and CNS tumors The heterogeneity of brain tumors may mask the
identification of causes when histology-specific studies are limited by the number of available
cases
Surveillance
Population-based cancer registries generally provide incidence rates and trends for
cancer surveillance purposes and support related clinical and epidemiological research To
receive accreditation from the COC hospital cancer registries are required to report only
in situ and primary malignant tumors for all sites including the brain and other CNS sites34
Because data collection for nonmalignant intracranial and CNS tumors is not standardized at
either the central tumors can be attributed to heredity or hospital registry level collecting data
for all primary intracranial tumors is a challenge
In 1997 CBTRUS conducted a state survey (Appendix A) of benign brain and other
CNS tumor collection35 This survey gathered information from 64 member registries of the
North American Association of Central Cancer Registries (NAACCR) representing 48 states
All 64 of the registries collected data for primary malignant brain and other CNS tumors
however only 15 state registries collected data for nonmalignant (ie benign) tumors at the
time of the survey Seven state registries had stopped collecting data for benign brain and
other CNS tumors three collected the data passively one had started to collect the data in
1997 and one planned to start in 1998The majority of the registries surveyed indicated that
the requirements of their brain and other CNS tumor data collection had not been altered in
the past 5 years
Page 15
Endash
DATA COLLECTION
OF PRIMARY
CENTRAL NERVOUS
SYSTEM TUMORS
Endash
METHODS
To analyze available data on issues related to the collection of data for primary
intracranial and CNS tumors the BTWG examined surveillance data from CBTRUS the
Minnesota Cancer Surveillance System (MCSS) NCDB and SEER (Table 1) The NCDB
includes cases from all 50 states the District of Columbia and Puerto Rico however it is not
population-based CBTRUS MCSS and the SEER Program are population-based registries
that cover selected areas of the US Three SEER areas collect information for benign and
uncertain (ie nonmalignant) brain tumors but they do not report it Currently however
there are no standard definitions for the collection of site and type among the areas CBTRUS
MCSS and NCDB collect information on both malignant and nonmalignant primary brain
tumors Because the accessioning of nonmalignant cases for NCDB is not required by COC
only 59 percent of the hospitals that submitted any data to NCDB on intracranialCNS cases
diagnosed during 1989-1994 submitted nonmalignant cases The NCDB data reported here
are restricted to those hospitals that reported at least one nonmalignant case as these cases
were thought to contribute most toward the purpose of this report Also although MCSS
collects data for both malignant and nonmalignant tumors it does so for microscopically-
confirmed cases only This registry performs 100-percent case finding audits in all pathology
laboratories in Minnesota
Data inclusion criteria were developed as specified in Appendix B and all four of the
resources (ie CBTRUS MCSS NCDB SEER) developed subsets of their currently
available data according to the agreed-upon inclusion criteria Frequencies and proportions
were computed to reflect variations in factors other than site and the resulting contrasts
across these registries broadly reflect data collection practices For example the primary
difference in brain and CNS definition between SEER and CBTRUS lies in reporting by
behavior with the latter including all nonmalignant tumors As such differences in
proportions between these two registries approximately reflect the magnitude of nonmalignant
brain and CNS tumors Similarly the primary difference in brain and CNS definition between
MCSS and CBTRUS is that the former requires microscopic confirmation of all tumors and
the latter includes clinically and radiologically diagnosed tumors Another important difference
Page 16
APPENDIX E between MCSS and CBTRUS is that MCSS uses a more active method for case finding
Therefore differences in proportions reported reflect the interaction between the magnitude of
nonmicroscopically diagnosed tumors and the magnitude of incomplete case finding of certain
tumor types in CBTRUS Finally the primary difference between NCDB and CBTRUS is that
the former is a hospital-based reporting system and the latter is a population-based reporting
system Therefore differences in proportions may largely reflect referral biases inherent in
hospital reporting systems While other data collection practices may influence information in
these data resources these data bases were selected to highlight the variation in current
information on primary brain and CNS tumors that arises without a standard definition
Frequencies were computed using ICD-O codes for topography (ie location)
behavior diagnostic confirmation histology and selected combinations of behavior and
topography codes Topography was broadly defined into two main categories with
subcategories as shown in Appendix B Intracranial tumors included tumors located in the
brain and other CNS regions (including the cranial nerves) in the meninges and in the
pituitary and pineal glands Extracranial tumors included those located in the spinal cord and
spinal meninges The distinction between intracranial and extracranial tumors was removed for
Table 7 by collapsing brain and spinal meninges into one category and combining the pituitary
and pineal glands into one group (as these regions have endocrine functions) to allow for
adequate numbers within categories of behavior For Table 10 the intracranial and extracranial
distinction was maintained however the pituitary and pineal glands were collapsed into one
category and the spinal cord and spinal meninges were collapsed into the extracranial
category
Behavior was coded using ICD-O categories 0 for benign 1 for uncertain and 3 for
malignant with the first two of these categories collapsed into a nonmalignant category
Microscopic confirmation is based on the SEER definition and grouped into positive
microscopic confirmation radiography without microscopy clinical and unknown These
categories were further grouped as microscopically confirmed and as not microscopically
confirmed for the analysis in Table 3
Page 17
Endash
DATA COLLECTION
OF PRIMARY
CENTRAL NERVOUS
SYSTEM TUMORS
Endash
CBTRUS developed preliminary histology groupings with the aim of improved clinical
relevance ICD-O morphology codes which are used by cancer registries were grouped
based on WHO categories for brain tumors The details of these groupings are shown in
Appendix C
RESULTS
Percentages of Primary Intracranial and CNS Tumors by Tumor Location and by
Microscopic Confirmation
Intracranial tumors comprise more than 94 percent of primary intracranial and CNS
tumors and between 50 and 92 percent of primary intracranial and CNS tumors occur in the
brain (Table 2) The data in this report also show that a slightly greater percentage of
malignant intracranial tumors including malignant brain tumors are microscopically
confirmed compared with corresponding tumors of benign or uncertain behavior (Table 3)
However regardless of tumor behavior the percentages of extracranial CNS tumors that are
microscopically confirmed are higher than the percentages of intracranial tumors that are
confirmed by pathologists (Table 3) Few primary intracranial and CNS tumors are not
microscopically confirmed approximately 11 percent of diagnoses are based only on a clinical
or radiographical (without microscopy) assessment (Table 4)
Percentages of Malignant and of Nonmalignant Intracranial and CNS Tumors by Location
The relative distribution of nonmalignant intracranial and CNS tumors varies by
primary site While greater than 90 percent of malignant intracranial and CNS tumors occur
in the brain (Table 5) only 9 to 26 percent of the nonmalignant tumors occur as parenchymal
tumors (Table 6) Nonmalignant tumors comprised a significant portion of the primary
intracranial and CNS tumors reported by the sources The ratios of nonmalignant to primary
malignant intracranial and CNS tumors reported by CBTRUS MCSS and NCDB were 09
10 and 05 respectively (Table 7)
Percentages of Malignant and of Nonmalignant Intracranial and CNS Tumors by Histology
Among the malignant primary intracranial and CNS tumors neuroepithelial (ie
astrocytic) tumors represent 83 to 90 percent of the cases depending on the data source
Page 18
APPENDIX E lymphomashemopoietic tumors 6 to 11 percent tumors of the meninges 1 to 2 percent and
tumors of cranial and spinal nerves 02 percent (Table 8) For nonmalignant primary
intracranial and CNS tumors tumors of the meninges represent 48 to 59 percent of the cases
tumors of the sellar region (including pituitary tumors and craniopharyngiomas) 21 to 26
percent tumors of cranial and spinal nerves 11 to 20 percent and neuroepithelial tumors 4 to
5 percent (Table 9)
Percentages of Primary Intracranial and CNS Tumors by Method of Case Finding (MCSS)
Case finding audits by the MCSS occur on an annual basis in all pathology laboratories in
Minnesota and include the review of surgerypathology cytology autopsy and hematology
records These audits enable the registry to ensure that there is complete reporting of cases of
malignant and nonmalignant tumors In tables 10 through 13 data from MCSS on primary
intracranial and CNS tumors are presented by method of case finding The two methods of case
finding are routine reporting and special efforts A case was found by routine reporting if one
or more reports received before the close-out date for a given diagnosis year was initiated by a
hospital or nonhospital facility In contrast a case was found by special efforts if all reports of that
case received before the close-out date were requested as a result of pathology laboratory audits
The data in Table 10 indicate that routine reporting of nonmalignant tumors was less complete
compared with reporting for malignant tumors The percentages of intracranial tumor cases that
were found by special efforts have varied from year to year but the trend suggests that routine
reporting may be improving (Table 11) The greatest improvement has been in the coverage of
nonbrain parenchymal tumors (ie pituitarypineal and other intracranial) The small numbers of
autopsy-only tumors were more likely to be found by special case finding efforts than by other
methods of microscopic confirmation (data not shown)
Most hospitals in Minnesota have cancer registries through which their tumor cases are
reported However some of the cases that are seen at hospitals with registries are reported only
through pathology laboratories affiliated with the hospitals Approximately 80 percent
(14511776) of the cases of nonmalignant intracranial tumors in the MCSS data base were
reported by hospitals with registries (Table 12) eighty-five percent (12261451) of these cases
were reported by the hospitals registries (Table 13)The remaining 15 percent (2251451) of the
Page 19
Endash
DATA COLLECTION
OF PRIMARY
CENTRAL NERVOUS
SYSTEM TUMORS
Endash0
cases were reported through the pathology laboratories affiliated with the hospitals with registries
(ie they were not accessioned by the registries) (Table 13) The percentages of cases of
nonmalignant tumors that were reported only by the pathology laboratories at facilities having
cancer registries can be viewed as a measure of how frequently the registries failed to accession
the cases Of the 225 nonaccessioned tumors half would have been missed without the MCSS
case finding audits of pathology laboratories (Table 13)
Percentages of Hospital Cancer Registries That Accessioned Malignant and Nonmalignant
Intracranial and CNS Tumors (NCDB)
Based on data from NCDB more than 1500 hospitals accessioned cases with either
malignant or nonmalignant intracranial and CNS tumors and approximately 800 hospitals
accessioned extracranial cases Cases with tumors that involved the cranial or spinal meninges or
the pituitary gland were more likely to be reported by hospitals that accessioned nonmalignant
primary intracranial and CNS tumors than by hospitals that accessioned only malignant tumors
(Table 14)
DISCUSSION
The findings for this report indicate that collection and reporting of incidence data for
primary malignant intracranial and other CNS tumors are well standardized However substantial
variation exists in the processes of collecting and reporting nonmalignant tumor data One
obstacle is that not all hospitals have cancer registries Another problem is that not all hospitals
with registries accession cases of nonmalignant tumors Data from Minnesota (Table 13) suggest
that approximately 85 percent of cases of nonmalignant intracranial tumors are accessioned by
hospital registries However nonaccessioned CNS cases are less likely to be routinely reported to
the central registry (Table 13) These differences in collection and reporting practices among the
registries make it difficult to assess the burden of primary intracranial and CNS tumors
Terminology for describing intracranial and CNS tumors is also not standardized For
example although the pituitary gland and pineal glands are not technically part of the CNS
tumors that involve these organs are often included in the term CNS tumors On the other hand
some consider the eye to be intracranial however CNS tumors generally do not include the
Page 20
APPENDIX E eyes Although the World Health Organization (WHO) has published a list of histologic
groupings at present no single comprehensive list of histologic groupings exists for intracranial
and CNS tumors Since the International Classification of Childhood Cancer (ICCC) is based on
histologic type rather than site certain benign histologies of sites other than brainCNS (eg non-
CNS ependymomas) would not be included in the BTWGs primary intracranial and CNS
histology groupings (Appendix D) Thus the variation in incidence estimates of primary
intracranial and CNS tumors may be attributable in part to the variation in the definitions of
these tumors In addition differences in cancer registry training and procedures may contribute to
nonreporting and inconsistent reporting of the tumors
The BTWG discussed the feasibility of conducting a random sampling procedure as an
alternative to complete enumeration and ongoing surveillance of nonmalignant brain tumors It
was agreed that this technique would not be valid or feasible for the following reasons
1 If a random sample of incident brain tumors were desired a complete list would be
needed first (a sampling frame is required)
2 If a survey method were used to identify brain tumors in the general population (eg
random digit dialing or other general population survey techniques) the information
needed could not be obtained for several reasons
- Either a prohibitively large numbers of individuals would have to be surveyed or
else only a very small number of brain tumors could be identified given the rarity
and sometimes short survival time
- The brain tumors identified would not be representative of all brain tumors that
occur because people who had survived their brain tumors would be more
likely to be identified
- The incidence rate would still not be known since cross-sectional surveys only
identify disease prevalence
3 If a sample of hospitals were selected to contribute data the tumors included would not
represent the entire spectrum of brain tumors because those that were diagnosed and
treated outside of the hospital setting would be excluded
Page 21
Endash
DATA COLLECTION
OF PRIMARY
CENTRAL NERVOUS
SYSTEM TUMORS
Endash
An alternative approach to sampling and the least troublesome would be to conduct
population-based surveillance only in certain geographic areas of the country If one assumes that
the etiology of brain tumors does not differ from one area of the country to another then the
scientific validity of studies based on this type of sampling would not be a problem However
given the rarity of some types of brain tumors sufficient numbers for study may not be available
unless the vast majority of the nations population were covered by population-based data
collection Also geographic areas without population-based surveillance would have no data to
use for assessing local trends or variations in brain tumor occurrence
In the absence of standard tumor registration procedures and training special case finding
efforts by central registries may be necessary to ensure that complete data are collected for
nonmalignant intracranial and CNS tumors Data from MCSS (Table 10) which has a legal
requirement for reporting nonmalignant intracranial tumors and performs 100 percent case finding
audits in all laboratories indicate that only 80 percent of nonmalignant tumors were routinely
reported In contrast routine reporting accounted for more than 95 percent of malignant
intracranial and CNS tumors Nonmalignant cases in Minnesota that were not accessioned by
hospital registries had a 50 percent chance of being routinely reported to the central registry
however these were only microscopically confirmed cases
Completeness of reporting is critical to cancer registries Accurate case counts are
necessary to assess the burden of cancer to guide cancer control program planning to prioritize
the allocation of health resources and to facilitate epidemiologic research Most central cancer
registries have state laws that mandate reporting of cases by physicians and by hospitals
laboratories and other facilities that provide screening diagnostic or therapeutic services
Complete reporting of nonmalignant intracranial and CNS tumors would be greatly
improved if reporting requirements of the COC central cancer registries SEER and the
National Program of Cancer Registries (NPCR) were changed to require the collection of
information for these tumors However this requirement would have many implications
including an increase in work load as well as associated costs for reporting facilities An estimated
14 percent of all new cancer cases diagnosed in 1998 will involve invasive brain and other
nervous system tumors7 since the numbers of benign and invasive brain and other CNS tumors
Page 22
Endash
APPENDIX E diagnosed annually are similar facilities that presently do not accession nonmalignant cases could
expect an approximately 14 percent increase in the total number of CNS cases collected by the
registry Some estimates of the percentage of brain tumors have been lower (05 percent)36 and
others have been higher (9 percent)37 therefore the extent to which the workload would be
affected may vary The data in this report suggest that if reporting of nonmalignant intracranial
and CNS tumors were required the total number of cases of tumors for these anatomic sites
would double for facilities that presently report only malignant tumors This is consistent with the
findings of Davis et al36 who reported that the incorporation of benign brain tumors into the
cancer-reporting systems of four central registries increased the overall incidence of brain cancer
by 49 percent Forty percent (913) of the hospital registries that submitted data to the NCDB did
not report nonmalignant brain tumors These registries could expect up to a 50 percent increase in
the number of intracranial and CNS tumors reported nonregistry facilities which represent
approximately 20 percent of cases reported to central cancer registries could expect a similar
increase Also central cancer registries that currently do not require reporting of nonmalignant
intracranial and CNS tumors could expect increases in their workloads as a result of the
additional time spent on processing and quality control procedures and training The lack of
standard definitions and collection and reporting guidelines would make these tasks more time-
consuming as well
For some central cancer registries that want to expand their reporting requirements to
include nonmalignant intracranial and CNS tumors a change in current legislation andor
regulations may be needed These changes could involve several months of lead time if public
hearings or other legal procedures are necessary In other states the reporting of these tumors is
not required in either their legislation or regulations in these situations hospitals have been asked
to voluntarily report the cases For example in Massachusetts the reporting of benign brain
tumors is not required by law but hospitals have been reporting these cases since 1982 However
the completeness of data reported on a voluntary basis is difficult to assess For public health
surveillance systems a mandate to report is the basic requirement of a comprehensive higher
quality system
DATA COLLECTION
OF PRIMARY
CENTRAL NERVOUS
SYSTEM TUMORS
If COC SEER NPCR and central cancer registries changed their reporting requirements
to include nonmalignant intracranial and CNS tumors the registry manuals disseminated by these
programs and registries would also need to be modified to include new definitions of reportable
diagnoses All reporting facilities would have to be notified of the new requirements To ensure
complete reporting from registries additional training of registrars should be expected Case
finding methods may need to be modified in order to identify the new cases and sources of
information Central cancer registries would also need to increase their case finding audits The
inclusion of nonmalignant tumors would also necessitate changes to other data items such as
sequence number Hospital and central cancer registries would need to consider adding WHO
brain tumor grade as an additional data item
Finally the software used by reporting facilities and by central registries would need to be
modified to accept nonmalignant morphology and behavior codes Also edits programs would
need to be modified to include these additions and to accept a nonmalignant sequence numbering
procedure
Before reporting requirements for primary intracranial and CNS tumors could be changed
feasibility studies would have to be conducted to determine whether such changes should be
recommended Two SEER special studies are under way to evaluate the impact of requiring the
collection of benign brain tumors on case finding cost quality control and training However
additional studies may be required
Page 24
Endash
APPENDIX E
RECOMMENDATIONS OF THE BRAIN TUMOR WORKING GROUP
1 We recommend the following standard definition for collecting precise data for all primary
intracranial and central nervous system tumors
Primary intracranial and central nervous (CNS) tumors are primary tumors occurring in
the following sites irrespective of histologic type or behavior brain meninges spinal
cord cauda equina cranial nerves and other parts of the CNS pituitary gland pineal
gland and craniopharyngeal duct (see Appendix B)
2 We recommend the development of a standard site and histology definition for tabulating
estimates of these tumors to allow comparability of information across registries Pathologists
the North American Association of Central Cancer Registries (NAACCR) the Commission
on Cancer (COC) the Surveillance Epidemiology and End Results (SEER) Program the
National Program of Cancer Registries (NPCR) and the International Agency for Research
on Cancer (IARC) need to be involved in developing this standard
3 We recommend collection of data for primary intracranial and extracranial CNS tumors by all
registries hospital- and central-based This effort will necessitate a change in the COC
requirements and will increase costs to the hospital-based programs Federal funding should be
allocated to supplement the additional transition and ongoing data collections costs that will be
incurred by central registries Before additional data collection is implemented we recommend
a pilot study should be conducted to assess the procedures and quality control functions
needed as well as the costs of collecting data for these tumors
4 We recommend that the appropriate government and professional organizations be involved in
carrying out the development and implementation of special training programs and curricula for
central registry hospital registry and laboratory personnel as well as the development of
computerized edit-checking procedures Training for reporting and tabulating primary
intracranial and CNS tumors should be offered on a regular basis
Page 25
Endash
DATA COLLECTION
OF PRIMARY
CENTRAL NERVOUS
SYSTEM TUMORS
Endash
REFERENCES
1 Davis F Preston-Martin S Epidemiology of brain tumors In Bigner DD McLendon RE Bruner JM eds Russell and Rubinsteins pathology of tumors of the nervous system ed 6 London Arnold Publishing 19965-45
2 World Health Organization (WHO) (1976) International classification of diseases foroncology ed 1 Geneva World Health Organization
3 World Health Organization (WHO) (1990) International classification of diseases foroncology ed 2 Geneva World Health Organization
4 Kleihues P Burger PC Scheithauer BW The new WHO classification of brain tumorsBrain Pathol 19933255-268
5 Thapar K Laws ER Tumors of the central nervous system In Murphy GP Lawrence WJr Lenhard RE Jr eds Textbook of clinical oncology ed 2 Atlanta American CancerSociety 1995378-410
6 Walker AE Robins M Weinfield FD Epidemiology of brain tumors the national survey ofintracranial neoplasms Neurol 198535219-226
7 Ries LAG Kosary CL Hankey BF Miller BA Edwards BK (eds) SEER Cancer StatisticsReview 1973-1995 National Cancer Institute Bethesda MD 1998
8 Cancer Facts amp Figures - 1998 American Cancer Society Atlanta Georgia 19989 Davis FG Bruner JM Surawicz TS The rationale for standardized registration and reporting
of brain and central nervous system tumors in population-based cancer registriesNeuroepidemiol 199716308-316
10CBTRUS (1996) First annual report 1995 Central Brain Tumor Registry of the UnitedStates Chicago Illinois
11 Preston-Martin S Epidemiology of primary CNS neoplasms Neurol Clinics 199614273-290
12 Greig NH Ries LG Yancik R Rapoport SI Increasing annual incidence of primary malignantbrain tumors in the elderly J Natl Cancer Inst 1991 831621-1624
13 Mao Y Desmeules M Semenciw RM Hill G Gaudette L Wigle DT Increasing brain cancerrates in Canada Can Med Assoc J 19911451583-1591
14 Frelick R Huang P Topham A Brain and central nervous system tumors Delaware 1980 to1989 Del Med J 199264571-573
15 Davis DL Ahlbom A Hoel D Percy C Is brain cancer mortality increasing in industrialcountries Am J Ind Med 199119421-431
16 Helseth A Increasing incidence of primary central nervous system tumors in the elderly Realincrease or improved detection J Natl Cancer Inst 1993851871-1872
17 Modan B Wagener D Feldman JJ Rosenberg HM Feinleib M Increased mortality frombrain tumors A combined outcome of diagnostic technology and change of attitude towardthe elderly Am J Epidemiol 19921351349-1357
18 Polednak AP Time trends in the incidence of brain and central nervous system cancers inConnecticut J Natl Cancer Inst 1991831679-1681
19 Boyle P Maissonneuve P Saracci R Muir CS Is the increase in incidence of primarymalignant brain tumors real J Natl Cancer Inst 1990201594-1596
Page 26
APPENDIX E 20 Preston-Martin S Descriptive epidemiology of primary tumors of the brain cranial nerves
and spinal meninges in Los Angeles County Neuroepidemiol 19898283-29521 Helseth A Mork SJ Neoplasms of the central nervous system in Norway Epidemiological
characteristics of intracranial gliomas according to histology APMIS 97 1989547-55522 Gurney JG Davis S Severson RK Fang J-Y Ross JA Robison LL Trends in cancer
incidence among children in the United States Cancer 199678532-54123 Gurney JG Ross JA Wall DA Bleyer WA Severson RK Robison LL Infant cancer in the
US histology-specific incidence trends 1973-1992 J Pediatr Hem Onc 199719428-43224 Nishio S Takeshita I Morioka T Fukui M Primary intracranial squamous cell carcinomas
report of two cases Neurosurgery 199537329-33225 Freilich RJ Thompson SJ Walker RW Rosenblum MK Adenocarcinomatous transformation
of intracranial germ cell tumors Am J Surg Pathol 199519537-54426Yuan S Miller DW Barnett GH Hahn JF Williams BR Identification and characterization of
human beta 2-chimaerin association with malignant transformation in astrocytoma CancerResearch 1995 553456-3461
27 Preston-Martin S Mack WJ Neoplasms of the nervous system In Schoenfeld D Fraumeni JFJr eds Cancer epidemiology and prevention ed 2 New York Oxford University Press19961231-1281
28 Riggs JE Rising primary malignant brain tumor mortality in the elderly A manifestation ofdifferential survival Arch of Neurol 199552571-575
29 Davis FG Freels S Grutsch J Barlas S Brem S Survival rates in patients with primarymalignant brain tumors stratified by patient age and tumor histological type an analysisbased on Surveillance Epidemiology and End Results (SEER) data 1973-1991J Neurosurg 1998881-10
30 Surawicz TS Davis F Freels S Laws ER Menck HR Brain tumor survival results from theNational Cancer Data Base (Accepted for publication in J Neuro-Oncol)
31 Bondy ML Lustbader ED Buffler PA Schull WJ Hardy RJ Strong LC Geneticepidemiology of childhood brain tumors Genet Epidemiol 19918253-267
32 Preston-Martin S Monroe K Lee P Bernstein L Kelsey J Henderson S Forrester DHenderson B Spinal meningiomas in women in Los Angeles County Investigation of anetiologic hypothesis Cancer Epidemiol Biomarkers Prev 19954333-339
33 Davis JR Brownson RC Garcia R Bentz BJ Turner A Family pesticide use and childhoodbrain cancer Arch Environ Contam Toxicol 19932487-92
34 Commission on Cancer General principles and coding In Standards of the Commission on Cancer vol II Registry Operations and Data Standards American College of SurgeonsChicago Illinois 1996
35 Central Brain Tumor Registry of the United States (CBTRUS) 1997 State Survey of BenignBrain Tumor Collection Chicago Illinois 1997
36 Davis FG Malinski N Haenszel W Chang J Flannery J Gershman S Dibble R Bigner DDPrimary brain tumor incidence rates in the four United States regions 1985-1989 A pilotstudy Neuroepidemiol 199615103-112
37 Schoenberg BS Christine BW Whisnant JP The descriptive epidemiology of primaryintracranial neoplasms the Connecticut experience Am J Epidemiol 1976104499-510
Page 27
Endash
DATA COLLECTION
OF PRIMARY
CENTRAL NERVOUS
SYSTEM TUMORS
TAB
LE 1
C
OM
PAR
ISO
N O
F R
EGIS
TRIE
S SU
PPLY
ING
DA
TA O
N P
RIM
AR
Y I
NTR
AC
RA
NIA
L A
ND
CEN
TRA
L N
ERV
OU
S SY
STEM
TU
MO
RS
IN T
HE
UN
ITED
STA
TES
Cen
tral B
rain
Tum
or R
egis
try o
fth
e U
nite
d St
ates
(CBT
RUS)
Min
neso
ta C
ance
rSu
rvei
llanc
e Sy
stem
(MC
SS)
ACo
SN
a tio
nal C
ance
r Dat
a B
ase
(NCD
B)
Surv
eilla
nce
Epid
emio
logy
and
End
Res
ults
Pro
gram
(SEE
R)
Purp
ose
ldquoCB
TRU
S ce
ntra
lizes
pop
ulat
ion-
base
d in
cide
nce
data
on
all b
rain
tum
ors a
nd u
ses o
ther
exi
stin
gda
ta re
sour
ces t
o ch
arac
teriz
e th
ein
cide
nce
mor
talit
y a
nd su
rviv
alof
pat
ient
s with
bra
in tu
mor
s rdquo
The
MC
SS c
olle
cts i
nfor
mat
ion
onal
l can
cers
dia
gnos
ed si
nce
1988
amon
g M
inne
sota
resi
dent
s Th
e M
CSS
is p
opul
atio
n-ba
sed
path
olog
y-ba
sed
and
is a
n ac
tive
syste
m
ldquoThe
goa
l of t
he N
CD
B is
to p
rese
nt a
n an
nual
sum
mar
y of
pat
ient
car
e fo
r cas
es o
f can
cer
diag
nose
d an
d tre
ated
at h
ospi
tals
thro
ugho
utth
e co
untry
rdquo
ldquoA c
ontin
uing
pro
ject
of th
e N
CI
the
SEER
prog
ram
col
lect
sca
ncer
dat
a on
aro
utin
e ba
sis f
rom
desi
gnat
ed p
opul
atio
n-ba
sed
canc
er re
gist
ries
in v
ario
us a
reas
of t
heco
untry
Targ
et p
opul
atio
n Th
e po
pula
tions
cov
ered
by
regi
strie
s in
Ari
zona
Col
orad
oC
onne
ctic
ut D
elaw
are
Idah
oM
aine
Mas
sach
uset
ts
Min
neso
ta M
issou
ri M
onta
na
Nor
th C
arol
ina
and
Uta
h
The
CB
TRU
S po
pula
tion
repr
esen
ts a
non
rand
om 1
5pe
rcen
t sam
ple
of th
e U
S
popu
latio
n
The
popu
latio
n of
Min
neso
ta
The
popu
latio
ns tr
eate
d at
par
ticip
atin
gho
spita
ls in
the
50 st
ates
the
Dist
rict
of
Col
umbi
a a
nd P
uert
o R
ico
NC
DB
is n
ot a
pop
ulat
ion-
base
d re
gist
ry
At
pres
ent
it is
est
imat
ed to
cov
er a
ppro
xim
atel
y57
per
cent
of t
otal
cas
es n
atio
nwid
e
The
popu
latio
nsco
vere
d by
the
state
regi
strie
s in
Con
nect
icut
Haw
aii
Iow
a N
ew M
exic
o
and
Uta
h a
s wel
l as
the
regi
onal
regi
strie
sin
Atla
nta
Geo
rgia
D
etro
it M
ichi
gan
San
Fran
cisc
o-O
akla
nd C
alifo
rnia
an
d Se
attle
-Pug
etSo
und
Was
hing
ton
The
SEER
pop
ulat
ion
repr
esen
ts a
nonr
ando
m 1
4 pe
rcen
tsa
mpl
e of
the
US
po
pula
tion
Page
28
Endash
APPENDIX E
Cen
tral B
rain
Tum
or R
egis
try o
fth
e U
nite
d St
ates
(CBT
RUS)
Min
neso
ta C
ance
rSu
rvei
llanc
e Sy
stem
(MC
SS)
ACo
SN
a tio
nal C
ance
r Dat
a B
ase
(NCD
B)
Surv
eilla
nce
Epid
emio
logy
and
End
Res
ults
Pro
gram
(SEE
R)
Type
of
prim
ary
intra
cran
ial
and
cent
ral n
ervo
us sy
stem
tum
ors r
epor
ted
Dat
a on
new
ly-d
iagn
osed
cas
es o
fbe
nign
and
mal
igna
nt p
rimar
ybr
ain
tum
ors b
ased
on
ICD
-Oco
des
Dat
a on
new
ly-d
iagn
osed
m
i cro
scop
ical
ly-c
onfir
med
tum
ors
of th
e ce
ntra
l ner
vous
syste
m
incl
udin
g pi
tuita
ry a
nd p
inea
lgl
ands
Hos
pita
ls v
olun
taril
y su
bmit
full
anal
ytic
canc
er re
gist
ry c
asel
oads
with
dat
a ite
ms a
ndco
des d
efin
ed b
y th
e C
omm
issio
n on
Can
cer
(CO
C) f
or h
ospi
tal c
ance
r reg
istri
es
Mos
tpa
rtici
patin
g ho
spita
ls h
ave
prog
ram
sap
prov
ed b
y C
OC
or a
re e
stab
lishi
ng p
rogr
amap
prov
al
NC
DB
cal
ls fo
r dat
a do
not
lim
itca
ses b
y m
alig
nant
beh
avio
r bu
t acc
essi
onin
gof
non
-mal
igna
nt c
ases
is n
ot re
quire
d fo
rpr
ogra
m a
ppro
val
Fifty
-nin
e pe
rcen
t of t
heho
spita
ls th
at su
bmitt
ed a
ny in
tracr
ania
lCN
Sca
ses d
iagn
osed
dur
ing
1989
-199
4 su
bmitt
edat
leas
t one
non
mal
igna
nt c
ase
The
NC
DB
data
in th
is re
port
are
limite
d to
the
case
ssu
bmitt
ed b
y th
ese
hosp
itals
(82
perc
ent o
f all
intra
cran
ial a
nd e
xtra
cran
ial c
entra
l ner
vous
syste
m c
ases
on
file)
Tren
ds in
the
inci
denc
e m
orta
lity
and
patie
nt su
rviv
al o
fbr
ain
tum
ors i
n th
eU
S H
owev
er S
EER
does
not
col
lect
info
rmat
ion
on b
enig
nan
d un
certa
in b
rain
tum
ors
Oth
er c
omm
ents
D
uplic
ate
canc
er re
gist
ratio
ns c
anno
t be
iden
tifie
d by
the
parti
cipa
ting
regi
strie
s
The
MC
SS p
erfo
rms 1
00 p
erce
ntca
se fi
ndin
g au
dits
in a
ll pa
thol
ogy
labo
rato
ries o
n an
ann
ual b
asis
Th
eref
ore
the
data
from
the
MC
SSm
ight
be
cons
ider
ed a
ldquobe
st-ca
sesc
enar
iordquo
in te
rms o
f com
plet
enes
sof
repo
rting
for m
icro
scop
ical
ly-
conf
irmed
tum
ors
Rep
ort d
uplic
atio
n fo
r 198
9-19
94 in
tracr
ania
lan
d ex
tracr
ania
l cen
tral n
ervo
us sy
stem
repo
rts w
as 6
7 p
erce
nt
How
ever
the
NC
DB
data
in T
able
s 2 th
roug
h 9
are
base
d on
undu
plic
ated
repo
rts
Page
29
Endash
DATA COLLECTION
OF PRIMARY
CENTRAL NERVOUS
SYSTEM TUMORS
TABLE 2 NUMBER AND PERCENT OF PRIMARY INTRACRANIAL AND CENTRAL NERVOUS SYSTEM TUMORS BY TUMOR LOCATION
Locationa CBTRUSb
Number () MCSSc
Number () NCDBd
Number () SEERe
Number ()
Intracranial 13084 (947) 3600 (936) 66322 (955) 10196 (969)
Brain 7999 (579) 1924 (500) 48527 (699) 9721 (924)
Meninges 2719 (197) 838 (218) 9365 (135) 139 (13)
Pituitarycraniopharygealduct
1491 (108) 530 (138) 4958 (71) 30 (03)
Pineal 74 (05) 21 (05) 477 (07) 80 (08)
Other central nervous systemincluding cranial nerves
801 (58) 287 (75) 2995 (43) 226 (22)
Extracranial 730 (53) 245 (64) 3137 (45) 322 (31)
Spinal cord 497 (36) 47 (38) 2395 (34) 313 (30)
Spinal meninges 233 (17) 98 (25) 742 (11) 9 (01)
TOTAL 13814 (100) 3845 (100) 69459 (100) 10518 (100)
Note Reported data are incident cases from 1989-1994 except for CBTRUS data which are from 1990-1993
aRefer to the sites in Appendix BbCentral Brain Tumor Registry of the United States cMinnesota Cancer Surveillance System (microscopically confirmed cases only)dNational Cancer Data Base (limited to cases reported by hospitals that accessioned nonmalignant cases) eSurvival Epidemiology and End results Program (malignant cases only)
Page 30
Endash0
TABL
E 3
RO
W P
ERCE
NT
DIS
TRIB
UTI
ON
OF
PRIM
ARY
INTR
ACR
AN
IAL
AN
D C
ENTR
AL
NER
VO
US
SYST
EM T
UM
ORS
BY
TU
MO
R B
EHA
VIO
RA
ND
MIC
ROSC
OPI
C C
ON
FIRM
ATI
ON
Loca
tiona
CB
TRU
Sb M
CSSc
NC
DB
d SE
ERe
Tota
l Pe
rcen
tM
icro
Co
nfirm
ed
Perc
ent
Not
Mic
ro
Conf
irmed
Tota
l Pe
rcen
tM
icro
Co
nfirm
ed
Perc
ent
Not
Mic
ro
Conf
irmed
Tota
l Pe
rcen
tM
icro
Co
nfirm
ed
Perc
ent
Not
Mic
ro
Conf
irmed
Tota
l Pe
rcen
tM
icro
Co
nfirm
ed
Perc
ent
Not
Mic
ro
Conf
irmed
Intra
cran
ial
130
84
867
13
3
360
0 10
0 N
A
663
22
887
11
3
101
96
871
12
9
Mal
igna
nt
717
1 89
2
108
1
824
100
NA
44
801
91
3
87
101
96
871
12
9
Beni
gn a
ndu n
certa
in
591
3 83
5
165
1
776
100
NA
21
521
83
2
168
N
A
NA
N
A
Bra
in
799
9 88
2
118
1
924
100
NA
48
527
90
2
98
972
1 87
3
127
Mal
igna
nt
686
2 89
6
104
1
746
100
NA
42
622
91
5
85
972
1 87
3
127
Beni
gnan
dun
certa
in
113
7 80
6
194
17
8 10
0 N
A
590
5 80
6
194
N
A
NA
N
A
Extra
cran
ial
730
962
3
8 24
5 10
0 N
A
313
7 96
0
40
322
957
4
3
Mal
igna
nt
242
934
6
6 60
10
0 N
A
148
3 96
6
34
322
957
4
3
Beni
gn a
ndu n
certa
in
488
975
2
5 18
5 10
0 N
A
165
4 95
5
45
NA
N
A
NA
TOTA
Lf 13
814
87
2
128
3
845
100
NA
69
459
89
0
110
10
518
87
4
126
Mal
igna
nt
741
3 89
4
106
1
884
100
NA
46
284
91
5
85
105
18
874
12
6
Beni
gn a
ndu n
certa
in
640
1 84
6
154
1
961
100
NA
23
175
84
1
159
N
A
NA
N
A
Not
e R
epor
ted
data
are
inci
dent
cas
es fr
om 1
989-
1994
exc
ept f
or C
BTR
US
data
whi
ch a
re fr
om 1
990-
1993
a Refe
r to
the
site
code
s in
App
endi
x B
b Cent
ral B
rain
Tum
or R
egist
ry o
f the
Uni
ted
Stat
es
c Min
neso
ta C
ance
r Sur
veill
ance
Sys
tem
(mic
rosc
opic
ally
con
firm
ed c
ases
onl
y)
d Nat
iona
l Can
cer D
ata
Base
(lim
ited
to c
ases
repo
rted
by h
ospi
tals
that
acc
essio
ned
nonm
alig
nant
cas
es)
e Surv
eilla
nce
Epi
dem
iolo
gy a
nd E
nd R
esul
ts Pr
ogra
m (m
alig
nant
cas
es o
nly)
f In
clud
es in
tracr
ania
l and
ext
racr
ania
l cas
es
NA
= N
ot a
pplic
able
Page
31
APPENDIX E
Endash
DATA COLLECTION
OF PRIMARY
CENTRAL NERVOUS
SYSTEM TUMORS
TABLE 4 NUMBER AND PERCENT OF PRIMARY INTRACRANIAL AND CENTRAL NERVOUS SYSTEM TUMORS BY DIAGNOSTIC CONFIRMATION
DiagnosticConfirmation
CBTRUSa
Number () MCSSb
Number () NCDBc
Number () SEERd
Number ()
Positive microscopy
12087 (875) 3845 (100) 61818 (890) 9188 (874)
Radiographywithout microscopy
1306 (95) NA 6759 (97) 1015 (97)
Clinical 204 (15) NA 484 (07) 98 (09)
Unknown 217 (15) NA 398 (06) 217 (21)
TOTAL 13814 (100) 3845 (100) 69459 (100) 10518 (100)
Note Reported data are incident cases from 1989-1994 except for CBTRUS data which are from 1990-1993
aCentral Brain Tumor Registry of the United Statesb Minnesota Cancer Surveillance System (microscopically confirmed cases only) cNational Cancer Data Base (limited to cases reported by hospitals that accessioned nonmalignant cases)dSurveillance Epidemiology and End Results Program (malignant cases only)NA = Not applicable
Page 32
Endash
Page 32
TABLE 4 NUMBER AND PERCENT OF PRIMARY INTRACRANIAL AND CENTRALNERVOUS SYSTEM TUMORS BY DIAGNOSTIC CONFIRMATION
DiagnosticConfirmation
CBTRUSa
Number ()MCSSb
Number ()NCDBc
Number ()SEERd
Number ()
Positivemicroscopy
12087 (875) 3845 (100) 61818 (890) 9188 (874)
Radiographywithout microscopy
1306 (95) NA 6759 (97) 1015 (97)
Clinical 204 (15) NA 484 (07) 98 (09)
Unknown 217 (15) NA 398 (06) 217 (21)
TOTAL 13814 (100) 3845 (100) 69459 (100) 10518 (100)
Note Reported data are incident cases from 1989-1994 except for CBTRUS data which are from 1990-1993
aCentral Brain Tumor Registry of the United Statesb Minnesota Cancer Surveillance System (microscopically confirmed cases only)cNational Cancer Data Base (limited to cases reported by hospitals that accessioned nonmalignant cases)dSurveillance Epidemiology and End Results Program (malignant cases only)NA = Not applicable
APPENDIX E
TABLE 5 NUMBER AND PERCENT OF MALIGNANT PRIMARY INTRACRANIAL AND CENTRAL SYSTEM TUMORS BY TUMOR LOCATION
Locationa CBTRUSb
Number () MCSSc
Number () NCDBd
Number () SEERe
Number ()
Intracranial 7171 (977) 1824 (968) 44801 (968) 10196 (969)
Brain 6862 (926) 1746 (927) 42622 (921) 9721 (924)
Meninges 98 (13) 23 (12) 581 (13) 139 (13)
Pituitarycraniopharyngealduct
37 (05) 13 (07) 189 (04) 30 (03)
Pineal 58 (08) 20 (11) 378 (08) 80 (08)
Other central nervous systemincluding cranial nerves
116 (16) 22 (12) 1031 (22) 226 (21)
Extracranial 242 (33) 60 (32) 1483 (32) 322 (31)
Spinal cord 234 (32) 60 (32) 1410 (30) 313 (30)
Spinal meninges 8 (01) 0 73 (02) 9 (01)
TOTAL 7413 (100) 1884 (100) 46284 (100) 10518 (100)
Note Reported data are incident cases from 1989-1994 except for CBTRUS data which are from 1990-1993
aRefer to the site codes in Appendix BbCentral Brain Tumor Registry of the United States cMinnesota Cancer Surveillance System (microscopically confirmed cases only)dNational Cancer Data Base (limited to cases reported by hospitals that accessioned nonmalignant cases) eSurvival Epidemiology and End Results Program (malignant cases only)
Page 33
Endash
DATA COLLECTION
OF PRIMARY
CENTRAL NERVOUS
SYSTEM TUMORS
TABLE 6 NUMBER AND PERCENT OF PRIMARY INTRACRANIAL AND CENTRAL NERVOUS SYSTEM TUMORS OF BENIGN AND UNCERTAIN BEHAVIOR BY TUMOR LOCATION
Locationa CBTRUSb
Number () MCSSc
Number () NCDBd
Number () SEERe
Number ()
Intracranial 5913 (924) 1776 (906) 21521 (929) NA
Brain 1137 (178) 178 (91) 5905 (255) NA
Meninges 2621 (409) 815 (416) 8784 (379) NA
Pituitarycraniopharyngealduct
1454 (227) 517 (264) 4769 (206) NA
Pineal 16 (02) 1 (lt01) 99 (04) NA
Other central nervous systemincluding cranial nerves
685 (107) 265 (135) 1964 (85) NA
Extracranial 488 (76) 185 (94) 1654 (71) NA
Spinal cord 263 (41) 87 (44) 985 (42) NA
Spinal meninges 225 (35) 98 (50) 669 (29) NA
TOTAL 6401 (100) 1961 (100) 23175 (100) NA
Note Reported data are incident cases from 1989-1994 except for CBTRUS data which are from 1990-1993
aRefer to the site codes in Appendix BbCentral Brain Tumor Registry of the United States cMinnesota Cancer Surveillance System (microscopically confirmed cases only)dNational Cancer Data Base (limited to cases reported by hospitals that accessioned nonmalignant cases) eSurveillance Epidemiology and End Results Program (malignant cases only)NA = Not applicable
Page 34
Endash
APPENDIX E TABLE 7 NUMBER AND PERCENT OF PRIMARY INTRACRANIAL AND CENTRAL
NERVOUS SYSTEM TUMORS BY TUMOR BEHAVIOR AND LOCATION
BehaviorTumor Locationa
CBTRUSb
Number () MCSSc
Number () NCDBd
Number () SEERe
Number ()
Malignant 7413 (537) 1884 (490) 46284 (666) 10518 (100)
Brain 6862 (497) 1746 (454) 42622 (614) 9721 (924)
Meninges 98 (07) 23 (06) 581 (08) 139 (13)
Pituitarycraniopharyn-geal ductpineal
95 (07) 33 (09) 567 (08) 110 (11)
Other central nervous system includingcranial nerves
116 (08) 22 (06) 1031 (15) 226 (22)
Spinal cord 242 (18) 60 (16) 1483 (21) 322 (31)
Benign 5794 (419) 1787 (465) 20694 (298) NA
Brain 803 (58) 99 (26) 4491 (65) NA
Meninges 2565 (186) 807 (210) 8613 (124) NA
Pituitarycraniopharyn-geal ductpineal
1322 (96) 458 (119) 4330 (62) NA
Other central nervous system includingcranial nerves
678 (49) 263 (68) 1911 (28) NA
Spinal cord 426 (31) 160 (42) 1349 (19) NA
Uncertain 607 (44) 174 (45) 2481 (36) NA
Brain 334 (24) 79 (21) 1414 (20) NA
Meninges 56 (04) 8 (02) 171 (02) NA
Pituitarycraniopharyn-geal ductpineal
148 (11) 60 (16) 538 (08) NA
Other central nervous system includingcranial nerves
7 (01) 2 (01) 53 (01) NA
Spinal cord 62 (05) 25 (07) 305 (04) NA
TOTAL 13814 (100) 3845 (100) 69459 (100) 10518 (100)
Note Reported data are incident cases from 1989-1994 except for CBTRUS data which are from 1990-1993 NA=Not applicableaRefer to the site codes in Appendix B bCentral Brain Tumor Registry of the United States cMinnesota Cancer Surveillance System (microscopically confirmed cases only)dNational Cancer Data Base (limited to cases reported byhospitals that accessioned nonmalignant cases eSurvival Epidemiology and End Results Program (malignant cases only)
Page 35
Endash
DATA COLLECTION
OF PRIMARY
CENTRAL NERVOUS
SYSTEM TUMORS
TABLE 8 NUMBER AND PERCENT OF MALIGNANT PRIMARY INTRACRANIAL AND
CENTRAL NERVOUS SYSTEM TUMORS BY HISTOLOGY GROUPINGS
WHO Histologya
Groupings CBTRUSb
Number () MCSSc
Number () NCDBd
Number () SEERe
Number ()
Neuroepithelial 6477 (874) 1689 (896) 39701 (858) 8676 (825)
Tumors of cranial and spinal nerves
12 (02) 3 (02) 108 (02) 25 (02)
Tumors of meninges
137 (18) 25 (13) 994 (21) 194 (18)
LymphomasHemopoietic
473 (64) 121 (64) 3492 (75) 1099 (105)
Germ cell 70 (09) 20 (11) 403 (09) 97 (09)
Cysts and tumor-like lesions
0 0 0 0
Tumors of sellar region
20 (03) 11 (06) 100 (02) 6 (01)
Local extensions 29 (04) 11 (06) 166 (04) 38 (04)
Unclassifiedunassigned tumorsf
195 (26) 4 (02) 1320 (29) 383 (36)
TOTAL 7413 (100) 1884 (100) 46284 (100) 10518 (100)
Note Reported data are incident cases from 1989-1994 except for CBTRUS data which are from 1990-1993
aRefer to the World Health Organization (WHO) histology groupings in Appendix CbCentral Brain Tumor Registry of the United States cMinnesota Cancer Surveillance System (microscopically confirmed cases only)dNational Cancer Data Base (limited to cases reported by hospitals that accessioned nonmalignant cases) f For MCSS unclassifiedunassigned tumors include one malignant and four nonmalignant histologies which were
not listed in the CBTRUS classification scheme For NCDB unclassifiedunassigned tumors include 319 cases(less than one half percent) which had histologies not assigned by CBTRUS to any other category For SEERunclassifiedunassigned tumors include all malignant histologies occurring in the brainCNS which could not beclassified in one of the above categories based on their 4-digit histologic type
Page 36
Endash
APPENDIX E
TABLE 9 NUMBER AND PERCENT OF PRIMARY INTRACRANIAL AND CENTRAL NERVOUS SYSTEM TUMORS OF BENIGN AND UNCERTAIN BEHAVIOR
BY HISTOLOGY GROUPINGS
WHO Histologya
Groupings CBTRUSb
Number () MCSSc
Number () NCDBd
Number () SEERe
Number ()
Neuroepithelial 275 (43) 91 (46) 1064 (46) NA
Tumors of cranial and spinal nerves
980 (153) 397 (202) 2618 (113) NA
Tumors of meninges
3509 (548) 941 (480) 13667 (590) NA
LymphomasHemopoietic
3 (lt01) 0 7 (lt01) NA
Germ cell 4 (lt01) 1 (01) 25 (01) NA
Cysts and tumor-like lesions
15 (02) 3 (02) 34 (01) NA
Tumors of sellar region
1444 (226) 510 (260) 4749 (205) NA
Local extensions 0 0 0 NA
Unclassifiedunassigned tumorsf
171 (27) 18 (09) 1011 (44) NA
TOTAL 6401 (100) 1961 (100) 23175 (100) NA
Note Reported data are incident cases from 1989-1994 except for CBTRUS which is 1990-1993
aRefer to the World Health Organization (WHO) histology groupings in Appendix CbCentral Brain Tumor Registry of the United States c Minnesota Cancer Surveillance System (microscopically confirmed cases only) dNational Cancer Data Base (limited to cases reported by hospitals that accessioned nonmalignant cases) eSurvival Epidemiology and End Results Program (malignant cases only)dFor MCSS unclassifiedunassigned tumors include one malignant and four nonmalignant histologies which werenot listed in the CBTRUS classification scheme For NCDB unclassifiedunassigned tumors include 319 cases(less than one half percent) which had histologies not assigned by CBTRUS to any other category For SEERunclassifiedunassigned tumors include all malignant histologies occurring in the brainCNS which could not beclassified in one of the above categories based on their 4-digit histologic typeNA = Not applicable
Page 37
Endash
DATA COLLECTION
OF PRIMARY
CENTRAL NERVOUS
SYSTEM TUMORS
TABLE 10 METHOD OF CASE FINDING FOR PRIMARY INTRACRANIAL AND CENTRAL NERVOUS SYSTEM TUMORS BY TUMOR BEHAVIOR AND LOCATION MINNESOTA 1989-1994
Behavior Tumor Locationa
Number of Cases
Percent Found byRoutine
Reporting
Percent Found by Special Efforts
Malignant Brain Cerebral meninges
Pituitarycranio duct pineal Other intracranial
18841746 23 33
22
961 965 957 939
864
39 35 43 61
136 Extracranial 60 883 117 Benign Brain
1787 99
788 838
212 162
Cerebral meninges Pituitarycranio duct
pineal Other intracranial
807 458
263
843 740
779
157 260
221 Extracranial 160 631 369 Uncertain 174 856 144 Brain 79 823 177 Cerebral meninges Pituitarycraniopharyn- geal ductpineal Other intracranial
8 60
2
875 850
1000
125 150
00 Extracranial 25 960 40
TOTAL 3845 876 124
aRefer to the site codes in Appendix B
Page 38
Endash
1989 1990 1991 1992 1993 1994
TOTAL
APPENDIX E TABLE 11 METHOD OF CASE FINDING FOR INTRACRANIALa TUMORS BY DIAGNOSIS YEAR MINNESOTA 1989-1994
DiagnosisYear
Number of
Cases
Percent Found byRoutine
Reporting
Percent Found by
Special Efforts
571 837 163 616 865 135 586 913 87 602 899 101
633 872 128 592 929 71
3600 886 114
aIncludes the brain cerebral meninges pituitary gland pineal gland and otherintracranial tumors (refer to the site codes in Appendix B)
Page 39
Endash
DATA COLLECTION
OF PRIMARY
CENTRAL NERVOUS
SYSTEM TUMORS
TABLE 12 METHOD OF CASE FINDING FOR NONMALIGNANT INTRACRANIALa TUMORS BY TYPE OF FACILITY MINNESOTA 1989-1994
Type of Facility Number of Tumors Percent Found byRoutine
Reporting
Percent Found by Special Efforts
Registry at facility No registry at facility
1451325
859 569
141 431
TOTAL 1776 806 194
aIncludes tumors with benign or uncertain behavior that involve the brain cerebral meningespituitary gland pineal gland or other intracranial sites (refer to the site codes in Appendix B)
TABLE 13 REPORTING METHOD AND SOURCE OF CASE FINDING FOR NON- MALIGNANT INTRACRANIALa TUMORS DIAGNOSED IN HOSPITALS WITH A TUMOR REGISTRY MINNESOTA 1989-1994
Reporting Method Number of Tumors Percent Found byRoutine
Reporting
Percent Found by
Special Efforts
Registry-reportedLaboratory-reported
1226225
925 502
75 498
TOTAL 1451 859 141
aIncludes tumors with benign or uncertain behavior that involve the brain cerebral meningespituitary gland pineal gland or other intracranial sites (refer to the site codes in Appendix B)
Page 40
Endash0
APPENDIX E TABLE 14 HOSPITAL REGISTRY ACCESSIONING OF MALIGNANT AND NON-
MALIGNANT PRIMARY INTRACRANIAL AND CENTRAL NERVOUS SYSTEM TUMORS NCDB 1989-1994
TUMOR Totalb
BEHAVIOR Malignant c Nonmalignantd
Tumor Locationa HospitalsReporting
Number ()
Hospitals Reporting
Number ()
Hospitals Reporting
Number ()
Intracranial 1542 (100) 1526 (100) 900 (99)
Brain 1527 (99) 1519 (gt99) 754 (83)
Meninges 740 (48) 390 (26) 613 (67)
Pituitaryglandcraniopharyn-
geal duct
602 (39) 168 (11) 538 (59)
Pineal gland 319 (21) 277 (18) 79 (9)
Other central nervous system including cranial
nerves
648 (42) 545 (36) 299 (33)
Extracranial 812 (53) 708 (46) 410 (45)
Spinal cord 760 (49) 692 (45) 311 (34)
Spinal meninges 299 (19) 72 (5) 258 (28)
TOTAL Hospitals 1542 (100) 1526 (100) 913 (100)
Note The number of hospitals in each of the second third and fourth columns is the number that submittedreports to the NCDB for any intracranial and central nervous system tumors for the respective malignancystatus Not all hospitals submitted reports for each year during the study period (1989-1994)
aRefer to the site codes in Appendix B bBehavior codes = 0 1 3 cBehavior code = 3 dBehavior codes = 0 1
Page 41
Endash
DATA COLLECTION
OF PRIMARY
CENTRAL NERVOUS
SYSTEM TUMORS
Texas Cancer Registry
1997 CBTRUS State Survey of Benign Brain Tumor Data Collection
State Collection Status
Currently Collecting Benign Tumor Data1 Arizona Cancer Registry since 1981 2 Colorado Central Cancer Registry since 1988 3 Connecticut Tumor Registry since 1965 4 Idaho Cancer Data Registry since 1970 5 Maine Cancer Registry since 1983 6 Massachusetts Cancer Registry since 1982 7 Minnesota Cancer Surveillance System since 1988 8 Montana Central Tumor Registry since 1979 9 New York State Cancer Registry since 1988
10 North Carolina Central Cancer Registry since 1990 11 Utah Cancer Registry since 1966 12 Virginia Cancer Registry since 1994 13 Delaware State Cancer Registry14 Washington State Cancer Registry since 1992 15 passive collection 1979-1994
active collection since 1995
Stopped or Passive Collection of Benign Tumor Data1 New Jersey State Cancer Registry stopped 1979-1995 2 Kansas Cancer Registry stopped 1969-1995 3 New Hampshire State Cancer Registry stopped 1986-1991 4 District of Columbia Cancer Registry stopped 1997 5 Wyoming Cancer Surveillance Program stopped 111996 6 Louisiana Tumor Registry stopped 1992 (passive collection) 7 Illinois State Cancer Registry stopped 111996 8 Missouri Cancer Registry passive collection since 1984 9 South Carolina Central Cancer Registry passive collection since 1996
Beginning Collection of Benign Tumor Data1 North Dakota Cancer Registry began collection 1997 2 Rhode Island Cancer Registry began collection 1998
Page 42
Endash
APPENDIX E
Codes for Primary Intracranial and Central Nervous System Tumors
Note For this report the designation of ldquoprimary intracranial and central nervous system tumorsrdquo includes thefollowing primary tumors of central nervous system sites as well as tumors of the pituitary and pinealglands All histology types within the topography codes are included in the designation of ldquoprimaryintracranial and CNS tumors The source for the topography codes is Percy C Van Holten V Muir Ceds International Classification of Diseases for Oncology Second Edition Geneva World Health Organization 1990
Intracranial tumors
Brain C710 Cerebrum C711 Frontal lobe C712 Temporal lobe C713 Parietal lobe C714 Occipital lobe C715 Ventricle NOSC716 Cerebellum NOS C717 Brain stem C718 Overlapping lesion of brain C719 Brain NOS
Meninges C700 Cerebral meninges C709 Meninges NOS
a
Cranial Nerves and other intracranial parts of the central nervous systemC722 Olfactory nerve C723 Optic nerve C724 Acoustic nerve C725 Cranial nerve NOS C728 Overlapping lesion of brain and central nervous system C729 Nervous system NOS
Other endrocrine glands and related structures C751 Pituitary gland C752 Craniopharyngeal duct C753 Pineal gland
Extracranial tumors
Spinal cord C720 Spinal cord C721 Cauda equina
Meninges C701 Spinal meninges
aNOS=Not Otherwise Specified
Page 43
Endash
DATA COLLECTION
OF PRIMARY
CENTRAL NERVOUS
SYSTEM TUMORS
Brain Tumor Histology Groupings
The following histology groupings were used for the primary intracranial and central nervoussystem tumors The source for the histology groupings is Central Brain Tumor Registry ofthe United States (CBTRUS) 1996 Statistics Report Table 4
WHOa HISTOLOGY GROUPINGS ICD-Ob MORPHOLOGY CODE
Diffuse astrocytoma (protoplasma fibrillary) 9410 9420 Anaplastic astrocytoma 9401 9411 Glioblastoma 9440 9441 9442 Pilocytic astrocytoma 9421 Unique astrocytoma variants 9383 9384 9424 Oligodendroglioma 9450 Anaplastic oligodendroglioma 9451 9460 Ependymomaanaplastic ependymoma 9391 9392 9393 Ependymoma variants 9394 Mixed glioma 9382 Astrocytoma NOSc 9400 Glioma malignant NOS 9380 Choroid plexus 9390 Neuroepithelial 9381 9423 9430 Benign neuronalglial neuronal and mixed 86801 8693 9490 9505 9506 Malignant neruonalglial neuronal and mixed 86803 9364 9490 9500 Pineal parenchymal 9360 9361 9362 Embryonalprimitivemedulloblastoma 8963 9470 9471 9472
9473 9501 9502 9503 9510
TUMORS OF NEUROEPITHELIAL TISSUE
TUMORS OF CRANIAL AND SPINAL NERVES Nerve sheath benign and malignant 9540 9550 9560 9570
TUMORS OF THE MENINGES Meningioma 9530 9531 9532 9533 9534 9537 9538 Other mesenchymal benign and malignant 8800 8801 8802 8803 8810 8830 8850 88618900
8910 8990 9133 9150 9240 9480 9481 9536 9539 Hemangioblastoma 9161 9535
LYMPHOMAS AND HEMOPOIETIC NEOPLASMS Lymphoma 9590 9591 9593 9594 9595 9630 9650 9652
9663 9670 9671 9672 9674 9675 9680 9681 9682 9684 9685 9686 9687 9690 9691 96939695 9696 9698 9702 9714 9723 9731 9766 9970
GERM CELL TUMORS Germ cell 8020 9060 9064 9070 9071 9080 9084 9085 9100
CYSTS AND TUMOR-LIKE LESIONS Cysts and heterotopias 9084
TUMORS OF THE SELLAR REGION Pituitary 8040 8l40 8l46 8260 8270 8271 8280
8281 8290 8300 8330 8323 8333 Craniopharyngioma 9350
Page 44
Endash
APPENDIX E
LOCAL EXTENSIONS FROM REGIONAL TUMORS Chordomachondrosarcoma 9370
UNCLASSIFIED TUMORS Hemangioma 9120 9121 9130 9131 Neoplasm benign 80000 8010 Neoplasm uncertain behavior 80001 80011 Neoplasm malignant 80003 80013 8002 8003 All other 8720 9580
aWHO = World Health OrganizationbICD-O = International Classification of Diseases for Oncology Second Edition 1990 cNOS=Not Otherwise Specified
Page 45
Endash
DATA COLLECTION
OF PRIMARY
CENTRAL NERVOUS
SYSTEM TUMORS
Endash
International Classification of Childhood Cancer (ICCC)
Diagnostic Group
ICD-Oa codes
Morphology Topography
I LEUKAEMIA
(a) Lymphoid leukaemia 9820-9827 9850
(b) Acute non-lymphocytic leukaemia 9840 9841 9861 9864 9866 9867 98919894 9910
(c) Chronic myeloid leukaemia 9863 9868
(d) Other specified leukaemias 9830 9842 9860 9862 9870-9890 9892 98939900 9930-9941
(e) Unspecified leukaemias 9800-9804
II LYMPHOMAS AND OTHER RETICULOENDOTHELIAL NEOPLASMS
(a) Hodgkinrsquos disease 9650-9667
(b) Non-Hodgkinrsquos lymphoma 9591-9595 9670-9686 9690-9714 9723
(c) Burkittrsquos lymphoma 9687
(d) Miscellaneous lymphoreticular neoplasms 9720 9731-9764
(e) Unspecified lymphomas 9590
III CENTRAL NERVOUS SYSTEM (CNS) ANDMISCELLANEOUS INTRACRANIAL AND
INTRASPINAL NEOPLASMSb
(a) Ependymomac 9383 9390-9394
(b) Astrocytoma 9380 C723
9381 9400-9441
(c) Primitive neuroectodermal tumours 9470-9473
(d) Other gliomasd 9380 C700-C722C724-C729
9382 9384
9442-9460 9481
APPENDIX E
Diagnostic Group
ICD-Oa codes
Morphology Topogragphy
III CNS AND MISCELLANEOUS INTRACRANIAL AND INTRASPINAL
NEOPLASMSb Continued
(e) Miscellaneous intracranial and intraspinalneoplasmsc
8270-8281 8300 9350-9362 9480 95059530-9539
(f) Unspecified intracranial and intraspinalneoplasmsc
8000-8004 C700-C729C751-C753
IV SYMPATHETIC NERVOUS SYSTEM TUMOURS
(a) Neuroblastoma and ganglioneuroblastoma 9490 9500
(b) Other sympathetic nervous system tumours 8680 8693-8710 9501-9504 9520-9523
aInternational Classification of Diseases for Oncology Second Edition World Health Organization 1990bGroup III excludes all lymphomas See group II cBehaviour codes 0 and 1 are included dBehaviour code 1 is included
Page 47
Endash
Comments and recommendations are welcome Should questions arise on how to use these
materials or for more information please contact
Centers for Disease Control and Prevention National Program of Cancer Registries
4770 Buford Hwy NE Mail Stop K-53
Atlanta GA 30042-3717
Voice Information System 1 (888) 842-6355 bull Fax (770) 488-4760
cancerinfocdcgov bull httpwwwcdcgovcancer
All materials are in the public domain and may be reproduced or copied without permission citation
to source however is appreciated
BACK COVER
(WHITE)
Spine(WHITE)
DATA COLLECTION OF PRIMARY CEN
TRAL NERVOUS SYSTEM
TUM
ORS 2004
National Program of Cancer Registries Training M
aterials

APPENDIX E
INTRODUCTION
Because nonmalignant brain tumors often can have a malignant clinical course leading to
substantial long-term morbidity and high risk for death the distinction between
histopathologically-defined malignancies versus nonmalignancies is tenuous from both a clinical
and an epidemiologic standpoint Likewise because nonmalignancies have not been systematically
or consistently included in most population-based cancer surveillance systems the public health
community has little information to offer on either incidence or mortality patterns and trends of
nonmalignant brain tumors in the United States (US) Additionally there have been virtually no
analytic epidemiology research studies conducted that would help identify factors that influence
the risk for nonmalignant brain tumor occurrence Thus despite their clinical importance both the
public health surveillance mission and the etiologic research mission of cancer prevention and
control are compromised by the exclusion of nonmalignant brain tumors in registry systems
Recognizing this challenge the National Coordinating Council for Cancer Surveillance (NCCCS)
established a Brain Tumor Working Group (BTWG) during its semi-annual meeting in January
1997 The purpose of BTWG was to review the status of the surveillance of brain tumors in the
US and examine the feasibility of collecting data for nonmalignant brain tumors Upon
completion of the project recommendations regarding surveillance of both malignant and
nonmalignant (ie benign or uncertain behavior) brain tumors would be presented at a special
meeting of the NCCCS This report describes data collection by US registries for primary
intracranial and central nervous system (CNS) tumors It includes data from several registries to
demonstrate variability in current reporting practices
BACKGROUND
Classification
Historically cancer registries have used the International Classification of Diseases (ICD)
system which describes tumors by their location (topography) and behavior (benign versus
malignant)1 to code neoplasms Tumor nomenclature describing histology was developed by
pathologists and incorporated into the International Classification of Diseases for Oncology (ICD-
O) system as a morphology code in 19762 and revised in a second edition (ICD-O-2)3 However
Page 11
Endash
DATA COLLECTION
OF PRIMARY
CENTRAL NERVOUS
SYSTEM TUMORS
Endash
not all of the morphology codes in the current ICD-O classification used by cancer registries are
consistent with the recent World Health Organization (WHO) brain tumor codes34 The recent
WHO brain tumor classification has new terms that are not included in ICD-O-2 however a new
third edition to ICD-O may include these terms ICD-O-2 also includes terms which are not
categorized by WHO
The CNS environment also contributes to the difficulty in characterizing tumors that
involve this site In contrast to tumors arising in other organ systems the terms benign and
malignant are only relative distinctions for CNS neoplasms Depending on location
histologically benign CNS tumors can result in similar or worse outcomes compared with
malignant tumors For these and other reasons classic oncologic concepts predicated on
histologic grade nodal status and staging strategies are not entirely applicable to tumors of the
CNS5
When the BTWG discussed whether to consider anatomic sites other than the brain for
this report the unique features of the CNS and the morbidity and mortality associated with non-
CNS intracranial tumors were closely examined For the sake of simplicity in reporting and
analyzing data for all of these sites the designation of primary intracranial and CNS tumors was
suggested This designation proposed by Walker et al6 is used by the Central Brain Tumor
Registry of the United States (CBTRUS) and includes the brain cerebral meninges cranial
nerves pituitary gland craniopharyngeal duct pineal gland spinal cord cauda equina and spinal
meninges The intracranial sites are the brain cerebral meninges cranial nerves and other
intracranial parts of the CNS the craniopharyngeal duct and the pineal and pituitary glands The
extracranial sites are the spinal cord cauda equina and spinal meninges The BTWG also included
lymphomas in the histology groupings for these sites The topography codes for the sites are in
Appendix B and the histology groupings are listed in Appendix C In this report no distinctions
are made between different age groups for intracranial and CNS tumors
Incidence
The age-adjusted incidence rate for malignant brain and other CNS tumors in the US
for 1991-1995 was 61 per 100000 person years7 Approximately 17400 new cases will be
diagnosed in 19988 The incidence of nonmalignant brain and other CNS tumors is difficult to
Page 12
APPENDIX E ascertain because few cancer registries collect or report these data However CBTRUS
reported an incidence rate for all primary brain and CNS tumors including the pituitary and
pineal glands of 118 per 100000 for 1990-19939 the organization also estimated that 28600
new cases of primary malignant and benign brain tumors were diagnosed nationwide in
199510 For both men and women rates for malignant and nonmalignant brain tumors decline
after a peak in childhood (younger than 10 years) increase after age 25 and stabilize after age
75 overall rates are higher for males11
Although the Surveillance Epidemiology and End Results (SEER) Program reported
a 28 percent decrease in the incidence of invasive brain and other nervous system cancer from
1991 to19957 within the last decade there have been many reports of dramatic increases in the
incidence of brain tumors12-21 particularly among children2223 and the elderly121617 Some
consider the increased rates as histology-specific14 and indicative of a true shift in incidence13
Other studies have concluded that many of the new cases are an artifact of changing
diagnostic procedures1617 In the US the discussion regarding the increased incidence of brain
tumors has been limited to rates for malignant tumors Standard reporting practices would aid
in the interpretation of time trends
Molecular studies24-26 have demonstrated that some low grade or benign intracranial
tumor subtypes transform to malignant tumors To understand the factors that might
contribute to this transformation and whether incidence rates for both malignant and
nonmalignant intracranial tumors are affected the full spectrum of the disease needs to be
observed
Mortality
Brain tumors regardless of behavior are the second leading cause of death from
neurological disease27 In 1995 malignant brain tumors accounted for 12062 deaths and
947 deaths were due to benign brain tumors Another 131 deaths were reported for brain
tumors of uncertain behavior and 2788 persons died of brain tumors for which the behavior
was unspecified28 The estimated number of deaths in 1998 due to malignant brain and other
CNS tumors is 133008 Increased mortality rates for malignant brain tumors particularly
among the elderly have been reported One study concluded that the increases were largely
Page 13
Endash
DATA COLLECTION
OF PRIMARY
CENTRAL NERVOUS
SYSTEM TUMORS
Endash
related to better diagnostic technology and the introduction of support programs such as
Medicare that facilitate diagnostic procedures in the elderly17 Another study attributed the
rising primary malignant brain tumor mortality to differential survival and its effect on the
surviving gene pool in an aging population28
Survival
Prognosis for CNS tumors depends on at least four variables tumor histopathology
anatomic location patient age and neurologic status5 According to a recent analysis using
SEER data from 1973-1991 overall survival rates for malignant brain tumors and rates for
patients with three specific histological types -- astrocytoma medulloblastoma and
oligodendroglioma -- improved29 Few data are available for survival rates for nonmalignant
primary intracranial and CNS tumors However Surawicz et al used data from the National
Cancer Data Base (NCDB) a joint project of the Commission on Cancer (COC) of the
American College of Surgeons (ACoS) and the American Cancer Society to examine survival
rates for patients diagnosed from 1985-1988 and from 1990-1992 with malignant or benign
brain tumors30 NCDB collects data from hospital tumor registries Based on the records of
more than 60000 patients the authors found a 216 percent 5-year survival rate for patients
with malignant tumors and a 724 percent rate for those with benign tumors The most
favorable prognosis was associated with neurilemmomas pilocytic astrocytomas and
meningiomas In contrast microgliomas lymphomas malignant gliomas and anaplastic
astrocytomas were associated with a poor outcome Surawicz et al also found variations in
survival for some tumors depending on location For example survival rates for
glioblastomas which generally have a poor prognosis improved if the tumors were located in
the cerebellum similarly astrocytomas and anaplastic astrocytomas were associated with a
better outcome if the tumors were in the ventricles or the cerebellum
Risk Factors
Although malignant and nonmalignant intracranial and CNS tumors have undergone
considerable study etiologic and pathophysiologic details concerning their genesis remain
obscure Definite genetic predispositions for the development of brain tumors have been
identified however population-based studies suggest that no more than 4 percent of these
Page 14
APPENDIX E tumors can be attributed to heredity 31 Several environmental carcinogens may be associated
with brain tumors including ionizing radiation11 electromagnetic fields32 and pesticides33
sustained exposure to vinyl chlorides polycyclic hydrocarbons and nitrosoureas has been
implicated as well5 Also the presence of the Epstein-Barr virus contained in the DNA of
primary lymphoma suggests that a viral etiology for human brain tumors cannot be entirely
ignored5 Accurate and complete data are necessary to develop hypotheses to identify the
causes of intracranial and CNS tumors The heterogeneity of brain tumors may mask the
identification of causes when histology-specific studies are limited by the number of available
cases
Surveillance
Population-based cancer registries generally provide incidence rates and trends for
cancer surveillance purposes and support related clinical and epidemiological research To
receive accreditation from the COC hospital cancer registries are required to report only
in situ and primary malignant tumors for all sites including the brain and other CNS sites34
Because data collection for nonmalignant intracranial and CNS tumors is not standardized at
either the central tumors can be attributed to heredity or hospital registry level collecting data
for all primary intracranial tumors is a challenge
In 1997 CBTRUS conducted a state survey (Appendix A) of benign brain and other
CNS tumor collection35 This survey gathered information from 64 member registries of the
North American Association of Central Cancer Registries (NAACCR) representing 48 states
All 64 of the registries collected data for primary malignant brain and other CNS tumors
however only 15 state registries collected data for nonmalignant (ie benign) tumors at the
time of the survey Seven state registries had stopped collecting data for benign brain and
other CNS tumors three collected the data passively one had started to collect the data in
1997 and one planned to start in 1998The majority of the registries surveyed indicated that
the requirements of their brain and other CNS tumor data collection had not been altered in
the past 5 years
Page 15
Endash
DATA COLLECTION
OF PRIMARY
CENTRAL NERVOUS
SYSTEM TUMORS
Endash
METHODS
To analyze available data on issues related to the collection of data for primary
intracranial and CNS tumors the BTWG examined surveillance data from CBTRUS the
Minnesota Cancer Surveillance System (MCSS) NCDB and SEER (Table 1) The NCDB
includes cases from all 50 states the District of Columbia and Puerto Rico however it is not
population-based CBTRUS MCSS and the SEER Program are population-based registries
that cover selected areas of the US Three SEER areas collect information for benign and
uncertain (ie nonmalignant) brain tumors but they do not report it Currently however
there are no standard definitions for the collection of site and type among the areas CBTRUS
MCSS and NCDB collect information on both malignant and nonmalignant primary brain
tumors Because the accessioning of nonmalignant cases for NCDB is not required by COC
only 59 percent of the hospitals that submitted any data to NCDB on intracranialCNS cases
diagnosed during 1989-1994 submitted nonmalignant cases The NCDB data reported here
are restricted to those hospitals that reported at least one nonmalignant case as these cases
were thought to contribute most toward the purpose of this report Also although MCSS
collects data for both malignant and nonmalignant tumors it does so for microscopically-
confirmed cases only This registry performs 100-percent case finding audits in all pathology
laboratories in Minnesota
Data inclusion criteria were developed as specified in Appendix B and all four of the
resources (ie CBTRUS MCSS NCDB SEER) developed subsets of their currently
available data according to the agreed-upon inclusion criteria Frequencies and proportions
were computed to reflect variations in factors other than site and the resulting contrasts
across these registries broadly reflect data collection practices For example the primary
difference in brain and CNS definition between SEER and CBTRUS lies in reporting by
behavior with the latter including all nonmalignant tumors As such differences in
proportions between these two registries approximately reflect the magnitude of nonmalignant
brain and CNS tumors Similarly the primary difference in brain and CNS definition between
MCSS and CBTRUS is that the former requires microscopic confirmation of all tumors and
the latter includes clinically and radiologically diagnosed tumors Another important difference
Page 16
APPENDIX E between MCSS and CBTRUS is that MCSS uses a more active method for case finding
Therefore differences in proportions reported reflect the interaction between the magnitude of
nonmicroscopically diagnosed tumors and the magnitude of incomplete case finding of certain
tumor types in CBTRUS Finally the primary difference between NCDB and CBTRUS is that
the former is a hospital-based reporting system and the latter is a population-based reporting
system Therefore differences in proportions may largely reflect referral biases inherent in
hospital reporting systems While other data collection practices may influence information in
these data resources these data bases were selected to highlight the variation in current
information on primary brain and CNS tumors that arises without a standard definition
Frequencies were computed using ICD-O codes for topography (ie location)
behavior diagnostic confirmation histology and selected combinations of behavior and
topography codes Topography was broadly defined into two main categories with
subcategories as shown in Appendix B Intracranial tumors included tumors located in the
brain and other CNS regions (including the cranial nerves) in the meninges and in the
pituitary and pineal glands Extracranial tumors included those located in the spinal cord and
spinal meninges The distinction between intracranial and extracranial tumors was removed for
Table 7 by collapsing brain and spinal meninges into one category and combining the pituitary
and pineal glands into one group (as these regions have endocrine functions) to allow for
adequate numbers within categories of behavior For Table 10 the intracranial and extracranial
distinction was maintained however the pituitary and pineal glands were collapsed into one
category and the spinal cord and spinal meninges were collapsed into the extracranial
category
Behavior was coded using ICD-O categories 0 for benign 1 for uncertain and 3 for
malignant with the first two of these categories collapsed into a nonmalignant category
Microscopic confirmation is based on the SEER definition and grouped into positive
microscopic confirmation radiography without microscopy clinical and unknown These
categories were further grouped as microscopically confirmed and as not microscopically
confirmed for the analysis in Table 3
Page 17
Endash
DATA COLLECTION
OF PRIMARY
CENTRAL NERVOUS
SYSTEM TUMORS
Endash
CBTRUS developed preliminary histology groupings with the aim of improved clinical
relevance ICD-O morphology codes which are used by cancer registries were grouped
based on WHO categories for brain tumors The details of these groupings are shown in
Appendix C
RESULTS
Percentages of Primary Intracranial and CNS Tumors by Tumor Location and by
Microscopic Confirmation
Intracranial tumors comprise more than 94 percent of primary intracranial and CNS
tumors and between 50 and 92 percent of primary intracranial and CNS tumors occur in the
brain (Table 2) The data in this report also show that a slightly greater percentage of
malignant intracranial tumors including malignant brain tumors are microscopically
confirmed compared with corresponding tumors of benign or uncertain behavior (Table 3)
However regardless of tumor behavior the percentages of extracranial CNS tumors that are
microscopically confirmed are higher than the percentages of intracranial tumors that are
confirmed by pathologists (Table 3) Few primary intracranial and CNS tumors are not
microscopically confirmed approximately 11 percent of diagnoses are based only on a clinical
or radiographical (without microscopy) assessment (Table 4)
Percentages of Malignant and of Nonmalignant Intracranial and CNS Tumors by Location
The relative distribution of nonmalignant intracranial and CNS tumors varies by
primary site While greater than 90 percent of malignant intracranial and CNS tumors occur
in the brain (Table 5) only 9 to 26 percent of the nonmalignant tumors occur as parenchymal
tumors (Table 6) Nonmalignant tumors comprised a significant portion of the primary
intracranial and CNS tumors reported by the sources The ratios of nonmalignant to primary
malignant intracranial and CNS tumors reported by CBTRUS MCSS and NCDB were 09
10 and 05 respectively (Table 7)
Percentages of Malignant and of Nonmalignant Intracranial and CNS Tumors by Histology
Among the malignant primary intracranial and CNS tumors neuroepithelial (ie
astrocytic) tumors represent 83 to 90 percent of the cases depending on the data source
Page 18
APPENDIX E lymphomashemopoietic tumors 6 to 11 percent tumors of the meninges 1 to 2 percent and
tumors of cranial and spinal nerves 02 percent (Table 8) For nonmalignant primary
intracranial and CNS tumors tumors of the meninges represent 48 to 59 percent of the cases
tumors of the sellar region (including pituitary tumors and craniopharyngiomas) 21 to 26
percent tumors of cranial and spinal nerves 11 to 20 percent and neuroepithelial tumors 4 to
5 percent (Table 9)
Percentages of Primary Intracranial and CNS Tumors by Method of Case Finding (MCSS)
Case finding audits by the MCSS occur on an annual basis in all pathology laboratories in
Minnesota and include the review of surgerypathology cytology autopsy and hematology
records These audits enable the registry to ensure that there is complete reporting of cases of
malignant and nonmalignant tumors In tables 10 through 13 data from MCSS on primary
intracranial and CNS tumors are presented by method of case finding The two methods of case
finding are routine reporting and special efforts A case was found by routine reporting if one
or more reports received before the close-out date for a given diagnosis year was initiated by a
hospital or nonhospital facility In contrast a case was found by special efforts if all reports of that
case received before the close-out date were requested as a result of pathology laboratory audits
The data in Table 10 indicate that routine reporting of nonmalignant tumors was less complete
compared with reporting for malignant tumors The percentages of intracranial tumor cases that
were found by special efforts have varied from year to year but the trend suggests that routine
reporting may be improving (Table 11) The greatest improvement has been in the coverage of
nonbrain parenchymal tumors (ie pituitarypineal and other intracranial) The small numbers of
autopsy-only tumors were more likely to be found by special case finding efforts than by other
methods of microscopic confirmation (data not shown)
Most hospitals in Minnesota have cancer registries through which their tumor cases are
reported However some of the cases that are seen at hospitals with registries are reported only
through pathology laboratories affiliated with the hospitals Approximately 80 percent
(14511776) of the cases of nonmalignant intracranial tumors in the MCSS data base were
reported by hospitals with registries (Table 12) eighty-five percent (12261451) of these cases
were reported by the hospitals registries (Table 13)The remaining 15 percent (2251451) of the
Page 19
Endash
DATA COLLECTION
OF PRIMARY
CENTRAL NERVOUS
SYSTEM TUMORS
Endash0
cases were reported through the pathology laboratories affiliated with the hospitals with registries
(ie they were not accessioned by the registries) (Table 13) The percentages of cases of
nonmalignant tumors that were reported only by the pathology laboratories at facilities having
cancer registries can be viewed as a measure of how frequently the registries failed to accession
the cases Of the 225 nonaccessioned tumors half would have been missed without the MCSS
case finding audits of pathology laboratories (Table 13)
Percentages of Hospital Cancer Registries That Accessioned Malignant and Nonmalignant
Intracranial and CNS Tumors (NCDB)
Based on data from NCDB more than 1500 hospitals accessioned cases with either
malignant or nonmalignant intracranial and CNS tumors and approximately 800 hospitals
accessioned extracranial cases Cases with tumors that involved the cranial or spinal meninges or
the pituitary gland were more likely to be reported by hospitals that accessioned nonmalignant
primary intracranial and CNS tumors than by hospitals that accessioned only malignant tumors
(Table 14)
DISCUSSION
The findings for this report indicate that collection and reporting of incidence data for
primary malignant intracranial and other CNS tumors are well standardized However substantial
variation exists in the processes of collecting and reporting nonmalignant tumor data One
obstacle is that not all hospitals have cancer registries Another problem is that not all hospitals
with registries accession cases of nonmalignant tumors Data from Minnesota (Table 13) suggest
that approximately 85 percent of cases of nonmalignant intracranial tumors are accessioned by
hospital registries However nonaccessioned CNS cases are less likely to be routinely reported to
the central registry (Table 13) These differences in collection and reporting practices among the
registries make it difficult to assess the burden of primary intracranial and CNS tumors
Terminology for describing intracranial and CNS tumors is also not standardized For
example although the pituitary gland and pineal glands are not technically part of the CNS
tumors that involve these organs are often included in the term CNS tumors On the other hand
some consider the eye to be intracranial however CNS tumors generally do not include the
Page 20
APPENDIX E eyes Although the World Health Organization (WHO) has published a list of histologic
groupings at present no single comprehensive list of histologic groupings exists for intracranial
and CNS tumors Since the International Classification of Childhood Cancer (ICCC) is based on
histologic type rather than site certain benign histologies of sites other than brainCNS (eg non-
CNS ependymomas) would not be included in the BTWGs primary intracranial and CNS
histology groupings (Appendix D) Thus the variation in incidence estimates of primary
intracranial and CNS tumors may be attributable in part to the variation in the definitions of
these tumors In addition differences in cancer registry training and procedures may contribute to
nonreporting and inconsistent reporting of the tumors
The BTWG discussed the feasibility of conducting a random sampling procedure as an
alternative to complete enumeration and ongoing surveillance of nonmalignant brain tumors It
was agreed that this technique would not be valid or feasible for the following reasons
1 If a random sample of incident brain tumors were desired a complete list would be
needed first (a sampling frame is required)
2 If a survey method were used to identify brain tumors in the general population (eg
random digit dialing or other general population survey techniques) the information
needed could not be obtained for several reasons
- Either a prohibitively large numbers of individuals would have to be surveyed or
else only a very small number of brain tumors could be identified given the rarity
and sometimes short survival time
- The brain tumors identified would not be representative of all brain tumors that
occur because people who had survived their brain tumors would be more
likely to be identified
- The incidence rate would still not be known since cross-sectional surveys only
identify disease prevalence
3 If a sample of hospitals were selected to contribute data the tumors included would not
represent the entire spectrum of brain tumors because those that were diagnosed and
treated outside of the hospital setting would be excluded
Page 21
Endash
DATA COLLECTION
OF PRIMARY
CENTRAL NERVOUS
SYSTEM TUMORS
Endash
An alternative approach to sampling and the least troublesome would be to conduct
population-based surveillance only in certain geographic areas of the country If one assumes that
the etiology of brain tumors does not differ from one area of the country to another then the
scientific validity of studies based on this type of sampling would not be a problem However
given the rarity of some types of brain tumors sufficient numbers for study may not be available
unless the vast majority of the nations population were covered by population-based data
collection Also geographic areas without population-based surveillance would have no data to
use for assessing local trends or variations in brain tumor occurrence
In the absence of standard tumor registration procedures and training special case finding
efforts by central registries may be necessary to ensure that complete data are collected for
nonmalignant intracranial and CNS tumors Data from MCSS (Table 10) which has a legal
requirement for reporting nonmalignant intracranial tumors and performs 100 percent case finding
audits in all laboratories indicate that only 80 percent of nonmalignant tumors were routinely
reported In contrast routine reporting accounted for more than 95 percent of malignant
intracranial and CNS tumors Nonmalignant cases in Minnesota that were not accessioned by
hospital registries had a 50 percent chance of being routinely reported to the central registry
however these were only microscopically confirmed cases
Completeness of reporting is critical to cancer registries Accurate case counts are
necessary to assess the burden of cancer to guide cancer control program planning to prioritize
the allocation of health resources and to facilitate epidemiologic research Most central cancer
registries have state laws that mandate reporting of cases by physicians and by hospitals
laboratories and other facilities that provide screening diagnostic or therapeutic services
Complete reporting of nonmalignant intracranial and CNS tumors would be greatly
improved if reporting requirements of the COC central cancer registries SEER and the
National Program of Cancer Registries (NPCR) were changed to require the collection of
information for these tumors However this requirement would have many implications
including an increase in work load as well as associated costs for reporting facilities An estimated
14 percent of all new cancer cases diagnosed in 1998 will involve invasive brain and other
nervous system tumors7 since the numbers of benign and invasive brain and other CNS tumors
Page 22
Endash
APPENDIX E diagnosed annually are similar facilities that presently do not accession nonmalignant cases could
expect an approximately 14 percent increase in the total number of CNS cases collected by the
registry Some estimates of the percentage of brain tumors have been lower (05 percent)36 and
others have been higher (9 percent)37 therefore the extent to which the workload would be
affected may vary The data in this report suggest that if reporting of nonmalignant intracranial
and CNS tumors were required the total number of cases of tumors for these anatomic sites
would double for facilities that presently report only malignant tumors This is consistent with the
findings of Davis et al36 who reported that the incorporation of benign brain tumors into the
cancer-reporting systems of four central registries increased the overall incidence of brain cancer
by 49 percent Forty percent (913) of the hospital registries that submitted data to the NCDB did
not report nonmalignant brain tumors These registries could expect up to a 50 percent increase in
the number of intracranial and CNS tumors reported nonregistry facilities which represent
approximately 20 percent of cases reported to central cancer registries could expect a similar
increase Also central cancer registries that currently do not require reporting of nonmalignant
intracranial and CNS tumors could expect increases in their workloads as a result of the
additional time spent on processing and quality control procedures and training The lack of
standard definitions and collection and reporting guidelines would make these tasks more time-
consuming as well
For some central cancer registries that want to expand their reporting requirements to
include nonmalignant intracranial and CNS tumors a change in current legislation andor
regulations may be needed These changes could involve several months of lead time if public
hearings or other legal procedures are necessary In other states the reporting of these tumors is
not required in either their legislation or regulations in these situations hospitals have been asked
to voluntarily report the cases For example in Massachusetts the reporting of benign brain
tumors is not required by law but hospitals have been reporting these cases since 1982 However
the completeness of data reported on a voluntary basis is difficult to assess For public health
surveillance systems a mandate to report is the basic requirement of a comprehensive higher
quality system
DATA COLLECTION
OF PRIMARY
CENTRAL NERVOUS
SYSTEM TUMORS
If COC SEER NPCR and central cancer registries changed their reporting requirements
to include nonmalignant intracranial and CNS tumors the registry manuals disseminated by these
programs and registries would also need to be modified to include new definitions of reportable
diagnoses All reporting facilities would have to be notified of the new requirements To ensure
complete reporting from registries additional training of registrars should be expected Case
finding methods may need to be modified in order to identify the new cases and sources of
information Central cancer registries would also need to increase their case finding audits The
inclusion of nonmalignant tumors would also necessitate changes to other data items such as
sequence number Hospital and central cancer registries would need to consider adding WHO
brain tumor grade as an additional data item
Finally the software used by reporting facilities and by central registries would need to be
modified to accept nonmalignant morphology and behavior codes Also edits programs would
need to be modified to include these additions and to accept a nonmalignant sequence numbering
procedure
Before reporting requirements for primary intracranial and CNS tumors could be changed
feasibility studies would have to be conducted to determine whether such changes should be
recommended Two SEER special studies are under way to evaluate the impact of requiring the
collection of benign brain tumors on case finding cost quality control and training However
additional studies may be required
Page 24
Endash
APPENDIX E
RECOMMENDATIONS OF THE BRAIN TUMOR WORKING GROUP
1 We recommend the following standard definition for collecting precise data for all primary
intracranial and central nervous system tumors
Primary intracranial and central nervous (CNS) tumors are primary tumors occurring in
the following sites irrespective of histologic type or behavior brain meninges spinal
cord cauda equina cranial nerves and other parts of the CNS pituitary gland pineal
gland and craniopharyngeal duct (see Appendix B)
2 We recommend the development of a standard site and histology definition for tabulating
estimates of these tumors to allow comparability of information across registries Pathologists
the North American Association of Central Cancer Registries (NAACCR) the Commission
on Cancer (COC) the Surveillance Epidemiology and End Results (SEER) Program the
National Program of Cancer Registries (NPCR) and the International Agency for Research
on Cancer (IARC) need to be involved in developing this standard
3 We recommend collection of data for primary intracranial and extracranial CNS tumors by all
registries hospital- and central-based This effort will necessitate a change in the COC
requirements and will increase costs to the hospital-based programs Federal funding should be
allocated to supplement the additional transition and ongoing data collections costs that will be
incurred by central registries Before additional data collection is implemented we recommend
a pilot study should be conducted to assess the procedures and quality control functions
needed as well as the costs of collecting data for these tumors
4 We recommend that the appropriate government and professional organizations be involved in
carrying out the development and implementation of special training programs and curricula for
central registry hospital registry and laboratory personnel as well as the development of
computerized edit-checking procedures Training for reporting and tabulating primary
intracranial and CNS tumors should be offered on a regular basis
Page 25
Endash
DATA COLLECTION
OF PRIMARY
CENTRAL NERVOUS
SYSTEM TUMORS
Endash
REFERENCES
1 Davis F Preston-Martin S Epidemiology of brain tumors In Bigner DD McLendon RE Bruner JM eds Russell and Rubinsteins pathology of tumors of the nervous system ed 6 London Arnold Publishing 19965-45
2 World Health Organization (WHO) (1976) International classification of diseases foroncology ed 1 Geneva World Health Organization
3 World Health Organization (WHO) (1990) International classification of diseases foroncology ed 2 Geneva World Health Organization
4 Kleihues P Burger PC Scheithauer BW The new WHO classification of brain tumorsBrain Pathol 19933255-268
5 Thapar K Laws ER Tumors of the central nervous system In Murphy GP Lawrence WJr Lenhard RE Jr eds Textbook of clinical oncology ed 2 Atlanta American CancerSociety 1995378-410
6 Walker AE Robins M Weinfield FD Epidemiology of brain tumors the national survey ofintracranial neoplasms Neurol 198535219-226
7 Ries LAG Kosary CL Hankey BF Miller BA Edwards BK (eds) SEER Cancer StatisticsReview 1973-1995 National Cancer Institute Bethesda MD 1998
8 Cancer Facts amp Figures - 1998 American Cancer Society Atlanta Georgia 19989 Davis FG Bruner JM Surawicz TS The rationale for standardized registration and reporting
of brain and central nervous system tumors in population-based cancer registriesNeuroepidemiol 199716308-316
10CBTRUS (1996) First annual report 1995 Central Brain Tumor Registry of the UnitedStates Chicago Illinois
11 Preston-Martin S Epidemiology of primary CNS neoplasms Neurol Clinics 199614273-290
12 Greig NH Ries LG Yancik R Rapoport SI Increasing annual incidence of primary malignantbrain tumors in the elderly J Natl Cancer Inst 1991 831621-1624
13 Mao Y Desmeules M Semenciw RM Hill G Gaudette L Wigle DT Increasing brain cancerrates in Canada Can Med Assoc J 19911451583-1591
14 Frelick R Huang P Topham A Brain and central nervous system tumors Delaware 1980 to1989 Del Med J 199264571-573
15 Davis DL Ahlbom A Hoel D Percy C Is brain cancer mortality increasing in industrialcountries Am J Ind Med 199119421-431
16 Helseth A Increasing incidence of primary central nervous system tumors in the elderly Realincrease or improved detection J Natl Cancer Inst 1993851871-1872
17 Modan B Wagener D Feldman JJ Rosenberg HM Feinleib M Increased mortality frombrain tumors A combined outcome of diagnostic technology and change of attitude towardthe elderly Am J Epidemiol 19921351349-1357
18 Polednak AP Time trends in the incidence of brain and central nervous system cancers inConnecticut J Natl Cancer Inst 1991831679-1681
19 Boyle P Maissonneuve P Saracci R Muir CS Is the increase in incidence of primarymalignant brain tumors real J Natl Cancer Inst 1990201594-1596
Page 26
APPENDIX E 20 Preston-Martin S Descriptive epidemiology of primary tumors of the brain cranial nerves
and spinal meninges in Los Angeles County Neuroepidemiol 19898283-29521 Helseth A Mork SJ Neoplasms of the central nervous system in Norway Epidemiological
characteristics of intracranial gliomas according to histology APMIS 97 1989547-55522 Gurney JG Davis S Severson RK Fang J-Y Ross JA Robison LL Trends in cancer
incidence among children in the United States Cancer 199678532-54123 Gurney JG Ross JA Wall DA Bleyer WA Severson RK Robison LL Infant cancer in the
US histology-specific incidence trends 1973-1992 J Pediatr Hem Onc 199719428-43224 Nishio S Takeshita I Morioka T Fukui M Primary intracranial squamous cell carcinomas
report of two cases Neurosurgery 199537329-33225 Freilich RJ Thompson SJ Walker RW Rosenblum MK Adenocarcinomatous transformation
of intracranial germ cell tumors Am J Surg Pathol 199519537-54426Yuan S Miller DW Barnett GH Hahn JF Williams BR Identification and characterization of
human beta 2-chimaerin association with malignant transformation in astrocytoma CancerResearch 1995 553456-3461
27 Preston-Martin S Mack WJ Neoplasms of the nervous system In Schoenfeld D Fraumeni JFJr eds Cancer epidemiology and prevention ed 2 New York Oxford University Press19961231-1281
28 Riggs JE Rising primary malignant brain tumor mortality in the elderly A manifestation ofdifferential survival Arch of Neurol 199552571-575
29 Davis FG Freels S Grutsch J Barlas S Brem S Survival rates in patients with primarymalignant brain tumors stratified by patient age and tumor histological type an analysisbased on Surveillance Epidemiology and End Results (SEER) data 1973-1991J Neurosurg 1998881-10
30 Surawicz TS Davis F Freels S Laws ER Menck HR Brain tumor survival results from theNational Cancer Data Base (Accepted for publication in J Neuro-Oncol)
31 Bondy ML Lustbader ED Buffler PA Schull WJ Hardy RJ Strong LC Geneticepidemiology of childhood brain tumors Genet Epidemiol 19918253-267
32 Preston-Martin S Monroe K Lee P Bernstein L Kelsey J Henderson S Forrester DHenderson B Spinal meningiomas in women in Los Angeles County Investigation of anetiologic hypothesis Cancer Epidemiol Biomarkers Prev 19954333-339
33 Davis JR Brownson RC Garcia R Bentz BJ Turner A Family pesticide use and childhoodbrain cancer Arch Environ Contam Toxicol 19932487-92
34 Commission on Cancer General principles and coding In Standards of the Commission on Cancer vol II Registry Operations and Data Standards American College of SurgeonsChicago Illinois 1996
35 Central Brain Tumor Registry of the United States (CBTRUS) 1997 State Survey of BenignBrain Tumor Collection Chicago Illinois 1997
36 Davis FG Malinski N Haenszel W Chang J Flannery J Gershman S Dibble R Bigner DDPrimary brain tumor incidence rates in the four United States regions 1985-1989 A pilotstudy Neuroepidemiol 199615103-112
37 Schoenberg BS Christine BW Whisnant JP The descriptive epidemiology of primaryintracranial neoplasms the Connecticut experience Am J Epidemiol 1976104499-510
Page 27
Endash
DATA COLLECTION
OF PRIMARY
CENTRAL NERVOUS
SYSTEM TUMORS
TAB
LE 1
C
OM
PAR
ISO
N O
F R
EGIS
TRIE
S SU
PPLY
ING
DA
TA O
N P
RIM
AR
Y I
NTR
AC
RA
NIA
L A
ND
CEN
TRA
L N
ERV
OU
S SY
STEM
TU
MO
RS
IN T
HE
UN
ITED
STA
TES
Cen
tral B
rain
Tum
or R
egis
try o
fth
e U
nite
d St
ates
(CBT
RUS)
Min
neso
ta C
ance
rSu
rvei
llanc
e Sy
stem
(MC
SS)
ACo
SN
a tio
nal C
ance
r Dat
a B
ase
(NCD
B)
Surv
eilla
nce
Epid
emio
logy
and
End
Res
ults
Pro
gram
(SEE
R)
Purp
ose
ldquoCB
TRU
S ce
ntra
lizes
pop
ulat
ion-
base
d in
cide
nce
data
on
all b
rain
tum
ors a
nd u
ses o
ther
exi
stin
gda
ta re
sour
ces t
o ch
arac
teriz
e th
ein
cide
nce
mor
talit
y a
nd su
rviv
alof
pat
ient
s with
bra
in tu
mor
s rdquo
The
MC
SS c
olle
cts i
nfor
mat
ion
onal
l can
cers
dia
gnos
ed si
nce
1988
amon
g M
inne
sota
resi
dent
s Th
e M
CSS
is p
opul
atio
n-ba
sed
path
olog
y-ba
sed
and
is a
n ac
tive
syste
m
ldquoThe
goa
l of t
he N
CD
B is
to p
rese
nt a
n an
nual
sum
mar
y of
pat
ient
car
e fo
r cas
es o
f can
cer
diag
nose
d an
d tre
ated
at h
ospi
tals
thro
ugho
utth
e co
untry
rdquo
ldquoA c
ontin
uing
pro
ject
of th
e N
CI
the
SEER
prog
ram
col
lect
sca
ncer
dat
a on
aro
utin
e ba
sis f
rom
desi
gnat
ed p
opul
atio
n-ba
sed
canc
er re
gist
ries
in v
ario
us a
reas
of t
heco
untry
Targ
et p
opul
atio
n Th
e po
pula
tions
cov
ered
by
regi
strie
s in
Ari
zona
Col
orad
oC
onne
ctic
ut D
elaw
are
Idah
oM
aine
Mas
sach
uset
ts
Min
neso
ta M
issou
ri M
onta
na
Nor
th C
arol
ina
and
Uta
h
The
CB
TRU
S po
pula
tion
repr
esen
ts a
non
rand
om 1
5pe
rcen
t sam
ple
of th
e U
S
popu
latio
n
The
popu
latio
n of
Min
neso
ta
The
popu
latio
ns tr
eate
d at
par
ticip
atin
gho
spita
ls in
the
50 st
ates
the
Dist
rict
of
Col
umbi
a a
nd P
uert
o R
ico
NC
DB
is n
ot a
pop
ulat
ion-
base
d re
gist
ry
At
pres
ent
it is
est
imat
ed to
cov
er a
ppro
xim
atel
y57
per
cent
of t
otal
cas
es n
atio
nwid
e
The
popu
latio
nsco
vere
d by
the
state
regi
strie
s in
Con
nect
icut
Haw
aii
Iow
a N
ew M
exic
o
and
Uta
h a
s wel
l as
the
regi
onal
regi
strie
sin
Atla
nta
Geo
rgia
D
etro
it M
ichi
gan
San
Fran
cisc
o-O
akla
nd C
alifo
rnia
an
d Se
attle
-Pug
etSo
und
Was
hing
ton
The
SEER
pop
ulat
ion
repr
esen
ts a
nonr
ando
m 1
4 pe
rcen
tsa
mpl
e of
the
US
po
pula
tion
Page
28
Endash
APPENDIX E
Cen
tral B
rain
Tum
or R
egis
try o
fth
e U
nite
d St
ates
(CBT
RUS)
Min
neso
ta C
ance
rSu
rvei
llanc
e Sy
stem
(MC
SS)
ACo
SN
a tio
nal C
ance
r Dat
a B
ase
(NCD
B)
Surv
eilla
nce
Epid
emio
logy
and
End
Res
ults
Pro
gram
(SEE
R)
Type
of
prim
ary
intra
cran
ial
and
cent
ral n
ervo
us sy
stem
tum
ors r
epor
ted
Dat
a on
new
ly-d
iagn
osed
cas
es o
fbe
nign
and
mal
igna
nt p
rimar
ybr
ain
tum
ors b
ased
on
ICD
-Oco
des
Dat
a on
new
ly-d
iagn
osed
m
i cro
scop
ical
ly-c
onfir
med
tum
ors
of th
e ce
ntra
l ner
vous
syste
m
incl
udin
g pi
tuita
ry a
nd p
inea
lgl
ands
Hos
pita
ls v
olun
taril
y su
bmit
full
anal
ytic
canc
er re
gist
ry c
asel
oads
with
dat
a ite
ms a
ndco
des d
efin
ed b
y th
e C
omm
issio
n on
Can
cer
(CO
C) f
or h
ospi
tal c
ance
r reg
istri
es
Mos
tpa
rtici
patin
g ho
spita
ls h
ave
prog
ram
sap
prov
ed b
y C
OC
or a
re e
stab
lishi
ng p
rogr
amap
prov
al
NC
DB
cal
ls fo
r dat
a do
not
lim
itca
ses b
y m
alig
nant
beh
avio
r bu
t acc
essi
onin
gof
non
-mal
igna
nt c
ases
is n
ot re
quire
d fo
rpr
ogra
m a
ppro
val
Fifty
-nin
e pe
rcen
t of t
heho
spita
ls th
at su
bmitt
ed a
ny in
tracr
ania
lCN
Sca
ses d
iagn
osed
dur
ing
1989
-199
4 su
bmitt
edat
leas
t one
non
mal
igna
nt c
ase
The
NC
DB
data
in th
is re
port
are
limite
d to
the
case
ssu
bmitt
ed b
y th
ese
hosp
itals
(82
perc
ent o
f all
intra
cran
ial a
nd e
xtra
cran
ial c
entra
l ner
vous
syste
m c
ases
on
file)
Tren
ds in
the
inci
denc
e m
orta
lity
and
patie
nt su
rviv
al o
fbr
ain
tum
ors i
n th
eU
S H
owev
er S
EER
does
not
col
lect
info
rmat
ion
on b
enig
nan
d un
certa
in b
rain
tum
ors
Oth
er c
omm
ents
D
uplic
ate
canc
er re
gist
ratio
ns c
anno
t be
iden
tifie
d by
the
parti
cipa
ting
regi
strie
s
The
MC
SS p
erfo
rms 1
00 p
erce
ntca
se fi
ndin
g au
dits
in a
ll pa
thol
ogy
labo
rato
ries o
n an
ann
ual b
asis
Th
eref
ore
the
data
from
the
MC
SSm
ight
be
cons
ider
ed a
ldquobe
st-ca
sesc
enar
iordquo
in te
rms o
f com
plet
enes
sof
repo
rting
for m
icro
scop
ical
ly-
conf
irmed
tum
ors
Rep
ort d
uplic
atio
n fo
r 198
9-19
94 in
tracr
ania
lan
d ex
tracr
ania
l cen
tral n
ervo
us sy
stem
repo
rts w
as 6
7 p
erce
nt
How
ever
the
NC
DB
data
in T
able
s 2 th
roug
h 9
are
base
d on
undu
plic
ated
repo
rts
Page
29
Endash
DATA COLLECTION
OF PRIMARY
CENTRAL NERVOUS
SYSTEM TUMORS
TABLE 2 NUMBER AND PERCENT OF PRIMARY INTRACRANIAL AND CENTRAL NERVOUS SYSTEM TUMORS BY TUMOR LOCATION
Locationa CBTRUSb
Number () MCSSc
Number () NCDBd
Number () SEERe
Number ()
Intracranial 13084 (947) 3600 (936) 66322 (955) 10196 (969)
Brain 7999 (579) 1924 (500) 48527 (699) 9721 (924)
Meninges 2719 (197) 838 (218) 9365 (135) 139 (13)
Pituitarycraniopharygealduct
1491 (108) 530 (138) 4958 (71) 30 (03)
Pineal 74 (05) 21 (05) 477 (07) 80 (08)
Other central nervous systemincluding cranial nerves
801 (58) 287 (75) 2995 (43) 226 (22)
Extracranial 730 (53) 245 (64) 3137 (45) 322 (31)
Spinal cord 497 (36) 47 (38) 2395 (34) 313 (30)
Spinal meninges 233 (17) 98 (25) 742 (11) 9 (01)
TOTAL 13814 (100) 3845 (100) 69459 (100) 10518 (100)
Note Reported data are incident cases from 1989-1994 except for CBTRUS data which are from 1990-1993
aRefer to the sites in Appendix BbCentral Brain Tumor Registry of the United States cMinnesota Cancer Surveillance System (microscopically confirmed cases only)dNational Cancer Data Base (limited to cases reported by hospitals that accessioned nonmalignant cases) eSurvival Epidemiology and End results Program (malignant cases only)
Page 30
Endash0
TABL
E 3
RO
W P
ERCE
NT
DIS
TRIB
UTI
ON
OF
PRIM
ARY
INTR
ACR
AN
IAL
AN
D C
ENTR
AL
NER
VO
US
SYST
EM T
UM
ORS
BY
TU
MO
R B
EHA
VIO
RA
ND
MIC
ROSC
OPI
C C
ON
FIRM
ATI
ON
Loca
tiona
CB
TRU
Sb M
CSSc
NC
DB
d SE
ERe
Tota
l Pe
rcen
tM
icro
Co
nfirm
ed
Perc
ent
Not
Mic
ro
Conf
irmed
Tota
l Pe
rcen
tM
icro
Co
nfirm
ed
Perc
ent
Not
Mic
ro
Conf
irmed
Tota
l Pe
rcen
tM
icro
Co
nfirm
ed
Perc
ent
Not
Mic
ro
Conf
irmed
Tota
l Pe
rcen
tM
icro
Co
nfirm
ed
Perc
ent
Not
Mic
ro
Conf
irmed
Intra
cran
ial
130
84
867
13
3
360
0 10
0 N
A
663
22
887
11
3
101
96
871
12
9
Mal
igna
nt
717
1 89
2
108
1
824
100
NA
44
801
91
3
87
101
96
871
12
9
Beni
gn a
ndu n
certa
in
591
3 83
5
165
1
776
100
NA
21
521
83
2
168
N
A
NA
N
A
Bra
in
799
9 88
2
118
1
924
100
NA
48
527
90
2
98
972
1 87
3
127
Mal
igna
nt
686
2 89
6
104
1
746
100
NA
42
622
91
5
85
972
1 87
3
127
Beni
gnan
dun
certa
in
113
7 80
6
194
17
8 10
0 N
A
590
5 80
6
194
N
A
NA
N
A
Extra
cran
ial
730
962
3
8 24
5 10
0 N
A
313
7 96
0
40
322
957
4
3
Mal
igna
nt
242
934
6
6 60
10
0 N
A
148
3 96
6
34
322
957
4
3
Beni
gn a
ndu n
certa
in
488
975
2
5 18
5 10
0 N
A
165
4 95
5
45
NA
N
A
NA
TOTA
Lf 13
814
87
2
128
3
845
100
NA
69
459
89
0
110
10
518
87
4
126
Mal
igna
nt
741
3 89
4
106
1
884
100
NA
46
284
91
5
85
105
18
874
12
6
Beni
gn a
ndu n
certa
in
640
1 84
6
154
1
961
100
NA
23
175
84
1
159
N
A
NA
N
A
Not
e R
epor
ted
data
are
inci
dent
cas
es fr
om 1
989-
1994
exc
ept f
or C
BTR
US
data
whi
ch a
re fr
om 1
990-
1993
a Refe
r to
the
site
code
s in
App
endi
x B
b Cent
ral B
rain
Tum
or R
egist
ry o
f the
Uni
ted
Stat
es
c Min
neso
ta C
ance
r Sur
veill
ance
Sys
tem
(mic
rosc
opic
ally
con
firm
ed c
ases
onl
y)
d Nat
iona
l Can
cer D
ata
Base
(lim
ited
to c
ases
repo
rted
by h
ospi
tals
that
acc
essio
ned
nonm
alig
nant
cas
es)
e Surv
eilla
nce
Epi
dem
iolo
gy a
nd E
nd R
esul
ts Pr
ogra
m (m
alig
nant
cas
es o
nly)
f In
clud
es in
tracr
ania
l and
ext
racr
ania
l cas
es
NA
= N
ot a
pplic
able
Page
31
APPENDIX E
Endash
DATA COLLECTION
OF PRIMARY
CENTRAL NERVOUS
SYSTEM TUMORS
TABLE 4 NUMBER AND PERCENT OF PRIMARY INTRACRANIAL AND CENTRAL NERVOUS SYSTEM TUMORS BY DIAGNOSTIC CONFIRMATION
DiagnosticConfirmation
CBTRUSa
Number () MCSSb
Number () NCDBc
Number () SEERd
Number ()
Positive microscopy
12087 (875) 3845 (100) 61818 (890) 9188 (874)
Radiographywithout microscopy
1306 (95) NA 6759 (97) 1015 (97)
Clinical 204 (15) NA 484 (07) 98 (09)
Unknown 217 (15) NA 398 (06) 217 (21)
TOTAL 13814 (100) 3845 (100) 69459 (100) 10518 (100)
Note Reported data are incident cases from 1989-1994 except for CBTRUS data which are from 1990-1993
aCentral Brain Tumor Registry of the United Statesb Minnesota Cancer Surveillance System (microscopically confirmed cases only) cNational Cancer Data Base (limited to cases reported by hospitals that accessioned nonmalignant cases)dSurveillance Epidemiology and End Results Program (malignant cases only)NA = Not applicable
Page 32
Endash
Page 32
TABLE 4 NUMBER AND PERCENT OF PRIMARY INTRACRANIAL AND CENTRALNERVOUS SYSTEM TUMORS BY DIAGNOSTIC CONFIRMATION
DiagnosticConfirmation
CBTRUSa
Number ()MCSSb
Number ()NCDBc
Number ()SEERd
Number ()
Positivemicroscopy
12087 (875) 3845 (100) 61818 (890) 9188 (874)
Radiographywithout microscopy
1306 (95) NA 6759 (97) 1015 (97)
Clinical 204 (15) NA 484 (07) 98 (09)
Unknown 217 (15) NA 398 (06) 217 (21)
TOTAL 13814 (100) 3845 (100) 69459 (100) 10518 (100)
Note Reported data are incident cases from 1989-1994 except for CBTRUS data which are from 1990-1993
aCentral Brain Tumor Registry of the United Statesb Minnesota Cancer Surveillance System (microscopically confirmed cases only)cNational Cancer Data Base (limited to cases reported by hospitals that accessioned nonmalignant cases)dSurveillance Epidemiology and End Results Program (malignant cases only)NA = Not applicable
APPENDIX E
TABLE 5 NUMBER AND PERCENT OF MALIGNANT PRIMARY INTRACRANIAL AND CENTRAL SYSTEM TUMORS BY TUMOR LOCATION
Locationa CBTRUSb
Number () MCSSc
Number () NCDBd
Number () SEERe
Number ()
Intracranial 7171 (977) 1824 (968) 44801 (968) 10196 (969)
Brain 6862 (926) 1746 (927) 42622 (921) 9721 (924)
Meninges 98 (13) 23 (12) 581 (13) 139 (13)
Pituitarycraniopharyngealduct
37 (05) 13 (07) 189 (04) 30 (03)
Pineal 58 (08) 20 (11) 378 (08) 80 (08)
Other central nervous systemincluding cranial nerves
116 (16) 22 (12) 1031 (22) 226 (21)
Extracranial 242 (33) 60 (32) 1483 (32) 322 (31)
Spinal cord 234 (32) 60 (32) 1410 (30) 313 (30)
Spinal meninges 8 (01) 0 73 (02) 9 (01)
TOTAL 7413 (100) 1884 (100) 46284 (100) 10518 (100)
Note Reported data are incident cases from 1989-1994 except for CBTRUS data which are from 1990-1993
aRefer to the site codes in Appendix BbCentral Brain Tumor Registry of the United States cMinnesota Cancer Surveillance System (microscopically confirmed cases only)dNational Cancer Data Base (limited to cases reported by hospitals that accessioned nonmalignant cases) eSurvival Epidemiology and End Results Program (malignant cases only)
Page 33
Endash
DATA COLLECTION
OF PRIMARY
CENTRAL NERVOUS
SYSTEM TUMORS
TABLE 6 NUMBER AND PERCENT OF PRIMARY INTRACRANIAL AND CENTRAL NERVOUS SYSTEM TUMORS OF BENIGN AND UNCERTAIN BEHAVIOR BY TUMOR LOCATION
Locationa CBTRUSb
Number () MCSSc
Number () NCDBd
Number () SEERe
Number ()
Intracranial 5913 (924) 1776 (906) 21521 (929) NA
Brain 1137 (178) 178 (91) 5905 (255) NA
Meninges 2621 (409) 815 (416) 8784 (379) NA
Pituitarycraniopharyngealduct
1454 (227) 517 (264) 4769 (206) NA
Pineal 16 (02) 1 (lt01) 99 (04) NA
Other central nervous systemincluding cranial nerves
685 (107) 265 (135) 1964 (85) NA
Extracranial 488 (76) 185 (94) 1654 (71) NA
Spinal cord 263 (41) 87 (44) 985 (42) NA
Spinal meninges 225 (35) 98 (50) 669 (29) NA
TOTAL 6401 (100) 1961 (100) 23175 (100) NA
Note Reported data are incident cases from 1989-1994 except for CBTRUS data which are from 1990-1993
aRefer to the site codes in Appendix BbCentral Brain Tumor Registry of the United States cMinnesota Cancer Surveillance System (microscopically confirmed cases only)dNational Cancer Data Base (limited to cases reported by hospitals that accessioned nonmalignant cases) eSurveillance Epidemiology and End Results Program (malignant cases only)NA = Not applicable
Page 34
Endash
APPENDIX E TABLE 7 NUMBER AND PERCENT OF PRIMARY INTRACRANIAL AND CENTRAL
NERVOUS SYSTEM TUMORS BY TUMOR BEHAVIOR AND LOCATION
BehaviorTumor Locationa
CBTRUSb
Number () MCSSc
Number () NCDBd
Number () SEERe
Number ()
Malignant 7413 (537) 1884 (490) 46284 (666) 10518 (100)
Brain 6862 (497) 1746 (454) 42622 (614) 9721 (924)
Meninges 98 (07) 23 (06) 581 (08) 139 (13)
Pituitarycraniopharyn-geal ductpineal
95 (07) 33 (09) 567 (08) 110 (11)
Other central nervous system includingcranial nerves
116 (08) 22 (06) 1031 (15) 226 (22)
Spinal cord 242 (18) 60 (16) 1483 (21) 322 (31)
Benign 5794 (419) 1787 (465) 20694 (298) NA
Brain 803 (58) 99 (26) 4491 (65) NA
Meninges 2565 (186) 807 (210) 8613 (124) NA
Pituitarycraniopharyn-geal ductpineal
1322 (96) 458 (119) 4330 (62) NA
Other central nervous system includingcranial nerves
678 (49) 263 (68) 1911 (28) NA
Spinal cord 426 (31) 160 (42) 1349 (19) NA
Uncertain 607 (44) 174 (45) 2481 (36) NA
Brain 334 (24) 79 (21) 1414 (20) NA
Meninges 56 (04) 8 (02) 171 (02) NA
Pituitarycraniopharyn-geal ductpineal
148 (11) 60 (16) 538 (08) NA
Other central nervous system includingcranial nerves
7 (01) 2 (01) 53 (01) NA
Spinal cord 62 (05) 25 (07) 305 (04) NA
TOTAL 13814 (100) 3845 (100) 69459 (100) 10518 (100)
Note Reported data are incident cases from 1989-1994 except for CBTRUS data which are from 1990-1993 NA=Not applicableaRefer to the site codes in Appendix B bCentral Brain Tumor Registry of the United States cMinnesota Cancer Surveillance System (microscopically confirmed cases only)dNational Cancer Data Base (limited to cases reported byhospitals that accessioned nonmalignant cases eSurvival Epidemiology and End Results Program (malignant cases only)
Page 35
Endash
DATA COLLECTION
OF PRIMARY
CENTRAL NERVOUS
SYSTEM TUMORS
TABLE 8 NUMBER AND PERCENT OF MALIGNANT PRIMARY INTRACRANIAL AND
CENTRAL NERVOUS SYSTEM TUMORS BY HISTOLOGY GROUPINGS
WHO Histologya
Groupings CBTRUSb
Number () MCSSc
Number () NCDBd
Number () SEERe
Number ()
Neuroepithelial 6477 (874) 1689 (896) 39701 (858) 8676 (825)
Tumors of cranial and spinal nerves
12 (02) 3 (02) 108 (02) 25 (02)
Tumors of meninges
137 (18) 25 (13) 994 (21) 194 (18)
LymphomasHemopoietic
473 (64) 121 (64) 3492 (75) 1099 (105)
Germ cell 70 (09) 20 (11) 403 (09) 97 (09)
Cysts and tumor-like lesions
0 0 0 0
Tumors of sellar region
20 (03) 11 (06) 100 (02) 6 (01)
Local extensions 29 (04) 11 (06) 166 (04) 38 (04)
Unclassifiedunassigned tumorsf
195 (26) 4 (02) 1320 (29) 383 (36)
TOTAL 7413 (100) 1884 (100) 46284 (100) 10518 (100)
Note Reported data are incident cases from 1989-1994 except for CBTRUS data which are from 1990-1993
aRefer to the World Health Organization (WHO) histology groupings in Appendix CbCentral Brain Tumor Registry of the United States cMinnesota Cancer Surveillance System (microscopically confirmed cases only)dNational Cancer Data Base (limited to cases reported by hospitals that accessioned nonmalignant cases) f For MCSS unclassifiedunassigned tumors include one malignant and four nonmalignant histologies which were
not listed in the CBTRUS classification scheme For NCDB unclassifiedunassigned tumors include 319 cases(less than one half percent) which had histologies not assigned by CBTRUS to any other category For SEERunclassifiedunassigned tumors include all malignant histologies occurring in the brainCNS which could not beclassified in one of the above categories based on their 4-digit histologic type
Page 36
Endash
APPENDIX E
TABLE 9 NUMBER AND PERCENT OF PRIMARY INTRACRANIAL AND CENTRAL NERVOUS SYSTEM TUMORS OF BENIGN AND UNCERTAIN BEHAVIOR
BY HISTOLOGY GROUPINGS
WHO Histologya
Groupings CBTRUSb
Number () MCSSc
Number () NCDBd
Number () SEERe
Number ()
Neuroepithelial 275 (43) 91 (46) 1064 (46) NA
Tumors of cranial and spinal nerves
980 (153) 397 (202) 2618 (113) NA
Tumors of meninges
3509 (548) 941 (480) 13667 (590) NA
LymphomasHemopoietic
3 (lt01) 0 7 (lt01) NA
Germ cell 4 (lt01) 1 (01) 25 (01) NA
Cysts and tumor-like lesions
15 (02) 3 (02) 34 (01) NA
Tumors of sellar region
1444 (226) 510 (260) 4749 (205) NA
Local extensions 0 0 0 NA
Unclassifiedunassigned tumorsf
171 (27) 18 (09) 1011 (44) NA
TOTAL 6401 (100) 1961 (100) 23175 (100) NA
Note Reported data are incident cases from 1989-1994 except for CBTRUS which is 1990-1993
aRefer to the World Health Organization (WHO) histology groupings in Appendix CbCentral Brain Tumor Registry of the United States c Minnesota Cancer Surveillance System (microscopically confirmed cases only) dNational Cancer Data Base (limited to cases reported by hospitals that accessioned nonmalignant cases) eSurvival Epidemiology and End Results Program (malignant cases only)dFor MCSS unclassifiedunassigned tumors include one malignant and four nonmalignant histologies which werenot listed in the CBTRUS classification scheme For NCDB unclassifiedunassigned tumors include 319 cases(less than one half percent) which had histologies not assigned by CBTRUS to any other category For SEERunclassifiedunassigned tumors include all malignant histologies occurring in the brainCNS which could not beclassified in one of the above categories based on their 4-digit histologic typeNA = Not applicable
Page 37
Endash
DATA COLLECTION
OF PRIMARY
CENTRAL NERVOUS
SYSTEM TUMORS
TABLE 10 METHOD OF CASE FINDING FOR PRIMARY INTRACRANIAL AND CENTRAL NERVOUS SYSTEM TUMORS BY TUMOR BEHAVIOR AND LOCATION MINNESOTA 1989-1994
Behavior Tumor Locationa
Number of Cases
Percent Found byRoutine
Reporting
Percent Found by Special Efforts
Malignant Brain Cerebral meninges
Pituitarycranio duct pineal Other intracranial
18841746 23 33
22
961 965 957 939
864
39 35 43 61
136 Extracranial 60 883 117 Benign Brain
1787 99
788 838
212 162
Cerebral meninges Pituitarycranio duct
pineal Other intracranial
807 458
263
843 740
779
157 260
221 Extracranial 160 631 369 Uncertain 174 856 144 Brain 79 823 177 Cerebral meninges Pituitarycraniopharyn- geal ductpineal Other intracranial
8 60
2
875 850
1000
125 150
00 Extracranial 25 960 40
TOTAL 3845 876 124
aRefer to the site codes in Appendix B
Page 38
Endash
1989 1990 1991 1992 1993 1994
TOTAL
APPENDIX E TABLE 11 METHOD OF CASE FINDING FOR INTRACRANIALa TUMORS BY DIAGNOSIS YEAR MINNESOTA 1989-1994
DiagnosisYear
Number of
Cases
Percent Found byRoutine
Reporting
Percent Found by
Special Efforts
571 837 163 616 865 135 586 913 87 602 899 101
633 872 128 592 929 71
3600 886 114
aIncludes the brain cerebral meninges pituitary gland pineal gland and otherintracranial tumors (refer to the site codes in Appendix B)
Page 39
Endash
DATA COLLECTION
OF PRIMARY
CENTRAL NERVOUS
SYSTEM TUMORS
TABLE 12 METHOD OF CASE FINDING FOR NONMALIGNANT INTRACRANIALa TUMORS BY TYPE OF FACILITY MINNESOTA 1989-1994
Type of Facility Number of Tumors Percent Found byRoutine
Reporting
Percent Found by Special Efforts
Registry at facility No registry at facility
1451325
859 569
141 431
TOTAL 1776 806 194
aIncludes tumors with benign or uncertain behavior that involve the brain cerebral meningespituitary gland pineal gland or other intracranial sites (refer to the site codes in Appendix B)
TABLE 13 REPORTING METHOD AND SOURCE OF CASE FINDING FOR NON- MALIGNANT INTRACRANIALa TUMORS DIAGNOSED IN HOSPITALS WITH A TUMOR REGISTRY MINNESOTA 1989-1994
Reporting Method Number of Tumors Percent Found byRoutine
Reporting
Percent Found by
Special Efforts
Registry-reportedLaboratory-reported
1226225
925 502
75 498
TOTAL 1451 859 141
aIncludes tumors with benign or uncertain behavior that involve the brain cerebral meningespituitary gland pineal gland or other intracranial sites (refer to the site codes in Appendix B)
Page 40
Endash0
APPENDIX E TABLE 14 HOSPITAL REGISTRY ACCESSIONING OF MALIGNANT AND NON-
MALIGNANT PRIMARY INTRACRANIAL AND CENTRAL NERVOUS SYSTEM TUMORS NCDB 1989-1994
TUMOR Totalb
BEHAVIOR Malignant c Nonmalignantd
Tumor Locationa HospitalsReporting
Number ()
Hospitals Reporting
Number ()
Hospitals Reporting
Number ()
Intracranial 1542 (100) 1526 (100) 900 (99)
Brain 1527 (99) 1519 (gt99) 754 (83)
Meninges 740 (48) 390 (26) 613 (67)
Pituitaryglandcraniopharyn-
geal duct
602 (39) 168 (11) 538 (59)
Pineal gland 319 (21) 277 (18) 79 (9)
Other central nervous system including cranial
nerves
648 (42) 545 (36) 299 (33)
Extracranial 812 (53) 708 (46) 410 (45)
Spinal cord 760 (49) 692 (45) 311 (34)
Spinal meninges 299 (19) 72 (5) 258 (28)
TOTAL Hospitals 1542 (100) 1526 (100) 913 (100)
Note The number of hospitals in each of the second third and fourth columns is the number that submittedreports to the NCDB for any intracranial and central nervous system tumors for the respective malignancystatus Not all hospitals submitted reports for each year during the study period (1989-1994)
aRefer to the site codes in Appendix B bBehavior codes = 0 1 3 cBehavior code = 3 dBehavior codes = 0 1
Page 41
Endash
DATA COLLECTION
OF PRIMARY
CENTRAL NERVOUS
SYSTEM TUMORS
Texas Cancer Registry
1997 CBTRUS State Survey of Benign Brain Tumor Data Collection
State Collection Status
Currently Collecting Benign Tumor Data1 Arizona Cancer Registry since 1981 2 Colorado Central Cancer Registry since 1988 3 Connecticut Tumor Registry since 1965 4 Idaho Cancer Data Registry since 1970 5 Maine Cancer Registry since 1983 6 Massachusetts Cancer Registry since 1982 7 Minnesota Cancer Surveillance System since 1988 8 Montana Central Tumor Registry since 1979 9 New York State Cancer Registry since 1988
10 North Carolina Central Cancer Registry since 1990 11 Utah Cancer Registry since 1966 12 Virginia Cancer Registry since 1994 13 Delaware State Cancer Registry14 Washington State Cancer Registry since 1992 15 passive collection 1979-1994
active collection since 1995
Stopped or Passive Collection of Benign Tumor Data1 New Jersey State Cancer Registry stopped 1979-1995 2 Kansas Cancer Registry stopped 1969-1995 3 New Hampshire State Cancer Registry stopped 1986-1991 4 District of Columbia Cancer Registry stopped 1997 5 Wyoming Cancer Surveillance Program stopped 111996 6 Louisiana Tumor Registry stopped 1992 (passive collection) 7 Illinois State Cancer Registry stopped 111996 8 Missouri Cancer Registry passive collection since 1984 9 South Carolina Central Cancer Registry passive collection since 1996
Beginning Collection of Benign Tumor Data1 North Dakota Cancer Registry began collection 1997 2 Rhode Island Cancer Registry began collection 1998
Page 42
Endash
APPENDIX E
Codes for Primary Intracranial and Central Nervous System Tumors
Note For this report the designation of ldquoprimary intracranial and central nervous system tumorsrdquo includes thefollowing primary tumors of central nervous system sites as well as tumors of the pituitary and pinealglands All histology types within the topography codes are included in the designation of ldquoprimaryintracranial and CNS tumors The source for the topography codes is Percy C Van Holten V Muir Ceds International Classification of Diseases for Oncology Second Edition Geneva World Health Organization 1990
Intracranial tumors
Brain C710 Cerebrum C711 Frontal lobe C712 Temporal lobe C713 Parietal lobe C714 Occipital lobe C715 Ventricle NOSC716 Cerebellum NOS C717 Brain stem C718 Overlapping lesion of brain C719 Brain NOS
Meninges C700 Cerebral meninges C709 Meninges NOS
a
Cranial Nerves and other intracranial parts of the central nervous systemC722 Olfactory nerve C723 Optic nerve C724 Acoustic nerve C725 Cranial nerve NOS C728 Overlapping lesion of brain and central nervous system C729 Nervous system NOS
Other endrocrine glands and related structures C751 Pituitary gland C752 Craniopharyngeal duct C753 Pineal gland
Extracranial tumors
Spinal cord C720 Spinal cord C721 Cauda equina
Meninges C701 Spinal meninges
aNOS=Not Otherwise Specified
Page 43
Endash
DATA COLLECTION
OF PRIMARY
CENTRAL NERVOUS
SYSTEM TUMORS
Brain Tumor Histology Groupings
The following histology groupings were used for the primary intracranial and central nervoussystem tumors The source for the histology groupings is Central Brain Tumor Registry ofthe United States (CBTRUS) 1996 Statistics Report Table 4
WHOa HISTOLOGY GROUPINGS ICD-Ob MORPHOLOGY CODE
Diffuse astrocytoma (protoplasma fibrillary) 9410 9420 Anaplastic astrocytoma 9401 9411 Glioblastoma 9440 9441 9442 Pilocytic astrocytoma 9421 Unique astrocytoma variants 9383 9384 9424 Oligodendroglioma 9450 Anaplastic oligodendroglioma 9451 9460 Ependymomaanaplastic ependymoma 9391 9392 9393 Ependymoma variants 9394 Mixed glioma 9382 Astrocytoma NOSc 9400 Glioma malignant NOS 9380 Choroid plexus 9390 Neuroepithelial 9381 9423 9430 Benign neuronalglial neuronal and mixed 86801 8693 9490 9505 9506 Malignant neruonalglial neuronal and mixed 86803 9364 9490 9500 Pineal parenchymal 9360 9361 9362 Embryonalprimitivemedulloblastoma 8963 9470 9471 9472
9473 9501 9502 9503 9510
TUMORS OF NEUROEPITHELIAL TISSUE
TUMORS OF CRANIAL AND SPINAL NERVES Nerve sheath benign and malignant 9540 9550 9560 9570
TUMORS OF THE MENINGES Meningioma 9530 9531 9532 9533 9534 9537 9538 Other mesenchymal benign and malignant 8800 8801 8802 8803 8810 8830 8850 88618900
8910 8990 9133 9150 9240 9480 9481 9536 9539 Hemangioblastoma 9161 9535
LYMPHOMAS AND HEMOPOIETIC NEOPLASMS Lymphoma 9590 9591 9593 9594 9595 9630 9650 9652
9663 9670 9671 9672 9674 9675 9680 9681 9682 9684 9685 9686 9687 9690 9691 96939695 9696 9698 9702 9714 9723 9731 9766 9970
GERM CELL TUMORS Germ cell 8020 9060 9064 9070 9071 9080 9084 9085 9100
CYSTS AND TUMOR-LIKE LESIONS Cysts and heterotopias 9084
TUMORS OF THE SELLAR REGION Pituitary 8040 8l40 8l46 8260 8270 8271 8280
8281 8290 8300 8330 8323 8333 Craniopharyngioma 9350
Page 44
Endash
APPENDIX E
LOCAL EXTENSIONS FROM REGIONAL TUMORS Chordomachondrosarcoma 9370
UNCLASSIFIED TUMORS Hemangioma 9120 9121 9130 9131 Neoplasm benign 80000 8010 Neoplasm uncertain behavior 80001 80011 Neoplasm malignant 80003 80013 8002 8003 All other 8720 9580
aWHO = World Health OrganizationbICD-O = International Classification of Diseases for Oncology Second Edition 1990 cNOS=Not Otherwise Specified
Page 45
Endash
DATA COLLECTION
OF PRIMARY
CENTRAL NERVOUS
SYSTEM TUMORS
Endash
International Classification of Childhood Cancer (ICCC)
Diagnostic Group
ICD-Oa codes
Morphology Topography
I LEUKAEMIA
(a) Lymphoid leukaemia 9820-9827 9850
(b) Acute non-lymphocytic leukaemia 9840 9841 9861 9864 9866 9867 98919894 9910
(c) Chronic myeloid leukaemia 9863 9868
(d) Other specified leukaemias 9830 9842 9860 9862 9870-9890 9892 98939900 9930-9941
(e) Unspecified leukaemias 9800-9804
II LYMPHOMAS AND OTHER RETICULOENDOTHELIAL NEOPLASMS
(a) Hodgkinrsquos disease 9650-9667
(b) Non-Hodgkinrsquos lymphoma 9591-9595 9670-9686 9690-9714 9723
(c) Burkittrsquos lymphoma 9687
(d) Miscellaneous lymphoreticular neoplasms 9720 9731-9764
(e) Unspecified lymphomas 9590
III CENTRAL NERVOUS SYSTEM (CNS) ANDMISCELLANEOUS INTRACRANIAL AND
INTRASPINAL NEOPLASMSb
(a) Ependymomac 9383 9390-9394
(b) Astrocytoma 9380 C723
9381 9400-9441
(c) Primitive neuroectodermal tumours 9470-9473
(d) Other gliomasd 9380 C700-C722C724-C729
9382 9384
9442-9460 9481
APPENDIX E
Diagnostic Group
ICD-Oa codes
Morphology Topogragphy
III CNS AND MISCELLANEOUS INTRACRANIAL AND INTRASPINAL
NEOPLASMSb Continued
(e) Miscellaneous intracranial and intraspinalneoplasmsc
8270-8281 8300 9350-9362 9480 95059530-9539
(f) Unspecified intracranial and intraspinalneoplasmsc
8000-8004 C700-C729C751-C753
IV SYMPATHETIC NERVOUS SYSTEM TUMOURS
(a) Neuroblastoma and ganglioneuroblastoma 9490 9500
(b) Other sympathetic nervous system tumours 8680 8693-8710 9501-9504 9520-9523
aInternational Classification of Diseases for Oncology Second Edition World Health Organization 1990bGroup III excludes all lymphomas See group II cBehaviour codes 0 and 1 are included dBehaviour code 1 is included
Page 47
Endash
Comments and recommendations are welcome Should questions arise on how to use these
materials or for more information please contact
Centers for Disease Control and Prevention National Program of Cancer Registries
4770 Buford Hwy NE Mail Stop K-53
Atlanta GA 30042-3717
Voice Information System 1 (888) 842-6355 bull Fax (770) 488-4760
cancerinfocdcgov bull httpwwwcdcgovcancer
All materials are in the public domain and may be reproduced or copied without permission citation
to source however is appreciated
BACK COVER
(WHITE)
Spine(WHITE)
DATA COLLECTION OF PRIMARY CEN
TRAL NERVOUS SYSTEM
TUM
ORS 2004
National Program of Cancer Registries Training M
aterials

DATA COLLECTION
OF PRIMARY
CENTRAL NERVOUS
SYSTEM TUMORS
Endash
not all of the morphology codes in the current ICD-O classification used by cancer registries are
consistent with the recent World Health Organization (WHO) brain tumor codes34 The recent
WHO brain tumor classification has new terms that are not included in ICD-O-2 however a new
third edition to ICD-O may include these terms ICD-O-2 also includes terms which are not
categorized by WHO
The CNS environment also contributes to the difficulty in characterizing tumors that
involve this site In contrast to tumors arising in other organ systems the terms benign and
malignant are only relative distinctions for CNS neoplasms Depending on location
histologically benign CNS tumors can result in similar or worse outcomes compared with
malignant tumors For these and other reasons classic oncologic concepts predicated on
histologic grade nodal status and staging strategies are not entirely applicable to tumors of the
CNS5
When the BTWG discussed whether to consider anatomic sites other than the brain for
this report the unique features of the CNS and the morbidity and mortality associated with non-
CNS intracranial tumors were closely examined For the sake of simplicity in reporting and
analyzing data for all of these sites the designation of primary intracranial and CNS tumors was
suggested This designation proposed by Walker et al6 is used by the Central Brain Tumor
Registry of the United States (CBTRUS) and includes the brain cerebral meninges cranial
nerves pituitary gland craniopharyngeal duct pineal gland spinal cord cauda equina and spinal
meninges The intracranial sites are the brain cerebral meninges cranial nerves and other
intracranial parts of the CNS the craniopharyngeal duct and the pineal and pituitary glands The
extracranial sites are the spinal cord cauda equina and spinal meninges The BTWG also included
lymphomas in the histology groupings for these sites The topography codes for the sites are in
Appendix B and the histology groupings are listed in Appendix C In this report no distinctions
are made between different age groups for intracranial and CNS tumors
Incidence
The age-adjusted incidence rate for malignant brain and other CNS tumors in the US
for 1991-1995 was 61 per 100000 person years7 Approximately 17400 new cases will be
diagnosed in 19988 The incidence of nonmalignant brain and other CNS tumors is difficult to
Page 12
APPENDIX E ascertain because few cancer registries collect or report these data However CBTRUS
reported an incidence rate for all primary brain and CNS tumors including the pituitary and
pineal glands of 118 per 100000 for 1990-19939 the organization also estimated that 28600
new cases of primary malignant and benign brain tumors were diagnosed nationwide in
199510 For both men and women rates for malignant and nonmalignant brain tumors decline
after a peak in childhood (younger than 10 years) increase after age 25 and stabilize after age
75 overall rates are higher for males11
Although the Surveillance Epidemiology and End Results (SEER) Program reported
a 28 percent decrease in the incidence of invasive brain and other nervous system cancer from
1991 to19957 within the last decade there have been many reports of dramatic increases in the
incidence of brain tumors12-21 particularly among children2223 and the elderly121617 Some
consider the increased rates as histology-specific14 and indicative of a true shift in incidence13
Other studies have concluded that many of the new cases are an artifact of changing
diagnostic procedures1617 In the US the discussion regarding the increased incidence of brain
tumors has been limited to rates for malignant tumors Standard reporting practices would aid
in the interpretation of time trends
Molecular studies24-26 have demonstrated that some low grade or benign intracranial
tumor subtypes transform to malignant tumors To understand the factors that might
contribute to this transformation and whether incidence rates for both malignant and
nonmalignant intracranial tumors are affected the full spectrum of the disease needs to be
observed
Mortality
Brain tumors regardless of behavior are the second leading cause of death from
neurological disease27 In 1995 malignant brain tumors accounted for 12062 deaths and
947 deaths were due to benign brain tumors Another 131 deaths were reported for brain
tumors of uncertain behavior and 2788 persons died of brain tumors for which the behavior
was unspecified28 The estimated number of deaths in 1998 due to malignant brain and other
CNS tumors is 133008 Increased mortality rates for malignant brain tumors particularly
among the elderly have been reported One study concluded that the increases were largely
Page 13
Endash
DATA COLLECTION
OF PRIMARY
CENTRAL NERVOUS
SYSTEM TUMORS
Endash
related to better diagnostic technology and the introduction of support programs such as
Medicare that facilitate diagnostic procedures in the elderly17 Another study attributed the
rising primary malignant brain tumor mortality to differential survival and its effect on the
surviving gene pool in an aging population28
Survival
Prognosis for CNS tumors depends on at least four variables tumor histopathology
anatomic location patient age and neurologic status5 According to a recent analysis using
SEER data from 1973-1991 overall survival rates for malignant brain tumors and rates for
patients with three specific histological types -- astrocytoma medulloblastoma and
oligodendroglioma -- improved29 Few data are available for survival rates for nonmalignant
primary intracranial and CNS tumors However Surawicz et al used data from the National
Cancer Data Base (NCDB) a joint project of the Commission on Cancer (COC) of the
American College of Surgeons (ACoS) and the American Cancer Society to examine survival
rates for patients diagnosed from 1985-1988 and from 1990-1992 with malignant or benign
brain tumors30 NCDB collects data from hospital tumor registries Based on the records of
more than 60000 patients the authors found a 216 percent 5-year survival rate for patients
with malignant tumors and a 724 percent rate for those with benign tumors The most
favorable prognosis was associated with neurilemmomas pilocytic astrocytomas and
meningiomas In contrast microgliomas lymphomas malignant gliomas and anaplastic
astrocytomas were associated with a poor outcome Surawicz et al also found variations in
survival for some tumors depending on location For example survival rates for
glioblastomas which generally have a poor prognosis improved if the tumors were located in
the cerebellum similarly astrocytomas and anaplastic astrocytomas were associated with a
better outcome if the tumors were in the ventricles or the cerebellum
Risk Factors
Although malignant and nonmalignant intracranial and CNS tumors have undergone
considerable study etiologic and pathophysiologic details concerning their genesis remain
obscure Definite genetic predispositions for the development of brain tumors have been
identified however population-based studies suggest that no more than 4 percent of these
Page 14
APPENDIX E tumors can be attributed to heredity 31 Several environmental carcinogens may be associated
with brain tumors including ionizing radiation11 electromagnetic fields32 and pesticides33
sustained exposure to vinyl chlorides polycyclic hydrocarbons and nitrosoureas has been
implicated as well5 Also the presence of the Epstein-Barr virus contained in the DNA of
primary lymphoma suggests that a viral etiology for human brain tumors cannot be entirely
ignored5 Accurate and complete data are necessary to develop hypotheses to identify the
causes of intracranial and CNS tumors The heterogeneity of brain tumors may mask the
identification of causes when histology-specific studies are limited by the number of available
cases
Surveillance
Population-based cancer registries generally provide incidence rates and trends for
cancer surveillance purposes and support related clinical and epidemiological research To
receive accreditation from the COC hospital cancer registries are required to report only
in situ and primary malignant tumors for all sites including the brain and other CNS sites34
Because data collection for nonmalignant intracranial and CNS tumors is not standardized at
either the central tumors can be attributed to heredity or hospital registry level collecting data
for all primary intracranial tumors is a challenge
In 1997 CBTRUS conducted a state survey (Appendix A) of benign brain and other
CNS tumor collection35 This survey gathered information from 64 member registries of the
North American Association of Central Cancer Registries (NAACCR) representing 48 states
All 64 of the registries collected data for primary malignant brain and other CNS tumors
however only 15 state registries collected data for nonmalignant (ie benign) tumors at the
time of the survey Seven state registries had stopped collecting data for benign brain and
other CNS tumors three collected the data passively one had started to collect the data in
1997 and one planned to start in 1998The majority of the registries surveyed indicated that
the requirements of their brain and other CNS tumor data collection had not been altered in
the past 5 years
Page 15
Endash
DATA COLLECTION
OF PRIMARY
CENTRAL NERVOUS
SYSTEM TUMORS
Endash
METHODS
To analyze available data on issues related to the collection of data for primary
intracranial and CNS tumors the BTWG examined surveillance data from CBTRUS the
Minnesota Cancer Surveillance System (MCSS) NCDB and SEER (Table 1) The NCDB
includes cases from all 50 states the District of Columbia and Puerto Rico however it is not
population-based CBTRUS MCSS and the SEER Program are population-based registries
that cover selected areas of the US Three SEER areas collect information for benign and
uncertain (ie nonmalignant) brain tumors but they do not report it Currently however
there are no standard definitions for the collection of site and type among the areas CBTRUS
MCSS and NCDB collect information on both malignant and nonmalignant primary brain
tumors Because the accessioning of nonmalignant cases for NCDB is not required by COC
only 59 percent of the hospitals that submitted any data to NCDB on intracranialCNS cases
diagnosed during 1989-1994 submitted nonmalignant cases The NCDB data reported here
are restricted to those hospitals that reported at least one nonmalignant case as these cases
were thought to contribute most toward the purpose of this report Also although MCSS
collects data for both malignant and nonmalignant tumors it does so for microscopically-
confirmed cases only This registry performs 100-percent case finding audits in all pathology
laboratories in Minnesota
Data inclusion criteria were developed as specified in Appendix B and all four of the
resources (ie CBTRUS MCSS NCDB SEER) developed subsets of their currently
available data according to the agreed-upon inclusion criteria Frequencies and proportions
were computed to reflect variations in factors other than site and the resulting contrasts
across these registries broadly reflect data collection practices For example the primary
difference in brain and CNS definition between SEER and CBTRUS lies in reporting by
behavior with the latter including all nonmalignant tumors As such differences in
proportions between these two registries approximately reflect the magnitude of nonmalignant
brain and CNS tumors Similarly the primary difference in brain and CNS definition between
MCSS and CBTRUS is that the former requires microscopic confirmation of all tumors and
the latter includes clinically and radiologically diagnosed tumors Another important difference
Page 16
APPENDIX E between MCSS and CBTRUS is that MCSS uses a more active method for case finding
Therefore differences in proportions reported reflect the interaction between the magnitude of
nonmicroscopically diagnosed tumors and the magnitude of incomplete case finding of certain
tumor types in CBTRUS Finally the primary difference between NCDB and CBTRUS is that
the former is a hospital-based reporting system and the latter is a population-based reporting
system Therefore differences in proportions may largely reflect referral biases inherent in
hospital reporting systems While other data collection practices may influence information in
these data resources these data bases were selected to highlight the variation in current
information on primary brain and CNS tumors that arises without a standard definition
Frequencies were computed using ICD-O codes for topography (ie location)
behavior diagnostic confirmation histology and selected combinations of behavior and
topography codes Topography was broadly defined into two main categories with
subcategories as shown in Appendix B Intracranial tumors included tumors located in the
brain and other CNS regions (including the cranial nerves) in the meninges and in the
pituitary and pineal glands Extracranial tumors included those located in the spinal cord and
spinal meninges The distinction between intracranial and extracranial tumors was removed for
Table 7 by collapsing brain and spinal meninges into one category and combining the pituitary
and pineal glands into one group (as these regions have endocrine functions) to allow for
adequate numbers within categories of behavior For Table 10 the intracranial and extracranial
distinction was maintained however the pituitary and pineal glands were collapsed into one
category and the spinal cord and spinal meninges were collapsed into the extracranial
category
Behavior was coded using ICD-O categories 0 for benign 1 for uncertain and 3 for
malignant with the first two of these categories collapsed into a nonmalignant category
Microscopic confirmation is based on the SEER definition and grouped into positive
microscopic confirmation radiography without microscopy clinical and unknown These
categories were further grouped as microscopically confirmed and as not microscopically
confirmed for the analysis in Table 3
Page 17
Endash
DATA COLLECTION
OF PRIMARY
CENTRAL NERVOUS
SYSTEM TUMORS
Endash
CBTRUS developed preliminary histology groupings with the aim of improved clinical
relevance ICD-O morphology codes which are used by cancer registries were grouped
based on WHO categories for brain tumors The details of these groupings are shown in
Appendix C
RESULTS
Percentages of Primary Intracranial and CNS Tumors by Tumor Location and by
Microscopic Confirmation
Intracranial tumors comprise more than 94 percent of primary intracranial and CNS
tumors and between 50 and 92 percent of primary intracranial and CNS tumors occur in the
brain (Table 2) The data in this report also show that a slightly greater percentage of
malignant intracranial tumors including malignant brain tumors are microscopically
confirmed compared with corresponding tumors of benign or uncertain behavior (Table 3)
However regardless of tumor behavior the percentages of extracranial CNS tumors that are
microscopically confirmed are higher than the percentages of intracranial tumors that are
confirmed by pathologists (Table 3) Few primary intracranial and CNS tumors are not
microscopically confirmed approximately 11 percent of diagnoses are based only on a clinical
or radiographical (without microscopy) assessment (Table 4)
Percentages of Malignant and of Nonmalignant Intracranial and CNS Tumors by Location
The relative distribution of nonmalignant intracranial and CNS tumors varies by
primary site While greater than 90 percent of malignant intracranial and CNS tumors occur
in the brain (Table 5) only 9 to 26 percent of the nonmalignant tumors occur as parenchymal
tumors (Table 6) Nonmalignant tumors comprised a significant portion of the primary
intracranial and CNS tumors reported by the sources The ratios of nonmalignant to primary
malignant intracranial and CNS tumors reported by CBTRUS MCSS and NCDB were 09
10 and 05 respectively (Table 7)
Percentages of Malignant and of Nonmalignant Intracranial and CNS Tumors by Histology
Among the malignant primary intracranial and CNS tumors neuroepithelial (ie
astrocytic) tumors represent 83 to 90 percent of the cases depending on the data source
Page 18
APPENDIX E lymphomashemopoietic tumors 6 to 11 percent tumors of the meninges 1 to 2 percent and
tumors of cranial and spinal nerves 02 percent (Table 8) For nonmalignant primary
intracranial and CNS tumors tumors of the meninges represent 48 to 59 percent of the cases
tumors of the sellar region (including pituitary tumors and craniopharyngiomas) 21 to 26
percent tumors of cranial and spinal nerves 11 to 20 percent and neuroepithelial tumors 4 to
5 percent (Table 9)
Percentages of Primary Intracranial and CNS Tumors by Method of Case Finding (MCSS)
Case finding audits by the MCSS occur on an annual basis in all pathology laboratories in
Minnesota and include the review of surgerypathology cytology autopsy and hematology
records These audits enable the registry to ensure that there is complete reporting of cases of
malignant and nonmalignant tumors In tables 10 through 13 data from MCSS on primary
intracranial and CNS tumors are presented by method of case finding The two methods of case
finding are routine reporting and special efforts A case was found by routine reporting if one
or more reports received before the close-out date for a given diagnosis year was initiated by a
hospital or nonhospital facility In contrast a case was found by special efforts if all reports of that
case received before the close-out date were requested as a result of pathology laboratory audits
The data in Table 10 indicate that routine reporting of nonmalignant tumors was less complete
compared with reporting for malignant tumors The percentages of intracranial tumor cases that
were found by special efforts have varied from year to year but the trend suggests that routine
reporting may be improving (Table 11) The greatest improvement has been in the coverage of
nonbrain parenchymal tumors (ie pituitarypineal and other intracranial) The small numbers of
autopsy-only tumors were more likely to be found by special case finding efforts than by other
methods of microscopic confirmation (data not shown)
Most hospitals in Minnesota have cancer registries through which their tumor cases are
reported However some of the cases that are seen at hospitals with registries are reported only
through pathology laboratories affiliated with the hospitals Approximately 80 percent
(14511776) of the cases of nonmalignant intracranial tumors in the MCSS data base were
reported by hospitals with registries (Table 12) eighty-five percent (12261451) of these cases
were reported by the hospitals registries (Table 13)The remaining 15 percent (2251451) of the
Page 19
Endash
DATA COLLECTION
OF PRIMARY
CENTRAL NERVOUS
SYSTEM TUMORS
Endash0
cases were reported through the pathology laboratories affiliated with the hospitals with registries
(ie they were not accessioned by the registries) (Table 13) The percentages of cases of
nonmalignant tumors that were reported only by the pathology laboratories at facilities having
cancer registries can be viewed as a measure of how frequently the registries failed to accession
the cases Of the 225 nonaccessioned tumors half would have been missed without the MCSS
case finding audits of pathology laboratories (Table 13)
Percentages of Hospital Cancer Registries That Accessioned Malignant and Nonmalignant
Intracranial and CNS Tumors (NCDB)
Based on data from NCDB more than 1500 hospitals accessioned cases with either
malignant or nonmalignant intracranial and CNS tumors and approximately 800 hospitals
accessioned extracranial cases Cases with tumors that involved the cranial or spinal meninges or
the pituitary gland were more likely to be reported by hospitals that accessioned nonmalignant
primary intracranial and CNS tumors than by hospitals that accessioned only malignant tumors
(Table 14)
DISCUSSION
The findings for this report indicate that collection and reporting of incidence data for
primary malignant intracranial and other CNS tumors are well standardized However substantial
variation exists in the processes of collecting and reporting nonmalignant tumor data One
obstacle is that not all hospitals have cancer registries Another problem is that not all hospitals
with registries accession cases of nonmalignant tumors Data from Minnesota (Table 13) suggest
that approximately 85 percent of cases of nonmalignant intracranial tumors are accessioned by
hospital registries However nonaccessioned CNS cases are less likely to be routinely reported to
the central registry (Table 13) These differences in collection and reporting practices among the
registries make it difficult to assess the burden of primary intracranial and CNS tumors
Terminology for describing intracranial and CNS tumors is also not standardized For
example although the pituitary gland and pineal glands are not technically part of the CNS
tumors that involve these organs are often included in the term CNS tumors On the other hand
some consider the eye to be intracranial however CNS tumors generally do not include the
Page 20
APPENDIX E eyes Although the World Health Organization (WHO) has published a list of histologic
groupings at present no single comprehensive list of histologic groupings exists for intracranial
and CNS tumors Since the International Classification of Childhood Cancer (ICCC) is based on
histologic type rather than site certain benign histologies of sites other than brainCNS (eg non-
CNS ependymomas) would not be included in the BTWGs primary intracranial and CNS
histology groupings (Appendix D) Thus the variation in incidence estimates of primary
intracranial and CNS tumors may be attributable in part to the variation in the definitions of
these tumors In addition differences in cancer registry training and procedures may contribute to
nonreporting and inconsistent reporting of the tumors
The BTWG discussed the feasibility of conducting a random sampling procedure as an
alternative to complete enumeration and ongoing surveillance of nonmalignant brain tumors It
was agreed that this technique would not be valid or feasible for the following reasons
1 If a random sample of incident brain tumors were desired a complete list would be
needed first (a sampling frame is required)
2 If a survey method were used to identify brain tumors in the general population (eg
random digit dialing or other general population survey techniques) the information
needed could not be obtained for several reasons
- Either a prohibitively large numbers of individuals would have to be surveyed or
else only a very small number of brain tumors could be identified given the rarity
and sometimes short survival time
- The brain tumors identified would not be representative of all brain tumors that
occur because people who had survived their brain tumors would be more
likely to be identified
- The incidence rate would still not be known since cross-sectional surveys only
identify disease prevalence
3 If a sample of hospitals were selected to contribute data the tumors included would not
represent the entire spectrum of brain tumors because those that were diagnosed and
treated outside of the hospital setting would be excluded
Page 21
Endash
DATA COLLECTION
OF PRIMARY
CENTRAL NERVOUS
SYSTEM TUMORS
Endash
An alternative approach to sampling and the least troublesome would be to conduct
population-based surveillance only in certain geographic areas of the country If one assumes that
the etiology of brain tumors does not differ from one area of the country to another then the
scientific validity of studies based on this type of sampling would not be a problem However
given the rarity of some types of brain tumors sufficient numbers for study may not be available
unless the vast majority of the nations population were covered by population-based data
collection Also geographic areas without population-based surveillance would have no data to
use for assessing local trends or variations in brain tumor occurrence
In the absence of standard tumor registration procedures and training special case finding
efforts by central registries may be necessary to ensure that complete data are collected for
nonmalignant intracranial and CNS tumors Data from MCSS (Table 10) which has a legal
requirement for reporting nonmalignant intracranial tumors and performs 100 percent case finding
audits in all laboratories indicate that only 80 percent of nonmalignant tumors were routinely
reported In contrast routine reporting accounted for more than 95 percent of malignant
intracranial and CNS tumors Nonmalignant cases in Minnesota that were not accessioned by
hospital registries had a 50 percent chance of being routinely reported to the central registry
however these were only microscopically confirmed cases
Completeness of reporting is critical to cancer registries Accurate case counts are
necessary to assess the burden of cancer to guide cancer control program planning to prioritize
the allocation of health resources and to facilitate epidemiologic research Most central cancer
registries have state laws that mandate reporting of cases by physicians and by hospitals
laboratories and other facilities that provide screening diagnostic or therapeutic services
Complete reporting of nonmalignant intracranial and CNS tumors would be greatly
improved if reporting requirements of the COC central cancer registries SEER and the
National Program of Cancer Registries (NPCR) were changed to require the collection of
information for these tumors However this requirement would have many implications
including an increase in work load as well as associated costs for reporting facilities An estimated
14 percent of all new cancer cases diagnosed in 1998 will involve invasive brain and other
nervous system tumors7 since the numbers of benign and invasive brain and other CNS tumors
Page 22
Endash
APPENDIX E diagnosed annually are similar facilities that presently do not accession nonmalignant cases could
expect an approximately 14 percent increase in the total number of CNS cases collected by the
registry Some estimates of the percentage of brain tumors have been lower (05 percent)36 and
others have been higher (9 percent)37 therefore the extent to which the workload would be
affected may vary The data in this report suggest that if reporting of nonmalignant intracranial
and CNS tumors were required the total number of cases of tumors for these anatomic sites
would double for facilities that presently report only malignant tumors This is consistent with the
findings of Davis et al36 who reported that the incorporation of benign brain tumors into the
cancer-reporting systems of four central registries increased the overall incidence of brain cancer
by 49 percent Forty percent (913) of the hospital registries that submitted data to the NCDB did
not report nonmalignant brain tumors These registries could expect up to a 50 percent increase in
the number of intracranial and CNS tumors reported nonregistry facilities which represent
approximately 20 percent of cases reported to central cancer registries could expect a similar
increase Also central cancer registries that currently do not require reporting of nonmalignant
intracranial and CNS tumors could expect increases in their workloads as a result of the
additional time spent on processing and quality control procedures and training The lack of
standard definitions and collection and reporting guidelines would make these tasks more time-
consuming as well
For some central cancer registries that want to expand their reporting requirements to
include nonmalignant intracranial and CNS tumors a change in current legislation andor
regulations may be needed These changes could involve several months of lead time if public
hearings or other legal procedures are necessary In other states the reporting of these tumors is
not required in either their legislation or regulations in these situations hospitals have been asked
to voluntarily report the cases For example in Massachusetts the reporting of benign brain
tumors is not required by law but hospitals have been reporting these cases since 1982 However
the completeness of data reported on a voluntary basis is difficult to assess For public health
surveillance systems a mandate to report is the basic requirement of a comprehensive higher
quality system
DATA COLLECTION
OF PRIMARY
CENTRAL NERVOUS
SYSTEM TUMORS
If COC SEER NPCR and central cancer registries changed their reporting requirements
to include nonmalignant intracranial and CNS tumors the registry manuals disseminated by these
programs and registries would also need to be modified to include new definitions of reportable
diagnoses All reporting facilities would have to be notified of the new requirements To ensure
complete reporting from registries additional training of registrars should be expected Case
finding methods may need to be modified in order to identify the new cases and sources of
information Central cancer registries would also need to increase their case finding audits The
inclusion of nonmalignant tumors would also necessitate changes to other data items such as
sequence number Hospital and central cancer registries would need to consider adding WHO
brain tumor grade as an additional data item
Finally the software used by reporting facilities and by central registries would need to be
modified to accept nonmalignant morphology and behavior codes Also edits programs would
need to be modified to include these additions and to accept a nonmalignant sequence numbering
procedure
Before reporting requirements for primary intracranial and CNS tumors could be changed
feasibility studies would have to be conducted to determine whether such changes should be
recommended Two SEER special studies are under way to evaluate the impact of requiring the
collection of benign brain tumors on case finding cost quality control and training However
additional studies may be required
Page 24
Endash
APPENDIX E
RECOMMENDATIONS OF THE BRAIN TUMOR WORKING GROUP
1 We recommend the following standard definition for collecting precise data for all primary
intracranial and central nervous system tumors
Primary intracranial and central nervous (CNS) tumors are primary tumors occurring in
the following sites irrespective of histologic type or behavior brain meninges spinal
cord cauda equina cranial nerves and other parts of the CNS pituitary gland pineal
gland and craniopharyngeal duct (see Appendix B)
2 We recommend the development of a standard site and histology definition for tabulating
estimates of these tumors to allow comparability of information across registries Pathologists
the North American Association of Central Cancer Registries (NAACCR) the Commission
on Cancer (COC) the Surveillance Epidemiology and End Results (SEER) Program the
National Program of Cancer Registries (NPCR) and the International Agency for Research
on Cancer (IARC) need to be involved in developing this standard
3 We recommend collection of data for primary intracranial and extracranial CNS tumors by all
registries hospital- and central-based This effort will necessitate a change in the COC
requirements and will increase costs to the hospital-based programs Federal funding should be
allocated to supplement the additional transition and ongoing data collections costs that will be
incurred by central registries Before additional data collection is implemented we recommend
a pilot study should be conducted to assess the procedures and quality control functions
needed as well as the costs of collecting data for these tumors
4 We recommend that the appropriate government and professional organizations be involved in
carrying out the development and implementation of special training programs and curricula for
central registry hospital registry and laboratory personnel as well as the development of
computerized edit-checking procedures Training for reporting and tabulating primary
intracranial and CNS tumors should be offered on a regular basis
Page 25
Endash
DATA COLLECTION
OF PRIMARY
CENTRAL NERVOUS
SYSTEM TUMORS
Endash
REFERENCES
1 Davis F Preston-Martin S Epidemiology of brain tumors In Bigner DD McLendon RE Bruner JM eds Russell and Rubinsteins pathology of tumors of the nervous system ed 6 London Arnold Publishing 19965-45
2 World Health Organization (WHO) (1976) International classification of diseases foroncology ed 1 Geneva World Health Organization
3 World Health Organization (WHO) (1990) International classification of diseases foroncology ed 2 Geneva World Health Organization
4 Kleihues P Burger PC Scheithauer BW The new WHO classification of brain tumorsBrain Pathol 19933255-268
5 Thapar K Laws ER Tumors of the central nervous system In Murphy GP Lawrence WJr Lenhard RE Jr eds Textbook of clinical oncology ed 2 Atlanta American CancerSociety 1995378-410
6 Walker AE Robins M Weinfield FD Epidemiology of brain tumors the national survey ofintracranial neoplasms Neurol 198535219-226
7 Ries LAG Kosary CL Hankey BF Miller BA Edwards BK (eds) SEER Cancer StatisticsReview 1973-1995 National Cancer Institute Bethesda MD 1998
8 Cancer Facts amp Figures - 1998 American Cancer Society Atlanta Georgia 19989 Davis FG Bruner JM Surawicz TS The rationale for standardized registration and reporting
of brain and central nervous system tumors in population-based cancer registriesNeuroepidemiol 199716308-316
10CBTRUS (1996) First annual report 1995 Central Brain Tumor Registry of the UnitedStates Chicago Illinois
11 Preston-Martin S Epidemiology of primary CNS neoplasms Neurol Clinics 199614273-290
12 Greig NH Ries LG Yancik R Rapoport SI Increasing annual incidence of primary malignantbrain tumors in the elderly J Natl Cancer Inst 1991 831621-1624
13 Mao Y Desmeules M Semenciw RM Hill G Gaudette L Wigle DT Increasing brain cancerrates in Canada Can Med Assoc J 19911451583-1591
14 Frelick R Huang P Topham A Brain and central nervous system tumors Delaware 1980 to1989 Del Med J 199264571-573
15 Davis DL Ahlbom A Hoel D Percy C Is brain cancer mortality increasing in industrialcountries Am J Ind Med 199119421-431
16 Helseth A Increasing incidence of primary central nervous system tumors in the elderly Realincrease or improved detection J Natl Cancer Inst 1993851871-1872
17 Modan B Wagener D Feldman JJ Rosenberg HM Feinleib M Increased mortality frombrain tumors A combined outcome of diagnostic technology and change of attitude towardthe elderly Am J Epidemiol 19921351349-1357
18 Polednak AP Time trends in the incidence of brain and central nervous system cancers inConnecticut J Natl Cancer Inst 1991831679-1681
19 Boyle P Maissonneuve P Saracci R Muir CS Is the increase in incidence of primarymalignant brain tumors real J Natl Cancer Inst 1990201594-1596
Page 26
APPENDIX E 20 Preston-Martin S Descriptive epidemiology of primary tumors of the brain cranial nerves
and spinal meninges in Los Angeles County Neuroepidemiol 19898283-29521 Helseth A Mork SJ Neoplasms of the central nervous system in Norway Epidemiological
characteristics of intracranial gliomas according to histology APMIS 97 1989547-55522 Gurney JG Davis S Severson RK Fang J-Y Ross JA Robison LL Trends in cancer
incidence among children in the United States Cancer 199678532-54123 Gurney JG Ross JA Wall DA Bleyer WA Severson RK Robison LL Infant cancer in the
US histology-specific incidence trends 1973-1992 J Pediatr Hem Onc 199719428-43224 Nishio S Takeshita I Morioka T Fukui M Primary intracranial squamous cell carcinomas
report of two cases Neurosurgery 199537329-33225 Freilich RJ Thompson SJ Walker RW Rosenblum MK Adenocarcinomatous transformation
of intracranial germ cell tumors Am J Surg Pathol 199519537-54426Yuan S Miller DW Barnett GH Hahn JF Williams BR Identification and characterization of
human beta 2-chimaerin association with malignant transformation in astrocytoma CancerResearch 1995 553456-3461
27 Preston-Martin S Mack WJ Neoplasms of the nervous system In Schoenfeld D Fraumeni JFJr eds Cancer epidemiology and prevention ed 2 New York Oxford University Press19961231-1281
28 Riggs JE Rising primary malignant brain tumor mortality in the elderly A manifestation ofdifferential survival Arch of Neurol 199552571-575
29 Davis FG Freels S Grutsch J Barlas S Brem S Survival rates in patients with primarymalignant brain tumors stratified by patient age and tumor histological type an analysisbased on Surveillance Epidemiology and End Results (SEER) data 1973-1991J Neurosurg 1998881-10
30 Surawicz TS Davis F Freels S Laws ER Menck HR Brain tumor survival results from theNational Cancer Data Base (Accepted for publication in J Neuro-Oncol)
31 Bondy ML Lustbader ED Buffler PA Schull WJ Hardy RJ Strong LC Geneticepidemiology of childhood brain tumors Genet Epidemiol 19918253-267
32 Preston-Martin S Monroe K Lee P Bernstein L Kelsey J Henderson S Forrester DHenderson B Spinal meningiomas in women in Los Angeles County Investigation of anetiologic hypothesis Cancer Epidemiol Biomarkers Prev 19954333-339
33 Davis JR Brownson RC Garcia R Bentz BJ Turner A Family pesticide use and childhoodbrain cancer Arch Environ Contam Toxicol 19932487-92
34 Commission on Cancer General principles and coding In Standards of the Commission on Cancer vol II Registry Operations and Data Standards American College of SurgeonsChicago Illinois 1996
35 Central Brain Tumor Registry of the United States (CBTRUS) 1997 State Survey of BenignBrain Tumor Collection Chicago Illinois 1997
36 Davis FG Malinski N Haenszel W Chang J Flannery J Gershman S Dibble R Bigner DDPrimary brain tumor incidence rates in the four United States regions 1985-1989 A pilotstudy Neuroepidemiol 199615103-112
37 Schoenberg BS Christine BW Whisnant JP The descriptive epidemiology of primaryintracranial neoplasms the Connecticut experience Am J Epidemiol 1976104499-510
Page 27
Endash
DATA COLLECTION
OF PRIMARY
CENTRAL NERVOUS
SYSTEM TUMORS
TAB
LE 1
C
OM
PAR
ISO
N O
F R
EGIS
TRIE
S SU
PPLY
ING
DA
TA O
N P
RIM
AR
Y I
NTR
AC
RA
NIA
L A
ND
CEN
TRA
L N
ERV
OU
S SY
STEM
TU
MO
RS
IN T
HE
UN
ITED
STA
TES
Cen
tral B
rain
Tum
or R
egis
try o
fth
e U
nite
d St
ates
(CBT
RUS)
Min
neso
ta C
ance
rSu
rvei
llanc
e Sy
stem
(MC
SS)
ACo
SN
a tio
nal C
ance
r Dat
a B
ase
(NCD
B)
Surv
eilla
nce
Epid
emio
logy
and
End
Res
ults
Pro
gram
(SEE
R)
Purp
ose
ldquoCB
TRU
S ce
ntra
lizes
pop
ulat
ion-
base
d in
cide
nce
data
on
all b
rain
tum
ors a
nd u
ses o
ther
exi
stin
gda
ta re
sour
ces t
o ch
arac
teriz
e th
ein
cide
nce
mor
talit
y a
nd su
rviv
alof
pat
ient
s with
bra
in tu
mor
s rdquo
The
MC
SS c
olle
cts i
nfor
mat
ion
onal
l can
cers
dia
gnos
ed si
nce
1988
amon
g M
inne
sota
resi
dent
s Th
e M
CSS
is p
opul
atio
n-ba
sed
path
olog
y-ba
sed
and
is a
n ac
tive
syste
m
ldquoThe
goa
l of t
he N
CD
B is
to p
rese
nt a
n an
nual
sum
mar
y of
pat
ient
car
e fo
r cas
es o
f can
cer
diag
nose
d an
d tre
ated
at h
ospi
tals
thro
ugho
utth
e co
untry
rdquo
ldquoA c
ontin
uing
pro
ject
of th
e N
CI
the
SEER
prog
ram
col
lect
sca
ncer
dat
a on
aro
utin
e ba
sis f
rom
desi
gnat
ed p
opul
atio
n-ba
sed
canc
er re
gist
ries
in v
ario
us a
reas
of t
heco
untry
Targ
et p
opul
atio
n Th
e po
pula
tions
cov
ered
by
regi
strie
s in
Ari
zona
Col
orad
oC
onne
ctic
ut D
elaw
are
Idah
oM
aine
Mas
sach
uset
ts
Min
neso
ta M
issou
ri M
onta
na
Nor
th C
arol
ina
and
Uta
h
The
CB
TRU
S po
pula
tion
repr
esen
ts a
non
rand
om 1
5pe
rcen
t sam
ple
of th
e U
S
popu
latio
n
The
popu
latio
n of
Min
neso
ta
The
popu
latio
ns tr
eate
d at
par
ticip
atin
gho
spita
ls in
the
50 st
ates
the
Dist
rict
of
Col
umbi
a a
nd P
uert
o R
ico
NC
DB
is n
ot a
pop
ulat
ion-
base
d re
gist
ry
At
pres
ent
it is
est
imat
ed to
cov
er a
ppro
xim
atel
y57
per
cent
of t
otal
cas
es n
atio
nwid
e
The
popu
latio
nsco
vere
d by
the
state
regi
strie
s in
Con
nect
icut
Haw
aii
Iow
a N
ew M
exic
o
and
Uta
h a
s wel
l as
the
regi
onal
regi
strie
sin
Atla
nta
Geo
rgia
D
etro
it M
ichi
gan
San
Fran
cisc
o-O
akla
nd C
alifo
rnia
an
d Se
attle
-Pug
etSo
und
Was
hing
ton
The
SEER
pop
ulat
ion
repr
esen
ts a
nonr
ando
m 1
4 pe
rcen
tsa
mpl
e of
the
US
po
pula
tion
Page
28
Endash
APPENDIX E
Cen
tral B
rain
Tum
or R
egis
try o
fth
e U
nite
d St
ates
(CBT
RUS)
Min
neso
ta C
ance
rSu
rvei
llanc
e Sy
stem
(MC
SS)
ACo
SN
a tio
nal C
ance
r Dat
a B
ase
(NCD
B)
Surv
eilla
nce
Epid
emio
logy
and
End
Res
ults
Pro
gram
(SEE
R)
Type
of
prim
ary
intra
cran
ial
and
cent
ral n
ervo
us sy
stem
tum
ors r
epor
ted
Dat
a on
new
ly-d
iagn
osed
cas
es o
fbe
nign
and
mal
igna
nt p
rimar
ybr
ain
tum
ors b
ased
on
ICD
-Oco
des
Dat
a on
new
ly-d
iagn
osed
m
i cro
scop
ical
ly-c
onfir
med
tum
ors
of th
e ce
ntra
l ner
vous
syste
m
incl
udin
g pi
tuita
ry a
nd p
inea
lgl
ands
Hos
pita
ls v
olun
taril
y su
bmit
full
anal
ytic
canc
er re
gist
ry c
asel
oads
with
dat
a ite
ms a
ndco
des d
efin
ed b
y th
e C
omm
issio
n on
Can
cer
(CO
C) f
or h
ospi
tal c
ance
r reg
istri
es
Mos
tpa
rtici
patin
g ho
spita
ls h
ave
prog
ram
sap
prov
ed b
y C
OC
or a
re e
stab
lishi
ng p
rogr
amap
prov
al
NC
DB
cal
ls fo
r dat
a do
not
lim
itca
ses b
y m
alig
nant
beh
avio
r bu
t acc
essi
onin
gof
non
-mal
igna
nt c
ases
is n
ot re
quire
d fo
rpr
ogra
m a
ppro
val
Fifty
-nin
e pe
rcen
t of t
heho
spita
ls th
at su
bmitt
ed a
ny in
tracr
ania
lCN
Sca
ses d
iagn
osed
dur
ing
1989
-199
4 su
bmitt
edat
leas
t one
non
mal
igna
nt c
ase
The
NC
DB
data
in th
is re
port
are
limite
d to
the
case
ssu
bmitt
ed b
y th
ese
hosp
itals
(82
perc
ent o
f all
intra
cran
ial a
nd e
xtra
cran
ial c
entra
l ner
vous
syste
m c
ases
on
file)
Tren
ds in
the
inci
denc
e m
orta
lity
and
patie
nt su
rviv
al o
fbr
ain
tum
ors i
n th
eU
S H
owev
er S
EER
does
not
col
lect
info
rmat
ion
on b
enig
nan
d un
certa
in b
rain
tum
ors
Oth
er c
omm
ents
D
uplic
ate
canc
er re
gist
ratio
ns c
anno
t be
iden
tifie
d by
the
parti
cipa
ting
regi
strie
s
The
MC
SS p
erfo
rms 1
00 p
erce
ntca
se fi
ndin
g au
dits
in a
ll pa
thol
ogy
labo
rato
ries o
n an
ann
ual b
asis
Th
eref
ore
the
data
from
the
MC
SSm
ight
be
cons
ider
ed a
ldquobe
st-ca
sesc
enar
iordquo
in te
rms o
f com
plet
enes
sof
repo
rting
for m
icro
scop
ical
ly-
conf
irmed
tum
ors
Rep
ort d
uplic
atio
n fo
r 198
9-19
94 in
tracr
ania
lan
d ex
tracr
ania
l cen
tral n
ervo
us sy
stem
repo
rts w
as 6
7 p
erce
nt
How
ever
the
NC
DB
data
in T
able
s 2 th
roug
h 9
are
base
d on
undu
plic
ated
repo
rts
Page
29
Endash
DATA COLLECTION
OF PRIMARY
CENTRAL NERVOUS
SYSTEM TUMORS
TABLE 2 NUMBER AND PERCENT OF PRIMARY INTRACRANIAL AND CENTRAL NERVOUS SYSTEM TUMORS BY TUMOR LOCATION
Locationa CBTRUSb
Number () MCSSc
Number () NCDBd
Number () SEERe
Number ()
Intracranial 13084 (947) 3600 (936) 66322 (955) 10196 (969)
Brain 7999 (579) 1924 (500) 48527 (699) 9721 (924)
Meninges 2719 (197) 838 (218) 9365 (135) 139 (13)
Pituitarycraniopharygealduct
1491 (108) 530 (138) 4958 (71) 30 (03)
Pineal 74 (05) 21 (05) 477 (07) 80 (08)
Other central nervous systemincluding cranial nerves
801 (58) 287 (75) 2995 (43) 226 (22)
Extracranial 730 (53) 245 (64) 3137 (45) 322 (31)
Spinal cord 497 (36) 47 (38) 2395 (34) 313 (30)
Spinal meninges 233 (17) 98 (25) 742 (11) 9 (01)
TOTAL 13814 (100) 3845 (100) 69459 (100) 10518 (100)
Note Reported data are incident cases from 1989-1994 except for CBTRUS data which are from 1990-1993
aRefer to the sites in Appendix BbCentral Brain Tumor Registry of the United States cMinnesota Cancer Surveillance System (microscopically confirmed cases only)dNational Cancer Data Base (limited to cases reported by hospitals that accessioned nonmalignant cases) eSurvival Epidemiology and End results Program (malignant cases only)
Page 30
Endash0
TABL
E 3
RO
W P
ERCE
NT
DIS
TRIB
UTI
ON
OF
PRIM
ARY
INTR
ACR
AN
IAL
AN
D C
ENTR
AL
NER
VO
US
SYST
EM T
UM
ORS
BY
TU
MO
R B
EHA
VIO
RA
ND
MIC
ROSC
OPI
C C
ON
FIRM
ATI
ON
Loca
tiona
CB
TRU
Sb M
CSSc
NC
DB
d SE
ERe
Tota
l Pe
rcen
tM
icro
Co
nfirm
ed
Perc
ent
Not
Mic
ro
Conf
irmed
Tota
l Pe
rcen
tM
icro
Co
nfirm
ed
Perc
ent
Not
Mic
ro
Conf
irmed
Tota
l Pe
rcen
tM
icro
Co
nfirm
ed
Perc
ent
Not
Mic
ro
Conf
irmed
Tota
l Pe
rcen
tM
icro
Co
nfirm
ed
Perc
ent
Not
Mic
ro
Conf
irmed
Intra
cran
ial
130
84
867
13
3
360
0 10
0 N
A
663
22
887
11
3
101
96
871
12
9
Mal
igna
nt
717
1 89
2
108
1
824
100
NA
44
801
91
3
87
101
96
871
12
9
Beni
gn a
ndu n
certa
in
591
3 83
5
165
1
776
100
NA
21
521
83
2
168
N
A
NA
N
A
Bra
in
799
9 88
2
118
1
924
100
NA
48
527
90
2
98
972
1 87
3
127
Mal
igna
nt
686
2 89
6
104
1
746
100
NA
42
622
91
5
85
972
1 87
3
127
Beni
gnan
dun
certa
in
113
7 80
6
194
17
8 10
0 N
A
590
5 80
6
194
N
A
NA
N
A
Extra
cran
ial
730
962
3
8 24
5 10
0 N
A
313
7 96
0
40
322
957
4
3
Mal
igna
nt
242
934
6
6 60
10
0 N
A
148
3 96
6
34
322
957
4
3
Beni
gn a
ndu n
certa
in
488
975
2
5 18
5 10
0 N
A
165
4 95
5
45
NA
N
A
NA
TOTA
Lf 13
814
87
2
128
3
845
100
NA
69
459
89
0
110
10
518
87
4
126
Mal
igna
nt
741
3 89
4
106
1
884
100
NA
46
284
91
5
85
105
18
874
12
6
Beni
gn a
ndu n
certa
in
640
1 84
6
154
1
961
100
NA
23
175
84
1
159
N
A
NA
N
A
Not
e R
epor
ted
data
are
inci
dent
cas
es fr
om 1
989-
1994
exc
ept f
or C
BTR
US
data
whi
ch a
re fr
om 1
990-
1993
a Refe
r to
the
site
code
s in
App
endi
x B
b Cent
ral B
rain
Tum
or R
egist
ry o
f the
Uni
ted
Stat
es
c Min
neso
ta C
ance
r Sur
veill
ance
Sys
tem
(mic
rosc
opic
ally
con
firm
ed c
ases
onl
y)
d Nat
iona
l Can
cer D
ata
Base
(lim
ited
to c
ases
repo
rted
by h
ospi
tals
that
acc
essio
ned
nonm
alig
nant
cas
es)
e Surv
eilla
nce
Epi
dem
iolo
gy a
nd E
nd R
esul
ts Pr
ogra
m (m
alig
nant
cas
es o
nly)
f In
clud
es in
tracr
ania
l and
ext
racr
ania
l cas
es
NA
= N
ot a
pplic
able
Page
31
APPENDIX E
Endash
DATA COLLECTION
OF PRIMARY
CENTRAL NERVOUS
SYSTEM TUMORS
TABLE 4 NUMBER AND PERCENT OF PRIMARY INTRACRANIAL AND CENTRAL NERVOUS SYSTEM TUMORS BY DIAGNOSTIC CONFIRMATION
DiagnosticConfirmation
CBTRUSa
Number () MCSSb
Number () NCDBc
Number () SEERd
Number ()
Positive microscopy
12087 (875) 3845 (100) 61818 (890) 9188 (874)
Radiographywithout microscopy
1306 (95) NA 6759 (97) 1015 (97)
Clinical 204 (15) NA 484 (07) 98 (09)
Unknown 217 (15) NA 398 (06) 217 (21)
TOTAL 13814 (100) 3845 (100) 69459 (100) 10518 (100)
Note Reported data are incident cases from 1989-1994 except for CBTRUS data which are from 1990-1993
aCentral Brain Tumor Registry of the United Statesb Minnesota Cancer Surveillance System (microscopically confirmed cases only) cNational Cancer Data Base (limited to cases reported by hospitals that accessioned nonmalignant cases)dSurveillance Epidemiology and End Results Program (malignant cases only)NA = Not applicable
Page 32
Endash
Page 32
TABLE 4 NUMBER AND PERCENT OF PRIMARY INTRACRANIAL AND CENTRALNERVOUS SYSTEM TUMORS BY DIAGNOSTIC CONFIRMATION
DiagnosticConfirmation
CBTRUSa
Number ()MCSSb
Number ()NCDBc
Number ()SEERd
Number ()
Positivemicroscopy
12087 (875) 3845 (100) 61818 (890) 9188 (874)
Radiographywithout microscopy
1306 (95) NA 6759 (97) 1015 (97)
Clinical 204 (15) NA 484 (07) 98 (09)
Unknown 217 (15) NA 398 (06) 217 (21)
TOTAL 13814 (100) 3845 (100) 69459 (100) 10518 (100)
Note Reported data are incident cases from 1989-1994 except for CBTRUS data which are from 1990-1993
aCentral Brain Tumor Registry of the United Statesb Minnesota Cancer Surveillance System (microscopically confirmed cases only)cNational Cancer Data Base (limited to cases reported by hospitals that accessioned nonmalignant cases)dSurveillance Epidemiology and End Results Program (malignant cases only)NA = Not applicable
APPENDIX E
TABLE 5 NUMBER AND PERCENT OF MALIGNANT PRIMARY INTRACRANIAL AND CENTRAL SYSTEM TUMORS BY TUMOR LOCATION
Locationa CBTRUSb
Number () MCSSc
Number () NCDBd
Number () SEERe
Number ()
Intracranial 7171 (977) 1824 (968) 44801 (968) 10196 (969)
Brain 6862 (926) 1746 (927) 42622 (921) 9721 (924)
Meninges 98 (13) 23 (12) 581 (13) 139 (13)
Pituitarycraniopharyngealduct
37 (05) 13 (07) 189 (04) 30 (03)
Pineal 58 (08) 20 (11) 378 (08) 80 (08)
Other central nervous systemincluding cranial nerves
116 (16) 22 (12) 1031 (22) 226 (21)
Extracranial 242 (33) 60 (32) 1483 (32) 322 (31)
Spinal cord 234 (32) 60 (32) 1410 (30) 313 (30)
Spinal meninges 8 (01) 0 73 (02) 9 (01)
TOTAL 7413 (100) 1884 (100) 46284 (100) 10518 (100)
Note Reported data are incident cases from 1989-1994 except for CBTRUS data which are from 1990-1993
aRefer to the site codes in Appendix BbCentral Brain Tumor Registry of the United States cMinnesota Cancer Surveillance System (microscopically confirmed cases only)dNational Cancer Data Base (limited to cases reported by hospitals that accessioned nonmalignant cases) eSurvival Epidemiology and End Results Program (malignant cases only)
Page 33
Endash
DATA COLLECTION
OF PRIMARY
CENTRAL NERVOUS
SYSTEM TUMORS
TABLE 6 NUMBER AND PERCENT OF PRIMARY INTRACRANIAL AND CENTRAL NERVOUS SYSTEM TUMORS OF BENIGN AND UNCERTAIN BEHAVIOR BY TUMOR LOCATION
Locationa CBTRUSb
Number () MCSSc
Number () NCDBd
Number () SEERe
Number ()
Intracranial 5913 (924) 1776 (906) 21521 (929) NA
Brain 1137 (178) 178 (91) 5905 (255) NA
Meninges 2621 (409) 815 (416) 8784 (379) NA
Pituitarycraniopharyngealduct
1454 (227) 517 (264) 4769 (206) NA
Pineal 16 (02) 1 (lt01) 99 (04) NA
Other central nervous systemincluding cranial nerves
685 (107) 265 (135) 1964 (85) NA
Extracranial 488 (76) 185 (94) 1654 (71) NA
Spinal cord 263 (41) 87 (44) 985 (42) NA
Spinal meninges 225 (35) 98 (50) 669 (29) NA
TOTAL 6401 (100) 1961 (100) 23175 (100) NA
Note Reported data are incident cases from 1989-1994 except for CBTRUS data which are from 1990-1993
aRefer to the site codes in Appendix BbCentral Brain Tumor Registry of the United States cMinnesota Cancer Surveillance System (microscopically confirmed cases only)dNational Cancer Data Base (limited to cases reported by hospitals that accessioned nonmalignant cases) eSurveillance Epidemiology and End Results Program (malignant cases only)NA = Not applicable
Page 34
Endash
APPENDIX E TABLE 7 NUMBER AND PERCENT OF PRIMARY INTRACRANIAL AND CENTRAL
NERVOUS SYSTEM TUMORS BY TUMOR BEHAVIOR AND LOCATION
BehaviorTumor Locationa
CBTRUSb
Number () MCSSc
Number () NCDBd
Number () SEERe
Number ()
Malignant 7413 (537) 1884 (490) 46284 (666) 10518 (100)
Brain 6862 (497) 1746 (454) 42622 (614) 9721 (924)
Meninges 98 (07) 23 (06) 581 (08) 139 (13)
Pituitarycraniopharyn-geal ductpineal
95 (07) 33 (09) 567 (08) 110 (11)
Other central nervous system includingcranial nerves
116 (08) 22 (06) 1031 (15) 226 (22)
Spinal cord 242 (18) 60 (16) 1483 (21) 322 (31)
Benign 5794 (419) 1787 (465) 20694 (298) NA
Brain 803 (58) 99 (26) 4491 (65) NA
Meninges 2565 (186) 807 (210) 8613 (124) NA
Pituitarycraniopharyn-geal ductpineal
1322 (96) 458 (119) 4330 (62) NA
Other central nervous system includingcranial nerves
678 (49) 263 (68) 1911 (28) NA
Spinal cord 426 (31) 160 (42) 1349 (19) NA
Uncertain 607 (44) 174 (45) 2481 (36) NA
Brain 334 (24) 79 (21) 1414 (20) NA
Meninges 56 (04) 8 (02) 171 (02) NA
Pituitarycraniopharyn-geal ductpineal
148 (11) 60 (16) 538 (08) NA
Other central nervous system includingcranial nerves
7 (01) 2 (01) 53 (01) NA
Spinal cord 62 (05) 25 (07) 305 (04) NA
TOTAL 13814 (100) 3845 (100) 69459 (100) 10518 (100)
Note Reported data are incident cases from 1989-1994 except for CBTRUS data which are from 1990-1993 NA=Not applicableaRefer to the site codes in Appendix B bCentral Brain Tumor Registry of the United States cMinnesota Cancer Surveillance System (microscopically confirmed cases only)dNational Cancer Data Base (limited to cases reported byhospitals that accessioned nonmalignant cases eSurvival Epidemiology and End Results Program (malignant cases only)
Page 35
Endash
DATA COLLECTION
OF PRIMARY
CENTRAL NERVOUS
SYSTEM TUMORS
TABLE 8 NUMBER AND PERCENT OF MALIGNANT PRIMARY INTRACRANIAL AND
CENTRAL NERVOUS SYSTEM TUMORS BY HISTOLOGY GROUPINGS
WHO Histologya
Groupings CBTRUSb
Number () MCSSc
Number () NCDBd
Number () SEERe
Number ()
Neuroepithelial 6477 (874) 1689 (896) 39701 (858) 8676 (825)
Tumors of cranial and spinal nerves
12 (02) 3 (02) 108 (02) 25 (02)
Tumors of meninges
137 (18) 25 (13) 994 (21) 194 (18)
LymphomasHemopoietic
473 (64) 121 (64) 3492 (75) 1099 (105)
Germ cell 70 (09) 20 (11) 403 (09) 97 (09)
Cysts and tumor-like lesions
0 0 0 0
Tumors of sellar region
20 (03) 11 (06) 100 (02) 6 (01)
Local extensions 29 (04) 11 (06) 166 (04) 38 (04)
Unclassifiedunassigned tumorsf
195 (26) 4 (02) 1320 (29) 383 (36)
TOTAL 7413 (100) 1884 (100) 46284 (100) 10518 (100)
Note Reported data are incident cases from 1989-1994 except for CBTRUS data which are from 1990-1993
aRefer to the World Health Organization (WHO) histology groupings in Appendix CbCentral Brain Tumor Registry of the United States cMinnesota Cancer Surveillance System (microscopically confirmed cases only)dNational Cancer Data Base (limited to cases reported by hospitals that accessioned nonmalignant cases) f For MCSS unclassifiedunassigned tumors include one malignant and four nonmalignant histologies which were
not listed in the CBTRUS classification scheme For NCDB unclassifiedunassigned tumors include 319 cases(less than one half percent) which had histologies not assigned by CBTRUS to any other category For SEERunclassifiedunassigned tumors include all malignant histologies occurring in the brainCNS which could not beclassified in one of the above categories based on their 4-digit histologic type
Page 36
Endash
APPENDIX E
TABLE 9 NUMBER AND PERCENT OF PRIMARY INTRACRANIAL AND CENTRAL NERVOUS SYSTEM TUMORS OF BENIGN AND UNCERTAIN BEHAVIOR
BY HISTOLOGY GROUPINGS
WHO Histologya
Groupings CBTRUSb
Number () MCSSc
Number () NCDBd
Number () SEERe
Number ()
Neuroepithelial 275 (43) 91 (46) 1064 (46) NA
Tumors of cranial and spinal nerves
980 (153) 397 (202) 2618 (113) NA
Tumors of meninges
3509 (548) 941 (480) 13667 (590) NA
LymphomasHemopoietic
3 (lt01) 0 7 (lt01) NA
Germ cell 4 (lt01) 1 (01) 25 (01) NA
Cysts and tumor-like lesions
15 (02) 3 (02) 34 (01) NA
Tumors of sellar region
1444 (226) 510 (260) 4749 (205) NA
Local extensions 0 0 0 NA
Unclassifiedunassigned tumorsf
171 (27) 18 (09) 1011 (44) NA
TOTAL 6401 (100) 1961 (100) 23175 (100) NA
Note Reported data are incident cases from 1989-1994 except for CBTRUS which is 1990-1993
aRefer to the World Health Organization (WHO) histology groupings in Appendix CbCentral Brain Tumor Registry of the United States c Minnesota Cancer Surveillance System (microscopically confirmed cases only) dNational Cancer Data Base (limited to cases reported by hospitals that accessioned nonmalignant cases) eSurvival Epidemiology and End Results Program (malignant cases only)dFor MCSS unclassifiedunassigned tumors include one malignant and four nonmalignant histologies which werenot listed in the CBTRUS classification scheme For NCDB unclassifiedunassigned tumors include 319 cases(less than one half percent) which had histologies not assigned by CBTRUS to any other category For SEERunclassifiedunassigned tumors include all malignant histologies occurring in the brainCNS which could not beclassified in one of the above categories based on their 4-digit histologic typeNA = Not applicable
Page 37
Endash
DATA COLLECTION
OF PRIMARY
CENTRAL NERVOUS
SYSTEM TUMORS
TABLE 10 METHOD OF CASE FINDING FOR PRIMARY INTRACRANIAL AND CENTRAL NERVOUS SYSTEM TUMORS BY TUMOR BEHAVIOR AND LOCATION MINNESOTA 1989-1994
Behavior Tumor Locationa
Number of Cases
Percent Found byRoutine
Reporting
Percent Found by Special Efforts
Malignant Brain Cerebral meninges
Pituitarycranio duct pineal Other intracranial
18841746 23 33
22
961 965 957 939
864
39 35 43 61
136 Extracranial 60 883 117 Benign Brain
1787 99
788 838
212 162
Cerebral meninges Pituitarycranio duct
pineal Other intracranial
807 458
263
843 740
779
157 260
221 Extracranial 160 631 369 Uncertain 174 856 144 Brain 79 823 177 Cerebral meninges Pituitarycraniopharyn- geal ductpineal Other intracranial
8 60
2
875 850
1000
125 150
00 Extracranial 25 960 40
TOTAL 3845 876 124
aRefer to the site codes in Appendix B
Page 38
Endash
1989 1990 1991 1992 1993 1994
TOTAL
APPENDIX E TABLE 11 METHOD OF CASE FINDING FOR INTRACRANIALa TUMORS BY DIAGNOSIS YEAR MINNESOTA 1989-1994
DiagnosisYear
Number of
Cases
Percent Found byRoutine
Reporting
Percent Found by
Special Efforts
571 837 163 616 865 135 586 913 87 602 899 101
633 872 128 592 929 71
3600 886 114
aIncludes the brain cerebral meninges pituitary gland pineal gland and otherintracranial tumors (refer to the site codes in Appendix B)
Page 39
Endash
DATA COLLECTION
OF PRIMARY
CENTRAL NERVOUS
SYSTEM TUMORS
TABLE 12 METHOD OF CASE FINDING FOR NONMALIGNANT INTRACRANIALa TUMORS BY TYPE OF FACILITY MINNESOTA 1989-1994
Type of Facility Number of Tumors Percent Found byRoutine
Reporting
Percent Found by Special Efforts
Registry at facility No registry at facility
1451325
859 569
141 431
TOTAL 1776 806 194
aIncludes tumors with benign or uncertain behavior that involve the brain cerebral meningespituitary gland pineal gland or other intracranial sites (refer to the site codes in Appendix B)
TABLE 13 REPORTING METHOD AND SOURCE OF CASE FINDING FOR NON- MALIGNANT INTRACRANIALa TUMORS DIAGNOSED IN HOSPITALS WITH A TUMOR REGISTRY MINNESOTA 1989-1994
Reporting Method Number of Tumors Percent Found byRoutine
Reporting
Percent Found by
Special Efforts
Registry-reportedLaboratory-reported
1226225
925 502
75 498
TOTAL 1451 859 141
aIncludes tumors with benign or uncertain behavior that involve the brain cerebral meningespituitary gland pineal gland or other intracranial sites (refer to the site codes in Appendix B)
Page 40
Endash0
APPENDIX E TABLE 14 HOSPITAL REGISTRY ACCESSIONING OF MALIGNANT AND NON-
MALIGNANT PRIMARY INTRACRANIAL AND CENTRAL NERVOUS SYSTEM TUMORS NCDB 1989-1994
TUMOR Totalb
BEHAVIOR Malignant c Nonmalignantd
Tumor Locationa HospitalsReporting
Number ()
Hospitals Reporting
Number ()
Hospitals Reporting
Number ()
Intracranial 1542 (100) 1526 (100) 900 (99)
Brain 1527 (99) 1519 (gt99) 754 (83)
Meninges 740 (48) 390 (26) 613 (67)
Pituitaryglandcraniopharyn-
geal duct
602 (39) 168 (11) 538 (59)
Pineal gland 319 (21) 277 (18) 79 (9)
Other central nervous system including cranial
nerves
648 (42) 545 (36) 299 (33)
Extracranial 812 (53) 708 (46) 410 (45)
Spinal cord 760 (49) 692 (45) 311 (34)
Spinal meninges 299 (19) 72 (5) 258 (28)
TOTAL Hospitals 1542 (100) 1526 (100) 913 (100)
Note The number of hospitals in each of the second third and fourth columns is the number that submittedreports to the NCDB for any intracranial and central nervous system tumors for the respective malignancystatus Not all hospitals submitted reports for each year during the study period (1989-1994)
aRefer to the site codes in Appendix B bBehavior codes = 0 1 3 cBehavior code = 3 dBehavior codes = 0 1
Page 41
Endash
DATA COLLECTION
OF PRIMARY
CENTRAL NERVOUS
SYSTEM TUMORS
Texas Cancer Registry
1997 CBTRUS State Survey of Benign Brain Tumor Data Collection
State Collection Status
Currently Collecting Benign Tumor Data1 Arizona Cancer Registry since 1981 2 Colorado Central Cancer Registry since 1988 3 Connecticut Tumor Registry since 1965 4 Idaho Cancer Data Registry since 1970 5 Maine Cancer Registry since 1983 6 Massachusetts Cancer Registry since 1982 7 Minnesota Cancer Surveillance System since 1988 8 Montana Central Tumor Registry since 1979 9 New York State Cancer Registry since 1988
10 North Carolina Central Cancer Registry since 1990 11 Utah Cancer Registry since 1966 12 Virginia Cancer Registry since 1994 13 Delaware State Cancer Registry14 Washington State Cancer Registry since 1992 15 passive collection 1979-1994
active collection since 1995
Stopped or Passive Collection of Benign Tumor Data1 New Jersey State Cancer Registry stopped 1979-1995 2 Kansas Cancer Registry stopped 1969-1995 3 New Hampshire State Cancer Registry stopped 1986-1991 4 District of Columbia Cancer Registry stopped 1997 5 Wyoming Cancer Surveillance Program stopped 111996 6 Louisiana Tumor Registry stopped 1992 (passive collection) 7 Illinois State Cancer Registry stopped 111996 8 Missouri Cancer Registry passive collection since 1984 9 South Carolina Central Cancer Registry passive collection since 1996
Beginning Collection of Benign Tumor Data1 North Dakota Cancer Registry began collection 1997 2 Rhode Island Cancer Registry began collection 1998
Page 42
Endash
APPENDIX E
Codes for Primary Intracranial and Central Nervous System Tumors
Note For this report the designation of ldquoprimary intracranial and central nervous system tumorsrdquo includes thefollowing primary tumors of central nervous system sites as well as tumors of the pituitary and pinealglands All histology types within the topography codes are included in the designation of ldquoprimaryintracranial and CNS tumors The source for the topography codes is Percy C Van Holten V Muir Ceds International Classification of Diseases for Oncology Second Edition Geneva World Health Organization 1990
Intracranial tumors
Brain C710 Cerebrum C711 Frontal lobe C712 Temporal lobe C713 Parietal lobe C714 Occipital lobe C715 Ventricle NOSC716 Cerebellum NOS C717 Brain stem C718 Overlapping lesion of brain C719 Brain NOS
Meninges C700 Cerebral meninges C709 Meninges NOS
a
Cranial Nerves and other intracranial parts of the central nervous systemC722 Olfactory nerve C723 Optic nerve C724 Acoustic nerve C725 Cranial nerve NOS C728 Overlapping lesion of brain and central nervous system C729 Nervous system NOS
Other endrocrine glands and related structures C751 Pituitary gland C752 Craniopharyngeal duct C753 Pineal gland
Extracranial tumors
Spinal cord C720 Spinal cord C721 Cauda equina
Meninges C701 Spinal meninges
aNOS=Not Otherwise Specified
Page 43
Endash
DATA COLLECTION
OF PRIMARY
CENTRAL NERVOUS
SYSTEM TUMORS
Brain Tumor Histology Groupings
The following histology groupings were used for the primary intracranial and central nervoussystem tumors The source for the histology groupings is Central Brain Tumor Registry ofthe United States (CBTRUS) 1996 Statistics Report Table 4
WHOa HISTOLOGY GROUPINGS ICD-Ob MORPHOLOGY CODE
Diffuse astrocytoma (protoplasma fibrillary) 9410 9420 Anaplastic astrocytoma 9401 9411 Glioblastoma 9440 9441 9442 Pilocytic astrocytoma 9421 Unique astrocytoma variants 9383 9384 9424 Oligodendroglioma 9450 Anaplastic oligodendroglioma 9451 9460 Ependymomaanaplastic ependymoma 9391 9392 9393 Ependymoma variants 9394 Mixed glioma 9382 Astrocytoma NOSc 9400 Glioma malignant NOS 9380 Choroid plexus 9390 Neuroepithelial 9381 9423 9430 Benign neuronalglial neuronal and mixed 86801 8693 9490 9505 9506 Malignant neruonalglial neuronal and mixed 86803 9364 9490 9500 Pineal parenchymal 9360 9361 9362 Embryonalprimitivemedulloblastoma 8963 9470 9471 9472
9473 9501 9502 9503 9510
TUMORS OF NEUROEPITHELIAL TISSUE
TUMORS OF CRANIAL AND SPINAL NERVES Nerve sheath benign and malignant 9540 9550 9560 9570
TUMORS OF THE MENINGES Meningioma 9530 9531 9532 9533 9534 9537 9538 Other mesenchymal benign and malignant 8800 8801 8802 8803 8810 8830 8850 88618900
8910 8990 9133 9150 9240 9480 9481 9536 9539 Hemangioblastoma 9161 9535
LYMPHOMAS AND HEMOPOIETIC NEOPLASMS Lymphoma 9590 9591 9593 9594 9595 9630 9650 9652
9663 9670 9671 9672 9674 9675 9680 9681 9682 9684 9685 9686 9687 9690 9691 96939695 9696 9698 9702 9714 9723 9731 9766 9970
GERM CELL TUMORS Germ cell 8020 9060 9064 9070 9071 9080 9084 9085 9100
CYSTS AND TUMOR-LIKE LESIONS Cysts and heterotopias 9084
TUMORS OF THE SELLAR REGION Pituitary 8040 8l40 8l46 8260 8270 8271 8280
8281 8290 8300 8330 8323 8333 Craniopharyngioma 9350
Page 44
Endash
APPENDIX E
LOCAL EXTENSIONS FROM REGIONAL TUMORS Chordomachondrosarcoma 9370
UNCLASSIFIED TUMORS Hemangioma 9120 9121 9130 9131 Neoplasm benign 80000 8010 Neoplasm uncertain behavior 80001 80011 Neoplasm malignant 80003 80013 8002 8003 All other 8720 9580
aWHO = World Health OrganizationbICD-O = International Classification of Diseases for Oncology Second Edition 1990 cNOS=Not Otherwise Specified
Page 45
Endash
DATA COLLECTION
OF PRIMARY
CENTRAL NERVOUS
SYSTEM TUMORS
Endash
International Classification of Childhood Cancer (ICCC)
Diagnostic Group
ICD-Oa codes
Morphology Topography
I LEUKAEMIA
(a) Lymphoid leukaemia 9820-9827 9850
(b) Acute non-lymphocytic leukaemia 9840 9841 9861 9864 9866 9867 98919894 9910
(c) Chronic myeloid leukaemia 9863 9868
(d) Other specified leukaemias 9830 9842 9860 9862 9870-9890 9892 98939900 9930-9941
(e) Unspecified leukaemias 9800-9804
II LYMPHOMAS AND OTHER RETICULOENDOTHELIAL NEOPLASMS
(a) Hodgkinrsquos disease 9650-9667
(b) Non-Hodgkinrsquos lymphoma 9591-9595 9670-9686 9690-9714 9723
(c) Burkittrsquos lymphoma 9687
(d) Miscellaneous lymphoreticular neoplasms 9720 9731-9764
(e) Unspecified lymphomas 9590
III CENTRAL NERVOUS SYSTEM (CNS) ANDMISCELLANEOUS INTRACRANIAL AND
INTRASPINAL NEOPLASMSb
(a) Ependymomac 9383 9390-9394
(b) Astrocytoma 9380 C723
9381 9400-9441
(c) Primitive neuroectodermal tumours 9470-9473
(d) Other gliomasd 9380 C700-C722C724-C729
9382 9384
9442-9460 9481
APPENDIX E
Diagnostic Group
ICD-Oa codes
Morphology Topogragphy
III CNS AND MISCELLANEOUS INTRACRANIAL AND INTRASPINAL
NEOPLASMSb Continued
(e) Miscellaneous intracranial and intraspinalneoplasmsc
8270-8281 8300 9350-9362 9480 95059530-9539
(f) Unspecified intracranial and intraspinalneoplasmsc
8000-8004 C700-C729C751-C753
IV SYMPATHETIC NERVOUS SYSTEM TUMOURS
(a) Neuroblastoma and ganglioneuroblastoma 9490 9500
(b) Other sympathetic nervous system tumours 8680 8693-8710 9501-9504 9520-9523
aInternational Classification of Diseases for Oncology Second Edition World Health Organization 1990bGroup III excludes all lymphomas See group II cBehaviour codes 0 and 1 are included dBehaviour code 1 is included
Page 47
Endash
Comments and recommendations are welcome Should questions arise on how to use these
materials or for more information please contact
Centers for Disease Control and Prevention National Program of Cancer Registries
4770 Buford Hwy NE Mail Stop K-53
Atlanta GA 30042-3717
Voice Information System 1 (888) 842-6355 bull Fax (770) 488-4760
cancerinfocdcgov bull httpwwwcdcgovcancer
All materials are in the public domain and may be reproduced or copied without permission citation
to source however is appreciated
BACK COVER
(WHITE)
Spine(WHITE)
DATA COLLECTION OF PRIMARY CEN
TRAL NERVOUS SYSTEM
TUM
ORS 2004
National Program of Cancer Registries Training M
aterials
DATA COLLECTION
OF PRIMARY
CENTRAL NERVOUS
SYSTEM TUMORS
Endash
related to better diagnostic technology and the introduction of support programs such as
Medicare that facilitate diagnostic procedures in the elderly17 Another study attributed the
rising primary malignant brain tumor mortality to differential survival and its effect on the
surviving gene pool in an aging population28
Survival
Prognosis for CNS tumors depends on at least four variables tumor histopathology
anatomic location patient age and neurologic status5 According to a recent analysis using
SEER data from 1973-1991 overall survival rates for malignant brain tumors and rates for
patients with three specific histological types -- astrocytoma medulloblastoma and
oligodendroglioma -- improved29 Few data are available for survival rates for nonmalignant
primary intracranial and CNS tumors However Surawicz et al used data from the National
Cancer Data Base (NCDB) a joint project of the Commission on Cancer (COC) of the
American College of Surgeons (ACoS) and the American Cancer Society to examine survival
rates for patients diagnosed from 1985-1988 and from 1990-1992 with malignant or benign
brain tumors30 NCDB collects data from hospital tumor registries Based on the records of
more than 60000 patients the authors found a 216 percent 5-year survival rate for patients
with malignant tumors and a 724 percent rate for those with benign tumors The most
favorable prognosis was associated with neurilemmomas pilocytic astrocytomas and
meningiomas In contrast microgliomas lymphomas malignant gliomas and anaplastic
astrocytomas were associated with a poor outcome Surawicz et al also found variations in
survival for some tumors depending on location For example survival rates for
glioblastomas which generally have a poor prognosis improved if the tumors were located in
the cerebellum similarly astrocytomas and anaplastic astrocytomas were associated with a
better outcome if the tumors were in the ventricles or the cerebellum
Risk Factors
Although malignant and nonmalignant intracranial and CNS tumors have undergone
considerable study etiologic and pathophysiologic details concerning their genesis remain
obscure Definite genetic predispositions for the development of brain tumors have been
identified however population-based studies suggest that no more than 4 percent of these
Page 14
APPENDIX E tumors can be attributed to heredity 31 Several environmental carcinogens may be associated
with brain tumors including ionizing radiation11 electromagnetic fields32 and pesticides33
sustained exposure to vinyl chlorides polycyclic hydrocarbons and nitrosoureas has been
implicated as well5 Also the presence of the Epstein-Barr virus contained in the DNA of
primary lymphoma suggests that a viral etiology for human brain tumors cannot be entirely
ignored5 Accurate and complete data are necessary to develop hypotheses to identify the
causes of intracranial and CNS tumors The heterogeneity of brain tumors may mask the
identification of causes when histology-specific studies are limited by the number of available
cases
Surveillance
Population-based cancer registries generally provide incidence rates and trends for
cancer surveillance purposes and support related clinical and epidemiological research To
receive accreditation from the COC hospital cancer registries are required to report only
in situ and primary malignant tumors for all sites including the brain and other CNS sites34
Because data collection for nonmalignant intracranial and CNS tumors is not standardized at
either the central tumors can be attributed to heredity or hospital registry level collecting data
for all primary intracranial tumors is a challenge
In 1997 CBTRUS conducted a state survey (Appendix A) of benign brain and other
CNS tumor collection35 This survey gathered information from 64 member registries of the
North American Association of Central Cancer Registries (NAACCR) representing 48 states
All 64 of the registries collected data for primary malignant brain and other CNS tumors
however only 15 state registries collected data for nonmalignant (ie benign) tumors at the
time of the survey Seven state registries had stopped collecting data for benign brain and
other CNS tumors three collected the data passively one had started to collect the data in
1997 and one planned to start in 1998The majority of the registries surveyed indicated that
the requirements of their brain and other CNS tumor data collection had not been altered in
the past 5 years
Page 15
Endash
DATA COLLECTION
OF PRIMARY
CENTRAL NERVOUS
SYSTEM TUMORS
Endash
METHODS
To analyze available data on issues related to the collection of data for primary
intracranial and CNS tumors the BTWG examined surveillance data from CBTRUS the
Minnesota Cancer Surveillance System (MCSS) NCDB and SEER (Table 1) The NCDB
includes cases from all 50 states the District of Columbia and Puerto Rico however it is not
population-based CBTRUS MCSS and the SEER Program are population-based registries
that cover selected areas of the US Three SEER areas collect information for benign and
uncertain (ie nonmalignant) brain tumors but they do not report it Currently however
there are no standard definitions for the collection of site and type among the areas CBTRUS
MCSS and NCDB collect information on both malignant and nonmalignant primary brain
tumors Because the accessioning of nonmalignant cases for NCDB is not required by COC
only 59 percent of the hospitals that submitted any data to NCDB on intracranialCNS cases
diagnosed during 1989-1994 submitted nonmalignant cases The NCDB data reported here
are restricted to those hospitals that reported at least one nonmalignant case as these cases
were thought to contribute most toward the purpose of this report Also although MCSS
collects data for both malignant and nonmalignant tumors it does so for microscopically-
confirmed cases only This registry performs 100-percent case finding audits in all pathology
laboratories in Minnesota
Data inclusion criteria were developed as specified in Appendix B and all four of the
resources (ie CBTRUS MCSS NCDB SEER) developed subsets of their currently
available data according to the agreed-upon inclusion criteria Frequencies and proportions
were computed to reflect variations in factors other than site and the resulting contrasts
across these registries broadly reflect data collection practices For example the primary
difference in brain and CNS definition between SEER and CBTRUS lies in reporting by
behavior with the latter including all nonmalignant tumors As such differences in
proportions between these two registries approximately reflect the magnitude of nonmalignant
brain and CNS tumors Similarly the primary difference in brain and CNS definition between
MCSS and CBTRUS is that the former requires microscopic confirmation of all tumors and
the latter includes clinically and radiologically diagnosed tumors Another important difference
Page 16
APPENDIX E between MCSS and CBTRUS is that MCSS uses a more active method for case finding
Therefore differences in proportions reported reflect the interaction between the magnitude of
nonmicroscopically diagnosed tumors and the magnitude of incomplete case finding of certain
tumor types in CBTRUS Finally the primary difference between NCDB and CBTRUS is that
the former is a hospital-based reporting system and the latter is a population-based reporting
system Therefore differences in proportions may largely reflect referral biases inherent in
hospital reporting systems While other data collection practices may influence information in
these data resources these data bases were selected to highlight the variation in current
information on primary brain and CNS tumors that arises without a standard definition
Frequencies were computed using ICD-O codes for topography (ie location)
behavior diagnostic confirmation histology and selected combinations of behavior and
topography codes Topography was broadly defined into two main categories with
subcategories as shown in Appendix B Intracranial tumors included tumors located in the
brain and other CNS regions (including the cranial nerves) in the meninges and in the
pituitary and pineal glands Extracranial tumors included those located in the spinal cord and
spinal meninges The distinction between intracranial and extracranial tumors was removed for
Table 7 by collapsing brain and spinal meninges into one category and combining the pituitary
and pineal glands into one group (as these regions have endocrine functions) to allow for
adequate numbers within categories of behavior For Table 10 the intracranial and extracranial
distinction was maintained however the pituitary and pineal glands were collapsed into one
category and the spinal cord and spinal meninges were collapsed into the extracranial
category
Behavior was coded using ICD-O categories 0 for benign 1 for uncertain and 3 for
malignant with the first two of these categories collapsed into a nonmalignant category
Microscopic confirmation is based on the SEER definition and grouped into positive
microscopic confirmation radiography without microscopy clinical and unknown These
categories were further grouped as microscopically confirmed and as not microscopically
confirmed for the analysis in Table 3
Page 17
Endash
DATA COLLECTION
OF PRIMARY
CENTRAL NERVOUS
SYSTEM TUMORS
Endash
CBTRUS developed preliminary histology groupings with the aim of improved clinical
relevance ICD-O morphology codes which are used by cancer registries were grouped
based on WHO categories for brain tumors The details of these groupings are shown in
Appendix C
RESULTS
Percentages of Primary Intracranial and CNS Tumors by Tumor Location and by
Microscopic Confirmation
Intracranial tumors comprise more than 94 percent of primary intracranial and CNS
tumors and between 50 and 92 percent of primary intracranial and CNS tumors occur in the
brain (Table 2) The data in this report also show that a slightly greater percentage of
malignant intracranial tumors including malignant brain tumors are microscopically
confirmed compared with corresponding tumors of benign or uncertain behavior (Table 3)
However regardless of tumor behavior the percentages of extracranial CNS tumors that are
microscopically confirmed are higher than the percentages of intracranial tumors that are
confirmed by pathologists (Table 3) Few primary intracranial and CNS tumors are not
microscopically confirmed approximately 11 percent of diagnoses are based only on a clinical
or radiographical (without microscopy) assessment (Table 4)
Percentages of Malignant and of Nonmalignant Intracranial and CNS Tumors by Location
The relative distribution of nonmalignant intracranial and CNS tumors varies by
primary site While greater than 90 percent of malignant intracranial and CNS tumors occur
in the brain (Table 5) only 9 to 26 percent of the nonmalignant tumors occur as parenchymal
tumors (Table 6) Nonmalignant tumors comprised a significant portion of the primary
intracranial and CNS tumors reported by the sources The ratios of nonmalignant to primary
malignant intracranial and CNS tumors reported by CBTRUS MCSS and NCDB were 09
10 and 05 respectively (Table 7)
Percentages of Malignant and of Nonmalignant Intracranial and CNS Tumors by Histology
Among the malignant primary intracranial and CNS tumors neuroepithelial (ie
astrocytic) tumors represent 83 to 90 percent of the cases depending on the data source
Page 18
APPENDIX E lymphomashemopoietic tumors 6 to 11 percent tumors of the meninges 1 to 2 percent and
tumors of cranial and spinal nerves 02 percent (Table 8) For nonmalignant primary
intracranial and CNS tumors tumors of the meninges represent 48 to 59 percent of the cases
tumors of the sellar region (including pituitary tumors and craniopharyngiomas) 21 to 26
percent tumors of cranial and spinal nerves 11 to 20 percent and neuroepithelial tumors 4 to
5 percent (Table 9)
Percentages of Primary Intracranial and CNS Tumors by Method of Case Finding (MCSS)
Case finding audits by the MCSS occur on an annual basis in all pathology laboratories in
Minnesota and include the review of surgerypathology cytology autopsy and hematology
records These audits enable the registry to ensure that there is complete reporting of cases of
malignant and nonmalignant tumors In tables 10 through 13 data from MCSS on primary
intracranial and CNS tumors are presented by method of case finding The two methods of case
finding are routine reporting and special efforts A case was found by routine reporting if one
or more reports received before the close-out date for a given diagnosis year was initiated by a
hospital or nonhospital facility In contrast a case was found by special efforts if all reports of that
case received before the close-out date were requested as a result of pathology laboratory audits
The data in Table 10 indicate that routine reporting of nonmalignant tumors was less complete
compared with reporting for malignant tumors The percentages of intracranial tumor cases that
were found by special efforts have varied from year to year but the trend suggests that routine
reporting may be improving (Table 11) The greatest improvement has been in the coverage of
nonbrain parenchymal tumors (ie pituitarypineal and other intracranial) The small numbers of
autopsy-only tumors were more likely to be found by special case finding efforts than by other
methods of microscopic confirmation (data not shown)
Most hospitals in Minnesota have cancer registries through which their tumor cases are
reported However some of the cases that are seen at hospitals with registries are reported only
through pathology laboratories affiliated with the hospitals Approximately 80 percent
(14511776) of the cases of nonmalignant intracranial tumors in the MCSS data base were
reported by hospitals with registries (Table 12) eighty-five percent (12261451) of these cases
were reported by the hospitals registries (Table 13)The remaining 15 percent (2251451) of the
Page 19
Endash
DATA COLLECTION
OF PRIMARY
CENTRAL NERVOUS
SYSTEM TUMORS
Endash0
cases were reported through the pathology laboratories affiliated with the hospitals with registries
(ie they were not accessioned by the registries) (Table 13) The percentages of cases of
nonmalignant tumors that were reported only by the pathology laboratories at facilities having
cancer registries can be viewed as a measure of how frequently the registries failed to accession
the cases Of the 225 nonaccessioned tumors half would have been missed without the MCSS
case finding audits of pathology laboratories (Table 13)
Percentages of Hospital Cancer Registries That Accessioned Malignant and Nonmalignant
Intracranial and CNS Tumors (NCDB)
Based on data from NCDB more than 1500 hospitals accessioned cases with either
malignant or nonmalignant intracranial and CNS tumors and approximately 800 hospitals
accessioned extracranial cases Cases with tumors that involved the cranial or spinal meninges or
the pituitary gland were more likely to be reported by hospitals that accessioned nonmalignant
primary intracranial and CNS tumors than by hospitals that accessioned only malignant tumors
(Table 14)
DISCUSSION
The findings for this report indicate that collection and reporting of incidence data for
primary malignant intracranial and other CNS tumors are well standardized However substantial
variation exists in the processes of collecting and reporting nonmalignant tumor data One
obstacle is that not all hospitals have cancer registries Another problem is that not all hospitals
with registries accession cases of nonmalignant tumors Data from Minnesota (Table 13) suggest
that approximately 85 percent of cases of nonmalignant intracranial tumors are accessioned by
hospital registries However nonaccessioned CNS cases are less likely to be routinely reported to
the central registry (Table 13) These differences in collection and reporting practices among the
registries make it difficult to assess the burden of primary intracranial and CNS tumors
Terminology for describing intracranial and CNS tumors is also not standardized For
example although the pituitary gland and pineal glands are not technically part of the CNS
tumors that involve these organs are often included in the term CNS tumors On the other hand
some consider the eye to be intracranial however CNS tumors generally do not include the
Page 20
APPENDIX E eyes Although the World Health Organization (WHO) has published a list of histologic
groupings at present no single comprehensive list of histologic groupings exists for intracranial
and CNS tumors Since the International Classification of Childhood Cancer (ICCC) is based on
histologic type rather than site certain benign histologies of sites other than brainCNS (eg non-
CNS ependymomas) would not be included in the BTWGs primary intracranial and CNS
histology groupings (Appendix D) Thus the variation in incidence estimates of primary
intracranial and CNS tumors may be attributable in part to the variation in the definitions of
these tumors In addition differences in cancer registry training and procedures may contribute to
nonreporting and inconsistent reporting of the tumors
The BTWG discussed the feasibility of conducting a random sampling procedure as an
alternative to complete enumeration and ongoing surveillance of nonmalignant brain tumors It
was agreed that this technique would not be valid or feasible for the following reasons
1 If a random sample of incident brain tumors were desired a complete list would be
needed first (a sampling frame is required)
2 If a survey method were used to identify brain tumors in the general population (eg
random digit dialing or other general population survey techniques) the information
needed could not be obtained for several reasons
- Either a prohibitively large numbers of individuals would have to be surveyed or
else only a very small number of brain tumors could be identified given the rarity
and sometimes short survival time
- The brain tumors identified would not be representative of all brain tumors that
occur because people who had survived their brain tumors would be more
likely to be identified
- The incidence rate would still not be known since cross-sectional surveys only
identify disease prevalence
3 If a sample of hospitals were selected to contribute data the tumors included would not
represent the entire spectrum of brain tumors because those that were diagnosed and
treated outside of the hospital setting would be excluded
Page 21
Endash
DATA COLLECTION
OF PRIMARY
CENTRAL NERVOUS
SYSTEM TUMORS
Endash
An alternative approach to sampling and the least troublesome would be to conduct
population-based surveillance only in certain geographic areas of the country If one assumes that
the etiology of brain tumors does not differ from one area of the country to another then the
scientific validity of studies based on this type of sampling would not be a problem However
given the rarity of some types of brain tumors sufficient numbers for study may not be available
unless the vast majority of the nations population were covered by population-based data
collection Also geographic areas without population-based surveillance would have no data to
use for assessing local trends or variations in brain tumor occurrence
In the absence of standard tumor registration procedures and training special case finding
efforts by central registries may be necessary to ensure that complete data are collected for
nonmalignant intracranial and CNS tumors Data from MCSS (Table 10) which has a legal
requirement for reporting nonmalignant intracranial tumors and performs 100 percent case finding
audits in all laboratories indicate that only 80 percent of nonmalignant tumors were routinely
reported In contrast routine reporting accounted for more than 95 percent of malignant
intracranial and CNS tumors Nonmalignant cases in Minnesota that were not accessioned by
hospital registries had a 50 percent chance of being routinely reported to the central registry
however these were only microscopically confirmed cases
Completeness of reporting is critical to cancer registries Accurate case counts are
necessary to assess the burden of cancer to guide cancer control program planning to prioritize
the allocation of health resources and to facilitate epidemiologic research Most central cancer
registries have state laws that mandate reporting of cases by physicians and by hospitals
laboratories and other facilities that provide screening diagnostic or therapeutic services
Complete reporting of nonmalignant intracranial and CNS tumors would be greatly
improved if reporting requirements of the COC central cancer registries SEER and the
National Program of Cancer Registries (NPCR) were changed to require the collection of
information for these tumors However this requirement would have many implications
including an increase in work load as well as associated costs for reporting facilities An estimated
14 percent of all new cancer cases diagnosed in 1998 will involve invasive brain and other
nervous system tumors7 since the numbers of benign and invasive brain and other CNS tumors
Page 22
Endash
APPENDIX E diagnosed annually are similar facilities that presently do not accession nonmalignant cases could
expect an approximately 14 percent increase in the total number of CNS cases collected by the
registry Some estimates of the percentage of brain tumors have been lower (05 percent)36 and
others have been higher (9 percent)37 therefore the extent to which the workload would be
affected may vary The data in this report suggest that if reporting of nonmalignant intracranial
and CNS tumors were required the total number of cases of tumors for these anatomic sites
would double for facilities that presently report only malignant tumors This is consistent with the
findings of Davis et al36 who reported that the incorporation of benign brain tumors into the
cancer-reporting systems of four central registries increased the overall incidence of brain cancer
by 49 percent Forty percent (913) of the hospital registries that submitted data to the NCDB did
not report nonmalignant brain tumors These registries could expect up to a 50 percent increase in
the number of intracranial and CNS tumors reported nonregistry facilities which represent
approximately 20 percent of cases reported to central cancer registries could expect a similar
increase Also central cancer registries that currently do not require reporting of nonmalignant
intracranial and CNS tumors could expect increases in their workloads as a result of the
additional time spent on processing and quality control procedures and training The lack of
standard definitions and collection and reporting guidelines would make these tasks more time-
consuming as well
For some central cancer registries that want to expand their reporting requirements to
include nonmalignant intracranial and CNS tumors a change in current legislation andor
regulations may be needed These changes could involve several months of lead time if public
hearings or other legal procedures are necessary In other states the reporting of these tumors is
not required in either their legislation or regulations in these situations hospitals have been asked
to voluntarily report the cases For example in Massachusetts the reporting of benign brain
tumors is not required by law but hospitals have been reporting these cases since 1982 However
the completeness of data reported on a voluntary basis is difficult to assess For public health
surveillance systems a mandate to report is the basic requirement of a comprehensive higher
quality system
DATA COLLECTION
OF PRIMARY
CENTRAL NERVOUS
SYSTEM TUMORS
If COC SEER NPCR and central cancer registries changed their reporting requirements
to include nonmalignant intracranial and CNS tumors the registry manuals disseminated by these
programs and registries would also need to be modified to include new definitions of reportable
diagnoses All reporting facilities would have to be notified of the new requirements To ensure
complete reporting from registries additional training of registrars should be expected Case
finding methods may need to be modified in order to identify the new cases and sources of
information Central cancer registries would also need to increase their case finding audits The
inclusion of nonmalignant tumors would also necessitate changes to other data items such as
sequence number Hospital and central cancer registries would need to consider adding WHO
brain tumor grade as an additional data item
Finally the software used by reporting facilities and by central registries would need to be
modified to accept nonmalignant morphology and behavior codes Also edits programs would
need to be modified to include these additions and to accept a nonmalignant sequence numbering
procedure
Before reporting requirements for primary intracranial and CNS tumors could be changed
feasibility studies would have to be conducted to determine whether such changes should be
recommended Two SEER special studies are under way to evaluate the impact of requiring the
collection of benign brain tumors on case finding cost quality control and training However
additional studies may be required
Page 24
Endash
APPENDIX E
RECOMMENDATIONS OF THE BRAIN TUMOR WORKING GROUP
1 We recommend the following standard definition for collecting precise data for all primary
intracranial and central nervous system tumors
Primary intracranial and central nervous (CNS) tumors are primary tumors occurring in
the following sites irrespective of histologic type or behavior brain meninges spinal
cord cauda equina cranial nerves and other parts of the CNS pituitary gland pineal
gland and craniopharyngeal duct (see Appendix B)
2 We recommend the development of a standard site and histology definition for tabulating
estimates of these tumors to allow comparability of information across registries Pathologists
the North American Association of Central Cancer Registries (NAACCR) the Commission
on Cancer (COC) the Surveillance Epidemiology and End Results (SEER) Program the
National Program of Cancer Registries (NPCR) and the International Agency for Research
on Cancer (IARC) need to be involved in developing this standard
3 We recommend collection of data for primary intracranial and extracranial CNS tumors by all
registries hospital- and central-based This effort will necessitate a change in the COC
requirements and will increase costs to the hospital-based programs Federal funding should be
allocated to supplement the additional transition and ongoing data collections costs that will be
incurred by central registries Before additional data collection is implemented we recommend
a pilot study should be conducted to assess the procedures and quality control functions
needed as well as the costs of collecting data for these tumors
4 We recommend that the appropriate government and professional organizations be involved in
carrying out the development and implementation of special training programs and curricula for
central registry hospital registry and laboratory personnel as well as the development of
computerized edit-checking procedures Training for reporting and tabulating primary
intracranial and CNS tumors should be offered on a regular basis
Page 25
Endash
DATA COLLECTION
OF PRIMARY
CENTRAL NERVOUS
SYSTEM TUMORS
Endash
REFERENCES
1 Davis F Preston-Martin S Epidemiology of brain tumors In Bigner DD McLendon RE Bruner JM eds Russell and Rubinsteins pathology of tumors of the nervous system ed 6 London Arnold Publishing 19965-45
2 World Health Organization (WHO) (1976) International classification of diseases foroncology ed 1 Geneva World Health Organization
3 World Health Organization (WHO) (1990) International classification of diseases foroncology ed 2 Geneva World Health Organization
4 Kleihues P Burger PC Scheithauer BW The new WHO classification of brain tumorsBrain Pathol 19933255-268
5 Thapar K Laws ER Tumors of the central nervous system In Murphy GP Lawrence WJr Lenhard RE Jr eds Textbook of clinical oncology ed 2 Atlanta American CancerSociety 1995378-410
6 Walker AE Robins M Weinfield FD Epidemiology of brain tumors the national survey ofintracranial neoplasms Neurol 198535219-226
7 Ries LAG Kosary CL Hankey BF Miller BA Edwards BK (eds) SEER Cancer StatisticsReview 1973-1995 National Cancer Institute Bethesda MD 1998
8 Cancer Facts amp Figures - 1998 American Cancer Society Atlanta Georgia 19989 Davis FG Bruner JM Surawicz TS The rationale for standardized registration and reporting
of brain and central nervous system tumors in population-based cancer registriesNeuroepidemiol 199716308-316
10CBTRUS (1996) First annual report 1995 Central Brain Tumor Registry of the UnitedStates Chicago Illinois
11 Preston-Martin S Epidemiology of primary CNS neoplasms Neurol Clinics 199614273-290
12 Greig NH Ries LG Yancik R Rapoport SI Increasing annual incidence of primary malignantbrain tumors in the elderly J Natl Cancer Inst 1991 831621-1624
13 Mao Y Desmeules M Semenciw RM Hill G Gaudette L Wigle DT Increasing brain cancerrates in Canada Can Med Assoc J 19911451583-1591
14 Frelick R Huang P Topham A Brain and central nervous system tumors Delaware 1980 to1989 Del Med J 199264571-573
15 Davis DL Ahlbom A Hoel D Percy C Is brain cancer mortality increasing in industrialcountries Am J Ind Med 199119421-431
16 Helseth A Increasing incidence of primary central nervous system tumors in the elderly Realincrease or improved detection J Natl Cancer Inst 1993851871-1872
17 Modan B Wagener D Feldman JJ Rosenberg HM Feinleib M Increased mortality frombrain tumors A combined outcome of diagnostic technology and change of attitude towardthe elderly Am J Epidemiol 19921351349-1357
18 Polednak AP Time trends in the incidence of brain and central nervous system cancers inConnecticut J Natl Cancer Inst 1991831679-1681
19 Boyle P Maissonneuve P Saracci R Muir CS Is the increase in incidence of primarymalignant brain tumors real J Natl Cancer Inst 1990201594-1596
Page 26
APPENDIX E 20 Preston-Martin S Descriptive epidemiology of primary tumors of the brain cranial nerves
and spinal meninges in Los Angeles County Neuroepidemiol 19898283-29521 Helseth A Mork SJ Neoplasms of the central nervous system in Norway Epidemiological
characteristics of intracranial gliomas according to histology APMIS 97 1989547-55522 Gurney JG Davis S Severson RK Fang J-Y Ross JA Robison LL Trends in cancer
incidence among children in the United States Cancer 199678532-54123 Gurney JG Ross JA Wall DA Bleyer WA Severson RK Robison LL Infant cancer in the
US histology-specific incidence trends 1973-1992 J Pediatr Hem Onc 199719428-43224 Nishio S Takeshita I Morioka T Fukui M Primary intracranial squamous cell carcinomas
report of two cases Neurosurgery 199537329-33225 Freilich RJ Thompson SJ Walker RW Rosenblum MK Adenocarcinomatous transformation
of intracranial germ cell tumors Am J Surg Pathol 199519537-54426Yuan S Miller DW Barnett GH Hahn JF Williams BR Identification and characterization of
human beta 2-chimaerin association with malignant transformation in astrocytoma CancerResearch 1995 553456-3461
27 Preston-Martin S Mack WJ Neoplasms of the nervous system In Schoenfeld D Fraumeni JFJr eds Cancer epidemiology and prevention ed 2 New York Oxford University Press19961231-1281
28 Riggs JE Rising primary malignant brain tumor mortality in the elderly A manifestation ofdifferential survival Arch of Neurol 199552571-575
29 Davis FG Freels S Grutsch J Barlas S Brem S Survival rates in patients with primarymalignant brain tumors stratified by patient age and tumor histological type an analysisbased on Surveillance Epidemiology and End Results (SEER) data 1973-1991J Neurosurg 1998881-10
30 Surawicz TS Davis F Freels S Laws ER Menck HR Brain tumor survival results from theNational Cancer Data Base (Accepted for publication in J Neuro-Oncol)
31 Bondy ML Lustbader ED Buffler PA Schull WJ Hardy RJ Strong LC Geneticepidemiology of childhood brain tumors Genet Epidemiol 19918253-267
32 Preston-Martin S Monroe K Lee P Bernstein L Kelsey J Henderson S Forrester DHenderson B Spinal meningiomas in women in Los Angeles County Investigation of anetiologic hypothesis Cancer Epidemiol Biomarkers Prev 19954333-339
33 Davis JR Brownson RC Garcia R Bentz BJ Turner A Family pesticide use and childhoodbrain cancer Arch Environ Contam Toxicol 19932487-92
34 Commission on Cancer General principles and coding In Standards of the Commission on Cancer vol II Registry Operations and Data Standards American College of SurgeonsChicago Illinois 1996
35 Central Brain Tumor Registry of the United States (CBTRUS) 1997 State Survey of BenignBrain Tumor Collection Chicago Illinois 1997
36 Davis FG Malinski N Haenszel W Chang J Flannery J Gershman S Dibble R Bigner DDPrimary brain tumor incidence rates in the four United States regions 1985-1989 A pilotstudy Neuroepidemiol 199615103-112
37 Schoenberg BS Christine BW Whisnant JP The descriptive epidemiology of primaryintracranial neoplasms the Connecticut experience Am J Epidemiol 1976104499-510
Page 27
Endash
DATA COLLECTION
OF PRIMARY
CENTRAL NERVOUS
SYSTEM TUMORS
TAB
LE 1
C
OM
PAR
ISO
N O
F R
EGIS
TRIE
S SU
PPLY
ING
DA
TA O
N P
RIM
AR
Y I
NTR
AC
RA
NIA
L A
ND
CEN
TRA
L N
ERV
OU
S SY
STEM
TU
MO
RS
IN T
HE
UN
ITED
STA
TES
Cen
tral B
rain
Tum
or R
egis
try o
fth
e U
nite
d St
ates
(CBT
RUS)
Min
neso
ta C
ance
rSu
rvei
llanc
e Sy
stem
(MC
SS)
ACo
SN
a tio
nal C
ance
r Dat
a B
ase
(NCD
B)
Surv
eilla
nce
Epid
emio
logy
and
End
Res
ults
Pro
gram
(SEE
R)
Purp
ose
ldquoCB
TRU
S ce
ntra
lizes
pop
ulat
ion-
base
d in
cide
nce
data
on
all b
rain
tum
ors a
nd u
ses o
ther
exi
stin
gda
ta re
sour
ces t
o ch
arac
teriz
e th
ein
cide
nce
mor
talit
y a
nd su
rviv
alof
pat
ient
s with
bra
in tu
mor
s rdquo
The
MC
SS c
olle
cts i
nfor
mat
ion
onal
l can
cers
dia
gnos
ed si
nce
1988
amon
g M
inne
sota
resi
dent
s Th
e M
CSS
is p
opul
atio
n-ba
sed
path
olog
y-ba
sed
and
is a
n ac
tive
syste
m
ldquoThe
goa
l of t
he N
CD
B is
to p
rese
nt a
n an
nual
sum
mar
y of
pat
ient
car
e fo
r cas
es o
f can
cer
diag
nose
d an
d tre
ated
at h
ospi
tals
thro
ugho
utth
e co
untry
rdquo
ldquoA c
ontin
uing
pro
ject
of th
e N
CI
the
SEER
prog
ram
col
lect
sca
ncer
dat
a on
aro
utin
e ba
sis f
rom
desi
gnat
ed p
opul
atio
n-ba
sed
canc
er re
gist
ries
in v
ario
us a
reas
of t
heco
untry
Targ
et p
opul
atio
n Th
e po
pula
tions
cov
ered
by
regi
strie
s in
Ari
zona
Col
orad
oC
onne
ctic
ut D
elaw
are
Idah
oM
aine
Mas
sach
uset
ts
Min
neso
ta M
issou
ri M
onta
na
Nor
th C
arol
ina
and
Uta
h
The
CB
TRU
S po
pula
tion
repr
esen
ts a
non
rand
om 1
5pe
rcen
t sam
ple
of th
e U
S
popu
latio
n
The
popu
latio
n of
Min
neso
ta
The
popu
latio
ns tr
eate
d at
par
ticip
atin
gho
spita
ls in
the
50 st
ates
the
Dist
rict
of
Col
umbi
a a
nd P
uert
o R
ico
NC
DB
is n
ot a
pop
ulat
ion-
base
d re
gist
ry
At
pres
ent
it is
est
imat
ed to
cov
er a
ppro
xim
atel
y57
per
cent
of t
otal
cas
es n
atio
nwid
e
The
popu
latio
nsco
vere
d by
the
state
regi
strie
s in
Con
nect
icut
Haw
aii
Iow
a N
ew M
exic
o
and
Uta
h a
s wel
l as
the
regi
onal
regi
strie
sin
Atla
nta
Geo
rgia
D
etro
it M
ichi
gan
San
Fran
cisc
o-O
akla
nd C
alifo
rnia
an
d Se
attle
-Pug
etSo
und
Was
hing
ton
The
SEER
pop
ulat
ion
repr
esen
ts a
nonr
ando
m 1
4 pe
rcen
tsa
mpl
e of
the
US
po
pula
tion
Page
28
Endash
APPENDIX E
Cen
tral B
rain
Tum
or R
egis
try o
fth
e U
nite
d St
ates
(CBT
RUS)
Min
neso
ta C
ance
rSu
rvei
llanc
e Sy
stem
(MC
SS)
ACo
SN
a tio
nal C
ance
r Dat
a B
ase
(NCD
B)
Surv
eilla
nce
Epid
emio
logy
and
End
Res
ults
Pro
gram
(SEE
R)
Type
of
prim
ary
intra
cran
ial
and
cent
ral n
ervo
us sy
stem
tum
ors r
epor
ted
Dat
a on
new
ly-d
iagn
osed
cas
es o
fbe
nign
and
mal
igna
nt p
rimar
ybr
ain
tum
ors b
ased
on
ICD
-Oco
des
Dat
a on
new
ly-d
iagn
osed
m
i cro
scop
ical
ly-c
onfir
med
tum
ors
of th
e ce
ntra
l ner
vous
syste
m
incl
udin
g pi
tuita
ry a
nd p
inea
lgl
ands
Hos
pita
ls v
olun
taril
y su
bmit
full
anal
ytic
canc
er re
gist
ry c
asel
oads
with
dat
a ite
ms a
ndco
des d
efin
ed b
y th
e C
omm
issio
n on
Can
cer
(CO
C) f
or h
ospi
tal c
ance
r reg
istri
es
Mos
tpa
rtici
patin
g ho
spita
ls h
ave
prog
ram
sap
prov
ed b
y C
OC
or a
re e
stab
lishi
ng p
rogr
amap
prov
al
NC
DB
cal
ls fo
r dat
a do
not
lim
itca
ses b
y m
alig
nant
beh
avio
r bu
t acc
essi
onin
gof
non
-mal
igna
nt c
ases
is n
ot re
quire
d fo
rpr
ogra
m a
ppro
val
Fifty
-nin
e pe
rcen
t of t
heho
spita
ls th
at su
bmitt
ed a
ny in
tracr
ania
lCN
Sca
ses d
iagn
osed
dur
ing
1989
-199
4 su
bmitt
edat
leas
t one
non
mal
igna
nt c
ase
The
NC
DB
data
in th
is re
port
are
limite
d to
the
case
ssu
bmitt
ed b
y th
ese
hosp
itals
(82
perc
ent o
f all
intra
cran
ial a
nd e
xtra
cran
ial c
entra
l ner
vous
syste
m c
ases
on
file)
Tren
ds in
the
inci
denc
e m
orta
lity
and
patie
nt su
rviv
al o
fbr
ain
tum
ors i
n th
eU
S H
owev
er S
EER
does
not
col
lect
info
rmat
ion
on b
enig
nan
d un
certa
in b
rain
tum
ors
Oth
er c
omm
ents
D
uplic
ate
canc
er re
gist
ratio
ns c
anno
t be
iden
tifie
d by
the
parti
cipa
ting
regi
strie
s
The
MC
SS p
erfo
rms 1
00 p
erce
ntca
se fi
ndin
g au
dits
in a
ll pa
thol
ogy
labo
rato
ries o
n an
ann
ual b
asis
Th
eref
ore
the
data
from
the
MC
SSm
ight
be
cons
ider
ed a
ldquobe
st-ca
sesc
enar
iordquo
in te
rms o
f com
plet
enes
sof
repo
rting
for m
icro
scop
ical
ly-
conf
irmed
tum
ors
Rep
ort d
uplic
atio
n fo
r 198
9-19
94 in
tracr
ania
lan
d ex
tracr
ania
l cen
tral n
ervo
us sy
stem
repo
rts w
as 6
7 p
erce
nt
How
ever
the
NC
DB
data
in T
able
s 2 th
roug
h 9
are
base
d on
undu
plic
ated
repo
rts
Page
29
Endash
DATA COLLECTION
OF PRIMARY
CENTRAL NERVOUS
SYSTEM TUMORS
TABLE 2 NUMBER AND PERCENT OF PRIMARY INTRACRANIAL AND CENTRAL NERVOUS SYSTEM TUMORS BY TUMOR LOCATION
Locationa CBTRUSb
Number () MCSSc
Number () NCDBd
Number () SEERe
Number ()
Intracranial 13084 (947) 3600 (936) 66322 (955) 10196 (969)
Brain 7999 (579) 1924 (500) 48527 (699) 9721 (924)
Meninges 2719 (197) 838 (218) 9365 (135) 139 (13)
Pituitarycraniopharygealduct
1491 (108) 530 (138) 4958 (71) 30 (03)
Pineal 74 (05) 21 (05) 477 (07) 80 (08)
Other central nervous systemincluding cranial nerves
801 (58) 287 (75) 2995 (43) 226 (22)
Extracranial 730 (53) 245 (64) 3137 (45) 322 (31)
Spinal cord 497 (36) 47 (38) 2395 (34) 313 (30)
Spinal meninges 233 (17) 98 (25) 742 (11) 9 (01)
TOTAL 13814 (100) 3845 (100) 69459 (100) 10518 (100)
Note Reported data are incident cases from 1989-1994 except for CBTRUS data which are from 1990-1993
aRefer to the sites in Appendix BbCentral Brain Tumor Registry of the United States cMinnesota Cancer Surveillance System (microscopically confirmed cases only)dNational Cancer Data Base (limited to cases reported by hospitals that accessioned nonmalignant cases) eSurvival Epidemiology and End results Program (malignant cases only)
Page 30
Endash0
TABL
E 3
RO
W P
ERCE
NT
DIS
TRIB
UTI
ON
OF
PRIM
ARY
INTR
ACR
AN
IAL
AN
D C
ENTR
AL
NER
VO
US
SYST
EM T
UM
ORS
BY
TU
MO
R B
EHA
VIO
RA
ND
MIC
ROSC
OPI
C C
ON
FIRM
ATI
ON
Loca
tiona
CB
TRU
Sb M
CSSc
NC
DB
d SE
ERe
Tota
l Pe
rcen
tM
icro
Co
nfirm
ed
Perc
ent
Not
Mic
ro
Conf
irmed
Tota
l Pe
rcen
tM
icro
Co
nfirm
ed
Perc
ent
Not
Mic
ro
Conf
irmed
Tota
l Pe
rcen
tM
icro
Co
nfirm
ed
Perc
ent
Not
Mic
ro
Conf
irmed
Tota
l Pe
rcen
tM
icro
Co
nfirm
ed
Perc
ent
Not
Mic
ro
Conf
irmed
Intra
cran
ial
130
84
867
13
3
360
0 10
0 N
A
663
22
887
11
3
101
96
871
12
9
Mal
igna
nt
717
1 89
2
108
1
824
100
NA
44
801
91
3
87
101
96
871
12
9
Beni
gn a
ndu n
certa
in
591
3 83
5
165
1
776
100
NA
21
521
83
2
168
N
A
NA
N
A
Bra
in
799
9 88
2
118
1
924
100
NA
48
527
90
2
98
972
1 87
3
127
Mal
igna
nt
686
2 89
6
104
1
746
100
NA
42
622
91
5
85
972
1 87
3
127
Beni
gnan
dun
certa
in
113
7 80
6
194
17
8 10
0 N
A
590
5 80
6
194
N
A
NA
N
A
Extra
cran
ial
730
962
3
8 24
5 10
0 N
A
313
7 96
0
40
322
957
4
3
Mal
igna
nt
242
934
6
6 60
10
0 N
A
148
3 96
6
34
322
957
4
3
Beni
gn a
ndu n
certa
in
488
975
2
5 18
5 10
0 N
A
165
4 95
5
45
NA
N
A
NA
TOTA
Lf 13
814
87
2
128
3
845
100
NA
69
459
89
0
110
10
518
87
4
126
Mal
igna
nt
741
3 89
4
106
1
884
100
NA
46
284
91
5
85
105
18
874
12
6
Beni
gn a
ndu n
certa
in
640
1 84
6
154
1
961
100
NA
23
175
84
1
159
N
A
NA
N
A
Not
e R
epor
ted
data
are
inci
dent
cas
es fr
om 1
989-
1994
exc
ept f
or C
BTR
US
data
whi
ch a
re fr
om 1
990-
1993
a Refe
r to
the
site
code
s in
App
endi
x B
b Cent
ral B
rain
Tum
or R
egist
ry o
f the
Uni
ted
Stat
es
c Min
neso
ta C
ance
r Sur
veill
ance
Sys
tem
(mic
rosc
opic
ally
con
firm
ed c
ases
onl
y)
d Nat
iona
l Can
cer D
ata
Base
(lim
ited
to c
ases
repo
rted
by h
ospi
tals
that
acc
essio
ned
nonm
alig
nant
cas
es)
e Surv
eilla
nce
Epi
dem
iolo
gy a
nd E
nd R
esul
ts Pr
ogra
m (m
alig
nant
cas
es o
nly)
f In
clud
es in
tracr
ania
l and
ext
racr
ania
l cas
es
NA
= N
ot a
pplic
able
Page
31
APPENDIX E
Endash
DATA COLLECTION
OF PRIMARY
CENTRAL NERVOUS
SYSTEM TUMORS
TABLE 4 NUMBER AND PERCENT OF PRIMARY INTRACRANIAL AND CENTRAL NERVOUS SYSTEM TUMORS BY DIAGNOSTIC CONFIRMATION
DiagnosticConfirmation
CBTRUSa
Number () MCSSb
Number () NCDBc
Number () SEERd
Number ()
Positive microscopy
12087 (875) 3845 (100) 61818 (890) 9188 (874)
Radiographywithout microscopy
1306 (95) NA 6759 (97) 1015 (97)
Clinical 204 (15) NA 484 (07) 98 (09)
Unknown 217 (15) NA 398 (06) 217 (21)
TOTAL 13814 (100) 3845 (100) 69459 (100) 10518 (100)
Note Reported data are incident cases from 1989-1994 except for CBTRUS data which are from 1990-1993
aCentral Brain Tumor Registry of the United Statesb Minnesota Cancer Surveillance System (microscopically confirmed cases only) cNational Cancer Data Base (limited to cases reported by hospitals that accessioned nonmalignant cases)dSurveillance Epidemiology and End Results Program (malignant cases only)NA = Not applicable
Page 32
Endash
Page 32
TABLE 4 NUMBER AND PERCENT OF PRIMARY INTRACRANIAL AND CENTRALNERVOUS SYSTEM TUMORS BY DIAGNOSTIC CONFIRMATION
DiagnosticConfirmation
CBTRUSa
Number ()MCSSb
Number ()NCDBc
Number ()SEERd
Number ()
Positivemicroscopy
12087 (875) 3845 (100) 61818 (890) 9188 (874)
Radiographywithout microscopy
1306 (95) NA 6759 (97) 1015 (97)
Clinical 204 (15) NA 484 (07) 98 (09)
Unknown 217 (15) NA 398 (06) 217 (21)
TOTAL 13814 (100) 3845 (100) 69459 (100) 10518 (100)
Note Reported data are incident cases from 1989-1994 except for CBTRUS data which are from 1990-1993
aCentral Brain Tumor Registry of the United Statesb Minnesota Cancer Surveillance System (microscopically confirmed cases only)cNational Cancer Data Base (limited to cases reported by hospitals that accessioned nonmalignant cases)dSurveillance Epidemiology and End Results Program (malignant cases only)NA = Not applicable
APPENDIX E
TABLE 5 NUMBER AND PERCENT OF MALIGNANT PRIMARY INTRACRANIAL AND CENTRAL SYSTEM TUMORS BY TUMOR LOCATION
Locationa CBTRUSb
Number () MCSSc
Number () NCDBd
Number () SEERe
Number ()
Intracranial 7171 (977) 1824 (968) 44801 (968) 10196 (969)
Brain 6862 (926) 1746 (927) 42622 (921) 9721 (924)
Meninges 98 (13) 23 (12) 581 (13) 139 (13)
Pituitarycraniopharyngealduct
37 (05) 13 (07) 189 (04) 30 (03)
Pineal 58 (08) 20 (11) 378 (08) 80 (08)
Other central nervous systemincluding cranial nerves
116 (16) 22 (12) 1031 (22) 226 (21)
Extracranial 242 (33) 60 (32) 1483 (32) 322 (31)
Spinal cord 234 (32) 60 (32) 1410 (30) 313 (30)
Spinal meninges 8 (01) 0 73 (02) 9 (01)
TOTAL 7413 (100) 1884 (100) 46284 (100) 10518 (100)
Note Reported data are incident cases from 1989-1994 except for CBTRUS data which are from 1990-1993
aRefer to the site codes in Appendix BbCentral Brain Tumor Registry of the United States cMinnesota Cancer Surveillance System (microscopically confirmed cases only)dNational Cancer Data Base (limited to cases reported by hospitals that accessioned nonmalignant cases) eSurvival Epidemiology and End Results Program (malignant cases only)
Page 33
Endash
DATA COLLECTION
OF PRIMARY
CENTRAL NERVOUS
SYSTEM TUMORS
TABLE 6 NUMBER AND PERCENT OF PRIMARY INTRACRANIAL AND CENTRAL NERVOUS SYSTEM TUMORS OF BENIGN AND UNCERTAIN BEHAVIOR BY TUMOR LOCATION
Locationa CBTRUSb
Number () MCSSc
Number () NCDBd
Number () SEERe
Number ()
Intracranial 5913 (924) 1776 (906) 21521 (929) NA
Brain 1137 (178) 178 (91) 5905 (255) NA
Meninges 2621 (409) 815 (416) 8784 (379) NA
Pituitarycraniopharyngealduct
1454 (227) 517 (264) 4769 (206) NA
Pineal 16 (02) 1 (lt01) 99 (04) NA
Other central nervous systemincluding cranial nerves
685 (107) 265 (135) 1964 (85) NA
Extracranial 488 (76) 185 (94) 1654 (71) NA
Spinal cord 263 (41) 87 (44) 985 (42) NA
Spinal meninges 225 (35) 98 (50) 669 (29) NA
TOTAL 6401 (100) 1961 (100) 23175 (100) NA
Note Reported data are incident cases from 1989-1994 except for CBTRUS data which are from 1990-1993
aRefer to the site codes in Appendix BbCentral Brain Tumor Registry of the United States cMinnesota Cancer Surveillance System (microscopically confirmed cases only)dNational Cancer Data Base (limited to cases reported by hospitals that accessioned nonmalignant cases) eSurveillance Epidemiology and End Results Program (malignant cases only)NA = Not applicable
Page 34
Endash
APPENDIX E TABLE 7 NUMBER AND PERCENT OF PRIMARY INTRACRANIAL AND CENTRAL
NERVOUS SYSTEM TUMORS BY TUMOR BEHAVIOR AND LOCATION
BehaviorTumor Locationa
CBTRUSb
Number () MCSSc
Number () NCDBd
Number () SEERe
Number ()
Malignant 7413 (537) 1884 (490) 46284 (666) 10518 (100)
Brain 6862 (497) 1746 (454) 42622 (614) 9721 (924)
Meninges 98 (07) 23 (06) 581 (08) 139 (13)
Pituitarycraniopharyn-geal ductpineal
95 (07) 33 (09) 567 (08) 110 (11)
Other central nervous system includingcranial nerves
116 (08) 22 (06) 1031 (15) 226 (22)
Spinal cord 242 (18) 60 (16) 1483 (21) 322 (31)
Benign 5794 (419) 1787 (465) 20694 (298) NA
Brain 803 (58) 99 (26) 4491 (65) NA
Meninges 2565 (186) 807 (210) 8613 (124) NA
Pituitarycraniopharyn-geal ductpineal
1322 (96) 458 (119) 4330 (62) NA
Other central nervous system includingcranial nerves
678 (49) 263 (68) 1911 (28) NA
Spinal cord 426 (31) 160 (42) 1349 (19) NA
Uncertain 607 (44) 174 (45) 2481 (36) NA
Brain 334 (24) 79 (21) 1414 (20) NA
Meninges 56 (04) 8 (02) 171 (02) NA
Pituitarycraniopharyn-geal ductpineal
148 (11) 60 (16) 538 (08) NA
Other central nervous system includingcranial nerves
7 (01) 2 (01) 53 (01) NA
Spinal cord 62 (05) 25 (07) 305 (04) NA
TOTAL 13814 (100) 3845 (100) 69459 (100) 10518 (100)
Note Reported data are incident cases from 1989-1994 except for CBTRUS data which are from 1990-1993 NA=Not applicableaRefer to the site codes in Appendix B bCentral Brain Tumor Registry of the United States cMinnesota Cancer Surveillance System (microscopically confirmed cases only)dNational Cancer Data Base (limited to cases reported byhospitals that accessioned nonmalignant cases eSurvival Epidemiology and End Results Program (malignant cases only)
Page 35
Endash
DATA COLLECTION
OF PRIMARY
CENTRAL NERVOUS
SYSTEM TUMORS
TABLE 8 NUMBER AND PERCENT OF MALIGNANT PRIMARY INTRACRANIAL AND
CENTRAL NERVOUS SYSTEM TUMORS BY HISTOLOGY GROUPINGS
WHO Histologya
Groupings CBTRUSb
Number () MCSSc
Number () NCDBd
Number () SEERe
Number ()
Neuroepithelial 6477 (874) 1689 (896) 39701 (858) 8676 (825)
Tumors of cranial and spinal nerves
12 (02) 3 (02) 108 (02) 25 (02)
Tumors of meninges
137 (18) 25 (13) 994 (21) 194 (18)
LymphomasHemopoietic
473 (64) 121 (64) 3492 (75) 1099 (105)
Germ cell 70 (09) 20 (11) 403 (09) 97 (09)
Cysts and tumor-like lesions
0 0 0 0
Tumors of sellar region
20 (03) 11 (06) 100 (02) 6 (01)
Local extensions 29 (04) 11 (06) 166 (04) 38 (04)
Unclassifiedunassigned tumorsf
195 (26) 4 (02) 1320 (29) 383 (36)
TOTAL 7413 (100) 1884 (100) 46284 (100) 10518 (100)
Note Reported data are incident cases from 1989-1994 except for CBTRUS data which are from 1990-1993
aRefer to the World Health Organization (WHO) histology groupings in Appendix CbCentral Brain Tumor Registry of the United States cMinnesota Cancer Surveillance System (microscopically confirmed cases only)dNational Cancer Data Base (limited to cases reported by hospitals that accessioned nonmalignant cases) f For MCSS unclassifiedunassigned tumors include one malignant and four nonmalignant histologies which were
not listed in the CBTRUS classification scheme For NCDB unclassifiedunassigned tumors include 319 cases(less than one half percent) which had histologies not assigned by CBTRUS to any other category For SEERunclassifiedunassigned tumors include all malignant histologies occurring in the brainCNS which could not beclassified in one of the above categories based on their 4-digit histologic type
Page 36
Endash
APPENDIX E
TABLE 9 NUMBER AND PERCENT OF PRIMARY INTRACRANIAL AND CENTRAL NERVOUS SYSTEM TUMORS OF BENIGN AND UNCERTAIN BEHAVIOR
BY HISTOLOGY GROUPINGS
WHO Histologya
Groupings CBTRUSb
Number () MCSSc
Number () NCDBd
Number () SEERe
Number ()
Neuroepithelial 275 (43) 91 (46) 1064 (46) NA
Tumors of cranial and spinal nerves
980 (153) 397 (202) 2618 (113) NA
Tumors of meninges
3509 (548) 941 (480) 13667 (590) NA
LymphomasHemopoietic
3 (lt01) 0 7 (lt01) NA
Germ cell 4 (lt01) 1 (01) 25 (01) NA
Cysts and tumor-like lesions
15 (02) 3 (02) 34 (01) NA
Tumors of sellar region
1444 (226) 510 (260) 4749 (205) NA
Local extensions 0 0 0 NA
Unclassifiedunassigned tumorsf
171 (27) 18 (09) 1011 (44) NA
TOTAL 6401 (100) 1961 (100) 23175 (100) NA
Note Reported data are incident cases from 1989-1994 except for CBTRUS which is 1990-1993
aRefer to the World Health Organization (WHO) histology groupings in Appendix CbCentral Brain Tumor Registry of the United States c Minnesota Cancer Surveillance System (microscopically confirmed cases only) dNational Cancer Data Base (limited to cases reported by hospitals that accessioned nonmalignant cases) eSurvival Epidemiology and End Results Program (malignant cases only)dFor MCSS unclassifiedunassigned tumors include one malignant and four nonmalignant histologies which werenot listed in the CBTRUS classification scheme For NCDB unclassifiedunassigned tumors include 319 cases(less than one half percent) which had histologies not assigned by CBTRUS to any other category For SEERunclassifiedunassigned tumors include all malignant histologies occurring in the brainCNS which could not beclassified in one of the above categories based on their 4-digit histologic typeNA = Not applicable
Page 37
Endash
DATA COLLECTION
OF PRIMARY
CENTRAL NERVOUS
SYSTEM TUMORS
TABLE 10 METHOD OF CASE FINDING FOR PRIMARY INTRACRANIAL AND CENTRAL NERVOUS SYSTEM TUMORS BY TUMOR BEHAVIOR AND LOCATION MINNESOTA 1989-1994
Behavior Tumor Locationa
Number of Cases
Percent Found byRoutine
Reporting
Percent Found by Special Efforts
Malignant Brain Cerebral meninges
Pituitarycranio duct pineal Other intracranial
18841746 23 33
22
961 965 957 939
864
39 35 43 61
136 Extracranial 60 883 117 Benign Brain
1787 99
788 838
212 162
Cerebral meninges Pituitarycranio duct
pineal Other intracranial
807 458
263
843 740
779
157 260
221 Extracranial 160 631 369 Uncertain 174 856 144 Brain 79 823 177 Cerebral meninges Pituitarycraniopharyn- geal ductpineal Other intracranial
8 60
2
875 850
1000
125 150
00 Extracranial 25 960 40
TOTAL 3845 876 124
aRefer to the site codes in Appendix B
Page 38
Endash
1989 1990 1991 1992 1993 1994
TOTAL
APPENDIX E TABLE 11 METHOD OF CASE FINDING FOR INTRACRANIALa TUMORS BY DIAGNOSIS YEAR MINNESOTA 1989-1994
DiagnosisYear
Number of
Cases
Percent Found byRoutine
Reporting
Percent Found by
Special Efforts
571 837 163 616 865 135 586 913 87 602 899 101
633 872 128 592 929 71
3600 886 114
aIncludes the brain cerebral meninges pituitary gland pineal gland and otherintracranial tumors (refer to the site codes in Appendix B)
Page 39
Endash
DATA COLLECTION
OF PRIMARY
CENTRAL NERVOUS
SYSTEM TUMORS
TABLE 12 METHOD OF CASE FINDING FOR NONMALIGNANT INTRACRANIALa TUMORS BY TYPE OF FACILITY MINNESOTA 1989-1994
Type of Facility Number of Tumors Percent Found byRoutine
Reporting
Percent Found by Special Efforts
Registry at facility No registry at facility
1451325
859 569
141 431
TOTAL 1776 806 194
aIncludes tumors with benign or uncertain behavior that involve the brain cerebral meningespituitary gland pineal gland or other intracranial sites (refer to the site codes in Appendix B)
TABLE 13 REPORTING METHOD AND SOURCE OF CASE FINDING FOR NON- MALIGNANT INTRACRANIALa TUMORS DIAGNOSED IN HOSPITALS WITH A TUMOR REGISTRY MINNESOTA 1989-1994
Reporting Method Number of Tumors Percent Found byRoutine
Reporting
Percent Found by
Special Efforts
Registry-reportedLaboratory-reported
1226225
925 502
75 498
TOTAL 1451 859 141
aIncludes tumors with benign or uncertain behavior that involve the brain cerebral meningespituitary gland pineal gland or other intracranial sites (refer to the site codes in Appendix B)
Page 40
Endash0
APPENDIX E TABLE 14 HOSPITAL REGISTRY ACCESSIONING OF MALIGNANT AND NON-
MALIGNANT PRIMARY INTRACRANIAL AND CENTRAL NERVOUS SYSTEM TUMORS NCDB 1989-1994
TUMOR Totalb
BEHAVIOR Malignant c Nonmalignantd
Tumor Locationa HospitalsReporting
Number ()
Hospitals Reporting
Number ()
Hospitals Reporting
Number ()
Intracranial 1542 (100) 1526 (100) 900 (99)
Brain 1527 (99) 1519 (gt99) 754 (83)
Meninges 740 (48) 390 (26) 613 (67)
Pituitaryglandcraniopharyn-
geal duct
602 (39) 168 (11) 538 (59)
Pineal gland 319 (21) 277 (18) 79 (9)
Other central nervous system including cranial
nerves
648 (42) 545 (36) 299 (33)
Extracranial 812 (53) 708 (46) 410 (45)
Spinal cord 760 (49) 692 (45) 311 (34)
Spinal meninges 299 (19) 72 (5) 258 (28)
TOTAL Hospitals 1542 (100) 1526 (100) 913 (100)
Note The number of hospitals in each of the second third and fourth columns is the number that submittedreports to the NCDB for any intracranial and central nervous system tumors for the respective malignancystatus Not all hospitals submitted reports for each year during the study period (1989-1994)
aRefer to the site codes in Appendix B bBehavior codes = 0 1 3 cBehavior code = 3 dBehavior codes = 0 1
Page 41
Endash
DATA COLLECTION
OF PRIMARY
CENTRAL NERVOUS
SYSTEM TUMORS
Texas Cancer Registry
1997 CBTRUS State Survey of Benign Brain Tumor Data Collection
State Collection Status
Currently Collecting Benign Tumor Data1 Arizona Cancer Registry since 1981 2 Colorado Central Cancer Registry since 1988 3 Connecticut Tumor Registry since 1965 4 Idaho Cancer Data Registry since 1970 5 Maine Cancer Registry since 1983 6 Massachusetts Cancer Registry since 1982 7 Minnesota Cancer Surveillance System since 1988 8 Montana Central Tumor Registry since 1979 9 New York State Cancer Registry since 1988
10 North Carolina Central Cancer Registry since 1990 11 Utah Cancer Registry since 1966 12 Virginia Cancer Registry since 1994 13 Delaware State Cancer Registry14 Washington State Cancer Registry since 1992 15 passive collection 1979-1994
active collection since 1995
Stopped or Passive Collection of Benign Tumor Data1 New Jersey State Cancer Registry stopped 1979-1995 2 Kansas Cancer Registry stopped 1969-1995 3 New Hampshire State Cancer Registry stopped 1986-1991 4 District of Columbia Cancer Registry stopped 1997 5 Wyoming Cancer Surveillance Program stopped 111996 6 Louisiana Tumor Registry stopped 1992 (passive collection) 7 Illinois State Cancer Registry stopped 111996 8 Missouri Cancer Registry passive collection since 1984 9 South Carolina Central Cancer Registry passive collection since 1996
Beginning Collection of Benign Tumor Data1 North Dakota Cancer Registry began collection 1997 2 Rhode Island Cancer Registry began collection 1998
Page 42
Endash
APPENDIX E
Codes for Primary Intracranial and Central Nervous System Tumors
Note For this report the designation of ldquoprimary intracranial and central nervous system tumorsrdquo includes thefollowing primary tumors of central nervous system sites as well as tumors of the pituitary and pinealglands All histology types within the topography codes are included in the designation of ldquoprimaryintracranial and CNS tumors The source for the topography codes is Percy C Van Holten V Muir Ceds International Classification of Diseases for Oncology Second Edition Geneva World Health Organization 1990
Intracranial tumors
Brain C710 Cerebrum C711 Frontal lobe C712 Temporal lobe C713 Parietal lobe C714 Occipital lobe C715 Ventricle NOSC716 Cerebellum NOS C717 Brain stem C718 Overlapping lesion of brain C719 Brain NOS
Meninges C700 Cerebral meninges C709 Meninges NOS
a
Cranial Nerves and other intracranial parts of the central nervous systemC722 Olfactory nerve C723 Optic nerve C724 Acoustic nerve C725 Cranial nerve NOS C728 Overlapping lesion of brain and central nervous system C729 Nervous system NOS
Other endrocrine glands and related structures C751 Pituitary gland C752 Craniopharyngeal duct C753 Pineal gland
Extracranial tumors
Spinal cord C720 Spinal cord C721 Cauda equina
Meninges C701 Spinal meninges
aNOS=Not Otherwise Specified
Page 43
Endash
DATA COLLECTION
OF PRIMARY
CENTRAL NERVOUS
SYSTEM TUMORS
Brain Tumor Histology Groupings
The following histology groupings were used for the primary intracranial and central nervoussystem tumors The source for the histology groupings is Central Brain Tumor Registry ofthe United States (CBTRUS) 1996 Statistics Report Table 4
WHOa HISTOLOGY GROUPINGS ICD-Ob MORPHOLOGY CODE
Diffuse astrocytoma (protoplasma fibrillary) 9410 9420 Anaplastic astrocytoma 9401 9411 Glioblastoma 9440 9441 9442 Pilocytic astrocytoma 9421 Unique astrocytoma variants 9383 9384 9424 Oligodendroglioma 9450 Anaplastic oligodendroglioma 9451 9460 Ependymomaanaplastic ependymoma 9391 9392 9393 Ependymoma variants 9394 Mixed glioma 9382 Astrocytoma NOSc 9400 Glioma malignant NOS 9380 Choroid plexus 9390 Neuroepithelial 9381 9423 9430 Benign neuronalglial neuronal and mixed 86801 8693 9490 9505 9506 Malignant neruonalglial neuronal and mixed 86803 9364 9490 9500 Pineal parenchymal 9360 9361 9362 Embryonalprimitivemedulloblastoma 8963 9470 9471 9472
9473 9501 9502 9503 9510
TUMORS OF NEUROEPITHELIAL TISSUE
TUMORS OF CRANIAL AND SPINAL NERVES Nerve sheath benign and malignant 9540 9550 9560 9570
TUMORS OF THE MENINGES Meningioma 9530 9531 9532 9533 9534 9537 9538 Other mesenchymal benign and malignant 8800 8801 8802 8803 8810 8830 8850 88618900
8910 8990 9133 9150 9240 9480 9481 9536 9539 Hemangioblastoma 9161 9535
LYMPHOMAS AND HEMOPOIETIC NEOPLASMS Lymphoma 9590 9591 9593 9594 9595 9630 9650 9652
9663 9670 9671 9672 9674 9675 9680 9681 9682 9684 9685 9686 9687 9690 9691 96939695 9696 9698 9702 9714 9723 9731 9766 9970
GERM CELL TUMORS Germ cell 8020 9060 9064 9070 9071 9080 9084 9085 9100
CYSTS AND TUMOR-LIKE LESIONS Cysts and heterotopias 9084
TUMORS OF THE SELLAR REGION Pituitary 8040 8l40 8l46 8260 8270 8271 8280
8281 8290 8300 8330 8323 8333 Craniopharyngioma 9350
Page 44
Endash
APPENDIX E
LOCAL EXTENSIONS FROM REGIONAL TUMORS Chordomachondrosarcoma 9370
UNCLASSIFIED TUMORS Hemangioma 9120 9121 9130 9131 Neoplasm benign 80000 8010 Neoplasm uncertain behavior 80001 80011 Neoplasm malignant 80003 80013 8002 8003 All other 8720 9580
aWHO = World Health OrganizationbICD-O = International Classification of Diseases for Oncology Second Edition 1990 cNOS=Not Otherwise Specified
Page 45
Endash
DATA COLLECTION
OF PRIMARY
CENTRAL NERVOUS
SYSTEM TUMORS
Endash
International Classification of Childhood Cancer (ICCC)
Diagnostic Group
ICD-Oa codes
Morphology Topography
I LEUKAEMIA
(a) Lymphoid leukaemia 9820-9827 9850
(b) Acute non-lymphocytic leukaemia 9840 9841 9861 9864 9866 9867 98919894 9910
(c) Chronic myeloid leukaemia 9863 9868
(d) Other specified leukaemias 9830 9842 9860 9862 9870-9890 9892 98939900 9930-9941
(e) Unspecified leukaemias 9800-9804
II LYMPHOMAS AND OTHER RETICULOENDOTHELIAL NEOPLASMS
(a) Hodgkinrsquos disease 9650-9667
(b) Non-Hodgkinrsquos lymphoma 9591-9595 9670-9686 9690-9714 9723
(c) Burkittrsquos lymphoma 9687
(d) Miscellaneous lymphoreticular neoplasms 9720 9731-9764
(e) Unspecified lymphomas 9590
III CENTRAL NERVOUS SYSTEM (CNS) ANDMISCELLANEOUS INTRACRANIAL AND
INTRASPINAL NEOPLASMSb
(a) Ependymomac 9383 9390-9394
(b) Astrocytoma 9380 C723
9381 9400-9441
(c) Primitive neuroectodermal tumours 9470-9473
(d) Other gliomasd 9380 C700-C722C724-C729
9382 9384
9442-9460 9481
APPENDIX E
Diagnostic Group
ICD-Oa codes
Morphology Topogragphy
III CNS AND MISCELLANEOUS INTRACRANIAL AND INTRASPINAL
NEOPLASMSb Continued
(e) Miscellaneous intracranial and intraspinalneoplasmsc
8270-8281 8300 9350-9362 9480 95059530-9539
(f) Unspecified intracranial and intraspinalneoplasmsc
8000-8004 C700-C729C751-C753
IV SYMPATHETIC NERVOUS SYSTEM TUMOURS
(a) Neuroblastoma and ganglioneuroblastoma 9490 9500
(b) Other sympathetic nervous system tumours 8680 8693-8710 9501-9504 9520-9523
aInternational Classification of Diseases for Oncology Second Edition World Health Organization 1990bGroup III excludes all lymphomas See group II cBehaviour codes 0 and 1 are included dBehaviour code 1 is included
Page 47
Endash
Comments and recommendations are welcome Should questions arise on how to use these
materials or for more information please contact
Centers for Disease Control and Prevention National Program of Cancer Registries
4770 Buford Hwy NE Mail Stop K-53
Atlanta GA 30042-3717
Voice Information System 1 (888) 842-6355 bull Fax (770) 488-4760
cancerinfocdcgov bull httpwwwcdcgovcancer
All materials are in the public domain and may be reproduced or copied without permission citation
to source however is appreciated
BACK COVER
(WHITE)
Spine(WHITE)
DATA COLLECTION OF PRIMARY CEN
TRAL NERVOUS SYSTEM
TUM
ORS 2004
National Program of Cancer Registries Training M
aterials

DATA COLLECTION
OF PRIMARY
CENTRAL NERVOUS
SYSTEM TUMORS
Endash
METHODS
To analyze available data on issues related to the collection of data for primary
intracranial and CNS tumors the BTWG examined surveillance data from CBTRUS the
Minnesota Cancer Surveillance System (MCSS) NCDB and SEER (Table 1) The NCDB
includes cases from all 50 states the District of Columbia and Puerto Rico however it is not
population-based CBTRUS MCSS and the SEER Program are population-based registries
that cover selected areas of the US Three SEER areas collect information for benign and
uncertain (ie nonmalignant) brain tumors but they do not report it Currently however
there are no standard definitions for the collection of site and type among the areas CBTRUS
MCSS and NCDB collect information on both malignant and nonmalignant primary brain
tumors Because the accessioning of nonmalignant cases for NCDB is not required by COC
only 59 percent of the hospitals that submitted any data to NCDB on intracranialCNS cases
diagnosed during 1989-1994 submitted nonmalignant cases The NCDB data reported here
are restricted to those hospitals that reported at least one nonmalignant case as these cases
were thought to contribute most toward the purpose of this report Also although MCSS
collects data for both malignant and nonmalignant tumors it does so for microscopically-
confirmed cases only This registry performs 100-percent case finding audits in all pathology
laboratories in Minnesota
Data inclusion criteria were developed as specified in Appendix B and all four of the
resources (ie CBTRUS MCSS NCDB SEER) developed subsets of their currently
available data according to the agreed-upon inclusion criteria Frequencies and proportions
were computed to reflect variations in factors other than site and the resulting contrasts
across these registries broadly reflect data collection practices For example the primary
difference in brain and CNS definition between SEER and CBTRUS lies in reporting by
behavior with the latter including all nonmalignant tumors As such differences in
proportions between these two registries approximately reflect the magnitude of nonmalignant
brain and CNS tumors Similarly the primary difference in brain and CNS definition between
MCSS and CBTRUS is that the former requires microscopic confirmation of all tumors and
the latter includes clinically and radiologically diagnosed tumors Another important difference
Page 16
APPENDIX E between MCSS and CBTRUS is that MCSS uses a more active method for case finding
Therefore differences in proportions reported reflect the interaction between the magnitude of
nonmicroscopically diagnosed tumors and the magnitude of incomplete case finding of certain
tumor types in CBTRUS Finally the primary difference between NCDB and CBTRUS is that
the former is a hospital-based reporting system and the latter is a population-based reporting
system Therefore differences in proportions may largely reflect referral biases inherent in
hospital reporting systems While other data collection practices may influence information in
these data resources these data bases were selected to highlight the variation in current
information on primary brain and CNS tumors that arises without a standard definition
Frequencies were computed using ICD-O codes for topography (ie location)
behavior diagnostic confirmation histology and selected combinations of behavior and
topography codes Topography was broadly defined into two main categories with
subcategories as shown in Appendix B Intracranial tumors included tumors located in the
brain and other CNS regions (including the cranial nerves) in the meninges and in the
pituitary and pineal glands Extracranial tumors included those located in the spinal cord and
spinal meninges The distinction between intracranial and extracranial tumors was removed for
Table 7 by collapsing brain and spinal meninges into one category and combining the pituitary
and pineal glands into one group (as these regions have endocrine functions) to allow for
adequate numbers within categories of behavior For Table 10 the intracranial and extracranial
distinction was maintained however the pituitary and pineal glands were collapsed into one
category and the spinal cord and spinal meninges were collapsed into the extracranial
category
Behavior was coded using ICD-O categories 0 for benign 1 for uncertain and 3 for
malignant with the first two of these categories collapsed into a nonmalignant category
Microscopic confirmation is based on the SEER definition and grouped into positive
microscopic confirmation radiography without microscopy clinical and unknown These
categories were further grouped as microscopically confirmed and as not microscopically
confirmed for the analysis in Table 3
Page 17
Endash
DATA COLLECTION
OF PRIMARY
CENTRAL NERVOUS
SYSTEM TUMORS
Endash
CBTRUS developed preliminary histology groupings with the aim of improved clinical
relevance ICD-O morphology codes which are used by cancer registries were grouped
based on WHO categories for brain tumors The details of these groupings are shown in
Appendix C
RESULTS
Percentages of Primary Intracranial and CNS Tumors by Tumor Location and by
Microscopic Confirmation
Intracranial tumors comprise more than 94 percent of primary intracranial and CNS
tumors and between 50 and 92 percent of primary intracranial and CNS tumors occur in the
brain (Table 2) The data in this report also show that a slightly greater percentage of
malignant intracranial tumors including malignant brain tumors are microscopically
confirmed compared with corresponding tumors of benign or uncertain behavior (Table 3)
However regardless of tumor behavior the percentages of extracranial CNS tumors that are
microscopically confirmed are higher than the percentages of intracranial tumors that are
confirmed by pathologists (Table 3) Few primary intracranial and CNS tumors are not
microscopically confirmed approximately 11 percent of diagnoses are based only on a clinical
or radiographical (without microscopy) assessment (Table 4)
Percentages of Malignant and of Nonmalignant Intracranial and CNS Tumors by Location
The relative distribution of nonmalignant intracranial and CNS tumors varies by
primary site While greater than 90 percent of malignant intracranial and CNS tumors occur
in the brain (Table 5) only 9 to 26 percent of the nonmalignant tumors occur as parenchymal
tumors (Table 6) Nonmalignant tumors comprised a significant portion of the primary
intracranial and CNS tumors reported by the sources The ratios of nonmalignant to primary
malignant intracranial and CNS tumors reported by CBTRUS MCSS and NCDB were 09
10 and 05 respectively (Table 7)
Percentages of Malignant and of Nonmalignant Intracranial and CNS Tumors by Histology
Among the malignant primary intracranial and CNS tumors neuroepithelial (ie
astrocytic) tumors represent 83 to 90 percent of the cases depending on the data source
Page 18
APPENDIX E lymphomashemopoietic tumors 6 to 11 percent tumors of the meninges 1 to 2 percent and
tumors of cranial and spinal nerves 02 percent (Table 8) For nonmalignant primary
intracranial and CNS tumors tumors of the meninges represent 48 to 59 percent of the cases
tumors of the sellar region (including pituitary tumors and craniopharyngiomas) 21 to 26
percent tumors of cranial and spinal nerves 11 to 20 percent and neuroepithelial tumors 4 to
5 percent (Table 9)
Percentages of Primary Intracranial and CNS Tumors by Method of Case Finding (MCSS)
Case finding audits by the MCSS occur on an annual basis in all pathology laboratories in
Minnesota and include the review of surgerypathology cytology autopsy and hematology
records These audits enable the registry to ensure that there is complete reporting of cases of
malignant and nonmalignant tumors In tables 10 through 13 data from MCSS on primary
intracranial and CNS tumors are presented by method of case finding The two methods of case
finding are routine reporting and special efforts A case was found by routine reporting if one
or more reports received before the close-out date for a given diagnosis year was initiated by a
hospital or nonhospital facility In contrast a case was found by special efforts if all reports of that
case received before the close-out date were requested as a result of pathology laboratory audits
The data in Table 10 indicate that routine reporting of nonmalignant tumors was less complete
compared with reporting for malignant tumors The percentages of intracranial tumor cases that
were found by special efforts have varied from year to year but the trend suggests that routine
reporting may be improving (Table 11) The greatest improvement has been in the coverage of
nonbrain parenchymal tumors (ie pituitarypineal and other intracranial) The small numbers of
autopsy-only tumors were more likely to be found by special case finding efforts than by other
methods of microscopic confirmation (data not shown)
Most hospitals in Minnesota have cancer registries through which their tumor cases are
reported However some of the cases that are seen at hospitals with registries are reported only
through pathology laboratories affiliated with the hospitals Approximately 80 percent
(14511776) of the cases of nonmalignant intracranial tumors in the MCSS data base were
reported by hospitals with registries (Table 12) eighty-five percent (12261451) of these cases
were reported by the hospitals registries (Table 13)The remaining 15 percent (2251451) of the
Page 19
Endash
DATA COLLECTION
OF PRIMARY
CENTRAL NERVOUS
SYSTEM TUMORS
Endash0
cases were reported through the pathology laboratories affiliated with the hospitals with registries
(ie they were not accessioned by the registries) (Table 13) The percentages of cases of
nonmalignant tumors that were reported only by the pathology laboratories at facilities having
cancer registries can be viewed as a measure of how frequently the registries failed to accession
the cases Of the 225 nonaccessioned tumors half would have been missed without the MCSS
case finding audits of pathology laboratories (Table 13)
Percentages of Hospital Cancer Registries That Accessioned Malignant and Nonmalignant
Intracranial and CNS Tumors (NCDB)
Based on data from NCDB more than 1500 hospitals accessioned cases with either
malignant or nonmalignant intracranial and CNS tumors and approximately 800 hospitals
accessioned extracranial cases Cases with tumors that involved the cranial or spinal meninges or
the pituitary gland were more likely to be reported by hospitals that accessioned nonmalignant
primary intracranial and CNS tumors than by hospitals that accessioned only malignant tumors
(Table 14)
DISCUSSION
The findings for this report indicate that collection and reporting of incidence data for
primary malignant intracranial and other CNS tumors are well standardized However substantial
variation exists in the processes of collecting and reporting nonmalignant tumor data One
obstacle is that not all hospitals have cancer registries Another problem is that not all hospitals
with registries accession cases of nonmalignant tumors Data from Minnesota (Table 13) suggest
that approximately 85 percent of cases of nonmalignant intracranial tumors are accessioned by
hospital registries However nonaccessioned CNS cases are less likely to be routinely reported to
the central registry (Table 13) These differences in collection and reporting practices among the
registries make it difficult to assess the burden of primary intracranial and CNS tumors
Terminology for describing intracranial and CNS tumors is also not standardized For
example although the pituitary gland and pineal glands are not technically part of the CNS
tumors that involve these organs are often included in the term CNS tumors On the other hand
some consider the eye to be intracranial however CNS tumors generally do not include the
Page 20
APPENDIX E eyes Although the World Health Organization (WHO) has published a list of histologic
groupings at present no single comprehensive list of histologic groupings exists for intracranial
and CNS tumors Since the International Classification of Childhood Cancer (ICCC) is based on
histologic type rather than site certain benign histologies of sites other than brainCNS (eg non-
CNS ependymomas) would not be included in the BTWGs primary intracranial and CNS
histology groupings (Appendix D) Thus the variation in incidence estimates of primary
intracranial and CNS tumors may be attributable in part to the variation in the definitions of
these tumors In addition differences in cancer registry training and procedures may contribute to
nonreporting and inconsistent reporting of the tumors
The BTWG discussed the feasibility of conducting a random sampling procedure as an
alternative to complete enumeration and ongoing surveillance of nonmalignant brain tumors It
was agreed that this technique would not be valid or feasible for the following reasons
1 If a random sample of incident brain tumors were desired a complete list would be
needed first (a sampling frame is required)
2 If a survey method were used to identify brain tumors in the general population (eg
random digit dialing or other general population survey techniques) the information
needed could not be obtained for several reasons
- Either a prohibitively large numbers of individuals would have to be surveyed or
else only a very small number of brain tumors could be identified given the rarity
and sometimes short survival time
- The brain tumors identified would not be representative of all brain tumors that
occur because people who had survived their brain tumors would be more
likely to be identified
- The incidence rate would still not be known since cross-sectional surveys only
identify disease prevalence
3 If a sample of hospitals were selected to contribute data the tumors included would not
represent the entire spectrum of brain tumors because those that were diagnosed and
treated outside of the hospital setting would be excluded
Page 21
Endash
DATA COLLECTION
OF PRIMARY
CENTRAL NERVOUS
SYSTEM TUMORS
Endash
An alternative approach to sampling and the least troublesome would be to conduct
population-based surveillance only in certain geographic areas of the country If one assumes that
the etiology of brain tumors does not differ from one area of the country to another then the
scientific validity of studies based on this type of sampling would not be a problem However
given the rarity of some types of brain tumors sufficient numbers for study may not be available
unless the vast majority of the nations population were covered by population-based data
collection Also geographic areas without population-based surveillance would have no data to
use for assessing local trends or variations in brain tumor occurrence
In the absence of standard tumor registration procedures and training special case finding
efforts by central registries may be necessary to ensure that complete data are collected for
nonmalignant intracranial and CNS tumors Data from MCSS (Table 10) which has a legal
requirement for reporting nonmalignant intracranial tumors and performs 100 percent case finding
audits in all laboratories indicate that only 80 percent of nonmalignant tumors were routinely
reported In contrast routine reporting accounted for more than 95 percent of malignant
intracranial and CNS tumors Nonmalignant cases in Minnesota that were not accessioned by
hospital registries had a 50 percent chance of being routinely reported to the central registry
however these were only microscopically confirmed cases
Completeness of reporting is critical to cancer registries Accurate case counts are
necessary to assess the burden of cancer to guide cancer control program planning to prioritize
the allocation of health resources and to facilitate epidemiologic research Most central cancer
registries have state laws that mandate reporting of cases by physicians and by hospitals
laboratories and other facilities that provide screening diagnostic or therapeutic services
Complete reporting of nonmalignant intracranial and CNS tumors would be greatly
improved if reporting requirements of the COC central cancer registries SEER and the
National Program of Cancer Registries (NPCR) were changed to require the collection of
information for these tumors However this requirement would have many implications
including an increase in work load as well as associated costs for reporting facilities An estimated
14 percent of all new cancer cases diagnosed in 1998 will involve invasive brain and other
nervous system tumors7 since the numbers of benign and invasive brain and other CNS tumors
Page 22
Endash
APPENDIX E diagnosed annually are similar facilities that presently do not accession nonmalignant cases could
expect an approximately 14 percent increase in the total number of CNS cases collected by the
registry Some estimates of the percentage of brain tumors have been lower (05 percent)36 and
others have been higher (9 percent)37 therefore the extent to which the workload would be
affected may vary The data in this report suggest that if reporting of nonmalignant intracranial
and CNS tumors were required the total number of cases of tumors for these anatomic sites
would double for facilities that presently report only malignant tumors This is consistent with the
findings of Davis et al36 who reported that the incorporation of benign brain tumors into the
cancer-reporting systems of four central registries increased the overall incidence of brain cancer
by 49 percent Forty percent (913) of the hospital registries that submitted data to the NCDB did
not report nonmalignant brain tumors These registries could expect up to a 50 percent increase in
the number of intracranial and CNS tumors reported nonregistry facilities which represent
approximately 20 percent of cases reported to central cancer registries could expect a similar
increase Also central cancer registries that currently do not require reporting of nonmalignant
intracranial and CNS tumors could expect increases in their workloads as a result of the
additional time spent on processing and quality control procedures and training The lack of
standard definitions and collection and reporting guidelines would make these tasks more time-
consuming as well
For some central cancer registries that want to expand their reporting requirements to
include nonmalignant intracranial and CNS tumors a change in current legislation andor
regulations may be needed These changes could involve several months of lead time if public
hearings or other legal procedures are necessary In other states the reporting of these tumors is
not required in either their legislation or regulations in these situations hospitals have been asked
to voluntarily report the cases For example in Massachusetts the reporting of benign brain
tumors is not required by law but hospitals have been reporting these cases since 1982 However
the completeness of data reported on a voluntary basis is difficult to assess For public health
surveillance systems a mandate to report is the basic requirement of a comprehensive higher
quality system
DATA COLLECTION
OF PRIMARY
CENTRAL NERVOUS
SYSTEM TUMORS
If COC SEER NPCR and central cancer registries changed their reporting requirements
to include nonmalignant intracranial and CNS tumors the registry manuals disseminated by these
programs and registries would also need to be modified to include new definitions of reportable
diagnoses All reporting facilities would have to be notified of the new requirements To ensure
complete reporting from registries additional training of registrars should be expected Case
finding methods may need to be modified in order to identify the new cases and sources of
information Central cancer registries would also need to increase their case finding audits The
inclusion of nonmalignant tumors would also necessitate changes to other data items such as
sequence number Hospital and central cancer registries would need to consider adding WHO
brain tumor grade as an additional data item
Finally the software used by reporting facilities and by central registries would need to be
modified to accept nonmalignant morphology and behavior codes Also edits programs would
need to be modified to include these additions and to accept a nonmalignant sequence numbering
procedure
Before reporting requirements for primary intracranial and CNS tumors could be changed
feasibility studies would have to be conducted to determine whether such changes should be
recommended Two SEER special studies are under way to evaluate the impact of requiring the
collection of benign brain tumors on case finding cost quality control and training However
additional studies may be required
Page 24
Endash
APPENDIX E
RECOMMENDATIONS OF THE BRAIN TUMOR WORKING GROUP
1 We recommend the following standard definition for collecting precise data for all primary
intracranial and central nervous system tumors
Primary intracranial and central nervous (CNS) tumors are primary tumors occurring in
the following sites irrespective of histologic type or behavior brain meninges spinal
cord cauda equina cranial nerves and other parts of the CNS pituitary gland pineal
gland and craniopharyngeal duct (see Appendix B)
2 We recommend the development of a standard site and histology definition for tabulating
estimates of these tumors to allow comparability of information across registries Pathologists
the North American Association of Central Cancer Registries (NAACCR) the Commission
on Cancer (COC) the Surveillance Epidemiology and End Results (SEER) Program the
National Program of Cancer Registries (NPCR) and the International Agency for Research
on Cancer (IARC) need to be involved in developing this standard
3 We recommend collection of data for primary intracranial and extracranial CNS tumors by all
registries hospital- and central-based This effort will necessitate a change in the COC
requirements and will increase costs to the hospital-based programs Federal funding should be
allocated to supplement the additional transition and ongoing data collections costs that will be
incurred by central registries Before additional data collection is implemented we recommend
a pilot study should be conducted to assess the procedures and quality control functions
needed as well as the costs of collecting data for these tumors
4 We recommend that the appropriate government and professional organizations be involved in
carrying out the development and implementation of special training programs and curricula for
central registry hospital registry and laboratory personnel as well as the development of
computerized edit-checking procedures Training for reporting and tabulating primary
intracranial and CNS tumors should be offered on a regular basis
Page 25
Endash
DATA COLLECTION
OF PRIMARY
CENTRAL NERVOUS
SYSTEM TUMORS
Endash
REFERENCES
1 Davis F Preston-Martin S Epidemiology of brain tumors In Bigner DD McLendon RE Bruner JM eds Russell and Rubinsteins pathology of tumors of the nervous system ed 6 London Arnold Publishing 19965-45
2 World Health Organization (WHO) (1976) International classification of diseases foroncology ed 1 Geneva World Health Organization
3 World Health Organization (WHO) (1990) International classification of diseases foroncology ed 2 Geneva World Health Organization
4 Kleihues P Burger PC Scheithauer BW The new WHO classification of brain tumorsBrain Pathol 19933255-268
5 Thapar K Laws ER Tumors of the central nervous system In Murphy GP Lawrence WJr Lenhard RE Jr eds Textbook of clinical oncology ed 2 Atlanta American CancerSociety 1995378-410
6 Walker AE Robins M Weinfield FD Epidemiology of brain tumors the national survey ofintracranial neoplasms Neurol 198535219-226
7 Ries LAG Kosary CL Hankey BF Miller BA Edwards BK (eds) SEER Cancer StatisticsReview 1973-1995 National Cancer Institute Bethesda MD 1998
8 Cancer Facts amp Figures - 1998 American Cancer Society Atlanta Georgia 19989 Davis FG Bruner JM Surawicz TS The rationale for standardized registration and reporting
of brain and central nervous system tumors in population-based cancer registriesNeuroepidemiol 199716308-316
10CBTRUS (1996) First annual report 1995 Central Brain Tumor Registry of the UnitedStates Chicago Illinois
11 Preston-Martin S Epidemiology of primary CNS neoplasms Neurol Clinics 199614273-290
12 Greig NH Ries LG Yancik R Rapoport SI Increasing annual incidence of primary malignantbrain tumors in the elderly J Natl Cancer Inst 1991 831621-1624
13 Mao Y Desmeules M Semenciw RM Hill G Gaudette L Wigle DT Increasing brain cancerrates in Canada Can Med Assoc J 19911451583-1591
14 Frelick R Huang P Topham A Brain and central nervous system tumors Delaware 1980 to1989 Del Med J 199264571-573
15 Davis DL Ahlbom A Hoel D Percy C Is brain cancer mortality increasing in industrialcountries Am J Ind Med 199119421-431
16 Helseth A Increasing incidence of primary central nervous system tumors in the elderly Realincrease or improved detection J Natl Cancer Inst 1993851871-1872
17 Modan B Wagener D Feldman JJ Rosenberg HM Feinleib M Increased mortality frombrain tumors A combined outcome of diagnostic technology and change of attitude towardthe elderly Am J Epidemiol 19921351349-1357
18 Polednak AP Time trends in the incidence of brain and central nervous system cancers inConnecticut J Natl Cancer Inst 1991831679-1681
19 Boyle P Maissonneuve P Saracci R Muir CS Is the increase in incidence of primarymalignant brain tumors real J Natl Cancer Inst 1990201594-1596
Page 26
APPENDIX E 20 Preston-Martin S Descriptive epidemiology of primary tumors of the brain cranial nerves
and spinal meninges in Los Angeles County Neuroepidemiol 19898283-29521 Helseth A Mork SJ Neoplasms of the central nervous system in Norway Epidemiological
characteristics of intracranial gliomas according to histology APMIS 97 1989547-55522 Gurney JG Davis S Severson RK Fang J-Y Ross JA Robison LL Trends in cancer
incidence among children in the United States Cancer 199678532-54123 Gurney JG Ross JA Wall DA Bleyer WA Severson RK Robison LL Infant cancer in the
US histology-specific incidence trends 1973-1992 J Pediatr Hem Onc 199719428-43224 Nishio S Takeshita I Morioka T Fukui M Primary intracranial squamous cell carcinomas
report of two cases Neurosurgery 199537329-33225 Freilich RJ Thompson SJ Walker RW Rosenblum MK Adenocarcinomatous transformation
of intracranial germ cell tumors Am J Surg Pathol 199519537-54426Yuan S Miller DW Barnett GH Hahn JF Williams BR Identification and characterization of
human beta 2-chimaerin association with malignant transformation in astrocytoma CancerResearch 1995 553456-3461
27 Preston-Martin S Mack WJ Neoplasms of the nervous system In Schoenfeld D Fraumeni JFJr eds Cancer epidemiology and prevention ed 2 New York Oxford University Press19961231-1281
28 Riggs JE Rising primary malignant brain tumor mortality in the elderly A manifestation ofdifferential survival Arch of Neurol 199552571-575
29 Davis FG Freels S Grutsch J Barlas S Brem S Survival rates in patients with primarymalignant brain tumors stratified by patient age and tumor histological type an analysisbased on Surveillance Epidemiology and End Results (SEER) data 1973-1991J Neurosurg 1998881-10
30 Surawicz TS Davis F Freels S Laws ER Menck HR Brain tumor survival results from theNational Cancer Data Base (Accepted for publication in J Neuro-Oncol)
31 Bondy ML Lustbader ED Buffler PA Schull WJ Hardy RJ Strong LC Geneticepidemiology of childhood brain tumors Genet Epidemiol 19918253-267
32 Preston-Martin S Monroe K Lee P Bernstein L Kelsey J Henderson S Forrester DHenderson B Spinal meningiomas in women in Los Angeles County Investigation of anetiologic hypothesis Cancer Epidemiol Biomarkers Prev 19954333-339
33 Davis JR Brownson RC Garcia R Bentz BJ Turner A Family pesticide use and childhoodbrain cancer Arch Environ Contam Toxicol 19932487-92
34 Commission on Cancer General principles and coding In Standards of the Commission on Cancer vol II Registry Operations and Data Standards American College of SurgeonsChicago Illinois 1996
35 Central Brain Tumor Registry of the United States (CBTRUS) 1997 State Survey of BenignBrain Tumor Collection Chicago Illinois 1997
36 Davis FG Malinski N Haenszel W Chang J Flannery J Gershman S Dibble R Bigner DDPrimary brain tumor incidence rates in the four United States regions 1985-1989 A pilotstudy Neuroepidemiol 199615103-112
37 Schoenberg BS Christine BW Whisnant JP The descriptive epidemiology of primaryintracranial neoplasms the Connecticut experience Am J Epidemiol 1976104499-510
Page 27
Endash
DATA COLLECTION
OF PRIMARY
CENTRAL NERVOUS
SYSTEM TUMORS
TAB
LE 1
C
OM
PAR
ISO
N O
F R
EGIS
TRIE
S SU
PPLY
ING
DA
TA O
N P
RIM
AR
Y I
NTR
AC
RA
NIA
L A
ND
CEN
TRA
L N
ERV
OU
S SY
STEM
TU
MO
RS
IN T
HE
UN
ITED
STA
TES
Cen
tral B
rain
Tum
or R
egis
try o
fth
e U
nite
d St
ates
(CBT
RUS)
Min
neso
ta C
ance
rSu
rvei
llanc
e Sy
stem
(MC
SS)
ACo
SN
a tio
nal C
ance
r Dat
a B
ase
(NCD
B)
Surv
eilla
nce
Epid
emio
logy
and
End
Res
ults
Pro
gram
(SEE
R)
Purp
ose
ldquoCB
TRU
S ce
ntra
lizes
pop
ulat
ion-
base
d in
cide
nce
data
on
all b
rain
tum
ors a
nd u
ses o
ther
exi
stin
gda
ta re
sour
ces t
o ch
arac
teriz
e th
ein
cide
nce
mor
talit
y a
nd su
rviv
alof
pat
ient
s with
bra
in tu
mor
s rdquo
The
MC
SS c
olle
cts i
nfor
mat
ion
onal
l can
cers
dia
gnos
ed si
nce
1988
amon
g M
inne
sota
resi
dent
s Th
e M
CSS
is p
opul
atio
n-ba
sed
path
olog
y-ba
sed
and
is a
n ac
tive
syste
m
ldquoThe
goa
l of t
he N
CD
B is
to p
rese
nt a
n an
nual
sum
mar
y of
pat
ient
car
e fo
r cas
es o
f can
cer
diag
nose
d an
d tre
ated
at h
ospi
tals
thro
ugho
utth
e co
untry
rdquo
ldquoA c
ontin
uing
pro
ject
of th
e N
CI
the
SEER
prog
ram
col
lect
sca
ncer
dat
a on
aro
utin
e ba
sis f
rom
desi
gnat
ed p
opul
atio
n-ba
sed
canc
er re
gist
ries
in v
ario
us a
reas
of t
heco
untry
Targ
et p
opul
atio
n Th
e po
pula
tions
cov
ered
by
regi
strie
s in
Ari
zona
Col
orad
oC
onne
ctic
ut D
elaw
are
Idah
oM
aine
Mas
sach
uset
ts
Min
neso
ta M
issou
ri M
onta
na
Nor
th C
arol
ina
and
Uta
h
The
CB
TRU
S po
pula
tion
repr
esen
ts a
non
rand
om 1
5pe
rcen
t sam
ple
of th
e U
S
popu
latio
n
The
popu
latio
n of
Min
neso
ta
The
popu
latio
ns tr
eate
d at
par
ticip
atin
gho
spita
ls in
the
50 st
ates
the
Dist
rict
of
Col
umbi
a a
nd P
uert
o R
ico
NC
DB
is n
ot a
pop
ulat
ion-
base
d re
gist
ry
At
pres
ent
it is
est
imat
ed to
cov
er a
ppro
xim
atel
y57
per
cent
of t
otal
cas
es n
atio
nwid
e
The
popu
latio
nsco
vere
d by
the
state
regi
strie
s in
Con
nect
icut
Haw
aii
Iow
a N
ew M
exic
o
and
Uta
h a
s wel
l as
the
regi
onal
regi
strie
sin
Atla
nta
Geo
rgia
D
etro
it M
ichi
gan
San
Fran
cisc
o-O
akla
nd C
alifo
rnia
an
d Se
attle
-Pug
etSo
und
Was
hing
ton
The
SEER
pop
ulat
ion
repr
esen
ts a
nonr
ando
m 1
4 pe
rcen
tsa
mpl
e of
the
US
po
pula
tion
Page
28
Endash
APPENDIX E
Cen
tral B
rain
Tum
or R
egis
try o
fth
e U
nite
d St
ates
(CBT
RUS)
Min
neso
ta C
ance
rSu
rvei
llanc
e Sy
stem
(MC
SS)
ACo
SN
a tio
nal C
ance
r Dat
a B
ase
(NCD
B)
Surv
eilla
nce
Epid
emio
logy
and
End
Res
ults
Pro
gram
(SEE
R)
Type
of
prim
ary
intra
cran
ial
and
cent
ral n
ervo
us sy
stem
tum
ors r
epor
ted
Dat
a on
new
ly-d
iagn
osed
cas
es o
fbe
nign
and
mal
igna
nt p
rimar
ybr
ain
tum
ors b
ased
on
ICD
-Oco
des
Dat
a on
new
ly-d
iagn
osed
m
i cro
scop
ical
ly-c
onfir
med
tum
ors
of th
e ce
ntra
l ner
vous
syste
m
incl
udin
g pi
tuita
ry a
nd p
inea
lgl
ands
Hos
pita
ls v
olun
taril
y su
bmit
full
anal
ytic
canc
er re
gist
ry c
asel
oads
with
dat
a ite
ms a
ndco
des d
efin
ed b
y th
e C
omm
issio
n on
Can
cer
(CO
C) f
or h
ospi
tal c
ance
r reg
istri
es
Mos
tpa
rtici
patin
g ho
spita
ls h
ave
prog
ram
sap
prov
ed b
y C
OC
or a
re e
stab
lishi
ng p
rogr
amap
prov
al
NC
DB
cal
ls fo
r dat
a do
not
lim
itca
ses b
y m
alig
nant
beh
avio
r bu
t acc
essi
onin
gof
non
-mal
igna
nt c
ases
is n
ot re
quire
d fo
rpr
ogra
m a
ppro
val
Fifty
-nin
e pe
rcen
t of t
heho
spita
ls th
at su
bmitt
ed a
ny in
tracr
ania
lCN
Sca
ses d
iagn
osed
dur
ing
1989
-199
4 su
bmitt
edat
leas
t one
non
mal
igna
nt c
ase
The
NC
DB
data
in th
is re
port
are
limite
d to
the
case
ssu
bmitt
ed b
y th
ese
hosp
itals
(82
perc
ent o
f all
intra
cran
ial a
nd e
xtra
cran
ial c
entra
l ner
vous
syste
m c
ases
on
file)
Tren
ds in
the
inci
denc
e m
orta
lity
and
patie
nt su
rviv
al o
fbr
ain
tum
ors i
n th
eU
S H
owev
er S
EER
does
not
col
lect
info
rmat
ion
on b
enig
nan
d un
certa
in b
rain
tum
ors
Oth
er c
omm
ents
D
uplic
ate
canc
er re
gist
ratio
ns c
anno
t be
iden
tifie
d by
the
parti
cipa
ting
regi
strie
s
The
MC
SS p
erfo
rms 1
00 p
erce
ntca
se fi
ndin
g au
dits
in a
ll pa
thol
ogy
labo
rato
ries o
n an
ann
ual b
asis
Th
eref
ore
the
data
from
the
MC
SSm
ight
be
cons
ider
ed a
ldquobe
st-ca
sesc
enar
iordquo
in te
rms o
f com
plet
enes
sof
repo
rting
for m
icro
scop
ical
ly-
conf
irmed
tum
ors
Rep
ort d
uplic
atio
n fo
r 198
9-19
94 in
tracr
ania
lan
d ex
tracr
ania
l cen
tral n
ervo
us sy
stem
repo
rts w
as 6
7 p
erce
nt
How
ever
the
NC
DB
data
in T
able
s 2 th
roug
h 9
are
base
d on
undu
plic
ated
repo
rts
Page
29
Endash
DATA COLLECTION
OF PRIMARY
CENTRAL NERVOUS
SYSTEM TUMORS
TABLE 2 NUMBER AND PERCENT OF PRIMARY INTRACRANIAL AND CENTRAL NERVOUS SYSTEM TUMORS BY TUMOR LOCATION
Locationa CBTRUSb
Number () MCSSc
Number () NCDBd
Number () SEERe
Number ()
Intracranial 13084 (947) 3600 (936) 66322 (955) 10196 (969)
Brain 7999 (579) 1924 (500) 48527 (699) 9721 (924)
Meninges 2719 (197) 838 (218) 9365 (135) 139 (13)
Pituitarycraniopharygealduct
1491 (108) 530 (138) 4958 (71) 30 (03)
Pineal 74 (05) 21 (05) 477 (07) 80 (08)
Other central nervous systemincluding cranial nerves
801 (58) 287 (75) 2995 (43) 226 (22)
Extracranial 730 (53) 245 (64) 3137 (45) 322 (31)
Spinal cord 497 (36) 47 (38) 2395 (34) 313 (30)
Spinal meninges 233 (17) 98 (25) 742 (11) 9 (01)
TOTAL 13814 (100) 3845 (100) 69459 (100) 10518 (100)
Note Reported data are incident cases from 1989-1994 except for CBTRUS data which are from 1990-1993
aRefer to the sites in Appendix BbCentral Brain Tumor Registry of the United States cMinnesota Cancer Surveillance System (microscopically confirmed cases only)dNational Cancer Data Base (limited to cases reported by hospitals that accessioned nonmalignant cases) eSurvival Epidemiology and End results Program (malignant cases only)
Page 30
Endash0
TABL
E 3
RO
W P
ERCE
NT
DIS
TRIB
UTI
ON
OF
PRIM
ARY
INTR
ACR
AN
IAL
AN
D C
ENTR
AL
NER
VO
US
SYST
EM T
UM
ORS
BY
TU
MO
R B
EHA
VIO
RA
ND
MIC
ROSC
OPI
C C
ON
FIRM
ATI
ON
Loca
tiona
CB
TRU
Sb M
CSSc
NC
DB
d SE
ERe
Tota
l Pe
rcen
tM
icro
Co
nfirm
ed
Perc
ent
Not
Mic
ro
Conf
irmed
Tota
l Pe
rcen
tM
icro
Co
nfirm
ed
Perc
ent
Not
Mic
ro
Conf
irmed
Tota
l Pe
rcen
tM
icro
Co
nfirm
ed
Perc
ent
Not
Mic
ro
Conf
irmed
Tota
l Pe
rcen
tM
icro
Co
nfirm
ed
Perc
ent
Not
Mic
ro
Conf
irmed
Intra
cran
ial
130
84
867
13
3
360
0 10
0 N
A
663
22
887
11
3
101
96
871
12
9
Mal
igna
nt
717
1 89
2
108
1
824
100
NA
44
801
91
3
87
101
96
871
12
9
Beni
gn a
ndu n
certa
in
591
3 83
5
165
1
776
100
NA
21
521
83
2
168
N
A
NA
N
A
Bra
in
799
9 88
2
118
1
924
100
NA
48
527
90
2
98
972
1 87
3
127
Mal
igna
nt
686
2 89
6
104
1
746
100
NA
42
622
91
5
85
972
1 87
3
127
Beni
gnan
dun
certa
in
113
7 80
6
194
17
8 10
0 N
A
590
5 80
6
194
N
A
NA
N
A
Extra
cran
ial
730
962
3
8 24
5 10
0 N
A
313
7 96
0
40
322
957
4
3
Mal
igna
nt
242
934
6
6 60
10
0 N
A
148
3 96
6
34
322
957
4
3
Beni
gn a
ndu n
certa
in
488
975
2
5 18
5 10
0 N
A
165
4 95
5
45
NA
N
A
NA
TOTA
Lf 13
814
87
2
128
3
845
100
NA
69
459
89
0
110
10
518
87
4
126
Mal
igna
nt
741
3 89
4
106
1
884
100
NA
46
284
91
5
85
105
18
874
12
6
Beni
gn a
ndu n
certa
in
640
1 84
6
154
1
961
100
NA
23
175
84
1
159
N
A
NA
N
A
Not
e R
epor
ted
data
are
inci
dent
cas
es fr
om 1
989-
1994
exc
ept f
or C
BTR
US
data
whi
ch a
re fr
om 1
990-
1993
a Refe
r to
the
site
code
s in
App
endi
x B
b Cent
ral B
rain
Tum
or R
egist
ry o
f the
Uni
ted
Stat
es
c Min
neso
ta C
ance
r Sur
veill
ance
Sys
tem
(mic
rosc
opic
ally
con
firm
ed c
ases
onl
y)
d Nat
iona
l Can
cer D
ata
Base
(lim
ited
to c
ases
repo
rted
by h
ospi
tals
that
acc
essio
ned
nonm
alig
nant
cas
es)
e Surv
eilla
nce
Epi
dem
iolo
gy a
nd E
nd R
esul
ts Pr
ogra
m (m
alig
nant
cas
es o
nly)
f In
clud
es in
tracr
ania
l and
ext
racr
ania
l cas
es
NA
= N
ot a
pplic
able
Page
31
APPENDIX E
Endash
DATA COLLECTION
OF PRIMARY
CENTRAL NERVOUS
SYSTEM TUMORS
TABLE 4 NUMBER AND PERCENT OF PRIMARY INTRACRANIAL AND CENTRAL NERVOUS SYSTEM TUMORS BY DIAGNOSTIC CONFIRMATION
DiagnosticConfirmation
CBTRUSa
Number () MCSSb
Number () NCDBc
Number () SEERd
Number ()
Positive microscopy
12087 (875) 3845 (100) 61818 (890) 9188 (874)
Radiographywithout microscopy
1306 (95) NA 6759 (97) 1015 (97)
Clinical 204 (15) NA 484 (07) 98 (09)
Unknown 217 (15) NA 398 (06) 217 (21)
TOTAL 13814 (100) 3845 (100) 69459 (100) 10518 (100)
Note Reported data are incident cases from 1989-1994 except for CBTRUS data which are from 1990-1993
aCentral Brain Tumor Registry of the United Statesb Minnesota Cancer Surveillance System (microscopically confirmed cases only) cNational Cancer Data Base (limited to cases reported by hospitals that accessioned nonmalignant cases)dSurveillance Epidemiology and End Results Program (malignant cases only)NA = Not applicable
Page 32
Endash
Page 32
TABLE 4 NUMBER AND PERCENT OF PRIMARY INTRACRANIAL AND CENTRALNERVOUS SYSTEM TUMORS BY DIAGNOSTIC CONFIRMATION
DiagnosticConfirmation
CBTRUSa
Number ()MCSSb
Number ()NCDBc
Number ()SEERd
Number ()
Positivemicroscopy
12087 (875) 3845 (100) 61818 (890) 9188 (874)
Radiographywithout microscopy
1306 (95) NA 6759 (97) 1015 (97)
Clinical 204 (15) NA 484 (07) 98 (09)
Unknown 217 (15) NA 398 (06) 217 (21)
TOTAL 13814 (100) 3845 (100) 69459 (100) 10518 (100)
Note Reported data are incident cases from 1989-1994 except for CBTRUS data which are from 1990-1993
aCentral Brain Tumor Registry of the United Statesb Minnesota Cancer Surveillance System (microscopically confirmed cases only)cNational Cancer Data Base (limited to cases reported by hospitals that accessioned nonmalignant cases)dSurveillance Epidemiology and End Results Program (malignant cases only)NA = Not applicable
APPENDIX E
TABLE 5 NUMBER AND PERCENT OF MALIGNANT PRIMARY INTRACRANIAL AND CENTRAL SYSTEM TUMORS BY TUMOR LOCATION
Locationa CBTRUSb
Number () MCSSc
Number () NCDBd
Number () SEERe
Number ()
Intracranial 7171 (977) 1824 (968) 44801 (968) 10196 (969)
Brain 6862 (926) 1746 (927) 42622 (921) 9721 (924)
Meninges 98 (13) 23 (12) 581 (13) 139 (13)
Pituitarycraniopharyngealduct
37 (05) 13 (07) 189 (04) 30 (03)
Pineal 58 (08) 20 (11) 378 (08) 80 (08)
Other central nervous systemincluding cranial nerves
116 (16) 22 (12) 1031 (22) 226 (21)
Extracranial 242 (33) 60 (32) 1483 (32) 322 (31)
Spinal cord 234 (32) 60 (32) 1410 (30) 313 (30)
Spinal meninges 8 (01) 0 73 (02) 9 (01)
TOTAL 7413 (100) 1884 (100) 46284 (100) 10518 (100)
Note Reported data are incident cases from 1989-1994 except for CBTRUS data which are from 1990-1993
aRefer to the site codes in Appendix BbCentral Brain Tumor Registry of the United States cMinnesota Cancer Surveillance System (microscopically confirmed cases only)dNational Cancer Data Base (limited to cases reported by hospitals that accessioned nonmalignant cases) eSurvival Epidemiology and End Results Program (malignant cases only)
Page 33
Endash
DATA COLLECTION
OF PRIMARY
CENTRAL NERVOUS
SYSTEM TUMORS
TABLE 6 NUMBER AND PERCENT OF PRIMARY INTRACRANIAL AND CENTRAL NERVOUS SYSTEM TUMORS OF BENIGN AND UNCERTAIN BEHAVIOR BY TUMOR LOCATION
Locationa CBTRUSb
Number () MCSSc
Number () NCDBd
Number () SEERe
Number ()
Intracranial 5913 (924) 1776 (906) 21521 (929) NA
Brain 1137 (178) 178 (91) 5905 (255) NA
Meninges 2621 (409) 815 (416) 8784 (379) NA
Pituitarycraniopharyngealduct
1454 (227) 517 (264) 4769 (206) NA
Pineal 16 (02) 1 (lt01) 99 (04) NA
Other central nervous systemincluding cranial nerves
685 (107) 265 (135) 1964 (85) NA
Extracranial 488 (76) 185 (94) 1654 (71) NA
Spinal cord 263 (41) 87 (44) 985 (42) NA
Spinal meninges 225 (35) 98 (50) 669 (29) NA
TOTAL 6401 (100) 1961 (100) 23175 (100) NA
Note Reported data are incident cases from 1989-1994 except for CBTRUS data which are from 1990-1993
aRefer to the site codes in Appendix BbCentral Brain Tumor Registry of the United States cMinnesota Cancer Surveillance System (microscopically confirmed cases only)dNational Cancer Data Base (limited to cases reported by hospitals that accessioned nonmalignant cases) eSurveillance Epidemiology and End Results Program (malignant cases only)NA = Not applicable
Page 34
Endash
APPENDIX E TABLE 7 NUMBER AND PERCENT OF PRIMARY INTRACRANIAL AND CENTRAL
NERVOUS SYSTEM TUMORS BY TUMOR BEHAVIOR AND LOCATION
BehaviorTumor Locationa
CBTRUSb
Number () MCSSc
Number () NCDBd
Number () SEERe
Number ()
Malignant 7413 (537) 1884 (490) 46284 (666) 10518 (100)
Brain 6862 (497) 1746 (454) 42622 (614) 9721 (924)
Meninges 98 (07) 23 (06) 581 (08) 139 (13)
Pituitarycraniopharyn-geal ductpineal
95 (07) 33 (09) 567 (08) 110 (11)
Other central nervous system includingcranial nerves
116 (08) 22 (06) 1031 (15) 226 (22)
Spinal cord 242 (18) 60 (16) 1483 (21) 322 (31)
Benign 5794 (419) 1787 (465) 20694 (298) NA
Brain 803 (58) 99 (26) 4491 (65) NA
Meninges 2565 (186) 807 (210) 8613 (124) NA
Pituitarycraniopharyn-geal ductpineal
1322 (96) 458 (119) 4330 (62) NA
Other central nervous system includingcranial nerves
678 (49) 263 (68) 1911 (28) NA
Spinal cord 426 (31) 160 (42) 1349 (19) NA
Uncertain 607 (44) 174 (45) 2481 (36) NA
Brain 334 (24) 79 (21) 1414 (20) NA
Meninges 56 (04) 8 (02) 171 (02) NA
Pituitarycraniopharyn-geal ductpineal
148 (11) 60 (16) 538 (08) NA
Other central nervous system includingcranial nerves
7 (01) 2 (01) 53 (01) NA
Spinal cord 62 (05) 25 (07) 305 (04) NA
TOTAL 13814 (100) 3845 (100) 69459 (100) 10518 (100)
Note Reported data are incident cases from 1989-1994 except for CBTRUS data which are from 1990-1993 NA=Not applicableaRefer to the site codes in Appendix B bCentral Brain Tumor Registry of the United States cMinnesota Cancer Surveillance System (microscopically confirmed cases only)dNational Cancer Data Base (limited to cases reported byhospitals that accessioned nonmalignant cases eSurvival Epidemiology and End Results Program (malignant cases only)
Page 35
Endash
DATA COLLECTION
OF PRIMARY
CENTRAL NERVOUS
SYSTEM TUMORS
TABLE 8 NUMBER AND PERCENT OF MALIGNANT PRIMARY INTRACRANIAL AND
CENTRAL NERVOUS SYSTEM TUMORS BY HISTOLOGY GROUPINGS
WHO Histologya
Groupings CBTRUSb
Number () MCSSc
Number () NCDBd
Number () SEERe
Number ()
Neuroepithelial 6477 (874) 1689 (896) 39701 (858) 8676 (825)
Tumors of cranial and spinal nerves
12 (02) 3 (02) 108 (02) 25 (02)
Tumors of meninges
137 (18) 25 (13) 994 (21) 194 (18)
LymphomasHemopoietic
473 (64) 121 (64) 3492 (75) 1099 (105)
Germ cell 70 (09) 20 (11) 403 (09) 97 (09)
Cysts and tumor-like lesions
0 0 0 0
Tumors of sellar region
20 (03) 11 (06) 100 (02) 6 (01)
Local extensions 29 (04) 11 (06) 166 (04) 38 (04)
Unclassifiedunassigned tumorsf
195 (26) 4 (02) 1320 (29) 383 (36)
TOTAL 7413 (100) 1884 (100) 46284 (100) 10518 (100)
Note Reported data are incident cases from 1989-1994 except for CBTRUS data which are from 1990-1993
aRefer to the World Health Organization (WHO) histology groupings in Appendix CbCentral Brain Tumor Registry of the United States cMinnesota Cancer Surveillance System (microscopically confirmed cases only)dNational Cancer Data Base (limited to cases reported by hospitals that accessioned nonmalignant cases) f For MCSS unclassifiedunassigned tumors include one malignant and four nonmalignant histologies which were
not listed in the CBTRUS classification scheme For NCDB unclassifiedunassigned tumors include 319 cases(less than one half percent) which had histologies not assigned by CBTRUS to any other category For SEERunclassifiedunassigned tumors include all malignant histologies occurring in the brainCNS which could not beclassified in one of the above categories based on their 4-digit histologic type
Page 36
Endash
APPENDIX E
TABLE 9 NUMBER AND PERCENT OF PRIMARY INTRACRANIAL AND CENTRAL NERVOUS SYSTEM TUMORS OF BENIGN AND UNCERTAIN BEHAVIOR
BY HISTOLOGY GROUPINGS
WHO Histologya
Groupings CBTRUSb
Number () MCSSc
Number () NCDBd
Number () SEERe
Number ()
Neuroepithelial 275 (43) 91 (46) 1064 (46) NA
Tumors of cranial and spinal nerves
980 (153) 397 (202) 2618 (113) NA
Tumors of meninges
3509 (548) 941 (480) 13667 (590) NA
LymphomasHemopoietic
3 (lt01) 0 7 (lt01) NA
Germ cell 4 (lt01) 1 (01) 25 (01) NA
Cysts and tumor-like lesions
15 (02) 3 (02) 34 (01) NA
Tumors of sellar region
1444 (226) 510 (260) 4749 (205) NA
Local extensions 0 0 0 NA
Unclassifiedunassigned tumorsf
171 (27) 18 (09) 1011 (44) NA
TOTAL 6401 (100) 1961 (100) 23175 (100) NA
Note Reported data are incident cases from 1989-1994 except for CBTRUS which is 1990-1993
aRefer to the World Health Organization (WHO) histology groupings in Appendix CbCentral Brain Tumor Registry of the United States c Minnesota Cancer Surveillance System (microscopically confirmed cases only) dNational Cancer Data Base (limited to cases reported by hospitals that accessioned nonmalignant cases) eSurvival Epidemiology and End Results Program (malignant cases only)dFor MCSS unclassifiedunassigned tumors include one malignant and four nonmalignant histologies which werenot listed in the CBTRUS classification scheme For NCDB unclassifiedunassigned tumors include 319 cases(less than one half percent) which had histologies not assigned by CBTRUS to any other category For SEERunclassifiedunassigned tumors include all malignant histologies occurring in the brainCNS which could not beclassified in one of the above categories based on their 4-digit histologic typeNA = Not applicable
Page 37
Endash
DATA COLLECTION
OF PRIMARY
CENTRAL NERVOUS
SYSTEM TUMORS
TABLE 10 METHOD OF CASE FINDING FOR PRIMARY INTRACRANIAL AND CENTRAL NERVOUS SYSTEM TUMORS BY TUMOR BEHAVIOR AND LOCATION MINNESOTA 1989-1994
Behavior Tumor Locationa
Number of Cases
Percent Found byRoutine
Reporting
Percent Found by Special Efforts
Malignant Brain Cerebral meninges
Pituitarycranio duct pineal Other intracranial
18841746 23 33
22
961 965 957 939
864
39 35 43 61
136 Extracranial 60 883 117 Benign Brain
1787 99
788 838
212 162
Cerebral meninges Pituitarycranio duct
pineal Other intracranial
807 458
263
843 740
779
157 260
221 Extracranial 160 631 369 Uncertain 174 856 144 Brain 79 823 177 Cerebral meninges Pituitarycraniopharyn- geal ductpineal Other intracranial
8 60
2
875 850
1000
125 150
00 Extracranial 25 960 40
TOTAL 3845 876 124
aRefer to the site codes in Appendix B
Page 38
Endash
1989 1990 1991 1992 1993 1994
TOTAL
APPENDIX E TABLE 11 METHOD OF CASE FINDING FOR INTRACRANIALa TUMORS BY DIAGNOSIS YEAR MINNESOTA 1989-1994
DiagnosisYear
Number of
Cases
Percent Found byRoutine
Reporting
Percent Found by
Special Efforts
571 837 163 616 865 135 586 913 87 602 899 101
633 872 128 592 929 71
3600 886 114
aIncludes the brain cerebral meninges pituitary gland pineal gland and otherintracranial tumors (refer to the site codes in Appendix B)
Page 39
Endash
DATA COLLECTION
OF PRIMARY
CENTRAL NERVOUS
SYSTEM TUMORS
TABLE 12 METHOD OF CASE FINDING FOR NONMALIGNANT INTRACRANIALa TUMORS BY TYPE OF FACILITY MINNESOTA 1989-1994
Type of Facility Number of Tumors Percent Found byRoutine
Reporting
Percent Found by Special Efforts
Registry at facility No registry at facility
1451325
859 569
141 431
TOTAL 1776 806 194
aIncludes tumors with benign or uncertain behavior that involve the brain cerebral meningespituitary gland pineal gland or other intracranial sites (refer to the site codes in Appendix B)
TABLE 13 REPORTING METHOD AND SOURCE OF CASE FINDING FOR NON- MALIGNANT INTRACRANIALa TUMORS DIAGNOSED IN HOSPITALS WITH A TUMOR REGISTRY MINNESOTA 1989-1994
Reporting Method Number of Tumors Percent Found byRoutine
Reporting
Percent Found by
Special Efforts
Registry-reportedLaboratory-reported
1226225
925 502
75 498
TOTAL 1451 859 141
aIncludes tumors with benign or uncertain behavior that involve the brain cerebral meningespituitary gland pineal gland or other intracranial sites (refer to the site codes in Appendix B)
Page 40
Endash0
APPENDIX E TABLE 14 HOSPITAL REGISTRY ACCESSIONING OF MALIGNANT AND NON-
MALIGNANT PRIMARY INTRACRANIAL AND CENTRAL NERVOUS SYSTEM TUMORS NCDB 1989-1994
TUMOR Totalb
BEHAVIOR Malignant c Nonmalignantd
Tumor Locationa HospitalsReporting
Number ()
Hospitals Reporting
Number ()
Hospitals Reporting
Number ()
Intracranial 1542 (100) 1526 (100) 900 (99)
Brain 1527 (99) 1519 (gt99) 754 (83)
Meninges 740 (48) 390 (26) 613 (67)
Pituitaryglandcraniopharyn-
geal duct
602 (39) 168 (11) 538 (59)
Pineal gland 319 (21) 277 (18) 79 (9)
Other central nervous system including cranial
nerves
648 (42) 545 (36) 299 (33)
Extracranial 812 (53) 708 (46) 410 (45)
Spinal cord 760 (49) 692 (45) 311 (34)
Spinal meninges 299 (19) 72 (5) 258 (28)
TOTAL Hospitals 1542 (100) 1526 (100) 913 (100)
Note The number of hospitals in each of the second third and fourth columns is the number that submittedreports to the NCDB for any intracranial and central nervous system tumors for the respective malignancystatus Not all hospitals submitted reports for each year during the study period (1989-1994)
aRefer to the site codes in Appendix B bBehavior codes = 0 1 3 cBehavior code = 3 dBehavior codes = 0 1
Page 41
Endash
DATA COLLECTION
OF PRIMARY
CENTRAL NERVOUS
SYSTEM TUMORS
Texas Cancer Registry
1997 CBTRUS State Survey of Benign Brain Tumor Data Collection
State Collection Status
Currently Collecting Benign Tumor Data1 Arizona Cancer Registry since 1981 2 Colorado Central Cancer Registry since 1988 3 Connecticut Tumor Registry since 1965 4 Idaho Cancer Data Registry since 1970 5 Maine Cancer Registry since 1983 6 Massachusetts Cancer Registry since 1982 7 Minnesota Cancer Surveillance System since 1988 8 Montana Central Tumor Registry since 1979 9 New York State Cancer Registry since 1988
10 North Carolina Central Cancer Registry since 1990 11 Utah Cancer Registry since 1966 12 Virginia Cancer Registry since 1994 13 Delaware State Cancer Registry14 Washington State Cancer Registry since 1992 15 passive collection 1979-1994
active collection since 1995
Stopped or Passive Collection of Benign Tumor Data1 New Jersey State Cancer Registry stopped 1979-1995 2 Kansas Cancer Registry stopped 1969-1995 3 New Hampshire State Cancer Registry stopped 1986-1991 4 District of Columbia Cancer Registry stopped 1997 5 Wyoming Cancer Surveillance Program stopped 111996 6 Louisiana Tumor Registry stopped 1992 (passive collection) 7 Illinois State Cancer Registry stopped 111996 8 Missouri Cancer Registry passive collection since 1984 9 South Carolina Central Cancer Registry passive collection since 1996
Beginning Collection of Benign Tumor Data1 North Dakota Cancer Registry began collection 1997 2 Rhode Island Cancer Registry began collection 1998
Page 42
Endash
APPENDIX E
Codes for Primary Intracranial and Central Nervous System Tumors
Note For this report the designation of ldquoprimary intracranial and central nervous system tumorsrdquo includes thefollowing primary tumors of central nervous system sites as well as tumors of the pituitary and pinealglands All histology types within the topography codes are included in the designation of ldquoprimaryintracranial and CNS tumors The source for the topography codes is Percy C Van Holten V Muir Ceds International Classification of Diseases for Oncology Second Edition Geneva World Health Organization 1990
Intracranial tumors
Brain C710 Cerebrum C711 Frontal lobe C712 Temporal lobe C713 Parietal lobe C714 Occipital lobe C715 Ventricle NOSC716 Cerebellum NOS C717 Brain stem C718 Overlapping lesion of brain C719 Brain NOS
Meninges C700 Cerebral meninges C709 Meninges NOS
a
Cranial Nerves and other intracranial parts of the central nervous systemC722 Olfactory nerve C723 Optic nerve C724 Acoustic nerve C725 Cranial nerve NOS C728 Overlapping lesion of brain and central nervous system C729 Nervous system NOS
Other endrocrine glands and related structures C751 Pituitary gland C752 Craniopharyngeal duct C753 Pineal gland
Extracranial tumors
Spinal cord C720 Spinal cord C721 Cauda equina
Meninges C701 Spinal meninges
aNOS=Not Otherwise Specified
Page 43
Endash
DATA COLLECTION
OF PRIMARY
CENTRAL NERVOUS
SYSTEM TUMORS
Brain Tumor Histology Groupings
The following histology groupings were used for the primary intracranial and central nervoussystem tumors The source for the histology groupings is Central Brain Tumor Registry ofthe United States (CBTRUS) 1996 Statistics Report Table 4
WHOa HISTOLOGY GROUPINGS ICD-Ob MORPHOLOGY CODE
Diffuse astrocytoma (protoplasma fibrillary) 9410 9420 Anaplastic astrocytoma 9401 9411 Glioblastoma 9440 9441 9442 Pilocytic astrocytoma 9421 Unique astrocytoma variants 9383 9384 9424 Oligodendroglioma 9450 Anaplastic oligodendroglioma 9451 9460 Ependymomaanaplastic ependymoma 9391 9392 9393 Ependymoma variants 9394 Mixed glioma 9382 Astrocytoma NOSc 9400 Glioma malignant NOS 9380 Choroid plexus 9390 Neuroepithelial 9381 9423 9430 Benign neuronalglial neuronal and mixed 86801 8693 9490 9505 9506 Malignant neruonalglial neuronal and mixed 86803 9364 9490 9500 Pineal parenchymal 9360 9361 9362 Embryonalprimitivemedulloblastoma 8963 9470 9471 9472
9473 9501 9502 9503 9510
TUMORS OF NEUROEPITHELIAL TISSUE
TUMORS OF CRANIAL AND SPINAL NERVES Nerve sheath benign and malignant 9540 9550 9560 9570
TUMORS OF THE MENINGES Meningioma 9530 9531 9532 9533 9534 9537 9538 Other mesenchymal benign and malignant 8800 8801 8802 8803 8810 8830 8850 88618900
8910 8990 9133 9150 9240 9480 9481 9536 9539 Hemangioblastoma 9161 9535
LYMPHOMAS AND HEMOPOIETIC NEOPLASMS Lymphoma 9590 9591 9593 9594 9595 9630 9650 9652
9663 9670 9671 9672 9674 9675 9680 9681 9682 9684 9685 9686 9687 9690 9691 96939695 9696 9698 9702 9714 9723 9731 9766 9970
GERM CELL TUMORS Germ cell 8020 9060 9064 9070 9071 9080 9084 9085 9100
CYSTS AND TUMOR-LIKE LESIONS Cysts and heterotopias 9084
TUMORS OF THE SELLAR REGION Pituitary 8040 8l40 8l46 8260 8270 8271 8280
8281 8290 8300 8330 8323 8333 Craniopharyngioma 9350
Page 44
Endash
APPENDIX E
LOCAL EXTENSIONS FROM REGIONAL TUMORS Chordomachondrosarcoma 9370
UNCLASSIFIED TUMORS Hemangioma 9120 9121 9130 9131 Neoplasm benign 80000 8010 Neoplasm uncertain behavior 80001 80011 Neoplasm malignant 80003 80013 8002 8003 All other 8720 9580
aWHO = World Health OrganizationbICD-O = International Classification of Diseases for Oncology Second Edition 1990 cNOS=Not Otherwise Specified
Page 45
Endash
DATA COLLECTION
OF PRIMARY
CENTRAL NERVOUS
SYSTEM TUMORS
Endash
International Classification of Childhood Cancer (ICCC)
Diagnostic Group
ICD-Oa codes
Morphology Topography
I LEUKAEMIA
(a) Lymphoid leukaemia 9820-9827 9850
(b) Acute non-lymphocytic leukaemia 9840 9841 9861 9864 9866 9867 98919894 9910
(c) Chronic myeloid leukaemia 9863 9868
(d) Other specified leukaemias 9830 9842 9860 9862 9870-9890 9892 98939900 9930-9941
(e) Unspecified leukaemias 9800-9804
II LYMPHOMAS AND OTHER RETICULOENDOTHELIAL NEOPLASMS
(a) Hodgkinrsquos disease 9650-9667
(b) Non-Hodgkinrsquos lymphoma 9591-9595 9670-9686 9690-9714 9723
(c) Burkittrsquos lymphoma 9687
(d) Miscellaneous lymphoreticular neoplasms 9720 9731-9764
(e) Unspecified lymphomas 9590
III CENTRAL NERVOUS SYSTEM (CNS) ANDMISCELLANEOUS INTRACRANIAL AND
INTRASPINAL NEOPLASMSb
(a) Ependymomac 9383 9390-9394
(b) Astrocytoma 9380 C723
9381 9400-9441
(c) Primitive neuroectodermal tumours 9470-9473
(d) Other gliomasd 9380 C700-C722C724-C729
9382 9384
9442-9460 9481
APPENDIX E
Diagnostic Group
ICD-Oa codes
Morphology Topogragphy
III CNS AND MISCELLANEOUS INTRACRANIAL AND INTRASPINAL
NEOPLASMSb Continued
(e) Miscellaneous intracranial and intraspinalneoplasmsc
8270-8281 8300 9350-9362 9480 95059530-9539
(f) Unspecified intracranial and intraspinalneoplasmsc
8000-8004 C700-C729C751-C753
IV SYMPATHETIC NERVOUS SYSTEM TUMOURS
(a) Neuroblastoma and ganglioneuroblastoma 9490 9500
(b) Other sympathetic nervous system tumours 8680 8693-8710 9501-9504 9520-9523
aInternational Classification of Diseases for Oncology Second Edition World Health Organization 1990bGroup III excludes all lymphomas See group II cBehaviour codes 0 and 1 are included dBehaviour code 1 is included
Page 47
Endash
Comments and recommendations are welcome Should questions arise on how to use these
materials or for more information please contact
Centers for Disease Control and Prevention National Program of Cancer Registries
4770 Buford Hwy NE Mail Stop K-53
Atlanta GA 30042-3717
Voice Information System 1 (888) 842-6355 bull Fax (770) 488-4760
cancerinfocdcgov bull httpwwwcdcgovcancer
All materials are in the public domain and may be reproduced or copied without permission citation
to source however is appreciated
BACK COVER
(WHITE)
Spine(WHITE)
DATA COLLECTION OF PRIMARY CEN
TRAL NERVOUS SYSTEM
TUM
ORS 2004
National Program of Cancer Registries Training M
aterials
DATA COLLECTION
OF PRIMARY
CENTRAL NERVOUS
SYSTEM TUMORS
Endash
CBTRUS developed preliminary histology groupings with the aim of improved clinical
relevance ICD-O morphology codes which are used by cancer registries were grouped
based on WHO categories for brain tumors The details of these groupings are shown in
Appendix C
RESULTS
Percentages of Primary Intracranial and CNS Tumors by Tumor Location and by
Microscopic Confirmation
Intracranial tumors comprise more than 94 percent of primary intracranial and CNS
tumors and between 50 and 92 percent of primary intracranial and CNS tumors occur in the
brain (Table 2) The data in this report also show that a slightly greater percentage of
malignant intracranial tumors including malignant brain tumors are microscopically
confirmed compared with corresponding tumors of benign or uncertain behavior (Table 3)
However regardless of tumor behavior the percentages of extracranial CNS tumors that are
microscopically confirmed are higher than the percentages of intracranial tumors that are
confirmed by pathologists (Table 3) Few primary intracranial and CNS tumors are not
microscopically confirmed approximately 11 percent of diagnoses are based only on a clinical
or radiographical (without microscopy) assessment (Table 4)
Percentages of Malignant and of Nonmalignant Intracranial and CNS Tumors by Location
The relative distribution of nonmalignant intracranial and CNS tumors varies by
primary site While greater than 90 percent of malignant intracranial and CNS tumors occur
in the brain (Table 5) only 9 to 26 percent of the nonmalignant tumors occur as parenchymal
tumors (Table 6) Nonmalignant tumors comprised a significant portion of the primary
intracranial and CNS tumors reported by the sources The ratios of nonmalignant to primary
malignant intracranial and CNS tumors reported by CBTRUS MCSS and NCDB were 09
10 and 05 respectively (Table 7)
Percentages of Malignant and of Nonmalignant Intracranial and CNS Tumors by Histology
Among the malignant primary intracranial and CNS tumors neuroepithelial (ie
astrocytic) tumors represent 83 to 90 percent of the cases depending on the data source
Page 18
APPENDIX E lymphomashemopoietic tumors 6 to 11 percent tumors of the meninges 1 to 2 percent and
tumors of cranial and spinal nerves 02 percent (Table 8) For nonmalignant primary
intracranial and CNS tumors tumors of the meninges represent 48 to 59 percent of the cases
tumors of the sellar region (including pituitary tumors and craniopharyngiomas) 21 to 26
percent tumors of cranial and spinal nerves 11 to 20 percent and neuroepithelial tumors 4 to
5 percent (Table 9)
Percentages of Primary Intracranial and CNS Tumors by Method of Case Finding (MCSS)
Case finding audits by the MCSS occur on an annual basis in all pathology laboratories in
Minnesota and include the review of surgerypathology cytology autopsy and hematology
records These audits enable the registry to ensure that there is complete reporting of cases of
malignant and nonmalignant tumors In tables 10 through 13 data from MCSS on primary
intracranial and CNS tumors are presented by method of case finding The two methods of case
finding are routine reporting and special efforts A case was found by routine reporting if one
or more reports received before the close-out date for a given diagnosis year was initiated by a
hospital or nonhospital facility In contrast a case was found by special efforts if all reports of that
case received before the close-out date were requested as a result of pathology laboratory audits
The data in Table 10 indicate that routine reporting of nonmalignant tumors was less complete
compared with reporting for malignant tumors The percentages of intracranial tumor cases that
were found by special efforts have varied from year to year but the trend suggests that routine
reporting may be improving (Table 11) The greatest improvement has been in the coverage of
nonbrain parenchymal tumors (ie pituitarypineal and other intracranial) The small numbers of
autopsy-only tumors were more likely to be found by special case finding efforts than by other
methods of microscopic confirmation (data not shown)
Most hospitals in Minnesota have cancer registries through which their tumor cases are
reported However some of the cases that are seen at hospitals with registries are reported only
through pathology laboratories affiliated with the hospitals Approximately 80 percent
(14511776) of the cases of nonmalignant intracranial tumors in the MCSS data base were
reported by hospitals with registries (Table 12) eighty-five percent (12261451) of these cases
were reported by the hospitals registries (Table 13)The remaining 15 percent (2251451) of the
Page 19
Endash
DATA COLLECTION
OF PRIMARY
CENTRAL NERVOUS
SYSTEM TUMORS
Endash0
cases were reported through the pathology laboratories affiliated with the hospitals with registries
(ie they were not accessioned by the registries) (Table 13) The percentages of cases of
nonmalignant tumors that were reported only by the pathology laboratories at facilities having
cancer registries can be viewed as a measure of how frequently the registries failed to accession
the cases Of the 225 nonaccessioned tumors half would have been missed without the MCSS
case finding audits of pathology laboratories (Table 13)
Percentages of Hospital Cancer Registries That Accessioned Malignant and Nonmalignant
Intracranial and CNS Tumors (NCDB)
Based on data from NCDB more than 1500 hospitals accessioned cases with either
malignant or nonmalignant intracranial and CNS tumors and approximately 800 hospitals
accessioned extracranial cases Cases with tumors that involved the cranial or spinal meninges or
the pituitary gland were more likely to be reported by hospitals that accessioned nonmalignant
primary intracranial and CNS tumors than by hospitals that accessioned only malignant tumors
(Table 14)
DISCUSSION
The findings for this report indicate that collection and reporting of incidence data for
primary malignant intracranial and other CNS tumors are well standardized However substantial
variation exists in the processes of collecting and reporting nonmalignant tumor data One
obstacle is that not all hospitals have cancer registries Another problem is that not all hospitals
with registries accession cases of nonmalignant tumors Data from Minnesota (Table 13) suggest
that approximately 85 percent of cases of nonmalignant intracranial tumors are accessioned by
hospital registries However nonaccessioned CNS cases are less likely to be routinely reported to
the central registry (Table 13) These differences in collection and reporting practices among the
registries make it difficult to assess the burden of primary intracranial and CNS tumors
Terminology for describing intracranial and CNS tumors is also not standardized For
example although the pituitary gland and pineal glands are not technically part of the CNS
tumors that involve these organs are often included in the term CNS tumors On the other hand
some consider the eye to be intracranial however CNS tumors generally do not include the
Page 20
APPENDIX E eyes Although the World Health Organization (WHO) has published a list of histologic
groupings at present no single comprehensive list of histologic groupings exists for intracranial
and CNS tumors Since the International Classification of Childhood Cancer (ICCC) is based on
histologic type rather than site certain benign histologies of sites other than brainCNS (eg non-
CNS ependymomas) would not be included in the BTWGs primary intracranial and CNS
histology groupings (Appendix D) Thus the variation in incidence estimates of primary
intracranial and CNS tumors may be attributable in part to the variation in the definitions of
these tumors In addition differences in cancer registry training and procedures may contribute to
nonreporting and inconsistent reporting of the tumors
The BTWG discussed the feasibility of conducting a random sampling procedure as an
alternative to complete enumeration and ongoing surveillance of nonmalignant brain tumors It
was agreed that this technique would not be valid or feasible for the following reasons
1 If a random sample of incident brain tumors were desired a complete list would be
needed first (a sampling frame is required)
2 If a survey method were used to identify brain tumors in the general population (eg
random digit dialing or other general population survey techniques) the information
needed could not be obtained for several reasons
- Either a prohibitively large numbers of individuals would have to be surveyed or
else only a very small number of brain tumors could be identified given the rarity
and sometimes short survival time
- The brain tumors identified would not be representative of all brain tumors that
occur because people who had survived their brain tumors would be more
likely to be identified
- The incidence rate would still not be known since cross-sectional surveys only
identify disease prevalence
3 If a sample of hospitals were selected to contribute data the tumors included would not
represent the entire spectrum of brain tumors because those that were diagnosed and
treated outside of the hospital setting would be excluded
Page 21
Endash
DATA COLLECTION
OF PRIMARY
CENTRAL NERVOUS
SYSTEM TUMORS
Endash
An alternative approach to sampling and the least troublesome would be to conduct
population-based surveillance only in certain geographic areas of the country If one assumes that
the etiology of brain tumors does not differ from one area of the country to another then the
scientific validity of studies based on this type of sampling would not be a problem However
given the rarity of some types of brain tumors sufficient numbers for study may not be available
unless the vast majority of the nations population were covered by population-based data
collection Also geographic areas without population-based surveillance would have no data to
use for assessing local trends or variations in brain tumor occurrence
In the absence of standard tumor registration procedures and training special case finding
efforts by central registries may be necessary to ensure that complete data are collected for
nonmalignant intracranial and CNS tumors Data from MCSS (Table 10) which has a legal
requirement for reporting nonmalignant intracranial tumors and performs 100 percent case finding
audits in all laboratories indicate that only 80 percent of nonmalignant tumors were routinely
reported In contrast routine reporting accounted for more than 95 percent of malignant
intracranial and CNS tumors Nonmalignant cases in Minnesota that were not accessioned by
hospital registries had a 50 percent chance of being routinely reported to the central registry
however these were only microscopically confirmed cases
Completeness of reporting is critical to cancer registries Accurate case counts are
necessary to assess the burden of cancer to guide cancer control program planning to prioritize
the allocation of health resources and to facilitate epidemiologic research Most central cancer
registries have state laws that mandate reporting of cases by physicians and by hospitals
laboratories and other facilities that provide screening diagnostic or therapeutic services
Complete reporting of nonmalignant intracranial and CNS tumors would be greatly
improved if reporting requirements of the COC central cancer registries SEER and the
National Program of Cancer Registries (NPCR) were changed to require the collection of
information for these tumors However this requirement would have many implications
including an increase in work load as well as associated costs for reporting facilities An estimated
14 percent of all new cancer cases diagnosed in 1998 will involve invasive brain and other
nervous system tumors7 since the numbers of benign and invasive brain and other CNS tumors
Page 22
Endash
APPENDIX E diagnosed annually are similar facilities that presently do not accession nonmalignant cases could
expect an approximately 14 percent increase in the total number of CNS cases collected by the
registry Some estimates of the percentage of brain tumors have been lower (05 percent)36 and
others have been higher (9 percent)37 therefore the extent to which the workload would be
affected may vary The data in this report suggest that if reporting of nonmalignant intracranial
and CNS tumors were required the total number of cases of tumors for these anatomic sites
would double for facilities that presently report only malignant tumors This is consistent with the
findings of Davis et al36 who reported that the incorporation of benign brain tumors into the
cancer-reporting systems of four central registries increased the overall incidence of brain cancer
by 49 percent Forty percent (913) of the hospital registries that submitted data to the NCDB did
not report nonmalignant brain tumors These registries could expect up to a 50 percent increase in
the number of intracranial and CNS tumors reported nonregistry facilities which represent
approximately 20 percent of cases reported to central cancer registries could expect a similar
increase Also central cancer registries that currently do not require reporting of nonmalignant
intracranial and CNS tumors could expect increases in their workloads as a result of the
additional time spent on processing and quality control procedures and training The lack of
standard definitions and collection and reporting guidelines would make these tasks more time-
consuming as well
For some central cancer registries that want to expand their reporting requirements to
include nonmalignant intracranial and CNS tumors a change in current legislation andor
regulations may be needed These changes could involve several months of lead time if public
hearings or other legal procedures are necessary In other states the reporting of these tumors is
not required in either their legislation or regulations in these situations hospitals have been asked
to voluntarily report the cases For example in Massachusetts the reporting of benign brain
tumors is not required by law but hospitals have been reporting these cases since 1982 However
the completeness of data reported on a voluntary basis is difficult to assess For public health
surveillance systems a mandate to report is the basic requirement of a comprehensive higher
quality system
DATA COLLECTION
OF PRIMARY
CENTRAL NERVOUS
SYSTEM TUMORS
If COC SEER NPCR and central cancer registries changed their reporting requirements
to include nonmalignant intracranial and CNS tumors the registry manuals disseminated by these
programs and registries would also need to be modified to include new definitions of reportable
diagnoses All reporting facilities would have to be notified of the new requirements To ensure
complete reporting from registries additional training of registrars should be expected Case
finding methods may need to be modified in order to identify the new cases and sources of
information Central cancer registries would also need to increase their case finding audits The
inclusion of nonmalignant tumors would also necessitate changes to other data items such as
sequence number Hospital and central cancer registries would need to consider adding WHO
brain tumor grade as an additional data item
Finally the software used by reporting facilities and by central registries would need to be
modified to accept nonmalignant morphology and behavior codes Also edits programs would
need to be modified to include these additions and to accept a nonmalignant sequence numbering
procedure
Before reporting requirements for primary intracranial and CNS tumors could be changed
feasibility studies would have to be conducted to determine whether such changes should be
recommended Two SEER special studies are under way to evaluate the impact of requiring the
collection of benign brain tumors on case finding cost quality control and training However
additional studies may be required
Page 24
Endash
APPENDIX E
RECOMMENDATIONS OF THE BRAIN TUMOR WORKING GROUP
1 We recommend the following standard definition for collecting precise data for all primary
intracranial and central nervous system tumors
Primary intracranial and central nervous (CNS) tumors are primary tumors occurring in
the following sites irrespective of histologic type or behavior brain meninges spinal
cord cauda equina cranial nerves and other parts of the CNS pituitary gland pineal
gland and craniopharyngeal duct (see Appendix B)
2 We recommend the development of a standard site and histology definition for tabulating
estimates of these tumors to allow comparability of information across registries Pathologists
the North American Association of Central Cancer Registries (NAACCR) the Commission
on Cancer (COC) the Surveillance Epidemiology and End Results (SEER) Program the
National Program of Cancer Registries (NPCR) and the International Agency for Research
on Cancer (IARC) need to be involved in developing this standard
3 We recommend collection of data for primary intracranial and extracranial CNS tumors by all
registries hospital- and central-based This effort will necessitate a change in the COC
requirements and will increase costs to the hospital-based programs Federal funding should be
allocated to supplement the additional transition and ongoing data collections costs that will be
incurred by central registries Before additional data collection is implemented we recommend
a pilot study should be conducted to assess the procedures and quality control functions
needed as well as the costs of collecting data for these tumors
4 We recommend that the appropriate government and professional organizations be involved in
carrying out the development and implementation of special training programs and curricula for
central registry hospital registry and laboratory personnel as well as the development of
computerized edit-checking procedures Training for reporting and tabulating primary
intracranial and CNS tumors should be offered on a regular basis
Page 25
Endash
DATA COLLECTION
OF PRIMARY
CENTRAL NERVOUS
SYSTEM TUMORS
Endash
REFERENCES
1 Davis F Preston-Martin S Epidemiology of brain tumors In Bigner DD McLendon RE Bruner JM eds Russell and Rubinsteins pathology of tumors of the nervous system ed 6 London Arnold Publishing 19965-45
2 World Health Organization (WHO) (1976) International classification of diseases foroncology ed 1 Geneva World Health Organization
3 World Health Organization (WHO) (1990) International classification of diseases foroncology ed 2 Geneva World Health Organization
4 Kleihues P Burger PC Scheithauer BW The new WHO classification of brain tumorsBrain Pathol 19933255-268
5 Thapar K Laws ER Tumors of the central nervous system In Murphy GP Lawrence WJr Lenhard RE Jr eds Textbook of clinical oncology ed 2 Atlanta American CancerSociety 1995378-410
6 Walker AE Robins M Weinfield FD Epidemiology of brain tumors the national survey ofintracranial neoplasms Neurol 198535219-226
7 Ries LAG Kosary CL Hankey BF Miller BA Edwards BK (eds) SEER Cancer StatisticsReview 1973-1995 National Cancer Institute Bethesda MD 1998
8 Cancer Facts amp Figures - 1998 American Cancer Society Atlanta Georgia 19989 Davis FG Bruner JM Surawicz TS The rationale for standardized registration and reporting
of brain and central nervous system tumors in population-based cancer registriesNeuroepidemiol 199716308-316
10CBTRUS (1996) First annual report 1995 Central Brain Tumor Registry of the UnitedStates Chicago Illinois
11 Preston-Martin S Epidemiology of primary CNS neoplasms Neurol Clinics 199614273-290
12 Greig NH Ries LG Yancik R Rapoport SI Increasing annual incidence of primary malignantbrain tumors in the elderly J Natl Cancer Inst 1991 831621-1624
13 Mao Y Desmeules M Semenciw RM Hill G Gaudette L Wigle DT Increasing brain cancerrates in Canada Can Med Assoc J 19911451583-1591
14 Frelick R Huang P Topham A Brain and central nervous system tumors Delaware 1980 to1989 Del Med J 199264571-573
15 Davis DL Ahlbom A Hoel D Percy C Is brain cancer mortality increasing in industrialcountries Am J Ind Med 199119421-431
16 Helseth A Increasing incidence of primary central nervous system tumors in the elderly Realincrease or improved detection J Natl Cancer Inst 1993851871-1872
17 Modan B Wagener D Feldman JJ Rosenberg HM Feinleib M Increased mortality frombrain tumors A combined outcome of diagnostic technology and change of attitude towardthe elderly Am J Epidemiol 19921351349-1357
18 Polednak AP Time trends in the incidence of brain and central nervous system cancers inConnecticut J Natl Cancer Inst 1991831679-1681
19 Boyle P Maissonneuve P Saracci R Muir CS Is the increase in incidence of primarymalignant brain tumors real J Natl Cancer Inst 1990201594-1596
Page 26
APPENDIX E 20 Preston-Martin S Descriptive epidemiology of primary tumors of the brain cranial nerves
and spinal meninges in Los Angeles County Neuroepidemiol 19898283-29521 Helseth A Mork SJ Neoplasms of the central nervous system in Norway Epidemiological
characteristics of intracranial gliomas according to histology APMIS 97 1989547-55522 Gurney JG Davis S Severson RK Fang J-Y Ross JA Robison LL Trends in cancer
incidence among children in the United States Cancer 199678532-54123 Gurney JG Ross JA Wall DA Bleyer WA Severson RK Robison LL Infant cancer in the
US histology-specific incidence trends 1973-1992 J Pediatr Hem Onc 199719428-43224 Nishio S Takeshita I Morioka T Fukui M Primary intracranial squamous cell carcinomas
report of two cases Neurosurgery 199537329-33225 Freilich RJ Thompson SJ Walker RW Rosenblum MK Adenocarcinomatous transformation
of intracranial germ cell tumors Am J Surg Pathol 199519537-54426Yuan S Miller DW Barnett GH Hahn JF Williams BR Identification and characterization of
human beta 2-chimaerin association with malignant transformation in astrocytoma CancerResearch 1995 553456-3461
27 Preston-Martin S Mack WJ Neoplasms of the nervous system In Schoenfeld D Fraumeni JFJr eds Cancer epidemiology and prevention ed 2 New York Oxford University Press19961231-1281
28 Riggs JE Rising primary malignant brain tumor mortality in the elderly A manifestation ofdifferential survival Arch of Neurol 199552571-575
29 Davis FG Freels S Grutsch J Barlas S Brem S Survival rates in patients with primarymalignant brain tumors stratified by patient age and tumor histological type an analysisbased on Surveillance Epidemiology and End Results (SEER) data 1973-1991J Neurosurg 1998881-10
30 Surawicz TS Davis F Freels S Laws ER Menck HR Brain tumor survival results from theNational Cancer Data Base (Accepted for publication in J Neuro-Oncol)
31 Bondy ML Lustbader ED Buffler PA Schull WJ Hardy RJ Strong LC Geneticepidemiology of childhood brain tumors Genet Epidemiol 19918253-267
32 Preston-Martin S Monroe K Lee P Bernstein L Kelsey J Henderson S Forrester DHenderson B Spinal meningiomas in women in Los Angeles County Investigation of anetiologic hypothesis Cancer Epidemiol Biomarkers Prev 19954333-339
33 Davis JR Brownson RC Garcia R Bentz BJ Turner A Family pesticide use and childhoodbrain cancer Arch Environ Contam Toxicol 19932487-92
34 Commission on Cancer General principles and coding In Standards of the Commission on Cancer vol II Registry Operations and Data Standards American College of SurgeonsChicago Illinois 1996
35 Central Brain Tumor Registry of the United States (CBTRUS) 1997 State Survey of BenignBrain Tumor Collection Chicago Illinois 1997
36 Davis FG Malinski N Haenszel W Chang J Flannery J Gershman S Dibble R Bigner DDPrimary brain tumor incidence rates in the four United States regions 1985-1989 A pilotstudy Neuroepidemiol 199615103-112
37 Schoenberg BS Christine BW Whisnant JP The descriptive epidemiology of primaryintracranial neoplasms the Connecticut experience Am J Epidemiol 1976104499-510
Page 27
Endash
DATA COLLECTION
OF PRIMARY
CENTRAL NERVOUS
SYSTEM TUMORS
TAB
LE 1
C
OM
PAR
ISO
N O
F R
EGIS
TRIE
S SU
PPLY
ING
DA
TA O
N P
RIM
AR
Y I
NTR
AC
RA
NIA
L A
ND
CEN
TRA
L N
ERV
OU
S SY
STEM
TU
MO
RS
IN T
HE
UN
ITED
STA
TES
Cen
tral B
rain
Tum
or R
egis
try o
fth
e U
nite
d St
ates
(CBT
RUS)
Min
neso
ta C
ance
rSu
rvei
llanc
e Sy
stem
(MC
SS)
ACo
SN
a tio
nal C
ance
r Dat
a B
ase
(NCD
B)
Surv
eilla
nce
Epid
emio
logy
and
End
Res
ults
Pro
gram
(SEE
R)
Purp
ose
ldquoCB
TRU
S ce
ntra
lizes
pop
ulat
ion-
base
d in
cide
nce
data
on
all b
rain
tum
ors a
nd u
ses o
ther
exi
stin
gda
ta re
sour
ces t
o ch
arac
teriz
e th
ein
cide
nce
mor
talit
y a
nd su
rviv
alof
pat
ient
s with
bra
in tu
mor
s rdquo
The
MC
SS c
olle
cts i
nfor
mat
ion
onal
l can
cers
dia
gnos
ed si
nce
1988
amon
g M
inne
sota
resi
dent
s Th
e M
CSS
is p
opul
atio
n-ba
sed
path
olog
y-ba
sed
and
is a
n ac
tive
syste
m
ldquoThe
goa
l of t
he N
CD
B is
to p
rese
nt a
n an
nual
sum
mar
y of
pat
ient
car
e fo
r cas
es o
f can
cer
diag
nose
d an
d tre
ated
at h
ospi
tals
thro
ugho
utth
e co
untry
rdquo
ldquoA c
ontin
uing
pro
ject
of th
e N
CI
the
SEER
prog
ram
col
lect
sca
ncer
dat
a on
aro
utin
e ba
sis f
rom
desi
gnat
ed p
opul
atio
n-ba
sed
canc
er re
gist
ries
in v
ario
us a
reas
of t
heco
untry
Targ
et p
opul
atio
n Th
e po
pula
tions
cov
ered
by
regi
strie
s in
Ari
zona
Col
orad
oC
onne
ctic
ut D
elaw
are
Idah
oM
aine
Mas
sach
uset
ts
Min
neso
ta M
issou
ri M
onta
na
Nor
th C
arol
ina
and
Uta
h
The
CB
TRU
S po
pula
tion
repr
esen
ts a
non
rand
om 1
5pe
rcen
t sam
ple
of th
e U
S
popu
latio
n
The
popu
latio
n of
Min
neso
ta
The
popu
latio
ns tr
eate
d at
par
ticip
atin
gho
spita
ls in
the
50 st
ates
the
Dist
rict
of
Col
umbi
a a
nd P
uert
o R
ico
NC
DB
is n
ot a
pop
ulat
ion-
base
d re
gist
ry
At
pres
ent
it is
est
imat
ed to
cov
er a
ppro
xim
atel
y57
per
cent
of t
otal
cas
es n
atio
nwid
e
The
popu
latio
nsco
vere
d by
the
state
regi
strie
s in
Con
nect
icut
Haw
aii
Iow
a N
ew M
exic
o
and
Uta
h a
s wel
l as
the
regi
onal
regi
strie
sin
Atla
nta
Geo
rgia
D
etro
it M
ichi
gan
San
Fran
cisc
o-O
akla
nd C
alifo
rnia
an
d Se
attle
-Pug
etSo
und
Was
hing
ton
The
SEER
pop
ulat
ion
repr
esen
ts a
nonr
ando
m 1
4 pe
rcen
tsa
mpl
e of
the
US
po
pula
tion
Page
28
Endash
APPENDIX E
Cen
tral B
rain
Tum
or R
egis
try o
fth
e U
nite
d St
ates
(CBT
RUS)
Min
neso
ta C
ance
rSu
rvei
llanc
e Sy
stem
(MC
SS)
ACo
SN
a tio
nal C
ance
r Dat
a B
ase
(NCD
B)
Surv
eilla
nce
Epid
emio
logy
and
End
Res
ults
Pro
gram
(SEE
R)
Type
of
prim
ary
intra
cran
ial
and
cent
ral n
ervo
us sy
stem
tum
ors r
epor
ted
Dat
a on
new
ly-d
iagn
osed
cas
es o
fbe
nign
and
mal
igna
nt p
rimar
ybr
ain
tum
ors b
ased
on
ICD
-Oco
des
Dat
a on
new
ly-d
iagn
osed
m
i cro
scop
ical
ly-c
onfir
med
tum
ors
of th
e ce
ntra
l ner
vous
syste
m
incl
udin
g pi
tuita
ry a
nd p
inea
lgl
ands
Hos
pita
ls v
olun
taril
y su
bmit
full
anal
ytic
canc
er re
gist
ry c
asel
oads
with
dat
a ite
ms a
ndco
des d
efin
ed b
y th
e C
omm
issio
n on
Can
cer
(CO
C) f
or h
ospi
tal c
ance
r reg
istri
es
Mos
tpa
rtici
patin
g ho
spita
ls h
ave
prog
ram
sap
prov
ed b
y C
OC
or a
re e
stab
lishi
ng p
rogr
amap
prov
al
NC
DB
cal
ls fo
r dat
a do
not
lim
itca
ses b
y m
alig
nant
beh
avio
r bu
t acc
essi
onin
gof
non
-mal
igna
nt c
ases
is n
ot re
quire
d fo
rpr
ogra
m a
ppro
val
Fifty
-nin
e pe
rcen
t of t
heho
spita
ls th
at su
bmitt
ed a
ny in
tracr
ania
lCN
Sca
ses d
iagn
osed
dur
ing
1989
-199
4 su
bmitt
edat
leas
t one
non
mal
igna
nt c
ase
The
NC
DB
data
in th
is re
port
are
limite
d to
the
case
ssu
bmitt
ed b
y th
ese
hosp
itals
(82
perc
ent o
f all
intra
cran
ial a
nd e
xtra
cran
ial c
entra
l ner
vous
syste
m c
ases
on
file)
Tren
ds in
the
inci
denc
e m
orta
lity
and
patie
nt su
rviv
al o
fbr
ain
tum
ors i
n th
eU
S H
owev
er S
EER
does
not
col
lect
info
rmat
ion
on b
enig
nan
d un
certa
in b
rain
tum
ors
Oth
er c
omm
ents
D
uplic
ate
canc
er re
gist
ratio
ns c
anno
t be
iden
tifie
d by
the
parti
cipa
ting
regi
strie
s
The
MC
SS p
erfo
rms 1
00 p
erce
ntca
se fi
ndin
g au
dits
in a
ll pa
thol
ogy
labo
rato
ries o
n an
ann
ual b
asis
Th
eref
ore
the
data
from
the
MC
SSm
ight
be
cons
ider
ed a
ldquobe
st-ca
sesc
enar
iordquo
in te
rms o
f com
plet
enes
sof
repo
rting
for m
icro
scop
ical
ly-
conf
irmed
tum
ors
Rep
ort d
uplic
atio
n fo
r 198
9-19
94 in
tracr
ania
lan
d ex
tracr
ania
l cen
tral n
ervo
us sy
stem
repo
rts w
as 6
7 p
erce
nt
How
ever
the
NC
DB
data
in T
able
s 2 th
roug
h 9
are
base
d on
undu
plic
ated
repo
rts
Page
29
Endash
DATA COLLECTION
OF PRIMARY
CENTRAL NERVOUS
SYSTEM TUMORS
TABLE 2 NUMBER AND PERCENT OF PRIMARY INTRACRANIAL AND CENTRAL NERVOUS SYSTEM TUMORS BY TUMOR LOCATION
Locationa CBTRUSb
Number () MCSSc
Number () NCDBd
Number () SEERe
Number ()
Intracranial 13084 (947) 3600 (936) 66322 (955) 10196 (969)
Brain 7999 (579) 1924 (500) 48527 (699) 9721 (924)
Meninges 2719 (197) 838 (218) 9365 (135) 139 (13)
Pituitarycraniopharygealduct
1491 (108) 530 (138) 4958 (71) 30 (03)
Pineal 74 (05) 21 (05) 477 (07) 80 (08)
Other central nervous systemincluding cranial nerves
801 (58) 287 (75) 2995 (43) 226 (22)
Extracranial 730 (53) 245 (64) 3137 (45) 322 (31)
Spinal cord 497 (36) 47 (38) 2395 (34) 313 (30)
Spinal meninges 233 (17) 98 (25) 742 (11) 9 (01)
TOTAL 13814 (100) 3845 (100) 69459 (100) 10518 (100)
Note Reported data are incident cases from 1989-1994 except for CBTRUS data which are from 1990-1993
aRefer to the sites in Appendix BbCentral Brain Tumor Registry of the United States cMinnesota Cancer Surveillance System (microscopically confirmed cases only)dNational Cancer Data Base (limited to cases reported by hospitals that accessioned nonmalignant cases) eSurvival Epidemiology and End results Program (malignant cases only)
Page 30
Endash0
TABL
E 3
RO
W P
ERCE
NT
DIS
TRIB
UTI
ON
OF
PRIM
ARY
INTR
ACR
AN
IAL
AN
D C
ENTR
AL
NER
VO
US
SYST
EM T
UM
ORS
BY
TU
MO
R B
EHA
VIO
RA
ND
MIC
ROSC
OPI
C C
ON
FIRM
ATI
ON
Loca
tiona
CB
TRU
Sb M
CSSc
NC
DB
d SE
ERe
Tota
l Pe
rcen
tM
icro
Co
nfirm
ed
Perc
ent
Not
Mic
ro
Conf
irmed
Tota
l Pe
rcen
tM
icro
Co
nfirm
ed
Perc
ent
Not
Mic
ro
Conf
irmed
Tota
l Pe
rcen
tM
icro
Co
nfirm
ed
Perc
ent
Not
Mic
ro
Conf
irmed
Tota
l Pe
rcen
tM
icro
Co
nfirm
ed
Perc
ent
Not
Mic
ro
Conf
irmed
Intra
cran
ial
130
84
867
13
3
360
0 10
0 N
A
663
22
887
11
3
101
96
871
12
9
Mal
igna
nt
717
1 89
2
108
1
824
100
NA
44
801
91
3
87
101
96
871
12
9
Beni
gn a
ndu n
certa
in
591
3 83
5
165
1
776
100
NA
21
521
83
2
168
N
A
NA
N
A
Bra
in
799
9 88
2
118
1
924
100
NA
48
527
90
2
98
972
1 87
3
127
Mal
igna
nt
686
2 89
6
104
1
746
100
NA
42
622
91
5
85
972
1 87
3
127
Beni
gnan
dun
certa
in
113
7 80
6
194
17
8 10
0 N
A
590
5 80
6
194
N
A
NA
N
A
Extra
cran
ial
730
962
3
8 24
5 10
0 N
A
313
7 96
0
40
322
957
4
3
Mal
igna
nt
242
934
6
6 60
10
0 N
A
148
3 96
6
34
322
957
4
3
Beni
gn a
ndu n
certa
in
488
975
2
5 18
5 10
0 N
A
165
4 95
5
45
NA
N
A
NA
TOTA
Lf 13
814
87
2
128
3
845
100
NA
69
459
89
0
110
10
518
87
4
126
Mal
igna
nt
741
3 89
4
106
1
884
100
NA
46
284
91
5
85
105
18
874
12
6
Beni
gn a
ndu n
certa
in
640
1 84
6
154
1
961
100
NA
23
175
84
1
159
N
A
NA
N
A
Not
e R
epor
ted
data
are
inci
dent
cas
es fr
om 1
989-
1994
exc
ept f
or C
BTR
US
data
whi
ch a
re fr
om 1
990-
1993
a Refe
r to
the
site
code
s in
App
endi
x B
b Cent
ral B
rain
Tum
or R
egist
ry o
f the
Uni
ted
Stat
es
c Min
neso
ta C
ance
r Sur
veill
ance
Sys
tem
(mic
rosc
opic
ally
con
firm
ed c
ases
onl
y)
d Nat
iona
l Can
cer D
ata
Base
(lim
ited
to c
ases
repo
rted
by h
ospi
tals
that
acc
essio
ned
nonm
alig
nant
cas
es)
e Surv
eilla
nce
Epi
dem
iolo
gy a
nd E
nd R
esul
ts Pr
ogra
m (m
alig
nant
cas
es o
nly)
f In
clud
es in
tracr
ania
l and
ext
racr
ania
l cas
es
NA
= N
ot a
pplic
able
Page
31
APPENDIX E
Endash
DATA COLLECTION
OF PRIMARY
CENTRAL NERVOUS
SYSTEM TUMORS
TABLE 4 NUMBER AND PERCENT OF PRIMARY INTRACRANIAL AND CENTRAL NERVOUS SYSTEM TUMORS BY DIAGNOSTIC CONFIRMATION
DiagnosticConfirmation
CBTRUSa
Number () MCSSb
Number () NCDBc
Number () SEERd
Number ()
Positive microscopy
12087 (875) 3845 (100) 61818 (890) 9188 (874)
Radiographywithout microscopy
1306 (95) NA 6759 (97) 1015 (97)
Clinical 204 (15) NA 484 (07) 98 (09)
Unknown 217 (15) NA 398 (06) 217 (21)
TOTAL 13814 (100) 3845 (100) 69459 (100) 10518 (100)
Note Reported data are incident cases from 1989-1994 except for CBTRUS data which are from 1990-1993
aCentral Brain Tumor Registry of the United Statesb Minnesota Cancer Surveillance System (microscopically confirmed cases only) cNational Cancer Data Base (limited to cases reported by hospitals that accessioned nonmalignant cases)dSurveillance Epidemiology and End Results Program (malignant cases only)NA = Not applicable
Page 32
Endash
Page 32
TABLE 4 NUMBER AND PERCENT OF PRIMARY INTRACRANIAL AND CENTRALNERVOUS SYSTEM TUMORS BY DIAGNOSTIC CONFIRMATION
DiagnosticConfirmation
CBTRUSa
Number ()MCSSb
Number ()NCDBc
Number ()SEERd
Number ()
Positivemicroscopy
12087 (875) 3845 (100) 61818 (890) 9188 (874)
Radiographywithout microscopy
1306 (95) NA 6759 (97) 1015 (97)
Clinical 204 (15) NA 484 (07) 98 (09)
Unknown 217 (15) NA 398 (06) 217 (21)
TOTAL 13814 (100) 3845 (100) 69459 (100) 10518 (100)
Note Reported data are incident cases from 1989-1994 except for CBTRUS data which are from 1990-1993
aCentral Brain Tumor Registry of the United Statesb Minnesota Cancer Surveillance System (microscopically confirmed cases only)cNational Cancer Data Base (limited to cases reported by hospitals that accessioned nonmalignant cases)dSurveillance Epidemiology and End Results Program (malignant cases only)NA = Not applicable
APPENDIX E
TABLE 5 NUMBER AND PERCENT OF MALIGNANT PRIMARY INTRACRANIAL AND CENTRAL SYSTEM TUMORS BY TUMOR LOCATION
Locationa CBTRUSb
Number () MCSSc
Number () NCDBd
Number () SEERe
Number ()
Intracranial 7171 (977) 1824 (968) 44801 (968) 10196 (969)
Brain 6862 (926) 1746 (927) 42622 (921) 9721 (924)
Meninges 98 (13) 23 (12) 581 (13) 139 (13)
Pituitarycraniopharyngealduct
37 (05) 13 (07) 189 (04) 30 (03)
Pineal 58 (08) 20 (11) 378 (08) 80 (08)
Other central nervous systemincluding cranial nerves
116 (16) 22 (12) 1031 (22) 226 (21)
Extracranial 242 (33) 60 (32) 1483 (32) 322 (31)
Spinal cord 234 (32) 60 (32) 1410 (30) 313 (30)
Spinal meninges 8 (01) 0 73 (02) 9 (01)
TOTAL 7413 (100) 1884 (100) 46284 (100) 10518 (100)
Note Reported data are incident cases from 1989-1994 except for CBTRUS data which are from 1990-1993
aRefer to the site codes in Appendix BbCentral Brain Tumor Registry of the United States cMinnesota Cancer Surveillance System (microscopically confirmed cases only)dNational Cancer Data Base (limited to cases reported by hospitals that accessioned nonmalignant cases) eSurvival Epidemiology and End Results Program (malignant cases only)
Page 33
Endash
DATA COLLECTION
OF PRIMARY
CENTRAL NERVOUS
SYSTEM TUMORS
TABLE 6 NUMBER AND PERCENT OF PRIMARY INTRACRANIAL AND CENTRAL NERVOUS SYSTEM TUMORS OF BENIGN AND UNCERTAIN BEHAVIOR BY TUMOR LOCATION
Locationa CBTRUSb
Number () MCSSc
Number () NCDBd
Number () SEERe
Number ()
Intracranial 5913 (924) 1776 (906) 21521 (929) NA
Brain 1137 (178) 178 (91) 5905 (255) NA
Meninges 2621 (409) 815 (416) 8784 (379) NA
Pituitarycraniopharyngealduct
1454 (227) 517 (264) 4769 (206) NA
Pineal 16 (02) 1 (lt01) 99 (04) NA
Other central nervous systemincluding cranial nerves
685 (107) 265 (135) 1964 (85) NA
Extracranial 488 (76) 185 (94) 1654 (71) NA
Spinal cord 263 (41) 87 (44) 985 (42) NA
Spinal meninges 225 (35) 98 (50) 669 (29) NA
TOTAL 6401 (100) 1961 (100) 23175 (100) NA
Note Reported data are incident cases from 1989-1994 except for CBTRUS data which are from 1990-1993
aRefer to the site codes in Appendix BbCentral Brain Tumor Registry of the United States cMinnesota Cancer Surveillance System (microscopically confirmed cases only)dNational Cancer Data Base (limited to cases reported by hospitals that accessioned nonmalignant cases) eSurveillance Epidemiology and End Results Program (malignant cases only)NA = Not applicable
Page 34
Endash
APPENDIX E TABLE 7 NUMBER AND PERCENT OF PRIMARY INTRACRANIAL AND CENTRAL
NERVOUS SYSTEM TUMORS BY TUMOR BEHAVIOR AND LOCATION
BehaviorTumor Locationa
CBTRUSb
Number () MCSSc
Number () NCDBd
Number () SEERe
Number ()
Malignant 7413 (537) 1884 (490) 46284 (666) 10518 (100)
Brain 6862 (497) 1746 (454) 42622 (614) 9721 (924)
Meninges 98 (07) 23 (06) 581 (08) 139 (13)
Pituitarycraniopharyn-geal ductpineal
95 (07) 33 (09) 567 (08) 110 (11)
Other central nervous system includingcranial nerves
116 (08) 22 (06) 1031 (15) 226 (22)
Spinal cord 242 (18) 60 (16) 1483 (21) 322 (31)
Benign 5794 (419) 1787 (465) 20694 (298) NA
Brain 803 (58) 99 (26) 4491 (65) NA
Meninges 2565 (186) 807 (210) 8613 (124) NA
Pituitarycraniopharyn-geal ductpineal
1322 (96) 458 (119) 4330 (62) NA
Other central nervous system includingcranial nerves
678 (49) 263 (68) 1911 (28) NA
Spinal cord 426 (31) 160 (42) 1349 (19) NA
Uncertain 607 (44) 174 (45) 2481 (36) NA
Brain 334 (24) 79 (21) 1414 (20) NA
Meninges 56 (04) 8 (02) 171 (02) NA
Pituitarycraniopharyn-geal ductpineal
148 (11) 60 (16) 538 (08) NA
Other central nervous system includingcranial nerves
7 (01) 2 (01) 53 (01) NA
Spinal cord 62 (05) 25 (07) 305 (04) NA
TOTAL 13814 (100) 3845 (100) 69459 (100) 10518 (100)
Note Reported data are incident cases from 1989-1994 except for CBTRUS data which are from 1990-1993 NA=Not applicableaRefer to the site codes in Appendix B bCentral Brain Tumor Registry of the United States cMinnesota Cancer Surveillance System (microscopically confirmed cases only)dNational Cancer Data Base (limited to cases reported byhospitals that accessioned nonmalignant cases eSurvival Epidemiology and End Results Program (malignant cases only)
Page 35
Endash
DATA COLLECTION
OF PRIMARY
CENTRAL NERVOUS
SYSTEM TUMORS
TABLE 8 NUMBER AND PERCENT OF MALIGNANT PRIMARY INTRACRANIAL AND
CENTRAL NERVOUS SYSTEM TUMORS BY HISTOLOGY GROUPINGS
WHO Histologya
Groupings CBTRUSb
Number () MCSSc
Number () NCDBd
Number () SEERe
Number ()
Neuroepithelial 6477 (874) 1689 (896) 39701 (858) 8676 (825)
Tumors of cranial and spinal nerves
12 (02) 3 (02) 108 (02) 25 (02)
Tumors of meninges
137 (18) 25 (13) 994 (21) 194 (18)
LymphomasHemopoietic
473 (64) 121 (64) 3492 (75) 1099 (105)
Germ cell 70 (09) 20 (11) 403 (09) 97 (09)
Cysts and tumor-like lesions
0 0 0 0
Tumors of sellar region
20 (03) 11 (06) 100 (02) 6 (01)
Local extensions 29 (04) 11 (06) 166 (04) 38 (04)
Unclassifiedunassigned tumorsf
195 (26) 4 (02) 1320 (29) 383 (36)
TOTAL 7413 (100) 1884 (100) 46284 (100) 10518 (100)
Note Reported data are incident cases from 1989-1994 except for CBTRUS data which are from 1990-1993
aRefer to the World Health Organization (WHO) histology groupings in Appendix CbCentral Brain Tumor Registry of the United States cMinnesota Cancer Surveillance System (microscopically confirmed cases only)dNational Cancer Data Base (limited to cases reported by hospitals that accessioned nonmalignant cases) f For MCSS unclassifiedunassigned tumors include one malignant and four nonmalignant histologies which were
not listed in the CBTRUS classification scheme For NCDB unclassifiedunassigned tumors include 319 cases(less than one half percent) which had histologies not assigned by CBTRUS to any other category For SEERunclassifiedunassigned tumors include all malignant histologies occurring in the brainCNS which could not beclassified in one of the above categories based on their 4-digit histologic type
Page 36
Endash
APPENDIX E
TABLE 9 NUMBER AND PERCENT OF PRIMARY INTRACRANIAL AND CENTRAL NERVOUS SYSTEM TUMORS OF BENIGN AND UNCERTAIN BEHAVIOR
BY HISTOLOGY GROUPINGS
WHO Histologya
Groupings CBTRUSb
Number () MCSSc
Number () NCDBd
Number () SEERe
Number ()
Neuroepithelial 275 (43) 91 (46) 1064 (46) NA
Tumors of cranial and spinal nerves
980 (153) 397 (202) 2618 (113) NA
Tumors of meninges
3509 (548) 941 (480) 13667 (590) NA
LymphomasHemopoietic
3 (lt01) 0 7 (lt01) NA
Germ cell 4 (lt01) 1 (01) 25 (01) NA
Cysts and tumor-like lesions
15 (02) 3 (02) 34 (01) NA
Tumors of sellar region
1444 (226) 510 (260) 4749 (205) NA
Local extensions 0 0 0 NA
Unclassifiedunassigned tumorsf
171 (27) 18 (09) 1011 (44) NA
TOTAL 6401 (100) 1961 (100) 23175 (100) NA
Note Reported data are incident cases from 1989-1994 except for CBTRUS which is 1990-1993
aRefer to the World Health Organization (WHO) histology groupings in Appendix CbCentral Brain Tumor Registry of the United States c Minnesota Cancer Surveillance System (microscopically confirmed cases only) dNational Cancer Data Base (limited to cases reported by hospitals that accessioned nonmalignant cases) eSurvival Epidemiology and End Results Program (malignant cases only)dFor MCSS unclassifiedunassigned tumors include one malignant and four nonmalignant histologies which werenot listed in the CBTRUS classification scheme For NCDB unclassifiedunassigned tumors include 319 cases(less than one half percent) which had histologies not assigned by CBTRUS to any other category For SEERunclassifiedunassigned tumors include all malignant histologies occurring in the brainCNS which could not beclassified in one of the above categories based on their 4-digit histologic typeNA = Not applicable
Page 37
Endash
DATA COLLECTION
OF PRIMARY
CENTRAL NERVOUS
SYSTEM TUMORS
TABLE 10 METHOD OF CASE FINDING FOR PRIMARY INTRACRANIAL AND CENTRAL NERVOUS SYSTEM TUMORS BY TUMOR BEHAVIOR AND LOCATION MINNESOTA 1989-1994
Behavior Tumor Locationa
Number of Cases
Percent Found byRoutine
Reporting
Percent Found by Special Efforts
Malignant Brain Cerebral meninges
Pituitarycranio duct pineal Other intracranial
18841746 23 33
22
961 965 957 939
864
39 35 43 61
136 Extracranial 60 883 117 Benign Brain
1787 99
788 838
212 162
Cerebral meninges Pituitarycranio duct
pineal Other intracranial
807 458
263
843 740
779
157 260
221 Extracranial 160 631 369 Uncertain 174 856 144 Brain 79 823 177 Cerebral meninges Pituitarycraniopharyn- geal ductpineal Other intracranial
8 60
2
875 850
1000
125 150
00 Extracranial 25 960 40
TOTAL 3845 876 124
aRefer to the site codes in Appendix B
Page 38
Endash
1989 1990 1991 1992 1993 1994
TOTAL
APPENDIX E TABLE 11 METHOD OF CASE FINDING FOR INTRACRANIALa TUMORS BY DIAGNOSIS YEAR MINNESOTA 1989-1994
DiagnosisYear
Number of
Cases
Percent Found byRoutine
Reporting
Percent Found by
Special Efforts
571 837 163 616 865 135 586 913 87 602 899 101
633 872 128 592 929 71
3600 886 114
aIncludes the brain cerebral meninges pituitary gland pineal gland and otherintracranial tumors (refer to the site codes in Appendix B)
Page 39
Endash
DATA COLLECTION
OF PRIMARY
CENTRAL NERVOUS
SYSTEM TUMORS
TABLE 12 METHOD OF CASE FINDING FOR NONMALIGNANT INTRACRANIALa TUMORS BY TYPE OF FACILITY MINNESOTA 1989-1994
Type of Facility Number of Tumors Percent Found byRoutine
Reporting
Percent Found by Special Efforts
Registry at facility No registry at facility
1451325
859 569
141 431
TOTAL 1776 806 194
aIncludes tumors with benign or uncertain behavior that involve the brain cerebral meningespituitary gland pineal gland or other intracranial sites (refer to the site codes in Appendix B)
TABLE 13 REPORTING METHOD AND SOURCE OF CASE FINDING FOR NON- MALIGNANT INTRACRANIALa TUMORS DIAGNOSED IN HOSPITALS WITH A TUMOR REGISTRY MINNESOTA 1989-1994
Reporting Method Number of Tumors Percent Found byRoutine
Reporting
Percent Found by
Special Efforts
Registry-reportedLaboratory-reported
1226225
925 502
75 498
TOTAL 1451 859 141
aIncludes tumors with benign or uncertain behavior that involve the brain cerebral meningespituitary gland pineal gland or other intracranial sites (refer to the site codes in Appendix B)
Page 40
Endash0
APPENDIX E TABLE 14 HOSPITAL REGISTRY ACCESSIONING OF MALIGNANT AND NON-
MALIGNANT PRIMARY INTRACRANIAL AND CENTRAL NERVOUS SYSTEM TUMORS NCDB 1989-1994
TUMOR Totalb
BEHAVIOR Malignant c Nonmalignantd
Tumor Locationa HospitalsReporting
Number ()
Hospitals Reporting
Number ()
Hospitals Reporting
Number ()
Intracranial 1542 (100) 1526 (100) 900 (99)
Brain 1527 (99) 1519 (gt99) 754 (83)
Meninges 740 (48) 390 (26) 613 (67)
Pituitaryglandcraniopharyn-
geal duct
602 (39) 168 (11) 538 (59)
Pineal gland 319 (21) 277 (18) 79 (9)
Other central nervous system including cranial
nerves
648 (42) 545 (36) 299 (33)
Extracranial 812 (53) 708 (46) 410 (45)
Spinal cord 760 (49) 692 (45) 311 (34)
Spinal meninges 299 (19) 72 (5) 258 (28)
TOTAL Hospitals 1542 (100) 1526 (100) 913 (100)
Note The number of hospitals in each of the second third and fourth columns is the number that submittedreports to the NCDB for any intracranial and central nervous system tumors for the respective malignancystatus Not all hospitals submitted reports for each year during the study period (1989-1994)
aRefer to the site codes in Appendix B bBehavior codes = 0 1 3 cBehavior code = 3 dBehavior codes = 0 1
Page 41
Endash
DATA COLLECTION
OF PRIMARY
CENTRAL NERVOUS
SYSTEM TUMORS
Texas Cancer Registry
1997 CBTRUS State Survey of Benign Brain Tumor Data Collection
State Collection Status
Currently Collecting Benign Tumor Data1 Arizona Cancer Registry since 1981 2 Colorado Central Cancer Registry since 1988 3 Connecticut Tumor Registry since 1965 4 Idaho Cancer Data Registry since 1970 5 Maine Cancer Registry since 1983 6 Massachusetts Cancer Registry since 1982 7 Minnesota Cancer Surveillance System since 1988 8 Montana Central Tumor Registry since 1979 9 New York State Cancer Registry since 1988
10 North Carolina Central Cancer Registry since 1990 11 Utah Cancer Registry since 1966 12 Virginia Cancer Registry since 1994 13 Delaware State Cancer Registry14 Washington State Cancer Registry since 1992 15 passive collection 1979-1994
active collection since 1995
Stopped or Passive Collection of Benign Tumor Data1 New Jersey State Cancer Registry stopped 1979-1995 2 Kansas Cancer Registry stopped 1969-1995 3 New Hampshire State Cancer Registry stopped 1986-1991 4 District of Columbia Cancer Registry stopped 1997 5 Wyoming Cancer Surveillance Program stopped 111996 6 Louisiana Tumor Registry stopped 1992 (passive collection) 7 Illinois State Cancer Registry stopped 111996 8 Missouri Cancer Registry passive collection since 1984 9 South Carolina Central Cancer Registry passive collection since 1996
Beginning Collection of Benign Tumor Data1 North Dakota Cancer Registry began collection 1997 2 Rhode Island Cancer Registry began collection 1998
Page 42
Endash
APPENDIX E
Codes for Primary Intracranial and Central Nervous System Tumors
Note For this report the designation of ldquoprimary intracranial and central nervous system tumorsrdquo includes thefollowing primary tumors of central nervous system sites as well as tumors of the pituitary and pinealglands All histology types within the topography codes are included in the designation of ldquoprimaryintracranial and CNS tumors The source for the topography codes is Percy C Van Holten V Muir Ceds International Classification of Diseases for Oncology Second Edition Geneva World Health Organization 1990
Intracranial tumors
Brain C710 Cerebrum C711 Frontal lobe C712 Temporal lobe C713 Parietal lobe C714 Occipital lobe C715 Ventricle NOSC716 Cerebellum NOS C717 Brain stem C718 Overlapping lesion of brain C719 Brain NOS
Meninges C700 Cerebral meninges C709 Meninges NOS
a
Cranial Nerves and other intracranial parts of the central nervous systemC722 Olfactory nerve C723 Optic nerve C724 Acoustic nerve C725 Cranial nerve NOS C728 Overlapping lesion of brain and central nervous system C729 Nervous system NOS
Other endrocrine glands and related structures C751 Pituitary gland C752 Craniopharyngeal duct C753 Pineal gland
Extracranial tumors
Spinal cord C720 Spinal cord C721 Cauda equina
Meninges C701 Spinal meninges
aNOS=Not Otherwise Specified
Page 43
Endash
DATA COLLECTION
OF PRIMARY
CENTRAL NERVOUS
SYSTEM TUMORS
Brain Tumor Histology Groupings
The following histology groupings were used for the primary intracranial and central nervoussystem tumors The source for the histology groupings is Central Brain Tumor Registry ofthe United States (CBTRUS) 1996 Statistics Report Table 4
WHOa HISTOLOGY GROUPINGS ICD-Ob MORPHOLOGY CODE
Diffuse astrocytoma (protoplasma fibrillary) 9410 9420 Anaplastic astrocytoma 9401 9411 Glioblastoma 9440 9441 9442 Pilocytic astrocytoma 9421 Unique astrocytoma variants 9383 9384 9424 Oligodendroglioma 9450 Anaplastic oligodendroglioma 9451 9460 Ependymomaanaplastic ependymoma 9391 9392 9393 Ependymoma variants 9394 Mixed glioma 9382 Astrocytoma NOSc 9400 Glioma malignant NOS 9380 Choroid plexus 9390 Neuroepithelial 9381 9423 9430 Benign neuronalglial neuronal and mixed 86801 8693 9490 9505 9506 Malignant neruonalglial neuronal and mixed 86803 9364 9490 9500 Pineal parenchymal 9360 9361 9362 Embryonalprimitivemedulloblastoma 8963 9470 9471 9472
9473 9501 9502 9503 9510
TUMORS OF NEUROEPITHELIAL TISSUE
TUMORS OF CRANIAL AND SPINAL NERVES Nerve sheath benign and malignant 9540 9550 9560 9570
TUMORS OF THE MENINGES Meningioma 9530 9531 9532 9533 9534 9537 9538 Other mesenchymal benign and malignant 8800 8801 8802 8803 8810 8830 8850 88618900
8910 8990 9133 9150 9240 9480 9481 9536 9539 Hemangioblastoma 9161 9535
LYMPHOMAS AND HEMOPOIETIC NEOPLASMS Lymphoma 9590 9591 9593 9594 9595 9630 9650 9652
9663 9670 9671 9672 9674 9675 9680 9681 9682 9684 9685 9686 9687 9690 9691 96939695 9696 9698 9702 9714 9723 9731 9766 9970
GERM CELL TUMORS Germ cell 8020 9060 9064 9070 9071 9080 9084 9085 9100
CYSTS AND TUMOR-LIKE LESIONS Cysts and heterotopias 9084
TUMORS OF THE SELLAR REGION Pituitary 8040 8l40 8l46 8260 8270 8271 8280
8281 8290 8300 8330 8323 8333 Craniopharyngioma 9350
Page 44
Endash
APPENDIX E
LOCAL EXTENSIONS FROM REGIONAL TUMORS Chordomachondrosarcoma 9370
UNCLASSIFIED TUMORS Hemangioma 9120 9121 9130 9131 Neoplasm benign 80000 8010 Neoplasm uncertain behavior 80001 80011 Neoplasm malignant 80003 80013 8002 8003 All other 8720 9580
aWHO = World Health OrganizationbICD-O = International Classification of Diseases for Oncology Second Edition 1990 cNOS=Not Otherwise Specified
Page 45
Endash
DATA COLLECTION
OF PRIMARY
CENTRAL NERVOUS
SYSTEM TUMORS
Endash
International Classification of Childhood Cancer (ICCC)
Diagnostic Group
ICD-Oa codes
Morphology Topography
I LEUKAEMIA
(a) Lymphoid leukaemia 9820-9827 9850
(b) Acute non-lymphocytic leukaemia 9840 9841 9861 9864 9866 9867 98919894 9910
(c) Chronic myeloid leukaemia 9863 9868
(d) Other specified leukaemias 9830 9842 9860 9862 9870-9890 9892 98939900 9930-9941
(e) Unspecified leukaemias 9800-9804
II LYMPHOMAS AND OTHER RETICULOENDOTHELIAL NEOPLASMS
(a) Hodgkinrsquos disease 9650-9667
(b) Non-Hodgkinrsquos lymphoma 9591-9595 9670-9686 9690-9714 9723
(c) Burkittrsquos lymphoma 9687
(d) Miscellaneous lymphoreticular neoplasms 9720 9731-9764
(e) Unspecified lymphomas 9590
III CENTRAL NERVOUS SYSTEM (CNS) ANDMISCELLANEOUS INTRACRANIAL AND
INTRASPINAL NEOPLASMSb
(a) Ependymomac 9383 9390-9394
(b) Astrocytoma 9380 C723
9381 9400-9441
(c) Primitive neuroectodermal tumours 9470-9473
(d) Other gliomasd 9380 C700-C722C724-C729
9382 9384
9442-9460 9481
APPENDIX E
Diagnostic Group
ICD-Oa codes
Morphology Topogragphy
III CNS AND MISCELLANEOUS INTRACRANIAL AND INTRASPINAL
NEOPLASMSb Continued
(e) Miscellaneous intracranial and intraspinalneoplasmsc
8270-8281 8300 9350-9362 9480 95059530-9539
(f) Unspecified intracranial and intraspinalneoplasmsc
8000-8004 C700-C729C751-C753
IV SYMPATHETIC NERVOUS SYSTEM TUMOURS
(a) Neuroblastoma and ganglioneuroblastoma 9490 9500
(b) Other sympathetic nervous system tumours 8680 8693-8710 9501-9504 9520-9523
aInternational Classification of Diseases for Oncology Second Edition World Health Organization 1990bGroup III excludes all lymphomas See group II cBehaviour codes 0 and 1 are included dBehaviour code 1 is included
Page 47
Endash
Comments and recommendations are welcome Should questions arise on how to use these
materials or for more information please contact
Centers for Disease Control and Prevention National Program of Cancer Registries
4770 Buford Hwy NE Mail Stop K-53
Atlanta GA 30042-3717
Voice Information System 1 (888) 842-6355 bull Fax (770) 488-4760
cancerinfocdcgov bull httpwwwcdcgovcancer
All materials are in the public domain and may be reproduced or copied without permission citation
to source however is appreciated
BACK COVER
(WHITE)
Spine(WHITE)
DATA COLLECTION OF PRIMARY CEN
TRAL NERVOUS SYSTEM
TUM
ORS 2004
National Program of Cancer Registries Training M
aterials

DATA COLLECTION
OF PRIMARY
CENTRAL NERVOUS
SYSTEM TUMORS
Endash0
cases were reported through the pathology laboratories affiliated with the hospitals with registries
(ie they were not accessioned by the registries) (Table 13) The percentages of cases of
nonmalignant tumors that were reported only by the pathology laboratories at facilities having
cancer registries can be viewed as a measure of how frequently the registries failed to accession
the cases Of the 225 nonaccessioned tumors half would have been missed without the MCSS
case finding audits of pathology laboratories (Table 13)
Percentages of Hospital Cancer Registries That Accessioned Malignant and Nonmalignant
Intracranial and CNS Tumors (NCDB)
Based on data from NCDB more than 1500 hospitals accessioned cases with either
malignant or nonmalignant intracranial and CNS tumors and approximately 800 hospitals
accessioned extracranial cases Cases with tumors that involved the cranial or spinal meninges or
the pituitary gland were more likely to be reported by hospitals that accessioned nonmalignant
primary intracranial and CNS tumors than by hospitals that accessioned only malignant tumors
(Table 14)
DISCUSSION
The findings for this report indicate that collection and reporting of incidence data for
primary malignant intracranial and other CNS tumors are well standardized However substantial
variation exists in the processes of collecting and reporting nonmalignant tumor data One
obstacle is that not all hospitals have cancer registries Another problem is that not all hospitals
with registries accession cases of nonmalignant tumors Data from Minnesota (Table 13) suggest
that approximately 85 percent of cases of nonmalignant intracranial tumors are accessioned by
hospital registries However nonaccessioned CNS cases are less likely to be routinely reported to
the central registry (Table 13) These differences in collection and reporting practices among the
registries make it difficult to assess the burden of primary intracranial and CNS tumors
Terminology for describing intracranial and CNS tumors is also not standardized For
example although the pituitary gland and pineal glands are not technically part of the CNS
tumors that involve these organs are often included in the term CNS tumors On the other hand
some consider the eye to be intracranial however CNS tumors generally do not include the
Page 20
APPENDIX E eyes Although the World Health Organization (WHO) has published a list of histologic
groupings at present no single comprehensive list of histologic groupings exists for intracranial
and CNS tumors Since the International Classification of Childhood Cancer (ICCC) is based on
histologic type rather than site certain benign histologies of sites other than brainCNS (eg non-
CNS ependymomas) would not be included in the BTWGs primary intracranial and CNS
histology groupings (Appendix D) Thus the variation in incidence estimates of primary
intracranial and CNS tumors may be attributable in part to the variation in the definitions of
these tumors In addition differences in cancer registry training and procedures may contribute to
nonreporting and inconsistent reporting of the tumors
The BTWG discussed the feasibility of conducting a random sampling procedure as an
alternative to complete enumeration and ongoing surveillance of nonmalignant brain tumors It
was agreed that this technique would not be valid or feasible for the following reasons
1 If a random sample of incident brain tumors were desired a complete list would be
needed first (a sampling frame is required)
2 If a survey method were used to identify brain tumors in the general population (eg
random digit dialing or other general population survey techniques) the information
needed could not be obtained for several reasons
- Either a prohibitively large numbers of individuals would have to be surveyed or
else only a very small number of brain tumors could be identified given the rarity
and sometimes short survival time
- The brain tumors identified would not be representative of all brain tumors that
occur because people who had survived their brain tumors would be more
likely to be identified
- The incidence rate would still not be known since cross-sectional surveys only
identify disease prevalence
3 If a sample of hospitals were selected to contribute data the tumors included would not
represent the entire spectrum of brain tumors because those that were diagnosed and
treated outside of the hospital setting would be excluded
Page 21
Endash
DATA COLLECTION
OF PRIMARY
CENTRAL NERVOUS
SYSTEM TUMORS
Endash
An alternative approach to sampling and the least troublesome would be to conduct
population-based surveillance only in certain geographic areas of the country If one assumes that
the etiology of brain tumors does not differ from one area of the country to another then the
scientific validity of studies based on this type of sampling would not be a problem However
given the rarity of some types of brain tumors sufficient numbers for study may not be available
unless the vast majority of the nations population were covered by population-based data
collection Also geographic areas without population-based surveillance would have no data to
use for assessing local trends or variations in brain tumor occurrence
In the absence of standard tumor registration procedures and training special case finding
efforts by central registries may be necessary to ensure that complete data are collected for
nonmalignant intracranial and CNS tumors Data from MCSS (Table 10) which has a legal
requirement for reporting nonmalignant intracranial tumors and performs 100 percent case finding
audits in all laboratories indicate that only 80 percent of nonmalignant tumors were routinely
reported In contrast routine reporting accounted for more than 95 percent of malignant
intracranial and CNS tumors Nonmalignant cases in Minnesota that were not accessioned by
hospital registries had a 50 percent chance of being routinely reported to the central registry
however these were only microscopically confirmed cases
Completeness of reporting is critical to cancer registries Accurate case counts are
necessary to assess the burden of cancer to guide cancer control program planning to prioritize
the allocation of health resources and to facilitate epidemiologic research Most central cancer
registries have state laws that mandate reporting of cases by physicians and by hospitals
laboratories and other facilities that provide screening diagnostic or therapeutic services
Complete reporting of nonmalignant intracranial and CNS tumors would be greatly
improved if reporting requirements of the COC central cancer registries SEER and the
National Program of Cancer Registries (NPCR) were changed to require the collection of
information for these tumors However this requirement would have many implications
including an increase in work load as well as associated costs for reporting facilities An estimated
14 percent of all new cancer cases diagnosed in 1998 will involve invasive brain and other
nervous system tumors7 since the numbers of benign and invasive brain and other CNS tumors
Page 22
Endash
APPENDIX E diagnosed annually are similar facilities that presently do not accession nonmalignant cases could
expect an approximately 14 percent increase in the total number of CNS cases collected by the
registry Some estimates of the percentage of brain tumors have been lower (05 percent)36 and
others have been higher (9 percent)37 therefore the extent to which the workload would be
affected may vary The data in this report suggest that if reporting of nonmalignant intracranial
and CNS tumors were required the total number of cases of tumors for these anatomic sites
would double for facilities that presently report only malignant tumors This is consistent with the
findings of Davis et al36 who reported that the incorporation of benign brain tumors into the
cancer-reporting systems of four central registries increased the overall incidence of brain cancer
by 49 percent Forty percent (913) of the hospital registries that submitted data to the NCDB did
not report nonmalignant brain tumors These registries could expect up to a 50 percent increase in
the number of intracranial and CNS tumors reported nonregistry facilities which represent
approximately 20 percent of cases reported to central cancer registries could expect a similar
increase Also central cancer registries that currently do not require reporting of nonmalignant
intracranial and CNS tumors could expect increases in their workloads as a result of the
additional time spent on processing and quality control procedures and training The lack of
standard definitions and collection and reporting guidelines would make these tasks more time-
consuming as well
For some central cancer registries that want to expand their reporting requirements to
include nonmalignant intracranial and CNS tumors a change in current legislation andor
regulations may be needed These changes could involve several months of lead time if public
hearings or other legal procedures are necessary In other states the reporting of these tumors is
not required in either their legislation or regulations in these situations hospitals have been asked
to voluntarily report the cases For example in Massachusetts the reporting of benign brain
tumors is not required by law but hospitals have been reporting these cases since 1982 However
the completeness of data reported on a voluntary basis is difficult to assess For public health
surveillance systems a mandate to report is the basic requirement of a comprehensive higher
quality system
DATA COLLECTION
OF PRIMARY
CENTRAL NERVOUS
SYSTEM TUMORS
If COC SEER NPCR and central cancer registries changed their reporting requirements
to include nonmalignant intracranial and CNS tumors the registry manuals disseminated by these
programs and registries would also need to be modified to include new definitions of reportable
diagnoses All reporting facilities would have to be notified of the new requirements To ensure
complete reporting from registries additional training of registrars should be expected Case
finding methods may need to be modified in order to identify the new cases and sources of
information Central cancer registries would also need to increase their case finding audits The
inclusion of nonmalignant tumors would also necessitate changes to other data items such as
sequence number Hospital and central cancer registries would need to consider adding WHO
brain tumor grade as an additional data item
Finally the software used by reporting facilities and by central registries would need to be
modified to accept nonmalignant morphology and behavior codes Also edits programs would
need to be modified to include these additions and to accept a nonmalignant sequence numbering
procedure
Before reporting requirements for primary intracranial and CNS tumors could be changed
feasibility studies would have to be conducted to determine whether such changes should be
recommended Two SEER special studies are under way to evaluate the impact of requiring the
collection of benign brain tumors on case finding cost quality control and training However
additional studies may be required
Page 24
Endash
APPENDIX E
RECOMMENDATIONS OF THE BRAIN TUMOR WORKING GROUP
1 We recommend the following standard definition for collecting precise data for all primary
intracranial and central nervous system tumors
Primary intracranial and central nervous (CNS) tumors are primary tumors occurring in
the following sites irrespective of histologic type or behavior brain meninges spinal
cord cauda equina cranial nerves and other parts of the CNS pituitary gland pineal
gland and craniopharyngeal duct (see Appendix B)
2 We recommend the development of a standard site and histology definition for tabulating
estimates of these tumors to allow comparability of information across registries Pathologists
the North American Association of Central Cancer Registries (NAACCR) the Commission
on Cancer (COC) the Surveillance Epidemiology and End Results (SEER) Program the
National Program of Cancer Registries (NPCR) and the International Agency for Research
on Cancer (IARC) need to be involved in developing this standard
3 We recommend collection of data for primary intracranial and extracranial CNS tumors by all
registries hospital- and central-based This effort will necessitate a change in the COC
requirements and will increase costs to the hospital-based programs Federal funding should be
allocated to supplement the additional transition and ongoing data collections costs that will be
incurred by central registries Before additional data collection is implemented we recommend
a pilot study should be conducted to assess the procedures and quality control functions
needed as well as the costs of collecting data for these tumors
4 We recommend that the appropriate government and professional organizations be involved in
carrying out the development and implementation of special training programs and curricula for
central registry hospital registry and laboratory personnel as well as the development of
computerized edit-checking procedures Training for reporting and tabulating primary
intracranial and CNS tumors should be offered on a regular basis
Page 25
Endash
DATA COLLECTION
OF PRIMARY
CENTRAL NERVOUS
SYSTEM TUMORS
Endash
REFERENCES
1 Davis F Preston-Martin S Epidemiology of brain tumors In Bigner DD McLendon RE Bruner JM eds Russell and Rubinsteins pathology of tumors of the nervous system ed 6 London Arnold Publishing 19965-45
2 World Health Organization (WHO) (1976) International classification of diseases foroncology ed 1 Geneva World Health Organization
3 World Health Organization (WHO) (1990) International classification of diseases foroncology ed 2 Geneva World Health Organization
4 Kleihues P Burger PC Scheithauer BW The new WHO classification of brain tumorsBrain Pathol 19933255-268
5 Thapar K Laws ER Tumors of the central nervous system In Murphy GP Lawrence WJr Lenhard RE Jr eds Textbook of clinical oncology ed 2 Atlanta American CancerSociety 1995378-410
6 Walker AE Robins M Weinfield FD Epidemiology of brain tumors the national survey ofintracranial neoplasms Neurol 198535219-226
7 Ries LAG Kosary CL Hankey BF Miller BA Edwards BK (eds) SEER Cancer StatisticsReview 1973-1995 National Cancer Institute Bethesda MD 1998
8 Cancer Facts amp Figures - 1998 American Cancer Society Atlanta Georgia 19989 Davis FG Bruner JM Surawicz TS The rationale for standardized registration and reporting
of brain and central nervous system tumors in population-based cancer registriesNeuroepidemiol 199716308-316
10CBTRUS (1996) First annual report 1995 Central Brain Tumor Registry of the UnitedStates Chicago Illinois
11 Preston-Martin S Epidemiology of primary CNS neoplasms Neurol Clinics 199614273-290
12 Greig NH Ries LG Yancik R Rapoport SI Increasing annual incidence of primary malignantbrain tumors in the elderly J Natl Cancer Inst 1991 831621-1624
13 Mao Y Desmeules M Semenciw RM Hill G Gaudette L Wigle DT Increasing brain cancerrates in Canada Can Med Assoc J 19911451583-1591
14 Frelick R Huang P Topham A Brain and central nervous system tumors Delaware 1980 to1989 Del Med J 199264571-573
15 Davis DL Ahlbom A Hoel D Percy C Is brain cancer mortality increasing in industrialcountries Am J Ind Med 199119421-431
16 Helseth A Increasing incidence of primary central nervous system tumors in the elderly Realincrease or improved detection J Natl Cancer Inst 1993851871-1872
17 Modan B Wagener D Feldman JJ Rosenberg HM Feinleib M Increased mortality frombrain tumors A combined outcome of diagnostic technology and change of attitude towardthe elderly Am J Epidemiol 19921351349-1357
18 Polednak AP Time trends in the incidence of brain and central nervous system cancers inConnecticut J Natl Cancer Inst 1991831679-1681
19 Boyle P Maissonneuve P Saracci R Muir CS Is the increase in incidence of primarymalignant brain tumors real J Natl Cancer Inst 1990201594-1596
Page 26
APPENDIX E 20 Preston-Martin S Descriptive epidemiology of primary tumors of the brain cranial nerves
and spinal meninges in Los Angeles County Neuroepidemiol 19898283-29521 Helseth A Mork SJ Neoplasms of the central nervous system in Norway Epidemiological
characteristics of intracranial gliomas according to histology APMIS 97 1989547-55522 Gurney JG Davis S Severson RK Fang J-Y Ross JA Robison LL Trends in cancer
incidence among children in the United States Cancer 199678532-54123 Gurney JG Ross JA Wall DA Bleyer WA Severson RK Robison LL Infant cancer in the
US histology-specific incidence trends 1973-1992 J Pediatr Hem Onc 199719428-43224 Nishio S Takeshita I Morioka T Fukui M Primary intracranial squamous cell carcinomas
report of two cases Neurosurgery 199537329-33225 Freilich RJ Thompson SJ Walker RW Rosenblum MK Adenocarcinomatous transformation
of intracranial germ cell tumors Am J Surg Pathol 199519537-54426Yuan S Miller DW Barnett GH Hahn JF Williams BR Identification and characterization of
human beta 2-chimaerin association with malignant transformation in astrocytoma CancerResearch 1995 553456-3461
27 Preston-Martin S Mack WJ Neoplasms of the nervous system In Schoenfeld D Fraumeni JFJr eds Cancer epidemiology and prevention ed 2 New York Oxford University Press19961231-1281
28 Riggs JE Rising primary malignant brain tumor mortality in the elderly A manifestation ofdifferential survival Arch of Neurol 199552571-575
29 Davis FG Freels S Grutsch J Barlas S Brem S Survival rates in patients with primarymalignant brain tumors stratified by patient age and tumor histological type an analysisbased on Surveillance Epidemiology and End Results (SEER) data 1973-1991J Neurosurg 1998881-10
30 Surawicz TS Davis F Freels S Laws ER Menck HR Brain tumor survival results from theNational Cancer Data Base (Accepted for publication in J Neuro-Oncol)
31 Bondy ML Lustbader ED Buffler PA Schull WJ Hardy RJ Strong LC Geneticepidemiology of childhood brain tumors Genet Epidemiol 19918253-267
32 Preston-Martin S Monroe K Lee P Bernstein L Kelsey J Henderson S Forrester DHenderson B Spinal meningiomas in women in Los Angeles County Investigation of anetiologic hypothesis Cancer Epidemiol Biomarkers Prev 19954333-339
33 Davis JR Brownson RC Garcia R Bentz BJ Turner A Family pesticide use and childhoodbrain cancer Arch Environ Contam Toxicol 19932487-92
34 Commission on Cancer General principles and coding In Standards of the Commission on Cancer vol II Registry Operations and Data Standards American College of SurgeonsChicago Illinois 1996
35 Central Brain Tumor Registry of the United States (CBTRUS) 1997 State Survey of BenignBrain Tumor Collection Chicago Illinois 1997
36 Davis FG Malinski N Haenszel W Chang J Flannery J Gershman S Dibble R Bigner DDPrimary brain tumor incidence rates in the four United States regions 1985-1989 A pilotstudy Neuroepidemiol 199615103-112
37 Schoenberg BS Christine BW Whisnant JP The descriptive epidemiology of primaryintracranial neoplasms the Connecticut experience Am J Epidemiol 1976104499-510
Page 27
Endash
DATA COLLECTION
OF PRIMARY
CENTRAL NERVOUS
SYSTEM TUMORS
TAB
LE 1
C
OM
PAR
ISO
N O
F R
EGIS
TRIE
S SU
PPLY
ING
DA
TA O
N P
RIM
AR
Y I
NTR
AC
RA
NIA
L A
ND
CEN
TRA
L N
ERV
OU
S SY
STEM
TU
MO
RS
IN T
HE
UN
ITED
STA
TES
Cen
tral B
rain
Tum
or R
egis
try o
fth
e U
nite
d St
ates
(CBT
RUS)
Min
neso
ta C
ance
rSu
rvei
llanc
e Sy
stem
(MC
SS)
ACo
SN
a tio
nal C
ance
r Dat
a B
ase
(NCD
B)
Surv
eilla
nce
Epid
emio
logy
and
End
Res
ults
Pro
gram
(SEE
R)
Purp
ose
ldquoCB
TRU
S ce
ntra
lizes
pop
ulat
ion-
base
d in
cide
nce
data
on
all b
rain
tum
ors a
nd u
ses o
ther
exi
stin
gda
ta re
sour
ces t
o ch
arac
teriz
e th
ein
cide
nce
mor
talit
y a
nd su
rviv
alof
pat
ient
s with
bra
in tu
mor
s rdquo
The
MC
SS c
olle
cts i
nfor
mat
ion
onal
l can
cers
dia
gnos
ed si
nce
1988
amon
g M
inne
sota
resi
dent
s Th
e M
CSS
is p
opul
atio
n-ba
sed
path
olog
y-ba
sed
and
is a
n ac
tive
syste
m
ldquoThe
goa
l of t
he N
CD
B is
to p
rese
nt a
n an
nual
sum
mar
y of
pat
ient
car
e fo
r cas
es o
f can
cer
diag
nose
d an
d tre
ated
at h
ospi
tals
thro
ugho
utth
e co
untry
rdquo
ldquoA c
ontin
uing
pro
ject
of th
e N
CI
the
SEER
prog
ram
col
lect
sca
ncer
dat
a on
aro
utin
e ba
sis f
rom
desi
gnat
ed p
opul
atio
n-ba
sed
canc
er re
gist
ries
in v
ario
us a
reas
of t
heco
untry
Targ
et p
opul
atio
n Th
e po
pula
tions
cov
ered
by
regi
strie
s in
Ari
zona
Col
orad
oC
onne
ctic
ut D
elaw
are
Idah
oM
aine
Mas
sach
uset
ts
Min
neso
ta M
issou
ri M
onta
na
Nor
th C
arol
ina
and
Uta
h
The
CB
TRU
S po
pula
tion
repr
esen
ts a
non
rand
om 1
5pe
rcen
t sam
ple
of th
e U
S
popu
latio
n
The
popu
latio
n of
Min
neso
ta
The
popu
latio
ns tr
eate
d at
par
ticip
atin
gho
spita
ls in
the
50 st
ates
the
Dist
rict
of
Col
umbi
a a
nd P
uert
o R
ico
NC
DB
is n
ot a
pop
ulat
ion-
base
d re
gist
ry
At
pres
ent
it is
est
imat
ed to
cov
er a
ppro
xim
atel
y57
per
cent
of t
otal
cas
es n
atio
nwid
e
The
popu
latio
nsco
vere
d by
the
state
regi
strie
s in
Con
nect
icut
Haw
aii
Iow
a N
ew M
exic
o
and
Uta
h a
s wel
l as
the
regi
onal
regi
strie
sin
Atla
nta
Geo
rgia
D
etro
it M
ichi
gan
San
Fran
cisc
o-O
akla
nd C
alifo
rnia
an
d Se
attle
-Pug
etSo
und
Was
hing
ton
The
SEER
pop
ulat
ion
repr
esen
ts a
nonr
ando
m 1
4 pe
rcen
tsa
mpl
e of
the
US
po
pula
tion
Page
28
Endash
APPENDIX E
Cen
tral B
rain
Tum
or R
egis
try o
fth
e U
nite
d St
ates
(CBT
RUS)
Min
neso
ta C
ance
rSu
rvei
llanc
e Sy
stem
(MC
SS)
ACo
SN
a tio
nal C
ance
r Dat
a B
ase
(NCD
B)
Surv
eilla
nce
Epid
emio
logy
and
End
Res
ults
Pro
gram
(SEE
R)
Type
of
prim
ary
intra
cran
ial
and
cent
ral n
ervo
us sy
stem
tum
ors r
epor
ted
Dat
a on
new
ly-d
iagn
osed
cas
es o
fbe
nign
and
mal
igna
nt p
rimar
ybr
ain
tum
ors b
ased
on
ICD
-Oco
des
Dat
a on
new
ly-d
iagn
osed
m
i cro
scop
ical
ly-c
onfir
med
tum
ors
of th
e ce
ntra
l ner
vous
syste
m
incl
udin
g pi
tuita
ry a
nd p
inea
lgl
ands
Hos
pita
ls v
olun
taril
y su
bmit
full
anal
ytic
canc
er re
gist
ry c
asel
oads
with
dat
a ite
ms a
ndco
des d
efin
ed b
y th
e C
omm
issio
n on
Can
cer
(CO
C) f
or h
ospi
tal c
ance
r reg
istri
es
Mos
tpa
rtici
patin
g ho
spita
ls h
ave
prog
ram
sap
prov
ed b
y C
OC
or a
re e
stab
lishi
ng p
rogr
amap
prov
al
NC
DB
cal
ls fo
r dat
a do
not
lim
itca
ses b
y m
alig
nant
beh
avio
r bu
t acc
essi
onin
gof
non
-mal
igna
nt c
ases
is n
ot re
quire
d fo
rpr
ogra
m a
ppro
val
Fifty
-nin
e pe
rcen
t of t
heho
spita
ls th
at su
bmitt
ed a
ny in
tracr
ania
lCN
Sca
ses d
iagn
osed
dur
ing
1989
-199
4 su
bmitt
edat
leas
t one
non
mal
igna
nt c
ase
The
NC
DB
data
in th
is re
port
are
limite
d to
the
case
ssu
bmitt
ed b
y th
ese
hosp
itals
(82
perc
ent o
f all
intra
cran
ial a
nd e
xtra
cran
ial c
entra
l ner
vous
syste
m c
ases
on
file)
Tren
ds in
the
inci
denc
e m
orta
lity
and
patie
nt su
rviv
al o
fbr
ain
tum
ors i
n th
eU
S H
owev
er S
EER
does
not
col
lect
info
rmat
ion
on b
enig
nan
d un
certa
in b
rain
tum
ors
Oth
er c
omm
ents
D
uplic
ate
canc
er re
gist
ratio
ns c
anno
t be
iden
tifie
d by
the
parti
cipa
ting
regi
strie
s
The
MC
SS p
erfo
rms 1
00 p
erce
ntca
se fi
ndin
g au
dits
in a
ll pa
thol
ogy
labo
rato
ries o
n an
ann
ual b
asis
Th
eref
ore
the
data
from
the
MC
SSm
ight
be
cons
ider
ed a
ldquobe
st-ca
sesc
enar
iordquo
in te
rms o
f com
plet
enes
sof
repo
rting
for m
icro
scop
ical
ly-
conf
irmed
tum
ors
Rep
ort d
uplic
atio
n fo
r 198
9-19
94 in
tracr
ania
lan
d ex
tracr
ania
l cen
tral n
ervo
us sy
stem
repo
rts w
as 6
7 p
erce
nt
How
ever
the
NC
DB
data
in T
able
s 2 th
roug
h 9
are
base
d on
undu
plic
ated
repo
rts
Page
29
Endash
DATA COLLECTION
OF PRIMARY
CENTRAL NERVOUS
SYSTEM TUMORS
TABLE 2 NUMBER AND PERCENT OF PRIMARY INTRACRANIAL AND CENTRAL NERVOUS SYSTEM TUMORS BY TUMOR LOCATION
Locationa CBTRUSb
Number () MCSSc
Number () NCDBd
Number () SEERe
Number ()
Intracranial 13084 (947) 3600 (936) 66322 (955) 10196 (969)
Brain 7999 (579) 1924 (500) 48527 (699) 9721 (924)
Meninges 2719 (197) 838 (218) 9365 (135) 139 (13)
Pituitarycraniopharygealduct
1491 (108) 530 (138) 4958 (71) 30 (03)
Pineal 74 (05) 21 (05) 477 (07) 80 (08)
Other central nervous systemincluding cranial nerves
801 (58) 287 (75) 2995 (43) 226 (22)
Extracranial 730 (53) 245 (64) 3137 (45) 322 (31)
Spinal cord 497 (36) 47 (38) 2395 (34) 313 (30)
Spinal meninges 233 (17) 98 (25) 742 (11) 9 (01)
TOTAL 13814 (100) 3845 (100) 69459 (100) 10518 (100)
Note Reported data are incident cases from 1989-1994 except for CBTRUS data which are from 1990-1993
aRefer to the sites in Appendix BbCentral Brain Tumor Registry of the United States cMinnesota Cancer Surveillance System (microscopically confirmed cases only)dNational Cancer Data Base (limited to cases reported by hospitals that accessioned nonmalignant cases) eSurvival Epidemiology and End results Program (malignant cases only)
Page 30
Endash0
TABL
E 3
RO
W P
ERCE
NT
DIS
TRIB
UTI
ON
OF
PRIM
ARY
INTR
ACR
AN
IAL
AN
D C
ENTR
AL
NER
VO
US
SYST
EM T
UM
ORS
BY
TU
MO
R B
EHA
VIO
RA
ND
MIC
ROSC
OPI
C C
ON
FIRM
ATI
ON
Loca
tiona
CB
TRU
Sb M
CSSc
NC
DB
d SE
ERe
Tota
l Pe
rcen
tM
icro
Co
nfirm
ed
Perc
ent
Not
Mic
ro
Conf
irmed
Tota
l Pe
rcen
tM
icro
Co
nfirm
ed
Perc
ent
Not
Mic
ro
Conf
irmed
Tota
l Pe
rcen
tM
icro
Co
nfirm
ed
Perc
ent
Not
Mic
ro
Conf
irmed
Tota
l Pe
rcen
tM
icro
Co
nfirm
ed
Perc
ent
Not
Mic
ro
Conf
irmed
Intra
cran
ial
130
84
867
13
3
360
0 10
0 N
A
663
22
887
11
3
101
96
871
12
9
Mal
igna
nt
717
1 89
2
108
1
824
100
NA
44
801
91
3
87
101
96
871
12
9
Beni
gn a
ndu n
certa
in
591
3 83
5
165
1
776
100
NA
21
521
83
2
168
N
A
NA
N
A
Bra
in
799
9 88
2
118
1
924
100
NA
48
527
90
2
98
972
1 87
3
127
Mal
igna
nt
686
2 89
6
104
1
746
100
NA
42
622
91
5
85
972
1 87
3
127
Beni
gnan
dun
certa
in
113
7 80
6
194
17
8 10
0 N
A
590
5 80
6
194
N
A
NA
N
A
Extra
cran
ial
730
962
3
8 24
5 10
0 N
A
313
7 96
0
40
322
957
4
3
Mal
igna
nt
242
934
6
6 60
10
0 N
A
148
3 96
6
34
322
957
4
3
Beni
gn a
ndu n
certa
in
488
975
2
5 18
5 10
0 N
A
165
4 95
5
45
NA
N
A
NA
TOTA
Lf 13
814
87
2
128
3
845
100
NA
69
459
89
0
110
10
518
87
4
126
Mal
igna
nt
741
3 89
4
106
1
884
100
NA
46
284
91
5
85
105
18
874
12
6
Beni
gn a
ndu n
certa
in
640
1 84
6
154
1
961
100
NA
23
175
84
1
159
N
A
NA
N
A
Not
e R
epor
ted
data
are
inci
dent
cas
es fr
om 1
989-
1994
exc
ept f
or C
BTR
US
data
whi
ch a
re fr
om 1
990-
1993
a Refe
r to
the
site
code
s in
App
endi
x B
b Cent
ral B
rain
Tum
or R
egist
ry o
f the
Uni
ted
Stat
es
c Min
neso
ta C
ance
r Sur
veill
ance
Sys
tem
(mic
rosc
opic
ally
con
firm
ed c
ases
onl
y)
d Nat
iona
l Can
cer D
ata
Base
(lim
ited
to c
ases
repo
rted
by h
ospi
tals
that
acc
essio
ned
nonm
alig
nant
cas
es)
e Surv
eilla
nce
Epi
dem
iolo
gy a
nd E
nd R
esul
ts Pr
ogra
m (m
alig
nant
cas
es o
nly)
f In
clud
es in
tracr
ania
l and
ext
racr
ania
l cas
es
NA
= N
ot a
pplic
able
Page
31
APPENDIX E
Endash
DATA COLLECTION
OF PRIMARY
CENTRAL NERVOUS
SYSTEM TUMORS
TABLE 4 NUMBER AND PERCENT OF PRIMARY INTRACRANIAL AND CENTRAL NERVOUS SYSTEM TUMORS BY DIAGNOSTIC CONFIRMATION
DiagnosticConfirmation
CBTRUSa
Number () MCSSb
Number () NCDBc
Number () SEERd
Number ()
Positive microscopy
12087 (875) 3845 (100) 61818 (890) 9188 (874)
Radiographywithout microscopy
1306 (95) NA 6759 (97) 1015 (97)
Clinical 204 (15) NA 484 (07) 98 (09)
Unknown 217 (15) NA 398 (06) 217 (21)
TOTAL 13814 (100) 3845 (100) 69459 (100) 10518 (100)
Note Reported data are incident cases from 1989-1994 except for CBTRUS data which are from 1990-1993
aCentral Brain Tumor Registry of the United Statesb Minnesota Cancer Surveillance System (microscopically confirmed cases only) cNational Cancer Data Base (limited to cases reported by hospitals that accessioned nonmalignant cases)dSurveillance Epidemiology and End Results Program (malignant cases only)NA = Not applicable
Page 32
Endash
Page 32
TABLE 4 NUMBER AND PERCENT OF PRIMARY INTRACRANIAL AND CENTRALNERVOUS SYSTEM TUMORS BY DIAGNOSTIC CONFIRMATION
DiagnosticConfirmation
CBTRUSa
Number ()MCSSb
Number ()NCDBc
Number ()SEERd
Number ()
Positivemicroscopy
12087 (875) 3845 (100) 61818 (890) 9188 (874)
Radiographywithout microscopy
1306 (95) NA 6759 (97) 1015 (97)
Clinical 204 (15) NA 484 (07) 98 (09)
Unknown 217 (15) NA 398 (06) 217 (21)
TOTAL 13814 (100) 3845 (100) 69459 (100) 10518 (100)
Note Reported data are incident cases from 1989-1994 except for CBTRUS data which are from 1990-1993
aCentral Brain Tumor Registry of the United Statesb Minnesota Cancer Surveillance System (microscopically confirmed cases only)cNational Cancer Data Base (limited to cases reported by hospitals that accessioned nonmalignant cases)dSurveillance Epidemiology and End Results Program (malignant cases only)NA = Not applicable
APPENDIX E
TABLE 5 NUMBER AND PERCENT OF MALIGNANT PRIMARY INTRACRANIAL AND CENTRAL SYSTEM TUMORS BY TUMOR LOCATION
Locationa CBTRUSb
Number () MCSSc
Number () NCDBd
Number () SEERe
Number ()
Intracranial 7171 (977) 1824 (968) 44801 (968) 10196 (969)
Brain 6862 (926) 1746 (927) 42622 (921) 9721 (924)
Meninges 98 (13) 23 (12) 581 (13) 139 (13)
Pituitarycraniopharyngealduct
37 (05) 13 (07) 189 (04) 30 (03)
Pineal 58 (08) 20 (11) 378 (08) 80 (08)
Other central nervous systemincluding cranial nerves
116 (16) 22 (12) 1031 (22) 226 (21)
Extracranial 242 (33) 60 (32) 1483 (32) 322 (31)
Spinal cord 234 (32) 60 (32) 1410 (30) 313 (30)
Spinal meninges 8 (01) 0 73 (02) 9 (01)
TOTAL 7413 (100) 1884 (100) 46284 (100) 10518 (100)
Note Reported data are incident cases from 1989-1994 except for CBTRUS data which are from 1990-1993
aRefer to the site codes in Appendix BbCentral Brain Tumor Registry of the United States cMinnesota Cancer Surveillance System (microscopically confirmed cases only)dNational Cancer Data Base (limited to cases reported by hospitals that accessioned nonmalignant cases) eSurvival Epidemiology and End Results Program (malignant cases only)
Page 33
Endash
DATA COLLECTION
OF PRIMARY
CENTRAL NERVOUS
SYSTEM TUMORS
TABLE 6 NUMBER AND PERCENT OF PRIMARY INTRACRANIAL AND CENTRAL NERVOUS SYSTEM TUMORS OF BENIGN AND UNCERTAIN BEHAVIOR BY TUMOR LOCATION
Locationa CBTRUSb
Number () MCSSc
Number () NCDBd
Number () SEERe
Number ()
Intracranial 5913 (924) 1776 (906) 21521 (929) NA
Brain 1137 (178) 178 (91) 5905 (255) NA
Meninges 2621 (409) 815 (416) 8784 (379) NA
Pituitarycraniopharyngealduct
1454 (227) 517 (264) 4769 (206) NA
Pineal 16 (02) 1 (lt01) 99 (04) NA
Other central nervous systemincluding cranial nerves
685 (107) 265 (135) 1964 (85) NA
Extracranial 488 (76) 185 (94) 1654 (71) NA
Spinal cord 263 (41) 87 (44) 985 (42) NA
Spinal meninges 225 (35) 98 (50) 669 (29) NA
TOTAL 6401 (100) 1961 (100) 23175 (100) NA
Note Reported data are incident cases from 1989-1994 except for CBTRUS data which are from 1990-1993
aRefer to the site codes in Appendix BbCentral Brain Tumor Registry of the United States cMinnesota Cancer Surveillance System (microscopically confirmed cases only)dNational Cancer Data Base (limited to cases reported by hospitals that accessioned nonmalignant cases) eSurveillance Epidemiology and End Results Program (malignant cases only)NA = Not applicable
Page 34
Endash
APPENDIX E TABLE 7 NUMBER AND PERCENT OF PRIMARY INTRACRANIAL AND CENTRAL
NERVOUS SYSTEM TUMORS BY TUMOR BEHAVIOR AND LOCATION
BehaviorTumor Locationa
CBTRUSb
Number () MCSSc
Number () NCDBd
Number () SEERe
Number ()
Malignant 7413 (537) 1884 (490) 46284 (666) 10518 (100)
Brain 6862 (497) 1746 (454) 42622 (614) 9721 (924)
Meninges 98 (07) 23 (06) 581 (08) 139 (13)
Pituitarycraniopharyn-geal ductpineal
95 (07) 33 (09) 567 (08) 110 (11)
Other central nervous system includingcranial nerves
116 (08) 22 (06) 1031 (15) 226 (22)
Spinal cord 242 (18) 60 (16) 1483 (21) 322 (31)
Benign 5794 (419) 1787 (465) 20694 (298) NA
Brain 803 (58) 99 (26) 4491 (65) NA
Meninges 2565 (186) 807 (210) 8613 (124) NA
Pituitarycraniopharyn-geal ductpineal
1322 (96) 458 (119) 4330 (62) NA
Other central nervous system includingcranial nerves
678 (49) 263 (68) 1911 (28) NA
Spinal cord 426 (31) 160 (42) 1349 (19) NA
Uncertain 607 (44) 174 (45) 2481 (36) NA
Brain 334 (24) 79 (21) 1414 (20) NA
Meninges 56 (04) 8 (02) 171 (02) NA
Pituitarycraniopharyn-geal ductpineal
148 (11) 60 (16) 538 (08) NA
Other central nervous system includingcranial nerves
7 (01) 2 (01) 53 (01) NA
Spinal cord 62 (05) 25 (07) 305 (04) NA
TOTAL 13814 (100) 3845 (100) 69459 (100) 10518 (100)
Note Reported data are incident cases from 1989-1994 except for CBTRUS data which are from 1990-1993 NA=Not applicableaRefer to the site codes in Appendix B bCentral Brain Tumor Registry of the United States cMinnesota Cancer Surveillance System (microscopically confirmed cases only)dNational Cancer Data Base (limited to cases reported byhospitals that accessioned nonmalignant cases eSurvival Epidemiology and End Results Program (malignant cases only)
Page 35
Endash
DATA COLLECTION
OF PRIMARY
CENTRAL NERVOUS
SYSTEM TUMORS
TABLE 8 NUMBER AND PERCENT OF MALIGNANT PRIMARY INTRACRANIAL AND
CENTRAL NERVOUS SYSTEM TUMORS BY HISTOLOGY GROUPINGS
WHO Histologya
Groupings CBTRUSb
Number () MCSSc
Number () NCDBd
Number () SEERe
Number ()
Neuroepithelial 6477 (874) 1689 (896) 39701 (858) 8676 (825)
Tumors of cranial and spinal nerves
12 (02) 3 (02) 108 (02) 25 (02)
Tumors of meninges
137 (18) 25 (13) 994 (21) 194 (18)
LymphomasHemopoietic
473 (64) 121 (64) 3492 (75) 1099 (105)
Germ cell 70 (09) 20 (11) 403 (09) 97 (09)
Cysts and tumor-like lesions
0 0 0 0
Tumors of sellar region
20 (03) 11 (06) 100 (02) 6 (01)
Local extensions 29 (04) 11 (06) 166 (04) 38 (04)
Unclassifiedunassigned tumorsf
195 (26) 4 (02) 1320 (29) 383 (36)
TOTAL 7413 (100) 1884 (100) 46284 (100) 10518 (100)
Note Reported data are incident cases from 1989-1994 except for CBTRUS data which are from 1990-1993
aRefer to the World Health Organization (WHO) histology groupings in Appendix CbCentral Brain Tumor Registry of the United States cMinnesota Cancer Surveillance System (microscopically confirmed cases only)dNational Cancer Data Base (limited to cases reported by hospitals that accessioned nonmalignant cases) f For MCSS unclassifiedunassigned tumors include one malignant and four nonmalignant histologies which were
not listed in the CBTRUS classification scheme For NCDB unclassifiedunassigned tumors include 319 cases(less than one half percent) which had histologies not assigned by CBTRUS to any other category For SEERunclassifiedunassigned tumors include all malignant histologies occurring in the brainCNS which could not beclassified in one of the above categories based on their 4-digit histologic type
Page 36
Endash
APPENDIX E
TABLE 9 NUMBER AND PERCENT OF PRIMARY INTRACRANIAL AND CENTRAL NERVOUS SYSTEM TUMORS OF BENIGN AND UNCERTAIN BEHAVIOR
BY HISTOLOGY GROUPINGS
WHO Histologya
Groupings CBTRUSb
Number () MCSSc
Number () NCDBd
Number () SEERe
Number ()
Neuroepithelial 275 (43) 91 (46) 1064 (46) NA
Tumors of cranial and spinal nerves
980 (153) 397 (202) 2618 (113) NA
Tumors of meninges
3509 (548) 941 (480) 13667 (590) NA
LymphomasHemopoietic
3 (lt01) 0 7 (lt01) NA
Germ cell 4 (lt01) 1 (01) 25 (01) NA
Cysts and tumor-like lesions
15 (02) 3 (02) 34 (01) NA
Tumors of sellar region
1444 (226) 510 (260) 4749 (205) NA
Local extensions 0 0 0 NA
Unclassifiedunassigned tumorsf
171 (27) 18 (09) 1011 (44) NA
TOTAL 6401 (100) 1961 (100) 23175 (100) NA
Note Reported data are incident cases from 1989-1994 except for CBTRUS which is 1990-1993
aRefer to the World Health Organization (WHO) histology groupings in Appendix CbCentral Brain Tumor Registry of the United States c Minnesota Cancer Surveillance System (microscopically confirmed cases only) dNational Cancer Data Base (limited to cases reported by hospitals that accessioned nonmalignant cases) eSurvival Epidemiology and End Results Program (malignant cases only)dFor MCSS unclassifiedunassigned tumors include one malignant and four nonmalignant histologies which werenot listed in the CBTRUS classification scheme For NCDB unclassifiedunassigned tumors include 319 cases(less than one half percent) which had histologies not assigned by CBTRUS to any other category For SEERunclassifiedunassigned tumors include all malignant histologies occurring in the brainCNS which could not beclassified in one of the above categories based on their 4-digit histologic typeNA = Not applicable
Page 37
Endash
DATA COLLECTION
OF PRIMARY
CENTRAL NERVOUS
SYSTEM TUMORS
TABLE 10 METHOD OF CASE FINDING FOR PRIMARY INTRACRANIAL AND CENTRAL NERVOUS SYSTEM TUMORS BY TUMOR BEHAVIOR AND LOCATION MINNESOTA 1989-1994
Behavior Tumor Locationa
Number of Cases
Percent Found byRoutine
Reporting
Percent Found by Special Efforts
Malignant Brain Cerebral meninges
Pituitarycranio duct pineal Other intracranial
18841746 23 33
22
961 965 957 939
864
39 35 43 61
136 Extracranial 60 883 117 Benign Brain
1787 99
788 838
212 162
Cerebral meninges Pituitarycranio duct
pineal Other intracranial
807 458
263
843 740
779
157 260
221 Extracranial 160 631 369 Uncertain 174 856 144 Brain 79 823 177 Cerebral meninges Pituitarycraniopharyn- geal ductpineal Other intracranial
8 60
2
875 850
1000
125 150
00 Extracranial 25 960 40
TOTAL 3845 876 124
aRefer to the site codes in Appendix B
Page 38
Endash
1989 1990 1991 1992 1993 1994
TOTAL
APPENDIX E TABLE 11 METHOD OF CASE FINDING FOR INTRACRANIALa TUMORS BY DIAGNOSIS YEAR MINNESOTA 1989-1994
DiagnosisYear
Number of
Cases
Percent Found byRoutine
Reporting
Percent Found by
Special Efforts
571 837 163 616 865 135 586 913 87 602 899 101
633 872 128 592 929 71
3600 886 114
aIncludes the brain cerebral meninges pituitary gland pineal gland and otherintracranial tumors (refer to the site codes in Appendix B)
Page 39
Endash
DATA COLLECTION
OF PRIMARY
CENTRAL NERVOUS
SYSTEM TUMORS
TABLE 12 METHOD OF CASE FINDING FOR NONMALIGNANT INTRACRANIALa TUMORS BY TYPE OF FACILITY MINNESOTA 1989-1994
Type of Facility Number of Tumors Percent Found byRoutine
Reporting
Percent Found by Special Efforts
Registry at facility No registry at facility
1451325
859 569
141 431
TOTAL 1776 806 194
aIncludes tumors with benign or uncertain behavior that involve the brain cerebral meningespituitary gland pineal gland or other intracranial sites (refer to the site codes in Appendix B)
TABLE 13 REPORTING METHOD AND SOURCE OF CASE FINDING FOR NON- MALIGNANT INTRACRANIALa TUMORS DIAGNOSED IN HOSPITALS WITH A TUMOR REGISTRY MINNESOTA 1989-1994
Reporting Method Number of Tumors Percent Found byRoutine
Reporting
Percent Found by
Special Efforts
Registry-reportedLaboratory-reported
1226225
925 502
75 498
TOTAL 1451 859 141
aIncludes tumors with benign or uncertain behavior that involve the brain cerebral meningespituitary gland pineal gland or other intracranial sites (refer to the site codes in Appendix B)
Page 40
Endash0
APPENDIX E TABLE 14 HOSPITAL REGISTRY ACCESSIONING OF MALIGNANT AND NON-
MALIGNANT PRIMARY INTRACRANIAL AND CENTRAL NERVOUS SYSTEM TUMORS NCDB 1989-1994
TUMOR Totalb
BEHAVIOR Malignant c Nonmalignantd
Tumor Locationa HospitalsReporting
Number ()
Hospitals Reporting
Number ()
Hospitals Reporting
Number ()
Intracranial 1542 (100) 1526 (100) 900 (99)
Brain 1527 (99) 1519 (gt99) 754 (83)
Meninges 740 (48) 390 (26) 613 (67)
Pituitaryglandcraniopharyn-
geal duct
602 (39) 168 (11) 538 (59)
Pineal gland 319 (21) 277 (18) 79 (9)
Other central nervous system including cranial
nerves
648 (42) 545 (36) 299 (33)
Extracranial 812 (53) 708 (46) 410 (45)
Spinal cord 760 (49) 692 (45) 311 (34)
Spinal meninges 299 (19) 72 (5) 258 (28)
TOTAL Hospitals 1542 (100) 1526 (100) 913 (100)
Note The number of hospitals in each of the second third and fourth columns is the number that submittedreports to the NCDB for any intracranial and central nervous system tumors for the respective malignancystatus Not all hospitals submitted reports for each year during the study period (1989-1994)
aRefer to the site codes in Appendix B bBehavior codes = 0 1 3 cBehavior code = 3 dBehavior codes = 0 1
Page 41
Endash
DATA COLLECTION
OF PRIMARY
CENTRAL NERVOUS
SYSTEM TUMORS
Texas Cancer Registry
1997 CBTRUS State Survey of Benign Brain Tumor Data Collection
State Collection Status
Currently Collecting Benign Tumor Data1 Arizona Cancer Registry since 1981 2 Colorado Central Cancer Registry since 1988 3 Connecticut Tumor Registry since 1965 4 Idaho Cancer Data Registry since 1970 5 Maine Cancer Registry since 1983 6 Massachusetts Cancer Registry since 1982 7 Minnesota Cancer Surveillance System since 1988 8 Montana Central Tumor Registry since 1979 9 New York State Cancer Registry since 1988
10 North Carolina Central Cancer Registry since 1990 11 Utah Cancer Registry since 1966 12 Virginia Cancer Registry since 1994 13 Delaware State Cancer Registry14 Washington State Cancer Registry since 1992 15 passive collection 1979-1994
active collection since 1995
Stopped or Passive Collection of Benign Tumor Data1 New Jersey State Cancer Registry stopped 1979-1995 2 Kansas Cancer Registry stopped 1969-1995 3 New Hampshire State Cancer Registry stopped 1986-1991 4 District of Columbia Cancer Registry stopped 1997 5 Wyoming Cancer Surveillance Program stopped 111996 6 Louisiana Tumor Registry stopped 1992 (passive collection) 7 Illinois State Cancer Registry stopped 111996 8 Missouri Cancer Registry passive collection since 1984 9 South Carolina Central Cancer Registry passive collection since 1996
Beginning Collection of Benign Tumor Data1 North Dakota Cancer Registry began collection 1997 2 Rhode Island Cancer Registry began collection 1998
Page 42
Endash
APPENDIX E
Codes for Primary Intracranial and Central Nervous System Tumors
Note For this report the designation of ldquoprimary intracranial and central nervous system tumorsrdquo includes thefollowing primary tumors of central nervous system sites as well as tumors of the pituitary and pinealglands All histology types within the topography codes are included in the designation of ldquoprimaryintracranial and CNS tumors The source for the topography codes is Percy C Van Holten V Muir Ceds International Classification of Diseases for Oncology Second Edition Geneva World Health Organization 1990
Intracranial tumors
Brain C710 Cerebrum C711 Frontal lobe C712 Temporal lobe C713 Parietal lobe C714 Occipital lobe C715 Ventricle NOSC716 Cerebellum NOS C717 Brain stem C718 Overlapping lesion of brain C719 Brain NOS
Meninges C700 Cerebral meninges C709 Meninges NOS
a
Cranial Nerves and other intracranial parts of the central nervous systemC722 Olfactory nerve C723 Optic nerve C724 Acoustic nerve C725 Cranial nerve NOS C728 Overlapping lesion of brain and central nervous system C729 Nervous system NOS
Other endrocrine glands and related structures C751 Pituitary gland C752 Craniopharyngeal duct C753 Pineal gland
Extracranial tumors
Spinal cord C720 Spinal cord C721 Cauda equina
Meninges C701 Spinal meninges
aNOS=Not Otherwise Specified
Page 43
Endash
DATA COLLECTION
OF PRIMARY
CENTRAL NERVOUS
SYSTEM TUMORS
Brain Tumor Histology Groupings
The following histology groupings were used for the primary intracranial and central nervoussystem tumors The source for the histology groupings is Central Brain Tumor Registry ofthe United States (CBTRUS) 1996 Statistics Report Table 4
WHOa HISTOLOGY GROUPINGS ICD-Ob MORPHOLOGY CODE
Diffuse astrocytoma (protoplasma fibrillary) 9410 9420 Anaplastic astrocytoma 9401 9411 Glioblastoma 9440 9441 9442 Pilocytic astrocytoma 9421 Unique astrocytoma variants 9383 9384 9424 Oligodendroglioma 9450 Anaplastic oligodendroglioma 9451 9460 Ependymomaanaplastic ependymoma 9391 9392 9393 Ependymoma variants 9394 Mixed glioma 9382 Astrocytoma NOSc 9400 Glioma malignant NOS 9380 Choroid plexus 9390 Neuroepithelial 9381 9423 9430 Benign neuronalglial neuronal and mixed 86801 8693 9490 9505 9506 Malignant neruonalglial neuronal and mixed 86803 9364 9490 9500 Pineal parenchymal 9360 9361 9362 Embryonalprimitivemedulloblastoma 8963 9470 9471 9472
9473 9501 9502 9503 9510
TUMORS OF NEUROEPITHELIAL TISSUE
TUMORS OF CRANIAL AND SPINAL NERVES Nerve sheath benign and malignant 9540 9550 9560 9570
TUMORS OF THE MENINGES Meningioma 9530 9531 9532 9533 9534 9537 9538 Other mesenchymal benign and malignant 8800 8801 8802 8803 8810 8830 8850 88618900
8910 8990 9133 9150 9240 9480 9481 9536 9539 Hemangioblastoma 9161 9535
LYMPHOMAS AND HEMOPOIETIC NEOPLASMS Lymphoma 9590 9591 9593 9594 9595 9630 9650 9652
9663 9670 9671 9672 9674 9675 9680 9681 9682 9684 9685 9686 9687 9690 9691 96939695 9696 9698 9702 9714 9723 9731 9766 9970
GERM CELL TUMORS Germ cell 8020 9060 9064 9070 9071 9080 9084 9085 9100
CYSTS AND TUMOR-LIKE LESIONS Cysts and heterotopias 9084
TUMORS OF THE SELLAR REGION Pituitary 8040 8l40 8l46 8260 8270 8271 8280
8281 8290 8300 8330 8323 8333 Craniopharyngioma 9350
Page 44
Endash
APPENDIX E
LOCAL EXTENSIONS FROM REGIONAL TUMORS Chordomachondrosarcoma 9370
UNCLASSIFIED TUMORS Hemangioma 9120 9121 9130 9131 Neoplasm benign 80000 8010 Neoplasm uncertain behavior 80001 80011 Neoplasm malignant 80003 80013 8002 8003 All other 8720 9580
aWHO = World Health OrganizationbICD-O = International Classification of Diseases for Oncology Second Edition 1990 cNOS=Not Otherwise Specified
Page 45
Endash
DATA COLLECTION
OF PRIMARY
CENTRAL NERVOUS
SYSTEM TUMORS
Endash
International Classification of Childhood Cancer (ICCC)
Diagnostic Group
ICD-Oa codes
Morphology Topography
I LEUKAEMIA
(a) Lymphoid leukaemia 9820-9827 9850
(b) Acute non-lymphocytic leukaemia 9840 9841 9861 9864 9866 9867 98919894 9910
(c) Chronic myeloid leukaemia 9863 9868
(d) Other specified leukaemias 9830 9842 9860 9862 9870-9890 9892 98939900 9930-9941
(e) Unspecified leukaemias 9800-9804
II LYMPHOMAS AND OTHER RETICULOENDOTHELIAL NEOPLASMS
(a) Hodgkinrsquos disease 9650-9667
(b) Non-Hodgkinrsquos lymphoma 9591-9595 9670-9686 9690-9714 9723
(c) Burkittrsquos lymphoma 9687
(d) Miscellaneous lymphoreticular neoplasms 9720 9731-9764
(e) Unspecified lymphomas 9590
III CENTRAL NERVOUS SYSTEM (CNS) ANDMISCELLANEOUS INTRACRANIAL AND
INTRASPINAL NEOPLASMSb
(a) Ependymomac 9383 9390-9394
(b) Astrocytoma 9380 C723
9381 9400-9441
(c) Primitive neuroectodermal tumours 9470-9473
(d) Other gliomasd 9380 C700-C722C724-C729
9382 9384
9442-9460 9481
APPENDIX E
Diagnostic Group
ICD-Oa codes
Morphology Topogragphy
III CNS AND MISCELLANEOUS INTRACRANIAL AND INTRASPINAL
NEOPLASMSb Continued
(e) Miscellaneous intracranial and intraspinalneoplasmsc
8270-8281 8300 9350-9362 9480 95059530-9539
(f) Unspecified intracranial and intraspinalneoplasmsc
8000-8004 C700-C729C751-C753
IV SYMPATHETIC NERVOUS SYSTEM TUMOURS
(a) Neuroblastoma and ganglioneuroblastoma 9490 9500
(b) Other sympathetic nervous system tumours 8680 8693-8710 9501-9504 9520-9523
aInternational Classification of Diseases for Oncology Second Edition World Health Organization 1990bGroup III excludes all lymphomas See group II cBehaviour codes 0 and 1 are included dBehaviour code 1 is included
Page 47
Endash
Comments and recommendations are welcome Should questions arise on how to use these
materials or for more information please contact
Centers for Disease Control and Prevention National Program of Cancer Registries
4770 Buford Hwy NE Mail Stop K-53
Atlanta GA 30042-3717
Voice Information System 1 (888) 842-6355 bull Fax (770) 488-4760
cancerinfocdcgov bull httpwwwcdcgovcancer
All materials are in the public domain and may be reproduced or copied without permission citation
to source however is appreciated
BACK COVER
(WHITE)
Spine(WHITE)
DATA COLLECTION OF PRIMARY CEN
TRAL NERVOUS SYSTEM
TUM
ORS 2004
National Program of Cancer Registries Training M
aterials

DATA COLLECTION
OF PRIMARY
CENTRAL NERVOUS
SYSTEM TUMORS
Endash
An alternative approach to sampling and the least troublesome would be to conduct
population-based surveillance only in certain geographic areas of the country If one assumes that
the etiology of brain tumors does not differ from one area of the country to another then the
scientific validity of studies based on this type of sampling would not be a problem However
given the rarity of some types of brain tumors sufficient numbers for study may not be available
unless the vast majority of the nations population were covered by population-based data
collection Also geographic areas without population-based surveillance would have no data to
use for assessing local trends or variations in brain tumor occurrence
In the absence of standard tumor registration procedures and training special case finding
efforts by central registries may be necessary to ensure that complete data are collected for
nonmalignant intracranial and CNS tumors Data from MCSS (Table 10) which has a legal
requirement for reporting nonmalignant intracranial tumors and performs 100 percent case finding
audits in all laboratories indicate that only 80 percent of nonmalignant tumors were routinely
reported In contrast routine reporting accounted for more than 95 percent of malignant
intracranial and CNS tumors Nonmalignant cases in Minnesota that were not accessioned by
hospital registries had a 50 percent chance of being routinely reported to the central registry
however these were only microscopically confirmed cases
Completeness of reporting is critical to cancer registries Accurate case counts are
necessary to assess the burden of cancer to guide cancer control program planning to prioritize
the allocation of health resources and to facilitate epidemiologic research Most central cancer
registries have state laws that mandate reporting of cases by physicians and by hospitals
laboratories and other facilities that provide screening diagnostic or therapeutic services
Complete reporting of nonmalignant intracranial and CNS tumors would be greatly
improved if reporting requirements of the COC central cancer registries SEER and the
National Program of Cancer Registries (NPCR) were changed to require the collection of
information for these tumors However this requirement would have many implications
including an increase in work load as well as associated costs for reporting facilities An estimated
14 percent of all new cancer cases diagnosed in 1998 will involve invasive brain and other
nervous system tumors7 since the numbers of benign and invasive brain and other CNS tumors
Page 22
Endash
APPENDIX E diagnosed annually are similar facilities that presently do not accession nonmalignant cases could
expect an approximately 14 percent increase in the total number of CNS cases collected by the
registry Some estimates of the percentage of brain tumors have been lower (05 percent)36 and
others have been higher (9 percent)37 therefore the extent to which the workload would be
affected may vary The data in this report suggest that if reporting of nonmalignant intracranial
and CNS tumors were required the total number of cases of tumors for these anatomic sites
would double for facilities that presently report only malignant tumors This is consistent with the
findings of Davis et al36 who reported that the incorporation of benign brain tumors into the
cancer-reporting systems of four central registries increased the overall incidence of brain cancer
by 49 percent Forty percent (913) of the hospital registries that submitted data to the NCDB did
not report nonmalignant brain tumors These registries could expect up to a 50 percent increase in
the number of intracranial and CNS tumors reported nonregistry facilities which represent
approximately 20 percent of cases reported to central cancer registries could expect a similar
increase Also central cancer registries that currently do not require reporting of nonmalignant
intracranial and CNS tumors could expect increases in their workloads as a result of the
additional time spent on processing and quality control procedures and training The lack of
standard definitions and collection and reporting guidelines would make these tasks more time-
consuming as well
For some central cancer registries that want to expand their reporting requirements to
include nonmalignant intracranial and CNS tumors a change in current legislation andor
regulations may be needed These changes could involve several months of lead time if public
hearings or other legal procedures are necessary In other states the reporting of these tumors is
not required in either their legislation or regulations in these situations hospitals have been asked
to voluntarily report the cases For example in Massachusetts the reporting of benign brain
tumors is not required by law but hospitals have been reporting these cases since 1982 However
the completeness of data reported on a voluntary basis is difficult to assess For public health
surveillance systems a mandate to report is the basic requirement of a comprehensive higher
quality system
DATA COLLECTION
OF PRIMARY
CENTRAL NERVOUS
SYSTEM TUMORS
If COC SEER NPCR and central cancer registries changed their reporting requirements
to include nonmalignant intracranial and CNS tumors the registry manuals disseminated by these
programs and registries would also need to be modified to include new definitions of reportable
diagnoses All reporting facilities would have to be notified of the new requirements To ensure
complete reporting from registries additional training of registrars should be expected Case
finding methods may need to be modified in order to identify the new cases and sources of
information Central cancer registries would also need to increase their case finding audits The
inclusion of nonmalignant tumors would also necessitate changes to other data items such as
sequence number Hospital and central cancer registries would need to consider adding WHO
brain tumor grade as an additional data item
Finally the software used by reporting facilities and by central registries would need to be
modified to accept nonmalignant morphology and behavior codes Also edits programs would
need to be modified to include these additions and to accept a nonmalignant sequence numbering
procedure
Before reporting requirements for primary intracranial and CNS tumors could be changed
feasibility studies would have to be conducted to determine whether such changes should be
recommended Two SEER special studies are under way to evaluate the impact of requiring the
collection of benign brain tumors on case finding cost quality control and training However
additional studies may be required
Page 24
Endash
APPENDIX E
RECOMMENDATIONS OF THE BRAIN TUMOR WORKING GROUP
1 We recommend the following standard definition for collecting precise data for all primary
intracranial and central nervous system tumors
Primary intracranial and central nervous (CNS) tumors are primary tumors occurring in
the following sites irrespective of histologic type or behavior brain meninges spinal
cord cauda equina cranial nerves and other parts of the CNS pituitary gland pineal
gland and craniopharyngeal duct (see Appendix B)
2 We recommend the development of a standard site and histology definition for tabulating
estimates of these tumors to allow comparability of information across registries Pathologists
the North American Association of Central Cancer Registries (NAACCR) the Commission
on Cancer (COC) the Surveillance Epidemiology and End Results (SEER) Program the
National Program of Cancer Registries (NPCR) and the International Agency for Research
on Cancer (IARC) need to be involved in developing this standard
3 We recommend collection of data for primary intracranial and extracranial CNS tumors by all
registries hospital- and central-based This effort will necessitate a change in the COC
requirements and will increase costs to the hospital-based programs Federal funding should be
allocated to supplement the additional transition and ongoing data collections costs that will be
incurred by central registries Before additional data collection is implemented we recommend
a pilot study should be conducted to assess the procedures and quality control functions
needed as well as the costs of collecting data for these tumors
4 We recommend that the appropriate government and professional organizations be involved in
carrying out the development and implementation of special training programs and curricula for
central registry hospital registry and laboratory personnel as well as the development of
computerized edit-checking procedures Training for reporting and tabulating primary
intracranial and CNS tumors should be offered on a regular basis
Page 25
Endash
DATA COLLECTION
OF PRIMARY
CENTRAL NERVOUS
SYSTEM TUMORS
Endash
REFERENCES
1 Davis F Preston-Martin S Epidemiology of brain tumors In Bigner DD McLendon RE Bruner JM eds Russell and Rubinsteins pathology of tumors of the nervous system ed 6 London Arnold Publishing 19965-45
2 World Health Organization (WHO) (1976) International classification of diseases foroncology ed 1 Geneva World Health Organization
3 World Health Organization (WHO) (1990) International classification of diseases foroncology ed 2 Geneva World Health Organization
4 Kleihues P Burger PC Scheithauer BW The new WHO classification of brain tumorsBrain Pathol 19933255-268
5 Thapar K Laws ER Tumors of the central nervous system In Murphy GP Lawrence WJr Lenhard RE Jr eds Textbook of clinical oncology ed 2 Atlanta American CancerSociety 1995378-410
6 Walker AE Robins M Weinfield FD Epidemiology of brain tumors the national survey ofintracranial neoplasms Neurol 198535219-226
7 Ries LAG Kosary CL Hankey BF Miller BA Edwards BK (eds) SEER Cancer StatisticsReview 1973-1995 National Cancer Institute Bethesda MD 1998
8 Cancer Facts amp Figures - 1998 American Cancer Society Atlanta Georgia 19989 Davis FG Bruner JM Surawicz TS The rationale for standardized registration and reporting
of brain and central nervous system tumors in population-based cancer registriesNeuroepidemiol 199716308-316
10CBTRUS (1996) First annual report 1995 Central Brain Tumor Registry of the UnitedStates Chicago Illinois
11 Preston-Martin S Epidemiology of primary CNS neoplasms Neurol Clinics 199614273-290
12 Greig NH Ries LG Yancik R Rapoport SI Increasing annual incidence of primary malignantbrain tumors in the elderly J Natl Cancer Inst 1991 831621-1624
13 Mao Y Desmeules M Semenciw RM Hill G Gaudette L Wigle DT Increasing brain cancerrates in Canada Can Med Assoc J 19911451583-1591
14 Frelick R Huang P Topham A Brain and central nervous system tumors Delaware 1980 to1989 Del Med J 199264571-573
15 Davis DL Ahlbom A Hoel D Percy C Is brain cancer mortality increasing in industrialcountries Am J Ind Med 199119421-431
16 Helseth A Increasing incidence of primary central nervous system tumors in the elderly Realincrease or improved detection J Natl Cancer Inst 1993851871-1872
17 Modan B Wagener D Feldman JJ Rosenberg HM Feinleib M Increased mortality frombrain tumors A combined outcome of diagnostic technology and change of attitude towardthe elderly Am J Epidemiol 19921351349-1357
18 Polednak AP Time trends in the incidence of brain and central nervous system cancers inConnecticut J Natl Cancer Inst 1991831679-1681
19 Boyle P Maissonneuve P Saracci R Muir CS Is the increase in incidence of primarymalignant brain tumors real J Natl Cancer Inst 1990201594-1596
Page 26
APPENDIX E 20 Preston-Martin S Descriptive epidemiology of primary tumors of the brain cranial nerves
and spinal meninges in Los Angeles County Neuroepidemiol 19898283-29521 Helseth A Mork SJ Neoplasms of the central nervous system in Norway Epidemiological
characteristics of intracranial gliomas according to histology APMIS 97 1989547-55522 Gurney JG Davis S Severson RK Fang J-Y Ross JA Robison LL Trends in cancer
incidence among children in the United States Cancer 199678532-54123 Gurney JG Ross JA Wall DA Bleyer WA Severson RK Robison LL Infant cancer in the
US histology-specific incidence trends 1973-1992 J Pediatr Hem Onc 199719428-43224 Nishio S Takeshita I Morioka T Fukui M Primary intracranial squamous cell carcinomas
report of two cases Neurosurgery 199537329-33225 Freilich RJ Thompson SJ Walker RW Rosenblum MK Adenocarcinomatous transformation
of intracranial germ cell tumors Am J Surg Pathol 199519537-54426Yuan S Miller DW Barnett GH Hahn JF Williams BR Identification and characterization of
human beta 2-chimaerin association with malignant transformation in astrocytoma CancerResearch 1995 553456-3461
27 Preston-Martin S Mack WJ Neoplasms of the nervous system In Schoenfeld D Fraumeni JFJr eds Cancer epidemiology and prevention ed 2 New York Oxford University Press19961231-1281
28 Riggs JE Rising primary malignant brain tumor mortality in the elderly A manifestation ofdifferential survival Arch of Neurol 199552571-575
29 Davis FG Freels S Grutsch J Barlas S Brem S Survival rates in patients with primarymalignant brain tumors stratified by patient age and tumor histological type an analysisbased on Surveillance Epidemiology and End Results (SEER) data 1973-1991J Neurosurg 1998881-10
30 Surawicz TS Davis F Freels S Laws ER Menck HR Brain tumor survival results from theNational Cancer Data Base (Accepted for publication in J Neuro-Oncol)
31 Bondy ML Lustbader ED Buffler PA Schull WJ Hardy RJ Strong LC Geneticepidemiology of childhood brain tumors Genet Epidemiol 19918253-267
32 Preston-Martin S Monroe K Lee P Bernstein L Kelsey J Henderson S Forrester DHenderson B Spinal meningiomas in women in Los Angeles County Investigation of anetiologic hypothesis Cancer Epidemiol Biomarkers Prev 19954333-339
33 Davis JR Brownson RC Garcia R Bentz BJ Turner A Family pesticide use and childhoodbrain cancer Arch Environ Contam Toxicol 19932487-92
34 Commission on Cancer General principles and coding In Standards of the Commission on Cancer vol II Registry Operations and Data Standards American College of SurgeonsChicago Illinois 1996
35 Central Brain Tumor Registry of the United States (CBTRUS) 1997 State Survey of BenignBrain Tumor Collection Chicago Illinois 1997
36 Davis FG Malinski N Haenszel W Chang J Flannery J Gershman S Dibble R Bigner DDPrimary brain tumor incidence rates in the four United States regions 1985-1989 A pilotstudy Neuroepidemiol 199615103-112
37 Schoenberg BS Christine BW Whisnant JP The descriptive epidemiology of primaryintracranial neoplasms the Connecticut experience Am J Epidemiol 1976104499-510
Page 27
Endash
DATA COLLECTION
OF PRIMARY
CENTRAL NERVOUS
SYSTEM TUMORS
TAB
LE 1
C
OM
PAR
ISO
N O
F R
EGIS
TRIE
S SU
PPLY
ING
DA
TA O
N P
RIM
AR
Y I
NTR
AC
RA
NIA
L A
ND
CEN
TRA
L N
ERV
OU
S SY
STEM
TU
MO
RS
IN T
HE
UN
ITED
STA
TES
Cen
tral B
rain
Tum
or R
egis
try o
fth
e U
nite
d St
ates
(CBT
RUS)
Min
neso
ta C
ance
rSu
rvei
llanc
e Sy
stem
(MC
SS)
ACo
SN
a tio
nal C
ance
r Dat
a B
ase
(NCD
B)
Surv
eilla
nce
Epid
emio
logy
and
End
Res
ults
Pro
gram
(SEE
R)
Purp
ose
ldquoCB
TRU
S ce
ntra
lizes
pop
ulat
ion-
base
d in
cide
nce
data
on
all b
rain
tum
ors a
nd u
ses o
ther
exi
stin
gda
ta re
sour
ces t
o ch
arac
teriz
e th
ein
cide
nce
mor
talit
y a
nd su
rviv
alof
pat
ient
s with
bra
in tu
mor
s rdquo
The
MC
SS c
olle
cts i
nfor
mat
ion
onal
l can
cers
dia
gnos
ed si
nce
1988
amon
g M
inne
sota
resi
dent
s Th
e M
CSS
is p
opul
atio
n-ba
sed
path
olog
y-ba
sed
and
is a
n ac
tive
syste
m
ldquoThe
goa
l of t
he N
CD
B is
to p
rese
nt a
n an
nual
sum
mar
y of
pat
ient
car
e fo
r cas
es o
f can
cer
diag
nose
d an
d tre
ated
at h
ospi
tals
thro
ugho
utth
e co
untry
rdquo
ldquoA c
ontin
uing
pro
ject
of th
e N
CI
the
SEER
prog
ram
col
lect
sca
ncer
dat
a on
aro
utin
e ba
sis f
rom
desi
gnat
ed p
opul
atio
n-ba
sed
canc
er re
gist
ries
in v
ario
us a
reas
of t
heco
untry
Targ
et p
opul
atio
n Th
e po
pula
tions
cov
ered
by
regi
strie
s in
Ari
zona
Col
orad
oC
onne
ctic
ut D
elaw
are
Idah
oM
aine
Mas
sach
uset
ts
Min
neso
ta M
issou
ri M
onta
na
Nor
th C
arol
ina
and
Uta
h
The
CB
TRU
S po
pula
tion
repr
esen
ts a
non
rand
om 1
5pe
rcen
t sam
ple
of th
e U
S
popu
latio
n
The
popu
latio
n of
Min
neso
ta
The
popu
latio
ns tr
eate
d at
par
ticip
atin
gho
spita
ls in
the
50 st
ates
the
Dist
rict
of
Col
umbi
a a
nd P
uert
o R
ico
NC
DB
is n
ot a
pop
ulat
ion-
base
d re
gist
ry
At
pres
ent
it is
est
imat
ed to
cov
er a
ppro
xim
atel
y57
per
cent
of t
otal
cas
es n
atio
nwid
e
The
popu
latio
nsco
vere
d by
the
state
regi
strie
s in
Con
nect
icut
Haw
aii
Iow
a N
ew M
exic
o
and
Uta
h a
s wel
l as
the
regi
onal
regi
strie
sin
Atla
nta
Geo
rgia
D
etro
it M
ichi
gan
San
Fran
cisc
o-O
akla
nd C
alifo
rnia
an
d Se
attle
-Pug
etSo
und
Was
hing
ton
The
SEER
pop
ulat
ion
repr
esen
ts a
nonr
ando
m 1
4 pe
rcen
tsa
mpl
e of
the
US
po
pula
tion
Page
28
Endash
APPENDIX E
Cen
tral B
rain
Tum
or R
egis
try o
fth
e U
nite
d St
ates
(CBT
RUS)
Min
neso
ta C
ance
rSu
rvei
llanc
e Sy
stem
(MC
SS)
ACo
SN
a tio
nal C
ance
r Dat
a B
ase
(NCD
B)
Surv
eilla
nce
Epid
emio
logy
and
End
Res
ults
Pro
gram
(SEE
R)
Type
of
prim
ary
intra
cran
ial
and
cent
ral n
ervo
us sy
stem
tum
ors r
epor
ted
Dat
a on
new
ly-d
iagn
osed
cas
es o
fbe
nign
and
mal
igna
nt p
rimar
ybr
ain
tum
ors b
ased
on
ICD
-Oco
des
Dat
a on
new
ly-d
iagn
osed
m
i cro
scop
ical
ly-c
onfir
med
tum
ors
of th
e ce
ntra
l ner
vous
syste
m
incl
udin
g pi
tuita
ry a
nd p
inea
lgl
ands
Hos
pita
ls v
olun
taril
y su
bmit
full
anal
ytic
canc
er re
gist
ry c
asel
oads
with
dat
a ite
ms a
ndco
des d
efin
ed b
y th
e C
omm
issio
n on
Can
cer
(CO
C) f
or h
ospi
tal c
ance
r reg
istri
es
Mos
tpa
rtici
patin
g ho
spita
ls h
ave
prog
ram
sap
prov
ed b
y C
OC
or a
re e
stab
lishi
ng p
rogr
amap
prov
al
NC
DB
cal
ls fo
r dat
a do
not
lim
itca
ses b
y m
alig
nant
beh
avio
r bu
t acc
essi
onin
gof
non
-mal
igna
nt c
ases
is n
ot re
quire
d fo
rpr
ogra
m a
ppro
val
Fifty
-nin
e pe
rcen
t of t
heho
spita
ls th
at su
bmitt
ed a
ny in
tracr
ania
lCN
Sca
ses d
iagn
osed
dur
ing
1989
-199
4 su
bmitt
edat
leas
t one
non
mal
igna
nt c
ase
The
NC
DB
data
in th
is re
port
are
limite
d to
the
case
ssu
bmitt
ed b
y th
ese
hosp
itals
(82
perc
ent o
f all
intra
cran
ial a
nd e
xtra
cran
ial c
entra
l ner
vous
syste
m c
ases
on
file)
Tren
ds in
the
inci
denc
e m
orta
lity
and
patie
nt su
rviv
al o
fbr
ain
tum
ors i
n th
eU
S H
owev
er S
EER
does
not
col
lect
info
rmat
ion
on b
enig
nan
d un
certa
in b
rain
tum
ors
Oth
er c
omm
ents
D
uplic
ate
canc
er re
gist
ratio
ns c
anno
t be
iden
tifie
d by
the
parti
cipa
ting
regi
strie
s
The
MC
SS p
erfo
rms 1
00 p
erce
ntca
se fi
ndin
g au
dits
in a
ll pa
thol
ogy
labo
rato
ries o
n an
ann
ual b
asis
Th
eref
ore
the
data
from
the
MC
SSm
ight
be
cons
ider
ed a
ldquobe
st-ca
sesc
enar
iordquo
in te
rms o
f com
plet
enes
sof
repo
rting
for m
icro
scop
ical
ly-
conf
irmed
tum
ors
Rep
ort d
uplic
atio
n fo
r 198
9-19
94 in
tracr
ania
lan
d ex
tracr
ania
l cen
tral n
ervo
us sy
stem
repo
rts w
as 6
7 p
erce
nt
How
ever
the
NC
DB
data
in T
able
s 2 th
roug
h 9
are
base
d on
undu
plic
ated
repo
rts
Page
29
Endash
DATA COLLECTION
OF PRIMARY
CENTRAL NERVOUS
SYSTEM TUMORS
TABLE 2 NUMBER AND PERCENT OF PRIMARY INTRACRANIAL AND CENTRAL NERVOUS SYSTEM TUMORS BY TUMOR LOCATION
Locationa CBTRUSb
Number () MCSSc
Number () NCDBd
Number () SEERe
Number ()
Intracranial 13084 (947) 3600 (936) 66322 (955) 10196 (969)
Brain 7999 (579) 1924 (500) 48527 (699) 9721 (924)
Meninges 2719 (197) 838 (218) 9365 (135) 139 (13)
Pituitarycraniopharygealduct
1491 (108) 530 (138) 4958 (71) 30 (03)
Pineal 74 (05) 21 (05) 477 (07) 80 (08)
Other central nervous systemincluding cranial nerves
801 (58) 287 (75) 2995 (43) 226 (22)
Extracranial 730 (53) 245 (64) 3137 (45) 322 (31)
Spinal cord 497 (36) 47 (38) 2395 (34) 313 (30)
Spinal meninges 233 (17) 98 (25) 742 (11) 9 (01)
TOTAL 13814 (100) 3845 (100) 69459 (100) 10518 (100)
Note Reported data are incident cases from 1989-1994 except for CBTRUS data which are from 1990-1993
aRefer to the sites in Appendix BbCentral Brain Tumor Registry of the United States cMinnesota Cancer Surveillance System (microscopically confirmed cases only)dNational Cancer Data Base (limited to cases reported by hospitals that accessioned nonmalignant cases) eSurvival Epidemiology and End results Program (malignant cases only)
Page 30
Endash0
TABL
E 3
RO
W P
ERCE
NT
DIS
TRIB
UTI
ON
OF
PRIM
ARY
INTR
ACR
AN
IAL
AN
D C
ENTR
AL
NER
VO
US
SYST
EM T
UM
ORS
BY
TU
MO
R B
EHA
VIO
RA
ND
MIC
ROSC
OPI
C C
ON
FIRM
ATI
ON
Loca
tiona
CB
TRU
Sb M
CSSc
NC
DB
d SE
ERe
Tota
l Pe
rcen
tM
icro
Co
nfirm
ed
Perc
ent
Not
Mic
ro
Conf
irmed
Tota
l Pe
rcen
tM
icro
Co
nfirm
ed
Perc
ent
Not
Mic
ro
Conf
irmed
Tota
l Pe
rcen
tM
icro
Co
nfirm
ed
Perc
ent
Not
Mic
ro
Conf
irmed
Tota
l Pe
rcen
tM
icro
Co
nfirm
ed
Perc
ent
Not
Mic
ro
Conf
irmed
Intra
cran
ial
130
84
867
13
3
360
0 10
0 N
A
663
22
887
11
3
101
96
871
12
9
Mal
igna
nt
717
1 89
2
108
1
824
100
NA
44
801
91
3
87
101
96
871
12
9
Beni
gn a
ndu n
certa
in
591
3 83
5
165
1
776
100
NA
21
521
83
2
168
N
A
NA
N
A
Bra
in
799
9 88
2
118
1
924
100
NA
48
527
90
2
98
972
1 87
3
127
Mal
igna
nt
686
2 89
6
104
1
746
100
NA
42
622
91
5
85
972
1 87
3
127
Beni
gnan
dun
certa
in
113
7 80
6
194
17
8 10
0 N
A
590
5 80
6
194
N
A
NA
N
A
Extra
cran
ial
730
962
3
8 24
5 10
0 N
A
313
7 96
0
40
322
957
4
3
Mal
igna
nt
242
934
6
6 60
10
0 N
A
148
3 96
6
34
322
957
4
3
Beni
gn a
ndu n
certa
in
488
975
2
5 18
5 10
0 N
A
165
4 95
5
45
NA
N
A
NA
TOTA
Lf 13
814
87
2
128
3
845
100
NA
69
459
89
0
110
10
518
87
4
126
Mal
igna
nt
741
3 89
4
106
1
884
100
NA
46
284
91
5
85
105
18
874
12
6
Beni
gn a
ndu n
certa
in
640
1 84
6
154
1
961
100
NA
23
175
84
1
159
N
A
NA
N
A
Not
e R
epor
ted
data
are
inci
dent
cas
es fr
om 1
989-
1994
exc
ept f
or C
BTR
US
data
whi
ch a
re fr
om 1
990-
1993
a Refe
r to
the
site
code
s in
App
endi
x B
b Cent
ral B
rain
Tum
or R
egist
ry o
f the
Uni
ted
Stat
es
c Min
neso
ta C
ance
r Sur
veill
ance
Sys
tem
(mic
rosc
opic
ally
con
firm
ed c
ases
onl
y)
d Nat
iona
l Can
cer D
ata
Base
(lim
ited
to c
ases
repo
rted
by h
ospi
tals
that
acc
essio
ned
nonm
alig
nant
cas
es)
e Surv
eilla
nce
Epi
dem
iolo
gy a
nd E
nd R
esul
ts Pr
ogra
m (m
alig
nant
cas
es o
nly)
f In
clud
es in
tracr
ania
l and
ext
racr
ania
l cas
es
NA
= N
ot a
pplic
able
Page
31
APPENDIX E
Endash
DATA COLLECTION
OF PRIMARY
CENTRAL NERVOUS
SYSTEM TUMORS
TABLE 4 NUMBER AND PERCENT OF PRIMARY INTRACRANIAL AND CENTRAL NERVOUS SYSTEM TUMORS BY DIAGNOSTIC CONFIRMATION
DiagnosticConfirmation
CBTRUSa
Number () MCSSb
Number () NCDBc
Number () SEERd
Number ()
Positive microscopy
12087 (875) 3845 (100) 61818 (890) 9188 (874)
Radiographywithout microscopy
1306 (95) NA 6759 (97) 1015 (97)
Clinical 204 (15) NA 484 (07) 98 (09)
Unknown 217 (15) NA 398 (06) 217 (21)
TOTAL 13814 (100) 3845 (100) 69459 (100) 10518 (100)
Note Reported data are incident cases from 1989-1994 except for CBTRUS data which are from 1990-1993
aCentral Brain Tumor Registry of the United Statesb Minnesota Cancer Surveillance System (microscopically confirmed cases only) cNational Cancer Data Base (limited to cases reported by hospitals that accessioned nonmalignant cases)dSurveillance Epidemiology and End Results Program (malignant cases only)NA = Not applicable
Page 32
Endash
Page 32
TABLE 4 NUMBER AND PERCENT OF PRIMARY INTRACRANIAL AND CENTRALNERVOUS SYSTEM TUMORS BY DIAGNOSTIC CONFIRMATION
DiagnosticConfirmation
CBTRUSa
Number ()MCSSb
Number ()NCDBc
Number ()SEERd
Number ()
Positivemicroscopy
12087 (875) 3845 (100) 61818 (890) 9188 (874)
Radiographywithout microscopy
1306 (95) NA 6759 (97) 1015 (97)
Clinical 204 (15) NA 484 (07) 98 (09)
Unknown 217 (15) NA 398 (06) 217 (21)
TOTAL 13814 (100) 3845 (100) 69459 (100) 10518 (100)
Note Reported data are incident cases from 1989-1994 except for CBTRUS data which are from 1990-1993
aCentral Brain Tumor Registry of the United Statesb Minnesota Cancer Surveillance System (microscopically confirmed cases only)cNational Cancer Data Base (limited to cases reported by hospitals that accessioned nonmalignant cases)dSurveillance Epidemiology and End Results Program (malignant cases only)NA = Not applicable
APPENDIX E
TABLE 5 NUMBER AND PERCENT OF MALIGNANT PRIMARY INTRACRANIAL AND CENTRAL SYSTEM TUMORS BY TUMOR LOCATION
Locationa CBTRUSb
Number () MCSSc
Number () NCDBd
Number () SEERe
Number ()
Intracranial 7171 (977) 1824 (968) 44801 (968) 10196 (969)
Brain 6862 (926) 1746 (927) 42622 (921) 9721 (924)
Meninges 98 (13) 23 (12) 581 (13) 139 (13)
Pituitarycraniopharyngealduct
37 (05) 13 (07) 189 (04) 30 (03)
Pineal 58 (08) 20 (11) 378 (08) 80 (08)
Other central nervous systemincluding cranial nerves
116 (16) 22 (12) 1031 (22) 226 (21)
Extracranial 242 (33) 60 (32) 1483 (32) 322 (31)
Spinal cord 234 (32) 60 (32) 1410 (30) 313 (30)
Spinal meninges 8 (01) 0 73 (02) 9 (01)
TOTAL 7413 (100) 1884 (100) 46284 (100) 10518 (100)
Note Reported data are incident cases from 1989-1994 except for CBTRUS data which are from 1990-1993
aRefer to the site codes in Appendix BbCentral Brain Tumor Registry of the United States cMinnesota Cancer Surveillance System (microscopically confirmed cases only)dNational Cancer Data Base (limited to cases reported by hospitals that accessioned nonmalignant cases) eSurvival Epidemiology and End Results Program (malignant cases only)
Page 33
Endash
DATA COLLECTION
OF PRIMARY
CENTRAL NERVOUS
SYSTEM TUMORS
TABLE 6 NUMBER AND PERCENT OF PRIMARY INTRACRANIAL AND CENTRAL NERVOUS SYSTEM TUMORS OF BENIGN AND UNCERTAIN BEHAVIOR BY TUMOR LOCATION
Locationa CBTRUSb
Number () MCSSc
Number () NCDBd
Number () SEERe
Number ()
Intracranial 5913 (924) 1776 (906) 21521 (929) NA
Brain 1137 (178) 178 (91) 5905 (255) NA
Meninges 2621 (409) 815 (416) 8784 (379) NA
Pituitarycraniopharyngealduct
1454 (227) 517 (264) 4769 (206) NA
Pineal 16 (02) 1 (lt01) 99 (04) NA
Other central nervous systemincluding cranial nerves
685 (107) 265 (135) 1964 (85) NA
Extracranial 488 (76) 185 (94) 1654 (71) NA
Spinal cord 263 (41) 87 (44) 985 (42) NA
Spinal meninges 225 (35) 98 (50) 669 (29) NA
TOTAL 6401 (100) 1961 (100) 23175 (100) NA
Note Reported data are incident cases from 1989-1994 except for CBTRUS data which are from 1990-1993
aRefer to the site codes in Appendix BbCentral Brain Tumor Registry of the United States cMinnesota Cancer Surveillance System (microscopically confirmed cases only)dNational Cancer Data Base (limited to cases reported by hospitals that accessioned nonmalignant cases) eSurveillance Epidemiology and End Results Program (malignant cases only)NA = Not applicable
Page 34
Endash
APPENDIX E TABLE 7 NUMBER AND PERCENT OF PRIMARY INTRACRANIAL AND CENTRAL
NERVOUS SYSTEM TUMORS BY TUMOR BEHAVIOR AND LOCATION
BehaviorTumor Locationa
CBTRUSb
Number () MCSSc
Number () NCDBd
Number () SEERe
Number ()
Malignant 7413 (537) 1884 (490) 46284 (666) 10518 (100)
Brain 6862 (497) 1746 (454) 42622 (614) 9721 (924)
Meninges 98 (07) 23 (06) 581 (08) 139 (13)
Pituitarycraniopharyn-geal ductpineal
95 (07) 33 (09) 567 (08) 110 (11)
Other central nervous system includingcranial nerves
116 (08) 22 (06) 1031 (15) 226 (22)
Spinal cord 242 (18) 60 (16) 1483 (21) 322 (31)
Benign 5794 (419) 1787 (465) 20694 (298) NA
Brain 803 (58) 99 (26) 4491 (65) NA
Meninges 2565 (186) 807 (210) 8613 (124) NA
Pituitarycraniopharyn-geal ductpineal
1322 (96) 458 (119) 4330 (62) NA
Other central nervous system includingcranial nerves
678 (49) 263 (68) 1911 (28) NA
Spinal cord 426 (31) 160 (42) 1349 (19) NA
Uncertain 607 (44) 174 (45) 2481 (36) NA
Brain 334 (24) 79 (21) 1414 (20) NA
Meninges 56 (04) 8 (02) 171 (02) NA
Pituitarycraniopharyn-geal ductpineal
148 (11) 60 (16) 538 (08) NA
Other central nervous system includingcranial nerves
7 (01) 2 (01) 53 (01) NA
Spinal cord 62 (05) 25 (07) 305 (04) NA
TOTAL 13814 (100) 3845 (100) 69459 (100) 10518 (100)
Note Reported data are incident cases from 1989-1994 except for CBTRUS data which are from 1990-1993 NA=Not applicableaRefer to the site codes in Appendix B bCentral Brain Tumor Registry of the United States cMinnesota Cancer Surveillance System (microscopically confirmed cases only)dNational Cancer Data Base (limited to cases reported byhospitals that accessioned nonmalignant cases eSurvival Epidemiology and End Results Program (malignant cases only)
Page 35
Endash
DATA COLLECTION
OF PRIMARY
CENTRAL NERVOUS
SYSTEM TUMORS
TABLE 8 NUMBER AND PERCENT OF MALIGNANT PRIMARY INTRACRANIAL AND
CENTRAL NERVOUS SYSTEM TUMORS BY HISTOLOGY GROUPINGS
WHO Histologya
Groupings CBTRUSb
Number () MCSSc
Number () NCDBd
Number () SEERe
Number ()
Neuroepithelial 6477 (874) 1689 (896) 39701 (858) 8676 (825)
Tumors of cranial and spinal nerves
12 (02) 3 (02) 108 (02) 25 (02)
Tumors of meninges
137 (18) 25 (13) 994 (21) 194 (18)
LymphomasHemopoietic
473 (64) 121 (64) 3492 (75) 1099 (105)
Germ cell 70 (09) 20 (11) 403 (09) 97 (09)
Cysts and tumor-like lesions
0 0 0 0
Tumors of sellar region
20 (03) 11 (06) 100 (02) 6 (01)
Local extensions 29 (04) 11 (06) 166 (04) 38 (04)
Unclassifiedunassigned tumorsf
195 (26) 4 (02) 1320 (29) 383 (36)
TOTAL 7413 (100) 1884 (100) 46284 (100) 10518 (100)
Note Reported data are incident cases from 1989-1994 except for CBTRUS data which are from 1990-1993
aRefer to the World Health Organization (WHO) histology groupings in Appendix CbCentral Brain Tumor Registry of the United States cMinnesota Cancer Surveillance System (microscopically confirmed cases only)dNational Cancer Data Base (limited to cases reported by hospitals that accessioned nonmalignant cases) f For MCSS unclassifiedunassigned tumors include one malignant and four nonmalignant histologies which were
not listed in the CBTRUS classification scheme For NCDB unclassifiedunassigned tumors include 319 cases(less than one half percent) which had histologies not assigned by CBTRUS to any other category For SEERunclassifiedunassigned tumors include all malignant histologies occurring in the brainCNS which could not beclassified in one of the above categories based on their 4-digit histologic type
Page 36
Endash
APPENDIX E
TABLE 9 NUMBER AND PERCENT OF PRIMARY INTRACRANIAL AND CENTRAL NERVOUS SYSTEM TUMORS OF BENIGN AND UNCERTAIN BEHAVIOR
BY HISTOLOGY GROUPINGS
WHO Histologya
Groupings CBTRUSb
Number () MCSSc
Number () NCDBd
Number () SEERe
Number ()
Neuroepithelial 275 (43) 91 (46) 1064 (46) NA
Tumors of cranial and spinal nerves
980 (153) 397 (202) 2618 (113) NA
Tumors of meninges
3509 (548) 941 (480) 13667 (590) NA
LymphomasHemopoietic
3 (lt01) 0 7 (lt01) NA
Germ cell 4 (lt01) 1 (01) 25 (01) NA
Cysts and tumor-like lesions
15 (02) 3 (02) 34 (01) NA
Tumors of sellar region
1444 (226) 510 (260) 4749 (205) NA
Local extensions 0 0 0 NA
Unclassifiedunassigned tumorsf
171 (27) 18 (09) 1011 (44) NA
TOTAL 6401 (100) 1961 (100) 23175 (100) NA
Note Reported data are incident cases from 1989-1994 except for CBTRUS which is 1990-1993
aRefer to the World Health Organization (WHO) histology groupings in Appendix CbCentral Brain Tumor Registry of the United States c Minnesota Cancer Surveillance System (microscopically confirmed cases only) dNational Cancer Data Base (limited to cases reported by hospitals that accessioned nonmalignant cases) eSurvival Epidemiology and End Results Program (malignant cases only)dFor MCSS unclassifiedunassigned tumors include one malignant and four nonmalignant histologies which werenot listed in the CBTRUS classification scheme For NCDB unclassifiedunassigned tumors include 319 cases(less than one half percent) which had histologies not assigned by CBTRUS to any other category For SEERunclassifiedunassigned tumors include all malignant histologies occurring in the brainCNS which could not beclassified in one of the above categories based on their 4-digit histologic typeNA = Not applicable
Page 37
Endash
DATA COLLECTION
OF PRIMARY
CENTRAL NERVOUS
SYSTEM TUMORS
TABLE 10 METHOD OF CASE FINDING FOR PRIMARY INTRACRANIAL AND CENTRAL NERVOUS SYSTEM TUMORS BY TUMOR BEHAVIOR AND LOCATION MINNESOTA 1989-1994
Behavior Tumor Locationa
Number of Cases
Percent Found byRoutine
Reporting
Percent Found by Special Efforts
Malignant Brain Cerebral meninges
Pituitarycranio duct pineal Other intracranial
18841746 23 33
22
961 965 957 939
864
39 35 43 61
136 Extracranial 60 883 117 Benign Brain
1787 99
788 838
212 162
Cerebral meninges Pituitarycranio duct
pineal Other intracranial
807 458
263
843 740
779
157 260
221 Extracranial 160 631 369 Uncertain 174 856 144 Brain 79 823 177 Cerebral meninges Pituitarycraniopharyn- geal ductpineal Other intracranial
8 60
2
875 850
1000
125 150
00 Extracranial 25 960 40
TOTAL 3845 876 124
aRefer to the site codes in Appendix B
Page 38
Endash
1989 1990 1991 1992 1993 1994
TOTAL
APPENDIX E TABLE 11 METHOD OF CASE FINDING FOR INTRACRANIALa TUMORS BY DIAGNOSIS YEAR MINNESOTA 1989-1994
DiagnosisYear
Number of
Cases
Percent Found byRoutine
Reporting
Percent Found by
Special Efforts
571 837 163 616 865 135 586 913 87 602 899 101
633 872 128 592 929 71
3600 886 114
aIncludes the brain cerebral meninges pituitary gland pineal gland and otherintracranial tumors (refer to the site codes in Appendix B)
Page 39
Endash
DATA COLLECTION
OF PRIMARY
CENTRAL NERVOUS
SYSTEM TUMORS
TABLE 12 METHOD OF CASE FINDING FOR NONMALIGNANT INTRACRANIALa TUMORS BY TYPE OF FACILITY MINNESOTA 1989-1994
Type of Facility Number of Tumors Percent Found byRoutine
Reporting
Percent Found by Special Efforts
Registry at facility No registry at facility
1451325
859 569
141 431
TOTAL 1776 806 194
aIncludes tumors with benign or uncertain behavior that involve the brain cerebral meningespituitary gland pineal gland or other intracranial sites (refer to the site codes in Appendix B)
TABLE 13 REPORTING METHOD AND SOURCE OF CASE FINDING FOR NON- MALIGNANT INTRACRANIALa TUMORS DIAGNOSED IN HOSPITALS WITH A TUMOR REGISTRY MINNESOTA 1989-1994
Reporting Method Number of Tumors Percent Found byRoutine
Reporting
Percent Found by
Special Efforts
Registry-reportedLaboratory-reported
1226225
925 502
75 498
TOTAL 1451 859 141
aIncludes tumors with benign or uncertain behavior that involve the brain cerebral meningespituitary gland pineal gland or other intracranial sites (refer to the site codes in Appendix B)
Page 40
Endash0
APPENDIX E TABLE 14 HOSPITAL REGISTRY ACCESSIONING OF MALIGNANT AND NON-
MALIGNANT PRIMARY INTRACRANIAL AND CENTRAL NERVOUS SYSTEM TUMORS NCDB 1989-1994
TUMOR Totalb
BEHAVIOR Malignant c Nonmalignantd
Tumor Locationa HospitalsReporting
Number ()
Hospitals Reporting
Number ()
Hospitals Reporting
Number ()
Intracranial 1542 (100) 1526 (100) 900 (99)
Brain 1527 (99) 1519 (gt99) 754 (83)
Meninges 740 (48) 390 (26) 613 (67)
Pituitaryglandcraniopharyn-
geal duct
602 (39) 168 (11) 538 (59)
Pineal gland 319 (21) 277 (18) 79 (9)
Other central nervous system including cranial
nerves
648 (42) 545 (36) 299 (33)
Extracranial 812 (53) 708 (46) 410 (45)
Spinal cord 760 (49) 692 (45) 311 (34)
Spinal meninges 299 (19) 72 (5) 258 (28)
TOTAL Hospitals 1542 (100) 1526 (100) 913 (100)
Note The number of hospitals in each of the second third and fourth columns is the number that submittedreports to the NCDB for any intracranial and central nervous system tumors for the respective malignancystatus Not all hospitals submitted reports for each year during the study period (1989-1994)
aRefer to the site codes in Appendix B bBehavior codes = 0 1 3 cBehavior code = 3 dBehavior codes = 0 1
Page 41
Endash
DATA COLLECTION
OF PRIMARY
CENTRAL NERVOUS
SYSTEM TUMORS
Texas Cancer Registry
1997 CBTRUS State Survey of Benign Brain Tumor Data Collection
State Collection Status
Currently Collecting Benign Tumor Data1 Arizona Cancer Registry since 1981 2 Colorado Central Cancer Registry since 1988 3 Connecticut Tumor Registry since 1965 4 Idaho Cancer Data Registry since 1970 5 Maine Cancer Registry since 1983 6 Massachusetts Cancer Registry since 1982 7 Minnesota Cancer Surveillance System since 1988 8 Montana Central Tumor Registry since 1979 9 New York State Cancer Registry since 1988
10 North Carolina Central Cancer Registry since 1990 11 Utah Cancer Registry since 1966 12 Virginia Cancer Registry since 1994 13 Delaware State Cancer Registry14 Washington State Cancer Registry since 1992 15 passive collection 1979-1994
active collection since 1995
Stopped or Passive Collection of Benign Tumor Data1 New Jersey State Cancer Registry stopped 1979-1995 2 Kansas Cancer Registry stopped 1969-1995 3 New Hampshire State Cancer Registry stopped 1986-1991 4 District of Columbia Cancer Registry stopped 1997 5 Wyoming Cancer Surveillance Program stopped 111996 6 Louisiana Tumor Registry stopped 1992 (passive collection) 7 Illinois State Cancer Registry stopped 111996 8 Missouri Cancer Registry passive collection since 1984 9 South Carolina Central Cancer Registry passive collection since 1996
Beginning Collection of Benign Tumor Data1 North Dakota Cancer Registry began collection 1997 2 Rhode Island Cancer Registry began collection 1998
Page 42
Endash
APPENDIX E
Codes for Primary Intracranial and Central Nervous System Tumors
Note For this report the designation of ldquoprimary intracranial and central nervous system tumorsrdquo includes thefollowing primary tumors of central nervous system sites as well as tumors of the pituitary and pinealglands All histology types within the topography codes are included in the designation of ldquoprimaryintracranial and CNS tumors The source for the topography codes is Percy C Van Holten V Muir Ceds International Classification of Diseases for Oncology Second Edition Geneva World Health Organization 1990
Intracranial tumors
Brain C710 Cerebrum C711 Frontal lobe C712 Temporal lobe C713 Parietal lobe C714 Occipital lobe C715 Ventricle NOSC716 Cerebellum NOS C717 Brain stem C718 Overlapping lesion of brain C719 Brain NOS
Meninges C700 Cerebral meninges C709 Meninges NOS
a
Cranial Nerves and other intracranial parts of the central nervous systemC722 Olfactory nerve C723 Optic nerve C724 Acoustic nerve C725 Cranial nerve NOS C728 Overlapping lesion of brain and central nervous system C729 Nervous system NOS
Other endrocrine glands and related structures C751 Pituitary gland C752 Craniopharyngeal duct C753 Pineal gland
Extracranial tumors
Spinal cord C720 Spinal cord C721 Cauda equina
Meninges C701 Spinal meninges
aNOS=Not Otherwise Specified
Page 43
Endash
DATA COLLECTION
OF PRIMARY
CENTRAL NERVOUS
SYSTEM TUMORS
Brain Tumor Histology Groupings
The following histology groupings were used for the primary intracranial and central nervoussystem tumors The source for the histology groupings is Central Brain Tumor Registry ofthe United States (CBTRUS) 1996 Statistics Report Table 4
WHOa HISTOLOGY GROUPINGS ICD-Ob MORPHOLOGY CODE
Diffuse astrocytoma (protoplasma fibrillary) 9410 9420 Anaplastic astrocytoma 9401 9411 Glioblastoma 9440 9441 9442 Pilocytic astrocytoma 9421 Unique astrocytoma variants 9383 9384 9424 Oligodendroglioma 9450 Anaplastic oligodendroglioma 9451 9460 Ependymomaanaplastic ependymoma 9391 9392 9393 Ependymoma variants 9394 Mixed glioma 9382 Astrocytoma NOSc 9400 Glioma malignant NOS 9380 Choroid plexus 9390 Neuroepithelial 9381 9423 9430 Benign neuronalglial neuronal and mixed 86801 8693 9490 9505 9506 Malignant neruonalglial neuronal and mixed 86803 9364 9490 9500 Pineal parenchymal 9360 9361 9362 Embryonalprimitivemedulloblastoma 8963 9470 9471 9472
9473 9501 9502 9503 9510
TUMORS OF NEUROEPITHELIAL TISSUE
TUMORS OF CRANIAL AND SPINAL NERVES Nerve sheath benign and malignant 9540 9550 9560 9570
TUMORS OF THE MENINGES Meningioma 9530 9531 9532 9533 9534 9537 9538 Other mesenchymal benign and malignant 8800 8801 8802 8803 8810 8830 8850 88618900
8910 8990 9133 9150 9240 9480 9481 9536 9539 Hemangioblastoma 9161 9535
LYMPHOMAS AND HEMOPOIETIC NEOPLASMS Lymphoma 9590 9591 9593 9594 9595 9630 9650 9652
9663 9670 9671 9672 9674 9675 9680 9681 9682 9684 9685 9686 9687 9690 9691 96939695 9696 9698 9702 9714 9723 9731 9766 9970
GERM CELL TUMORS Germ cell 8020 9060 9064 9070 9071 9080 9084 9085 9100
CYSTS AND TUMOR-LIKE LESIONS Cysts and heterotopias 9084
TUMORS OF THE SELLAR REGION Pituitary 8040 8l40 8l46 8260 8270 8271 8280
8281 8290 8300 8330 8323 8333 Craniopharyngioma 9350
Page 44
Endash
APPENDIX E
LOCAL EXTENSIONS FROM REGIONAL TUMORS Chordomachondrosarcoma 9370
UNCLASSIFIED TUMORS Hemangioma 9120 9121 9130 9131 Neoplasm benign 80000 8010 Neoplasm uncertain behavior 80001 80011 Neoplasm malignant 80003 80013 8002 8003 All other 8720 9580
aWHO = World Health OrganizationbICD-O = International Classification of Diseases for Oncology Second Edition 1990 cNOS=Not Otherwise Specified
Page 45
Endash
DATA COLLECTION
OF PRIMARY
CENTRAL NERVOUS
SYSTEM TUMORS
Endash
International Classification of Childhood Cancer (ICCC)
Diagnostic Group
ICD-Oa codes
Morphology Topography
I LEUKAEMIA
(a) Lymphoid leukaemia 9820-9827 9850
(b) Acute non-lymphocytic leukaemia 9840 9841 9861 9864 9866 9867 98919894 9910
(c) Chronic myeloid leukaemia 9863 9868
(d) Other specified leukaemias 9830 9842 9860 9862 9870-9890 9892 98939900 9930-9941
(e) Unspecified leukaemias 9800-9804
II LYMPHOMAS AND OTHER RETICULOENDOTHELIAL NEOPLASMS
(a) Hodgkinrsquos disease 9650-9667
(b) Non-Hodgkinrsquos lymphoma 9591-9595 9670-9686 9690-9714 9723
(c) Burkittrsquos lymphoma 9687
(d) Miscellaneous lymphoreticular neoplasms 9720 9731-9764
(e) Unspecified lymphomas 9590
III CENTRAL NERVOUS SYSTEM (CNS) ANDMISCELLANEOUS INTRACRANIAL AND
INTRASPINAL NEOPLASMSb
(a) Ependymomac 9383 9390-9394
(b) Astrocytoma 9380 C723
9381 9400-9441
(c) Primitive neuroectodermal tumours 9470-9473
(d) Other gliomasd 9380 C700-C722C724-C729
9382 9384
9442-9460 9481
APPENDIX E
Diagnostic Group
ICD-Oa codes
Morphology Topogragphy
III CNS AND MISCELLANEOUS INTRACRANIAL AND INTRASPINAL
NEOPLASMSb Continued
(e) Miscellaneous intracranial and intraspinalneoplasmsc
8270-8281 8300 9350-9362 9480 95059530-9539
(f) Unspecified intracranial and intraspinalneoplasmsc
8000-8004 C700-C729C751-C753
IV SYMPATHETIC NERVOUS SYSTEM TUMOURS
(a) Neuroblastoma and ganglioneuroblastoma 9490 9500
(b) Other sympathetic nervous system tumours 8680 8693-8710 9501-9504 9520-9523
aInternational Classification of Diseases for Oncology Second Edition World Health Organization 1990bGroup III excludes all lymphomas See group II cBehaviour codes 0 and 1 are included dBehaviour code 1 is included
Page 47
Endash
Comments and recommendations are welcome Should questions arise on how to use these
materials or for more information please contact
Centers for Disease Control and Prevention National Program of Cancer Registries
4770 Buford Hwy NE Mail Stop K-53
Atlanta GA 30042-3717
Voice Information System 1 (888) 842-6355 bull Fax (770) 488-4760
cancerinfocdcgov bull httpwwwcdcgovcancer
All materials are in the public domain and may be reproduced or copied without permission citation
to source however is appreciated
BACK COVER
(WHITE)
Spine(WHITE)
DATA COLLECTION OF PRIMARY CEN
TRAL NERVOUS SYSTEM
TUM
ORS 2004
National Program of Cancer Registries Training M
aterials
Endash
APPENDIX E diagnosed annually are similar facilities that presently do not accession nonmalignant cases could
expect an approximately 14 percent increase in the total number of CNS cases collected by the
registry Some estimates of the percentage of brain tumors have been lower (05 percent)36 and
others have been higher (9 percent)37 therefore the extent to which the workload would be
affected may vary The data in this report suggest that if reporting of nonmalignant intracranial
and CNS tumors were required the total number of cases of tumors for these anatomic sites
would double for facilities that presently report only malignant tumors This is consistent with the
findings of Davis et al36 who reported that the incorporation of benign brain tumors into the
cancer-reporting systems of four central registries increased the overall incidence of brain cancer
by 49 percent Forty percent (913) of the hospital registries that submitted data to the NCDB did
not report nonmalignant brain tumors These registries could expect up to a 50 percent increase in
the number of intracranial and CNS tumors reported nonregistry facilities which represent
approximately 20 percent of cases reported to central cancer registries could expect a similar
increase Also central cancer registries that currently do not require reporting of nonmalignant
intracranial and CNS tumors could expect increases in their workloads as a result of the
additional time spent on processing and quality control procedures and training The lack of
standard definitions and collection and reporting guidelines would make these tasks more time-
consuming as well
For some central cancer registries that want to expand their reporting requirements to
include nonmalignant intracranial and CNS tumors a change in current legislation andor
regulations may be needed These changes could involve several months of lead time if public
hearings or other legal procedures are necessary In other states the reporting of these tumors is
not required in either their legislation or regulations in these situations hospitals have been asked
to voluntarily report the cases For example in Massachusetts the reporting of benign brain
tumors is not required by law but hospitals have been reporting these cases since 1982 However
the completeness of data reported on a voluntary basis is difficult to assess For public health
surveillance systems a mandate to report is the basic requirement of a comprehensive higher
quality system
DATA COLLECTION
OF PRIMARY
CENTRAL NERVOUS
SYSTEM TUMORS
If COC SEER NPCR and central cancer registries changed their reporting requirements
to include nonmalignant intracranial and CNS tumors the registry manuals disseminated by these
programs and registries would also need to be modified to include new definitions of reportable
diagnoses All reporting facilities would have to be notified of the new requirements To ensure
complete reporting from registries additional training of registrars should be expected Case
finding methods may need to be modified in order to identify the new cases and sources of
information Central cancer registries would also need to increase their case finding audits The
inclusion of nonmalignant tumors would also necessitate changes to other data items such as
sequence number Hospital and central cancer registries would need to consider adding WHO
brain tumor grade as an additional data item
Finally the software used by reporting facilities and by central registries would need to be
modified to accept nonmalignant morphology and behavior codes Also edits programs would
need to be modified to include these additions and to accept a nonmalignant sequence numbering
procedure
Before reporting requirements for primary intracranial and CNS tumors could be changed
feasibility studies would have to be conducted to determine whether such changes should be
recommended Two SEER special studies are under way to evaluate the impact of requiring the
collection of benign brain tumors on case finding cost quality control and training However
additional studies may be required
Page 24
Endash
APPENDIX E
RECOMMENDATIONS OF THE BRAIN TUMOR WORKING GROUP
1 We recommend the following standard definition for collecting precise data for all primary
intracranial and central nervous system tumors
Primary intracranial and central nervous (CNS) tumors are primary tumors occurring in
the following sites irrespective of histologic type or behavior brain meninges spinal
cord cauda equina cranial nerves and other parts of the CNS pituitary gland pineal
gland and craniopharyngeal duct (see Appendix B)
2 We recommend the development of a standard site and histology definition for tabulating
estimates of these tumors to allow comparability of information across registries Pathologists
the North American Association of Central Cancer Registries (NAACCR) the Commission
on Cancer (COC) the Surveillance Epidemiology and End Results (SEER) Program the
National Program of Cancer Registries (NPCR) and the International Agency for Research
on Cancer (IARC) need to be involved in developing this standard
3 We recommend collection of data for primary intracranial and extracranial CNS tumors by all
registries hospital- and central-based This effort will necessitate a change in the COC
requirements and will increase costs to the hospital-based programs Federal funding should be
allocated to supplement the additional transition and ongoing data collections costs that will be
incurred by central registries Before additional data collection is implemented we recommend
a pilot study should be conducted to assess the procedures and quality control functions
needed as well as the costs of collecting data for these tumors
4 We recommend that the appropriate government and professional organizations be involved in
carrying out the development and implementation of special training programs and curricula for
central registry hospital registry and laboratory personnel as well as the development of
computerized edit-checking procedures Training for reporting and tabulating primary
intracranial and CNS tumors should be offered on a regular basis
Page 25
Endash
DATA COLLECTION
OF PRIMARY
CENTRAL NERVOUS
SYSTEM TUMORS
Endash
REFERENCES
1 Davis F Preston-Martin S Epidemiology of brain tumors In Bigner DD McLendon RE Bruner JM eds Russell and Rubinsteins pathology of tumors of the nervous system ed 6 London Arnold Publishing 19965-45
2 World Health Organization (WHO) (1976) International classification of diseases foroncology ed 1 Geneva World Health Organization
3 World Health Organization (WHO) (1990) International classification of diseases foroncology ed 2 Geneva World Health Organization
4 Kleihues P Burger PC Scheithauer BW The new WHO classification of brain tumorsBrain Pathol 19933255-268
5 Thapar K Laws ER Tumors of the central nervous system In Murphy GP Lawrence WJr Lenhard RE Jr eds Textbook of clinical oncology ed 2 Atlanta American CancerSociety 1995378-410
6 Walker AE Robins M Weinfield FD Epidemiology of brain tumors the national survey ofintracranial neoplasms Neurol 198535219-226
7 Ries LAG Kosary CL Hankey BF Miller BA Edwards BK (eds) SEER Cancer StatisticsReview 1973-1995 National Cancer Institute Bethesda MD 1998
8 Cancer Facts amp Figures - 1998 American Cancer Society Atlanta Georgia 19989 Davis FG Bruner JM Surawicz TS The rationale for standardized registration and reporting
of brain and central nervous system tumors in population-based cancer registriesNeuroepidemiol 199716308-316
10CBTRUS (1996) First annual report 1995 Central Brain Tumor Registry of the UnitedStates Chicago Illinois
11 Preston-Martin S Epidemiology of primary CNS neoplasms Neurol Clinics 199614273-290
12 Greig NH Ries LG Yancik R Rapoport SI Increasing annual incidence of primary malignantbrain tumors in the elderly J Natl Cancer Inst 1991 831621-1624
13 Mao Y Desmeules M Semenciw RM Hill G Gaudette L Wigle DT Increasing brain cancerrates in Canada Can Med Assoc J 19911451583-1591
14 Frelick R Huang P Topham A Brain and central nervous system tumors Delaware 1980 to1989 Del Med J 199264571-573
15 Davis DL Ahlbom A Hoel D Percy C Is brain cancer mortality increasing in industrialcountries Am J Ind Med 199119421-431
16 Helseth A Increasing incidence of primary central nervous system tumors in the elderly Realincrease or improved detection J Natl Cancer Inst 1993851871-1872
17 Modan B Wagener D Feldman JJ Rosenberg HM Feinleib M Increased mortality frombrain tumors A combined outcome of diagnostic technology and change of attitude towardthe elderly Am J Epidemiol 19921351349-1357
18 Polednak AP Time trends in the incidence of brain and central nervous system cancers inConnecticut J Natl Cancer Inst 1991831679-1681
19 Boyle P Maissonneuve P Saracci R Muir CS Is the increase in incidence of primarymalignant brain tumors real J Natl Cancer Inst 1990201594-1596
Page 26
APPENDIX E 20 Preston-Martin S Descriptive epidemiology of primary tumors of the brain cranial nerves
and spinal meninges in Los Angeles County Neuroepidemiol 19898283-29521 Helseth A Mork SJ Neoplasms of the central nervous system in Norway Epidemiological
characteristics of intracranial gliomas according to histology APMIS 97 1989547-55522 Gurney JG Davis S Severson RK Fang J-Y Ross JA Robison LL Trends in cancer
incidence among children in the United States Cancer 199678532-54123 Gurney JG Ross JA Wall DA Bleyer WA Severson RK Robison LL Infant cancer in the
US histology-specific incidence trends 1973-1992 J Pediatr Hem Onc 199719428-43224 Nishio S Takeshita I Morioka T Fukui M Primary intracranial squamous cell carcinomas
report of two cases Neurosurgery 199537329-33225 Freilich RJ Thompson SJ Walker RW Rosenblum MK Adenocarcinomatous transformation
of intracranial germ cell tumors Am J Surg Pathol 199519537-54426Yuan S Miller DW Barnett GH Hahn JF Williams BR Identification and characterization of
human beta 2-chimaerin association with malignant transformation in astrocytoma CancerResearch 1995 553456-3461
27 Preston-Martin S Mack WJ Neoplasms of the nervous system In Schoenfeld D Fraumeni JFJr eds Cancer epidemiology and prevention ed 2 New York Oxford University Press19961231-1281
28 Riggs JE Rising primary malignant brain tumor mortality in the elderly A manifestation ofdifferential survival Arch of Neurol 199552571-575
29 Davis FG Freels S Grutsch J Barlas S Brem S Survival rates in patients with primarymalignant brain tumors stratified by patient age and tumor histological type an analysisbased on Surveillance Epidemiology and End Results (SEER) data 1973-1991J Neurosurg 1998881-10
30 Surawicz TS Davis F Freels S Laws ER Menck HR Brain tumor survival results from theNational Cancer Data Base (Accepted for publication in J Neuro-Oncol)
31 Bondy ML Lustbader ED Buffler PA Schull WJ Hardy RJ Strong LC Geneticepidemiology of childhood brain tumors Genet Epidemiol 19918253-267
32 Preston-Martin S Monroe K Lee P Bernstein L Kelsey J Henderson S Forrester DHenderson B Spinal meningiomas in women in Los Angeles County Investigation of anetiologic hypothesis Cancer Epidemiol Biomarkers Prev 19954333-339
33 Davis JR Brownson RC Garcia R Bentz BJ Turner A Family pesticide use and childhoodbrain cancer Arch Environ Contam Toxicol 19932487-92
34 Commission on Cancer General principles and coding In Standards of the Commission on Cancer vol II Registry Operations and Data Standards American College of SurgeonsChicago Illinois 1996
35 Central Brain Tumor Registry of the United States (CBTRUS) 1997 State Survey of BenignBrain Tumor Collection Chicago Illinois 1997
36 Davis FG Malinski N Haenszel W Chang J Flannery J Gershman S Dibble R Bigner DDPrimary brain tumor incidence rates in the four United States regions 1985-1989 A pilotstudy Neuroepidemiol 199615103-112
37 Schoenberg BS Christine BW Whisnant JP The descriptive epidemiology of primaryintracranial neoplasms the Connecticut experience Am J Epidemiol 1976104499-510
Page 27
Endash
DATA COLLECTION
OF PRIMARY
CENTRAL NERVOUS
SYSTEM TUMORS
TAB
LE 1
C
OM
PAR
ISO
N O
F R
EGIS
TRIE
S SU
PPLY
ING
DA
TA O
N P
RIM
AR
Y I
NTR
AC
RA
NIA
L A
ND
CEN
TRA
L N
ERV
OU
S SY
STEM
TU
MO
RS
IN T
HE
UN
ITED
STA
TES
Cen
tral B
rain
Tum
or R
egis
try o
fth
e U
nite
d St
ates
(CBT
RUS)
Min
neso
ta C
ance
rSu
rvei
llanc
e Sy
stem
(MC
SS)
ACo
SN
a tio
nal C
ance
r Dat
a B
ase
(NCD
B)
Surv
eilla
nce
Epid
emio
logy
and
End
Res
ults
Pro
gram
(SEE
R)
Purp
ose
ldquoCB
TRU
S ce
ntra
lizes
pop
ulat
ion-
base
d in
cide
nce
data
on
all b
rain
tum
ors a
nd u
ses o
ther
exi
stin
gda
ta re
sour
ces t
o ch
arac
teriz
e th
ein
cide
nce
mor
talit
y a
nd su
rviv
alof
pat
ient
s with
bra
in tu
mor
s rdquo
The
MC
SS c
olle
cts i
nfor
mat
ion
onal
l can
cers
dia
gnos
ed si
nce
1988
amon
g M
inne
sota
resi
dent
s Th
e M
CSS
is p
opul
atio
n-ba
sed
path
olog
y-ba
sed
and
is a
n ac
tive
syste
m
ldquoThe
goa
l of t
he N
CD
B is
to p
rese
nt a
n an
nual
sum
mar
y of
pat
ient
car
e fo
r cas
es o
f can
cer
diag
nose
d an
d tre
ated
at h
ospi
tals
thro
ugho
utth
e co
untry
rdquo
ldquoA c
ontin
uing
pro
ject
of th
e N
CI
the
SEER
prog
ram
col
lect
sca
ncer
dat
a on
aro
utin
e ba
sis f
rom
desi
gnat
ed p
opul
atio
n-ba
sed
canc
er re
gist
ries
in v
ario
us a
reas
of t
heco
untry
Targ
et p
opul
atio
n Th
e po
pula
tions
cov
ered
by
regi
strie
s in
Ari
zona
Col
orad
oC
onne
ctic
ut D
elaw
are
Idah
oM
aine
Mas
sach
uset
ts
Min
neso
ta M
issou
ri M
onta
na
Nor
th C
arol
ina
and
Uta
h
The
CB
TRU
S po
pula
tion
repr
esen
ts a
non
rand
om 1
5pe
rcen
t sam
ple
of th
e U
S
popu
latio
n
The
popu
latio
n of
Min
neso
ta
The
popu
latio
ns tr
eate
d at
par
ticip
atin
gho
spita
ls in
the
50 st
ates
the
Dist
rict
of
Col
umbi
a a
nd P
uert
o R
ico
NC
DB
is n
ot a
pop
ulat
ion-
base
d re
gist
ry
At
pres
ent
it is
est
imat
ed to
cov
er a
ppro
xim
atel
y57
per
cent
of t
otal
cas
es n
atio
nwid
e
The
popu
latio
nsco
vere
d by
the
state
regi
strie
s in
Con
nect
icut
Haw
aii
Iow
a N
ew M
exic
o
and
Uta
h a
s wel
l as
the
regi
onal
regi
strie
sin
Atla
nta
Geo
rgia
D
etro
it M
ichi
gan
San
Fran
cisc
o-O
akla
nd C
alifo
rnia
an
d Se
attle
-Pug
etSo
und
Was
hing
ton
The
SEER
pop
ulat
ion
repr
esen
ts a
nonr
ando
m 1
4 pe
rcen
tsa
mpl
e of
the
US
po
pula
tion
Page
28
Endash
APPENDIX E
Cen
tral B
rain
Tum
or R
egis
try o
fth
e U
nite
d St
ates
(CBT
RUS)
Min
neso
ta C
ance
rSu
rvei
llanc
e Sy
stem
(MC
SS)
ACo
SN
a tio
nal C
ance
r Dat
a B
ase
(NCD
B)
Surv
eilla
nce
Epid
emio
logy
and
End
Res
ults
Pro
gram
(SEE
R)
Type
of
prim
ary
intra
cran
ial
and
cent
ral n
ervo
us sy
stem
tum
ors r
epor
ted
Dat
a on
new
ly-d
iagn
osed
cas
es o
fbe
nign
and
mal
igna
nt p
rimar
ybr
ain
tum
ors b
ased
on
ICD
-Oco
des
Dat
a on
new
ly-d
iagn
osed
m
i cro
scop
ical
ly-c
onfir
med
tum
ors
of th
e ce
ntra
l ner
vous
syste
m
incl
udin
g pi
tuita
ry a
nd p
inea
lgl
ands
Hos
pita
ls v
olun
taril
y su
bmit
full
anal
ytic
canc
er re
gist
ry c
asel
oads
with
dat
a ite
ms a
ndco
des d
efin
ed b
y th
e C
omm
issio
n on
Can
cer
(CO
C) f
or h
ospi
tal c
ance
r reg
istri
es
Mos
tpa
rtici
patin
g ho
spita
ls h
ave
prog
ram
sap
prov
ed b
y C
OC
or a
re e
stab
lishi
ng p
rogr
amap
prov
al
NC
DB
cal
ls fo
r dat
a do
not
lim
itca
ses b
y m
alig
nant
beh
avio
r bu
t acc
essi
onin
gof
non
-mal
igna
nt c
ases
is n
ot re
quire
d fo
rpr
ogra
m a
ppro
val
Fifty
-nin
e pe
rcen
t of t
heho
spita
ls th
at su
bmitt
ed a
ny in
tracr
ania
lCN
Sca
ses d
iagn
osed
dur
ing
1989
-199
4 su
bmitt
edat
leas
t one
non
mal
igna
nt c
ase
The
NC
DB
data
in th
is re
port
are
limite
d to
the
case
ssu
bmitt
ed b
y th
ese
hosp
itals
(82
perc
ent o
f all
intra
cran
ial a
nd e
xtra
cran
ial c
entra
l ner
vous
syste
m c
ases
on
file)
Tren
ds in
the
inci
denc
e m
orta
lity
and
patie
nt su
rviv
al o
fbr
ain
tum
ors i
n th
eU
S H
owev
er S
EER
does
not
col
lect
info
rmat
ion
on b
enig
nan
d un
certa
in b
rain
tum
ors
Oth
er c
omm
ents
D
uplic
ate
canc
er re
gist
ratio
ns c
anno
t be
iden
tifie
d by
the
parti
cipa
ting
regi
strie
s
The
MC
SS p
erfo
rms 1
00 p
erce
ntca
se fi
ndin
g au
dits
in a
ll pa
thol
ogy
labo
rato
ries o
n an
ann
ual b
asis
Th
eref
ore
the
data
from
the
MC
SSm
ight
be
cons
ider
ed a
ldquobe
st-ca
sesc
enar
iordquo
in te
rms o
f com
plet
enes
sof
repo
rting
for m
icro
scop
ical
ly-
conf
irmed
tum
ors
Rep
ort d
uplic
atio
n fo
r 198
9-19
94 in
tracr
ania
lan
d ex
tracr
ania
l cen
tral n
ervo
us sy
stem
repo
rts w
as 6
7 p
erce
nt
How
ever
the
NC
DB
data
in T
able
s 2 th
roug
h 9
are
base
d on
undu
plic
ated
repo
rts
Page
29
Endash
DATA COLLECTION
OF PRIMARY
CENTRAL NERVOUS
SYSTEM TUMORS
TABLE 2 NUMBER AND PERCENT OF PRIMARY INTRACRANIAL AND CENTRAL NERVOUS SYSTEM TUMORS BY TUMOR LOCATION
Locationa CBTRUSb
Number () MCSSc
Number () NCDBd
Number () SEERe
Number ()
Intracranial 13084 (947) 3600 (936) 66322 (955) 10196 (969)
Brain 7999 (579) 1924 (500) 48527 (699) 9721 (924)
Meninges 2719 (197) 838 (218) 9365 (135) 139 (13)
Pituitarycraniopharygealduct
1491 (108) 530 (138) 4958 (71) 30 (03)
Pineal 74 (05) 21 (05) 477 (07) 80 (08)
Other central nervous systemincluding cranial nerves
801 (58) 287 (75) 2995 (43) 226 (22)
Extracranial 730 (53) 245 (64) 3137 (45) 322 (31)
Spinal cord 497 (36) 47 (38) 2395 (34) 313 (30)
Spinal meninges 233 (17) 98 (25) 742 (11) 9 (01)
TOTAL 13814 (100) 3845 (100) 69459 (100) 10518 (100)
Note Reported data are incident cases from 1989-1994 except for CBTRUS data which are from 1990-1993
aRefer to the sites in Appendix BbCentral Brain Tumor Registry of the United States cMinnesota Cancer Surveillance System (microscopically confirmed cases only)dNational Cancer Data Base (limited to cases reported by hospitals that accessioned nonmalignant cases) eSurvival Epidemiology and End results Program (malignant cases only)
Page 30
Endash0
TABL
E 3
RO
W P
ERCE
NT
DIS
TRIB
UTI
ON
OF
PRIM
ARY
INTR
ACR
AN
IAL
AN
D C
ENTR
AL
NER
VO
US
SYST
EM T
UM
ORS
BY
TU
MO
R B
EHA
VIO
RA
ND
MIC
ROSC
OPI
C C
ON
FIRM
ATI
ON
Loca
tiona
CB
TRU
Sb M
CSSc
NC
DB
d SE
ERe
Tota
l Pe
rcen
tM
icro
Co
nfirm
ed
Perc
ent
Not
Mic
ro
Conf
irmed
Tota
l Pe
rcen
tM
icro
Co
nfirm
ed
Perc
ent
Not
Mic
ro
Conf
irmed
Tota
l Pe
rcen
tM
icro
Co
nfirm
ed
Perc
ent
Not
Mic
ro
Conf
irmed
Tota
l Pe
rcen
tM
icro
Co
nfirm
ed
Perc
ent
Not
Mic
ro
Conf
irmed
Intra
cran
ial
130
84
867
13
3
360
0 10
0 N
A
663
22
887
11
3
101
96
871
12
9
Mal
igna
nt
717
1 89
2
108
1
824
100
NA
44
801
91
3
87
101
96
871
12
9
Beni
gn a
ndu n
certa
in
591
3 83
5
165
1
776
100
NA
21
521
83
2
168
N
A
NA
N
A
Bra
in
799
9 88
2
118
1
924
100
NA
48
527
90
2
98
972
1 87
3
127
Mal
igna
nt
686
2 89
6
104
1
746
100
NA
42
622
91
5
85
972
1 87
3
127
Beni
gnan
dun
certa
in
113
7 80
6
194
17
8 10
0 N
A
590
5 80
6
194
N
A
NA
N
A
Extra
cran
ial
730
962
3
8 24
5 10
0 N
A
313
7 96
0
40
322
957
4
3
Mal
igna
nt
242
934
6
6 60
10
0 N
A
148
3 96
6
34
322
957
4
3
Beni
gn a
ndu n
certa
in
488
975
2
5 18
5 10
0 N
A
165
4 95
5
45
NA
N
A
NA
TOTA
Lf 13
814
87
2
128
3
845
100
NA
69
459
89
0
110
10
518
87
4
126
Mal
igna
nt
741
3 89
4
106
1
884
100
NA
46
284
91
5
85
105
18
874
12
6
Beni
gn a
ndu n
certa
in
640
1 84
6
154
1
961
100
NA
23
175
84
1
159
N
A
NA
N
A
Not
e R
epor
ted
data
are
inci
dent
cas
es fr
om 1
989-
1994
exc
ept f
or C
BTR
US
data
whi
ch a
re fr
om 1
990-
1993
a Refe
r to
the
site
code
s in
App
endi
x B
b Cent
ral B
rain
Tum
or R
egist
ry o
f the
Uni
ted
Stat
es
c Min
neso
ta C
ance
r Sur
veill
ance
Sys
tem
(mic
rosc
opic
ally
con
firm
ed c
ases
onl
y)
d Nat
iona
l Can
cer D
ata
Base
(lim
ited
to c
ases
repo
rted
by h
ospi
tals
that
acc
essio
ned
nonm
alig
nant
cas
es)
e Surv
eilla
nce
Epi
dem
iolo
gy a
nd E
nd R
esul
ts Pr
ogra
m (m
alig
nant
cas
es o
nly)
f In
clud
es in
tracr
ania
l and
ext
racr
ania
l cas
es
NA
= N
ot a
pplic
able
Page
31
APPENDIX E
Endash
DATA COLLECTION
OF PRIMARY
CENTRAL NERVOUS
SYSTEM TUMORS
TABLE 4 NUMBER AND PERCENT OF PRIMARY INTRACRANIAL AND CENTRAL NERVOUS SYSTEM TUMORS BY DIAGNOSTIC CONFIRMATION
DiagnosticConfirmation
CBTRUSa
Number () MCSSb
Number () NCDBc
Number () SEERd
Number ()
Positive microscopy
12087 (875) 3845 (100) 61818 (890) 9188 (874)
Radiographywithout microscopy
1306 (95) NA 6759 (97) 1015 (97)
Clinical 204 (15) NA 484 (07) 98 (09)
Unknown 217 (15) NA 398 (06) 217 (21)
TOTAL 13814 (100) 3845 (100) 69459 (100) 10518 (100)
Note Reported data are incident cases from 1989-1994 except for CBTRUS data which are from 1990-1993
aCentral Brain Tumor Registry of the United Statesb Minnesota Cancer Surveillance System (microscopically confirmed cases only) cNational Cancer Data Base (limited to cases reported by hospitals that accessioned nonmalignant cases)dSurveillance Epidemiology and End Results Program (malignant cases only)NA = Not applicable
Page 32
Endash
Page 32
TABLE 4 NUMBER AND PERCENT OF PRIMARY INTRACRANIAL AND CENTRALNERVOUS SYSTEM TUMORS BY DIAGNOSTIC CONFIRMATION
DiagnosticConfirmation
CBTRUSa
Number ()MCSSb
Number ()NCDBc
Number ()SEERd
Number ()
Positivemicroscopy
12087 (875) 3845 (100) 61818 (890) 9188 (874)
Radiographywithout microscopy
1306 (95) NA 6759 (97) 1015 (97)
Clinical 204 (15) NA 484 (07) 98 (09)
Unknown 217 (15) NA 398 (06) 217 (21)
TOTAL 13814 (100) 3845 (100) 69459 (100) 10518 (100)
Note Reported data are incident cases from 1989-1994 except for CBTRUS data which are from 1990-1993
aCentral Brain Tumor Registry of the United Statesb Minnesota Cancer Surveillance System (microscopically confirmed cases only)cNational Cancer Data Base (limited to cases reported by hospitals that accessioned nonmalignant cases)dSurveillance Epidemiology and End Results Program (malignant cases only)NA = Not applicable
APPENDIX E
TABLE 5 NUMBER AND PERCENT OF MALIGNANT PRIMARY INTRACRANIAL AND CENTRAL SYSTEM TUMORS BY TUMOR LOCATION
Locationa CBTRUSb
Number () MCSSc
Number () NCDBd
Number () SEERe
Number ()
Intracranial 7171 (977) 1824 (968) 44801 (968) 10196 (969)
Brain 6862 (926) 1746 (927) 42622 (921) 9721 (924)
Meninges 98 (13) 23 (12) 581 (13) 139 (13)
Pituitarycraniopharyngealduct
37 (05) 13 (07) 189 (04) 30 (03)
Pineal 58 (08) 20 (11) 378 (08) 80 (08)
Other central nervous systemincluding cranial nerves
116 (16) 22 (12) 1031 (22) 226 (21)
Extracranial 242 (33) 60 (32) 1483 (32) 322 (31)
Spinal cord 234 (32) 60 (32) 1410 (30) 313 (30)
Spinal meninges 8 (01) 0 73 (02) 9 (01)
TOTAL 7413 (100) 1884 (100) 46284 (100) 10518 (100)
Note Reported data are incident cases from 1989-1994 except for CBTRUS data which are from 1990-1993
aRefer to the site codes in Appendix BbCentral Brain Tumor Registry of the United States cMinnesota Cancer Surveillance System (microscopically confirmed cases only)dNational Cancer Data Base (limited to cases reported by hospitals that accessioned nonmalignant cases) eSurvival Epidemiology and End Results Program (malignant cases only)
Page 33
Endash
DATA COLLECTION
OF PRIMARY
CENTRAL NERVOUS
SYSTEM TUMORS
TABLE 6 NUMBER AND PERCENT OF PRIMARY INTRACRANIAL AND CENTRAL NERVOUS SYSTEM TUMORS OF BENIGN AND UNCERTAIN BEHAVIOR BY TUMOR LOCATION
Locationa CBTRUSb
Number () MCSSc
Number () NCDBd
Number () SEERe
Number ()
Intracranial 5913 (924) 1776 (906) 21521 (929) NA
Brain 1137 (178) 178 (91) 5905 (255) NA
Meninges 2621 (409) 815 (416) 8784 (379) NA
Pituitarycraniopharyngealduct
1454 (227) 517 (264) 4769 (206) NA
Pineal 16 (02) 1 (lt01) 99 (04) NA
Other central nervous systemincluding cranial nerves
685 (107) 265 (135) 1964 (85) NA
Extracranial 488 (76) 185 (94) 1654 (71) NA
Spinal cord 263 (41) 87 (44) 985 (42) NA
Spinal meninges 225 (35) 98 (50) 669 (29) NA
TOTAL 6401 (100) 1961 (100) 23175 (100) NA
Note Reported data are incident cases from 1989-1994 except for CBTRUS data which are from 1990-1993
aRefer to the site codes in Appendix BbCentral Brain Tumor Registry of the United States cMinnesota Cancer Surveillance System (microscopically confirmed cases only)dNational Cancer Data Base (limited to cases reported by hospitals that accessioned nonmalignant cases) eSurveillance Epidemiology and End Results Program (malignant cases only)NA = Not applicable
Page 34
Endash
APPENDIX E TABLE 7 NUMBER AND PERCENT OF PRIMARY INTRACRANIAL AND CENTRAL
NERVOUS SYSTEM TUMORS BY TUMOR BEHAVIOR AND LOCATION
BehaviorTumor Locationa
CBTRUSb
Number () MCSSc
Number () NCDBd
Number () SEERe
Number ()
Malignant 7413 (537) 1884 (490) 46284 (666) 10518 (100)
Brain 6862 (497) 1746 (454) 42622 (614) 9721 (924)
Meninges 98 (07) 23 (06) 581 (08) 139 (13)
Pituitarycraniopharyn-geal ductpineal
95 (07) 33 (09) 567 (08) 110 (11)
Other central nervous system includingcranial nerves
116 (08) 22 (06) 1031 (15) 226 (22)
Spinal cord 242 (18) 60 (16) 1483 (21) 322 (31)
Benign 5794 (419) 1787 (465) 20694 (298) NA
Brain 803 (58) 99 (26) 4491 (65) NA
Meninges 2565 (186) 807 (210) 8613 (124) NA
Pituitarycraniopharyn-geal ductpineal
1322 (96) 458 (119) 4330 (62) NA
Other central nervous system includingcranial nerves
678 (49) 263 (68) 1911 (28) NA
Spinal cord 426 (31) 160 (42) 1349 (19) NA
Uncertain 607 (44) 174 (45) 2481 (36) NA
Brain 334 (24) 79 (21) 1414 (20) NA
Meninges 56 (04) 8 (02) 171 (02) NA
Pituitarycraniopharyn-geal ductpineal
148 (11) 60 (16) 538 (08) NA
Other central nervous system includingcranial nerves
7 (01) 2 (01) 53 (01) NA
Spinal cord 62 (05) 25 (07) 305 (04) NA
TOTAL 13814 (100) 3845 (100) 69459 (100) 10518 (100)
Note Reported data are incident cases from 1989-1994 except for CBTRUS data which are from 1990-1993 NA=Not applicableaRefer to the site codes in Appendix B bCentral Brain Tumor Registry of the United States cMinnesota Cancer Surveillance System (microscopically confirmed cases only)dNational Cancer Data Base (limited to cases reported byhospitals that accessioned nonmalignant cases eSurvival Epidemiology and End Results Program (malignant cases only)
Page 35
Endash
DATA COLLECTION
OF PRIMARY
CENTRAL NERVOUS
SYSTEM TUMORS
TABLE 8 NUMBER AND PERCENT OF MALIGNANT PRIMARY INTRACRANIAL AND
CENTRAL NERVOUS SYSTEM TUMORS BY HISTOLOGY GROUPINGS
WHO Histologya
Groupings CBTRUSb
Number () MCSSc
Number () NCDBd
Number () SEERe
Number ()
Neuroepithelial 6477 (874) 1689 (896) 39701 (858) 8676 (825)
Tumors of cranial and spinal nerves
12 (02) 3 (02) 108 (02) 25 (02)
Tumors of meninges
137 (18) 25 (13) 994 (21) 194 (18)
LymphomasHemopoietic
473 (64) 121 (64) 3492 (75) 1099 (105)
Germ cell 70 (09) 20 (11) 403 (09) 97 (09)
Cysts and tumor-like lesions
0 0 0 0
Tumors of sellar region
20 (03) 11 (06) 100 (02) 6 (01)
Local extensions 29 (04) 11 (06) 166 (04) 38 (04)
Unclassifiedunassigned tumorsf
195 (26) 4 (02) 1320 (29) 383 (36)
TOTAL 7413 (100) 1884 (100) 46284 (100) 10518 (100)
Note Reported data are incident cases from 1989-1994 except for CBTRUS data which are from 1990-1993
aRefer to the World Health Organization (WHO) histology groupings in Appendix CbCentral Brain Tumor Registry of the United States cMinnesota Cancer Surveillance System (microscopically confirmed cases only)dNational Cancer Data Base (limited to cases reported by hospitals that accessioned nonmalignant cases) f For MCSS unclassifiedunassigned tumors include one malignant and four nonmalignant histologies which were
not listed in the CBTRUS classification scheme For NCDB unclassifiedunassigned tumors include 319 cases(less than one half percent) which had histologies not assigned by CBTRUS to any other category For SEERunclassifiedunassigned tumors include all malignant histologies occurring in the brainCNS which could not beclassified in one of the above categories based on their 4-digit histologic type
Page 36
Endash
APPENDIX E
TABLE 9 NUMBER AND PERCENT OF PRIMARY INTRACRANIAL AND CENTRAL NERVOUS SYSTEM TUMORS OF BENIGN AND UNCERTAIN BEHAVIOR
BY HISTOLOGY GROUPINGS
WHO Histologya
Groupings CBTRUSb
Number () MCSSc
Number () NCDBd
Number () SEERe
Number ()
Neuroepithelial 275 (43) 91 (46) 1064 (46) NA
Tumors of cranial and spinal nerves
980 (153) 397 (202) 2618 (113) NA
Tumors of meninges
3509 (548) 941 (480) 13667 (590) NA
LymphomasHemopoietic
3 (lt01) 0 7 (lt01) NA
Germ cell 4 (lt01) 1 (01) 25 (01) NA
Cysts and tumor-like lesions
15 (02) 3 (02) 34 (01) NA
Tumors of sellar region
1444 (226) 510 (260) 4749 (205) NA
Local extensions 0 0 0 NA
Unclassifiedunassigned tumorsf
171 (27) 18 (09) 1011 (44) NA
TOTAL 6401 (100) 1961 (100) 23175 (100) NA
Note Reported data are incident cases from 1989-1994 except for CBTRUS which is 1990-1993
aRefer to the World Health Organization (WHO) histology groupings in Appendix CbCentral Brain Tumor Registry of the United States c Minnesota Cancer Surveillance System (microscopically confirmed cases only) dNational Cancer Data Base (limited to cases reported by hospitals that accessioned nonmalignant cases) eSurvival Epidemiology and End Results Program (malignant cases only)dFor MCSS unclassifiedunassigned tumors include one malignant and four nonmalignant histologies which werenot listed in the CBTRUS classification scheme For NCDB unclassifiedunassigned tumors include 319 cases(less than one half percent) which had histologies not assigned by CBTRUS to any other category For SEERunclassifiedunassigned tumors include all malignant histologies occurring in the brainCNS which could not beclassified in one of the above categories based on their 4-digit histologic typeNA = Not applicable
Page 37
Endash
DATA COLLECTION
OF PRIMARY
CENTRAL NERVOUS
SYSTEM TUMORS
TABLE 10 METHOD OF CASE FINDING FOR PRIMARY INTRACRANIAL AND CENTRAL NERVOUS SYSTEM TUMORS BY TUMOR BEHAVIOR AND LOCATION MINNESOTA 1989-1994
Behavior Tumor Locationa
Number of Cases
Percent Found byRoutine
Reporting
Percent Found by Special Efforts
Malignant Brain Cerebral meninges
Pituitarycranio duct pineal Other intracranial
18841746 23 33
22
961 965 957 939
864
39 35 43 61
136 Extracranial 60 883 117 Benign Brain
1787 99
788 838
212 162
Cerebral meninges Pituitarycranio duct
pineal Other intracranial
807 458
263
843 740
779
157 260
221 Extracranial 160 631 369 Uncertain 174 856 144 Brain 79 823 177 Cerebral meninges Pituitarycraniopharyn- geal ductpineal Other intracranial
8 60
2
875 850
1000
125 150
00 Extracranial 25 960 40
TOTAL 3845 876 124
aRefer to the site codes in Appendix B
Page 38
Endash
1989 1990 1991 1992 1993 1994
TOTAL
APPENDIX E TABLE 11 METHOD OF CASE FINDING FOR INTRACRANIALa TUMORS BY DIAGNOSIS YEAR MINNESOTA 1989-1994
DiagnosisYear
Number of
Cases
Percent Found byRoutine
Reporting
Percent Found by
Special Efforts
571 837 163 616 865 135 586 913 87 602 899 101
633 872 128 592 929 71
3600 886 114
aIncludes the brain cerebral meninges pituitary gland pineal gland and otherintracranial tumors (refer to the site codes in Appendix B)
Page 39
Endash
DATA COLLECTION
OF PRIMARY
CENTRAL NERVOUS
SYSTEM TUMORS
TABLE 12 METHOD OF CASE FINDING FOR NONMALIGNANT INTRACRANIALa TUMORS BY TYPE OF FACILITY MINNESOTA 1989-1994
Type of Facility Number of Tumors Percent Found byRoutine
Reporting
Percent Found by Special Efforts
Registry at facility No registry at facility
1451325
859 569
141 431
TOTAL 1776 806 194
aIncludes tumors with benign or uncertain behavior that involve the brain cerebral meningespituitary gland pineal gland or other intracranial sites (refer to the site codes in Appendix B)
TABLE 13 REPORTING METHOD AND SOURCE OF CASE FINDING FOR NON- MALIGNANT INTRACRANIALa TUMORS DIAGNOSED IN HOSPITALS WITH A TUMOR REGISTRY MINNESOTA 1989-1994
Reporting Method Number of Tumors Percent Found byRoutine
Reporting
Percent Found by
Special Efforts
Registry-reportedLaboratory-reported
1226225
925 502
75 498
TOTAL 1451 859 141
aIncludes tumors with benign or uncertain behavior that involve the brain cerebral meningespituitary gland pineal gland or other intracranial sites (refer to the site codes in Appendix B)
Page 40
Endash0
APPENDIX E TABLE 14 HOSPITAL REGISTRY ACCESSIONING OF MALIGNANT AND NON-
MALIGNANT PRIMARY INTRACRANIAL AND CENTRAL NERVOUS SYSTEM TUMORS NCDB 1989-1994
TUMOR Totalb
BEHAVIOR Malignant c Nonmalignantd
Tumor Locationa HospitalsReporting
Number ()
Hospitals Reporting
Number ()
Hospitals Reporting
Number ()
Intracranial 1542 (100) 1526 (100) 900 (99)
Brain 1527 (99) 1519 (gt99) 754 (83)
Meninges 740 (48) 390 (26) 613 (67)
Pituitaryglandcraniopharyn-
geal duct
602 (39) 168 (11) 538 (59)
Pineal gland 319 (21) 277 (18) 79 (9)
Other central nervous system including cranial
nerves
648 (42) 545 (36) 299 (33)
Extracranial 812 (53) 708 (46) 410 (45)
Spinal cord 760 (49) 692 (45) 311 (34)
Spinal meninges 299 (19) 72 (5) 258 (28)
TOTAL Hospitals 1542 (100) 1526 (100) 913 (100)
Note The number of hospitals in each of the second third and fourth columns is the number that submittedreports to the NCDB for any intracranial and central nervous system tumors for the respective malignancystatus Not all hospitals submitted reports for each year during the study period (1989-1994)
aRefer to the site codes in Appendix B bBehavior codes = 0 1 3 cBehavior code = 3 dBehavior codes = 0 1
Page 41
Endash
DATA COLLECTION
OF PRIMARY
CENTRAL NERVOUS
SYSTEM TUMORS
Texas Cancer Registry
1997 CBTRUS State Survey of Benign Brain Tumor Data Collection
State Collection Status
Currently Collecting Benign Tumor Data1 Arizona Cancer Registry since 1981 2 Colorado Central Cancer Registry since 1988 3 Connecticut Tumor Registry since 1965 4 Idaho Cancer Data Registry since 1970 5 Maine Cancer Registry since 1983 6 Massachusetts Cancer Registry since 1982 7 Minnesota Cancer Surveillance System since 1988 8 Montana Central Tumor Registry since 1979 9 New York State Cancer Registry since 1988
10 North Carolina Central Cancer Registry since 1990 11 Utah Cancer Registry since 1966 12 Virginia Cancer Registry since 1994 13 Delaware State Cancer Registry14 Washington State Cancer Registry since 1992 15 passive collection 1979-1994
active collection since 1995
Stopped or Passive Collection of Benign Tumor Data1 New Jersey State Cancer Registry stopped 1979-1995 2 Kansas Cancer Registry stopped 1969-1995 3 New Hampshire State Cancer Registry stopped 1986-1991 4 District of Columbia Cancer Registry stopped 1997 5 Wyoming Cancer Surveillance Program stopped 111996 6 Louisiana Tumor Registry stopped 1992 (passive collection) 7 Illinois State Cancer Registry stopped 111996 8 Missouri Cancer Registry passive collection since 1984 9 South Carolina Central Cancer Registry passive collection since 1996
Beginning Collection of Benign Tumor Data1 North Dakota Cancer Registry began collection 1997 2 Rhode Island Cancer Registry began collection 1998
Page 42
Endash
APPENDIX E
Codes for Primary Intracranial and Central Nervous System Tumors
Note For this report the designation of ldquoprimary intracranial and central nervous system tumorsrdquo includes thefollowing primary tumors of central nervous system sites as well as tumors of the pituitary and pinealglands All histology types within the topography codes are included in the designation of ldquoprimaryintracranial and CNS tumors The source for the topography codes is Percy C Van Holten V Muir Ceds International Classification of Diseases for Oncology Second Edition Geneva World Health Organization 1990
Intracranial tumors
Brain C710 Cerebrum C711 Frontal lobe C712 Temporal lobe C713 Parietal lobe C714 Occipital lobe C715 Ventricle NOSC716 Cerebellum NOS C717 Brain stem C718 Overlapping lesion of brain C719 Brain NOS
Meninges C700 Cerebral meninges C709 Meninges NOS
a
Cranial Nerves and other intracranial parts of the central nervous systemC722 Olfactory nerve C723 Optic nerve C724 Acoustic nerve C725 Cranial nerve NOS C728 Overlapping lesion of brain and central nervous system C729 Nervous system NOS
Other endrocrine glands and related structures C751 Pituitary gland C752 Craniopharyngeal duct C753 Pineal gland
Extracranial tumors
Spinal cord C720 Spinal cord C721 Cauda equina
Meninges C701 Spinal meninges
aNOS=Not Otherwise Specified
Page 43
Endash
DATA COLLECTION
OF PRIMARY
CENTRAL NERVOUS
SYSTEM TUMORS
Brain Tumor Histology Groupings
The following histology groupings were used for the primary intracranial and central nervoussystem tumors The source for the histology groupings is Central Brain Tumor Registry ofthe United States (CBTRUS) 1996 Statistics Report Table 4
WHOa HISTOLOGY GROUPINGS ICD-Ob MORPHOLOGY CODE
Diffuse astrocytoma (protoplasma fibrillary) 9410 9420 Anaplastic astrocytoma 9401 9411 Glioblastoma 9440 9441 9442 Pilocytic astrocytoma 9421 Unique astrocytoma variants 9383 9384 9424 Oligodendroglioma 9450 Anaplastic oligodendroglioma 9451 9460 Ependymomaanaplastic ependymoma 9391 9392 9393 Ependymoma variants 9394 Mixed glioma 9382 Astrocytoma NOSc 9400 Glioma malignant NOS 9380 Choroid plexus 9390 Neuroepithelial 9381 9423 9430 Benign neuronalglial neuronal and mixed 86801 8693 9490 9505 9506 Malignant neruonalglial neuronal and mixed 86803 9364 9490 9500 Pineal parenchymal 9360 9361 9362 Embryonalprimitivemedulloblastoma 8963 9470 9471 9472
9473 9501 9502 9503 9510
TUMORS OF NEUROEPITHELIAL TISSUE
TUMORS OF CRANIAL AND SPINAL NERVES Nerve sheath benign and malignant 9540 9550 9560 9570
TUMORS OF THE MENINGES Meningioma 9530 9531 9532 9533 9534 9537 9538 Other mesenchymal benign and malignant 8800 8801 8802 8803 8810 8830 8850 88618900
8910 8990 9133 9150 9240 9480 9481 9536 9539 Hemangioblastoma 9161 9535
LYMPHOMAS AND HEMOPOIETIC NEOPLASMS Lymphoma 9590 9591 9593 9594 9595 9630 9650 9652
9663 9670 9671 9672 9674 9675 9680 9681 9682 9684 9685 9686 9687 9690 9691 96939695 9696 9698 9702 9714 9723 9731 9766 9970
GERM CELL TUMORS Germ cell 8020 9060 9064 9070 9071 9080 9084 9085 9100
CYSTS AND TUMOR-LIKE LESIONS Cysts and heterotopias 9084
TUMORS OF THE SELLAR REGION Pituitary 8040 8l40 8l46 8260 8270 8271 8280
8281 8290 8300 8330 8323 8333 Craniopharyngioma 9350
Page 44
Endash
APPENDIX E
LOCAL EXTENSIONS FROM REGIONAL TUMORS Chordomachondrosarcoma 9370
UNCLASSIFIED TUMORS Hemangioma 9120 9121 9130 9131 Neoplasm benign 80000 8010 Neoplasm uncertain behavior 80001 80011 Neoplasm malignant 80003 80013 8002 8003 All other 8720 9580
aWHO = World Health OrganizationbICD-O = International Classification of Diseases for Oncology Second Edition 1990 cNOS=Not Otherwise Specified
Page 45
Endash
DATA COLLECTION
OF PRIMARY
CENTRAL NERVOUS
SYSTEM TUMORS
Endash
International Classification of Childhood Cancer (ICCC)
Diagnostic Group
ICD-Oa codes
Morphology Topography
I LEUKAEMIA
(a) Lymphoid leukaemia 9820-9827 9850
(b) Acute non-lymphocytic leukaemia 9840 9841 9861 9864 9866 9867 98919894 9910
(c) Chronic myeloid leukaemia 9863 9868
(d) Other specified leukaemias 9830 9842 9860 9862 9870-9890 9892 98939900 9930-9941
(e) Unspecified leukaemias 9800-9804
II LYMPHOMAS AND OTHER RETICULOENDOTHELIAL NEOPLASMS
(a) Hodgkinrsquos disease 9650-9667
(b) Non-Hodgkinrsquos lymphoma 9591-9595 9670-9686 9690-9714 9723
(c) Burkittrsquos lymphoma 9687
(d) Miscellaneous lymphoreticular neoplasms 9720 9731-9764
(e) Unspecified lymphomas 9590
III CENTRAL NERVOUS SYSTEM (CNS) ANDMISCELLANEOUS INTRACRANIAL AND
INTRASPINAL NEOPLASMSb
(a) Ependymomac 9383 9390-9394
(b) Astrocytoma 9380 C723
9381 9400-9441
(c) Primitive neuroectodermal tumours 9470-9473
(d) Other gliomasd 9380 C700-C722C724-C729
9382 9384
9442-9460 9481
APPENDIX E
Diagnostic Group
ICD-Oa codes
Morphology Topogragphy
III CNS AND MISCELLANEOUS INTRACRANIAL AND INTRASPINAL
NEOPLASMSb Continued
(e) Miscellaneous intracranial and intraspinalneoplasmsc
8270-8281 8300 9350-9362 9480 95059530-9539
(f) Unspecified intracranial and intraspinalneoplasmsc
8000-8004 C700-C729C751-C753
IV SYMPATHETIC NERVOUS SYSTEM TUMOURS
(a) Neuroblastoma and ganglioneuroblastoma 9490 9500
(b) Other sympathetic nervous system tumours 8680 8693-8710 9501-9504 9520-9523
aInternational Classification of Diseases for Oncology Second Edition World Health Organization 1990bGroup III excludes all lymphomas See group II cBehaviour codes 0 and 1 are included dBehaviour code 1 is included
Page 47
Endash
Comments and recommendations are welcome Should questions arise on how to use these
materials or for more information please contact
Centers for Disease Control and Prevention National Program of Cancer Registries
4770 Buford Hwy NE Mail Stop K-53
Atlanta GA 30042-3717
Voice Information System 1 (888) 842-6355 bull Fax (770) 488-4760
cancerinfocdcgov bull httpwwwcdcgovcancer
All materials are in the public domain and may be reproduced or copied without permission citation
to source however is appreciated
BACK COVER
(WHITE)
Spine(WHITE)
DATA COLLECTION OF PRIMARY CEN
TRAL NERVOUS SYSTEM
TUM
ORS 2004
National Program of Cancer Registries Training M
aterials
DATA COLLECTION
OF PRIMARY
CENTRAL NERVOUS
SYSTEM TUMORS
If COC SEER NPCR and central cancer registries changed their reporting requirements
to include nonmalignant intracranial and CNS tumors the registry manuals disseminated by these
programs and registries would also need to be modified to include new definitions of reportable
diagnoses All reporting facilities would have to be notified of the new requirements To ensure
complete reporting from registries additional training of registrars should be expected Case
finding methods may need to be modified in order to identify the new cases and sources of
information Central cancer registries would also need to increase their case finding audits The
inclusion of nonmalignant tumors would also necessitate changes to other data items such as
sequence number Hospital and central cancer registries would need to consider adding WHO
brain tumor grade as an additional data item
Finally the software used by reporting facilities and by central registries would need to be
modified to accept nonmalignant morphology and behavior codes Also edits programs would
need to be modified to include these additions and to accept a nonmalignant sequence numbering
procedure
Before reporting requirements for primary intracranial and CNS tumors could be changed
feasibility studies would have to be conducted to determine whether such changes should be
recommended Two SEER special studies are under way to evaluate the impact of requiring the
collection of benign brain tumors on case finding cost quality control and training However
additional studies may be required
Page 24
Endash
APPENDIX E
RECOMMENDATIONS OF THE BRAIN TUMOR WORKING GROUP
1 We recommend the following standard definition for collecting precise data for all primary
intracranial and central nervous system tumors
Primary intracranial and central nervous (CNS) tumors are primary tumors occurring in
the following sites irrespective of histologic type or behavior brain meninges spinal
cord cauda equina cranial nerves and other parts of the CNS pituitary gland pineal
gland and craniopharyngeal duct (see Appendix B)
2 We recommend the development of a standard site and histology definition for tabulating
estimates of these tumors to allow comparability of information across registries Pathologists
the North American Association of Central Cancer Registries (NAACCR) the Commission
on Cancer (COC) the Surveillance Epidemiology and End Results (SEER) Program the
National Program of Cancer Registries (NPCR) and the International Agency for Research
on Cancer (IARC) need to be involved in developing this standard
3 We recommend collection of data for primary intracranial and extracranial CNS tumors by all
registries hospital- and central-based This effort will necessitate a change in the COC
requirements and will increase costs to the hospital-based programs Federal funding should be
allocated to supplement the additional transition and ongoing data collections costs that will be
incurred by central registries Before additional data collection is implemented we recommend
a pilot study should be conducted to assess the procedures and quality control functions
needed as well as the costs of collecting data for these tumors
4 We recommend that the appropriate government and professional organizations be involved in
carrying out the development and implementation of special training programs and curricula for
central registry hospital registry and laboratory personnel as well as the development of
computerized edit-checking procedures Training for reporting and tabulating primary
intracranial and CNS tumors should be offered on a regular basis
Page 25
Endash
DATA COLLECTION
OF PRIMARY
CENTRAL NERVOUS
SYSTEM TUMORS
Endash
REFERENCES
1 Davis F Preston-Martin S Epidemiology of brain tumors In Bigner DD McLendon RE Bruner JM eds Russell and Rubinsteins pathology of tumors of the nervous system ed 6 London Arnold Publishing 19965-45
2 World Health Organization (WHO) (1976) International classification of diseases foroncology ed 1 Geneva World Health Organization
3 World Health Organization (WHO) (1990) International classification of diseases foroncology ed 2 Geneva World Health Organization
4 Kleihues P Burger PC Scheithauer BW The new WHO classification of brain tumorsBrain Pathol 19933255-268
5 Thapar K Laws ER Tumors of the central nervous system In Murphy GP Lawrence WJr Lenhard RE Jr eds Textbook of clinical oncology ed 2 Atlanta American CancerSociety 1995378-410
6 Walker AE Robins M Weinfield FD Epidemiology of brain tumors the national survey ofintracranial neoplasms Neurol 198535219-226
7 Ries LAG Kosary CL Hankey BF Miller BA Edwards BK (eds) SEER Cancer StatisticsReview 1973-1995 National Cancer Institute Bethesda MD 1998
8 Cancer Facts amp Figures - 1998 American Cancer Society Atlanta Georgia 19989 Davis FG Bruner JM Surawicz TS The rationale for standardized registration and reporting
of brain and central nervous system tumors in population-based cancer registriesNeuroepidemiol 199716308-316
10CBTRUS (1996) First annual report 1995 Central Brain Tumor Registry of the UnitedStates Chicago Illinois
11 Preston-Martin S Epidemiology of primary CNS neoplasms Neurol Clinics 199614273-290
12 Greig NH Ries LG Yancik R Rapoport SI Increasing annual incidence of primary malignantbrain tumors in the elderly J Natl Cancer Inst 1991 831621-1624
13 Mao Y Desmeules M Semenciw RM Hill G Gaudette L Wigle DT Increasing brain cancerrates in Canada Can Med Assoc J 19911451583-1591
14 Frelick R Huang P Topham A Brain and central nervous system tumors Delaware 1980 to1989 Del Med J 199264571-573
15 Davis DL Ahlbom A Hoel D Percy C Is brain cancer mortality increasing in industrialcountries Am J Ind Med 199119421-431
16 Helseth A Increasing incidence of primary central nervous system tumors in the elderly Realincrease or improved detection J Natl Cancer Inst 1993851871-1872
17 Modan B Wagener D Feldman JJ Rosenberg HM Feinleib M Increased mortality frombrain tumors A combined outcome of diagnostic technology and change of attitude towardthe elderly Am J Epidemiol 19921351349-1357
18 Polednak AP Time trends in the incidence of brain and central nervous system cancers inConnecticut J Natl Cancer Inst 1991831679-1681
19 Boyle P Maissonneuve P Saracci R Muir CS Is the increase in incidence of primarymalignant brain tumors real J Natl Cancer Inst 1990201594-1596
Page 26
APPENDIX E 20 Preston-Martin S Descriptive epidemiology of primary tumors of the brain cranial nerves
and spinal meninges in Los Angeles County Neuroepidemiol 19898283-29521 Helseth A Mork SJ Neoplasms of the central nervous system in Norway Epidemiological
characteristics of intracranial gliomas according to histology APMIS 97 1989547-55522 Gurney JG Davis S Severson RK Fang J-Y Ross JA Robison LL Trends in cancer
incidence among children in the United States Cancer 199678532-54123 Gurney JG Ross JA Wall DA Bleyer WA Severson RK Robison LL Infant cancer in the
US histology-specific incidence trends 1973-1992 J Pediatr Hem Onc 199719428-43224 Nishio S Takeshita I Morioka T Fukui M Primary intracranial squamous cell carcinomas
report of two cases Neurosurgery 199537329-33225 Freilich RJ Thompson SJ Walker RW Rosenblum MK Adenocarcinomatous transformation
of intracranial germ cell tumors Am J Surg Pathol 199519537-54426Yuan S Miller DW Barnett GH Hahn JF Williams BR Identification and characterization of
human beta 2-chimaerin association with malignant transformation in astrocytoma CancerResearch 1995 553456-3461
27 Preston-Martin S Mack WJ Neoplasms of the nervous system In Schoenfeld D Fraumeni JFJr eds Cancer epidemiology and prevention ed 2 New York Oxford University Press19961231-1281
28 Riggs JE Rising primary malignant brain tumor mortality in the elderly A manifestation ofdifferential survival Arch of Neurol 199552571-575
29 Davis FG Freels S Grutsch J Barlas S Brem S Survival rates in patients with primarymalignant brain tumors stratified by patient age and tumor histological type an analysisbased on Surveillance Epidemiology and End Results (SEER) data 1973-1991J Neurosurg 1998881-10
30 Surawicz TS Davis F Freels S Laws ER Menck HR Brain tumor survival results from theNational Cancer Data Base (Accepted for publication in J Neuro-Oncol)
31 Bondy ML Lustbader ED Buffler PA Schull WJ Hardy RJ Strong LC Geneticepidemiology of childhood brain tumors Genet Epidemiol 19918253-267
32 Preston-Martin S Monroe K Lee P Bernstein L Kelsey J Henderson S Forrester DHenderson B Spinal meningiomas in women in Los Angeles County Investigation of anetiologic hypothesis Cancer Epidemiol Biomarkers Prev 19954333-339
33 Davis JR Brownson RC Garcia R Bentz BJ Turner A Family pesticide use and childhoodbrain cancer Arch Environ Contam Toxicol 19932487-92
34 Commission on Cancer General principles and coding In Standards of the Commission on Cancer vol II Registry Operations and Data Standards American College of SurgeonsChicago Illinois 1996
35 Central Brain Tumor Registry of the United States (CBTRUS) 1997 State Survey of BenignBrain Tumor Collection Chicago Illinois 1997
36 Davis FG Malinski N Haenszel W Chang J Flannery J Gershman S Dibble R Bigner DDPrimary brain tumor incidence rates in the four United States regions 1985-1989 A pilotstudy Neuroepidemiol 199615103-112
37 Schoenberg BS Christine BW Whisnant JP The descriptive epidemiology of primaryintracranial neoplasms the Connecticut experience Am J Epidemiol 1976104499-510
Page 27
Endash
DATA COLLECTION
OF PRIMARY
CENTRAL NERVOUS
SYSTEM TUMORS
TAB
LE 1
C
OM
PAR
ISO
N O
F R
EGIS
TRIE
S SU
PPLY
ING
DA
TA O
N P
RIM
AR
Y I
NTR
AC
RA
NIA
L A
ND
CEN
TRA
L N
ERV
OU
S SY
STEM
TU
MO
RS
IN T
HE
UN
ITED
STA
TES
Cen
tral B
rain
Tum
or R
egis
try o
fth
e U
nite
d St
ates
(CBT
RUS)
Min
neso
ta C
ance
rSu
rvei
llanc
e Sy
stem
(MC
SS)
ACo
SN
a tio
nal C
ance
r Dat
a B
ase
(NCD
B)
Surv
eilla
nce
Epid
emio
logy
and
End
Res
ults
Pro
gram
(SEE
R)
Purp
ose
ldquoCB
TRU
S ce
ntra
lizes
pop
ulat
ion-
base
d in
cide
nce
data
on
all b
rain
tum
ors a
nd u
ses o
ther
exi
stin
gda
ta re
sour
ces t
o ch
arac
teriz
e th
ein
cide
nce
mor
talit
y a
nd su
rviv
alof
pat
ient
s with
bra
in tu
mor
s rdquo
The
MC
SS c
olle
cts i
nfor
mat
ion
onal
l can
cers
dia
gnos
ed si
nce
1988
amon
g M
inne
sota
resi
dent
s Th
e M
CSS
is p
opul
atio
n-ba
sed
path
olog
y-ba
sed
and
is a
n ac
tive
syste
m
ldquoThe
goa
l of t
he N
CD
B is
to p
rese
nt a
n an
nual
sum
mar
y of
pat
ient
car
e fo
r cas
es o
f can
cer
diag
nose
d an
d tre
ated
at h
ospi
tals
thro
ugho
utth
e co
untry
rdquo
ldquoA c
ontin
uing
pro
ject
of th
e N
CI
the
SEER
prog
ram
col
lect
sca
ncer
dat
a on
aro
utin
e ba
sis f
rom
desi
gnat
ed p
opul
atio
n-ba
sed
canc
er re
gist
ries
in v
ario
us a
reas
of t
heco
untry
Targ
et p
opul
atio
n Th
e po
pula
tions
cov
ered
by
regi
strie
s in
Ari
zona
Col
orad
oC
onne
ctic
ut D
elaw
are
Idah
oM
aine
Mas
sach
uset
ts
Min
neso
ta M
issou
ri M
onta
na
Nor
th C
arol
ina
and
Uta
h
The
CB
TRU
S po
pula
tion
repr
esen
ts a
non
rand
om 1
5pe
rcen
t sam
ple
of th
e U
S
popu
latio
n
The
popu
latio
n of
Min
neso
ta
The
popu
latio
ns tr
eate
d at
par
ticip
atin
gho
spita
ls in
the
50 st
ates
the
Dist
rict
of
Col
umbi
a a
nd P
uert
o R
ico
NC
DB
is n
ot a
pop
ulat
ion-
base
d re
gist
ry
At
pres
ent
it is
est
imat
ed to
cov
er a
ppro
xim
atel
y57
per
cent
of t
otal
cas
es n
atio
nwid
e
The
popu
latio
nsco
vere
d by
the
state
regi
strie
s in
Con
nect
icut
Haw
aii
Iow
a N
ew M
exic
o
and
Uta
h a
s wel
l as
the
regi
onal
regi
strie
sin
Atla
nta
Geo
rgia
D
etro
it M
ichi
gan
San
Fran
cisc
o-O
akla
nd C
alifo
rnia
an
d Se
attle
-Pug
etSo
und
Was
hing
ton
The
SEER
pop
ulat
ion
repr
esen
ts a
nonr
ando
m 1
4 pe
rcen
tsa
mpl
e of
the
US
po
pula
tion
Page
28
Endash
APPENDIX E
Cen
tral B
rain
Tum
or R
egis
try o
fth
e U
nite
d St
ates
(CBT
RUS)
Min
neso
ta C
ance
rSu
rvei
llanc
e Sy
stem
(MC
SS)
ACo
SN
a tio
nal C
ance
r Dat
a B
ase
(NCD
B)
Surv
eilla
nce
Epid
emio
logy
and
End
Res
ults
Pro
gram
(SEE
R)
Type
of
prim
ary
intra
cran
ial
and
cent
ral n
ervo
us sy
stem
tum
ors r
epor
ted
Dat
a on
new
ly-d
iagn
osed
cas
es o
fbe
nign
and
mal
igna
nt p
rimar
ybr
ain
tum
ors b
ased
on
ICD
-Oco
des
Dat
a on
new
ly-d
iagn
osed
m
i cro
scop
ical
ly-c
onfir
med
tum
ors
of th
e ce
ntra
l ner
vous
syste
m
incl
udin
g pi
tuita
ry a
nd p
inea
lgl
ands
Hos
pita
ls v
olun
taril
y su
bmit
full
anal
ytic
canc
er re
gist
ry c
asel
oads
with
dat
a ite
ms a
ndco
des d
efin
ed b
y th
e C
omm
issio
n on
Can
cer
(CO
C) f
or h
ospi
tal c
ance
r reg
istri
es
Mos
tpa
rtici
patin
g ho
spita
ls h
ave
prog
ram
sap
prov
ed b
y C
OC
or a
re e
stab
lishi
ng p
rogr
amap
prov
al
NC
DB
cal
ls fo
r dat
a do
not
lim
itca
ses b
y m
alig
nant
beh
avio
r bu
t acc
essi
onin
gof
non
-mal
igna
nt c
ases
is n
ot re
quire
d fo
rpr
ogra
m a
ppro
val
Fifty
-nin
e pe
rcen
t of t
heho
spita
ls th
at su
bmitt
ed a
ny in
tracr
ania
lCN
Sca
ses d
iagn
osed
dur
ing
1989
-199
4 su
bmitt
edat
leas
t one
non
mal
igna
nt c
ase
The
NC
DB
data
in th
is re
port
are
limite
d to
the
case
ssu
bmitt
ed b
y th
ese
hosp
itals
(82
perc
ent o
f all
intra
cran
ial a
nd e
xtra
cran
ial c
entra
l ner
vous
syste
m c
ases
on
file)
Tren
ds in
the
inci
denc
e m
orta
lity
and
patie
nt su
rviv
al o
fbr
ain
tum
ors i
n th
eU
S H
owev
er S
EER
does
not
col
lect
info
rmat
ion
on b
enig
nan
d un
certa
in b
rain
tum
ors
Oth
er c
omm
ents
D
uplic
ate
canc
er re
gist
ratio
ns c
anno
t be
iden
tifie
d by
the
parti
cipa
ting
regi
strie
s
The
MC
SS p
erfo
rms 1
00 p
erce
ntca
se fi
ndin
g au
dits
in a
ll pa
thol
ogy
labo
rato
ries o
n an
ann
ual b
asis
Th
eref
ore
the
data
from
the
MC
SSm
ight
be
cons
ider
ed a
ldquobe
st-ca
sesc
enar
iordquo
in te
rms o
f com
plet
enes
sof
repo
rting
for m
icro
scop
ical
ly-
conf
irmed
tum
ors
Rep
ort d
uplic
atio
n fo
r 198
9-19
94 in
tracr
ania
lan
d ex
tracr
ania
l cen
tral n
ervo
us sy
stem
repo
rts w
as 6
7 p
erce
nt
How
ever
the
NC
DB
data
in T
able
s 2 th
roug
h 9
are
base
d on
undu
plic
ated
repo
rts
Page
29
Endash
DATA COLLECTION
OF PRIMARY
CENTRAL NERVOUS
SYSTEM TUMORS
TABLE 2 NUMBER AND PERCENT OF PRIMARY INTRACRANIAL AND CENTRAL NERVOUS SYSTEM TUMORS BY TUMOR LOCATION
Locationa CBTRUSb
Number () MCSSc
Number () NCDBd
Number () SEERe
Number ()
Intracranial 13084 (947) 3600 (936) 66322 (955) 10196 (969)
Brain 7999 (579) 1924 (500) 48527 (699) 9721 (924)
Meninges 2719 (197) 838 (218) 9365 (135) 139 (13)
Pituitarycraniopharygealduct
1491 (108) 530 (138) 4958 (71) 30 (03)
Pineal 74 (05) 21 (05) 477 (07) 80 (08)
Other central nervous systemincluding cranial nerves
801 (58) 287 (75) 2995 (43) 226 (22)
Extracranial 730 (53) 245 (64) 3137 (45) 322 (31)
Spinal cord 497 (36) 47 (38) 2395 (34) 313 (30)
Spinal meninges 233 (17) 98 (25) 742 (11) 9 (01)
TOTAL 13814 (100) 3845 (100) 69459 (100) 10518 (100)
Note Reported data are incident cases from 1989-1994 except for CBTRUS data which are from 1990-1993
aRefer to the sites in Appendix BbCentral Brain Tumor Registry of the United States cMinnesota Cancer Surveillance System (microscopically confirmed cases only)dNational Cancer Data Base (limited to cases reported by hospitals that accessioned nonmalignant cases) eSurvival Epidemiology and End results Program (malignant cases only)
Page 30
Endash0
TABL
E 3
RO
W P
ERCE
NT
DIS
TRIB
UTI
ON
OF
PRIM
ARY
INTR
ACR
AN
IAL
AN
D C
ENTR
AL
NER
VO
US
SYST
EM T
UM
ORS
BY
TU
MO
R B
EHA
VIO
RA
ND
MIC
ROSC
OPI
C C
ON
FIRM
ATI
ON
Loca
tiona
CB
TRU
Sb M
CSSc
NC
DB
d SE
ERe
Tota
l Pe
rcen
tM
icro
Co
nfirm
ed
Perc
ent
Not
Mic
ro
Conf
irmed
Tota
l Pe
rcen
tM
icro
Co
nfirm
ed
Perc
ent
Not
Mic
ro
Conf
irmed
Tota
l Pe
rcen
tM
icro
Co
nfirm
ed
Perc
ent
Not
Mic
ro
Conf
irmed
Tota
l Pe
rcen
tM
icro
Co
nfirm
ed
Perc
ent
Not
Mic
ro
Conf
irmed
Intra
cran
ial
130
84
867
13
3
360
0 10
0 N
A
663
22
887
11
3
101
96
871
12
9
Mal
igna
nt
717
1 89
2
108
1
824
100
NA
44
801
91
3
87
101
96
871
12
9
Beni
gn a
ndu n
certa
in
591
3 83
5
165
1
776
100
NA
21
521
83
2
168
N
A
NA
N
A
Bra
in
799
9 88
2
118
1
924
100
NA
48
527
90
2
98
972
1 87
3
127
Mal
igna
nt
686
2 89
6
104
1
746
100
NA
42
622
91
5
85
972
1 87
3
127
Beni
gnan
dun
certa
in
113
7 80
6
194
17
8 10
0 N
A
590
5 80
6
194
N
A
NA
N
A
Extra
cran
ial
730
962
3
8 24
5 10
0 N
A
313
7 96
0
40
322
957
4
3
Mal
igna
nt
242
934
6
6 60
10
0 N
A
148
3 96
6
34
322
957
4
3
Beni
gn a
ndu n
certa
in
488
975
2
5 18
5 10
0 N
A
165
4 95
5
45
NA
N
A
NA
TOTA
Lf 13
814
87
2
128
3
845
100
NA
69
459
89
0
110
10
518
87
4
126
Mal
igna
nt
741
3 89
4
106
1
884
100
NA
46
284
91
5
85
105
18
874
12
6
Beni
gn a
ndu n
certa
in
640
1 84
6
154
1
961
100
NA
23
175
84
1
159
N
A
NA
N
A
Not
e R
epor
ted
data
are
inci
dent
cas
es fr
om 1
989-
1994
exc
ept f
or C
BTR
US
data
whi
ch a
re fr
om 1
990-
1993
a Refe
r to
the
site
code
s in
App
endi
x B
b Cent
ral B
rain
Tum
or R
egist
ry o
f the
Uni
ted
Stat
es
c Min
neso
ta C
ance
r Sur
veill
ance
Sys
tem
(mic
rosc
opic
ally
con
firm
ed c
ases
onl
y)
d Nat
iona
l Can
cer D
ata
Base
(lim
ited
to c
ases
repo
rted
by h
ospi
tals
that
acc
essio
ned
nonm
alig
nant
cas
es)
e Surv
eilla
nce
Epi
dem
iolo
gy a
nd E
nd R
esul
ts Pr
ogra
m (m
alig
nant
cas
es o
nly)
f In
clud
es in
tracr
ania
l and
ext
racr
ania
l cas
es
NA
= N
ot a
pplic
able
Page
31
APPENDIX E
Endash
DATA COLLECTION
OF PRIMARY
CENTRAL NERVOUS
SYSTEM TUMORS
TABLE 4 NUMBER AND PERCENT OF PRIMARY INTRACRANIAL AND CENTRAL NERVOUS SYSTEM TUMORS BY DIAGNOSTIC CONFIRMATION
DiagnosticConfirmation
CBTRUSa
Number () MCSSb
Number () NCDBc
Number () SEERd
Number ()
Positive microscopy
12087 (875) 3845 (100) 61818 (890) 9188 (874)
Radiographywithout microscopy
1306 (95) NA 6759 (97) 1015 (97)
Clinical 204 (15) NA 484 (07) 98 (09)
Unknown 217 (15) NA 398 (06) 217 (21)
TOTAL 13814 (100) 3845 (100) 69459 (100) 10518 (100)
Note Reported data are incident cases from 1989-1994 except for CBTRUS data which are from 1990-1993
aCentral Brain Tumor Registry of the United Statesb Minnesota Cancer Surveillance System (microscopically confirmed cases only) cNational Cancer Data Base (limited to cases reported by hospitals that accessioned nonmalignant cases)dSurveillance Epidemiology and End Results Program (malignant cases only)NA = Not applicable
Page 32
Endash
Page 32
TABLE 4 NUMBER AND PERCENT OF PRIMARY INTRACRANIAL AND CENTRALNERVOUS SYSTEM TUMORS BY DIAGNOSTIC CONFIRMATION
DiagnosticConfirmation
CBTRUSa
Number ()MCSSb
Number ()NCDBc
Number ()SEERd
Number ()
Positivemicroscopy
12087 (875) 3845 (100) 61818 (890) 9188 (874)
Radiographywithout microscopy
1306 (95) NA 6759 (97) 1015 (97)
Clinical 204 (15) NA 484 (07) 98 (09)
Unknown 217 (15) NA 398 (06) 217 (21)
TOTAL 13814 (100) 3845 (100) 69459 (100) 10518 (100)
Note Reported data are incident cases from 1989-1994 except for CBTRUS data which are from 1990-1993
aCentral Brain Tumor Registry of the United Statesb Minnesota Cancer Surveillance System (microscopically confirmed cases only)cNational Cancer Data Base (limited to cases reported by hospitals that accessioned nonmalignant cases)dSurveillance Epidemiology and End Results Program (malignant cases only)NA = Not applicable
APPENDIX E
TABLE 5 NUMBER AND PERCENT OF MALIGNANT PRIMARY INTRACRANIAL AND CENTRAL SYSTEM TUMORS BY TUMOR LOCATION
Locationa CBTRUSb
Number () MCSSc
Number () NCDBd
Number () SEERe
Number ()
Intracranial 7171 (977) 1824 (968) 44801 (968) 10196 (969)
Brain 6862 (926) 1746 (927) 42622 (921) 9721 (924)
Meninges 98 (13) 23 (12) 581 (13) 139 (13)
Pituitarycraniopharyngealduct
37 (05) 13 (07) 189 (04) 30 (03)
Pineal 58 (08) 20 (11) 378 (08) 80 (08)
Other central nervous systemincluding cranial nerves
116 (16) 22 (12) 1031 (22) 226 (21)
Extracranial 242 (33) 60 (32) 1483 (32) 322 (31)
Spinal cord 234 (32) 60 (32) 1410 (30) 313 (30)
Spinal meninges 8 (01) 0 73 (02) 9 (01)
TOTAL 7413 (100) 1884 (100) 46284 (100) 10518 (100)
Note Reported data are incident cases from 1989-1994 except for CBTRUS data which are from 1990-1993
aRefer to the site codes in Appendix BbCentral Brain Tumor Registry of the United States cMinnesota Cancer Surveillance System (microscopically confirmed cases only)dNational Cancer Data Base (limited to cases reported by hospitals that accessioned nonmalignant cases) eSurvival Epidemiology and End Results Program (malignant cases only)
Page 33
Endash
DATA COLLECTION
OF PRIMARY
CENTRAL NERVOUS
SYSTEM TUMORS
TABLE 6 NUMBER AND PERCENT OF PRIMARY INTRACRANIAL AND CENTRAL NERVOUS SYSTEM TUMORS OF BENIGN AND UNCERTAIN BEHAVIOR BY TUMOR LOCATION
Locationa CBTRUSb
Number () MCSSc
Number () NCDBd
Number () SEERe
Number ()
Intracranial 5913 (924) 1776 (906) 21521 (929) NA
Brain 1137 (178) 178 (91) 5905 (255) NA
Meninges 2621 (409) 815 (416) 8784 (379) NA
Pituitarycraniopharyngealduct
1454 (227) 517 (264) 4769 (206) NA
Pineal 16 (02) 1 (lt01) 99 (04) NA
Other central nervous systemincluding cranial nerves
685 (107) 265 (135) 1964 (85) NA
Extracranial 488 (76) 185 (94) 1654 (71) NA
Spinal cord 263 (41) 87 (44) 985 (42) NA
Spinal meninges 225 (35) 98 (50) 669 (29) NA
TOTAL 6401 (100) 1961 (100) 23175 (100) NA
Note Reported data are incident cases from 1989-1994 except for CBTRUS data which are from 1990-1993
aRefer to the site codes in Appendix BbCentral Brain Tumor Registry of the United States cMinnesota Cancer Surveillance System (microscopically confirmed cases only)dNational Cancer Data Base (limited to cases reported by hospitals that accessioned nonmalignant cases) eSurveillance Epidemiology and End Results Program (malignant cases only)NA = Not applicable
Page 34
Endash
APPENDIX E TABLE 7 NUMBER AND PERCENT OF PRIMARY INTRACRANIAL AND CENTRAL
NERVOUS SYSTEM TUMORS BY TUMOR BEHAVIOR AND LOCATION
BehaviorTumor Locationa
CBTRUSb
Number () MCSSc
Number () NCDBd
Number () SEERe
Number ()
Malignant 7413 (537) 1884 (490) 46284 (666) 10518 (100)
Brain 6862 (497) 1746 (454) 42622 (614) 9721 (924)
Meninges 98 (07) 23 (06) 581 (08) 139 (13)
Pituitarycraniopharyn-geal ductpineal
95 (07) 33 (09) 567 (08) 110 (11)
Other central nervous system includingcranial nerves
116 (08) 22 (06) 1031 (15) 226 (22)
Spinal cord 242 (18) 60 (16) 1483 (21) 322 (31)
Benign 5794 (419) 1787 (465) 20694 (298) NA
Brain 803 (58) 99 (26) 4491 (65) NA
Meninges 2565 (186) 807 (210) 8613 (124) NA
Pituitarycraniopharyn-geal ductpineal
1322 (96) 458 (119) 4330 (62) NA
Other central nervous system includingcranial nerves
678 (49) 263 (68) 1911 (28) NA
Spinal cord 426 (31) 160 (42) 1349 (19) NA
Uncertain 607 (44) 174 (45) 2481 (36) NA
Brain 334 (24) 79 (21) 1414 (20) NA
Meninges 56 (04) 8 (02) 171 (02) NA
Pituitarycraniopharyn-geal ductpineal
148 (11) 60 (16) 538 (08) NA
Other central nervous system includingcranial nerves
7 (01) 2 (01) 53 (01) NA
Spinal cord 62 (05) 25 (07) 305 (04) NA
TOTAL 13814 (100) 3845 (100) 69459 (100) 10518 (100)
Note Reported data are incident cases from 1989-1994 except for CBTRUS data which are from 1990-1993 NA=Not applicableaRefer to the site codes in Appendix B bCentral Brain Tumor Registry of the United States cMinnesota Cancer Surveillance System (microscopically confirmed cases only)dNational Cancer Data Base (limited to cases reported byhospitals that accessioned nonmalignant cases eSurvival Epidemiology and End Results Program (malignant cases only)
Page 35
Endash
DATA COLLECTION
OF PRIMARY
CENTRAL NERVOUS
SYSTEM TUMORS
TABLE 8 NUMBER AND PERCENT OF MALIGNANT PRIMARY INTRACRANIAL AND
CENTRAL NERVOUS SYSTEM TUMORS BY HISTOLOGY GROUPINGS
WHO Histologya
Groupings CBTRUSb
Number () MCSSc
Number () NCDBd
Number () SEERe
Number ()
Neuroepithelial 6477 (874) 1689 (896) 39701 (858) 8676 (825)
Tumors of cranial and spinal nerves
12 (02) 3 (02) 108 (02) 25 (02)
Tumors of meninges
137 (18) 25 (13) 994 (21) 194 (18)
LymphomasHemopoietic
473 (64) 121 (64) 3492 (75) 1099 (105)
Germ cell 70 (09) 20 (11) 403 (09) 97 (09)
Cysts and tumor-like lesions
0 0 0 0
Tumors of sellar region
20 (03) 11 (06) 100 (02) 6 (01)
Local extensions 29 (04) 11 (06) 166 (04) 38 (04)
Unclassifiedunassigned tumorsf
195 (26) 4 (02) 1320 (29) 383 (36)
TOTAL 7413 (100) 1884 (100) 46284 (100) 10518 (100)
Note Reported data are incident cases from 1989-1994 except for CBTRUS data which are from 1990-1993
aRefer to the World Health Organization (WHO) histology groupings in Appendix CbCentral Brain Tumor Registry of the United States cMinnesota Cancer Surveillance System (microscopically confirmed cases only)dNational Cancer Data Base (limited to cases reported by hospitals that accessioned nonmalignant cases) f For MCSS unclassifiedunassigned tumors include one malignant and four nonmalignant histologies which were
not listed in the CBTRUS classification scheme For NCDB unclassifiedunassigned tumors include 319 cases(less than one half percent) which had histologies not assigned by CBTRUS to any other category For SEERunclassifiedunassigned tumors include all malignant histologies occurring in the brainCNS which could not beclassified in one of the above categories based on their 4-digit histologic type
Page 36
Endash
APPENDIX E
TABLE 9 NUMBER AND PERCENT OF PRIMARY INTRACRANIAL AND CENTRAL NERVOUS SYSTEM TUMORS OF BENIGN AND UNCERTAIN BEHAVIOR
BY HISTOLOGY GROUPINGS
WHO Histologya
Groupings CBTRUSb
Number () MCSSc
Number () NCDBd
Number () SEERe
Number ()
Neuroepithelial 275 (43) 91 (46) 1064 (46) NA
Tumors of cranial and spinal nerves
980 (153) 397 (202) 2618 (113) NA
Tumors of meninges
3509 (548) 941 (480) 13667 (590) NA
LymphomasHemopoietic
3 (lt01) 0 7 (lt01) NA
Germ cell 4 (lt01) 1 (01) 25 (01) NA
Cysts and tumor-like lesions
15 (02) 3 (02) 34 (01) NA
Tumors of sellar region
1444 (226) 510 (260) 4749 (205) NA
Local extensions 0 0 0 NA
Unclassifiedunassigned tumorsf
171 (27) 18 (09) 1011 (44) NA
TOTAL 6401 (100) 1961 (100) 23175 (100) NA
Note Reported data are incident cases from 1989-1994 except for CBTRUS which is 1990-1993
aRefer to the World Health Organization (WHO) histology groupings in Appendix CbCentral Brain Tumor Registry of the United States c Minnesota Cancer Surveillance System (microscopically confirmed cases only) dNational Cancer Data Base (limited to cases reported by hospitals that accessioned nonmalignant cases) eSurvival Epidemiology and End Results Program (malignant cases only)dFor MCSS unclassifiedunassigned tumors include one malignant and four nonmalignant histologies which werenot listed in the CBTRUS classification scheme For NCDB unclassifiedunassigned tumors include 319 cases(less than one half percent) which had histologies not assigned by CBTRUS to any other category For SEERunclassifiedunassigned tumors include all malignant histologies occurring in the brainCNS which could not beclassified in one of the above categories based on their 4-digit histologic typeNA = Not applicable
Page 37
Endash
DATA COLLECTION
OF PRIMARY
CENTRAL NERVOUS
SYSTEM TUMORS
TABLE 10 METHOD OF CASE FINDING FOR PRIMARY INTRACRANIAL AND CENTRAL NERVOUS SYSTEM TUMORS BY TUMOR BEHAVIOR AND LOCATION MINNESOTA 1989-1994
Behavior Tumor Locationa
Number of Cases
Percent Found byRoutine
Reporting
Percent Found by Special Efforts
Malignant Brain Cerebral meninges
Pituitarycranio duct pineal Other intracranial
18841746 23 33
22
961 965 957 939
864
39 35 43 61
136 Extracranial 60 883 117 Benign Brain
1787 99
788 838
212 162
Cerebral meninges Pituitarycranio duct
pineal Other intracranial
807 458
263
843 740
779
157 260
221 Extracranial 160 631 369 Uncertain 174 856 144 Brain 79 823 177 Cerebral meninges Pituitarycraniopharyn- geal ductpineal Other intracranial
8 60
2
875 850
1000
125 150
00 Extracranial 25 960 40
TOTAL 3845 876 124
aRefer to the site codes in Appendix B
Page 38
Endash
1989 1990 1991 1992 1993 1994
TOTAL
APPENDIX E TABLE 11 METHOD OF CASE FINDING FOR INTRACRANIALa TUMORS BY DIAGNOSIS YEAR MINNESOTA 1989-1994
DiagnosisYear
Number of
Cases
Percent Found byRoutine
Reporting
Percent Found by
Special Efforts
571 837 163 616 865 135 586 913 87 602 899 101
633 872 128 592 929 71
3600 886 114
aIncludes the brain cerebral meninges pituitary gland pineal gland and otherintracranial tumors (refer to the site codes in Appendix B)
Page 39
Endash
DATA COLLECTION
OF PRIMARY
CENTRAL NERVOUS
SYSTEM TUMORS
TABLE 12 METHOD OF CASE FINDING FOR NONMALIGNANT INTRACRANIALa TUMORS BY TYPE OF FACILITY MINNESOTA 1989-1994
Type of Facility Number of Tumors Percent Found byRoutine
Reporting
Percent Found by Special Efforts
Registry at facility No registry at facility
1451325
859 569
141 431
TOTAL 1776 806 194
aIncludes tumors with benign or uncertain behavior that involve the brain cerebral meningespituitary gland pineal gland or other intracranial sites (refer to the site codes in Appendix B)
TABLE 13 REPORTING METHOD AND SOURCE OF CASE FINDING FOR NON- MALIGNANT INTRACRANIALa TUMORS DIAGNOSED IN HOSPITALS WITH A TUMOR REGISTRY MINNESOTA 1989-1994
Reporting Method Number of Tumors Percent Found byRoutine
Reporting
Percent Found by
Special Efforts
Registry-reportedLaboratory-reported
1226225
925 502
75 498
TOTAL 1451 859 141
aIncludes tumors with benign or uncertain behavior that involve the brain cerebral meningespituitary gland pineal gland or other intracranial sites (refer to the site codes in Appendix B)
Page 40
Endash0
APPENDIX E TABLE 14 HOSPITAL REGISTRY ACCESSIONING OF MALIGNANT AND NON-
MALIGNANT PRIMARY INTRACRANIAL AND CENTRAL NERVOUS SYSTEM TUMORS NCDB 1989-1994
TUMOR Totalb
BEHAVIOR Malignant c Nonmalignantd
Tumor Locationa HospitalsReporting
Number ()
Hospitals Reporting
Number ()
Hospitals Reporting
Number ()
Intracranial 1542 (100) 1526 (100) 900 (99)
Brain 1527 (99) 1519 (gt99) 754 (83)
Meninges 740 (48) 390 (26) 613 (67)
Pituitaryglandcraniopharyn-
geal duct
602 (39) 168 (11) 538 (59)
Pineal gland 319 (21) 277 (18) 79 (9)
Other central nervous system including cranial
nerves
648 (42) 545 (36) 299 (33)
Extracranial 812 (53) 708 (46) 410 (45)
Spinal cord 760 (49) 692 (45) 311 (34)
Spinal meninges 299 (19) 72 (5) 258 (28)
TOTAL Hospitals 1542 (100) 1526 (100) 913 (100)
Note The number of hospitals in each of the second third and fourth columns is the number that submittedreports to the NCDB for any intracranial and central nervous system tumors for the respective malignancystatus Not all hospitals submitted reports for each year during the study period (1989-1994)
aRefer to the site codes in Appendix B bBehavior codes = 0 1 3 cBehavior code = 3 dBehavior codes = 0 1
Page 41
Endash
DATA COLLECTION
OF PRIMARY
CENTRAL NERVOUS
SYSTEM TUMORS
Texas Cancer Registry
1997 CBTRUS State Survey of Benign Brain Tumor Data Collection
State Collection Status
Currently Collecting Benign Tumor Data1 Arizona Cancer Registry since 1981 2 Colorado Central Cancer Registry since 1988 3 Connecticut Tumor Registry since 1965 4 Idaho Cancer Data Registry since 1970 5 Maine Cancer Registry since 1983 6 Massachusetts Cancer Registry since 1982 7 Minnesota Cancer Surveillance System since 1988 8 Montana Central Tumor Registry since 1979 9 New York State Cancer Registry since 1988
10 North Carolina Central Cancer Registry since 1990 11 Utah Cancer Registry since 1966 12 Virginia Cancer Registry since 1994 13 Delaware State Cancer Registry14 Washington State Cancer Registry since 1992 15 passive collection 1979-1994
active collection since 1995
Stopped or Passive Collection of Benign Tumor Data1 New Jersey State Cancer Registry stopped 1979-1995 2 Kansas Cancer Registry stopped 1969-1995 3 New Hampshire State Cancer Registry stopped 1986-1991 4 District of Columbia Cancer Registry stopped 1997 5 Wyoming Cancer Surveillance Program stopped 111996 6 Louisiana Tumor Registry stopped 1992 (passive collection) 7 Illinois State Cancer Registry stopped 111996 8 Missouri Cancer Registry passive collection since 1984 9 South Carolina Central Cancer Registry passive collection since 1996
Beginning Collection of Benign Tumor Data1 North Dakota Cancer Registry began collection 1997 2 Rhode Island Cancer Registry began collection 1998
Page 42
Endash
APPENDIX E
Codes for Primary Intracranial and Central Nervous System Tumors
Note For this report the designation of ldquoprimary intracranial and central nervous system tumorsrdquo includes thefollowing primary tumors of central nervous system sites as well as tumors of the pituitary and pinealglands All histology types within the topography codes are included in the designation of ldquoprimaryintracranial and CNS tumors The source for the topography codes is Percy C Van Holten V Muir Ceds International Classification of Diseases for Oncology Second Edition Geneva World Health Organization 1990
Intracranial tumors
Brain C710 Cerebrum C711 Frontal lobe C712 Temporal lobe C713 Parietal lobe C714 Occipital lobe C715 Ventricle NOSC716 Cerebellum NOS C717 Brain stem C718 Overlapping lesion of brain C719 Brain NOS
Meninges C700 Cerebral meninges C709 Meninges NOS
a
Cranial Nerves and other intracranial parts of the central nervous systemC722 Olfactory nerve C723 Optic nerve C724 Acoustic nerve C725 Cranial nerve NOS C728 Overlapping lesion of brain and central nervous system C729 Nervous system NOS
Other endrocrine glands and related structures C751 Pituitary gland C752 Craniopharyngeal duct C753 Pineal gland
Extracranial tumors
Spinal cord C720 Spinal cord C721 Cauda equina
Meninges C701 Spinal meninges
aNOS=Not Otherwise Specified
Page 43
Endash
DATA COLLECTION
OF PRIMARY
CENTRAL NERVOUS
SYSTEM TUMORS
Brain Tumor Histology Groupings
The following histology groupings were used for the primary intracranial and central nervoussystem tumors The source for the histology groupings is Central Brain Tumor Registry ofthe United States (CBTRUS) 1996 Statistics Report Table 4
WHOa HISTOLOGY GROUPINGS ICD-Ob MORPHOLOGY CODE
Diffuse astrocytoma (protoplasma fibrillary) 9410 9420 Anaplastic astrocytoma 9401 9411 Glioblastoma 9440 9441 9442 Pilocytic astrocytoma 9421 Unique astrocytoma variants 9383 9384 9424 Oligodendroglioma 9450 Anaplastic oligodendroglioma 9451 9460 Ependymomaanaplastic ependymoma 9391 9392 9393 Ependymoma variants 9394 Mixed glioma 9382 Astrocytoma NOSc 9400 Glioma malignant NOS 9380 Choroid plexus 9390 Neuroepithelial 9381 9423 9430 Benign neuronalglial neuronal and mixed 86801 8693 9490 9505 9506 Malignant neruonalglial neuronal and mixed 86803 9364 9490 9500 Pineal parenchymal 9360 9361 9362 Embryonalprimitivemedulloblastoma 8963 9470 9471 9472
9473 9501 9502 9503 9510
TUMORS OF NEUROEPITHELIAL TISSUE
TUMORS OF CRANIAL AND SPINAL NERVES Nerve sheath benign and malignant 9540 9550 9560 9570
TUMORS OF THE MENINGES Meningioma 9530 9531 9532 9533 9534 9537 9538 Other mesenchymal benign and malignant 8800 8801 8802 8803 8810 8830 8850 88618900
8910 8990 9133 9150 9240 9480 9481 9536 9539 Hemangioblastoma 9161 9535
LYMPHOMAS AND HEMOPOIETIC NEOPLASMS Lymphoma 9590 9591 9593 9594 9595 9630 9650 9652
9663 9670 9671 9672 9674 9675 9680 9681 9682 9684 9685 9686 9687 9690 9691 96939695 9696 9698 9702 9714 9723 9731 9766 9970
GERM CELL TUMORS Germ cell 8020 9060 9064 9070 9071 9080 9084 9085 9100
CYSTS AND TUMOR-LIKE LESIONS Cysts and heterotopias 9084
TUMORS OF THE SELLAR REGION Pituitary 8040 8l40 8l46 8260 8270 8271 8280
8281 8290 8300 8330 8323 8333 Craniopharyngioma 9350
Page 44
Endash
APPENDIX E
LOCAL EXTENSIONS FROM REGIONAL TUMORS Chordomachondrosarcoma 9370
UNCLASSIFIED TUMORS Hemangioma 9120 9121 9130 9131 Neoplasm benign 80000 8010 Neoplasm uncertain behavior 80001 80011 Neoplasm malignant 80003 80013 8002 8003 All other 8720 9580
aWHO = World Health OrganizationbICD-O = International Classification of Diseases for Oncology Second Edition 1990 cNOS=Not Otherwise Specified
Page 45
Endash
DATA COLLECTION
OF PRIMARY
CENTRAL NERVOUS
SYSTEM TUMORS
Endash
International Classification of Childhood Cancer (ICCC)
Diagnostic Group
ICD-Oa codes
Morphology Topography
I LEUKAEMIA
(a) Lymphoid leukaemia 9820-9827 9850
(b) Acute non-lymphocytic leukaemia 9840 9841 9861 9864 9866 9867 98919894 9910
(c) Chronic myeloid leukaemia 9863 9868
(d) Other specified leukaemias 9830 9842 9860 9862 9870-9890 9892 98939900 9930-9941
(e) Unspecified leukaemias 9800-9804
II LYMPHOMAS AND OTHER RETICULOENDOTHELIAL NEOPLASMS
(a) Hodgkinrsquos disease 9650-9667
(b) Non-Hodgkinrsquos lymphoma 9591-9595 9670-9686 9690-9714 9723
(c) Burkittrsquos lymphoma 9687
(d) Miscellaneous lymphoreticular neoplasms 9720 9731-9764
(e) Unspecified lymphomas 9590
III CENTRAL NERVOUS SYSTEM (CNS) ANDMISCELLANEOUS INTRACRANIAL AND
INTRASPINAL NEOPLASMSb
(a) Ependymomac 9383 9390-9394
(b) Astrocytoma 9380 C723
9381 9400-9441
(c) Primitive neuroectodermal tumours 9470-9473
(d) Other gliomasd 9380 C700-C722C724-C729
9382 9384
9442-9460 9481
APPENDIX E
Diagnostic Group
ICD-Oa codes
Morphology Topogragphy
III CNS AND MISCELLANEOUS INTRACRANIAL AND INTRASPINAL
NEOPLASMSb Continued
(e) Miscellaneous intracranial and intraspinalneoplasmsc
8270-8281 8300 9350-9362 9480 95059530-9539
(f) Unspecified intracranial and intraspinalneoplasmsc
8000-8004 C700-C729C751-C753
IV SYMPATHETIC NERVOUS SYSTEM TUMOURS
(a) Neuroblastoma and ganglioneuroblastoma 9490 9500
(b) Other sympathetic nervous system tumours 8680 8693-8710 9501-9504 9520-9523
aInternational Classification of Diseases for Oncology Second Edition World Health Organization 1990bGroup III excludes all lymphomas See group II cBehaviour codes 0 and 1 are included dBehaviour code 1 is included
Page 47
Endash
Comments and recommendations are welcome Should questions arise on how to use these
materials or for more information please contact
Centers for Disease Control and Prevention National Program of Cancer Registries
4770 Buford Hwy NE Mail Stop K-53
Atlanta GA 30042-3717
Voice Information System 1 (888) 842-6355 bull Fax (770) 488-4760
cancerinfocdcgov bull httpwwwcdcgovcancer
All materials are in the public domain and may be reproduced or copied without permission citation
to source however is appreciated
BACK COVER
(WHITE)
Spine(WHITE)
DATA COLLECTION OF PRIMARY CEN
TRAL NERVOUS SYSTEM
TUM
ORS 2004
National Program of Cancer Registries Training M
aterials
APPENDIX E
RECOMMENDATIONS OF THE BRAIN TUMOR WORKING GROUP
1 We recommend the following standard definition for collecting precise data for all primary
intracranial and central nervous system tumors
Primary intracranial and central nervous (CNS) tumors are primary tumors occurring in
the following sites irrespective of histologic type or behavior brain meninges spinal
cord cauda equina cranial nerves and other parts of the CNS pituitary gland pineal
gland and craniopharyngeal duct (see Appendix B)
2 We recommend the development of a standard site and histology definition for tabulating
estimates of these tumors to allow comparability of information across registries Pathologists
the North American Association of Central Cancer Registries (NAACCR) the Commission
on Cancer (COC) the Surveillance Epidemiology and End Results (SEER) Program the
National Program of Cancer Registries (NPCR) and the International Agency for Research
on Cancer (IARC) need to be involved in developing this standard
3 We recommend collection of data for primary intracranial and extracranial CNS tumors by all
registries hospital- and central-based This effort will necessitate a change in the COC
requirements and will increase costs to the hospital-based programs Federal funding should be
allocated to supplement the additional transition and ongoing data collections costs that will be
incurred by central registries Before additional data collection is implemented we recommend
a pilot study should be conducted to assess the procedures and quality control functions
needed as well as the costs of collecting data for these tumors
4 We recommend that the appropriate government and professional organizations be involved in
carrying out the development and implementation of special training programs and curricula for
central registry hospital registry and laboratory personnel as well as the development of
computerized edit-checking procedures Training for reporting and tabulating primary
intracranial and CNS tumors should be offered on a regular basis
Page 25
Endash
DATA COLLECTION
OF PRIMARY
CENTRAL NERVOUS
SYSTEM TUMORS
Endash
REFERENCES
1 Davis F Preston-Martin S Epidemiology of brain tumors In Bigner DD McLendon RE Bruner JM eds Russell and Rubinsteins pathology of tumors of the nervous system ed 6 London Arnold Publishing 19965-45
2 World Health Organization (WHO) (1976) International classification of diseases foroncology ed 1 Geneva World Health Organization
3 World Health Organization (WHO) (1990) International classification of diseases foroncology ed 2 Geneva World Health Organization
4 Kleihues P Burger PC Scheithauer BW The new WHO classification of brain tumorsBrain Pathol 19933255-268
5 Thapar K Laws ER Tumors of the central nervous system In Murphy GP Lawrence WJr Lenhard RE Jr eds Textbook of clinical oncology ed 2 Atlanta American CancerSociety 1995378-410
6 Walker AE Robins M Weinfield FD Epidemiology of brain tumors the national survey ofintracranial neoplasms Neurol 198535219-226
7 Ries LAG Kosary CL Hankey BF Miller BA Edwards BK (eds) SEER Cancer StatisticsReview 1973-1995 National Cancer Institute Bethesda MD 1998
8 Cancer Facts amp Figures - 1998 American Cancer Society Atlanta Georgia 19989 Davis FG Bruner JM Surawicz TS The rationale for standardized registration and reporting
of brain and central nervous system tumors in population-based cancer registriesNeuroepidemiol 199716308-316
10CBTRUS (1996) First annual report 1995 Central Brain Tumor Registry of the UnitedStates Chicago Illinois
11 Preston-Martin S Epidemiology of primary CNS neoplasms Neurol Clinics 199614273-290
12 Greig NH Ries LG Yancik R Rapoport SI Increasing annual incidence of primary malignantbrain tumors in the elderly J Natl Cancer Inst 1991 831621-1624
13 Mao Y Desmeules M Semenciw RM Hill G Gaudette L Wigle DT Increasing brain cancerrates in Canada Can Med Assoc J 19911451583-1591
14 Frelick R Huang P Topham A Brain and central nervous system tumors Delaware 1980 to1989 Del Med J 199264571-573
15 Davis DL Ahlbom A Hoel D Percy C Is brain cancer mortality increasing in industrialcountries Am J Ind Med 199119421-431
16 Helseth A Increasing incidence of primary central nervous system tumors in the elderly Realincrease or improved detection J Natl Cancer Inst 1993851871-1872
17 Modan B Wagener D Feldman JJ Rosenberg HM Feinleib M Increased mortality frombrain tumors A combined outcome of diagnostic technology and change of attitude towardthe elderly Am J Epidemiol 19921351349-1357
18 Polednak AP Time trends in the incidence of brain and central nervous system cancers inConnecticut J Natl Cancer Inst 1991831679-1681
19 Boyle P Maissonneuve P Saracci R Muir CS Is the increase in incidence of primarymalignant brain tumors real J Natl Cancer Inst 1990201594-1596
Page 26
APPENDIX E 20 Preston-Martin S Descriptive epidemiology of primary tumors of the brain cranial nerves
and spinal meninges in Los Angeles County Neuroepidemiol 19898283-29521 Helseth A Mork SJ Neoplasms of the central nervous system in Norway Epidemiological
characteristics of intracranial gliomas according to histology APMIS 97 1989547-55522 Gurney JG Davis S Severson RK Fang J-Y Ross JA Robison LL Trends in cancer
incidence among children in the United States Cancer 199678532-54123 Gurney JG Ross JA Wall DA Bleyer WA Severson RK Robison LL Infant cancer in the
US histology-specific incidence trends 1973-1992 J Pediatr Hem Onc 199719428-43224 Nishio S Takeshita I Morioka T Fukui M Primary intracranial squamous cell carcinomas
report of two cases Neurosurgery 199537329-33225 Freilich RJ Thompson SJ Walker RW Rosenblum MK Adenocarcinomatous transformation
of intracranial germ cell tumors Am J Surg Pathol 199519537-54426Yuan S Miller DW Barnett GH Hahn JF Williams BR Identification and characterization of
human beta 2-chimaerin association with malignant transformation in astrocytoma CancerResearch 1995 553456-3461
27 Preston-Martin S Mack WJ Neoplasms of the nervous system In Schoenfeld D Fraumeni JFJr eds Cancer epidemiology and prevention ed 2 New York Oxford University Press19961231-1281
28 Riggs JE Rising primary malignant brain tumor mortality in the elderly A manifestation ofdifferential survival Arch of Neurol 199552571-575
29 Davis FG Freels S Grutsch J Barlas S Brem S Survival rates in patients with primarymalignant brain tumors stratified by patient age and tumor histological type an analysisbased on Surveillance Epidemiology and End Results (SEER) data 1973-1991J Neurosurg 1998881-10
30 Surawicz TS Davis F Freels S Laws ER Menck HR Brain tumor survival results from theNational Cancer Data Base (Accepted for publication in J Neuro-Oncol)
31 Bondy ML Lustbader ED Buffler PA Schull WJ Hardy RJ Strong LC Geneticepidemiology of childhood brain tumors Genet Epidemiol 19918253-267
32 Preston-Martin S Monroe K Lee P Bernstein L Kelsey J Henderson S Forrester DHenderson B Spinal meningiomas in women in Los Angeles County Investigation of anetiologic hypothesis Cancer Epidemiol Biomarkers Prev 19954333-339
33 Davis JR Brownson RC Garcia R Bentz BJ Turner A Family pesticide use and childhoodbrain cancer Arch Environ Contam Toxicol 19932487-92
34 Commission on Cancer General principles and coding In Standards of the Commission on Cancer vol II Registry Operations and Data Standards American College of SurgeonsChicago Illinois 1996
35 Central Brain Tumor Registry of the United States (CBTRUS) 1997 State Survey of BenignBrain Tumor Collection Chicago Illinois 1997
36 Davis FG Malinski N Haenszel W Chang J Flannery J Gershman S Dibble R Bigner DDPrimary brain tumor incidence rates in the four United States regions 1985-1989 A pilotstudy Neuroepidemiol 199615103-112
37 Schoenberg BS Christine BW Whisnant JP The descriptive epidemiology of primaryintracranial neoplasms the Connecticut experience Am J Epidemiol 1976104499-510
Page 27
Endash
DATA COLLECTION
OF PRIMARY
CENTRAL NERVOUS
SYSTEM TUMORS
TAB
LE 1
C
OM
PAR
ISO
N O
F R
EGIS
TRIE
S SU
PPLY
ING
DA
TA O
N P
RIM
AR
Y I
NTR
AC
RA
NIA
L A
ND
CEN
TRA
L N
ERV
OU
S SY
STEM
TU
MO
RS
IN T
HE
UN
ITED
STA
TES
Cen
tral B
rain
Tum
or R
egis
try o
fth
e U
nite
d St
ates
(CBT
RUS)
Min
neso
ta C
ance
rSu
rvei
llanc
e Sy
stem
(MC
SS)
ACo
SN
a tio
nal C
ance
r Dat
a B
ase
(NCD
B)
Surv
eilla
nce
Epid
emio
logy
and
End
Res
ults
Pro
gram
(SEE
R)
Purp
ose
ldquoCB
TRU
S ce
ntra
lizes
pop
ulat
ion-
base
d in
cide
nce
data
on
all b
rain
tum
ors a
nd u
ses o
ther
exi
stin
gda
ta re
sour
ces t
o ch
arac
teriz
e th
ein
cide
nce
mor
talit
y a
nd su
rviv
alof
pat
ient
s with
bra
in tu
mor
s rdquo
The
MC
SS c
olle
cts i
nfor
mat
ion
onal
l can
cers
dia
gnos
ed si
nce
1988
amon
g M
inne
sota
resi
dent
s Th
e M
CSS
is p
opul
atio
n-ba
sed
path
olog
y-ba
sed
and
is a
n ac
tive
syste
m
ldquoThe
goa
l of t
he N
CD
B is
to p
rese
nt a
n an
nual
sum
mar
y of
pat
ient
car
e fo
r cas
es o
f can
cer
diag
nose
d an
d tre
ated
at h
ospi
tals
thro
ugho
utth
e co
untry
rdquo
ldquoA c
ontin
uing
pro
ject
of th
e N
CI
the
SEER
prog
ram
col
lect
sca
ncer
dat
a on
aro
utin
e ba
sis f
rom
desi
gnat
ed p
opul
atio
n-ba
sed
canc
er re
gist
ries
in v
ario
us a
reas
of t
heco
untry
Targ
et p
opul
atio
n Th
e po
pula
tions
cov
ered
by
regi
strie
s in
Ari
zona
Col
orad
oC
onne
ctic
ut D
elaw
are
Idah
oM
aine
Mas
sach
uset
ts
Min
neso
ta M
issou
ri M
onta
na
Nor
th C
arol
ina
and
Uta
h
The
CB
TRU
S po
pula
tion
repr
esen
ts a
non
rand
om 1
5pe
rcen
t sam
ple
of th
e U
S
popu
latio
n
The
popu
latio
n of
Min
neso
ta
The
popu
latio
ns tr
eate
d at
par
ticip
atin
gho
spita
ls in
the
50 st
ates
the
Dist
rict
of
Col
umbi
a a
nd P
uert
o R
ico
NC
DB
is n
ot a
pop
ulat
ion-
base
d re
gist
ry
At
pres
ent
it is
est
imat
ed to
cov
er a
ppro
xim
atel
y57
per
cent
of t
otal
cas
es n
atio
nwid
e
The
popu
latio
nsco
vere
d by
the
state
regi
strie
s in
Con
nect
icut
Haw
aii
Iow
a N
ew M
exic
o
and
Uta
h a
s wel
l as
the
regi
onal
regi
strie
sin
Atla
nta
Geo
rgia
D
etro
it M
ichi
gan
San
Fran
cisc
o-O
akla
nd C
alifo
rnia
an
d Se
attle
-Pug
etSo
und
Was
hing
ton
The
SEER
pop
ulat
ion
repr
esen
ts a
nonr
ando
m 1
4 pe
rcen
tsa
mpl
e of
the
US
po
pula
tion
Page
28
Endash
APPENDIX E
Cen
tral B
rain
Tum
or R
egis
try o
fth
e U
nite
d St
ates
(CBT
RUS)
Min
neso
ta C
ance
rSu
rvei
llanc
e Sy
stem
(MC
SS)
ACo
SN
a tio
nal C
ance
r Dat
a B
ase
(NCD
B)
Surv
eilla
nce
Epid
emio
logy
and
End
Res
ults
Pro
gram
(SEE
R)
Type
of
prim
ary
intra
cran
ial
and
cent
ral n
ervo
us sy
stem
tum
ors r
epor
ted
Dat
a on
new
ly-d
iagn
osed
cas
es o
fbe
nign
and
mal
igna
nt p
rimar
ybr
ain
tum
ors b
ased
on
ICD
-Oco
des
Dat
a on
new
ly-d
iagn
osed
m
i cro
scop
ical
ly-c
onfir
med
tum
ors
of th
e ce
ntra
l ner
vous
syste
m
incl
udin
g pi
tuita
ry a
nd p
inea
lgl
ands
Hos
pita
ls v
olun
taril
y su
bmit
full
anal
ytic
canc
er re
gist
ry c
asel
oads
with
dat
a ite
ms a
ndco
des d
efin
ed b
y th
e C
omm
issio
n on
Can
cer
(CO
C) f
or h
ospi
tal c
ance
r reg
istri
es
Mos
tpa
rtici
patin
g ho
spita
ls h
ave
prog
ram
sap
prov
ed b
y C
OC
or a
re e
stab
lishi
ng p
rogr
amap
prov
al
NC
DB
cal
ls fo
r dat
a do
not
lim
itca
ses b
y m
alig
nant
beh
avio
r bu
t acc
essi
onin
gof
non
-mal
igna
nt c
ases
is n
ot re
quire
d fo
rpr
ogra
m a
ppro
val
Fifty
-nin
e pe
rcen
t of t
heho
spita
ls th
at su
bmitt
ed a
ny in
tracr
ania
lCN
Sca
ses d
iagn
osed
dur
ing
1989
-199
4 su
bmitt
edat
leas
t one
non
mal
igna
nt c
ase
The
NC
DB
data
in th
is re
port
are
limite
d to
the
case
ssu
bmitt
ed b
y th
ese
hosp
itals
(82
perc
ent o
f all
intra
cran
ial a
nd e
xtra
cran
ial c
entra
l ner
vous
syste
m c
ases
on
file)
Tren
ds in
the
inci
denc
e m
orta
lity
and
patie
nt su
rviv
al o
fbr
ain
tum
ors i
n th
eU
S H
owev
er S
EER
does
not
col
lect
info
rmat
ion
on b
enig
nan
d un
certa
in b
rain
tum
ors
Oth
er c
omm
ents
D
uplic
ate
canc
er re
gist
ratio
ns c
anno
t be
iden
tifie
d by
the
parti
cipa
ting
regi
strie
s
The
MC
SS p
erfo
rms 1
00 p
erce
ntca
se fi
ndin
g au
dits
in a
ll pa
thol
ogy
labo
rato
ries o
n an
ann
ual b
asis
Th
eref
ore
the
data
from
the
MC
SSm
ight
be
cons
ider
ed a
ldquobe
st-ca
sesc
enar
iordquo
in te
rms o
f com
plet
enes
sof
repo
rting
for m
icro
scop
ical
ly-
conf
irmed
tum
ors
Rep
ort d
uplic
atio
n fo
r 198
9-19
94 in
tracr
ania
lan
d ex
tracr
ania
l cen
tral n
ervo
us sy
stem
repo
rts w
as 6
7 p
erce
nt
How
ever
the
NC
DB
data
in T
able
s 2 th
roug
h 9
are
base
d on
undu
plic
ated
repo
rts
Page
29
Endash
DATA COLLECTION
OF PRIMARY
CENTRAL NERVOUS
SYSTEM TUMORS
TABLE 2 NUMBER AND PERCENT OF PRIMARY INTRACRANIAL AND CENTRAL NERVOUS SYSTEM TUMORS BY TUMOR LOCATION
Locationa CBTRUSb
Number () MCSSc
Number () NCDBd
Number () SEERe
Number ()
Intracranial 13084 (947) 3600 (936) 66322 (955) 10196 (969)
Brain 7999 (579) 1924 (500) 48527 (699) 9721 (924)
Meninges 2719 (197) 838 (218) 9365 (135) 139 (13)
Pituitarycraniopharygealduct
1491 (108) 530 (138) 4958 (71) 30 (03)
Pineal 74 (05) 21 (05) 477 (07) 80 (08)
Other central nervous systemincluding cranial nerves
801 (58) 287 (75) 2995 (43) 226 (22)
Extracranial 730 (53) 245 (64) 3137 (45) 322 (31)
Spinal cord 497 (36) 47 (38) 2395 (34) 313 (30)
Spinal meninges 233 (17) 98 (25) 742 (11) 9 (01)
TOTAL 13814 (100) 3845 (100) 69459 (100) 10518 (100)
Note Reported data are incident cases from 1989-1994 except for CBTRUS data which are from 1990-1993
aRefer to the sites in Appendix BbCentral Brain Tumor Registry of the United States cMinnesota Cancer Surveillance System (microscopically confirmed cases only)dNational Cancer Data Base (limited to cases reported by hospitals that accessioned nonmalignant cases) eSurvival Epidemiology and End results Program (malignant cases only)
Page 30
Endash0
TABL
E 3
RO
W P
ERCE
NT
DIS
TRIB
UTI
ON
OF
PRIM
ARY
INTR
ACR
AN
IAL
AN
D C
ENTR
AL
NER
VO
US
SYST
EM T
UM
ORS
BY
TU
MO
R B
EHA
VIO
RA
ND
MIC
ROSC
OPI
C C
ON
FIRM
ATI
ON
Loca
tiona
CB
TRU
Sb M
CSSc
NC
DB
d SE
ERe
Tota
l Pe
rcen
tM
icro
Co
nfirm
ed
Perc
ent
Not
Mic
ro
Conf
irmed
Tota
l Pe
rcen
tM
icro
Co
nfirm
ed
Perc
ent
Not
Mic
ro
Conf
irmed
Tota
l Pe
rcen
tM
icro
Co
nfirm
ed
Perc
ent
Not
Mic
ro
Conf
irmed
Tota
l Pe
rcen
tM
icro
Co
nfirm
ed
Perc
ent
Not
Mic
ro
Conf
irmed
Intra
cran
ial
130
84
867
13
3
360
0 10
0 N
A
663
22
887
11
3
101
96
871
12
9
Mal
igna
nt
717
1 89
2
108
1
824
100
NA
44
801
91
3
87
101
96
871
12
9
Beni
gn a
ndu n
certa
in
591
3 83
5
165
1
776
100
NA
21
521
83
2
168
N
A
NA
N
A
Bra
in
799
9 88
2
118
1
924
100
NA
48
527
90
2
98
972
1 87
3
127
Mal
igna
nt
686
2 89
6
104
1
746
100
NA
42
622
91
5
85
972
1 87
3
127
Beni
gnan
dun
certa
in
113
7 80
6
194
17
8 10
0 N
A
590
5 80
6
194
N
A
NA
N
A
Extra
cran
ial
730
962
3
8 24
5 10
0 N
A
313
7 96
0
40
322
957
4
3
Mal
igna
nt
242
934
6
6 60
10
0 N
A
148
3 96
6
34
322
957
4
3
Beni
gn a
ndu n
certa
in
488
975
2
5 18
5 10
0 N
A
165
4 95
5
45
NA
N
A
NA
TOTA
Lf 13
814
87
2
128
3
845
100
NA
69
459
89
0
110
10
518
87
4
126
Mal
igna
nt
741
3 89
4
106
1
884
100
NA
46
284
91
5
85
105
18
874
12
6
Beni
gn a
ndu n
certa
in
640
1 84
6
154
1
961
100
NA
23
175
84
1
159
N
A
NA
N
A
Not
e R
epor
ted
data
are
inci
dent
cas
es fr
om 1
989-
1994
exc
ept f
or C
BTR
US
data
whi
ch a
re fr
om 1
990-
1993
a Refe
r to
the
site
code
s in
App
endi
x B
b Cent
ral B
rain
Tum
or R
egist
ry o
f the
Uni
ted
Stat
es
c Min
neso
ta C
ance
r Sur
veill
ance
Sys
tem
(mic
rosc
opic
ally
con
firm
ed c
ases
onl
y)
d Nat
iona
l Can
cer D
ata
Base
(lim
ited
to c
ases
repo
rted
by h
ospi
tals
that
acc
essio
ned
nonm
alig
nant
cas
es)
e Surv
eilla
nce
Epi
dem
iolo
gy a
nd E
nd R
esul
ts Pr
ogra
m (m
alig
nant
cas
es o
nly)
f In
clud
es in
tracr
ania
l and
ext
racr
ania
l cas
es
NA
= N
ot a
pplic
able
Page
31
APPENDIX E
Endash
DATA COLLECTION
OF PRIMARY
CENTRAL NERVOUS
SYSTEM TUMORS
TABLE 4 NUMBER AND PERCENT OF PRIMARY INTRACRANIAL AND CENTRAL NERVOUS SYSTEM TUMORS BY DIAGNOSTIC CONFIRMATION
DiagnosticConfirmation
CBTRUSa
Number () MCSSb
Number () NCDBc
Number () SEERd
Number ()
Positive microscopy
12087 (875) 3845 (100) 61818 (890) 9188 (874)
Radiographywithout microscopy
1306 (95) NA 6759 (97) 1015 (97)
Clinical 204 (15) NA 484 (07) 98 (09)
Unknown 217 (15) NA 398 (06) 217 (21)
TOTAL 13814 (100) 3845 (100) 69459 (100) 10518 (100)
Note Reported data are incident cases from 1989-1994 except for CBTRUS data which are from 1990-1993
aCentral Brain Tumor Registry of the United Statesb Minnesota Cancer Surveillance System (microscopically confirmed cases only) cNational Cancer Data Base (limited to cases reported by hospitals that accessioned nonmalignant cases)dSurveillance Epidemiology and End Results Program (malignant cases only)NA = Not applicable
Page 32
Endash
Page 32
TABLE 4 NUMBER AND PERCENT OF PRIMARY INTRACRANIAL AND CENTRALNERVOUS SYSTEM TUMORS BY DIAGNOSTIC CONFIRMATION
DiagnosticConfirmation
CBTRUSa
Number ()MCSSb
Number ()NCDBc
Number ()SEERd
Number ()
Positivemicroscopy
12087 (875) 3845 (100) 61818 (890) 9188 (874)
Radiographywithout microscopy
1306 (95) NA 6759 (97) 1015 (97)
Clinical 204 (15) NA 484 (07) 98 (09)
Unknown 217 (15) NA 398 (06) 217 (21)
TOTAL 13814 (100) 3845 (100) 69459 (100) 10518 (100)
Note Reported data are incident cases from 1989-1994 except for CBTRUS data which are from 1990-1993
aCentral Brain Tumor Registry of the United Statesb Minnesota Cancer Surveillance System (microscopically confirmed cases only)cNational Cancer Data Base (limited to cases reported by hospitals that accessioned nonmalignant cases)dSurveillance Epidemiology and End Results Program (malignant cases only)NA = Not applicable
APPENDIX E
TABLE 5 NUMBER AND PERCENT OF MALIGNANT PRIMARY INTRACRANIAL AND CENTRAL SYSTEM TUMORS BY TUMOR LOCATION
Locationa CBTRUSb
Number () MCSSc
Number () NCDBd
Number () SEERe
Number ()
Intracranial 7171 (977) 1824 (968) 44801 (968) 10196 (969)
Brain 6862 (926) 1746 (927) 42622 (921) 9721 (924)
Meninges 98 (13) 23 (12) 581 (13) 139 (13)
Pituitarycraniopharyngealduct
37 (05) 13 (07) 189 (04) 30 (03)
Pineal 58 (08) 20 (11) 378 (08) 80 (08)
Other central nervous systemincluding cranial nerves
116 (16) 22 (12) 1031 (22) 226 (21)
Extracranial 242 (33) 60 (32) 1483 (32) 322 (31)
Spinal cord 234 (32) 60 (32) 1410 (30) 313 (30)
Spinal meninges 8 (01) 0 73 (02) 9 (01)
TOTAL 7413 (100) 1884 (100) 46284 (100) 10518 (100)
Note Reported data are incident cases from 1989-1994 except for CBTRUS data which are from 1990-1993
aRefer to the site codes in Appendix BbCentral Brain Tumor Registry of the United States cMinnesota Cancer Surveillance System (microscopically confirmed cases only)dNational Cancer Data Base (limited to cases reported by hospitals that accessioned nonmalignant cases) eSurvival Epidemiology and End Results Program (malignant cases only)
Page 33
Endash
DATA COLLECTION
OF PRIMARY
CENTRAL NERVOUS
SYSTEM TUMORS
TABLE 6 NUMBER AND PERCENT OF PRIMARY INTRACRANIAL AND CENTRAL NERVOUS SYSTEM TUMORS OF BENIGN AND UNCERTAIN BEHAVIOR BY TUMOR LOCATION
Locationa CBTRUSb
Number () MCSSc
Number () NCDBd
Number () SEERe
Number ()
Intracranial 5913 (924) 1776 (906) 21521 (929) NA
Brain 1137 (178) 178 (91) 5905 (255) NA
Meninges 2621 (409) 815 (416) 8784 (379) NA
Pituitarycraniopharyngealduct
1454 (227) 517 (264) 4769 (206) NA
Pineal 16 (02) 1 (lt01) 99 (04) NA
Other central nervous systemincluding cranial nerves
685 (107) 265 (135) 1964 (85) NA
Extracranial 488 (76) 185 (94) 1654 (71) NA
Spinal cord 263 (41) 87 (44) 985 (42) NA
Spinal meninges 225 (35) 98 (50) 669 (29) NA
TOTAL 6401 (100) 1961 (100) 23175 (100) NA
Note Reported data are incident cases from 1989-1994 except for CBTRUS data which are from 1990-1993
aRefer to the site codes in Appendix BbCentral Brain Tumor Registry of the United States cMinnesota Cancer Surveillance System (microscopically confirmed cases only)dNational Cancer Data Base (limited to cases reported by hospitals that accessioned nonmalignant cases) eSurveillance Epidemiology and End Results Program (malignant cases only)NA = Not applicable
Page 34
Endash
APPENDIX E TABLE 7 NUMBER AND PERCENT OF PRIMARY INTRACRANIAL AND CENTRAL
NERVOUS SYSTEM TUMORS BY TUMOR BEHAVIOR AND LOCATION
BehaviorTumor Locationa
CBTRUSb
Number () MCSSc
Number () NCDBd
Number () SEERe
Number ()
Malignant 7413 (537) 1884 (490) 46284 (666) 10518 (100)
Brain 6862 (497) 1746 (454) 42622 (614) 9721 (924)
Meninges 98 (07) 23 (06) 581 (08) 139 (13)
Pituitarycraniopharyn-geal ductpineal
95 (07) 33 (09) 567 (08) 110 (11)
Other central nervous system includingcranial nerves
116 (08) 22 (06) 1031 (15) 226 (22)
Spinal cord 242 (18) 60 (16) 1483 (21) 322 (31)
Benign 5794 (419) 1787 (465) 20694 (298) NA
Brain 803 (58) 99 (26) 4491 (65) NA
Meninges 2565 (186) 807 (210) 8613 (124) NA
Pituitarycraniopharyn-geal ductpineal
1322 (96) 458 (119) 4330 (62) NA
Other central nervous system includingcranial nerves
678 (49) 263 (68) 1911 (28) NA
Spinal cord 426 (31) 160 (42) 1349 (19) NA
Uncertain 607 (44) 174 (45) 2481 (36) NA
Brain 334 (24) 79 (21) 1414 (20) NA
Meninges 56 (04) 8 (02) 171 (02) NA
Pituitarycraniopharyn-geal ductpineal
148 (11) 60 (16) 538 (08) NA
Other central nervous system includingcranial nerves
7 (01) 2 (01) 53 (01) NA
Spinal cord 62 (05) 25 (07) 305 (04) NA
TOTAL 13814 (100) 3845 (100) 69459 (100) 10518 (100)
Note Reported data are incident cases from 1989-1994 except for CBTRUS data which are from 1990-1993 NA=Not applicableaRefer to the site codes in Appendix B bCentral Brain Tumor Registry of the United States cMinnesota Cancer Surveillance System (microscopically confirmed cases only)dNational Cancer Data Base (limited to cases reported byhospitals that accessioned nonmalignant cases eSurvival Epidemiology and End Results Program (malignant cases only)
Page 35
Endash
DATA COLLECTION
OF PRIMARY
CENTRAL NERVOUS
SYSTEM TUMORS
TABLE 8 NUMBER AND PERCENT OF MALIGNANT PRIMARY INTRACRANIAL AND
CENTRAL NERVOUS SYSTEM TUMORS BY HISTOLOGY GROUPINGS
WHO Histologya
Groupings CBTRUSb
Number () MCSSc
Number () NCDBd
Number () SEERe
Number ()
Neuroepithelial 6477 (874) 1689 (896) 39701 (858) 8676 (825)
Tumors of cranial and spinal nerves
12 (02) 3 (02) 108 (02) 25 (02)
Tumors of meninges
137 (18) 25 (13) 994 (21) 194 (18)
LymphomasHemopoietic
473 (64) 121 (64) 3492 (75) 1099 (105)
Germ cell 70 (09) 20 (11) 403 (09) 97 (09)
Cysts and tumor-like lesions
0 0 0 0
Tumors of sellar region
20 (03) 11 (06) 100 (02) 6 (01)
Local extensions 29 (04) 11 (06) 166 (04) 38 (04)
Unclassifiedunassigned tumorsf
195 (26) 4 (02) 1320 (29) 383 (36)
TOTAL 7413 (100) 1884 (100) 46284 (100) 10518 (100)
Note Reported data are incident cases from 1989-1994 except for CBTRUS data which are from 1990-1993
aRefer to the World Health Organization (WHO) histology groupings in Appendix CbCentral Brain Tumor Registry of the United States cMinnesota Cancer Surveillance System (microscopically confirmed cases only)dNational Cancer Data Base (limited to cases reported by hospitals that accessioned nonmalignant cases) f For MCSS unclassifiedunassigned tumors include one malignant and four nonmalignant histologies which were
not listed in the CBTRUS classification scheme For NCDB unclassifiedunassigned tumors include 319 cases(less than one half percent) which had histologies not assigned by CBTRUS to any other category For SEERunclassifiedunassigned tumors include all malignant histologies occurring in the brainCNS which could not beclassified in one of the above categories based on their 4-digit histologic type
Page 36
Endash
APPENDIX E
TABLE 9 NUMBER AND PERCENT OF PRIMARY INTRACRANIAL AND CENTRAL NERVOUS SYSTEM TUMORS OF BENIGN AND UNCERTAIN BEHAVIOR
BY HISTOLOGY GROUPINGS
WHO Histologya
Groupings CBTRUSb
Number () MCSSc
Number () NCDBd
Number () SEERe
Number ()
Neuroepithelial 275 (43) 91 (46) 1064 (46) NA
Tumors of cranial and spinal nerves
980 (153) 397 (202) 2618 (113) NA
Tumors of meninges
3509 (548) 941 (480) 13667 (590) NA
LymphomasHemopoietic
3 (lt01) 0 7 (lt01) NA
Germ cell 4 (lt01) 1 (01) 25 (01) NA
Cysts and tumor-like lesions
15 (02) 3 (02) 34 (01) NA
Tumors of sellar region
1444 (226) 510 (260) 4749 (205) NA
Local extensions 0 0 0 NA
Unclassifiedunassigned tumorsf
171 (27) 18 (09) 1011 (44) NA
TOTAL 6401 (100) 1961 (100) 23175 (100) NA
Note Reported data are incident cases from 1989-1994 except for CBTRUS which is 1990-1993
aRefer to the World Health Organization (WHO) histology groupings in Appendix CbCentral Brain Tumor Registry of the United States c Minnesota Cancer Surveillance System (microscopically confirmed cases only) dNational Cancer Data Base (limited to cases reported by hospitals that accessioned nonmalignant cases) eSurvival Epidemiology and End Results Program (malignant cases only)dFor MCSS unclassifiedunassigned tumors include one malignant and four nonmalignant histologies which werenot listed in the CBTRUS classification scheme For NCDB unclassifiedunassigned tumors include 319 cases(less than one half percent) which had histologies not assigned by CBTRUS to any other category For SEERunclassifiedunassigned tumors include all malignant histologies occurring in the brainCNS which could not beclassified in one of the above categories based on their 4-digit histologic typeNA = Not applicable
Page 37
Endash
DATA COLLECTION
OF PRIMARY
CENTRAL NERVOUS
SYSTEM TUMORS
TABLE 10 METHOD OF CASE FINDING FOR PRIMARY INTRACRANIAL AND CENTRAL NERVOUS SYSTEM TUMORS BY TUMOR BEHAVIOR AND LOCATION MINNESOTA 1989-1994
Behavior Tumor Locationa
Number of Cases
Percent Found byRoutine
Reporting
Percent Found by Special Efforts
Malignant Brain Cerebral meninges
Pituitarycranio duct pineal Other intracranial
18841746 23 33
22
961 965 957 939
864
39 35 43 61
136 Extracranial 60 883 117 Benign Brain
1787 99
788 838
212 162
Cerebral meninges Pituitarycranio duct
pineal Other intracranial
807 458
263
843 740
779
157 260
221 Extracranial 160 631 369 Uncertain 174 856 144 Brain 79 823 177 Cerebral meninges Pituitarycraniopharyn- geal ductpineal Other intracranial
8 60
2
875 850
1000
125 150
00 Extracranial 25 960 40
TOTAL 3845 876 124
aRefer to the site codes in Appendix B
Page 38
Endash
1989 1990 1991 1992 1993 1994
TOTAL
APPENDIX E TABLE 11 METHOD OF CASE FINDING FOR INTRACRANIALa TUMORS BY DIAGNOSIS YEAR MINNESOTA 1989-1994
DiagnosisYear
Number of
Cases
Percent Found byRoutine
Reporting
Percent Found by
Special Efforts
571 837 163 616 865 135 586 913 87 602 899 101
633 872 128 592 929 71
3600 886 114
aIncludes the brain cerebral meninges pituitary gland pineal gland and otherintracranial tumors (refer to the site codes in Appendix B)
Page 39
Endash
DATA COLLECTION
OF PRIMARY
CENTRAL NERVOUS
SYSTEM TUMORS
TABLE 12 METHOD OF CASE FINDING FOR NONMALIGNANT INTRACRANIALa TUMORS BY TYPE OF FACILITY MINNESOTA 1989-1994
Type of Facility Number of Tumors Percent Found byRoutine
Reporting
Percent Found by Special Efforts
Registry at facility No registry at facility
1451325
859 569
141 431
TOTAL 1776 806 194
aIncludes tumors with benign or uncertain behavior that involve the brain cerebral meningespituitary gland pineal gland or other intracranial sites (refer to the site codes in Appendix B)
TABLE 13 REPORTING METHOD AND SOURCE OF CASE FINDING FOR NON- MALIGNANT INTRACRANIALa TUMORS DIAGNOSED IN HOSPITALS WITH A TUMOR REGISTRY MINNESOTA 1989-1994
Reporting Method Number of Tumors Percent Found byRoutine
Reporting
Percent Found by
Special Efforts
Registry-reportedLaboratory-reported
1226225
925 502
75 498
TOTAL 1451 859 141
aIncludes tumors with benign or uncertain behavior that involve the brain cerebral meningespituitary gland pineal gland or other intracranial sites (refer to the site codes in Appendix B)
Page 40
Endash0
APPENDIX E TABLE 14 HOSPITAL REGISTRY ACCESSIONING OF MALIGNANT AND NON-
MALIGNANT PRIMARY INTRACRANIAL AND CENTRAL NERVOUS SYSTEM TUMORS NCDB 1989-1994
TUMOR Totalb
BEHAVIOR Malignant c Nonmalignantd
Tumor Locationa HospitalsReporting
Number ()
Hospitals Reporting
Number ()
Hospitals Reporting
Number ()
Intracranial 1542 (100) 1526 (100) 900 (99)
Brain 1527 (99) 1519 (gt99) 754 (83)
Meninges 740 (48) 390 (26) 613 (67)
Pituitaryglandcraniopharyn-
geal duct
602 (39) 168 (11) 538 (59)
Pineal gland 319 (21) 277 (18) 79 (9)
Other central nervous system including cranial
nerves
648 (42) 545 (36) 299 (33)
Extracranial 812 (53) 708 (46) 410 (45)
Spinal cord 760 (49) 692 (45) 311 (34)
Spinal meninges 299 (19) 72 (5) 258 (28)
TOTAL Hospitals 1542 (100) 1526 (100) 913 (100)
Note The number of hospitals in each of the second third and fourth columns is the number that submittedreports to the NCDB for any intracranial and central nervous system tumors for the respective malignancystatus Not all hospitals submitted reports for each year during the study period (1989-1994)
aRefer to the site codes in Appendix B bBehavior codes = 0 1 3 cBehavior code = 3 dBehavior codes = 0 1
Page 41
Endash
DATA COLLECTION
OF PRIMARY
CENTRAL NERVOUS
SYSTEM TUMORS
Texas Cancer Registry
1997 CBTRUS State Survey of Benign Brain Tumor Data Collection
State Collection Status
Currently Collecting Benign Tumor Data1 Arizona Cancer Registry since 1981 2 Colorado Central Cancer Registry since 1988 3 Connecticut Tumor Registry since 1965 4 Idaho Cancer Data Registry since 1970 5 Maine Cancer Registry since 1983 6 Massachusetts Cancer Registry since 1982 7 Minnesota Cancer Surveillance System since 1988 8 Montana Central Tumor Registry since 1979 9 New York State Cancer Registry since 1988
10 North Carolina Central Cancer Registry since 1990 11 Utah Cancer Registry since 1966 12 Virginia Cancer Registry since 1994 13 Delaware State Cancer Registry14 Washington State Cancer Registry since 1992 15 passive collection 1979-1994
active collection since 1995
Stopped or Passive Collection of Benign Tumor Data1 New Jersey State Cancer Registry stopped 1979-1995 2 Kansas Cancer Registry stopped 1969-1995 3 New Hampshire State Cancer Registry stopped 1986-1991 4 District of Columbia Cancer Registry stopped 1997 5 Wyoming Cancer Surveillance Program stopped 111996 6 Louisiana Tumor Registry stopped 1992 (passive collection) 7 Illinois State Cancer Registry stopped 111996 8 Missouri Cancer Registry passive collection since 1984 9 South Carolina Central Cancer Registry passive collection since 1996
Beginning Collection of Benign Tumor Data1 North Dakota Cancer Registry began collection 1997 2 Rhode Island Cancer Registry began collection 1998
Page 42
Endash
APPENDIX E
Codes for Primary Intracranial and Central Nervous System Tumors
Note For this report the designation of ldquoprimary intracranial and central nervous system tumorsrdquo includes thefollowing primary tumors of central nervous system sites as well as tumors of the pituitary and pinealglands All histology types within the topography codes are included in the designation of ldquoprimaryintracranial and CNS tumors The source for the topography codes is Percy C Van Holten V Muir Ceds International Classification of Diseases for Oncology Second Edition Geneva World Health Organization 1990
Intracranial tumors
Brain C710 Cerebrum C711 Frontal lobe C712 Temporal lobe C713 Parietal lobe C714 Occipital lobe C715 Ventricle NOSC716 Cerebellum NOS C717 Brain stem C718 Overlapping lesion of brain C719 Brain NOS
Meninges C700 Cerebral meninges C709 Meninges NOS
a
Cranial Nerves and other intracranial parts of the central nervous systemC722 Olfactory nerve C723 Optic nerve C724 Acoustic nerve C725 Cranial nerve NOS C728 Overlapping lesion of brain and central nervous system C729 Nervous system NOS
Other endrocrine glands and related structures C751 Pituitary gland C752 Craniopharyngeal duct C753 Pineal gland
Extracranial tumors
Spinal cord C720 Spinal cord C721 Cauda equina
Meninges C701 Spinal meninges
aNOS=Not Otherwise Specified
Page 43
Endash
DATA COLLECTION
OF PRIMARY
CENTRAL NERVOUS
SYSTEM TUMORS
Brain Tumor Histology Groupings
The following histology groupings were used for the primary intracranial and central nervoussystem tumors The source for the histology groupings is Central Brain Tumor Registry ofthe United States (CBTRUS) 1996 Statistics Report Table 4
WHOa HISTOLOGY GROUPINGS ICD-Ob MORPHOLOGY CODE
Diffuse astrocytoma (protoplasma fibrillary) 9410 9420 Anaplastic astrocytoma 9401 9411 Glioblastoma 9440 9441 9442 Pilocytic astrocytoma 9421 Unique astrocytoma variants 9383 9384 9424 Oligodendroglioma 9450 Anaplastic oligodendroglioma 9451 9460 Ependymomaanaplastic ependymoma 9391 9392 9393 Ependymoma variants 9394 Mixed glioma 9382 Astrocytoma NOSc 9400 Glioma malignant NOS 9380 Choroid plexus 9390 Neuroepithelial 9381 9423 9430 Benign neuronalglial neuronal and mixed 86801 8693 9490 9505 9506 Malignant neruonalglial neuronal and mixed 86803 9364 9490 9500 Pineal parenchymal 9360 9361 9362 Embryonalprimitivemedulloblastoma 8963 9470 9471 9472
9473 9501 9502 9503 9510
TUMORS OF NEUROEPITHELIAL TISSUE
TUMORS OF CRANIAL AND SPINAL NERVES Nerve sheath benign and malignant 9540 9550 9560 9570
TUMORS OF THE MENINGES Meningioma 9530 9531 9532 9533 9534 9537 9538 Other mesenchymal benign and malignant 8800 8801 8802 8803 8810 8830 8850 88618900
8910 8990 9133 9150 9240 9480 9481 9536 9539 Hemangioblastoma 9161 9535
LYMPHOMAS AND HEMOPOIETIC NEOPLASMS Lymphoma 9590 9591 9593 9594 9595 9630 9650 9652
9663 9670 9671 9672 9674 9675 9680 9681 9682 9684 9685 9686 9687 9690 9691 96939695 9696 9698 9702 9714 9723 9731 9766 9970
GERM CELL TUMORS Germ cell 8020 9060 9064 9070 9071 9080 9084 9085 9100
CYSTS AND TUMOR-LIKE LESIONS Cysts and heterotopias 9084
TUMORS OF THE SELLAR REGION Pituitary 8040 8l40 8l46 8260 8270 8271 8280
8281 8290 8300 8330 8323 8333 Craniopharyngioma 9350
Page 44
Endash
APPENDIX E
LOCAL EXTENSIONS FROM REGIONAL TUMORS Chordomachondrosarcoma 9370
UNCLASSIFIED TUMORS Hemangioma 9120 9121 9130 9131 Neoplasm benign 80000 8010 Neoplasm uncertain behavior 80001 80011 Neoplasm malignant 80003 80013 8002 8003 All other 8720 9580
aWHO = World Health OrganizationbICD-O = International Classification of Diseases for Oncology Second Edition 1990 cNOS=Not Otherwise Specified
Page 45
Endash
DATA COLLECTION
OF PRIMARY
CENTRAL NERVOUS
SYSTEM TUMORS
Endash
International Classification of Childhood Cancer (ICCC)
Diagnostic Group
ICD-Oa codes
Morphology Topography
I LEUKAEMIA
(a) Lymphoid leukaemia 9820-9827 9850
(b) Acute non-lymphocytic leukaemia 9840 9841 9861 9864 9866 9867 98919894 9910
(c) Chronic myeloid leukaemia 9863 9868
(d) Other specified leukaemias 9830 9842 9860 9862 9870-9890 9892 98939900 9930-9941
(e) Unspecified leukaemias 9800-9804
II LYMPHOMAS AND OTHER RETICULOENDOTHELIAL NEOPLASMS
(a) Hodgkinrsquos disease 9650-9667
(b) Non-Hodgkinrsquos lymphoma 9591-9595 9670-9686 9690-9714 9723
(c) Burkittrsquos lymphoma 9687
(d) Miscellaneous lymphoreticular neoplasms 9720 9731-9764
(e) Unspecified lymphomas 9590
III CENTRAL NERVOUS SYSTEM (CNS) ANDMISCELLANEOUS INTRACRANIAL AND
INTRASPINAL NEOPLASMSb
(a) Ependymomac 9383 9390-9394
(b) Astrocytoma 9380 C723
9381 9400-9441
(c) Primitive neuroectodermal tumours 9470-9473
(d) Other gliomasd 9380 C700-C722C724-C729
9382 9384
9442-9460 9481
APPENDIX E
Diagnostic Group
ICD-Oa codes
Morphology Topogragphy
III CNS AND MISCELLANEOUS INTRACRANIAL AND INTRASPINAL
NEOPLASMSb Continued
(e) Miscellaneous intracranial and intraspinalneoplasmsc
8270-8281 8300 9350-9362 9480 95059530-9539
(f) Unspecified intracranial and intraspinalneoplasmsc
8000-8004 C700-C729C751-C753
IV SYMPATHETIC NERVOUS SYSTEM TUMOURS
(a) Neuroblastoma and ganglioneuroblastoma 9490 9500
(b) Other sympathetic nervous system tumours 8680 8693-8710 9501-9504 9520-9523
aInternational Classification of Diseases for Oncology Second Edition World Health Organization 1990bGroup III excludes all lymphomas See group II cBehaviour codes 0 and 1 are included dBehaviour code 1 is included
Page 47
Endash
Comments and recommendations are welcome Should questions arise on how to use these
materials or for more information please contact
Centers for Disease Control and Prevention National Program of Cancer Registries
4770 Buford Hwy NE Mail Stop K-53
Atlanta GA 30042-3717
Voice Information System 1 (888) 842-6355 bull Fax (770) 488-4760
cancerinfocdcgov bull httpwwwcdcgovcancer
All materials are in the public domain and may be reproduced or copied without permission citation
to source however is appreciated
BACK COVER
(WHITE)
Spine(WHITE)
DATA COLLECTION OF PRIMARY CEN
TRAL NERVOUS SYSTEM
TUM
ORS 2004
National Program of Cancer Registries Training M
aterials
DATA COLLECTION
OF PRIMARY
CENTRAL NERVOUS
SYSTEM TUMORS
Endash
REFERENCES
1 Davis F Preston-Martin S Epidemiology of brain tumors In Bigner DD McLendon RE Bruner JM eds Russell and Rubinsteins pathology of tumors of the nervous system ed 6 London Arnold Publishing 19965-45
2 World Health Organization (WHO) (1976) International classification of diseases foroncology ed 1 Geneva World Health Organization
3 World Health Organization (WHO) (1990) International classification of diseases foroncology ed 2 Geneva World Health Organization
4 Kleihues P Burger PC Scheithauer BW The new WHO classification of brain tumorsBrain Pathol 19933255-268
5 Thapar K Laws ER Tumors of the central nervous system In Murphy GP Lawrence WJr Lenhard RE Jr eds Textbook of clinical oncology ed 2 Atlanta American CancerSociety 1995378-410
6 Walker AE Robins M Weinfield FD Epidemiology of brain tumors the national survey ofintracranial neoplasms Neurol 198535219-226
7 Ries LAG Kosary CL Hankey BF Miller BA Edwards BK (eds) SEER Cancer StatisticsReview 1973-1995 National Cancer Institute Bethesda MD 1998
8 Cancer Facts amp Figures - 1998 American Cancer Society Atlanta Georgia 19989 Davis FG Bruner JM Surawicz TS The rationale for standardized registration and reporting
of brain and central nervous system tumors in population-based cancer registriesNeuroepidemiol 199716308-316
10CBTRUS (1996) First annual report 1995 Central Brain Tumor Registry of the UnitedStates Chicago Illinois
11 Preston-Martin S Epidemiology of primary CNS neoplasms Neurol Clinics 199614273-290
12 Greig NH Ries LG Yancik R Rapoport SI Increasing annual incidence of primary malignantbrain tumors in the elderly J Natl Cancer Inst 1991 831621-1624
13 Mao Y Desmeules M Semenciw RM Hill G Gaudette L Wigle DT Increasing brain cancerrates in Canada Can Med Assoc J 19911451583-1591
14 Frelick R Huang P Topham A Brain and central nervous system tumors Delaware 1980 to1989 Del Med J 199264571-573
15 Davis DL Ahlbom A Hoel D Percy C Is brain cancer mortality increasing in industrialcountries Am J Ind Med 199119421-431
16 Helseth A Increasing incidence of primary central nervous system tumors in the elderly Realincrease or improved detection J Natl Cancer Inst 1993851871-1872
17 Modan B Wagener D Feldman JJ Rosenberg HM Feinleib M Increased mortality frombrain tumors A combined outcome of diagnostic technology and change of attitude towardthe elderly Am J Epidemiol 19921351349-1357
18 Polednak AP Time trends in the incidence of brain and central nervous system cancers inConnecticut J Natl Cancer Inst 1991831679-1681
19 Boyle P Maissonneuve P Saracci R Muir CS Is the increase in incidence of primarymalignant brain tumors real J Natl Cancer Inst 1990201594-1596
Page 26
APPENDIX E 20 Preston-Martin S Descriptive epidemiology of primary tumors of the brain cranial nerves
and spinal meninges in Los Angeles County Neuroepidemiol 19898283-29521 Helseth A Mork SJ Neoplasms of the central nervous system in Norway Epidemiological
characteristics of intracranial gliomas according to histology APMIS 97 1989547-55522 Gurney JG Davis S Severson RK Fang J-Y Ross JA Robison LL Trends in cancer
incidence among children in the United States Cancer 199678532-54123 Gurney JG Ross JA Wall DA Bleyer WA Severson RK Robison LL Infant cancer in the
US histology-specific incidence trends 1973-1992 J Pediatr Hem Onc 199719428-43224 Nishio S Takeshita I Morioka T Fukui M Primary intracranial squamous cell carcinomas
report of two cases Neurosurgery 199537329-33225 Freilich RJ Thompson SJ Walker RW Rosenblum MK Adenocarcinomatous transformation
of intracranial germ cell tumors Am J Surg Pathol 199519537-54426Yuan S Miller DW Barnett GH Hahn JF Williams BR Identification and characterization of
human beta 2-chimaerin association with malignant transformation in astrocytoma CancerResearch 1995 553456-3461
27 Preston-Martin S Mack WJ Neoplasms of the nervous system In Schoenfeld D Fraumeni JFJr eds Cancer epidemiology and prevention ed 2 New York Oxford University Press19961231-1281
28 Riggs JE Rising primary malignant brain tumor mortality in the elderly A manifestation ofdifferential survival Arch of Neurol 199552571-575
29 Davis FG Freels S Grutsch J Barlas S Brem S Survival rates in patients with primarymalignant brain tumors stratified by patient age and tumor histological type an analysisbased on Surveillance Epidemiology and End Results (SEER) data 1973-1991J Neurosurg 1998881-10
30 Surawicz TS Davis F Freels S Laws ER Menck HR Brain tumor survival results from theNational Cancer Data Base (Accepted for publication in J Neuro-Oncol)
31 Bondy ML Lustbader ED Buffler PA Schull WJ Hardy RJ Strong LC Geneticepidemiology of childhood brain tumors Genet Epidemiol 19918253-267
32 Preston-Martin S Monroe K Lee P Bernstein L Kelsey J Henderson S Forrester DHenderson B Spinal meningiomas in women in Los Angeles County Investigation of anetiologic hypothesis Cancer Epidemiol Biomarkers Prev 19954333-339
33 Davis JR Brownson RC Garcia R Bentz BJ Turner A Family pesticide use and childhoodbrain cancer Arch Environ Contam Toxicol 19932487-92
34 Commission on Cancer General principles and coding In Standards of the Commission on Cancer vol II Registry Operations and Data Standards American College of SurgeonsChicago Illinois 1996
35 Central Brain Tumor Registry of the United States (CBTRUS) 1997 State Survey of BenignBrain Tumor Collection Chicago Illinois 1997
36 Davis FG Malinski N Haenszel W Chang J Flannery J Gershman S Dibble R Bigner DDPrimary brain tumor incidence rates in the four United States regions 1985-1989 A pilotstudy Neuroepidemiol 199615103-112
37 Schoenberg BS Christine BW Whisnant JP The descriptive epidemiology of primaryintracranial neoplasms the Connecticut experience Am J Epidemiol 1976104499-510
Page 27
Endash
DATA COLLECTION
OF PRIMARY
CENTRAL NERVOUS
SYSTEM TUMORS
TAB
LE 1
C
OM
PAR
ISO
N O
F R
EGIS
TRIE
S SU
PPLY
ING
DA
TA O
N P
RIM
AR
Y I
NTR
AC
RA
NIA
L A
ND
CEN
TRA
L N
ERV
OU
S SY
STEM
TU
MO
RS
IN T
HE
UN
ITED
STA
TES
Cen
tral B
rain
Tum
or R
egis
try o
fth
e U
nite
d St
ates
(CBT
RUS)
Min
neso
ta C
ance
rSu
rvei
llanc
e Sy
stem
(MC
SS)
ACo
SN
a tio
nal C
ance
r Dat
a B
ase
(NCD
B)
Surv
eilla
nce
Epid
emio
logy
and
End
Res
ults
Pro
gram
(SEE
R)
Purp
ose
ldquoCB
TRU
S ce
ntra
lizes
pop
ulat
ion-
base
d in
cide
nce
data
on
all b
rain
tum
ors a
nd u
ses o
ther
exi
stin
gda
ta re
sour
ces t
o ch
arac
teriz
e th
ein
cide
nce
mor
talit
y a
nd su
rviv
alof
pat
ient
s with
bra
in tu
mor
s rdquo
The
MC
SS c
olle
cts i
nfor
mat
ion
onal
l can
cers
dia
gnos
ed si
nce
1988
amon
g M
inne
sota
resi
dent
s Th
e M
CSS
is p
opul
atio
n-ba
sed
path
olog
y-ba
sed
and
is a
n ac
tive
syste
m
ldquoThe
goa
l of t
he N
CD
B is
to p
rese
nt a
n an
nual
sum
mar
y of
pat
ient
car
e fo
r cas
es o
f can
cer
diag
nose
d an
d tre
ated
at h
ospi
tals
thro
ugho
utth
e co
untry
rdquo
ldquoA c
ontin
uing
pro
ject
of th
e N
CI
the
SEER
prog
ram
col
lect
sca
ncer
dat
a on
aro
utin
e ba
sis f
rom
desi
gnat
ed p
opul
atio
n-ba
sed
canc
er re
gist
ries
in v
ario
us a
reas
of t
heco
untry
Targ
et p
opul
atio
n Th
e po
pula
tions
cov
ered
by
regi
strie
s in
Ari
zona
Col
orad
oC
onne
ctic
ut D
elaw
are
Idah
oM
aine
Mas
sach
uset
ts
Min
neso
ta M
issou
ri M
onta
na
Nor
th C
arol
ina
and
Uta
h
The
CB
TRU
S po
pula
tion
repr
esen
ts a
non
rand
om 1
5pe
rcen
t sam
ple
of th
e U
S
popu
latio
n
The
popu
latio
n of
Min
neso
ta
The
popu
latio
ns tr
eate
d at
par
ticip
atin
gho
spita
ls in
the
50 st
ates
the
Dist
rict
of
Col
umbi
a a
nd P
uert
o R
ico
NC
DB
is n
ot a
pop
ulat
ion-
base
d re
gist
ry
At
pres
ent
it is
est
imat
ed to
cov
er a
ppro
xim
atel
y57
per
cent
of t
otal
cas
es n
atio
nwid
e
The
popu
latio
nsco
vere
d by
the
state
regi
strie
s in
Con
nect
icut
Haw
aii
Iow
a N
ew M
exic
o
and
Uta
h a
s wel
l as
the
regi
onal
regi
strie
sin
Atla
nta
Geo
rgia
D
etro
it M
ichi
gan
San
Fran
cisc
o-O
akla
nd C
alifo
rnia
an
d Se
attle
-Pug
etSo
und
Was
hing
ton
The
SEER
pop
ulat
ion
repr
esen
ts a
nonr
ando
m 1
4 pe
rcen
tsa
mpl
e of
the
US
po
pula
tion
Page
28
Endash
APPENDIX E
Cen
tral B
rain
Tum
or R
egis
try o
fth
e U
nite
d St
ates
(CBT
RUS)
Min
neso
ta C
ance
rSu
rvei
llanc
e Sy
stem
(MC
SS)
ACo
SN
a tio
nal C
ance
r Dat
a B
ase
(NCD
B)
Surv
eilla
nce
Epid
emio
logy
and
End
Res
ults
Pro
gram
(SEE
R)
Type
of
prim
ary
intra
cran
ial
and
cent
ral n
ervo
us sy
stem
tum
ors r
epor
ted
Dat
a on
new
ly-d
iagn
osed
cas
es o
fbe
nign
and
mal
igna
nt p
rimar
ybr
ain
tum
ors b
ased
on
ICD
-Oco
des
Dat
a on
new
ly-d
iagn
osed
m
i cro
scop
ical
ly-c
onfir
med
tum
ors
of th
e ce
ntra
l ner
vous
syste
m
incl
udin
g pi
tuita
ry a
nd p
inea
lgl
ands
Hos
pita
ls v
olun
taril
y su
bmit
full
anal
ytic
canc
er re
gist
ry c
asel
oads
with
dat
a ite
ms a
ndco
des d
efin
ed b
y th
e C
omm
issio
n on
Can
cer
(CO
C) f
or h
ospi
tal c
ance
r reg
istri
es
Mos
tpa
rtici
patin
g ho
spita
ls h
ave
prog
ram
sap
prov
ed b
y C
OC
or a
re e
stab
lishi
ng p
rogr
amap
prov
al
NC
DB
cal
ls fo
r dat
a do
not
lim
itca
ses b
y m
alig
nant
beh
avio
r bu
t acc
essi
onin
gof
non
-mal
igna
nt c
ases
is n
ot re
quire
d fo
rpr
ogra
m a
ppro
val
Fifty
-nin
e pe
rcen
t of t
heho
spita
ls th
at su
bmitt
ed a
ny in
tracr
ania
lCN
Sca
ses d
iagn
osed
dur
ing
1989
-199
4 su
bmitt
edat
leas
t one
non
mal
igna
nt c
ase
The
NC
DB
data
in th
is re
port
are
limite
d to
the
case
ssu
bmitt
ed b
y th
ese
hosp
itals
(82
perc
ent o
f all
intra
cran
ial a
nd e
xtra
cran
ial c
entra
l ner
vous
syste
m c
ases
on
file)
Tren
ds in
the
inci
denc
e m
orta
lity
and
patie
nt su
rviv
al o
fbr
ain
tum
ors i
n th
eU
S H
owev
er S
EER
does
not
col
lect
info
rmat
ion
on b
enig
nan
d un
certa
in b
rain
tum
ors
Oth
er c
omm
ents
D
uplic
ate
canc
er re
gist
ratio
ns c
anno
t be
iden
tifie
d by
the
parti
cipa
ting
regi
strie
s
The
MC
SS p
erfo
rms 1
00 p
erce
ntca
se fi
ndin
g au
dits
in a
ll pa
thol
ogy
labo
rato
ries o
n an
ann
ual b
asis
Th
eref
ore
the
data
from
the
MC
SSm
ight
be
cons
ider
ed a
ldquobe
st-ca
sesc
enar
iordquo
in te
rms o
f com
plet
enes
sof
repo
rting
for m
icro
scop
ical
ly-
conf
irmed
tum
ors
Rep
ort d
uplic
atio
n fo
r 198
9-19
94 in
tracr
ania
lan
d ex
tracr
ania
l cen
tral n
ervo
us sy
stem
repo
rts w
as 6
7 p
erce
nt
How
ever
the
NC
DB
data
in T
able
s 2 th
roug
h 9
are
base
d on
undu
plic
ated
repo
rts
Page
29
Endash
DATA COLLECTION
OF PRIMARY
CENTRAL NERVOUS
SYSTEM TUMORS
TABLE 2 NUMBER AND PERCENT OF PRIMARY INTRACRANIAL AND CENTRAL NERVOUS SYSTEM TUMORS BY TUMOR LOCATION
Locationa CBTRUSb
Number () MCSSc
Number () NCDBd
Number () SEERe
Number ()
Intracranial 13084 (947) 3600 (936) 66322 (955) 10196 (969)
Brain 7999 (579) 1924 (500) 48527 (699) 9721 (924)
Meninges 2719 (197) 838 (218) 9365 (135) 139 (13)
Pituitarycraniopharygealduct
1491 (108) 530 (138) 4958 (71) 30 (03)
Pineal 74 (05) 21 (05) 477 (07) 80 (08)
Other central nervous systemincluding cranial nerves
801 (58) 287 (75) 2995 (43) 226 (22)
Extracranial 730 (53) 245 (64) 3137 (45) 322 (31)
Spinal cord 497 (36) 47 (38) 2395 (34) 313 (30)
Spinal meninges 233 (17) 98 (25) 742 (11) 9 (01)
TOTAL 13814 (100) 3845 (100) 69459 (100) 10518 (100)
Note Reported data are incident cases from 1989-1994 except for CBTRUS data which are from 1990-1993
aRefer to the sites in Appendix BbCentral Brain Tumor Registry of the United States cMinnesota Cancer Surveillance System (microscopically confirmed cases only)dNational Cancer Data Base (limited to cases reported by hospitals that accessioned nonmalignant cases) eSurvival Epidemiology and End results Program (malignant cases only)
Page 30
Endash0
TABL
E 3
RO
W P
ERCE
NT
DIS
TRIB
UTI
ON
OF
PRIM
ARY
INTR
ACR
AN
IAL
AN
D C
ENTR
AL
NER
VO
US
SYST
EM T
UM
ORS
BY
TU
MO
R B
EHA
VIO
RA
ND
MIC
ROSC
OPI
C C
ON
FIRM
ATI
ON
Loca
tiona
CB
TRU
Sb M
CSSc
NC
DB
d SE
ERe
Tota
l Pe
rcen
tM
icro
Co
nfirm
ed
Perc
ent
Not
Mic
ro
Conf
irmed
Tota
l Pe
rcen
tM
icro
Co
nfirm
ed
Perc
ent
Not
Mic
ro
Conf
irmed
Tota
l Pe
rcen
tM
icro
Co
nfirm
ed
Perc
ent
Not
Mic
ro
Conf
irmed
Tota
l Pe
rcen
tM
icro
Co
nfirm
ed
Perc
ent
Not
Mic
ro
Conf
irmed
Intra
cran
ial
130
84
867
13
3
360
0 10
0 N
A
663
22
887
11
3
101
96
871
12
9
Mal
igna
nt
717
1 89
2
108
1
824
100
NA
44
801
91
3
87
101
96
871
12
9
Beni
gn a
ndu n
certa
in
591
3 83
5
165
1
776
100
NA
21
521
83
2
168
N
A
NA
N
A
Bra
in
799
9 88
2
118
1
924
100
NA
48
527
90
2
98
972
1 87
3
127
Mal
igna
nt
686
2 89
6
104
1
746
100
NA
42
622
91
5
85
972
1 87
3
127
Beni
gnan
dun
certa
in
113
7 80
6
194
17
8 10
0 N
A
590
5 80
6
194
N
A
NA
N
A
Extra
cran
ial
730
962
3
8 24
5 10
0 N
A
313
7 96
0
40
322
957
4
3
Mal
igna
nt
242
934
6
6 60
10
0 N
A
148
3 96
6
34
322
957
4
3
Beni
gn a
ndu n
certa
in
488
975
2
5 18
5 10
0 N
A
165
4 95
5
45
NA
N
A
NA
TOTA
Lf 13
814
87
2
128
3
845
100
NA
69
459
89
0
110
10
518
87
4
126
Mal
igna
nt
741
3 89
4
106
1
884
100
NA
46
284
91
5
85
105
18
874
12
6
Beni
gn a
ndu n
certa
in
640
1 84
6
154
1
961
100
NA
23
175
84
1
159
N
A
NA
N
A
Not
e R
epor
ted
data
are
inci
dent
cas
es fr
om 1
989-
1994
exc
ept f
or C
BTR
US
data
whi
ch a
re fr
om 1
990-
1993
a Refe
r to
the
site
code
s in
App
endi
x B
b Cent
ral B
rain
Tum
or R
egist
ry o
f the
Uni
ted
Stat
es
c Min
neso
ta C
ance
r Sur
veill
ance
Sys
tem
(mic
rosc
opic
ally
con
firm
ed c
ases
onl
y)
d Nat
iona
l Can
cer D
ata
Base
(lim
ited
to c
ases
repo
rted
by h
ospi
tals
that
acc
essio
ned
nonm
alig
nant
cas
es)
e Surv
eilla
nce
Epi
dem
iolo
gy a
nd E
nd R
esul
ts Pr
ogra
m (m
alig
nant
cas
es o
nly)
f In
clud
es in
tracr
ania
l and
ext
racr
ania
l cas
es
NA
= N
ot a
pplic
able
Page
31
APPENDIX E
Endash
DATA COLLECTION
OF PRIMARY
CENTRAL NERVOUS
SYSTEM TUMORS
TABLE 4 NUMBER AND PERCENT OF PRIMARY INTRACRANIAL AND CENTRAL NERVOUS SYSTEM TUMORS BY DIAGNOSTIC CONFIRMATION
DiagnosticConfirmation
CBTRUSa
Number () MCSSb
Number () NCDBc
Number () SEERd
Number ()
Positive microscopy
12087 (875) 3845 (100) 61818 (890) 9188 (874)
Radiographywithout microscopy
1306 (95) NA 6759 (97) 1015 (97)
Clinical 204 (15) NA 484 (07) 98 (09)
Unknown 217 (15) NA 398 (06) 217 (21)
TOTAL 13814 (100) 3845 (100) 69459 (100) 10518 (100)
Note Reported data are incident cases from 1989-1994 except for CBTRUS data which are from 1990-1993
aCentral Brain Tumor Registry of the United Statesb Minnesota Cancer Surveillance System (microscopically confirmed cases only) cNational Cancer Data Base (limited to cases reported by hospitals that accessioned nonmalignant cases)dSurveillance Epidemiology and End Results Program (malignant cases only)NA = Not applicable
Page 32
Endash
Page 32
TABLE 4 NUMBER AND PERCENT OF PRIMARY INTRACRANIAL AND CENTRALNERVOUS SYSTEM TUMORS BY DIAGNOSTIC CONFIRMATION
DiagnosticConfirmation
CBTRUSa
Number ()MCSSb
Number ()NCDBc
Number ()SEERd
Number ()
Positivemicroscopy
12087 (875) 3845 (100) 61818 (890) 9188 (874)
Radiographywithout microscopy
1306 (95) NA 6759 (97) 1015 (97)
Clinical 204 (15) NA 484 (07) 98 (09)
Unknown 217 (15) NA 398 (06) 217 (21)
TOTAL 13814 (100) 3845 (100) 69459 (100) 10518 (100)
Note Reported data are incident cases from 1989-1994 except for CBTRUS data which are from 1990-1993
aCentral Brain Tumor Registry of the United Statesb Minnesota Cancer Surveillance System (microscopically confirmed cases only)cNational Cancer Data Base (limited to cases reported by hospitals that accessioned nonmalignant cases)dSurveillance Epidemiology and End Results Program (malignant cases only)NA = Not applicable
APPENDIX E
TABLE 5 NUMBER AND PERCENT OF MALIGNANT PRIMARY INTRACRANIAL AND CENTRAL SYSTEM TUMORS BY TUMOR LOCATION
Locationa CBTRUSb
Number () MCSSc
Number () NCDBd
Number () SEERe
Number ()
Intracranial 7171 (977) 1824 (968) 44801 (968) 10196 (969)
Brain 6862 (926) 1746 (927) 42622 (921) 9721 (924)
Meninges 98 (13) 23 (12) 581 (13) 139 (13)
Pituitarycraniopharyngealduct
37 (05) 13 (07) 189 (04) 30 (03)
Pineal 58 (08) 20 (11) 378 (08) 80 (08)
Other central nervous systemincluding cranial nerves
116 (16) 22 (12) 1031 (22) 226 (21)
Extracranial 242 (33) 60 (32) 1483 (32) 322 (31)
Spinal cord 234 (32) 60 (32) 1410 (30) 313 (30)
Spinal meninges 8 (01) 0 73 (02) 9 (01)
TOTAL 7413 (100) 1884 (100) 46284 (100) 10518 (100)
Note Reported data are incident cases from 1989-1994 except for CBTRUS data which are from 1990-1993
aRefer to the site codes in Appendix BbCentral Brain Tumor Registry of the United States cMinnesota Cancer Surveillance System (microscopically confirmed cases only)dNational Cancer Data Base (limited to cases reported by hospitals that accessioned nonmalignant cases) eSurvival Epidemiology and End Results Program (malignant cases only)
Page 33
Endash
DATA COLLECTION
OF PRIMARY
CENTRAL NERVOUS
SYSTEM TUMORS
TABLE 6 NUMBER AND PERCENT OF PRIMARY INTRACRANIAL AND CENTRAL NERVOUS SYSTEM TUMORS OF BENIGN AND UNCERTAIN BEHAVIOR BY TUMOR LOCATION
Locationa CBTRUSb
Number () MCSSc
Number () NCDBd
Number () SEERe
Number ()
Intracranial 5913 (924) 1776 (906) 21521 (929) NA
Brain 1137 (178) 178 (91) 5905 (255) NA
Meninges 2621 (409) 815 (416) 8784 (379) NA
Pituitarycraniopharyngealduct
1454 (227) 517 (264) 4769 (206) NA
Pineal 16 (02) 1 (lt01) 99 (04) NA
Other central nervous systemincluding cranial nerves
685 (107) 265 (135) 1964 (85) NA
Extracranial 488 (76) 185 (94) 1654 (71) NA
Spinal cord 263 (41) 87 (44) 985 (42) NA
Spinal meninges 225 (35) 98 (50) 669 (29) NA
TOTAL 6401 (100) 1961 (100) 23175 (100) NA
Note Reported data are incident cases from 1989-1994 except for CBTRUS data which are from 1990-1993
aRefer to the site codes in Appendix BbCentral Brain Tumor Registry of the United States cMinnesota Cancer Surveillance System (microscopically confirmed cases only)dNational Cancer Data Base (limited to cases reported by hospitals that accessioned nonmalignant cases) eSurveillance Epidemiology and End Results Program (malignant cases only)NA = Not applicable
Page 34
Endash
APPENDIX E TABLE 7 NUMBER AND PERCENT OF PRIMARY INTRACRANIAL AND CENTRAL
NERVOUS SYSTEM TUMORS BY TUMOR BEHAVIOR AND LOCATION
BehaviorTumor Locationa
CBTRUSb
Number () MCSSc
Number () NCDBd
Number () SEERe
Number ()
Malignant 7413 (537) 1884 (490) 46284 (666) 10518 (100)
Brain 6862 (497) 1746 (454) 42622 (614) 9721 (924)
Meninges 98 (07) 23 (06) 581 (08) 139 (13)
Pituitarycraniopharyn-geal ductpineal
95 (07) 33 (09) 567 (08) 110 (11)
Other central nervous system includingcranial nerves
116 (08) 22 (06) 1031 (15) 226 (22)
Spinal cord 242 (18) 60 (16) 1483 (21) 322 (31)
Benign 5794 (419) 1787 (465) 20694 (298) NA
Brain 803 (58) 99 (26) 4491 (65) NA
Meninges 2565 (186) 807 (210) 8613 (124) NA
Pituitarycraniopharyn-geal ductpineal
1322 (96) 458 (119) 4330 (62) NA
Other central nervous system includingcranial nerves
678 (49) 263 (68) 1911 (28) NA
Spinal cord 426 (31) 160 (42) 1349 (19) NA
Uncertain 607 (44) 174 (45) 2481 (36) NA
Brain 334 (24) 79 (21) 1414 (20) NA
Meninges 56 (04) 8 (02) 171 (02) NA
Pituitarycraniopharyn-geal ductpineal
148 (11) 60 (16) 538 (08) NA
Other central nervous system includingcranial nerves
7 (01) 2 (01) 53 (01) NA
Spinal cord 62 (05) 25 (07) 305 (04) NA
TOTAL 13814 (100) 3845 (100) 69459 (100) 10518 (100)
Note Reported data are incident cases from 1989-1994 except for CBTRUS data which are from 1990-1993 NA=Not applicableaRefer to the site codes in Appendix B bCentral Brain Tumor Registry of the United States cMinnesota Cancer Surveillance System (microscopically confirmed cases only)dNational Cancer Data Base (limited to cases reported byhospitals that accessioned nonmalignant cases eSurvival Epidemiology and End Results Program (malignant cases only)
Page 35
Endash
DATA COLLECTION
OF PRIMARY
CENTRAL NERVOUS
SYSTEM TUMORS
TABLE 8 NUMBER AND PERCENT OF MALIGNANT PRIMARY INTRACRANIAL AND
CENTRAL NERVOUS SYSTEM TUMORS BY HISTOLOGY GROUPINGS
WHO Histologya
Groupings CBTRUSb
Number () MCSSc
Number () NCDBd
Number () SEERe
Number ()
Neuroepithelial 6477 (874) 1689 (896) 39701 (858) 8676 (825)
Tumors of cranial and spinal nerves
12 (02) 3 (02) 108 (02) 25 (02)
Tumors of meninges
137 (18) 25 (13) 994 (21) 194 (18)
LymphomasHemopoietic
473 (64) 121 (64) 3492 (75) 1099 (105)
Germ cell 70 (09) 20 (11) 403 (09) 97 (09)
Cysts and tumor-like lesions
0 0 0 0
Tumors of sellar region
20 (03) 11 (06) 100 (02) 6 (01)
Local extensions 29 (04) 11 (06) 166 (04) 38 (04)
Unclassifiedunassigned tumorsf
195 (26) 4 (02) 1320 (29) 383 (36)
TOTAL 7413 (100) 1884 (100) 46284 (100) 10518 (100)
Note Reported data are incident cases from 1989-1994 except for CBTRUS data which are from 1990-1993
aRefer to the World Health Organization (WHO) histology groupings in Appendix CbCentral Brain Tumor Registry of the United States cMinnesota Cancer Surveillance System (microscopically confirmed cases only)dNational Cancer Data Base (limited to cases reported by hospitals that accessioned nonmalignant cases) f For MCSS unclassifiedunassigned tumors include one malignant and four nonmalignant histologies which were
not listed in the CBTRUS classification scheme For NCDB unclassifiedunassigned tumors include 319 cases(less than one half percent) which had histologies not assigned by CBTRUS to any other category For SEERunclassifiedunassigned tumors include all malignant histologies occurring in the brainCNS which could not beclassified in one of the above categories based on their 4-digit histologic type
Page 36
Endash
APPENDIX E
TABLE 9 NUMBER AND PERCENT OF PRIMARY INTRACRANIAL AND CENTRAL NERVOUS SYSTEM TUMORS OF BENIGN AND UNCERTAIN BEHAVIOR
BY HISTOLOGY GROUPINGS
WHO Histologya
Groupings CBTRUSb
Number () MCSSc
Number () NCDBd
Number () SEERe
Number ()
Neuroepithelial 275 (43) 91 (46) 1064 (46) NA
Tumors of cranial and spinal nerves
980 (153) 397 (202) 2618 (113) NA
Tumors of meninges
3509 (548) 941 (480) 13667 (590) NA
LymphomasHemopoietic
3 (lt01) 0 7 (lt01) NA
Germ cell 4 (lt01) 1 (01) 25 (01) NA
Cysts and tumor-like lesions
15 (02) 3 (02) 34 (01) NA
Tumors of sellar region
1444 (226) 510 (260) 4749 (205) NA
Local extensions 0 0 0 NA
Unclassifiedunassigned tumorsf
171 (27) 18 (09) 1011 (44) NA
TOTAL 6401 (100) 1961 (100) 23175 (100) NA
Note Reported data are incident cases from 1989-1994 except for CBTRUS which is 1990-1993
aRefer to the World Health Organization (WHO) histology groupings in Appendix CbCentral Brain Tumor Registry of the United States c Minnesota Cancer Surveillance System (microscopically confirmed cases only) dNational Cancer Data Base (limited to cases reported by hospitals that accessioned nonmalignant cases) eSurvival Epidemiology and End Results Program (malignant cases only)dFor MCSS unclassifiedunassigned tumors include one malignant and four nonmalignant histologies which werenot listed in the CBTRUS classification scheme For NCDB unclassifiedunassigned tumors include 319 cases(less than one half percent) which had histologies not assigned by CBTRUS to any other category For SEERunclassifiedunassigned tumors include all malignant histologies occurring in the brainCNS which could not beclassified in one of the above categories based on their 4-digit histologic typeNA = Not applicable
Page 37
Endash
DATA COLLECTION
OF PRIMARY
CENTRAL NERVOUS
SYSTEM TUMORS
TABLE 10 METHOD OF CASE FINDING FOR PRIMARY INTRACRANIAL AND CENTRAL NERVOUS SYSTEM TUMORS BY TUMOR BEHAVIOR AND LOCATION MINNESOTA 1989-1994
Behavior Tumor Locationa
Number of Cases
Percent Found byRoutine
Reporting
Percent Found by Special Efforts
Malignant Brain Cerebral meninges
Pituitarycranio duct pineal Other intracranial
18841746 23 33
22
961 965 957 939
864
39 35 43 61
136 Extracranial 60 883 117 Benign Brain
1787 99
788 838
212 162
Cerebral meninges Pituitarycranio duct
pineal Other intracranial
807 458
263
843 740
779
157 260
221 Extracranial 160 631 369 Uncertain 174 856 144 Brain 79 823 177 Cerebral meninges Pituitarycraniopharyn- geal ductpineal Other intracranial
8 60
2
875 850
1000
125 150
00 Extracranial 25 960 40
TOTAL 3845 876 124
aRefer to the site codes in Appendix B
Page 38
Endash
1989 1990 1991 1992 1993 1994
TOTAL
APPENDIX E TABLE 11 METHOD OF CASE FINDING FOR INTRACRANIALa TUMORS BY DIAGNOSIS YEAR MINNESOTA 1989-1994
DiagnosisYear
Number of
Cases
Percent Found byRoutine
Reporting
Percent Found by
Special Efforts
571 837 163 616 865 135 586 913 87 602 899 101
633 872 128 592 929 71
3600 886 114
aIncludes the brain cerebral meninges pituitary gland pineal gland and otherintracranial tumors (refer to the site codes in Appendix B)
Page 39
Endash
DATA COLLECTION
OF PRIMARY
CENTRAL NERVOUS
SYSTEM TUMORS
TABLE 12 METHOD OF CASE FINDING FOR NONMALIGNANT INTRACRANIALa TUMORS BY TYPE OF FACILITY MINNESOTA 1989-1994
Type of Facility Number of Tumors Percent Found byRoutine
Reporting
Percent Found by Special Efforts
Registry at facility No registry at facility
1451325
859 569
141 431
TOTAL 1776 806 194
aIncludes tumors with benign or uncertain behavior that involve the brain cerebral meningespituitary gland pineal gland or other intracranial sites (refer to the site codes in Appendix B)
TABLE 13 REPORTING METHOD AND SOURCE OF CASE FINDING FOR NON- MALIGNANT INTRACRANIALa TUMORS DIAGNOSED IN HOSPITALS WITH A TUMOR REGISTRY MINNESOTA 1989-1994
Reporting Method Number of Tumors Percent Found byRoutine
Reporting
Percent Found by
Special Efforts
Registry-reportedLaboratory-reported
1226225
925 502
75 498
TOTAL 1451 859 141
aIncludes tumors with benign or uncertain behavior that involve the brain cerebral meningespituitary gland pineal gland or other intracranial sites (refer to the site codes in Appendix B)
Page 40
Endash0
APPENDIX E TABLE 14 HOSPITAL REGISTRY ACCESSIONING OF MALIGNANT AND NON-
MALIGNANT PRIMARY INTRACRANIAL AND CENTRAL NERVOUS SYSTEM TUMORS NCDB 1989-1994
TUMOR Totalb
BEHAVIOR Malignant c Nonmalignantd
Tumor Locationa HospitalsReporting
Number ()
Hospitals Reporting
Number ()
Hospitals Reporting
Number ()
Intracranial 1542 (100) 1526 (100) 900 (99)
Brain 1527 (99) 1519 (gt99) 754 (83)
Meninges 740 (48) 390 (26) 613 (67)
Pituitaryglandcraniopharyn-
geal duct
602 (39) 168 (11) 538 (59)
Pineal gland 319 (21) 277 (18) 79 (9)
Other central nervous system including cranial
nerves
648 (42) 545 (36) 299 (33)
Extracranial 812 (53) 708 (46) 410 (45)
Spinal cord 760 (49) 692 (45) 311 (34)
Spinal meninges 299 (19) 72 (5) 258 (28)
TOTAL Hospitals 1542 (100) 1526 (100) 913 (100)
Note The number of hospitals in each of the second third and fourth columns is the number that submittedreports to the NCDB for any intracranial and central nervous system tumors for the respective malignancystatus Not all hospitals submitted reports for each year during the study period (1989-1994)
aRefer to the site codes in Appendix B bBehavior codes = 0 1 3 cBehavior code = 3 dBehavior codes = 0 1
Page 41
Endash
DATA COLLECTION
OF PRIMARY
CENTRAL NERVOUS
SYSTEM TUMORS
Texas Cancer Registry
1997 CBTRUS State Survey of Benign Brain Tumor Data Collection
State Collection Status
Currently Collecting Benign Tumor Data1 Arizona Cancer Registry since 1981 2 Colorado Central Cancer Registry since 1988 3 Connecticut Tumor Registry since 1965 4 Idaho Cancer Data Registry since 1970 5 Maine Cancer Registry since 1983 6 Massachusetts Cancer Registry since 1982 7 Minnesota Cancer Surveillance System since 1988 8 Montana Central Tumor Registry since 1979 9 New York State Cancer Registry since 1988
10 North Carolina Central Cancer Registry since 1990 11 Utah Cancer Registry since 1966 12 Virginia Cancer Registry since 1994 13 Delaware State Cancer Registry14 Washington State Cancer Registry since 1992 15 passive collection 1979-1994
active collection since 1995
Stopped or Passive Collection of Benign Tumor Data1 New Jersey State Cancer Registry stopped 1979-1995 2 Kansas Cancer Registry stopped 1969-1995 3 New Hampshire State Cancer Registry stopped 1986-1991 4 District of Columbia Cancer Registry stopped 1997 5 Wyoming Cancer Surveillance Program stopped 111996 6 Louisiana Tumor Registry stopped 1992 (passive collection) 7 Illinois State Cancer Registry stopped 111996 8 Missouri Cancer Registry passive collection since 1984 9 South Carolina Central Cancer Registry passive collection since 1996
Beginning Collection of Benign Tumor Data1 North Dakota Cancer Registry began collection 1997 2 Rhode Island Cancer Registry began collection 1998
Page 42
Endash
APPENDIX E
Codes for Primary Intracranial and Central Nervous System Tumors
Note For this report the designation of ldquoprimary intracranial and central nervous system tumorsrdquo includes thefollowing primary tumors of central nervous system sites as well as tumors of the pituitary and pinealglands All histology types within the topography codes are included in the designation of ldquoprimaryintracranial and CNS tumors The source for the topography codes is Percy C Van Holten V Muir Ceds International Classification of Diseases for Oncology Second Edition Geneva World Health Organization 1990
Intracranial tumors
Brain C710 Cerebrum C711 Frontal lobe C712 Temporal lobe C713 Parietal lobe C714 Occipital lobe C715 Ventricle NOSC716 Cerebellum NOS C717 Brain stem C718 Overlapping lesion of brain C719 Brain NOS
Meninges C700 Cerebral meninges C709 Meninges NOS
a
Cranial Nerves and other intracranial parts of the central nervous systemC722 Olfactory nerve C723 Optic nerve C724 Acoustic nerve C725 Cranial nerve NOS C728 Overlapping lesion of brain and central nervous system C729 Nervous system NOS
Other endrocrine glands and related structures C751 Pituitary gland C752 Craniopharyngeal duct C753 Pineal gland
Extracranial tumors
Spinal cord C720 Spinal cord C721 Cauda equina
Meninges C701 Spinal meninges
aNOS=Not Otherwise Specified
Page 43
Endash
DATA COLLECTION
OF PRIMARY
CENTRAL NERVOUS
SYSTEM TUMORS
Brain Tumor Histology Groupings
The following histology groupings were used for the primary intracranial and central nervoussystem tumors The source for the histology groupings is Central Brain Tumor Registry ofthe United States (CBTRUS) 1996 Statistics Report Table 4
WHOa HISTOLOGY GROUPINGS ICD-Ob MORPHOLOGY CODE
Diffuse astrocytoma (protoplasma fibrillary) 9410 9420 Anaplastic astrocytoma 9401 9411 Glioblastoma 9440 9441 9442 Pilocytic astrocytoma 9421 Unique astrocytoma variants 9383 9384 9424 Oligodendroglioma 9450 Anaplastic oligodendroglioma 9451 9460 Ependymomaanaplastic ependymoma 9391 9392 9393 Ependymoma variants 9394 Mixed glioma 9382 Astrocytoma NOSc 9400 Glioma malignant NOS 9380 Choroid plexus 9390 Neuroepithelial 9381 9423 9430 Benign neuronalglial neuronal and mixed 86801 8693 9490 9505 9506 Malignant neruonalglial neuronal and mixed 86803 9364 9490 9500 Pineal parenchymal 9360 9361 9362 Embryonalprimitivemedulloblastoma 8963 9470 9471 9472
9473 9501 9502 9503 9510
TUMORS OF NEUROEPITHELIAL TISSUE
TUMORS OF CRANIAL AND SPINAL NERVES Nerve sheath benign and malignant 9540 9550 9560 9570
TUMORS OF THE MENINGES Meningioma 9530 9531 9532 9533 9534 9537 9538 Other mesenchymal benign and malignant 8800 8801 8802 8803 8810 8830 8850 88618900
8910 8990 9133 9150 9240 9480 9481 9536 9539 Hemangioblastoma 9161 9535
LYMPHOMAS AND HEMOPOIETIC NEOPLASMS Lymphoma 9590 9591 9593 9594 9595 9630 9650 9652
9663 9670 9671 9672 9674 9675 9680 9681 9682 9684 9685 9686 9687 9690 9691 96939695 9696 9698 9702 9714 9723 9731 9766 9970
GERM CELL TUMORS Germ cell 8020 9060 9064 9070 9071 9080 9084 9085 9100
CYSTS AND TUMOR-LIKE LESIONS Cysts and heterotopias 9084
TUMORS OF THE SELLAR REGION Pituitary 8040 8l40 8l46 8260 8270 8271 8280
8281 8290 8300 8330 8323 8333 Craniopharyngioma 9350
Page 44
Endash
APPENDIX E
LOCAL EXTENSIONS FROM REGIONAL TUMORS Chordomachondrosarcoma 9370
UNCLASSIFIED TUMORS Hemangioma 9120 9121 9130 9131 Neoplasm benign 80000 8010 Neoplasm uncertain behavior 80001 80011 Neoplasm malignant 80003 80013 8002 8003 All other 8720 9580
aWHO = World Health OrganizationbICD-O = International Classification of Diseases for Oncology Second Edition 1990 cNOS=Not Otherwise Specified
Page 45
Endash
DATA COLLECTION
OF PRIMARY
CENTRAL NERVOUS
SYSTEM TUMORS
Endash
International Classification of Childhood Cancer (ICCC)
Diagnostic Group
ICD-Oa codes
Morphology Topography
I LEUKAEMIA
(a) Lymphoid leukaemia 9820-9827 9850
(b) Acute non-lymphocytic leukaemia 9840 9841 9861 9864 9866 9867 98919894 9910
(c) Chronic myeloid leukaemia 9863 9868
(d) Other specified leukaemias 9830 9842 9860 9862 9870-9890 9892 98939900 9930-9941
(e) Unspecified leukaemias 9800-9804
II LYMPHOMAS AND OTHER RETICULOENDOTHELIAL NEOPLASMS
(a) Hodgkinrsquos disease 9650-9667
(b) Non-Hodgkinrsquos lymphoma 9591-9595 9670-9686 9690-9714 9723
(c) Burkittrsquos lymphoma 9687
(d) Miscellaneous lymphoreticular neoplasms 9720 9731-9764
(e) Unspecified lymphomas 9590
III CENTRAL NERVOUS SYSTEM (CNS) ANDMISCELLANEOUS INTRACRANIAL AND
INTRASPINAL NEOPLASMSb
(a) Ependymomac 9383 9390-9394
(b) Astrocytoma 9380 C723
9381 9400-9441
(c) Primitive neuroectodermal tumours 9470-9473
(d) Other gliomasd 9380 C700-C722C724-C729
9382 9384
9442-9460 9481
APPENDIX E
Diagnostic Group
ICD-Oa codes
Morphology Topogragphy
III CNS AND MISCELLANEOUS INTRACRANIAL AND INTRASPINAL
NEOPLASMSb Continued
(e) Miscellaneous intracranial and intraspinalneoplasmsc
8270-8281 8300 9350-9362 9480 95059530-9539
(f) Unspecified intracranial and intraspinalneoplasmsc
8000-8004 C700-C729C751-C753
IV SYMPATHETIC NERVOUS SYSTEM TUMOURS
(a) Neuroblastoma and ganglioneuroblastoma 9490 9500
(b) Other sympathetic nervous system tumours 8680 8693-8710 9501-9504 9520-9523
aInternational Classification of Diseases for Oncology Second Edition World Health Organization 1990bGroup III excludes all lymphomas See group II cBehaviour codes 0 and 1 are included dBehaviour code 1 is included
Page 47
Endash
Comments and recommendations are welcome Should questions arise on how to use these
materials or for more information please contact
Centers for Disease Control and Prevention National Program of Cancer Registries
4770 Buford Hwy NE Mail Stop K-53
Atlanta GA 30042-3717
Voice Information System 1 (888) 842-6355 bull Fax (770) 488-4760
cancerinfocdcgov bull httpwwwcdcgovcancer
All materials are in the public domain and may be reproduced or copied without permission citation
to source however is appreciated
BACK COVER
(WHITE)
Spine(WHITE)
DATA COLLECTION OF PRIMARY CEN
TRAL NERVOUS SYSTEM
TUM
ORS 2004
National Program of Cancer Registries Training M
aterials
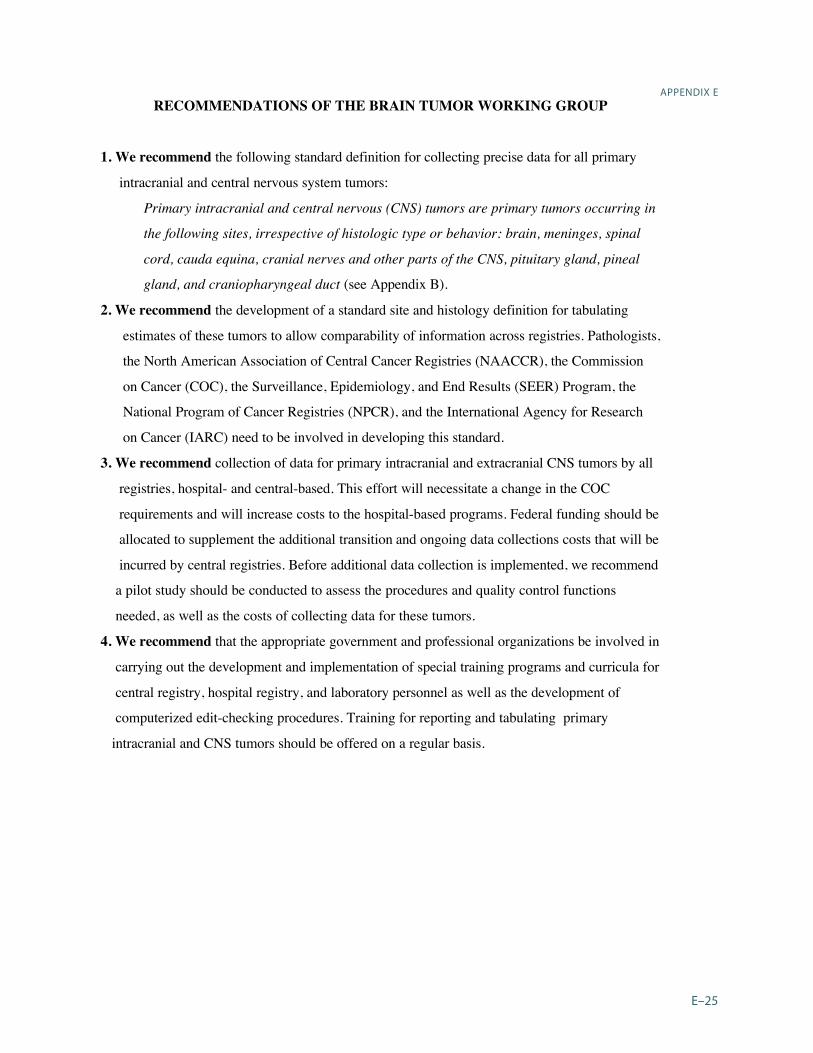
DATA COLLECTION
OF PRIMARY
CENTRAL NERVOUS
SYSTEM TUMORS
TAB
LE 1
C
OM
PAR
ISO
N O
F R
EGIS
TRIE
S SU
PPLY
ING
DA
TA O
N P
RIM
AR
Y I
NTR
AC
RA
NIA
L A
ND
CEN
TRA
L N
ERV
OU
S SY
STEM
TU
MO
RS
IN T
HE
UN
ITED
STA
TES
Cen
tral B
rain
Tum
or R
egis
try o
fth
e U
nite
d St
ates
(CBT
RUS)
Min
neso
ta C
ance
rSu
rvei
llanc
e Sy
stem
(MC
SS)
ACo
SN
a tio
nal C
ance
r Dat
a B
ase
(NCD
B)
Surv
eilla
nce
Epid
emio
logy
and
End
Res
ults
Pro
gram
(SEE
R)
Purp
ose
ldquoCB
TRU
S ce
ntra
lizes
pop
ulat
ion-
base
d in
cide
nce
data
on
all b
rain
tum
ors a
nd u
ses o
ther
exi
stin
gda
ta re
sour
ces t
o ch
arac
teriz
e th
ein
cide
nce
mor
talit
y a
nd su
rviv
alof
pat
ient
s with
bra
in tu
mor
s rdquo
The
MC
SS c
olle
cts i
nfor
mat
ion
onal
l can
cers
dia
gnos
ed si
nce
1988
amon
g M
inne
sota
resi
dent
s Th
e M
CSS
is p
opul
atio
n-ba
sed
path
olog
y-ba
sed
and
is a
n ac
tive
syste
m
ldquoThe
goa
l of t
he N
CD
B is
to p
rese
nt a
n an
nual
sum
mar
y of
pat
ient
car
e fo
r cas
es o
f can
cer
diag
nose
d an
d tre
ated
at h
ospi
tals
thro
ugho
utth
e co
untry
rdquo
ldquoA c
ontin
uing
pro
ject
of th
e N
CI
the
SEER
prog
ram
col
lect
sca
ncer
dat
a on
aro
utin
e ba
sis f
rom
desi
gnat
ed p
opul
atio
n-ba
sed
canc
er re
gist
ries
in v
ario
us a
reas
of t
heco
untry
Targ
et p
opul
atio
n Th
e po
pula
tions
cov
ered
by
regi
strie
s in
Ari
zona
Col
orad
oC
onne
ctic
ut D
elaw
are
Idah
oM
aine
Mas
sach
uset
ts
Min
neso
ta M
issou
ri M
onta
na
Nor
th C
arol
ina
and
Uta
h
The
CB
TRU
S po
pula
tion
repr
esen
ts a
non
rand
om 1
5pe
rcen
t sam
ple
of th
e U
S
popu
latio
n
The
popu
latio
n of
Min
neso
ta
The
popu
latio
ns tr
eate
d at
par
ticip
atin
gho
spita
ls in
the
50 st
ates
the
Dist
rict
of
Col
umbi
a a
nd P
uert
o R
ico
NC
DB
is n
ot a
pop
ulat
ion-
base
d re
gist
ry
At
pres
ent
it is
est
imat
ed to
cov
er a
ppro
xim
atel
y57
per
cent
of t
otal
cas
es n
atio
nwid
e
The
popu
latio
nsco
vere
d by
the
state
regi
strie
s in
Con
nect
icut
Haw
aii
Iow
a N
ew M
exic
o
and
Uta
h a
s wel
l as
the
regi
onal
regi
strie
sin
Atla
nta
Geo
rgia
D
etro
it M
ichi
gan
San
Fran
cisc
o-O
akla
nd C
alifo
rnia
an
d Se
attle
-Pug
etSo
und
Was
hing
ton
The
SEER
pop
ulat
ion
repr
esen
ts a
nonr
ando
m 1
4 pe
rcen
tsa
mpl
e of
the
US
po
pula
tion
Page
28
Endash
APPENDIX E
Cen
tral B
rain
Tum
or R
egis
try o
fth
e U
nite
d St
ates
(CBT
RUS)
Min
neso
ta C
ance
rSu
rvei
llanc
e Sy
stem
(MC
SS)
ACo
SN
a tio
nal C
ance
r Dat
a B
ase
(NCD
B)
Surv
eilla
nce
Epid
emio
logy
and
End
Res
ults
Pro
gram
(SEE
R)
Type
of
prim
ary
intra
cran
ial
and
cent
ral n
ervo
us sy
stem
tum
ors r
epor
ted
Dat
a on
new
ly-d
iagn
osed
cas
es o
fbe
nign
and
mal
igna
nt p
rimar
ybr
ain
tum
ors b
ased
on
ICD
-Oco
des
Dat
a on
new
ly-d
iagn
osed
m
i cro
scop
ical
ly-c
onfir
med
tum
ors
of th
e ce
ntra
l ner
vous
syste
m
incl
udin
g pi
tuita
ry a
nd p
inea
lgl
ands
Hos
pita
ls v
olun
taril
y su
bmit
full
anal
ytic
canc
er re
gist
ry c
asel
oads
with
dat
a ite
ms a
ndco
des d
efin
ed b
y th
e C
omm
issio
n on
Can
cer
(CO
C) f
or h
ospi
tal c
ance
r reg
istri
es
Mos
tpa
rtici
patin
g ho
spita
ls h
ave
prog
ram
sap
prov
ed b
y C
OC
or a
re e
stab
lishi
ng p
rogr
amap
prov
al
NC
DB
cal
ls fo
r dat
a do
not
lim
itca
ses b
y m
alig
nant
beh
avio
r bu
t acc
essi
onin
gof
non
-mal
igna
nt c
ases
is n
ot re
quire
d fo
rpr
ogra
m a
ppro
val
Fifty
-nin
e pe
rcen
t of t
heho
spita
ls th
at su
bmitt
ed a
ny in
tracr
ania
lCN
Sca
ses d
iagn
osed
dur
ing
1989
-199
4 su
bmitt
edat
leas
t one
non
mal
igna
nt c
ase
The
NC
DB
data
in th
is re
port
are
limite
d to
the
case
ssu
bmitt
ed b
y th
ese
hosp
itals
(82
perc
ent o
f all
intra
cran
ial a
nd e
xtra
cran
ial c
entra
l ner
vous
syste
m c
ases
on
file)
Tren
ds in
the
inci
denc
e m
orta
lity
and
patie
nt su
rviv
al o
fbr
ain
tum
ors i
n th
eU
S H
owev
er S
EER
does
not
col
lect
info
rmat
ion
on b
enig
nan
d un
certa
in b
rain
tum
ors
Oth
er c
omm
ents
D
uplic
ate
canc
er re
gist
ratio
ns c
anno
t be
iden
tifie
d by
the
parti
cipa
ting
regi
strie
s
The
MC
SS p
erfo
rms 1
00 p
erce
ntca
se fi
ndin
g au
dits
in a
ll pa
thol
ogy
labo
rato
ries o
n an
ann
ual b
asis
Th
eref
ore
the
data
from
the
MC
SSm
ight
be
cons
ider
ed a
ldquobe
st-ca
sesc
enar
iordquo
in te
rms o
f com
plet
enes
sof
repo
rting
for m
icro
scop
ical
ly-
conf
irmed
tum
ors
Rep
ort d
uplic
atio
n fo
r 198
9-19
94 in
tracr
ania
lan
d ex
tracr
ania
l cen
tral n
ervo
us sy
stem
repo
rts w
as 6
7 p
erce
nt
How
ever
the
NC
DB
data
in T
able
s 2 th
roug
h 9
are
base
d on
undu
plic
ated
repo
rts
Page
29
Endash
DATA COLLECTION
OF PRIMARY
CENTRAL NERVOUS
SYSTEM TUMORS
TABLE 2 NUMBER AND PERCENT OF PRIMARY INTRACRANIAL AND CENTRAL NERVOUS SYSTEM TUMORS BY TUMOR LOCATION
Locationa CBTRUSb
Number () MCSSc
Number () NCDBd
Number () SEERe
Number ()
Intracranial 13084 (947) 3600 (936) 66322 (955) 10196 (969)
Brain 7999 (579) 1924 (500) 48527 (699) 9721 (924)
Meninges 2719 (197) 838 (218) 9365 (135) 139 (13)
Pituitarycraniopharygealduct
1491 (108) 530 (138) 4958 (71) 30 (03)
Pineal 74 (05) 21 (05) 477 (07) 80 (08)
Other central nervous systemincluding cranial nerves
801 (58) 287 (75) 2995 (43) 226 (22)
Extracranial 730 (53) 245 (64) 3137 (45) 322 (31)
Spinal cord 497 (36) 47 (38) 2395 (34) 313 (30)
Spinal meninges 233 (17) 98 (25) 742 (11) 9 (01)
TOTAL 13814 (100) 3845 (100) 69459 (100) 10518 (100)
Note Reported data are incident cases from 1989-1994 except for CBTRUS data which are from 1990-1993
aRefer to the sites in Appendix BbCentral Brain Tumor Registry of the United States cMinnesota Cancer Surveillance System (microscopically confirmed cases only)dNational Cancer Data Base (limited to cases reported by hospitals that accessioned nonmalignant cases) eSurvival Epidemiology and End results Program (malignant cases only)
Page 30
Endash0
TABL
E 3
RO
W P
ERCE
NT
DIS
TRIB
UTI
ON
OF
PRIM
ARY
INTR
ACR
AN
IAL
AN
D C
ENTR
AL
NER
VO
US
SYST
EM T
UM
ORS
BY
TU
MO
R B
EHA
VIO
RA
ND
MIC
ROSC
OPI
C C
ON
FIRM
ATI
ON
Loca
tiona
CB
TRU
Sb M
CSSc
NC
DB
d SE
ERe
Tota
l Pe
rcen
tM
icro
Co
nfirm
ed
Perc
ent
Not
Mic
ro
Conf
irmed
Tota
l Pe
rcen
tM
icro
Co
nfirm
ed
Perc
ent
Not
Mic
ro
Conf
irmed
Tota
l Pe
rcen
tM
icro
Co
nfirm
ed
Perc
ent
Not
Mic
ro
Conf
irmed
Tota
l Pe
rcen
tM
icro
Co
nfirm
ed
Perc
ent
Not
Mic
ro
Conf
irmed
Intra
cran
ial
130
84
867
13
3
360
0 10
0 N
A
663
22
887
11
3
101
96
871
12
9
Mal
igna
nt
717
1 89
2
108
1
824
100
NA
44
801
91
3
87
101
96
871
12
9
Beni
gn a
ndu n
certa
in
591
3 83
5
165
1
776
100
NA
21
521
83
2
168
N
A
NA
N
A
Bra
in
799
9 88
2
118
1
924
100
NA
48
527
90
2
98
972
1 87
3
127
Mal
igna
nt
686
2 89
6
104
1
746
100
NA
42
622
91
5
85
972
1 87
3
127
Beni
gnan
dun
certa
in
113
7 80
6
194
17
8 10
0 N
A
590
5 80
6
194
N
A
NA
N
A
Extra
cran
ial
730
962
3
8 24
5 10
0 N
A
313
7 96
0
40
322
957
4
3
Mal
igna
nt
242
934
6
6 60
10
0 N
A
148
3 96
6
34
322
957
4
3
Beni
gn a
ndu n
certa
in
488
975
2
5 18
5 10
0 N
A
165
4 95
5
45
NA
N
A
NA
TOTA
Lf 13
814
87
2
128
3
845
100
NA
69
459
89
0
110
10
518
87
4
126
Mal
igna
nt
741
3 89
4
106
1
884
100
NA
46
284
91
5
85
105
18
874
12
6
Beni
gn a
ndu n
certa
in
640
1 84
6
154
1
961
100
NA
23
175
84
1
159
N
A
NA
N
A
Not
e R
epor
ted
data
are
inci
dent
cas
es fr
om 1
989-
1994
exc
ept f
or C
BTR
US
data
whi
ch a
re fr
om 1
990-
1993
a Refe
r to
the
site
code
s in
App
endi
x B
b Cent
ral B
rain
Tum
or R
egist
ry o
f the
Uni
ted
Stat
es
c Min
neso
ta C
ance
r Sur
veill
ance
Sys
tem
(mic
rosc
opic
ally
con
firm
ed c
ases
onl
y)
d Nat
iona
l Can
cer D
ata
Base
(lim
ited
to c
ases
repo
rted
by h
ospi
tals
that
acc
essio
ned
nonm
alig
nant
cas
es)
e Surv
eilla
nce
Epi
dem
iolo
gy a
nd E
nd R
esul
ts Pr
ogra
m (m
alig
nant
cas
es o
nly)
f In
clud
es in
tracr
ania
l and
ext
racr
ania
l cas
es
NA
= N
ot a
pplic
able
Page
31
APPENDIX E
Endash
DATA COLLECTION
OF PRIMARY
CENTRAL NERVOUS
SYSTEM TUMORS
TABLE 4 NUMBER AND PERCENT OF PRIMARY INTRACRANIAL AND CENTRAL NERVOUS SYSTEM TUMORS BY DIAGNOSTIC CONFIRMATION
DiagnosticConfirmation
CBTRUSa
Number () MCSSb
Number () NCDBc
Number () SEERd
Number ()
Positive microscopy
12087 (875) 3845 (100) 61818 (890) 9188 (874)
Radiographywithout microscopy
1306 (95) NA 6759 (97) 1015 (97)
Clinical 204 (15) NA 484 (07) 98 (09)
Unknown 217 (15) NA 398 (06) 217 (21)
TOTAL 13814 (100) 3845 (100) 69459 (100) 10518 (100)
Note Reported data are incident cases from 1989-1994 except for CBTRUS data which are from 1990-1993
aCentral Brain Tumor Registry of the United Statesb Minnesota Cancer Surveillance System (microscopically confirmed cases only) cNational Cancer Data Base (limited to cases reported by hospitals that accessioned nonmalignant cases)dSurveillance Epidemiology and End Results Program (malignant cases only)NA = Not applicable
Page 32
Endash
Page 32
TABLE 4 NUMBER AND PERCENT OF PRIMARY INTRACRANIAL AND CENTRALNERVOUS SYSTEM TUMORS BY DIAGNOSTIC CONFIRMATION
DiagnosticConfirmation
CBTRUSa
Number ()MCSSb
Number ()NCDBc
Number ()SEERd
Number ()
Positivemicroscopy
12087 (875) 3845 (100) 61818 (890) 9188 (874)
Radiographywithout microscopy
1306 (95) NA 6759 (97) 1015 (97)
Clinical 204 (15) NA 484 (07) 98 (09)
Unknown 217 (15) NA 398 (06) 217 (21)
TOTAL 13814 (100) 3845 (100) 69459 (100) 10518 (100)
Note Reported data are incident cases from 1989-1994 except for CBTRUS data which are from 1990-1993
aCentral Brain Tumor Registry of the United Statesb Minnesota Cancer Surveillance System (microscopically confirmed cases only)cNational Cancer Data Base (limited to cases reported by hospitals that accessioned nonmalignant cases)dSurveillance Epidemiology and End Results Program (malignant cases only)NA = Not applicable
APPENDIX E
TABLE 5 NUMBER AND PERCENT OF MALIGNANT PRIMARY INTRACRANIAL AND CENTRAL SYSTEM TUMORS BY TUMOR LOCATION
Locationa CBTRUSb
Number () MCSSc
Number () NCDBd
Number () SEERe
Number ()
Intracranial 7171 (977) 1824 (968) 44801 (968) 10196 (969)
Brain 6862 (926) 1746 (927) 42622 (921) 9721 (924)
Meninges 98 (13) 23 (12) 581 (13) 139 (13)
Pituitarycraniopharyngealduct
37 (05) 13 (07) 189 (04) 30 (03)
Pineal 58 (08) 20 (11) 378 (08) 80 (08)
Other central nervous systemincluding cranial nerves
116 (16) 22 (12) 1031 (22) 226 (21)
Extracranial 242 (33) 60 (32) 1483 (32) 322 (31)
Spinal cord 234 (32) 60 (32) 1410 (30) 313 (30)
Spinal meninges 8 (01) 0 73 (02) 9 (01)
TOTAL 7413 (100) 1884 (100) 46284 (100) 10518 (100)
Note Reported data are incident cases from 1989-1994 except for CBTRUS data which are from 1990-1993
aRefer to the site codes in Appendix BbCentral Brain Tumor Registry of the United States cMinnesota Cancer Surveillance System (microscopically confirmed cases only)dNational Cancer Data Base (limited to cases reported by hospitals that accessioned nonmalignant cases) eSurvival Epidemiology and End Results Program (malignant cases only)
Page 33
Endash
DATA COLLECTION
OF PRIMARY
CENTRAL NERVOUS
SYSTEM TUMORS
TABLE 6 NUMBER AND PERCENT OF PRIMARY INTRACRANIAL AND CENTRAL NERVOUS SYSTEM TUMORS OF BENIGN AND UNCERTAIN BEHAVIOR BY TUMOR LOCATION
Locationa CBTRUSb
Number () MCSSc
Number () NCDBd
Number () SEERe
Number ()
Intracranial 5913 (924) 1776 (906) 21521 (929) NA
Brain 1137 (178) 178 (91) 5905 (255) NA
Meninges 2621 (409) 815 (416) 8784 (379) NA
Pituitarycraniopharyngealduct
1454 (227) 517 (264) 4769 (206) NA
Pineal 16 (02) 1 (lt01) 99 (04) NA
Other central nervous systemincluding cranial nerves
685 (107) 265 (135) 1964 (85) NA
Extracranial 488 (76) 185 (94) 1654 (71) NA
Spinal cord 263 (41) 87 (44) 985 (42) NA
Spinal meninges 225 (35) 98 (50) 669 (29) NA
TOTAL 6401 (100) 1961 (100) 23175 (100) NA
Note Reported data are incident cases from 1989-1994 except for CBTRUS data which are from 1990-1993
aRefer to the site codes in Appendix BbCentral Brain Tumor Registry of the United States cMinnesota Cancer Surveillance System (microscopically confirmed cases only)dNational Cancer Data Base (limited to cases reported by hospitals that accessioned nonmalignant cases) eSurveillance Epidemiology and End Results Program (malignant cases only)NA = Not applicable
Page 34
Endash
APPENDIX E TABLE 7 NUMBER AND PERCENT OF PRIMARY INTRACRANIAL AND CENTRAL
NERVOUS SYSTEM TUMORS BY TUMOR BEHAVIOR AND LOCATION
BehaviorTumor Locationa
CBTRUSb
Number () MCSSc
Number () NCDBd
Number () SEERe
Number ()
Malignant 7413 (537) 1884 (490) 46284 (666) 10518 (100)
Brain 6862 (497) 1746 (454) 42622 (614) 9721 (924)
Meninges 98 (07) 23 (06) 581 (08) 139 (13)
Pituitarycraniopharyn-geal ductpineal
95 (07) 33 (09) 567 (08) 110 (11)
Other central nervous system includingcranial nerves
116 (08) 22 (06) 1031 (15) 226 (22)
Spinal cord 242 (18) 60 (16) 1483 (21) 322 (31)
Benign 5794 (419) 1787 (465) 20694 (298) NA
Brain 803 (58) 99 (26) 4491 (65) NA
Meninges 2565 (186) 807 (210) 8613 (124) NA
Pituitarycraniopharyn-geal ductpineal
1322 (96) 458 (119) 4330 (62) NA
Other central nervous system includingcranial nerves
678 (49) 263 (68) 1911 (28) NA
Spinal cord 426 (31) 160 (42) 1349 (19) NA
Uncertain 607 (44) 174 (45) 2481 (36) NA
Brain 334 (24) 79 (21) 1414 (20) NA
Meninges 56 (04) 8 (02) 171 (02) NA
Pituitarycraniopharyn-geal ductpineal
148 (11) 60 (16) 538 (08) NA
Other central nervous system includingcranial nerves
7 (01) 2 (01) 53 (01) NA
Spinal cord 62 (05) 25 (07) 305 (04) NA
TOTAL 13814 (100) 3845 (100) 69459 (100) 10518 (100)
Note Reported data are incident cases from 1989-1994 except for CBTRUS data which are from 1990-1993 NA=Not applicableaRefer to the site codes in Appendix B bCentral Brain Tumor Registry of the United States cMinnesota Cancer Surveillance System (microscopically confirmed cases only)dNational Cancer Data Base (limited to cases reported byhospitals that accessioned nonmalignant cases eSurvival Epidemiology and End Results Program (malignant cases only)
Page 35
Endash
DATA COLLECTION
OF PRIMARY
CENTRAL NERVOUS
SYSTEM TUMORS
TABLE 8 NUMBER AND PERCENT OF MALIGNANT PRIMARY INTRACRANIAL AND
CENTRAL NERVOUS SYSTEM TUMORS BY HISTOLOGY GROUPINGS
WHO Histologya
Groupings CBTRUSb
Number () MCSSc
Number () NCDBd
Number () SEERe
Number ()
Neuroepithelial 6477 (874) 1689 (896) 39701 (858) 8676 (825)
Tumors of cranial and spinal nerves
12 (02) 3 (02) 108 (02) 25 (02)
Tumors of meninges
137 (18) 25 (13) 994 (21) 194 (18)
LymphomasHemopoietic
473 (64) 121 (64) 3492 (75) 1099 (105)
Germ cell 70 (09) 20 (11) 403 (09) 97 (09)
Cysts and tumor-like lesions
0 0 0 0
Tumors of sellar region
20 (03) 11 (06) 100 (02) 6 (01)
Local extensions 29 (04) 11 (06) 166 (04) 38 (04)
Unclassifiedunassigned tumorsf
195 (26) 4 (02) 1320 (29) 383 (36)
TOTAL 7413 (100) 1884 (100) 46284 (100) 10518 (100)
Note Reported data are incident cases from 1989-1994 except for CBTRUS data which are from 1990-1993
aRefer to the World Health Organization (WHO) histology groupings in Appendix CbCentral Brain Tumor Registry of the United States cMinnesota Cancer Surveillance System (microscopically confirmed cases only)dNational Cancer Data Base (limited to cases reported by hospitals that accessioned nonmalignant cases) f For MCSS unclassifiedunassigned tumors include one malignant and four nonmalignant histologies which were
not listed in the CBTRUS classification scheme For NCDB unclassifiedunassigned tumors include 319 cases(less than one half percent) which had histologies not assigned by CBTRUS to any other category For SEERunclassifiedunassigned tumors include all malignant histologies occurring in the brainCNS which could not beclassified in one of the above categories based on their 4-digit histologic type
Page 36
Endash
APPENDIX E
TABLE 9 NUMBER AND PERCENT OF PRIMARY INTRACRANIAL AND CENTRAL NERVOUS SYSTEM TUMORS OF BENIGN AND UNCERTAIN BEHAVIOR
BY HISTOLOGY GROUPINGS
WHO Histologya
Groupings CBTRUSb
Number () MCSSc
Number () NCDBd
Number () SEERe
Number ()
Neuroepithelial 275 (43) 91 (46) 1064 (46) NA
Tumors of cranial and spinal nerves
980 (153) 397 (202) 2618 (113) NA
Tumors of meninges
3509 (548) 941 (480) 13667 (590) NA
LymphomasHemopoietic
3 (lt01) 0 7 (lt01) NA
Germ cell 4 (lt01) 1 (01) 25 (01) NA
Cysts and tumor-like lesions
15 (02) 3 (02) 34 (01) NA
Tumors of sellar region
1444 (226) 510 (260) 4749 (205) NA
Local extensions 0 0 0 NA
Unclassifiedunassigned tumorsf
171 (27) 18 (09) 1011 (44) NA
TOTAL 6401 (100) 1961 (100) 23175 (100) NA
Note Reported data are incident cases from 1989-1994 except for CBTRUS which is 1990-1993
aRefer to the World Health Organization (WHO) histology groupings in Appendix CbCentral Brain Tumor Registry of the United States c Minnesota Cancer Surveillance System (microscopically confirmed cases only) dNational Cancer Data Base (limited to cases reported by hospitals that accessioned nonmalignant cases) eSurvival Epidemiology and End Results Program (malignant cases only)dFor MCSS unclassifiedunassigned tumors include one malignant and four nonmalignant histologies which werenot listed in the CBTRUS classification scheme For NCDB unclassifiedunassigned tumors include 319 cases(less than one half percent) which had histologies not assigned by CBTRUS to any other category For SEERunclassifiedunassigned tumors include all malignant histologies occurring in the brainCNS which could not beclassified in one of the above categories based on their 4-digit histologic typeNA = Not applicable
Page 37
Endash
DATA COLLECTION
OF PRIMARY
CENTRAL NERVOUS
SYSTEM TUMORS
TABLE 10 METHOD OF CASE FINDING FOR PRIMARY INTRACRANIAL AND CENTRAL NERVOUS SYSTEM TUMORS BY TUMOR BEHAVIOR AND LOCATION MINNESOTA 1989-1994
Behavior Tumor Locationa
Number of Cases
Percent Found byRoutine
Reporting
Percent Found by Special Efforts
Malignant Brain Cerebral meninges
Pituitarycranio duct pineal Other intracranial
18841746 23 33
22
961 965 957 939
864
39 35 43 61
136 Extracranial 60 883 117 Benign Brain
1787 99
788 838
212 162
Cerebral meninges Pituitarycranio duct
pineal Other intracranial
807 458
263
843 740
779
157 260
221 Extracranial 160 631 369 Uncertain 174 856 144 Brain 79 823 177 Cerebral meninges Pituitarycraniopharyn- geal ductpineal Other intracranial
8 60
2
875 850
1000
125 150
00 Extracranial 25 960 40
TOTAL 3845 876 124
aRefer to the site codes in Appendix B
Page 38
Endash
1989 1990 1991 1992 1993 1994
TOTAL
APPENDIX E TABLE 11 METHOD OF CASE FINDING FOR INTRACRANIALa TUMORS BY DIAGNOSIS YEAR MINNESOTA 1989-1994
DiagnosisYear
Number of
Cases
Percent Found byRoutine
Reporting
Percent Found by
Special Efforts
571 837 163 616 865 135 586 913 87 602 899 101
633 872 128 592 929 71
3600 886 114
aIncludes the brain cerebral meninges pituitary gland pineal gland and otherintracranial tumors (refer to the site codes in Appendix B)
Page 39
Endash
DATA COLLECTION
OF PRIMARY
CENTRAL NERVOUS
SYSTEM TUMORS
TABLE 12 METHOD OF CASE FINDING FOR NONMALIGNANT INTRACRANIALa TUMORS BY TYPE OF FACILITY MINNESOTA 1989-1994
Type of Facility Number of Tumors Percent Found byRoutine
Reporting
Percent Found by Special Efforts
Registry at facility No registry at facility
1451325
859 569
141 431
TOTAL 1776 806 194
aIncludes tumors with benign or uncertain behavior that involve the brain cerebral meningespituitary gland pineal gland or other intracranial sites (refer to the site codes in Appendix B)
TABLE 13 REPORTING METHOD AND SOURCE OF CASE FINDING FOR NON- MALIGNANT INTRACRANIALa TUMORS DIAGNOSED IN HOSPITALS WITH A TUMOR REGISTRY MINNESOTA 1989-1994
Reporting Method Number of Tumors Percent Found byRoutine
Reporting
Percent Found by
Special Efforts
Registry-reportedLaboratory-reported
1226225
925 502
75 498
TOTAL 1451 859 141
aIncludes tumors with benign or uncertain behavior that involve the brain cerebral meningespituitary gland pineal gland or other intracranial sites (refer to the site codes in Appendix B)
Page 40
Endash0
APPENDIX E TABLE 14 HOSPITAL REGISTRY ACCESSIONING OF MALIGNANT AND NON-
MALIGNANT PRIMARY INTRACRANIAL AND CENTRAL NERVOUS SYSTEM TUMORS NCDB 1989-1994
TUMOR Totalb
BEHAVIOR Malignant c Nonmalignantd
Tumor Locationa HospitalsReporting
Number ()
Hospitals Reporting
Number ()
Hospitals Reporting
Number ()
Intracranial 1542 (100) 1526 (100) 900 (99)
Brain 1527 (99) 1519 (gt99) 754 (83)
Meninges 740 (48) 390 (26) 613 (67)
Pituitaryglandcraniopharyn-
geal duct
602 (39) 168 (11) 538 (59)
Pineal gland 319 (21) 277 (18) 79 (9)
Other central nervous system including cranial
nerves
648 (42) 545 (36) 299 (33)
Extracranial 812 (53) 708 (46) 410 (45)
Spinal cord 760 (49) 692 (45) 311 (34)
Spinal meninges 299 (19) 72 (5) 258 (28)
TOTAL Hospitals 1542 (100) 1526 (100) 913 (100)
Note The number of hospitals in each of the second third and fourth columns is the number that submittedreports to the NCDB for any intracranial and central nervous system tumors for the respective malignancystatus Not all hospitals submitted reports for each year during the study period (1989-1994)
aRefer to the site codes in Appendix B bBehavior codes = 0 1 3 cBehavior code = 3 dBehavior codes = 0 1
Page 41
Endash
DATA COLLECTION
OF PRIMARY
CENTRAL NERVOUS
SYSTEM TUMORS
Texas Cancer Registry
1997 CBTRUS State Survey of Benign Brain Tumor Data Collection
State Collection Status
Currently Collecting Benign Tumor Data1 Arizona Cancer Registry since 1981 2 Colorado Central Cancer Registry since 1988 3 Connecticut Tumor Registry since 1965 4 Idaho Cancer Data Registry since 1970 5 Maine Cancer Registry since 1983 6 Massachusetts Cancer Registry since 1982 7 Minnesota Cancer Surveillance System since 1988 8 Montana Central Tumor Registry since 1979 9 New York State Cancer Registry since 1988
10 North Carolina Central Cancer Registry since 1990 11 Utah Cancer Registry since 1966 12 Virginia Cancer Registry since 1994 13 Delaware State Cancer Registry14 Washington State Cancer Registry since 1992 15 passive collection 1979-1994
active collection since 1995
Stopped or Passive Collection of Benign Tumor Data1 New Jersey State Cancer Registry stopped 1979-1995 2 Kansas Cancer Registry stopped 1969-1995 3 New Hampshire State Cancer Registry stopped 1986-1991 4 District of Columbia Cancer Registry stopped 1997 5 Wyoming Cancer Surveillance Program stopped 111996 6 Louisiana Tumor Registry stopped 1992 (passive collection) 7 Illinois State Cancer Registry stopped 111996 8 Missouri Cancer Registry passive collection since 1984 9 South Carolina Central Cancer Registry passive collection since 1996
Beginning Collection of Benign Tumor Data1 North Dakota Cancer Registry began collection 1997 2 Rhode Island Cancer Registry began collection 1998
Page 42
Endash
APPENDIX E
Codes for Primary Intracranial and Central Nervous System Tumors
Note For this report the designation of ldquoprimary intracranial and central nervous system tumorsrdquo includes thefollowing primary tumors of central nervous system sites as well as tumors of the pituitary and pinealglands All histology types within the topography codes are included in the designation of ldquoprimaryintracranial and CNS tumors The source for the topography codes is Percy C Van Holten V Muir Ceds International Classification of Diseases for Oncology Second Edition Geneva World Health Organization 1990
Intracranial tumors
Brain C710 Cerebrum C711 Frontal lobe C712 Temporal lobe C713 Parietal lobe C714 Occipital lobe C715 Ventricle NOSC716 Cerebellum NOS C717 Brain stem C718 Overlapping lesion of brain C719 Brain NOS
Meninges C700 Cerebral meninges C709 Meninges NOS
a
Cranial Nerves and other intracranial parts of the central nervous systemC722 Olfactory nerve C723 Optic nerve C724 Acoustic nerve C725 Cranial nerve NOS C728 Overlapping lesion of brain and central nervous system C729 Nervous system NOS
Other endrocrine glands and related structures C751 Pituitary gland C752 Craniopharyngeal duct C753 Pineal gland
Extracranial tumors
Spinal cord C720 Spinal cord C721 Cauda equina
Meninges C701 Spinal meninges
aNOS=Not Otherwise Specified
Page 43
Endash
DATA COLLECTION
OF PRIMARY
CENTRAL NERVOUS
SYSTEM TUMORS
Brain Tumor Histology Groupings
The following histology groupings were used for the primary intracranial and central nervoussystem tumors The source for the histology groupings is Central Brain Tumor Registry ofthe United States (CBTRUS) 1996 Statistics Report Table 4
WHOa HISTOLOGY GROUPINGS ICD-Ob MORPHOLOGY CODE
Diffuse astrocytoma (protoplasma fibrillary) 9410 9420 Anaplastic astrocytoma 9401 9411 Glioblastoma 9440 9441 9442 Pilocytic astrocytoma 9421 Unique astrocytoma variants 9383 9384 9424 Oligodendroglioma 9450 Anaplastic oligodendroglioma 9451 9460 Ependymomaanaplastic ependymoma 9391 9392 9393 Ependymoma variants 9394 Mixed glioma 9382 Astrocytoma NOSc 9400 Glioma malignant NOS 9380 Choroid plexus 9390 Neuroepithelial 9381 9423 9430 Benign neuronalglial neuronal and mixed 86801 8693 9490 9505 9506 Malignant neruonalglial neuronal and mixed 86803 9364 9490 9500 Pineal parenchymal 9360 9361 9362 Embryonalprimitivemedulloblastoma 8963 9470 9471 9472
9473 9501 9502 9503 9510
TUMORS OF NEUROEPITHELIAL TISSUE
TUMORS OF CRANIAL AND SPINAL NERVES Nerve sheath benign and malignant 9540 9550 9560 9570
TUMORS OF THE MENINGES Meningioma 9530 9531 9532 9533 9534 9537 9538 Other mesenchymal benign and malignant 8800 8801 8802 8803 8810 8830 8850 88618900
8910 8990 9133 9150 9240 9480 9481 9536 9539 Hemangioblastoma 9161 9535
LYMPHOMAS AND HEMOPOIETIC NEOPLASMS Lymphoma 9590 9591 9593 9594 9595 9630 9650 9652
9663 9670 9671 9672 9674 9675 9680 9681 9682 9684 9685 9686 9687 9690 9691 96939695 9696 9698 9702 9714 9723 9731 9766 9970
GERM CELL TUMORS Germ cell 8020 9060 9064 9070 9071 9080 9084 9085 9100
CYSTS AND TUMOR-LIKE LESIONS Cysts and heterotopias 9084
TUMORS OF THE SELLAR REGION Pituitary 8040 8l40 8l46 8260 8270 8271 8280
8281 8290 8300 8330 8323 8333 Craniopharyngioma 9350
Page 44
Endash
APPENDIX E
LOCAL EXTENSIONS FROM REGIONAL TUMORS Chordomachondrosarcoma 9370
UNCLASSIFIED TUMORS Hemangioma 9120 9121 9130 9131 Neoplasm benign 80000 8010 Neoplasm uncertain behavior 80001 80011 Neoplasm malignant 80003 80013 8002 8003 All other 8720 9580
aWHO = World Health OrganizationbICD-O = International Classification of Diseases for Oncology Second Edition 1990 cNOS=Not Otherwise Specified
Page 45
Endash
DATA COLLECTION
OF PRIMARY
CENTRAL NERVOUS
SYSTEM TUMORS
Endash
International Classification of Childhood Cancer (ICCC)
Diagnostic Group
ICD-Oa codes
Morphology Topography
I LEUKAEMIA
(a) Lymphoid leukaemia 9820-9827 9850
(b) Acute non-lymphocytic leukaemia 9840 9841 9861 9864 9866 9867 98919894 9910
(c) Chronic myeloid leukaemia 9863 9868
(d) Other specified leukaemias 9830 9842 9860 9862 9870-9890 9892 98939900 9930-9941
(e) Unspecified leukaemias 9800-9804
II LYMPHOMAS AND OTHER RETICULOENDOTHELIAL NEOPLASMS
(a) Hodgkinrsquos disease 9650-9667
(b) Non-Hodgkinrsquos lymphoma 9591-9595 9670-9686 9690-9714 9723
(c) Burkittrsquos lymphoma 9687
(d) Miscellaneous lymphoreticular neoplasms 9720 9731-9764
(e) Unspecified lymphomas 9590
III CENTRAL NERVOUS SYSTEM (CNS) ANDMISCELLANEOUS INTRACRANIAL AND
INTRASPINAL NEOPLASMSb
(a) Ependymomac 9383 9390-9394
(b) Astrocytoma 9380 C723
9381 9400-9441
(c) Primitive neuroectodermal tumours 9470-9473
(d) Other gliomasd 9380 C700-C722C724-C729
9382 9384
9442-9460 9481
APPENDIX E
Diagnostic Group
ICD-Oa codes
Morphology Topogragphy
III CNS AND MISCELLANEOUS INTRACRANIAL AND INTRASPINAL
NEOPLASMSb Continued
(e) Miscellaneous intracranial and intraspinalneoplasmsc
8270-8281 8300 9350-9362 9480 95059530-9539
(f) Unspecified intracranial and intraspinalneoplasmsc
8000-8004 C700-C729C751-C753
IV SYMPATHETIC NERVOUS SYSTEM TUMOURS
(a) Neuroblastoma and ganglioneuroblastoma 9490 9500
(b) Other sympathetic nervous system tumours 8680 8693-8710 9501-9504 9520-9523
aInternational Classification of Diseases for Oncology Second Edition World Health Organization 1990bGroup III excludes all lymphomas See group II cBehaviour codes 0 and 1 are included dBehaviour code 1 is included
Page 47
Endash
Comments and recommendations are welcome Should questions arise on how to use these
materials or for more information please contact
Centers for Disease Control and Prevention National Program of Cancer Registries
4770 Buford Hwy NE Mail Stop K-53
Atlanta GA 30042-3717
Voice Information System 1 (888) 842-6355 bull Fax (770) 488-4760
cancerinfocdcgov bull httpwwwcdcgovcancer
All materials are in the public domain and may be reproduced or copied without permission citation
to source however is appreciated
BACK COVER
(WHITE)
Spine(WHITE)
DATA COLLECTION OF PRIMARY CEN
TRAL NERVOUS SYSTEM
TUM
ORS 2004
National Program of Cancer Registries Training M
aterials
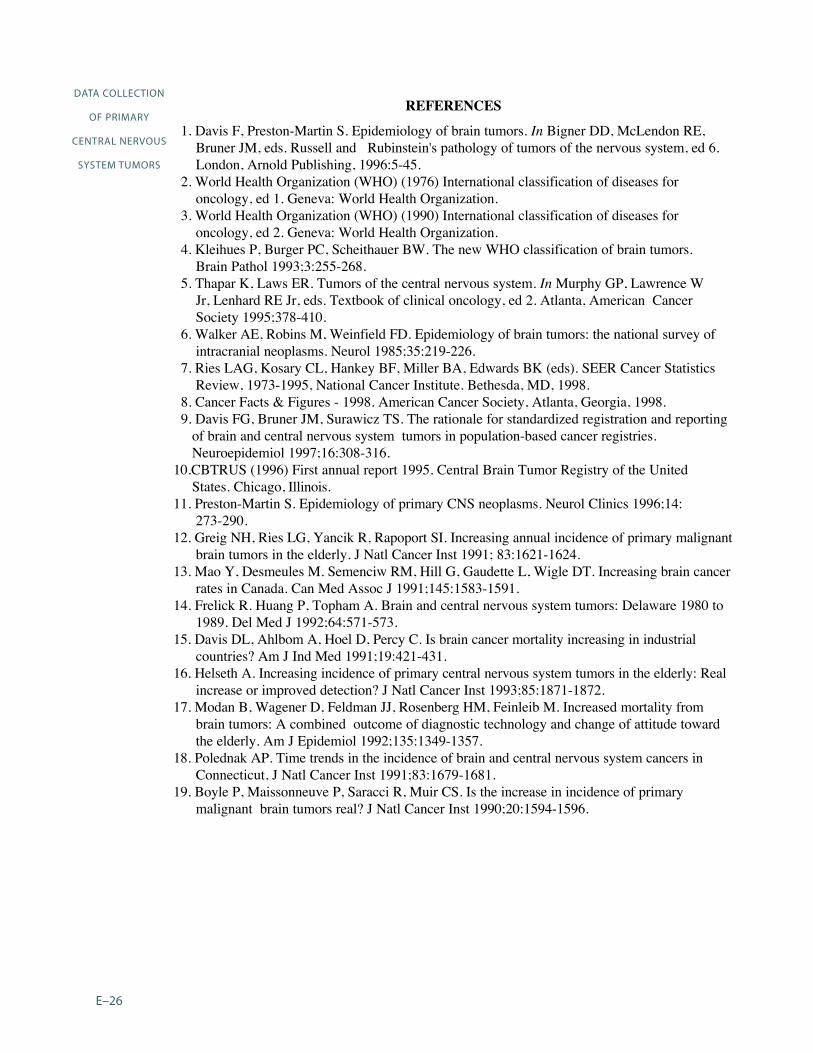
APPENDIX E
Cen
tral B
rain
Tum
or R
egis
try o
fth
e U
nite
d St
ates
(CBT
RUS)
Min
neso
ta C
ance
rSu
rvei
llanc
e Sy
stem
(MC
SS)
ACo
SN
a tio
nal C
ance
r Dat
a B
ase
(NCD
B)
Surv
eilla
nce
Epid
emio
logy
and
End
Res
ults
Pro
gram
(SEE
R)
Type
of
prim
ary
intra
cran
ial
and
cent
ral n
ervo
us sy
stem
tum
ors r
epor
ted
Dat
a on
new
ly-d
iagn
osed
cas
es o
fbe
nign
and
mal
igna
nt p
rimar
ybr
ain
tum
ors b
ased
on
ICD
-Oco
des
Dat
a on
new
ly-d
iagn
osed
m
i cro
scop
ical
ly-c
onfir
med
tum
ors
of th
e ce
ntra
l ner
vous
syste
m
incl
udin
g pi
tuita
ry a
nd p
inea
lgl
ands
Hos
pita
ls v
olun
taril
y su
bmit
full
anal
ytic
canc
er re
gist
ry c
asel
oads
with
dat
a ite
ms a
ndco
des d
efin
ed b
y th
e C
omm
issio
n on
Can
cer
(CO
C) f
or h
ospi
tal c
ance
r reg
istri
es
Mos
tpa
rtici
patin
g ho
spita
ls h
ave
prog
ram
sap
prov
ed b
y C
OC
or a
re e
stab
lishi
ng p
rogr
amap
prov
al
NC
DB
cal
ls fo
r dat
a do
not
lim
itca
ses b
y m
alig
nant
beh
avio
r bu
t acc
essi
onin
gof
non
-mal
igna
nt c
ases
is n
ot re
quire
d fo
rpr
ogra
m a
ppro
val
Fifty
-nin
e pe
rcen
t of t
heho
spita
ls th
at su
bmitt
ed a
ny in
tracr
ania
lCN
Sca
ses d
iagn
osed
dur
ing
1989
-199
4 su
bmitt
edat
leas
t one
non
mal
igna
nt c
ase
The
NC
DB
data
in th
is re
port
are
limite
d to
the
case
ssu
bmitt
ed b
y th
ese
hosp
itals
(82
perc
ent o
f all
intra
cran
ial a
nd e
xtra
cran
ial c
entra
l ner
vous
syste
m c
ases
on
file)
Tren
ds in
the
inci
denc
e m
orta
lity
and
patie
nt su
rviv
al o
fbr
ain
tum
ors i
n th
eU
S H
owev
er S
EER
does
not
col
lect
info
rmat
ion
on b
enig
nan
d un
certa
in b
rain
tum
ors
Oth
er c
omm
ents
D
uplic
ate
canc
er re
gist
ratio
ns c
anno
t be
iden
tifie
d by
the
parti
cipa
ting
regi
strie
s
The
MC
SS p
erfo
rms 1
00 p
erce
ntca
se fi
ndin
g au
dits
in a
ll pa
thol
ogy
labo
rato
ries o
n an
ann
ual b
asis
Th
eref
ore
the
data
from
the
MC
SSm
ight
be
cons
ider
ed a
ldquobe
st-ca
sesc
enar
iordquo
in te
rms o
f com
plet
enes
sof
repo
rting
for m
icro
scop
ical
ly-
conf
irmed
tum
ors
Rep
ort d
uplic
atio
n fo
r 198
9-19
94 in
tracr
ania
lan
d ex
tracr
ania
l cen
tral n
ervo
us sy
stem
repo
rts w
as 6
7 p
erce
nt
How
ever
the
NC
DB
data
in T
able
s 2 th
roug
h 9
are
base
d on
undu
plic
ated
repo
rts
Page
29
Endash
DATA COLLECTION
OF PRIMARY
CENTRAL NERVOUS
SYSTEM TUMORS
TABLE 2 NUMBER AND PERCENT OF PRIMARY INTRACRANIAL AND CENTRAL NERVOUS SYSTEM TUMORS BY TUMOR LOCATION
Locationa CBTRUSb
Number () MCSSc
Number () NCDBd
Number () SEERe
Number ()
Intracranial 13084 (947) 3600 (936) 66322 (955) 10196 (969)
Brain 7999 (579) 1924 (500) 48527 (699) 9721 (924)
Meninges 2719 (197) 838 (218) 9365 (135) 139 (13)
Pituitarycraniopharygealduct
1491 (108) 530 (138) 4958 (71) 30 (03)
Pineal 74 (05) 21 (05) 477 (07) 80 (08)
Other central nervous systemincluding cranial nerves
801 (58) 287 (75) 2995 (43) 226 (22)
Extracranial 730 (53) 245 (64) 3137 (45) 322 (31)
Spinal cord 497 (36) 47 (38) 2395 (34) 313 (30)
Spinal meninges 233 (17) 98 (25) 742 (11) 9 (01)
TOTAL 13814 (100) 3845 (100) 69459 (100) 10518 (100)
Note Reported data are incident cases from 1989-1994 except for CBTRUS data which are from 1990-1993
aRefer to the sites in Appendix BbCentral Brain Tumor Registry of the United States cMinnesota Cancer Surveillance System (microscopically confirmed cases only)dNational Cancer Data Base (limited to cases reported by hospitals that accessioned nonmalignant cases) eSurvival Epidemiology and End results Program (malignant cases only)
Page 30
Endash0
TABL
E 3
RO
W P
ERCE
NT
DIS
TRIB
UTI
ON
OF
PRIM
ARY
INTR
ACR
AN
IAL
AN
D C
ENTR
AL
NER
VO
US
SYST
EM T
UM
ORS
BY
TU
MO
R B
EHA
VIO
RA
ND
MIC
ROSC
OPI
C C
ON
FIRM
ATI
ON
Loca
tiona
CB
TRU
Sb M
CSSc
NC
DB
d SE
ERe
Tota
l Pe
rcen
tM
icro
Co
nfirm
ed
Perc
ent
Not
Mic
ro
Conf
irmed
Tota
l Pe
rcen
tM
icro
Co
nfirm
ed
Perc
ent
Not
Mic
ro
Conf
irmed
Tota
l Pe
rcen
tM
icro
Co
nfirm
ed
Perc
ent
Not
Mic
ro
Conf
irmed
Tota
l Pe
rcen
tM
icro
Co
nfirm
ed
Perc
ent
Not
Mic
ro
Conf
irmed
Intra
cran
ial
130
84
867
13
3
360
0 10
0 N
A
663
22
887
11
3
101
96
871
12
9
Mal
igna
nt
717
1 89
2
108
1
824
100
NA
44
801
91
3
87
101
96
871
12
9
Beni
gn a
ndu n
certa
in
591
3 83
5
165
1
776
100
NA
21
521
83
2
168
N
A
NA
N
A
Bra
in
799
9 88
2
118
1
924
100
NA
48
527
90
2
98
972
1 87
3
127
Mal
igna
nt
686
2 89
6
104
1
746
100
NA
42
622
91
5
85
972
1 87
3
127
Beni
gnan
dun
certa
in
113
7 80
6
194
17
8 10
0 N
A
590
5 80
6
194
N
A
NA
N
A
Extra
cran
ial
730
962
3
8 24
5 10
0 N
A
313
7 96
0
40
322
957
4
3
Mal
igna
nt
242
934
6
6 60
10
0 N
A
148
3 96
6
34
322
957
4
3
Beni
gn a
ndu n
certa
in
488
975
2
5 18
5 10
0 N
A
165
4 95
5
45
NA
N
A
NA
TOTA
Lf 13
814
87
2
128
3
845
100
NA
69
459
89
0
110
10
518
87
4
126
Mal
igna
nt
741
3 89
4
106
1
884
100
NA
46
284
91
5
85
105
18
874
12
6
Beni
gn a
ndu n
certa
in
640
1 84
6
154
1
961
100
NA
23
175
84
1
159
N
A
NA
N
A
Not
e R
epor
ted
data
are
inci
dent
cas
es fr
om 1
989-
1994
exc
ept f
or C
BTR
US
data
whi
ch a
re fr
om 1
990-
1993
a Refe
r to
the
site
code
s in
App
endi
x B
b Cent
ral B
rain
Tum
or R
egist
ry o
f the
Uni
ted
Stat
es
c Min
neso
ta C
ance
r Sur
veill
ance
Sys
tem
(mic
rosc
opic
ally
con
firm
ed c
ases
onl
y)
d Nat
iona
l Can
cer D
ata
Base
(lim
ited
to c
ases
repo
rted
by h
ospi
tals
that
acc
essio
ned
nonm
alig
nant
cas
es)
e Surv
eilla
nce
Epi
dem
iolo
gy a
nd E
nd R
esul
ts Pr
ogra
m (m
alig
nant
cas
es o
nly)
f In
clud
es in
tracr
ania
l and
ext
racr
ania
l cas
es
NA
= N
ot a
pplic
able
Page
31
APPENDIX E
Endash
DATA COLLECTION
OF PRIMARY
CENTRAL NERVOUS
SYSTEM TUMORS
TABLE 4 NUMBER AND PERCENT OF PRIMARY INTRACRANIAL AND CENTRAL NERVOUS SYSTEM TUMORS BY DIAGNOSTIC CONFIRMATION
DiagnosticConfirmation
CBTRUSa
Number () MCSSb
Number () NCDBc
Number () SEERd
Number ()
Positive microscopy
12087 (875) 3845 (100) 61818 (890) 9188 (874)
Radiographywithout microscopy
1306 (95) NA 6759 (97) 1015 (97)
Clinical 204 (15) NA 484 (07) 98 (09)
Unknown 217 (15) NA 398 (06) 217 (21)
TOTAL 13814 (100) 3845 (100) 69459 (100) 10518 (100)
Note Reported data are incident cases from 1989-1994 except for CBTRUS data which are from 1990-1993
aCentral Brain Tumor Registry of the United Statesb Minnesota Cancer Surveillance System (microscopically confirmed cases only) cNational Cancer Data Base (limited to cases reported by hospitals that accessioned nonmalignant cases)dSurveillance Epidemiology and End Results Program (malignant cases only)NA = Not applicable
Page 32
Endash
Page 32
TABLE 4 NUMBER AND PERCENT OF PRIMARY INTRACRANIAL AND CENTRALNERVOUS SYSTEM TUMORS BY DIAGNOSTIC CONFIRMATION
DiagnosticConfirmation
CBTRUSa
Number ()MCSSb
Number ()NCDBc
Number ()SEERd
Number ()
Positivemicroscopy
12087 (875) 3845 (100) 61818 (890) 9188 (874)
Radiographywithout microscopy
1306 (95) NA 6759 (97) 1015 (97)
Clinical 204 (15) NA 484 (07) 98 (09)
Unknown 217 (15) NA 398 (06) 217 (21)
TOTAL 13814 (100) 3845 (100) 69459 (100) 10518 (100)
Note Reported data are incident cases from 1989-1994 except for CBTRUS data which are from 1990-1993
aCentral Brain Tumor Registry of the United Statesb Minnesota Cancer Surveillance System (microscopically confirmed cases only)cNational Cancer Data Base (limited to cases reported by hospitals that accessioned nonmalignant cases)dSurveillance Epidemiology and End Results Program (malignant cases only)NA = Not applicable
APPENDIX E
TABLE 5 NUMBER AND PERCENT OF MALIGNANT PRIMARY INTRACRANIAL AND CENTRAL SYSTEM TUMORS BY TUMOR LOCATION
Locationa CBTRUSb
Number () MCSSc
Number () NCDBd
Number () SEERe
Number ()
Intracranial 7171 (977) 1824 (968) 44801 (968) 10196 (969)
Brain 6862 (926) 1746 (927) 42622 (921) 9721 (924)
Meninges 98 (13) 23 (12) 581 (13) 139 (13)
Pituitarycraniopharyngealduct
37 (05) 13 (07) 189 (04) 30 (03)
Pineal 58 (08) 20 (11) 378 (08) 80 (08)
Other central nervous systemincluding cranial nerves
116 (16) 22 (12) 1031 (22) 226 (21)
Extracranial 242 (33) 60 (32) 1483 (32) 322 (31)
Spinal cord 234 (32) 60 (32) 1410 (30) 313 (30)
Spinal meninges 8 (01) 0 73 (02) 9 (01)
TOTAL 7413 (100) 1884 (100) 46284 (100) 10518 (100)
Note Reported data are incident cases from 1989-1994 except for CBTRUS data which are from 1990-1993
aRefer to the site codes in Appendix BbCentral Brain Tumor Registry of the United States cMinnesota Cancer Surveillance System (microscopically confirmed cases only)dNational Cancer Data Base (limited to cases reported by hospitals that accessioned nonmalignant cases) eSurvival Epidemiology and End Results Program (malignant cases only)
Page 33
Endash
DATA COLLECTION
OF PRIMARY
CENTRAL NERVOUS
SYSTEM TUMORS
TABLE 6 NUMBER AND PERCENT OF PRIMARY INTRACRANIAL AND CENTRAL NERVOUS SYSTEM TUMORS OF BENIGN AND UNCERTAIN BEHAVIOR BY TUMOR LOCATION
Locationa CBTRUSb
Number () MCSSc
Number () NCDBd
Number () SEERe
Number ()
Intracranial 5913 (924) 1776 (906) 21521 (929) NA
Brain 1137 (178) 178 (91) 5905 (255) NA
Meninges 2621 (409) 815 (416) 8784 (379) NA
Pituitarycraniopharyngealduct
1454 (227) 517 (264) 4769 (206) NA
Pineal 16 (02) 1 (lt01) 99 (04) NA
Other central nervous systemincluding cranial nerves
685 (107) 265 (135) 1964 (85) NA
Extracranial 488 (76) 185 (94) 1654 (71) NA
Spinal cord 263 (41) 87 (44) 985 (42) NA
Spinal meninges 225 (35) 98 (50) 669 (29) NA
TOTAL 6401 (100) 1961 (100) 23175 (100) NA
Note Reported data are incident cases from 1989-1994 except for CBTRUS data which are from 1990-1993
aRefer to the site codes in Appendix BbCentral Brain Tumor Registry of the United States cMinnesota Cancer Surveillance System (microscopically confirmed cases only)dNational Cancer Data Base (limited to cases reported by hospitals that accessioned nonmalignant cases) eSurveillance Epidemiology and End Results Program (malignant cases only)NA = Not applicable
Page 34
Endash
APPENDIX E TABLE 7 NUMBER AND PERCENT OF PRIMARY INTRACRANIAL AND CENTRAL
NERVOUS SYSTEM TUMORS BY TUMOR BEHAVIOR AND LOCATION
BehaviorTumor Locationa
CBTRUSb
Number () MCSSc
Number () NCDBd
Number () SEERe
Number ()
Malignant 7413 (537) 1884 (490) 46284 (666) 10518 (100)
Brain 6862 (497) 1746 (454) 42622 (614) 9721 (924)
Meninges 98 (07) 23 (06) 581 (08) 139 (13)
Pituitarycraniopharyn-geal ductpineal
95 (07) 33 (09) 567 (08) 110 (11)
Other central nervous system includingcranial nerves
116 (08) 22 (06) 1031 (15) 226 (22)
Spinal cord 242 (18) 60 (16) 1483 (21) 322 (31)
Benign 5794 (419) 1787 (465) 20694 (298) NA
Brain 803 (58) 99 (26) 4491 (65) NA
Meninges 2565 (186) 807 (210) 8613 (124) NA
Pituitarycraniopharyn-geal ductpineal
1322 (96) 458 (119) 4330 (62) NA
Other central nervous system includingcranial nerves
678 (49) 263 (68) 1911 (28) NA
Spinal cord 426 (31) 160 (42) 1349 (19) NA
Uncertain 607 (44) 174 (45) 2481 (36) NA
Brain 334 (24) 79 (21) 1414 (20) NA
Meninges 56 (04) 8 (02) 171 (02) NA
Pituitarycraniopharyn-geal ductpineal
148 (11) 60 (16) 538 (08) NA
Other central nervous system includingcranial nerves
7 (01) 2 (01) 53 (01) NA
Spinal cord 62 (05) 25 (07) 305 (04) NA
TOTAL 13814 (100) 3845 (100) 69459 (100) 10518 (100)
Note Reported data are incident cases from 1989-1994 except for CBTRUS data which are from 1990-1993 NA=Not applicableaRefer to the site codes in Appendix B bCentral Brain Tumor Registry of the United States cMinnesota Cancer Surveillance System (microscopically confirmed cases only)dNational Cancer Data Base (limited to cases reported byhospitals that accessioned nonmalignant cases eSurvival Epidemiology and End Results Program (malignant cases only)
Page 35
Endash
DATA COLLECTION
OF PRIMARY
CENTRAL NERVOUS
SYSTEM TUMORS
TABLE 8 NUMBER AND PERCENT OF MALIGNANT PRIMARY INTRACRANIAL AND
CENTRAL NERVOUS SYSTEM TUMORS BY HISTOLOGY GROUPINGS
WHO Histologya
Groupings CBTRUSb
Number () MCSSc
Number () NCDBd
Number () SEERe
Number ()
Neuroepithelial 6477 (874) 1689 (896) 39701 (858) 8676 (825)
Tumors of cranial and spinal nerves
12 (02) 3 (02) 108 (02) 25 (02)
Tumors of meninges
137 (18) 25 (13) 994 (21) 194 (18)
LymphomasHemopoietic
473 (64) 121 (64) 3492 (75) 1099 (105)
Germ cell 70 (09) 20 (11) 403 (09) 97 (09)
Cysts and tumor-like lesions
0 0 0 0
Tumors of sellar region
20 (03) 11 (06) 100 (02) 6 (01)
Local extensions 29 (04) 11 (06) 166 (04) 38 (04)
Unclassifiedunassigned tumorsf
195 (26) 4 (02) 1320 (29) 383 (36)
TOTAL 7413 (100) 1884 (100) 46284 (100) 10518 (100)
Note Reported data are incident cases from 1989-1994 except for CBTRUS data which are from 1990-1993
aRefer to the World Health Organization (WHO) histology groupings in Appendix CbCentral Brain Tumor Registry of the United States cMinnesota Cancer Surveillance System (microscopically confirmed cases only)dNational Cancer Data Base (limited to cases reported by hospitals that accessioned nonmalignant cases) f For MCSS unclassifiedunassigned tumors include one malignant and four nonmalignant histologies which were
not listed in the CBTRUS classification scheme For NCDB unclassifiedunassigned tumors include 319 cases(less than one half percent) which had histologies not assigned by CBTRUS to any other category For SEERunclassifiedunassigned tumors include all malignant histologies occurring in the brainCNS which could not beclassified in one of the above categories based on their 4-digit histologic type
Page 36
Endash
APPENDIX E
TABLE 9 NUMBER AND PERCENT OF PRIMARY INTRACRANIAL AND CENTRAL NERVOUS SYSTEM TUMORS OF BENIGN AND UNCERTAIN BEHAVIOR
BY HISTOLOGY GROUPINGS
WHO Histologya
Groupings CBTRUSb
Number () MCSSc
Number () NCDBd
Number () SEERe
Number ()
Neuroepithelial 275 (43) 91 (46) 1064 (46) NA
Tumors of cranial and spinal nerves
980 (153) 397 (202) 2618 (113) NA
Tumors of meninges
3509 (548) 941 (480) 13667 (590) NA
LymphomasHemopoietic
3 (lt01) 0 7 (lt01) NA
Germ cell 4 (lt01) 1 (01) 25 (01) NA
Cysts and tumor-like lesions
15 (02) 3 (02) 34 (01) NA
Tumors of sellar region
1444 (226) 510 (260) 4749 (205) NA
Local extensions 0 0 0 NA
Unclassifiedunassigned tumorsf
171 (27) 18 (09) 1011 (44) NA
TOTAL 6401 (100) 1961 (100) 23175 (100) NA
Note Reported data are incident cases from 1989-1994 except for CBTRUS which is 1990-1993
aRefer to the World Health Organization (WHO) histology groupings in Appendix CbCentral Brain Tumor Registry of the United States c Minnesota Cancer Surveillance System (microscopically confirmed cases only) dNational Cancer Data Base (limited to cases reported by hospitals that accessioned nonmalignant cases) eSurvival Epidemiology and End Results Program (malignant cases only)dFor MCSS unclassifiedunassigned tumors include one malignant and four nonmalignant histologies which werenot listed in the CBTRUS classification scheme For NCDB unclassifiedunassigned tumors include 319 cases(less than one half percent) which had histologies not assigned by CBTRUS to any other category For SEERunclassifiedunassigned tumors include all malignant histologies occurring in the brainCNS which could not beclassified in one of the above categories based on their 4-digit histologic typeNA = Not applicable
Page 37
Endash
DATA COLLECTION
OF PRIMARY
CENTRAL NERVOUS
SYSTEM TUMORS
TABLE 10 METHOD OF CASE FINDING FOR PRIMARY INTRACRANIAL AND CENTRAL NERVOUS SYSTEM TUMORS BY TUMOR BEHAVIOR AND LOCATION MINNESOTA 1989-1994
Behavior Tumor Locationa
Number of Cases
Percent Found byRoutine
Reporting
Percent Found by Special Efforts
Malignant Brain Cerebral meninges
Pituitarycranio duct pineal Other intracranial
18841746 23 33
22
961 965 957 939
864
39 35 43 61
136 Extracranial 60 883 117 Benign Brain
1787 99
788 838
212 162
Cerebral meninges Pituitarycranio duct
pineal Other intracranial
807 458
263
843 740
779
157 260
221 Extracranial 160 631 369 Uncertain 174 856 144 Brain 79 823 177 Cerebral meninges Pituitarycraniopharyn- geal ductpineal Other intracranial
8 60
2
875 850
1000
125 150
00 Extracranial 25 960 40
TOTAL 3845 876 124
aRefer to the site codes in Appendix B
Page 38
Endash
1989 1990 1991 1992 1993 1994
TOTAL
APPENDIX E TABLE 11 METHOD OF CASE FINDING FOR INTRACRANIALa TUMORS BY DIAGNOSIS YEAR MINNESOTA 1989-1994
DiagnosisYear
Number of
Cases
Percent Found byRoutine
Reporting
Percent Found by
Special Efforts
571 837 163 616 865 135 586 913 87 602 899 101
633 872 128 592 929 71
3600 886 114
aIncludes the brain cerebral meninges pituitary gland pineal gland and otherintracranial tumors (refer to the site codes in Appendix B)
Page 39
Endash
DATA COLLECTION
OF PRIMARY
CENTRAL NERVOUS
SYSTEM TUMORS
TABLE 12 METHOD OF CASE FINDING FOR NONMALIGNANT INTRACRANIALa TUMORS BY TYPE OF FACILITY MINNESOTA 1989-1994
Type of Facility Number of Tumors Percent Found byRoutine
Reporting
Percent Found by Special Efforts
Registry at facility No registry at facility
1451325
859 569
141 431
TOTAL 1776 806 194
aIncludes tumors with benign or uncertain behavior that involve the brain cerebral meningespituitary gland pineal gland or other intracranial sites (refer to the site codes in Appendix B)
TABLE 13 REPORTING METHOD AND SOURCE OF CASE FINDING FOR NON- MALIGNANT INTRACRANIALa TUMORS DIAGNOSED IN HOSPITALS WITH A TUMOR REGISTRY MINNESOTA 1989-1994
Reporting Method Number of Tumors Percent Found byRoutine
Reporting
Percent Found by
Special Efforts
Registry-reportedLaboratory-reported
1226225
925 502
75 498
TOTAL 1451 859 141
aIncludes tumors with benign or uncertain behavior that involve the brain cerebral meningespituitary gland pineal gland or other intracranial sites (refer to the site codes in Appendix B)
Page 40
Endash0
APPENDIX E TABLE 14 HOSPITAL REGISTRY ACCESSIONING OF MALIGNANT AND NON-
MALIGNANT PRIMARY INTRACRANIAL AND CENTRAL NERVOUS SYSTEM TUMORS NCDB 1989-1994
TUMOR Totalb
BEHAVIOR Malignant c Nonmalignantd
Tumor Locationa HospitalsReporting
Number ()
Hospitals Reporting
Number ()
Hospitals Reporting
Number ()
Intracranial 1542 (100) 1526 (100) 900 (99)
Brain 1527 (99) 1519 (gt99) 754 (83)
Meninges 740 (48) 390 (26) 613 (67)
Pituitaryglandcraniopharyn-
geal duct
602 (39) 168 (11) 538 (59)
Pineal gland 319 (21) 277 (18) 79 (9)
Other central nervous system including cranial
nerves
648 (42) 545 (36) 299 (33)
Extracranial 812 (53) 708 (46) 410 (45)
Spinal cord 760 (49) 692 (45) 311 (34)
Spinal meninges 299 (19) 72 (5) 258 (28)
TOTAL Hospitals 1542 (100) 1526 (100) 913 (100)
Note The number of hospitals in each of the second third and fourth columns is the number that submittedreports to the NCDB for any intracranial and central nervous system tumors for the respective malignancystatus Not all hospitals submitted reports for each year during the study period (1989-1994)
aRefer to the site codes in Appendix B bBehavior codes = 0 1 3 cBehavior code = 3 dBehavior codes = 0 1
Page 41
Endash
DATA COLLECTION
OF PRIMARY
CENTRAL NERVOUS
SYSTEM TUMORS
Texas Cancer Registry
1997 CBTRUS State Survey of Benign Brain Tumor Data Collection
State Collection Status
Currently Collecting Benign Tumor Data1 Arizona Cancer Registry since 1981 2 Colorado Central Cancer Registry since 1988 3 Connecticut Tumor Registry since 1965 4 Idaho Cancer Data Registry since 1970 5 Maine Cancer Registry since 1983 6 Massachusetts Cancer Registry since 1982 7 Minnesota Cancer Surveillance System since 1988 8 Montana Central Tumor Registry since 1979 9 New York State Cancer Registry since 1988
10 North Carolina Central Cancer Registry since 1990 11 Utah Cancer Registry since 1966 12 Virginia Cancer Registry since 1994 13 Delaware State Cancer Registry14 Washington State Cancer Registry since 1992 15 passive collection 1979-1994
active collection since 1995
Stopped or Passive Collection of Benign Tumor Data1 New Jersey State Cancer Registry stopped 1979-1995 2 Kansas Cancer Registry stopped 1969-1995 3 New Hampshire State Cancer Registry stopped 1986-1991 4 District of Columbia Cancer Registry stopped 1997 5 Wyoming Cancer Surveillance Program stopped 111996 6 Louisiana Tumor Registry stopped 1992 (passive collection) 7 Illinois State Cancer Registry stopped 111996 8 Missouri Cancer Registry passive collection since 1984 9 South Carolina Central Cancer Registry passive collection since 1996
Beginning Collection of Benign Tumor Data1 North Dakota Cancer Registry began collection 1997 2 Rhode Island Cancer Registry began collection 1998
Page 42
Endash
APPENDIX E
Codes for Primary Intracranial and Central Nervous System Tumors
Note For this report the designation of ldquoprimary intracranial and central nervous system tumorsrdquo includes thefollowing primary tumors of central nervous system sites as well as tumors of the pituitary and pinealglands All histology types within the topography codes are included in the designation of ldquoprimaryintracranial and CNS tumors The source for the topography codes is Percy C Van Holten V Muir Ceds International Classification of Diseases for Oncology Second Edition Geneva World Health Organization 1990
Intracranial tumors
Brain C710 Cerebrum C711 Frontal lobe C712 Temporal lobe C713 Parietal lobe C714 Occipital lobe C715 Ventricle NOSC716 Cerebellum NOS C717 Brain stem C718 Overlapping lesion of brain C719 Brain NOS
Meninges C700 Cerebral meninges C709 Meninges NOS
a
Cranial Nerves and other intracranial parts of the central nervous systemC722 Olfactory nerve C723 Optic nerve C724 Acoustic nerve C725 Cranial nerve NOS C728 Overlapping lesion of brain and central nervous system C729 Nervous system NOS
Other endrocrine glands and related structures C751 Pituitary gland C752 Craniopharyngeal duct C753 Pineal gland
Extracranial tumors
Spinal cord C720 Spinal cord C721 Cauda equina
Meninges C701 Spinal meninges
aNOS=Not Otherwise Specified
Page 43
Endash
DATA COLLECTION
OF PRIMARY
CENTRAL NERVOUS
SYSTEM TUMORS
Brain Tumor Histology Groupings
The following histology groupings were used for the primary intracranial and central nervoussystem tumors The source for the histology groupings is Central Brain Tumor Registry ofthe United States (CBTRUS) 1996 Statistics Report Table 4
WHOa HISTOLOGY GROUPINGS ICD-Ob MORPHOLOGY CODE
Diffuse astrocytoma (protoplasma fibrillary) 9410 9420 Anaplastic astrocytoma 9401 9411 Glioblastoma 9440 9441 9442 Pilocytic astrocytoma 9421 Unique astrocytoma variants 9383 9384 9424 Oligodendroglioma 9450 Anaplastic oligodendroglioma 9451 9460 Ependymomaanaplastic ependymoma 9391 9392 9393 Ependymoma variants 9394 Mixed glioma 9382 Astrocytoma NOSc 9400 Glioma malignant NOS 9380 Choroid plexus 9390 Neuroepithelial 9381 9423 9430 Benign neuronalglial neuronal and mixed 86801 8693 9490 9505 9506 Malignant neruonalglial neuronal and mixed 86803 9364 9490 9500 Pineal parenchymal 9360 9361 9362 Embryonalprimitivemedulloblastoma 8963 9470 9471 9472
9473 9501 9502 9503 9510
TUMORS OF NEUROEPITHELIAL TISSUE
TUMORS OF CRANIAL AND SPINAL NERVES Nerve sheath benign and malignant 9540 9550 9560 9570
TUMORS OF THE MENINGES Meningioma 9530 9531 9532 9533 9534 9537 9538 Other mesenchymal benign and malignant 8800 8801 8802 8803 8810 8830 8850 88618900
8910 8990 9133 9150 9240 9480 9481 9536 9539 Hemangioblastoma 9161 9535
LYMPHOMAS AND HEMOPOIETIC NEOPLASMS Lymphoma 9590 9591 9593 9594 9595 9630 9650 9652
9663 9670 9671 9672 9674 9675 9680 9681 9682 9684 9685 9686 9687 9690 9691 96939695 9696 9698 9702 9714 9723 9731 9766 9970
GERM CELL TUMORS Germ cell 8020 9060 9064 9070 9071 9080 9084 9085 9100
CYSTS AND TUMOR-LIKE LESIONS Cysts and heterotopias 9084
TUMORS OF THE SELLAR REGION Pituitary 8040 8l40 8l46 8260 8270 8271 8280
8281 8290 8300 8330 8323 8333 Craniopharyngioma 9350
Page 44
Endash
APPENDIX E
LOCAL EXTENSIONS FROM REGIONAL TUMORS Chordomachondrosarcoma 9370
UNCLASSIFIED TUMORS Hemangioma 9120 9121 9130 9131 Neoplasm benign 80000 8010 Neoplasm uncertain behavior 80001 80011 Neoplasm malignant 80003 80013 8002 8003 All other 8720 9580
aWHO = World Health OrganizationbICD-O = International Classification of Diseases for Oncology Second Edition 1990 cNOS=Not Otherwise Specified
Page 45
Endash
DATA COLLECTION
OF PRIMARY
CENTRAL NERVOUS
SYSTEM TUMORS
Endash
International Classification of Childhood Cancer (ICCC)
Diagnostic Group
ICD-Oa codes
Morphology Topography
I LEUKAEMIA
(a) Lymphoid leukaemia 9820-9827 9850
(b) Acute non-lymphocytic leukaemia 9840 9841 9861 9864 9866 9867 98919894 9910
(c) Chronic myeloid leukaemia 9863 9868
(d) Other specified leukaemias 9830 9842 9860 9862 9870-9890 9892 98939900 9930-9941
(e) Unspecified leukaemias 9800-9804
II LYMPHOMAS AND OTHER RETICULOENDOTHELIAL NEOPLASMS
(a) Hodgkinrsquos disease 9650-9667
(b) Non-Hodgkinrsquos lymphoma 9591-9595 9670-9686 9690-9714 9723
(c) Burkittrsquos lymphoma 9687
(d) Miscellaneous lymphoreticular neoplasms 9720 9731-9764
(e) Unspecified lymphomas 9590
III CENTRAL NERVOUS SYSTEM (CNS) ANDMISCELLANEOUS INTRACRANIAL AND
INTRASPINAL NEOPLASMSb
(a) Ependymomac 9383 9390-9394
(b) Astrocytoma 9380 C723
9381 9400-9441
(c) Primitive neuroectodermal tumours 9470-9473
(d) Other gliomasd 9380 C700-C722C724-C729
9382 9384
9442-9460 9481
APPENDIX E
Diagnostic Group
ICD-Oa codes
Morphology Topogragphy
III CNS AND MISCELLANEOUS INTRACRANIAL AND INTRASPINAL
NEOPLASMSb Continued
(e) Miscellaneous intracranial and intraspinalneoplasmsc
8270-8281 8300 9350-9362 9480 95059530-9539
(f) Unspecified intracranial and intraspinalneoplasmsc
8000-8004 C700-C729C751-C753
IV SYMPATHETIC NERVOUS SYSTEM TUMOURS
(a) Neuroblastoma and ganglioneuroblastoma 9490 9500
(b) Other sympathetic nervous system tumours 8680 8693-8710 9501-9504 9520-9523
aInternational Classification of Diseases for Oncology Second Edition World Health Organization 1990bGroup III excludes all lymphomas See group II cBehaviour codes 0 and 1 are included dBehaviour code 1 is included
Page 47
Endash
Comments and recommendations are welcome Should questions arise on how to use these
materials or for more information please contact
Centers for Disease Control and Prevention National Program of Cancer Registries
4770 Buford Hwy NE Mail Stop K-53
Atlanta GA 30042-3717
Voice Information System 1 (888) 842-6355 bull Fax (770) 488-4760
cancerinfocdcgov bull httpwwwcdcgovcancer
All materials are in the public domain and may be reproduced or copied without permission citation
to source however is appreciated
BACK COVER
(WHITE)
Spine(WHITE)
DATA COLLECTION OF PRIMARY CEN
TRAL NERVOUS SYSTEM
TUM
ORS 2004
National Program of Cancer Registries Training M
aterials

DATA COLLECTION
OF PRIMARY
CENTRAL NERVOUS
SYSTEM TUMORS
TABLE 2 NUMBER AND PERCENT OF PRIMARY INTRACRANIAL AND CENTRAL NERVOUS SYSTEM TUMORS BY TUMOR LOCATION
Locationa CBTRUSb
Number () MCSSc
Number () NCDBd
Number () SEERe
Number ()
Intracranial 13084 (947) 3600 (936) 66322 (955) 10196 (969)
Brain 7999 (579) 1924 (500) 48527 (699) 9721 (924)
Meninges 2719 (197) 838 (218) 9365 (135) 139 (13)
Pituitarycraniopharygealduct
1491 (108) 530 (138) 4958 (71) 30 (03)
Pineal 74 (05) 21 (05) 477 (07) 80 (08)
Other central nervous systemincluding cranial nerves
801 (58) 287 (75) 2995 (43) 226 (22)
Extracranial 730 (53) 245 (64) 3137 (45) 322 (31)
Spinal cord 497 (36) 47 (38) 2395 (34) 313 (30)
Spinal meninges 233 (17) 98 (25) 742 (11) 9 (01)
TOTAL 13814 (100) 3845 (100) 69459 (100) 10518 (100)
Note Reported data are incident cases from 1989-1994 except for CBTRUS data which are from 1990-1993
aRefer to the sites in Appendix BbCentral Brain Tumor Registry of the United States cMinnesota Cancer Surveillance System (microscopically confirmed cases only)dNational Cancer Data Base (limited to cases reported by hospitals that accessioned nonmalignant cases) eSurvival Epidemiology and End results Program (malignant cases only)
Page 30
Endash0
TABL
E 3
RO
W P
ERCE
NT
DIS
TRIB
UTI
ON
OF
PRIM
ARY
INTR
ACR
AN
IAL
AN
D C
ENTR
AL
NER
VO
US
SYST
EM T
UM
ORS
BY
TU
MO
R B
EHA
VIO
RA
ND
MIC
ROSC
OPI
C C
ON
FIRM
ATI
ON
Loca
tiona
CB
TRU
Sb M
CSSc
NC
DB
d SE
ERe
Tota
l Pe
rcen
tM
icro
Co
nfirm
ed
Perc
ent
Not
Mic
ro
Conf
irmed
Tota
l Pe
rcen
tM
icro
Co
nfirm
ed
Perc
ent
Not
Mic
ro
Conf
irmed
Tota
l Pe
rcen
tM
icro
Co
nfirm
ed
Perc
ent
Not
Mic
ro
Conf
irmed
Tota
l Pe
rcen
tM
icro
Co
nfirm
ed
Perc
ent
Not
Mic
ro
Conf
irmed
Intra
cran
ial
130
84
867
13
3
360
0 10
0 N
A
663
22
887
11
3
101
96
871
12
9
Mal
igna
nt
717
1 89
2
108
1
824
100
NA
44
801
91
3
87
101
96
871
12
9
Beni
gn a
ndu n
certa
in
591
3 83
5
165
1
776
100
NA
21
521
83
2
168
N
A
NA
N
A
Bra
in
799
9 88
2
118
1
924
100
NA
48
527
90
2
98
972
1 87
3
127
Mal
igna
nt
686
2 89
6
104
1
746
100
NA
42
622
91
5
85
972
1 87
3
127
Beni
gnan
dun
certa
in
113
7 80
6
194
17
8 10
0 N
A
590
5 80
6
194
N
A
NA
N
A
Extra
cran
ial
730
962
3
8 24
5 10
0 N
A
313
7 96
0
40
322
957
4
3
Mal
igna
nt
242
934
6
6 60
10
0 N
A
148
3 96
6
34
322
957
4
3
Beni
gn a
ndu n
certa
in
488
975
2
5 18
5 10
0 N
A
165
4 95
5
45
NA
N
A
NA
TOTA
Lf 13
814
87
2
128
3
845
100
NA
69
459
89
0
110
10
518
87
4
126
Mal
igna
nt
741
3 89
4
106
1
884
100
NA
46
284
91
5
85
105
18
874
12
6
Beni
gn a
ndu n
certa
in
640
1 84
6
154
1
961
100
NA
23
175
84
1
159
N
A
NA
N
A
Not
e R
epor
ted
data
are
inci
dent
cas
es fr
om 1
989-
1994
exc
ept f
or C
BTR
US
data
whi
ch a
re fr
om 1
990-
1993
a Refe
r to
the
site
code
s in
App
endi
x B
b Cent
ral B
rain
Tum
or R
egist
ry o
f the
Uni
ted
Stat
es
c Min
neso
ta C
ance
r Sur
veill
ance
Sys
tem
(mic
rosc
opic
ally
con
firm
ed c
ases
onl
y)
d Nat
iona
l Can
cer D
ata
Base
(lim
ited
to c
ases
repo
rted
by h
ospi
tals
that
acc
essio
ned
nonm
alig
nant
cas
es)
e Surv
eilla
nce
Epi
dem
iolo
gy a
nd E
nd R
esul
ts Pr
ogra
m (m
alig
nant
cas
es o
nly)
f In
clud
es in
tracr
ania
l and
ext
racr
ania
l cas
es
NA
= N
ot a
pplic
able
Page
31
APPENDIX E
Endash
DATA COLLECTION
OF PRIMARY
CENTRAL NERVOUS
SYSTEM TUMORS
TABLE 4 NUMBER AND PERCENT OF PRIMARY INTRACRANIAL AND CENTRAL NERVOUS SYSTEM TUMORS BY DIAGNOSTIC CONFIRMATION
DiagnosticConfirmation
CBTRUSa
Number () MCSSb
Number () NCDBc
Number () SEERd
Number ()
Positive microscopy
12087 (875) 3845 (100) 61818 (890) 9188 (874)
Radiographywithout microscopy
1306 (95) NA 6759 (97) 1015 (97)
Clinical 204 (15) NA 484 (07) 98 (09)
Unknown 217 (15) NA 398 (06) 217 (21)
TOTAL 13814 (100) 3845 (100) 69459 (100) 10518 (100)
Note Reported data are incident cases from 1989-1994 except for CBTRUS data which are from 1990-1993
aCentral Brain Tumor Registry of the United Statesb Minnesota Cancer Surveillance System (microscopically confirmed cases only) cNational Cancer Data Base (limited to cases reported by hospitals that accessioned nonmalignant cases)dSurveillance Epidemiology and End Results Program (malignant cases only)NA = Not applicable
Page 32
Endash
Page 32
TABLE 4 NUMBER AND PERCENT OF PRIMARY INTRACRANIAL AND CENTRALNERVOUS SYSTEM TUMORS BY DIAGNOSTIC CONFIRMATION
DiagnosticConfirmation
CBTRUSa
Number ()MCSSb
Number ()NCDBc
Number ()SEERd
Number ()
Positivemicroscopy
12087 (875) 3845 (100) 61818 (890) 9188 (874)
Radiographywithout microscopy
1306 (95) NA 6759 (97) 1015 (97)
Clinical 204 (15) NA 484 (07) 98 (09)
Unknown 217 (15) NA 398 (06) 217 (21)
TOTAL 13814 (100) 3845 (100) 69459 (100) 10518 (100)
Note Reported data are incident cases from 1989-1994 except for CBTRUS data which are from 1990-1993
aCentral Brain Tumor Registry of the United Statesb Minnesota Cancer Surveillance System (microscopically confirmed cases only)cNational Cancer Data Base (limited to cases reported by hospitals that accessioned nonmalignant cases)dSurveillance Epidemiology and End Results Program (malignant cases only)NA = Not applicable
APPENDIX E
TABLE 5 NUMBER AND PERCENT OF MALIGNANT PRIMARY INTRACRANIAL AND CENTRAL SYSTEM TUMORS BY TUMOR LOCATION
Locationa CBTRUSb
Number () MCSSc
Number () NCDBd
Number () SEERe
Number ()
Intracranial 7171 (977) 1824 (968) 44801 (968) 10196 (969)
Brain 6862 (926) 1746 (927) 42622 (921) 9721 (924)
Meninges 98 (13) 23 (12) 581 (13) 139 (13)
Pituitarycraniopharyngealduct
37 (05) 13 (07) 189 (04) 30 (03)
Pineal 58 (08) 20 (11) 378 (08) 80 (08)
Other central nervous systemincluding cranial nerves
116 (16) 22 (12) 1031 (22) 226 (21)
Extracranial 242 (33) 60 (32) 1483 (32) 322 (31)
Spinal cord 234 (32) 60 (32) 1410 (30) 313 (30)
Spinal meninges 8 (01) 0 73 (02) 9 (01)
TOTAL 7413 (100) 1884 (100) 46284 (100) 10518 (100)
Note Reported data are incident cases from 1989-1994 except for CBTRUS data which are from 1990-1993
aRefer to the site codes in Appendix BbCentral Brain Tumor Registry of the United States cMinnesota Cancer Surveillance System (microscopically confirmed cases only)dNational Cancer Data Base (limited to cases reported by hospitals that accessioned nonmalignant cases) eSurvival Epidemiology and End Results Program (malignant cases only)
Page 33
Endash
DATA COLLECTION
OF PRIMARY
CENTRAL NERVOUS
SYSTEM TUMORS
TABLE 6 NUMBER AND PERCENT OF PRIMARY INTRACRANIAL AND CENTRAL NERVOUS SYSTEM TUMORS OF BENIGN AND UNCERTAIN BEHAVIOR BY TUMOR LOCATION
Locationa CBTRUSb
Number () MCSSc
Number () NCDBd
Number () SEERe
Number ()
Intracranial 5913 (924) 1776 (906) 21521 (929) NA
Brain 1137 (178) 178 (91) 5905 (255) NA
Meninges 2621 (409) 815 (416) 8784 (379) NA
Pituitarycraniopharyngealduct
1454 (227) 517 (264) 4769 (206) NA
Pineal 16 (02) 1 (lt01) 99 (04) NA
Other central nervous systemincluding cranial nerves
685 (107) 265 (135) 1964 (85) NA
Extracranial 488 (76) 185 (94) 1654 (71) NA
Spinal cord 263 (41) 87 (44) 985 (42) NA
Spinal meninges 225 (35) 98 (50) 669 (29) NA
TOTAL 6401 (100) 1961 (100) 23175 (100) NA
Note Reported data are incident cases from 1989-1994 except for CBTRUS data which are from 1990-1993
aRefer to the site codes in Appendix BbCentral Brain Tumor Registry of the United States cMinnesota Cancer Surveillance System (microscopically confirmed cases only)dNational Cancer Data Base (limited to cases reported by hospitals that accessioned nonmalignant cases) eSurveillance Epidemiology and End Results Program (malignant cases only)NA = Not applicable
Page 34
Endash
APPENDIX E TABLE 7 NUMBER AND PERCENT OF PRIMARY INTRACRANIAL AND CENTRAL
NERVOUS SYSTEM TUMORS BY TUMOR BEHAVIOR AND LOCATION
BehaviorTumor Locationa
CBTRUSb
Number () MCSSc
Number () NCDBd
Number () SEERe
Number ()
Malignant 7413 (537) 1884 (490) 46284 (666) 10518 (100)
Brain 6862 (497) 1746 (454) 42622 (614) 9721 (924)
Meninges 98 (07) 23 (06) 581 (08) 139 (13)
Pituitarycraniopharyn-geal ductpineal
95 (07) 33 (09) 567 (08) 110 (11)
Other central nervous system includingcranial nerves
116 (08) 22 (06) 1031 (15) 226 (22)
Spinal cord 242 (18) 60 (16) 1483 (21) 322 (31)
Benign 5794 (419) 1787 (465) 20694 (298) NA
Brain 803 (58) 99 (26) 4491 (65) NA
Meninges 2565 (186) 807 (210) 8613 (124) NA
Pituitarycraniopharyn-geal ductpineal
1322 (96) 458 (119) 4330 (62) NA
Other central nervous system includingcranial nerves
678 (49) 263 (68) 1911 (28) NA
Spinal cord 426 (31) 160 (42) 1349 (19) NA
Uncertain 607 (44) 174 (45) 2481 (36) NA
Brain 334 (24) 79 (21) 1414 (20) NA
Meninges 56 (04) 8 (02) 171 (02) NA
Pituitarycraniopharyn-geal ductpineal
148 (11) 60 (16) 538 (08) NA
Other central nervous system includingcranial nerves
7 (01) 2 (01) 53 (01) NA
Spinal cord 62 (05) 25 (07) 305 (04) NA
TOTAL 13814 (100) 3845 (100) 69459 (100) 10518 (100)
Note Reported data are incident cases from 1989-1994 except for CBTRUS data which are from 1990-1993 NA=Not applicableaRefer to the site codes in Appendix B bCentral Brain Tumor Registry of the United States cMinnesota Cancer Surveillance System (microscopically confirmed cases only)dNational Cancer Data Base (limited to cases reported byhospitals that accessioned nonmalignant cases eSurvival Epidemiology and End Results Program (malignant cases only)
Page 35
Endash
DATA COLLECTION
OF PRIMARY
CENTRAL NERVOUS
SYSTEM TUMORS
TABLE 8 NUMBER AND PERCENT OF MALIGNANT PRIMARY INTRACRANIAL AND
CENTRAL NERVOUS SYSTEM TUMORS BY HISTOLOGY GROUPINGS
WHO Histologya
Groupings CBTRUSb
Number () MCSSc
Number () NCDBd
Number () SEERe
Number ()
Neuroepithelial 6477 (874) 1689 (896) 39701 (858) 8676 (825)
Tumors of cranial and spinal nerves
12 (02) 3 (02) 108 (02) 25 (02)
Tumors of meninges
137 (18) 25 (13) 994 (21) 194 (18)
LymphomasHemopoietic
473 (64) 121 (64) 3492 (75) 1099 (105)
Germ cell 70 (09) 20 (11) 403 (09) 97 (09)
Cysts and tumor-like lesions
0 0 0 0
Tumors of sellar region
20 (03) 11 (06) 100 (02) 6 (01)
Local extensions 29 (04) 11 (06) 166 (04) 38 (04)
Unclassifiedunassigned tumorsf
195 (26) 4 (02) 1320 (29) 383 (36)
TOTAL 7413 (100) 1884 (100) 46284 (100) 10518 (100)
Note Reported data are incident cases from 1989-1994 except for CBTRUS data which are from 1990-1993
aRefer to the World Health Organization (WHO) histology groupings in Appendix CbCentral Brain Tumor Registry of the United States cMinnesota Cancer Surveillance System (microscopically confirmed cases only)dNational Cancer Data Base (limited to cases reported by hospitals that accessioned nonmalignant cases) f For MCSS unclassifiedunassigned tumors include one malignant and four nonmalignant histologies which were
not listed in the CBTRUS classification scheme For NCDB unclassifiedunassigned tumors include 319 cases(less than one half percent) which had histologies not assigned by CBTRUS to any other category For SEERunclassifiedunassigned tumors include all malignant histologies occurring in the brainCNS which could not beclassified in one of the above categories based on their 4-digit histologic type
Page 36
Endash
APPENDIX E
TABLE 9 NUMBER AND PERCENT OF PRIMARY INTRACRANIAL AND CENTRAL NERVOUS SYSTEM TUMORS OF BENIGN AND UNCERTAIN BEHAVIOR
BY HISTOLOGY GROUPINGS
WHO Histologya
Groupings CBTRUSb
Number () MCSSc
Number () NCDBd
Number () SEERe
Number ()
Neuroepithelial 275 (43) 91 (46) 1064 (46) NA
Tumors of cranial and spinal nerves
980 (153) 397 (202) 2618 (113) NA
Tumors of meninges
3509 (548) 941 (480) 13667 (590) NA
LymphomasHemopoietic
3 (lt01) 0 7 (lt01) NA
Germ cell 4 (lt01) 1 (01) 25 (01) NA
Cysts and tumor-like lesions
15 (02) 3 (02) 34 (01) NA
Tumors of sellar region
1444 (226) 510 (260) 4749 (205) NA
Local extensions 0 0 0 NA
Unclassifiedunassigned tumorsf
171 (27) 18 (09) 1011 (44) NA
TOTAL 6401 (100) 1961 (100) 23175 (100) NA
Note Reported data are incident cases from 1989-1994 except for CBTRUS which is 1990-1993
aRefer to the World Health Organization (WHO) histology groupings in Appendix CbCentral Brain Tumor Registry of the United States c Minnesota Cancer Surveillance System (microscopically confirmed cases only) dNational Cancer Data Base (limited to cases reported by hospitals that accessioned nonmalignant cases) eSurvival Epidemiology and End Results Program (malignant cases only)dFor MCSS unclassifiedunassigned tumors include one malignant and four nonmalignant histologies which werenot listed in the CBTRUS classification scheme For NCDB unclassifiedunassigned tumors include 319 cases(less than one half percent) which had histologies not assigned by CBTRUS to any other category For SEERunclassifiedunassigned tumors include all malignant histologies occurring in the brainCNS which could not beclassified in one of the above categories based on their 4-digit histologic typeNA = Not applicable
Page 37
Endash
DATA COLLECTION
OF PRIMARY
CENTRAL NERVOUS
SYSTEM TUMORS
TABLE 10 METHOD OF CASE FINDING FOR PRIMARY INTRACRANIAL AND CENTRAL NERVOUS SYSTEM TUMORS BY TUMOR BEHAVIOR AND LOCATION MINNESOTA 1989-1994
Behavior Tumor Locationa
Number of Cases
Percent Found byRoutine
Reporting
Percent Found by Special Efforts
Malignant Brain Cerebral meninges
Pituitarycranio duct pineal Other intracranial
18841746 23 33
22
961 965 957 939
864
39 35 43 61
136 Extracranial 60 883 117 Benign Brain
1787 99
788 838
212 162
Cerebral meninges Pituitarycranio duct
pineal Other intracranial
807 458
263
843 740
779
157 260
221 Extracranial 160 631 369 Uncertain 174 856 144 Brain 79 823 177 Cerebral meninges Pituitarycraniopharyn- geal ductpineal Other intracranial
8 60
2
875 850
1000
125 150
00 Extracranial 25 960 40
TOTAL 3845 876 124
aRefer to the site codes in Appendix B
Page 38
Endash
1989 1990 1991 1992 1993 1994
TOTAL
APPENDIX E TABLE 11 METHOD OF CASE FINDING FOR INTRACRANIALa TUMORS BY DIAGNOSIS YEAR MINNESOTA 1989-1994
DiagnosisYear
Number of
Cases
Percent Found byRoutine
Reporting
Percent Found by
Special Efforts
571 837 163 616 865 135 586 913 87 602 899 101
633 872 128 592 929 71
3600 886 114
aIncludes the brain cerebral meninges pituitary gland pineal gland and otherintracranial tumors (refer to the site codes in Appendix B)
Page 39
Endash
DATA COLLECTION
OF PRIMARY
CENTRAL NERVOUS
SYSTEM TUMORS
TABLE 12 METHOD OF CASE FINDING FOR NONMALIGNANT INTRACRANIALa TUMORS BY TYPE OF FACILITY MINNESOTA 1989-1994
Type of Facility Number of Tumors Percent Found byRoutine
Reporting
Percent Found by Special Efforts
Registry at facility No registry at facility
1451325
859 569
141 431
TOTAL 1776 806 194
aIncludes tumors with benign or uncertain behavior that involve the brain cerebral meningespituitary gland pineal gland or other intracranial sites (refer to the site codes in Appendix B)
TABLE 13 REPORTING METHOD AND SOURCE OF CASE FINDING FOR NON- MALIGNANT INTRACRANIALa TUMORS DIAGNOSED IN HOSPITALS WITH A TUMOR REGISTRY MINNESOTA 1989-1994
Reporting Method Number of Tumors Percent Found byRoutine
Reporting
Percent Found by
Special Efforts
Registry-reportedLaboratory-reported
1226225
925 502
75 498
TOTAL 1451 859 141
aIncludes tumors with benign or uncertain behavior that involve the brain cerebral meningespituitary gland pineal gland or other intracranial sites (refer to the site codes in Appendix B)
Page 40
Endash0
APPENDIX E TABLE 14 HOSPITAL REGISTRY ACCESSIONING OF MALIGNANT AND NON-
MALIGNANT PRIMARY INTRACRANIAL AND CENTRAL NERVOUS SYSTEM TUMORS NCDB 1989-1994
TUMOR Totalb
BEHAVIOR Malignant c Nonmalignantd
Tumor Locationa HospitalsReporting
Number ()
Hospitals Reporting
Number ()
Hospitals Reporting
Number ()
Intracranial 1542 (100) 1526 (100) 900 (99)
Brain 1527 (99) 1519 (gt99) 754 (83)
Meninges 740 (48) 390 (26) 613 (67)
Pituitaryglandcraniopharyn-
geal duct
602 (39) 168 (11) 538 (59)
Pineal gland 319 (21) 277 (18) 79 (9)
Other central nervous system including cranial
nerves
648 (42) 545 (36) 299 (33)
Extracranial 812 (53) 708 (46) 410 (45)
Spinal cord 760 (49) 692 (45) 311 (34)
Spinal meninges 299 (19) 72 (5) 258 (28)
TOTAL Hospitals 1542 (100) 1526 (100) 913 (100)
Note The number of hospitals in each of the second third and fourth columns is the number that submittedreports to the NCDB for any intracranial and central nervous system tumors for the respective malignancystatus Not all hospitals submitted reports for each year during the study period (1989-1994)
aRefer to the site codes in Appendix B bBehavior codes = 0 1 3 cBehavior code = 3 dBehavior codes = 0 1
Page 41
Endash
DATA COLLECTION
OF PRIMARY
CENTRAL NERVOUS
SYSTEM TUMORS
Texas Cancer Registry
1997 CBTRUS State Survey of Benign Brain Tumor Data Collection
State Collection Status
Currently Collecting Benign Tumor Data1 Arizona Cancer Registry since 1981 2 Colorado Central Cancer Registry since 1988 3 Connecticut Tumor Registry since 1965 4 Idaho Cancer Data Registry since 1970 5 Maine Cancer Registry since 1983 6 Massachusetts Cancer Registry since 1982 7 Minnesota Cancer Surveillance System since 1988 8 Montana Central Tumor Registry since 1979 9 New York State Cancer Registry since 1988
10 North Carolina Central Cancer Registry since 1990 11 Utah Cancer Registry since 1966 12 Virginia Cancer Registry since 1994 13 Delaware State Cancer Registry14 Washington State Cancer Registry since 1992 15 passive collection 1979-1994
active collection since 1995
Stopped or Passive Collection of Benign Tumor Data1 New Jersey State Cancer Registry stopped 1979-1995 2 Kansas Cancer Registry stopped 1969-1995 3 New Hampshire State Cancer Registry stopped 1986-1991 4 District of Columbia Cancer Registry stopped 1997 5 Wyoming Cancer Surveillance Program stopped 111996 6 Louisiana Tumor Registry stopped 1992 (passive collection) 7 Illinois State Cancer Registry stopped 111996 8 Missouri Cancer Registry passive collection since 1984 9 South Carolina Central Cancer Registry passive collection since 1996
Beginning Collection of Benign Tumor Data1 North Dakota Cancer Registry began collection 1997 2 Rhode Island Cancer Registry began collection 1998
Page 42
Endash
APPENDIX E
Codes for Primary Intracranial and Central Nervous System Tumors
Note For this report the designation of ldquoprimary intracranial and central nervous system tumorsrdquo includes thefollowing primary tumors of central nervous system sites as well as tumors of the pituitary and pinealglands All histology types within the topography codes are included in the designation of ldquoprimaryintracranial and CNS tumors The source for the topography codes is Percy C Van Holten V Muir Ceds International Classification of Diseases for Oncology Second Edition Geneva World Health Organization 1990
Intracranial tumors
Brain C710 Cerebrum C711 Frontal lobe C712 Temporal lobe C713 Parietal lobe C714 Occipital lobe C715 Ventricle NOSC716 Cerebellum NOS C717 Brain stem C718 Overlapping lesion of brain C719 Brain NOS
Meninges C700 Cerebral meninges C709 Meninges NOS
a
Cranial Nerves and other intracranial parts of the central nervous systemC722 Olfactory nerve C723 Optic nerve C724 Acoustic nerve C725 Cranial nerve NOS C728 Overlapping lesion of brain and central nervous system C729 Nervous system NOS
Other endrocrine glands and related structures C751 Pituitary gland C752 Craniopharyngeal duct C753 Pineal gland
Extracranial tumors
Spinal cord C720 Spinal cord C721 Cauda equina
Meninges C701 Spinal meninges
aNOS=Not Otherwise Specified
Page 43
Endash
DATA COLLECTION
OF PRIMARY
CENTRAL NERVOUS
SYSTEM TUMORS
Brain Tumor Histology Groupings
The following histology groupings were used for the primary intracranial and central nervoussystem tumors The source for the histology groupings is Central Brain Tumor Registry ofthe United States (CBTRUS) 1996 Statistics Report Table 4
WHOa HISTOLOGY GROUPINGS ICD-Ob MORPHOLOGY CODE
Diffuse astrocytoma (protoplasma fibrillary) 9410 9420 Anaplastic astrocytoma 9401 9411 Glioblastoma 9440 9441 9442 Pilocytic astrocytoma 9421 Unique astrocytoma variants 9383 9384 9424 Oligodendroglioma 9450 Anaplastic oligodendroglioma 9451 9460 Ependymomaanaplastic ependymoma 9391 9392 9393 Ependymoma variants 9394 Mixed glioma 9382 Astrocytoma NOSc 9400 Glioma malignant NOS 9380 Choroid plexus 9390 Neuroepithelial 9381 9423 9430 Benign neuronalglial neuronal and mixed 86801 8693 9490 9505 9506 Malignant neruonalglial neuronal and mixed 86803 9364 9490 9500 Pineal parenchymal 9360 9361 9362 Embryonalprimitivemedulloblastoma 8963 9470 9471 9472
9473 9501 9502 9503 9510
TUMORS OF NEUROEPITHELIAL TISSUE
TUMORS OF CRANIAL AND SPINAL NERVES Nerve sheath benign and malignant 9540 9550 9560 9570
TUMORS OF THE MENINGES Meningioma 9530 9531 9532 9533 9534 9537 9538 Other mesenchymal benign and malignant 8800 8801 8802 8803 8810 8830 8850 88618900
8910 8990 9133 9150 9240 9480 9481 9536 9539 Hemangioblastoma 9161 9535
LYMPHOMAS AND HEMOPOIETIC NEOPLASMS Lymphoma 9590 9591 9593 9594 9595 9630 9650 9652
9663 9670 9671 9672 9674 9675 9680 9681 9682 9684 9685 9686 9687 9690 9691 96939695 9696 9698 9702 9714 9723 9731 9766 9970
GERM CELL TUMORS Germ cell 8020 9060 9064 9070 9071 9080 9084 9085 9100
CYSTS AND TUMOR-LIKE LESIONS Cysts and heterotopias 9084
TUMORS OF THE SELLAR REGION Pituitary 8040 8l40 8l46 8260 8270 8271 8280
8281 8290 8300 8330 8323 8333 Craniopharyngioma 9350
Page 44
Endash
APPENDIX E
LOCAL EXTENSIONS FROM REGIONAL TUMORS Chordomachondrosarcoma 9370
UNCLASSIFIED TUMORS Hemangioma 9120 9121 9130 9131 Neoplasm benign 80000 8010 Neoplasm uncertain behavior 80001 80011 Neoplasm malignant 80003 80013 8002 8003 All other 8720 9580
aWHO = World Health OrganizationbICD-O = International Classification of Diseases for Oncology Second Edition 1990 cNOS=Not Otherwise Specified
Page 45
Endash
DATA COLLECTION
OF PRIMARY
CENTRAL NERVOUS
SYSTEM TUMORS
Endash
International Classification of Childhood Cancer (ICCC)
Diagnostic Group
ICD-Oa codes
Morphology Topography
I LEUKAEMIA
(a) Lymphoid leukaemia 9820-9827 9850
(b) Acute non-lymphocytic leukaemia 9840 9841 9861 9864 9866 9867 98919894 9910
(c) Chronic myeloid leukaemia 9863 9868
(d) Other specified leukaemias 9830 9842 9860 9862 9870-9890 9892 98939900 9930-9941
(e) Unspecified leukaemias 9800-9804
II LYMPHOMAS AND OTHER RETICULOENDOTHELIAL NEOPLASMS
(a) Hodgkinrsquos disease 9650-9667
(b) Non-Hodgkinrsquos lymphoma 9591-9595 9670-9686 9690-9714 9723
(c) Burkittrsquos lymphoma 9687
(d) Miscellaneous lymphoreticular neoplasms 9720 9731-9764
(e) Unspecified lymphomas 9590
III CENTRAL NERVOUS SYSTEM (CNS) ANDMISCELLANEOUS INTRACRANIAL AND
INTRASPINAL NEOPLASMSb
(a) Ependymomac 9383 9390-9394
(b) Astrocytoma 9380 C723
9381 9400-9441
(c) Primitive neuroectodermal tumours 9470-9473
(d) Other gliomasd 9380 C700-C722C724-C729
9382 9384
9442-9460 9481
APPENDIX E
Diagnostic Group
ICD-Oa codes
Morphology Topogragphy
III CNS AND MISCELLANEOUS INTRACRANIAL AND INTRASPINAL
NEOPLASMSb Continued
(e) Miscellaneous intracranial and intraspinalneoplasmsc
8270-8281 8300 9350-9362 9480 95059530-9539
(f) Unspecified intracranial and intraspinalneoplasmsc
8000-8004 C700-C729C751-C753
IV SYMPATHETIC NERVOUS SYSTEM TUMOURS
(a) Neuroblastoma and ganglioneuroblastoma 9490 9500
(b) Other sympathetic nervous system tumours 8680 8693-8710 9501-9504 9520-9523
aInternational Classification of Diseases for Oncology Second Edition World Health Organization 1990bGroup III excludes all lymphomas See group II cBehaviour codes 0 and 1 are included dBehaviour code 1 is included
Page 47
Endash
Comments and recommendations are welcome Should questions arise on how to use these
materials or for more information please contact
Centers for Disease Control and Prevention National Program of Cancer Registries
4770 Buford Hwy NE Mail Stop K-53
Atlanta GA 30042-3717
Voice Information System 1 (888) 842-6355 bull Fax (770) 488-4760
cancerinfocdcgov bull httpwwwcdcgovcancer
All materials are in the public domain and may be reproduced or copied without permission citation
to source however is appreciated
BACK COVER
(WHITE)
Spine(WHITE)
DATA COLLECTION OF PRIMARY CEN
TRAL NERVOUS SYSTEM
TUM
ORS 2004
National Program of Cancer Registries Training M
aterials
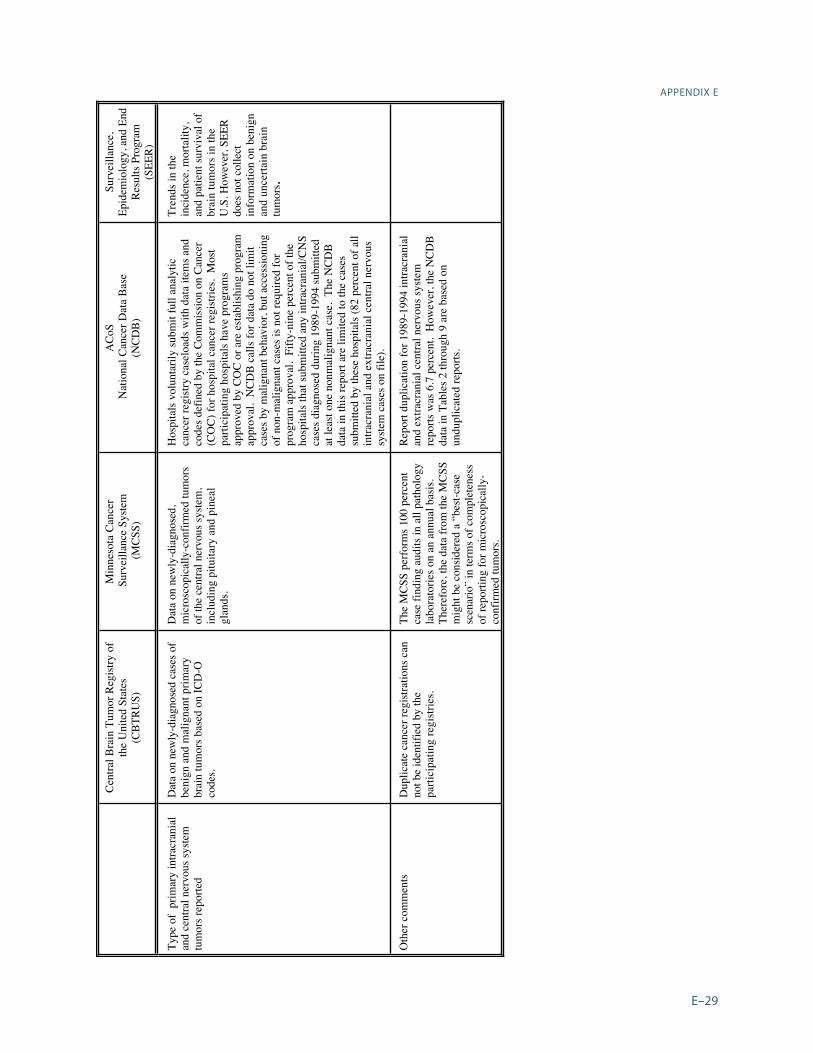
DATA COLLECTION
OF PRIMARY
CENTRAL NERVOUS
SYSTEM TUMORS
TABLE 4 NUMBER AND PERCENT OF PRIMARY INTRACRANIAL AND CENTRAL NERVOUS SYSTEM TUMORS BY DIAGNOSTIC CONFIRMATION
DiagnosticConfirmation
CBTRUSa
Number () MCSSb
Number () NCDBc
Number () SEERd
Number ()
Positive microscopy
12087 (875) 3845 (100) 61818 (890) 9188 (874)
Radiographywithout microscopy
1306 (95) NA 6759 (97) 1015 (97)
Clinical 204 (15) NA 484 (07) 98 (09)
Unknown 217 (15) NA 398 (06) 217 (21)
TOTAL 13814 (100) 3845 (100) 69459 (100) 10518 (100)
Note Reported data are incident cases from 1989-1994 except for CBTRUS data which are from 1990-1993
aCentral Brain Tumor Registry of the United Statesb Minnesota Cancer Surveillance System (microscopically confirmed cases only) cNational Cancer Data Base (limited to cases reported by hospitals that accessioned nonmalignant cases)dSurveillance Epidemiology and End Results Program (malignant cases only)NA = Not applicable
Page 32
Endash
Page 32
TABLE 4 NUMBER AND PERCENT OF PRIMARY INTRACRANIAL AND CENTRALNERVOUS SYSTEM TUMORS BY DIAGNOSTIC CONFIRMATION
DiagnosticConfirmation
CBTRUSa
Number ()MCSSb
Number ()NCDBc
Number ()SEERd
Number ()
Positivemicroscopy
12087 (875) 3845 (100) 61818 (890) 9188 (874)
Radiographywithout microscopy
1306 (95) NA 6759 (97) 1015 (97)
Clinical 204 (15) NA 484 (07) 98 (09)
Unknown 217 (15) NA 398 (06) 217 (21)
TOTAL 13814 (100) 3845 (100) 69459 (100) 10518 (100)
Note Reported data are incident cases from 1989-1994 except for CBTRUS data which are from 1990-1993
aCentral Brain Tumor Registry of the United Statesb Minnesota Cancer Surveillance System (microscopically confirmed cases only)cNational Cancer Data Base (limited to cases reported by hospitals that accessioned nonmalignant cases)dSurveillance Epidemiology and End Results Program (malignant cases only)NA = Not applicable
APPENDIX E
TABLE 5 NUMBER AND PERCENT OF MALIGNANT PRIMARY INTRACRANIAL AND CENTRAL SYSTEM TUMORS BY TUMOR LOCATION
Locationa CBTRUSb
Number () MCSSc
Number () NCDBd
Number () SEERe
Number ()
Intracranial 7171 (977) 1824 (968) 44801 (968) 10196 (969)
Brain 6862 (926) 1746 (927) 42622 (921) 9721 (924)
Meninges 98 (13) 23 (12) 581 (13) 139 (13)
Pituitarycraniopharyngealduct
37 (05) 13 (07) 189 (04) 30 (03)
Pineal 58 (08) 20 (11) 378 (08) 80 (08)
Other central nervous systemincluding cranial nerves
116 (16) 22 (12) 1031 (22) 226 (21)
Extracranial 242 (33) 60 (32) 1483 (32) 322 (31)
Spinal cord 234 (32) 60 (32) 1410 (30) 313 (30)
Spinal meninges 8 (01) 0 73 (02) 9 (01)
TOTAL 7413 (100) 1884 (100) 46284 (100) 10518 (100)
Note Reported data are incident cases from 1989-1994 except for CBTRUS data which are from 1990-1993
aRefer to the site codes in Appendix BbCentral Brain Tumor Registry of the United States cMinnesota Cancer Surveillance System (microscopically confirmed cases only)dNational Cancer Data Base (limited to cases reported by hospitals that accessioned nonmalignant cases) eSurvival Epidemiology and End Results Program (malignant cases only)
Page 33
Endash
DATA COLLECTION
OF PRIMARY
CENTRAL NERVOUS
SYSTEM TUMORS
TABLE 6 NUMBER AND PERCENT OF PRIMARY INTRACRANIAL AND CENTRAL NERVOUS SYSTEM TUMORS OF BENIGN AND UNCERTAIN BEHAVIOR BY TUMOR LOCATION
Locationa CBTRUSb
Number () MCSSc
Number () NCDBd
Number () SEERe
Number ()
Intracranial 5913 (924) 1776 (906) 21521 (929) NA
Brain 1137 (178) 178 (91) 5905 (255) NA
Meninges 2621 (409) 815 (416) 8784 (379) NA
Pituitarycraniopharyngealduct
1454 (227) 517 (264) 4769 (206) NA
Pineal 16 (02) 1 (lt01) 99 (04) NA
Other central nervous systemincluding cranial nerves
685 (107) 265 (135) 1964 (85) NA
Extracranial 488 (76) 185 (94) 1654 (71) NA
Spinal cord 263 (41) 87 (44) 985 (42) NA
Spinal meninges 225 (35) 98 (50) 669 (29) NA
TOTAL 6401 (100) 1961 (100) 23175 (100) NA
Note Reported data are incident cases from 1989-1994 except for CBTRUS data which are from 1990-1993
aRefer to the site codes in Appendix BbCentral Brain Tumor Registry of the United States cMinnesota Cancer Surveillance System (microscopically confirmed cases only)dNational Cancer Data Base (limited to cases reported by hospitals that accessioned nonmalignant cases) eSurveillance Epidemiology and End Results Program (malignant cases only)NA = Not applicable
Page 34
Endash
APPENDIX E TABLE 7 NUMBER AND PERCENT OF PRIMARY INTRACRANIAL AND CENTRAL
NERVOUS SYSTEM TUMORS BY TUMOR BEHAVIOR AND LOCATION
BehaviorTumor Locationa
CBTRUSb
Number () MCSSc
Number () NCDBd
Number () SEERe
Number ()
Malignant 7413 (537) 1884 (490) 46284 (666) 10518 (100)
Brain 6862 (497) 1746 (454) 42622 (614) 9721 (924)
Meninges 98 (07) 23 (06) 581 (08) 139 (13)
Pituitarycraniopharyn-geal ductpineal
95 (07) 33 (09) 567 (08) 110 (11)
Other central nervous system includingcranial nerves
116 (08) 22 (06) 1031 (15) 226 (22)
Spinal cord 242 (18) 60 (16) 1483 (21) 322 (31)
Benign 5794 (419) 1787 (465) 20694 (298) NA
Brain 803 (58) 99 (26) 4491 (65) NA
Meninges 2565 (186) 807 (210) 8613 (124) NA
Pituitarycraniopharyn-geal ductpineal
1322 (96) 458 (119) 4330 (62) NA
Other central nervous system includingcranial nerves
678 (49) 263 (68) 1911 (28) NA
Spinal cord 426 (31) 160 (42) 1349 (19) NA
Uncertain 607 (44) 174 (45) 2481 (36) NA
Brain 334 (24) 79 (21) 1414 (20) NA
Meninges 56 (04) 8 (02) 171 (02) NA
Pituitarycraniopharyn-geal ductpineal
148 (11) 60 (16) 538 (08) NA
Other central nervous system includingcranial nerves
7 (01) 2 (01) 53 (01) NA
Spinal cord 62 (05) 25 (07) 305 (04) NA
TOTAL 13814 (100) 3845 (100) 69459 (100) 10518 (100)
Note Reported data are incident cases from 1989-1994 except for CBTRUS data which are from 1990-1993 NA=Not applicableaRefer to the site codes in Appendix B bCentral Brain Tumor Registry of the United States cMinnesota Cancer Surveillance System (microscopically confirmed cases only)dNational Cancer Data Base (limited to cases reported byhospitals that accessioned nonmalignant cases eSurvival Epidemiology and End Results Program (malignant cases only)
Page 35
Endash
DATA COLLECTION
OF PRIMARY
CENTRAL NERVOUS
SYSTEM TUMORS
TABLE 8 NUMBER AND PERCENT OF MALIGNANT PRIMARY INTRACRANIAL AND
CENTRAL NERVOUS SYSTEM TUMORS BY HISTOLOGY GROUPINGS
WHO Histologya
Groupings CBTRUSb
Number () MCSSc
Number () NCDBd
Number () SEERe
Number ()
Neuroepithelial 6477 (874) 1689 (896) 39701 (858) 8676 (825)
Tumors of cranial and spinal nerves
12 (02) 3 (02) 108 (02) 25 (02)
Tumors of meninges
137 (18) 25 (13) 994 (21) 194 (18)
LymphomasHemopoietic
473 (64) 121 (64) 3492 (75) 1099 (105)
Germ cell 70 (09) 20 (11) 403 (09) 97 (09)
Cysts and tumor-like lesions
0 0 0 0
Tumors of sellar region
20 (03) 11 (06) 100 (02) 6 (01)
Local extensions 29 (04) 11 (06) 166 (04) 38 (04)
Unclassifiedunassigned tumorsf
195 (26) 4 (02) 1320 (29) 383 (36)
TOTAL 7413 (100) 1884 (100) 46284 (100) 10518 (100)
Note Reported data are incident cases from 1989-1994 except for CBTRUS data which are from 1990-1993
aRefer to the World Health Organization (WHO) histology groupings in Appendix CbCentral Brain Tumor Registry of the United States cMinnesota Cancer Surveillance System (microscopically confirmed cases only)dNational Cancer Data Base (limited to cases reported by hospitals that accessioned nonmalignant cases) f For MCSS unclassifiedunassigned tumors include one malignant and four nonmalignant histologies which were
not listed in the CBTRUS classification scheme For NCDB unclassifiedunassigned tumors include 319 cases(less than one half percent) which had histologies not assigned by CBTRUS to any other category For SEERunclassifiedunassigned tumors include all malignant histologies occurring in the brainCNS which could not beclassified in one of the above categories based on their 4-digit histologic type
Page 36
Endash
APPENDIX E
TABLE 9 NUMBER AND PERCENT OF PRIMARY INTRACRANIAL AND CENTRAL NERVOUS SYSTEM TUMORS OF BENIGN AND UNCERTAIN BEHAVIOR
BY HISTOLOGY GROUPINGS
WHO Histologya
Groupings CBTRUSb
Number () MCSSc
Number () NCDBd
Number () SEERe
Number ()
Neuroepithelial 275 (43) 91 (46) 1064 (46) NA
Tumors of cranial and spinal nerves
980 (153) 397 (202) 2618 (113) NA
Tumors of meninges
3509 (548) 941 (480) 13667 (590) NA
LymphomasHemopoietic
3 (lt01) 0 7 (lt01) NA
Germ cell 4 (lt01) 1 (01) 25 (01) NA
Cysts and tumor-like lesions
15 (02) 3 (02) 34 (01) NA
Tumors of sellar region
1444 (226) 510 (260) 4749 (205) NA
Local extensions 0 0 0 NA
Unclassifiedunassigned tumorsf
171 (27) 18 (09) 1011 (44) NA
TOTAL 6401 (100) 1961 (100) 23175 (100) NA
Note Reported data are incident cases from 1989-1994 except for CBTRUS which is 1990-1993
aRefer to the World Health Organization (WHO) histology groupings in Appendix CbCentral Brain Tumor Registry of the United States c Minnesota Cancer Surveillance System (microscopically confirmed cases only) dNational Cancer Data Base (limited to cases reported by hospitals that accessioned nonmalignant cases) eSurvival Epidemiology and End Results Program (malignant cases only)dFor MCSS unclassifiedunassigned tumors include one malignant and four nonmalignant histologies which werenot listed in the CBTRUS classification scheme For NCDB unclassifiedunassigned tumors include 319 cases(less than one half percent) which had histologies not assigned by CBTRUS to any other category For SEERunclassifiedunassigned tumors include all malignant histologies occurring in the brainCNS which could not beclassified in one of the above categories based on their 4-digit histologic typeNA = Not applicable
Page 37
Endash
DATA COLLECTION
OF PRIMARY
CENTRAL NERVOUS
SYSTEM TUMORS
TABLE 10 METHOD OF CASE FINDING FOR PRIMARY INTRACRANIAL AND CENTRAL NERVOUS SYSTEM TUMORS BY TUMOR BEHAVIOR AND LOCATION MINNESOTA 1989-1994
Behavior Tumor Locationa
Number of Cases
Percent Found byRoutine
Reporting
Percent Found by Special Efforts
Malignant Brain Cerebral meninges
Pituitarycranio duct pineal Other intracranial
18841746 23 33
22
961 965 957 939
864
39 35 43 61
136 Extracranial 60 883 117 Benign Brain
1787 99
788 838
212 162
Cerebral meninges Pituitarycranio duct
pineal Other intracranial
807 458
263
843 740
779
157 260
221 Extracranial 160 631 369 Uncertain 174 856 144 Brain 79 823 177 Cerebral meninges Pituitarycraniopharyn- geal ductpineal Other intracranial
8 60
2
875 850
1000
125 150
00 Extracranial 25 960 40
TOTAL 3845 876 124
aRefer to the site codes in Appendix B
Page 38
Endash
1989 1990 1991 1992 1993 1994
TOTAL
APPENDIX E TABLE 11 METHOD OF CASE FINDING FOR INTRACRANIALa TUMORS BY DIAGNOSIS YEAR MINNESOTA 1989-1994
DiagnosisYear
Number of
Cases
Percent Found byRoutine
Reporting
Percent Found by
Special Efforts
571 837 163 616 865 135 586 913 87 602 899 101
633 872 128 592 929 71
3600 886 114
aIncludes the brain cerebral meninges pituitary gland pineal gland and otherintracranial tumors (refer to the site codes in Appendix B)
Page 39
Endash
DATA COLLECTION
OF PRIMARY
CENTRAL NERVOUS
SYSTEM TUMORS
TABLE 12 METHOD OF CASE FINDING FOR NONMALIGNANT INTRACRANIALa TUMORS BY TYPE OF FACILITY MINNESOTA 1989-1994
Type of Facility Number of Tumors Percent Found byRoutine
Reporting
Percent Found by Special Efforts
Registry at facility No registry at facility
1451325
859 569
141 431
TOTAL 1776 806 194
aIncludes tumors with benign or uncertain behavior that involve the brain cerebral meningespituitary gland pineal gland or other intracranial sites (refer to the site codes in Appendix B)
TABLE 13 REPORTING METHOD AND SOURCE OF CASE FINDING FOR NON- MALIGNANT INTRACRANIALa TUMORS DIAGNOSED IN HOSPITALS WITH A TUMOR REGISTRY MINNESOTA 1989-1994
Reporting Method Number of Tumors Percent Found byRoutine
Reporting
Percent Found by
Special Efforts
Registry-reportedLaboratory-reported
1226225
925 502
75 498
TOTAL 1451 859 141
aIncludes tumors with benign or uncertain behavior that involve the brain cerebral meningespituitary gland pineal gland or other intracranial sites (refer to the site codes in Appendix B)
Page 40
Endash0
APPENDIX E TABLE 14 HOSPITAL REGISTRY ACCESSIONING OF MALIGNANT AND NON-
MALIGNANT PRIMARY INTRACRANIAL AND CENTRAL NERVOUS SYSTEM TUMORS NCDB 1989-1994
TUMOR Totalb
BEHAVIOR Malignant c Nonmalignantd
Tumor Locationa HospitalsReporting
Number ()
Hospitals Reporting
Number ()
Hospitals Reporting
Number ()
Intracranial 1542 (100) 1526 (100) 900 (99)
Brain 1527 (99) 1519 (gt99) 754 (83)
Meninges 740 (48) 390 (26) 613 (67)
Pituitaryglandcraniopharyn-
geal duct
602 (39) 168 (11) 538 (59)
Pineal gland 319 (21) 277 (18) 79 (9)
Other central nervous system including cranial
nerves
648 (42) 545 (36) 299 (33)
Extracranial 812 (53) 708 (46) 410 (45)
Spinal cord 760 (49) 692 (45) 311 (34)
Spinal meninges 299 (19) 72 (5) 258 (28)
TOTAL Hospitals 1542 (100) 1526 (100) 913 (100)
Note The number of hospitals in each of the second third and fourth columns is the number that submittedreports to the NCDB for any intracranial and central nervous system tumors for the respective malignancystatus Not all hospitals submitted reports for each year during the study period (1989-1994)
aRefer to the site codes in Appendix B bBehavior codes = 0 1 3 cBehavior code = 3 dBehavior codes = 0 1
Page 41
Endash
DATA COLLECTION
OF PRIMARY
CENTRAL NERVOUS
SYSTEM TUMORS
Texas Cancer Registry
1997 CBTRUS State Survey of Benign Brain Tumor Data Collection
State Collection Status
Currently Collecting Benign Tumor Data1 Arizona Cancer Registry since 1981 2 Colorado Central Cancer Registry since 1988 3 Connecticut Tumor Registry since 1965 4 Idaho Cancer Data Registry since 1970 5 Maine Cancer Registry since 1983 6 Massachusetts Cancer Registry since 1982 7 Minnesota Cancer Surveillance System since 1988 8 Montana Central Tumor Registry since 1979 9 New York State Cancer Registry since 1988
10 North Carolina Central Cancer Registry since 1990 11 Utah Cancer Registry since 1966 12 Virginia Cancer Registry since 1994 13 Delaware State Cancer Registry14 Washington State Cancer Registry since 1992 15 passive collection 1979-1994
active collection since 1995
Stopped or Passive Collection of Benign Tumor Data1 New Jersey State Cancer Registry stopped 1979-1995 2 Kansas Cancer Registry stopped 1969-1995 3 New Hampshire State Cancer Registry stopped 1986-1991 4 District of Columbia Cancer Registry stopped 1997 5 Wyoming Cancer Surveillance Program stopped 111996 6 Louisiana Tumor Registry stopped 1992 (passive collection) 7 Illinois State Cancer Registry stopped 111996 8 Missouri Cancer Registry passive collection since 1984 9 South Carolina Central Cancer Registry passive collection since 1996
Beginning Collection of Benign Tumor Data1 North Dakota Cancer Registry began collection 1997 2 Rhode Island Cancer Registry began collection 1998
Page 42
Endash
APPENDIX E
Codes for Primary Intracranial and Central Nervous System Tumors
Note For this report the designation of ldquoprimary intracranial and central nervous system tumorsrdquo includes thefollowing primary tumors of central nervous system sites as well as tumors of the pituitary and pinealglands All histology types within the topography codes are included in the designation of ldquoprimaryintracranial and CNS tumors The source for the topography codes is Percy C Van Holten V Muir Ceds International Classification of Diseases for Oncology Second Edition Geneva World Health Organization 1990
Intracranial tumors
Brain C710 Cerebrum C711 Frontal lobe C712 Temporal lobe C713 Parietal lobe C714 Occipital lobe C715 Ventricle NOSC716 Cerebellum NOS C717 Brain stem C718 Overlapping lesion of brain C719 Brain NOS
Meninges C700 Cerebral meninges C709 Meninges NOS
a
Cranial Nerves and other intracranial parts of the central nervous systemC722 Olfactory nerve C723 Optic nerve C724 Acoustic nerve C725 Cranial nerve NOS C728 Overlapping lesion of brain and central nervous system C729 Nervous system NOS
Other endrocrine glands and related structures C751 Pituitary gland C752 Craniopharyngeal duct C753 Pineal gland
Extracranial tumors
Spinal cord C720 Spinal cord C721 Cauda equina
Meninges C701 Spinal meninges
aNOS=Not Otherwise Specified
Page 43
Endash
DATA COLLECTION
OF PRIMARY
CENTRAL NERVOUS
SYSTEM TUMORS
Brain Tumor Histology Groupings
The following histology groupings were used for the primary intracranial and central nervoussystem tumors The source for the histology groupings is Central Brain Tumor Registry ofthe United States (CBTRUS) 1996 Statistics Report Table 4
WHOa HISTOLOGY GROUPINGS ICD-Ob MORPHOLOGY CODE
Diffuse astrocytoma (protoplasma fibrillary) 9410 9420 Anaplastic astrocytoma 9401 9411 Glioblastoma 9440 9441 9442 Pilocytic astrocytoma 9421 Unique astrocytoma variants 9383 9384 9424 Oligodendroglioma 9450 Anaplastic oligodendroglioma 9451 9460 Ependymomaanaplastic ependymoma 9391 9392 9393 Ependymoma variants 9394 Mixed glioma 9382 Astrocytoma NOSc 9400 Glioma malignant NOS 9380 Choroid plexus 9390 Neuroepithelial 9381 9423 9430 Benign neuronalglial neuronal and mixed 86801 8693 9490 9505 9506 Malignant neruonalglial neuronal and mixed 86803 9364 9490 9500 Pineal parenchymal 9360 9361 9362 Embryonalprimitivemedulloblastoma 8963 9470 9471 9472
9473 9501 9502 9503 9510
TUMORS OF NEUROEPITHELIAL TISSUE
TUMORS OF CRANIAL AND SPINAL NERVES Nerve sheath benign and malignant 9540 9550 9560 9570
TUMORS OF THE MENINGES Meningioma 9530 9531 9532 9533 9534 9537 9538 Other mesenchymal benign and malignant 8800 8801 8802 8803 8810 8830 8850 88618900
8910 8990 9133 9150 9240 9480 9481 9536 9539 Hemangioblastoma 9161 9535
LYMPHOMAS AND HEMOPOIETIC NEOPLASMS Lymphoma 9590 9591 9593 9594 9595 9630 9650 9652
9663 9670 9671 9672 9674 9675 9680 9681 9682 9684 9685 9686 9687 9690 9691 96939695 9696 9698 9702 9714 9723 9731 9766 9970
GERM CELL TUMORS Germ cell 8020 9060 9064 9070 9071 9080 9084 9085 9100
CYSTS AND TUMOR-LIKE LESIONS Cysts and heterotopias 9084
TUMORS OF THE SELLAR REGION Pituitary 8040 8l40 8l46 8260 8270 8271 8280
8281 8290 8300 8330 8323 8333 Craniopharyngioma 9350
Page 44
Endash
APPENDIX E
LOCAL EXTENSIONS FROM REGIONAL TUMORS Chordomachondrosarcoma 9370
UNCLASSIFIED TUMORS Hemangioma 9120 9121 9130 9131 Neoplasm benign 80000 8010 Neoplasm uncertain behavior 80001 80011 Neoplasm malignant 80003 80013 8002 8003 All other 8720 9580
aWHO = World Health OrganizationbICD-O = International Classification of Diseases for Oncology Second Edition 1990 cNOS=Not Otherwise Specified
Page 45
Endash
DATA COLLECTION
OF PRIMARY
CENTRAL NERVOUS
SYSTEM TUMORS
Endash
International Classification of Childhood Cancer (ICCC)
Diagnostic Group
ICD-Oa codes
Morphology Topography
I LEUKAEMIA
(a) Lymphoid leukaemia 9820-9827 9850
(b) Acute non-lymphocytic leukaemia 9840 9841 9861 9864 9866 9867 98919894 9910
(c) Chronic myeloid leukaemia 9863 9868
(d) Other specified leukaemias 9830 9842 9860 9862 9870-9890 9892 98939900 9930-9941
(e) Unspecified leukaemias 9800-9804
II LYMPHOMAS AND OTHER RETICULOENDOTHELIAL NEOPLASMS
(a) Hodgkinrsquos disease 9650-9667
(b) Non-Hodgkinrsquos lymphoma 9591-9595 9670-9686 9690-9714 9723
(c) Burkittrsquos lymphoma 9687
(d) Miscellaneous lymphoreticular neoplasms 9720 9731-9764
(e) Unspecified lymphomas 9590
III CENTRAL NERVOUS SYSTEM (CNS) ANDMISCELLANEOUS INTRACRANIAL AND
INTRASPINAL NEOPLASMSb
(a) Ependymomac 9383 9390-9394
(b) Astrocytoma 9380 C723
9381 9400-9441
(c) Primitive neuroectodermal tumours 9470-9473
(d) Other gliomasd 9380 C700-C722C724-C729
9382 9384
9442-9460 9481
APPENDIX E
Diagnostic Group
ICD-Oa codes
Morphology Topogragphy
III CNS AND MISCELLANEOUS INTRACRANIAL AND INTRASPINAL
NEOPLASMSb Continued
(e) Miscellaneous intracranial and intraspinalneoplasmsc
8270-8281 8300 9350-9362 9480 95059530-9539
(f) Unspecified intracranial and intraspinalneoplasmsc
8000-8004 C700-C729C751-C753
IV SYMPATHETIC NERVOUS SYSTEM TUMOURS
(a) Neuroblastoma and ganglioneuroblastoma 9490 9500
(b) Other sympathetic nervous system tumours 8680 8693-8710 9501-9504 9520-9523
aInternational Classification of Diseases for Oncology Second Edition World Health Organization 1990bGroup III excludes all lymphomas See group II cBehaviour codes 0 and 1 are included dBehaviour code 1 is included
Page 47
Endash
Comments and recommendations are welcome Should questions arise on how to use these
materials or for more information please contact
Centers for Disease Control and Prevention National Program of Cancer Registries
4770 Buford Hwy NE Mail Stop K-53
Atlanta GA 30042-3717
Voice Information System 1 (888) 842-6355 bull Fax (770) 488-4760
cancerinfocdcgov bull httpwwwcdcgovcancer
All materials are in the public domain and may be reproduced or copied without permission citation
to source however is appreciated
BACK COVER
(WHITE)
Spine(WHITE)
DATA COLLECTION OF PRIMARY CEN
TRAL NERVOUS SYSTEM
TUM
ORS 2004
National Program of Cancer Registries Training M
aterials

DATA COLLECTION
OF PRIMARY
CENTRAL NERVOUS
SYSTEM TUMORS
TABLE 6 NUMBER AND PERCENT OF PRIMARY INTRACRANIAL AND CENTRAL NERVOUS SYSTEM TUMORS OF BENIGN AND UNCERTAIN BEHAVIOR BY TUMOR LOCATION
Locationa CBTRUSb
Number () MCSSc
Number () NCDBd
Number () SEERe
Number ()
Intracranial 5913 (924) 1776 (906) 21521 (929) NA
Brain 1137 (178) 178 (91) 5905 (255) NA
Meninges 2621 (409) 815 (416) 8784 (379) NA
Pituitarycraniopharyngealduct
1454 (227) 517 (264) 4769 (206) NA
Pineal 16 (02) 1 (lt01) 99 (04) NA
Other central nervous systemincluding cranial nerves
685 (107) 265 (135) 1964 (85) NA
Extracranial 488 (76) 185 (94) 1654 (71) NA
Spinal cord 263 (41) 87 (44) 985 (42) NA
Spinal meninges 225 (35) 98 (50) 669 (29) NA
TOTAL 6401 (100) 1961 (100) 23175 (100) NA
Note Reported data are incident cases from 1989-1994 except for CBTRUS data which are from 1990-1993
aRefer to the site codes in Appendix BbCentral Brain Tumor Registry of the United States cMinnesota Cancer Surveillance System (microscopically confirmed cases only)dNational Cancer Data Base (limited to cases reported by hospitals that accessioned nonmalignant cases) eSurveillance Epidemiology and End Results Program (malignant cases only)NA = Not applicable
Page 34
Endash
APPENDIX E TABLE 7 NUMBER AND PERCENT OF PRIMARY INTRACRANIAL AND CENTRAL
NERVOUS SYSTEM TUMORS BY TUMOR BEHAVIOR AND LOCATION
BehaviorTumor Locationa
CBTRUSb
Number () MCSSc
Number () NCDBd
Number () SEERe
Number ()
Malignant 7413 (537) 1884 (490) 46284 (666) 10518 (100)
Brain 6862 (497) 1746 (454) 42622 (614) 9721 (924)
Meninges 98 (07) 23 (06) 581 (08) 139 (13)
Pituitarycraniopharyn-geal ductpineal
95 (07) 33 (09) 567 (08) 110 (11)
Other central nervous system includingcranial nerves
116 (08) 22 (06) 1031 (15) 226 (22)
Spinal cord 242 (18) 60 (16) 1483 (21) 322 (31)
Benign 5794 (419) 1787 (465) 20694 (298) NA
Brain 803 (58) 99 (26) 4491 (65) NA
Meninges 2565 (186) 807 (210) 8613 (124) NA
Pituitarycraniopharyn-geal ductpineal
1322 (96) 458 (119) 4330 (62) NA
Other central nervous system includingcranial nerves
678 (49) 263 (68) 1911 (28) NA
Spinal cord 426 (31) 160 (42) 1349 (19) NA
Uncertain 607 (44) 174 (45) 2481 (36) NA
Brain 334 (24) 79 (21) 1414 (20) NA
Meninges 56 (04) 8 (02) 171 (02) NA
Pituitarycraniopharyn-geal ductpineal
148 (11) 60 (16) 538 (08) NA
Other central nervous system includingcranial nerves
7 (01) 2 (01) 53 (01) NA
Spinal cord 62 (05) 25 (07) 305 (04) NA
TOTAL 13814 (100) 3845 (100) 69459 (100) 10518 (100)
Note Reported data are incident cases from 1989-1994 except for CBTRUS data which are from 1990-1993 NA=Not applicableaRefer to the site codes in Appendix B bCentral Brain Tumor Registry of the United States cMinnesota Cancer Surveillance System (microscopically confirmed cases only)dNational Cancer Data Base (limited to cases reported byhospitals that accessioned nonmalignant cases eSurvival Epidemiology and End Results Program (malignant cases only)
Page 35
Endash
DATA COLLECTION
OF PRIMARY
CENTRAL NERVOUS
SYSTEM TUMORS
TABLE 8 NUMBER AND PERCENT OF MALIGNANT PRIMARY INTRACRANIAL AND
CENTRAL NERVOUS SYSTEM TUMORS BY HISTOLOGY GROUPINGS
WHO Histologya
Groupings CBTRUSb
Number () MCSSc
Number () NCDBd
Number () SEERe
Number ()
Neuroepithelial 6477 (874) 1689 (896) 39701 (858) 8676 (825)
Tumors of cranial and spinal nerves
12 (02) 3 (02) 108 (02) 25 (02)
Tumors of meninges
137 (18) 25 (13) 994 (21) 194 (18)
LymphomasHemopoietic
473 (64) 121 (64) 3492 (75) 1099 (105)
Germ cell 70 (09) 20 (11) 403 (09) 97 (09)
Cysts and tumor-like lesions
0 0 0 0
Tumors of sellar region
20 (03) 11 (06) 100 (02) 6 (01)
Local extensions 29 (04) 11 (06) 166 (04) 38 (04)
Unclassifiedunassigned tumorsf
195 (26) 4 (02) 1320 (29) 383 (36)
TOTAL 7413 (100) 1884 (100) 46284 (100) 10518 (100)
Note Reported data are incident cases from 1989-1994 except for CBTRUS data which are from 1990-1993
aRefer to the World Health Organization (WHO) histology groupings in Appendix CbCentral Brain Tumor Registry of the United States cMinnesota Cancer Surveillance System (microscopically confirmed cases only)dNational Cancer Data Base (limited to cases reported by hospitals that accessioned nonmalignant cases) f For MCSS unclassifiedunassigned tumors include one malignant and four nonmalignant histologies which were
not listed in the CBTRUS classification scheme For NCDB unclassifiedunassigned tumors include 319 cases(less than one half percent) which had histologies not assigned by CBTRUS to any other category For SEERunclassifiedunassigned tumors include all malignant histologies occurring in the brainCNS which could not beclassified in one of the above categories based on their 4-digit histologic type
Page 36
Endash
APPENDIX E
TABLE 9 NUMBER AND PERCENT OF PRIMARY INTRACRANIAL AND CENTRAL NERVOUS SYSTEM TUMORS OF BENIGN AND UNCERTAIN BEHAVIOR
BY HISTOLOGY GROUPINGS
WHO Histologya
Groupings CBTRUSb
Number () MCSSc
Number () NCDBd
Number () SEERe
Number ()
Neuroepithelial 275 (43) 91 (46) 1064 (46) NA
Tumors of cranial and spinal nerves
980 (153) 397 (202) 2618 (113) NA
Tumors of meninges
3509 (548) 941 (480) 13667 (590) NA
LymphomasHemopoietic
3 (lt01) 0 7 (lt01) NA
Germ cell 4 (lt01) 1 (01) 25 (01) NA
Cysts and tumor-like lesions
15 (02) 3 (02) 34 (01) NA
Tumors of sellar region
1444 (226) 510 (260) 4749 (205) NA
Local extensions 0 0 0 NA
Unclassifiedunassigned tumorsf
171 (27) 18 (09) 1011 (44) NA
TOTAL 6401 (100) 1961 (100) 23175 (100) NA
Note Reported data are incident cases from 1989-1994 except for CBTRUS which is 1990-1993
aRefer to the World Health Organization (WHO) histology groupings in Appendix CbCentral Brain Tumor Registry of the United States c Minnesota Cancer Surveillance System (microscopically confirmed cases only) dNational Cancer Data Base (limited to cases reported by hospitals that accessioned nonmalignant cases) eSurvival Epidemiology and End Results Program (malignant cases only)dFor MCSS unclassifiedunassigned tumors include one malignant and four nonmalignant histologies which werenot listed in the CBTRUS classification scheme For NCDB unclassifiedunassigned tumors include 319 cases(less than one half percent) which had histologies not assigned by CBTRUS to any other category For SEERunclassifiedunassigned tumors include all malignant histologies occurring in the brainCNS which could not beclassified in one of the above categories based on their 4-digit histologic typeNA = Not applicable
Page 37
Endash
DATA COLLECTION
OF PRIMARY
CENTRAL NERVOUS
SYSTEM TUMORS
TABLE 10 METHOD OF CASE FINDING FOR PRIMARY INTRACRANIAL AND CENTRAL NERVOUS SYSTEM TUMORS BY TUMOR BEHAVIOR AND LOCATION MINNESOTA 1989-1994
Behavior Tumor Locationa
Number of Cases
Percent Found byRoutine
Reporting
Percent Found by Special Efforts
Malignant Brain Cerebral meninges
Pituitarycranio duct pineal Other intracranial
18841746 23 33
22
961 965 957 939
864
39 35 43 61
136 Extracranial 60 883 117 Benign Brain
1787 99
788 838
212 162
Cerebral meninges Pituitarycranio duct
pineal Other intracranial
807 458
263
843 740
779
157 260
221 Extracranial 160 631 369 Uncertain 174 856 144 Brain 79 823 177 Cerebral meninges Pituitarycraniopharyn- geal ductpineal Other intracranial
8 60
2
875 850
1000
125 150
00 Extracranial 25 960 40
TOTAL 3845 876 124
aRefer to the site codes in Appendix B
Page 38
Endash
1989 1990 1991 1992 1993 1994
TOTAL
APPENDIX E TABLE 11 METHOD OF CASE FINDING FOR INTRACRANIALa TUMORS BY DIAGNOSIS YEAR MINNESOTA 1989-1994
DiagnosisYear
Number of
Cases
Percent Found byRoutine
Reporting
Percent Found by
Special Efforts
571 837 163 616 865 135 586 913 87 602 899 101
633 872 128 592 929 71
3600 886 114
aIncludes the brain cerebral meninges pituitary gland pineal gland and otherintracranial tumors (refer to the site codes in Appendix B)
Page 39
Endash
DATA COLLECTION
OF PRIMARY
CENTRAL NERVOUS
SYSTEM TUMORS
TABLE 12 METHOD OF CASE FINDING FOR NONMALIGNANT INTRACRANIALa TUMORS BY TYPE OF FACILITY MINNESOTA 1989-1994
Type of Facility Number of Tumors Percent Found byRoutine
Reporting
Percent Found by Special Efforts
Registry at facility No registry at facility
1451325
859 569
141 431
TOTAL 1776 806 194
aIncludes tumors with benign or uncertain behavior that involve the brain cerebral meningespituitary gland pineal gland or other intracranial sites (refer to the site codes in Appendix B)
TABLE 13 REPORTING METHOD AND SOURCE OF CASE FINDING FOR NON- MALIGNANT INTRACRANIALa TUMORS DIAGNOSED IN HOSPITALS WITH A TUMOR REGISTRY MINNESOTA 1989-1994
Reporting Method Number of Tumors Percent Found byRoutine
Reporting
Percent Found by
Special Efforts
Registry-reportedLaboratory-reported
1226225
925 502
75 498
TOTAL 1451 859 141
aIncludes tumors with benign or uncertain behavior that involve the brain cerebral meningespituitary gland pineal gland or other intracranial sites (refer to the site codes in Appendix B)
Page 40
Endash0
APPENDIX E TABLE 14 HOSPITAL REGISTRY ACCESSIONING OF MALIGNANT AND NON-
MALIGNANT PRIMARY INTRACRANIAL AND CENTRAL NERVOUS SYSTEM TUMORS NCDB 1989-1994
TUMOR Totalb
BEHAVIOR Malignant c Nonmalignantd
Tumor Locationa HospitalsReporting
Number ()
Hospitals Reporting
Number ()
Hospitals Reporting
Number ()
Intracranial 1542 (100) 1526 (100) 900 (99)
Brain 1527 (99) 1519 (gt99) 754 (83)
Meninges 740 (48) 390 (26) 613 (67)
Pituitaryglandcraniopharyn-
geal duct
602 (39) 168 (11) 538 (59)
Pineal gland 319 (21) 277 (18) 79 (9)
Other central nervous system including cranial
nerves
648 (42) 545 (36) 299 (33)
Extracranial 812 (53) 708 (46) 410 (45)
Spinal cord 760 (49) 692 (45) 311 (34)
Spinal meninges 299 (19) 72 (5) 258 (28)
TOTAL Hospitals 1542 (100) 1526 (100) 913 (100)
Note The number of hospitals in each of the second third and fourth columns is the number that submittedreports to the NCDB for any intracranial and central nervous system tumors for the respective malignancystatus Not all hospitals submitted reports for each year during the study period (1989-1994)
aRefer to the site codes in Appendix B bBehavior codes = 0 1 3 cBehavior code = 3 dBehavior codes = 0 1
Page 41
Endash
DATA COLLECTION
OF PRIMARY
CENTRAL NERVOUS
SYSTEM TUMORS
Texas Cancer Registry
1997 CBTRUS State Survey of Benign Brain Tumor Data Collection
State Collection Status
Currently Collecting Benign Tumor Data1 Arizona Cancer Registry since 1981 2 Colorado Central Cancer Registry since 1988 3 Connecticut Tumor Registry since 1965 4 Idaho Cancer Data Registry since 1970 5 Maine Cancer Registry since 1983 6 Massachusetts Cancer Registry since 1982 7 Minnesota Cancer Surveillance System since 1988 8 Montana Central Tumor Registry since 1979 9 New York State Cancer Registry since 1988
10 North Carolina Central Cancer Registry since 1990 11 Utah Cancer Registry since 1966 12 Virginia Cancer Registry since 1994 13 Delaware State Cancer Registry14 Washington State Cancer Registry since 1992 15 passive collection 1979-1994
active collection since 1995
Stopped or Passive Collection of Benign Tumor Data1 New Jersey State Cancer Registry stopped 1979-1995 2 Kansas Cancer Registry stopped 1969-1995 3 New Hampshire State Cancer Registry stopped 1986-1991 4 District of Columbia Cancer Registry stopped 1997 5 Wyoming Cancer Surveillance Program stopped 111996 6 Louisiana Tumor Registry stopped 1992 (passive collection) 7 Illinois State Cancer Registry stopped 111996 8 Missouri Cancer Registry passive collection since 1984 9 South Carolina Central Cancer Registry passive collection since 1996
Beginning Collection of Benign Tumor Data1 North Dakota Cancer Registry began collection 1997 2 Rhode Island Cancer Registry began collection 1998
Page 42
Endash
APPENDIX E
Codes for Primary Intracranial and Central Nervous System Tumors
Note For this report the designation of ldquoprimary intracranial and central nervous system tumorsrdquo includes thefollowing primary tumors of central nervous system sites as well as tumors of the pituitary and pinealglands All histology types within the topography codes are included in the designation of ldquoprimaryintracranial and CNS tumors The source for the topography codes is Percy C Van Holten V Muir Ceds International Classification of Diseases for Oncology Second Edition Geneva World Health Organization 1990
Intracranial tumors
Brain C710 Cerebrum C711 Frontal lobe C712 Temporal lobe C713 Parietal lobe C714 Occipital lobe C715 Ventricle NOSC716 Cerebellum NOS C717 Brain stem C718 Overlapping lesion of brain C719 Brain NOS
Meninges C700 Cerebral meninges C709 Meninges NOS
a
Cranial Nerves and other intracranial parts of the central nervous systemC722 Olfactory nerve C723 Optic nerve C724 Acoustic nerve C725 Cranial nerve NOS C728 Overlapping lesion of brain and central nervous system C729 Nervous system NOS
Other endrocrine glands and related structures C751 Pituitary gland C752 Craniopharyngeal duct C753 Pineal gland
Extracranial tumors
Spinal cord C720 Spinal cord C721 Cauda equina
Meninges C701 Spinal meninges
aNOS=Not Otherwise Specified
Page 43
Endash
DATA COLLECTION
OF PRIMARY
CENTRAL NERVOUS
SYSTEM TUMORS
Brain Tumor Histology Groupings
The following histology groupings were used for the primary intracranial and central nervoussystem tumors The source for the histology groupings is Central Brain Tumor Registry ofthe United States (CBTRUS) 1996 Statistics Report Table 4
WHOa HISTOLOGY GROUPINGS ICD-Ob MORPHOLOGY CODE
Diffuse astrocytoma (protoplasma fibrillary) 9410 9420 Anaplastic astrocytoma 9401 9411 Glioblastoma 9440 9441 9442 Pilocytic astrocytoma 9421 Unique astrocytoma variants 9383 9384 9424 Oligodendroglioma 9450 Anaplastic oligodendroglioma 9451 9460 Ependymomaanaplastic ependymoma 9391 9392 9393 Ependymoma variants 9394 Mixed glioma 9382 Astrocytoma NOSc 9400 Glioma malignant NOS 9380 Choroid plexus 9390 Neuroepithelial 9381 9423 9430 Benign neuronalglial neuronal and mixed 86801 8693 9490 9505 9506 Malignant neruonalglial neuronal and mixed 86803 9364 9490 9500 Pineal parenchymal 9360 9361 9362 Embryonalprimitivemedulloblastoma 8963 9470 9471 9472
9473 9501 9502 9503 9510
TUMORS OF NEUROEPITHELIAL TISSUE
TUMORS OF CRANIAL AND SPINAL NERVES Nerve sheath benign and malignant 9540 9550 9560 9570
TUMORS OF THE MENINGES Meningioma 9530 9531 9532 9533 9534 9537 9538 Other mesenchymal benign and malignant 8800 8801 8802 8803 8810 8830 8850 88618900
8910 8990 9133 9150 9240 9480 9481 9536 9539 Hemangioblastoma 9161 9535
LYMPHOMAS AND HEMOPOIETIC NEOPLASMS Lymphoma 9590 9591 9593 9594 9595 9630 9650 9652
9663 9670 9671 9672 9674 9675 9680 9681 9682 9684 9685 9686 9687 9690 9691 96939695 9696 9698 9702 9714 9723 9731 9766 9970
GERM CELL TUMORS Germ cell 8020 9060 9064 9070 9071 9080 9084 9085 9100
CYSTS AND TUMOR-LIKE LESIONS Cysts and heterotopias 9084
TUMORS OF THE SELLAR REGION Pituitary 8040 8l40 8l46 8260 8270 8271 8280
8281 8290 8300 8330 8323 8333 Craniopharyngioma 9350
Page 44
Endash
APPENDIX E
LOCAL EXTENSIONS FROM REGIONAL TUMORS Chordomachondrosarcoma 9370
UNCLASSIFIED TUMORS Hemangioma 9120 9121 9130 9131 Neoplasm benign 80000 8010 Neoplasm uncertain behavior 80001 80011 Neoplasm malignant 80003 80013 8002 8003 All other 8720 9580
aWHO = World Health OrganizationbICD-O = International Classification of Diseases for Oncology Second Edition 1990 cNOS=Not Otherwise Specified
Page 45
Endash
DATA COLLECTION
OF PRIMARY
CENTRAL NERVOUS
SYSTEM TUMORS
Endash
International Classification of Childhood Cancer (ICCC)
Diagnostic Group
ICD-Oa codes
Morphology Topography
I LEUKAEMIA
(a) Lymphoid leukaemia 9820-9827 9850
(b) Acute non-lymphocytic leukaemia 9840 9841 9861 9864 9866 9867 98919894 9910
(c) Chronic myeloid leukaemia 9863 9868
(d) Other specified leukaemias 9830 9842 9860 9862 9870-9890 9892 98939900 9930-9941
(e) Unspecified leukaemias 9800-9804
II LYMPHOMAS AND OTHER RETICULOENDOTHELIAL NEOPLASMS
(a) Hodgkinrsquos disease 9650-9667
(b) Non-Hodgkinrsquos lymphoma 9591-9595 9670-9686 9690-9714 9723
(c) Burkittrsquos lymphoma 9687
(d) Miscellaneous lymphoreticular neoplasms 9720 9731-9764
(e) Unspecified lymphomas 9590
III CENTRAL NERVOUS SYSTEM (CNS) ANDMISCELLANEOUS INTRACRANIAL AND
INTRASPINAL NEOPLASMSb
(a) Ependymomac 9383 9390-9394
(b) Astrocytoma 9380 C723
9381 9400-9441
(c) Primitive neuroectodermal tumours 9470-9473
(d) Other gliomasd 9380 C700-C722C724-C729
9382 9384
9442-9460 9481
APPENDIX E
Diagnostic Group
ICD-Oa codes
Morphology Topogragphy
III CNS AND MISCELLANEOUS INTRACRANIAL AND INTRASPINAL
NEOPLASMSb Continued
(e) Miscellaneous intracranial and intraspinalneoplasmsc
8270-8281 8300 9350-9362 9480 95059530-9539
(f) Unspecified intracranial and intraspinalneoplasmsc
8000-8004 C700-C729C751-C753
IV SYMPATHETIC NERVOUS SYSTEM TUMOURS
(a) Neuroblastoma and ganglioneuroblastoma 9490 9500
(b) Other sympathetic nervous system tumours 8680 8693-8710 9501-9504 9520-9523
aInternational Classification of Diseases for Oncology Second Edition World Health Organization 1990bGroup III excludes all lymphomas See group II cBehaviour codes 0 and 1 are included dBehaviour code 1 is included
Page 47
Endash
Comments and recommendations are welcome Should questions arise on how to use these
materials or for more information please contact
Centers for Disease Control and Prevention National Program of Cancer Registries
4770 Buford Hwy NE Mail Stop K-53
Atlanta GA 30042-3717
Voice Information System 1 (888) 842-6355 bull Fax (770) 488-4760
cancerinfocdcgov bull httpwwwcdcgovcancer
All materials are in the public domain and may be reproduced or copied without permission citation
to source however is appreciated
BACK COVER
(WHITE)
Spine(WHITE)
DATA COLLECTION OF PRIMARY CEN
TRAL NERVOUS SYSTEM
TUM
ORS 2004
National Program of Cancer Registries Training M
aterials

DATA COLLECTION
OF PRIMARY
CENTRAL NERVOUS
SYSTEM TUMORS
TABLE 8 NUMBER AND PERCENT OF MALIGNANT PRIMARY INTRACRANIAL AND
CENTRAL NERVOUS SYSTEM TUMORS BY HISTOLOGY GROUPINGS
WHO Histologya
Groupings CBTRUSb
Number () MCSSc
Number () NCDBd
Number () SEERe
Number ()
Neuroepithelial 6477 (874) 1689 (896) 39701 (858) 8676 (825)
Tumors of cranial and spinal nerves
12 (02) 3 (02) 108 (02) 25 (02)
Tumors of meninges
137 (18) 25 (13) 994 (21) 194 (18)
LymphomasHemopoietic
473 (64) 121 (64) 3492 (75) 1099 (105)
Germ cell 70 (09) 20 (11) 403 (09) 97 (09)
Cysts and tumor-like lesions
0 0 0 0
Tumors of sellar region
20 (03) 11 (06) 100 (02) 6 (01)
Local extensions 29 (04) 11 (06) 166 (04) 38 (04)
Unclassifiedunassigned tumorsf
195 (26) 4 (02) 1320 (29) 383 (36)
TOTAL 7413 (100) 1884 (100) 46284 (100) 10518 (100)
Note Reported data are incident cases from 1989-1994 except for CBTRUS data which are from 1990-1993
aRefer to the World Health Organization (WHO) histology groupings in Appendix CbCentral Brain Tumor Registry of the United States cMinnesota Cancer Surveillance System (microscopically confirmed cases only)dNational Cancer Data Base (limited to cases reported by hospitals that accessioned nonmalignant cases) f For MCSS unclassifiedunassigned tumors include one malignant and four nonmalignant histologies which were
not listed in the CBTRUS classification scheme For NCDB unclassifiedunassigned tumors include 319 cases(less than one half percent) which had histologies not assigned by CBTRUS to any other category For SEERunclassifiedunassigned tumors include all malignant histologies occurring in the brainCNS which could not beclassified in one of the above categories based on their 4-digit histologic type
Page 36
Endash
APPENDIX E
TABLE 9 NUMBER AND PERCENT OF PRIMARY INTRACRANIAL AND CENTRAL NERVOUS SYSTEM TUMORS OF BENIGN AND UNCERTAIN BEHAVIOR
BY HISTOLOGY GROUPINGS
WHO Histologya
Groupings CBTRUSb
Number () MCSSc
Number () NCDBd
Number () SEERe
Number ()
Neuroepithelial 275 (43) 91 (46) 1064 (46) NA
Tumors of cranial and spinal nerves
980 (153) 397 (202) 2618 (113) NA
Tumors of meninges
3509 (548) 941 (480) 13667 (590) NA
LymphomasHemopoietic
3 (lt01) 0 7 (lt01) NA
Germ cell 4 (lt01) 1 (01) 25 (01) NA
Cysts and tumor-like lesions
15 (02) 3 (02) 34 (01) NA
Tumors of sellar region
1444 (226) 510 (260) 4749 (205) NA
Local extensions 0 0 0 NA
Unclassifiedunassigned tumorsf
171 (27) 18 (09) 1011 (44) NA
TOTAL 6401 (100) 1961 (100) 23175 (100) NA
Note Reported data are incident cases from 1989-1994 except for CBTRUS which is 1990-1993
aRefer to the World Health Organization (WHO) histology groupings in Appendix CbCentral Brain Tumor Registry of the United States c Minnesota Cancer Surveillance System (microscopically confirmed cases only) dNational Cancer Data Base (limited to cases reported by hospitals that accessioned nonmalignant cases) eSurvival Epidemiology and End Results Program (malignant cases only)dFor MCSS unclassifiedunassigned tumors include one malignant and four nonmalignant histologies which werenot listed in the CBTRUS classification scheme For NCDB unclassifiedunassigned tumors include 319 cases(less than one half percent) which had histologies not assigned by CBTRUS to any other category For SEERunclassifiedunassigned tumors include all malignant histologies occurring in the brainCNS which could not beclassified in one of the above categories based on their 4-digit histologic typeNA = Not applicable
Page 37
Endash
DATA COLLECTION
OF PRIMARY
CENTRAL NERVOUS
SYSTEM TUMORS
TABLE 10 METHOD OF CASE FINDING FOR PRIMARY INTRACRANIAL AND CENTRAL NERVOUS SYSTEM TUMORS BY TUMOR BEHAVIOR AND LOCATION MINNESOTA 1989-1994
Behavior Tumor Locationa
Number of Cases
Percent Found byRoutine
Reporting
Percent Found by Special Efforts
Malignant Brain Cerebral meninges
Pituitarycranio duct pineal Other intracranial
18841746 23 33
22
961 965 957 939
864
39 35 43 61
136 Extracranial 60 883 117 Benign Brain
1787 99
788 838
212 162
Cerebral meninges Pituitarycranio duct
pineal Other intracranial
807 458
263
843 740
779
157 260
221 Extracranial 160 631 369 Uncertain 174 856 144 Brain 79 823 177 Cerebral meninges Pituitarycraniopharyn- geal ductpineal Other intracranial
8 60
2
875 850
1000
125 150
00 Extracranial 25 960 40
TOTAL 3845 876 124
aRefer to the site codes in Appendix B
Page 38
Endash
1989 1990 1991 1992 1993 1994
TOTAL
APPENDIX E TABLE 11 METHOD OF CASE FINDING FOR INTRACRANIALa TUMORS BY DIAGNOSIS YEAR MINNESOTA 1989-1994
DiagnosisYear
Number of
Cases
Percent Found byRoutine
Reporting
Percent Found by
Special Efforts
571 837 163 616 865 135 586 913 87 602 899 101
633 872 128 592 929 71
3600 886 114
aIncludes the brain cerebral meninges pituitary gland pineal gland and otherintracranial tumors (refer to the site codes in Appendix B)
Page 39
Endash
DATA COLLECTION
OF PRIMARY
CENTRAL NERVOUS
SYSTEM TUMORS
TABLE 12 METHOD OF CASE FINDING FOR NONMALIGNANT INTRACRANIALa TUMORS BY TYPE OF FACILITY MINNESOTA 1989-1994
Type of Facility Number of Tumors Percent Found byRoutine
Reporting
Percent Found by Special Efforts
Registry at facility No registry at facility
1451325
859 569
141 431
TOTAL 1776 806 194
aIncludes tumors with benign or uncertain behavior that involve the brain cerebral meningespituitary gland pineal gland or other intracranial sites (refer to the site codes in Appendix B)
TABLE 13 REPORTING METHOD AND SOURCE OF CASE FINDING FOR NON- MALIGNANT INTRACRANIALa TUMORS DIAGNOSED IN HOSPITALS WITH A TUMOR REGISTRY MINNESOTA 1989-1994
Reporting Method Number of Tumors Percent Found byRoutine
Reporting
Percent Found by
Special Efforts
Registry-reportedLaboratory-reported
1226225
925 502
75 498
TOTAL 1451 859 141
aIncludes tumors with benign or uncertain behavior that involve the brain cerebral meningespituitary gland pineal gland or other intracranial sites (refer to the site codes in Appendix B)
Page 40
Endash0
APPENDIX E TABLE 14 HOSPITAL REGISTRY ACCESSIONING OF MALIGNANT AND NON-
MALIGNANT PRIMARY INTRACRANIAL AND CENTRAL NERVOUS SYSTEM TUMORS NCDB 1989-1994
TUMOR Totalb
BEHAVIOR Malignant c Nonmalignantd
Tumor Locationa HospitalsReporting
Number ()
Hospitals Reporting
Number ()
Hospitals Reporting
Number ()
Intracranial 1542 (100) 1526 (100) 900 (99)
Brain 1527 (99) 1519 (gt99) 754 (83)
Meninges 740 (48) 390 (26) 613 (67)
Pituitaryglandcraniopharyn-
geal duct
602 (39) 168 (11) 538 (59)
Pineal gland 319 (21) 277 (18) 79 (9)
Other central nervous system including cranial
nerves
648 (42) 545 (36) 299 (33)
Extracranial 812 (53) 708 (46) 410 (45)
Spinal cord 760 (49) 692 (45) 311 (34)
Spinal meninges 299 (19) 72 (5) 258 (28)
TOTAL Hospitals 1542 (100) 1526 (100) 913 (100)
Note The number of hospitals in each of the second third and fourth columns is the number that submittedreports to the NCDB for any intracranial and central nervous system tumors for the respective malignancystatus Not all hospitals submitted reports for each year during the study period (1989-1994)
aRefer to the site codes in Appendix B bBehavior codes = 0 1 3 cBehavior code = 3 dBehavior codes = 0 1
Page 41
Endash
DATA COLLECTION
OF PRIMARY
CENTRAL NERVOUS
SYSTEM TUMORS
Texas Cancer Registry
1997 CBTRUS State Survey of Benign Brain Tumor Data Collection
State Collection Status
Currently Collecting Benign Tumor Data1 Arizona Cancer Registry since 1981 2 Colorado Central Cancer Registry since 1988 3 Connecticut Tumor Registry since 1965 4 Idaho Cancer Data Registry since 1970 5 Maine Cancer Registry since 1983 6 Massachusetts Cancer Registry since 1982 7 Minnesota Cancer Surveillance System since 1988 8 Montana Central Tumor Registry since 1979 9 New York State Cancer Registry since 1988
10 North Carolina Central Cancer Registry since 1990 11 Utah Cancer Registry since 1966 12 Virginia Cancer Registry since 1994 13 Delaware State Cancer Registry14 Washington State Cancer Registry since 1992 15 passive collection 1979-1994
active collection since 1995
Stopped or Passive Collection of Benign Tumor Data1 New Jersey State Cancer Registry stopped 1979-1995 2 Kansas Cancer Registry stopped 1969-1995 3 New Hampshire State Cancer Registry stopped 1986-1991 4 District of Columbia Cancer Registry stopped 1997 5 Wyoming Cancer Surveillance Program stopped 111996 6 Louisiana Tumor Registry stopped 1992 (passive collection) 7 Illinois State Cancer Registry stopped 111996 8 Missouri Cancer Registry passive collection since 1984 9 South Carolina Central Cancer Registry passive collection since 1996
Beginning Collection of Benign Tumor Data1 North Dakota Cancer Registry began collection 1997 2 Rhode Island Cancer Registry began collection 1998
Page 42
Endash
APPENDIX E
Codes for Primary Intracranial and Central Nervous System Tumors
Note For this report the designation of ldquoprimary intracranial and central nervous system tumorsrdquo includes thefollowing primary tumors of central nervous system sites as well as tumors of the pituitary and pinealglands All histology types within the topography codes are included in the designation of ldquoprimaryintracranial and CNS tumors The source for the topography codes is Percy C Van Holten V Muir Ceds International Classification of Diseases for Oncology Second Edition Geneva World Health Organization 1990
Intracranial tumors
Brain C710 Cerebrum C711 Frontal lobe C712 Temporal lobe C713 Parietal lobe C714 Occipital lobe C715 Ventricle NOSC716 Cerebellum NOS C717 Brain stem C718 Overlapping lesion of brain C719 Brain NOS
Meninges C700 Cerebral meninges C709 Meninges NOS
a
Cranial Nerves and other intracranial parts of the central nervous systemC722 Olfactory nerve C723 Optic nerve C724 Acoustic nerve C725 Cranial nerve NOS C728 Overlapping lesion of brain and central nervous system C729 Nervous system NOS
Other endrocrine glands and related structures C751 Pituitary gland C752 Craniopharyngeal duct C753 Pineal gland
Extracranial tumors
Spinal cord C720 Spinal cord C721 Cauda equina
Meninges C701 Spinal meninges
aNOS=Not Otherwise Specified
Page 43
Endash
DATA COLLECTION
OF PRIMARY
CENTRAL NERVOUS
SYSTEM TUMORS
Brain Tumor Histology Groupings
The following histology groupings were used for the primary intracranial and central nervoussystem tumors The source for the histology groupings is Central Brain Tumor Registry ofthe United States (CBTRUS) 1996 Statistics Report Table 4
WHOa HISTOLOGY GROUPINGS ICD-Ob MORPHOLOGY CODE
Diffuse astrocytoma (protoplasma fibrillary) 9410 9420 Anaplastic astrocytoma 9401 9411 Glioblastoma 9440 9441 9442 Pilocytic astrocytoma 9421 Unique astrocytoma variants 9383 9384 9424 Oligodendroglioma 9450 Anaplastic oligodendroglioma 9451 9460 Ependymomaanaplastic ependymoma 9391 9392 9393 Ependymoma variants 9394 Mixed glioma 9382 Astrocytoma NOSc 9400 Glioma malignant NOS 9380 Choroid plexus 9390 Neuroepithelial 9381 9423 9430 Benign neuronalglial neuronal and mixed 86801 8693 9490 9505 9506 Malignant neruonalglial neuronal and mixed 86803 9364 9490 9500 Pineal parenchymal 9360 9361 9362 Embryonalprimitivemedulloblastoma 8963 9470 9471 9472
9473 9501 9502 9503 9510
TUMORS OF NEUROEPITHELIAL TISSUE
TUMORS OF CRANIAL AND SPINAL NERVES Nerve sheath benign and malignant 9540 9550 9560 9570
TUMORS OF THE MENINGES Meningioma 9530 9531 9532 9533 9534 9537 9538 Other mesenchymal benign and malignant 8800 8801 8802 8803 8810 8830 8850 88618900
8910 8990 9133 9150 9240 9480 9481 9536 9539 Hemangioblastoma 9161 9535
LYMPHOMAS AND HEMOPOIETIC NEOPLASMS Lymphoma 9590 9591 9593 9594 9595 9630 9650 9652
9663 9670 9671 9672 9674 9675 9680 9681 9682 9684 9685 9686 9687 9690 9691 96939695 9696 9698 9702 9714 9723 9731 9766 9970
GERM CELL TUMORS Germ cell 8020 9060 9064 9070 9071 9080 9084 9085 9100
CYSTS AND TUMOR-LIKE LESIONS Cysts and heterotopias 9084
TUMORS OF THE SELLAR REGION Pituitary 8040 8l40 8l46 8260 8270 8271 8280
8281 8290 8300 8330 8323 8333 Craniopharyngioma 9350
Page 44
Endash
APPENDIX E
LOCAL EXTENSIONS FROM REGIONAL TUMORS Chordomachondrosarcoma 9370
UNCLASSIFIED TUMORS Hemangioma 9120 9121 9130 9131 Neoplasm benign 80000 8010 Neoplasm uncertain behavior 80001 80011 Neoplasm malignant 80003 80013 8002 8003 All other 8720 9580
aWHO = World Health OrganizationbICD-O = International Classification of Diseases for Oncology Second Edition 1990 cNOS=Not Otherwise Specified
Page 45
Endash
DATA COLLECTION
OF PRIMARY
CENTRAL NERVOUS
SYSTEM TUMORS
Endash
International Classification of Childhood Cancer (ICCC)
Diagnostic Group
ICD-Oa codes
Morphology Topography
I LEUKAEMIA
(a) Lymphoid leukaemia 9820-9827 9850
(b) Acute non-lymphocytic leukaemia 9840 9841 9861 9864 9866 9867 98919894 9910
(c) Chronic myeloid leukaemia 9863 9868
(d) Other specified leukaemias 9830 9842 9860 9862 9870-9890 9892 98939900 9930-9941
(e) Unspecified leukaemias 9800-9804
II LYMPHOMAS AND OTHER RETICULOENDOTHELIAL NEOPLASMS
(a) Hodgkinrsquos disease 9650-9667
(b) Non-Hodgkinrsquos lymphoma 9591-9595 9670-9686 9690-9714 9723
(c) Burkittrsquos lymphoma 9687
(d) Miscellaneous lymphoreticular neoplasms 9720 9731-9764
(e) Unspecified lymphomas 9590
III CENTRAL NERVOUS SYSTEM (CNS) ANDMISCELLANEOUS INTRACRANIAL AND
INTRASPINAL NEOPLASMSb
(a) Ependymomac 9383 9390-9394
(b) Astrocytoma 9380 C723
9381 9400-9441
(c) Primitive neuroectodermal tumours 9470-9473
(d) Other gliomasd 9380 C700-C722C724-C729
9382 9384
9442-9460 9481
APPENDIX E
Diagnostic Group
ICD-Oa codes
Morphology Topogragphy
III CNS AND MISCELLANEOUS INTRACRANIAL AND INTRASPINAL
NEOPLASMSb Continued
(e) Miscellaneous intracranial and intraspinalneoplasmsc
8270-8281 8300 9350-9362 9480 95059530-9539
(f) Unspecified intracranial and intraspinalneoplasmsc
8000-8004 C700-C729C751-C753
IV SYMPATHETIC NERVOUS SYSTEM TUMOURS
(a) Neuroblastoma and ganglioneuroblastoma 9490 9500
(b) Other sympathetic nervous system tumours 8680 8693-8710 9501-9504 9520-9523
aInternational Classification of Diseases for Oncology Second Edition World Health Organization 1990bGroup III excludes all lymphomas See group II cBehaviour codes 0 and 1 are included dBehaviour code 1 is included
Page 47
Endash
Comments and recommendations are welcome Should questions arise on how to use these
materials or for more information please contact
Centers for Disease Control and Prevention National Program of Cancer Registries
4770 Buford Hwy NE Mail Stop K-53
Atlanta GA 30042-3717
Voice Information System 1 (888) 842-6355 bull Fax (770) 488-4760
cancerinfocdcgov bull httpwwwcdcgovcancer
All materials are in the public domain and may be reproduced or copied without permission citation
to source however is appreciated
BACK COVER
(WHITE)
Spine(WHITE)
DATA COLLECTION OF PRIMARY CEN
TRAL NERVOUS SYSTEM
TUM
ORS 2004
National Program of Cancer Registries Training M
aterials

APPENDIX E
TABLE 9 NUMBER AND PERCENT OF PRIMARY INTRACRANIAL AND CENTRAL NERVOUS SYSTEM TUMORS OF BENIGN AND UNCERTAIN BEHAVIOR
BY HISTOLOGY GROUPINGS
WHO Histologya
Groupings CBTRUSb
Number () MCSSc
Number () NCDBd
Number () SEERe
Number ()
Neuroepithelial 275 (43) 91 (46) 1064 (46) NA
Tumors of cranial and spinal nerves
980 (153) 397 (202) 2618 (113) NA
Tumors of meninges
3509 (548) 941 (480) 13667 (590) NA
LymphomasHemopoietic
3 (lt01) 0 7 (lt01) NA
Germ cell 4 (lt01) 1 (01) 25 (01) NA
Cysts and tumor-like lesions
15 (02) 3 (02) 34 (01) NA
Tumors of sellar region
1444 (226) 510 (260) 4749 (205) NA
Local extensions 0 0 0 NA
Unclassifiedunassigned tumorsf
171 (27) 18 (09) 1011 (44) NA
TOTAL 6401 (100) 1961 (100) 23175 (100) NA
Note Reported data are incident cases from 1989-1994 except for CBTRUS which is 1990-1993
aRefer to the World Health Organization (WHO) histology groupings in Appendix CbCentral Brain Tumor Registry of the United States c Minnesota Cancer Surveillance System (microscopically confirmed cases only) dNational Cancer Data Base (limited to cases reported by hospitals that accessioned nonmalignant cases) eSurvival Epidemiology and End Results Program (malignant cases only)dFor MCSS unclassifiedunassigned tumors include one malignant and four nonmalignant histologies which werenot listed in the CBTRUS classification scheme For NCDB unclassifiedunassigned tumors include 319 cases(less than one half percent) which had histologies not assigned by CBTRUS to any other category For SEERunclassifiedunassigned tumors include all malignant histologies occurring in the brainCNS which could not beclassified in one of the above categories based on their 4-digit histologic typeNA = Not applicable
Page 37
Endash
DATA COLLECTION
OF PRIMARY
CENTRAL NERVOUS
SYSTEM TUMORS
TABLE 10 METHOD OF CASE FINDING FOR PRIMARY INTRACRANIAL AND CENTRAL NERVOUS SYSTEM TUMORS BY TUMOR BEHAVIOR AND LOCATION MINNESOTA 1989-1994
Behavior Tumor Locationa
Number of Cases
Percent Found byRoutine
Reporting
Percent Found by Special Efforts
Malignant Brain Cerebral meninges
Pituitarycranio duct pineal Other intracranial
18841746 23 33
22
961 965 957 939
864
39 35 43 61
136 Extracranial 60 883 117 Benign Brain
1787 99
788 838
212 162
Cerebral meninges Pituitarycranio duct
pineal Other intracranial
807 458
263
843 740
779
157 260
221 Extracranial 160 631 369 Uncertain 174 856 144 Brain 79 823 177 Cerebral meninges Pituitarycraniopharyn- geal ductpineal Other intracranial
8 60
2
875 850
1000
125 150
00 Extracranial 25 960 40
TOTAL 3845 876 124
aRefer to the site codes in Appendix B
Page 38
Endash
1989 1990 1991 1992 1993 1994
TOTAL
APPENDIX E TABLE 11 METHOD OF CASE FINDING FOR INTRACRANIALa TUMORS BY DIAGNOSIS YEAR MINNESOTA 1989-1994
DiagnosisYear
Number of
Cases
Percent Found byRoutine
Reporting
Percent Found by
Special Efforts
571 837 163 616 865 135 586 913 87 602 899 101
633 872 128 592 929 71
3600 886 114
aIncludes the brain cerebral meninges pituitary gland pineal gland and otherintracranial tumors (refer to the site codes in Appendix B)
Page 39
Endash
DATA COLLECTION
OF PRIMARY
CENTRAL NERVOUS
SYSTEM TUMORS
TABLE 12 METHOD OF CASE FINDING FOR NONMALIGNANT INTRACRANIALa TUMORS BY TYPE OF FACILITY MINNESOTA 1989-1994
Type of Facility Number of Tumors Percent Found byRoutine
Reporting
Percent Found by Special Efforts
Registry at facility No registry at facility
1451325
859 569
141 431
TOTAL 1776 806 194
aIncludes tumors with benign or uncertain behavior that involve the brain cerebral meningespituitary gland pineal gland or other intracranial sites (refer to the site codes in Appendix B)
TABLE 13 REPORTING METHOD AND SOURCE OF CASE FINDING FOR NON- MALIGNANT INTRACRANIALa TUMORS DIAGNOSED IN HOSPITALS WITH A TUMOR REGISTRY MINNESOTA 1989-1994
Reporting Method Number of Tumors Percent Found byRoutine
Reporting
Percent Found by
Special Efforts
Registry-reportedLaboratory-reported
1226225
925 502
75 498
TOTAL 1451 859 141
aIncludes tumors with benign or uncertain behavior that involve the brain cerebral meningespituitary gland pineal gland or other intracranial sites (refer to the site codes in Appendix B)
Page 40
Endash0
APPENDIX E TABLE 14 HOSPITAL REGISTRY ACCESSIONING OF MALIGNANT AND NON-
MALIGNANT PRIMARY INTRACRANIAL AND CENTRAL NERVOUS SYSTEM TUMORS NCDB 1989-1994
TUMOR Totalb
BEHAVIOR Malignant c Nonmalignantd
Tumor Locationa HospitalsReporting
Number ()
Hospitals Reporting
Number ()
Hospitals Reporting
Number ()
Intracranial 1542 (100) 1526 (100) 900 (99)
Brain 1527 (99) 1519 (gt99) 754 (83)
Meninges 740 (48) 390 (26) 613 (67)
Pituitaryglandcraniopharyn-
geal duct
602 (39) 168 (11) 538 (59)
Pineal gland 319 (21) 277 (18) 79 (9)
Other central nervous system including cranial
nerves
648 (42) 545 (36) 299 (33)
Extracranial 812 (53) 708 (46) 410 (45)
Spinal cord 760 (49) 692 (45) 311 (34)
Spinal meninges 299 (19) 72 (5) 258 (28)
TOTAL Hospitals 1542 (100) 1526 (100) 913 (100)
Note The number of hospitals in each of the second third and fourth columns is the number that submittedreports to the NCDB for any intracranial and central nervous system tumors for the respective malignancystatus Not all hospitals submitted reports for each year during the study period (1989-1994)
aRefer to the site codes in Appendix B bBehavior codes = 0 1 3 cBehavior code = 3 dBehavior codes = 0 1
Page 41
Endash
DATA COLLECTION
OF PRIMARY
CENTRAL NERVOUS
SYSTEM TUMORS
Texas Cancer Registry
1997 CBTRUS State Survey of Benign Brain Tumor Data Collection
State Collection Status
Currently Collecting Benign Tumor Data1 Arizona Cancer Registry since 1981 2 Colorado Central Cancer Registry since 1988 3 Connecticut Tumor Registry since 1965 4 Idaho Cancer Data Registry since 1970 5 Maine Cancer Registry since 1983 6 Massachusetts Cancer Registry since 1982 7 Minnesota Cancer Surveillance System since 1988 8 Montana Central Tumor Registry since 1979 9 New York State Cancer Registry since 1988
10 North Carolina Central Cancer Registry since 1990 11 Utah Cancer Registry since 1966 12 Virginia Cancer Registry since 1994 13 Delaware State Cancer Registry14 Washington State Cancer Registry since 1992 15 passive collection 1979-1994
active collection since 1995
Stopped or Passive Collection of Benign Tumor Data1 New Jersey State Cancer Registry stopped 1979-1995 2 Kansas Cancer Registry stopped 1969-1995 3 New Hampshire State Cancer Registry stopped 1986-1991 4 District of Columbia Cancer Registry stopped 1997 5 Wyoming Cancer Surveillance Program stopped 111996 6 Louisiana Tumor Registry stopped 1992 (passive collection) 7 Illinois State Cancer Registry stopped 111996 8 Missouri Cancer Registry passive collection since 1984 9 South Carolina Central Cancer Registry passive collection since 1996
Beginning Collection of Benign Tumor Data1 North Dakota Cancer Registry began collection 1997 2 Rhode Island Cancer Registry began collection 1998
Page 42
Endash
APPENDIX E
Codes for Primary Intracranial and Central Nervous System Tumors
Note For this report the designation of ldquoprimary intracranial and central nervous system tumorsrdquo includes thefollowing primary tumors of central nervous system sites as well as tumors of the pituitary and pinealglands All histology types within the topography codes are included in the designation of ldquoprimaryintracranial and CNS tumors The source for the topography codes is Percy C Van Holten V Muir Ceds International Classification of Diseases for Oncology Second Edition Geneva World Health Organization 1990
Intracranial tumors
Brain C710 Cerebrum C711 Frontal lobe C712 Temporal lobe C713 Parietal lobe C714 Occipital lobe C715 Ventricle NOSC716 Cerebellum NOS C717 Brain stem C718 Overlapping lesion of brain C719 Brain NOS
Meninges C700 Cerebral meninges C709 Meninges NOS
a
Cranial Nerves and other intracranial parts of the central nervous systemC722 Olfactory nerve C723 Optic nerve C724 Acoustic nerve C725 Cranial nerve NOS C728 Overlapping lesion of brain and central nervous system C729 Nervous system NOS
Other endrocrine glands and related structures C751 Pituitary gland C752 Craniopharyngeal duct C753 Pineal gland
Extracranial tumors
Spinal cord C720 Spinal cord C721 Cauda equina
Meninges C701 Spinal meninges
aNOS=Not Otherwise Specified
Page 43
Endash
DATA COLLECTION
OF PRIMARY
CENTRAL NERVOUS
SYSTEM TUMORS
Brain Tumor Histology Groupings
The following histology groupings were used for the primary intracranial and central nervoussystem tumors The source for the histology groupings is Central Brain Tumor Registry ofthe United States (CBTRUS) 1996 Statistics Report Table 4
WHOa HISTOLOGY GROUPINGS ICD-Ob MORPHOLOGY CODE
Diffuse astrocytoma (protoplasma fibrillary) 9410 9420 Anaplastic astrocytoma 9401 9411 Glioblastoma 9440 9441 9442 Pilocytic astrocytoma 9421 Unique astrocytoma variants 9383 9384 9424 Oligodendroglioma 9450 Anaplastic oligodendroglioma 9451 9460 Ependymomaanaplastic ependymoma 9391 9392 9393 Ependymoma variants 9394 Mixed glioma 9382 Astrocytoma NOSc 9400 Glioma malignant NOS 9380 Choroid plexus 9390 Neuroepithelial 9381 9423 9430 Benign neuronalglial neuronal and mixed 86801 8693 9490 9505 9506 Malignant neruonalglial neuronal and mixed 86803 9364 9490 9500 Pineal parenchymal 9360 9361 9362 Embryonalprimitivemedulloblastoma 8963 9470 9471 9472
9473 9501 9502 9503 9510
TUMORS OF NEUROEPITHELIAL TISSUE
TUMORS OF CRANIAL AND SPINAL NERVES Nerve sheath benign and malignant 9540 9550 9560 9570
TUMORS OF THE MENINGES Meningioma 9530 9531 9532 9533 9534 9537 9538 Other mesenchymal benign and malignant 8800 8801 8802 8803 8810 8830 8850 88618900
8910 8990 9133 9150 9240 9480 9481 9536 9539 Hemangioblastoma 9161 9535
LYMPHOMAS AND HEMOPOIETIC NEOPLASMS Lymphoma 9590 9591 9593 9594 9595 9630 9650 9652
9663 9670 9671 9672 9674 9675 9680 9681 9682 9684 9685 9686 9687 9690 9691 96939695 9696 9698 9702 9714 9723 9731 9766 9970
GERM CELL TUMORS Germ cell 8020 9060 9064 9070 9071 9080 9084 9085 9100
CYSTS AND TUMOR-LIKE LESIONS Cysts and heterotopias 9084
TUMORS OF THE SELLAR REGION Pituitary 8040 8l40 8l46 8260 8270 8271 8280
8281 8290 8300 8330 8323 8333 Craniopharyngioma 9350
Page 44
Endash
APPENDIX E
LOCAL EXTENSIONS FROM REGIONAL TUMORS Chordomachondrosarcoma 9370
UNCLASSIFIED TUMORS Hemangioma 9120 9121 9130 9131 Neoplasm benign 80000 8010 Neoplasm uncertain behavior 80001 80011 Neoplasm malignant 80003 80013 8002 8003 All other 8720 9580
aWHO = World Health OrganizationbICD-O = International Classification of Diseases for Oncology Second Edition 1990 cNOS=Not Otherwise Specified
Page 45
Endash
DATA COLLECTION
OF PRIMARY
CENTRAL NERVOUS
SYSTEM TUMORS
Endash
International Classification of Childhood Cancer (ICCC)
Diagnostic Group
ICD-Oa codes
Morphology Topography
I LEUKAEMIA
(a) Lymphoid leukaemia 9820-9827 9850
(b) Acute non-lymphocytic leukaemia 9840 9841 9861 9864 9866 9867 98919894 9910
(c) Chronic myeloid leukaemia 9863 9868
(d) Other specified leukaemias 9830 9842 9860 9862 9870-9890 9892 98939900 9930-9941
(e) Unspecified leukaemias 9800-9804
II LYMPHOMAS AND OTHER RETICULOENDOTHELIAL NEOPLASMS
(a) Hodgkinrsquos disease 9650-9667
(b) Non-Hodgkinrsquos lymphoma 9591-9595 9670-9686 9690-9714 9723
(c) Burkittrsquos lymphoma 9687
(d) Miscellaneous lymphoreticular neoplasms 9720 9731-9764
(e) Unspecified lymphomas 9590
III CENTRAL NERVOUS SYSTEM (CNS) ANDMISCELLANEOUS INTRACRANIAL AND
INTRASPINAL NEOPLASMSb
(a) Ependymomac 9383 9390-9394
(b) Astrocytoma 9380 C723
9381 9400-9441
(c) Primitive neuroectodermal tumours 9470-9473
(d) Other gliomasd 9380 C700-C722C724-C729
9382 9384
9442-9460 9481
APPENDIX E
Diagnostic Group
ICD-Oa codes
Morphology Topogragphy
III CNS AND MISCELLANEOUS INTRACRANIAL AND INTRASPINAL
NEOPLASMSb Continued
(e) Miscellaneous intracranial and intraspinalneoplasmsc
8270-8281 8300 9350-9362 9480 95059530-9539
(f) Unspecified intracranial and intraspinalneoplasmsc
8000-8004 C700-C729C751-C753
IV SYMPATHETIC NERVOUS SYSTEM TUMOURS
(a) Neuroblastoma and ganglioneuroblastoma 9490 9500
(b) Other sympathetic nervous system tumours 8680 8693-8710 9501-9504 9520-9523
aInternational Classification of Diseases for Oncology Second Edition World Health Organization 1990bGroup III excludes all lymphomas See group II cBehaviour codes 0 and 1 are included dBehaviour code 1 is included
Page 47
Endash
Comments and recommendations are welcome Should questions arise on how to use these
materials or for more information please contact
Centers for Disease Control and Prevention National Program of Cancer Registries
4770 Buford Hwy NE Mail Stop K-53
Atlanta GA 30042-3717
Voice Information System 1 (888) 842-6355 bull Fax (770) 488-4760
cancerinfocdcgov bull httpwwwcdcgovcancer
All materials are in the public domain and may be reproduced or copied without permission citation
to source however is appreciated
BACK COVER
(WHITE)
Spine(WHITE)
DATA COLLECTION OF PRIMARY CEN
TRAL NERVOUS SYSTEM
TUM
ORS 2004
National Program of Cancer Registries Training M
aterials

DATA COLLECTION
OF PRIMARY
CENTRAL NERVOUS
SYSTEM TUMORS
TABLE 10 METHOD OF CASE FINDING FOR PRIMARY INTRACRANIAL AND CENTRAL NERVOUS SYSTEM TUMORS BY TUMOR BEHAVIOR AND LOCATION MINNESOTA 1989-1994
Behavior Tumor Locationa
Number of Cases
Percent Found byRoutine
Reporting
Percent Found by Special Efforts
Malignant Brain Cerebral meninges
Pituitarycranio duct pineal Other intracranial
18841746 23 33
22
961 965 957 939
864
39 35 43 61
136 Extracranial 60 883 117 Benign Brain
1787 99
788 838
212 162
Cerebral meninges Pituitarycranio duct
pineal Other intracranial
807 458
263
843 740
779
157 260
221 Extracranial 160 631 369 Uncertain 174 856 144 Brain 79 823 177 Cerebral meninges Pituitarycraniopharyn- geal ductpineal Other intracranial
8 60
2
875 850
1000
125 150
00 Extracranial 25 960 40
TOTAL 3845 876 124
aRefer to the site codes in Appendix B
Page 38
Endash
1989 1990 1991 1992 1993 1994
TOTAL
APPENDIX E TABLE 11 METHOD OF CASE FINDING FOR INTRACRANIALa TUMORS BY DIAGNOSIS YEAR MINNESOTA 1989-1994
DiagnosisYear
Number of
Cases
Percent Found byRoutine
Reporting
Percent Found by
Special Efforts
571 837 163 616 865 135 586 913 87 602 899 101
633 872 128 592 929 71
3600 886 114
aIncludes the brain cerebral meninges pituitary gland pineal gland and otherintracranial tumors (refer to the site codes in Appendix B)
Page 39
Endash
DATA COLLECTION
OF PRIMARY
CENTRAL NERVOUS
SYSTEM TUMORS
TABLE 12 METHOD OF CASE FINDING FOR NONMALIGNANT INTRACRANIALa TUMORS BY TYPE OF FACILITY MINNESOTA 1989-1994
Type of Facility Number of Tumors Percent Found byRoutine
Reporting
Percent Found by Special Efforts
Registry at facility No registry at facility
1451325
859 569
141 431
TOTAL 1776 806 194
aIncludes tumors with benign or uncertain behavior that involve the brain cerebral meningespituitary gland pineal gland or other intracranial sites (refer to the site codes in Appendix B)
TABLE 13 REPORTING METHOD AND SOURCE OF CASE FINDING FOR NON- MALIGNANT INTRACRANIALa TUMORS DIAGNOSED IN HOSPITALS WITH A TUMOR REGISTRY MINNESOTA 1989-1994
Reporting Method Number of Tumors Percent Found byRoutine
Reporting
Percent Found by
Special Efforts
Registry-reportedLaboratory-reported
1226225
925 502
75 498
TOTAL 1451 859 141
aIncludes tumors with benign or uncertain behavior that involve the brain cerebral meningespituitary gland pineal gland or other intracranial sites (refer to the site codes in Appendix B)
Page 40
Endash0
APPENDIX E TABLE 14 HOSPITAL REGISTRY ACCESSIONING OF MALIGNANT AND NON-
MALIGNANT PRIMARY INTRACRANIAL AND CENTRAL NERVOUS SYSTEM TUMORS NCDB 1989-1994
TUMOR Totalb
BEHAVIOR Malignant c Nonmalignantd
Tumor Locationa HospitalsReporting
Number ()
Hospitals Reporting
Number ()
Hospitals Reporting
Number ()
Intracranial 1542 (100) 1526 (100) 900 (99)
Brain 1527 (99) 1519 (gt99) 754 (83)
Meninges 740 (48) 390 (26) 613 (67)
Pituitaryglandcraniopharyn-
geal duct
602 (39) 168 (11) 538 (59)
Pineal gland 319 (21) 277 (18) 79 (9)
Other central nervous system including cranial
nerves
648 (42) 545 (36) 299 (33)
Extracranial 812 (53) 708 (46) 410 (45)
Spinal cord 760 (49) 692 (45) 311 (34)
Spinal meninges 299 (19) 72 (5) 258 (28)
TOTAL Hospitals 1542 (100) 1526 (100) 913 (100)
Note The number of hospitals in each of the second third and fourth columns is the number that submittedreports to the NCDB for any intracranial and central nervous system tumors for the respective malignancystatus Not all hospitals submitted reports for each year during the study period (1989-1994)
aRefer to the site codes in Appendix B bBehavior codes = 0 1 3 cBehavior code = 3 dBehavior codes = 0 1
Page 41
Endash
DATA COLLECTION
OF PRIMARY
CENTRAL NERVOUS
SYSTEM TUMORS
Texas Cancer Registry
1997 CBTRUS State Survey of Benign Brain Tumor Data Collection
State Collection Status
Currently Collecting Benign Tumor Data1 Arizona Cancer Registry since 1981 2 Colorado Central Cancer Registry since 1988 3 Connecticut Tumor Registry since 1965 4 Idaho Cancer Data Registry since 1970 5 Maine Cancer Registry since 1983 6 Massachusetts Cancer Registry since 1982 7 Minnesota Cancer Surveillance System since 1988 8 Montana Central Tumor Registry since 1979 9 New York State Cancer Registry since 1988
10 North Carolina Central Cancer Registry since 1990 11 Utah Cancer Registry since 1966 12 Virginia Cancer Registry since 1994 13 Delaware State Cancer Registry14 Washington State Cancer Registry since 1992 15 passive collection 1979-1994
active collection since 1995
Stopped or Passive Collection of Benign Tumor Data1 New Jersey State Cancer Registry stopped 1979-1995 2 Kansas Cancer Registry stopped 1969-1995 3 New Hampshire State Cancer Registry stopped 1986-1991 4 District of Columbia Cancer Registry stopped 1997 5 Wyoming Cancer Surveillance Program stopped 111996 6 Louisiana Tumor Registry stopped 1992 (passive collection) 7 Illinois State Cancer Registry stopped 111996 8 Missouri Cancer Registry passive collection since 1984 9 South Carolina Central Cancer Registry passive collection since 1996
Beginning Collection of Benign Tumor Data1 North Dakota Cancer Registry began collection 1997 2 Rhode Island Cancer Registry began collection 1998
Page 42
Endash
APPENDIX E
Codes for Primary Intracranial and Central Nervous System Tumors
Note For this report the designation of ldquoprimary intracranial and central nervous system tumorsrdquo includes thefollowing primary tumors of central nervous system sites as well as tumors of the pituitary and pinealglands All histology types within the topography codes are included in the designation of ldquoprimaryintracranial and CNS tumors The source for the topography codes is Percy C Van Holten V Muir Ceds International Classification of Diseases for Oncology Second Edition Geneva World Health Organization 1990
Intracranial tumors
Brain C710 Cerebrum C711 Frontal lobe C712 Temporal lobe C713 Parietal lobe C714 Occipital lobe C715 Ventricle NOSC716 Cerebellum NOS C717 Brain stem C718 Overlapping lesion of brain C719 Brain NOS
Meninges C700 Cerebral meninges C709 Meninges NOS
a
Cranial Nerves and other intracranial parts of the central nervous systemC722 Olfactory nerve C723 Optic nerve C724 Acoustic nerve C725 Cranial nerve NOS C728 Overlapping lesion of brain and central nervous system C729 Nervous system NOS
Other endrocrine glands and related structures C751 Pituitary gland C752 Craniopharyngeal duct C753 Pineal gland
Extracranial tumors
Spinal cord C720 Spinal cord C721 Cauda equina
Meninges C701 Spinal meninges
aNOS=Not Otherwise Specified
Page 43
Endash
DATA COLLECTION
OF PRIMARY
CENTRAL NERVOUS
SYSTEM TUMORS
Brain Tumor Histology Groupings
The following histology groupings were used for the primary intracranial and central nervoussystem tumors The source for the histology groupings is Central Brain Tumor Registry ofthe United States (CBTRUS) 1996 Statistics Report Table 4
WHOa HISTOLOGY GROUPINGS ICD-Ob MORPHOLOGY CODE
Diffuse astrocytoma (protoplasma fibrillary) 9410 9420 Anaplastic astrocytoma 9401 9411 Glioblastoma 9440 9441 9442 Pilocytic astrocytoma 9421 Unique astrocytoma variants 9383 9384 9424 Oligodendroglioma 9450 Anaplastic oligodendroglioma 9451 9460 Ependymomaanaplastic ependymoma 9391 9392 9393 Ependymoma variants 9394 Mixed glioma 9382 Astrocytoma NOSc 9400 Glioma malignant NOS 9380 Choroid plexus 9390 Neuroepithelial 9381 9423 9430 Benign neuronalglial neuronal and mixed 86801 8693 9490 9505 9506 Malignant neruonalglial neuronal and mixed 86803 9364 9490 9500 Pineal parenchymal 9360 9361 9362 Embryonalprimitivemedulloblastoma 8963 9470 9471 9472
9473 9501 9502 9503 9510
TUMORS OF NEUROEPITHELIAL TISSUE
TUMORS OF CRANIAL AND SPINAL NERVES Nerve sheath benign and malignant 9540 9550 9560 9570
TUMORS OF THE MENINGES Meningioma 9530 9531 9532 9533 9534 9537 9538 Other mesenchymal benign and malignant 8800 8801 8802 8803 8810 8830 8850 88618900
8910 8990 9133 9150 9240 9480 9481 9536 9539 Hemangioblastoma 9161 9535
LYMPHOMAS AND HEMOPOIETIC NEOPLASMS Lymphoma 9590 9591 9593 9594 9595 9630 9650 9652
9663 9670 9671 9672 9674 9675 9680 9681 9682 9684 9685 9686 9687 9690 9691 96939695 9696 9698 9702 9714 9723 9731 9766 9970
GERM CELL TUMORS Germ cell 8020 9060 9064 9070 9071 9080 9084 9085 9100
CYSTS AND TUMOR-LIKE LESIONS Cysts and heterotopias 9084
TUMORS OF THE SELLAR REGION Pituitary 8040 8l40 8l46 8260 8270 8271 8280
8281 8290 8300 8330 8323 8333 Craniopharyngioma 9350
Page 44
Endash
APPENDIX E
LOCAL EXTENSIONS FROM REGIONAL TUMORS Chordomachondrosarcoma 9370
UNCLASSIFIED TUMORS Hemangioma 9120 9121 9130 9131 Neoplasm benign 80000 8010 Neoplasm uncertain behavior 80001 80011 Neoplasm malignant 80003 80013 8002 8003 All other 8720 9580
aWHO = World Health OrganizationbICD-O = International Classification of Diseases for Oncology Second Edition 1990 cNOS=Not Otherwise Specified
Page 45
Endash
DATA COLLECTION
OF PRIMARY
CENTRAL NERVOUS
SYSTEM TUMORS
Endash
International Classification of Childhood Cancer (ICCC)
Diagnostic Group
ICD-Oa codes
Morphology Topography
I LEUKAEMIA
(a) Lymphoid leukaemia 9820-9827 9850
(b) Acute non-lymphocytic leukaemia 9840 9841 9861 9864 9866 9867 98919894 9910
(c) Chronic myeloid leukaemia 9863 9868
(d) Other specified leukaemias 9830 9842 9860 9862 9870-9890 9892 98939900 9930-9941
(e) Unspecified leukaemias 9800-9804
II LYMPHOMAS AND OTHER RETICULOENDOTHELIAL NEOPLASMS
(a) Hodgkinrsquos disease 9650-9667
(b) Non-Hodgkinrsquos lymphoma 9591-9595 9670-9686 9690-9714 9723
(c) Burkittrsquos lymphoma 9687
(d) Miscellaneous lymphoreticular neoplasms 9720 9731-9764
(e) Unspecified lymphomas 9590
III CENTRAL NERVOUS SYSTEM (CNS) ANDMISCELLANEOUS INTRACRANIAL AND
INTRASPINAL NEOPLASMSb
(a) Ependymomac 9383 9390-9394
(b) Astrocytoma 9380 C723
9381 9400-9441
(c) Primitive neuroectodermal tumours 9470-9473
(d) Other gliomasd 9380 C700-C722C724-C729
9382 9384
9442-9460 9481
APPENDIX E
Diagnostic Group
ICD-Oa codes
Morphology Topogragphy
III CNS AND MISCELLANEOUS INTRACRANIAL AND INTRASPINAL
NEOPLASMSb Continued
(e) Miscellaneous intracranial and intraspinalneoplasmsc
8270-8281 8300 9350-9362 9480 95059530-9539
(f) Unspecified intracranial and intraspinalneoplasmsc
8000-8004 C700-C729C751-C753
IV SYMPATHETIC NERVOUS SYSTEM TUMOURS
(a) Neuroblastoma and ganglioneuroblastoma 9490 9500
(b) Other sympathetic nervous system tumours 8680 8693-8710 9501-9504 9520-9523
aInternational Classification of Diseases for Oncology Second Edition World Health Organization 1990bGroup III excludes all lymphomas See group II cBehaviour codes 0 and 1 are included dBehaviour code 1 is included
Page 47
Endash
Comments and recommendations are welcome Should questions arise on how to use these
materials or for more information please contact
Centers for Disease Control and Prevention National Program of Cancer Registries
4770 Buford Hwy NE Mail Stop K-53
Atlanta GA 30042-3717
Voice Information System 1 (888) 842-6355 bull Fax (770) 488-4760
cancerinfocdcgov bull httpwwwcdcgovcancer
All materials are in the public domain and may be reproduced or copied without permission citation
to source however is appreciated
BACK COVER
(WHITE)
Spine(WHITE)
DATA COLLECTION OF PRIMARY CEN
TRAL NERVOUS SYSTEM
TUM
ORS 2004
National Program of Cancer Registries Training M
aterials
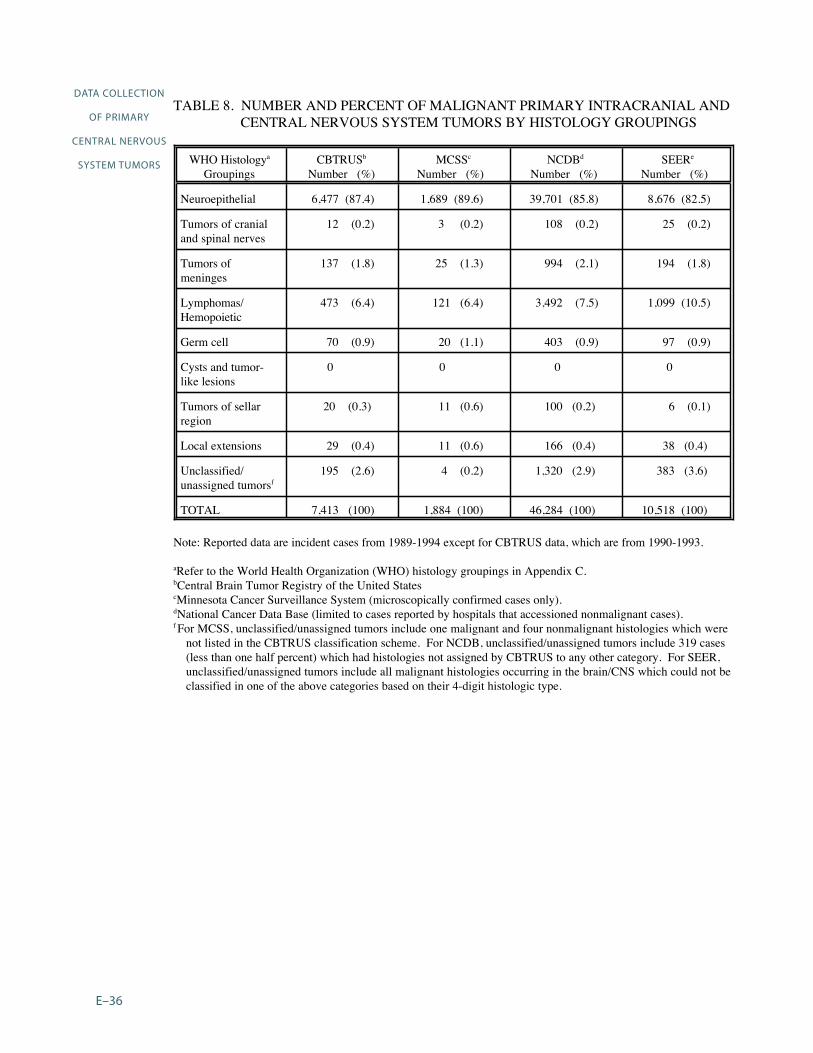
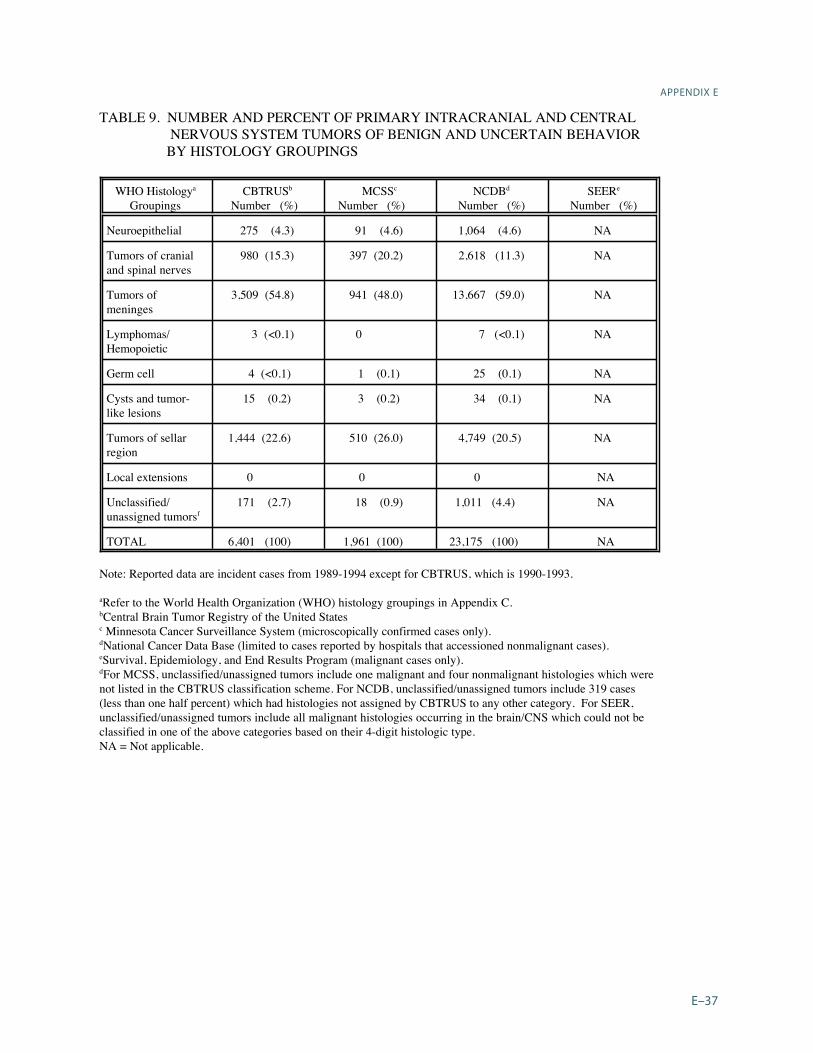
DATA COLLECTION
OF PRIMARY
CENTRAL NERVOUS
SYSTEM TUMORS
TABLE 12 METHOD OF CASE FINDING FOR NONMALIGNANT INTRACRANIALa TUMORS BY TYPE OF FACILITY MINNESOTA 1989-1994
Type of Facility Number of Tumors Percent Found byRoutine
Reporting
Percent Found by Special Efforts
Registry at facility No registry at facility
1451325
859 569
141 431
TOTAL 1776 806 194
aIncludes tumors with benign or uncertain behavior that involve the brain cerebral meningespituitary gland pineal gland or other intracranial sites (refer to the site codes in Appendix B)
TABLE 13 REPORTING METHOD AND SOURCE OF CASE FINDING FOR NON- MALIGNANT INTRACRANIALa TUMORS DIAGNOSED IN HOSPITALS WITH A TUMOR REGISTRY MINNESOTA 1989-1994
Reporting Method Number of Tumors Percent Found byRoutine
Reporting
Percent Found by
Special Efforts
Registry-reportedLaboratory-reported
1226225
925 502
75 498
TOTAL 1451 859 141
aIncludes tumors with benign or uncertain behavior that involve the brain cerebral meningespituitary gland pineal gland or other intracranial sites (refer to the site codes in Appendix B)
Page 40
Endash0
APPENDIX E TABLE 14 HOSPITAL REGISTRY ACCESSIONING OF MALIGNANT AND NON-
MALIGNANT PRIMARY INTRACRANIAL AND CENTRAL NERVOUS SYSTEM TUMORS NCDB 1989-1994
TUMOR Totalb
BEHAVIOR Malignant c Nonmalignantd
Tumor Locationa HospitalsReporting
Number ()
Hospitals Reporting
Number ()
Hospitals Reporting
Number ()
Intracranial 1542 (100) 1526 (100) 900 (99)
Brain 1527 (99) 1519 (gt99) 754 (83)
Meninges 740 (48) 390 (26) 613 (67)
Pituitaryglandcraniopharyn-
geal duct
602 (39) 168 (11) 538 (59)
Pineal gland 319 (21) 277 (18) 79 (9)
Other central nervous system including cranial
nerves
648 (42) 545 (36) 299 (33)
Extracranial 812 (53) 708 (46) 410 (45)
Spinal cord 760 (49) 692 (45) 311 (34)
Spinal meninges 299 (19) 72 (5) 258 (28)
TOTAL Hospitals 1542 (100) 1526 (100) 913 (100)
Note The number of hospitals in each of the second third and fourth columns is the number that submittedreports to the NCDB for any intracranial and central nervous system tumors for the respective malignancystatus Not all hospitals submitted reports for each year during the study period (1989-1994)
aRefer to the site codes in Appendix B bBehavior codes = 0 1 3 cBehavior code = 3 dBehavior codes = 0 1
Page 41
Endash
DATA COLLECTION
OF PRIMARY
CENTRAL NERVOUS
SYSTEM TUMORS
Texas Cancer Registry
1997 CBTRUS State Survey of Benign Brain Tumor Data Collection
State Collection Status
Currently Collecting Benign Tumor Data1 Arizona Cancer Registry since 1981 2 Colorado Central Cancer Registry since 1988 3 Connecticut Tumor Registry since 1965 4 Idaho Cancer Data Registry since 1970 5 Maine Cancer Registry since 1983 6 Massachusetts Cancer Registry since 1982 7 Minnesota Cancer Surveillance System since 1988 8 Montana Central Tumor Registry since 1979 9 New York State Cancer Registry since 1988
10 North Carolina Central Cancer Registry since 1990 11 Utah Cancer Registry since 1966 12 Virginia Cancer Registry since 1994 13 Delaware State Cancer Registry14 Washington State Cancer Registry since 1992 15 passive collection 1979-1994
active collection since 1995
Stopped or Passive Collection of Benign Tumor Data1 New Jersey State Cancer Registry stopped 1979-1995 2 Kansas Cancer Registry stopped 1969-1995 3 New Hampshire State Cancer Registry stopped 1986-1991 4 District of Columbia Cancer Registry stopped 1997 5 Wyoming Cancer Surveillance Program stopped 111996 6 Louisiana Tumor Registry stopped 1992 (passive collection) 7 Illinois State Cancer Registry stopped 111996 8 Missouri Cancer Registry passive collection since 1984 9 South Carolina Central Cancer Registry passive collection since 1996
Beginning Collection of Benign Tumor Data1 North Dakota Cancer Registry began collection 1997 2 Rhode Island Cancer Registry began collection 1998
Page 42
Endash
APPENDIX E
Codes for Primary Intracranial and Central Nervous System Tumors
Note For this report the designation of ldquoprimary intracranial and central nervous system tumorsrdquo includes thefollowing primary tumors of central nervous system sites as well as tumors of the pituitary and pinealglands All histology types within the topography codes are included in the designation of ldquoprimaryintracranial and CNS tumors The source for the topography codes is Percy C Van Holten V Muir Ceds International Classification of Diseases for Oncology Second Edition Geneva World Health Organization 1990
Intracranial tumors
Brain C710 Cerebrum C711 Frontal lobe C712 Temporal lobe C713 Parietal lobe C714 Occipital lobe C715 Ventricle NOSC716 Cerebellum NOS C717 Brain stem C718 Overlapping lesion of brain C719 Brain NOS
Meninges C700 Cerebral meninges C709 Meninges NOS
a
Cranial Nerves and other intracranial parts of the central nervous systemC722 Olfactory nerve C723 Optic nerve C724 Acoustic nerve C725 Cranial nerve NOS C728 Overlapping lesion of brain and central nervous system C729 Nervous system NOS
Other endrocrine glands and related structures C751 Pituitary gland C752 Craniopharyngeal duct C753 Pineal gland
Extracranial tumors
Spinal cord C720 Spinal cord C721 Cauda equina
Meninges C701 Spinal meninges
aNOS=Not Otherwise Specified
Page 43
Endash
DATA COLLECTION
OF PRIMARY
CENTRAL NERVOUS
SYSTEM TUMORS
Brain Tumor Histology Groupings
The following histology groupings were used for the primary intracranial and central nervoussystem tumors The source for the histology groupings is Central Brain Tumor Registry ofthe United States (CBTRUS) 1996 Statistics Report Table 4
WHOa HISTOLOGY GROUPINGS ICD-Ob MORPHOLOGY CODE
Diffuse astrocytoma (protoplasma fibrillary) 9410 9420 Anaplastic astrocytoma 9401 9411 Glioblastoma 9440 9441 9442 Pilocytic astrocytoma 9421 Unique astrocytoma variants 9383 9384 9424 Oligodendroglioma 9450 Anaplastic oligodendroglioma 9451 9460 Ependymomaanaplastic ependymoma 9391 9392 9393 Ependymoma variants 9394 Mixed glioma 9382 Astrocytoma NOSc 9400 Glioma malignant NOS 9380 Choroid plexus 9390 Neuroepithelial 9381 9423 9430 Benign neuronalglial neuronal and mixed 86801 8693 9490 9505 9506 Malignant neruonalglial neuronal and mixed 86803 9364 9490 9500 Pineal parenchymal 9360 9361 9362 Embryonalprimitivemedulloblastoma 8963 9470 9471 9472
9473 9501 9502 9503 9510
TUMORS OF NEUROEPITHELIAL TISSUE
TUMORS OF CRANIAL AND SPINAL NERVES Nerve sheath benign and malignant 9540 9550 9560 9570
TUMORS OF THE MENINGES Meningioma 9530 9531 9532 9533 9534 9537 9538 Other mesenchymal benign and malignant 8800 8801 8802 8803 8810 8830 8850 88618900
8910 8990 9133 9150 9240 9480 9481 9536 9539 Hemangioblastoma 9161 9535
LYMPHOMAS AND HEMOPOIETIC NEOPLASMS Lymphoma 9590 9591 9593 9594 9595 9630 9650 9652
9663 9670 9671 9672 9674 9675 9680 9681 9682 9684 9685 9686 9687 9690 9691 96939695 9696 9698 9702 9714 9723 9731 9766 9970
GERM CELL TUMORS Germ cell 8020 9060 9064 9070 9071 9080 9084 9085 9100
CYSTS AND TUMOR-LIKE LESIONS Cysts and heterotopias 9084
TUMORS OF THE SELLAR REGION Pituitary 8040 8l40 8l46 8260 8270 8271 8280
8281 8290 8300 8330 8323 8333 Craniopharyngioma 9350
Page 44
Endash
APPENDIX E
LOCAL EXTENSIONS FROM REGIONAL TUMORS Chordomachondrosarcoma 9370
UNCLASSIFIED TUMORS Hemangioma 9120 9121 9130 9131 Neoplasm benign 80000 8010 Neoplasm uncertain behavior 80001 80011 Neoplasm malignant 80003 80013 8002 8003 All other 8720 9580
aWHO = World Health OrganizationbICD-O = International Classification of Diseases for Oncology Second Edition 1990 cNOS=Not Otherwise Specified
Page 45
Endash
DATA COLLECTION
OF PRIMARY
CENTRAL NERVOUS
SYSTEM TUMORS
Endash
International Classification of Childhood Cancer (ICCC)
Diagnostic Group
ICD-Oa codes
Morphology Topography
I LEUKAEMIA
(a) Lymphoid leukaemia 9820-9827 9850
(b) Acute non-lymphocytic leukaemia 9840 9841 9861 9864 9866 9867 98919894 9910
(c) Chronic myeloid leukaemia 9863 9868
(d) Other specified leukaemias 9830 9842 9860 9862 9870-9890 9892 98939900 9930-9941
(e) Unspecified leukaemias 9800-9804
II LYMPHOMAS AND OTHER RETICULOENDOTHELIAL NEOPLASMS
(a) Hodgkinrsquos disease 9650-9667
(b) Non-Hodgkinrsquos lymphoma 9591-9595 9670-9686 9690-9714 9723
(c) Burkittrsquos lymphoma 9687
(d) Miscellaneous lymphoreticular neoplasms 9720 9731-9764
(e) Unspecified lymphomas 9590
III CENTRAL NERVOUS SYSTEM (CNS) ANDMISCELLANEOUS INTRACRANIAL AND
INTRASPINAL NEOPLASMSb
(a) Ependymomac 9383 9390-9394
(b) Astrocytoma 9380 C723
9381 9400-9441
(c) Primitive neuroectodermal tumours 9470-9473
(d) Other gliomasd 9380 C700-C722C724-C729
9382 9384
9442-9460 9481
APPENDIX E
Diagnostic Group
ICD-Oa codes
Morphology Topogragphy
III CNS AND MISCELLANEOUS INTRACRANIAL AND INTRASPINAL
NEOPLASMSb Continued
(e) Miscellaneous intracranial and intraspinalneoplasmsc
8270-8281 8300 9350-9362 9480 95059530-9539
(f) Unspecified intracranial and intraspinalneoplasmsc
8000-8004 C700-C729C751-C753
IV SYMPATHETIC NERVOUS SYSTEM TUMOURS
(a) Neuroblastoma and ganglioneuroblastoma 9490 9500
(b) Other sympathetic nervous system tumours 8680 8693-8710 9501-9504 9520-9523
aInternational Classification of Diseases for Oncology Second Edition World Health Organization 1990bGroup III excludes all lymphomas See group II cBehaviour codes 0 and 1 are included dBehaviour code 1 is included
Page 47
Endash
Comments and recommendations are welcome Should questions arise on how to use these
materials or for more information please contact
Centers for Disease Control and Prevention National Program of Cancer Registries
4770 Buford Hwy NE Mail Stop K-53
Atlanta GA 30042-3717
Voice Information System 1 (888) 842-6355 bull Fax (770) 488-4760
cancerinfocdcgov bull httpwwwcdcgovcancer
All materials are in the public domain and may be reproduced or copied without permission citation
to source however is appreciated
BACK COVER
(WHITE)
Spine(WHITE)
DATA COLLECTION OF PRIMARY CEN
TRAL NERVOUS SYSTEM
TUM
ORS 2004
National Program of Cancer Registries Training M
aterials
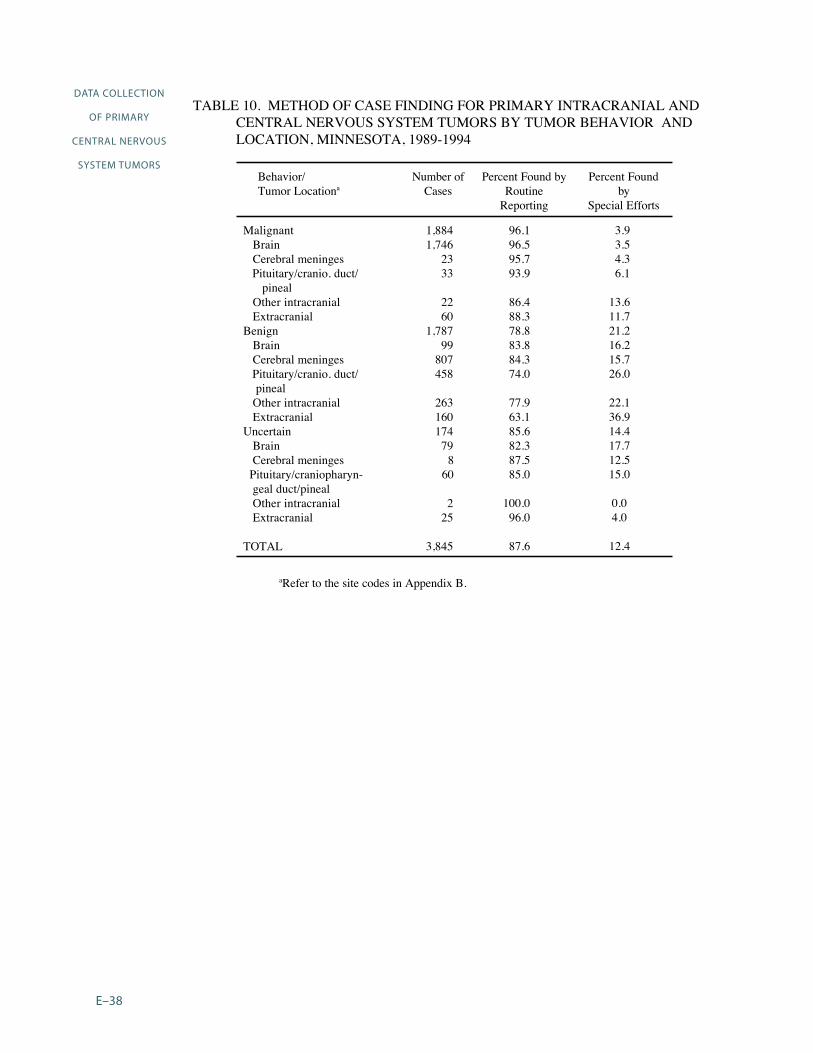

DATA COLLECTION
OF PRIMARY
CENTRAL NERVOUS
SYSTEM TUMORS
Texas Cancer Registry
1997 CBTRUS State Survey of Benign Brain Tumor Data Collection
State Collection Status
Currently Collecting Benign Tumor Data1 Arizona Cancer Registry since 1981 2 Colorado Central Cancer Registry since 1988 3 Connecticut Tumor Registry since 1965 4 Idaho Cancer Data Registry since 1970 5 Maine Cancer Registry since 1983 6 Massachusetts Cancer Registry since 1982 7 Minnesota Cancer Surveillance System since 1988 8 Montana Central Tumor Registry since 1979 9 New York State Cancer Registry since 1988
10 North Carolina Central Cancer Registry since 1990 11 Utah Cancer Registry since 1966 12 Virginia Cancer Registry since 1994 13 Delaware State Cancer Registry14 Washington State Cancer Registry since 1992 15 passive collection 1979-1994
active collection since 1995
Stopped or Passive Collection of Benign Tumor Data1 New Jersey State Cancer Registry stopped 1979-1995 2 Kansas Cancer Registry stopped 1969-1995 3 New Hampshire State Cancer Registry stopped 1986-1991 4 District of Columbia Cancer Registry stopped 1997 5 Wyoming Cancer Surveillance Program stopped 111996 6 Louisiana Tumor Registry stopped 1992 (passive collection) 7 Illinois State Cancer Registry stopped 111996 8 Missouri Cancer Registry passive collection since 1984 9 South Carolina Central Cancer Registry passive collection since 1996
Beginning Collection of Benign Tumor Data1 North Dakota Cancer Registry began collection 1997 2 Rhode Island Cancer Registry began collection 1998
Page 42
Endash
APPENDIX E
Codes for Primary Intracranial and Central Nervous System Tumors
Note For this report the designation of ldquoprimary intracranial and central nervous system tumorsrdquo includes thefollowing primary tumors of central nervous system sites as well as tumors of the pituitary and pinealglands All histology types within the topography codes are included in the designation of ldquoprimaryintracranial and CNS tumors The source for the topography codes is Percy C Van Holten V Muir Ceds International Classification of Diseases for Oncology Second Edition Geneva World Health Organization 1990
Intracranial tumors
Brain C710 Cerebrum C711 Frontal lobe C712 Temporal lobe C713 Parietal lobe C714 Occipital lobe C715 Ventricle NOSC716 Cerebellum NOS C717 Brain stem C718 Overlapping lesion of brain C719 Brain NOS
Meninges C700 Cerebral meninges C709 Meninges NOS
a
Cranial Nerves and other intracranial parts of the central nervous systemC722 Olfactory nerve C723 Optic nerve C724 Acoustic nerve C725 Cranial nerve NOS C728 Overlapping lesion of brain and central nervous system C729 Nervous system NOS
Other endrocrine glands and related structures C751 Pituitary gland C752 Craniopharyngeal duct C753 Pineal gland
Extracranial tumors
Spinal cord C720 Spinal cord C721 Cauda equina
Meninges C701 Spinal meninges
aNOS=Not Otherwise Specified
Page 43
Endash
DATA COLLECTION
OF PRIMARY
CENTRAL NERVOUS
SYSTEM TUMORS
Brain Tumor Histology Groupings
The following histology groupings were used for the primary intracranial and central nervoussystem tumors The source for the histology groupings is Central Brain Tumor Registry ofthe United States (CBTRUS) 1996 Statistics Report Table 4
WHOa HISTOLOGY GROUPINGS ICD-Ob MORPHOLOGY CODE
Diffuse astrocytoma (protoplasma fibrillary) 9410 9420 Anaplastic astrocytoma 9401 9411 Glioblastoma 9440 9441 9442 Pilocytic astrocytoma 9421 Unique astrocytoma variants 9383 9384 9424 Oligodendroglioma 9450 Anaplastic oligodendroglioma 9451 9460 Ependymomaanaplastic ependymoma 9391 9392 9393 Ependymoma variants 9394 Mixed glioma 9382 Astrocytoma NOSc 9400 Glioma malignant NOS 9380 Choroid plexus 9390 Neuroepithelial 9381 9423 9430 Benign neuronalglial neuronal and mixed 86801 8693 9490 9505 9506 Malignant neruonalglial neuronal and mixed 86803 9364 9490 9500 Pineal parenchymal 9360 9361 9362 Embryonalprimitivemedulloblastoma 8963 9470 9471 9472
9473 9501 9502 9503 9510
TUMORS OF NEUROEPITHELIAL TISSUE
TUMORS OF CRANIAL AND SPINAL NERVES Nerve sheath benign and malignant 9540 9550 9560 9570
TUMORS OF THE MENINGES Meningioma 9530 9531 9532 9533 9534 9537 9538 Other mesenchymal benign and malignant 8800 8801 8802 8803 8810 8830 8850 88618900
8910 8990 9133 9150 9240 9480 9481 9536 9539 Hemangioblastoma 9161 9535
LYMPHOMAS AND HEMOPOIETIC NEOPLASMS Lymphoma 9590 9591 9593 9594 9595 9630 9650 9652
9663 9670 9671 9672 9674 9675 9680 9681 9682 9684 9685 9686 9687 9690 9691 96939695 9696 9698 9702 9714 9723 9731 9766 9970
GERM CELL TUMORS Germ cell 8020 9060 9064 9070 9071 9080 9084 9085 9100
CYSTS AND TUMOR-LIKE LESIONS Cysts and heterotopias 9084
TUMORS OF THE SELLAR REGION Pituitary 8040 8l40 8l46 8260 8270 8271 8280
8281 8290 8300 8330 8323 8333 Craniopharyngioma 9350
Page 44
Endash
APPENDIX E
LOCAL EXTENSIONS FROM REGIONAL TUMORS Chordomachondrosarcoma 9370
UNCLASSIFIED TUMORS Hemangioma 9120 9121 9130 9131 Neoplasm benign 80000 8010 Neoplasm uncertain behavior 80001 80011 Neoplasm malignant 80003 80013 8002 8003 All other 8720 9580
aWHO = World Health OrganizationbICD-O = International Classification of Diseases for Oncology Second Edition 1990 cNOS=Not Otherwise Specified
Page 45
Endash
DATA COLLECTION
OF PRIMARY
CENTRAL NERVOUS
SYSTEM TUMORS
Endash
International Classification of Childhood Cancer (ICCC)
Diagnostic Group
ICD-Oa codes
Morphology Topography
I LEUKAEMIA
(a) Lymphoid leukaemia 9820-9827 9850
(b) Acute non-lymphocytic leukaemia 9840 9841 9861 9864 9866 9867 98919894 9910
(c) Chronic myeloid leukaemia 9863 9868
(d) Other specified leukaemias 9830 9842 9860 9862 9870-9890 9892 98939900 9930-9941
(e) Unspecified leukaemias 9800-9804
II LYMPHOMAS AND OTHER RETICULOENDOTHELIAL NEOPLASMS
(a) Hodgkinrsquos disease 9650-9667
(b) Non-Hodgkinrsquos lymphoma 9591-9595 9670-9686 9690-9714 9723
(c) Burkittrsquos lymphoma 9687
(d) Miscellaneous lymphoreticular neoplasms 9720 9731-9764
(e) Unspecified lymphomas 9590
III CENTRAL NERVOUS SYSTEM (CNS) ANDMISCELLANEOUS INTRACRANIAL AND
INTRASPINAL NEOPLASMSb
(a) Ependymomac 9383 9390-9394
(b) Astrocytoma 9380 C723
9381 9400-9441
(c) Primitive neuroectodermal tumours 9470-9473
(d) Other gliomasd 9380 C700-C722C724-C729
9382 9384
9442-9460 9481
APPENDIX E
Diagnostic Group
ICD-Oa codes
Morphology Topogragphy
III CNS AND MISCELLANEOUS INTRACRANIAL AND INTRASPINAL
NEOPLASMSb Continued
(e) Miscellaneous intracranial and intraspinalneoplasmsc
8270-8281 8300 9350-9362 9480 95059530-9539
(f) Unspecified intracranial and intraspinalneoplasmsc
8000-8004 C700-C729C751-C753
IV SYMPATHETIC NERVOUS SYSTEM TUMOURS
(a) Neuroblastoma and ganglioneuroblastoma 9490 9500
(b) Other sympathetic nervous system tumours 8680 8693-8710 9501-9504 9520-9523
aInternational Classification of Diseases for Oncology Second Edition World Health Organization 1990bGroup III excludes all lymphomas See group II cBehaviour codes 0 and 1 are included dBehaviour code 1 is included
Page 47
Endash
Comments and recommendations are welcome Should questions arise on how to use these
materials or for more information please contact
Centers for Disease Control and Prevention National Program of Cancer Registries
4770 Buford Hwy NE Mail Stop K-53
Atlanta GA 30042-3717
Voice Information System 1 (888) 842-6355 bull Fax (770) 488-4760
cancerinfocdcgov bull httpwwwcdcgovcancer
All materials are in the public domain and may be reproduced or copied without permission citation
to source however is appreciated
BACK COVER
(WHITE)
Spine(WHITE)
DATA COLLECTION OF PRIMARY CEN
TRAL NERVOUS SYSTEM
TUM
ORS 2004
National Program of Cancer Registries Training M
aterials

APPENDIX E
Codes for Primary Intracranial and Central Nervous System Tumors
Note For this report the designation of ldquoprimary intracranial and central nervous system tumorsrdquo includes thefollowing primary tumors of central nervous system sites as well as tumors of the pituitary and pinealglands All histology types within the topography codes are included in the designation of ldquoprimaryintracranial and CNS tumors The source for the topography codes is Percy C Van Holten V Muir Ceds International Classification of Diseases for Oncology Second Edition Geneva World Health Organization 1990
Intracranial tumors
Brain C710 Cerebrum C711 Frontal lobe C712 Temporal lobe C713 Parietal lobe C714 Occipital lobe C715 Ventricle NOSC716 Cerebellum NOS C717 Brain stem C718 Overlapping lesion of brain C719 Brain NOS
Meninges C700 Cerebral meninges C709 Meninges NOS
a
Cranial Nerves and other intracranial parts of the central nervous systemC722 Olfactory nerve C723 Optic nerve C724 Acoustic nerve C725 Cranial nerve NOS C728 Overlapping lesion of brain and central nervous system C729 Nervous system NOS
Other endrocrine glands and related structures C751 Pituitary gland C752 Craniopharyngeal duct C753 Pineal gland
Extracranial tumors
Spinal cord C720 Spinal cord C721 Cauda equina
Meninges C701 Spinal meninges
aNOS=Not Otherwise Specified
Page 43
Endash
DATA COLLECTION
OF PRIMARY
CENTRAL NERVOUS
SYSTEM TUMORS
Brain Tumor Histology Groupings
The following histology groupings were used for the primary intracranial and central nervoussystem tumors The source for the histology groupings is Central Brain Tumor Registry ofthe United States (CBTRUS) 1996 Statistics Report Table 4
WHOa HISTOLOGY GROUPINGS ICD-Ob MORPHOLOGY CODE
Diffuse astrocytoma (protoplasma fibrillary) 9410 9420 Anaplastic astrocytoma 9401 9411 Glioblastoma 9440 9441 9442 Pilocytic astrocytoma 9421 Unique astrocytoma variants 9383 9384 9424 Oligodendroglioma 9450 Anaplastic oligodendroglioma 9451 9460 Ependymomaanaplastic ependymoma 9391 9392 9393 Ependymoma variants 9394 Mixed glioma 9382 Astrocytoma NOSc 9400 Glioma malignant NOS 9380 Choroid plexus 9390 Neuroepithelial 9381 9423 9430 Benign neuronalglial neuronal and mixed 86801 8693 9490 9505 9506 Malignant neruonalglial neuronal and mixed 86803 9364 9490 9500 Pineal parenchymal 9360 9361 9362 Embryonalprimitivemedulloblastoma 8963 9470 9471 9472
9473 9501 9502 9503 9510
TUMORS OF NEUROEPITHELIAL TISSUE
TUMORS OF CRANIAL AND SPINAL NERVES Nerve sheath benign and malignant 9540 9550 9560 9570
TUMORS OF THE MENINGES Meningioma 9530 9531 9532 9533 9534 9537 9538 Other mesenchymal benign and malignant 8800 8801 8802 8803 8810 8830 8850 88618900
8910 8990 9133 9150 9240 9480 9481 9536 9539 Hemangioblastoma 9161 9535
LYMPHOMAS AND HEMOPOIETIC NEOPLASMS Lymphoma 9590 9591 9593 9594 9595 9630 9650 9652
9663 9670 9671 9672 9674 9675 9680 9681 9682 9684 9685 9686 9687 9690 9691 96939695 9696 9698 9702 9714 9723 9731 9766 9970
GERM CELL TUMORS Germ cell 8020 9060 9064 9070 9071 9080 9084 9085 9100
CYSTS AND TUMOR-LIKE LESIONS Cysts and heterotopias 9084
TUMORS OF THE SELLAR REGION Pituitary 8040 8l40 8l46 8260 8270 8271 8280
8281 8290 8300 8330 8323 8333 Craniopharyngioma 9350
Page 44
Endash
APPENDIX E
LOCAL EXTENSIONS FROM REGIONAL TUMORS Chordomachondrosarcoma 9370
UNCLASSIFIED TUMORS Hemangioma 9120 9121 9130 9131 Neoplasm benign 80000 8010 Neoplasm uncertain behavior 80001 80011 Neoplasm malignant 80003 80013 8002 8003 All other 8720 9580
aWHO = World Health OrganizationbICD-O = International Classification of Diseases for Oncology Second Edition 1990 cNOS=Not Otherwise Specified
Page 45
Endash
DATA COLLECTION
OF PRIMARY
CENTRAL NERVOUS
SYSTEM TUMORS
Endash
International Classification of Childhood Cancer (ICCC)
Diagnostic Group
ICD-Oa codes
Morphology Topography
I LEUKAEMIA
(a) Lymphoid leukaemia 9820-9827 9850
(b) Acute non-lymphocytic leukaemia 9840 9841 9861 9864 9866 9867 98919894 9910
(c) Chronic myeloid leukaemia 9863 9868
(d) Other specified leukaemias 9830 9842 9860 9862 9870-9890 9892 98939900 9930-9941
(e) Unspecified leukaemias 9800-9804
II LYMPHOMAS AND OTHER RETICULOENDOTHELIAL NEOPLASMS
(a) Hodgkinrsquos disease 9650-9667
(b) Non-Hodgkinrsquos lymphoma 9591-9595 9670-9686 9690-9714 9723
(c) Burkittrsquos lymphoma 9687
(d) Miscellaneous lymphoreticular neoplasms 9720 9731-9764
(e) Unspecified lymphomas 9590
III CENTRAL NERVOUS SYSTEM (CNS) ANDMISCELLANEOUS INTRACRANIAL AND
INTRASPINAL NEOPLASMSb
(a) Ependymomac 9383 9390-9394
(b) Astrocytoma 9380 C723
9381 9400-9441
(c) Primitive neuroectodermal tumours 9470-9473
(d) Other gliomasd 9380 C700-C722C724-C729
9382 9384
9442-9460 9481
APPENDIX E
Diagnostic Group
ICD-Oa codes
Morphology Topogragphy
III CNS AND MISCELLANEOUS INTRACRANIAL AND INTRASPINAL
NEOPLASMSb Continued
(e) Miscellaneous intracranial and intraspinalneoplasmsc
8270-8281 8300 9350-9362 9480 95059530-9539
(f) Unspecified intracranial and intraspinalneoplasmsc
8000-8004 C700-C729C751-C753
IV SYMPATHETIC NERVOUS SYSTEM TUMOURS
(a) Neuroblastoma and ganglioneuroblastoma 9490 9500
(b) Other sympathetic nervous system tumours 8680 8693-8710 9501-9504 9520-9523
aInternational Classification of Diseases for Oncology Second Edition World Health Organization 1990bGroup III excludes all lymphomas See group II cBehaviour codes 0 and 1 are included dBehaviour code 1 is included
Page 47
Endash
Comments and recommendations are welcome Should questions arise on how to use these
materials or for more information please contact
Centers for Disease Control and Prevention National Program of Cancer Registries
4770 Buford Hwy NE Mail Stop K-53
Atlanta GA 30042-3717
Voice Information System 1 (888) 842-6355 bull Fax (770) 488-4760
cancerinfocdcgov bull httpwwwcdcgovcancer
All materials are in the public domain and may be reproduced or copied without permission citation
to source however is appreciated
BACK COVER
(WHITE)
Spine(WHITE)
DATA COLLECTION OF PRIMARY CEN
TRAL NERVOUS SYSTEM
TUM
ORS 2004
National Program of Cancer Registries Training M
aterials
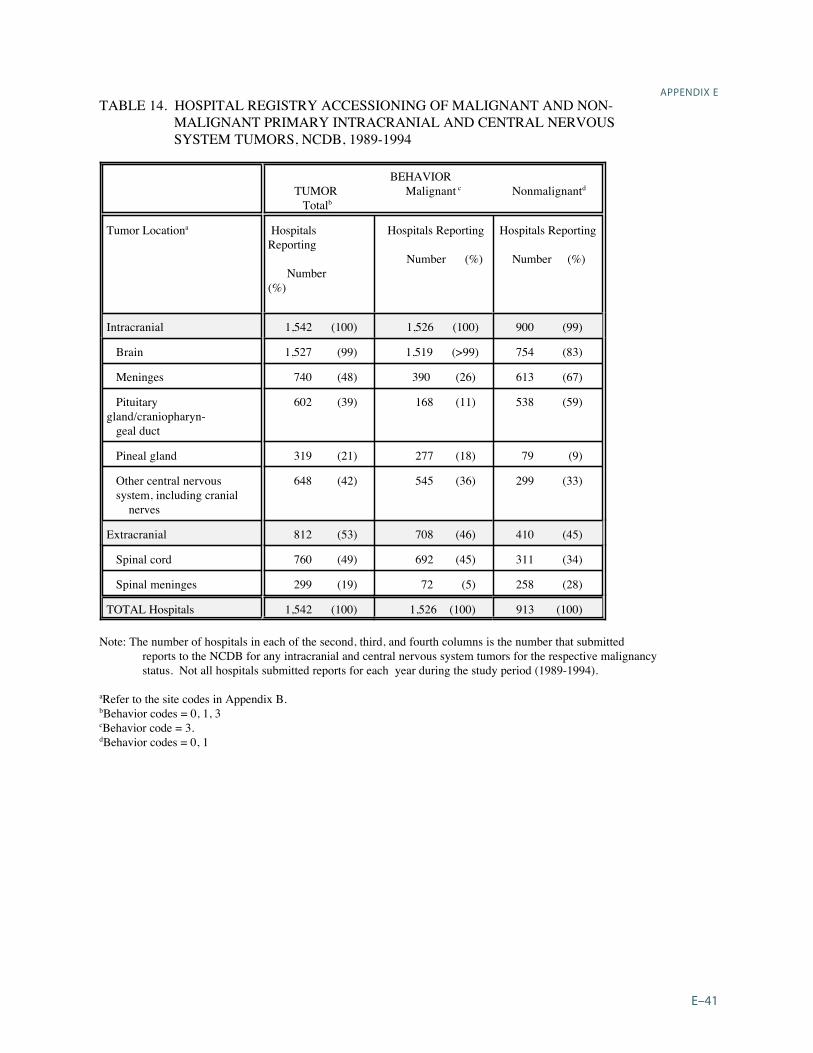
DATA COLLECTION
OF PRIMARY
CENTRAL NERVOUS
SYSTEM TUMORS
Brain Tumor Histology Groupings
The following histology groupings were used for the primary intracranial and central nervoussystem tumors The source for the histology groupings is Central Brain Tumor Registry ofthe United States (CBTRUS) 1996 Statistics Report Table 4
WHOa HISTOLOGY GROUPINGS ICD-Ob MORPHOLOGY CODE
Diffuse astrocytoma (protoplasma fibrillary) 9410 9420 Anaplastic astrocytoma 9401 9411 Glioblastoma 9440 9441 9442 Pilocytic astrocytoma 9421 Unique astrocytoma variants 9383 9384 9424 Oligodendroglioma 9450 Anaplastic oligodendroglioma 9451 9460 Ependymomaanaplastic ependymoma 9391 9392 9393 Ependymoma variants 9394 Mixed glioma 9382 Astrocytoma NOSc 9400 Glioma malignant NOS 9380 Choroid plexus 9390 Neuroepithelial 9381 9423 9430 Benign neuronalglial neuronal and mixed 86801 8693 9490 9505 9506 Malignant neruonalglial neuronal and mixed 86803 9364 9490 9500 Pineal parenchymal 9360 9361 9362 Embryonalprimitivemedulloblastoma 8963 9470 9471 9472
9473 9501 9502 9503 9510
TUMORS OF NEUROEPITHELIAL TISSUE
TUMORS OF CRANIAL AND SPINAL NERVES Nerve sheath benign and malignant 9540 9550 9560 9570
TUMORS OF THE MENINGES Meningioma 9530 9531 9532 9533 9534 9537 9538 Other mesenchymal benign and malignant 8800 8801 8802 8803 8810 8830 8850 88618900
8910 8990 9133 9150 9240 9480 9481 9536 9539 Hemangioblastoma 9161 9535
LYMPHOMAS AND HEMOPOIETIC NEOPLASMS Lymphoma 9590 9591 9593 9594 9595 9630 9650 9652
9663 9670 9671 9672 9674 9675 9680 9681 9682 9684 9685 9686 9687 9690 9691 96939695 9696 9698 9702 9714 9723 9731 9766 9970
GERM CELL TUMORS Germ cell 8020 9060 9064 9070 9071 9080 9084 9085 9100
CYSTS AND TUMOR-LIKE LESIONS Cysts and heterotopias 9084
TUMORS OF THE SELLAR REGION Pituitary 8040 8l40 8l46 8260 8270 8271 8280
8281 8290 8300 8330 8323 8333 Craniopharyngioma 9350
Page 44
Endash
APPENDIX E
LOCAL EXTENSIONS FROM REGIONAL TUMORS Chordomachondrosarcoma 9370
UNCLASSIFIED TUMORS Hemangioma 9120 9121 9130 9131 Neoplasm benign 80000 8010 Neoplasm uncertain behavior 80001 80011 Neoplasm malignant 80003 80013 8002 8003 All other 8720 9580
aWHO = World Health OrganizationbICD-O = International Classification of Diseases for Oncology Second Edition 1990 cNOS=Not Otherwise Specified
Page 45
Endash
DATA COLLECTION
OF PRIMARY
CENTRAL NERVOUS
SYSTEM TUMORS
Endash
International Classification of Childhood Cancer (ICCC)
Diagnostic Group
ICD-Oa codes
Morphology Topography
I LEUKAEMIA
(a) Lymphoid leukaemia 9820-9827 9850
(b) Acute non-lymphocytic leukaemia 9840 9841 9861 9864 9866 9867 98919894 9910
(c) Chronic myeloid leukaemia 9863 9868
(d) Other specified leukaemias 9830 9842 9860 9862 9870-9890 9892 98939900 9930-9941
(e) Unspecified leukaemias 9800-9804
II LYMPHOMAS AND OTHER RETICULOENDOTHELIAL NEOPLASMS
(a) Hodgkinrsquos disease 9650-9667
(b) Non-Hodgkinrsquos lymphoma 9591-9595 9670-9686 9690-9714 9723
(c) Burkittrsquos lymphoma 9687
(d) Miscellaneous lymphoreticular neoplasms 9720 9731-9764
(e) Unspecified lymphomas 9590
III CENTRAL NERVOUS SYSTEM (CNS) ANDMISCELLANEOUS INTRACRANIAL AND
INTRASPINAL NEOPLASMSb
(a) Ependymomac 9383 9390-9394
(b) Astrocytoma 9380 C723
9381 9400-9441
(c) Primitive neuroectodermal tumours 9470-9473
(d) Other gliomasd 9380 C700-C722C724-C729
9382 9384
9442-9460 9481
APPENDIX E
Diagnostic Group
ICD-Oa codes
Morphology Topogragphy
III CNS AND MISCELLANEOUS INTRACRANIAL AND INTRASPINAL
NEOPLASMSb Continued
(e) Miscellaneous intracranial and intraspinalneoplasmsc
8270-8281 8300 9350-9362 9480 95059530-9539
(f) Unspecified intracranial and intraspinalneoplasmsc
8000-8004 C700-C729C751-C753
IV SYMPATHETIC NERVOUS SYSTEM TUMOURS
(a) Neuroblastoma and ganglioneuroblastoma 9490 9500
(b) Other sympathetic nervous system tumours 8680 8693-8710 9501-9504 9520-9523
aInternational Classification of Diseases for Oncology Second Edition World Health Organization 1990bGroup III excludes all lymphomas See group II cBehaviour codes 0 and 1 are included dBehaviour code 1 is included
Page 47
Endash
Comments and recommendations are welcome Should questions arise on how to use these
materials or for more information please contact
Centers for Disease Control and Prevention National Program of Cancer Registries
4770 Buford Hwy NE Mail Stop K-53
Atlanta GA 30042-3717
Voice Information System 1 (888) 842-6355 bull Fax (770) 488-4760
cancerinfocdcgov bull httpwwwcdcgovcancer
All materials are in the public domain and may be reproduced or copied without permission citation
to source however is appreciated
BACK COVER
(WHITE)
Spine(WHITE)
DATA COLLECTION OF PRIMARY CEN
TRAL NERVOUS SYSTEM
TUM
ORS 2004
National Program of Cancer Registries Training M
aterials
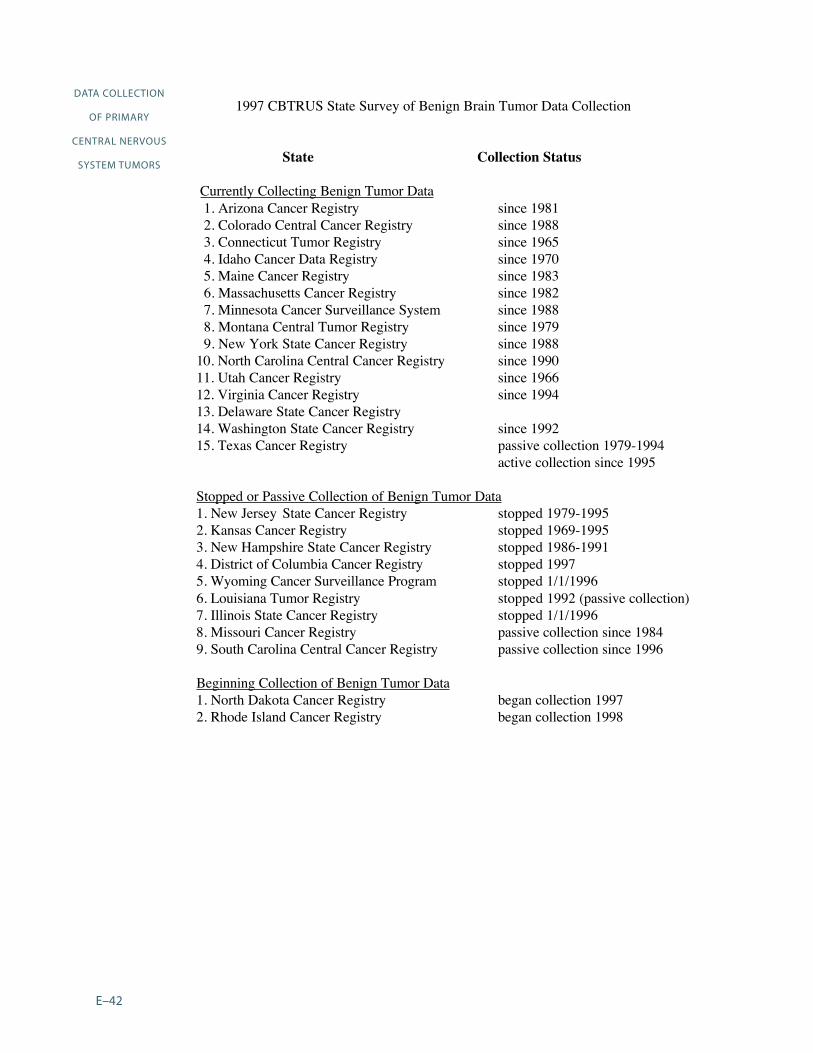
APPENDIX E
LOCAL EXTENSIONS FROM REGIONAL TUMORS Chordomachondrosarcoma 9370
UNCLASSIFIED TUMORS Hemangioma 9120 9121 9130 9131 Neoplasm benign 80000 8010 Neoplasm uncertain behavior 80001 80011 Neoplasm malignant 80003 80013 8002 8003 All other 8720 9580
aWHO = World Health OrganizationbICD-O = International Classification of Diseases for Oncology Second Edition 1990 cNOS=Not Otherwise Specified
Page 45
Endash
DATA COLLECTION
OF PRIMARY
CENTRAL NERVOUS
SYSTEM TUMORS
Endash
International Classification of Childhood Cancer (ICCC)
Diagnostic Group
ICD-Oa codes
Morphology Topography
I LEUKAEMIA
(a) Lymphoid leukaemia 9820-9827 9850
(b) Acute non-lymphocytic leukaemia 9840 9841 9861 9864 9866 9867 98919894 9910
(c) Chronic myeloid leukaemia 9863 9868
(d) Other specified leukaemias 9830 9842 9860 9862 9870-9890 9892 98939900 9930-9941
(e) Unspecified leukaemias 9800-9804
II LYMPHOMAS AND OTHER RETICULOENDOTHELIAL NEOPLASMS
(a) Hodgkinrsquos disease 9650-9667
(b) Non-Hodgkinrsquos lymphoma 9591-9595 9670-9686 9690-9714 9723
(c) Burkittrsquos lymphoma 9687
(d) Miscellaneous lymphoreticular neoplasms 9720 9731-9764
(e) Unspecified lymphomas 9590
III CENTRAL NERVOUS SYSTEM (CNS) ANDMISCELLANEOUS INTRACRANIAL AND
INTRASPINAL NEOPLASMSb
(a) Ependymomac 9383 9390-9394
(b) Astrocytoma 9380 C723
9381 9400-9441
(c) Primitive neuroectodermal tumours 9470-9473
(d) Other gliomasd 9380 C700-C722C724-C729
9382 9384
9442-9460 9481
APPENDIX E
Diagnostic Group
ICD-Oa codes
Morphology Topogragphy
III CNS AND MISCELLANEOUS INTRACRANIAL AND INTRASPINAL
NEOPLASMSb Continued
(e) Miscellaneous intracranial and intraspinalneoplasmsc
8270-8281 8300 9350-9362 9480 95059530-9539
(f) Unspecified intracranial and intraspinalneoplasmsc
8000-8004 C700-C729C751-C753
IV SYMPATHETIC NERVOUS SYSTEM TUMOURS
(a) Neuroblastoma and ganglioneuroblastoma 9490 9500
(b) Other sympathetic nervous system tumours 8680 8693-8710 9501-9504 9520-9523
aInternational Classification of Diseases for Oncology Second Edition World Health Organization 1990bGroup III excludes all lymphomas See group II cBehaviour codes 0 and 1 are included dBehaviour code 1 is included
Page 47
Endash
Comments and recommendations are welcome Should questions arise on how to use these
materials or for more information please contact
Centers for Disease Control and Prevention National Program of Cancer Registries
4770 Buford Hwy NE Mail Stop K-53
Atlanta GA 30042-3717
Voice Information System 1 (888) 842-6355 bull Fax (770) 488-4760
cancerinfocdcgov bull httpwwwcdcgovcancer
All materials are in the public domain and may be reproduced or copied without permission citation
to source however is appreciated
BACK COVER
(WHITE)
Spine(WHITE)
DATA COLLECTION OF PRIMARY CEN
TRAL NERVOUS SYSTEM
TUM
ORS 2004
National Program of Cancer Registries Training M
aterials
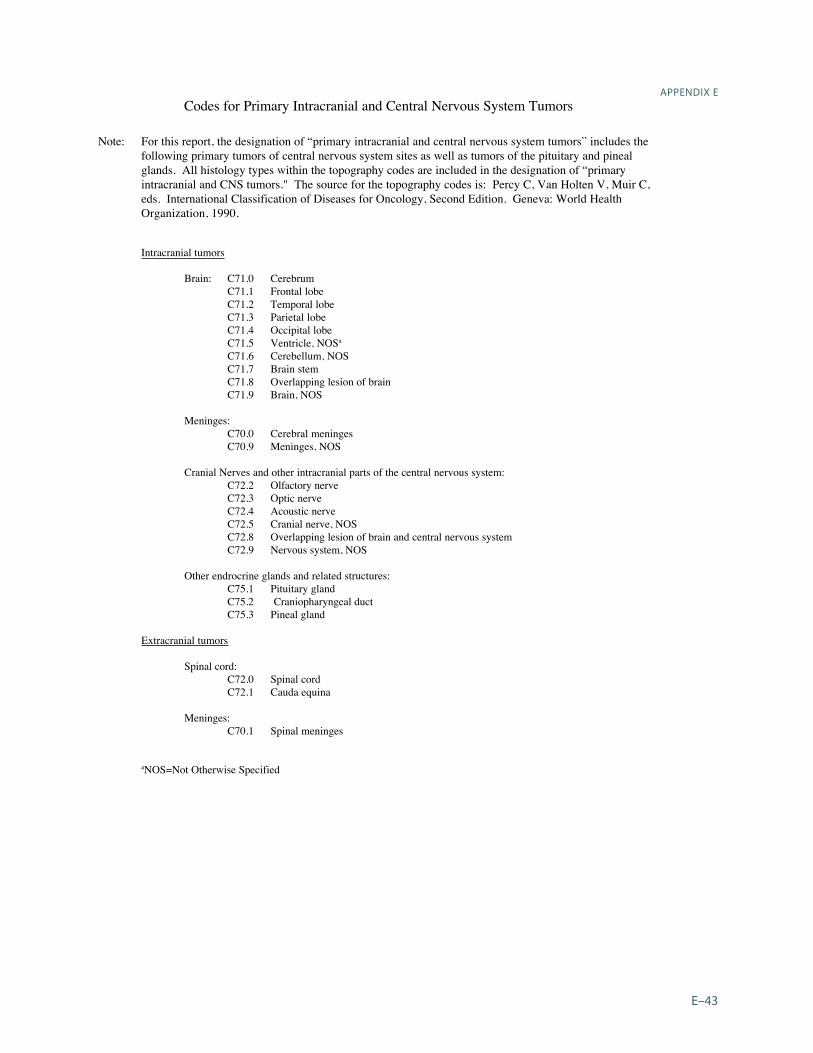

BACK COVER
(WHITE)
Spine(WHITE)
DATA COLLECTION OF PRIMARY CEN
TRAL NERVOUS SYSTEM
TUM
ORS 2004
National Program of Cancer Registries Training M
aterials
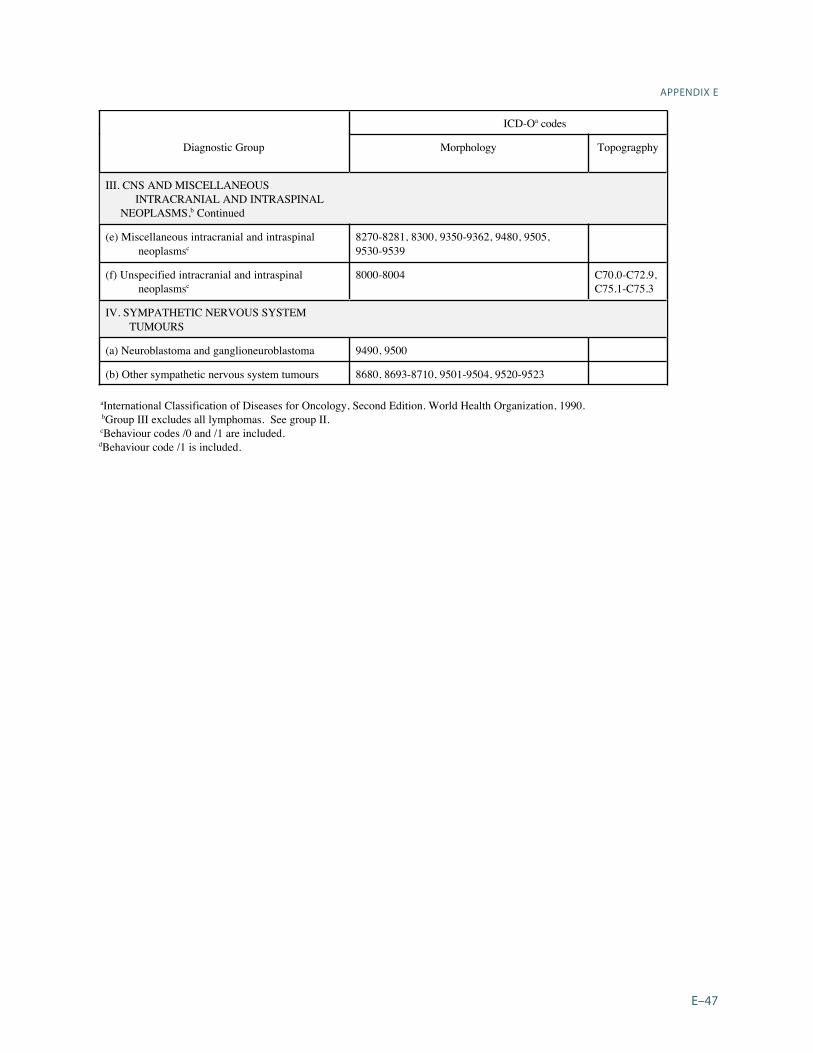
Spine(WHITE)
DATA COLLECTION OF PRIMARY CEN
TRAL NERVOUS SYSTEM
TUM
ORS 2004
National Program of Cancer Registries Training M
aterials