surface uv irradiance from omi on eos aura
TRANSCRIPT

Surface UV Irradiance from OMI on EOS Aura
Atmospheric Science ConferenceESRIN, 8-12 May 2006Aapo Tanskanen
ContentsOMI Surface UV Algorithm
N. Krotkov /GEST Center, University of MarylandJ. Herman /NASA GSFCA. Tanskanen, A. Arola /FMIpaper: ”Surface Ultraviolet Irradiance from OMI”, IEEE TGRS Aura Special Issue, May 2006
Validation of the OMI Surface UV DataA. Määttä, A. Tanskanen, J. Kaurola, T. Koskela, A. Karpetchko /FMIV. Fioletov / MSC Environment CanadaG. Bernhard / Biospherical Instrumentsposter: ”Validation of the OMI surface UV data” in the AGU fall meeting, 5-9 Dec, 2005
OMI is a contribution of NIVR in collaboration with FMI to the EOS Aura mission of NASA. Scientific use of OMI data is coordinated by KNMI, NASA and FMI.

UV radiation affects• Human health: skin cancer,
cataracts, immune system, vitamin D synthesis
• Aquatic and terrestrial ecosystems
• Materials• Additionally, UV is involved in
various atmospheric and other processes by photochemical reactions
Surface UV depends on• Solar zenith angle• Total column ozone• Clouds• Aerosols• Surface albedo• Topography
Some Background Information about UV
There is a need for UV forecasts and longterm monitoring of UV. These services are being developed for example within the PROMOTE GSE of ESA.
http://www.gse-promote.org/
OMI Surface UV Algorithm and Surface UV Products
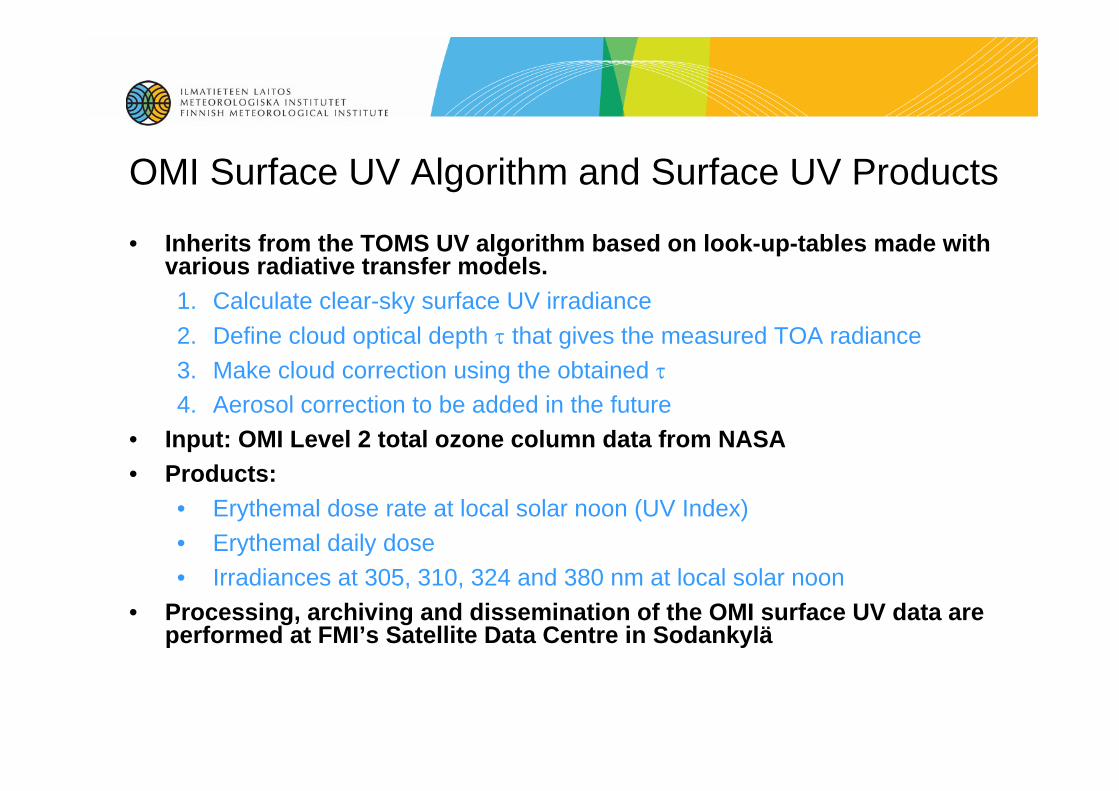
• Inherits from the TOMS UV algorithm based on look-up-tables made with various radiative transfer models. 1. Calculate clear-sky surface UV irradiance2. Define cloud optical depth τ that gives the measured TOA radiance3. Make cloud correction using the obtained τ4. Aerosol correction to be added in the future
• Input: OMI Level 2 total ozone column data from NASA• Products:
• Erythemal dose rate at local solar noon (UV Index)• Erythemal daily dose• Irradiances at 305, 310, 324 and 380 nm at local solar noon
• Processing, archiving and dissemination of the OMI surface UV data are performed at FMI’s Satellite Data Centre in Sodankylä

Current Processing Status• Currently, some 7000 granules out of
the total 8000 ECS Collection 2 OMTO3 granules have been processed.
• The data corresponds to a time period from August 17, 2004 to February 4, 2006.
• The OMI UV data (OMUVB) are archived locally in Sodankylä and have been submitted to the Aura Validation Data Center. AVDC provides overpass data for some 80 sites for OMI validation teams.
• There are plans to reprocess all the data as a new version of the OMTO3 data becomens available.
607000OMUVB
4008000OMTO3
Size in GBytes
Number of HDF5 granules
Dataset

• FMI has developed a satellite data archive in Sodankylä as a part of the EUMETSAT’s O3MSAF project primarily for MetOp data
• The archive is an Oracle based relational database with WWW user interface for search, online plotting and download of data
• OMI surface UV data is used for testing of the archive and the user interface
Level 2 OMUVB data in HDF-EOS5
Online plotting of gridded data
Local time series in ASCII
UV effect research
General public
Registered scientific users
Data user group

Example: UV Index in October 15, 2005

Examples: Daily Erythemal Dose (kJ/m2) in May 11, 2005
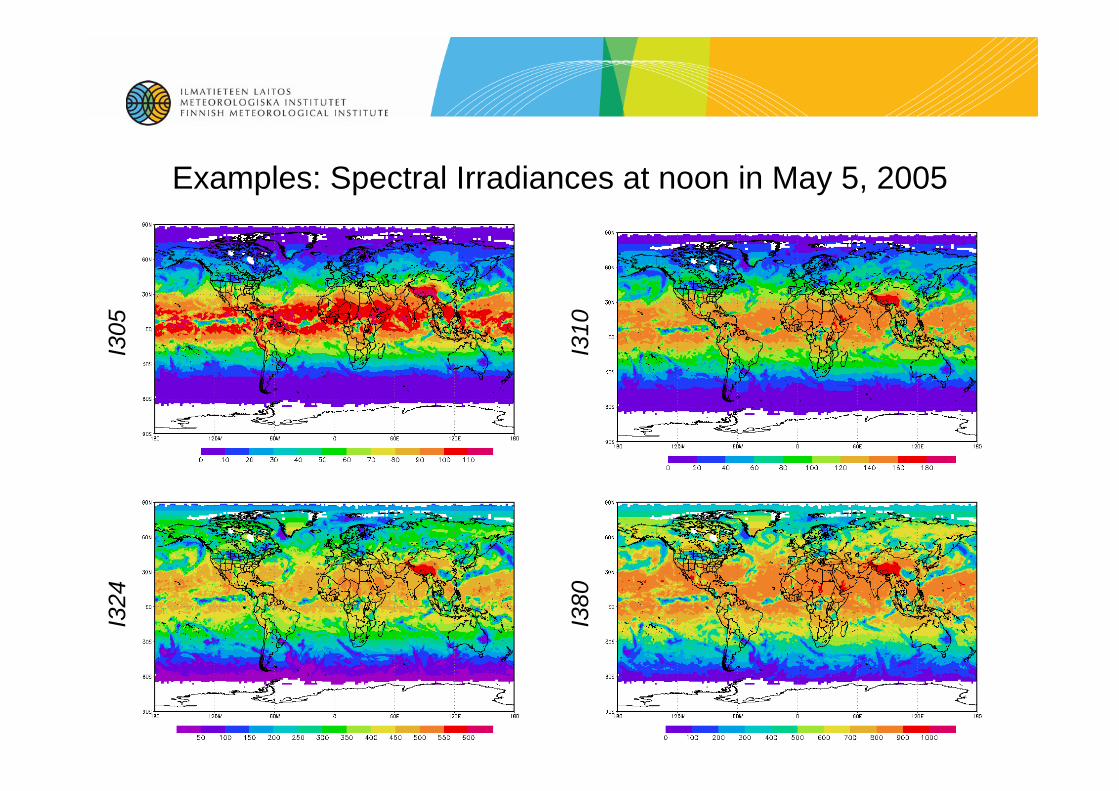
Examples: Spectral Irradiances at noon in May 5, 2005
I305
I310
I324
I380

OMI Surface UV Validation• Comparison of the OMI UV data with
the EP/TOMS satellite data• Direct comparison of the daily values• Comparison of the monthly zonal averages
• Validation of the OMI UV data with ground-based spectral UV measurement data• Comparison of the daily doses• Reference data from FMI, NSF, MSC
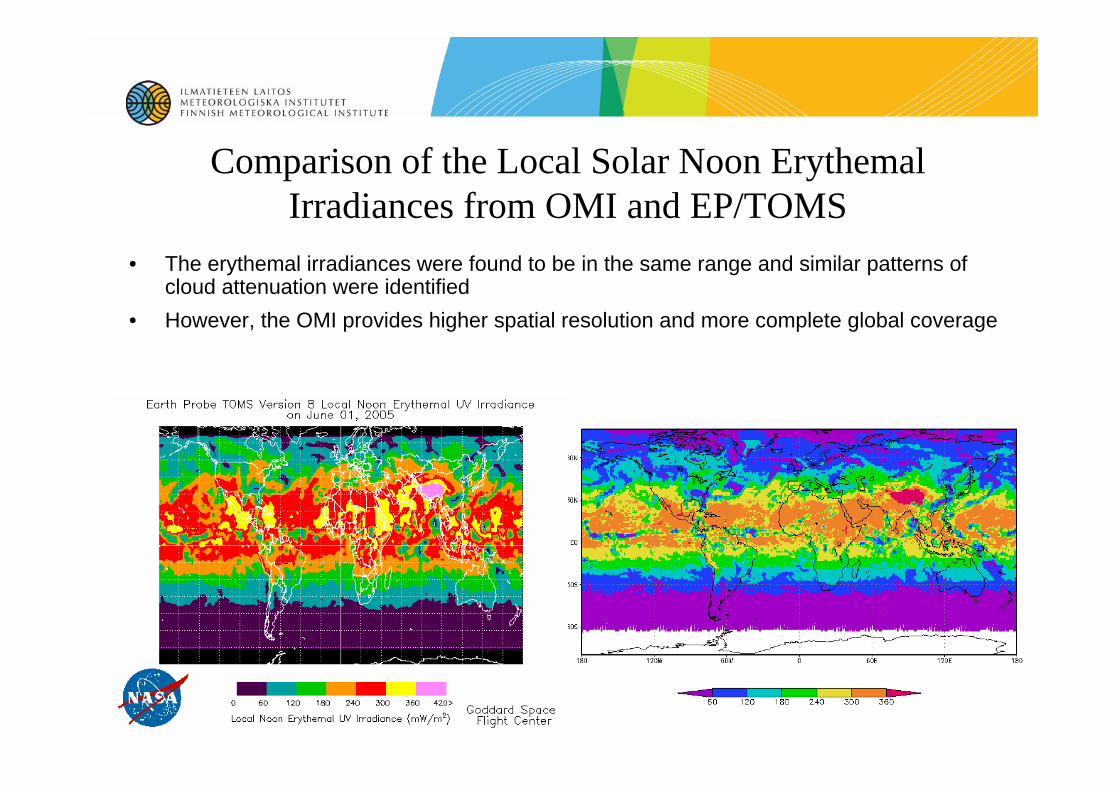
• The erythemal irradiances were found to be in the same range and similar patterns of cloud attenuation were identified
• However, the OMI provides higher spatial resolution and more complete global coverage
Comparison of the Local Solar Noon Erythemal Irradiances from OMI and EP/TOMS
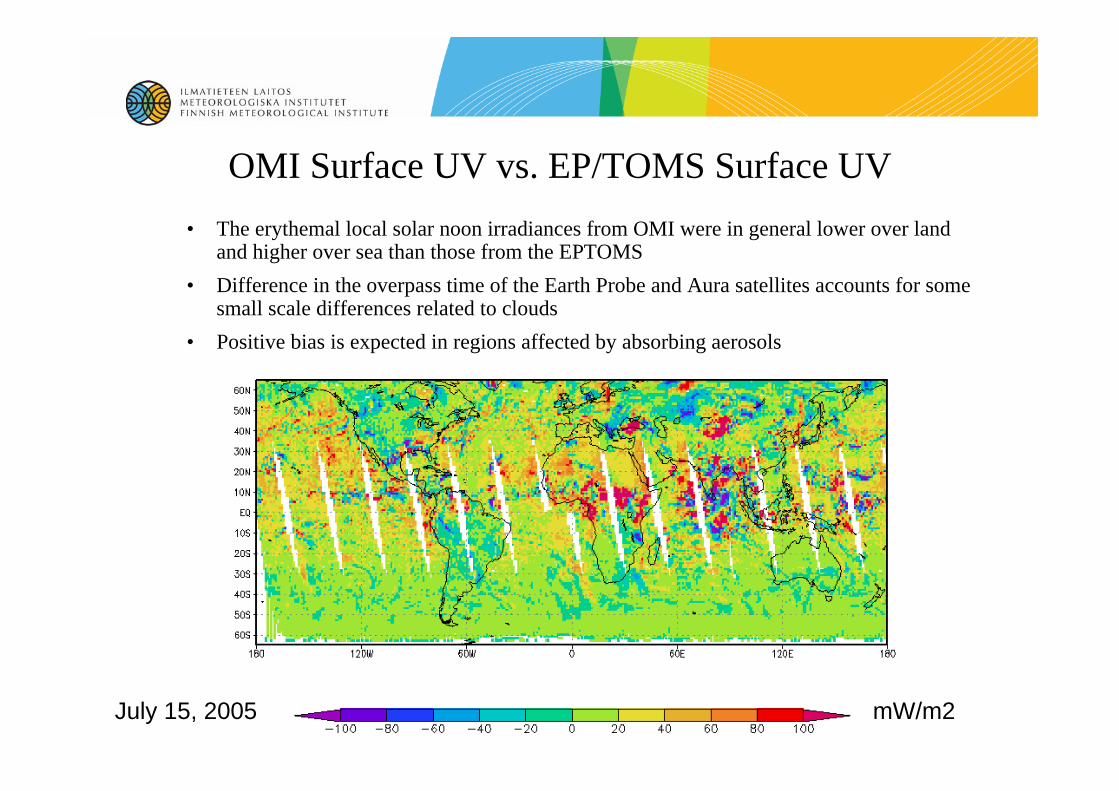
OMI Surface UV vs. EP/TOMS Surface UV• The erythemal local solar noon irradiances from OMI were in general lower over land
and higher over sea than those from the EPTOMS• Difference in the overpass time of the Earth Probe and Aura satellites accounts for some
small scale differences related to clouds• Positive bias is expected in regions affected by absorbing aerosols
July 15, 2005 mW/m2
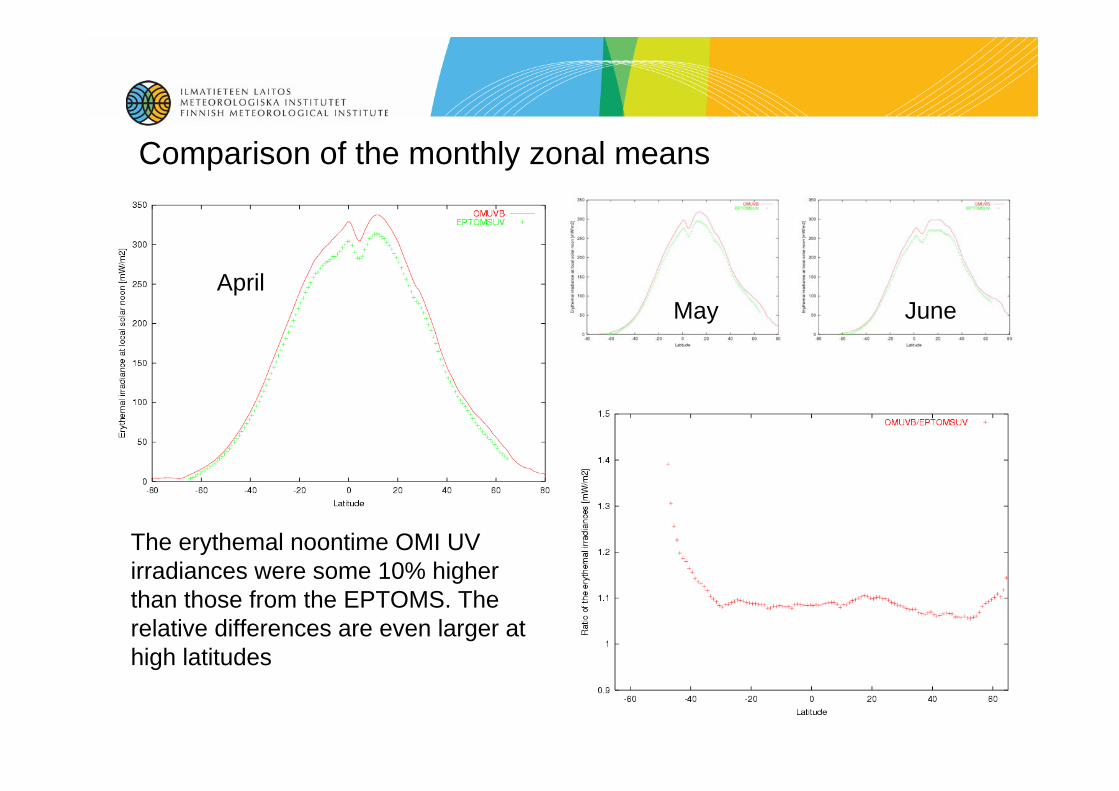
Comparison of the monthly zonal means
AprilMay June
The erythemal noontime OMI UV irradiances were some 10% higher than those from the EPTOMS. The relative differences are even larger at high latitudes

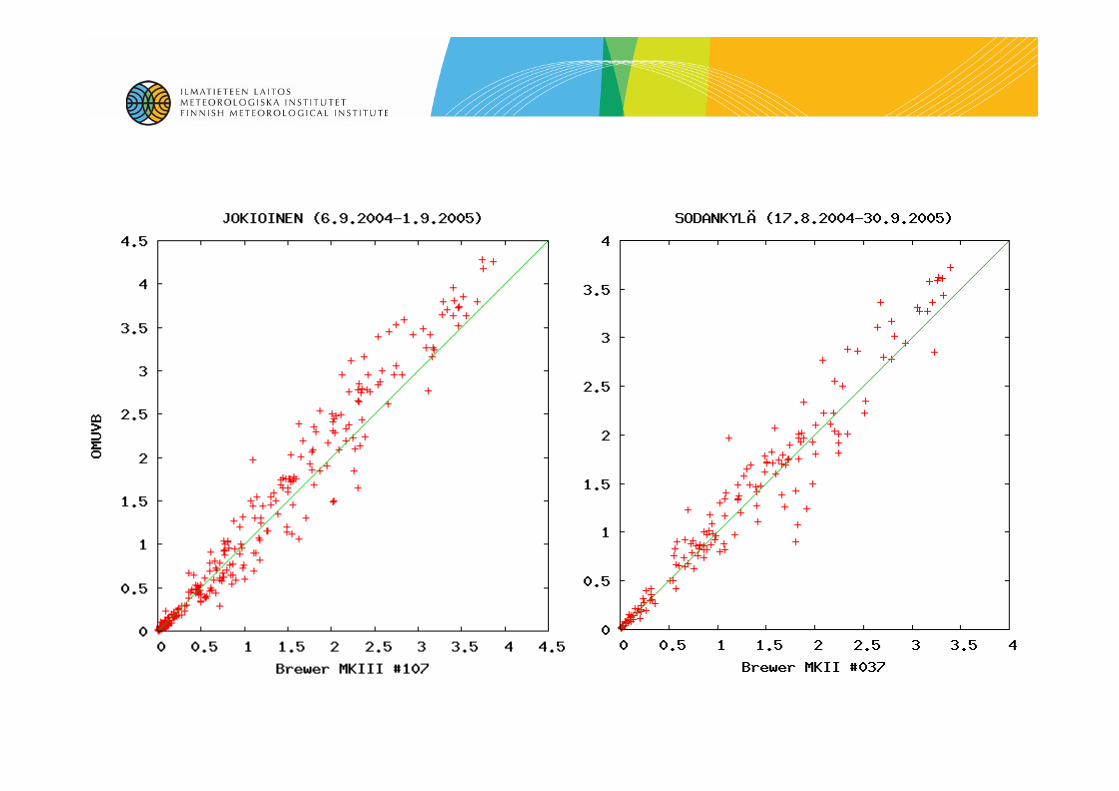
Validation of the OMI UV data with Ground-Based Spectral UV Measurements
• Comparison of the daily erythemal doses • Ground-based reference data
• Brewers in Jokioinen and Sodankylä• SUV100 network data by National
Science Foundation• Canadian Brewer network data from
Meteorological Service of Canada• Additional data in near future

Dai
ly e
ryth
emal
dos
e (k
J/m
2)
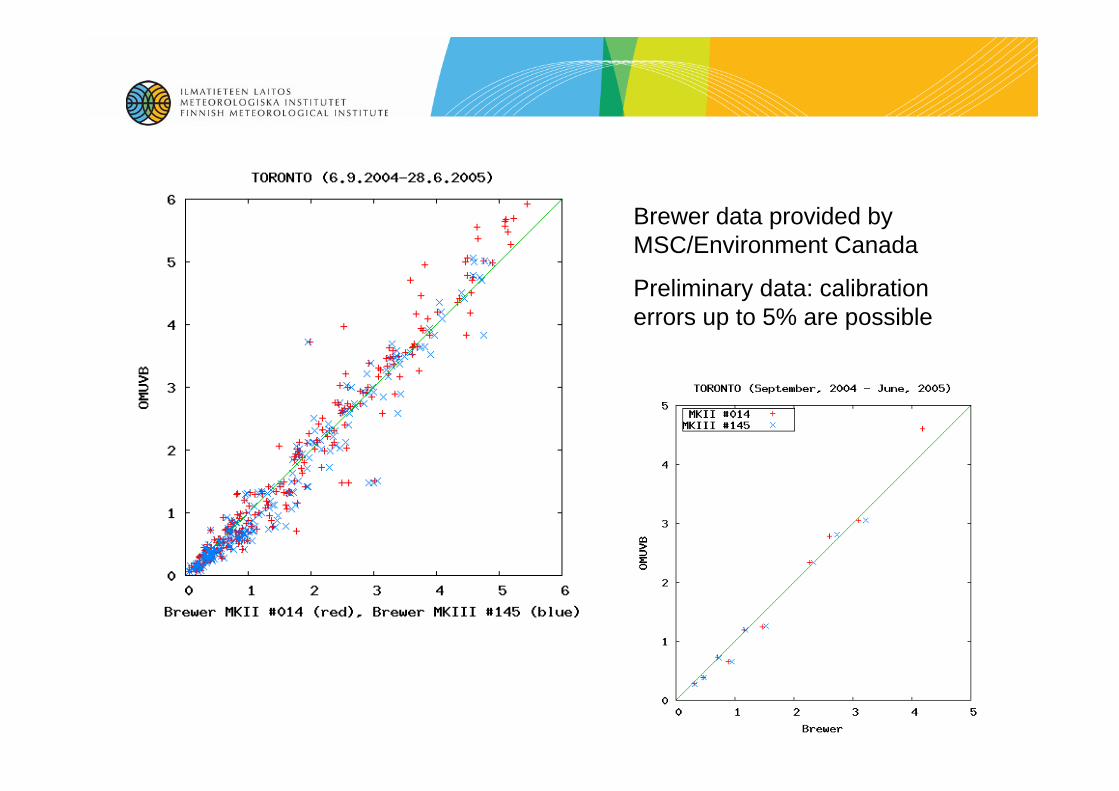
Brewer data provided by MSC/Environment Canada
Preliminary data: calibration errors up to 5% are possible

SUV-100 data provided by NSF UV Monitoring Network, operated by Biospherical Instruments Inc. under a contract from the US National Science Foundation’s Office of Polar Programs via Raytheon Polar Services Company.
Preliminary Version 0 data: no cosine correction, Version 2 data will be higher by 4-10%

Validation Statistics for Daily Doses from OMI [kJ/m2]
0.492
0.379
0.974
0.322
0.336
0.234
0.263
RMS
0.221
0.089
0.768
-0.092
0.001
0.050
0.083
Bias
0.9725%-9.4%232Toronto Brewer Mk-III #145
0.9541%31%293San Diego SUV-100
0.9725%2.6%339Ushuaia SUV-100
0.9436%19%203Barrow SUV-100
0.9824%-3.7%262Toronto Brewer Mk-II #014
0.9722%7.6%175Sodankylä Brewer Mk-II #037
0.9834%5.2%292Jokioinen Brewer Mk-III #107
r%RMS%BiasnValidation instrument
∑ ∑∑∑= ===
∗⎟⎟⎠
⎞⎜⎜⎝
⎛ −=−=∗⎟⎟
⎠
⎞⎜⎜⎝
⎛ −=−=
n
i
n
i i
iin
iii
i
iii
n
ii g
gsn
RMSgsn
RMSg
gsn
Biasgsn
Bias1
2
11
2
1
%1001% )(1 %1001% )(1
r stands for the correlation coefficient

Conclusions• Analog to the TOMS total column ozone time-series the surface UV
time-series are continued with the OMI measurement data applying an algorithm that is similar to the TOMS UV algorithm
• First validation results imply anticipated accuracy of the OMI surface UV data. Thus, the current version data will be published soon!
• The validation effort continues: use more reference data from ground-based instruments, validate also noontime irradiances, elaborate the statistical analysis of validation results
• During the OMI ST meeting in June 20-23 in De Bilt a workshop on the future development of the OMI surface UV algorithm will be organized. Some of the discussion topics are:• Correction for absorbing aerosols• Additional UV products• New methods to account for the effects clouds and snow albedo• Homogenization of the UV time-series from multiple instruments

OMI Very-Fast-Delivery
OMI data is received by Direct Broadcast in Sodankylä and is processed immediately after each overpass of the Aura satellite. Distribution plots for total column ozone, UV Index and Erythemal daily dose are published within 30 minutes after the overpass at
http://omivfd.fmi.fi/index_eng.html