suppression of methanogenesis in cellulose-fed microbial fuel cells in relation to performance,...
TRANSCRIPT

Bioresource Technology 129 (2013) 281–288
Contents lists available at SciVerse ScienceDirect
Bioresource Technology
journal homepage: www.elsevier .com/locate /bior tech
Suppression of methanogenesis in cellulose-fed microbial fuel cells in relationto performance, metabolite formation, and microbial population
Hamid Rismani-Yazdi a,1, Sarah M. Carver b,c,2, Ann D. Christy a,⇑, Zhongtang Yu d, Kyle Bibby e,3,Jordan Peccia e, Olli H. Tuovinen b,c
a Department of Food, Agricultural and Biological Engineering, Ohio State University, 590 Woody Hayes Drive, Columbus, OH 43210, USAb Department of Microbiology, Ohio State University, 484 West 12th Ave., Columbus, OH 43210, USAc Department of Chemistry and Bioengineering, Tampere University of Technology, FI-33101 Tampere, Finlandd Department of Animal Sciences, Ohio State University, 2029 Fyffe Road, Columbus, OH 43210, USAe Department of Chemical and Environmental Engineering, Yale University, 9 Hillhouse Ave., New Haven, CT 06520, USA
h i g h l i g h t s
" Methanogenesis was active in cellulose-fed MFCs but declined on prolonged operation." Coulombic efficiencies increased as methanogenesis became undetectable." Acetic acid was the main metabolite of cellulose degradation in MFCs." Bacterial and archaeal diversities decreased over the 90 day operation." Firmicutes, Methanoculleus, and Methanobrevibacter were the most dominant.
a r t i c l e i n f o
Article history:Received 12 September 2012Received in revised form 24 October 2012Accepted 26 October 2012Available online 9 November 2012
Keywords:CelluloseMethanogensMicrobial fuel cells454 Pyrosequencing16S rRNA
0960-8524/$ - see front matter � 2012 Elsevier Ltd. Ahttp://dx.doi.org/10.1016/j.biortech.2012.10.137
⇑ Corresponding author. Tel.: +1 (614) 292 3171; faE-mail address: [email protected] (A.D. Christy).
1 Present address: Department of Chemical EngineerTechnology, Cambridge, MA 02139, USA.
2 Present address: Department of Horticulture, C14853, USA.
3 Present address: Department of Civil and Environmof Pittsburgh, Pittsburgh, PA 15261, USA.
a b s t r a c t
The objective of this work was to evaluate methanogenesis in relation to the changes in performance andmicrobial diversity of cellulose-fed microbial fuel cells (MFCs). Replicate MFCs were inoculated with aruminal microbial consortium and operated under 20 (R20X) or 100 X (R100X) external resistances. Duringthe first week of operation, 0.31 and 0.44 mmol l�1of methane were produced in the R20X and R100X
MFCs, respectively. Methanogenesis was, however, suppressed to undetectable levels within 90 days ofoperation, accompanied with increased current production and improved coulombic efficiency. Sup-pressed methanogenesis coincided with changes in the concentrations of short chain fatty acids and adecrease in the microbial diversity. The results demonstrated that methanogenesis was active duringthe early stage of cellulose-fed MFCs but this activity declined over prolonged operation.
� 2012 Elsevier Ltd. All rights reserved.
1. Introduction
Microbial fuel cells (MFCs) represent a sustainable technologyfor treating wastes and generating renewable electricity. Effortshave been made in recent years to improve the power output ofMFCs by optimizing reactor design, electrode composition, andother engineering aspects in both the anode and cathode chambers
ll rights reserved.
x: +1 (614) 292 9448.
ing, Massachusetts Institute of
ornell University, Ithaca, NY
ental Engineering, University
(Qiao et al., 2010). Relatively less effort has been devoted toimproving substrate oxidation efficiency, electron donation to theclosed circuit, and preventing undesirable side reactions (Heet al., 2005; Kim et al., 2005). MFCs inoculated with mixed micro-bial populations inevitably have concurrent metabolic pathwaysthat may lead to undesirable side reactions that drain electronsaway from the circuit.
The ideal biochemical premise for electricity generation inMFCs is the transfer of electrons to the anode through microbialelectron transport systems. Some microorganisms have beenshown to transfer electrons to the anode via electrically conductivepili and biofilm formation but these interactions are poorly under-stood (Logan, 2009). Other mechanisms may include direct transferof electrons via microbial cytochromes or excreted mediators (Lo-gan, 2009). In MFCs fed with wastewater or biomass polymers,

282 H. Rismani-Yazdi et al. / Bioresource Technology 129 (2013) 281–288
metabolism by microbial consortia proceeds via shuttling of reduc-ing equivalents by fermentation pathways and electron transport-coupled anaerobic respiration. External electron acceptors such asMn(IV), nitrate, Fe(III), sulfate, or fumarate are typically excludedfrom MFCs as their reduction would scavenge electrons away fromanode reduction. Methanogenesis, in contrast, cannot be elimi-nated by virtue of electron donor exclusion because H2, acetate,and CO2 are formed through degradation of organic compoundsand fermentative pathways. Since methanogenesis utilizes elec-trons otherwise available for electricity producing pathways, ithas been shown to decrease the coulombic efficiency in MFCs (Fre-guia et al., 2007).
Methanogenesis can be suppressed through changing feedstockconditions. Lee et al. (2008) showed that energy-conversion effi-ciency in glucose-fed MFCs that produced methane was 3.7% of ini-tial COD, whereas methane was not detected in acetate-fed MFCs.In an ethanol-fed microbial electrolysis cell, which generates H2
rather than electricity, about 25% of the electrons were divertedto methane formation (Parameswaran et al., 2009). Upon suppres-sion of methanogens with 2-bromoethanesulfonate, almost allreducing equivalents were converted to H2. Other studies haveshown that anodic conditions such as redox potential, pH, lowpulses of oxygen, timing of batch feeding, and applied voltagecan be used to modulate methane production (Freguia et al.,2007; Wang et al., 2009; Zhuang et al., 2010). The presence ofmethanogens in MFC systems has been confirmed via microscopicand PCR-based approaches (He et al., 2005; Ishii et al., 2008b; Jungand Regan, 2011).
Methane production has been previously reported for MFCs thathave been inoculated with environmental samples of knownsources of methanogens such as waterlogged soils or anaerobicsludge (Rabaey et al., 2004; Kim et al., 2005; He et al., 2005; Ishiiet al., 2008a,b). In the rumen ecosystem, methanogenesis is com-mon and poses a potential drawback when using the highly cellu-lolytic consortium as an inoculum in cellulose-fed MFCs (Rismani-Yazdi et al., 2007). It was hypothesized in the present study thatmethanogens would be present in cellulose-fed MFCs becausethe original inoculum was rumen fluid. The purpose of this studywas to characterize the diversity of methanogens and track theirchanges over time in relation to the current production, coulombicefficiency, and metabolite formation in cellulose-fed MFCs.
2. Methods
2.1. Construction and operation of MFCs
Replicate MFCs comprised of two compartments, anode andcathode of equal dimensions and volume separated by a proton ex-change membrane, were constructed as reported previously (Ris-mani-Yazdi et al., 2011). The anode compartments (75 mlworking volume each) were filled with nutrient medium underanaerobic conditions and inoculated with a bovine ruminal micro-bial consortium prepared as previously described (Rismani-Yazdiet al., 2011). The cathode compartments contained an aerobic solu-tion of 50 mM potassium hexacyanoferrate in 100 mM phosphatebuffer (Park and Zeikus, 2003), which was replenished every2 days. Ball-milled, microcrystalline cellulose (Sigmacell, Type20) was used as the feedstock in the anode compartments. TheMFCs were operated for 90 days. They received 5 g l-1 celluloseduring the first week of the experiment, and then were fed 1 g l-1
cellulose every other day (day 8 through 90) by replacing 10 mlof the anolyte with fresh medium. The MFCs were operated at39 ± 1 �C on a shaker at 100 rev min-1. The pH of the anolyte wasmonitored and adjusted to pH 6.8 with NaOH or HCl. In order tomaintain anaerobic conditions throughout the experiment, the
preparation of MFCs and addition of substrate were done underO2-free N2 stream and sampling was performed inside an anaero-bic chamber.
2.2. Electrical measurements
Two MFCs with a 20 X external resistor and two with 100 X wereused in this study. The difference in the potential (V) between theanode and cathode was measured every 10 s using a computer con-trolled Agilent HP 34970 data acquisition unit (Agilent Technologies,Santa Clara, CA). The current (I, amps) was calculated according toOhm’s law (I = V/R), where V is the measured voltage (V) and R (X)is the known external resistance. The current density (mA m�2)was calculated using the anode surface area of 40 cm2. The volumet-ric power density (W m�3) was computed as the product of the volt-age, current and the reciprocal of the working volume of the anodecompartment. Polarization tests were performed on day 73 by vary-ing the external resistance between the electrodes stepwise from1 MX to 5 X using a resistance decade box (Extech Instruments,Waltham, MA) with a pause at each resistance to allow voltage toreach equilibrium. Coulombic efficiency (CE) was calculated as theratio of the coulombic output, computed by integrating the electricalcurrent (I) over time, to the theoretical amount of coulombs avail-able from glucose equivalents through cellulose hydrolysis as de-scribed previously (Rismani-Yazdi et al., 2011).
2.3. Analytical techniques
Methane concentration in the headspace of the anode compart-ment of MFCs was analyzed during the first week (days 1–7) andthe last 2 weeks (days 77–90) of the experiment. The headspacegas of the anode compartment of each MFC was collected in Tedlargas sampling bags (Zefon International, Ocala, FL) attached to the an-ode chamber using a three-way valve. The methane concentration ofthe headspace gas was analyzed using a Shimadzu GC-2014 gaschromatograph equipped with a Porapak N column (2 m � 1/8 in. � 2.0 mm I.D., Varian, Palo Alto, CA) and a thermal conductivitydetector with N2 as the carrier gas. Injection, detection and columntemperatures were maintained at 110, 110 and 180 �C, respectively.Short chain fatty acids in the anolyte samples were separated andquantified by HPLC (Rismani-Yazdi et al., 2011).
2.4. DNA extraction, 454 pyrosequencing and analysis
The biomass of planktonic and anode-colonizing microorgan-isms was harvested by sampling the anolyte and scraping the bio-film off the anode, respectively. Extraction of genomic DNA wasperformed using a repeated bead beating method followed byDNA purification with QIAamp columns (Qiagen, Valencia, CA)(Yu and Morrison, 2004). The DNA quantity from each samplewas determined fluorometrically using a Quant-iT broad rangeDNA assay kit (Molecular Probes, Eugene, OR). The extractedDNA from inoculum, planktonic cells sampled on day 16, 49, and73, and biofilm sampled on day 73 were used to generate nine(one for the inoculum and 4 for each of the two external resis-tances) bacterial and nine archaeal amplicon libraries of 16S rRNAgenes V3-V5 regions. Amplicon libraries were sequenced using 454GS FLX Titanium (454 Life Sciences, Branford, CT). Each library wasamplified separately using special fusion primers constructed fol-lowing 454 Life Sciences’ instructions to include adaptors, librarykey, multiplex identifiers, and universal bacterial primers 343F50-TACGGRAGGCAGCAG-30 and 926R 50-CCGTCAATTYYTTTRAGTTT-30 (Liu et al., 2007; Wang and Qian, 2009), or archaeal spe-cific primers ARC346-F 5-GGGGYGCAGCAGGCG-30 and ARC915-R5-GTGCTCCCCCGCCAATTCCT-30 (Wang and Qian, 2009). Fusionprimers were evaluated using the prediction algorithm of Inte-
H. Rismani-Yazdi et al. / Bioresource Technology 129 (2013) 281–288 283
grated DNA Technologies (http://www.idtdna.com/analyzer/Appli-cations/OligoAnalyzer/) to ensure that they did not form primerduplex and hairpin structures. PCR amplification was conductedin 50-ll volumes containing 1� PCR master mix (Roche AppliedScience, Indianapolis, IN), 0.4 lM of each primer, and 2 ll of DNAtemplate (10 ng ll�1). After an initial denaturation step (94 �C for4 min), 25 amplification cycles were performed as follows: dena-turation at 94 �C for 30 s, annealing at 56 �C for 30 s, and extensionat 72 �C for 60 s, followed by a final extension at 72 �C for 8 min.Four reactions were conducted for each sample, and the replicateswere pooled and purified using Qiagen MinElute PCR purificationkit (Yates et al., 2012). Amplicons were visualized on a 1.2% aga-rose gel, then excised and purified, if smearing was observed, usinga Qiagen MinElute gel extraction kit.
Each purified amplicon library was quantified using the Quant-iT PicoGreen dsDNA Assay Kit (Invitrogen, Carlsbad, CA). Bacterialand archaeal amplicon libraries were pooled separately at equalconcentrations, and then verified for concentration and purity ona 2100 Bioanalyzer (Agilent Technologies, Santa Clara, CA) priorto sequencing. Pooled amplicon libraries were processed sepa-rately through emulsion PCR using the Lib-A Kit according to themanufacturer’s instructions (Roche Applied Science), and se-quenced in two regions of a single PicoTiterPlate. Sequencingwas performed at the Yale Center for Genome Analysis. Nucleotidesequences were subjected to quality control based on the phredscores on consensus bases. Denoising was conducted using Tita-nium Pyronoise software (Caporaso et al., 2010).
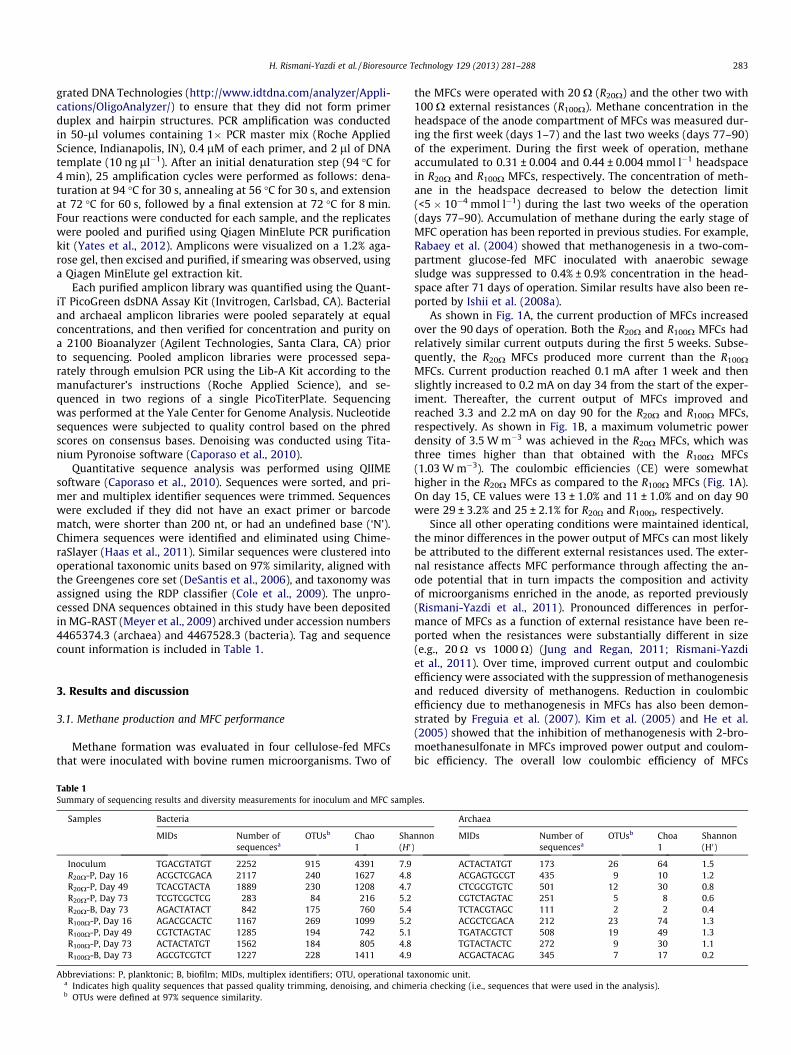
Quantitative sequence analysis was performed using QIIMEsoftware (Caporaso et al., 2010). Sequences were sorted, and pri-mer and multiplex identifier sequences were trimmed. Sequenceswere excluded if they did not have an exact primer or barcodematch, were shorter than 200 nt, or had an undefined base (‘N’).Chimera sequences were identified and eliminated using Chime-raSlayer (Haas et al., 2011). Similar sequences were clustered intooperational taxonomic units based on 97% similarity, aligned withthe Greengenes core set (DeSantis et al., 2006), and taxonomy wasassigned using the RDP classifier (Cole et al., 2009). The unpro-cessed DNA sequences obtained in this study have been depositedin MG-RAST (Meyer et al., 2009) archived under accession numbers4465374.3 (archaea) and 4467528.3 (bacteria). Tag and sequencecount information is included in Table 1.
3. Results and discussion
3.1. Methane production and MFC performance
Methane formation was evaluated in four cellulose-fed MFCsthat were inoculated with bovine rumen microorganisms. Two of
Table 1Summary of sequencing results and diversity measurements for inoculum and MFC samp
Samples Bacteria
MIDs Number ofsequencesa
OTUsb Chao1
Sha(H0
Inoculum TGACGTATGT 2252 915 4391 7.9R20X-P, Day 16 ACGCTCGACA 2117 240 1627 4.8R20X-P, Day 49 TCACGTACTA 1889 230 1208 4.7R20X-P, Day 73 TCGTCGCTCG 283 84 216 5.2R20X-B, Day 73 AGACTATACT 842 175 760 5.4R100X-P, Day 16 AGACGCACTC 1167 269 1099 5.2R100X-P, Day 49 CGTCTAGTAC 1285 194 742 5.1R100X-P, Day 73 ACTACTATGT 1562 184 805 4.8R100X-B, Day 73 AGCGTCGTCT 1227 228 1411 4.9
Abbreviations: P, planktonic; B, biofilm; MIDs, multiplex identifiers; OTU, operational taa Indicates high quality sequences that passed quality trimming, denoising, and chimb OTUs were defined at 97% sequence similarity.
the MFCs were operated with 20 X (R20X) and the other two with100 X external resistances (R100X). Methane concentration in theheadspace of the anode compartment of MFCs was measured dur-ing the first week (days 1–7) and the last two weeks (days 77–90)of the experiment. During the first week of operation, methaneaccumulated to 0.31 ± 0.004 and 0.44 ± 0.004 mmol l�1 headspacein R20X and R100X MFCs, respectively. The concentration of meth-ane in the headspace decreased to below the detection limit(<5 � 10�4 mmol l�1) during the last two weeks of the operation(days 77–90). Accumulation of methane during the early stage ofMFC operation has been reported in previous studies. For example,Rabaey et al. (2004) showed that methanogenesis in a two-com-partment glucose-fed MFC inoculated with anaerobic sewagesludge was suppressed to 0.4% ± 0.9% concentration in the head-space after 71 days of operation. Similar results have also been re-ported by Ishii et al. (2008a).
As shown in Fig. 1A, the current production of MFCs increasedover the 90 days of operation. Both the R20X and R100X MFCs hadrelatively similar current outputs during the first 5 weeks. Subse-quently, the R20X MFCs produced more current than the R100X
MFCs. Current production reached 0.1 mA after 1 week and thenslightly increased to 0.2 mA on day 34 from the start of the exper-iment. Thereafter, the current output of MFCs improved andreached 3.3 and 2.2 mA on day 90 for the R20X and R100X MFCs,respectively. As shown in Fig. 1B, a maximum volumetric powerdensity of 3.5 W m�3 was achieved in the R20X MFCs, which wasthree times higher than that obtained with the R100X MFCs(1.03 W m�3). The coulombic efficiencies (CE) were somewhathigher in the R20X MFCs as compared to the R100X MFCs (Fig. 1A).On day 15, CE values were 13 ± 1.0% and 11 ± 1.0% and on day 90were 29 ± 3.2% and 25 ± 2.1% for R20O and R100O, respectively.
Since all other operating conditions were maintained identical,the minor differences in the power output of MFCs can most likelybe attributed to the different external resistances used. The exter-nal resistance affects MFC performance through affecting the an-ode potential that in turn impacts the composition and activityof microorganisms enriched in the anode, as reported previously(Rismani-Yazdi et al., 2011). Pronounced differences in perfor-mance of MFCs as a function of external resistance have been re-ported when the resistances were substantially different in size(e.g., 20 O vs 1000 O) (Jung and Regan, 2011; Rismani-Yazdiet al., 2011). Over time, improved current output and coulombicefficiency were associated with the suppression of methanogenesisand reduced diversity of methanogens. Reduction in coulombicefficiency due to methanogenesis in MFCs has also been demon-strated by Freguia et al. (2007). Kim et al. (2005) and He et al.(2005) showed that the inhibition of methanogenesis with 2-bro-moethanesulfonate in MFCs improved power output and coulom-bic efficiency. The overall low coulombic efficiency of MFCs
les.
Archaea
nnon)
MIDs Number ofsequencesa
OTUsb Choa1
Shannon(H0)
ACTACTATGT 173 26 64 1.5ACGAGTGCGT 435 9 10 1.2CTCGCGTGTC 501 12 30 0.8CGTCTAGTAC 251 5 8 0.6TCTACGTAGC 111 2 2 0.4ACGCTCGACA 212 23 74 1.3TGATACGTCT 508 19 49 1.3TGTACTACTC 272 9 30 1.1ACGACTACAG 345 7 17 0.2
xonomic unit.eria checking (i.e., sequences that were used in the analysis).

Fig. 1. Performance characteristics of MFCs generating electricity from cellulosewith rumen microorganisms as biocatalysts under 20 X and 100 X externalresistances. (A) Current production and coulombic efficiency (CE) of the MFCsduring the course of operation and (B) polarization and power-current densitycharacteristics of the MFCs as determined on day 73.
284 H. Rismani-Yazdi et al. / Bioresource Technology 129 (2013) 281–288
despite suppressed methanogenesis in the present study could bedue to other factors including biomass growth, accumulation ofmetabolites, substrate crossover, and O2 diffusion through themembrane. The exact reason cannot be resolved with these results.Thus, although current production and methanogenesis wereseemingly inversely associated, the results cannot be construedto suggest a causative relationship.
3.2. Changes in metabolite production over time
The anolyte of each MFC was sampled and analyzed to trackshort chain fatty acid (SCFA) metabolites of cellulose fermentationover time. Fig. 2 shows changes in SCFA concentrations at 6, 16, 49,73, and 90 days after MFC inoculation. The concentration of SCFAswas generally lower in the R20X vs. the R100X MFCs, perhaps reflect-ing more efficient SCFA metabolism, which led to increased currentoutput.
Acetic acid was the major SCFA during cellulose metabolism inall MFCs (Fig. 2), followed, in a descending order, by isovaleric, pro-pionic, butyric, valeric, isobutyric, and lactic acids. Pyruvic and fu-maric acids were not detected. Except for acetic and lactic acid, theconcentrations of the SCFAs decreased during the first 73 days ofoperation, and then leveled off. The concentration of acetic acid in-creased over the first 42 days, followed by a decrease on day 73and then remained constant until the end of the experiment. Theconcentration of lactic acid increased slightly over time (Fig. 2).
Changes in the SCFA profile might be attributed to changes inthe microbial community over time and increased consumptionof intermediates by exoelectrogenic bacteria enriched during theMFC operation, as evident by increased performance of the MFCs.In addition, methanogenesis can affect SCFA profiles by influencingH2-producing cellulolytic bacteria. Rychlik and May (2000) re-ported that the metabolism of cellulose-hydrolyzing microorgan-isms in the presence of methanogens increased the production ofacetate instead of more reduced metabolites. This could also ex-plain the higher acetate concentrations observed in the anolytewhen methanogenesis was active as compared to when methaneproduction was suppressed in the MFCs.
3.3. Microbial diversity and structure analyzed by pyrosequencing
To assess the links between performance of the MFCs, methaneproduction, and bacterial and archaeal diversity, DNA samplesfrom the inoculum and MFCs were analyzed by 454 sequencingof 16S rRNA genes (targeting Bacteria and Archaea). Pyrosequenc-ing resulted in a total of 12,624 bacterial and 2519 archaeal 16SrRNA gene sequences that passed quality trimming, denoising,and chimeria checking. The library size for bacterial sequences ran-ged from 2252 to 283 sequences while the archaeal sequences li-brary size ranged from 508 to 111 sequences. Using a 97%similarity cutoff, a total of 1927 and 63 operational taxonomicunits (OTUs) were obtained for the bacterial and archaeal libraries,respectively (Table 1). Of the 1927 bacterial OTUs, 539 (39.0% ofreads) were assigned to genus levels in the GreenGenes core setand 294 (8.6% of reads) were not assigned to phylum level. Ofthe 63 archaeal OTUs, 47 OTUs, representing 99.4% of reads, wereassigned to the genus level, and 10 (0.4% of reads) were not as-signed to phylum level. Sequences with relatively low similarityto existing sequences likely represent either sequencing errors ornovel bacterial and archaeal species which have not been previ-ously retrieved or are yet to be recovered in pure culture.
The diversity of MFCs’ microbial community was different fromthat of the original inoculum and changed in response to time andthe external resistance as indicated by changes in Shannon (H0)and Chao 1 diversity indices (Table 1). The bacterial and archaealcommunities in MFCs were less diverse than those of the inoculumand their diversity decreased during the operation, suggesting selec-tion of bacterial and archaeal populations that were competitiveover time under the MFC conditions. Higher microbial diversitywas observed in R20X MFCs than in R100X MFCs. A comparison ofthe planktonic and biofilm populations on day 73 revealed a morediverse bacterial population in the anode-attached community thanthe suspended population under both external resistances (Table 1).
3.3.1. Bacterial community structureFig. 3 shows the profile of bacterial OTUs at the phylum level for
each sample. The most abundant sequences in the original inocu-lum sample belonged to two phyla, Bacteroidetes and Firmicutes,accounting for 48 and 41% of the total reads, respectively. TheseOTUs were also dominant in the MFCs. However, their representa-tion varied, with Firmicutes and Bacteroidetes comprising 71–82%and 8–21% of the total bacteria, respectively. Other phyla repre-sented smaller fractions (7–16%) of the total bacteria.
In the inoculum sample, Bacteroidetes were primarily comprisedof the family Prevotellaceae (75% of the total Bacteroidetes). Prevo-tella, known for its polysaccharide-degrading abilities, representedthe dominant genus (58%) in the Prevotellaceae family (Fig. 4A). Thedominance of Prevotella in the inoculum sample is in agreementwith previous reports on its abundance in the bovine rumen (Ste-venson and Weimer, 2007).
In contrast to the inoculum sample, Bacteroidetes was more di-verse in the MFC samples, predominantly represented by the fam-

Fig. 2. Concentrations of SCFAs produced in cellulose-fed MFCs over the course of operation. Closed symbols represent results from MFCs with R20X and open symbolsrepresent R100X.
H. Rismani-Yazdi et al. / Bioresource Technology 129 (2013) 281–288 285
ily Bacteroidaceae (22–65% of the total Bacteroidetes), and entirelycomprised of the genus Bacteroides, capable of hydrolyzing com-plex molecules including cellulose.
As shown in Fig. 4B, the phylum Firmicutes was comprised oftwo major families; Lachnospiraceae and Ruminococcaceae, andIncertae Sedis, an unclassified fraction of Firmicutes. The representa-tion of these families in the microbial community varied amongsamples. The family Ruminococcaceae was primarily comprised ofgenus Ruminococcus, with most sequences closely matched cellulo-lytic species Ruminococcus albus and Ruminococcus flavefaciens(Supplementary File 1). A recent study by Khan et al. (2012) hasdemonstrated the ability of Faecalibacterium prausnitzii, a speciesof Ruminococcaceae, to transfer electrons to the anode of an MFCusing riboflavin as an extracellular electron transport mediator.The majority of the close-relatives of the dominant OTUs (supple-mentary file 1) are known to produce acetate as a major fermenta-tion product. Acetate was the main fermentation metabolite incellulose-fed MFCs. The accumulation of acetate suggests that itssubsequent anaerobic respiration was not in concert with fermen-tative formation, and this would partially explain the relatively lowcoulombic efficiencies.
In the Lachnospiraceae family, and also among the Incertae Se-dis, the unclassified taxon of Firmicutes, the majority of se-quences were related to acetogenic bacteria, predominantlyBlautia schinkii, an H2/CO2-utilizing homoacetogen (RieuLesmeet al., 1996), and Sporanaerobacter acetigenes, a known acetogencapable of reducing sulfur (Hernandez-Eugenio et al., 2002)(Supplementary File 1). The occurrence of these acetogens
suggests possible acetogenesis in the MFCs where methanogene-sis was suppressed.
The prevalence of Firmicutes in the MFC samples is consistentwith previous reports on microbial diversity of MFCs fed with fer-mentable substrates and inoculated with environmental samples(Rismani-Yazdi et al., 2007; Ishii et al., 2008b; Timmers et al.,2012). Electricity generation from cellulose primarily relies on cel-lulolytic bacteria, many of which were identified here as membersof Firmicutes (Supplementary File 1). Cellulolytic bacteria breakdown beta 1–4 glycosidic bonds in cellulose and ferment the resul-tant sugars to SCFAs, CO2, and H2 that can be utilized as substrates,by other microorganisms including anode-reducers and methano-gens in MFCs. Occurrence of such synergistic interaction in MFCs issupported by recent findings of Parameswaran et al. (2009). Theseauthors demonstrated a syntrophic relation among ethanol fer-menting bacteria, H2-oxidizing methanogens or homo-acetogens,and anode-reducing bacteria that directed electron flow to meth-ane or electricity in the anode biofilm of ethanol-fed microbialelectrolysis cells. Furthermore, some members of the Firmicuteshave been shown to be exoelectrogenic; (Khan et al., 2012).
More pronounced differences in the community compositionwere observed among the less abundant (i.e., minor) phyla(Fig. 3B). Sequences belonging to the Fibrobacteres and Cyanobacte-ria phyla were detected in the inoculum sample (<1% of the totalreads), but were not present in the MFC samples. Two phyla, Fuso-bacteria and Deferribacteres, were not detected in the inoculum, butwere found in the MFCs, and their representation appeared to in-crease over time (Fig. 3B). In addition, sequences assigned to the

Fig. 3. Relative abundances of bacterial OTUs based on 454 sequencing of the V3–V5 regions of 16S rRNA genes at the (A) major and (B) minor phylum level. DNAsamples were obtained from planktonic and biofilm communities enriched overtime in MFCs with 20 O or 100 O external resistances and cellulose as the solesubstrate. P and B represent planktonic and biofilm communities, respectively.
286 H. Rismani-Yazdi et al. / Bioresource Technology 129 (2013) 281–288
phyla Tenericutes and Spirochaetes were present during the earlystage of MFC operation but were eventually displaced. These obser-vations suggest a dynamic bacterial interplay during the enrich-ment of microbial communities in the anode chamber.
The external resistance appeared to affect the diversity andoccurrence of the minor phyla (Fig. 3). The fraction of sequencesaffiliated with Proteobacteria increased over time in the planktonicpopulation of R100X MFCs and represented the third most domi-nant phylum (3.1%) after 73 days. However, it gradually declinedto below the detection level in the planktonic population of R20X
MFCs and was only detected in the anode-biofilm (Fig. 3). Fig. 5shows the distribution of various classes of Proteobacteria in theinoculum and MFCs samples. Proteobacteria in the R20X MFCs werepredominantly comprised of Deltaproteobacteria (50–100% of totalProteobacteria), mostly represented by genus Desulfovibrio. How-ever, Proteobacteria in the R100X MFCs were mainly comprised ofEpsilonproteobacteria and Deltaproteobacteria (39–71% and 26–
55% of total Proteobacteria, respectively), with Epsilonproteobacteriabeing almost entirely represented by genus Campylobacter. It is notknown whether Campylobacter spp. can utilize the anode as anelectron acceptor. Other representatives of Epsilonproteobacteriasuch as genus Wolinella, which have the ability to oxidize acetatehave been detected in MFCs. For example, Parameswaran and co-workers (2009) identified sequences affiliated with Wolinella inthe anode of ethanol-fed microbial electrolysis cells. They sug-gested that Wolinella could respire using the anode as an electronacceptor.
Another noticeable distinction between the R20X and R100X
MFCs was the distribution of the phyla Fusobacteria and Actinobac-teria in the planktonic and anode-attached bacterial communities.Sequences assigned to Fusobacteria accounted for about 1.1 and4.5% of the total planktonic and anode-biofilm bacteria, respec-tively, in the R20X MFCs after 73 days. In the R100X MFCs, however,Fusobacteria-related bacteria only accounted for 0.2% of the anode-biofilm population and were not detected in the planktonic com-munity. In both the R20X and R100X MFCs, Fusobacteria was entirelyrepresented by the genus Fusobacterium, with some sequencesbeing closely matched with Fusobacterium ulcerans (Supplemen-tary file 1). Fusobacterium ulcerans is an anaerobic bacterium capa-ble of reducing nitrate and producing butyric acid as the mainproduct of glucose catabolism (Adriaans and Shah, 1988). Further-more, Actinobacteria formed the third most predominant phylumin the R100X MFCs, on day 73, accounting for 1.7% and 2.2% of totalsuspended and anode-attached bacteria, respectively. However,Actinobacteria represented 1.2% of the anode-biofilm populationand were not detected in the planktonic community of R20X MFCsafter 73 days.
Representatives of Fusobacteria and Actinobacteria have beenfound also at relatively low levels in other MFCs (Zhang et al.,2012). However, their physiological role in anaerobic substrate oxi-dation and anode respiration in microbial communities in MFCs isnot known.
3.3.2. Archaeal community structureAlmost all archaeal sequences (>99%) were related to methano-
gens. Fig. 6 shows the profile of archaeal OTUs at the genus level. Inthe inoculum sample, the majority of reads (96%) were related togenus Methanobrevibacter of the family Methanobacteriaceae. MFCoperation resulted in a major shift in the community structure ofmethanogens. Archaeal sequences belonging to genus Methanocul-leus of the family Methanomicrobiaceae emerged as the secondmost dominant group after 16 days, comprising 27% and 20% ofthe archaeal population in R20X and R100X MFCs, respectively.The contribution of Methanoculleus spp. to the planktonic metha-nogenic communities in MFCs increased with time; 89% and 66%in the R20X and R100X MFCs, respectively (Fig. 6). The anode-at-tached archaeal community had a noticeably different compositionfrom that of suspended archaeal population. The most abundantarchaeal sequences in the biofilm samples were related to Methan-obrevibacter (91% in R20X and 98% in R100X MFCs), while sequencesbelonging to Methanoculleus comprised 9% of the sequences.
Despite identification of methanogens in both the planktonicand biofilm communities, no methane was detected in head spaceof MFCs after 73 days of operation. The lack of methane can beattributed to the inactivity of methanogens and subsequent mini-mal production of methane. As supported by the observed in-creases in current production and coulombic efficiency over time,the temporal changes in methanogenic community structure didnot adversely affect the performance of MFCs. The methanogensdetected in the MFCs here mostly belong to hydrogenotrophic fam-ilies of Methanobacteriaceae and Methanomicrobiaceae (Thaueret al., 2008). Thus these methanogens do not compete with an-ode-reducing bacteria for acetate, the main metabolite of cellulose

Fig. 4. Distribution of the phyla (A) Bacteroidetes and (B) Firmicutes 16S rRNA genes at the family level. Insertae sedis presents the unclassified fraction of Firmicutes. P and Brepresent planktonic and biofilm communities, respectively, enriched over time in MFCs with 20 O or 100 O external resistances and cellulose as the sole substrate.
Fig. 5. Distribution of various classes of the phylum Proteobacteria 16S rRNA genes.P and B represent planktonic and biofilm communities, respectively, enriched overtime in MFCs with 20 O or 100 O external resistances and cellulose as the solesubstrate.
Fig. 6. Relative abundance distribution of archaeal OTUs based on 454 sequencingof the V3–V5 regions of t16S rRNA genes at the genus level. DNA samples wereobtained from planktonic and biofilm communities enriched over time in MFCswith 20 O or 100 O external resistances and cellulose as the sole substrate. P and Brepresent planktonic and biofilm communities, respectively.
H. Rismani-Yazdi et al. / Bioresource Technology 129 (2013) 281–288 287
fermentation in cellulose-fed MFCs. Previous studies have shownevidence for hydrogenotrophic, but not acetoclastic, methanogensin MFCs (Lee et al., 2008; Parameswaran et al., 2009). However, a
more recent examination of methanogenesis in MFCs showeddominance of acetoclastic methanogens in acetate-fed MFCs (Jungand Regan, 2011). In the present study, members of the aceto-trophic family Methanosarcinaceae were only identified in the

288 H. Rismani-Yazdi et al. / Bioresource Technology 129 (2013) 281–288
inoculum sample and the anode biofilm of the R100X MFCs, but notin other MFC samples. The predominance of hydrogenotrophicmethanogens may be the result of their faster growth rates as com-pared to their acetotrophic peers, in connection with the relativelyshort hydraulic retention time (7.5 days) of MFCs, or higher toler-ance of hydrogenotrophic methanogens to sub-optimal anoxicconditions (Angel et al., 2011) common in MFCs.
Due to its adverse effect on coulombic efficiency, metabolicinhibitors have been used to inhibit methanogenesis during thestart-up period of MFCs operation (He et al., 2005; Kim et al.,2005). However, the use of inhibitors is not a sustainable opera-tional practice due to the high cost. Results show that methano-genesis stops over time in cellulose-fed MFCs, coinciding withimproved performance without the need for inhibitors. Furtherunderstanding of the microbial communities, interspecies interac-tions and processes involved in electricity generation are essentialto effectively improve the design and control of cellulose-fed MFCsfor enhanced performance.
4. Conclusions
This study demonstrated that methanogenesis in cellulose-fedMFCs, while active during the early stage of operation, fell belowthe detection limit toward the end of the 90 days of operation.The decrease in methane production was accompanied by in-creased current production and coulombic efficiency, and de-creased concentrations of SCFAs. Over time, a number ofphylotypes of Firmicutes became the most dominant bacteria inMFCs while archaea belonging to the genera Methanoculleus andMethanobrevibacter were the most predominant methanogens inthe anode-attached biofilm and the suspended population,respectively.
Acknowledgements
The authors thank Najmeh Pashmi for assistance with DNAextraction and Annukka Mäkinen for methane analyses. Helpfulcomments on the manuscript were provided by two anonymousreviewers. This research was partially funded by the Ohio Agricul-tural Research and Development Center and the College of Food,Agricultural and Environmental Sciences at The Ohio State Univer-sity. We also acknowledge with thanks partial funding from theFinnish Agency of Technology and Innovation (Finland Distin-guished Professor Program 402/2006) to S.M.C. and O.H.T, USDANational Needs Graduate Fellowship Program to S.M.C., and DOEGrant DE-FG36-05GO85010 to Z.Y.
References
Adriaans, B., Shah, H., 1988. Fusobacterium ulcerans sp. nov. from tropical ulcers. Int.J. Syst. Bacteriol. 38, 447–448.
Angel, R., Matthies, D., Conrad, R., 2011. Activation of methanogenesis in aridbiological soil crusts despite the presence of oxygen. Plos One, 6.
Caporaso, J.G., Kuczynski, J., Stombaugh, J., Bittinger, K., Bushman, F.D., Costello, E.K.,Fierer, N., Pena, A.G., Goodrich, J.K., Gordon, J.I., Huttley, G.A., Kelley, S.T.,Knights, D., Koenig, J.E., Ley, R.E., Lozupone, C.A., McDonald, D., Muegge, B.D.,Pirrung, M., Reeder, J., Sevinsky, J.R., Turnbaugh, P.J., Walters, W.A., Widmann, J.,Yatsunenko, T., Zaneveld, J., Knight, R., 2010. QIIME allows analysis of high-throughput community sequencing data. Nat. Meth. 7, 335–336.
Cole, J.R., Wang, Q., Cardenas, E., Fish, J., Chai, B., Farris, R.J., Kulam-Syed-Mohideen,A.S., McGarrell, D.M., Marsh, T., Garrity, G.M., Tiedje, J.M., 2009. The RibosomalDatabase Project: improved alignments and new tools for rRNA analysis. Nucl.Acids Res. 37, 141–145.
DeSantis, T.Z., Hugenholtz, P., Larsen, N., Rojas, M., Brodie, E.L., Keller, K., Huber, T.,Dalevi, D., Hu, P., Andersen, G.L., 2006. Greengenes, a chimera-checked 16SrRNA Gene database and workbench compatible with ARB. Appl. Environ.Microbiol. 72, 5069–5072.
Freguia, S., Rabaey, K., Yuan, Z.G., Keller, J., 2007. Electron and carbon balances inmicrobial fuel cells reveal temporary bacterial storage behavior duringelectricity generation. Environ. Sci. Technol. 41, 2915–2921.
Haas, B.J., Gevers, D., Earl, A.M., Feldgarden, M., Ward, D.V., Giannoukos, G., Ciulla,D., Tabbaa, D., Highlander, S.K., Sodergren, E., Meth, B., DeSantis, T.Z.,Consortium, T.H.M., Petrosino, J.F., Knight, R., Birren, B.W., 2011. Chimeric 16SrRNA sequence formation and detection in Sanger and 454-pyrosequenced PCRamplicons. Genome Res. 21, 494–504.
He, Z., Minteer, S.D., Angenent, L.T., 2005. Electricity generation from artificial waste-water using an upflow microbial fuel cell. Environ. Sci. Technol. 39, 5262–5267.
Hernandez-Eugenio, G., Fardeau, M.L., Cayol, J.C., Patel, B.K.C., Thomas, P., Macarie,H., Garcia, J.L., Ollivier, B., 2002. Sporanaerobacter acetigenes gen. nov., sp. nov., anovel acetogenic, facultatively sulfur-reducing bacterium. Int. J. Syst. Evol.Microbiol. 52, 1217–1223.
Ishii, S., Hotta, Y., Watanabe, K., 2008a. Methanogenesis versus electrogenesis:morphological and phylogenetic comparisons of microbial communities. Bios.Biotechnol. Biochem. 72, 286–294.
Ishii, S., Shimoyama, T., Hotta, Y., Watanabe, K., 2008b. Characterization of afilamentous biofilm community established in a cellulose-fed microbial fuelcell. BMC Microbiol. 8, 6.
Jung, S., Regan, J.M., 2011. Influence of external resistance on electrogenesis,methanogenesis, and anode prokaryotic communities in microbial fuel cells.Appl. Environ. Microbiol. 77, 564–571.
Khan, M.T., Duncan, S.H., Stams, A.J.M., van Dijl, J.M., Flint, H.J., Harmsen, H.J.M.,2012. The gut anaerobe Faecalibacterium prausnitzii uses an extracellularelectron shuttle to grow at oxic–anoxic interphases. ISME J. 6, 1578–1585.
Kim, J.R., Min, B., Logan, B.E., 2005. Evaluation of procedures to acclimate a microbialfuel cell for electricity production. Appl. Microbiol. Biotechnol. 68, 23–30.
Lee, H.S., Parameswaran, P., Kato-Marcus, A., Torres, C.I., Rittmann, B.E., 2008.Evaluation of energy-conversion efficiencies in microbial fuel cells (MFCs)utilizing fermentable and non-fermentable substrates. Water Res. 42, 1501–1510.
Liu, Z., Lozupone, C., Hamady, M., Bushman, F.D., Knight, R., 2007. Shortpyrosequencing reads suffice for accurate microbial community analysis.Nucl. Acids Res. 35, e120.
Logan, B.E., 2009. Exoelectrogenic bacteria that power microbial fuel cells. Nat. Rev.Microbiol. 7, 375–381.
Meyer, E., Aglyamova, G., Wang, S., Buchanan-Carter, J., Abrego, D., Colbourne, J.,Willis, B., Matz, M., 2009. Sequencing and de novo analysis of a coral larvaltranscriptome using 454 GSFlx. BMC Genomics 10, 219.
Parameswaran, P., Torres, C.I., Lee, H.S., Krajmalnik-Brown, R., Rittmann, B.E., 2009.Syntrophic interactions among anode respiring bacteria (ARB) and non-ARB in abiofilm anode: electron balances. Biotechnol. Bioeng. 103, 513–523.
Park, D.H., Zeikus, J.G., 2003. Improved fuel cell and electrode designs for producingelectricity from microbial degradation. Biotechnol. Bioeng. 81, 348–355.
Qiao, Y., Bao, S.J., Li, C.M., 2010. Electrocatalysis in microbial fuel cells-fromelectrode material to direct electrochemistry. Energy Environ. Sci. 3, 544–553.
Rabaey, K., Boon, N., Siciliano, S.D., Verhaege, M., Verstraete, W., 2004. Biofuel cellsselect for microbial consortia that self-mediate electron transfer. Appl. Environ.Microbiol. 70, 5373–5382.
RieuLesme, F., Morvan, B., Collins, M.D., Fonty, G., Willems, A., 1996. A new H2/CO2-using acetogenic bacterium from the rumen: description of Ruminococcusschinkii sp. nov. FEMS Microbiol. Lett. 140, 281–286.
Rismani-Yazdi, H., Christy, A.D., Dehority, B.A., Morrison, M., Yu, Z., Tuovinen, O.H.,2007. Electricity generation from cellulose by rumen microorganisms inmicrobial fuel cells. Biotechnol. Bioeng. 97, 1398–1407.
Rismani-Yazdi, H., Christy, A.D., Carver, S.M., Yu, Z.T., Dehority, B.A., Tuovinen, O.H.,2011. Effect of external resistance on bacterial diversity and metabolism incellulose-fed microbial fuel cells. Bioresour. Technol. 102, 278–283.
Rychlik, J.L., May, T., 2000. The effect of a methanogen, Methanobrevibacter smithii,on the growth rate, organic acid production, and specific ATP activity of threepredominant ruminal cellulolytic bacteria. Curr. Microbiol. 40, 176–180.
Stevenson, D.M., Weimer, P.J., 2007. Dominance of Prevotella and low abundance ofclassical ruminal bacterial species in the bovine rumen revealed by relativequantification real-time PCR. Appl. Microbiol. Biotechnol. 75, 165–174.
Thauer, R.K., Kaster, A.-K., Seedorf, H., Buckel, W., Hedderich, R., 2008.Methanogenic archaea: ecologically relevant differences in energyconservation. Nat. Rev. Microbiol. 6, 579–591.
Timmers, R.A., Rothballer, M., Strik, D.P.B.T.B., Engel, M., Schulz, S., Schloter, M.,Hartmann, A., Hamelers, B., Buisman, C., 2012. Microbial community structureelucidates performance of Glyceria maxima plant microbial fuel cell. Appl.Microbiol. Biotechnol. 94, 537–548.
Wang, Y., Qian, P.Y., 2009. Conservative fragments in bacterial 16S rRNA genes andprimer design for 16S Ribosomal DNA amplicons in metagenomic studies. PlosOne, 4.
Wang, A.J., Liu, W.Z., Cheng, S.A., Xing, D.F., Zhou, J.H., Logan, B.E., 2009. Source ofmethane and methods to control its formation in single chamber microbialelectrolysis cells. Int. J. Hydrogen Energy 34, 3653–3658.
Yates, M.D., Kiely, P.D., Call, D.F., Rismani-Yadzi, H., Bibby, K., Peccia, J., Regan, J.M.,Logan, B.E., 2012. Convergent development of bacterial communities inmicrobial fuel cells. ISME J., http://dx.doi.org/10.1038/ismej.2012.42.
Yu, Z.T., Morrison, M., 2004. Improved extraction of PCR-quality community DNAfrom digesta and fecal samples. Biotechniques 36, 808–812.
Zhang, G., Zhao, Q., Jiao, Y., Wang, K., Lee, D.J., Ren, N., 2012. Efficient electricitygeneration from sewage sludge using biocathode microbial fuel cell. Water Res.46, 43–52.
Zhuang, L., Zhou, S.G., Li, Y.T., Yuan, Y., 2010. Enhanced performance of air-cathodetwo-chamber microbial fuel cells with high-pH anode and low-pH cathode.Bioresour. Technol. 101, 3514–3519.