supporting informationsthe fluorescein isothiocyanate (a) and methylenefigureblue (b) solutionsthein...
TRANSCRIPT
S1
SUPPORTING INFORMATIONS
Ratiometric multiplexed barcodes based on luminescent metal-organic framework films
You Zhou and Bing Yan*
Shanghai Key Lab of Chemical Assessment and Sustainability, Department of Chemistry, Tongji University, Siping Road 1239, Shanghai 200092, China.
*Phone: +86-21-65984663. Fax: +86-21-65981097. E-mail: [email protected].
Electronic Supplementary Material (ESI) for Journal of Materials Chemistry C.This journal is © The Royal Society of Chemistry 2015

S2
The calculation method of the dye contents in MOF films
Figure S1. The integrated photoluminescence (PL) intensity-concentration diagrams for
the fluorescein isothiocyanate (a) and methylene blue (b) solutions in ethanol. The red
solid lines plotted in (a) and (b) are the linear fitted curves.
In order to determine to the amount of loaded dyes at the MOF films, we
measured the luminescence spectra of ethanol solutions of fluorescein
isothiocyanate (FL) and methylene blue (MB) with various concentrations.
Figure R1a and Figure R1b show the relationships for the intensity-
concentration of the FL and MB in ethanol solutions, respectively. The
luminescence intensities in Figure R1a and Figure R1b were the average values
calculated from three repeated luminescence measurements. The relationships
for the intensity of FL and MB in ethanol solution can be fitted as respective
functions of
y = 182092 + 985980 x (1)
y = 367701 + 292811 x (2)
where x is the concentration of dyes, and y is the luminescent intensity.
Therefore, the dye contents in ethanol solution can be determined from their
S3
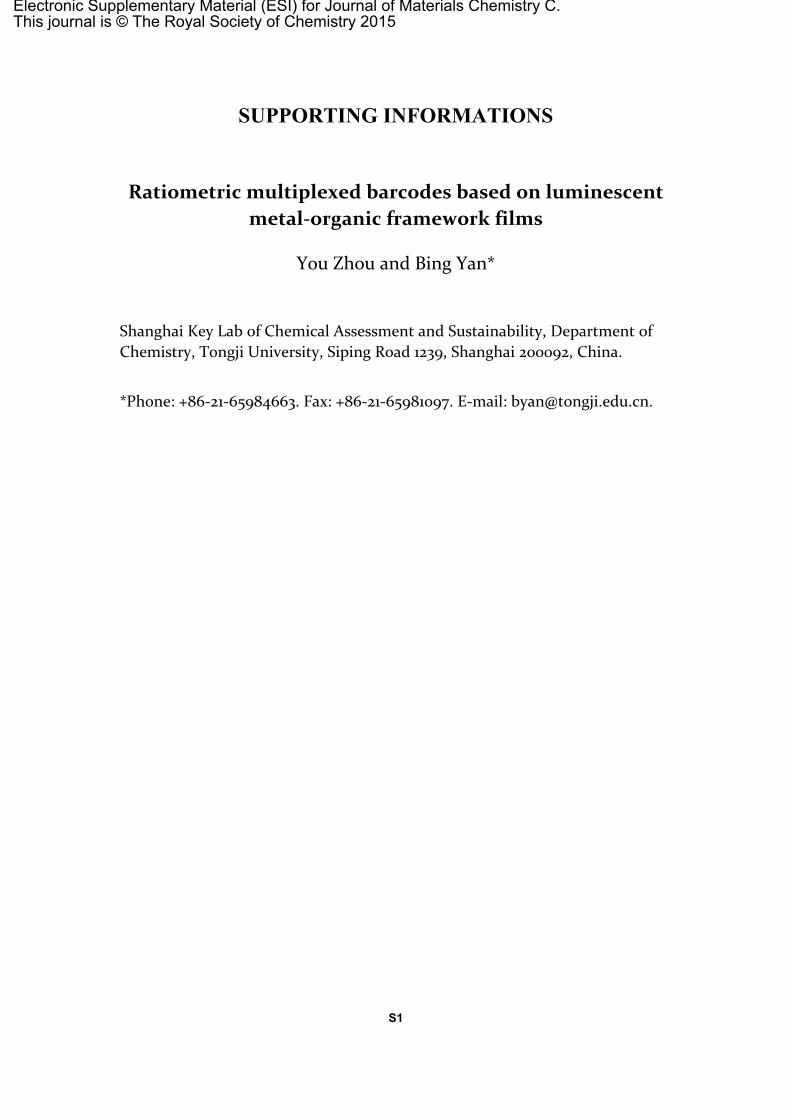
luminescence intensity through Equation 1 and 2.
Figure S2. The luminescence spectra of the ethanol solutions containing the dissolved
isothiocyanate loaded Tb3+@MIL-100 films (a) and methylene blue loaded Tb3+@MIL-100
films (b).
The dye loaded MOF films were dissolved in 5 mL ethanol solution containing
20 L HCl (12 mol/L). The luminescence intensity of the resulted solutions was
measured (Figure S2a, b), and then the dye concentration was calculated
through Equation 1 and 2. The amount of the MOF of the film was estimated
from the In3+ content of the as-obtained ethanol solutions, which was
determined by ICP measurements. Based on the above discussions, the dye
contents of the MOF films were estimated and provide in Table S1.
Table S1. The dye contents in the Ln3+@MOF films.
Dye contents (wt%) Materials
FL MBA1 0.24 —
A2 0.87 —
A3 1.29 —
B1 — 0.43
B2 — 2.06
B3 — 6.43

S4
Figure S3. The photograph of the obtained MIL-100 (In) film. The ITO substrate is ~1 × 1 cm.
Figure S4. PXRD patterns of Eu@MIL-100 (In) and Tb@ MIL-100 (In) films.
S5
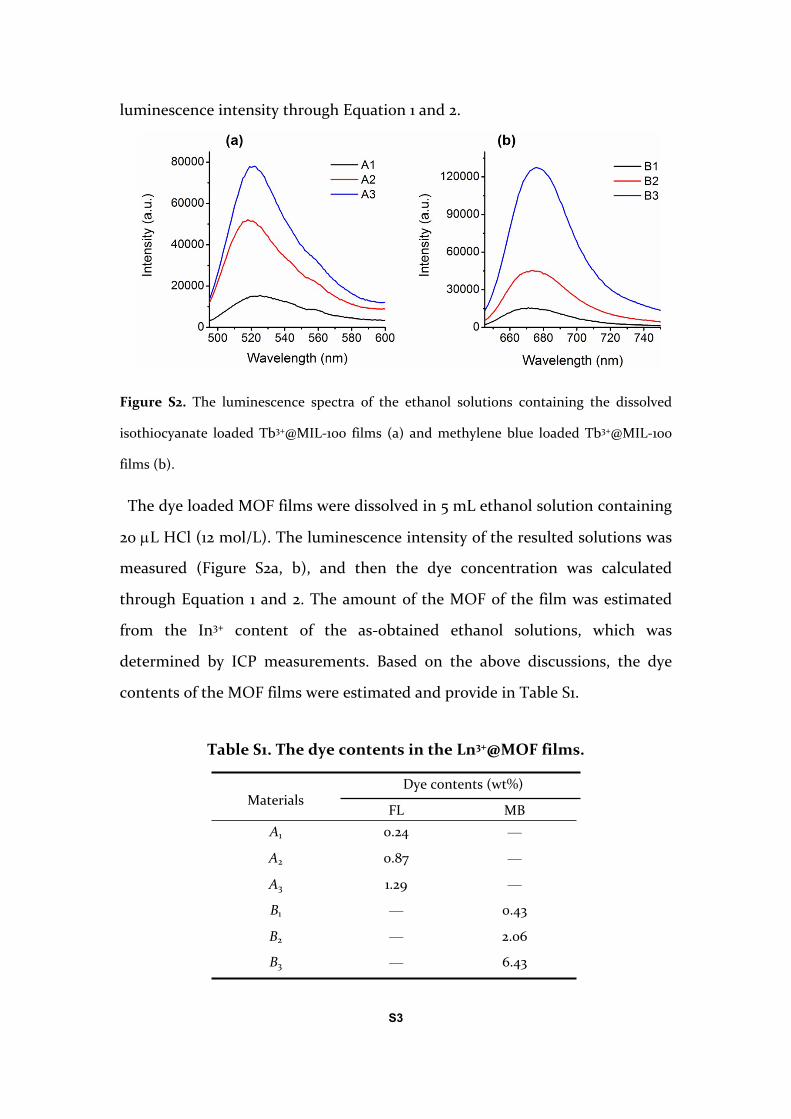
Figure S5. SEM images of Tb@ MIL-100 (In) film with different magnifications.
S6
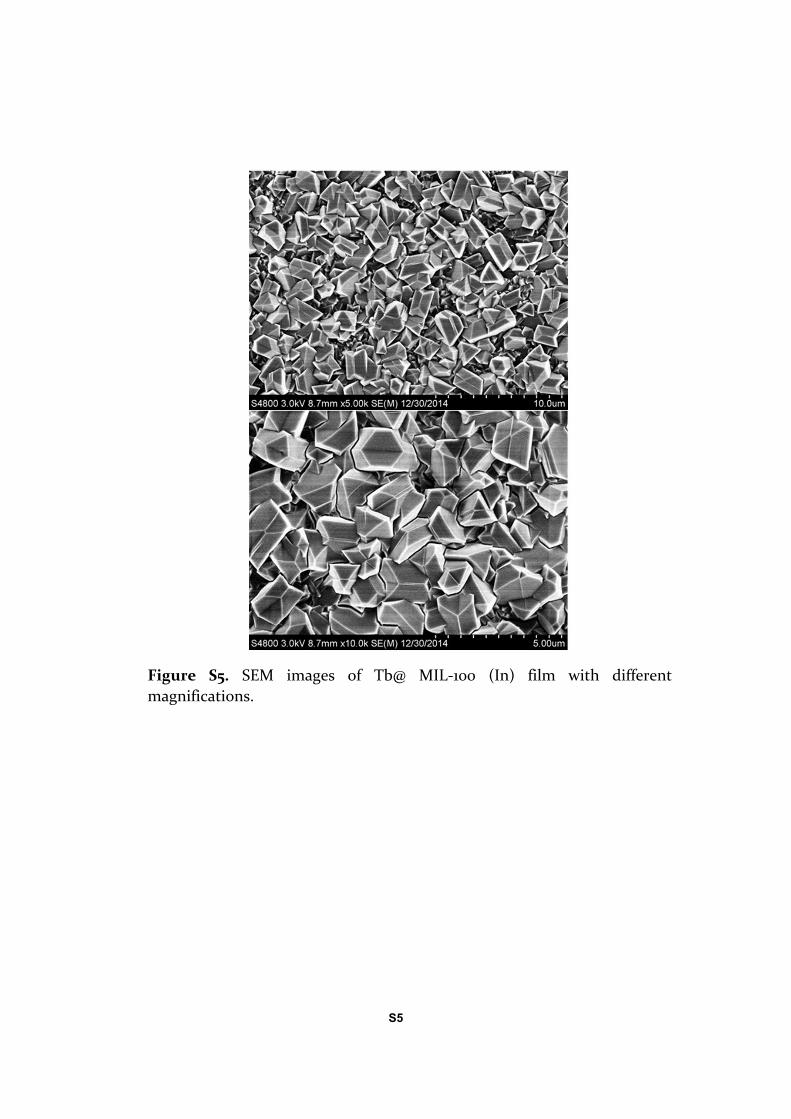
Figure S6. SEM images of Eu@ MIL-100 (In) film with different magnifications.

S7
Figure S7. Tb (a) and Eu (b) 4d XPS spectra of LnCl3 and Ln3+@MIL-100 (In).
Figure S8. UV-vis absorption spectra and molecular structures of fluorescein
isothiocyanate (FL, yellow) and methylene blue (MB, blue). The range of the filtered emission bands of Tb (blue) and Eu (red) is also shown with different color.

S8
Figure S9. PXRD pattern of Eu/Tb@MIL-100 (In) film.
Figure S10. SEM images of Eu/Tb@ MIL-100 (In) film with different magnifications

S9
Figure S11. Excitation (λem = 544 nm) and excitation (λem = 297 nm) spectra of Eu/Tb@MIL-100 (In) film. The inset is the photograph of Eu/Tb@MIL-100 (In) film under UV irradiation
Table S2. Luminescent Lifetimes (τ) and Absolute Quantum Yields (φ) of Ln3+@MIL-100 (In) (Ln = Eu, Tb, Eu/Tb).
Ln3+ τ (ms) φ (%) λex (nm)Eu 0.596 a 10.3 297Tb 1.401 b 26.4 297Eu/Tb 1.081 a/0.815 b 22.7 297
a For the 5D0→7F2 transition of Eu3+, λem = 615 nm. b The transition 5D4→7F5 of Tb3+, λem = 544 nm.