supporting paper 11: energy - productivity commission · web viewsp 11 – energy...
TRANSCRIPT
Energy
Shifting
CONTENTS 3

ã Commonwealth of Australia 2017ISBN 978-1-74037-639-6 (PDF)
Except for the Commonwealth Coat of Arms and content supplied by third parties, this copyright work is licensed under a Creative Commons Attribution 3.0 Australia licence. To view a copy of this licence, visit http://creativecommons.org/licenses/by/3.0/au. In essence, you are free to copy, communicate and adapt the work, as long as you attribute the work to the Productivity Commission (but not in any way that suggests the Commission endorses you or your use) and abide by the other licence terms.
Use of the Commonwealth Coat of ArmsFor terms of use of the Coat of Arms visit the ‘It’s an Honour’ website: http://www.itsanhonour.gov.au
Third party copyrightWherever a third party holds copyright in this material, the copyright remains with that party. Their permission may be required to use the material, please contact them directly.
AttributionThis work should be attributed as follows, Source: Productivity Commission, Energy, Shifting the Dial: 5 year Productivity Review, Supporting Paper No. 11.If you have adapted, modified or transformed this work in anyway, please use the following, Source: based on Productivity Commission data, Energy, Shifting the Dial: 5 year Productivity Review, Supporting Paper No. 11.
An appropriate reference for this publication is:Productivity Commission 2017, Energy, Shifting the Dial: 5 year Productivity Review, Supporting Paper No. 11, Canberra.
Publications enquiriesMedia and Publications, phone: (03) 9653 2244 or email: [email protected]
The Productivity CommissionThe Productivity Commission is the Australian Government’s independent research and advisory body on a range of economic, social and environmental issues affecting the welfare of Australians. Its role, expressed most simply, is to help governments make better policies, in the long term interest of the Australian community.The Commission’s independence is underpinned by an Act of Parliament. Its processes and outputs are open to public scrutiny and are driven by concern for the wellbeing of the community as a whole.Further information on the Productivity Commission can be obtained from the Commission’s website (www.pc.gov.au).
Note: After receiving advice from the NSW Government, the Commission has amended its words in relation to contemporary arrangements for gas exploration and development in that state on pages 118 and 122.

Contents
Abbreviations and explanations ii
Key points v
1 Introduction 12 Energy 3
2.1 Overview 3
2.2 Governance and institutional arrangements 8
2.3 Emission reduction and renewable energy policy 16
2.4 Energy data 21
3 Electricity 253.1 Overview 25
3.2 National electricity market 37
3.3 Historical development 62
3.4 Possible future directions 64
3.5 Electricity-specific policy-related issues 65
3.6 Recent developments 81
4 Gas 854.1 Overview 85
4.2 Historical development 96
4.3 Market structure 97
4.4 Gas-specific policy-related issues 109
4.5 Recent developments 125
References 129
SP 11– ENERGY i

Abbreviations and explanations
AbbreviationsABS Australian Bureau of Statistics
ACCC Australian Competition and Consumer Commission
ACT Australian Capital Territory
AEMA Australian Energy Market Agreement
AEMC Australian Energy Market Commission
AEMO Australian Energy Market Operator
AER Australian Energy Regulator
ARENA Australian Renewable Energy Agency
CCGT Combined cycle gas turbine
CER Clean Energy Regulator
COAG Council of Australian Governments
CPI Consumer price index
CRNP Cost reflective network pricing
CSG Coal seam gas
DIIS Department of Industry, Innovation and Science
DKIS Darwin to Katherine Interconnected System
ECA Energy Consumers Australia
EGWWS Electricity supply, gas, water and waste services
FCAS Frequency control ancillary services
FiT Feed-in tariff
GDP Gross domestic product
IC Industry Commission
ICRC (ACT) Independent Competition and Regulatory Commission
LHS Left-hand side
LNG Liquefied natural gas
LRET Large-scale renewable energy target
ii PRODUCTIVITY REVIEW

NCC National Competition Council
NEL National Electricity Law
NEM National Electricity Market
NEO National Electricity Objective
NER National Electricity Rules
NGL National Gas Law
NGO National Gas Objective
NGR National Gas Rules
NSCAS Network support and control ancillary services
NSW New South Wales
NT Northern Territory
NWIS North West Interconnected System
PC Productivity Commission
PV Photovoltaic
Qld Queensland
QNI Queensland–New South Wales interconnector
RET Renewable energy target
RHS Right-hand side
RIT-D Regulatory investment test for distribution
RIT-T Regulatory investment test for transmission
SA South Australia
SCO Senior Committee Officials
SRAS System restart ancillary services
SRES Small-scale renewable energy scheme
SWIS South West Interconnected System
Tas Tasmania
TNSP Transmission Network Service Provider
Vic Victoria
WA Western Australia
WACC Weighted average cost of capital
WEM Wholesale Electricity Market (Western Australia)
SP 11 – ENERGY iii
ExplanationsBillion The convention used for a billion is a thousand million (109).
GJ gigajoule (109 joules)
GW gigawatt (109 watts)
GWh gigawatt hours (109 watt hours)
km kilometres
kW kilowatt (103 watts)
kWh kilowatt hour
Mtpa million tonnes per annum
MW megawatt (106 watts)
MWh megawatt hour
PJ petajoule (1015 joules)
TJ terajoule (1012 joules)
TWh terawatt hours (1012 watt hours)
iv PRODUCTIVITY REVIEW

Key Points The Australian energy sector, especially in the east coast, is in a fragile state.
While the past reforms that injected competition into the sector and radically altered its structure have served Australia well, the sector has undergone significant change in the last decade.
Technological change is radically altering the economics and structure of the sector, particular in the electricity industry.
The construction of five LNG trains in Queensland have linked the east coast gas market to the international market.
Government policies, particularly those mandating the uptake of renewable sources, have significantly altered the mix of technologies being used.
In electricity, a lack of stability and uncertainty in climate change policy has created an uncertain environment for investment.
This has resulted in insufficient investment in new generating capacity that complements renewable generation.
Sharp rises in the cost of gas prices and supply concerns are limiting the ability of gas-fired generation to complement the uptake of renewables and constraining the sector’s ability to reduce carbon emissions by replacing coal-fired generation.
No one jurisdiction can fix the issues currently confronting Australian energy markets.
Australian governments need to work cooperatively to resolve the issues.
Fixing these issues will require sustained commitment from governments, including to an emission reduction strategy.
Australian governments should set a clear and considered long-term strategic vision for energy markets.
This should include a clear transition path from current arrangements.
Energy consumers should be central to this vision.
A balance will have to be struck between reliable, affordable and sustainable energy. Governments to be clear about the trade-offs that they are willing to make.
Governments should avoid ad hoc policy fixes.
A market-driven national emission reduction policy should replace the myriad of existing Australian and state and territory government policies.
Governments and opposition parties should commit to an agreed emission policy for a specified period of time to provide much needed investment certainty.
This will enable emissions reduction targets to be met in the least overall economic cost.
The uptake of renewables is having unintended implications for network security and reliability.
The renewable generators should bear the costs of ancillary services that the characteristics of their supply impose on the network.
More effective stakeholder engagement processes should be adopted to allow the
SP 11 – ENERGY v

moratoria on gas supply to be overturned.
The cost of not fixing the current mess will be significant, as indicated by the problems that beset South Australia in September 2016.
vi PRODUCTIVITY REVIEW

1 Introduction
Energy is vital to the Australian economy and to the Australian way of life.
Recent developments in the east coast electricity and gas markets have highlighted systemic issues affecting both markets, and have made energy policy a topical issue. Systems that have supported the Australian economy well for over two decades have failed in specific instances or otherwise shown signs of fragility. The South Australian blackouts of 2016 and 2017 highlighted issues with system security and reliability. The disconnection from December 2015 to June 2016 of the Bass Strait interconnector contributed to electricity shortages in Tasmania that required emergency diesel generators to deployed. Electricity and gas prices have also risen sharply, especially the price of natural gas (AER 2017b, p. 52).
This supporting paper explores recent trends in electricity and gas markets to identify areas where policy responses are needed, and canvasses possible ways to ameliorate or address these issues. It supports the ‘efficient markets’ chapter (chapter 5) of the Productivity Commission’s Productivity Review.
Microeconomic reform of the electricity industry began on a state-by-state basis in the late 1980s (IC 1998). In 1990, a Special Premiers Conference agreed to establish a national electricity market. Reform of the gas industry commenced shortly afterwards.
Over time, state-based electricity and gas markets in eastern Australia were linked to create quasi ‘national’ markets. There remain a number of separate electricity and gas markets (most notably in Western Australia and the Northern Territory), as the vast distances have, until recently, made it uneconomic to link these markets.1 This has resulted in a series of electricity and gas markets of different sizes, structures and regulatory arrangements. Consequently, issues in one market need not automatically translate to other markets.
These industries are in transition. In the case of electricity, governments have legislated significant uptake of renewable energy, and rapid technological change is materially altering the economics of the entire industry. In the case of gas, the development of export facilities in Queensland now link the eastern Australia grid to world markets.
These changes have prompted a significant number of official reviews into the electricity and gas industries. The recent review into the future security of the National Electricity Market (NEM) identified 23 separate studies or reviews that were then currently underway or that had been completed in the last five years (Finkel et al. 2016 appendix C). Further reviews have been commissioned in the wake of recent electricity and gas market
1 Work is currently under way to link the Northern Territory gas grid and east coast markets.SP 11 – ENERGY (INTRODUCTION) 1

difficulties. These studies deal with complex technical and economic issues, are frequently lengthy and often deal with aspects of markets.
Some issues are common to both the electricity and gas industries in Australia, while others are specific to either the electricity or gas industry. There are also interactions between many of these issues. Given the sheer number and complexity of these studies and the dynamic nature of current policy in this area, this supporting paper focuses on higher level substantive issues that need resolution before detailed policy prescriptions can be sensibly developed. It draws heavily on existing studies and data sources.
Reflecting this, this paper commences by providing an overview of energy use in Australia to draw out issues of relevance to both electricity and gas markets (chapter 2). It then examines issues specific to electricity markets in general, and the National Electricity Market in particular (chapter 3). It then examines issues specific to gas markets (chapter 4).
The paper does not cover issues pertaining to other sources of energy, such as petroleum products, or nuclear power.
2 PRODUCTIVITY REVIEW

2 Energy
This chapter provides an overview of the electricity and gas industries in Australia and sets out some of the key issues confronting both industries.
The chapter commences by providing an overview of the electricity and gas industries and their importance to the Australian economy (section 2.1) The chapter then outlines the regulatory and institutional arrangements applying to the sector (section 2.2). The chapter then details emission reduction and renewable energy policy applying to both industries (section 2.3). The chapter concludes with a review of energy data (section 2.4).
Issues specific to the electricity and gas industries are discussed in chapters 3 and chapter 4, respectively.
2.1 Overview
Energy is essential to economic activity. The sector is a valuable source of export income, production, investment and, to a lesser extent, employment. Its outputs are also vital inputs into many industries, particularly those in the manufacturing, transportation and mining sectors, and for use by households.
Contribution to economic activity
Australia produced $202 billion of energy in 2014-15, with over half exported (excluding uranium) (figure 2.1). Of this, $39 billion was electricity generation and $35 billion was natural gas. Collectively, these two sources of energy accounted for 37 per cent of energy production by value. The inclusion of transmission, distribution, on-selling and retailing of these sources of energy would further increase the relative size and importance of the sector.
The inclusion of transportation and retailing lifts the sales of electricity and gas — the two energy sectors that are the focus of this paper — up towards $100 billion in 2014-15 (excluding taxes and margins levied on these sales).
SP 11 – ENERGY (ENERGY) 3

Figure 2.1 Australian energy production by value, 2014-15a
$ billion
41
35
24
63
39
0
10
20
30
40
50
60
70
Coal Gas Oil Petroleum products
Electricity generation
a Total supply valued at purchasers’ prices.
Source: ABS (Energy Account, Australia, 2014-15, Cat. no. 4604.0, table 5.1).
In terms of its overall contribution to economic activity, value added of the electricity supply sector was $23 billion in 2014-15, or 1.5 per cent of Australian gross domestic product (GDP) (table 2.1).2 As of May 2015, the industry employed 63 000 people (excluding contractors), or 0.5 per cent of total employment. Employment has since declined to 52 000 by May 2017.
Table 2.1 Australian electricity and gas industries, 2014-15
Gross industry value
added
Value-addedshare of
total economy
Total salesa Employmentb Employment share of
total economy
$m Per cent $m ‘000 Per cent
ElectricityElectricity generation 3 910 0.2 18 500Electricity transmission, distribution, on selling and electricity market operation
19 573 1.2 39 447
Electricity supply 23 483 1.5 57 947 63.0 0.5
2 Industry contributions to national production are expressed in terms of the value that they add in production (termed valued added) to avoid the double counting of sales from industries that are used as inputs by other industries.
4 PRODUCTIVITY REVIEW

GasOil & gas extraction 27 302 1.7 52 297 28.2 0.2Of whichOil extraction 13 651d 0.8d 23 104 14.1d 0.1d
Gas extraction 13 651d 0.8d 29 193 14.1d 0.1d
Gas supply 1 769 0.1 4 744 14.2 0.1Gas combined 15 420 1.0 33 937 28.3 0.2
Total economy 1 617 016c 11 767.9
na: not available. a Sales valued at basic prices excluding taxes and other margins. b Total persons employed, as at May 2015. c Total value added for the economy is GDP. d Assuming that gas accounts for half of Oil and gas extraction value added and employment (see footnote 3).
Sources: ABS (Australian National Accounts: Input-Output Tables, 2014-15, Cat. no. 5209.0.55.001, table 2), ABS (Labour Force, Australia, Detailed, Quarterly, May 2017, Cat. no. 6291.0.55.003, table 6).
Available data suggest that the contribution of the gas sector is somewhat smaller than that made by electricity, at around $15.4 billion in 2014-15, or 1.0 per cent of Australian GDP (table 2.1).3 Employment by the gas industry was around 28 300 (excluding contractors), or 0.2 per cent of total employment as of May 2015. Employment has since declined to around 19 900 in May 2017.
Energy content
Australia supplied 5920 petajoules (PJ) energy in 2014-15 and consumed 4076 PJ (latest available) (DIIS 2016a table A2).4 Gas and electricity collectively accounted for 40 per cent of energy consumption (both 20 per cent), and were the second and third largest sources, respectively, after petroleum products (50 per cent). Renewable sources collectively accounted for just under 5 per cent of measured consumption.
3 The ABS aggregates oil and gas extraction in many of its publications, including those that provide industry value added (ABS, Australian National Accounts: Input-Output Tables, Cat. no. 5209.0.55.001). The supporting ABS product details (ABS, Australian National Accounts: Input-Output Tables (Product Details), Cat. no. 5215.0.55.001) do not provide sufficient data to separate gas extraction from oil extraction, as the information on some products are not published to protect respondent confidentiality. Historical data (ABS, Australian Industry, 2010-11, Cat. no. 81550DO005_201011) suggest that that gas accounted for 43 per cent of Oil and gas extraction in 2009-10 and 44 per cent in 2010-11. The value added estimates presented here assume that this historical growth continues such that gas accounts for half of the $13.7 billion of value added by Oil and gas extraction in 2014-15. The estimates of gas sector value added also include $1.8 billion in value added from Gas supply (distribution).
4 Just over 30 per cent of primary energy supplied in 2014-15 was used or lost in converting primary energy sources into the secondary sources that are ultimately consumed (based on DIIS (2016a), table A2).
SP 11 – ENERGY (ENERGY) 5

In terms of the underlying sources of this energy, natural gas accounted for just under one-quarter of all primary energy, making it the third largest primary fuel source after crude oil (38 per cent) and coal (32 per cent).5
Australian energy consumption grew by 2.8 per cent per year from 1960-61 to 2014-15 (figure 2.2). This was higher than the 1.5 per cent growth in population over the same period, but lower than the 3.4 per cent growth in output of the Australian economy. Consequently, energy consumption per person over this period grew by 1.2 per cent per year, and the energy intensity of production — the amount of energy consumed per unit of output produced — fell by 0.7 per cent.
Total energy consumption (primary energy supply) grew more-or-less continually to 2011-12 (where it peaked at 5954 PJ), and has remained around this level since then.
Energy-intensity of production
The energy intensity of Australian production grew by 0.6 per cent per year before peaking in 1977-78 at 5874 gigajoules (GJ) per million dollars of output, after which it fell by 1.3 per cent per year to 3653 GJ per million dollars on production in 2014-15.
5 Electricity and petroleum products are secondary sources of energy as they are derived from other sources of energy. Electricity in Australia is mainly produced from turbines powered by steam produced by burning non-renewable fossil fuels (mainly coal and natural gas) or from renewable sources — such as from running water (hydroelectricity), the wind (wind electricity) and the sun (solar electricity). Petroleum products (such as petrol, diesel and liquefied petroleum gas) are produced by refining crude oil.
6 PRODUCTIVITY REVIEW

Figure 2.2 Australian energy consumption, energy intensity and energy productivity, 1960-61 to 2014-15Index (1960-61=100)
a GDP: chain volume GDP (reference year 2012-13). Energy consumption: PJ. Energy intensity: GJ per million dollars of production. Energy productivity: million dollars of production per GJ.
Source: DIIS (2016a table B).
Energy productivity
Energy productivity in the Australian economy — the amount of output produced per unit of energy consumed — remained generally flat until the sector was reformed in the mid to late 1980s. Since 1989-90, the value of production per GJ of energy consumed grew from $193 million to $274 million, an increase of 1.4 per cent per year.
Energy consumption per person grew at an annual average rate of 1.7 per cent to 2006-07. Since then, per person consumption fell by 1.2 per cent per year.
Two other clear trends in this aggregate analysis are:
First, there has been a decoupling of the growth in production (real GDP) from energy consumption since 1991-92. Before then, the two measures grew more-or-less in step. Since then, real GDP has grown at a faster rate than energy consumption.
Second, the energy intensity of production has declined more-or-less steadily each year since the second oil price shock in 1979. Prior to that, the energy intensity of production was essentially flat.
SP 11 – ENERGY (ENERGY) 7

2.2 Governance and institutional arrangements
The legislative and institutional frameworks that govern the energy sector have been developed by Australian governments within the constraints imposed by the Constitution (box 2.1).
Box 2.1 Energy policy and the Australian ConstitutionThe Australian Constitution arguably constrains the ability of the Australian Government to legislate over energy, electricity, gas or the environment.
Under the Constitution, state and territory governments have exclusive power over all matters not explicitly shared with or referred to the Australian Government. These matters are set out in sections 51 and 52, respectively.
Section 51 enables the [Australian] Parliament power to make laws for the peace, order, and good government of the Commonwealth with respect to, among other things:
(i) trade and commerce with other countries, and among the States;
(ii) taxation; but so as not to discriminate between States or parts of States;
(xx) foreign corporations, and trading or financial corporations formed within the limits of the Commonwealth;
(xxix) external affairs;
(xxxvii) matters referred to the Parliament of the Commonwealth by the Parliament or Parliaments of any State or States, but so that the law shall extend only to States by whose Parliaments the matter is referred, or which afterwards adopt the law.
There is no explicit reference to energy, electricity, gas or the environment in the Constitution.
As such, the constitutional power to make laws over energy, electricity, gas or the environment arguably lie with state and territory governments. The Australian Government is also able to make laws on these topics insofar as they relate to the powers conferred to it under section 51 (such as, for example, by imposing taxation or by entering into an international treaty).
Energy reform in Australia has progressed through intergovernmental agreements between the Australian and state and territory governments. The development of national energy laws is achieved through ‘template legislation’. South Australia typically drafts and implements the required energy legislation. This law is then applied in the remaining state and territories by reference to the South Australian legislation, with supporting Australian Government legislation as required.
Legislative framework
The legislative and regulatory framework for Australia’s energy markets is set out in the December 2013 Australian Energy Market Agreement (AEMA) between the Australian Government and all eight state and territory governments. The Agreement provides for
8 PRODUCTIVITY REVIEW

national legislation that is implemented in each participating state and territory. All jurisdictions are parties to the gas provisions, and all except Western Australia and the Northern Territory are parties to the electricity provisions.
South Australia is the lead legislator for both electricity and gas, with other jurisdictions enacting legislation to give effect to the South Australian legislation.
The National Electricity Law (NEL) sets out the National Electricity Rules (NER) that govern the operation of the NEM. It also sets out the National Electricity Objective (NEO) which is:
… to promote efficient investment in, and efficient operation and use of, electricity services for the long term interests of consumers of electricity with respect to — (a) price, quality, safety, reliability, and security of supply of electricity; and (b) the reliability, safety and security of the national electricity system.
The Rules set out the rights and responsibilities of the market participants, and aim to regulate how these players behave so that consumers do not pay more than necessary for their electricity. The focus of the Rules is very much on the long-term interest of consumer.
The Law and Rules are supported by the National Electricity Regulations.
Gas is similarly governed by the National Gas Law (NGL) that establishes obligations for gas pipelines, gas wholesale markets and a gas market bulletin board. The Law is supported by the National Gas Rules (NGR) and National Gas Regulations. There is a National Gas Objective (NGO), similar to that for electricity, which also focuses on the long-term interest of consumers.
Institutional arrangements
The COAG Energy Council has overarching responsibility for monitoring and reforming national energy markets. The role of the Council in energy market reform and the associated governance arrangements are set out in the AEMA. The Council is supported in developing national energy market policy by the Senior Committee of Officials (SCO).
The Council has oversight of the three main institutions responsible for the operation of national energy markets (including the NEM):
the Australian Energy Market Commission (AEMC) — the rule maker and market development adviser
the Australian Energy Regulator (AER) — the economic regulator and rule enforcer
the Australian Energy Market Operator (AEMO) — the system and market operator.6
6 The AEMC is established under section 5 of the Australian Energy Market Commission Establishment Act 2004 (SA). The AER is established under section 44AE of the Competition and Consumer Act 2010 (Cth). The AEMO is incorporated as a company limited by guarantee under the Corporations Act 2001
SP 11 – ENERGY (ENERGY) 9

The AEMC is responsible for the rules that govern the operation of the market. In order to change the rules, a party formally applies to the AEMC for a rule change. The AEMC seeks input from affected parties on each proposed change. It then publishes a draft determination and seeks feedback before issuing a final determination.
A number of other Australian Government agencies have regulatory responsibilities over specific aspects of the energy sector or have wider regulatory responsibilities that also impinge on the sector. The Australian Competition and Consumer Commission (ACCC) and the National Competition Council (NCC) ensure third-party access to essential network infrastructure to promote competition within the sector. The ACCC also assesses energy-related mergers and authorisations, and enforces general customer and competition protections under the Competition and Consumer Act 2010 (Cth). The Clean Energy Regulator (CER) regulates Australian Government schemes for measuring, managing, reducing and offsetting carbon emissions.
The operation of other Australian Government agencies also impact on the energy sector. The Australian Renewable Energy Agency (ARENA), for example, aims to accelerate Australia’s shift to an affordable and reliable renewable energy future. Their investments impact on the mix of technologies used in electricity generation both directly where they fund new generation, and through the testing and development of renewable technologies.
The roles of each Australian Government agency are outlined in box 2.2.
In addition to these national agencies, each state and territory has its own regulatory agency covering electricity and gas retailing in that jurisdiction:
Independent Pricing and Regulatory Tribunal (New South Wales)
Essential Services Commission (Victoria)
Queensland Competition Authority (Queensland)
Essential Services Commission of South Australia (South Australia)
Economic Regulation Authority (Western Australia)
Tasmanian Economic Regulator (Tasmania)
Utilities Commission (Northern Territory)
Independent Competition and Regulatory Commission (Australian Capital Territory).
These agencies, to differing extents, provide independent regulatory advice and decisions to protect and promote the ongoing interests of the consumers, taxpayers and citizens in each jurisdiction. These agencies may also have wider responsibilities, such as covering water, transport and local government.
(Cth), and owned by Australian governments (60 per cent) and industry participants (40 per cent).
10 PRODUCTIVITY REVIEW

Box 2.2 Key governance and institutional arrangements
Council of Australian Governments (COAG) Energy Council
The Council has overarching responsibility and policy leadership for electricity and gas markets in Australia, and oversees national energy policy and law. It consists of the energy and resources ministers from the Australian Government, each state and territory government, and New Zealand. The Council was previously known as: the Standing Council on Energy and Resources; and the Ministerial Council on Energy.
Australian Energy Market Commission
The AEMC makes and amends the National Electricity Rules, the National Gas Rules and the National Energy Retail Rules which govern the National Electricity Market, elements of natural gas markets and energy retail markets. Its objective is to promote efficient investment, use and operation of electricity and gas services in the long-term interests of consumers.
Australian Energy Regulator
The AER regulates energy markets and networks (mainly in eastern and southern Australia) under national energy market legislation and rules. Its functions include:
monitoring wholesale electricity and gas markets to ensure energy businesses comply with the legislation and rules, and taking enforcement action where necessary
setting the amount of revenue that network businesses can recover from customers for using networks (electricity poles and wires and gas pipelines) that transport energy
regulating retail energy markets in Queensland, New South Wales, South Australia, Tasmania (electricity only) and the Australian Capital Territory
publishing information on energy markets.
Australian Energy Market Operator
The AEMO is responsible for the day-to-day management of most wholesale and retail energy market operations in Australia, including:
the National Electricity Market (NEM)
the Wholesale Electricity Market (WEM) in Western Australia
the Victorian Declared Wholesale Gas Market and the Victorian gas transmission system
retail gas markets in Victoria, Queensland, South Australia, Western Australia, New South Wales and the Australia Capital Territory
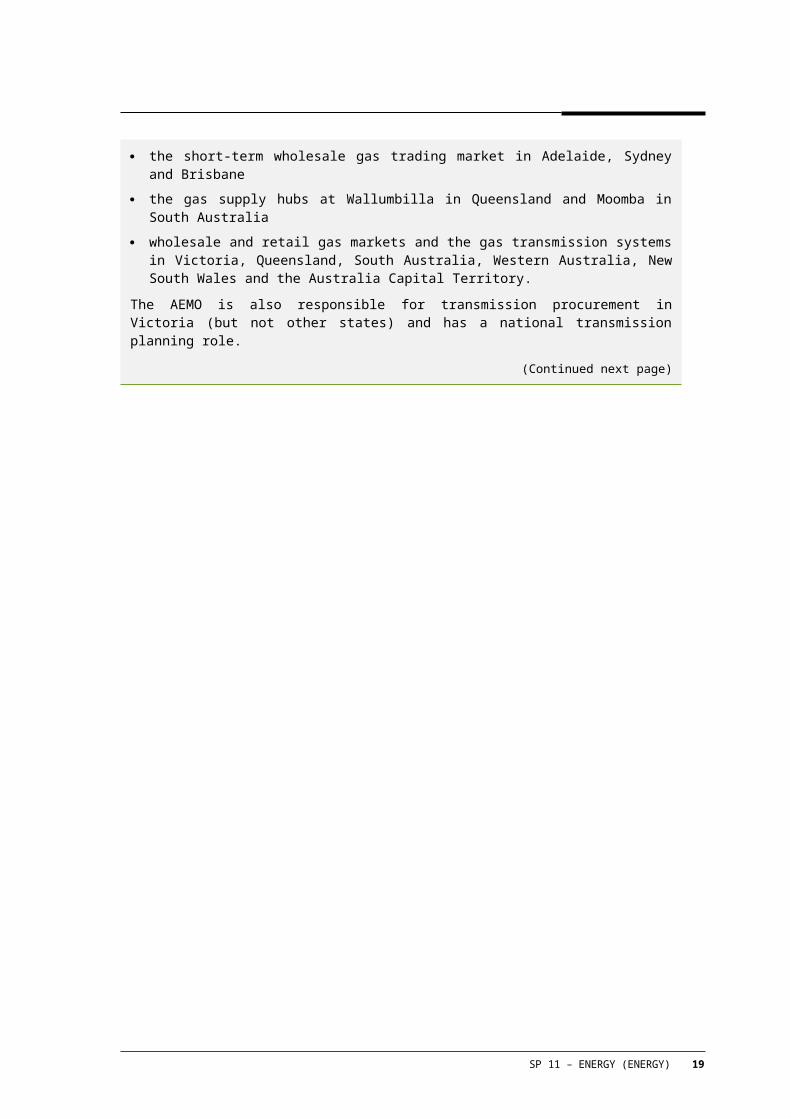
the short-term wholesale gas trading market in Adelaide, Sydney and Brisbane
the gas supply hubs at Wallumbilla in Queensland and Moomba in South Australia
wholesale and retail gas markets and the gas transmission systems in Victoria, Queensland, South Australia, Western Australia, New South Wales and the Australia Capital Territory.
The AEMO is also responsible for transmission procurement in Victoria (but not other states) and has a national transmission planning role.
(Continued next page)
SP 11 – ENERGY (ENERGY) 11

Box 2.2 (Continued)
Energy Consumers Australia (ECA)
The ECA was created by COAG to promote the long-term interests of consumers with respect to the price, quality, safety, reliability and security of supply of energy services. The ECA gives residential and small businesses a national voice in the energy market. It conducts research and analysis, identifies issues and works with other consumer organisations, ombudsmen, energy companies, regulators and governments to improve outcomes for consumers.
Australian Competition and Consumer Commission
The ACCC’s role in energy markets is in the context of the Competition and Consumer Act 2010 (Cth), including the enforcement of the competition and consumer protection provisions in energy markets and assessing energy mergers and authorisations.
National Competition Council
The NCC administers the National Access Regime — which deals with general third party access to nationally significant infrastructure that cannot be economically duplicated — prescribed in Part IIIA of the Competition and Consumer Act 2010 (Cth). Under the National Gas Law, the NCC:
makes recommendations to relevant Minister(s) on the coverage (regulation) of natural gas pipeline systems
decides the form of regulation of natural gas pipeline systems (ie. light or full regulation)
classifies pipelines as transmission or distribution pipelines
makes recommendations in relation to certain exemptions for ‘greenfields’ gas pipeline proposals.
Clean Energy Regulator
The CER administers schemes legislated by the Australian Government for measuring, managing, reducing or offsetting Australia’s carbon emissions.
Its role is determined by climate change law. It has administrative responsibilities for the:
National Greenhouse and Energy Reporting Scheme, under the National Greenhouse and Energy Reporting Act 2007
Emissions Reduction Fund, under the Carbon Credits (Carbon Farming Initiative) Act 2011
Renewable Energy Target, under the Renewable Energy (Electricity) Act 2000, and
Australian National Registry of Emissions Units, under the Australian National Registry of Emissions Units Act 2011.
Australian Renewable Energy Agency
ARENA is a commercially oriented agency with the objective of:
improving the competitiveness of renewable energy technologies
increasing the supply of renewable energy in Australia.
It was established in July 2012 by the Australian Renewable Energy Agency Act 2011 (Cth).
12 PRODUCTIVITY REVIEW

Sources: Finkel Review (2016, p. 48); Agency web sites.
The role played by each agency partially reflects the extent to which each jurisdiction has signed up, if at all, to the National Energy Customer Framework to regulate the sale and supply of electricity and gas to retail customers. The Independent Pricing and Regulatory Tribunal, for example, plays a smaller role than does, say, the Essential Services Commission, as New South Wales has fully signed up to the framework while Victoria has only partially done so.
Governance issues
Good institutional arrangements and governance processes are vital to the effective and efficient functioning of energy markets.
The Vertigan Review (2015) examined the governance arrangements for Australian energy markets.
At a higher level, the Vertigan Review found that:
… the division of functions established by the current governance arrangements for Australian energy markets is fundamentally sound and that Australian energy market governance is amongst best practice internationally. Australia’s energy market governance relies on clearly specified and stable policy and appropriate regulatory objectives, delegation of some roles to specialist institutions and importantly, institutional separation. (p. 7)
It went on to say that:
… scope for improvement exists to adapt to the challenges foreshadowed by two themes that consistently emerged during consultations
the pace of change in the energy sector is arguably unprecedented; and
a ‘strategic policy deficit’ exists which has led to diminished clarity and focus in roles, fragmentation and a diminished sense of common purpose. (p. 7)
The Vertigan Review made 47 recommendations in all, covering setting strategy and determining priorities, rules and rule making, regulatory decision making, market operation and governance processes.
While supporting the role of the COAG Energy Council as the premier policy leadership body with responsibility for the Australian energy market, the Review observed that:
… the Council and SCO appear to lack a focus on strategic direction and are therefore not providing effective and active policy leadership to the energy sector. Whilst the inherent structure of the Council cannot be altered, the Council can improve the visibility, transparency and accountability of its processes and operations to more effectively progress strategic energy market reform. Clear and rigorous criteria should be established for assessing proposals by jurisdictions who seek derogations from otherwise nationally agreed arrangements. (p. 7)
SP 11 – ENERGY (ENERGY) 13

The Review recommended that the COAG Energy Council should develop a greater focus on determining strategic direction and specifying priorities for energy market reform and delegate its other responsibilities. To guide this, they proposed that the SCO should present recommendations on strategic direction, priorities and a work program, with the AEMC taking on an expanded role in initiating the development of this advice.
These are all sensible suggestions and should be implemented.
Governments need to take joint leadership on energy policy and fix the myriad of issues currently confronting the industry (discussed throughout this paper and in other reviews such as the Finkel Review). This cooperative approach to energy policy has worked successfully in the past.
Government should set a clear, overarching long-term vision for energy policy by:
setting out clear objectives — that recognise the inherent tensions between prices/costs, reliability and emissions, and provide clear guidance on acceptable trade-offs now and into the future
determining the role of each institution — and then let them get on with their work, holding them to account for their responsibilities but not interfering
ensuring that the sector can access the full set of instruments in doing their work — not locking in or out technologies, or excluding other solutions by design
setting out a clear roadmap for reforms — ideally with bipartisan and cross jurisdictional commitment.
System security and reliability comes as a cost. In seeking to achieve this long-term vision, a balance will need to be struck with the cost of energy to consumers. Inevitably, trade-offs between the two will have to be made.
Energy market reform requires more than just improving the structure and operation of energy markets. Effective reform will also require consideration of environmental and other policies that might conflict with energy policy to ensure that policies are consistent and coherent (discussed in section 2.3).
The COAG Energy Council should take the leadership role in implementing energy reform. It should be rely heavily on expert advice from the AEMC and the AER.
Institutional responsibilities
The Vertigan Review’s recommendations included that the:
role of AEMC should be reinforced through greater reliance on this institution for the development of strategic advice
AER should be separated from the ACCC and established as an independent organisation
14 PRODUCTIVITY REVIEW

AEMO should be left to play its role as independent system and market operator.
Further, the Review also found that with respect to the AER that:
… the AER Board lacks autonomy over the organisation as it is not in full control of the resources required to achieve its tasks and lacks full independence in decision making; and that its culture is not fully conducive to its regulatory role, due to fact that the culture and skills required to regulate an industry differ from those of a competition law enforcement agency. On that basis, the Panel believes the AER’s performance could be strengthened by establishing it as an independent organisation, separating it from the Australian Competition and Consumer Commission (ACCC). (p. 8)
In respect of the latter, while the in-principle argument for separation has some merit, institutional change can be costly and disruptive. Making major institutional changes may not be warranted if they impose further uncertainty in the system, and delay the broader reforms required. (For these and other reasons, the Productivity Commission did not recommend separation in its 2013 inquiry into electricity networks.)
The terms of reference for the Vertigan Review did not cover the suitability of wider institutional governance arrangements that impact on energy markets. In particular, it did not cover governance arrangements concerning institutions charged with environmental and other objectives that also impact on energy markets. These institutions include ARENA and the CER.
Responsiveness
In its 2013 review into the regulation of transmission networks, the Productivity Commission raised concerns about the time taken for critical reforms to be implemented. It found that:
Some of the more critical reforms in the NEM have already taken far too long. While the complexities of the NEM, the number of stakeholders involved, and the issues relating to investor confidence noted above, justify a considered and thorough examination of reforms before they are implemented, the current system has sometimes descended into paralysis by analysis. Reform appears to have been frustrated by complex processes, constant and overlapping reviews, and a lack of agreement by relevant governments about either the reforms themselves or the need for more timely progress to a genuinely NEM-wide approach to energy regulation. (PC 2013a, p. 36)
In light of recent issues surrounding the supply of electricity in South Australia and the provision of gas in the east coast market it is timely to review what has occurred in order to learn what happened, why, how it could be avoided in the future, and how best to deal with similar situations if they arise.
SP 11 – ENERGY (ENERGY) 15

The same approach should also be applied to the governance arrangements to assess what lessons can be learnt. Indeed, a number of reviews have been commissioned to learn from these events.
Policy responses to emerging issues should be considered, appropriate and based on sound technical advice that takes into account any wider implications.
CONCLUSION 2.1
The governance arrangements for Australian energy markets need to be more flexible and adaptable to changes in technology and circumstances, both in the short- and long-term. Issues that arise should be dealt with in a timely, efficient and cost-effective manner that does not compromise system reliability and security. Existing processes are long and time consuming. They should be reviewed to see if they can be streamlined and made more timely, especially where more than one agency is involved (including the COAG Energy Council).
2.3 Emission reduction and renewable energy policy
The energy sector is an important source of greenhouse gas (carbon) emissions. Emissions of carbon dioxide, methane and other greenhouse gases are produced when fossil fuels are burned to generate electricity (termed combustion emissions). Methane is also released into the atmosphere at the wellhead when natural gas in extracted and from the coalface when coal is mined (termed fugitive emissions).
Electricity generation is the largest source of carbon emissions in Australia, contributing one-third of all emission in 2015 (Commonwealth of Australia 2017).7
International commitments
As a result, the energy sector has a crucial role to play in meeting Australia’s carbon emission targets. Under the Paris Agreement, the Australia Government committed in April 2016 to reduce carbon emissions by 26–28 per cent on 2005 levels by 2030. This means that energy in general, and the electricity sector in particular, will be central to Australia achieving this target.
However, achieving the 2030 target may require substantially larger reductions in emissions in electricity generation than in the rest of the economy — that is, reductions significantly higher than 26–28 per cent on 2005 levels — if other sectors of the economy are excluded, or face higher costs to reduce emissions.
Despite this interlinkage between carbon emissions and energy, climate change policy in Australia has been developed largely independently of energy policy. In this respect,
7 The inclusion of all emissions from oil and natural gas would lift the share of total emissions in 2015 from 33 per cent to 37 per cent.
16 PRODUCTIVITY REVIEW

Australia is not alone (Yarrow 2017). Nor have policies been coordinated across and even within jurisdictions.
The result is a range of Australian and state government policies to facilitate the uptake of renewable energy and to reduce greenhouse gas emission from the combustion of fossil fuels.
Renewable energy target
The renewable energy target (RET), is an Australian Government policy designed to reduce emissions of greenhouse gases in the electricity sector and encourage the additional generation of electricity from sustainable and renewable sources. It seeks to achieve 33 000 gigawatt hours (GWh) of additional renewable electricity generation by 2020. The scheme consists of two parts, based on the size of the source of the approved renewable energy system involved:
a large-scale renewable energy target (LRET), covering large-scale systems such as wind and solar farms, and hydroelectric power stations
a small-scale renewable energy scheme (SRES), covering small-scale systems such as solar photovoltaic (PV) panel systems, small-scale wind systems, small-scale hydro systems, solar water heaters and air source heat pumps.
Under the larger LRET, wholesale purchasers of electricity (typically electricity retailers) are required to purchase and surrender renewable certificates to the Clean Energy Regulator each year to fulfil their legal obligations under the Renewable Energy (Electricity) Act 2000 (Cth). The number of certificates that need to be surrendered is in proportion (14.2 per cent in 2017) to the amount of electricity they purchase each year. Certificates are issued free to large-scale generators for each megawatt hour of eligible renewable electricity produced above their baseline. Renewable generators get the income from the sale of the certificates to the wholesale purchasers. Once created and validated, these certificates act as a form of currency and can be sold and transferred to other individuals and businesses at a negotiated price.
The RET cost roughly $1.6 billion in 2013-14 ($668 million for the LRET; $932 million for the SRES) (Principal Economics 2015, p. 25).8
Collectively, AEMC (2016a) estimate that environmental policies directly accounted just under 9 per cent of retail electricity prices in Australia in 2016-17, ranging from 4.3 per cent (Northern Territory) to 13.9 per cent (Queensland) (figure 2.3).9 This translates into $117 on an average annual electricity bill of $1356. The renewable energy target contributed 56 per cent of this (the LRET and SRES contributed 37 percentage points and
8 This is the derived as the average value of certificates traded in 2013 and 2014 based on the number of LRET and SRES certificates multiplied by the volume-weighted average price of each type of certificate.
9 Environmental policies also affect prices indirectly because — as intended — they lead to the closure of emission-intensive generators that can supply electricity at low prices (AEMC 2016a, p. ii).
SP 11 – ENERGY (ENERGY) 17

18 percentage points, respectively). State environmental policies contributed the remaining 44 per cent of the contribution made by environmental policies.
Figure 2.3 Average residential electricity prices by jurisdiction, 2016-17a,b,c
$/kWh
$0.00
$0.05
$0.10
$0.15
$0.20
$0.25
$0.30
$0.35
NSW Vic Qld SA WA Tas NT ACT AUST
Wholesale & retail Transmission charges Distribution charges Environmental policies
a Environmental policies cover: the LRET (Australian Government); the SRES (Australian Government); climate change fund (NSW); energy efficiency improvements scheme (ACT); energy saving scheme (NSW); feed-in tariff schemes (ACT, Vic); retailer energy efficiency scheme (SA); solar bonus scheme (Qld) solar feed-in tariff (SA); and the Victorian energy efficiency target (Vic). b Qld: South-east Queensland. c Northern Territory network charges are not separated into transmission and distribution.
Source: AEMC (2016a).
An important feature of the Australian electricity market is that, unlike other generators, renewable generators primarily earn their income from the sale of renewable energy certificates rather than from the sale of electricity in wholesale markets.10 This enables renewable generators to bid into wholesale electricity markets at prices that do not fully reflect their underlying cost of production, and increases the likelihood that their bids will be successful. This has consequent effects on the financial viability of non-renewable generators.
This is how the RET is intended to operate, as renewable power will always be used where it is available (as these generators can afford lower bid prices). But it has unintended consequences in relation to other costs that some renewables impose on the system (see below).
10 This can have the perverse effect of leading to negative prices for electricity.
18 PRODUCTIVITY REVIEW
Emission reduction and renewable energy policy issues
Well-functioning energy markets require climate change policy to be integrated with energy policy in a clear, consistent and coherent manner. The Australian Government took a step towards this by combining the environment and energy functions within the Department of Environment and Energy after the 2016 election.
The market price of energy — whether it be electricity or gas — is intended to provide appropriate signals for investment and demand-side management. With clear price signals different firms and technologies can compete on the basis of their underlying costs of production such that energy is supplied in the least cost manner.
The current suite of climate change abatement policies in Australia is intended to reduce greenhouse gas emissions. They do not achieve the required cuts in emissions at the lowest possible economic cost and are not technology neutral. Consequently, these policies do not provide the appropriate price signals to energy markets to guide investor and consumer behaviour.
National and state governments have independently made differing commitments to reduce greenhouse gas emissions and/or the uptake of renewable energy by different dates (table 2.2). New South Wales and Victoria have committed to zero net emissions by 2050, while other states have committed to shares of renewable energy. The Australian Government RET is equivalent to 20 per cent renewable energy by 2020. In contrast, South Australia, Queensland and the Northern Territory have committed to a target of 50 per cent by 2025, 2030 and 2030, respectively. The Australian Capital Territory has gone further, committing to 100 per cent renewable energy by 2020.
Despite these commitments, there is uncertainty as to how most jurisdictions will actually achieve these targets. The Australian Capital Territory has detailed how it intends to achieve its target (ACT Government 2016). Some jurisdictions are proposing or investigating policy mechanisms, but others have not outlined how these commitments will be achieved. There is a real problem in a connected system where states set their own targets without fully recognising the system consequences. States may set a high renewable target, relying on base-load in other jurisdictions to manage the production uncertainties. This can lead to the classic prisoners’ dilemma — which will result in insufficient base-load to stabilise the system. A NEM-wide target is needed to avoid this outcome.
There is also uncertainty about how the Australian Government will achieve its commitment to reduce greenhouse gas emissions by 26–28 per cent compared with 2005 levels by 2030.
There is also a lack of consensus between political parties. Past commitments have changed as governments or leaders have changed. This lack of clear stable signals concerning emission policy has created an uncertain investment environment and raised concerns around sovereign risk as policies and rules change after investments have been made.
SP 11 – ENERGY (ENERGY) 19

Table 2.2 Greenhouse gas emissions reduction and renewable energy commitments
Jurisdiction Commitment
Emission reductionsAustralia 26–28 per cent reduction compared with 2005 levels by 2030New South Wales Zero net emissions by 2050Victoria Zero net emissions by 2050
Renewable energyAustralia 20 per cent renewables by 2020Queensland 50 per cent renewables by 2030South Australia 50 per cent renewables by 2025Western AustraliaTasmaniaNorthern Territory 50 per cent renewables by 2030Australian Capital Territory 100 per cent renewables by 2020
Source: Australian Government (2015).
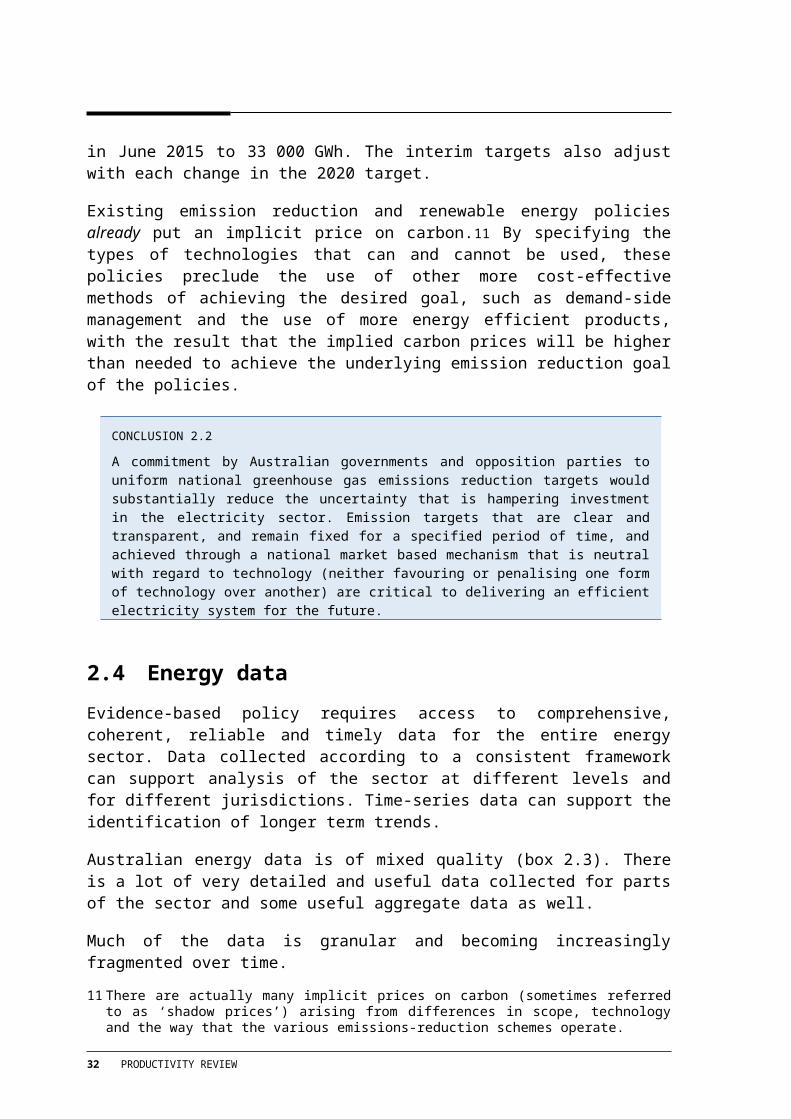
Investment uncertainty has also been hampered by a lack of policy stability and consistency. The RET is a good case in point. When it was introduced in 2001, the target of the then Mandatory Renewable Energy Target was to achieve an additional two per cent of electricity generation from renewables by 2020 (9500 GWh). The 2020 target was increased in 2009 to 41 000 GWh of additional electricity supplied by renewables. The scheme was then split in January 2011 into the LRET and SRES. The 2020 target was subsequently decreased in June 2015 to 33 000 GWh. The interim targets also adjust with each change in the 2020 target.
Existing emission reduction and renewable energy policies already put an implicit price on carbon.11 By specifying the types of technologies that can and cannot be used, these policies preclude the use of other more cost-effective methods of achieving the desired goal, such as demand-side management and the use of more energy efficient products, with the result that the implied carbon prices will be higher than needed to achieve the underlying emission reduction goal of the policies.
11 There are actually many implicit prices on carbon (sometimes referred to as ‘shadow prices’) arising from differences in scope, technology and the way that the various emissions-reduction schemes operate.
20 PRODUCTIVITY REVIEW

CONCLUSION 2.2
A commitment by Australian governments and opposition parties to uniform national greenhouse gas emissions reduction targets would substantially reduce the uncertainty that is hampering investment in the electricity sector. Emission targets that are clear and transparent, and remain fixed for a specified period of time, and achieved through a national market based mechanism that is neutral with regard to technology (neither favouring or penalising one form of technology over another) are critical to delivering an efficient electricity system for the future.
2.4 Energy data
Evidence-based policy requires access to comprehensive, coherent, reliable and timely data for the entire energy sector. Data collected according to a consistent framework can support analysis of the sector at different levels and for different jurisdictions. Time-series data can support the identification of longer term trends.
Australian energy data is of mixed quality (box 2.3). There is a lot of very detailed and useful data collected for parts of the sector and some useful aggregate data as well.
Much of the data is granular and becoming increasingly fragmented over time.
The official data sources used in this supporting paper do not make it possible to provide a consistent overview of the energy industry in Australia at a single point in time (such as for 2015-16 or 2016-17). Furthermore, the most recent year for which data are available varies between sources, ranging from a dated 2013-14 to 2107. This makes it difficult to gauge recent industry developments, particularly in a broader historical context. This is particularly an issue for electricity.12
12 The last year for which national electricity data for all Australian states is published is 2014-15 (DIIS 2016a). One table in the national energy statistics (table O) has been updated to 2015-16 (DEE 2017). Some NEM data sources more recent data.
SP 11 – ENERGY (ENERGY) 21

22 PRODUCTIVITY REVIEW

Box 2.3 Australia energy dataA lot of energy-related data is collected and published in Australia.
Very detailed data is published for parts of the sector. The AEMO, for example, publishes detailed wholesale electricity and gas spot market data for each five minute trading interval. These data are downloadable, and much of it is displayed visually. This detailed real -time data is extremely useful, particularly for market participants.
Aggregated data, such as by industry segment or financial year, is also published. The type and nature of these data vary depending on the agency concerned, and frequently reflect the remit of the organisation concerned. Recently, there has been a move towards publishing data on energy in aggregate, rather than for electricity and gas, with some resultant loss of information.
Some published data are the by-product of other specific functions undertaken by the collecting agency. For example, energy data that feeds into the national inventory of greenhouse gas emissions is published annually by the Department of Environment and Energy (last published for the calendar year 2015).
The AER publishes an overview of the electricity, gas and energy sectors in its State of the Energy Market (AER 2017b). This report focuses on the states regulated by the AER. It contains little statistical data on the Northern Territory, and less data on Western Australia than on other states and territories. Somewhat understandably given its remit, the AER places greater focus on the sectors that it regulates rather than those that it does not. The report does not contain comparable metrics such as value added, turnover, the value of capital stocks or employment by industry segment — generation, transmission, distribution and retail for the electricity industry, and production, transmission, distribution and retail for the gas industry — that enable comparisons to be made. Published information is generally restricted to the most recent years.
The Department of Industry, Innovation and Science published longer time-series for some energy-related aggregates in its Australian Energy Statistics (2016a). The publication is intended to be ‘the authoritative and official source of energy data for Australia and forms the basis of Australia’s international reporting obligations’. It contained detailed historical energy consumption, production and trade statistics, with some series extending back annually to 1960-61. The most recent published data is for 2014-15.
Numerous ‘machinery of government’ changes in recent years have meant that the energy function has repeatedly transferred between agencies and, with it, responsibility for collecting and publishing energy data.
The responsibility for energy now lies with the Department of Environment and Energy.
The ABS publishes some energy data, but these data tend to be highly aggregated and more dated. The more detailed energy-related publications have been discontinued. The periodic ABS Australian National Accounts: Input-Output Tables (Product Details) provides a limited breakdown of the Australian electricity industry (ABS Cat. no. 5215.0.55.001).
The comprehensiveness and timeliness of data on the electricity and gas industries has deteriorated recently.
Much of these data needed to support public policy is already collected or can be easily compiled from data collected. Electronic delivery mechanisms should enable these data to be released more promptly and enable greater comprehensiveness than publication in hardcopy.
SP 11 – ENERGY (ENERGY) 23

As a result, the time periods reported in this paper vary depending on data availability.
Moreover, the coverage is also often less than ideal. The AEMC, the AER and AEMO publish limited data for the Australian Capital Territory compared with the other eastern states; the Australian Capital Territory is often included as part of New South Wales. Many energy data sources do not include Western Australia and the Northern Territory at all.
The usefulness and quality of the higher-level energy data could be improved for policy analysis in particular by:
adopting an overarching coherent framework to guide existing data collections
improving the consistency of energy data collections and publications with wider reporting on economic activity
adopting an Australia-wide focus that covers all states and territories
focusing more on the contribution of the sector to wider economic activity
publishing separate measures, where appropriate, for electricity, gas and energy
publishing comparable measures for each industry market segment (electricity generation/gas extraction, transmission, distribution and retail)
publishing the data in a timely manner.
Much of the data required would already be collected by various government agencies. The key issue is that these data are not published, and certainly not in a timely or consistent manner.
There is limited price or value data to enable the cost of the renewable energy target to be accurately assessed over time and the impact of the renewable energy schemes on wholesale electricity prices and on incumbent generators.
CONCLUSION 2.3
The comprehensiveness and timeliness of data for the electricity, gas and energy sectors could be improved to provide a stronger evidence-base to support public policy in the electricity, gas and energy industries and to support wider industry analysis. For example, the publication of price and quantity data for the LRET and SRES schemes would inform the wider public on the effects of both schemes.
24 PRODUCTIVITY REVIEW

3 Electricity
This chapter provides an overview of the electricity industry in Australia and some of the key issues confronting it.
The chapter commences with an overview of the electricity industry (section 3.1) and the NEM (section 3.2) It then briefly outlines the recent evolution of the industry that has given rise to its current structure (section 3.3), before examining some of the issues likely to confront the industry (section 3.4). The chapter then explores some key issues affecting the industry (section 3.5). It then highlights some recent initiatives that will have implications for the industry (section 3.6).
Readers familiar with the industry structure, its evolution and current trends can proceed to the discussion of industry-specific policy issues in section 3.4. Chapter 2 canvases issues that also apply to the electricity industry. Policy issues specific to the gas industry are discussed in chapter 4.
3.1 Overview
The electricity supply industry covers the generation of electricity, its transportation from where it is produced to where it is used (the poles and wires of the network), and its sale to end users (figure 3.1). A range of other activities such as wholesale electricity markets, bilateral contracts and trade in electricity-related financial instruments support these sectors.13
The emergence of new more cost-effective technologies and government policies have led to fundamental changes that are challenging this traditional characterisation of the industry. Technological change is widespread throughout the industry, affecting the way that and where electricity is generated, and how it is transported and used. The resulting changes are having widespread ramifications. End users, for example, are playing an increasing role in the generation of electricity. Likewise, the increased use of distribution networks is leading to two way flows of electricity along distribution networks.
13 In the ABS Australian National Accounts (Cat. no. 5204.0), electricity-related financial instruments are treated as being part of the financial sector rather than the electricity supply industry.
SP 11 – ENERGY (ELECTRICITY) 25

Figure 3.1 Electricity supply chain
Source: AER (2017b, p. 18).
Government policies have been central to many of the changes that are directly affecting the industry. These include policy mandated increases in the production of electricity from renewable sources and generous feed-in tariffs.
Regulatory and other changes have been made to accommodate these changes affecting the industry.
26 PRODUCTIVITY REVIEW

Production of electricity
Electricity is produced commercially from the transformation of another source of energy. Energy is lost in this conversion process, such that the energy consumed is less than that produced.
In Australia, most electricity is generated by rotating magnets through electrostatic coils. These magnets are located on turbines that are primarily rotated by:
steam created by burning fossil fuels such as coal and natural gas to heat water
natural forces (such as wind and running water).
The production of electricity in this way usually occurs in specially built facilities, such as power stations and wind farms.
Some electricity is also produced by converting sunlight into electrons at the atomic level through the use of PV materials (termed solar PV). This production typically occurs in PV panels located in large-scale solar farms or on the rooftops of buildings.14
Geographic networks
The electricity supply industry in Australia consists of five geographically distinct networks (box 3.1).
Four of these networks supply electricity entirely within the state in which they are located — two in Western Australia, one in the Northern Territory and one in Queensland.
Only the NEM straddles state borders. It uses high voltage interconnectors to link the transmission networks in Queensland, New South Wales, Victoria, South Australia and Tasmania.15 The New South Wales transmission grid also services the Australian Capital Territory.
Interstate trade in electricity is only possible in the NEM. This chapter primarily focuses on the NEM unless otherwise stated. However, many of the issues raised may also be applicable to Western Australia and the Northern Territory.
14 Electricity produced directly by households, such as through the use of solar hot water systems, is generally only recorded in official statistics if it is subsequently sold into the grid. Household use of electricity generated in this way usually shows up in the electricity statistics as reduced demand.
15 The BassLink interconnector linking the Tasmanian transmission system to Victoria is a submerged high voltage direct current cable.
SP 11 – ENERGY (ELECTRICITY) 27

Box 3.1 Australian electricity networksThere are five main electricity grids in Australia:
the National Electricity Market (NEM) — which runs down the east and south east coast of Australia, covering the much of coastal Queensland, New South Wales, the Australian Capital Territory, Victoria, South Australia and Tasmania
the South West Interconnected System (SWIS) — which covers the south west of Western Australia, extending from Albany in the south to Kalgoorlie in the east and Kalbarri in the north
the North West Interconnected System (NWIS) — which covers part of the north west of Western Australia, servicing Dampier, Tom Price, Port Hedland, Karratha and Roebourne
the Darwin to Katherine Interconnected System (DKIS) — which runs from Katherine to Darwin in the Northern Territory
the Mount Isa-Cloncurry supply network (Mt Isa Network) — which runs from Cloncurry to Mount Isa in Queensland.
Of these, the NEM is the largest electricity network, accounting for 83 per cent of production and consumption in 2014-15 (DIIS 2016a table D).
Production and consumption
Production
Australia produced 258 terawatt hours (TWh) or 928 PJ of electricity in 2015-16 (figure 3.2). Production grew more-or-less continuously at 4.6 per year from 1960-61 to 2010-11. Since then, production has stabilised. Just over one-third of this long-term growth in production can be attributed to servicing the growth in the population (35 per cent).
Electricity production also grew steadily from 1960-61 in per person terms (figure 3.2). However, production per person peaked in 2006-07 at 11.7 megawatt hours (MWh) per person. Since then, production has declined by 9 per cent to 10.7 MWh per person. A range of factors have affected electricity use per person (and hence production), including more energy efficient appliances, increasing use of roof top solar hot water, better insulated buildings, and the continued shift in the share of production toward services.
The Electricity generation sector produced $19 billion in gross industry value in 2013-14 (latest available) (0.5 per cent of GDP), or 31 per cent of the gross value of the overall electricity supply industry (ABS 2016).16
16 The remainder was contributed by Electricity transmission, distribution, on selling and electricity market operation.
28 PRODUCTIVITY REVIEW

Figure 3.2 Electricity generation, Australia, 1989-90 to 2015-16a
0
2
4
6
8
10
12
14
0
50
100
150
200
250
300
1989-90 1994-95 1999-00 2004-05 2009-10 2014-15
MWh/personTWh Electricity generation (LHS) Electricity generation per person (RHS)
a Defined as total consumption of electricity by all states and territories (excludes solar energy).
Sources: 1989-90 to 2012-13: DIIS (2016a table O), 2013-14 to 2015-16: Department of the Environment and Energy (DEE 2017), table O).
State production
Electricity production in 2014-15 was concentrated in four states: Queensland (27 per cent); New South Wales (25 per cent); Victoria (22 per cent); and Western Australia (15 per cent). The first three of these states form part of the NEM.
Production by fuel type
Most electricity in Australia is produced from the combustion of fossil fuels (85.3 per cent in 2015-16) (figure 3.3). Thermal (black) coal is the major fuel source, followed by natural gas and lignite (brown coal).17 Coal accounted for 63 per cent of electricity production. The main sources of electricity from renewable sources were hydroelectricity and wind, which collectively accounted for one-tenth of all electricity produced.
The renewable energy sector has undergone strong growth in recent years — both in terms of the amount of electricity produced and as a share of overall production (figure 3.4). Despite this growth, renewables accounted for just 15 per cent of overall electricity production in 2015-16. However, the use of renewables is higher in some jurisdictions such as Tasmania (hydroelectricity) and South Australia (wind).
17 This predates the 2016-17 closure of the 1600 MW brown coal fired Hazelwood Power Station in Victoria’s La Trobe Valley.
SP 11 – ENERGY (ELECTRICITY) 29

Figure 3.3 Share of electricity generation by fuel type, 2015-16a
Black coal 44%
Natural gas 20%
Brown coal 19%
Oil products 2%
Hydro 6%
Wind 5%Solar PV 2.7% Biomass 1%
a All states and territories.
Source: Department of the Environment and Energy (DEE 2017), table O).
Figure 3.4 Electricity generation by broad fuel type, Australia, 1989-90 to 2015-16a
Generation (TWh)
0
50
100
150
200
250
1989-90 1999-00 2009-10
Non-renewables Renewables
Share (Per cent)
0
20
40
60
80
100
1989-90 1999-00 2009-10
Non-renewables Renewables
a Non-renewables: black coal, brown coal (lignite), natural gas, oil products and, up to 2013-14, multi-fuel fired plants. Renewables: bagasse, biogas, geothermal, hydro, solar PV, wind and wood.
Sources: 1989-90 to 2012-13: DIIS (2016a table O), 2013-14 to 2015-16: Department of the Environment and Energy (DEE 2017).
30 PRODUCTIVITY REVIEW

Generators
There are over 300 registered generators in the NEM. There is a single generator in Tasmania, which accounted for 96 per cent of that state’s generating capacity in 2017, with BassLink accounting for the remainder. The remaining NEM regions consist of multiple generators. AGL Energy was the largest generator in capacity terms in three states — South Australia (42 per cent), Victoria (31 per cent) and New South Wales (29 per cent) — while CS Energy was the largest generator in Queensland (35 per cent).The three largest generators accounted for roughly three-quarters of generating capacity in each NEM region outside Tasmania, other than New South Wales, where they accounted for 62 per cent (figure 3.5).
There is a mix of public and private ownership, with most generators in Victoria, New South Wales and South Australia being privately owned. The single generator in Tasmania (Hydro Tasmania) is government owned.
Figure 3.5 Market shares in NEM generation capacity by state, 2017a
MW
a Capacity is based on summer availability for January 2017, except wind, which is adjusted for an average contribution factor. Interconnector capacity is based on observed flows when the price differential between regions exceeds $10/MWh in favour of the importing region; the data excludes trading intervals in which counter flows were observed (that is, when electricity was imported from a high priced region into a lower priced region). Capacity that is subject to power purchase agreements is attributed to the party with control over output.Source: AER (2017b, p. 44).
SP 11 – ENERGY (ELECTRICITY) 31
Consumption
The convention in Australian electricity statistics is for the quantity consumed to equal the quantity produced, with the use of electricity in the production of electricity (own-use) and losses incurred in transportation recorded as part of electricity consumption.
As final consumption of electricity in 2014-15 was 803 PJ, this suggests that these losses accounted for roughly 11 per cent of Australian production in that year.
Households and the manufacturing sector collectively account for almost half of electricity consumption (figure 3.6). Other notable users are mining and the electricity supply, gas, water and waste industries, which both account for just over 10 per cent.
Figure 3.6 Australian electricity consumption by user, 1973-74 to 2014-15a
PJ
0
50
100
150
200
250
300
1973-74 1978-79 1983-84 1988-89 1993-94 1998-99 2003-04 2008-09 2013-14
Agriculture Mining Manufacturing EGWWS
Construction Transport All other Residential
EGWWS: electricity supply, gas, water and waste services. a Share of total final energy supply by natural gas.
Source: DIIS (2016a table F).
32 PRODUCTIVITY REVIEW

Three clear trends are evident over the last 40 years:
residential demand has grown more-or-less continuously (2.8 per cent per year)
mining demand has grown more-or-less continuously (4.6 per cent per year)
manufacturing sector demand grew strongly to 2001-02 (4.0 per cent per year), before declining (-1.5 per cent per year).
Interstate trade
Interstate trade accounts for the difference between electricity production and consumption in each state. The direction and extent of this trade varies depending on the spot prices in interconnected states and availability of interconnector capacity. These prices reflect local demand and supply conditions in each state.
Queensland and Victoria were net exporters of electricity in 2014-15, while New South Wales, South Australia and Tasmania were net importers (figure 3.7). Given that their grids are not connected to other states, there was no interstate trade for Western Australia and the Northern Territory.
Figure 3.7 Electricity production, consumption and interstate trade, 2014-15 a
TWh
-20
0
20
40
60
80
NSW Vic Qld SA WA Tas NT
Production Consumption Net imports (exports)
a New South Wales includes the Australian Capital Territory.
Source: DIIS (2016a).
SP 11 – ENERGY (ELECTRICITY) 33

Variation over the course of the year
Production, consumption and interstate trade in electricity vary markedly over the course of each day and throughout the year. These variations are driven principally by the demand patterns of households, not businesses.
The demand for electricity typically peaks in the early evening and is lowest overnight. Over the seasons it is higher on hot days in summer (from the increased use of air conditioners) and on cold days in winter (from the increased use of heaters). Summer peak demand typically exceeds that of winter. Around three quarters of Australian households have air conditioning or evaporative cooling (AER 2015, p. 25).
The use of rooftop solar panels and air conditioners also shifts the profile of electricity sourced from the grid. Understandably, households with rooftop solar panels supply most of their own electricity during the day when the sun shines and, as a result, source less electricity from the grid (figure 3.8). However, this changes in the evening and overnight when these customers source their electricity from the grid. Likewise, air conditioners increase the demand for electricity during daylight hours (particularly in the afternoon).
Figure 3.8 Typical daily electricity consumptionAverage consumption
a Based on Western Power’s Perth Solar City program spanning several [unspecified] years. Raw consumption for each customer by time of day averaged separately for weekdays and weekends and for each season. Averaged over the course of a year. Smoothed.
Source: Data Analysis Australia (2015).
34 PRODUCTIVITY REVIEW

Maximum electricity (peak) demand is closely linked to weather conditions. It also reflects local demand and supply conditions prevailing at the time (such as generator availability). After rising for a decade to 2009, maximum electricity (peak) demand has been generally flat or declined in most NEM regions to 2014-15 (AER 2017b, pp. 26–27). However, maximum demand for New South Wales, Victoria and South Australia rose significantly in 2015-16 (although well below historical peaks).
Queensland continued its almost unbroken trend of rising maximum demand, setting a new record peak on 18 January 2017 (AER 2017b, p. 26).
Significant generating capacity needs to be available to meet these relatively infrequent peaks. Maximum demand accounts for between 70 and 80 per cent of installed capacity in the NEM in most years (AER nd). Strong demand on these days feeds through into higher spot market prices for electricity, which induces extra capacity to come online.
Spot prices in the NEM have exceeded $5000/MWh on 487 occasions since 2001, an average of 30 times a year across all NEM regions (or 6 per NEM region per year). These price spikes are more common in the hotter states — South Australia (10 per year), New South Wales (7 per year) and Queensland (6 per year) (AER 2017d).
The supply of electricity at any point in time also varies. Renewable sources of energy are particularly susceptible to variations in weather conditions that affect wind strength, the amount of sunshine and water availability. Wind power, for example, is unable to generate when there is no wind or when the wind exceeds maximum acceptable operating levels. All generation and network infrastructure are subject to maintenance down time, equipment failures (which may be more likely under adverse conditions) and climatic conditions (such as bushfires, thunderstorms and cyclones).
The supply of electricity may also vary depending on market conditions, whether generators have market power (either permanent or temporary) and for strategic reasons, such as temporarily withholding supply now in the hope that the rise in future prices will offset the loss from not generating now (a particular issue for hydropower). Individual generators that are unsuccessful in their offer bids are not needed for the timeslots sought.
Subject to availability and suitable conditions, some forms of generation such as hydroelectricity, gas peaking plants and batteries can be brought online to generate electricity at short notice or if directed to do so by the market operator.
Interstate trade can assist in meeting sudden changes in demand or supply within particular NEM regions and enable the more efficient use of generator capacity across the NEM. The scope to do so is, however, limited by the capacity of the interconnectors and their availability.
SP 11 – ENERGY (ELECTRICITY) 35

Distributed generation and distributed systems
Falling costs are making the small-scale (micro) production of electricity increasingly viable. These generators are often modular, and may involve renewable sources of energy.
Distributed generation is when these small-scale generators are located close to the end users of that electricity, thereby bypassing the transmission network and potentially the distribution network as well. New technologies are allowing electricity to be supplied through distributed generation at lower-cost than in the past and potentially with more reliability and security, and with fewer environmental impacts, than traditional power generators.
Falling information technology costs are also making it more viable for localised sharing or trade in electricity between office and residential buildings (termed distributed systems).
Photovoltaic solar panels
Commercial solar farms in Australia are in their infancy. As at March 2017, there was 232 MW of solar capacity installed in the NEM, all located in New South Wales (AER 2017b, p. 33). Growth has been slow given the relatively high costs involved.
In contrast, Australia has high take up rates for photovoltaic panels by international standards (figure 3.9). More than 1.6 million Australian households have rooftop solar panels, with roughly one in four households in the Australian Capital Territory and New South Wales having them installed.
Governments encouraged this uptake of rooftop solar by mandating higher feed-in tariffs for electricity sold into the grid between 2008 and 2012. Since 2012, the schemes have been phased out or closed to new entrants, and replaced by ‘market offers’ from electricity retailers at unregulated prices. These market offers do not provide the same incentives to install rooftop solar.
Collectively, these panels had an installed capacity of 5286 MW in 2016, equivalent to 9 per cent total installed generating capacity (AER 2017b, pp. 33 & 35).
36 PRODUCTIVITY REVIEW

Figure 3.9 Rooftop solar penetrationPer cent of households
Source: AER (2017b, p. 36).
3.2 National electricity market
The transmission network that supports the NEM is almost 44 000 kilometres (km) long (AEMC 2013). It is over 4500 km from its northern tip at Port Douglas in far northern Queensland to Port Lincoln in South Australia and across to Tasmania (figure 3.10).
SP 11 – ENERGY (ELECTRICITY) 37
Figure 3.10 The National Electricity Market
Source: AER (2017b, p. 23).
38 PRODUCTIVITY REVIEW

In 2015-16, the NEM:
consisted of 336 registered generators, which collectively had an installed generating capacity of 47 148 MW
generated 198 TWh of electricity
supplied 9.6 million customers
generated $11.7 billion in turnover (AER 2017b, p. 24).
Generation sector
Installed generating capacity in the NEM grew at 2.4 per cent per year from 1998-99 to 2012-13 (figure 3.11). Installed generating capacity then fell by 1.8 per cent per year to 2016-17. This reflects that the reduction in capacity with the withdrawal of older coal and gas-fired power stations exceeded the addition of new capacity (mostly renewables) (table 3.1).
Figure 3.11 Installed generating capacity and peak demand, NEM, 1998-99 to 2016-17GW
0
10
20
30
40
50
NEM capacity NEM demand
Source: AER (Generation capacity and peak demand (nd)).
SP 11 – ENERGY (ELECTRICITY) 39

Table 3.1 Withdrawn and announced withdrawal of generation capacity from the NEM, since 2011-12
Year of withdrawal
Power station State Year commissioned
Capacity Fuel typea
MWWithdrawal2011-12 Swanbank Bb Qld 1971 480 CCGT2012-13 Munmorah NSW 1967 600 Coal
Tarongc Qld 1984–1986 700 CoalCollinsville Qld 1968 180 Coal
2014-15 Morwell, Brix Vic 1956 95 CoalWallerawang C NSW 1976 1 000 CoalRedbank NSW 2001 144 CoalPelican Pointd SA 2001 249 CCGTSwanbank Ee Qld 2002 385 CCGT
2015-16 Northern SA 1985 540 CoalPlayford B SA 1963 200 CoalAnglesea Vic 1969 150 Coal
2016-17 Hazelwood Vic 1964 1 600 Coal
Announced withdrawal2017 Smithfield NSW 1996 171 Gas
Tamar Valleyf Tas 2009 208 CCGT2021 Mackay Qld 1975 34 CCGT2022 Daadine Qld 2006 33 CCGT
Liddell NSW 1971–1973 2 000 Coala CCGT: combined cycle gas turbine. b Decommissioned progressively between April 2010 and May 2012. c Closed 2012 to 2014. d Half capacity withdrawn. Announced return to full capacity in June quarter 2017. e Placed into cold storage. Expected to return December 2018. f Mothballing.
Sources: AER (2017b, p. 40); Generator web sites.
The lack of investment in new generating capacity and extending the economic lives of existing generators partially reflects uncertainty concerning the future investment environment. This uncertain has arisen for many reasons, including:
recent changes in Australian climate change policy (including moving from tradable emissions permits to a fixed carbon price (carbon tax), and then moving from a ‘market-based’ emissions reduction scheme to direct action) (discussed in chapter 2)
uncertainties about how Australia will meet its international commitment to reduce greenhouse gas emissions by 26–28 per cent on 2005 levels by 2030 (discussed in chapter 2)
uncertainties concerning the availability and price of natural gas as feedstock (discussed in chapter 4)
40 PRODUCTIVITY REVIEW

increased sovereign risk associated with recent government interventions in the market following the problems in South Australia and Tasmania, and supply uncertainties in New South Wales, Victoria and Queensland.
Many of the power stations withdrawn have been older coal fired power stations built in the 1960s or early 1970s, or smaller combined cycle gas power stations built around the year 2000. These withdrawals include (in decreasing order of size): Hazelwood (Victoria), Wallerawang C (New South Wales), Swanbank B and E (Queensland), Munmorah (New South Wales), Northern (South Australia) and Pelican Point (South Australia). Other coal and gas fired power stations are scheduled to close in the near future, including the giant Liddell power station in New South Wales (capacity 2000 MW), which is scheduled to close in 2022.
At its April 2017 meeting, the Chief Executive Officer of the AEMO briefed the COAG Energy Council that the closure of the Hazelwood power station:
… would not compromise the security of the National Electricity Market next summer [2017-18]. (COAG Energy Council 2016)
Many of these withdrawals have been large power stations, while the additions tend to be smaller.
System reliability
The intermittency of renewable generation18 makes it difficult for the system operator to ensure that there is always sufficient supply to meet required demand (termed system reliability).The problems of intermittent and variable sources of electricity can be, at least partially, overcome through a variety of means, such as aggregation (bundling), increased use of interconnectors and the use of storage facilities (like dams and batteries).
Dispatchability
Most forms of generation connected to electricity grids can be called on by the system operator to produce electricity when required. The system operator needs to know, among other relevant factors, that the generator exists, its capacity and its physical location. It also needs to communicate with the generator to be able to control its input into the grid.
The system operator can do this for registered generators.
All generators that connect to the interconnected transmission or distribution system are required, unless exempted, to be registered under section 11 of the National Electricity
18 Hydro is not intermittent, and pumped hydro, where the water is pumped back up to the dam at times where cheap power is available, can be used to generate power to meet peak demand. But hydro is affected by the catchment rainfall, which can vary from year to year.
SP 11 – ENERGY (ELECTRICITY) 41

Law. The main exemption from registration is for small generating systems with a combined nameplate rating of less than 5 MW.
As a result, the system operator is not aware of small generators, such as rooftop solar panels connected to distributed systems, even though they are connected to the grid and may be supplying electricity (typically through the distribution system).
Moreover, these small generators cannot be controlled by the system operator.
This lack of awareness and inability to control their output makes it harder for the system operator to maintain system stability (discussed below).
Responsiveness
Some sources of generation such as gas, hydro, wind and solar can be rapidly brought online to generate electricity. The amount of electricity produced by gas and hydro can also be varied quickly as required by the system operator.
On the other hand, coal-fired power stations take much longer before they can begin generating electricity and it is much harder to vary their output.
Coal power stations are capable of generating large quantities of electricity (with installed capacities of 600 to 2000 MW). They are expensive to build, but, on a per MW produced basis, these ‘fixed’ costs are typically lower than other forms of generation. However, as they require fuel to produce electricity, the cost of producing each additional unit of electricity (referred to as their ‘marginal cost’) is also typically higher. The long ramp up to peak capacity means that coal-fired power stations frequently operate 24 hours a day, 7 days a week, so are ideal for providing baseload demand, with other more responsive sources of electricity meeting peaks in demand.
Gas generation tends to have lower fixed costs and higher marginal costs than renewables, but not to the same extent as coal generation.19
Ancillary services
Ancillary services encompass a range of technical services that are needed to maintain the physical properties of the electricity being supplied, such as its voltage and frequency (box 3.2). These services ensure that there are no surges, spikes and other disturbances that could potentially damage all equipment connected to the electricity grid. Ancillary services are vital for power system security.
Electricity on transmission networks need to adhere to a standard frequency of 50 cycles per second (termed Hertz). Frequency control services provided by certain generators seek to maintain this by balancing supply and demand in the short-term.
19 The marginal cost of some renewable is minimal.
42 PRODUCTIVITY REVIEW

Synchronous generation is important for frequency control. Some sources of electricity, such as coal, gas and hydroelectricity, produce waveforms of voltage that are synchronized with the physical rotation of the rotor in the generator (termed synchronous generation). These generators resist sudden changes, thereby making it easier to maintain grid frequency.
However, some sources of electricity, particularly wind power, do not produce waveforms that coincide the physical rotation of the rotor (termed asynchronous generation). Frequency control services are required to maintain grid frequency.
System inertia helps resist sudden changes in frequency. The output of some sources of electricity, such as coal, gas and hydroelectricity, inherently possess system inertia, but other sources, such as renewables, do not. Changes in the mix of generation over time has made the provision of system inertia more critical, and work is underway to ensure it can be provided as a separate service.
Companies bid to provide these services to the NEM on a competitive basis to ensure that, if needed, they are provided on a least cost basis (box 3.2).
On 7 July 2017, the AEMC announced a review into the market and regulatory arrangements necessary to support effective control of system frequency in the NEM (AEMC 2017b).
SP 11 – ENERGY (ELECTRICITY) 43

44 PRODUCTIVITY REVIEW

Box 3.2 Ancillary Service
SP 11 – ENERGY (ELECTRICITY) 45

Ancillary services maintain the availability and quantity of electricity supplied across networks. They seek to maintain the physical characteristics of the electricity being supplied, such as its voltage, frequency, waveform purity and phase balance. They underpin the physical trade that occurs in the sport market.
Ancillary services are vital for ensuring a safe, secure and reliable supply of electricity to customers. They are essential for preventing damage to all infrastructure connected to the network that may otherwise occur.20
The AEMO is responsible for maintaining the provision of ancillary services to the NEM.
Ancillary services encapsulate a number of different types of physical services:
frequency control ancillary services (FCAS), which maintain the frequency on the electrical system at any point in time, close to 50 cycles per second (split into six second, 60 second and five minute responses to raise or lower the frequency)
network support and control ancillary services (NSCAS), which control transmission line flows and permit full utilisation of transmission lines by:
– controlling the voltage at different points on the electrical network to within prescribed standards
– controlling the power flow on network elements to within their physical limitations
– maintaining transient and oscillatory stability within the power system following major power system events
system restart ancillary services (SRAS), which enable the electrical system to be restarted after a complete or partial system blackout.
As electricity is supplied through networks, supply problems in one part of the network can flow through to other users and, in some cases, escalate.
Synchronous generation is important for frequency control.
The manner in which these services are provided, who pays and how much they pay varies depending on the nature of the service provided.
Frequency control involves bringing the demand for, and supply of, electricity back into balance. Regulation frequency control services respond to minor deviations in load or generation, while contingency frequency control services respond to major events such as the loss of a generating unit.
The price of FCAS is determined in a broadly similar way to that used to price electricity in the wholesale market. Companies offer to provide the different types of services required and the price at which they are prepared to supply them. The market operator determines the amount of FCAS service required and selects the companies that minimise the cost of the services. The market clearing price is the bid price of the highest cost company selected. This price is then paid to all companies that supplied the services used.
FCAS services are paid for by different parties depending on the nature of the underlying problem and, hence, the response required. The cost of regulating FCAS is recovered from the causer (causer pays basis). The cost of contingency FCAS that raise and lower
20 Important infrastructure such as power stations, interconnectors and substations have their own additional security measures such as surge protectors and voltage optimisation to protect them. For example, the surge protector on the Heywood interconnector that links the South Australia and Victorian transmission systems tripped to prevent damage to the interconnector after the loss of other generators following storm damage to the South Australia transmission system in September 2016 (AEMO 2017a).
46 PRODUCTIVITY REVIEW

frequency are recovered from generators and customers, respectively.
Source: Based on AEMO (2017d).
Wholesale electricity market
The NEM wholesale electricity ‘market’ consists of five interconnected state-based spot markets (referred to as ‘NEM regions’) that instantaneously match the supply and demand for electricity in each market.21 Interconnectors allow trade between adjacent spot markets up to their capacity. If the interconnectors are down or their capacity is reached, the prices of electricity in adjacent spot markets become separated from each other.
The spot price in each NEM region is determined by demand and supply in that market and the extent of cross-border trade.
Generators submit bids to supply specified amounts of electricity at specified prices for set time periods to the market operator (AEMO). Generators can resubmit the amounts offered at any time (but not their price). Bids are submitted for every five minutes of the day (giving 288 dispatch intervals).
From all the bids offered, the AEMO determines which generators will be deployed to produce electricity, with the cheapest generator put into operation first in order to meet demand in the most cost-efficient way. This is done by progressively dispatching generators in increasing order of their bid price. The dispatching of generators is done in real-time through a centrally-coordinated dispatch process that also takes into account transmission limitations to prevent the network from becoming overloaded.
Spare generating capacity is always kept in reserve in case it is needed.
Should consumption in a NEM region exceed supply, and all other means of meeting that consumption have been exhausted, the AEMO can instruct network service providers to temporarily cut off the electricity supply to some customers, usually a large industrial customer (termed load shedding). This action is only taken when there is an urgent need to protect the power system by reducing consumption and returning supply and demand in the system to balance.
The market price for every five minute trading interval (referred to as the ‘dispatch price’) is determined by the highest bid price accepted by the market operator for the last MWh of electricity dispatched. The spot price in each market is then determined for every half-hour by averaging the six dispatch prices that make up that half hour. All generators dispatched in the half-hour are paid the spot price.
21 There is one spot market for each state in the NEM. The New South Wales spot market also covers the Australian Capital Territory.
SP 11 – ENERGY (ELECTRICITY) 47

The National Electricity Rules set a minimum (negative $1000/MWh) and a maximum price for the spot price ($14 000/MWh in 2016-17 and $14 200 in 2017-18).
The market operator also manages the financial settlements that accompany the physical flows of electricity. These settlements are based on the spot price.
Wholesale electricity prices vary between NEM regions and over time (figure 3.12). These prices provide signals to market participants to guide their responses and signal the need for possible future investment. Variations in the price over time (price volatility) potentially exposes electricity generators and users to financial risk and uncertainty. Financial instruments can be used to hedge against these risks.
Figure 3.12 Annual NEM electricity prices by region, 1999–2000 to 2016-17a
$/MWh
0
20
40
60
80
100
120
140
1999-2000 2001-02 2003-04 2005-06 2007-08 2009-10 2011-12 2013-14 2015-16
Qld NSW Vic SA Tas
a Volume weighted average prices; 2016-17 data is for the nine months to 31 March 2017.
Source: AER (2017b, p. 52)..
Between January 2013 and August 2016, average wholesale prices were lowest in Victoria ($45/MWh) and New South Wales ($48/MWh) (table 3.2). Average prices were appreciably higher in the remaining NEM regions, with South Australia having the highest average price ($62/MWh).
Wholesale prices tended to be more stable (less volatile) in Tasmania, New South Wales and Victoria, although Tasmania did experience significantly more price spikes — wholesale electricity prices over $300/MWh — than the two mainland states (311 compared with 22 and 64, respectively) (table 3.2). Queensland experienced the highest price variability (365 per cent from average), but South Australia experienced the highest number of price spikes (610 in total, or an average of 14 per year).
48 PRODUCTIVITY REVIEW

Table 3.2 Wholesale electricity market price characteristics by NEM region, January 2013 to August 2016
NSW VIC QLD SA TAS
Average wholesale price $47.80 $44.78 $59.90 $61.78 $59.03Volatilitya 162% 167% 365% 260% 128%Number of price spikesb 22 64 405 610 311a Half-hourly wholesale price variations from the average wholesale price. b Half-hourly wholesale prices greater than $300/MWh.
Source: PWC (2016, p. 13).
While price variability has always been part of the NEM, of particular concern has been a sharp jump in prices in 2016-17 in all NEM regions other than Tasmania. The smallest increase in average prices was 15 per cent in Victoria, and the largest increase was 65 per cent in South Australia (figure 3.12). The increases in Queensland and New South Wales were both in the order of 50 per cent. These large price increases reflected changes in the supply–demand balance and in the mix of generation supply, with gas generation being the marginal producer for longer periods and gas prices being high by historic standards (discussed in chapter 4).
The fall in Tasmanian spot prices reflected a partial unwinding of the higher prices that followed the problems in the previous year with the BassLink interconnector, which was out of operation from 20 December 2015 to 13 June 2016 following a subsea fault in the cable (and some subsequent disruptions).
Transmission sector
Transmission grids
Transmission involves the transportation of electricity at high voltages from the point of generation to the point where local distribution network begins or, for large customers, the point of final demand.
The NEM consists of five state-based transmission networks. Each region has a single ‘Transmission Network Service Provider (TNSP)’ that is responsible for the overall management of the transmission network in that region, even if other companies also provide these services (table 3.3).22
Table 3.3 Transmission networks in the NEMNEM region TNSP Owner Network
22 In Western Australia, there are two transmission companies, one for the SWIS and one for the NWIS.
SP 11 – ENERGY (ELECTRICITY) 49

length
kmQld Powerlink Queensland Government 14 756
NSW (and ACT) TransGrid Hastings 20%; Spark Infrastructure 15%; other private equity 65%
13 039
Vic AusNet Services
Listed company (Singapore Power 31.1%, State Grid Corporation 19.9 %)
6 559
SA ElectraNet State Grid Corporation 46.6%; YTL Power Investments Limited 33.5%; Hastings 19.9%
5 524
Tas Transend Tasmanian Government 3 564
NEM total 43 442
Source: AER (2017b, p. 96).
The transmission network assets in all states except Victoria are government owned. In Victoria, the network is owned by the private sector TNSP.
In contrast, the majority of companies that actually operate the networks — the TNSPs — are privately owned, with the TNSPs in South Australia and New South Wales leasing the assets from their respective state governments.23
The transmission networks and the TNSPs in Queensland and Tasmania are government owned.
Interconnectors
Interconnectors are the high-voltage transmission lines that transport electricity between most adjacent regions in the NEM (although not between New South Wales and South Australia). They allow electricity to be imported into a region when demand is higher than can be met by local generators, or when the price of electricity in an adjoining region is low enough to displace local supply.
There are six interconnectors currently in the NEM (table 3.4). Each interconnector consists of connections to allow electricity to flow in both directions. However, as the capacity of the connections are often not symmetric, some interconnectors allow more electricity to flow in one direction than the other.
23 In December 2015, the New South Wales Government leased TransGrid for 99 years to the NSW Electricity Networks consortium — Caisse de dépôt et placement du Québec (24.99 per cent), Hastings (20.02 per cent), Tawreed Investments (19.99 per cent), Wren House Infrastructure (19.99 per cent) and Spark Infrastructure (15.01 per cent) — for $10.258 billion. The consortium signed an ‘Electricity Price Guarantee’ confirming that total network charges will be lower in 2019 than they were in 2014.
50 PRODUCTIVITY REVIEW

There are two types of interconnectors in the NEM:
regulated interconnectors
unregulated interconnectors.
Regulated Interconnectors
A regulated interconnector is an interconnector that has passed the regulatory test set out in the National Electricity Rules and has been deemed to add net market value to the NEM. The owners of a regulated interconnector receive a fixed annual revenue set by the AER based on the value of the asset, rather than on the usage of the interconnector. The revenue forms part of the network charges levied on electricity users.
All interconnectors in the NEM other than BassLink are regulated.
Table 3.4 NEM interconnectors
Name NEM regions linked
Nominal capacity
Owners Length
MW kmRegulatedDirectLink (Terranora) NSW–QLD North: 107
South: 210Energy Infrastructure Investments (Marubeni 49.9%, Osaka Gas 30.2%, APA Group 19.9%)
63
Heywood SA–VIC East: 460West: 460
200
Murraylink NSW–VIC East: 220West: 220
Energy Infrastructure Investments (Marubeni 49.9%, Osaka Gas 30.2%, APA Group 19.9%)
104
Queensland to New South Wales Interconnector (QNI)
NSW–QLD North: 300–600
South: 1 078
NSW Government/Queensland Government
~235
Victoria to New South Wales
VIC–NSW North: 1 600South: 1 600
NSW Government/AusNet Services
~150
UnregulatedBassLink TAS–VIC North: 594
South: 478Keppel Infrastructure Trust
375
Sources: AER (2017b, p. 96); AEMO (2015).
Unregulated Interconnectors
An unregulated (or market) interconnector derives revenue by trading electricity in the spot market. The owners purchase electricity in a lower price region and sell it to a higher price
SP 11 – ENERGY (ELECTRICITY) 51

region, or by selling the rights to revenue generated by trading across the interconnector. Unregulated interconnectors are not required to undergo regulatory test evaluation.
BassLink is the only unregulated interconnector in the NEM.
Planning and augmentation
TNSPs are required to account for the costs of system maintenance separately from that of new investment in augmenting the grid.
The AEMO is responsible for planning of the national transmission network. It publishes a 10 year forecast annually to assist market participants assess the future need for electricity generating capacity, demand-side capacity and augmentation of the network to support the operation of the NEM (AEMO 2016a).
Under the National Electricity Rules, TNSPs are required to undertake a market-based cost-benefit test known as the ‘regulatory investment test for transmission’ (known as a RIT-T) for potential network augmentation and non-network investment proposals.
Under the test, TNSPs are required to assess the efficiency of proposed investment options by estimating the benefits that would result for market participants and consumers, and comparing these to the associated costs. They are required to put forward and evaluate various options including non-network solutions, such as generation support and demand management, and engage in stakeholder consultation. The test is intended to ensure that each individual investment proposal is evaluated on its merits.
Connection
Companies wishing to connect any facility to the NEM — be it a power station, industrial facility or a connection to a distribution network — must liaise with the connecting TNSP, who manage the connection process. The facility must meet the network performance standards required by the system operator. The AEMO is involved in assessing simulation models of power system plant and associated control systems, and commissioning and post-commissioning activities.
Regulation
Transmission networks are highly capital intensive and involve significant costs that do not vary with the quantity of electricity transported. As a result, the average cost of transporting electricity generally declines as output increases. These ‘economies of scale’ mean that it is typically cheaper for transmission services to be provided by a single company rather than by competing ones. Transmission companies are highly regulated to
52 PRODUCTIVITY REVIEW

prevent them from exploiting the market power that arises from these ‘natural monopoly’ characteristics.24
The approach for regulating electricity networks is set out in the National Electricity Law and Rules. Chapter 6A of those Rules sets out the framework to be used for transmission networks, while chapter 6 does the same for distribution networks.
Prices are set on a state-by-state basis for each state’s TNSP. The process differs depending on whether the services being provided are:
negotiated between the network operator and the customer (termed ‘negotiated services’)
open to all customers (termed ‘prescribed services’).
Negotiated services are usually provided to a single customers (or small group) that connect directly to the grid. These typically include registered generators and large industrial customers. The prices are negotiated with the TNSP in accordance with their Negotiating Framework, which is required by the National Electricity Rules, and approved by the AER.
Prescribed transmission services are subject to revenue regulation by the AER under the National Electricity Rules. This involves: the determination of total revenue that each TNSP can earn; and its translation into the prices levied on network users (box 3.3).
Annual revenue requirements
The AER determines the aggregate annual revenue requirement that each TNSP can earn over a specified period of time (such as for three years) using a ‘building-block’ approach, which builds up its ‘Regulated Asset Base’ from past and current approved capital expenditures. The AER then applies an estimate of the cost of financing that expenditure (including a rate of return on that expenditure) — termed the weighted-average cost of capital (WACC) — to these regulated asset bases to determine the revenue that it can earn in each year.
This process requires the AER to make judgements on the efficient level of operating costs together with depreciation and a rate of return on its Regulated Asset Base. This process is costly and contentious, and frequently the basis for legal reviews against the final determination.
The approach is intended to act as a form of ‘incentive regulation’, whereby the business can keep the balance of its revenue allowance for the regulatory period if it can outperform the revenue allowance by operating more efficiently.
24 The exercise of monopoly power can be exerted in different ways, such as by raising prices, inflating costs or by reducing the quality of services supplied.
SP 11 – ENERGY (ELECTRICITY) 53

Box 3.3 The setting of transmission prices in the NEMThere is a three-step process for translating the maximum allowable revenue that each TNSP can earn into the actual transmission prices levied in each year.
The first step involves the TNSP allocating this revenue across four different types of prescribed activities: entry services, which cover assets used to support the connection of generators to the grid exit services, which cover assets used to support the connection of large customers and
distributors to the grid common services, which cover services that benefit all customers irrespective of location shared network services, which covers the use of the transmission network (including
transmission power lines/towers and terminal stations) by large customers and distribution companies. These are specified on a ‘locational’ and ‘non-locational’ basis.25
The second step involves the TNSP allocating the amount of revenue to each connection point on the transmission network.
The third step involves the TNSP setting the prices at each connection point to recover the required revenue.
The TNSP then submits the resulting draft prices along with their forecast expenditures and the methodology and asset allocations used to the AER for approval.
The AER then reviews and revises these calculations in line with the detailed National Electricity Rules before setting the final prices.
This process involves extensive stakeholder consultation from both the TNSP and the AER with position papers, draft proposals and final proposals being issued (and revised proposals where relevant).
The process of setting the prices to be charged for each regulated activity seeks to balance a number of criteria, including consistency across the NEM, price stability, reflect the underlying costs of providing the service and provide appropriate price signals to guide producer, consumer and investor behaviour in the least distortionary manner.
The general aim is for the charge to reflect the nature of the underlying cost involved, with a cost that does not vary with the quantity of electricity carried (fixed cost) ideally being recovered through a fixed charge and a cost that varies with the quantity of electricity carried (variable costs) ideally being recovered through a usage-based variable charge.
For example, TransGrid recovers the cost of: exit and entry services through fixed charges ($/day) non-locational and common services on the basis of maximum demand at each
connection point ($/kW) locational services on the basis of a ‘modified cost reflective network pricing’ methodology
that takes into account network utilisation shared services on the basis of customer forecast average monthly maximum demand
($/KW).Sources: AEMO (2017d); TransGrid (2017, nd).
25 In its 2018-19 to 2022-23 pricing methodology, the NSW TNSP TransGrid distributed its revenue allocation: 4.1 per cent to entry services; 16.2 per cent to exit services; 1.7 per cent to common services; and 78.0 per cent to shared network services (TransGrid 2017, p. 10).
54 PRODUCTIVITY REVIEW

Transmission prices
The process by which annual revenue requirements are translated into transmission prices is summarised in box 3.3. The resulting price structures vary by TNSP across the NEM (figure 3.13).
The cost of transmission across Australia (excluding the Northern Territory) averaged 2.18 cents/kWh in 2016-17 (figure 2.3). This is equivalent to $114 per household per year, or 8 per cent of residential electricity prices. The cost of transmission is lowest in Victoria (1.45 cents) and Western Australia (1.50 cents) and highest in South Australia (2.80 cents).
Figure 3.13 TNSP pricing structuresa
a CRNP: cost reflective network pricing.
Source: TransGrid (2016, p. 17)..
Distribution sector
Distribution involves the low voltage transportation of electricity from the high voltage long-distance transmission lines to the end customers, typically households, commercial and smaller industrial users.
SP 11 – ENERGY (ELECTRICITY) 55

There are 16 electricity distribution companies in Australia, each serving a specific geographic area (table 3.5). Only Victoria, New South Wales and Queensland have more than one distribution company connected to the same grid.26
Table 3.5 Electricity distribution companies by jurisdictiona
Jurisdiction Distribution companies Customers Line length Regulator
kmNew South Wales Ausgrid 1 688 282 41 453 AER
Endeavour Energy 968 355 36 468 AEREssential Energy 879 065 191 945 AER
Victoriab Powercor Australia 777 161 74 452 AERAusNet Services 706 424 44 349 AERUnited Energy 664 549 12 873 AERCitiPower 327 907 4 505 AERJemena 321 417 6 252 AER
Queensland Energex 1 421 522 53 202 AER
Ergon Energy 739 354 152 255 AER
South Australia SA Power Networks 858 647 88 808 AER
Western Australia Western Power [SWIS] 1 065 355c 93 347d Economic Regulation Authority of WA
Horizon Power [NWIS] 47 168 7 896d Economic Regulation Authority of WA
Tasmania TasNetworks 285 325 22 681 AER
Northern Territorye Power and Water Corporation
84 196 8 375d Utilities Commission
Australian Capital Territoryf
ActewAGL 184 962 5 312 AER
a Ordered within each jurisdiction by customer numbers. b Essential Energy also serves a small number of customers in Victoria. c Residential and small and medium enterprise customers. d Excluding transmission network. e Power and Water also supplies electricity generation and retail services to 72 remote communities through its not-for-profit subsidiary, Indigenous Essential Services. f Essential Energy also serves some customers in the ACT.
Sources: AER (AER 2017b, p. 97); Horizon Power (2016, pp. 4 & 17); Power and Water Corporation (2016, p. 40); Regulator web sites; .Western Power (2016, pp. 3 & 8).
Two distribution companies each have over 1 million customers: Ausgrid in New South Wales (1.7 million); and Energex in Queensland (1.4 million). Essential Energy in New South Wales has the longest distribution network at 192 000 km.
26 Western Australia has two distribution companies: one for the SWIS and one for the NWIS.
56 PRODUCTIVITY REVIEW

Regulation
Distribution companies are regulated by the AER in a broadly similar manner to transmission companies (discussed previously).
Distribution prices
Distribution costs add significantly to the retail price of electricity in Australia. In 2016-17, distribution costs accounted for 38 per cent of average residential electricity prices (AEMC 2016a, p. 191). This is equivalent to $519 per household per year. Distribution costs are the second largest source of household expenditure on cost incurred by households after ‘wholesale and retail [margins]’, and 2.3 times the contribution made by transmission costs and environmental policies combined.
Retail sector
Electricity consumers are central to the National Electricity Objective that is at the core of the National Electricity Law:
… to promote efficient investment in, and efficient operation and use of, electricity services for the long term interests of consumers of electricity with respect to — (a) price, quality, safety, reliability, and security of supply of electricity; and (b) the reliability, safety and security of the national electricity system.
Retailing of electricity involves the sale of electricity to final customers, usually households, commercial and smaller industrial users (typically those using less than 50 MWh per year). Retail companies purchase the electricity sold from the spot market or directly from generators through the use of bilateral contracts.
Retail contestability
Historically, retail companies were monopoly sellers of electricity to all households in specific geographic areas. The prices paid by retail customers were set independently by state government pricing authorities, such as the Victorian Essential Services Commission. Their price determinations took into account the costs involved to ensure that the retailers earned a suitable return on their investment. Retail prices typically involved a charge for access to the distribution network and a per unit price, often based on a sliding scale according to the quantity used. While these prices may have varied depending on the time of use (such as ‘peak’ and ‘off-peak’ times), they did not reflect the price of electricity in the wholesale market throughout the day.
Things have changed, with Tasmania being the last jurisdiction to introduce retail contestability on 1 July 2014, so now all customers in the NEM are free to choose their
SP 11 – ENERGY (ELECTRICITY) 57

own retailer. Retail customers can remain with their existing retailer on regulated retail prices or switch to a new retailer.
The introduction of retail contestability has resulted in a range of different pricing structures for retail customers, including:
time-of-use tariffs, made possible by interval (smart) meters that measure a customer’s energy use in real time
pool pass-through arrangements (whereby the customer takes on the risk of wholesale market volatility)
fixed price contracts (whereby the customer pays a fixed amount regardless of how much energy they use).
tailored offers to customers with specific requirements (such as households with swimming pools) (AER 2017b, p. 126).
Retailers can also offer other services such as direct load control at times of high demand.
Retailers manage the risks associated with potential price volatility in the wholesale market through a variety of means. They can enter into bilateral contracts with generators to secure price certainty. They can purchase generation assets to supply themselves with electricity. Retailers also use financial instruments (derivatives), such as hedging (discussed later).
The changing nature of the retail sector
Improvements in information technology are increasingly empowering electricity consumers to better understand their own electricity use, make better informed decisions concerning their electricity choices and manage their bills. Smart meters, for example, record details on electricity use (such as the amount of electricity used and time of day that it is used). Applications and web sites have been developed to make this data easier and simpler to analyse (to find the retail plan that best suits them).
The rollout of these technologies may also benefit other sections of the industry, particularly retailers. The rollout of smart meters in Victoria, for example, has reduced the cost to retailers of meter reading.
The result is that retail electricity customers now have a much wider range of choice than they did previously. The retail market is also now more complex than it was.
The introduction of rooftop solar panels has also had a material impact on retail markets. These households and business generate much of the electricity they use, thereby reducing their demand from retailers. When their generation of electricity exceeds their own requirements, these customers may sell the excess back to electricity retailers. Some feed-in tariff schemes allow customers to sell all the electricity they produce to retailers and buy what they need back from the grid at cheaper prices.
58 PRODUCTIVITY REVIEW

The falling cost of battery storage will enable households to store their electricity generated for future use. It also allows, if agreed to by the retail customers, companies to manage these batteries (and the electricity generated by any supporting solar panels) and engage in electricity trade on their own behalf or on behalf of the retail customer.
Competition in the retail sector
The introduction of retail contestability means that some retail customers are on market contracts, while others are still on regulated contracts. This share varies markedly by jurisdiction, as does the number of retail companies operating in each market.
Despite this, retail competition in electricity markets is limited and market concentration high. Three retail suppliers — AGL Energy, Origin Energy and EnergyAustralia — supplied over 70 per cent of small electricity customers in southern and eastern Australia as at 30 June 2015 (AER 2015, p. 18).
The AER found that retail electricity markets in Tasmania, regional Queensland and the Australian Capital Territory were ‘not yet fully competitive’ (AER 2015, p. 18). This reflects ongoing retail price regulation and the dominance of the incumbent retailer.
Retail price regulation
While the AER is the national regulator of the retail electricity (and gas) markets under the National Energy Retail Law, it does not regulate retail prices in any jurisdiction.
Retail prices were deregulated in Victoria in 2009, South Australia in 2013, New South Wales in 2014 and south east Queensland from 1 July 2016. Retailers in these states offer electricity contracts that specify the prices that they are willing to supply electricity at. Customers then choose between retailers. The price they pay will depend on the terms of the contract that they enter into. Retailers can only adjust their prices once every six months. Governments still require retailers to publish standing offer prices that small customers can access.
From 1 January 2017, the retail price of electricity for small customers — those consuming less than 100 MWh per year — is only regulated in rural Queensland, Tasmania and the Australian Capital Territory.
Retail prices
Retail electricity prices in Australia averaged 25.8 c/kWh in 2016-17 (figure 2.3). The Australian Capital Territory had the lowest price (19.6 c/kWh and South Australia the highest (32.0 c/kWh). The average household electricity bill in that year was $1356.
SP 11 – ENERGY (ELECTRICITY) 59

Network costs were the largest contributor to the average household electricity bill in 2016-17, accounting for accounted for 47 per cent or $633. The next largest contributor was wholesale and retail combined (45 per cent).27 The cost of environmental policies accounted for the balance (AEMC 2016a, p. 191).
Distribution network costs accounted for 82 per cent of network costs, with transmission costs accounting for the remainder. This means that distribution network costs alone cost the average household $519 in 2016-17.
In terms of cents per kWh, network costs are highest in the non-NEM jurisdictions of Western Australia (14.8c/kWh) and the Northern Territory (13.6c/kWh) and lowest in the Australian Capital Territory (8.1c/kWh) and New South Wales (10.9c/kWh). As a share of total household electricity bills, network costs are highest in Tasmania (54 per cent) and Western Australia (50 per cent) and lowest in the Australian Capital Territory (41 per cent) and South Australia (42 per cent).
ABS data indicate that real electricity prices grew by an average of 2 per cent per year between June 1990 and June 2016, with nominal prices growing by 4.5 per cent per year and the consumer price index (CPI) by 2.5 per cent (figure 3.14). Real and nominal household electricity prices grew particularly strongly between 2008 and 2013 (9.9 per cent and 12.2 per cent per year, respectively). Since then, nominal prices have remained essentially flat, implying a 1.8 per cent fall in real prices.
Real retail electricity price growth has followed the growth in real retail gas prices, albeit with a lag in the mid-2000s (figure 3.14).
However, the ABS data also indicate that real and nominal electricity prices have risen strongly in the nine months to March 2107 (increasing by 8 per cent and 10.3 per cent, respectively). This growth is significantly higher than that for gas over the same period, although this may reflect a catch-up from earlier growth in gas prices.
The main drivers of higher retail bills in 2016 were wholesale prices and retail margins (AEMC 2016a, p. ii).
27 Western Australia is the only jurisdiction for which the AEMC reports the contribution from wholesale prices and the retail margin separately.
60 PRODUCTIVITY REVIEW

Figure 3.14 Household electricity and gas prices, June 1990 to March 2017Index (June 1990=100)
0
50
100
150
200
250
300
350
Jun-1990 Jun-1993 Jun-1996 Jun-1999 Jun-2002 Jun-2005 Jun-2008 Jun-2011 Jun-2014
Electricity Gas CPI
Source: ABS (2017).
Recent price determinations have involved significant increases in regulated retail prices. The Independent Competition and Regulatory Commission (ICRC), for example, approved an average 18.95 per cent increase in regulated retail electricity prices for small customers in the Australian Capital Territory for 2017-18 (equivalent to $333 per year). This was based on a 112.36 per cent jump in wholesale market price from $49.77/MWh at 31 May 2016 to $105.69/MWh at 31 May 2017 (contributing 13.26 percentage points of the 18.95 per cent) and forward electricity prices (ICRC 2017).
The ICRC final ruling indicated the contribution of different cost components to the average ACT regulated electricity bill (figure 3.15). Wholesale electricity prices and network costs account for two-thirds of the regulated retail price (33.51 per cent and 32.59 per cent, respectively). Environmental policies contributed 17.88 per cent (of which Australian Government LRET and SRES schemes accounted for 7.13 percentage points, ACT feed-in tariffs for rooftop solar contributed 8.89 percentage points and ACT energy efficiency scheme contributed 1.86 percentage points). Retail operating costs contributed a further 6.81 per cent and retail margins 5.03 per cent. The ICRC noted that 88 per cent of these price increases were outside its control (ICRC 2017, p. x & 56).
SP 11 – ENERGY (ELECTRICITY) 61

Figure 3.15 Cost components of ActewAGL’s total costs, 2017-18a
Per cent
a FiT: feed-in tariff.
Source: ICRC (2017, p. 56).
Financial management
Movements in the price of electricity, and the associated uncertainty concerning future prices, potentially expose many market participants to significant financial risk. Retailers in particular face significant potential financial risk, given that they purchase electricity from the wholesale market at prices that vary, sometimes substantially, while the price at which they sell electricity to many of their consumers may be regulated.
There are two main ways that participants can manage the associated risks. The first is through the use of bilateral contracts, such as an agreement for a generator to supply a retailer a given amount of electricity at some future date for an agreed price. The contracts may also be specified relative to the wholesale spot price (sometimes referred to as contracts-for-difference). Parties to such contracts have countervailing risk profiles. The second is using a range of standardised financial products such as futures and options that are tradable on the Australian Securities Exchange that are linked to the wholesale spot price.
A range of electricity-related financial derivatives such as options and futures enable market participants to better manage these risks by providing greater price certainty and assist them in managing their financial returns. Futures enable participants to agree on a
62 PRODUCTIVITY REVIEW

future price for electricity around which they can base their activities. These instruments cover four of the five NEM regions — New South Wales, Victoria, Queensland and South Australia. Financial instruments do not cover the Tasmanian market.
Trade in electricity futures and options has grown over time to exceed the physical trade in electricity. Participants in the electricity-related financial market are broader than those engaged in the physical market, including, for example, brokers and financial services companies.
The use of financial instruments exposes the counterparty to the financial fortunes of the buyer or seller (AEMC 2015b). The use of financial reserves reduces this exposure but does not eliminate it.
In response, the AEMC recommended that the COAG Energy Council implement new measures through developing changes to legislation and submitting rule changes to better respond to the financial distress and failure of large participants. The Report contained a number of procedural and governance responses intended to minimise disruptions to consumers and maintain the financial stability of the NEM.
Governance and regulation
The governance and regulatory arrangements applying to the NEM are discussed in chapter 2.
It is worth highlighting that the AEMO undertakes a range of electricity-specific functions:
managing the physical flows of electricity across all parts of the network to ensure that there is sufficient electricity generated to meet demand at all times28
ensuring that the technical attributes of the electricity supplied (such voltage and frequency) comply within specified guidelines to maintain system stability
operating the wholesale electricity market
managing the financial payments that accompany the physical flows of electricity
operating the retail electricity markets across the NEM
forecasting generating capacity, demand and power system requirements
planning future power system needs and requirements
providing data and information to support the efficient and effective operation of electricity markets and to enable the assessments of investment requirements
providing security and other advice.
28 These system stability functions include, among other things, load shedding to reduce excess demand or requiring additional generation to increase supply. As a last resort, AEMO can temporarily suspend the National Electricity Rules and directly intervene in the market.
SP 11 – ENERGY (ELECTRICITY) 63

3.3 Historical development
It is important to understand the evolution of the industry that gave rise to the current market structure and regulatory arrangements to better understand the issues confronting the industry today (discussed in section 3.5).
The electricity industry in each state generally developed more-or-less independently of other states, and largely through government investment.
From the 1950s, power stations were more likely to be located near the fuel source used to minimise transport costs, typically near coal deposits for coal-fired generation or dams for hydroelectricity. The electricity produced was transported to the major urban centres in that state through high-voltage, long-distance transmission lines. Lower voltage distribution networks transported the electricity from the high-voltage transmission lines to end users (households, commercial and smaller industrial users).
For example, most of the major power stations in New South Wales were built near coal deposits in the upper and lower Hunter Valley. Significant transmission infrastructure then transported the electricity produced in the Hunter Valley to users in Sydney.
The development of the Snowy Mountains Scheme in southern New South Wales overlaid this separate development of state electricity systems. The Scheme was built to divert rivers that ran eastwards into the ocean inland to provide water for irrigation and to generate electricity. It consists of: 16 major dams; seven power stations; a pumping station and 225 km of tunnels, pipelines and aqueducts. The hydroelectric power stations are linked into the New South Wales and Victorian transmission systems, thereby enabling trade in electricity across state borders.
Prior to the mid-1980s, the entire process of generating the electricity and transporting it to the end users within a state was undertaken by a state government-owned monopoly. The Snowy Mountains Scheme was run by the Snowy Mountains Hydro-electric Authority (now called Snowy Hydro).
However, by the mid-1980s there were concerns about the inefficiency of these vertically integrated state-owned monopolies, the cost of producing electricity, and the ability of state governments to fund much needed investment.
Electricity market reform commenced in the mid-1980s. The nature, timing and pace of this reform in Australia varied across states, with the eastern and south eastern states generally leading the way. The reform model adopted in Australia closely followed that used in the United Kingdom (particularly in England and Wales).
Reforms initially focused on improving the operational efficiency of these vertically integrated monopolies, including the shedding of excess labour and lowering capital and operating costs.
64 PRODUCTIVITY REVIEW

The next step was to get these vertically integrated monopolies to operate on a more commercially-orientated basis. This was achieved by turning the agencies into public corporations and introducing dividend and income tax equivalent payments to government and other arrangements such as ring fencing their operations to mimic the disciplines faced by private firms (termed ‘competitive neutrality’).
As some elements, notably transmission, are natural monopolies, the next step was to create separate business units responsible for electricity generation, transmission and distribution before separating these units into separate companies. Competition was subsequently introduced into the generation and retail sectors by breaking the existing companies up into smaller companies and by allowing new entrants. The majority of publicly owned generation capacity was privatised (except in Tasmania, Queensland and, until recently, New South Wales). Some states, such as Victoria, went further and privatised their network infrastructure (transmission and distribution grids). Other states, such as South Australia, went part way by leasing their network infrastructure to private-sector operators, while still retaining public ownership.
The existing state-based electricity grids in eastern and south eastern Australia — initially Queensland, New South Wales, Victoria, the Australian Capital Territory and South Australia and subsequently Tasmania — were linked through interconnectors to form the NEM in 1990. These interconnectors enhanced competition in the generation and retail sectors by enabling the trading of electricity between states. The interconnectors also allowed states to improve their capital efficiency by sharing spare generating capacity (termed ‘reserve plant margin’) needed to meet peak demand.
The pricing of electricity was also reformed. Cross-subsidies that had existed between different types of users were gradually unwound. The prices charged became more reflective of the underlying costs involved.
A wholesale electricity market covering eastern and south eastern Australia developed following the linking of the state grids (becoming the NEM). A separate wholesale market was established in Western Australia (referred to as the WEM).
Renewable policies such as the uptake of renewables encouraged by the RET and other technological change has seen the industry undergo significant change in recent years that have materially altered the economics of generating, supplying and using electricity (chapter 2). These trends may accelerate.
On the supply side, technological change and higher production volumes have lowered the cost of producing electricity from renewable sources such as wind and solar. Falling production costs and government schemes such as high feed-in tariffs have encouraged many households and businesses to install rooftop solar panels, enabling them to sell their surplus electricity back into the grid. The cost of batteries to store electricity for use when it is most needed is falling. Declining information technology costs are also making it possible for office and residential buildings to share or trade electricity between tenants (termed distributed systems).
SP 11 – ENERGY (ELECTRICITY) 65

On the demand side, the development of smart meters, computerisation and mobile phone applications enable users of electricity to be more informed about their usage and to monitor and alter their use in real time in response to changing prices. Improvements in product design and energy efficiency are also reducing the demand for electricity, as have improvements in building design and building standards. Consumers are responding to lower production costs and are becoming more environmentally conscious and purchasing electric vehicles in increasing numbers (off a very small base). The installation of rooftop solar panels means that those customers do not need to purchase as much electricity from the grid. This, coupled with the falling cost of batteries, will make it easier for households to be self-sufficient in electricity and would access the grid only as a back-up system, or as an active market player.
In terms of transporting the electricity, transmission grids now need to link new power stations located in places abundant with wind and sunshine, which are frequently in different places to where fossil fuels are located.
The introduction of roof top solar panels, battery storage, and other technologies, such as distributed systems, are placing new demands on electricity supply infrastructure. Distribution networks were, for example, designed to supply electricity to end users. These new technologies now enable these end users to sell the electricity that they generate back into the grid. This means that distribution networks and associated infrastructure have to be capable of handling two-way variable flows of electricity. The supply of electricity from these micro-generators also raise issues for electricity markets that seek to match electricity producers with electricity consumers.
This evolution in the industry underpins the issues confronting the industry today.
3.4 Possible future directions
While the industry has undergone significant change recently, these changes are likely to continue into the future, and the industry’s structure and governance arrangements will need to adapt to these changing realities.
This section outlines a few of the possible changes confronting the industry to set the scene for the discussion of the policy-related issues confronting the industry that follows.
Electricity supply
The Australian electricity generation sector will continue to decarbonise, with strong growth in renewable sources mandated by the RET and by new policies needed to meet Australia’s climate change commitments. Ongoing technological change will support this by reducing the cost of batteries and new generating technologies, with the result that the use of fossil fuels will progressively account for a smaller share of the generation task.
66 PRODUCTIVITY REVIEW

The increased use of renewables and distributed generation will make industry more geographically dispersed, with more of that electricity bypassing the transmission system entirely. This will increase the challenges faced by the market operator in physically managing the flow of electricity across an increasingly complex system while ensuring that the system is secure and reliable. It also poses risks for the transmission network owners, that the regulator needs to consider.
Electricity demand
Technological change will continue to drive improvements in energy efficiency and enable end users to better manage their electricity use.
While currently in their infancy, the demand for electric vehicles is projected to grow strongly. Technological change and increased market uptake will make them more cost effective over time, and decarbonising the transport sector will be important for Australia to meet its climate change commitments. Increased market penetration by electric vehicles will increase the demand for electricity (at least relative to what it would otherwise have been) as the transport sector switches fuel sources from petrol and diesel to electricity (CSIRO 2015). Future population growth will also add to future consumption, but average per capita consumption may continue to decline as building standards improve, and aggregate production is increasingly decoupled from energy demand.
Climate projections suggest that there will be more extreme weather days in the future in general, and more hot days in particular. An increase in the number of hot days will increase electricity demand for air conditioning. With a projected rise in average temperatures, there may also be a fall in electricity demand for heating. Rises in the number and intensity of extreme weather events will also have supply-side implications, such that events like those that gave rise to the recent problems in South Australia may become more common.
3.5 Electricity-specific policy-related issues
Against this background, there are a number of serious policy-related issues confronting the Australian electricity industry. Most of these issues relate to its ability to provide reliable and affordable electricity and to, at the same time, reduce emissions (termed sustainability) now and into the future. These issues are particularly resonant for the NEM.
Some of these issues apply across the industry, while others relate to particular sectors. Many have been raised recently in the context of other reviews, including the Finkel Review.
The numerous issues identified have been developing over a substantial period of time.
SP 11 – ENERGY (ELECTRICITY) 67

System-wide issues
Need for greater certainty
Probably the biggest issue confronting the Australian electricity industry today is the lack of clarity and consistency over future government policy on energy and energy-related environmental issues, such as future climate change policy. These issues were discussed at length in chapter 2.
The result of this lack of clarity is that uncertainty permeates throughout the industry. This uncertainty has led to insufficient investment in base-load generating capacity and in generators that can meet intermittent demand (such as combined gas cycle, although the trends in the gas market has also restrained investment).
Further withdrawals of large base-load power stations such as Liddell in New South Wales will further reduce generating capacity unless significant new offsetting investment occurs.
Australian energy users in general, and large energy-intensive industrial customers in particular, need to know that they will be able to access a reliable and affordable supply of electricity into the future, otherwise the viability of their operations will be adversely affected.
The uptake of renewables and technological change are creating challenges for managing the grid
Many of the issues confronting the industry today, either directly or indirectly, relate to the industry’s ability to incorporate new technologies into an industry designed and structured around the traditional model of electricity delivery. There does not appear a clear strategy for addressing the technical and market issues that will arise as new technologies enter the market. Planning for new technologies will be needed to ensure that the rules can adjust to ensure the ’full cost‘ of different generation, distribution and use technologies will be brought to ’book‘ in the system.
Renewable generation is located in different parts of the state to traditional fuel sources used for generation such as coal. The transmission networks, which were designed and built to support these traditional sources of generation, frequently require augmentation or strengthening to incorporate these new sources of generation into the grid. The result is a larger and more geographically dispersed electricity network that carries more variable flows.
This makes the task of managing the physical flows of electricity on the network, while at the same time ensuring system security and reliability, more challenging. Some of these additional challenges include:
68 PRODUCTIVITY REVIEW

the intermittent and variable nature of wind and solar generation make it more difficult to dispatch sufficient generation to meet required demand
the asynchronous nature of wind and solar generation makes it harder to maintain the physical requirements of the electricity being produced
the variability in supply makes the provision and pricing of ancillary services more important
the more geographically dispersed nature of the network means that electricity may be required to flow in directions that differ from when infrastructure was built (this may require some re-engineering of the infrastructure as well as the task of managing contraflows)
the growth in distributed generation, which is not centrally dispatched or known to the market operator, complicates these tasks (discussed later).
The declining cost of renewables generation, together with increasing volumes being mandated under the RET, means that these challenges are likely to increase over time.
Need for a system-wide focus
As noted, the significant uptake of renewable energy, coupled with rapid decentralised technologies such as wind, solar, batteries, embedded generation, have widespread implications for the entire industry.
The governance arrangements for the industry are adapting and responding to these changes, albeit frequently slowly. The issues increasingly require a ‘whole of system’ perspective commensurate with a national grid as well as quicker responses. Responses should also be consistent, integrated, economically efficient, based on expert advice and, insofar as possible, technologically neutral.
These emerging governance issues, which also apply to gas markets, are discussed in chapter 2.
Development of a consistent approach across the NEM
As discussed, the NEM arose by linking the transmission systems in Queensland, New South Wales, Victoria, South Australia and, subsequently, Tasmania through the construction of high voltage, high capacity interconnectors. This enabled trade in electricity across state borders.
Significant process has occurred in transitioning away from the former state-based grids.
State markets operate separately from each other when interconnectors are capacity constrained, with the result that spot prices regularly diverge across NEM regions. These
SP 11 – ENERGY (ELECTRICITY) 69

limitations were most evident during the storms that hit South Australia in September 2016.
As discussed in chapter 2, the governance arrangements reflect, at least in part, the rights conferred to the states under the Australian Constitution for energy policy. The role and responsibilities of the three national agencies responsible for governing the operation of the electricity industry in each jurisdiction reflect past agreements reached with state and territory governments. They also reflect the evolution from state-based regulatory systems. As a result, their roles and responsibilities are not the same across all jurisdictions, which may warrant investigation to identify whether improvements can be made.
Generation specific issues
The renewable energy target distorts the operation of the generation market
As discussed in chapter 2, the renewable energy target is intended to increase the share of electricity generated from clean energy sources. It seeks to do this by mandating specified shares of renewable generation to be achieved in specified years. Wholesale purchasers of electricity are required to buy and surrender certificates proportional to the amount of electricity they acquired during the year.
This policy operates independently of wholesale electricity markets.
The wholesale spot price is intended to reflect the underlying economic cost of generating that electricity. The operation of the RET means that this is no longer the case.
The primary source of income for producers of renewable electricity is from the sale of the renewable energy certificates granted to them under the RET rather than from the sale of electricity in the wholesale spot market. This enables them to sell into the spot market at a price that does not reflect their underlying cost of generating the electricity (much of which is the capital cost).
This is at odds with other generators who earn their income from the sale of electricity into spot markets (and through the provision of ancillary services). This gives producers of renewable electricity an advantage over non-renewable generators in selling into the spot market.
This gives rise to two issues. First, the RET is not integrated into the operation of the wholesale electricity markets and does not achieve the desired level of emissions reduction at the lowest overall economic cost (chapter 2). Second, there are network security and reliability issues that affect electricity networks from the growth in asynchronous renewable energy. Under the current market rules the costs of addressing these is not easily transferred to the generators of renewable energy.
70 PRODUCTIVITY REVIEW

Cost-reflective prices should guide market participants
Market prices provide signals to producers, consumers and investors to guide their decisions. Prices that do not adequately reflect the underlying economic costs to society will not be economically efficient, as they will lead to too much or too little of particular activities, such as investment in particular types of generation.
Cost reflective pricing is important for all industries, but particularly in industries where some activities require significant amounts of infrastructure and possess natural monopoly characteristics. However, cost plus pricing regimes must be carefully managed to avoid the incentives for over investment.
The growth in the different types of generators in the industry make it even more important for appropriate pricing so as not to favour one form of generation over another. This is especially relevant given that there are significant underlying differences in the economics of generating electricity between these technologies. The generation sector, for example, consists of different generating technologies in plants of vastly different sizes dispersed across many parts of Australia. The sector includes among other things:
base load power stations and peaking plants
large coal-fired power stations and small rooftop solar panels
gas generators that can be easily controlled and highly variable wind turbines
registered generators known to the market operator and distributed systems that are not.
Prices provide the means that the AEMO uses to coordinate all these technologies; they direct how much electricity each producer should supply at any point of time and pathways of projected prices determine whether investment is warranted and, if so, what type is required.
The relative competitiveness of each technology should depend not only on their own cost of generating the electricity, but also the costs they impose in relation to connecting to the grid, transporting electricity, other market-related imposts levied on them (such as NEM fees and pricing of ancillary services) and their emissions’ intensity.
The growth in distributed generation is creating new challenges
The growth in distributed generation raises many challenges for the electricity system in general, and the market operator in particular.
Distributed generation involves using smaller-scale, sometimes modular, technologies to produce electricity close to where it is needed. Their output tends to be asynchronous and may need an inverter to produce alternating current for connection to the grid.
SP 11 – ENERGY (ELECTRICITY) 71

Such technologies can reduce the cost of producing and transporting electricity to where it is needed, and assist in reducing congestion on the transmission network and improving system reliability.
This gives rise to further geographic dispersion in the production of electricity across the network. Given their smaller output, distributed generators connect directly to the lower voltage distribution network rather than the higher voltage transmission network. This results in two-way flows in electricity along distribution network, rather than the one way flow these networks were designed and built for, and, as a result, may increase congestion on the distribution network.
Larger distributed generators need to be registered to sell into the grid, unless they have an exemption. However, smaller ones do not.
The growth in household rooftop solar panels highlight many of the issues associated with the emergence of distributed generation. Households with these panels can sell the electricity produced into the grid in return for a payment known as a ‘feed-in tariff’. Households can also use the electricity produced themselves or, if the panels are not producing electricity or additional electricity is required, they can purchase electricity from the grid in the conventional manner. At any point in time, these households may be selling electricity into the grid, buying electricity from the grid or may be entirely electricity self-sufficient and not using the grid at all.
These rooftop solar panels are unlike conventional generators. They do not participate in the wholesale market and are not required to notify the market operator of the amount of electricity that they wish to supply and times at which supply will occur. Nor are they centrally dispatched.
The result is that these transactions are effectively invisible to the market operator who is charged with dispatching sufficient generation to meet demand, and ensuring system security and reliability. The geographic dispersion of these facilities, along with the less predictable local weather and hence generation, further complicate the functions of the system operator.
The growth in distributed generators and rooftop solar raise many important policy issues. They may increase congestion on distribution networks that were not designed to handle the additional flows of electricity and raise local system security and reliability issues. Distributed generators are generally intermittent in much the same way as renewables are, and still require some other source of electricity as backup. The falling cost of batteries will help in this regard, as will employing a range of different technologies (such as wind and solar). An additional issue is how to achieve efficient cost recovery for use of the distribution network and for the backup sources of supply needed. Regulators will need consider the effect of their pricing formulas on the incentives to invest in and maintain transmission and distribution networks.
72 PRODUCTIVITY REVIEW

As rooftop solar panels, with appropriate storage or back-up capacity, enable households to potentially go off grid entirely, this raises the risk that fewer households (and in general lower-income ones), will be left to cover the costs of the distribution and transmission networks. Going off grid will be more viable as the costs of storage technologies fall further, which, if the network costs are shared only by those remaining on grid, could see this number spiral downward over time. The main concern is that it will be lower-income households that have the least capacity to go off-grid, so should such a spiral arise, governments will have to pay attention to the distributional consequences. Ultimately it will be a matter of economics as to whether it is more efficient for households to use the grid as their ‘battery’, or to switch to an alternative back-up system.
The AEMC is currently undertaking a review into the distribution market model to set out:
… the key characteristics of a potential evolution to a future that enables investment in and operation of distributed energy resources to be optimised to the greatest extent possible, and identifies the barriers to this occurring. (AEMC 2017a, p. ii)
The draft report was released on 6 June 2017 (AEMC 2017a).
This is an important review for effectively integrating distributed generation into the grid and ensuring that the AEMO is able to fulfil its role as system operator.
Rising gas prices are reducing the ability of gas generation to reduce carbon emissions
As discussed in chapter 4, gas-fired electricity generation accounts for around 40 per cent of domestic gas use in Australia. It is particularly important in Western Australia and Queensland. The cost of natural gas as a fuel source has a material impact on the cost competitiveness of gas-fired generators and their ability to compete in wholesale markets.
Gas-fired generation has lower greenhouse gas emissions per unit of energy than do brown and black coal-fired generation. This means that Australia could reduce its carbon emissions by increasing the share of electricity produced from natural gas.
The certainty that gas generation provides also makes it a suitable counterpart to intermittent renewable sources of electricity such as wind and solar.
However, recent significant rises in domestic gas prices in eastern Australia (discussed in chapter 4) is making gas-fired generation less competitive than traditional coal-fired generation. This has led to a fall in the share of electricity generated from gas in eastern Australia.
The key policy issues are that, while gas has lower carbon emissions than traditional coal generation, these cost increases are constraining the ability of gas-fired generation to play an increasingly important role in reducing carbon emissions and in maintaining network security and reliability.
SP 11 – ENERGY (ELECTRICITY) 73

Wholesale market-specific issues
Strategic rebidding is adding to spot price variability
The National Electricity Rules enable generators to resubmit the quantity of electricity that they are willing to sell at any time up to 15 minutes before the trading period. To avoid strategic ‘market testing or signalling’ behaviour, the Rules prevent them resubmitting the price at which they are prepared to sell. Generators are required to make these bids in good faith.
However, even volume bid resubmitting can, under certain circumstances, enable generators to engage in strategic bidding.
This has been raised as an issue in Queensland and South Australia (AER 2017b, pp. 54 & 56). In relation to Queensland, the AER stated that:
Opportunistic bidding by large generators has caused periods of spot market volatility in Queensland for several years, typically during summer. In summer 2014-15, for example, generators periodically rebid large volumes of capacity from low to very high prices late in a trading interval, typically on days of high energy demand and when import capability on transmission interconnectors was constrained. By rebidding late in a trading interval, other generators lacked time to respond by ramping up their output. Given the settlement price is the average of the six dispatch prices forming a trading interval, a price spike in just one dispatch interval can flow through to very high 30 minute settlement prices. (p. 56)
This was particularly an issue on hot days and when interconnector capacity with New South Wales was constrained.
This behaviour has continued notwithstanding an AEMC rule determination that became effective from 1 July 2016 (AEMC 2015a).
Network-specific issues
Nearly all electricity network service providers in the NEM — whether they run transmission or distribution networks or interconnectors — are regulated by the AER.29 While there are some differences in the way that they are regulated, the basic approach is similar for transmission and distribution networks.
As a result of this similar regulatory approach, many of the policy-related issues are germane to both sectors.
There have been a number of recent reviews in the regulation of network services.
29 The one exception is the BassLink interconnector which is not regulated by the AER.
74 PRODUCTIVITY REVIEW

The Productivity Commission conducted a thorough and extensive review of the then issues affecting the sector in its 2013 report Electricity Network Regulatory Frameworks (PC 2013a). The 871 page report includes whole host of findings and recommendations aimed at improving the efficiency and effectiveness of regulatory regime for the evaluation and development of interregional network capacity in the NEM.
Since then, there have been many policy changes affecting network service. These include:
a move towards greater regulatory consistency across network sectors
the adoption of more economically efficient pricing mechanisms to guide producers and consumers and to provide more suitable appropriate investment signals — the use of long-run marginal cost pricing for distribution and cost-reflective pricing for transmission
the adoption of regulatory investment tests for new investment and grid augmentation (the RIT-T for transmission and the RIT-D for distribution)
reviewing the pricing of the provision of ancillary services to ensure system security.
It will take some time for these changes to flow fully through the system and for major issues to become apparent.
The recent Finkel Review (2017) identified further issues relating to network services that need to be addressed (section 5.3), covering:
network incentives
reducing incentives for network over-investment
limited merits review
more equitable consideration of alternatives to network investment
strengthening the regulatory investment test for transmission.
Instead of covering all the complex issues besetting this key part of the energy sector, this sections canvases some issues affecting network services that are of recent significance.
High cost of network services
One current issue is the high cost of network services (section 3.2).
Network services are regulated by the AER to ensure that the companies that own and operate the transmission and distribution networks do not exploit the monopoly power that may arise from their high fixed and low marginal costs.
Little progress appears to have been made in bringing down network costs, since the time when the Productivity Commission last looked at the issue:
SP 11 – ENERGY (ELECTRICITY) 75

Average electricity prices have risen by 70 per cent in real terms from June 2007 to December 2012. Spiralling network costs in most states are the main contributor to these increases, partly driven by inefficiencies in the industry and flaws in the regulatory environment. (PC 2013a, p. 2).
The AER attempted to reign in network costs (discussed next), but decisions by the Australian Competition Tribunal and the Federal Court have negated their efforts. The complexity and subjectivity of parts of the process have hindered the effectiveness of the AER.
Merits Review appears to work against the public interest
Participants can challenge decisions of the AER in the Australian Competition Tribunal through a ‘Limited Merits Review’. Decisions of the Tribunal can then be appealed to the Federal Court.
As the name suggests, the process as envisaged was intended to be ‘limited’ and only cover selected aspects of the determinations such as rectifying factual errors, the incorrect exercise of discretion, and unreasonableness in the regulator’s decision making. However, the process has been used to resist regulatory price reductions.
The intention of the review process is for companies to have the right to correct factual errors and the incorrect exercise of discretion as well as other matters of law. ‘Unreasonableness’ in the regulator’s decision is also a grounds for review.
In practice, the process has not lived up to this closely-defined role for reviews. This reflects a number of interwoven factors, including:
the complex methodology used in making revenue determinations
the requirement to make subjective assessments about which operating expenditures and assets to include
the requirement to make subjective assessments about the appropriate parameter values to use (such as, but not limited to, what is appropriate WACC, depreciation and tax rate)
decisions by the Australian Competition Tribunal and the Federal Court that have effectively made reviews routine rather than the exception
that regulated companies can selectively choose the issues to be reviewed
the narrowness of the process that does not take into consider wider implications, such as the impact on customers.
The reviews are narrowly focused, and do not take into account wider implications, such as their impact on the consumers and the wider community. This is contrary to the National Electricity Objective that focuses on the long term interests of consumers.
76 PRODUCTIVITY REVIEW

The consequences of review decisions can be very significant for the network businesses and consumers. Without commenting on whether the particular decisions had merit or not, a good example of this was the ensuing legal tussles that arose after the AER in its 2014–19 determinations attempted to reduce the allowable revenue earned by NSW and ACT electricity and gas distribution network businesses — Ausgrid, Endeavour Energy, Essential Energy, ActewAGL and Jemena Gas Networks (NSW). The AER determined that the businesses were operating less efficiently than other comparable networks and that the rate of return and corporate tax allowance used were higher than those in the market.
The companies sought a limited merits review of the AER’s decisions in the Australian Competition Tribunal, seeking to recover greater revenue from customers.
In February 2016, the Tribunal found in favour of the AER in some matters and in favour of the businesses in other areas. The AER was directed to remake its decisions in relation to the networks’ operating expenses, cost of corporate income tax and cost of debt.
The AER subsequently appealed to the Federal Court for a judicial review of the Tribunal’s decisions to set aside the network revenue determinations. The AER asked the Federal Court to consider whether the grounds of review were properly established by the network businesses and whether these were correctly applied by the Tribunal.
On 24 May 2017, the Federal Court upheld the AER’s appeal in relation to the Tribunal’s decision on the cost of corporate income tax, but upheld the Australian Competition Tribunal’s findings in relation to the networks’ operating expenses and the cost of debt (AER 2017a).
This decision enables NSW and ACT electricity and gas distribution network businesses to collect significantly more revenue from their customers than originally allowed by the AER. This additional revenue is estimated to be in the order of $2.5 billion (Winestock and McDonald-Smith 2017).
Putting aside the particular circumstances of this case, when the implications of reviews are so big, it is clearly critical that the review process is functioning well. Many are concerned that the ‘ limited’ merits review process has expanded to one in which a regulatory matter is entirely re-prosecuted. The original goal that the review process be confined to matters of error or the inappropriate exercise of responsibility seems to have been mislaid, with the risk that it is compromising the long-term benefit of electricity consumers.
Moreover, the process for making revenue determinations in the first place is time consuming, costly and contentious. Reviews add to the costs involved and further delay this process. The process needs to be clearer, simpler and the decisions of the AER should be binding unless they err in a matter of law. The Limited Merits Review process is clearly not working as it was intended, and needs to be rectified. Recent movement by the COAG Energy Council in this area is welcome. On 20 June 2017, the Prime Minister announced the Australian Government’s intention of ‘taking steps to legislate to abolish the Limited
SP 11 – ENERGY (ELECTRICITY) 77

Merits Review’ to protect consumers and to ensure consistency with other similar utility sectors (Turnbull, Frydenberg and Canavan 2017).
System security
The increasing penetration of wind and solar generation makes it harder for the system operator to maintain a stable frequency of supply — a key requirement for avoiding damaging equipment attached to the grid and for maintaining system reliability.
On 27 June 2017, the AEMC released its final System Security Market Frameworks Review report into power system security. The report contained nine recommendations for changes to market and regulatory frameworks to support the shift towards new forms of generation while maintaining power system security. The reforms covering frequency control, extreme power system conditions and system strength are aimed at:
guarding against technical failures that lead to cascading blackouts
delivering a more stable and secure power supply.
The AEMC is currently progressing a number of proposed rule changes relating to power system security concerning:
the inertia ancillary service market
the rate of change of power system frequency
the management of power system fault levels
the generating system model guidelines.
Power system security is important for all electricity users. Generators should fully cover the cost of frequency management and other associated ancillary services that they place on transmission networks.
System reliability
The system reliability problems stemming from the greater use of intermittent generation can be partially managed through a variety of measures including:
spatial separation, as the wind will be blowing somewhere to generate electricity
the use of transmission networks and interconnectors, so that electricity can be supplied from other regions
by bundling different forms of generation, such as using gas-fired generation as a complement to wind or solar
increasingly, through the use of battery storage technologies (as discussed earlier).
78 PRODUCTIVITY REVIEW

These measures all add to the cost of renewable energy and need to be factored into their pricing.
A diversified mix of generation sources — spanning various intermittent and base load capacities helps ensure supply reliability. This underlines the importance in this paper of the repeated themes that policy settings should reduce unwarranted uncertainty and be technology neutral. Planning and preparedness is part of a policy framework for reduced uncertainty. The Finkel Review recommended that:
all generators will be required to provide three years’ notice of closure
the AEMO should also publish a register of expected closures to assist long-term investor planning.
Renewable energy has a vital role to play in Australia’s energy future, in achieving emission commitments and in replacing ageing power stations. The uptake of renewables should be based on them providing more cost effective supply, with the cost of greenhouse gas emission incorporated into the market.
As market penetration of renewable energy is set to further increase, supply reliability may become more of an issue, particularly for some regions such as South Australia and south western Victoria. The Finkel Review recommended that:
Obligations on new generators will ensure adequate dispatchable capacity is present in all [NEM] regions to ensure consumer demand for electricity is met. They can meet their obligation using a variety of technologies or partnership solutions. The obligation will provide regional investment signals. (p. 10)
The events of the summer of 2016–2017 highlighted that Australia’s electricity system is in a fragile state. While natural disasters can happen anywhere and affect supply, the national electricity grid should be strengthened to make the system more robust and resilient. Having reliable electricity supply is an important aspect of this.
Demand-side management
Retail customers should face incentives to engage in demand-side management
Effective demand-side management can be a more cost effective way of dealing with peak demand and the price spikes arising from supply–demand imbalances than investing in supply-side measures, such as building additional generating or interconnector capacity that is only used sporadically.
Cost-reflective prices, especially those that vary throughout the day, provide customers with appropriate signals to engage in demand-side management. Customers may, for example, invest in more energy efficient technology or change the time they use the electricity if the cost of doing so is substantially less than the price of the electricity.
SP 11 – ENERGY (ELECTRICITY) 79

Larger industrial customers, especially those exposed to the wholesale market, already face cost reflective pricing that varies throughout the day and engage in demand-side management. These electricity users can also use financial instruments, such as hedging, to manage the risks and uncertainties that price variability introduces.
Time-of-day pricing needs to be supported by meters that record the time at which consumption occurs. Smart meters and interval meters do this. Smart meters are capable of providing additional benefits such as remote meter reading that reduce the cost of meter reading. They also enable customers to be aware of the prevailing price of electricity in real time.
The economic rationale for the introduction of time-of-day pricing and smart meters for retail customers is twofold.
First, there should be a gain in overall economic efficiency by using society’s resources more efficiently. In the absence of time-of-day pricing, retail consumers will use more electricity at times of high electricity demand relative to available supply as they do not face the same incentives to reduce demand, thereby driving up the price for all customers. This, in turn, means that additional generating (and transmission and distribution) capacity is needed in order to meet peak demand that occurs relatively infrequently, but otherwise sits around idly for the remainder of time. In short, the cost to society from consumers reducing their demand should be less than the cost to society of investing in additional capacity that is not otherwise needed.
Second, given that the provision of electricity is a network industry, there may be external benefits that flow through to other parties (externalities) from the use of these meters. For example, the use of smart meters may enable distribution companies to more quickly pinpoint problems with the distribution network. Moreover, these benefits increase with the number of smart meters in use.
The presence of external benefits flowing to other parties is not, in itself, sufficient to ensure an externality that warrants a mandated rollout of smart meters. If the introduction of smart meters results in lower overall costs to retail companies by reducing the net cost of reading electricity meters, then retailers have a commercial incentive to offer to install smart meters at their own expense for willing retail customers.
However, there is some question as to whether the social benefits of rolling out smart meters outweigh their cost in practice.
In evaluating the mandatory rollout of smart meters (advanced metering information) that began in Victoria in 2006, the Victorian Auditor-General was critical of the rollout. He found that the benefits from innovative tariffs, products and demand management was only $0.23 million from 2006 to 2014, well short of the anticipated benefits of $9.19 million (VAGO 2015, p. 32). The Report concluded that there was:
… expected to be … [a] net cost to consumers over the life of the program. (p. X)
80 PRODUCTIVITY REVIEW

A key finding was that the anticipated benefits were overstated, and the costs understated.
There were many issues with the rollout of smart meters in Victoria. A lot of these issues arose from the way the scheme was implemented, particularly a lack of consumer understanding of why the smart meters were being rolled out and how consumers could use the information to reduce their electricity bills. This was noted in the Victorian Auditor-General report which cited market research conducted in early 2014 that found:
… that two-thirds of Victorians did not understand what the benefits of smart meters were and many were still unaware of the link between their smart meter and saving money on their electricity bills. (p. xiv)
The Victorian experience highlights that, for the potential benefit offered by smart meters to be realised, customers need to be exposed to time-of-day pricing.
In its 2013 Electricity Network Regulatory Frameworks inquiry, the Commission highlighted the need to link the rollout of smart meters with time-of-day (or critical peak) pricing:
If carefully implemented, critical peak pricing and the rollout of smart meters could produce average savings of around $100–$200 per household each year in regions with impending capacity constraints (after accounting for the costs of smart meters). (PC 2013a, p. 21)
The Commission went on to find that a rollout of smart meters had the potential to benefit all jurisdictions (including Victoria) if the investments decisions were based on their value to consumers rather than being mandated.
The Commission considered at some length whether the capacity for cost-reflective prices would result in exposure by consumers to the large fluctuations in wholesale energy prices that sometimes (albeit rarely) occur for short periods. In concluded that:
… , even if permitted to adopt cost-reflective prices for wholesale energy variations, it is unlikely that retailers would change their current practice of hedging, or contracting with generators (thus smoothing price volatility in the wholesale energy market) for residential customers. This is because such events are not predictable — but can arise from generator failure, strategic behaviour by generators and transmission failures at any time. Consequently, it would be hard to pre-notify consumers of such pricing events.
Nor is it clear that where the pricing events result from such unpredictable events (compared with the predictably high costs associated with network capacity built for the hottest days) that it would be efficient to pass on these volatile unhedged wholesale prices to consumers. Consumers value insurance for such unpredictable events. A retailer that failed to provide such a service would be unlikely to retain customers. Large energy users fall into a different category — and will sometimes agree (with the possible involvement of an intermediary) to voluntary load shedding in return for a fee during high price events, thus lowering their overall costs. Such firms or their intermediaries have the facility to continuously monitor five-minute interval wholesale electricity prices and have the ability to take very rapid action to curtail consumption. Households are unlikely (even with the aid of an intermediary) to ever be able to respond in this sort of manner. (p. 22)
SP 11 – ENERGY (ELECTRICITY) 81

The AEMC changed the National Electricity Rules in 2015 to assist the rollout of advanced metering technology. Retailers are responsible for arranging metering services for small customers, but customers can opt out of having an advanced meter if their existing meter works. The rule changes also enable:
Customers’ electricity data, and other services available from an advanced meter, can be provided to other service providers such as energy service companies, with the customer’s consent, to enable a range of services which can help consumers understand and manage their electricity use.
The new rules also require retailers and distributors to adhere to minimum standards regarding the format, time frame and cost by which usage data are delivered to customers (or parties authorised by that customer) (AEMC 2015c).
Effective competition requires better informed and engaged retail customers
The rollout of smart meters was one of many issues considered by AEMC in late 2012 with the aim of empowering electricity consumers and giving them more options in the way they use electricity. A central issue considered by the AEMC was whether the rules at the time penalised or otherwise discouraged electricity distributors, retailers and customers from engaging in demand-side management.
A broad suite of detailed measures arose from this review that sought to:
reform distribution network pricing principles to improve consumer understanding of cost reflective network tariffs and give people more opportunity to be rewarded for changing their consumption patterns
expand competition in metering and related services to all consumers, putting greater discipline on competitive metering suppliers to provide services at efficient cost and consistent with consumer preferences
clarify existing provisions regarding the ability of the market operator to collect information on demand side participation to make its market operational functions more efficient
give consumers better access to their electricity consumption data
establish a framework for open access and common communication standards to support contestability in demand side participation end user services enabled by smart meters. This will support consumer choice
introduce a new category of market participant for non-energy services in the National Electricity Rules to facilitate the entry of innovative products for consumers
reform the application of the current demand management and embedded generation connection incentive scheme to provide an appropriate incentive for distribution businesses to pursue demand side participation projects which deliver a net cost saving to consumers
82 PRODUCTIVITY REVIEW

establish a new demand response mechanism in the wholesale market option for demand side resources to participate in the wholesale market for electricity.
The recommendations of the Productivity Commission’s Data Availability and Use inquiry (PC 2017) supports the AEMC’s Power of Choice program.
Notwithstanding the introduction of retail contestability, the high concentration in some NEM retail markets (discussed in section 3.3) indicates that more still needs to be done to deliver effective retail competition. As the Victoria experience illustrates, consumer education will be an essential component in success of these reforms.
CONCLUSION 3.1
There are many challenges facing the electricity system arising from new technologies, investment uncertainty, declining baseload capacity and the potential for demand peaks that the system may find hard to meet. In response, governments will need to authorise the regulator and market operators to make the changes needed to ensure the ongoing viability of the electricity system. Attention will be needed to:
make sure that the market rules support a pricing structure that reflects the costs imposed on the system by all market players, including the cost of carbon emission abatement
where possible, provide consistency across the jurisdictions in the roles and responsibilities of the AEMC, the AER and the AEMO
ensure that the processes used to review the AER’s determinations are closely confined, and do not become an avenue for re-prosecuting regulatory decisions
assess and manage the risk of stranded transmission and distribution assets, and the implications that this has for consumers
ensure that consumers have incentives to manage their demand, and access to the technology to do so, and understand the options available to them.
3.6 Recent developments
There has been a lot of recent activity in terms of electricity policy. Much of which has been outlined above has arisen through the normal day-to-day operation of the existing governance arrangements. For example, past regulatory determinations and rule changes take some time to impact on affected participants and the wider economy. Other activity has been in response to the range of issues that have come to the fore in the wake of the power difficulties in South Australia. In the past year, many reviews were commissioned on key aspects of the system.
As a result, there has been too much recent activity to summarise here.
Given this, this section highlights some more pertinent activity. The discussion is not intended to be comprehensive.
SP 11 – ENERGY (ELECTRICITY) 83

ACCC Electricity supply & prices inquiry
On 27 March 2017 the Australian Government directed the ACCC to hold an inquiry into the supply of retail electricity and the competitiveness of retail electricity prices. The inquiry is to investigate:
the key cost components of electricity retail pricing and how they have changed over time
the existence and extent of any barriers to entry, expansion and/or exit in retail electricity markets
the extent and impact of vertical integration
the existence of, or potential for, anti-competitive behaviour by market participants and the impact of such behaviour on electricity consumers
any impediments to consumer choice, including transaction costs, a lack of transparent information, or other factors
the impact of diverse customer segments, and different levels of consumer behaviour, on electricity retailer behaviour and practices
any regulatory issues, or market participant behaviour or practices that may not be supporting the development of competitive retail markets
the profitability of electricity retailers through time and the extent to which profits are, or are expected to be, commensurate with risk
all wholesale market price, cost and conduct issues relevant to the inquiry.
South Australian Government response
The South Australia Government responded to the power difficulties in September 2016 by announcing a package of measures that includes:
$150 million for 100 megawatts of battery storage for renewable energy
building its own gas power plant to have government-owned stand-by power available in South Australia
new laws to allow the state the power to override the AEMO and require more power to be sent to the state when needed
incentives to source more gas for use in South Australia
a new target that will increase South Australia’s energy self-reliance by requiring more locally generated, cleaner, secure energy to be used in South Australia (South Australian Government 2017).
84 PRODUCTIVITY REVIEW

Snowy 2.0
On 15 March 2017, the Prime Minister announced plans for a $2 billion expansion of the Snowy Hydro scheme to provide power for up to 500 000 homes through a new network of tunnels and power stations (referred to as ‘Snowy Mountains Scheme 2.0’). The scheme has the potential to increase the 4100 MW capacity of the Snowy Mountains Scheme by 2000 MW (Turnbull 2017b).
The plan is intended to make renewables more reliable and improved network security by filling the gaps caused by intermittent supply and generator outages.
Ministers also discussed recent announcements about the significant pumped hydro energy storage feasibility study for the Snowy Hydro Scheme.
The Finkel Review
On 7 October 2016, the Australian Government commissioned an expert panel lead by the Chief Scientist Dr Alan Finkel to take stock of the current state of the security, reliability and governance of the NEM and to provide advice to governments on a coordinated, national reform blueprint.
The final report of the Independent Review into the Future Security of the National Electricity Market was delivered to the COAG Leaders’ meeting on 9 June 2017 (Finkel et al. 2017). A preliminary report was released on 9 December 2016 (Finkel et al. 2016).
The final report contained 50 recommendations covering:
preparing for next summer (1 recommendation)
increased security (12)
a reliable and low emissions future – the need for an orderly transition (4)
more efficient gas markets (4)
improved system planning (5)
rewarding consumers (10)
stronger governance (14).
Some notable recommendations include:
a package of Energy Security Obligations should be adopted to ensure regional electricity security and address connection standards (recommendation 2.1)
the COAG Energy Council should direct the AEMC to review the regulatory framework for power system security in respect of distributed energy resources participation (recommendation 2.5)
SP 11 – ENERGY (ELECTRICITY) 85

an annual cyber security preparedness report should be prepared (recommendation 2.10)
the Australian Government should develop a whole-of-economy emissions reduction strategy for 2050 by 2020 (recommendation 3.1)
the Australian and State and Territory governments should agree to an emissions reduction trajectory for the National Electricity Market (recommendation 3.2)
that a clean energy target be adopted to achieve emissions reduction (recommendation 3.2)
large generators be required to provide at least three years’ notice prior to closure to support the orderly transition (recommendation 3.2)
AEMO, in consultation with transmission network service providers and consistent with the integrated grid plan, should develop a list of potential priority projects in each region that governments could support if the market is unable to deliver the investment required to enable the development of renewable energy zones by mid-2019 (recommendation 5.2)
reviews should be undertaken of the regulatory investment tests for transmission and distribution by mid-2020 (recommendation 5.5)
remove complexities to and improve consumer access to, and rights to share, their energy data (recommendation 6.3)
an Energy Security Board be established to be responsible for the implementation of the Finkel review and to provide whole-of-system oversight for energy security and reliability (recommendation 7.2).
The Australian Government has accepted 49 to the 50 recommendations — but not the one that counts the most for reducing the uncertainty that hamstrings investment, the recommendation for the adoption of a Low Emissions Target.
86 PRODUCTIVITY REVIEW

4 Gas
This chapter provides an overview of the natural gas industry in Australia and some of the key policy issues confronting it. It does not cover liquefied petroleum gas (LPG), which is a by-product of extracting crude oil. The terms gas and natural gas are used interchangeably.
The chapter begins by providing an overview of the gas industry in Australia (section 4.1). It then briefly outlines the recent evolution of the industry (section 4.2) that has given rise to its current structure (section 4.3). The chapter then explores some of the key policy-related issues confronting the industry (section 4.4). It then highlights some recent initiatives that have important implications for the industry (section 4.5).
Readers familiar with the industry structure and its evolution can proceed to the discussion of industry-specific policy issues in section 4.4. Chapter 2 canvases issues that also apply to the gas industry. Policy issues specific to the electricity industry are discussed in chapter 3.
4.1 Overview
Natural gas is the third largest primary source of energy consumed in Australia in 2014-15 (after oil30 and coal), accounting for almost one-quarter (chapter 2). Consumption of gas has also grown at a much faster rate over the last 40 years than either oil or coal.
Australia produced (extracted) 66 421 million cubic metres of natural gas in 2014-15 (DIIS 2016a). The energy content of this production was 2462 PJ and the energy content of gas consumed (used) was 1431 PJ. The main gases produced were: methane and, to a much lesser extent, ethane.
Most of this production was ‘conventional’ gas (82 per cent). Conventional gas is found in underground reservoirs, often along with oil, and can be extracted using traditional methods, with only a few wells for each basin. ‘Unconventional’ natural gas requires additional technology for extraction and requires more wells. Coal seam gas (CSG) accounted for 18 per cent of national production, but almost half of east coast production (principally in Queensland to supply LNG exports). In contrast to the United States,
30 Crude oil is subsequently refined to produce other fuels such as automotive gasoline, aviation gasoline, aviation turbine fuel, diesel and fuel oil.
SP 11 – ENERGY (GAS) 87

Australia does not produce shale gas despite having significant reserves.31 Nor also does Australia produce any ‘tight gas’ (GeoScience Australia 2016).
Gas fields cover much of Australia, with major basins located on and off the length of the Western Australian west coast and across the Northern Territory border, onshore through the Kimberley and Pilbara regions of Western Australia and down through central Australia into South Australia, Queensland and New South Wales and right along the Victorian coast (figure 4.1).
Production
Large-scale commercial oil and gas exploration began in Australia after the Australian Government introduced a subsidy scheme to encourage petroleum exploration in 1957.
Gas fields were subsequently discovered in the Surat Basin near Roma in Queensland (1960), followed by the Cooper Basin in the north-east of South Australia (1963), in the Amadeus Basin west of Alice Springs in the Northern Territory (1963), at Barrow Island off the coast of Western Australia (1964) and in the Barracouta field in Bass Strait off the coast of Gippsland (1965).
Commercial extraction commenced in the early 1960s (figure 4.2).32 However, output growth over the 1960s was subdued.
With the commercial development of Bass Strait and the Surat and Cooper Basins in the late 1960s, output grew strongly during the 1970s. Commercial extraction commenced in Western Australia in the early 1970s and in the Northern Territory in the early 1980s.
In 2014-15, Australian gas production was concentrated in three states. Western Australia was by far and away the largest producer, accounting for 61 per cent of production. Queensland and Victoria were the next biggest producers (20 per cent and 15 per cent, respectively). Production in South Australia, the Northern Territory and New South Wales together accounted for just 4 per cent of national production (figure 4.3).
Collectively, production from the four gas producing states that make up the east coast gas market — Queensland, Victoria, South Australia and New South Wales — accounted for 38 per cent of national output in 2014-15 (figure 4.3).33
31 CSG is gas extracted from coal beds, while shale gas is extracted from organic-rich rocks such as shale. Tight gas is found in low porosity sandstone and carbonate reservoirs. CSG occurs closer to the surface than shale gas and is easier and cheaper to extract. All shale gas and some CSG requires hydraulic fracturing (referred to as ‘fracking’) to extract the gas from the rocks (discussed in section 4.4).
32 Prior to the 1960s, gas was manufactured in Australia (dating back to, at least, the 1860s). It was not extracted from the earth as a mining activity.
33 The east coast market is sometimes referred to as the eastern market.
88 PRODUCTIVITY REVIEW

Figure 4.1 Australian gas supplies and pipelines
Source: GeoScience Australia (2016).
The South Australia and Victorian gas fields are mature fields. Production in South Australia grew strongly from 1969-70 until production peaked in 1989-90. Production subsequently declined steadily between 1989-90 and 2005-06. Since then, production has remained relatively flat. Victorian gas production peaked in 2012-13.
Until 1989, all production supplied the domestic market (such that domestic consumption of gas grew in line with production) (figure 4.2).
SP 11 – ENERGY (GAS) 89

Figure 4.2 Australian gas production and consumption, 1960-61 to 2014-15Billion cubic metres
0
10
20
30
40
50
60
70
1960-61 1970-71 1980-81 1990-91 2000-01 2010-11
Production Consumption
Source: DIIS (2016a, tables Q1 & Q2).
Figure 4.3 Share of Australian gas production by jurisdiction, 2014-15
NSW 0.2%
Vic 15%
Qld 20%
WA 61%
SA 3% NT 1%
Source: DIIS (2016a table Q1).
90 PRODUCTIVITY REVIEW

Consumption
Consumption by state
Western Australia was the largest natural gas consumer in Australia in 2014-15, accounting for over one-third of total use (figure 4.4). Queensland and Victoria were the next biggest consumers, each accounting for around one-fifth of total natural gas use. New South Wales (including the Australian Capital Territory) was the next largest consumer, accounting for half that of Queensland. South Australia was the largest consumer among the remaining states.
Figure 4.4 Share of Australian gas consumption by jurisdiction, 2014-15a
NSW 11%
Vic 20%
Qld 21%
WA 37%
SA 8%NT 3% Tas 0.4%
a NSW includes the ACT.
Source: DIIS (2016a table Q2).
Consumption by sector
The electricity generation sector was the biggest domestic user of natural gas in 2014-15, accounting for almost 40 per cent of all gas used in that year (figure 4.5). The manufacturing sector was the next largest user (accounting for 30 per cent of demand). The main gas using manufacturing industries are non-ferrous metals processing (such as alumina) and chemicals manufacturing and, to a lesser extent, food processing. Gas is used as a source of power and as a feedstock, such as in the production of polyethylene.
SP 11 – ENERGY (GAS) 91

Reflecting the strength of the mining industry in that year, the mining sector accounted for 14 per cent of total use. Residential users accounted for 11 per cent of gas use.
Figure 4.5 Share of Australian gas consumption by user, 2014-15a
Mining 14%
Chemicals 9%
Non-metallic mineral products
4%
Basic non-ferrous metals 10%
Other manufacturing 7%
Electricity generation 39%
Residential 11%
All other 6%
a Share of total final energy supply by natural gas.
Source: DIIS (2016a tables Q1 & Q2).
The gas use varies markedly by state (DIIS 2016b, p. 31). There are significant differences across states in the use of gas for electricity generation (discussed below). Manufacturing use was highest in Tasmania and New South Wales (72 per cent and 44 per cent, respectively), while residential usage was the main use in Victoria (39 per cent). Mining accounted for relatively high usage in the Northern Territory, Western Australia and South Australia (43 per cent, 19 per cent and 17 per cent, respectively). Residential usage was also high in New South Wales (18 per cent).
In contrast, there was almost no mining use in New South Wales or Tasmania. There was minimal residential use of gas outside of Victoria and New South Wales.
Electricity generation
As noted, the electricity generation sector accounted for almost 40 per cent of natural gas use in 2014-15.
Gas-fired generation was concentrated in two states in 2014-15: Western Australia (246 PJ) and Queensland (166 PJ). These two states accounted for three-quarters of all gas used in generating electricity (figure 4.6).
92 PRODUCTIVITY REVIEW

There was limited use of gas in electricity generation in the remaining states.
Figure 4.6 Gas use by the electricity sector by jurisdiction, 2014-15a
PJ
3827
166
48
246
1
26
0
50
100
150
200
250
300
NSW Vic Qld SA WA Tas NT
a Natural gas consumption by Electricity, Gas, Water & Waste Services.
Source: DIIS (2016a table F).
In terms of overall state usage of gas, electricity generation was the main user of gas in Queensland, the Northern Territory, South Australia and Western Australia (accounting for 58 per cent, 57 per cent, 45 per cent, and 44 per cent, respectively) (DIIS 2016b, p. 31).
Interstate trade
Interstate trade in natural gas occurs in the east coast gas grid via transmission pipelines that cross jurisdictional borders. Trade can occur at any point in time up to the capacity of the pipeline.
In 2014-15, Victoria was a net exporter of natural gas to the other states in the southern part of the grid. All of the other states — New South Wales, South Australia and Tasmania — were all net importers of natural gas (figure 4.7).
SP 11 – ENERGY (GAS) 93

Figure 4.7 Implied net gas exports by jurisdiction, 2014-15a
Billion cubic metres
0
1013
40
2 14
7 8
14
30 1
-4
26
27
-1 -0 -0
-10
-5
0
5
10
15
20
25
30
35
40
45
NSW Vic Qld WA SA Tas NT
Production Consumption Implied net exports (net imports)
a Implied net exports includes sales to other states (interstate trade) and exports overseas.
Source: DIIS (2016a table Q1 & Q2).
Exports
Australia exports natural gas overseas in its liquid rather than gaseous form given our geographical location makes pipelines unviable. The gas is liquefied by chilling it to -161 degrees Celsius in processing and purification facilities known as ‘LNG trains’ to reduce its volume by more than 600 times. The resulting LNG is then exported in specifically designed cryogenic tankers. On arrival, it is stored in tanks before undergoing regasification prior to use.
Exports of Australian LNG commenced in 1989, with the development of the North West Shelf off the coast of Karratha in Western Australia.
Western Australia was the sole exporter of LNG until exports from the Northern Territory commenced in 2006.34
Exports from Queensland commenced from Curtis Island (north of Gladstone) in 2014. Two additional export facilities have since come online (both also on Curtis Island). These developments link the east coast to world gas markets. The three Queensland LNG export
34 The Port of Darwin exports LNG from the Joint Development Zone between Australia and East Timor.
94 PRODUCTIVITY REVIEW

facilities are the first in the world to process CSG. They are partly supplied from their own reserves and partly from gas sourced from the domestic market (discussed in section 4.4).
All up, there are 16 LNG trains in Australia with a combined capacity of 74.1 Mt per year (table 4.1). Two additional processing facilities are also under development — one floating facility in the East Browse Basin, 200 km off the far north west coast of Western Australia, and one at Darwin — with three trains and a capacity of 12 Mt per year (both scheduled for completion in 2018).
Table 4.1 Australia LNG export facilities
Field Processing facility
State Exports commenced
Capacity LNG trains
Mtpa No.
ConventionalNorth West Shelf Karratha WA 1989 16.3 5Bonaparte Darwin NT 2006 3.7 1Pluto Burrup
PeninsulaWA 2012 4.3 1
Gorgon Barrow Island WA 2016 15.6 3Wheatstone Onslow WA 2017 8.9 2
Onshore CSGQueensland Curtis LNG Gladstone Qld 2014 8.5 2Australia Pacific LNG Gladstone Qld 2015 9 1Gladstone LNG Gladstone Qld 2015 7.8 2
Under developmentIchthys Darwin NT 2018 8.4 2Prelude Floatinga WA 2018 3.6 1
State totalsa
Queensland 25.3 5Northern Territory 3.7 1Western Australia 45.1 11a World’s first offshore floating processing facility. b Excluding projects under development.
Sources: Australian Petroleum Production & Exploration Association, Chevron and Inpex web sites, WA DSD(2016).
Australia is the world’s second largest exporter of LNG after Qatar (BP 2017, p. 35), exporting 53 million tonnes (Mt) of LNG valued at $23.7 billion in 2016-17.
LNG exports — both in volume and value terms — have grown strongly, especially since 1990 (figure 4.8). Australian exports were just 14 Mt worth $5.2 billion a decade ago. As a result, Australian natural gas production now greatly exceeds domestic use (figure 4.2). Export volumes grew by 37 per cent in 2016-17 financial year.
SP 11 – ENERGY (GAS) 95

Figure 4.8 Australian LNG exports by value and volume, 1989-90 to 2016-17$ billion (LHS); Mt (RHS)
0
10
20
30
40
50
60
0
4
8
12
16
20
1989-90 1994-95 1999-00 2004-05 2009-10 2014-15
Value (LHS) Volume (RHS)
Source: DIIS (2017 tables 1 & 2).
Australia is expected to become the largest LNG exporter by 2020 (DIIS 2016b).
Three Australian jurisdictions export LNG. Western Australia was by far the largest exporter in 2014-15 (92 per cent of all exports by volume), followed by Queensland (7 per cent). The Northern Territory was the smallest exporter (less than 1 per cent) (figure 4.9, left-hand panel).
Half of all Australian natural gas production was exported in 2014-15 (figure 4.9, right-hand panel). Three-quarters of Western Australian production was exported in that year, one-third of Northern Territory production and one-fifth of Queensland production.
The two additional LNG facilities that came online in Queensland led to a dramatic increase in that state’s and eastern Australia’s export capacity.
More recent data indicates that LNG export volumes from Queensland have grown at a much faster rate for Western Australia (34 and 15 per cent per year, respectively, over the three years to 2016-17) (DIIS 2017). There has been no growth in the share of exports from the Northern Territory.
96 PRODUCTIVITY REVIEW

Figure 4.9 LNG export shares by jurisdiction, 2014-15Per cent
Share of Australian LNG exports
WA92%
Qld7%
NT1%
Share of production
76
17
33
50
0
20
40
60
80
WA Qld NT Aust
Source: AER (AER 2015, p. 90).
Reserves
Reserves are untapped sources of gas. They consist of known deposits that have yet to be developed or, based on their geology, suspected deposits of gas. Uncertainty exists concerning the volume of gas in each basin and the economic viability of extracting it. This is particularly so for unconventional gas whose deposits have yet to be developed and are dependent on additional technology to make them economically viable. This gives rise to uncertainty surrounding the size of gas reserves.
Australia is assessed as having considerable gas reserves, with 279 819 PJ of known identifiable reserves (GeoScience Australia 2016). This is equivalent to around 106 years of production at current rates.
With the development of new technologies and the advance of exploration into proven basins and frontier areas, opportunities remain for new large gas discoveries. Geoscience Australia forecasts that these prospective (contingent) resources may be in the order of 3.5 times total identified reserves (GeoScience Australia 2016).
Conventional gas accounts for the bulk of identified reserves (63 per cent of known reserves, and 70 per cent of contingent reserves) (figure 4.10). Based on current production, known reserves are expected to last for 47 years.
Unconventional sources, particularly shale gas, account for just under three-quarters of Australia’s prospective gas resources (figure 4.10).
These gas reserves are concentrated in, or off the coast of, three jurisdictions: Western Australia (56 per cent), Queensland (27 per cent) and the Northern Territory (9 per cent). The east coast gas market states collectively account for 35 per cent of these reserves.
SP 11 – ENERGY (GAS) 97

Figure 4.10 Australia’s total identified and prospective gas resourcesGJ
0
250
500
750
1,000
Conventional gas Coal seam gas Tight gas Shale gas Total
Reserves Contingent resources Prospective resources
a Contingent resources: known discoveries that currently are subeconomic. Prospective resources: reserves that are deemed probable (at least 50 per cent likely) to be commercially recoverable. Also known as 2P or P50 reserves.
Source: GeoScience Australia (2016).
In terms of the east coast market, 85 per cent of total identified and prospective gas reserves are in the Surat–Bowen Basin in Queensland, 9 per cent in Victoria (mainly in Gippsland), 3 per cent each in South Australia and New South Wales (AER 2015, p. 92).
4.2 Historical development
Gas fields were initially developed to supply specific domestic markets, typically capital cities, or for export. The former involved linking production facilities to retail markets through long-distance high-pressure transmission pipelines and local distribution networks or to large industrial customers, including electricity generators. The gas tended to flow through these pipelines in one direction.
This trade initially occurred through confidential bilateral, long-term trades between producers and retailers. Gas production tended to involve joint ventures between large private-sector companies. The retailers consisted of a mix of private and government-owned utilities.
Bilateral contracts — often referred to as gas supply agreements (GSAs) — underpinned the development of the gas industry by giving users the confidence to invest in long-lived
98 PRODUCTIVITY REVIEW

infrastructure, and for suppliers to develop or underwrite capital intensive gas production and transmission facilities.
Over time, transmission pipelines were linked to facilitate trade between regions. This linking gave rise to gas grids. There are three such grids in Australia:
the east coast grid, covering Queensland, New South Wales, Victoria, South Australia and Tasmania (22 pipelines; 13 408 km)
the west coast grid, covering Western Australian (7 pipelines; 4758 km)
the north coast grid, covering the Northern Territory (4 pipelines; 2423 km) (AER 2015, p. 112), WA Public Utilities Office web site).
Some major transmission pipelines were re-engineered in 2015 to allow gas to flow in both directions (AER 2015, p. 12). As a result, most of the transmission pipelines in the east coast grid are now bi-directional.
This allows users to purchase gas from almost anywhere on the grid and has given rise to the development of ‘gas markets’.
4.3 Market structure
The vertical structure of the gas industry is broadly similar to that of the electricity industry (discussed in chapter 3) — production (extraction and processing to remove impurities — dust, water and heavy hydrocarbons, and gases other than methane, such as helium), long-distance transmission, localised distribution and retail. One material difference is that the storage of gas is already economically viable (figure 4.11).
Large customers (power stations and industrial customers) generally access their gas directly from the transmission network, and negotiate the price paid with gas producers.
Four large retailers — Jemena Gas Networks (NSW), Multinet (Victoria), AusNet Services (Victoria) and Australian Gas Networks (Victoria) — accounted for around 88 per cent of retail customers (based on AER 2015, p. 113). These companies source their supply under contracts with the gas producers. As a consequence, the downstream market has been characterised as possessing ‘strong oligopsony characteristics’ (DIIS 2016b, p. 34).
Nearly all large customers and retailers must deal with the gas transmission companies to obtain delivery of contracted gas supplies.
SP 11 – ENERGY (GAS) 99
Figure 4.11 Gas supply chaina
Source: AER (2017b, p. 19).
100 PRODUCTIVITY REVIEW

Production
Gas production involves the extraction of gas from the earth’s crust and the processing of that gas to remove gases other than methane and any impurities. The production sector also includes exploration to find new sources of gas (termed reserves).
Production can occur offshore or onshore. Offshore production primarily occurs off the north west coast of Western Australia and straddling the Northern Territory border and off the coast of Victoria (primarily in Bass Strait).
One important distinction is between production that occurs offshore and onshore. The Australian Government controls mining beyond a three mile nautical limit, while the states control both the landward side of that limit and all onshore oil and gas production. Most gas in Australia is produced offshore, but transported through pipelines for processing onshore.
Onshore and offshore operations are subject to a three-tier system of licensing:
exploration permits that allow the search for new reserves
retention leases that preserve the tenure on as-yet non-commercial discoveries
production licences that enable the extraction and processing of the gas.
Reflecting public ownership of the underlying resources, Australian governments levy taxes specifically on the extraction of gas in Australia. These taxes form part of the wider taxation of oil extraction and are not reported separately. These taxes are in addition to general taxes levied on the business (such as company and payroll tax).
The main taxes on gas production are the Australian Government’s Petroleum Resource Rent Tax (PRRT) and royalties payable to both the Australian Government and state and territory governments. Oil production also incurs excise duty. In 2015-16, Australian governments raised roughly $2.2 billion from taxes levied specifically on oil and gas production — roughly $750 million from the PRRT, $300 million from Australian Government royalties, $750 million from state and territory government royalties and $300 million from excise on oil (Callaghan 2017, pp. 38 & 40). These revenue collections are linked to oil prices.
Taxes on the extraction of gas, and to a slightly lesser extent oil, are less than those on iron ore and coal.
Production in each basin typically consists of a number of mining companies (figure 4.12). Many of these mining companies are joint ventures. There is significant foreign investment in the Australian gas industry, including production. The major gas mining companies include: BG Group, BHP Billiton, Chevron, ConocoPhillips, Origin Energy, Santos, Shell and Woodside.
SP 11 – ENERGY (GAS) 101

Figure 4.12 Market shares in gas production in the east coast market, 2014-15a
PJ
a Date for the 12 months to 31 May 2015. NSW CSG basins include the Sydney and Gunnedah Basins. Not all minority owners listed.
Source: AER (2015, p. 94).
Storage
Gas can be stored underground in reservoirs and in pipelines, or post-liquefaction as LNG in purpose built facilities.
Gas storage enhances system security by allowing for system injections at short notice to manage peak demand and emergencies. It also allows retailers a hedging mechanism if gas
102 PRODUCTIVITY REVIEW

demand varies significantly from forecast, and is increasingly being used to manage supply and demand fluctuations in the east coast market.
The key storage facilities in the east coast market are:
Moomba (storage capacity 85 PJ; South Australia)
Roma (70 PJ; Queensland)
Silver Springs (35 PJ; Queensland)
Iona gas plant (26 PJ; Victoria)
Ballera (10 PJ; Queensland)
Newstead (2 PJ; Queensland)
Newcastle LNG (1.5 PJ; New South Wales)
Dandenong LNG (0.7 PJ; Victoria) (AER 2017b, p. 72)
Wholesale gas markets
Wholesale gas markets have been developed to supplement the use of bilateral contracts.
The six east coast markets can be broadly categorised into three groups. While similar in many respects, the design and operation of each group differs in some important respects.
The first group of wholesale markets are the three short-term spot markets in Sydney (established September 2010), Adelaide (September 2010) and Brisbane (December 2011) that were developed as a means for balancing supply (deliveries into the system) and demand (withdrawals from the system). These markets are referred to as ‘hubs’ and occur at the interface of the transmission and distribution systems.
The daily price of gas at each hub reflects local supply and demand. Prices can vary between a floor price of $0/GJ and a maximum price of $400/GJ. Bids are placed the day before the trade in gas is to occur. Trades are balanced by the pipeline operators, with the AEMO operating the financial-side of the market.
The spot market typically accounts for 15 per cent of wholesale gas sales in Sydney and Adelaide, and 5 per cent in Brisbane (AER 2015, p. 96). Bilateral contracts account for the remainder of wholesale gas sales or through vertical arrangements between producers and retailers.
The second group of wholesale markets is the Victorian spot market that manages gas flows on the Victorian transmission system. It is different from the first group of short-term spot markets in that:
the maximum price in Victoria is $800/GJ
SP 11 – ENERGY (GAS) 103

the AEMO manages the physical balancing of gas trades in Victoria, while the pipeline operators are responsible for the short-term spot markets (the AEMO operates the financial side of both markets)
the Victoria market is for gas only, while prices in short-term spot markets include transmission pipeline delivery to the hub.
The final group of wholesale markets is the Wallumbilla (March 2014) and Moomba (June 2016) gas hubs. The Wallumbilla hub, which is located at the interconnection point for the Surat-Bowen Basin, was developed to support the LNG export facilities in Queensland. It enables buyers and sellers to voluntary trade gas products in spot (balance of day or day ahead) or forward markets. It allows trading for the three pipelines involved: the South West Queensland, Roma to Brisbane, and Queensland Gas pipelines. The Moomba hub is located at the junction of Moomba to Adelaide and Moomba to Sydney pipelines, and was developed to enhance the transparency and reliability of gas supply.
Transmission networks
Transmission networks transport gas under high pressure over long distances.
There are currently 34 gas transmission pipelines in Australia. Collectively, these pipelines are more than 20 000 km in length (table 4.2).
The New South Wales and Northern Territory Governments signed a memorandum of understanding in November 2014 to develop a transmission pipeline connecting the Northern Territory with the east coast market. In November 2015, the Northern Territory Government selected Jemena Northern Gas Pipeline Pty Ltd to build, own and operate the $800 million 622 km Northern Gas Pipeline to link Tennant Creek in the Northern Territory to Mount Isa in Queensland. Once completed, this will link the Northern Territory to the east coast market.
Like the electricity sector, and for the same reasons, gas transmission tends to be regulated with restrictions on gas trading by pipeline owners, and regulatory limitations on cross-ownership of competitive pipelines.
104 PRODUCTIVITY REVIEW

SP 11 – ENERGY (GAS) 105

Table 4.2 Major gas transmission pipelines in AustraliaPipeline Length Capacit
yRevers
e capacit
y
Regulatory status
km TJ/Day TJ/Day
QueenslandAustralia Pacific LNG
Pipeline530 1 560 No coverage (15 years)
Berwyndale to Wallumbilla Pipeline
112 164 276 Unregulated
Carpentaria Pipeline (Ballera to Mount Isa)
840 119 Light regulation
Comet Ridge to Wallumbilla Pipeline
127 950 175 Unregulated
Dawson Valley Pipeline 47 30 Unregulated (revoked 2014)Gladstone LNG Pipeline 435 1 430 No coverage (15 years)North Queensland Gas
Pipeline391 108 Unregulated
QSN Link (Ballera to Moomba)
182 404 340 Unregulated
Queensland Gas Pipeline (Wallumbilla to Gladstone)
627 149 40 Unregulated
Roma (Wallumbilla) to Brisbane
438 233 125 Full regulation
South West Queensland Pipeline (Ballera to Wallumbilla)
756 404 340 Unregulated
Wallumbilla Gladstone Pipeline
334 1 588 No coverage (15 years)
Wallumbilla to Darling Downs Pipeline
205 270 530 Unregulated
New South WalesCentral Ranges Pipeline
(Dubbo to Tamworth)294 7 Full regulation
Central West Pipeline (Marsden to Dubbo)
255 10 Light regulation
Eastern Gas Pipeline (Longford to Sydney)
797 351 Unregulated
Moomba to Sydney Pipeline 2 029 439 381 Partial light regulation
VictoriaSouth Gippsland Natural
Gas Pipeline250 Unregulated
Vic–NSW Interconnect 126/120
153 196 Unregulated
Victorian Transmission System (GasNet)
2 035 1 030 Full regulation
South AustraliaMoomba to Adelaide
Pipeline1184 241 55 Unregulated
SEA Gas Pipeline (Port Campbell to Adelaide)
680 314 Unregulated
(Continued)
106 PRODUCTIVITY REVIEW

Table 4.2 (Continued)
Pipeline Length Capacity
Reverse
capacity
Regulatory status
TasmaniaTasmanian Gas Pipeline
(Longford to Hobart)734 129 Unregulated
Northern TerritoryAmadeus Gas Pipeline 1 658 120 Full regulationBonaparte Pipeline 286 80 UnregulatedDaly Waters to McArthur
River Pipeline332 16 Unregulated
Palm Valley to Alice Springs Pipeline
146 27 Unregulated
Western Australiaa
Dampier to Bunbury Natural Gas Pipeline
1 530 845 Regulated
Goldfields Gas Transmission Pipeline
1 426 202.5 Regulated
Kalgoorlie to Kambalda Pipeline
44 20 Light regulation
Kambalda to Esperance Pipeline
340 6
Mid West Pipeline 352 10 RegulatedParmelia Pipeline 416 65.4Pilbara Energy Pipeline 251 166Telfer Pipeline 443 29
Total 20 589
Pipelines
Length Share
No. km Per cent
East coast 23 13 408 62.2Northern 4 2 423 11.8Western 8 4 802 27.0
a List excludes a number of smaller lateral pipelines.
Sources: AEMO (2016b, p. 18); AER (2015, p. 112, 2017b, pp. 72–73); APA web site.
Distribution networks
Gas distribution networks transport natural gas from transmission pipelines to end users. They typically consist of a backbone of high and medium pressure pipelines running between the ‘city gate’ (the point of connection to the transmission pipeline) and major
SP 11 – ENERGY (GAS) 107

demand centres. This network then uses low-pressure pipelines to deliver the gas to retail customers (businesses and homes).
There are currently 11 gas distribution companies operating in eastern Australia. Collectively, their networks are 76 420 km long and supply gas to just over 4 million customers (table 4.3).
Table 4.3 Major gas distribution networks in eastern AustraliaNetwork Customer
numbersLength
of mainsAsset base
Investment current
period
Revenue current period
Current regulatory period
km $m $m $m
QueenslandAllgas Energy 100 000 3 220 na na na Light
regulation from July 2015
Australian Gas Networks
92 900 2 700 na na na Light regulation from February 2015
New South Wales and ActJemena Gas
Networks (NSW)1 300 00
025 380 3 022 971 2 101 1 Jul 2015–
30 Jun 2020ActewAGL 137 800 4 900 343 80 291 1 Jul 2016–
30 Jun 2021Central Ranges
System7 000 220 na na na 1 Jul 2004–
30 Jun 2019
VictoriaAusNet Services 647 000 10 480 1 362 498 944 1 Jan 2013–
31 Dec 2017Multinet 687 000 10 030 1 126 897 873 1 Jan 2013–
31 Dec 2017Australian Gas
Networks648 000 11 000 1 193 431 904 1 Jan 2013–
31 Dec 2017
South AustraliaAustralian Gas
Networks423 300 7 950 1 093 527 1 103 1 Jul 2011–
30 Jun 2016
TasmaniaTas Gas Networks 12 000 710 na na na Not
regulated
TOTALS 4 055 000
76 590 8 139 3 404 6 216
Sources: AER (2015, p. 113, 2017b, p. 101).
108 PRODUCTIVITY REVIEW

Retail
The retail sector sells gas and gas-related services to smaller customers such as households.
Energy retailers are the main customers of the distribution networks. They buy natural gas in large volumes and on-sell it to consumers. This gas is mostly sourced from gas producers under bilateral contracts. Additional gas can be sourced from wholesale gas markets if needed. Retailers arrange with gas distribution network operators for the supply of gas to end users via the distribution network.
Consumers in all Australian states and territories are able to choose their gas retailer. They can also remain on regulated tariffs, although the number is steadily decreasing. The AEMC has recommended that retail price regulation be removed in Victoria, South Australia, the Australian Capital Territory and New South Wales.
The AEMO operates the gas retail markets in Queensland, New South Wales, the Australian Capital Territory, Victoria and South Australia. It manages the systems required for customer transfers (when a customer switches its retailer), delivery point management and balancing and reconciliation (managing the daily allocation of gas usage to retailers to enable the settlement of gas supply contracts).
Regulatory environment
The rationale for gas market regulation is also similar to that for electricity — the presence of large fixed costs and low marginal costs make it unlikely that there will be significant competition in the transmission and distribution of gas. Regulation is intended to constrain companies from exploiting any monopoly power they might have.
As gas is an important fuel source in electricity generation, the same key agencies are responsible for the governance of Australian gas markets as for electricity (discussed in chapter 2). The AER regulates network services in all jurisdictions, except Western Australia, where the Economic Regulation Authority of Western Australia holds this responsibility.
The National Gas Law and the National Gas Rules provide the regulatory framework for gas markets in the Australian Capital Territory, Tasmania, South Australia, New South Wales and Queensland, but not in Victoria.
Significant gas regulation focuses on those transmission and distribution pipelines where strategic behaviour is assessed as being more likely.
The National Competition Council recommends whether a gas distribution network should be regulated based on an assessment of the extent of competition for that service and their significance. The relevant minister in each jurisdiction then decides whether to regulate and, if so, the form of that regulation — light or full.
SP 11 – ENERGY (GAS) 109

Covered pipelines may be subject to either:
light regulation, where the pipeline owner determines its own tariffs, access arrangements and other terms and conditions, which must be published on its website. In the event of a dispute, a party seeking access to the pipeline may ask the AER to arbitrate.
full regulation, where pipeline owners must periodically submit their access arrangements to the AER for approval. The AER determines the reference tariffs for the pipeline based on the revenues needed to cover efficient costs and provide a commercial return on capital.
In practice, the industry generally operates with ‘light-handed’ economic regulation (tables 4.2 to 4.4). Only those elements with strong monopoly characteristics are regulated under the National Gas Law and Rules. This comprises distribution networks, those transmission lines with no direct competitors, and retail prices in a limited number of jurisdictions. Historically, the upstream gas industry has successfully relied on unregulated transactions between private sector producers and public or private utilities.
New pipelines are typically unregulated.
Table 4.4 Gas market structure
Sector Price regulation Linkages
Exploration & production Competitive Oil productionLNG exportStorage
Transmission Pipelines with market power are regulatedNew pipelines typically not regulated
StorageDistributionBarred from trading gas
Storage Competitive ProductionTransmission
Distribution Regulated due to strong monopoly characteristics
TransmissionBarred from trading gas
Retail Competitive except NSW with price controls on some small users
Electricity retail and generationGas production
End users Not applicable Some vertically integrated with retail and production (eg generators)
LNG Competitive on world market Exploration and production
Source: DIIS (2016a, p. 34).
The regulatory framework anticipates the potential for market conditions to evolve, and includes a mechanism for reviewing whether a particular pipeline needs economic regulation, and the extent of that regulation.
110 PRODUCTIVITY REVIEW

Rules made by the AEMC at the end of 2012 introduced a common approach to setting the rate of return for gas (and electricity) networks (AEMC 2012).
Transmission
The gas transmission sector is generally subject to light-handed regulation (table 4.2). This is in marked contrast to the electricity transmission sector, which is highly regulated given that it also possesses strong natural monopoly characteristics arising from the large fixed and low variable costs involved in transportation (discussed in chapter 3).
Most transmission of the 27 pipelines in the east coast grid and in the Northern Territory are unregulated (table 4.2). That is, they are not subject to economic regulation (and are referred to as ‘uncovered’).
All remaining transmission pipelines in the east coast grid and in the Northern Territory are regulated to varying degrees (referred to as ‘covered’).
Four pipelines (15 per cent) are fully regulated:
Amadeus Gas Pipeline (Northern Territory)
Roma (Wallumbilla) to Brisbane (Queensland)
Central Ranges Pipeline (Dubbo to Tamworth) (New South Wales)
Victorian Transmission System (GasNet) (Victoria).
A further three pipelines (11 per cent) are subject to partial or light regulation:
Carpentaria Pipeline (Ballera to Mount Isa) (Queensland)
Central West Pipeline (Marsden to Dubbo)
Moomba to Sydney Pipeline (South Australia/New South Wales).
Despite the gas market being widely regarded as being heavily regulated, the ACCC (2015) found less than 20 per cent of the transmission pipelines on the east coast are currently subject to regulation under the National Gas Law and Rules. This is at direct contrast to comparable jurisdictions, such as the United States, the European Union and New Zealand, where the vast majority of transmission pipelines are regulated.
Distribution
In contrast to transmission, gas distribution tends to be subject to full economic regulation.
The regulation of gas distribution networks in eastern Australia varies by state (table 4.3).
All distribution networks in New South Wales, Victoria, South Australia and the Australian Capital Territory are fully regulated by the AER.
SP 11 – ENERGY (GAS) 111

The two distribution networks in Queensland — Allgas Energy and Australian Gas Networks — are subject to light regulation by the AER.
The Tasmanian distribution network is not subject to regulation by the AER, but is subject to regulation by the Office of the Tasmanian Economic Regulator.
4.4 Gas-specific policy-related issues
In addition to the issues covered in the energy chapter (chapter 2), there are a number of policy-related issues specific to Australian gas markets. These issues predominantly relate to the east coast market.
Two topical issues are the availability and price of gas in the east coast market. These issues are interlinked.
The recent development of LNG export facilities in Queensland has linked the east coast to wider world markets. This development now gives domestic producers the option of selling their gas on world markets.
The intention was that gas from new developments would largely meet the demand from the LNG export facilities, leaving the amount of gas available for the domestic market relatively unchanged.
This has, however, not been the case for two of the facilities — Gladstone LNG and Queensland Curtis LNG (AER 2017b, p. 81). Not only was the yield less than expected, but the costs of extraction were higher.
LNG exporters subsequently drew on existing fields to source supply in order to fulfil the balance of their export contracts. This additional demand was large relative to the size of the east coast market and this increase in demand led to substantially higher domestic prices, and a reluctance by suppliers to enter into long term contracts. As a result, many domestic consumers had difficulty in securing supply contracts at prices that they found acceptable.
In theory, notwithstanding the use of bilateral contracts and strategic behaviour, arbitrage should ensure that the domestic price of gas will converge over time to the ‘LNG netback price’ — the export price of LNG less the costs of transport and liquefaction.
Thus, the issues of domestic availability and the domestic price of gas are linked to wider issues affecting current and future east coast production, domestic demand and LNG exports. Considerable uncertainty compounds these issues.
Other important policy-related issues affecting Australian gas markets include:
domestic gas reservation schemes
moratoria on onshore gas exploration and production in some states
112 PRODUCTIVITY REVIEW

misuse of market power
third party access
lack of market transparency and information
the absence of a well-functioning and liquid spot market.
While the discussion that follows attempts to separate these issues in order to shed light on the underlying policy-relevant factors, it should be remembered that they are interlinked.
Domestic availability of gas
The availability of gas in the east coast market is inextricably linked to the construction of the three LNG export facilities (consisting of five LNG trains) in Queensland.
The three facilities are large relative to the size of the domestic market. Their combined installed capacity is 25.3 Mtpa, which is 34 per cent of total Australian capacity. If they operated at 100 per cent capacity, these facilities would be capable of processing around 39 billion cubic metres of natural gas a year.35 This is roughly 50 per cent more than total east coast production in 2014-15.
Furthermore, these three facilities are linked into the east coast grid through transmission pipelines that join the Roma to Brisbane pipeline at Wallumbilla.
The linkage to the domestic transmission system means that, as long as the export facilities have spare capacity and if the domestic price is lower than the netback price, it is more profitable to export gas than to supply the domestic market. Given this, the domestic price of gas would be expected to increase towards the netback price.
Prior to the development of the LNG export facilities, the east coast domestic price of gas was significantly lower than international prices (figure 4.13). For example, prior to the development of the LNG export facilities, the monthly Australian dollar price of gas per GJ at Wallumbilla in March 2014 was roughly one-quarter of the North East Asian spot price — roughly A$4/GJ compared with almost A$18/GJ.36 The subsequent strong increase in domestic prices and decline in world oil prices (which gas prices are linked to with a three to four month lag) has seen this gap largely disappear.
35 Based on a gas density of 0.656 kg/m³.36 Even though the export facilities were yet to come online at this time, the domestic price may still reflect
lower domestic gas supplies resulting from LNG exporters procuring supply to meet future export orders.
SP 11 – ENERGY (GAS) 113

Figure 4.13 Monthly Wallumbilla gas price and Asian LNG spot price, 2014 to 2017a
A$/GJ
a The chart plots the month that LNG production began at each train at Gladstone. The North East Asian spot price index, which covers Japan, China, South Korea and Taiwan, is for delivery in 4–6 weeks, and is composed of 50 per cent volume weighted deal data and 50 per cent average bids and offers.
Source: DIIS (2017, p. 72).
While it was envisaged that these facilities would be supplied through the development of new CSG fields, thereby matching growth in supply to the increase in demand, this has not been the case for two of the facilities — Gladstone LNG and Queensland Curtis LNG — whose reserves at the time their final investment decision was made fell well short of their productive capacity (AER 2017b, p. 81).37
This has meant that the exporters were competing with other consumers on the domestic market in order to meet their contractual obligations.
As a result, the growth in the demand for east coast gas has outstripped the growth in supply, such that east coast domestic gas prices have risen strongly (figure 4.14). Sydney spot prices have risen by 18 per cent per year since June 2010, and 34 per cent per year since June 2014. Movements in Brisbane and Adelaide gas prices were broadly similar.
37 Queensland Curtis LNG would also have sufficient reserves if all of the significant uncommitted reserves of Arrow Energy are included. Shell is the principal owner of Queensland Curtis LNG (with a 73.75 per cent stake) and owns half of Arrow Energy with PetroChina.
114 PRODUCTIVITY REVIEW

Figure 4.14 Wholesale short term trading market gas prices, September 2010 to June 2017a
$/GJ
0
2
4
6
8
10
12
Sep-10 Sep-11 Sep-12 Sep-13 Sep-14 Sep-15 Sep-16
Sydney Adelaide Brisbane
a Average daily ex ante gas prices by quarter for each STTM hub.
Source: AER (2017c).
While many expected price increases to occur with the linking to international markets, the increases were quicker and larger than many anticipated. Many large domestic customers have had difficulty in securing new supply contracts and/or have done so at significantly higher prices, particularly as their existing contracts expire or come up for renewal.
Higher gas prices and an inability to secure long-term supply have an adverse impacts on domestic gas users in Australia, with flow-on effects to regional employment and local communities.
These price rises also make it harder for natural gas to replace coal in electricity generation to reduce greenhouse gas emissions, and to provide the stability needed for the grid by quickly smoothing out the intermittent generation from renewables (discussed in chapter 3).
In response to conflicting views between gas producers and customers concerning how well the east coast gas market was functioning and whether there were domestic supply issues, the Australian Government commissioned the ACCC in 2015 to inquire into the competitiveness of wholesale gas prices and the structure of the upstream processing, transportation, storage and marketing segments of the east coast gas industry.
SP 11 – ENERGY (GAS) 115

The final Inquiry into the East Coast Gas Market found that:
… many industrial users did experience real difficulties during this period [2012 to the end of 2014] and that they were receiving few, if any, real offers for gas. The offers that they did receive were often at sharply higher prices and on strict ‘take it or leave it’ terms.
Domestic suppliers were either unwilling or unable to make firm offers for gas supply for 2016 and onwards. They were either already fully contracted, reviewing their supply arrangements and strategies, in negotiation to secure their own supplies or, in the case of the LNG projects, focused on ensuring gas supply for LNG production rather than supplying additional gas for domestic users. This combination of factors led to great uncertainty for industrial gas users in the domestic market. (ACCC 2015, p. 1)
It went on to find that there were:
… now more gas supply offers available in the market, but they are from fewer sources of supply, higher priced, often for shorter durations and with tighter non-price terms and conditions. Other problems also remain in the market. (ACCC 2015, p. 1)
The ACCC concluded that the dramatic changes in the supply–demand balance and new contractual arrangements for conventional gas to support the LNG projects led to this market disruption.
The ACCC inquiry found that:
While it is clear that there are sufficient east coast reserves to meet likely demand for the foreseeable future, it is not at all clear whether these reserves will be developed in a timely fashion to meet demand at any particular point in time. (ACCC 2015, p. 2)
It found that there were three major factors that were feeding into the uncertainty about future gas supplies on the east coast:
gas flows to the LNG projects were removing gas from the domestic market
low oil prices were resulting in declining investment in gas exploration and lower production forecasts for both domestic and LNG projects
moratoria and regulatory restrictions were affecting onshore gas exploration and development, in New South Wales, Victoria, Tasmania and potentially the Northern Territory.
The inquiry recommended:
reconsidering the approach being taken under regulatory regimes for gas development
addressing pipeline sector problems that exacerbate gas supply and pricing issues in the domestic market
improving market operations and increasing the level of market transparency.
116 PRODUCTIVITY REVIEW

Domestic gas reservation schemes
Domestic gas reservation schemes have been promoted as one way of ensuring the supply of gas to the domestic market.
Western Australia has had a gas reservation policy to ensure the availability and affordability of domestic supply since the 1970s.
It is claimed that the east coast market is the only natural gas export market that does not prioritise local supply (DomGas Alliance 2012).
Other countries typically ensure domestic supply by introducing:
a domestic gas reservation scheme
restrictions on export volumes
export permits.
The Australian Government has since introduced what is effectively a threat of restrictions on export volumes (see below). Such measures are intended to prevent the subsequent loss in domestic economic activity, including employment, profits and tax revenue that would occur without such a scheme.
Higher export prices also bring economic benefits to Australia in the form of additional profits, tax revenue and employment. However, gas is subject to lower royalties (taxes on production) than iron ore and coal.
In its 2015 study examining barriers to more efficient gas markets, the Productivity Commission warned that a reservation policy would divert gas supply from the highest prices (and hence value uses), and that the cost of this would outweigh the gains from domestic use:
The integration of the eastern Australian gas market with the Asia–Pacific market represents an opportunity for the Australian community to earn a higher return from its substantial non-renewable resources. This will result in a net benefit to the community. (PC 2015, p. 54)
The Commission went on to state that:
The opening of the export market is creating significant disruption for market participants and will lead to material costs for some gas users, including through higher prices. There are concerns about short-term gas shortages and some gas users have indicated that they are unable to secure supply contracts.
Policies that seek to counteract the pressures from structural adjustment arising from the opening of the export market, such as domestic gas reservation, could distort important signals for adjustment and are unlikely to be efficient or effective in the long run.
Governments should be mindful that policies that interfere with market signals could undermine investment incentives, including incentives to bring on new sources of gas supply. (p. 2)
SP 11 – ENERGY (GAS) 117

In its Inquiry into the East Coast Gas Market the ACCC found that the lack of a domestic reservation policy was not responsible for high domestic gas prices:
Gas reservation policies seek to shield domestic users from the effects of linking to export markets. They include policies to require a percentage share of gas reserves or production to be placed in the domestic market, or export controls which require a licence for exporting gas subject to certain conditions, such as a national interest test, which could include considerations of the impact on domestic supply.
In the short term, such policies may reduce prices for domestic users as additional gas is forced onto the domestic market above efficient market demand. These artificially reduced prices weaken the economic incentives for further gas exploration and appraisal. In addition, new gas projects which are scaled to the domestic market may be forced out of the market due to poor economic returns. Over time, reservation policies would reduce the likelihood of new sources of gas being developed, to the detriment of the level and diversity of supply for domestic gas users.
In a market that is facing supply issues arising from LNG, moratoria, and a low oil price, further impediments to gas supply development would be detrimental and so should not be introduced. (ACCC 2015, pp. 7–8)
It recommended that:
Gas reservation policies should not be introduced, given their likely detrimental effect on already uncertain supply. (p. 8)
However, the rise in prices in the east coast market have been unprecedented following the development of the export market. In response the Prime Minister convened a roundtable with gas company executives in March 2017 seeking a commitment to increase the supply of gas to the domestic market at peak times to put downward pressure on prices and ensure that the east coast does not experience the electricity blackouts that affected South Australia.
The Government announced after this meeting that it had decided to impose export restrictions on gas in a bid to ensure there are no domestic shortages. It introduced the Australian Domestic Gas Security Mechanism (which sits within the new Division 6 of the Customs (Prohibited Exports) Regulations 1958), that came into effect 1 July 2017 (DIIS 2017). This allows the Minister to make a determination to declare if a year is a shortfall year, which would trigger export controls. The aim is to encourage producers to boost supply for Australian users to avoid controls on export.
Following a meeting with the AEMO in April 2017, the Prime Minister announced that:
… the industry … with AEMO, have developed a framework to make sure gas is delivered at times of peak electricity demand to prevent blackouts. The arrangement will be in place by 1 October this year well in time to prepare for the next summer.
… The meeting also discussed the agreement of the COAG Energy Council to accelerate gas market and pipeline reforms with rollout to commence from 1 July 2017. The meeting further noted the critical role of the states and territories in enabling gas exploration and development.
118 PRODUCTIVITY REVIEW

To verify the progress in gas supply, the Treasurer has today directed the ACCC to establish a monitoring regime by using its inquiry powers to compel the gas industry to provide information, to underpin a new transparency in the gas market to the benefit of consumers. (Turnbull 2017a)
A key function of policy is to monitor the extent to which this and other policy measures (including those aimed at concerns about the misuse of market power) will increase domestic gas supply and relieve price pressures.
Moratoria on onshore gas exploration and production
New supplies of gas are needed on the east coast to meet the increase in demand arising from the development of export facilities.
Currently, several states have moratoria on exploring or developing coal seam gas reserves — most notably Victoria, Tasmania and the Northern Territory.
Following the O’Kane review, NSW has lifted its prior pause on exploration and development, and has implemented a new set of regulatory arrangements (the ‘Gas Plan’). The new framework permits onshore gas exploration and development subject to compliance with the relevant regulations. In this new context, several major projects for development (the Narrabri Gas Project) and potential exploration (the Bancannia Trough and Pondie Range Trough) are under assessment for potential approval.
The Victorian Government has permanently banned all onshore unconventional gas exploration and development, including hydraulic fracturing (‘fracking’) and CSG. It also has a moratorium on conventional onshore gas exploration and development (extended to 30 June 2020) (Noonan 2017).
In March 2014, the Tasmania Government introduced a one-year ban on hydraulic fracking needed to extract all shale gas and some CSG. The ban has been extended to five-years (Hodgman, Rockliff and Harriss 2015).
Independent reviews
At least four separate Australian reviews and inquiries have independently found that the environmental and social concerns regarding gas exploration and production can be effectively managed through a well-designed, evidence-based regulatory regime.
In her 2014 review of the evidence, the NSW Chief Scientist and Engineer, Professor Mary O’Kane, found that the risks of gas development could be effectively managed with the right regulation, engineering solutions, and ongoing monitoring and research (O’Kane 2014). The NSW Government agreed to all of her recommendations (NSW Government nd).
SP 11 – ENERGY (GAS) 119

In November 2014, the Hawke Inquiry into hydraulic fracturing (fracking) in the Northern Territory recommended that:
The substantive weight of agreed expert opinion leads the Inquiry to find that there is no justification whatsoever for the imposition of a moratorium of hydraulic fracturing in the NT. (Hawke 2014, p. 46).
The major recommendation of the inquiry was that:
… the environmental risks associated with hydraulic fracturing can be managed effectively subject to the creation of a robust regulatory regime. (p. x).
The inquiry noted that:
… the level of distrust and hostility towards the unconventional gas industry might seem curious given the NT’s history of fracking in conventional reserves, without adverse consequences. (p ii)
A subsequent Northern Territory Government announced on 14 September 2016 a moratorium on hydraulic fracturing of onshore unconventional reservoirs, including its use for exploration, extraction, production and Diagnostic Fracture Injection Testing.
This was followed by an announcement on 3 December 2016 of another independent Scientific Inquiry into Hydraulic Fracturing in the Northern Territory to be headed by the Honourable Justice Rachel Pepper.
Reasons for the moratoria
These four moratoria were introduced in response to strong community concerns around the actual and perceived environmental and public health risks associated with fracking, access to farm land, its impact on agricultural production, and the loss of amenity.
Onshore gas exploration and production are clearly contentious, especially the production of CSG through fracking.
Some of this strong resistance was partly due to the poor early record of some companies in dealing with landholders and local communities (PC 2015, p. 11). The Commission identified that some gas companies had increased their engagement efforts, but found that there was scope to improve the legislated compensation provisions to better reflect the costs to landholders from negotiating land access agreements and from the decline in the value of their properties.
The Commission concluded that moratoria are not costless:
The expected benefits of the moratoria must be weighed against their expected costs — higher gas prices for users and reduced royalty and taxation revenue for governments. (p. 14)
120 PRODUCTIVITY REVIEW

It found that the technical challenges and risks could be managed through a well-designed regulatory regime that was underpinned by effective monitoring and enforcement of compliance (p. 77).
The Commission found that there were more effective models of community engagement than simple bans, which could include a voluntary industry-wide code of practice. It went on to say that:
A well-designed uniform voluntary code of practice outlining the principles and elements of best practice community engagement for the gas industry may improve outcomes and address expectations of future interactions on both sides. Other sectors that have faced similar issues with community resistance, such as the wind energy industry, have adopted this approach. (p. 11)
A voluntary industry-wide code of practice might help the gas industry improve their relationship with the community, but must be accompanied by moves of substance. None of this is intended to question the science and the efforts of Chief Scientists to establish safer practice. But as is often the case, the science is not enough to carry the policy debate.
The gas industry needs to address its relationship with the community to build confidence in the safety of the operations and provide sufficient compensation for disruption and loss of value to the landholder. To build community confidence in gas exploration and production, such a code must go beyond other desirable aspects of gas exploration — safety regulation, sound scientific evidence, and monitoring and enforcement of compliance — and include clear guidelines and arrangements to support landholders in negotiating land access agreements.
The ACCC came to a similar conclusion in its Inquiry into the East Coast Gas Market (ACCC 2015). While recognising the importance of the environmental and social considerations that underpinned the moratoria, the inquiry found that the moratoria on the supply of gas was one of three main factors contributing to future uncertainty about gas prices (p. 2). It went on to recommend that:
Governments should consider adopting regulatory regimes to manage the risks of individual gas supply projects on a case by case basis rather than using blanket moratoria. Governments should take into consideration the significant effects that moratoria and other restrictions on gas development may have on gas users. (p. 8)
The effect of these moratoria has been exacerbated by decline in exploration and new development linked to falling oil prices and regulatory uncertainty. This has created an increasingly complex environment for many gas market participants (ACCC 2015).
While many of these factors are outside their control, governments have direct control over the moratoria on onshore gas exploration and production.
SP 11 – ENERGY (GAS) 121

Adequacy of existing gas reserves
Despite having substantial proven reserves, New South Wales produced just over 3 per cent of the gas that it consumed in 2014-15 (figure 4.7).
There are sufficient proved and probable reserves in eastern Australia to theoretically supply both the domestic and export markets for the next 60 or so years.
However, if the market is divided into the North (Queensland and the Cooper Basin) and the South (Victorian and New South Wales reserves), there are insufficient probable reserves in the South to meet forecast demand, which will require the development of contingent resources, new gas discoveries and/or imports from the North.
In its Gas Statement of Opportunities for Eastern and South-Eastern Australia, the AEMO warned that, without further supply, there may be gas shortages in South Australia, New South Wales and Victoria (AEMO 2017c). Domestic gas production is forecast to decline, particularly offshore in Victoria, which is expected to fall by 38 per cent between 2017 and 2021. Reductions in domestic supply are expected to have flow-on implications for the use of gas in electricity generation. The AEMO also warned that there may be insufficient gas to meet the projected need of gas powered generation from the summer 2018-19.
To meet forecast gas demand, the AEMO states that supply from existing fields needs to increase and/or exploration and development of new fields is required.
The pipeline being built to link the Northern Territory to Mt Isa will give the east coast access to additional potential supply. It may also enable east coast gas to be exported through the Northern Territory.
Even if supply were to increase, the AEMO warns that this may not lead to lower gas prices:
Geological challenges of gas extraction are reducing gas well productivity and driving production costs higher, while low cost reserves in eastern Australia are in decline. The increased cost of sourcing new gas supply means additional gas in the market may not translate to lower prices. (AEMO 2017c, p. 21)
Nonetheless, removing unnecessary barriers that restrict the development of lower cost gas fields would still be beneficial.
While clearly flagging these potential risks, the AEMO was not as pessimistic on the outlook for gas in its recent Energy Supply Outlook (which replaces, among other publications, the earlier Gas Statement of Opportunities) (AEMO 2017b). Nevertheless, the AEMO still found that:
Domestic gas supply and demand remain finely balanced. Whether sufficient gas is available to meet demand will depend on:
The actual quantities of gas available to the domestic market after liquefied natural gas (LNG) exports.
122 PRODUCTIVITY REVIEW

The level of domestic gas demand for gas-powered generation of electricity (GPG).
The adequacy of coal supplies for coal-powered generation. The amount of GPG needed to secure electricity supplies will depend on how much coal-powered generation contributes, particularly in New South Wales. (p. 3).
The AEMO is working with the industry to ensure that sufficient gas available to meet demand, including for electricity generation.
The difference between the two AEMO reports highlight the sensitivity of the east coast market and prices to the level of capacity utilisation of LNG export facilities. The higher the level of utilisation, the tighter the east coast market will be without additional sources of supply.
The restrictions on onshore gas exploration in several jurisdictions is restricting the supply of gas and contributing to the forecast shortages.
CONCLUSION 4.1
The moratoria on onshore gas exploration and production is contributing to gas price pressures on the east coast and there are better ways to address community concerns. Onshore exploration and production should be governed by a well-designed regulatory regime, underpinned by sound scientific evidence, effective monitoring and enforcement of compliance. The processes should be clear and transparent. More effective models of community engagement are preferable to simple bans.
Misuse of market power
As stated, the transmission and distribution of gas involves high fixed upfront costs in constructing pipelines and relatively low operating costs in transporting the gas (marginal cost). These high fixed and relatively low marginal costs mean that there is unlikely to be significant competition in the transmission and distribution of gas to specific locations.
This lack of competition gives gas transmission and/or distribution companies the potential to charge their customers excessive prices. Regulation is aimed at preventing these companies from exploiting any market power that they may have.
In its inquiry of the east coast gas market, the ACCC (2015) found that the regime regulating gas pipelines was not fit for purpose and that pipeline pricing was largely unconstrained by either the threat of regulation or effective competition:
The ability and incentive of existing transmission pipelines to engage in monopoly pricing is not being effectively constrained by competition from other pipelines, competition from alternative energy sources, the risk of stranding, the countervailing power of shippers or the threat of regulation.
The transmission sector is already subject to an access regime under the National Gas Law (NGL) and the National Gas Rules (NGR), but less than 20 per cent of the transmission pipelines on the east coast are currently subject to any form of regulation. This is in stark
SP 11 – ENERGY (GAS) 123

contrast to other comparable jurisdictions, such as the United States, New Zealand and the European Union, where the vast majority of transmission pipelines are subject to economic regulation because it has been recognised that pipelines can wield substantial market power. (ACCC 2015, p. 10)
The inquiry found evidence of capacity being withheld by incumbents on some regional pipelines, which restricted competition for supply from other retailers.
The inquiry went on to find that there was ‘evidence of monopoly pricing [by pipeline operators] giving rise to higher prices and economic inefficiencies’ (p. 8). This pricing had exacerbated the effect of supply tightness on wholesale gas prices. The difference between a competitive market and an uncompetitive market in south-eastern Australia could be as much as $4/GJ for wholesale gas.
Third party access
As noted, the ACCC found in its Inquiry in the East Coast Gas Market (ACCC 2015, p. 10) that the ability of, and incentive for, transmission pipelines to engage in monopoly pricing was not being effectively constrained by competition from other pipelines, competition from alternative energy sources, the risk of stranding, the countervailing power of shippers, or the threat of regulation (p. 10).
The ACCC went on to find that regulation or the threat of regulation was not imposing an effective constraint on the behaviour of a number of unregulated pipelines. The ‘coverage criteria’ for regulation under the National Gas Law required the exercise of market power to have an effect on competition in a dependent market. However, this criterion was considered unlikely to be met by the majority of transmission pipelines given the characteristics of the market.38
The ACCC inquiry recommended that the coverage criteria should be replaced by a new test to better address the issue of market power and monopoly pricing by focusing on: whether the pipeline in question has substantial market power; it is likely that the pipeline will continue to have substantial market power in the medium term; and coverage will or is likely to contribute to the achievement of the National Gas Objective (NGO) (for example, by promoting efficient investment, operation and/or the use of natural gas services for the long-term interests of consumers of natural gas) (ACCC 2015, p. 10).
In response, the COAG Energy Council appointed Dr Michael Vertigan to examine whether a new test for determining if a gas transportation pipeline should be subject to economic regulation.
The Review found that the principal problem was not whether the existing regulatory test was appropriate and how it should be changed, but rather that:
38 This mirrors concerns raised by the Productivity Commission over analogous provisions in the access regime set out in Part IIIA of the Competition and Consumer Act 2010 (Cth) (PC 2013b, pp. 172–173).
124 PRODUCTIVITY REVIEW

… parties negotiating for pipeline access and services have unequal levels of bargaining power and information. Consequently, the examination has focused on the most effective and least onerous ways to address this negotiating imbalance, with the objective of delivering more competitive outcomes in the market for pipelines services. (p. 99)
The Review’s recommendations were directed at addressing the two principal issues: the information asymmetry between the parties in negotiations; and the superior negotiating position of the pipeline operators.
To this end, he recommended the introduction of an open access regime:
That a framework for binding arbitration, available to all open access pipelines in the event parties are unable to reach a commercial agreement, be introduced into the National Gas Law (NGL). (Vertigan 2016, p. 13)
Arbitration would be activated where negotiating parties were unable to reach a commercial resolution.
He agreed with the ACCC finding that there was little publicly available information on the costs incurred by pipeline operators in providing services and the relationship between these costs and the prices charged for services. Increased transparency provides parties seeking pipeline services with an improved ability to undertake timely and effective negotiations:
That the disclosure and transparency of pipeline service pricing and contract terms and conditions be enhanced, including requiring the provision of information on the full range of pipeline services which are available or sought (not solely focused on forward haul services). (Vertigan 2016, p. 13)
On the appropriateness of the coverage test, the Review recommended:
That no change be made to the current coverage test at this stage. The appropriateness of amending the coverage test should be reviewed within five years after the arbitration framework is operational. (Vertigan 2016, p. 16)
In its December 2016 Communique, the COAG Energy Council welcomed the release of Vertigan Review and indicated they would implement the recommendations.
Contractual congestion
The ACCC also found ‘contractual congestion’ to be a problem on some routes that prevent prospective shippers from securing sufficient pipeline access despite there being spare physical capacity (ACCC 2015, pp. 80 & 154). This congestion arises because other shippers have entered into Gas Transportation Agreements with the pipeline owner to secure pipeline capacity (termed primary capacity). These agreements can effectively lock-up capacity that the shipper may not ultimately use on any given day. Shippers can on-sell their unused capacity that would otherwise be lost, but it may not be worthwhile for them to do so given the cost and effort involved, and the risk of being short of capacity
SP 11 – ENERGY (GAS) 125

(p. 72). A lack of information transparency, search and transaction costs, and the pricing of transportation further also impede capacity utilisation and gas flows (p. 149).
Further, although not widespread, the ACCC found evidence in the case of some regional pipelines that shippers were deliberately withholding capacity in order to improve their competitive position in up- or downstream markets.
Recent changes to the way that the east coast gas market operates, including the development of LNG export facilities, are making the task of allocating gas to where it is valued the most more challenging. This task is increasingly linked to the efficiency with which transportation capacity is allocated and used (AEMC 2016b, p. vii).
Contractually congested assets adversely affect the efficiency with which pipeline capacity is being used to transport gas to where it is valued most highly.
In its East Coast Wholesale Gas Markets and Pipeline Frameworks Review, the AEMC subsequently recommended the development of a market to trade spare contracted pipeline capacity. The publication of information on secondary trades of pipeline capacity and hub services is needed to underpin the development of a liquid market (AEMC 2016b, p. viii).
Lack of market transparency and information
The AEMO operates a ‘gas bulletin board’ that provides information on gas production, fields, storage facilities, major demand centres and transmission pipeline systems in the east coast market. It includes interactive maps. The amount and quality of the information contained on this bulletin board has been extended and improved since its introduction in July 2008.
Despite the operation of the gas bulletin board, insufficient transparency and information has been raised as an issue affecting Australian gas markets.
The prevalence of confidential bilateral long-term contracts for buying and selling gas in Australia does not provide readily observable price signals needed to drive investment. In contrast, prices are readily observable where gas is bought and sold through spot markets, reflecting the interactions between supply and demand.
This lack of observable price signals is exacerbated by a lack of transparency and information about the level of reserves and transport prices.
Producers prefer bilateral contracts as a means of locking in customers before they undertake the significant capital investments (often in the billions of dollars) needed to develop new gas-related infrastructure (the development of new fields, processing facilities and LNG export facilities).
126 PRODUCTIVITY REVIEW

The ACCC found that the lack of consistent, publicly available data on the sector was an impediment to participants, investors, and policymakers and recommended rules enforcing a consistent and transparent flow of information to industry users (ACCC 2015).
The east coast gas market has developed trading hubs as a means to develop gas trading and to balance system flows.
Market-based price signals lie at the core of the COAG Energy Council’s vision for Australian gas markets (COAG Energy Council 2014). Central to this is the establishment of a liquid wholesale gas market: that provides market signals for investment and supply; where responses to those signals are facilitated by a supportive investment and regulatory environment; where trade is focused at a point that best serves the needs of participants; where an efficient reference price is established; and where producers, consumers and trading markets are connected to infrastructure that enables participants the opportunity to readily trade between locations and arbitrage trading opportunities.
Achieving this vision requires the development of an efficient and transparent reference price for gas that would reflect underlying supply and demand conditions. The development of a liquid market requires many parties buying and selling gas.
To assist it in developing a roadmap for achieving its vision requested, the COAG Energy Council requested the AEMC to review the design, function and roles of facilitated gas markets and gas transportation arrangements on the east coast of Australia.
The AEMC recommended a gas market development ‘roadmap’ that brings together recommendations on wholesale and transportation capacity markets, and information provision (AEMC 2016b). The proposed reforms were designed to promote the National Gas Objective.
Central to this is reducing the five existing gas markets on the east coast into two — one in the northern part of the grid and one in the south. The markets would involve continuous exchange-based trading with common processes and procedures to reduce transaction costs and complexity for businesses operating across multiple markets and to encourage greater participation.
These reforms are to be supported by a detailed package of recommendations to enhance the information provided to the market. Pivotal to this was a recommendation for a central repository of information for use by all market participants and the public in the form of a ‘Natural Gas Services Bulletin Board’. The package also included recommendations to improve information transparency, including expanding coverage of the Bulletin Board so that a wider range of information is provided and enhancing the reporting and compliance framework. Some of its recommendations require amendments to the National Gas Law and supporting regulations.
SP 11 – ENERGY (GAS) 127

The absence of a well-functioning and liquid spot market
While these trading hubs allow for the trading of imbalances and set a daily or intra-day market price, there are concerns about whether there is currently sufficient liquidity and market depth to create a viable spot market for managing the significant financial risks involved.
The use of long-term bilateral contracts limits the opportunities for producers and consumers to actively and reliably participate in spot markets by constraining their ability to adjust the price and quantities of gas being traded.
This lack of liquidity reflects the limited number of participants in each hub and, more broadly, in the east coast market. There are also difficulties in trading gas across the hubs.
Until this liquidity develops, the markets will lack the financial risk management tools that are required to enable all participants to hedge spot market risks and trade without physical gas contracts.
A consequence of the absence of well-functioning and liquid spot market may be to force participants into long-term, rigid commercial arrangements in order to minimise long-term supply and demand risks. This favours concentration and vertical integration and means that new entrants find it difficult to enter the market (DIIS 2016b, p. 36).
The reduction in the number of gas spot markets and the development of a secondary market for pipeline capacity will go some way to increasing market liquidity. Further development of the gas bulletin board and real-time information on gas trades should also assist by encouraging arbitrage, especially if existing pipeline capacity constraints can be overcome. Nevertheless, liquidity and the associated price volatility may remain an ongoing issue.
4.5 Recent developments
The AEMC developed a longer term roadmap for gas market development (AEMC 2016b). It proposed creating two virtual gas trading hubs:
a northern hub located initially at Wallumbilla, Queensland
a southern hub in Victoria (to eventually replace the declared gas market currently operating in Victoria).
Each hub would adopt exchange-based trading similar to that already in place at the Wallumbilla gas supply hub. Participants could also buy and sell gas via bilateral over-the- counter trading or long-term contracts.
The COAG Energy Council released a Gas Market Reform Package on 19 August 2016. The package responded to the findings and recommendations of:
128 PRODUCTIVITY REVIEW

the ACCC inquiry into the East Coast Gas Market (ACCC 2015)
the AEMC Eastern Australian Wholesale Gas Market and Pipelines Framework Review (AEMC 2016b).
The Gas Market Reform Package aims to achieve a liquid wholesale gas market where an efficient reference price provides signals for investment and new gas supply. It consists of 15 reforms covering four priority areas:
gas supply
market operation
gas transportation
market transparency.
Its recommendations include:
concentrating wholesale gas trading at two primary trading hubs, a northern hub and a southern hub and improving and unifying the designs of the market at each hub
developing a gas transportation capacity market to underpin the new wholesale market design
broadening and improving the quality of market-related information for participants and the public, primarily through a redeveloped Natural Gas Services Bulletin Board
examining whether a new test for determining whether a gas transportation pipeline should be subject to price regulation through a consultation process
implementation of the Energy Council Gas Supply Strategy.
The reduction in the number of east coast wholesale markets from five to two should partially assist in providing additional liquidity and market depth, and make it easier to standardise trading rules.
These benefits will need to be balanced against the potential for costs to increase for market participants (buyers and sellers) that currently trade through the three hubs that are earmarked for closure (Sydney, Adelaide and Brisbane).
The adoption of two hubs raises the issue of possible capacity constraints at the interface of the northern and south parts of the east coast network (at Moomba in South Australia). In the absence of an alternative north–south transmission pipeline (such as Sydney to Brisbane or, if the existing pipeline to Tamworth is upgraded, Tamworth to Brisbane), the AER will need to pay closer scrutiny to the pipeline operators to curb any additional market power conferred by the consolidation.
As part of its gas reform package of 5 May 2017, the COAG Energy Council initiated an AEMC review into the scope of economic regulation applied to gas pipelines. The terms of reference request the AEMC to:
SP 11 – ENERGY (GAS) 129

… make recommendations on any amendments it considers necessary to Parts 8-12 of the NGR [National Gas Rules] to address concerns that pipelines subject to full regulation are able to exercise market power to the detriment of economic efficiency and the long term interests of consumers.
The Review will cover the rules relating to third party access arrangements, the calculation of revenue and prices, non-price terms and conditions of access, and dispute resolution procedures (AEMC 2017c).
The AEMC plans to publish a draft report in February 2018.
Markets have an important role to play in ensuring the effective and efficient provision of gas in Australia. Given the relatively small number of players involved, these markets need to be designed and developed carefully to ensure that they provide participants with appropriate price signals and economic incentives to guide their behaviour.
CONCLUSION 4.2
There has been considerable activity aimed at addressing the problems that have emerged in the east coast gas market.
The AEMC recommendations to improve gas market information are welcome. Timely and reliable information is vital for ensuring that all markets operate efficiently and effectively to guide producer, consumer and investor behaviour.
The Vertigan recommendations to enable more open and consistent access to transmission pipelines also would assist in improving the operation of the market.
Other avenues that have been flagged are worth development.
Vertigan recommended a future review to examine whether the operator of specific gas pipelines have market power and whether the level of regulation is appropriate.
There is also merit in exploring the development of a secondary market for trading spare pipeline capacity as a means of enabling gas to be used where it is valued most highly.
130 PRODUCTIVITY REVIEW

References
ABS (Australian Bureau of Statistics) 2016, Australian National Accounts: Input-Output Tables, 2013-14, 29 June, Cat. no. 5209.0.55.001.
—— (2017, Consumer Price Index, Australia, March 2017, 26 April, Cat. no. 6401.0.
ACCC (Australian Competition and Consumer Commission) 2015, East Coast Gas Inquiry 2015, 23 April.
ACT Government 2016, 2015-16 Minister’s Annual Report, Climate Change and Greenhouse Gas Reduction Act 2010.
AEMC (Australian Energy Market Commission) 2012, Economic Regulation of Network Service Providers, Final Rule Determination, 29 November, ERC0134.
—— (2013, Transmission: Who does what?, 11 April.
—— (2015a, Bidding in Good Faith, Final Rule Determination, 10 December, ERC0166.
—— (2015b, NEM Financial Market Resilience, Final Report, 6 March, EMO0024.
—— (2015c, Supporting Choices for Consumers and Businesses to Manage their Electricity Demand, Final Determination, 26 November, ERC0169.
—— (2016a, 2016 Residential Electricity Price Trends, Final report, 14 December.
—— (2016b, East Coast Wholesale Gas Market and Pipeline Frameworks Review, Stage 2 Final Report, 23 May.
—— (2017a, Distribution Market Model, Draft Report, 6 June, SEA0004.
—— (2017b, Frequency Control Frameworks Review, Terms of Reference, 7 July, EPR0059.
—— (2017c, Review into the Scope of Economic Regulation Applied to Covered Pipelines, Issues Paper, 27 June, GPR0004.
AEMO (Australian Energy Market Operator) 2015, Interconnector Capabilities for the National Electricity Market, September.
—— (2016a, Electricity Statement of Opportunities for the National Electricity Market, 21 September, Version 2.
—— (2016b, Gas Statement of Opportunities for Western Australia, December.
—— (2017a, Black System South Australia 28 September 2016, 30 March.
—— (2017b, Energy Supply Outlook for Eastern and South-Eastern Australia, 17 June.
—— (2017c, Gas Statement of Opportunities for Eastern and South-Eastern Australia, 9 March.
SP 11 – ENERGY (REFERENCES) 131

—— (2017d, Guide to Ancillary Services in the National Electricity Market, April.
AER (Australian Energy Regulator) 2015, State of the Energy Market 2015, www.aer.gov.au/publications/state-of-the-energy-market-reports/state-of-the-energy-market-2015 (accessed 27 April 2017).
—— (2017a, Federal Court Judgement on AER Electricity and Gas Price Decisions Disappointing Outcome for NSW and ACT Consumers, Media Release, 24 May, NR 12/17.
—— (2017b, State of the Energy Market, May 2017, 30 May.
—— (2017c, STTM - Quarterly Prices, D11/2298801[V4], www.aer.gov.au/wholesale-markets/wholesale-statistics/sttm-quarterly-prices (accessed 21 July 2017).
—— (2017d, Trading Intervals Above $5000/MWh (quarterly), D11/2285335[V2], www.aer.gov.au/wholesale-markets/wholesale-statistics/trading-intervals-above-5000-mwh-quarterly (accessed 21 July 2017).
—— (nd, Generation Capacity and Peak Demand, www.aer.gov.au/wholesale-markets/wholesale-statistics/generation-capacity-and-peak-demand (accessed 2 May 2017).
Australian Government 2015, Australia’s 2030 Emissions Reduction Target, Department of Environment and Energy.
BP 2017, BP Statistical Review of World Energy June 2017, June, 66th edition.
Callaghan, M. 2017, Petroleum Resource Rent Tax Review, Final Report, 13 April, Department of the Treasury.
COAG Energy Council 2014, COAG Energy Council Australian Gas Market Vision, 11 December.
—— 2016, COAG Energy Council Meeting Communique, 14 December.
Commonwealth of Australia 2017, National Inventory Report 2015, vol. 1, May.
CSIRO (Commonwealth Scientific and Industrial Research Organisation) 2015, Australian National Outlook 2015, Economic Activity, Resource Use, Environmental Performance and Living Standards, 1970–2050, October.
Data Analysis Australia 2015, Profiles of Power, March, www.daa.com.au/case-studies/profiles-of-power/ (accessed 11 July 2017).
DEE (Department of the Environment and Energy) 2017, Australian Energy Statistics, Table O — Australian Electricity Generation, by Fuel Type, www.environment.gov.au/energy/publications/australian-energy-update-table-o (accessed 30 May 2017).
DIIS (Department of Industry Innovation and Science) 2016a, Australian Energy Update, 2016, October.
132 PRODUCTIVITY REVIEW

—— (2016b, Gas Market Report, www.industry.gov.au/Office-of-the-Chief-Economist/Publications/Pages/Gas-market-report.aspx (accessed 15 May 2017).
—— (2017, Resources and Energy Quarterly, vol. 5, no. 5.
DomGas Alliance 2012, Australia’s Domestic Gas Security.
Finkel, A., Moses, K., Munro, C., Effeney, T. and O’Kane, M. 2016, Preliminary Report of the Independent Review into the Future Security of the National Electricity Market , Preliminary Report, 8 December.
——, ——, ——, —— and —— 2017, Blueprint for the Future: Independent Review into the Future Security of the National Electricity Market, Final Report, 9 June.
GeoScience Australia 2016, Australian Energy Resources Assessment (AERA): Gas, Interim Report, 20 April, www.ga.gov.au/aera/gas (accessed 23 May 2017).
Hawke, A. 2014, Report of the Independent Inquiry into Hydraulic Fracturing in the Northern Territory, Independent Inquiry, 28 November.
Hodgman, W., Rockliff, J. and Harriss, P. 2015, Fracking Moratorium to Continue, www.premier.tas.gov.au/releases/fracking (accessed 23 May 2017).
Horizon Power 2016, 2015-16 Business Report, Annual Report 2015-16, 7 September.
IC (Industry Commission) 1998, Microeconomic Reforms in Australia: A Compendium from the 1970s to 1997, Research Paper, January.
ICRC (Independent Competition and Regulatory Commission) 2017, Standing Offer Prices for the Supply of Electricity to Small Customers from 1 July 2017, Final Report, 7 June.
Noonan, W. 2017, Fracking Banned in Victoria, Giving Certainty to Farmers, Media Release, 7 March.
NSW Government nd, Government Response to the Final Report of the Independent Review of Coal Seam Gas Activities in NSW by the NSW Chief Scientist and Engineer.
O’Kane, P.M. 2014, Independent Review of Coal Seam Gas Activities in NSW, Final Report, 30 September, NSW Chief Scientist & Engineer.
—— nd, NSW Gas Plan.
PC (Productivity Commission) 2013a, Electricity Network Regulatory Frameworks, Inquiry Report.
—— (2013b, National Access Regime, Inquiry Report.
—— (2015, Examining Barriers to More Efficient Gas Markets, Research Paper.
—— (2017, Data Availability and Use, Inquiry Report.
Power and Water Corporation 2016, Annual Report 2015-16, 30 September.
Principal Economics 2015, Electricity Production Subsidies in Australia, Policy Paper, August, Minerals Council of Australia.
SP 11 – ENERGY (REFERENCES) 133

PwC (PricewaterhouseCoopers) 2016, Electricity market issues in South Australia: Analysis of an interconnector between New South Wales and South Australia, August.
Roberts, A. 2015, NSW Gas Plan PEL Buy-Back Scheme, Media Release, 1 October.
South Australian Government 2017, South Australian Energy Plan.
TransGrid 2016, Pricing Methodology 2018-19 — 2022-23 Stakeholder Consultation, TransGrid.
—— 2017, Pricing Methodology, 2018-19 to 2022-23, January.
—— nd, Pricing Methodology 2015-16 – 2017-18 (effective 1 July 2016).
Turnbull, M. 2017a, Gas Supply, Media Release, 19 April.
—— 2017b, Securing Australia’s Energy Future with Snowy Mountains 2.0, Media Release, 16 March.
——, Frydenberg, J. and Canavan, M. 2017b, Press Conference with The Hon. Josh Frydenberg MP, Minister for the Environment and Energy and Senator The Hon. Matt Canavan, Minister for Resources and Northern Australia, Press Conference, 20 June, www.pm.gov.au/media/2017-06-20/press-conference-hon-josh-frydenberg-mp-minister-environment-and-energy-and-senator.
VAGO (Auditor-General) 2015, Realising the Benefits of Smart Meters, September, 2015-16:8, Victorian Government.
Vertigan, M. 2016, Examination of the Current Test for the Regulation of Gas Pipelines, 14 December.
Vertigan Review (Vertigan, Yarrow and Morton) 2015, Review of Governance Arrangements for Australian Energy Markets, Final Report, 4 December.
WA DSD (Department of State Development) 2016, WA Liquefied Natural Gas Industry Profile, February.
Western Power 2016, Facts and Statistics, 2015-16, 25 November.
Winestock, G. and McDonald-Smith, A. 2017, ‘Ausgrid, Endeavour, AGL, Jemena score win in $5b NSW case’, Australian Financial Review, 26 May.
Yarrow, G. 2017, Energy and Environmental Policy: the GB Experience A Report for the Australian Energy Market Commission, February, Regulatory Policy Institute.
134 PRODUCTIVITY REVIEW