supporting online material for - science acquisition and time-lapse recording was controlled by...
TRANSCRIPT

www.sciencemag.org/cgi/content/full/science.1183415/DC1
Supporting Online Material for
The Onset of Collective Behavior in Social Amoebae
Thomas Gregor, Koichi Fujimoto, Noritaka Masaki, Satoshi Sawai*
*To whom correspondence should be addressed. E-mail: [email protected]
Published 22 April 2010 on Science Express DOI: 10.1126/science.1183415
This PDF file includes:
Materials and Methods Figs. S1 to S10 References
Other Supporting Online Material for this manuscript includes the following: (available at www.sciencemag.org/cgi/content/full/science.1183415/DC1)
Movie S1
Supporting Online Material
Materials and Methods.
Fig. S1, S2, S3, S4, S5, S6, S7, S8, S9, S10.
Mov. S1.
Materials and methods
1. Genetic manipulation and cell culture
A vector containing the cAMP-sensor Epac1camps (1) was kindly provided by Dr. Martin
J. Lohse and Dr. Viacheslav O. Nikolaev (University of Würzburg). The sequence
encodes a cAMP binding domain of human Epac flanked by CFP and YFP. Binding of
cAMP to the sensor protein equilibrates rapidly and can be detected fluorometrically as loss
in FRET-efficiency (1). The entire open reading frame was PCR-amplified and ligated to
the ClaI and XhoI sites in plasmid pA15GFP (2) whereby replacing GFP with Epac1camps
to obtain an expression vector pA15Epac1camps. The construct allows constitutive
expression of Epac1camps in Dictyostelium discoideum under the act15 promoter. The
wildtype axenic strain AX4 and regA- (3) was transformed by electroporation following a
standard protocol (4) and selected clones were isolated for further analysis. Under a
microscope, fluorescence of Epac1camps appears uniform in the cytosol with no apparent
subcellular localization. Expression of full-length Epac1camps was also confirmed by
Western blot using anti-GFP antibody (Clontech). The obtained clonal strains expressing
Epac1camps developed and formed fruiting bodies indistinguishable from its parental strain
AX4. One of these clonal strains was chosen based on the intensity and cell-cell
uniformity of fluorescence and used for detailed analyses. A knock-out strain of the pdsA
gene was prepared by homologous recombination using blasticidine as a selection marker
in the Epac1camps/AX4 background. Cells were grown axenically in modified HL5
medium supplemented with 5% glucose, 40ng/mL vitamine B12, 80ng/mL folic acid, 1x
antibiotic-antimycotic mix (Gibco) and 10�g/mL G418.
1
2. Protein purification and fluorometric measurements
A hexa histidine-tag was inserted directly on the N-terminus of the epac1camps sequence to
obtain pA15His6x-Epac1camps. Typically 1-2x10⁹ Dictostelium discoideum cells
expressing the His6x- Epac1camps were washed and starved for 2hr. The cytosolic fraction
was obtained by nitrogen decompression using a cell disruption vessel (model 4639l, Parr
Instrument) followed by centrifugation. Protein was purified by affinity chromatography
using nickel-sepharose resin (GE Healthcare). Concentrations were determined by
Bradford’s method using immunoglobulin as a standard. The typical yield was 0.4 mg per
1x10⁹ cells. The protein was stored on ice and used within a few days. To obtain
calibration curves, the purified protein mixed with cAMP or
8-Bromoadenosine-3’,5’-cyclic monophosphate (8-Br-cAMP) was excited at 442nm and
emission spectrum from 450nm to 600nm was measured at 22�C using a fluorometer (F-7000, Hitachi). For 8-Br-cAMP incorporation into the cells, washed cells were first
incubated with 10 or 20mM caffeine for 40min. Cells were further incubated with 2mM
DTT (Wako Chemical) and 0 to 20mM 8-Br-cAMP until the FRET signals reach a steady
state (approximately 50 min). Cells were shaken at 22�C during the treatment. For time-lapse recording using the fluorometer, a continuously stirred cell suspension at
2x10⁷cells/mL density was excited every 1min at 425nm and an emission spectrum
between 470 to 530 nm was measured at a scanning speed of 1 nm/msec. To obtain
dosage dependence in the change of FRET efficiency, the fluorescence intensities in images
taken at 475 nm were divided by those from images taken at 525 nm to obtain relative
intensity levels (fig. S3; y-axis). cAMP, 8-Br-cAMP and caffeine were obtained from
Sigma. SQ22536 was obtained from Calbiochem.
3. Perfusion and cAMP stimulation
Vegetative cells were washed and shaken at 2x10⁷ cells/mL in developmental buffer (DB;
10mM K/Na2 phosphate buffer, 1mM CaCl2, 2mM MgCl2; pH 6.5) for 4 to 5h before
2

plating on a glass bottom dish (MatTek, Ashland, MA). Plates were allowed to sit still for
12 minutes while cells attach to the bottom. A chamber insert (35 mm diameter Wilco,
Warner Instruments) mounted onto the dish using silicone grease (Dow Corning) served as
perfusion device with a suction pump attached to the outlet. Two communicating syringe
pumps (NE-1000X dual, New Era Pump Systems Inc., Wantagh, NY) attached to the inlet
provided a constant influx of DB over a period of up to 2 hours. The chamber has a
circular surface of 13 mm diameter with an average fluid volume of 0.25 ml. For cAMP
stimulation, a gravity flow system with pinch valves (Warner Instrument) and C-tube
fittings were used. Micropipette stimulations were performed by applying a method used
for chemotaxis studies (5). A glass needle filled with 10�M cAMP and 0.1�g/�lAlexa594 was moved to the field of view by a motorized micromanipulator (NKII;
Eppendorf) and pressurized at 80hPa using an injector (FemtoJet; Eppendorf). To remove
the stimulus, pressure was released and the pipette was moved approximately 5mm away
from the field of view.
4. Image Acquisition
Cells were observed at 22�C under an inverted epifluorescence microscope (IX81 Olympus, Japan) equipped with a Xenon lamp, an automated stage (Sigma Koki, Japan),
filter wheels (Ludl) and oil immersion lenses (20x UplanSApo NA 0.85 and 60x PlanApoN
NA 1.42; Olympus). For FRET measurements, 435nm excitation filter (BP425-445HQ;
Olympus) and 460-510nm (BA460-510HQ; Olympus) and 515-560nm (BA515-560HQ;
Olympus) bandpass filters were used to detect fluorescence from CFP and YFP
respectively. A dichroic mirror (DM450) separated emission from excitation. The
fluorescent and transmitted light images were captured with a depth of 16 bit by a 512x512
pixels using an Electron Multiplying CCD (EMCCD) camera (Photometrix, Tucson, AZ).
To minimize photodamage to the cells, neutral density filters were used to reduce the light
intensity, and the exposure time was limited to 10-15 ms for 60x objective lens and 30-50
ms for 20x objective lens. Images were taken at 4 to 30s intervals for total durations of
0.5h to 20h. CFP and YFP images were taken in succession at approximately 200ms
3
interval. Data acquisition and time-lapse recording was controlled by Metamorph
software (Universal Imaging, Media, PA). For small population observation (Fig. 1),
washed cells were suspended at a density of ~108 cells/ml and a drop of <1 �L was spotted onto a surface of hydrophogic agar (6) using a microloader (Eppendorf), resulting in a total
of 100-200 cells in a circular spot of ~400 �m in diameter.
5. Data analysis
Image analyses were performed using ImageJ (National Institutes of Health, Bethesda,
Maryland) and custom plugins programmed in JAVA; or with MATLAB (MathWorks,
Natwick, MA) and custom routines therein. Acquired images were binarized and cell
masks were generated, representing regions of interest that correspond to individual cells or
groups of cells. Changes in FRET-efficiency during cAMP-induced cAMP response occur
uniformly in the cytosol without apparent spatial heterogeneities. The fluorescence
intensity was averaged for individual cell masks to reduce noise, and the ratio of the CFP-
and YFP- channels was calculated. To obtain a time-series, the mean of the first 10 time
points was subtracted from the ratio which typically yields values between 0 and 0.1. To
extract data from individual cells at high cell densities, we used custom-made cell tracking
programs. When two or more cells met they were sorted by manual inspection. Pulsing
rates were obtained by manual counting. In order to evaluate the relative output of an
isolated cell for a given input stimulus over a time period T, we computed the time-integral
of I485/I540 given by
Icyt.cAMP (T) �1T
I485(t) /I540(t)dt0
T� ,
where the stimulus is applied at t = 0. The input-output relation (Fig. 3C) was obtained
from these datasets (fig. S9).
6. Verification of Epac-based FRET observation of cytosolic cAMP changes.
The Epac-based cAMP sensor combined with time-lapse fluorescence microscopy allows
direct measurements of cytosolic cAMP in Dictyostelium discoideum. Under a submerged
4

condition, cells starved for 3 to 7 hours show synchronized oscillations of cytosolic cAMP
at 6 to 7 minutes period at a monolayer cell density (fig. S1A). The period becomes
longer (10 to 20 minutes) as cell density is lowered (fig. S2 left panels). Concomitant
shifts in the signals from the YFP- and CFP- channels signify changes in FRET-efficiency
(fig. S1A). The peaks appear as loss of FRET (the fluorescence from CFP increases
relative to that from YFP) in accordance with the expected rise in cAMP. Figure S1B
shows that the phase of the oscillations can be entrained by pulsatile application of
extracellular cAMP; a well-known behavior resulting from the cAMP-induced cAMP
production (cAMP relay response). The oscillations are not observed in strains expressing
CFP or YFP only (data not shown), indicating that oscillations are not provoked by other
physiological factors such as cytosolic pH which could result in spectral changes in CFP or
YFP alone.
The population-level behavior can be studied quantitatively for cells suspended in buffer
using a fluorometer (fig. S1C; see section 2). Using this setup, we checked that the
observed changes in FRET efficiency reflect changes in the level of cytosolic cAMP.
Dictyostelium discoideum has three enzymes that convert ATP to cAMP - adenylyl
cyclases ACA, ACB and ACG each developmentally regulated with distinct roles (7) in the
life-cycle. ACA is a plasma membrane bound adenylyl cyclase expressed during the first
7 hours of development. It is indispensable for the oscillations and waves (8). When
SQ22536, a specific inhibitor of ACA (7), is applied at 1 to 2mM, the oscillations of
cytosolic cAMP cease (fig. S1D). Treatment with 10mM caffeine, which also inhibits
adenylyl cyclase activity in Dictyostelium (7), had a similar effect (fig. S1E). We also
confirmed that the lowering of FRET-efficiency upon cAMP stimulation is due to synthesis
of cytosolic cAMP by ACA. When cells are treated with 2 mM SQ22536 or 10 mM
caffeine, the cAMP-induced response is diminished significantly (figs. S1F and S1G).
Together, these observations confirm that the periodic changes in the FRET efficiency is
due to changes in the level of cytosolic cAMP.
7. Estimation of the cytosolic cAMP levels.
5
From fluorometric measurements of cell suspensions we can obtain a quantitative and
reliable estimate of the FRET efficiency change in a population. Here we employ this
setup to estimate the absolute concentration of cytosolic cAMP. To determine the
minimum and maximum of the sensor’s dynamic range in the cytosol, cells were either
inhibited from synthesizing cAMP or saturated with membrane permeable cAMP analogue.
Specifically, to inhibit adenylyl cyclase, cells were treated for 40 min with 10 to 20 mM
caffeine (fig. S1E), resulting in maximal reduction of the relative cytosolic fluorescence
intensities (I475/I525). The caffeine treated cells were then allowed to incorporate
8-Br-cAMP - a cell permeable analogue of cAMP - at various concentrations in the
presence of DTT. After the loading has reached a steady state (at about 50 min, as judged
by the changes in FRET efficiency) the new fluorescence level of the cell suspsension was
measured using a fluorometer (see section 2). The relative intensity obtained from the
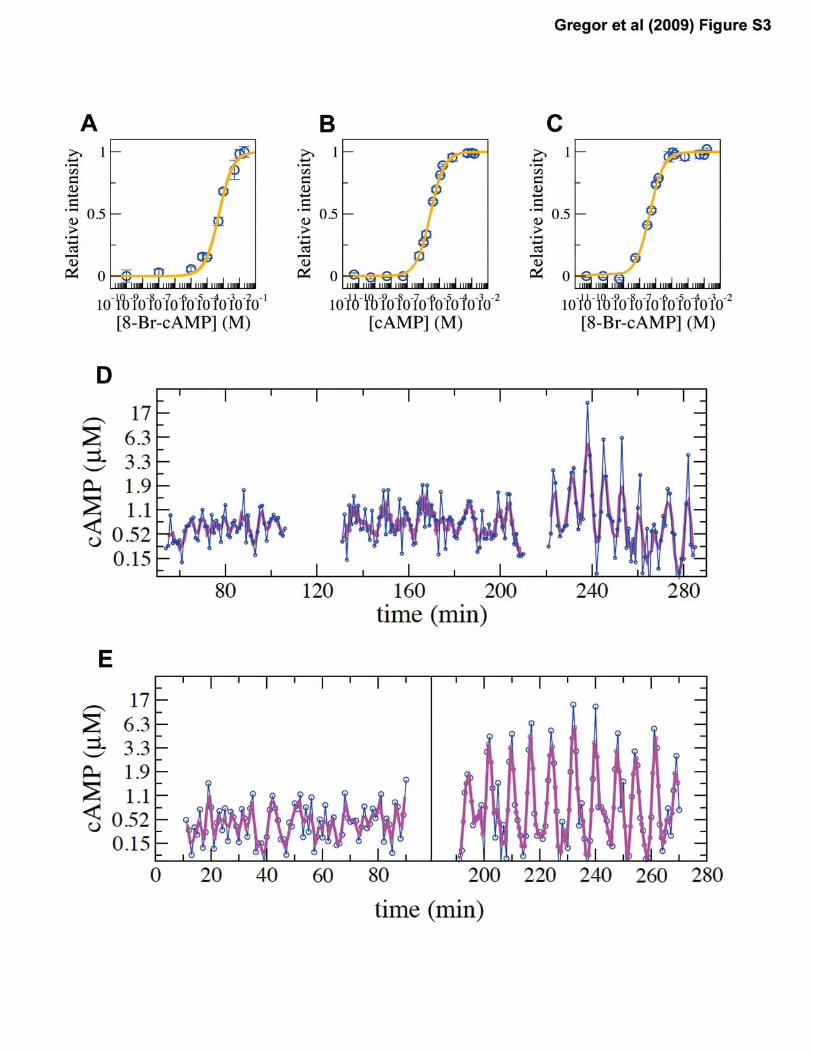
spectra can be fitted by a binding curve (yellow line) with the half-maximal change
occurring at 0.48 (�0.09) mM 8-Br-cAMP (fig. S3A). The binding curve is comparable to the curves of purified Epac1camps protein for both cAMP and 8-Br-cAMP (fig. S3B and
S3C; yellow lines). Under our conditions, the sensor protein has EC50 values of 2.55
(�0.19) �M for cAMP (see also (1); 2.4 �M) and 0.40 (�0.07) �M for 8-Br-cAMP. Figs. S3A and S3C reveal that the amount of 8-Br-cAMP in the cytosol is roughly 3 orders of
magnitude lower than in the extracellular medium, possibly due to low permeability and
intracellular degradation of 8-Br-cAMP.
Apart from differences in the EC50 values, the three dosage dependence curves (fig. S3A-C)
follow the same sigmoidal function. This implies that the expected dosage dependence of
the fluorescent probe for cAMP in live cells should follow the same curve as the one
obtained for 8-Br-cAMP (fig. S3A) except that it should be shifted to match the EC50 value
for cAMP. By assuming that the EC50 for cAMP is the same in vitro and in vivo, we can
esitmate the sensor’s dynamic range in live cells by knowing the maximal (no 8-Br-cAMP
loading) and the minimal FRET efficiency (8-Br-cAMP loading to saturation) in caffeine
treated cells.
6

The relative fluorescence intensity of the cell suspension I(t) at time t depends on the
absolute cytosolic cAMP concentration ([cAMP]cyt), given by
I(t) �Imax � Imin )� [cAMP]cyt
(EC50 [cAMP]cyt ) Imin .
Here, the relative intensity measured for caffeine treated cells with or without 20mM
8-Br-cAMP are substituted as Imax and Imin respectively. Figures S3D and S3E show two
representative time-series where the y-axis now indicates the absolute level of cytosolic
cAMP obtained by inverting the above equation. The average cytosolic cAMP levels
during the first 2 hours of development remain relatively unchanged (fig. S3, D and E).
The basal level of cytosolic cAMP during the first 4 hours of development is approximately
400nM on average, and the cytosolic cAMP pulses peak between 5 and 20 �M (fig. S3, D and E). These measured peak concentrations are comparable to the levels of intracellular
cAMP measured previously by isotope dilution assays (9). However, we also detect basal
levels that are slightly lower than the ones reported in earlier measurements which were
between 400 nM to 2 �M (10, 11). Possibly additional cAMP resides in intracellular vesicles (12) which is not detected here. Nonetheless, the current estimate suggests that a
large fraction of the intracellular pool of cAMP is in the cytosol, which is in good
agreement with earlier reports (13).
8. Derivation of Phase equation
In order to understand the onset of the synchronized oscillations, we use a mathematical
model that can quantitatively capture the relationship between the dynamics at the
single-cell level and that of the population. We first introduce the equations that simulate
the pulsatile response of isolated cells to external stimuli (Fig. 3) by following a framework
of phase dynamics (14). Subsequently we will couple these equations with the aim to
7

obtain predictions for the cells’ population behavior.
In a population of NC cells, the level of cytosolic cAMP in the i–th cell can be
approximated by the phase of the oscillations following
cAMP� �cyt,i ��Amax Abas� sin�i Amax Abas
2 (eq. S1),
where Amax=20�M and Abas=0.4�M indicate the maximum and the minimum concentrations, respectively (see section 7). According to Winfree’s theory (14-16), the phase equation
for excitable and oscillatory elements take the form of
d�i
dt= � 1 � � �i� �
which describes a response of a cell to a perturbation �������(�) is the phase response curve (14) that defines whether, upon perturbation, the phase will advance or will be delayed
depending on the state of the current oscillation. For the cAMP signaling response in
Dictyostelium, the phase response curve has been well described in the form of �(�) �
-sin�� (17). A model equation can thus be written as follows;
d�i
dt= � 1� � cAMP� �ext� cexcitesin�i� �i (eq. S2),
where 2����=1/6 (min-1) represents the intrinsic frequency (Fig. 3, D and E), and [cAMP]ext
is the level of extracellular cAMP. Here, we adopt changes in the cytosolic cAMP level as
the perturbation with respect to the extracellular cAMP level by taking �(y) = K/(y + K) (K= 400pM; Fig. 3C). In its current structure, this formulation defines only the
dose-dependence. In order to describe the reaction rate, we introduced a proportionality
constant cexcite which can be determined by fitting the input-output relation to the single cell
8

data from Fig. 3C using the expression
Icyt.cAMP (T ) � 1T
[cAMP]cyt (t)dt0
T�,
where the stimulus is applied between t = 0 and T = 3 min (see fit in fig. S6B, and also
section 5). This is done numerically after substituting eq. S2 into eq. S1. Lastly, the
noise term �i was fit by Gaussian white noise (|�i| = 0.002) so that spontaneous firings occur at a very low rate (~ 0.0007/min at [cAMP]ext = 0), as observed experimentally in
well-isolated cells (fig. S4). Converting this noise magnitude to a corresponding level of
cAMP using the Wiener-Khinchin theorem, we see that fluctuations of 3.5% is added to the
basal cytosolic cAMP level (i.e. 400nM � 14nM), which is below the resolution of our measurements. Note that the addition of noise of this magnitude would increase
extracellular cAMP only by ~0.07pM (see eq. S3 below). Without excitable dynamics, the
noise term does little to increase the concentration of extracellular cAMP and is insufficient
to generate the spontaneous cytosolic cAMP pulses.
The level of extracellular cAMP in a perfusion chamber under a well-mixed condition is
determined by secretion and dilution. Assuming that secretion follows first-order kinetics
at a rate csec per cell (18, 19),
�
d cAMP� �ex ( rx)dt
= csec cAMP� �cy,i �k
VT
cAMP� �ex ( rx) rx �cell�
d cAMP� �ex ( rx)dt
= �k
VT
cAMP� �ex ( rx) rx �cell�
�
���
���
where x denotes a position vector, k is the dilution rate (ml/min) and VT is chamber volume. By taking the spatial average of the extracellular and intracellular variables over
the chamber volume, we rewrite Eq. 1 with a more explicit representation for the effective
synthesis term r;
9
d cAMP� �ext
dt� � STVC
VT SC
csec cAMP� �cyt� k
VT
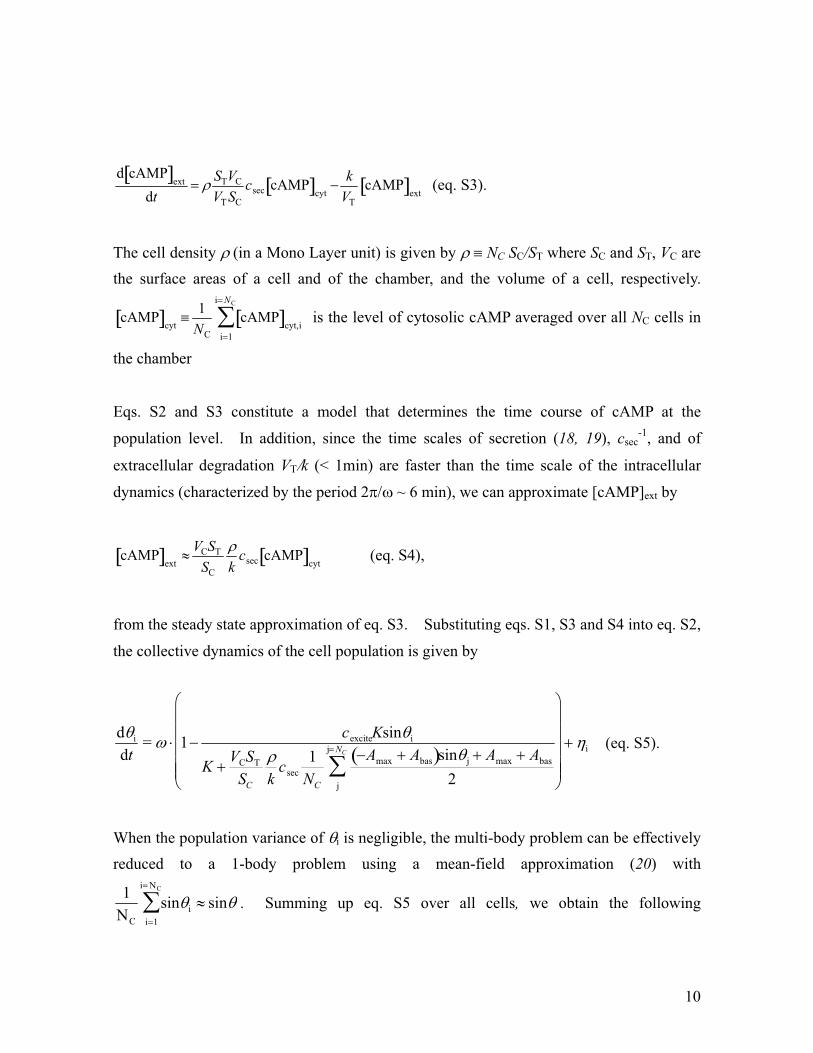
cAMP� �ext(eq. S3).
The cell density ��(in a Mono Layer unit) is given by � � NC SC/ST where SC and ST, VC are the surface areas of a cell and of the chamber, and the volume of a cell, respectively.
cAMP� �cyt� 1
NC
cAMP� �cyt,ii�1
i� NC
� is the level of cytosolic cAMP averaged over all NC cells in
the chamber
Eqs. S2 and S3 constitute a model that determines the time course of cAMP at the
population level. In addition, since the time scales of secretion (18, 19), csec-1, and of
extracellular degradation VT k (< 1min) are faster than the time scale of the intracellular
dynamics (characterized by the period 2� � ~ 6 min), we can approximate [cAMP]ext by
cAMP� �ext! VCST
SC
�k
csec cAMP� �cyt (eq. S4),
from the steady state approximation of eq. S3. Substituting eqs. S1, S3 and S4 into eq. S2,
the collective dynamics of the cell population is given by
d�i
dt= � 1�
cexciteKsin�i
K VCST
SC
�k
csec1
NC
�Amax Abas� sin� j Amax Abas
2j
j� NC
�
"�
#�
$�$�$�$�$�
%�
&�
'�'�'�'�'�
�i (eq. S5).
When the population variance of �i is negligible, the multi-body problem can be effectively reduced to a 1-body problem using a mean-field approximation (20) with
1NC
sin�ii�1
i� NC
� ! sin� . Summing up eq. S5 over all cells, we obtain the following
10

mean-field model for the population
d�dt
� � 1�cexciteKsin�
K VCST
SC
�k
csec�Amax Abas� sin� Amax Abas
2
"�
#�
$�$�$�$�
%�
&�
'�'�'�'�
(eq. S6).
Together with eqs. S1 and S4, the 1-variable equation simulates the dynamics of both
[cAMP]cyt and [cAMP]ext.
Lacking an amplitude equation, this model cannot display damping of the cytosolic cAMP
oscillations as observed in Fig. 3A and 3B. Instead, the present model is designed to
simulate the minimal excitable/oscillatory switch necessary to understand the onset of the
synchronized oscillations (Fig. 4).
9. Estimation of cAMP outputs and model validation
Here we compare the simulated levels of cAMP synthesis and secretion by the above
chosen parameters to earlier biochemical measurements (8, 9, 21, 22). At the onset of the
synchronized oscillations, [cAMP]cyt is at a basal level of ~400 nM, as determined by the
fluorometer experiments described above. From Fig. 2C, �/k�(10-3 and hence, using the steady state approximation of eq. S4,
cAMP� �ext !�k
VCST
SC
csec cAMP� �cyt ~ 3 (pM) (eq. S7)
is the minimum level of extracellular cAMP required to invoke a synchronized pulse (VC =
1.1x10⁻¹² l, ST = 1.33 cm2 and SC = 1.3x10⁻⁶ cm2). Here we have chosen a secretion rate
per cell of csec = 3.6 (min-1) which is higher than the earlier reported value of ~1 (min-1)
(18, 19) to fit our experimental data (fig. 4B). This adjustment can be justified
11
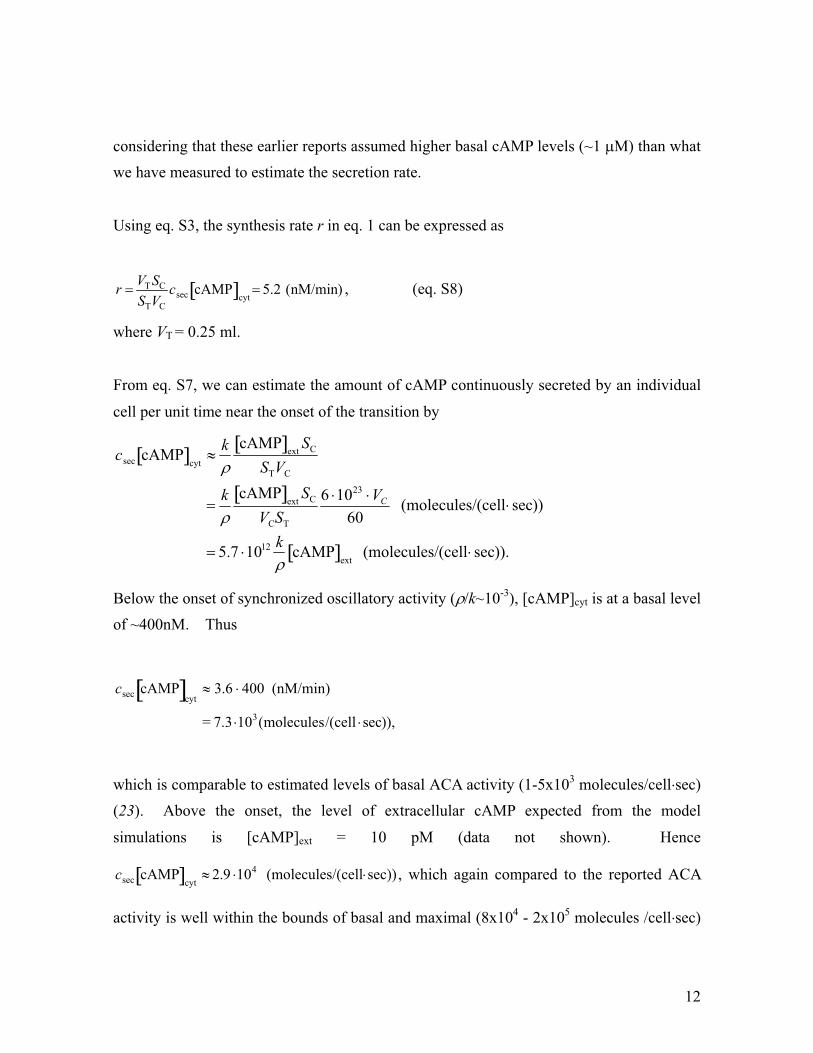
considering that these earlier reports assumed higher basal cAMP levels (~1 �M) than what we have measured to estimate the secretion rate.
Using eq. S3, the synthesis rate r in eq. 1 can be expressed as
r � VT SC
STVC
csec cAMP� �cyt� 5.2 (nM/min) , (eq. S8)
where VT = 0.25 ml.
From eq. S7, we can estimate the amount of cAMP continuously secreted by an individual
cell per unit time near the onset of the transition by
csec cAMP� �cyt!
k�
cAMP� �ext SC
STVC
�k�
cAMP� �extSC
VCST
6 1023 VC
60 (molecules/(cell sec))
� 5.7 1012 k�
cAMP� �ext (molecules/(cell sec)).
Below the onset of synchronized oscillatory activity (� k~10-3), [cAMP]cyt is at a basal level of ~400nM. Thus
csec cAMP� �cyt! 3.6 400 (nM/min)
= 7.3 103(molecules/(cell sec)),
which is comparable to estimated levels of basal ACA activity (1-5x10³ molecules/cell sec) (23). Above the onset, the level of extracellular cAMP expected from the model
simulations is [cAMP]ext = 10 pM (data not shown). Hence
csec cAMP� � ! 2.9 104 (molecules/(cell sec))cyt
, which again compared to the reported ACA
activity is well within the bounds of basal and maximal (8x10⁴ - 2x10⁵ molecules /cell sec)
12
cAMP levels (8, 21). At higher � k (~ 10-1), i.e. when the period levels off at 6 min, simulated extracellular cAMP oscillates in the nanomolar range (Fig. 4A; 1/3ML) which
agrees with the level of extracellular cAMP oscillations in a dense population (9, 22).
Together, these estimations confirm that the amount of secreted cAMP, as simulated by our
model parameters, agree well with the earlier biochemical studies.
10. Numerical calculations
Numerical calculations of the model were implemented by 4th-order Runge-Kutta method
in C language. The numerical input-output relation (fig. S6B) is computed using eqs. S1
and S2. Time courses for [cAMP]cyt and [cAMP]ext (Fig. 4A and 4C and fig. S6C) are
sequentially calculated from eqs. S5 and S1. The frequency of [cAMP]cyt oscillations
(Fig. 4B) is calculated numerically after the system has reached steady state. The blue and
grey squares in Fig. 4B are obtained from numerical calculations using eq. S5 with noise
strengths of |�i|=0.002 and |�i|=0, respectively.
13
Supporting Figures
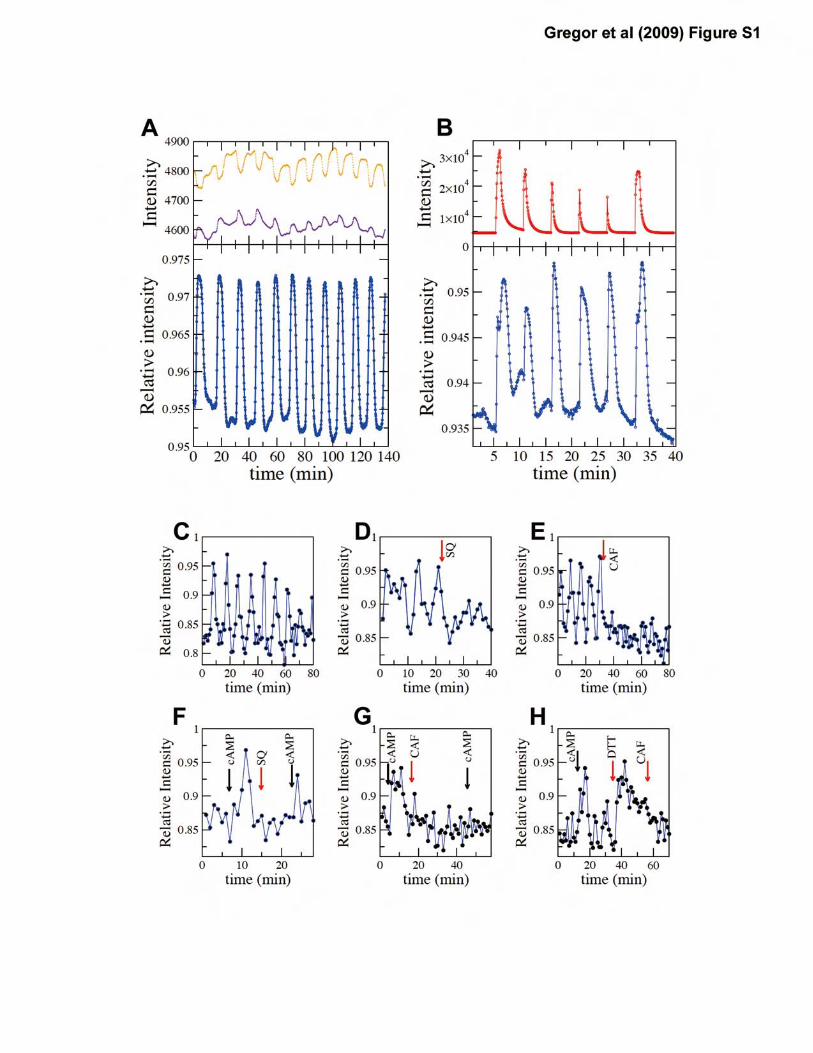
Figure S1: Epac1camps serves as an indicator for cytosolic cAMP in Dictyostelium discoideum.
Synchronized oscillations are observed in cells starved for 3 to 7 hours. (A) A representative data
taken from ~65 cells in a monolayer of cells submerged in developmental buffer. Upper panel:
average fluorescence intensities of CFP-channel and YFP-channel are shown in violet and orange
respectively. Lower panel: the ratio of average fluorescence intensities in the CFP and YFP
channel. (B) The oscillations can be entrained (lower panel) by pulsatile application of
extracellular cAMP (upper panel). (C-E) The periodic behavior is also observed in suspended
cells. The synchronized oscillations are suppressed by (D) 10mM SQ22536 (SQ) and (E) 10mM
caffeine (CAF). (F-H) 10�M cAMP was applied at times indicated by black arrows. The
cAMP-induced response is suppressed by (F) 10mM SQ22536 or (G) 10mM caffeine. (H)
Addition of 2mM DTT also elicits transient increase in cytosolic cAMP. Fluorescence intensities
were recorded under a microscope (A-B) or by a fluorometer (C-H). The cell density is at
2x10⁷cells/ml for (C-H).
Figure S2: Spontaneous oscillations in intact populations require extracellular PDE. Cells had
been starved for 4h and washed for 3 min by perfusion before time-lapse imaging begins at t=0.
Left panels show the typical periodic firing events observed in submerged conditions. In
experiments shown in the right column, DTT is added at t = 1 min. Cell densities are 1/2 ML (2
upper rows) and 1/4 ML (lowest row). When DTT is applied to inhibit extracellular
cAMP-phosphodiesterase (PDE) (24), cells respond with a transient rise in cytosolic cAMP
followed by a slow relaxation to the basal level (right panels; also fig. S1H). This behavior can be
attributed to elevated levels of extracellular cAMP due to inhibition of PDE, consistent with a
similar observation based on isotope dilution (24). Secretion of cAMP therefore appears to be
occurring regardless of whether the cells are pulsing or not (19). Note that the time it takes for the
elevated cytosolic cAMP to return to the basal level is very long (>20 min). In addition, the
average cytosolic cAMP level in individual cells remains elevated when cells are continuously
exposed to micromolar cAMP concentrations (Fig. 3B). It appears that extracellular cAMP is still
degraded albeit very slowly under the presence of DTT.
14
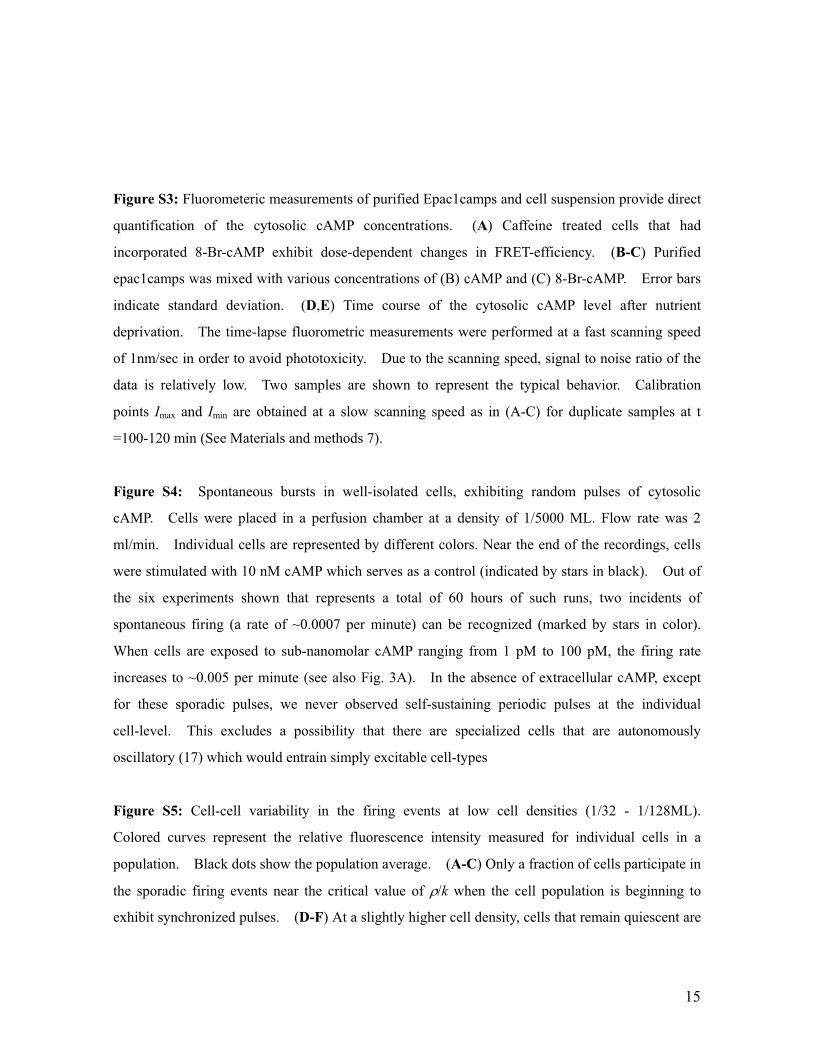
Figure S3: Fluorometeric measurements of purified Epac1camps and cell suspension provide direct
quantification of the cytosolic cAMP concentrations. (A) Caffeine treated cells that had
incorporated 8-Br-cAMP exhibit dose-dependent changes in FRET-efficiency. (B-C) Purified
epac1camps was mixed with various concentrations of (B) cAMP and (C) 8-Br-cAMP. Error bars
indicate standard deviation. (D,E) Time course of the cytosolic cAMP level after nutrient
deprivation. The time-lapse fluorometric measurements were performed at a fast scanning speed
of 1nm/sec in order to avoid phototoxicity. Due to the scanning speed, signal to noise ratio of the
data is relatively low. Two samples are shown to represent the typical behavior. Calibration
points Imax and Imin are obtained at a slow scanning speed as in (A-C) for duplicate samples at t
=100-120 min (See Materials and methods 7).
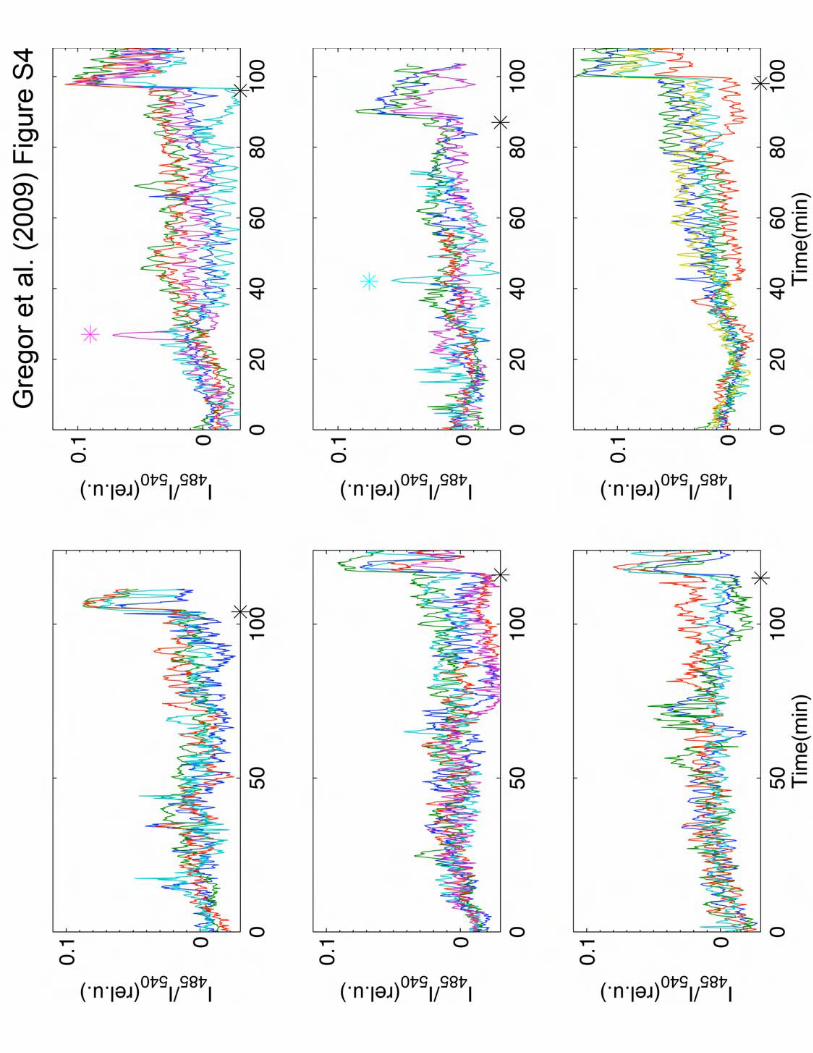
Figure S4: Spontaneous bursts in well-isolated cells, exhibiting random pulses of cytosolic
cAMP. Cells were placed in a perfusion chamber at a density of 1/5000 ML. Flow rate was 2
ml/min. Individual cells are represented by different colors. Near the end of the recordings, cells
were stimulated with 10 nM cAMP which serves as a control (indicated by stars in black). Out of
the six experiments shown that represents a total of 60 hours of such runs, two incidents of
spontaneous firing (a rate of ~0.0007 per minute) can be recognized (marked by stars in color).
When cells are exposed to sub-nanomolar cAMP ranging from 1 pM to 100 pM, the firing rate
increases to ~0.005 per minute (see also Fig. 3A). In the absence of extracellular cAMP, except
for these sporadic pulses, we never observed self-sustaining periodic pulses at the individual
cell-level. This excludes a possibility that there are specialized cells that are autonomously
oscillatory (17) which would entrain simply excitable cell-types
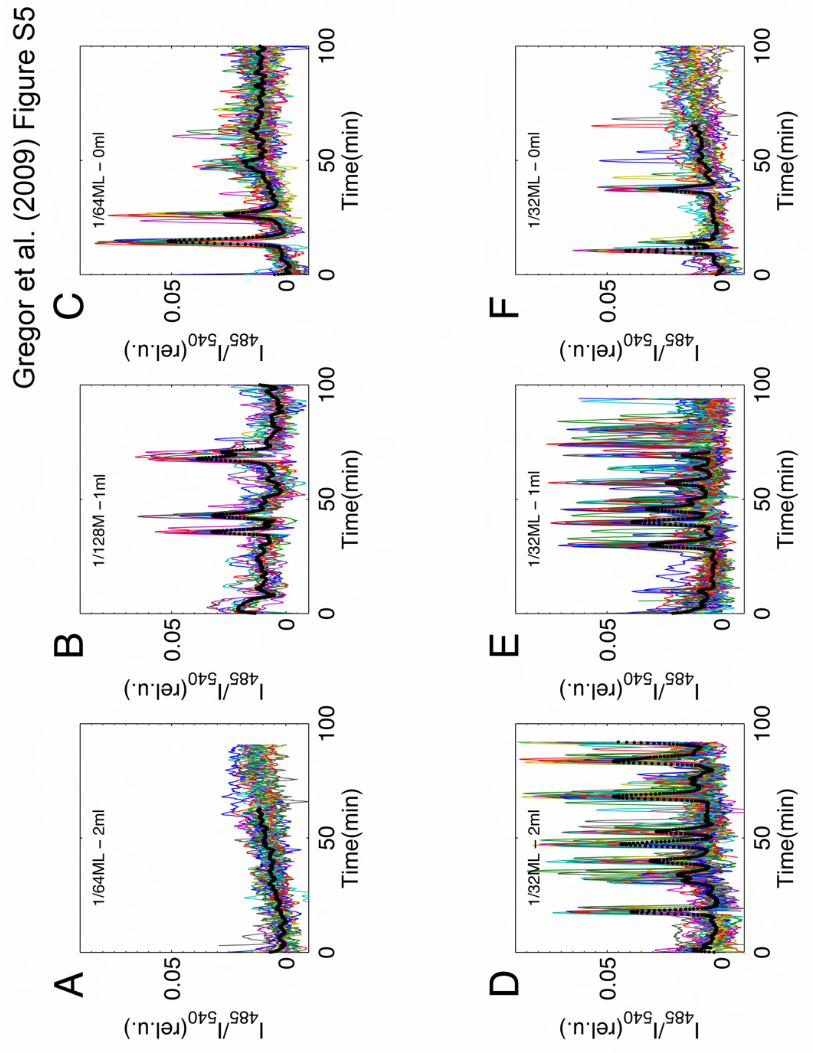
Figure S5: Cell-cell variability in the firing events at low cell densities (1/32 - 1/128ML).
Colored curves represent the relative fluorescence intensity measured for individual cells in a
population. Black dots show the population average. (A-C) Only a fraction of cells participate in
the sporadic firing events near the critical value of �/k when the cell population is beginning to
exhibit synchronized pulses. (D-F) At a slightly higher cell density, cells that remain quiescent are
15
still present even though pulses appear more frequently. Cell densities are (A,C) 1/64ML, (B)
1/128ML and (D-F) 1/32 ML. Flow rate is (A,D) 2ml/min, (B,E) 1ml/min and (C,F) 0ml/min. Note
that only a sub-population of cells pulsed and that they are not well synchronized. Such behavior
is in marked contrast to periodic pulses observed at higher cell densities where they appear
significantly more uniform and synchronized (see Fig. 1C).
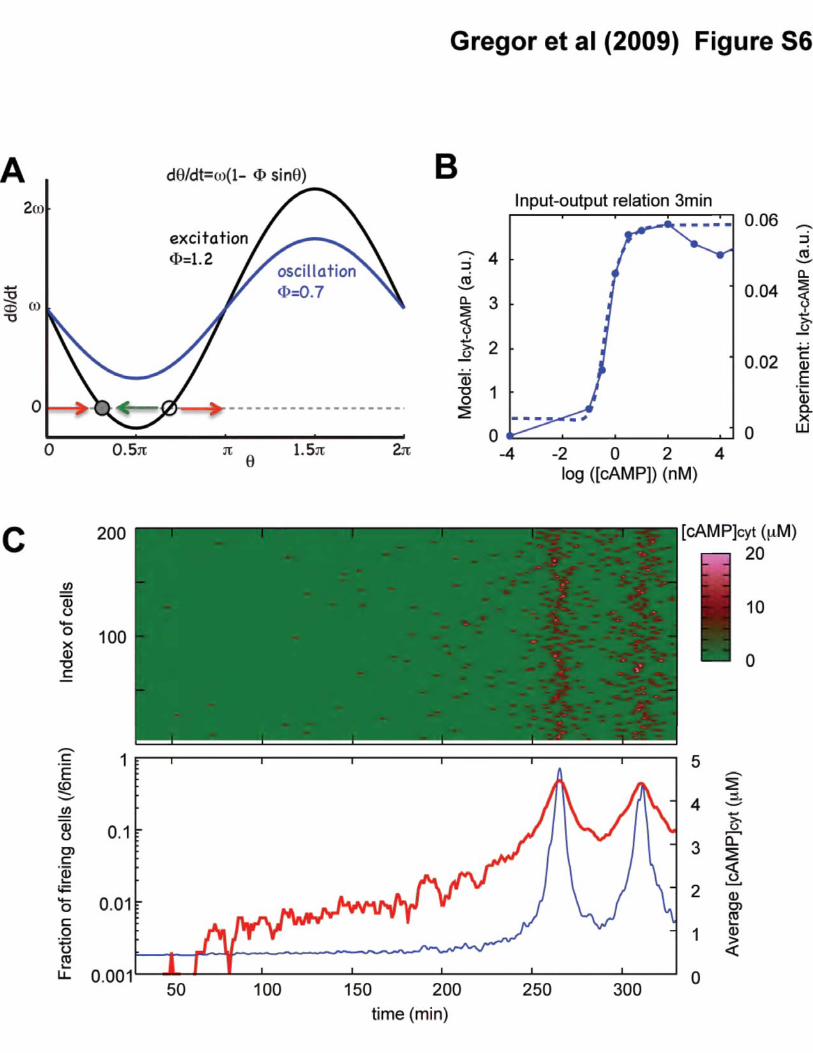
Figure S6: A phase model for the cytosolic cAMP dynamics. (A) A basic equation d�/dt =
� (1-� sin� illustrates how excitation switches to oscillations in the model (eq. S2). Above � =
1, a pair of stable (filled circle) and unstable (open circle) fixed points exist (black line shown for �
= 1.2). When perturbation is small, the system is not excited (green arrow). However, when
perturbation of sufficient magnitude is applied, the oscillator passes through the unstable fixed point
and rotates around a ring once before returning to the stable fixed point (red arrows).
Oscillations appear when � < 1, since d�/dt is positive for an arbitrary �� indicating continuous
increase in phase (black line for � = 0.7). (B) The input-output relation computed for a single
oscillator (eqs. S1 and S2) (dashed line) and the corresponding relation from the experiments (solid
line; from Fig. 3C). The parameters are Amax = 20�M and Abas = 0.4�M, K = 400pM, ����)�/6
(1/min) and cexcite=1.01. By chosing these parameters, the model serves as an automaton that
simulates the pulsatile output of cAMP by an isolated cell for a given input of extracellular cAMP.
(C) Discrete firing events by the individual cells (red dots) show how the synchronized oscillations
arise from stochastic pulsing (upper panel; 200 representative cells are plotted). Color in upper
panel indicates cytosolic cAMP level of individual cells. The percentage of cells that fire
simultaneously increases as extracellular cAMP concentration rises (red line in lower panel), further
promoting synchronous firing by an even larger fraction of cells which in turn adds to the
extracellular cAMP level. This chain reaction finally gives rise to synchronous firing of the entire
population (observed at 270 min; �/k=10-2.8 and NC= 1000). Blue line in lower panel indicates
average cytosolic cAMP concentrations.
Figure S7: cAMP signal propagates in wave-like manner in small populations. Plotted below
each time window from Fig. 1B is a representation of the cell population where the different regions
are color-coded according to their respective pulsing times. At time zero, the first region pulsed,
16

corresponding to the left-most signal trace in the top row and to the black region in the bottom row.
The longer it took for a region to pulse after that initial pulse, the lighter the color in the bottom
row.
Figure S8: Stimulation experiments. (A, B) Individual cells responding to repetitive stimuli at 4
min (A) and 15 min (B) intervals. Stimuli are all at 10 nM for 1 min. The gray shaded regions
indicate stimulus application; in white regions buffer is perfused without addition of cAMP stimulus.
Cells were separated from each other by at least 1mm. The flow rate was 4 ml/min.
Figure S9: Representative data used to obtain the input/output relation in Fig. 3C. (A-C)
cAMP-induced cytosolic cAMP signaling response. Representative time courses for isolated cells
in a perfusion chamber. Cells are represented by different colors. The concentration of
extracellular cAMP was changed at time points indicated by dashed lines.
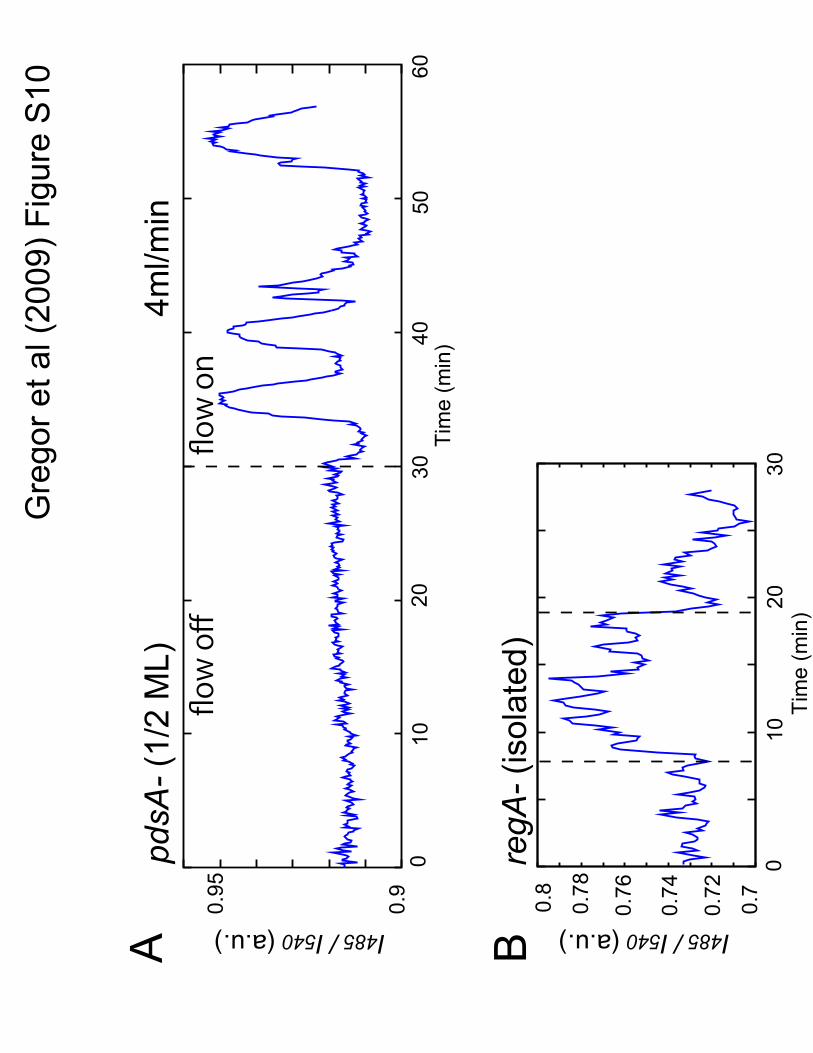
Figure S10: Deletion of extracellular and intracellular PDEs. (A) Cells that do not produce
extracellular PDE (pdsA-) are unable to oscillate synchronously without assisted removal of
extracellular cAMP by perfusion (in contrast to the wild type cells in fig. S1A). Dashed line
indicates time when washing with buffer at a rate of 4mL/min began (cell density; 1/2ML). (B)
Isolated regA- cells exhibit the cell-intrinsic rhythmic activity when continuously stimulated by a
glass needle filled with 10�M cAMP (Materials and methods 3). Dashed lines indicate time of
application and removal of the stimulus.
Supporting References
1. V. O. Nikolaev, M. Bunemann, L. Hein, A. Hannawacker, M. J. Lohse, J Biol
Chem 279, 37215 (2004).
2. P. Fey, K. Compton, E. C. Cox, Gene 165, 127 (1995).
3. P. Thomason et al., EMBO J 17, 2838 (1998).
4. W. Nellen, C. Silan, R. A. Firtel, Mol. Cell. Biol. 4, 2890 (1984).
17
18
5. X. Xu, M. Meier-Schellersheim, J. Yan, T. Jin, J Cell Biol 178, 141 (2007).
6. T. M. Konijn, Experientia 26, 367 (1970).
7. E. Alvarez-Curto, K. E. Weening, P. Schaap, Biochem J 401, 309 (2007).
8. H. Patel et al., EMBO J. 19, 2247 (2000).
9. G. Gerisch, U. Wick, Biochem. Biophys. Res. Commun. 65, 364 (1975).
10. C. P. Klein, FEBS Lett. 68, 125 (1976).
11. M. B. Coukell, F. K. Chan, FEBS Lett. 110, 39 (1980).
12. P. W. Kriebel, V. A. Barr, E. C. Rericha, G. Zhang, C. A. Parent, J Cell Biol 183,
949 (2008).
13. C. D. Schoen, J. C. Arents, T. Bruin, R. van Driel, Exp. Cell Res. 181, 51 (1989).
14. A. T. Winfree, in The geometry of biological time (Biomathematics series).
(Springer-Verlag, New York, 1980).
15. Y. Kuramoto, Chemical Oscillations, Waves, and Turbulence. (Springer, Berlin,
1984).
16. E. M. Izhikevich, in Dynamical Systems in Neuroscience: The Geometry of
Excitability and Bursting, Chapter 10, Synchronization. (MIT Press, Cambidge,
2007).
17. V. Nanjundiah, Biophys. Chem. 72, 1 (1998).
18. P. J. M. van Haastert, J. Gen. Microbiol. 130, 2559 (1984).
19. M. C. Dinauer, S. A. MacKay, P. N. Devreotes, J. Cell Biol. 86, 537 (1980).
20. L. P. Kadanoff, Statistical Physics: Statics, Dynamics and Renormalization.
(World Scientific, 2000).
21. G. Gerisch, D. Malchow, Adv. Cycl. Nucl. Res. 7, 49 (1976).
22. K. J. Tomchik, P. N. Devreotes, Science 212, 443 (1981).
23. W. F. Loomis, C. Klein, P. Brachet, Differentiation 12, 83 (1978).
24. P. N. Devreotes, P. L. Derstine, T. L. Steck, J. Cell Biol. 80, 291 (1979).


Gre
gor e
t al (
2009
) Fig
ure
S10
A B
pdsA
-(1/
2 M
L)
4m
l/min
0.7
0.7
2
0.7
4
0.7
6
0.7
8
0.8
10
20
30
I485/ I540 (a.u.)
Tim
e (m
in)
0regA
-(is
olat
ed)
Tim
e (m
in)
0.9
0.9
5
I485/ I540 (a.u.)
0 6
0 2
0 1
0 4
0 3
0 5
0
flow off flow on

Movie S1. A time-lapse movie showing aggregation of approximately 180 cells confined to a 420 µm diameter area on hydrophobic agar (see Fig. 1 for corresponding snapshots and the cAMP signals). Fluorescent images of the CFP channel are shown at the top, and fluorescent intensities of the CFP-channel divided by that of the YFP-channel in gray-scale are displayed at the bottom. Flash of pulses from dark to light gray signifies transient rise in the level of cytosolic cAMP.