supporting mechanisms for the development of biomethane in
TRANSCRIPT

Supporting mechanisms
for the development of
biomethane in transport

1 March 2017 3.K49 – Supporting mechanisms for the development of biomethane in transport
Authors:
Anouk van Grinsven (CE Delft)
Cor Leguijt (CE Delft)
Jurga Tallat-Kelpsaite (eclareon)
Delft, CE Delft, March 2017
Publication code: 17.3K49.31
Methane / Biogas / Transport / EU / Policy / Government / Measures
Client: GRDF.
CE publications are available from www.cedelft.eu
Further information on this study can be obtained from the contact person, Anouk van Grinsven.
© copyright, CE Delft, Delft
Supporting mechanisms
for the development of
biomethane in transport
CE Delft
Committed to the Environment
Through its independent research and consultancy work CE Delft is helping build a sustainable
world. In the fields of energy, transport and resources our expertise is leading-edge. With our
wealth of know-how on technologies, policies and economic issues we support government
agencies, NGOs and industries in pursuit of structural change. For 35 years now, the skills and
enthusiasm of CE Delft’s staff have been devoted to achieving this mission.

2 March 2017 3.K49 – Supporting mechanisms for the development of biomethane in transport
Content
Abbreviations 4
Summary 5
1 Introduction 8 1.5 Outline of this report 10
2 Biomethane use within the case study countries 11 2.1 Introduction 11 2.2 Policy context 11 2.3 Biogas production 12 2.4 Biomethane production 15 2.5 Natural gas and biomethane consumption 16 2.6 Natural gas vehicle uptake 17 2.7 Filling infrastructure developments 18 2.8 Conclusions 18
3 Supporting measures at the national level 20 3.1 Introduction 20 3.2 Summary of policy strategy per case study country 20 3.3 Overall comparison of policy measures 25 3.4 Fuel uptake 25 3.5 Developments in natural gas vehicle uptake 27 3.6 Infrastructure and filling stations 30 3.7 Aspects related to biogas production 32
4 Transferability to the French context 34 4.1 Introduction 34 4.2 French context 34 4.3 Identified measures 37 4.4 Description of the individual measures 37 4.5 Conclusions 46
5 Conclusions and recommendations 47
6 References 50

3 March 2017 3.K49 – Supporting mechanisms for the development of biomethane in transport
Annex A EU policy context 54 A.1 Introduction 54 A.2 Renewable Energy Directive 54 A.3 ILUC Directive 55 A.4 Fuel Quality Directive 57 A.5 Clean Power for Transport Directive 58 A.6 Clean Vehicle Directive 58 A.7 EU winter package 59

4 March 2017 3.K49 – Supporting mechanisms for the development of biomethane in transport
Abbreviations
AT Austria
bioNG biogas/biomethane
CH Switzerland
CNG Compressed Natural Gas
DE Germany
EBA European Biogas Association
EC European Commission
EU European Union
FQD Fuel Quality Directive
FR France
GHG Green House Gas
GRDF Gaz Réseau Distribution France
HDV Heavy Duty Vehicle
ILUC indirect land use change
IT Italy
LCV light commercial vehicles
LDV Light Duty Vehicle
LNG Liquefied Natural Gas
Mtoe Million tonne of oil equivalent
MW MegaWatt (106 Watt)
NG natural gas
NL the Netherlands
PJ PetaJoule (1015 Joule)
PM particulate matter
RED Renewable Energy Directive
SE Sweden
TTW Tank-To-Wheel
TWh TeraWatthour (1012 Watthour)
WTW Well-To-Wheel
UK United Kingdom

5 March 2017 3.K49 – Supporting mechanisms for the development of biomethane in transport
Summary
Objective of this study GRDF would like to gain insight into the supporting measures applied in
European countries to support biomethane in transport. Therefore the main
objective of this study is to provide insight in the support measures taken at
the national level by various European countries and to identify the most
promising measures and to assess their transferability to the French context.
The focus of this study is on the use of biomethane in the transport sector
(vehicle uptake, fuel uptake and filling infrastructure developments), but
biogas production and upgrading of biogas to biomethane is also taken into
account, as they constitute necessary first steps in the supply chain.
Research approach/methodology Seven countries (Austria, Germany, Italy, the Netherlands, Sweden,
Switzerland and the United Kingdom) are chosen as case study countries,
together with France. These countries have been selected, because of their
high uptake of (natural) gas vehicles, high share of biomethane in the natural
gas share in transport, number of filling stations and strong biogas industries.
Factsheets have been produced based on literature review in order to identify
the most promising policy measures. Additional interviews have been held with
French experts to assess the transferability of policy measures to the French
context.
Current uptake of biomethane in the transport sector Statistics show that the investigated eight countries cover almost the entire
market of biogas production and biomethane in transport. Regarding biogas
production, the case study countries, including France, represent 81% of EU
biogas production and 99% of all the biomethane produced in the EU. The role
of biomethane in transport is still very limited in most countries, especially in
relation to total fuel sales (including diesel and petrol). Italy has a strong
natural gas market for transport with a large share of natural gas filling
stations (in % of all filling stations) and relatively high uptake of NG vehicles in
the passenger car and truck fleet segments. Probably as a result of the focus
on HDV (Heavy Duty Vehicles), the share of NG buses and trucks is also
relatively high in France (in % of total HDV). In terms of fuel uptake, Sweden
and Switzerland sell a relatively high portion of biomethane compared to
natural gas sales in transport: in Sweden biomethane consumption in transport
even exceeds natural gas consumption in transport.
Case study findings In Table 1 the most common policy measures are listed including an indication
of which countries these measures are applied in. This way, the differences
between France and the other case studies countries become clear.
The measures in bold have been identified as the most promising measures to
also be implemented in France.

6 March 2017 3.K49 – Supporting mechanisms for the development of biomethane in transport
Table 1 Overview of applied individual measures per aspect
FR AT DE IT NL SE CH UK
Fuel uptake
Specific target for bioNG X X X1
Lower fuel tax for NG compared to diesel and petrol X X X X X X X X
Lower fuel tax for bioNG compared to NG X 2 X X
BioNG included in the blending obligation X X X X
Vehicle uptake
Specific target for vehicles running on NG X X
Vehicle tax exemption based on CO2/low-carbon
vehicles
X X X
Company car taxation/tax reduction for environmental
investments/tax measured aimed at commercial
vehicles
X X X3 X X
Subsidies for retrofitting/scrapping schemes X X
Climate investment grants for municipal vehicle fleets X
Low-interest loans This measure is applied in Egypt and was
identified during the literature review.
Filling
infrasturcture
Co-finance projects for the deployment of CNG stations
and compatible vehicle fleets
X
Direct link to biogas plants X
Demand for realisation of public infrastructure in
public procurement
X
Simplification of procedures X
Subsidy scheme for alternative fuel infrastructure X
Obligation to offer at least one alternative fuel at filling
stations
X
Research activities X
Identification of most promising measures and assessment of their transferability to the French context The transferability of the identified measures to the French context has been
assessed as follows:
Including biomethane in the blending obligation, as is for example the case
in the Netherlands, does not seem to be feasible on the short term in
France and within the current system, but seems to be important to create
a level playing field between biofuels and biomethane and to make
biomethane part of the decarbonisation strategy for transport. Extending
the scope of the blending obligation might be included in any reforms on
the medium term as part of the new post-2020 EU policy framework.
Fuel tax differentiation, including lower taxes for bioNG compared to NG,
a measure applied in Sweden and Switzerland, seem to be the most
effective way to stimulate the uptake of biomethane in transport. Due to
the shortage of green certificates and in order not to harm the natural gas
market it is recommended to implement this gradually or at least to
pre-emptively announce it before actual implementation.
Providing low-interest loans for vehicles, as is the case in Egypt, seems to
be a risk-free option that can be complementary to other measures. A pilot
project could be started in an area with a high share of public accessible
NG stations, to see whether this measure also works in France.
1 The target also includes biofuels, but Italy has a strong focus on bioNG.
2 Only in case where biomethane is consumed on-site.
3 Provisions have been changed at the end of 2016.

7 March 2017 3.K49 – Supporting mechanisms for the development of biomethane in transport
Because most filling stations are private, actions are required to reach a
higher share of public accessible filling stations at the same time.
Depending on the type and size of tenders, a requirement to build filling
infrastructure in public procurement, as is the case in Italy, seems to be a
good option. However, attention has to be paid to the amount of vehicles
that will make use of this filling infrastructure and the location and
distribution of filling stations in an area. Filling stations need to add value
to the current system in place and therefore any extra station has to be
integrated into a broader system.
Establishing a direct link between filling stations and biogas plants as is the
case in Austria might help to increase awareness and understanding among
consumers and to increase the visibility and public awareness of
biomethane in a municipality.
The extent to which a system such as the Green Gas system in Göteborg
would be helpful to overcome investment risks due to differences in
development time between production and market demand (‘chicken and
egg’ problems) remains undecided: it seems to be more helpful to realise a
better market for green gas certificates and to increase the availability of
these certificates.
Main conclusions and recommendations Based on the outcomes of the case study and the assessment of the
transferability to the French context the following recommendations have
been identified:
Allow the market of natural gas and biomethane in transport to grow
(because it also took some years in other successful countries).
This requires a long term, coherent and stable policy framework.
Keep a specific eye on the development of NG and bioNG in transport in
Sweden and Italy, since the policies and underlying strategy of these two
countries seems to fit best to the French situation. One has to keep in
mind that the policy measures in these countries form part of a broader
long term strategy build also on national circumstances, on bioNG in
transport (Sweden) and NG in transport (Italy).
Integrate biomethane more in the decarbonisation strategy of the
transport sector and create a level playing field between biofuels and
biomethane; this could be achieved by, for example including biomethane
in the blending obligation (when the current system will be reformed).
Introduce measures gradually to allow companies to adjust and to take
these changes into account in their investment decisions.
Fuel differentiation between NG and biomethane can work as an enabler
for other policy measures.
Improve the system of guarantees of origin and green certificates, because
the current availability of certificates is not sufficient for a higher demand
in case additional policy incentives for the uptake of biomethane will be
implemented.
Strengthen the natural gas market further through low-interest loans for
commercial vehicles.
Maintain the focus on HDV.
Make the link between biogas production and biomethane in transport
more visible to the public.

8 March 2017 3.K49 – Supporting mechanisms for the development of biomethane in transport
1 Introduction
1.1 Background
Biogas is a very versatile form of bioenergy, as it can be produced from a
range of feedstocks and valorized in various energy forms: for electricity
production, heating and cooling, and in transport. The current biogas
production level in the EU is 13.4 Mtoe4 (155.8 TWh), of which 9.4% is
produced by wastewater treatment plants, 21.6% is landfill biogas and the
remainder, 69%, is biogas produced by anaerobic digestion of feedstock such as
agricultural, industrial or household waste and energy crops. In comparison:
total natural gas consumption was estimated to be 356.3 Mtoe (4143.8 TWh)
net calorific value, according to 2015 estimates of Eurogas.
Biogas can contribute to the decarbonisation of various sectors, to an
increasing share of renewable energy and to reaching energy security
objectives.
Due to successful policies in various Member States, EU-wide biogas production
increased rapidly in recent years. Germany, the UK and Italy alone are
responsible for more than 77% of the EU’s biogas production2. Since biogas has
higher production costs than natural gas, the differences in biogas production
between the European countries reflect differences in national energy
strategies and subsequently differences in supporting measures for biogas
production. As some of the existing policies were recently modified and
incentives reduced, it is also expected that this level of growth will not be
sustained in the coming years.
In relation to the transport sector, the Renewable Energy Directive (RED)
(EC, 2009a) and the Fuel Quality Directive (FQD (EC, 2009b) are the main
drivers on the EU level for the share of renewable energy in the transport
sector. The RED obliges Member States to realise a 10% share of renewable
energy in the final energy consumption of the transport sector by 2020.
The Fuel Quality Directive (FQD) obliges fuel suppliers to reduce the average
GHG intensity of their fuels by 6% in 2020 compared to 2010 levels (Article 7a).
Many Member States have introduced a blending obligation at the national
level to ensure the realisation of both targets. To the present day this has
mainly resulted in blending of liquid biofuels in conventional fuels, but
biomethane, renewable electricity in electric vehicles and renewable
hydrogen also count towards the 10% target.
Biomethane has the potential to reduce GHG emissions. The actual GHG
reduction potential depends on the feedstocks, the mode of operation (of the
biogas plant) and the utilisation pathway. In addition, biomethane, like natural
gas, also reduces air polluting emissions, like particulate matter (PM) and NOX.
The use of biomethane in transport requires incentives at different levels in
the supply chain of biogas/biomethane. As depicted in Figure 1, the use of
biomethane requires production of biogas, its upgrading to natural gas quality,
distribution through the grid or direct filling on-site, sufficient refuelling
infrastructure and vehicles that are engineered to run on natural
gas/biomethane and are actually filling up their tanks with biomethane.
4 2013 (primary energy) data, EurObserv’ER barometer.

9 March 2017 3.K49 – Supporting mechanisms for the development of biomethane in transport
Figure 1 Supply chain of biomethane
1.2 Objective
GRDF would like to gain insight into the supporting measures applied in
European countries and the transferability of these measures to the French
context. Therefore the main objective of this study is to provide insight into
the support measures taken at the national level by various European countries
to stimulate the use of biomethane in the transport sector and to assess the
transferability of successful measures to the French context.
This objective results in the following main research questions:
What supporting measures are applied to stimulate the use of biomethane
in relation to the 10% transport target of the Renewable Energy Directive?
What measures can then be mirrored and applied to the French context?
1.3 Approach/methodology
This study consists of three tasks. In the first two tasks the current uptake of
biomethane in the transport sector and the policy measures applied in the
eight case study countries have been investigated by means of a literature
review and additional requests for information where a gap was identified.
Data has been gathered by the various country experts using a factsheet
format developed for this purpose. Note that in some cases other countries
were also taken into account (only when found during the literature review).
At the end of Task 2 CE Delft analysed the factsheets in order to identify
similarities and differences between the various countries and to identify
future potential measures for the French context. In the third phase interviews
were conducted with French experts to assess the transferability to the French
context. Based on these findings final conclusions and policy recommendations
have been formulated.

10 March 2017 3.K49 – Supporting mechanisms for the development of biomethane in transport
1.4 Scope
This study focuses on the national supporting mechanisms in place to stimulate
biogas. This includes both financial measures, such as tax measures, as well as
non-financial measures, such as quota to bring a certain amount of
biomethane on the market.
Concerning the time horizon, this study will focus on the measures currently in
place applied and planned measures (until 2020). Attention will also be paid to
the recent developments in order to account for current shares of biomethane
in transport.
The geographical scope is limited to the EU policy framework (and
Switzerland) and the analysis of supporting measures at the national level will
be limited to France plus the seven selected case study countries:
Austria;
Germany;
Italy;
the Netherlands;
Switzerland;
Sweden;
United Kingdom.
Other applications of renewable energy in transport and the use of biogas in
other sectors, like the electricity or the heat sector, will only be described as
a way to put the use of biomethane into perspective. Biomethane is linked to
natural gas developments as well, because natural gas vehicles are both able
to run on natural gas and biomethane and because the natural gas grid can be
used for the distribution of biomethane as well.
1.5 Outline of this report
This report consists of the following sections:
Section 2 describes the use of biomethane within the context of the 10%
target of the RED and provides an overview of the current levels reached in
the various countries, investigated in this study. This includes both
production and consumption. Shares of NG filling stations and vehicle
uptake in various market segments are also presented.
Section 3 provides an overall comparison of the findings as outcome of the
various case studies. In this way insight will be gained in the differences
and similarities in the supporting measures applied at the national level.
Section 4 aims to assess the transferability of supporting measures
effectively applied in other countries to the French context.
Finally, Section 5 presents the main conclusions and policy
recommendations to French public authorities.
Annex A contains more details about the European legislative framework
briefly outlined in the introduction.
The factsheets for each case study country can be found in the Annexes,
which are included in a separate document. These factsheets contain e.g.
the detailed information about the policy measures of each country.

11 March 2017 3.K49 – Supporting mechanisms for the development of biomethane in transport
2 Biomethane use within the case study countries
2.1 Introduction
As already stated in the introduction section, the use of biomethane is,
because of the additional cost, almost completely driven by policy.
This section aims to provide a short overview of the most important EU policies
that can be seen as the main drivers behind biomethane consumption.
Secondly, this section aims to provide insight into current biomethane use in
the European Union (and Switzerland) and in the case study countries in
particular. From these overviews it will become clear why these countries
have been selected as case studies. In the next section, current biomethane
uptake in the transport sector as described in this section will be linked to the
various policy strategies and individual policy measures. By doing so
conclusions on successfulness of policy strategies can be drawn. For example,
this might lead to the conclusion that the countries with a high uptake of
biomethane in transport all have applied one specific policy measure.
This section is based on data sources as the Biogas report of the European
Biogas Association (EBA) published at the end of 2016, EurObserv’ER and
Eurostat. These last two sources do, however, not contain data on 2015 or
2016. The reports covering this information have not been published yet.
2.2 Policy context
The main EU policies providing an incentive for the uptake of biomethane in
the transport sector are:
The Renewable Energy Directive (EC, 2009a) of 2009 sets a binding target for
renewable energy in general (20% by 2020), but also includes a specific target
for the transport sector of at least 10% of renewable energy in transport by
2020. In order to count towards this target, biofuels and bioliquids have to
meet the sustainability criteria as laid down in this Directive and amended by
the ILUC Directive (EU, 2015b). Advanced biofuels produced from waste and
residues are allowed to count double towards the transport target.
Although renewable electricity and hydrogen can also count towards the
transport target, the target will be mainly fulfilled by the consumption of
biofuels. Many Member States have implemented a national blending
obligation for fuel suppliers to reach compliance.
The Fuel Quality Directive (EC, 2009b), also of 2009, aims to reduce the
average GHG emissions intensity of fuels along the supply side. Therefore the
average GHG intensity should be 6% lower by 2020 compared to 2010 levels.
This can also be realised by upstream reduction measures, but until now the
FQD has mainly resulted in the uptake of biofuels. The same blending
obligation as for the RED can be used to fulfil the FQD target, although the
FQD does not allow double counting.
Renewable Energy Directive
Fuel Quality Directive

12 March 2017 3.K49 – Supporting mechanisms for the development of biomethane in transport
As result of impacts of indirect land use change, land based biofuels can result
in indirect GHG emissions. If these indirect emissions are taken into account as
well, biofuels might even cause an increase in GHG emissions rather than a
reduction. In order to limit the share of land based biofuels the ILUC Directive
(EU, 2015b) has introduced a cap on land based fuels and has introduced a
sub-target for the most advanced biofuels. Because biogas is mostly produced
from waste and residues, biogas does not fall under this cap (except biogas
from energy crops).
The Clean Power for Transport Directive (or the Directive on the deployment
of alternative fuels infrastructure (AFI), (EC, 2014) focuses on the build-up of
an EU-wide network of recharging and refuelling points, interoperability (by
means of standards and technical specifications) and clear consumer
information to raise awareness. The Directive contains minimum requirements
to be implemented through Member States’ national policy frameworks.
This includes recharging and refuelling infrastructure for electric vehicles,
natural gas (LNG and CNG) and hydrogen.
The Clean Vehicle Directive (EC, 2009c), or the Directive on the Promotion of
Clean and Energy Efficient Road Transport Vehicles aims at the broad market
introduction of environmental-friendly vehicles on the market. This includes
that the energy and environmental impacts over the entire lifetime of a
vehicle should be taken into account in all purchases of road transport vehicles
covered by the Directives regulating public procurement and the public service
Regulation. These impacts can be monetised for inclusion in the purchasing
decision and requires the use of specific calculation rules for calculating the
lifetime costs and are laid down in the Directive.5
Above mentioned Directives are all part of the current policy framework.
However, many new investments will be based on the post-2020 policy
framework. At the end of November 2016 the European Commission has
published the so-called Winter Package which includes a proposal for a new
Renewable Energy Directive. The proposal includes a target for renewable
energy in transport of 6.8% for all types of renewable energy in transport,
including advanced biofuels, biogas, renewable electricity etc. by 2030,
abolition of the double counting provision, further strengthening of the cap on
land based biofuels and an increasing sub-target for advanced biofuels.
More detailed information on the policy framework can be found in Annex A.
2.3 Biogas production
Total biogas production Biomethane is produced by upgrading biogas to required gas quality for
injection into the gas grid or use as Bio-NGV (BioCNG or BioLNG). The total
biogas production in the EU is 625 PJ, based on the most recent data of 2014
from Eurostat (622 PJ according to EurObserv’ER). This is about 172.8 TWh.
It accounted for 7.6% of the total primary energy production from renewable
energy sources in 2014. Germany produces by far the largest amount of biogas,
followed by Italy and the UK; France produced 17.6 PJ biogas in total, which is
about 4.9 TWh.
5 www.ec.europa.eu/transport/themes/urban/vehicles/directive_en
ILUC Directive
Directive on the deployment of alternative fuels infrastructure
Clean Vehicle Directive
EU Winter Package

13 March 2017 3.K49 – Supporting mechanisms for the development of biomethane in transport
Figure 2 Biogas production per EU member state in 2014 (PJ)
Source: Graph from (CE Delft, DLO and Eclareon, 2016), data from (EurObserv'ER, 2015).
Number of biogas plants The number of biogas plants and yearly biogas production in the case study
countries and total EU28 is given in Table 2. In France the number of biogas
plants was 717 in 2015, 19 plants less compared to 2014 (EBA, 2016). In terms
of biogas plants and biogas production over 2015 the case study countries
represent 88% of all biogas plants and 86% of total EU biogas production.
Table 2 Number of biogas plants in 2015
Biogas
plants #
Biogas production
GWh/year
Austria 444 1,584
France 717 5,079
Germany 10,846 61,500
Italy 1,555 26,556
Sweden 282 3,843
Switzerland 638 1,909
the Netherlands 268 1,044
United Kingdom 523 17,791
Total case studies 15,426 119,306
Share presented by case studies 88% 81%
Total 17,376 138,340
Source: (EBA, 2016).

14 March 2017 3.K49 – Supporting mechanisms for the development of biomethane in transport
Installed capacity The installed capacity in the EU almost doubled in five years time (2010-2015)
from 4,823 MWel to 8,728 MWel, as is depicted in Figure 3 (EBA, 2016).
Figure 3 Development of the number of biogas plants and installed electric capacities in the EU
Source: (EBA, 2016).
Feedstocks used Figure 4 shows the result of an analysis of the feedstocks used for the
production of biogas in 2014 by CE Delft, DLO and Eclareon (CE Delft, DLO and
Eclareon, 2016). Energy crops (mainly maize) was the main feedstock, used
for about half of the biogas production (318 PJ/88.3 TWh), followed by
landfill (114 PJ/31.7 TWh), organic waste (including municipal waste)
(86 PJ/23.9 TWh), sewage sludge (57 PJ/15.8 TWh) and manure
(46 PJ/12.8 TWh). However, expressed in terms of mass, manure contributes
about 43%, since the biogas/energy yield of manure is relatively low (CE Delft,
DLO and Eclareon, 2016).
Compared to the other case study countries France has a relative low share of
biogas produced from energy crops, while Austria and Germany have a
relatively high share. The latter is less sustainable as result of the indirect
emissions, which are the result of the consumption of energy crops.
In the Netherlands and Italy about 50-60% of biogas is produced from manure.
About 80% of biogas is produced from sewage sludge and organic waste in
Sweden and the United Kingdom.

15 March 2017 3.K49 – Supporting mechanisms for the development of biomethane in transport
Figure 4 Share of feedstock use for biogas (on energy basis), estimates6
Source: Graph from (CE Delft, DLO and Eclareon, 2016).
2.4 Biomethane production
The total production of biomethane in Europe was 12.03 TWh (EBA, 2016).
According to the same report: ‘Germany, Sweden and the UK are leading the
way in terms both of the number of facilities and infrastructure for
biomethane use. In the UK, Germany, Switzerland, Austria and France nearly
all plants are connected to the national gas grids. This was made possible by
policies and support schemes that are in place for both producers and
consumers’.
Biomethane plants are sites where biogas is produced and subsequently
upgraded to biomethane on-site. The number of biomethane plants in the case
study countries are listed in Table 3 and this table shows that the case study
countries almost completely cover all the biomethane plants: only 9% of
biomethane plants are located outside the case study countries. Note that
these biomethane plants cover biomethane production for various uses and not
only for injection into the grid.
6 EurObserv’ER data stated only landfill gas and sewage sludge for Estonia, while EBA data
stated also other feedstock use.

16 March 2017 3.K49 – Supporting mechanisms for the development of biomethane in transport
Table 3 Number of biomethane plants (2015)
Country #
Austria 13
France 20
Germany 185
Italy 6
Sweden 61
Switzerland 35
The Netherlands 21
United Kingdom 80
Total case studies 421
Share presented by case studies 91%
Total 459
Source: (EBA, 2016).
On average 12% of the biogas is used to produce biomethane: the other 88% is
used to generate electricity or heat. The case studies represent 99% of all
produced biomethane and 88% of all electricity generated from biogas and 91%
heat used. Note that there are substantial differences between the various
countries: in Sweden 74% of all biogas is dedicated to biomethane production.
In the Netherlands and Switzerland 26% and respectively 19% of biogas is used
to produce biomethane, while this is only 2% in France.
Table 4 Produced biomethane compared to generated electricity and generated heat (GWh/yr), in
2014
Electricity
generated
Heat
used
Biomethane
produced
annually
Share of
produced
biomethane
in total
Austria 560 310 82 9%
France 2,738 2,190 85 2%
Germany 31,890 18,069 8,771 15%
Italy 9,368 14,052 n.a. n.a.
The Netherlands 1,148 1,863 704 19%
Sweden 62 387 1,257 74%
Switzerland 316 443 271 26%
United Kingdom 7,280 n.a. 722 9%
Total 60,644 40,804 12,027
Total case studies 53,362 37,313 11,892
Share presented by case studies 88% 91% 99%
Source: (EBA, 2016).
2.5 Natural gas and biomethane consumption
If we look specifically at biomethane consumption, data on biomethane is very
limited and for most countries no volumes are reported at all. This implies
that the biomethane consumption in transport is still very limited and might
also imply that the data collection and reporting has not developed into a
mature system yet. The data that has been collected on natural gas and
biomethane consumption are depicted in Table 5.

17 March 2017 3.K49 – Supporting mechanisms for the development of biomethane in transport
Table 5 Fuel uptake
Natural gas
consumption
Biomethane
consumption
Total energy
consumption
in transport
% of natural
gas in total
energy
consumption
% of biogas
in total
natural gas
(NG +
biomethane)
GWh GWh GWh % %
France 1,163 n.a. 56,9870 0.2% n.a.
Austria 5,554 6 101,483 5.5% 0.1%
Germany 2,300 460 738,121 0.3% 16.7%
Italy 10,025 0.3 466,200 2,2% 0%
Netherlands 417 46 161,831 0.3% 9.9%
Sweden 457 1131 362,890 0.1% 71.2%
Switzerland 386 134 84,800 0.5% 25.8%
UK n.a. 28 594,677 n.a, n.a.
According to EBA (2015) slightly more biomethane ended up in the transport
sector in 2014 compared to 2013 levels: 11.75% compared to 10% in 2013.
This is mainly the result of biomethane consumption in Sweden (78% of all
biomethane is consumed in the transport sector), Switzerland (33%) and
Germany (3%). Besides the case studies, in Finland also 43% of biomethane is
consumed in transport, but the production has been assessed to be too small
to add it as a case study.
2.6 Natural gas vehicle uptake
The uptake of vehicles is very limited compared to the size of overall fleets.
Although this share is very limited, a strong growth (sometimes 4-5 times
higher than five years ago) has occurred in our case studies (except in
Germany, where the sales in new NGV has dropped in 2015 compared to 2014.
In some countries the share of bi-fuelled vehicles is far higher than the share
of natural gas vehicles.
Italy has by far the highest number of NG passenger cars: the 837,470
passenger cars represent a share of over 2% of all passenger cars. Of all the
case study countries Italy also has a large share of NG trucks, but France has
an even higher share with 2.63%. Almost 30% of all buses in France also run on
natural gas.
With almost 17% a considerable amount of buses in Sweden are running on
natural gas as well. Overall the uptake of natural gas in the bus fleets seems
to be more successful compared to passenger cars and trucks. No information
on vehicle statistics could be found for the United Kingdom. Note that the
data presented in Table 6 is compiled using various data sources for the most
recent year available. References can be found in the factsheet report.

18 March 2017 3.K49 – Supporting mechanisms for the development of biomethane in transport
Table 6 Share of NG vehicles in vehicle market segments
AT CH DE FR IT NL SE UK
Number of NG
passenger cars
5,087 11,278 80,300 2,549 837,470 7,452 42,675 20
Total number of
passenger cars
4,750,000 4,500,000 45,071,209 32,325,000 37,332,024 8,100,864 4,669,069 3,181,300
% of passenger cars 0.1% 0.3% 0.2% 0.01% 2.2% 0.1% 0.9% 0.0%
Number of NG buses 485 173 1,422 2,172 3,668 674 2,357 37
Total number of buses 9,679 6,779 78,345 7,344 97,910 9,833 14,144 169,000
% of buses 5.0% 2.6% 1.8% 29.6% 3.8% 6.9% 16.7% 0.0%
Number of NG trucks 2,086 129 15,523 364 82,530 623 8,079 621
Total number of trucks 427,515 400,000 2,800,780 13,828 4,460,389 157,562 596,214 4,411,000
% of trucks 0.5% 0.03% 0.6% 2.6% 1.9% 0.4% 1.4% 0.0%
2.7 Filling infrastructure developments
Regarding filling infrastructure developments there are large differences
between the various countries. Italy also has, besides the largest share of NG
passenger cars, the highest share of NG filling stations with almost 24% of all
filling stations in Italy (including multi-use stations). Other countries, like
Austria, Germany and Sweden all three have a share of about 6%. The other
countries, Switzerland, France, the Netherlands and the United Kingdom all
have lower shares.
Table 7 Share of NG filling stations in total filling stations
NG filling stations Total filling stations %
AT 172 2,641 6.5%
CH 140 3,461 4.1%
DE 883 14,531 6.1%
FR 288 11,269 2.6%
IT 1,046 4,420 23.7%
NL 140 4,000 3.5%
SE 162 2,680 6.1%
UK 16 8,490 0.2%
2.8 Conclusions
Based on this section it can be concluded that a few countries are being
responsible for most of the biomethane transport market in Europe. This is
also summarised in Table 8 in which the shares covered by the case study
countries are depicted for the indicators discussed in this section.
Table 8 Shares covered by case study countries for four indicators
Indicator Share covered by case study countries
Biogas plants 88%
Biogas production 86%
Number of biomethane plants 91%
Biomethane production 99%
Biomethane consumed in transport 56%
Natural gas vehicles 68%
Filling stations 98%

19 March 2017 3.K49 – Supporting mechanisms for the development of biomethane in transport
In the next section the indicators discussed in this section will be linked to the
policy strategies and individual policy measures in the countries. In this way
conclusions can be drawn on the effectiveness of these policies.

20 March 2017 3.K49 – Supporting mechanisms for the development of biomethane in transport
3 Supporting measures at the national level
3.1 Introduction
Based on the previous section it can be concluded that the selected case
studies together with France cover almost the entire biomethane and biogas
market in the EU. There are, however, also large differences between
countries in terms of vehicle uptake, share of natural gas filling stations and
share of biomethane.
In this section we aim to analyse the policy strategy and individual measures in
each case study country in order to provide insight in the link between policy
incentives and biomethane uptake in transport.
Because of the focus on the transport sector, natural gas vehicle uptake,
uptake of natural gas and biomethane and infrastructure developments are
discussed in more detail than aspects related to biogas production and grid
injection.
Before zooming in on the individual policy measures a short description of the
overall strategy is presented per case study country. After that an overview of
the measures applied is given followed by a description of the individual
measures according to the following stages in the supply chain:
developments in natural gas vehicle uptake;
uptake of fuel;
infrastructure and filling stations;
link with biogas production and grid injection.
Detailed information per case study can be found in the factsheets in the
Annexes. The Annexes also include all the references used, like strategic
papers and regulatory documents.
3.2 Summary of policy strategy per case study country
The case study outcomes have shown that the uptake of biomethane in
transport is mostly the result of broader policy strategies targeting more than
one element. Therefore, we will start by giving a short summary for each case
study country to describe the overall policy strategy. A graphic overview of the
strategies is also provided.
France The market for natural gas vehicles and filling stations is not seen as a mature
market yet and the transition towards biomethane is yet to truly take place.
The share of biomethane in the transport sector is expected to strongly
increase in the next years. According to the French energy agency ADEME,
bioNGV represents the best alternative for the use of biomethane production
in the future. In this regard, the multi-annual energy programme (Ministère de
l' Environment, 2016) established by the French government in October 2016,
sets a consumption target for bioNGV of 0.7 TWh by 2018 and 2 TWh by 2023,
in order to achieve 20% of all NGV consumed by 2023. Due to the focus on HDV

21 March 2017 3.K49 – Supporting mechanisms for the development of biomethane in transport
and the focus of policy on air quality in urban areas, France has a large share
of NG buses in the national bus fleet and natural gas trucks. The share of
passenger cars is quite low. An explanation for this is that there are less
alternatives available for heavy duty vehicles to meet the requirements of
environmental zones in urban centres. Heavy duty vehicles also have a higher
need to meet the requirements of environmental zones, because their
businesses depend on the access to these areas.
Austria From all the case study countries, Austria shows a modest share on all
indicators studied. This can be explained by the broader decarbonisation
strategy applied by the country, which is not specifically targeted at
biomethane, but includes all type of renewable options for the transport
sector and even has a strong focus on e-mobility, as is the case in Germany.
Austria has a tax exemption for natural gas in transport. Biomethane is
exempted only in case refuelling occurs on the production site. No information
has been found on support schemes for infrastructure, but Austria has some
filling stations, of which at least 3 are directly linked to biogas plants.
Germany The German strategy has shifted away from biomethane to electromobility,
both for incentives to stimulate fuel, as well as for vehicles and infrastructure.
Fuel tax exemptions have ceased or will be ceased in the short term. Due to
the focus on e-mobility there are currently no substantial incentives or
measures to stimulate the uptake of natural gas vehicles, because natural
gas vehicles are no longer included within the support schemes for new
low-emission vehicles. However, new incentives might be implemented in the
coming years. Given the slow progress in reducing GHG emissions in the
transport sector, the German Government is set to place an increasing
emphasis on the use of natural gas and biogas as transportation fuels. To that
end, the Ministry of Economy and Energy launched in September 2016 the
Rounde Table Natural Gas Mobility (Runde Tisch Erdgasmobilität) composed of
the representatives of the industry and the government. It declared the
ambitious goal of reaching 4% of natural gas share in fuel consumption by
2020. The proportion of biomethane in natural gas for transportation is
expected to be at 20%. In 2015, the share of natural gas (together with
biomethane) in the final fuel consumption was only 0.38% (Initiative
Erdgasmobilität, 2016).The Ministry for Economic Affairs and Energy also
announced the plans to extend the tax benefits for CNG vehicles beyond 2018.
The sources can be found in the Factsheet report.
Italy Italy has already a long history in natural gas in transport. Although current
biomethane consumption is negligible, the natural gas market is large and
mature, including high share of natural gas vehicles in the passenger car fleet
and a substantial role for natural gas in the HDV fleet. These large shares in
the vehicle fleet are linked to a well-developed infrastructure network in
which natural gas stations have a substantial share. This is in line with the fact
that policy measures have been focused on vehicle and infrastructure
measures and the large tax advantage of natural gas over diesel and petrol.
The system of certificates (CICs) first needs to be further developed before
biomethane can take off.

22 March 2017 3.K49 – Supporting mechanisms for the development of biomethane in transport
The Netherlands The Netherlands show a modest growth in both natural gas and biomethane.
In terms of vehicle fleet penetration the share of passenger cars and trucks is
lower compared to most other case study countries. Only, the share of buses is
above average. A subsidy scheme for alternative fuel filling stations has been
in place, but no longer exists. Market actors behind the natural gas stations
have committed themselves to realising a 100% share of biogas in natural gas
by 2015. It is not clear to what extent this has been realized.
Sweden Sweden is not characterized by the highest share of natural gas in transport,
but by the large share of biomethane. The consumption of biomethane has
exceeded the natural gas consumption in transport, which can be explained by
the lower taxes for biomethane compared to natural gas. Because the tax
exemptions apply to all fuels and all vehicle segments, both the share of NG
passenger cars as well as the share of NG trucks are relatively high. Due its
strong push for natural gas in public procurement by local governments a large
share of the bus fleet also runs on natural gas.
Switzerland Within its strategy Switzerland, like Sweden, has specific measures to
stimulate the uptake of biomethane in transport by lower fuel taxes (even an
exemption in case the sustainability criteria are met) and biogas in transport is
preferred over use in other sectors. This explains the higher uptake of
biomethane in transport in Switzerland compared to other case studies.
Vehicle measures are comparable to other case study countries by being
targeted at low-emission vehicles in general.
United Kingdom The United Kingdom has a relatively modest uptake of natural gas and
biomethane. This can probably be explained by the broader scope of the policy
measures, which are focused on low-emission fuels and alternative fuel cars
without having specific incentives for natural gas and biomethane. Incentives
are limited to use biomethane under the blending obligations and some
research activities and pilot projects.

23 March 2017 3.K49 – Supporting mechanisms for the development of biomethane in transport
Figure 5 Schematic overview of national strategies and status of the market

24 March 2017 3.K49 – Supporting mechanisms for the development of biomethane in transport

25 March 2017 3.K49 – Supporting mechanisms for the development of biomethane in transport
3.3 Overall comparison of policy measures
The strategies as depicted in Figure 5 are the result of individual policy
measures. Table 9 summarizes the main policy measures as identified in the
case studies and shows in which countries these measures have been applied.
Table 9 Overview of applied individual measures per aspect
FR AT DE IT NL SE CH UK
Fuel uptake
Specific target for bioNG X X X7
Lower fuel tax for NG compared to diesel and petrol X X X X X X X X
Lower fuel tax for bioNG compared to NG X 8 X X
BioNG included in the blending obligation X X X X
Vehicle uptake
Specific target for vehicles running on NG X X
Vehicle tax exemption based on CO2/low-carbon
vehicles
X X X
Company car taxation/tax reduction for environmental
investments/tax measured aimed at commercial
vehicles
X X X9 X X
Subsidies for retrofitting/scrapping schemes X X
Climate investment grants for municipal vehicle fleets X
Low-interest loans This measure is applied in Egypt and was
identified during the literature review.
Filling
infrasturcture
Co-finance projects for the deployment of CNG stations
and compatible vehicle fleets
X
Direct link to biogas plants X
Demand for realisation of public infrastructure in
public procurement
X
Simplification of procedures X
Subsidy scheme for alternative fuel infrastructure X
Obligation to offer at least one alternative fuel at filling
stations
X
Research activities X
3.4 Fuel uptake
Below the policy measures aimed at the realisation of fuel uptake are listed
for each country.
The act on energy transition published in 2015 has set an objective of 10%
renewable energy in total energy consumption of transport by 2020 and at
least 15% by 2030. The Multi-annual Energy Programme is the main
implementing tool to be carried out by 2018 and 2023. The specific targets for
bioNGV are 0.7 TWh by 2018 and 2 TWh by 2023. This shall cover 20% of total
NGV consumed in 2023.
7 The target also includes biofuels, but Italy has a strong focus on bioNG.
8 Only in case where biomethane is consumed on-site.
9 Provisions have been changed at the end of 2016.
France

26 March 2017 3.K49 – Supporting mechanisms for the development of biomethane in transport
Biomethane and natural gas are subject to the same tax. It is forbidden to
increase the tax for natural gas applied in transport. Biogas is exempt from tax
when consumed on the spot.
The use of natural gas as a fuel offers a tax reduction until 2018. At the start
this reduction was envisaged until 2024, but this period has been significantly
reduced. The tax benefits for biomethane have ceased completely in 2015.
5.5% of total fuel consumption should come from biofuels and biomethane by
2016 through ‘Certificates of Release for Consumption’ (CIC) for biofuels.
(Ministero dello Sviluppo Economico, 2014)). Although this target can also be
met with other biofuels, Italy strongly focuses on the role of biomethane.
No support for biomethane solely for the transport sector has been found.
Natural gas fuel taxes are lower compared to petrol and diesel. The system for
certificates called CICs can be used to fulfil the blending obligation with
biomethane. This system has not yet resulted in significant shares of
biomethane, partly because this system required further development.
Biomethane is part of the blending obligation: biotickets (now changed into
Renewable Fuel Units) could be traded and could help to realise the blending
obligation. The double counting provision helps to improve the business case.
Fuel tax on CNG is considerably lower compared to diesel and petrol.
The Dutch market actors responsible for the natural gas stations have
committed themselves to deliver solely 100% biomethane by 2015. It is not
clear to what extent this has been realised.
The price at different CNG filling stations might vary due to differences in
distance between the production/upgrading plant and the filling station and
on the availability of distribution options. Increased supply of LNG through LNG
terminals might affect the price in the future. A network fee will also be
included in the gas price. The CO2 and energy tax which both determine the
total fuel tax on biomethane result in a lower fuel tax for biomethane
compared to natural gas, which is also lower compared to diesel and petrol.
Tax exemptions for biogas have been approved by the European Commission.
Biogas is exempted from mineral oil tax if biogas meets the sustainability
criteria. The tax on natural gas is also lower compared to petrol. Biogas has a
tax advantage in transport compared to use in other sectors. Tax exemptions
for biogas have been approved by the European Commission.
Biomethane can play a role in the UK blending obligation, called the
Renewable Transport Fuel Obligation (RTFO). Fuel taxes for natural gas are
lower compared to diesel and petrol.
Overall conclusions France is a frontrunner in setting targets for the consumption of bioNG
(together with Italy and Germany). However, the differentiation in French fuel
taxes does not favour biomethane. A lower fuel tax exists for natural gas,
which is also common in the other countries. Even lower taxes for bioNG are
only applied in Sweden, Switzerland and to some extent Austria. A majority of
the countries also offers the opportunity to let biomethane count towards the
blending obligation. However, this seems to have less impact on biomethane
uptake compared to lower fuel taxes for bioNG according to the statistics as
presented in the previous section.
Austria
Germany
Italy
The Netherlands
Sweden
Switzerland
United Kingdom

27 March 2017 3.K49 – Supporting mechanisms for the development of biomethane in transport
As result of the differences between France and case study countries the
following measures have been identified as most promising measures to
incentives fuel uptake:
the lower fuel tax for bioNG;
including biomethane in the blending obligation.
3.5 Developments in natural gas vehicle uptake
Below the policy measures aimed at the realisation of natural gas vehicle
uptake are listed for each country.
France is one of the few countries with a specific target for the share of
natural gas vehicles: the Multi-annual Energy Programme strongly focuses on
HDVs and aims to increase the share of HDVs on natural gas to 3% by 2023 and
10% by 2030. The amount of LDVs (light commercial vehicles and passenger
cars) is expected to increase accordingly. Until recently the use of NGV in
captive fleets was hindered by the legal and fiscal frameworks, but with the
Multi-annual Energy Programme several supporting measures are foreseen for
the coming years, like a tax reduction since 1 January 2016 for vehicles
over 3.5 tons. This is valid for CNG, LNG, bioCNG and bioLNG and companies
may deduct up to 40% of the original value from their taxable income from
1 January 2016 until 31 December 2017. This will cost 0.6 million euros for a
total of 1,500 LCVs, which is very limited compared to total public budget,
while this is a substantial measure to stimulate the uptake of (bio)methane by
company cars.
ADEME also manages a national call for tenders within the framework of Future
Investments Programme ‘Demonstrators of the ecological and energy
transition’. The tender aims to co-finance projects for the deployment of CNG
stations and compatible vehicle fleets. Final submission is scheduled for end of
March 2017. The projects shall foresee at least 5 filling stations and at least
20 vehicles per station. Financial support could be up to € 300,000 (for
1 station and 20 vehicles) of which € 100,000 in grants and € 200,000 in
repayable advances.
The project Equilibre financially supported the acquisition of natural gas
vehicles, while at the same time supporting the realisation of filling stations.
The Paris Town Hall has granted bonuses for small companies to purchase
electric or natural gas vehicles (LCVs, vans or HDVs).
Although the decarbonisation strategy of Austria mainly is targeted at e-
mobility, the scheme ‘klimaaktiv mobil’ of the Austrian Federal Ministry of
Agriculture, Forestry, Environment and Water Management (BMLFUW, ongoing)
offers a total budget of 18.25 million euros to for example the environmental
friendly refurbishment of vehicle fleets of companies. Grants could be € 500 or
€ 1,000 per vehicle and is limited to 50% of the eligible cost for enterprises
and 30% of the eligible cost for local authorities. Projects can receive support
in case at least a minimum share of 50% is deployed.
There has also been a tender for cabs and car-sharing on a federal level.
The acquisition or retrofitting of up to ten passenger cars is promoted by
offering a lump sum of € 1,500 for CNG vehicles. Various electric vehicles are
also promoted. The premium is doubled in case green electricity is used.
The tender closed on 15 October 2016.
France
Austria

28 March 2017 3.K49 – Supporting mechanisms for the development of biomethane in transport
Due to the focus on e-mobility there are currently no substantial incentives or
measures to stimulate the uptake of natural gas vehicles.
The KfW Environmental Programme (KfW, 2017) supports environment
protective measures in the commercial business sector, such as low-interest
loans for the commercial purchase of new emission-low vehicles. While these
new emission-low vehicles addressed also the one powered by biogas and
biomethane, the provisions have been changed at the end of 2016.
Currently, under the same programme, only hybrid, electrical cars and such
vehicles fuelled by hydrogen are eligible.
Since 2009 Italy has been offering incentive for the conversion of vehicles on
gasoline to LPG and CNG vehicles. The fund has been renamed several times to
ICBI incentive (Low Impact Fuel Initiative). For 2016 the fund was 1.8 million
euros. Incentives are 500 euro for LPG vehicles and 650 euro for CNG vehicles.
150 euro is from the installer and the rest is dispensed by the ICBI.
In addition to this, subsidies have also been granted for the acquisition of new
low-emission vehicles (enacted by Law 134/2012) between 2013-2015.
Low-emission vehicles include CNG, LNG, higher blends of biofuels, hydrogen,
hybrid and electric cars. The height of the subsidy is a share of the purchase
price and depends on the period in which the vehicle is acquired and the
CO2 emissions in g/km. Total budget was 120 million euros. The old used
vehicle should be supplied to a wrecker.
In the Netherlands several local governments offer vehicle subsidies to
natural gas vehicles. At the national level tax reduction is possible, because a
NGV is seen as environmental investment. In 2014 there has also been a
subsidy scheme for LNG trucks.
Sweden applies an income tax reduction for companies for the use of natural
gas vehicles (incl. biomethane), plug-in hybrid vehicles and electric cars.
Although the maximum amount of funding has been reduced from 1,714 euro
to 1,029 euro, the support scheme has been extended until the end of 2019.
Under the climate investment grant for municipalities local authorities can
receive support for various biogas projects, including projects targeted at the
municipal vehicle fleet. The main aim of all projects should be GHG reduction.
In 2015 total granted aid was 12,8 million euro and another 61,6 million euro is
available for 2016-2018.
In 2015 a draft of the national biogas strategy has been published by a group
of main stakeholders in the biogas industry (gas user trade association
Energigas Sverige, gas network owner/operator Swedegas, and the
municipality of Region Skåne). In this draft the following measures are
proposed, but this roadmap has not been implemented:
a policy instrument to promote ‘environmental trucks’;
a premium for electric buses has already been proposed by the
government, the draft biogas strategy gas-powered buses should also be
included in this premium, especially in relation to outlying areas where
electric buses are not an option;
a bonus-malus system for LDVs (based on gCO2/km of a vehicle) should also
cover gas-powered vehicles;
maintaining the benefits for company cars (see first point).
Germany
Italy
The Netherlands
Sweden

29 March 2017 3.K49 – Supporting mechanisms for the development of biomethane in transport
More and more cantons grant a reduction on the motor vehicle tax for
low-emission vehicles (such as electric, hybrid, fuel cell or energy efficient
cars, but also for natural gas, biogas and hydrogen.
In the UK vehicle tax rates for cars (registered after 2001) are based on fuel
type and CO2 emissions. The lower the emissions, the lower the tax.
This also applies for alternative fuel cars.
Regarding HDVs, the Low-Carbon Truck Trial, funded by the Department for
Transport, the Office for Low-Emission Vehicles and Innovate UK, budget was
provided to invest prime procurement of low-emission heavy goods vehicles
(HGV) technologies and supporting infrastructure. The aim is to raise
awareness and to enable low-carbon vehicle producers to develop products in
a new way. The publically-accessible gas refuelling infrastructure should help
with the monitoring of data to emission reductions, fuel savings and
operational benefits. By the end of 2014 317 trucks were on the road
(91 additional dual fuel LNG and 51 CNG additional vehicles) compared to the
end of 2013.
Overall conclusions Overall, France is the only country with a specific target for the share of
natural gas vehicles. France also strongly focuses on heavy duty vehicles.
The measures aimed to increase the vehicle uptake of natural gas vehicles at
the national level are focused on low-carbon vehicles in general, which include
natural gas vehicles, electric vehicles, but also vehicles on hydrogen or higher
blend of biofuels. Because many measures are technology neutral, natural gas
vehicles compete with for example electric vehicles. On the one hand, this
competition can be seen as an unwanted effect, but on the other hand, policy
measures formulated in a technology neutral way are more likely to result in
cost-effective results, because the choices are left to the market.
We can distinguish the following measures:
Reduction of motor tax levels (based on fuel type and or gCO2/km).
In several countries, motor tax levels are based on fuel type and gCO2/km
in line with the CO2 regulation for light duty vehicles at the EU level.
Because CO2 regulations solely focus on the TTW emissions of vehicles no
difference is made between natural gas and biomethane.
Subsidies for the purchase of new vehicles or retrofitting of existing
vehicles; at the national level or local level, specific vehicle types (for
example LNG trucks).
Income tax deduction for companies/environmental investment.
Climate investment grant for municipalities in for example Sweden and
France.
Pilot project to gain more knowledge on natural gas trucks in the United
Kingdom.
Local measures: environmental zoning, benefits (dedicated lane, parking
policy).
Low-interest loans for commercial vehicles.
The policy measures aimed at vehicle uptake often do not include additional
incentives to stimulate the uptake of biomethane by these vehicles.
Switzerland
United Kingdom

30 March 2017 3.K49 – Supporting mechanisms for the development of biomethane in transport
Because France has mostly already applied the measures applied in other
countries the following measure has been identified as most promising
measure to incentives vehicle uptake:
Low-interest loans for commercial vehicles.
This measure has been applied in Egypt and has been found during the
literature study for the case study countries.
3.6 Infrastructure and filling stations
Below the policy measures aimed at the realisation of infrastructure and filling
stations are listed for each country.
In France the majority of filling infrastructure is privately owned, while the
filling infrastructure in other countries is mainly public. This can partly be
explained by the larger role of HDVs: HDV fleets often have their own filling
infrastructure, but according to the French Association for natural gas vehicles
(AFGNV) a strategic network of filling infrastructure is required, requiring a
total number of 150 public stations (40 LNG stations and 110 CNG stations) by
2020 in order to meet the national objectives of the government for HDV.
This equals an investment of 150 million euros. In addition to this, the AFGNV
also recommends to expand the network of stations for private vehicles,
especially in urban areas. This will require 100 filling stations by 2020 and
equals an investment of about 25 million euros. This equals 250,000 euros per
filling station.
There have been several initiatives from the French Energy Agency (ADEME) at
national and regional level to develop the filling infrastructure for NGVs. At
the regional level the project, called ‘Equilibre’, has taken place in the
Rhône-Alpes Region in 2011. This project has resulted in 25 NGV stations and
1,200 NGVs using this infrastructure in February 2015. The initiative
‘GNVolontaires’ aims to duplicate this project in other regions and cities
across the country.
The partnership between GRDF and the city of Paris, the French Post and Ile
de France Region launched in December 2014 has resulted in equipping the
vehicle fleets of Paris and the post offices with CNG and the realisation of CNG
filling infrastructure across the region.
In Austria there are four biomethane filling stations across the country which
are open to the public and of which three are directly connected to biogas
plants. In case of the fourth filling station the biomethane is fed into the
natural gas grid and allocated to the filling stations. No information has been
found on support schemes for infrastructure.
The number of filling stations offering biomethane in a blend or 100% is
dropping due to the strong increase in charging infrastructure for electric
vehicles. The German government puts all its efforts in the establishment of a
strong e-mobility network. Therefore no supporting measures could be
mentioned here.
A L-CNG filling station was operating in Munich between October 2001 and
May 2007 as part of a pilot project.
According to CIB, the current natural gas fuelling stations should double to
2,000 by 2020 in order to keep up with the developments in NGVs. In Italy the
supporting measures in place are aimed at the simplification of procedures for
France
Austria
Germany
Italy

31 March 2017 3.K49 – Supporting mechanisms for the development of biomethane in transport
new distribution plants, which also includes the procedures for self-delivery
at guarded and non-guarded facilities. The development of natural gas
infrastructure is also part of the DDL Competition, which makes that within
public procurement the need/obligation to develop an alternative fuel
network is confirmed, unless there are technical and economic obstacles that
can be proven and which will be assessed by the authorities involved.
The development needs of alternative fuel infrastructure are linked to the
Clean Power for Transport Directive (EC, 2014).
In the Netherlands over 50% of the public filling stations offering CNG offer
100% biomethane. Around 2009/2010 the Dutch government and local
authorities have invested in a subsidy scheme for alternative fuel
infrastructure, including biomethane, but also E85, B30, etc. The first tender
was open for natural gas, biogas and bioethanol. The second tender only for
biodiesel. Both rounds in total involved about 6 million euro. Currently, the
support for filling infrastructure is part of the Dutch National Fuel Strategy
which has been defined together with the involvement of stakeholders and
which includes the overall strategy for the decarbonisation of the transport
sector. There are also some private initiatives where energy companies work
together with fuel suppliers to build a network of biomethane filling
infrastructure, like Essent and Tamoil have done. The biomethane brought on
the market is called OGO CNG.
Sweden is the only country which has introduced an obligation to offer
alternative fuels at filling stations. Already in 2005 the Pump Act (Pumplagen)
was introduced and obligates larger filling stations to offer at least one
renewable fuel. From a cost perspective offering bioethanol was more
attractive, which makes that the Pump Act has mostly resulted in bioethanol
rather than biomethane or natural gas.
There is no information available on support measures for filling
infrastructure. The minimum share of biogas in the CNG/LNG gas mix is in
every Swiss filling station 10%. The average share of biogas in 2015 was 24.5%.
Besides the implementation of the Clean Power for Transport Directive
(CPT/AFI), the UK is, together with the Netherlands, involved in a study on
innovative natural gas solutions for road transport. Flexible modular natural
gas filling stations have been designed using containers which can easily meet
customers’ needs. The project is partly financed by the European Commission
and will be finished by December 2018.
Overall conclusions Based on the information on the case study countries, the following
conclusions can be drawn in relation to supporting measures to stimulate the
realisation of infrastructure and filling stations:
Public versus private Compared to other countries, France has a low number of public accessible
filling stations, while the majority of filling stations in other countries is
accessible to the public. From the interviews it can be concluded that a large
share is private, because most filling stations have been dedicated to captive
fleets, like garbage trucks. These trucks refuel at low speed overnight and
therefore are not accessible to the public. However, more recently more
attention is given to public accessible fillings stations by AFGNV, so there does
not seem to be a need to address this issue by supporting measures.
The Netherlands
Sweden
Switzerland
United Kingdom

32 March 2017 3.K49 – Supporting mechanisms for the development of biomethane in transport
Matching infrastructure to specific fleets Based on the analysis, France seems to be frontrunner in projects aimed at
providing investment support to projects realising filling stations and demand
for infrastructure at the same time: these projects ensure that at least a
number of vehicles will make use of the infrastructure. This could be seen as a
bonus to the (older) subsidy scheme in the Netherlands where only the filling
station was subsidized.
Obligation Sweden has experienced that an obligation to offer at least one renewable
fuel at a filling station will likely not result in strong increase of natural gas
infrastructure, because other alternatives are less expensive. Italy has
formulated a requirement to realise infrastructure in alternative fuels in (part
of the) public procurement procedures.
Physical link between biogas plants and filling infrastructure Austria has shown that filling infrastructure could also be directly linked to
biogas plants. Although this ensures the consumption of biomethane, a
physical connection might be in many options an expensive option compared to
grid injection or administrative ways to account biomethane to the transport
sector. There are, however, two arguments which might make this an
interesting option for France:
In the interviews several interviewees have mentioned the aspect of
communication to the wider public: biomethane in transport is more
difficult to understand compared to biofuels, where biofuels are actually
blended with the fossil fuels. Aspects like the grid and green certificates
make biomethane less transparent. A direct link to the production plant
might help in raising awareness among the public.
Another reason might be the long distance between biogas plants and the
natural gas grid, which is sometimes also the case in France. This is more
likely to happen in remote areas.
As a result of the differences between France and case study countries the
following measures have been identified as most promising measures to
incentives filling stations and infrastructure:
demand for realisation of public infrastructure in public procurement;
direct link to biogas plants.
3.7 Aspects related to biogas production
Due to the existence of green certificates biomethane can be delivered to the
transport sector in an administrative way. This makes the realisation of the
physical link with the biogas sector and distribution less important.
However, information about these stages of the supply chains has been
collected as well, including information on grid injection and distribution and
biogas and biomethane production. The main findings are shortly discussed
below.
Most producers prefer grid injection, because granted feed-in tariffs. 40% of
the producers cannot benefit from these feed-in tariffs, because their
production plants are too far away.
The national goals on biomethane deployment intend to foster its grid
injection and the purchase at petrol stations. However, many of the biogas
plants in Austria are not situated close to the natural gas distribution grid
France
Austria

33 March 2017 3.K49 – Supporting mechanisms for the development of biomethane in transport
making further extension necessary, but the impacts of and requirements for
these extensions are mostly not part of the feasibility studies carried out.
In general, a legal framework for the injection of biomethane and its
deployment in the transport sector is missing in Austria.
No incentive to feed-in biomethane into the natural gas grid anymore.
Since January 2016 no tax exemption for biomethane are granted anymore.
Interconnection costs are shared between grid operator and the biomethane
producer. In 2015 incentive schemes have been accepted for the biomethane
injected into the grid and guidelines for network operators. Incentives are
focused on biomethane from biogas to produce electricity and heating in
co-generation and CIC-certificates for biomethane as fuel for vehicles, but the
value of these certificates have not been determined yet.
Until 31 October 2016 technical rules were not in place and there was also no
value in place for CIC-certificates. Therefore no biomethane was injected to
the grid. Only demonstration plants, but expectations for 2018 are 225 million
m3 biomethane as transport fuel.
There is a lot of discussion on the future of the role of natural gas in the
energy mix and therefore, also on the future of the gas infrastructure in the
Netherlands, especially in relation to households/heating. Grid operators wait
with allocating their investment accordingly. Biogas production itself has a
strong place within the subsidy scheme (in the form of a tender system) for
renewable energy in general. Biogas granted subsidy under this scheme cannot
be used to meet the blending obligation to avoid double financing.
Biomethane is injected into the gas grid only from a limited amount of
biomethane plants. Hence, 75-80% of the produced biomethane is transported
by trucks to the gas station. There are no support measures to stimulate the
grind injection of biomethane in Sweden.
In Switzerland financial support is granted for investments in new biogas plants
as well as for the feed-in and submission into the grid. The fund consist of
approximatively 2,8 million euro provided by local utilities. Over a period of
three years, producers of biogas and grid operators can receive funding
depending on the quantity of their additional expenditure. Only biogas from
waste and residues but not from food (or cultivated energy plants) are
promoted.
There is no (free) capacity to connect AD plants in the UK. There is also no
incentive for grid operators to accept biomethane.
Overall conclusions Several case study countries, including France, Germany and Austria face
problems in relation to the distance between biogas plants and the natural gas
grid. The various case studies show also that there are different ways to share
connection costs.
Because biomethane upgrading might form a barrier between biogas
production and the use of biomethane in transport. Therefore, a measure
which stimulates the use of biomethane in transport without the need for
biomethane upgrading facilities has been identified as promising measure.
This concerns green gas credits in Sweden, where raw biogas is injected into a
grid and attributed to the transport sector.
Germany
Italy
The Netherlands
Sweden
Switzerland
United Kingdom

34 March 2017 3.K49 – Supporting mechanisms for the development of biomethane in transport
4 Transferability to the French context
4.1 Introduction
In the previous section various aspects of the case study countries have been
compared. Based on a comparison between the situation in France and the
policy framework in the case study countries, a number of measures have been
identified, which currently do not seem to be implemented in France (or could
be improved or applied on a larger scale). The identified measures are taken
from the case studies or were identified through a literature review.
This section provides a description of the French context in Section 4.2.
A description of the identified measures is given in Sections 4.3 and 4.4.
For the assessment of the transferability several interviews have been
conducted with French experts. Interviews have been held by phone.
The interviewees are listed in Table 10.
Table 10 Overview of interviews
Organisation Name
GRDF Mr. Almosni
FNTR Mr. Daly
GRDF Mr. De Singly
French Ministry of environment, energy and the sea Mrs. Chini
French Ministry of environment, energy and the sea Mr. Denieul
4.2 French context
The French context should by now become clearer from the data collected in
the case study comparison. However, the interviews were useful in order to
contextualise and to gain further insight into the current attitudes of various
stakeholders regarding the support for biomethane in transport.
New window of opportunity First of all, France faces a new window of opportunity due to the national
elections in April/May 2017. This opens the possibility for a review of the
policy framework for biomethane in transport which could last for at least five
years. The target for NGV in transport is seen as a strong signal from the
national government to the various actors, but requires more specific policy
instruments in order to reach these objectives.
Driven by local air quality policies Despite the national objectives natural gas in transport seems to be more
driven by regional and local authorities and their aim to improve air quality
than by the need to decarbonise the transport sector. Many cities have
implemented local restrictions, like low-emissions zones, which require
companies active in these areas to invest in less polluting vehicles. For heavy
duty vehicles and commercial vehicles in general natural gas is currently the

35 March 2017 3.K49 – Supporting mechanisms for the development of biomethane in transport
most cost-effective option to comply with new requirements, from total cost
of ownership (TCO) perspective, especially compared to electric vehicles.
According to the interviewees, the impact on TCO is very important:
supporting measures targeting the uptake of biomethane should only to a
limited extent affect the TCO. Companies will only consider biomethane as an
option in case their customers are willing to pay the additional price for
biomethane. An important argument for this is how competitive French
transport companies are in comparison with, in particular, Central European
transport companies. These have a competitive advantage in terms of labour
costs.
Room to invest and willingness to pay of customers Based on the interviews it can be concluded that local authorities have more
room to invest in biomethane projects than transport companies and
agricultural businesses. Transport companies face strong competition from
outside France and agricultural businesses are often too small to invest in
biogas projects, while multiple actors getting involved in one project often
complicate preliminary procedures which pre-empt the launch of these
projects. Local authorities have more room to invest than transport companies
and are able to accept a longer Return On Investment (ROI) than private
companies; private companies only accept a return of investment of 4-5 years,
while local authorities may accept payback times of ten years.
Market distortion According to the interviewees, supporting measures that increase the total
cost of ownership, like some measures aimed at the uptake of biomethane,
might even harm the developments of natural gas in transport. This because
the natural gas market, as niche market in the transport sector, is still
assessed to be very fragile. The interviewees, therefore, recommend to first
build a mature NGV market before focusing on biomethane.
Although transport companies will not benefit from an increase in the price of
biomethane, biogas projects might benefit from a higher demand and this
higher price for biomethane. This will likely improve the business case.
The fact that price increases might impact the various aspects of the supply
chain in a different way should be taken into account and considered at the
time of decision making process. Impact assessment can help to investigate
potential impacts. In addition to the fear for market distorting effects at the
demand side, there is also a lack of green certificates to meet an increase in
demand (according to the interviews much of the green certificates sold for
fuel use are already needed by the Carréfour initiative). This means that any
other initiative from a larger company might face a shortage of green
certificates. For these two reasons, the realisation of cost reduction in
biomethane production is a key priority and makes that many measures aimed
at an increase of biomethane in transport are likely to be hindered by barriers
at the supply side.
Two-step approach Currently natural gas is one of the best ways to meet the air quality standards
of environmental zones/low-emissions zones, especially for heavy duty
vehicles. However, this might change in the future: as result of stricter
emission standards diesel vehicles are likely to also achieve very low
emissions. The cost, performance and CO2 reduction of electric vehicles will

36 March 2017 3.K49 – Supporting mechanisms for the development of biomethane in transport
also improve.10 Natural gas might then no longer be the preferred option,
unless it can offer even lower CO2 emissions. Therefore, natural gas should be
perceived to be the first step towards a 100% biomethane uptake by the
transport sector.
This transition could be compared to the market penetration of electric
vehicles: first electric vehicles are brought on the market, secondly, the
electricity mix will become decarbonized. In case of biomethane the step from
natural gas to biomethane will be very important to further realise the
decarbonisation potential: natural gas itself reduces carbon emissions by
10-15% and full uptake of biomethane could reduce CO2 emissions by up to 80%
or 95% depending on the feedstock used to produce biomethane. A stagnation
of the shift from natural gas to biomethane might endanger the realisation of
long term decarbonisation targets for the transport sector. Therefore, making
biomethane in transport an integral part of the decarbonisation strategy for
the transport sector is a key priority as well.
First of all, biomethane is, in a few of the case study countries a more integral
part of the current national implementation of the Renewable Energy Directive
and Fuel Quality Directive. It is important to link biomethane not only to air
quality policies, but also to the national decarbonisation strategy of the
transport sector. Not only by having targets in place in national strategies, but
also by means of specific obligations for stakeholders. In this way these
stakeholders can be held accountable for the realisation of these targets.
Secondly, at the vehicle level there are some options to provide additional
incentives for the use of biomethane at the time of purchase. Many of the
vehicle tax exemptions granted are based on TTW emissions and therefore do
not benefit vehicles driving on biomethane. This because the main emission
reduction occurs during well-to-tank phase (CO2 is ‘stored/captured’ in the
biomass sources), which is responsible for low or even negative emissions. It is,
however, complicated to verify the use of biomethane by a vehicle owner.
As the interviewees have also pointed out the need to develop a mature
natural gas market before shifting to biomethane, providing strong incentives
for the use of biomethane does not seem to be the best option on the short
term, especially for individual vehicle owners. Because of the strong
competition in the transport sector a measure has been identified, which helps
vehicle owners to overcome the additional investments costs for natural gas
vehicles compared to diesel or petrol vehicles. This measure differs from most
fiscal incentives for vehicle uptake applied in the case studies, as most of
these take the form of subsidies.
Because of the high investment needed to upgrade biogas, a measure applied
in Sweden to couple regional biogas production to regional biomethane
consumption in transport, in an administrative way, before investing in
upgrading facilities seems to be a potential good measure to shift from natural
gas towards biomethane. This is described in more detail in Section 4.4.6.
10 www.afdc.energy.gov/vehicles/natural_gas_emissions.html

37 March 2017 3.K49 – Supporting mechanisms for the development of biomethane in transport
4.3 Identified measures
Before zooming in on individual supporting measures it should be noted that
the case studies have shown that the countries being successful in the
stimulation of natural gas and/or biomethane in transport have been
successful because of a mix of individual measures. These broader strategies
stimulate various parts of the supply chain, although each country has
different focus areas. It is therefore hard to assess the effectiveness of
individual measures. Also note, that some of the case study countries, like
Italy and Sweden, already have a long history in the support for natural gas
and/or biomethane. This proves that the duration of some measures, and
therefore ensuring a long term perspective is taken, is also an important
aspect.
The following measures have been identified as potential supporting measures,
because these have not yet been implemented in France (or not to the same
extent) and have turned out to be successful or at least have played a
significant role in natural gas developments or biomethane in transport
developments in case study countries.
Uptake of fuel:
lower fuel tax for bioNG (Sweden);
including biomethane in the blending obligation (the Netherlands,
Germany, Italy, UK).
Use in various transport modes:
low-interest loans for commercial vehicles (Egypt).
Infrastructure and filling stations:
demand for realisation of filling infrastructure in public procurement;
direct link to biogas plants.
Other measures related to distribution and biogas production:
Green Gas system Göteborg.
4.4 Description of the individual measures
For each measure a description can be found below.
4.4.1 Including biomethane in the blending obligation for fuel suppliers
Link biomethane to decarbonisation policies rather than only air quality policy Biomethane and natural gas offer both more or less the same benefits in terms
of air quality compared to diesel. In addition, biomethane also results in a
significant WTW reduction of GHG emissions (about 80-95% depending on
feedstock use), while natural gas only reduces GHG emissions to some extent
(about 10-15%) compared to conventional fuels. Most supporting measures in
France are, however, linked to air quality problems in larger cities. From an
air quality perspective, there seems to be no need to pay the additional cost
for biomethane. To justify the higher cost of biomethane, biomethane should
be linked to the national or local policies to decarbonise the transport sector
and to policies aimed at increasing the share of renewable energy in transport.

38 March 2017 3.K49 – Supporting mechanisms for the development of biomethane in transport
Blending obligation An important difference between France and other case study countries is the
fact that France has not included biomethane in the blending obligation, which
fuel suppliers have to fulfil in order to reach the renewable energy targets for
the transport sector. Countries like the Netherlands, Italy, the UK and
Germany all have the option to fulfil the biofuel quota partly through
biomethane, mostly in the form or tradable certificates enabling the exchange
for market prices. The new Renewable Energy Directive (RED II), as proposed
for the post-2020 period, might give renewed importance of including
biomethane in the blending obligation. The target for renewable energy in
transport of 6.8% in combination with a declining role for land based biofuels
will require a higher contribution from renewable electricity, advanced
biofuels and biogas.
Double counting provision Although biomethane is mostly more expensive compared to first generation
biofuels, the double counting provision strongly improves the business case of
biomethane in transport: half the quantity of biomethane is required to meet
the same target.
Positive business case In the Netherlands the inclusion of biomethane by means of tradable biotickets
and now Renewable Fuel Units means that the use of biomethane in transport
has resulted in the most positive business case for biomethane from sewage
sludge compared to the use in other sectors, even without the subsidies (in the
Netherlands it is forbidden to receive a subsidy and use the biomethane to
meet the blending obligation at the same time, because this will not result in
additional biomethane on the market).
Relevant policy developments There are, however, some discussion points, which should be taken into
account when considering this measure to be implemented in France as well:
Double counting provision: according to the recently published Winter
Package of the European Commission there will probably no longer a
double counting provision after 2020. In the Netherlands there is currently
also a discussion in the Dutch Parliament to abandon double counting,
because the targets of the ILUC-Directive provide an incentive for
advanced biofuels as well. It is still uncertain what the political decision
will be. The new policy framework probably implies that France can still
implement the double counting provision, but that this will not count
towards the targets set at the European level.
Emission reduction versus volumes: Member States might shift from an
obligation based on volumes to an obligation based on emission reduction,
as is the case in Germany. This would be a positive development for
biomethane, because biomethane mainly results in higher emission
reductions compared to first generation biofuels.
FQD blending limits: currently, fuel suppliers face difficulties in meeting
the blending obligation, because the current blending obligation is above
the blending limit for FAME (B7) as laid down in the Fuel Quality Directive.
Because it is unclear when the Commission will allow a higher biodiesel
content in regular diesel, biomethane seems to be a good alternative
together with fungible biofuels (like HVO, which are also most expensive
than FAME).
Implementation of the ILUC Directive: the cap on land based biofuels will
limit the role of biofuels from food crops and will result in a stronger role
of biofuels or biogas from waste and residues. This results in opportunities

39 March 2017 3.K49 – Supporting mechanisms for the development of biomethane in transport
for biogas from waste and residues, but some other types of biogas
produced partly from food crops, like maize, will be limited. The EU
Winter Package is in line with the ILUC Directive, because it proposes to
further limit food/land based biofuels (however, some stakeholders think
these types of biofuels should be completely eliminated by 2030).
Price impacts: no information could be found on market distorting effects.
Based on the interviews it can be concluded that including biomethane in
the blending obligation would be good for biogas production, because of
the higher demand for green certificates and probably a higher price.
The current proposed revisions of the system of guarantees of origins in
the EU Winter package might change the business case of guarantees of
origins: RED II envisages that GOs would no longer be the property of the
producer, but of the state. This makes that a higher price would have no
impact on producers and the business model, but rather on state revenue.
This is different in case of tradable units under a blending obligation, like
Renewable Fuel Units in the Netherlands. This might still impact the price
of and demand for biogas production. However, exact impacts will depend
on the final text and the implementation of the RED II.
Advantages creates a level playing field for biofuels and biomethane;
makes biomethane a more integrated part of the decarbonisation strategy
for the transport sector;
a premium price might help to improve the business case of biogas
production.
Disadvantages Might increase the cost of biomethane as result of higher demand.
Does not fit within the current French system, because France has specific
targets for each fuel. Because the current share of NG is so low, having a
target for bioNG in NG will not have a large impact. There are already
targets in place in France, but these targets are part of the high level
strategy, but this still requires implementation in specific policy
instruments.
Because the end is near of the current EU policy framework.
Redesigning the systems might better take place after 2020.
4.4.2 Fuel tax differentiation between natural gas and/or biomethane There are two strong examples on how fuel tax differentiation can impact the
share of natural gas vehicles and/or the share of biomethane in the transport
sector. A fuel tax exemption for natural gas is also applied in France, but the
example of Italy is important as it shows the extent to which a measure aimed
at fuel uptake is extremely linked to the vehicle uptake and that a market can
respond very quickly to decreasing support, thus showing significant
policy-dependency.
Italy In Italy, the country with the highest share of NGVs, natural gas developments
have been partly realised by the price difference between natural gas and
petrol and diesel. The following graph shows a lower market share of new
purchases of CNG vehicles as a consequence of the lower fuel price gap
between petrol, diesel and natural gas. These price gaps are partly caused by
favourable taxes for natural gas. Note that the Italian tax level of petrol is
among the highest in the European Union. CNG is on average 64% cheaper than
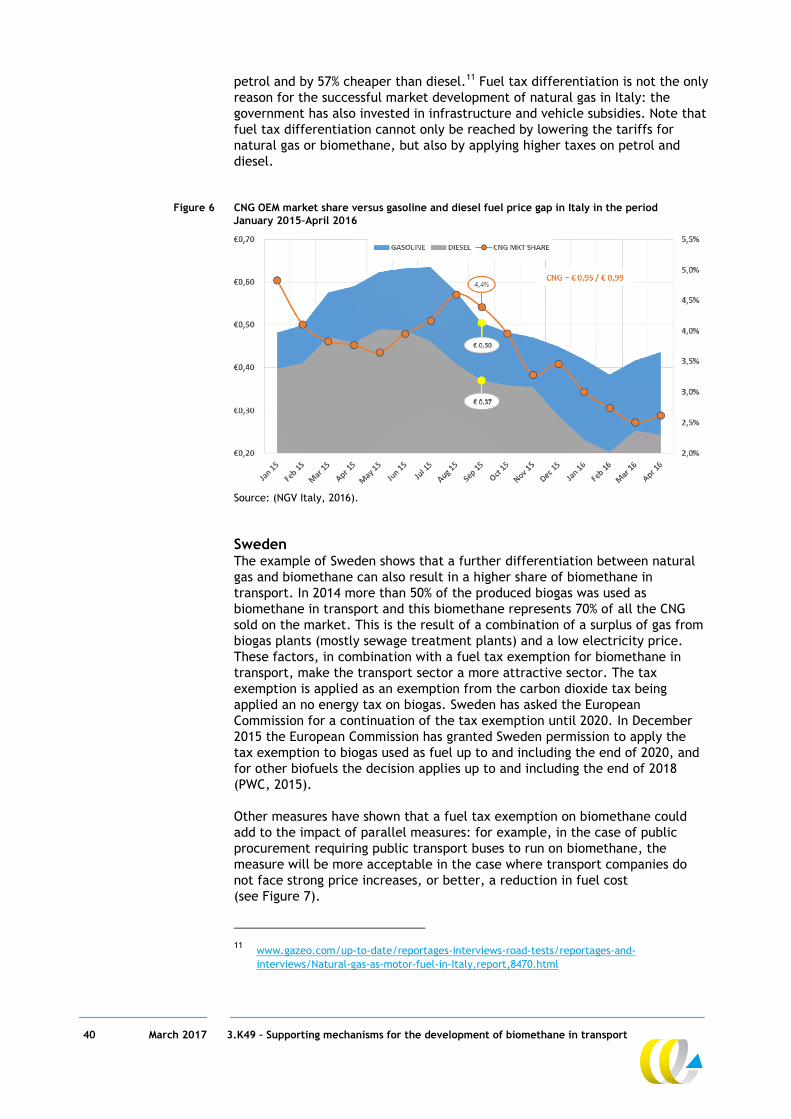
40 March 2017 3.K49 – Supporting mechanisms for the development of biomethane in transport
petrol and by 57% cheaper than diesel.11 Fuel tax differentiation is not the only
reason for the successful market development of natural gas in Italy: the
government has also invested in infrastructure and vehicle subsidies. Note that
fuel tax differentiation cannot only be reached by lowering the tariffs for
natural gas or biomethane, but also by applying higher taxes on petrol and
diesel.
Figure 6 CNG OEM market share versus gasoline and diesel fuel price gap in Italy in the period
January 2015–April 2016
Source: (NGV Italy, 2016).
Sweden The example of Sweden shows that a further differentiation between natural
gas and biomethane can also result in a higher share of biomethane in
transport. In 2014 more than 50% of the produced biogas was used as
biomethane in transport and this biomethane represents 70% of all the CNG
sold on the market. This is the result of a combination of a surplus of gas from
biogas plants (mostly sewage treatment plants) and a low electricity price.
These factors, in combination with a fuel tax exemption for biomethane in
transport, make the transport sector a more attractive sector. The tax
exemption is applied as an exemption from the carbon dioxide tax being
applied an no energy tax on biogas. Sweden has asked the European
Commission for a continuation of the tax exemption until 2020. In December
2015 the European Commission has granted Sweden permission to apply the
tax exemption to biogas used as fuel up to and including the end of 2020, and
for other biofuels the decision applies up to and including the end of 2018
(PWC, 2015).
Other measures have shown that a fuel tax exemption on biomethane could
add to the impact of parallel measures: for example, in the case of public
procurement requiring public transport buses to run on biomethane, the
measure will be more acceptable in the case where transport companies do
not face strong price increases, or better, a reduction in fuel cost
(see Figure 7).
11 www.gazeo.com/up-to-date/reportages-interviews-road-tests/reportages-and-
interviews/Natural-gas-as-motor-fuel-in-Italy,report,8470.html

41 March 2017 3.K49 – Supporting mechanisms for the development of biomethane in transport
Figure 7 Volumes of CNG/biomethane used in Sweden (GWh)12
Advantages consumers/companies are likely to go for the cheapest option;
might make it easier to demand the use of biomethane in public
procurement without resulting in disproportional cost;
might enable systems like the SmartCard system in Egypt, which we outline
below: this requires a price difference;
strong relation between vehicle sales, because of operational cost.
Disadvantages shortage of green gas certificates in France:
other fuels might become more expensive;
competition between natural gas and biomethane;
requires sufficient green gas certificates on the market to cover higher
demand for biomethane in case it becomes more attractive due to the
lower price.
4.4.3 SmartCard system in Egypt The following supporting measure is not in place in any of the case study
countries, but has been found in the literature review carried out for the
project and is nonetheless a good example of how the vehicle uptake of NGVs
can be stimulated without subsidies. The so-called SmartCard system in Egypt
has resulted in converting many vehicles to natural gas vehicles, in particular
taxis.
The additional cost for natural gas vehicles can be a financial burden for
drivers, which negatively affects the total cost of ownership. To overcome this
burden, the financing scheme in Egypt provides no cost ‘loans’ to drivers in
order for them to convert their vehicles. This has been a cooperation with
local banks. The conversion is provided for ‘free’. Drivers repay this
12 wwww.archiwummotoryzacji.pl/images/AM/vol71/PIMOT_71_Backman_7-20.pdf

42 March 2017 3.K49 – Supporting mechanisms for the development of biomethane in transport
investment by paying the same prices as petrol, for the natural gas they
consume until the loan has been repaid. After the repayment period drivers
directly benefit from the lower fuel costs. The repayment system works with a
so-called SmartCard system which can be used at filling stations to pay for fuel
use. The payback period strongly depends on the price differences; therefore,
no exact payback time can be given. No information could be found in the
literature sources on the durations and payback periods associated with this
measure.
To participate in the scheme any car owner who would like to convert his or
her car to an NGV could contact an NGVs operating company. This company
can approve to join the smart card program. After this approval, the bank
transfers the total conversion cost to the NGVS operating company and issues a
smart card to the vehicle owner. With the smart card the vehicle owners pays
an equivalent to the price of petrol until he has paid back his loan. The role of
various actors is presented in a schematic overview below.
Figure 8 Schematic overview of the SmartCard scheme to convert vehicles to NGVs13
Such supporting measure can be a joint partnership between local banks, gas
companies, filling stations and national or local governments. It is known
whether it is profitable for the local banks to participate, but there is portably
construction possible, where governments provide an incentive to local banks
to make it attractive to join. Regarding filling stations, it might be an option
to link the Smart Card system to a specific brand of filling stations:
participating in the scheme will make that the brand consisting of various
filling stations has a minimum number of clients during the payback periods
and has a better basis to expand the number of filling stations in an area.
This measure does not directly stimulate the uptake of biomethane in
transport, but in line with the interview outcomes a stronger uptake of natural
gas in transport must be reached before the transition towards biomethane
can truly take place. In case fiscal measures are implemented that result in
lower prices for biomethane compared to natural gas and/or petrol and diesel
this scheme will automatically result in a higher uptake of biomethane.
A higher price difference between petrol/diesel and natural gas/biomethane
13 http://css.escwa.org.lb/SDPD/3451/1-2.pdf

43 March 2017 3.K49 – Supporting mechanisms for the development of biomethane in transport
will ensure that loans are paid back in a shorter time period. Note that it is
important to guarantee a long term security with regards to the natural gas
price compared to diesel/petrol.14 15 16
Advantages No government support needed or any form of subsidies. There will be
some cost associated with setting up the system, but the vehicle owner
will pay back the additional cost for the natural gas vehicle.
Can stimulate vehicle uptake also for individual vehicle owners.
Links vehicle uptake to filling infrastructure and by doing so might ensure
higher demand for natural gas or biomethane in case a filling station is
part of the system.
Disadvantages requires lower natural gas price/biomethane price;
requires sufficient filling infrastructure: a certain share of filling stations
need to be involved to make it attractive for a user;
system of loans might increase the administrative burden, because an
administrative system needs to be in place.
4.4.4 Demand for realisation of filling infrastructure in public procurement As described in the previous section, Italy has made the development of
natural gas infrastructure part of public procurement procedures (within the
DDL Competition in particular), which demonstrates that the need/obligation
to develop an alternative fuel network is confirmed, unless there are technical
and economic obstacles that can be proven and which will then be reviewed
by the authorities involved. The development needs of an alternative fuel
infrastructure are linked to the Clean Power for Transport Directive (EC,
2014).
It is not exactly clear what the exact requirements are and in what cases these
requirement are applied. Because of the lack of data on the specific
requirements in the public procurement procedures further research is
required, for example by consulting the Italian government.
Below we present some potential advantages and disadvantages:
Advantages can contribute to the gradual developments of both vehicle and
infrastructure at the same time;
shows the commitment of the government to the development of the
natural gas infrastructure for transport and can strengthen the role of the
government as launching customer;
is likely to result in cost-effective realisation of infrastructure, because it
involves tendering of contracts.
14 www.nigerianbestforum.com/index.php?topic=305795.0;wap
15 http://css.escwa.org.lb/SDPD/3451/1-2.pdf
16 https://cleancities.energy.gov/files/u/news_events/document/
document_url/6/ngv_policymaking.pdf

44 March 2017 3.K49 – Supporting mechanisms for the development of biomethane in transport
Disadvantages This is only useful in case filling infrastructure forms a barrier towards the
uptake of natural gas and biomethane. For example, when the number of
filling stations is lagging behind compared to the levels of vehicle uptake.
Requires close coordination of distribution of filling stations, preferably at
the regional or national level. Local governments might not have sufficient
oversight to be involved.
Might increase the projected cost of government support to disproportional
height.
4.4.5 Direct link to biogas plants From the case studies it became clear that Austria in particular had built some
biomethane filling stations which are directly linked to biogas plants. This also
seems to be the case in France and could be a logical choice in case garbage
trucks drive on biomethane produced from collected waste. Because the issue
of visibility and public acceptability of biomethane in transport among the
general public has been mentioned several times in the interviews, this
measure has been selected to put forward a solution to these issues.
The advantages and disadvantages of establishing a direct link between
biomethane production and filling stations are listed below.
Advantages in case there is a need for filling infrastructure nearby biogas production,
realising a direct link might avoid grid injection and thus costs;
in some countries, like Austria, tax exemptions are granted for biomethane
in case the biomethane is consumed on the spot;
establishing a direct link might contribute to the circular economy in a
region;
consumers might better understand the biomethane supply chain in case
they know the origin of the biogas and location of production.
Disadvantages A direct link might result in unnecessary cost; these could be avoided using
green certificates/guarantees of origin.
Linking a filling station only to one biogas plant makes a filling station
dependent on the production of the specific biogas plant as it is not
directly connected to the natural gas network, but only to that specific
biogas plant.
Distances between biogas plants and preferred locations of filling stations
can be very long. This can, however, also be the case for the natural gas
grid making the realisation of filling stations with a direct link a better
option in that case. These considerations clearly explain why a direct link
between biogas plant and a filling station should be assessed on a case by
case basis.
4.4.6 Green gas credits in Sweden In terms of linking biogas production to the transport sector investments are
also needed to upgrade the biogas to biomethane and for grid injection and
distribution. Especially at the early stage of development, where the demand
for biomethane in transport is still uncertain, a lack of investments could form
financial and technical barriers. The following example illustrates how
biomethane production can be stimulated in transport before any investment
in upgrading capacity takes place.

45 March 2017 3.K49 – Supporting mechanisms for the development of biomethane in transport
The system applied in Göteborg is an example of how credits can be traded in
an administrative way, while stimulating biogas production and use in
transport at the same time. From 2001 onwards Göteborg required the bus
operators to use gas buses in combination with an increasing amount of
renewable fuels. At that time there was however no upgraded biogas
available. Therefore the concept of ‘green gas credits’ was developed.
The company Göteborg Energy owns the ‘town gas’ grid, which is primarily
used for cooking. On an annual basis Göteborg Energi purchased a certain
amount of biogas from the waste water treatment plant of Göteborg. The raw
biogas is then mixed into the ‘town gas’ grid. The ‘town gas’ is a mixture of
50% methane and air and the share of raw biogas is limited to a maximum of
40%, because of quality aspects. Göteborg Energy sells green gas credits to
Fordonsgas Väst, a supplier of gas as transport fuel, which was allowed to sell
a corresponding amount of CNG fuel from the NG grid as green gas. Revenues
of this project in combination with national funding should contribute to the
realisation of an upgrading plant planned for 2006 (Miljoinfo, 2001-ongoing)
(NICHES, 2011).
Advantages Does not require direct link between transport and biogas production.
Removes biomethane from being a potential barrier.
Investments do not have to be arranged directly. This type of projects
makes it possible to test the demand for biomethane in a region before
actually investing in a more comprehensive development scheme.
Although this specific measures might not be applied in France, generating
funds somewhere before actually investing might also be applied in a
different way.
Might help to make the link between local biogas production and local
consumption of biomethane more visible to the public and to raise
awareness without a physical link.
Disadvantages Can only be used if you have raw biogas and town grid. This measure will
not be helpful in case biomethane production and grid injections are
sufficiently developed.
A well-working system of green certificates make these kinds of measures
unnecessary and a national market might be preferred over local
initiatives.
Assessment of the transferability to the French context The system of Green Gas credits might be hard to transfer to the French
context and other EU Member States, because it is mostly not possible to
inject raw biogas into an existing grid. Most cities do not have a town grid,
such as in Göteborg.
However, this example shows the feasibility of one import aspect: the option
to pre-finance developments in biomethane production. Pre-financing will
enable generating investments before actual investments are made to link
biogas production to application in the transport sector. Therefore, this
example might provide as inspiration to generate funds before the realisation
of biomethane conversion plants in an area.
To make it more specific: in case successful projects have led to more natural
gas filling infrastructure in a region selling biomethane might be an option as
well. This can be done through green certificates, but this will only cover
existing biogas/biomethane production. In case there is a desire to realise

46 March 2017 3.K49 – Supporting mechanisms for the development of biomethane in transport
more biogas production/biomethane upgrading in the region itself,
investments in production capacity can be stimulated by pre-financing.
A system can be set up to let users pay a premium which can be invested in
regional biogas/biomethane production.
4.5 Conclusions
The transferability of the identified measures to the French context has been
assessed as follows:
Including biomethane in the blending obligation does not seem to be
feasible on the short term, but might be part of any reforms on the
medium term as part of the new post-2020 EU policy framework.
Fuel tax differentiation, including lower taxes for bioNG compared to NG
seem to be the most effective way to stimulate the uptake of biomethane
in transport. Due to the shortage of green certificates and in order not to
harm the natural gas market it is recommended to implement this
gradually or at least announce it pre-emptively before actual
implementation.
Low-interest loans for vehicles, as is the case in Egypt, seem to be a risk-
free option that can be complementary to other measures. A pilot project
can be started in a large city like Paris, which already has natural gas
infrastructure for transport, to see whether this measure also works in
France.
Depending on the type and size of tenders, requiring the realisation of
filling infrastructure in public procurement seems to be a good option.
However, attention has to be paid to the amount of vehicles that will make
use of this filling infrastructure and the location and distribution of filling
stations in an area. Filling stations need to add value to the current
system.
Establishing a direct link between filling stations and biogas plants and
understanding among consumers and to increase the visibility of
biomethane in a municipality.
The extent to which the Green Gas system in Göteborg would be helpful
remains opens for further analysis: it seems to be more helpful to realise a
better market for green gas certificates and to increase the availability of
these certificates.
47 March 2017 3.K49 – Supporting mechanisms for the development of biomethane in transport
5 Conclusions and recommendations
Based on the case study comparison in this study the following conclusions can
be drawn:
Measures are not necessarily ineffective, but might take some more time First of all, the further development of both the natural gas market in
transport as well as the uptake of biomethane in transport will take time.
France does not yet have a strong natural gas market in transport and only
very limited biomethane consumption in the transport sector. Regarding the
development of the natural gas market France has implemented many
measures, which have also been implemented in other countries.
The countries with a far higher share of natural gas vehicles and natural gas
consumption in transport, like Sweden and Italy, have in general been
promoting natural gas use in transport for a longer period of time. For
example, the history of biogas in Sweden goes back to biogas production at
municipal wastewater treatment plants since 1960’s.17 The main reason for
this was to reduce sludge volumes. After World War II Italy took an early lead
in utilizing gas resources, resulting in a strong national natural gas market and
consequently a stronger role for natural gas in transport.18
This implies that the measures that France is currently taking are not
necessarily less effective or ineffective, but might require some additional
time.
Improve the system of green certificates/guarantees of origin Secondly, increasing the share of biomethane in transport gradually would also
allow the further growth and development of the market for green
certificates. The current shortage of green certificates should be solved,
because it is one of the main barriers mentioned for the current uptake of
biomethane in transport. Any to be introduced policy incentive for biomethane
will be hindered due to a shortage of green certificates and thus will require
to further stimulate biomethane production or to either improve the system of
certificates
Make the link between biogas production and biomethane in transport more visible to the public Thirdly, based on the interviews the link between biogas and actual
consumption by vehicles seems to be hard to understand by the general public,
especially when it is arranged in an administrative way through green
certificates. Although linking direct biogas plants to a filling stations and
specific fleets in a city seems to be more costly than arranging biomethane
uptake in an administrative way, a direct link might contribute to the visibility
and better understanding of the supply chain.
17 Swedish Gas Association, 2011, Biogas in Sweden.
18 Hayes, 2004, Algerian gas to Europe: the transmed pipeline and early Spanish gas import
projects.

48 March 2017 3.K49 – Supporting mechanisms for the development of biomethane in transport
Integrate biomethane more in the decarbonisation strategy of the transport sector and create a level playing field between biofuels and biomethane France does not have many measures that focus on the link between biogas
production and natural gas and/or biomethane in transport. Not many options
promote the integration of both sectors. Although bioNGV targets have been
set at the national level, the measures that are implemented to realise these
targets focus either on biogas production or on the transport sector. In case
bioNGV should contribute to long term GHG reduction in the transport sector,
it is recommended to work towards an integrated approach, which will provide
an incentive to use biomethane in the transport sector in a structural way.
Of the identified measures, extending the scope of the blending obligation
seems to be the best option in order to increase the level playing field
between biofuels and biomethane, like is also the case in for example the
Netherlands, Italy, Germany and the United Kingdom. Although this does not
seem to be feasible or of any impact under the current system, the role of
biomethane could be better taken into account in any revision of the system,
for example as part of their revision of the post-2020 legal framework. Note
that the blending obligation should also be compared to the overall BioNGV
target (20% of all NG should be made up of biomethane by 2023), but it is
important that stakeholders, like fuel suppliers are held responsible for this
target. A national target like the BioNGV target therefore requires further
implementation.
Introduce measures gradually From the interviews it became clear that it is important to first develop the
NGV market further, before biomethane can play a significant role. In addition
to this, the total cost of ownership has been mentioned several times as the
indicator which determines whether companies will decide to invest or not.
These two reasons require for a long term policy approach in which measures
are announced in advance and are guaranteed for a certain amount of years: a
long enough period of time on which to base investment decisions on.
Fuel tax differentiation between NG and biomethane can be an enabler for other policy measures Sweden and Switzerland show that fuel tax differentiation between NG and
biomethane can result in significant shares of biomethane in transport.
Italy has shown the impact changes in natural gas fuel taxes can have on
vehicle sales. In France, a further differentiation can be gradually introduced,
which will make biomethane cheaper compared to natural gas. Case studies
(for example Sweden and Egypt) have shown that other policy incentives will
also benefit from a fuel differentiation: for example, including a biomethane
requirement in public procurement is more acceptable in case this does not
increase costs significantly. For example, in case of procurement of buses in
Sweden.
Strengthen the natural gas market further Because France has a fuel tax differentiation between diesel and petrol and
natural gas, low-interest loans for vehicles paid back with a similar structure
as the one implemented in Egypt might further help to increase the vehicle
uptake without considerable government support. This will require various
stakeholders from the supply chain to work together. Projects like these do
also seem to be feasible for local governments and can complement projects
realising infrastructure and vehicle fleets at the same time. Increasing vehicle
penetration any further in the region might help to make the filling stations
profitable on the short term.

49 March 2017 3.K49 – Supporting mechanisms for the development of biomethane in transport
Maintain the focus on HDV France is a frontrunner in specifically targeting heavy duty vehicles, which
seems to be justified from an environmental perspective and in light of the
potential of other decarbonisation options, like the electrification of passenger
cars. While other vehicle market segments face competition from electro-
mobility (especially in Germany), this might be less the case in France. It is
therefore recommended to maintain this approach.
Overall, the case study countries have shown that a high share of biomethane
in transport is mostly the result of a combination of various policy measures
used together. This list is therefore non-exhaustive and more detailed
information can be found in the annexes.
Follow the front runners Altogether, Sweden can be identified as front runner in biomethane uptake
and Italy in terms of the NGV market. It is therefore recommended to keep a
specific eye on the development of NG and bioNG in transport in Sweden and
Italy, since the policies and underlying strategy of these two countries seems
to fit best to the French situation. One has to keep in mind that the policy
measures in these countries form part of a broader long term strategy build
also on national circumstances. These policies are, for example, not only
driven by decarbonisation policy objectives, but are also linked to issues, like
energy diversification and waste management.

50 March 2017 3.K49 – Supporting mechanisms for the development of biomethane in transport
6 References
Atee, 2014. White book for biogas: a multiform renewable energy, with a
strategic role for energy transition, http://atee.fr/sites/default/files/2014-
04_livre-blanc-biogaz_web_0.pdf: Atee (Technical Association for Energy and
Environment).
Atee, 2016. Interview with Marie Verney on 18.04.2016. sl:Atee (Technical
Association for Energy and Environment).
Backman, M. & Rogulska, M., 2016. Biomethane use in Sweden. The Archives
of Automotive Engineering = Archiwum Motoryzacji, 71(1), pp. 7-19.
Biomass Policies, 2015. Outlook of spatial biomass value chains in EU28
(Deliverable 2.3), Brussels: EC/Biomass Policies.
Biomass Policies, 2015. Scenarios for Biomass Policies (Deliverable 2.1),
Brussels: EC/Biomass Policies.
Biosurf, 2015. Report on current and future sustainable biomass supply for
biomethane production, www.aebig.org/wp-
content/uploads/2015/01/BIOSURF-D4.2.pdf: Biosurf.
BMLFUW, ongoing. Klimaaktiv mobil. [Online]
Available at: www.klimaaktiv.at/mobilitaet.html
[Accessed 2016].
CBS, 2012. Co-vergisting van dierlijke mest 2006–2011. Tables 4.2.1 and
4.2.2., Den Haag: CBS.
CE Delft, DLO and Eclareon, 2016. Optimal use of biogas from waste streams -
An assessment of the potential of biogas from digestion in the EU beyond
2020, Brussels: EC DG Energy.
Clean Fuels Consulting, 2014. NGVs Past & Prologue Lessons Learned to Create
Deployment Strategies for Commercializing NGVs Webinar 3 Natural Gas
Vehicles: Role of Government – Policymaking and Strategy Process,
presentation 15 December. [Online]
Available at: https://cleancities.energy.gov/files/u/news_events/document/
[Accessed 2016].
Department for Transport, 2015. Implementing the FQD 7a Working Group.
[Online]
Available at:
www.gov.uk/government/uploads/system/uploads/attachment_data/
EBA, 2016. Statistical Report 2016, Brussels: European Biogas Asspciation
(EBA).
EC DG Environment, 2015. Summary note on biogas status and trends in EU.
[Online]

51 March 2017 3.K49 – Supporting mechanisms for the development of biomethane in transport
Available at: http://ec.europa.eu/environment/water/water-
nitrates/pdf/Summary%20document%20Biogas.pdf
[Accessed 23 November 2016].
EC, Mobility and Transport, n.d. Clean transport, Urban transport: Clean
Vehicles Directive. [Online]
Available at:
https://ec.europa.eu/transport/themes/urban/vehicles/directive_en
EC, 1998. Directive 98/70/EC of the European Parliament and of the Council of
13 October 1998 relating to the quality of petrol and diesel fuels and amending
Council Directive 93/12/EEC. Official Journal of the European Communities,
L350(28-12-98), pp. 58-67.
EC, 2009a. Directive 2009/28/EC of the European Parliament and of the
Council of 23 April 2009 on the promotion of the use of energy from
renewable sources and amending and subsequently repealing Directives
2001/77/EC and 2003/30/EC, Brussels: European Commission.
EC, 2009b. Directive 2009/30/EC of the EU Parlement and the Council
amending Directive 98/70/EC as regards the specification of petrol, diesel and
gas-oil and introducing a mechanism to monitor and reduce ghg emissions and
amending CD1999/32/EC .... Official Journal of the European Union, L140(5-6-
2009), pp. 88-113.
EC, 2009c. Directive 2009/33/EC of the European Parliament and of the
Council of 23 April 2009 on the promotion of clean and energy-efficient road
transport vehicles (Text with EEA relevance). Official Journal of the European
Union, L120(15-5-2009), p. 5.
EC, 2014. Directive 2014/94/EU of the European Parliament and of the
Council of 22 October 2014 on the deployment of alternative fuels
infrastructure Text with EEA relevance, Brussels: European Commission.
ECN & DNV GL, 2015. Eindadvies basisbedragen SDE+ 2016, Petten: ECN.
ECN, 2015. Production of Green Gas through Biomass Gasification in the
Netherlands, Petten: ECN.
E-cube, 2015. Assessment of the Biogas sector in France. [Online]
Available at: http://atee.fr/sites/default/files/2015-11-26_etat-des-lieux-
biogaz_rapport_final.pdf
[Geopend 12 April 2016].
EU, 2015a. Council Directive (EU) 2015/652 of 20 April 2015 laying down
calculation methods and reporting requirements pursuant to Directive
98/70/EC of the European Parliament and of the Council relating to the quality
of petrol and diesel fuels. L107(25-4-2015), pp. 26-67.
EU, 2015b. Directive (EU) 2015/1513 of the EP and of the Council of amending
Directive 98/70/EC relating to the quality of petrol and diesel fuels and
amending Directive 2009/28/EC on the promotion of the use of energy from
renewable sources. Official Journal of the European Union, L239(15-9-2015),
pp. 1-29.

52 March 2017 3.K49 – Supporting mechanisms for the development of biomethane in transport
EurObserv'ER, 2015. The state of renewable energies in Europe edition 2015,
Paris: EurObserv'ER.
European Biogas Association, 2015. Biomethane & Biogas Report 2015,
Brussels: European Biogas Association.
Eurostat, 2016. Supply, transformation and consumption of renewable
energies - annual data [nrg_107a]. [Online]
Available at:
http://ec.europa.eu/eurostat/cache/metadata/en/nrg_10_esms.htm
Gasunie, 2016. Groen gas invoeder worden. [Online]
Available at:
www.gasunietransportservices.nl/aangeslotenen/systeembeheerders/groen-
gas-invoeder-worden
[Geopend 23 November 2016].
Groen Gas Forum, 2014. Routekaart hernieuwbaar gas, sl: Groen Gas Forum.
IEA Bioenergy, 2015. France Country Report of the French Agency for
Environment and Energy Management. [Online]
Available at: www.iea-biogas.net/country-reports.html?file=files/daten-
redaktion/download/publications/country-
reports/2015/France_Country_Report_Berlin_10-2015.pdf
[Accessed 20 April 2016].
KfW, 2017. www.kfw.de/Download-Center/F%C3%B6rderprogramme-
(Inlandsf%C3%B6rderung)/PDF-Dokumente/6000002220-Merkblatt-240-241.pdf.
[Online]
Available at: www.kfw.de/Download-Center/F%C3%B6rderprogramme-
(Inlandsf%C3%B6rderung)/PDF-Dokumente/6000002220-Merkblatt-240-241.pdf
[Geopend 7 Februari 2017].
Korkor, H., 2014. Policy Reforms to Promote Energy Efficiency in the
Transportation Sector in Egypt; presentation at the Regional Seminar on:
"Enabling Policies for Financing Energy Efficiency Investments " Tunis -
Tunisia, 14-15 april. [Online]
Available at: http://css.escwa.org.lb/SDPD/3451/1-2.pdf
[Accessed 2016].
Miljoinfo, 2001-ongoing. Gothenburg Green gas (Sweden). [Online]
Available at: www.osmose-os.org/documents/13/FactSheetGreenGas(SE).pdf
[Accessed 2016].
Ministère de l' Environment, 2016. Décret no 2016-1442 du 27 octobre 2016
relatif à la programmation pluriannuelle de l’énergie. Journal Officiel de la
Répubique Française, Issue 28-10-2016.
Ministero dello Sviluppo Economico, 2014. Decreto 10 ottobre 2014:
Aggiornamento delle condizioni, dei criteri e delle modalita' di attuazione
dell'obbligo di immissione in consumo di biocarburanti compresi quelli avanzati
(14A08212). Gazetta Ufficiale della Republica Italiana, GU Serie Generale
n.250(27-10-2014).

53 March 2017 3.K49 – Supporting mechanisms for the development of biomethane in transport
Morel, J., 2016. FrieslandCampina doopt veehouders om tot leveranciers
groene energie. Trouw, 7 May, pp.
http://www.trouw.nl/tr/nl/4504/Economie/article/detail/4295923/2016/05/
07/FrieslandCampina-doopt-veehouders-om-tot-leveranciers-groene-
energie.dhtml.
NEa, 2016. Rapportage Energie voor Vervoer in Nederland 2015, The Hague:
Dutch Emissions Authority (NEa).
Netbeheer Nederland, 2009. Aanvullende Voorwaarden RNB Groen Gas
Invoeders. [Online]
Available at:
www.netbeheernederland.nl/themas/dossier/documenten/?dossierid=1101005
3&title=Groen+gas&tab=3ss
[Accessed 24 November 2016].
NGV Italy, 2016. The CNG Italian Market : a journey from worldwide figures to
Italian ones; presentation at the Alternative Fuels Conferences and World Fair
Bologna. [Online]
Available at: www.altfuels2016.com/wp-
content/uploads/2016/05//ppt/NGV%20ITALY%20-
%20THE%20CNG%20ITALIAN%20MARKET,%20A%20JOURNEY%20FROM%20WORLDW
IDE%20FIGURES%20TO%20ITALIAN%20ONES.pdf
[Accessed 2016].
NICHES, 2011. Biogas in Captive Fleets: New Non-polluting and Energy
Efficient Vehicles, Policy notes 10. [Online]
Available at: www.rupprecht-
consult.eu/uploads/tx_rupprecht/10_biogas_in_captive_fleets.pdf
[Accessed 2016].
Nigerian Best Forum (NBF), 2013. Cng Conversion Smart Cards Enter Market.
[Online]
Available at: www.nigerianbestforum.com/index.php?topic=305795.0;wap
[Accessed 2016].
PWC, 2015. Tax matters Sweden's tax blog: Tax exemption for biofuels.
[Online]
Available at: http://blogg.pwc.se/taxmatters-en/tax-exemption-for-biofuels
[Accessed 2016].
RVO, 2016. BIO-Installaties. [Online]
Available at:
http://ez.maps.arcgis.com/apps/webappviewer/index.html?id=c9e9bfcb64744
8ce97ad0fbb8f05f7c7
[Accessed 23 November 2016].
SER, 2013. Energieakkoord voor duurzame groei, Den Haag: SER.

54 March 2017 3.K49 – Supporting mechanisms for the development of biomethane in transport
Annex A EU policy context
A.1 Introduction
Many of the supporting measures on the national level are a consequence of
the wider EU policy framework on renewable energy in transport, at least in
the case of the EU case study countries. Therefore, this section describes the
most relevant directives at the European level.
The Renewable Energy Directive (RED) will be discussed in Annex A.2, followed
by the ILUC Directive in Annex A.3 and the Fuel Quality Directive (FQD) in
Annex A.4. Note that the RED and FQD have already been in place since 2009
setting targets for 2020.
It is not clear yet what the policy framework will be after 2020, but the EU
winter package contains the first proposals for 2020-2030, which are depicted
in Annex A.6 after a short description of the Clean Power for Transport
Directive in Annex A.5.
A.2 Renewable Energy Directive
20% target The RED sets a 20% overall binding target for renewable energy use by 2020 for
the EU and individual targets for the various Member States. Besides this
target, the RED also regulates various issues concerning the use of renewable
energy in the electricity, heating and cooling and transport sectors.
Article 3(4) The Articles most relevant for the transport sector are Articles 3(4) and 17–21.
According to Article 3(4), each Member State shall ensure that the share of
energy from renewable sources in all forms of transport in 2020 is at least 10%
of the final consumption of energy in transport in that Member State. This 10%
target can be met by all types of renewable energy, including biofuels, biogas,
electricity and hydrogen (see Figure 1). In practice, it will be met mostly by an
increase in biofuel consumption and by renewable electricity in railway
transport.
Sustainability criteria Only biofuels that meet the sustainability criteria for biofuels and bioliquids as
laid down in Article 17 of the RED may count towards the 10% target.
These sustainability criteria include minimum requirements for the reduction
of GHG emissions and the exclusion of environmentally vulnerable areas for
biofuel production, such as areas with high biodiversity value or high carbon
stocks. These criteria address direct effects caused by biomass cultivation and
biofuel production. Indirect effects, such as indirect land use changes, are not
covered in the original Directive of 2009. The same sustainability criteria are
laid down in the Fuel Quality Directive.
Double counting provision and multiplication factors Article 21(2) of the RED defines that the contribution made by biofuels
produced from wastes, residues, non-food cellulosic material and
ligno-cellulosic material shall be considered to be twice that made by other
biofuels. Furthermore, the electricity from renewable energy sources
consumed by electric road vehicles shall be considered to be 2.5 times the
energy content of the input of electricity from renewable energy sources

55 March 2017 3.K49 – Supporting mechanisms for the development of biomethane in transport
(RED Article 3(4)), to account for the higher energy efficiency of electric
vehicles compared with vehicles with an internal combustion engine.
However, these multiplication factors have been amended by the Indirect Land
Use Change (ILUC )Directive (see 2.3) from 1 to 2.5 for the energy consumed in
electrified rail transport, and from 2.5 to 5 for renewable electricity use in
road transport.
Figure 9 Schematic overview of the 10% transport target of the RED
A.3 ILUC Directive
The ILUC proposal of 2012 The ILUC Directive is the result of years of debate between Member States and market actors. In the RED of 2009 the Commission was obliged to submit a report to the European Parliament and the Council by 31 December 2010 reviewing the impact of indirect land use change on greenhouse gas emissions and addressing ways to minimise that impact. This report was to be accompanied, as appropriate, by a proposal on how to factor in the emissions deriving from such indirect land use changes. This proposal was delayed several times, and was eventually published on 17 October 2012. The proposal’s main elements regarding the RED were:
a 5% cap on food-based biofuels similar to average ‘current consumption’
levels in the EU;
quadruple counting for biofuels from certain wastes and residues;
increase of the minimum greenhouse gas saving threshold for biofuels and
bioliquids produced in new installations with effect from 1 July 2014;
introduction of ILUC factors for three feedstock groups to be used in the
Member State reports to the Commission, shown in Table 1.
Table 11 ILUC factors proposed in the ILUC proposal of October 2012
Feedstock group Estimated indirect land use change
emissions (gCO2-eq/MJ)
Cereals and other starch-rich crops 12
Sugars 13
Oil crops 55

56 March 2017 3.K49 – Supporting mechanisms for the development of biomethane in transport
The ILUC Directive (2015/1513/EC) After publication of the proposal in 2012, the discussion resulted in several
changes to this original proposal. It took almost three years before a final vote
on ILUC was taken in April 2015, with publication of the ILUC Directive
following in September 2015 (EU, 2015b)and amending Directive 98/70/EC (the
original version of the Fuel Quality Directive) and Directive 2009/28/EC (the
Renewable Energy Directive).
Under this Directive, Member States finally agreed to introduce a cap on the
contribution to the RED targets that can be made by biofuels from food crops
and certain energy crops, quantified as 7% of transport energy. Member States
are also required to set a target for advanced biofuels, with a reference value
of 0.5%.
Implementation by Member States To what extent these provisions will result in a shift from food-based to
advanced biofuels depends on their implementation by Member States.
Because Member States have various implementation options, in practice
significant differences may arise. For example, as Member States are allowed
to set a lower cap on land based biofuels, they may also choose to apply this
target to the FQD. They may also set a sub-target for advanced biofuels lower
or higher than the reference value, although reasoning must be provided.
They could also decide to lower their biofuels incentives (e.g. lower the levels
of the biofuel obligation) in response to the higher multiplication values for
renewable electricity, but they may also aim for a higher level of renewable
energy sources in transport than the 10% target.
Figure 10 How the 10% can be met taking the provisions of the ILUC Directive into account

57 March 2017 3.K49 – Supporting mechanisms for the development of biomethane in transport
A.4 Fuel Quality Directive
Two objectives The FQD has a double role in relation to the consumption of biofuels in the
transport sector: Article 7a of the FQD provides an incentive for biofuel
consumption by means of a GHG reduction target, but, on the other hand,
Article 3 and 4 limit the maximum biofuel content of diesel and petrol.
Although this may seem contradictory, standardized fuel specifications benefit
the level of harmonization across Member States.
Scope This Directive applies to the fuels used by road vehicles, non-road mobile
machinery (including inland waterway vessels when not at sea), agricultural
and forestry tractors and recreational craft when not at sea. This definition
differs slightly from the scope of energy consumption applied in the
Renewable Energy Directive.
Obligation for fuel suppliers Concerning the GHG reduction target, the FQD requires fuel suppliers to
gradually reduce the average life cycle GHG emissions of the transport fuels
they market in the EU (Article 7a (2)). ‘Suppliers’ are, in most cases, defined
as the entities responsible for passing fuel or energy through an excise duty
point.
The 6% target Member States must oblige fuel suppliers to reduce the life cycle GHG
emissions per unit of energy of their supplied fuels by up to 10% compared
with the fuel baseline (of 2010). This 10% consists of:
a 6% mandatory target;
a voluntary 4%, which can be met by the use of carbon capture and storage
(2%) and credits purchased through the Clean Development Mechanism of
the Kyoto Protocol (2%), for reductions in the fuel supply sector; note that
it is considered unlikely that this voluntary 4% will be implemented.
Calculation methodology The targets were set in the Directive of 2009, but at that time no decision had
been taken regarding the methodology to be used for calculating the
contribution of fossil fuels and potential upstream GHG mitigation measures
towards the target. This methodology was only defined for biofuels (and
equivalent to the calculation methodology laid down in the RED, thus also
without ILUC emissions), but not for the upstream emission reductions in the
fossil fuel chain.
Implementing rules in Directive 2015/652 Directive 2015/652 (EU, 2015a), adopted in April 2015, also includes
implementing rules for the fossil fuel reductions. Member States are required
to implement this amendment to the FQD by 21 April 2017 (Department for
Transport, 2015). These implementing rules give fuel suppliers the option to
count the contribution of emission reductions occurring prior to the crude oil
entering a refinery towards the 6% target (the so-called upstream emission
reductions, UERs). Examples of these kinds of emission reductions are the
reduction of flaring and venting emissions.

58 March 2017 3.K49 – Supporting mechanisms for the development of biomethane in transport
Although this Directive has been adopted, there are still provisions that
require clarification. To further clarify these implementing rules, the
European Commission is to publish non-legislative guidelines in the coming
months.
Link between the FQD target and the ILUC Directive The ILUC Directive applies to both the RED and FQD, but the changes to the
FQD are relatively limited. The changes to the RED may, however, increase the
relative importance of the 6% target. In theory, if the average GHG intensity of
biofuels decreases as result of the ILUC Directive, the FQD target could also be
met more easily. However, the higher multiplication factor for renewable
electricity in rail and road transport and the increasing use of double counting
biofuels reduces the biofuel volume required to meet the 10% RED target.
This may effectively reduce the contribution of the RED policy measures
towards meeting the FQD target (where double-counting does not apply), and
additional efforts are likely to be required to achieve the 6% GHG intensity
reduction in 2020.
In this context, it should also be noted that there is a difference between
implementation of the ILUC Directive, the RED and the FQD: the RED obliges
Member States to take responsibility directly for meeting targets, while the
FQD requires Member States to oblige fuel suppliers to meet the FQD target.
This means that a Member State that had implemented the FQD in an
appropriate way would not be held accountable if targets were nevertheless
missed.
A.5 Clean Power for Transport Directive
The Clean Power for Transport Directive (or the Directive on the deployment
of alternative fuels infrastructure) focuses on the build-up of an EU-wide
network of recharging and refuelling points, interoperability (by means of
standards and technical specifications) and clear consumer information to
raise awareness. The Directive contains minimum requirements to be
implemented through Member States’ national policy frameworks.
This includes electric vehicles, natural gas (LNG and CNG) and hydrogen.
A.6 Clean Vehicle Directive
The Clean Vehicle Directive (EC, 2009c), or the Directive on the Promotion of
Clean and Energy Efficient Road Transport Vehicles aims at the broad market
introduction of environmental-friendly vehicles on the market. This includes
that the energy and environmental impacts over the entire lifetime of a
vehicle should be taken into account in all purchases of road transport vehicles
covered by the Directives regulating public procurement and the public service
Regulation. These impacts can be monetised for inclusion in the purchasing
decision and requires the specific calculation rules for calculating the lifetime
costs and are laid down in the Directive. (EC, Mobility and Transport, n.d.)

59 March 2017 3.K49 – Supporting mechanisms for the development of biomethane in transport
A.7 EU winter package
On November 30th, 2016, the European Commission published the so-called
Winter Package. This package included several proposals for the post-2020
policy framework. Regarding renewable energy in transport the main aspects
of this new Renewable Energy Directive are:
1.5% share of renewable energy in transport in 2021 growing to 6.8% in
2030.
No extension of the double counting.
A cap on land based biofuels of 3.8% in 2030. Note that the current market
share of land based biofuels is approximately 4.9% (in 2014).
A sub-target for advanced biofuels of 3.6% in 2030 (now 0.5% for 2021).
An additional reward for biofuels in aviation and maritime shipping (their
energy content is accounted for 20% more).
Biomass fuels should also meet the sustainability criteria rather than only
being obligatory for biofuels and bioliquids. Biomass fuels do also include
the biomass used in the heating and electricity sector.