supporting information - pnas€¦ · supporting information ... blood was immediately collected by...
TRANSCRIPT

Supporting InformationSheh et al. 10.1073/pnas.1009017107SI Materials and MethodsBacteria and Animals. H. pylori strain SS1 was cultured on bloodagar (TSA with sheep blood; Remel) or Brucella broth with 5%FBS under microaerobic conditions (10% H2, 10% CO2, 80%N2). Specific pathogen-free (including Helicobacter spp.) maleand female C57BL/6 gpt delta mice (1) bred and maintained inour facilities were used. Mice were maintained in a facility ac-credited by the Association for Assessment and Accreditation ofLaboratory Animal Care International, housed in polycarbonatemicroisolator cages on hardwood bedding, and provided stan-dard rodent chow and water ad libitum. All protocols were ap-proved by the Massachusetts Institute of Technology Committeeon Animal Care.
Experimental Design. Twenty-one 6- to 8-wk-old gpt delta mice (11male and 10 female) were infected by oral gavage with 0.2 mL ofH. pylori SS1 on alternate days for a total of three doses of ap-proximately 1 × 10⁸ organisms per dose (2, 3). Twelve age-matched uninfected mice were dosed with 0.2 mL of tryptic soybroth. Mice were euthanized at 6 or 12 MPI. After CO2 as-phyxiation, blood was immediately collected by cardiac punctureand the stomach and proximal duodenum were removed andincised along the greater curvature. For histopathologic study,linear gastric strips from the lesser curvature were fixed over-night in 10% neutral-buffered formalin, embedded, sectioned at4-μm thickness, and stained with H&E. A board-certified com-parative pathologist (B.H.R.), blinded to treatment groups,scored gastric lesions on an ascending scale of 0 to 4 for inflam-mation, epithelial defects, atrophy, hyperplasia, mucous meta-plasia, hyalinosis, intestinal metaplasia, and dysplasia accordingto previously published criteria (4). A GHAI was calculated asthe sum of scores for inflammation, epithelial defects, atrophy,hyperplasia, intestinal metaplasia, and dysplasia. Hyalinosis andmucous metaplasia were excluded from the GHAI as they havebeen observed to develop spontaneously in mice (4, 5). Data fortwo infected male mice with GHAI scores of 0 were excludedfrom all subsequent analyses, unless specifically noted, as a resultof their lack of response to infection. The remainder of the gastrictissue was snap-frozen in liquid nitrogen and stored at –70 °C forDNA and RNA analyses.
Assay for gpt Mutagenesis. Fifty-seven samples from 33 micewere processed according to the gpt delta mutagenesis proce-dures to determine frequencies of point mutations (6-TG selec-tion assay) and large deletions (Spi– assay). Animals were selectedfor analysis based on histopathological findings, and analyses oftissues from 15 mice were repeated two or three times to verifyassay reproducibility. Animals studied at 6 MPI included five un-infected males, four uninfected females, four infected males, andfour infected females; those at 12 MPI were three uninfectedmales, three uninfected females, four infected males, and six in-fected females. In the 6-TG selection assay procedure, genomicDNA was extracted from gastric tissue previously kept at −70 °Cusing the Recoverease DNA Isolation Kit (Stratagene). TheTranspack Packaging Extract (Stratagene) was used to recoverλ-EG10 phages from tissue DNA, and the 6-TG selection assaywas performed as previously described (1, 6). Briefly, E. coli ex-pressing Cre recombinase was infected with rescued λ-EG10phages and incubated for 72 h on selective media containing ei-ther Cm (25 μg/mL) or Cm (25 μg/mL) plus 6-TG (25 μg/mL) toselect colonies possessing Cm acetyltransferase activity only(survival) or both Cm acetyltransferase activity and loss of gpt
function (mutant). Recovered gpt mutants were restreaked ontoCm and 6-TG plates for confirmation. Mutant frequency wasexpressed as the mutant/survivor ratio.Confirmed 6-TG–resistant mutants were boiled and pelleted
to obtain DNA template for sequencing of the gpt gene. A 739-bp DNA fragment containing the gpt gene was amplified by PCRusing primers P1 (forward) 5′-TACCACTTTATCCCGCGT-CAGG-3′ and primer P2 (reverse) 5′-ACAGGGTTTGGCTCA-GGTTTGC-3′. PCR amplification was carried out using VentDNA polymerase (New England Biolabs) on a DNA EnginePTC-200 (MJ Research). The reaction was started by incubationat 94 °C for 5 min, followed by 30 cycles of 30 s at 94 °C, 30 sat 56 °C, and 120 s at 72 °C and finalized by incubating at 72 °Cfor 5 min before storing at 4 °C (6). PCR product cleanup andDNA sequencing were performed by the Biopolymers Facility atHarvard Medical School (Boston, MA) using AMPure beads(Agencourt) and a 3730xL DNA Analyzer (Applied Biosystems)using sequencing primers A (forward) 5′-GAGGCAGTGCGT-AAAAAGAC-3′ and A2 (forward) 5′-CTCGCGCAACCTAT-TTTCCC-3′. Sequences were aligned with the E. coli gpt gene(GenBank M13422.1) (7) with Geneious software (Biomatters).Mutations were individually corroborated by multiple sequenceresults and classified as transitions (G:C to A:T, A:T to G:C),transversions (G:C to T:A, G:C to C:G, A:T to T:A, A:T toC:G), deletions (1 bp or ≥2 bp), insertions, or complex (multiplechanges). A mutation found repeated at the same site within thesame sample was excluded from frequency calculations to elim-inate overrepresentation caused by sibling mutations. Samplesfrom 33 mice were sequenced. Mutation frequencies calculatedfor each animal and each mutation type were subjected to sta-tistical analysis.
Spi– Assay for Large Deletions. The Spi– assay was carried out asdescribed (1). E. coli strains XL-1 Blue MRA or XL-1 Blue MRAP2 lysogen were infected with phages rescued from mouse DNAand incubated for 20 min without shaking at 37 °C. The suspen-sions were poured on λ-trypticase agar plates (1% trypticasepeptone, 0.5% NaCl, 1.2% agar), which were then incubatedovernight at 37 °C to select for plaques formed in MRA P2 lawnscontaining phage with inactivated red and gam genes. Plaquesformed in MRA lawns were counted to determine titer. Mutantphages were picked and spotted onto lawns of E. coli strain WL95P2 lysogen (WL95 P2) to confirm the inactivation of red and gamgenes. The mutant frequency was expressed as mutant plaque/titer ratio. E. coli strain LE392 was infected with recovered Spi–
mutant phages to obtain phage lysates (8).
Quantitative Analysis of mRNA Expression. Total RNA was extra-cted from gastric tissue using TRIzol reagent (Invitrogen) and theRNeasy kit (Qiagen). cDNA was synthesized from 5 μg of totalRNA with SuperScript II RT (Invitrogen). Quantitative real-timePCR was performed on cDNA using TaqMan gene expressionassays (Applied Biosystems) specific for IFN-γ (assay Mm99999071_m1), TNF-α (Mm99999068_m1), IL-10 (Mm00439616_m1), IL-17 (Mm00439619_m1), iNOS (NOS2 or iNOS; Mm00440485_m1), and GAPDH (Mm99999915_g1). mRNA levels foreach cytokine were normalized to the mRNA level of internalcontrol GAPDH and compared with the data of uninfected miceusing the ΔΔCT method (User Bulletin 2; Applied Biosystems).Data were log10-transformed for analysis.
Sheh et al. www.pnas.org/cgi/content/short/1009017107 1 of 6
Detection of H. pylori Infection by Quantitative PCR. To quantifyinfection levels of H. pylori strain SS1 within the gastric mucosa,a real-time quantitative PCR assay targeting H. pylori urease Bwas used (9, 10). DNA was extracted from gastric tissue using theHigh Pure PCR Template purification kit (Roche). A standardcurve was generated by using serial 10-fold dilutions of H. pyloriSS1 genome copies (from 5 × 10⁵ to 5), estimated from an av-erage H. pylori genome size of 1.66 Mb (11, 12). Copy numbersof the gastric H. pylori genome were standardized using micro-grams of murine chromosomal DNA determined by quantitativePCR using a mammalian 18S rRNA gene-based primer andprobe mixture (Applied Biosystems) as described previously(13). A threshold of 15 copies of the H. pylori genome was set asthe lower limit for a positive sample. Although five infected fe-male mice and one infected male mouse had H. pylori levelsunder the established threshold, these mice had increased cyto-kine expression and higher GHAI scores consistent with that ofmice infected with H. pylori and not uninfected mice. Despite thelow counts, these six mice were considered infected duringsubsequent analyses as a result of serological and histological
evidence. Conversely, the two mice with the highest number ofH. pylori copies (one infected male at 6 MPI and one infectedmale at 12 MPI) had a GHAI of 0 and cytokine productionsimilar to uninfected controls, indicating an aberrant response toinfection, and they were excluded from subsequent analysesunless otherwise noted as a result of lack of pathology.
Serum IgG Isotype Measurement. Serum was analyzed for H. pylori-specific IgG2c and IgG1 by ELISA using an outer membraneprotein preparation from H. pylori (SS1 strain) as describedpreviously (14). In brief, 96-well flat-bottom plates were coatedwith 100 μL of antigen (10 μg/mL) overnight at 4 °C, and sera werediluted 1:100. Biotinylated secondary antibodies for detectingIgG2c and IgG1 were from clone 5.7 and A85-1 (BD Pharmin-gen). Incubation with extravidin peroxidase (Sigma-Aldrich) wasfollowed by treatment with 2,2′-azino-bis (3-ethylbenzthiazoline-6-sulphonic acid) substrate (Kirkegaard and Perry Laboratories)for color development. Optical density was recorded on a platereader according to the manufacturer’s protocol (VersaMax;Molecular Devices).
1. Nohmi T, et al. (1996) A new transgenic mouse mutagenesis test system using Spi- and6-thioguanine selections. Environ Mol Mutagen 28:465–470.
2. Fox JG, et al. (1999) High-salt diet induces gastric epithelial hyperplasia and parietalcell loss, and enhances Helicobacter pylori colonization in C57BL/6 mice. Cancer Res59:4823–4828.
3. Lee A, et al. (1997) A standardized mouse model of Helicobacter pylori infection:Introducing the Sydney strain. Gastroenterology 112:1386–1397.
4. Rogers AB, et al. (2005) Helicobacter pylori but not high salt induces gastricintraepithelial neoplasia in B6129 mice. Cancer Res 65:10709–10715.
5. Kang W, Rathinavelu S, Samuelson LC, Merchant JL (2005) Interferon gammainduction of gastric mucous neck cell hypertrophy. Lab Invest 85:702–715.
6. Masumura K, et al. (1999) Spectra of gpt mutations in ethylnitrosourea-treated anduntreated transgenic mice. Environ Mol Mutagen 34:1–8.
7. Nüesch J, Schümperli D (1984) Structural and functional organization of the gpt generegion of Escherichia coli. Gene 32:243–249.
8. Sambrook J, Fritsch EF, Maniatis T (1989) Molecular Cloning: A Laboratory Manual(Cold Spring Harbor Lab Press, Cold Spring Harbor, NY), 2nd Ed.
9. Fox JG, et al. (2003) Host and microbial constituents influence Helicobacter pylori-induced cancer in a murine model of hypergastrinemia. Gastroenterology 124:1879–1890.
10. Maurer KJ, et al. (2006) Helicobacter pylori and cholesterol gallstone formation inC57L/J mice: A prospective study. Am J Physiol Gastrointest Liver Physiol 290:G175–G182.
11. Alm RA, et al. (1999) Genomic-sequence comparison of two unrelated isolates of thehuman gastric pathogen Helicobacter pylori. Nature 397:176–180.
12. Tomb JF, et al. (1997) The complete genome sequence of the gastric pathogenHelicobacter pylori. Nature 388:539–547.
13. Whary MT, et al. (2001) Long-term colonization levels of Helicobacter hepaticus in thececum of hepatitis-prone A/JCr mice are significantly lower than those in hepatitis-resistant C57BL/6 mice. Comp Med 51:413–417.
14. Ihrig M, Whary MT, Dangler CA, Fox JG (2005) Gastric helicobacter infection inducesa Th2 phenotype but does not elevate serum cholesterol in mice lacking induciblenitric oxide synthase. Infect Immun 73:1664–1670.
Sheh et al. www.pnas.org/cgi/content/short/1009017107 2 of 6

Fig. S1. H. pylori-infected mice display significant gastric histomorphological alterations with an accelerated development of gastric pathologic processes infemales. (A–D) H&E staining of gastric tissue at 6 MPI. (A) Uninfected female control shows normal gastric mucosa. (B) H. pylori-infected male mice exhibitingmild gastric mucosal inflammation, associated oxyntic loss, metaplasia, and mild foveolar hyperplasia. (C) H. pylori-infected female mice had significantlyhigher histological activity than uninfected mice and infected males as shown by the moderate gastric inflammation, associated oxyntic loss, glandularmetaplasia, prominent epithelial defects, moderate foveolar hyperplasia, and mild dysplasia. (D) Higher magnification of C shows metaplastic glands witharchitectural distortion and loss of orientation (dysplasia). (E–H) H&E staining of gastric tissue at 12 MPI. (E) Uninfected male control with minimal gastricmorphological changes. (F) H. pylori-infected male with moderate inflammation, prominent oxyntic loss, hyperplasia, metaplasia, and mild dysplasia. (G)Higher magnification of F shows metaplastic and dysplastic glands. (H) H. pylori-infected female had similar gastric pathological changes as male mice. (Scalebars: 75 μM in A, D, E, and G; 150 μM in B, C, F and H.)
Sheh et al. www.pnas.org/cgi/content/short/1009017107 3 of 6

Fig. S2. H. pylori infection increases the expression levels of IFNγ, TNFα, iNOS, and IL-17. IFNγ, TNFα, iNOS, and IL-17 transcript levels relative to GAPDH in thegastric mucosa are presented in male (A) and female (B) mice. Uninfected mice at 12 mo (white bars; males, n = 3; females, n = 3) and H. pylori-infected mice at6 mo (light gray bars; males, n = 4; females, n = 4) and 12 mo (dark gray bars; males, n = 5; females, n = 6) are presented. H. pylori infection increased expressionof IFNγ, TNFα, IL-17, and iNOS in both sexes at 6 and 12 mo. *P < 0.05, **P < 0.01, and ***P < 0.001.
Sheh et al. www.pnas.org/cgi/content/short/1009017107 4 of 6

Fig. S3. H. pylori infection targets specific hot spots in the gpt gene. The distribution of mutations induced in the gpt gene was determined by sequencinganalysis of 411 mutants. Hot spots seen in uninfected and infected mice are denoted by▼. (A) Spectra of all uninfected mice. Not shown is a complex mutationfrom 407 to 429. A hot spot mainly seen in uninfected males is marked by□. (B) Spectra of all infected mice. Not shown is a complex mutation from 389 to 419.Mutations at 142 and 174 were second mutations. Hot spots mainly seen in infected mice of both sexes are represented by ◇ and hot spots seen mostly ininfected females are marked •. N* represents 3× mutations, d represents a deletion. Underlined mutations denote a single mutation.
Sheh et al. www.pnas.org/cgi/content/short/1009017107 5 of 6
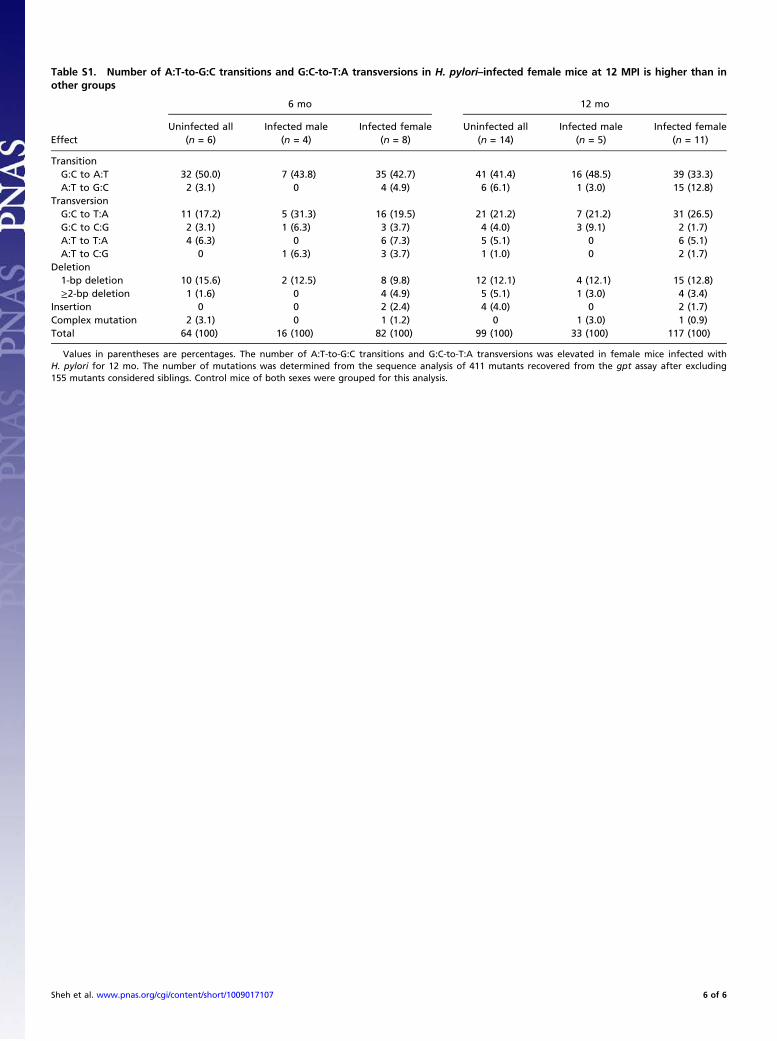
Table S1. Number of A:T-to-G:C transitions and G:C-to-T:A transversions in H. pylori–infected female mice at 12 MPI is higher than inother groups
Effect
6 mo 12 mo
Uninfected all(n = 6)
Infected male(n = 4)
Infected female(n = 8)
Uninfected all(n = 14)
Infected male(n = 5)
Infected female(n = 11)
TransitionG:C to A:T 32 (50.0) 7 (43.8) 35 (42.7) 41 (41.4) 16 (48.5) 39 (33.3)A:T to G:C 2 (3.1) 0 4 (4.9) 6 (6.1) 1 (3.0) 15 (12.8)
TransversionG:C to T:A 11 (17.2) 5 (31.3) 16 (19.5) 21 (21.2) 7 (21.2) 31 (26.5)G:C to C:G 2 (3.1) 1 (6.3) 3 (3.7) 4 (4.0) 3 (9.1) 2 (1.7)A:T to T:A 4 (6.3) 0 6 (7.3) 5 (5.1) 0 6 (5.1)A:T to C:G 0 1 (6.3) 3 (3.7) 1 (1.0) 0 2 (1.7)
Deletion1-bp deletion 10 (15.6) 2 (12.5) 8 (9.8) 12 (12.1) 4 (12.1) 15 (12.8)≥2-bp deletion 1 (1.6) 0 4 (4.9) 5 (5.1) 1 (3.0) 4 (3.4)
Insertion 0 0 2 (2.4) 4 (4.0) 0 2 (1.7)Complex mutation 2 (3.1) 0 1 (1.2) 0 1 (3.0) 1 (0.9)Total 64 (100) 16 (100) 82 (100) 99 (100) 33 (100) 117 (100)
Values in parentheses are percentages. The number of A:T-to-G:C transitions and G:C-to-T:A transversions was elevated in female mice infected withH. pylori for 12 mo. The number of mutations was determined from the sequence analysis of 411 mutants recovered from the gpt assay after excluding155 mutants considered siblings. Control mice of both sexes were grouped for this analysis.
Sheh et al. www.pnas.org/cgi/content/short/1009017107 6 of 6