supporting information spontaneous exfoliation and ... · 1 supporting information spontaneous...
TRANSCRIPT

1
Supporting Information
Spontaneous Exfoliation and Tailoring of MoS2 in Mixed Solvents
Lei Dong, Shan Lin, Liu Yang, Jiajia Zhang, Chao Yang, Dong Yang, Hongbin Lu*
Contents
1. Experimental section
2. Large-scale preparation of MoS2 nanosheets
3. The effect of H2O2 concentration in mixed solvent
4. HR-TEM images of the as-prepared MoS2 nanosheets and nanodots
5. Improved yield of spontaneous exfoliation
6. Photoluminescence spectra of MoS2 nanodots
7. Crystal defects of MoS2 nanosheets
8. In-site tailoring of MoS2 nanosheets
9. The effect of sonication time
10. AFM images of MoS2 nanosheets with assistance of sonication
11. Electrochemical measurement of MoS2 nanosheets
Electronic Supplementary Material (ESI) for ChemComm.This journal is © The Royal Society of Chemistry 2014

2
1. Experimental section
(1) Materials: Pristine MoS2 (CAS 69860) and graphite flake (CAS 332461) were purchased
from Sigma-Aldrich. N-Methyl-2-pyrrolidinone (NMP) and hydrogen peroxide (H2O2)
were purchased from Sinopharm Chemical Reagent Co. Ltd. All reagents were used
without further purification.
Tip sonication were performed with SCS 5200 sonicator from Hangzhou Success
Ultrasonic Equipment Co. Ltd, with a nominal power of 500 W. Centrifugation was carried
out with a GL-20B centrifuge with a large centrifugal radius (10.6 cm) from Shanghai
Anting Scientific Instrument Factory.
(2) Structure characterization: Atomic force microscopy (AFM) measurements were
conducted with a Bruker Multimode 8 AFM in tapping mode and the samples were
prepared by dropping on freshly cleaved mica substrates. High resolution transmission
electron microscopy (HR-TEM) imaging was performed with a JOEL JEM-2100F TEM at
an acceleration voltage of 200 kV. The samples were prepared by drop-casting dilute
solution of MoS2 on lacy carbon-coated copper grids. Raman spectra were acquired with a
HORIBA JobinYvon XploRa Laser Raman spectrometer with a 532-nm-wavelength laser.
The samples were prepared by drop-casting MoS2 dispersion onto glass substrate.
Ultraviolet visible (UV-vis) spectra were obtained with a Perkin-Elmer Lambda 35 UV-
Visible spectrophotometer. X-ray photoelectron spectroscopy (XPS) data were obtained
using an AXIS UltraDLD system (Shimadzu-Kratos) with Al Kα radiation (hv = 1486.6 eV).
X-ray diffraction (XRD) were carried out using a PANalytical X’Pert PRO X-ray
diffractometer operating at 40 kV and 40 mA with Cu Kα radiation (λ= 1.54 Å) at a
scanning rate of 5o min-1 and a scanning range from 5 to 90. The MoS2 samples used to
measure were dried under vacuum. Field emission scanning electron microscopy (FE-SEM)
and element mapping images were obtained with a Zeiss Ultra 55 FE-SEM with an energy
dispersive spectroscopy mapping system.

3
(3) Spontaneous exfoliation: Typically, 20 mg pristine MoS2 flake was dispersed in 20 mL
mixed solvents containing different volume ratios of H2O2 (30 wt% aqueous solution) and
NMP. The above mixtures (dispersions) were subsequently stirred at 35 oC for 10 hours in
20 mL bottles. At the end, stirring was stopped and the dispersions were cooled down to
room temperature naturally. The as-obtained dispersions were used immediately for
characterization.
(4) Ultrasonic-assistant exfoliation: 1.0 and 0.2 g pristine MoS2 flakes were dispersed in 200
mL mixed solvents containing different volume ratios of H2O2 (30 wt%) and NMP (3: 17
and 1: 19 v/v). The dispersions were treated with tip sonication with a nominal power of
500 W for different times (1 h, 2 h, and 5 h). Then the obtained black solution were
centrifugated at 5,000 rpm for 30 min. After pouring out the supernatant carefully, the dark
black MoS2 paste was collected.
(5) Calculation of exfoliation yields: The exfoliated MoS2 nanosheets were re-dispersed in
500 mL NMP and treated by tip sonication for 30 s. After centrifugation at 500 rpm for 30
min. The upper two-third of the supernatant was collected, repeating this process for 7~9
times until the dispersion completely became colorless. The obtained supernatant and
residual precipitate were vacuum-filtered on polytetrafluoroethylene (PTFE) membrane
(0.22 μm). After vacuum drying at 50 oC for 10 h, MoS2 nanosheets (MoS2-NS, supernatant)
and un-exfoliated MoS2 bulk (MoS2-B, precipitate) were obtained. The difference between
the initial MoS2 mass and obtained nanosheets (plus mass of the residual unexfoliated
particles) was considered as the mass of dissolved MoS2 and small MoS2 nanodots (MoS2-
ND). The exfoliation yield was calculated according to the initial MoS2 mass, that is, the
final yield equals the mass of exfoliated nanosheets divided by the initial MoS2 mass.
(6) MoS2-graphene composite: MoS2-graphene composite was prepared using the as-prepared
MoS2 nanosheets (by sonication-exfoliation for 1 hour in mixed solvent of H2O2 and NMP
(3: 17 v/v)) and exfoliated graphene nanosheets with a weight ratio of 4: 1. Graphene

4
nanosheets were obtained by sonication exfoliation of graphite flake (500 mg) with a tip-
sonication (with a nominal power of 500 W) for 2 h in 100 mL NMP. After centrifugation
at 2,000 rpm for 30 min, the supernatant was collected to obtain graphene dispersion. The
graphene dispersion was calibrated by solid content and diluted to 0.1 mg/mL by NMP.
Subsequently, 75 mL of graphene dispersion (0.1 mg mL-1) was mixed with 300 mL of the
as-prepared MoS2 dispersion (0.1 mg mL-1 in NMP) and then vacuum-filtered with a PTFE
membrane (0.22 μm) to give the desired MoS2-graphene composite.
(7) In-site tailoring: Firstly, the original MoS2 nanosheets were prepared by traditional
ultrasonic-assistant exfoliation, as follows. Pristine MoS2 (100 mg) was dispersed in NMP
(100 ml) and treated by tip-sonic (200 W) for 2 h. The mixture was centrifugated at 1,500
rpm for 30 min to obtain mono-layer nanosheets. Secondly, the supernatant was drop-
casted on freshly cleaved mica substrates. After vacuum drying at 50 oC for 10 h, one drop
of H2O2-NMP mixture with different volume ratio (5:15 or 20:0 v/v) was added onto the
mica surface. After standing for 10 min, the mixture was suck out carefully from the edge
of mica substrate by filter paper. To remove the rest H2O2-NMP mixture, one drop of
deionized water was added onto the mica surface and suck out as well. Finally, the in-sited
tailoring sheets was obtained by vacuum-drying at 50 oC for 10 h.
(8) Electrochemical measurement: The electrochemical tests were carried out using two-
electrode cells (2016R size) assembled in an argon-filled glove box. Lithium sheets were
used as the counter electrode and reference electrode, and a polypropylene film (Celgard-
2300) as a separator. The electrolyte was a LiPF6 solution (1.0 M) in a mixture of ethylene
carbonate and dimethyl carbonate with a volume ratio of 1: 1. The working electrodes
were prepared following a slurry coating procedure. The slurry was prepared by mixing an
NMP solution of active materials (MoS2 or MoS2-graphene composite), carbon black
(super P) and binder (polyvinylidene fluoride) with a weight ratio of 70: 15: 15. Then this
slurry was spread on current collector (copper foil) and dried at 100 C for 4 h in air,

5
followed by vacuum-drying at 100 C for 12 h and pressing. Galvanostatic
charge/discharge cycles were carried out on a NEWARE cell test instrument (Shenzhen
Neware Electronic Co., China) between 0.01- 3.00 V at different current densities.

6
2. Large-scale preparation of MoS2 nanosheets
Figure S1 Large-scale preparation of MoS2 nanosheets by spontaneous exfoliation in H2O2-NMP (1:19 v/v) mixed solvent. After mechanically stirring at 35oC for 5 hours, 4g raw MoS2 was peeled off with yield of 43% (see Figure S5).

7
3. The effect of H2O2 concentration in mixed solvent
Figure S2 Photographs of 1 mg/mL MoS2 dispersions in different mixed solvents after stirring for 10 hours at 35 C. The red numbers on caps denote the volume ratios of H2O2 to NMP.
Figure S3 The yields of exfoliated and unexfoliated MoS2 sheets after mechanically stirring for 10 hours in different mixed solvents. The calculation method of the yields is provided in the previous Method and Characterization section. The yields of MoS2-NS, MoS2-B and MoS2-ND are represented by red, blue, and blank column, respectively.

8
4. HR-TEM images of the as-prepared MoS2 nanosheets and nanodots
Figure S4 HR-TEM images obtained from spontaneous exfoliation (a) in 20: 0 mixed solvent and ultrasonic-assisted exfoliation (c) in 3: 17 mixed solvent show clearly MoS2 nanodots. Gaussian fitting (d) suggests a relatively uniform size distribution (2.5 ± 1.0 nm) for MoS2 nanodots in c. Amplified HR-TEM image (b) of the nanosheets obtained by spontaneous exfoliation in 1: 19 mixed solvent indicates the preservation of MoS2 lattice in exfoliated nanosheets.

9
5. Improved yield of spontaneous exfoliation
Figure S5 Improved yields of spontaneous exfoliation of MoS2 in 1: 19 mixed solvent. When shortening the reaction time to 5 hours, the exfoliation yield increases from 25% of 10 hours reaction time to 43% of 5 hours, implying that the prolonged reaction time practically causes more exfoliated nanosheets to be dissolved. After experiencing another 5 hours of exfoliation in fresh mixed solvent (1: 19), the residual unexfoliated particles were further exfoliated into nanosheets, resulting in an increased exfoliation yield (60.5%).
6. Photoluminescence spectra of MoS2 nanodots
Figure S6 Photoluminescence spectrum of MoS2 nanodots (Inset: photoluminescence photo of MoS2 nanodots, excitation at 365 nm).
Figure S6 shows the photoluminescence spectrum (excitation at 440 nm) of the MoS2
nanodots, which is the same sample as used in photoluminescence observation excited at 365
nm UV light in the inset. The maximum of luminescence (512 nm) is consistent with the

10
sonication-exfoliated MoS2 nanodots.1 Given that the luminescence property of nanodots is
strongly related to their size, the photoluminescence emission around 512 nm would suggest a
size of 1.5~3 nm, which is in accordance with the TEM measurements.2
7. Crystal defects of MoS2 nanosheets
Figure S7 HR-TEM image (a) shows the heterogeneous structure of MoS2 nanosheets which obtained by spontaneous exfoliation in H2O2-NMP (1: 19 v/v) mixed solvent, in which 1 T regions are enclosed by red lines. Amplified HR-TEM images show the crystal lattices of 1T (b) and 2H (c) phases. Mo 3d (d) and S 2p (e) XPS spectra show the difference between raw MoS2 and as-prepared MoS2 nanosheets after Shirley background subtraction. 2H and 1T phases are shown by the deconvoluted spectra and denoted by red and blue lines, respectively.
8. In-site tailoring of MoS2 nanosheets
11
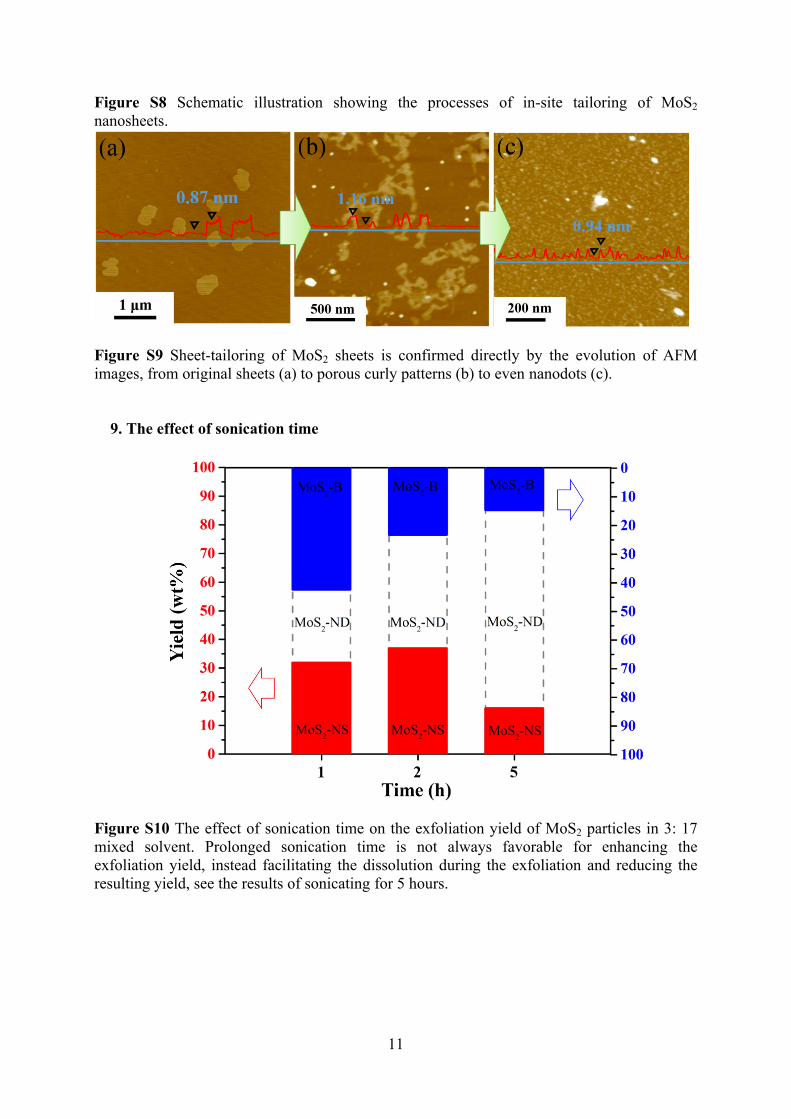
Figure S8 Schematic illustration showing the processes of in-site tailoring of MoS2 nanosheets.
Figure S9 Sheet-tailoring of MoS2 sheets is confirmed directly by the evolution of AFM images, from original sheets (a) to porous curly patterns (b) to even nanodots (c).
9. The effect of sonication time
Figure S10 The effect of sonication time on the exfoliation yield of MoS2 particles in 3: 17 mixed solvent. Prolonged sonication time is not always favorable for enhancing the exfoliation yield, instead facilitating the dissolution during the exfoliation and reducing the resulting yield, see the results of sonicating for 5 hours.

12
10. AFM images of MoS2 nanosheets with assistance of sonication
Figure S11 MoS2 nanosheets exfoliated in mixed solvent of H2O2: NMP=1: 19 v/v and solid content of 1 mg/mL with the assistance of sonication (a nominal power of 500 W). The sonication time was 1 hour under ambient condition. The majority of exfoliated nanosheets have irregular shapes and several microns of lateral sizes and 1-3 layers of thickness. Some small pores are also observed clearly. In addition, besides large nanosheets, a large amount of nanodots are present simultaneously, which would arise from tailoring and dissolution of exfoliated nanosheets during the exfoliation.
11. Electrochemical measurement of MoS2 nanosheets
Figure S12 CV curves of the first three cycles of MoS2-graphene composite electrode.

13
Figure S13 Galvanostatic charge-discharge profiles of the MoS2-graphene composite electrode.
Reference
1. V.Štengl, J. Henych, Nanoscale, 2013, 5, 3387-3394.2. H. Li, X. He, Z. Kang, H. Huang, Y. Liu, J. Liu, S. Lian, C. H. A. Tsang, X. Yang, S.-T. Lee, Angew. Chem., Int. Ed., 2010, 49, 4430–4434.