supporting information - rsc.org filefigure s8. (a) rde voltammograms of cegn in o2 –saturated 0.1...
TRANSCRIPT

Supporting Information
Trivalent Cerium Preponderant CeO2/Graphene Sandwich-structured
Nanocomposite with Greatly Enhanced Catalytic Activity for Oxygen
Reduction Reaction
Yu Yu,a Xiaofang Wang,a Wenyu Gao,a Pei Li,a Wei Yan,a Songmei Wu,a Qiuhong Cui,a Weiguo Song,*b and Kejian Ding*b
a School of Science, Beijing Jiaotong University, 100044 Beijing, PR Chinab Institute of Chemistry, Chinese Academy of Sciences, 100190 Beijing, PR China
*Email: [email protected] *Email: [email protected]
Electronic Supplementary Material (ESI) for Journal of Materials Chemistry A.This journal is © The Royal Society of Chemistry 2017

ExperimentalElectrochemical Measurements: Rotating disk electrode (RDE) measurements were carried at a rate of 10 mV s−1 with varying rotating speed from 625 to 2500 rpm on ALS RRDE-3A instrument. Koutecky–Levich plots (J-1 vs. ω-1/2) were analyzed at various electrode potentials, in which the slopes of linear fit lines were used to calculate the number of electrons transferred (n) on the basis of the Koutecky-Levich equation:1
1𝐽
=1𝐽𝑘
+1𝐽𝐿
=1𝐽𝑘
+1
𝐵𝜔1/2
𝐵 = 0.62𝑛𝐹𝐶𝑂(𝐷𝑂)2/3𝜈 - 1/6
Where J is the measured current density, and JK and JL are the kinetic- and diffusion limiting current densities, ω is the angular velocity, n is transferred electron number, F is the Faraday constant (96485 C mol-1), Co is the bulk concentration of O2 (1.26 × 10⁻⁶ mol cm-3), Do is the diffusion coefficient of O2 (1.93 × 10⁻⁵ cm2 s-1), and v is the kinematic viscosity of the electrolyte (1.09 × 10⁻² cm2 s-1). For Tafel plots, the kinetic current was calculated from the mass-transport correction of RDE curves according to:1
𝐽𝑘 =𝐽𝐿 × 𝐽
𝐽 - 𝐽𝐿
For the Rotating ring-disk electrode (RRDE) measurements, 15 ug catalyst was loaded on the RRED of a disk GCE (4 mm in diameter) and Ag ring electrode (5 mm inner diameter and 7 mm outer diameter). The cathodic scanning was the same as RDE’s measurements, and the ring potential
was constant at 1.5 V vs RHE. The percentage of HO2- ( ) and the electron transfer number (n)
𝑃𝐻𝑂 -
2
was determined by the followed equations:2
𝑃𝐻𝑂 -
2= 200 × (1 ‒
𝐼𝐷
𝐼𝐷 + 𝐼𝑅/𝐸𝑓)
𝑛 = 4 ×𝐼𝐷
𝐼𝐷 + 𝐼𝑅/𝐸𝑓
Where ID and IR were the disk and ring current respectively, and Ef is current collection efficiency of the Ag ring which was 0.424.

Figure S1. (a) A large area of SEM image of CeGS with lattice fringes almost full of the graphene nanosheet. (d) EDS spectra of CeGS.

Figure S2. The elements distribution mapping images of CeGS. The scale bar is 100 nm.
Figure S3. (a) AFM image and (b) height profile of GO.

Figure S4. Thermal gravimetric analysis (TGA) curves of CeGS and pristine GO.
Figure S5. N 1s XPS spectra of CeGS

Figure S6. (a) Low, (b) high resolution TEM images and (c) XRD pattern of CeGN
Figure S7. (a) Ce 3d, (b) O 1s and (c) N 1s XPS spectra of CeGN.

Figure S8. (a) RDE voltammograms of CeGN in O2 –saturated 0.1 M KOH at various rotation speed at a scan rate of 10 mV s-1, (b) Koutecky-Levich plots of CeGN at different potentials derived from RDE measurements.
Figure S9. (a) RDE voltammograms of CeGS, CeGN and N-RGO in O2-saturated 0.1 M KOH with a sweep rate of 10 mV s-1 at 1600 rpm, (b) RDE voltammograms of N-RGO in O2 –saturated 0.1 M KOH at various rotation speed, (b) Koutecky-Levich plots of N-RGO at different potentials derived from RDE measurements.

Figure S10. (a) RDE voltammograms of CeGS, CeGN and CeO2 in O2-saturated 0.1 M KOH, (b) RDE voltammograms of CeO2 at various rotation speed, (b) Koutecky-Levich plots of CeO2 at different potentials.
Figure S11. (a, c) N2 adsorption-desorption isotherm curve and (b, d) pore size distributions of CeGS (a, b) and CeGN (c, d)

Theoretical calculationAll calculations were carried out within the scheme of periodic DFT+U, using the Vienna ab initio simulation package (VASP). The projector augmented wave (PAW) method was employed for the exchange-correlation term, by the generalized gradient approximation (GGA) using the Perdew-Wang (PW91) functional,3 and with the cut-off energy of 400 eV, total energy convergence of 1 × 10⁻⁴ eV and force convergence of 0.01 eV Å-1. Hubbard U correction was adopted to minish the error caused by f electrons of Ce element, in which the LDAUU parameter was fixed at 0 5. (111) facet was representatively chosen to survey the surface chemical process in ORR, since it was the most stable facet in the cubic fluorite CeO2 crystals during the several highly probable low-index surfaces.4 For both the two catalyst, a slab model of six-layer (111) surface-exposed super-cell with the lattice parameters of 11.5 × 11.5 Å was adopted, with a vacuum spacing of 20.0 Å above the top O layer. The numbers of Ce and O in the control sample (CeGN) were 18 and 36 respectively, obeying stoichiometric ratio. In order to simplify the calculation, only the single oxygen vacancy (VO) was considered, and it was only placed in the top O layer in the constructing of CeGS surface. The schematics of the two adjusted surfaces were displayed in Figure S12. All the intermediates and top-three atom layers in catalysts were relaxed during the calculation, while the unrelaxed layers were set according to the results of bulk relaxation. (6×6×1) Monkhorst–Pack mesh k-points was used through all the steps, to guarantee the sufficient accuracy of the results. From the previous DFT studies,4 the magnetic effect for CeO2 by spin-polarization calculations is insignificant for adsorption energies (ΔEads) and geometries. So we conducted the surface calculations with non-spin-polarization methods, just except bare CeO2 surface and isolated oxygen molecule. The free energy changes of elementary reactions were adjusted versus the reversible hydrogen electrode (RHE) scheme proposed by Nørskov et al.5
The equation associated with ΔEads was interpreted as:
Δ𝐸𝑎𝑑𝑠 = 𝐸𝑠𝑙𝑎𝑏 + 𝑂2‒ 𝐸𝑠𝑙𝑎𝑏 ‒ 𝐸𝑂2
where Eslab+O2, Eslab, and EO2 were the calculated energies of O2-adsorbed CeO2 surface, bare CeO2 surface, and a triplet gas-phase spin-polarized oxygen molecule, respectively. After the adsorption of O2, another four elementary reactions based on the mechanism of peroxy intermediates involving the catalysts was delineated to investigate the whole reaction pathways. All the elementary reactions were exhibited as below:
O2 + * → O2*, ΔGads
O2* + H+ + e- → HOO*, ΔG1
HOO* + H+ + e- →O* + H2O, ΔG2
O* + H+ + e- → HO*, ΔG3
HO* + H+ + e- → * + H2O, ΔG4
Sometimes, a two-electronic oxygen reduction pathway accompanied with the generation of H2O2 may happen in ORR, in which the first two steps kept the same but the following elementary reaction took place as:
HOO* + H+ + e- →O* + H2O2, ΔG2†

The gibbs free energy (ΔG) was calculated by correcting the DFT energies for zero point energies and entropy via
ΔG = ΔE + ΔZPE - TΔS
Where ΔE and ΔZPE were the changes in DFT energy and zero-point energy of the adsorbates both obtained by calculation, while ΔS presented approximately the loss of entropy of the gas phase molecules upon binding them to the surface.6
Figure S12. The slab models of six-layer (111) surface-exposed super-cell with the lattice parameters of 11.5 × 11.5 Å, which were used to simulate the surfaces of CeGS (a) and CeGN (b). The yellow, red and pink balls were representative for Ce, under-layer O and top-layer O atoms respectively. The left and right images were along the c (top-view) and a axis (side-view) respectively.
Figure S13. Schematic diagram of ΔG of elementary reactions for ORR on VO-CeO2-111 (a) and CeO2-111 (b) at 0 V (RHE) in all the three adsorption pathways.
Table S1. The data of ΔG of elementary reactions in all the three adsorption pathways.ΔGads ΔG1 ΔG2 ΔG3 ΔG4
end-on -0.772 -0.317 -0.988side-on -2.166 0.650 -0.562VO-CeO2-111bridging -1.969 0.504 -0.612
-0.082 0.322
end-on 1.526 -0.404 1.36 -2.104 -2.215side-on 1.68 0.085 -1.97 0.507 -2.139CeO2-111bridging 1.609 0.319 -2.146 0.644 -2.263
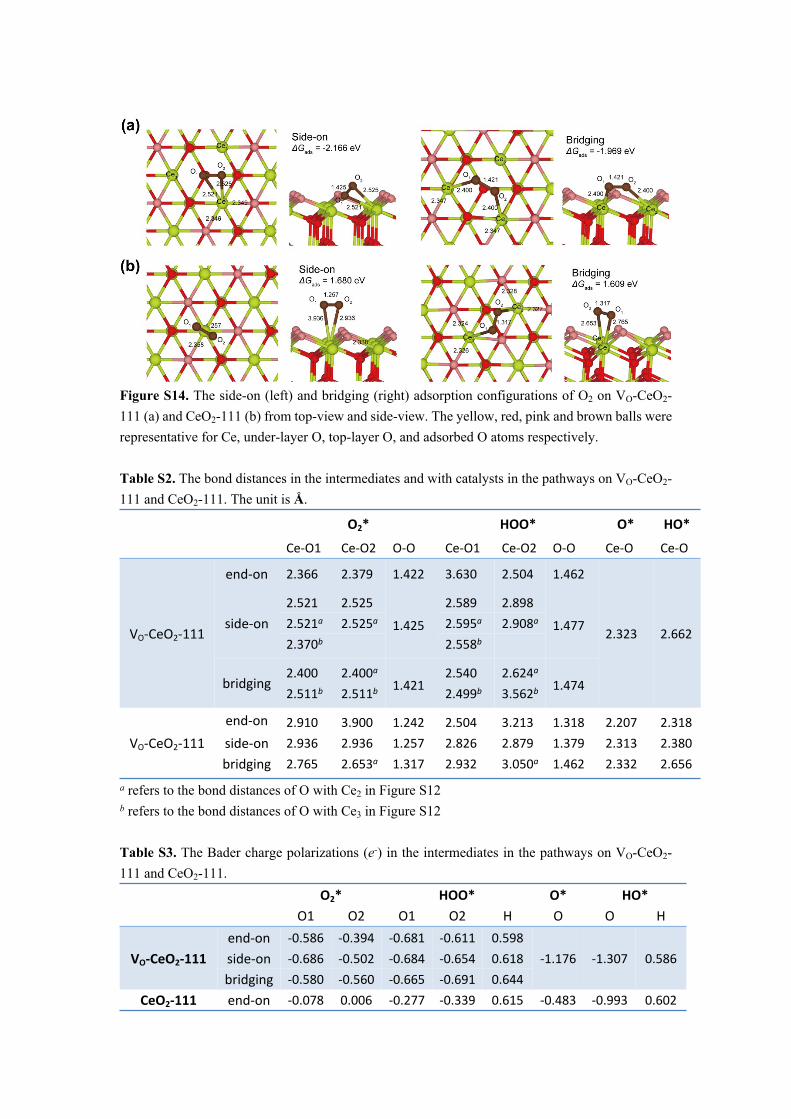
Figure S14. The side-on (left) and bridging (right) adsorption configurations of O2 on VO-CeO2-111 (a) and CeO2-111 (b) from top-view and side-view. The yellow, red, pink and brown balls were representative for Ce, under-layer O, top-layer O, and adsorbed O atoms respectively.
Table S2. The bond distances in the intermediates and with catalysts in the pathways on VO-CeO2-111 and CeO2-111. The unit is Å.
O2* HOO* O* HO*
Ce-O1 Ce-O2 O-O Ce-O1 Ce-O2 O-O Ce-O Ce-O
end-on 2.366 2.379 1.422 3.630 2.504 1.462
2.521 2.525 2.589 2.8982.521a 2.525a 2.595a 2.908aside-on2.370b
1.4252.558b
1.477
2.400 2.400a 2.540 2.624a
VO-CeO2-111
bridging2.511b 2.511b 1.421 2.499b 3.562b 1.474
2.323 2.662
end-on 2.910 3.900 1.242 2.504 3.213 1.318 2.207 2.318side-on 2.936 2.936 1.257 2.826 2.879 1.379 2.313 2.380VO-CeO2-111bridging 2.765 2.653a 1.317 2.932 3.050a 1.462 2.332 2.656
a refers to the bond distances of O with Ce2 in Figure S12b refers to the bond distances of O with Ce3 in Figure S12
Table S3. The Bader charge polarizations (e-) in the intermediates in the pathways on VO-CeO2-111 and CeO2-111.
O2* HOO* O* HO*O1 O2 O1 O2 H O O H
end-on -0.586 -0.394 -0.681 -0.611 0.598side-on -0.686 -0.502 -0.684 -0.654 0.618VO-CeO2-111bridging -0.580 -0.560 -0.665 -0.691 0.644
-1.176 -1.307 0.586
CeO2-111 end-on -0.078 0.006 -0.277 -0.339 0.615 -0.483 -0.993 0.602

side-on -0.042 -0.099 -0.264 -0.512 0.626 -0.464 -0.940 0.615bridging -0.069 -0.131 -0.068 -0.603 0.613 -0.466 -0.729 0.689
Figure S15. Schematic diagram of ΔG of the third elementary reaction in four and two electrons pathways on VO-CeO2-111.
Table S4. The data of ΔG of the following elementary reactions after the formation of HOO* in four and two electrons pathways respectively on VO-CeO2-111.
ΔG2 ΔG2†
end-on -0.988 2.699side-on -0.562 3.125bridging -0.612 3.075
Reference1. a) A. J. Bard and L. R. Faulkner, Electrochemical Methods, 2nd ed.; Wiley: New York, 2001; b) D.
R. Lawson, L. D. Whiteley, C. R. Martin, M. N. Szentirmay and J. I. Song, J. Electrochem. Soc., 1988, 135, 2247-2253.
2. U. A. Paulus, T. J. Schmidt, H. A. Gasteiger and R. J. Behm, J. Electroanal. Chem., 2001, 495, 134-145.
3. a) G. Kresse and J. Hafner, Phys. Rev. B, 1993, 47, 558-561; b) G. Kresse and J. Furthmüller, Phys. Rev. B, 1996, 54, 11169-11186.
4. a) M. Baudin, M. Wójcik and K. Hermansson, Surf. Sci., 2000, 468, 51-61; b) Z. Yang, T. K. Woo, M. Baudin and K. Hermansson, J. Chem. Phys., 2004, 120, 7741-7749.
5. J. K. Nørskov, J. Rossmeisl, A. Logadottir, L. Lindqvist, J. R. Kitchin, T. Bligaard and H. Jónsson, J. Phys. Chem. B, 2004, 108, 17886-17892.
6. a) H. A. Hansen, J. Rossmeisl and J. K. Nørskov, Phys. Chem. Chem. Phys., 2008, 10, 3722-3730; b) G. Baysinger, National Institute of Standards and Technology, 2015.