poly(3,4-ethylenedioxythiophene)/ nickel disulfide ... · soaked separator affixed between the two...
TRANSCRIPT

Supporting information
1
Poly(3,4-ethylenedioxythiophene)/ Nickel Disulfide Microspheres Hybrid in
Energy Storage and Conversion Cells
Radha Mukkabla,a Melepurath Deepa,a* and Avanish Kumar Srivastavab
Figure S1 (a) Low and (b) high magnification cross-sectional FE-SEM images of an
electrodeposited PEDOT-NiS2 hybrid film. The solid circles in (b) enclose the pores in the film.
Electronic Supplementary Material (ESI) for RSC Advances.This journal is © The Royal Society of Chemistry 2015

Supporting information
2
Figure S2 Energy dispersive X-ray (EDX) analysis plot of the PEDOT/NiS2 hybrid.

Supporting information
3
Figure S3 XRD patterns of NiS2 samples, obtained after heating an aqueous solution of 2.5 mM
of NiCl2 .6H2O and 2.5 mM Na2S2O3.5H2O at (a) 120 ̊C, (b) 140 ̊C, (c) 150 ̊C and (d) 160 oC for
12 h, under hydrothermal conditions. The asterisk marked peaks correspond to impurities.

Supporting information
4
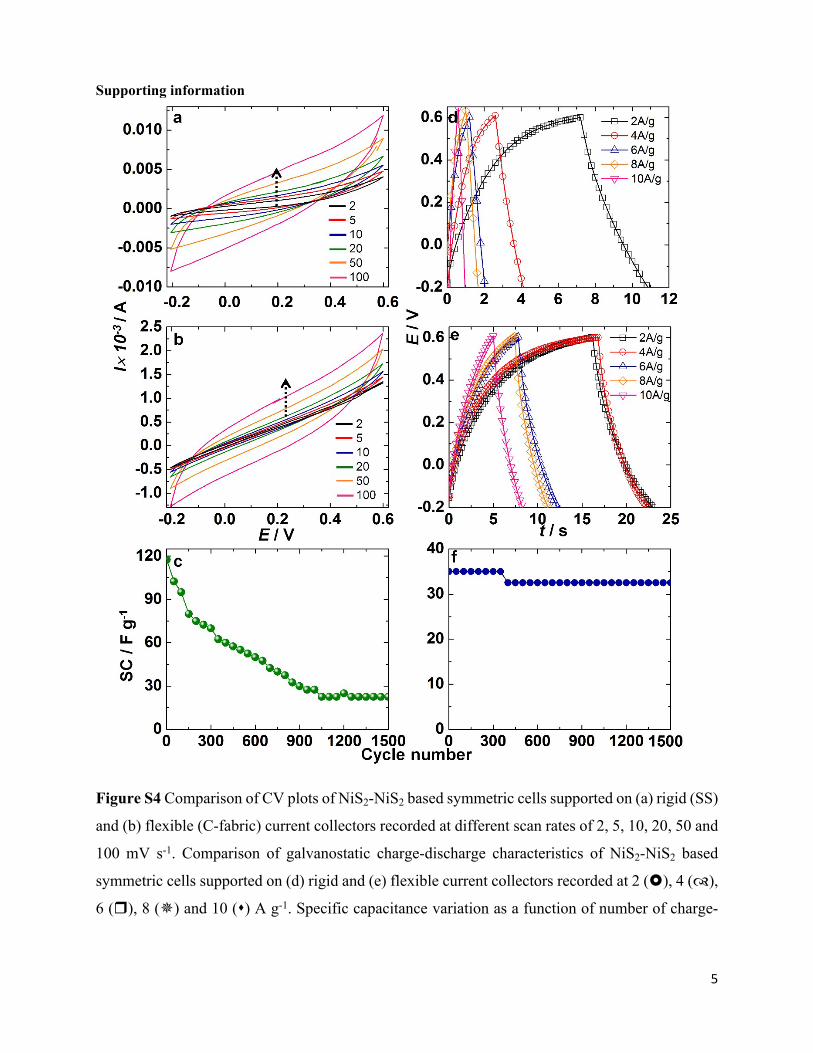
Symmetric cells were constructed in the NiS2-NiS2 configuration with an electrolyte
soaked separator affixed between the two layers. The cyclic voltammograms of symmetric cells of
pristine NiS2 (supported on both rigid (SS foil) and flexible (C-fabric) current collectors) were
recorded at different scan rates of 2, 5, 10, 20, 50 and 100 mV s-1 in the voltage window of 0.2 to
+0.6 V (Figure S4a and b). The CV profiles of the NiS2 based rigid and flexible cells show a leaf
like shape, at all scan rates. The capacitive characteristics of pristine NiS2 are poor, and this is also
reflected in the charge-discharge plots. Galvanostatic charge discharge curves of the pristine NiS2
based symmetric cells supported on both SS foil and C-fabric, measured at current densities of 2,
4, 6, 8,10 A g-1 are shown in Fig S4d and e respectively. The SC decreased from 9 F g-1 to 2.5 F
g-1 for the rigid SS cells and it is dropped from 16 F g-1 to 40 F g-1 when the current density was
increased from 2 to 10 A g-1 for the flexible C-fabric cells, with pristine NiS2 as the active layer.
The dismal perfromance of pristine NiS2 cells is attributed to two factors. (i) The adhesion of
pristine NiS2 with the current collector is poor and the active material peels off during
electrochemical cycling, and (ii) the redox reactions of NiS2 are kinetically slow. The cyling
stability of pristine NiS2 based rigid and flexible symmetric supercapacitors, recorded at the same
current density of 10 A g-1 over 1500 cycles are shown in Fig S4e and f. The flexible symmetric
cell exhibits better capacity retention and higher SC values compared to its’ rigid symmetric
counterpart. The flexible and the rigid symmetric cells show 19% (22 F g-1) and 92% (32 F g-1)
capacity retention at the end of 1500 cycles respectively. The better performance of the flexible
cell is due to the porous rough microstructure of the C-fabric, compared to the planar, smooth
surface of the SS foil. The NiS2 microspheres therefore, adhere more strongly to the C-fabric
compared the foil, which results in a higher SC for the cells supported on C-fabric.
Supporting information
5
Figure S4 Comparison of CV plots of NiS2-NiS2 based symmetric cells supported on (a) rigid (SS)
and (b) flexible (C-fabric) current collectors recorded at different scan rates of 2, 5, 10, 20, 50 and
100 mV s-1. Comparison of galvanostatic charge-discharge characteristics of NiS2-NiS2 based
symmetric cells supported on (d) rigid and (e) flexible current collectors recorded at 2 (), 4 (),
6 (), 8 () and 10 () A g-1. Specific capacitance variation as a function of number of charge-

Supporting information
6
discharge cycles recorded at a current density of 10 A g-1, for symmetric NiS2-NiS2 based cells
supported on (c) rigid and (f) flexible current collectors.
Construction of quantum dot solar cells (QDSCs) and characterization:
A lump-free TiO2 (anatase phase, particle size < 25 nm, Aldrich) dispersion was prepared in
ethanol, by mixing TiO2 (1 g) in ethanol (5 mL). The resulting white suspension was applied on
FTO coated glass using a doctor blade method and annealed at 150 oC for 40 minutes for solvent
removal and attachment of TiO2 to the substrate, followed by an annealing at 500 oC for 1 h. CdS
quantum dots (QDs) were deposited on the TiO2 coated FTO plates by a successive ionic layer
absorption and reaction (SILAR) method. The TiO2/FTO electrode was consecutively immersed
in four different beakers for about 30 s soaking time, in each solution. The first dipping solution
was composed of aqueous Cd(CH3COO)2 (0.1 M, Merck) which, was followed by a deionized
water rinse to remove the excess acetate. The film was then submerged in aqueous Na2S (0.1 M,
Merck), and again followed by a water dip to remove the surplus sulfide. The immersion cycle
was repeated seven times. The resulting films were yellow and were referred to as CdS/TiO2
electrodes. PEDOT/NiS2 and PEDOT films were deposited on FTO coated glass substrates by
potentiostatic electropolymerization (E = 1.5 V for 600 s) from their respective precursor solutions
containing (a) 0.1 M EDOT + NiS2 spheres (100 mg) + 0.1 M BMITFI and (b) only 0.1 M EDOT
+ 0.1 M BMITFI in 10 mL acetonitrile. Quantum dot solar cells were assembled by using a
CdS/TiO2 electrode as the photoanode, a PEDOT/NiS2 or a PEDOT film as the counter electrode
and a solution of 0.1 M Na2S in 3:7 v/v of deionized water: methanol was used as the electrolyte.
I-V characteristics were measured under illumination using a 150 W LOT-Oriel Xenon short arc
lamp ( > 300 nm) and the data was obtained using an Autolab 302 N Potentiostat/Galvanostat,
operating in the linear sweep voltammetric mode between two set potentials. The intensity incident
on the measuring cell was calibrated using a reference silicon solar cell traceable to NREL and it
was set at approximately one sun (100 mW cm-2). The incident light intensity was also reaffirmed
by using a Newport power meter.
Table S1 Solar cell parameters for QDSCs with CdS/TiO2-0.1 M Na2S-CE configurations.
Counter electrode VOC
(mV)
JSC
(mA cm-2)
FF
(fill factor)
(Efficiency, %)
PEDOT 682.8 4.65 0.39 1.238

Supporting information
7
PEDOT/NiS2 738.3 4.54 0.384 1.287