supporting information for - the royal society of … supplementary information nitrogen-doped...
TRANSCRIPT
S1
Supplementary Information
Nitrogen-doped Graphene Interpenetrated 3-D Ni-
Nanocage: Efficient and Stable
Water-to-Dioxygen Electrocatalyst
Vishal M. Dhavale,a,c
Sachin S. Gaikwad,a Leena George,
b,c R. Nandini Devi,
b,c Sreekumar
Kurungot*ac
aPhysical and Materials Chemistry Division, CSIR-National Chemical Laboratory, Pune-411 008, India.
bCatalysis and Inorganic Chemistry Division, CSIR-National Chemical Laboratory, Pune-411 008, India.
cAcademy of Scientific and Innovative Research (AcSIR), Anusandhan Bhawan, 2 Rafi Marg, New Delhi-
110001, India.
Fax: +91-20-25902636/2615; Tel: +91-20-25902566; E-mail: [email protected]
Electronic Supplementary Material (ESI) for Nanoscale.This journal is © The Royal Society of Chemistry 2014
S2
Content
1. Experimental and Characterization Section ……………………………………………..... S3
a) Synthesis of reduced graphene oxide (RGO)…………………………………………………… S3
b) Synthesis of N-doped graphene (NGr) ……………………………………………….................. S3
c) Synthesis of nickel-particles ……………………………………………....………………………S4
d) Rotating ring disk electrode study ………………………………………………………………...S4
2. Results ………………………………………………………………………………………….................S5
Figure S1: TEM image of RGO (Gr) and N-Gr ………………………………………………… S5
Figure S2a: HR-TEM image of Ni-NGr nanocage structures........................................................S6
Figure S2b: Line profile of the different edges of the Ni-NGr nanocage structure.......................S7
Figure S3: Dark field image of Ni-NGr nanocage structure ……………………………………. S8
Figure S4: SEM Elemental mapping of Ni-NGr nanocages structure …………………………..S9
Figure S5: TEM image of Ni-Gr………………….…………………………………………... S10
Figure S6: Comparative Raman spectra of NiCl2, RGO (Gr), NGr, Ni-NGr, physical
mixture of NiCl2+NGr…………………………………………………....................S11
Figure S7: XPS of Ni of NiCl2 ......................................................................................................S12
Figure S8: XPS of C1s and O1s of Ni-NGr sample …………….……………………………....S12
Figure S9: XPS of N1s of the Ni-NGr sample ………………………………………………….S13
Figure S10: Deconvoluted XPS of C1s spectra of the NGr sample…………………………......S13
Figure S11: Deconvoluted XPS of N1s spectra of the NGr sample …………………………….S14
Figure S12: XPS of O1s spectra of the NGr sample ………………………………………….…S15
Figure S13: Cyclic voltammetry study, Tafel plot, and RRDE study of Ni-NGr…………….…S16
Figure S14: OER stability of NGr by LSV………………………………………………………S17
Figure S15: Comparative LSV of Ni-Gr, Ni-particles, and Ni-NGr…………………………......S18
Figure S16: Capacitive CV and graph of anodic and cathodic current vs. scan rate of Ni-Gr......S19
3. Mechanism of OER in alkaline medium ……………………………………………………. S20
Table S1: Desorption energy per carbon atom (Edes) and activation energy (∆E) for
carbon diffusion of nickel surface ………………………………………….................. S20
Table S2: Reported specific capacitance for Ni-based materials and platinum
in alkaline medium ……………………………………………………………………. S21
Table S3: Comparison of overpotential values for Ni-based electrocatalyst ……………………. S21
4. References …………………………………………………………………………………… S22
S3
1. Experimental and Characterization Section
a. Synthesis of reduced graphene oxide (RGO):
Synthesis of graphene oxide (GO): GO was synthesized by improved Hummer’s method.1 In
short, a mixture of 3 g of graphite and required amount of KMnO4 was added slowly into a 1 : 9
mixture of conc. H3PO4:H2SO4 and the solution was kept under stirring for overnight by
maintaining the reaction mixture temperature at 60 °C. The obtained solution was poured into ice
cooled water containing 3% H2O2. A yellow precipitate formed was separated by centrifugation at
10,000 rpm, and this was washed well with copious DI water. Finally, the product was washed
with 30% HCl to remove unwanted impurities, followed by washing with ethanol and acetone.
The product was allowed to dry at room temperature and this was used as such for the further
studies.
Synthesis of RGO (Gr): GO was reduced by aqueous solution of sodium borohydride. Briefly, 50
mg of GO was dispersed in 50 ml DI water and this was transferred in a 250 ml round bottom
flask and was kept under vigorous magnetic stirring for 30 min. 0.1 M sodium borohydride (25
ml) aqueous solution was added slowly through burette into the above mixture under stirring for 4
h. Finally, the reaction mixture was centrifuged at 10,000 rpm, washed with DI water and dried at
80 oC in an oven for 10 h. After that the product was annealed at 900
oC to remove maximum
functional groups. The obtained black product is termed as RGO (Gr).
b. Synthesis of N-doped graphene (NGr):
1 g of RGO (Gr) was mixed with 6 g of melamine in 100 ml of DI water and the mixture was
stirred for 24 h. The slurry was filtered and dried in an oven at 80 oC for overnight. The obtained
melamine-Gr solid powder was heated at about 900 oC in an Argon atmosphere (flow rate: 0.2
S4
slpm) for about 4 h. The furnace was cooled down to room temperature under inert atmosphere
and the obtained N-Gr was used for the further investigations and synthesis of Ni-NGr structures.
c. Synthesis of nickel-particles:
Synthesis of Ni-particles: The Ni-particles are synthesized by chemical reduction method, for the
comparison purpose. 25 mL (100 mM) nickel chloride solution was taken in 100 mL round
bottom flask. Subsequently, 0.5 M aqueous solution of sodium borohydride was added slowly in
the above nickel chloride solution. After complete addition, reaction mixture was kept under
stirring for 8 h, and then, filtered with 0.2 μm polytetrafluoroethylene (PTFE) membrane filter
paper. Finally, washed with DI water and dried in oven at 80 oC for 10 h.
d. Rotating ring disk electrode study:
For the rotating ring disk electrode (RRDE) measurements, the collection efficiency (N) of the
electrode was determined by a standard ferrocene couple and the ratio of the ring and the disk
limiting current gives the value of N. During the RRDE investigation, the ring potential was set to
1.3 V (vs. RHE).
To measure the faradaic efficiency (ε) of Ni-NGr for oxygen evolution reaction, measurement
was done by applying a current step from 1 to 15 mA/cm2 to the carbon disk and the
corresponding voltage was measured. During the measurement, the rotation speed of the RRDE
was kept at 1600 rotation per minutes (rpm). The faradaic efficiency was calculated by using
Equation 1.17
S5
Faradaic efficiency (ε) = 2*Ir / Id*N ……….……… (Equation 1)
where, Ir is the ring current, Id is 2.7 mA, is the constant disk current for a 0.2646 cm2 disk
electrode to get minimum current density of 10 mA/cm2 and N is the collection efficiency (0.37).
2. Results:
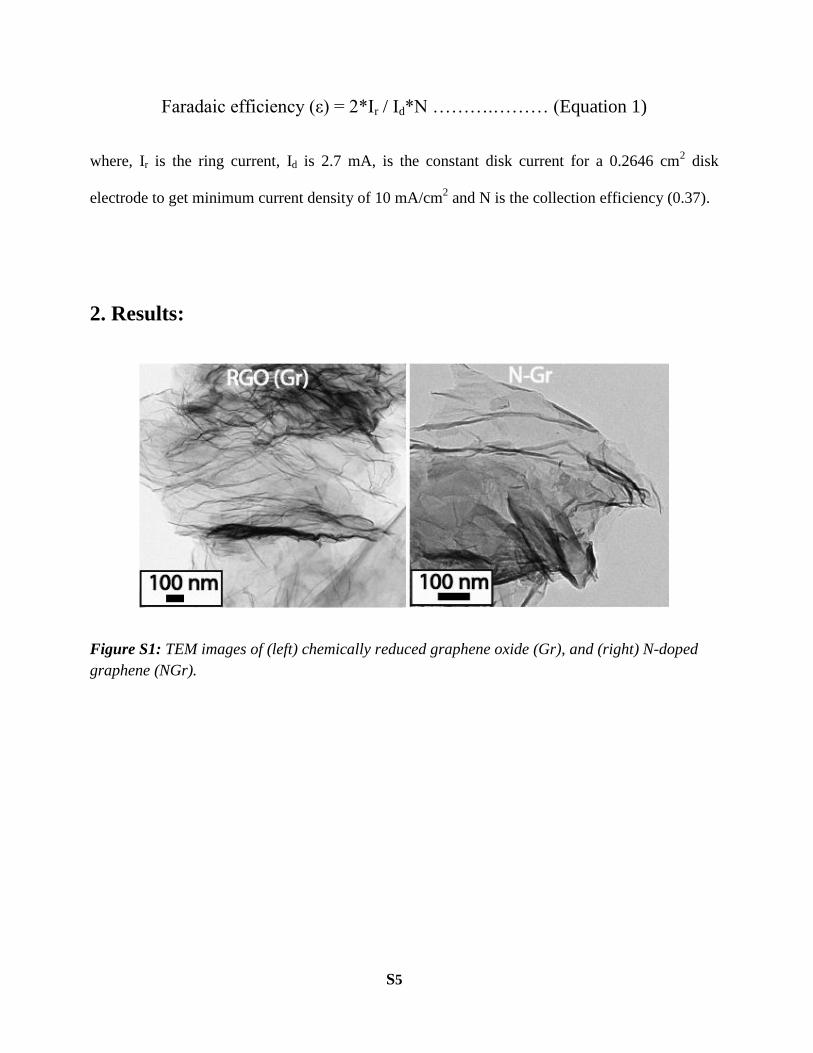
Figure S1: TEM images of (left) chemically reduced graphene oxide (Gr), and (right) N-doped
graphene (NGr).
S6
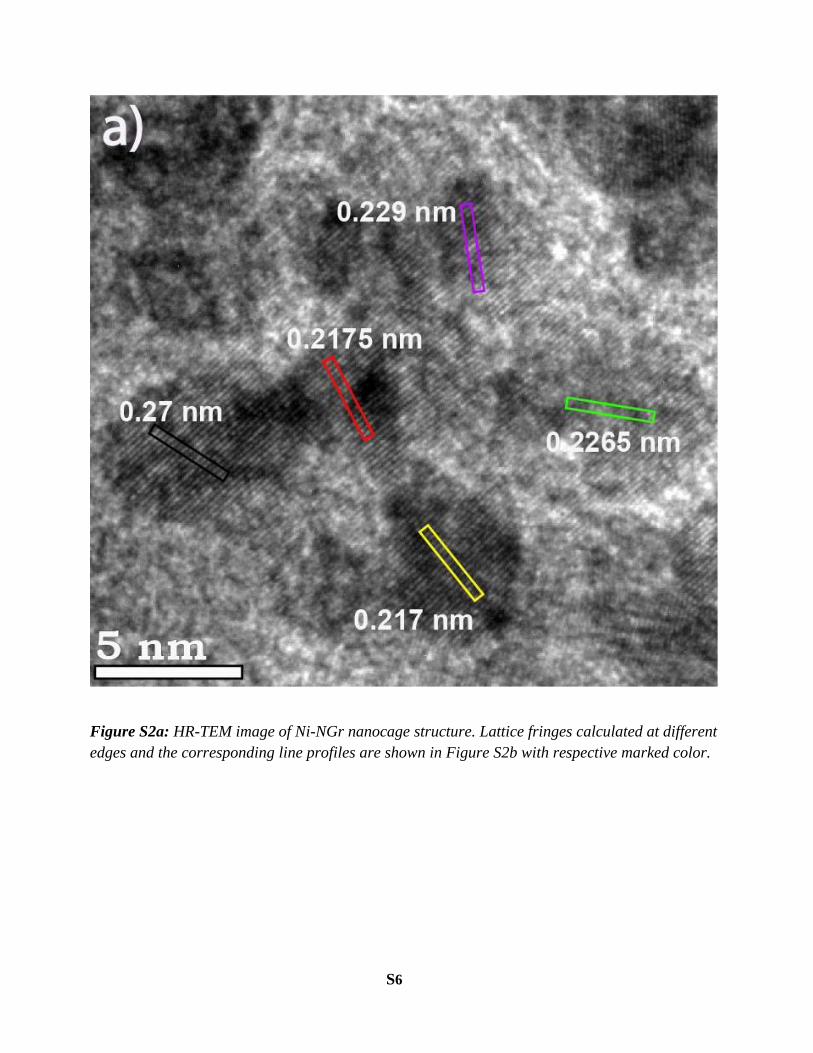
Figure S2a: HR-TEM image of Ni-NGr nanocage structure. Lattice fringes calculated at different
edges and the corresponding line profiles are shown in Figure S2b with respective marked color.
S7
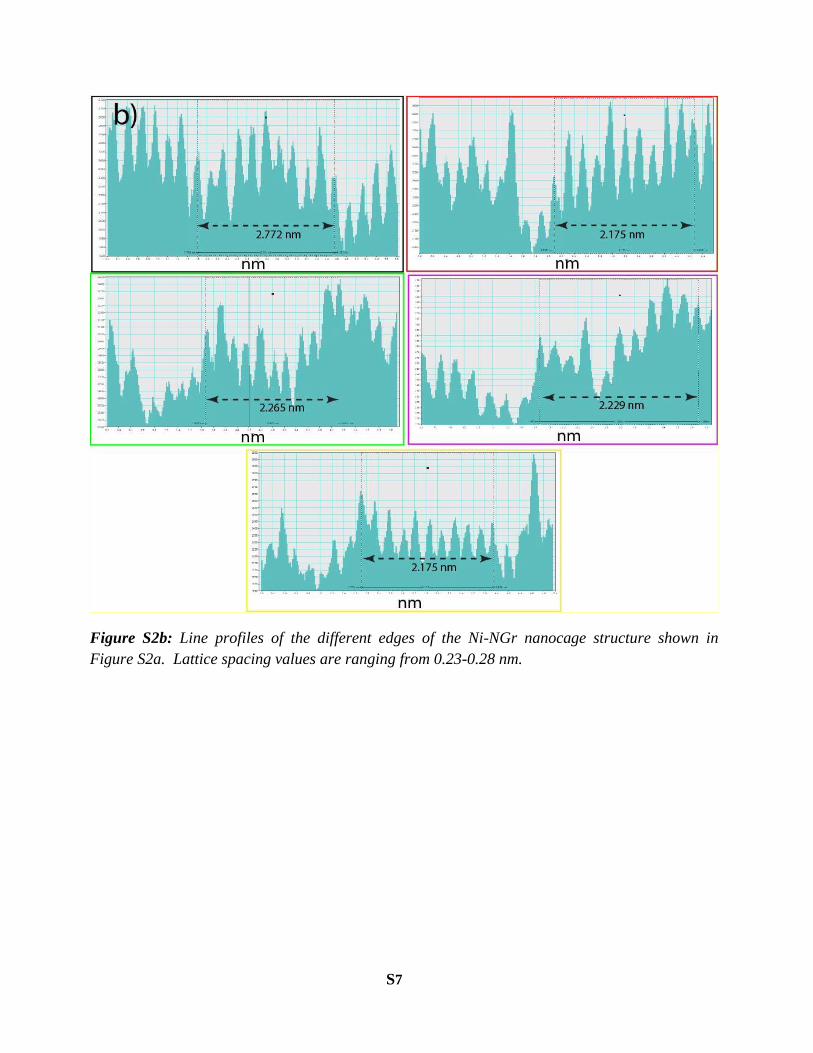
Figure S2b: Line profiles of the different edges of the Ni-NGr nanocage structure shown in
Figure S2a. Lattice spacing values are ranging from 0.23-0.28 nm.
S8
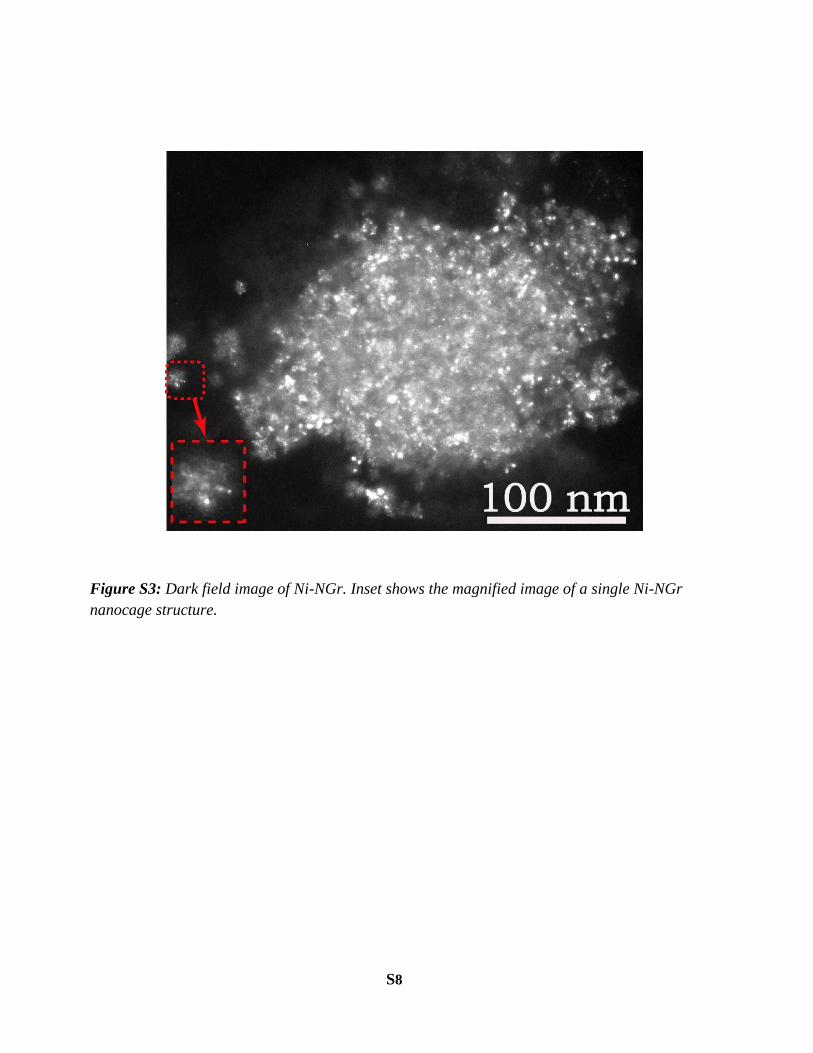
Figure S3: Dark field image of Ni-NGr. Inset shows the magnified image of a single Ni-NGr
nanocage structure.
S9
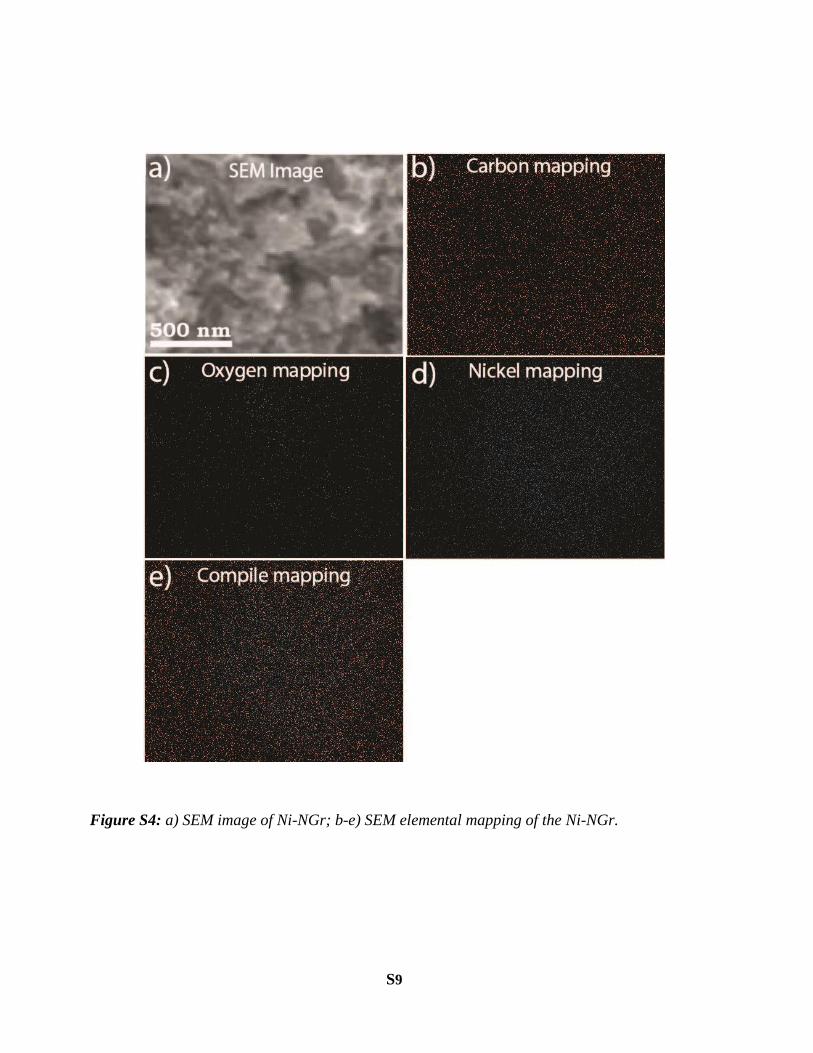
Figure S4: a) SEM image of Ni-NGr; b-e) SEM elemental mapping of the Ni-NGr.
S10
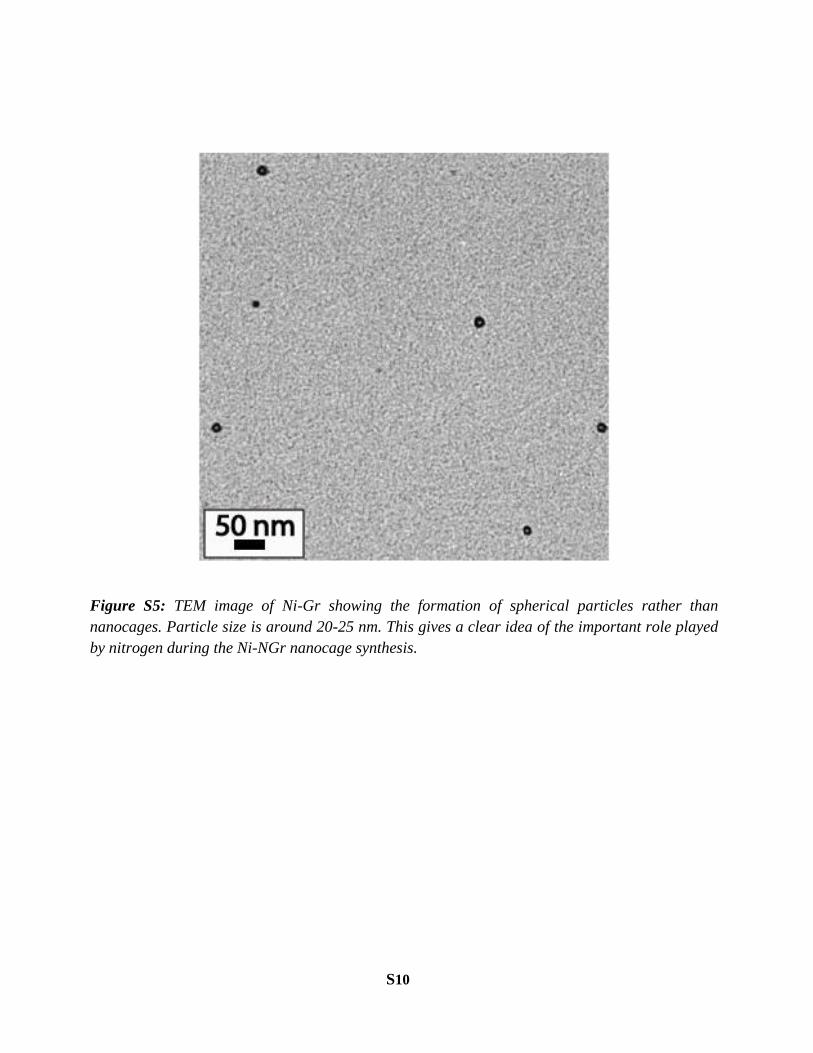
Figure S5: TEM image of Ni-Gr showing the formation of spherical particles rather than
nanocages. Particle size is around 20-25 nm. This gives a clear idea of the important role played
by nitrogen during the Ni-NGr nanocage synthesis.
S11
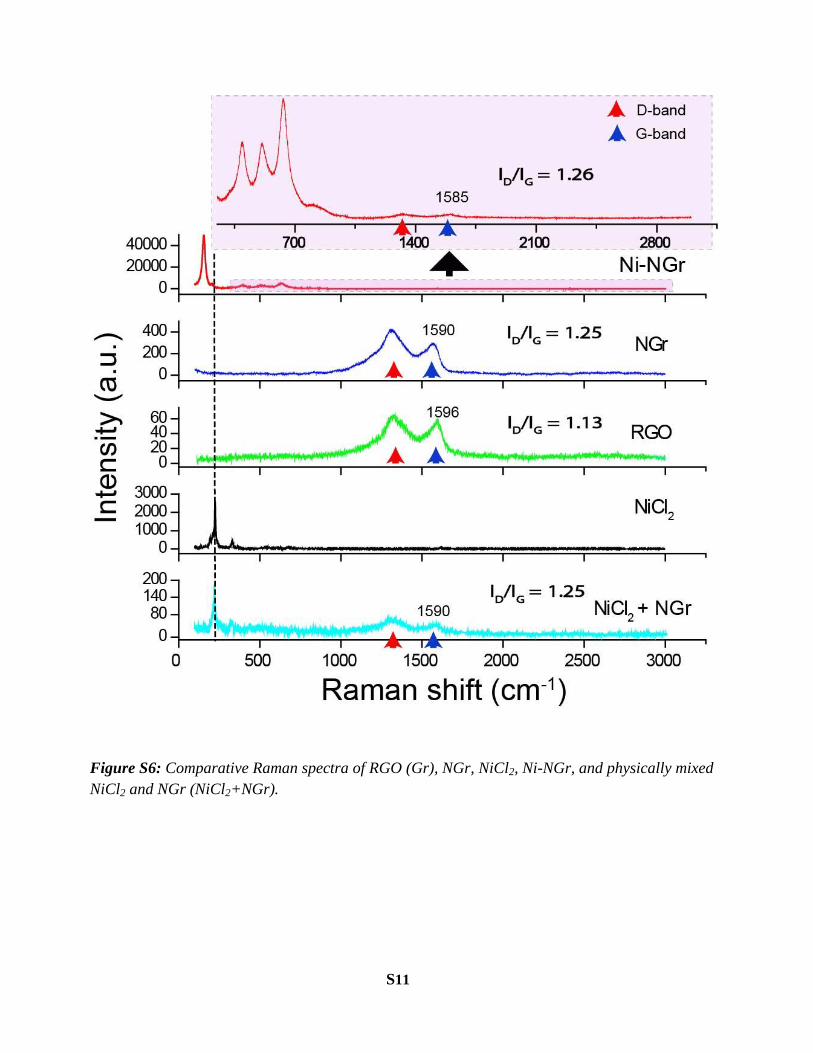
Figure S6: Comparative Raman spectra of RGO (Gr), NGr, NiCl2, Ni-NGr, and physically mixed
NiCl2 and NGr (NiCl2+NGr).
S12
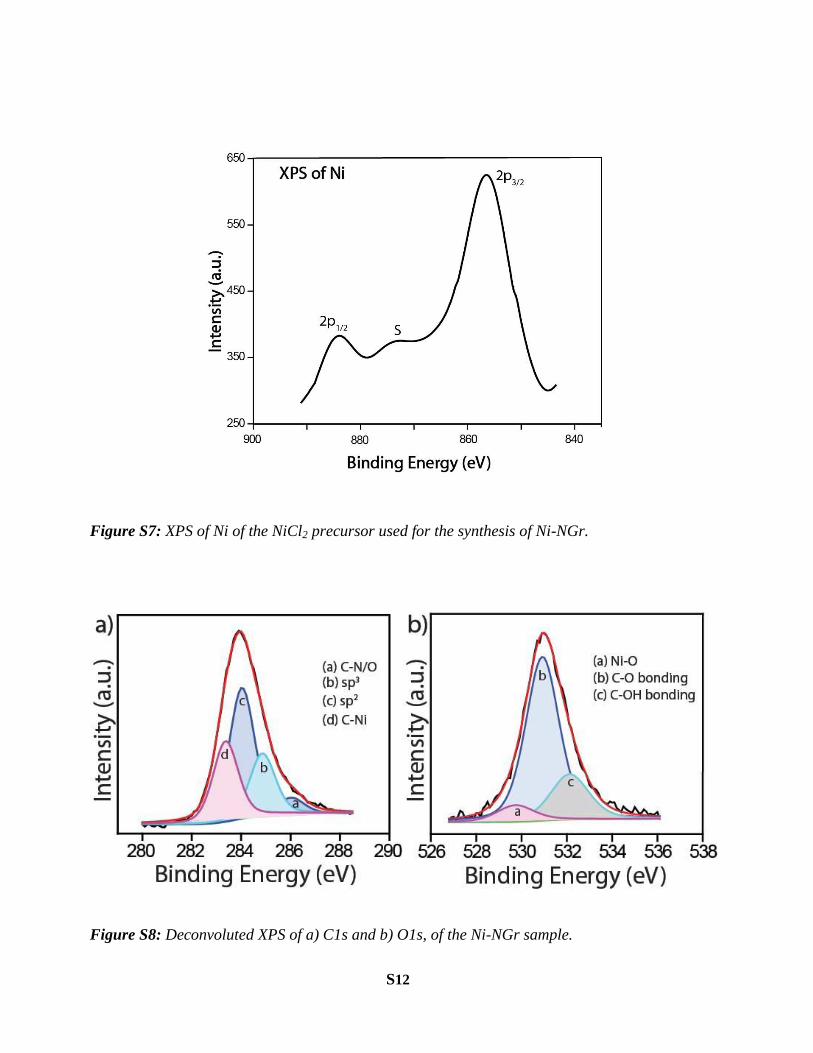
Figure S7: XPS of Ni of the NiCl2 precursor used for the synthesis of Ni-NGr.
Figure S8: Deconvoluted XPS of a) C1s and b) O1s, of the Ni-NGr sample.
S13
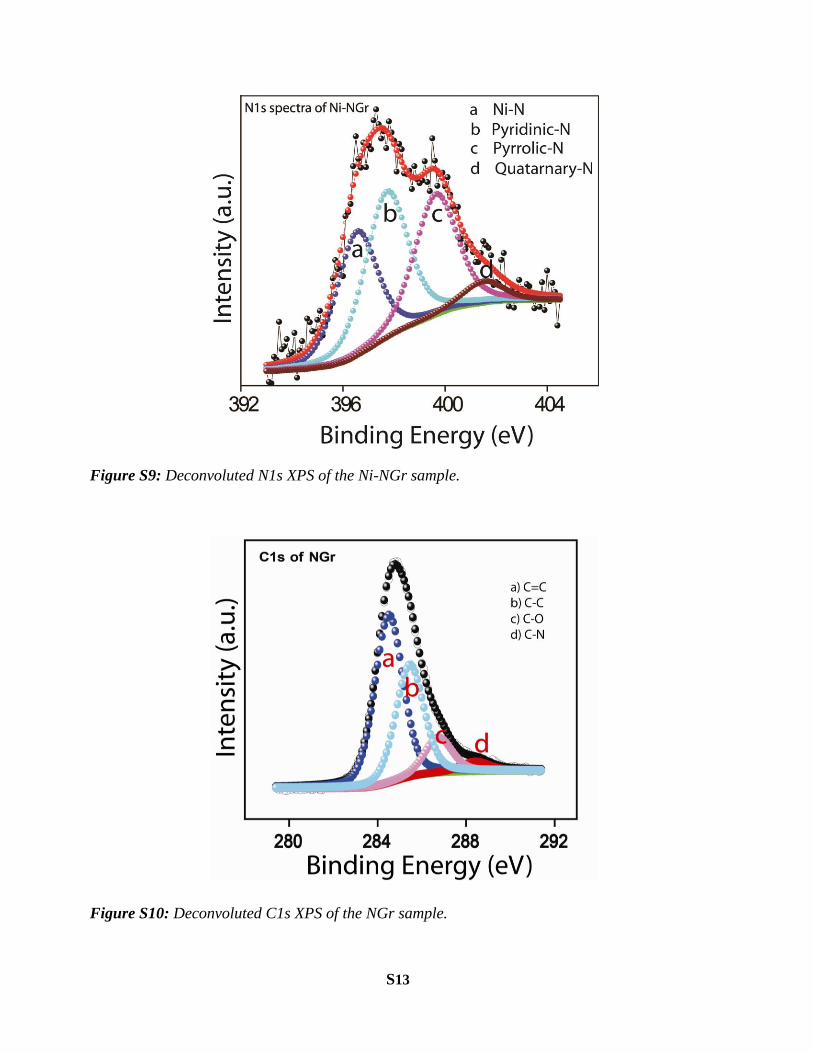
Figure S9: Deconvoluted N1s XPS of the Ni-NGr sample.
Figure S10: Deconvoluted C1s XPS of the NGr sample.
S14
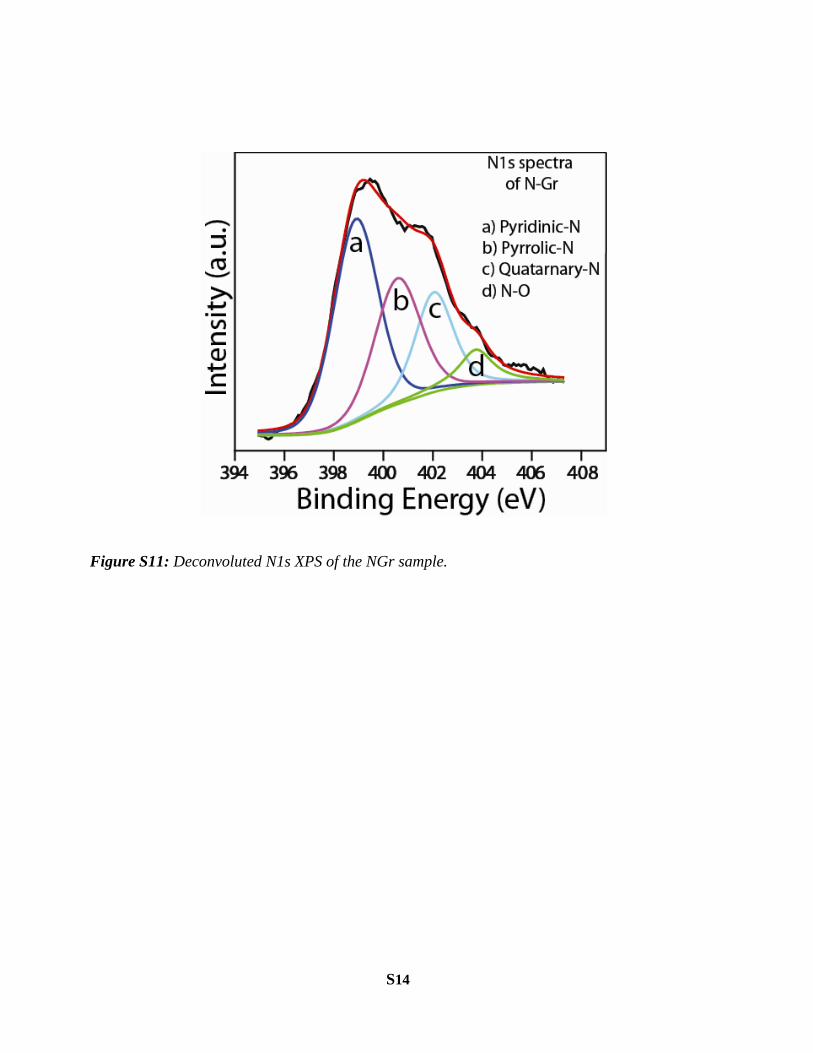
Figure S11: Deconvoluted N1s XPS of the NGr sample.
S15
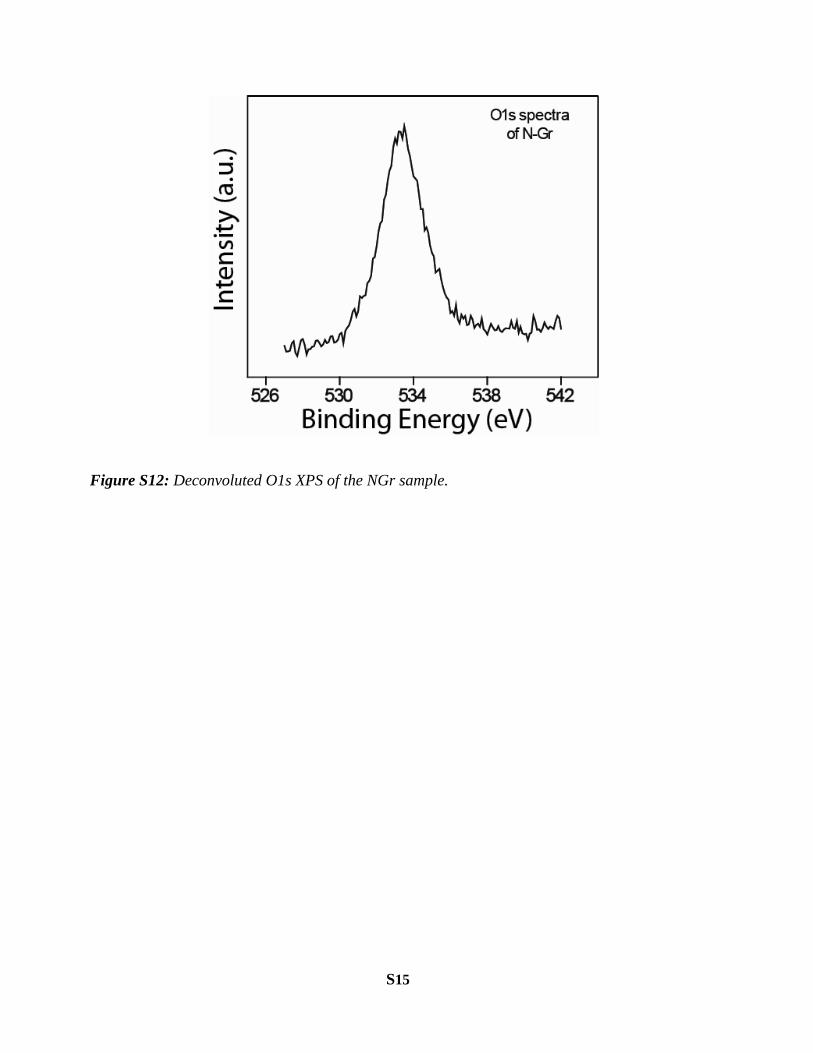
Figure S12: Deconvoluted O1s XPS of the NGr sample.

S16
Figure S13: a) Comparative CV of NGr and Ni-NGr, performed at a scan rate of 50 mV/s, b)
Tafel plot for oxygen evolution activity of Ni-NGr, and c) rotating-ring disk electrode (RRDE)
study for OER of Ni-NGr nanocages, recorded in nitrogen saturated 0.1M KOH at 1600 rpm. The
disk electrode is subjected to a series of current steps, and the corresponding potentials are
measured.

S17
Figure S14: LSV OER stability of NGr recorded in nitrogen saturated 0.1M KOH at 1600 rpm.
The overpotential is around 470 mV (at onset). The current is also very low for OER.

S18
Figure S15: Comparative LSV of Nickel particles, Ni-Gr, and Ni-NGr recorded in nitrogen
saturated 0.1M KOH at 1600 rpm. The calculated overpotential at 20 mAcm-2
for Ni-particles,
Ni-Gr and Ni-NGr is ~370, 570, and 290 mV. The OER current is seem to be in order of Ni-NGr
> Ni-particles > Ni-Gr.
S19
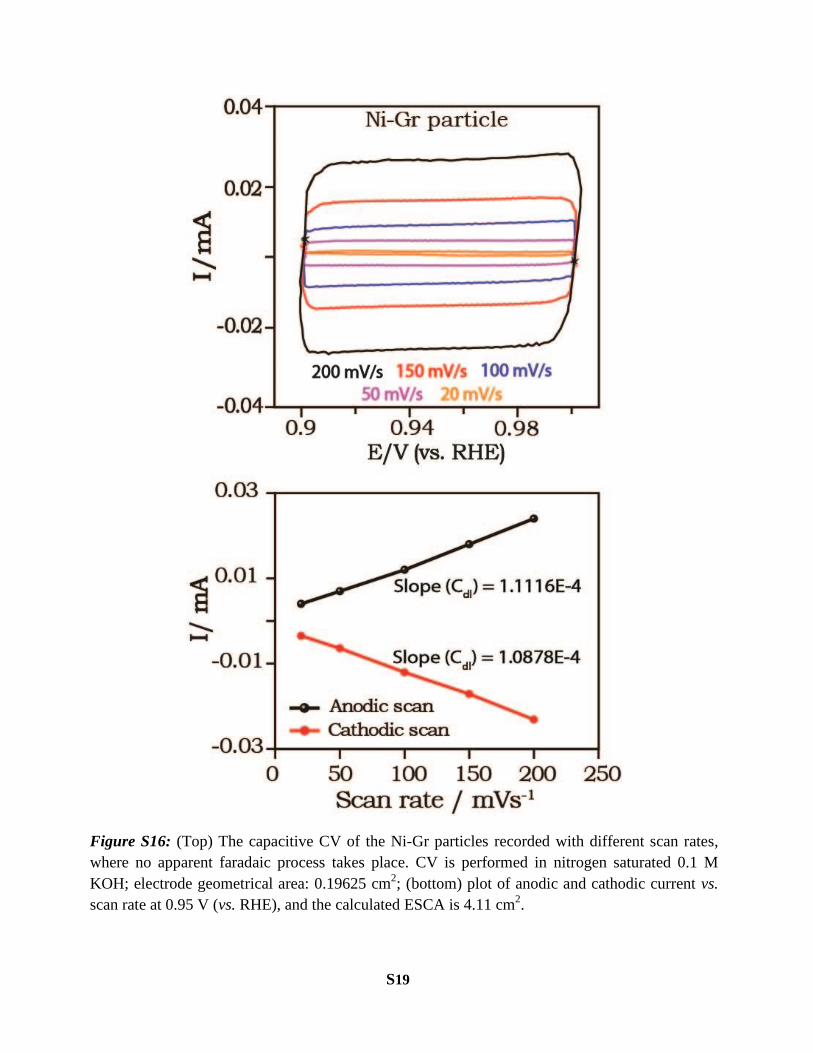
Figure S16: (Top) The capacitive CV of the Ni-Gr particles recorded with different scan rates,
where no apparent faradaic process takes place. CV is performed in nitrogen saturated 0.1 M
KOH; electrode geometrical area: 0.19625 cm2; (bottom) plot of anodic and cathodic current vs.
scan rate at 0.95 V (vs. RHE), and the calculated ESCA is 4.11 cm2.
S20
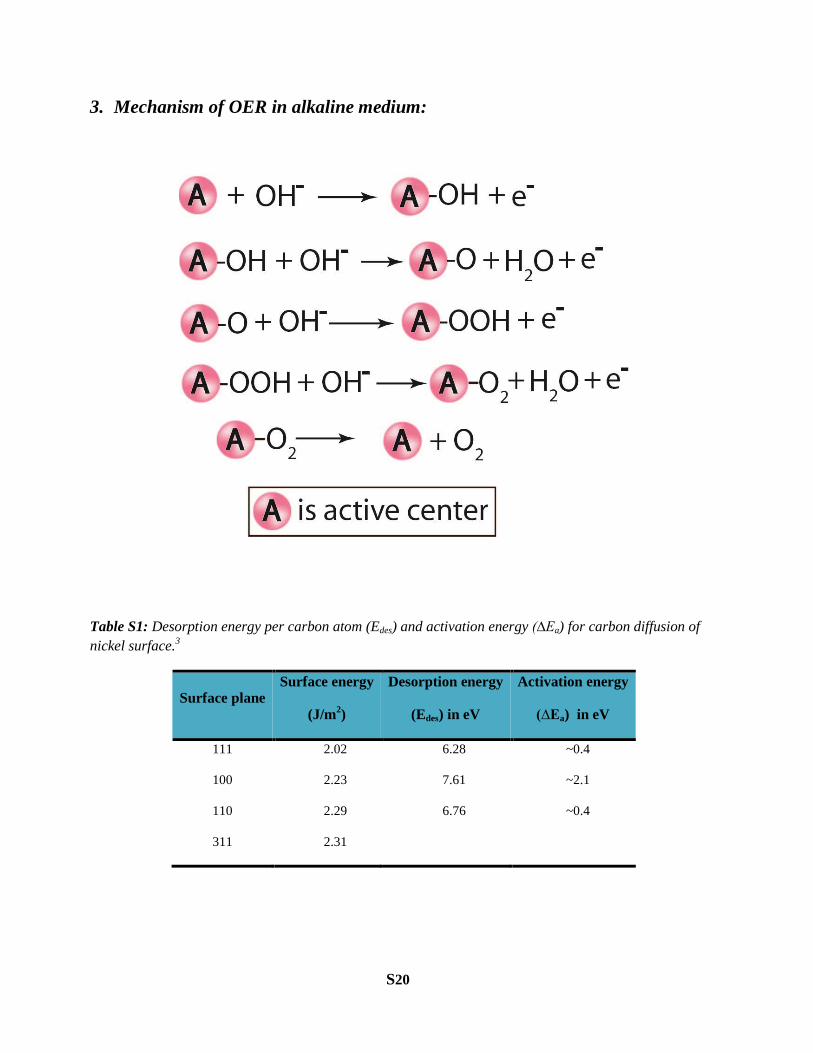
3. Mechanism of OER in alkaline medium:
Table S1: Desorption energy per carbon atom (Edes) and activation energy (∆Ea) for carbon diffusion of
nickel surface.3
Surface plane Surface energy
(J/m2)
Desorption energy
(Edes) in eV
Activation energy
(∆Ea) in eV
111 2.02 6.28 ~0.4
100 2.23 7.61 ~2.1
110 2.29 6.76 ~0.4
311 2.31
S21
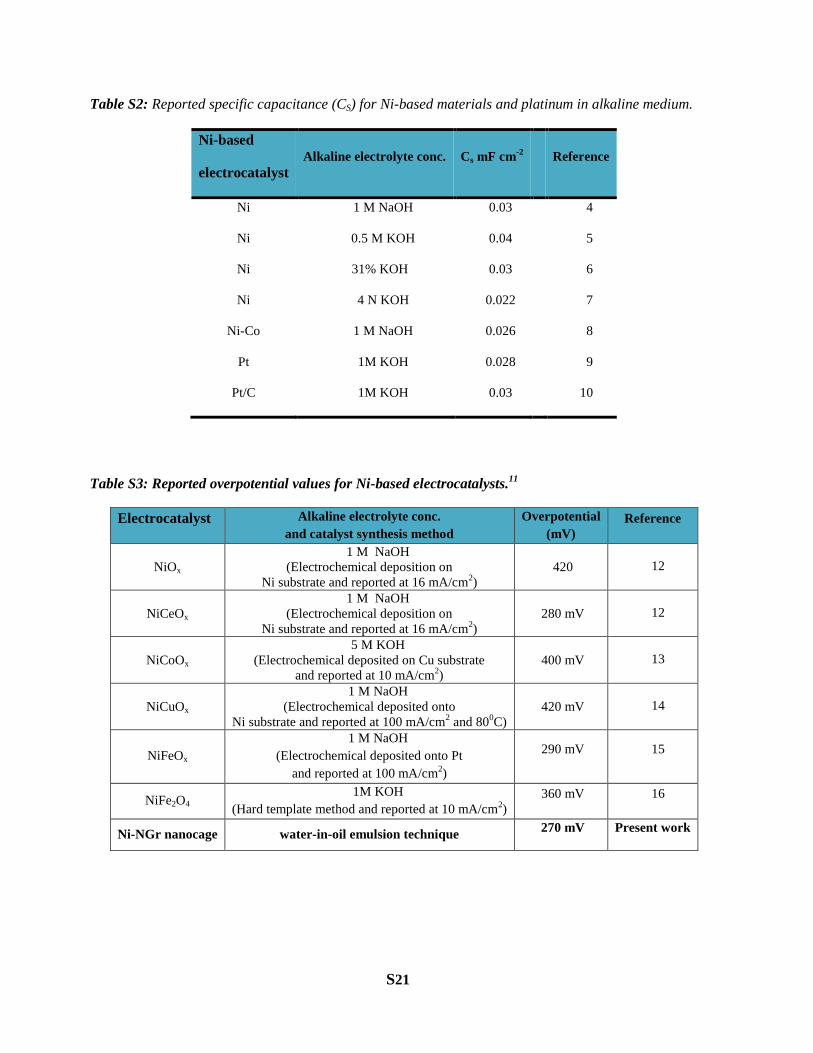
Table S2: Reported specific capacitance (CS) for Ni-based materials and platinum in alkaline medium.
Ni-based
electrocatalyst
Alkaline electrolyte conc. Cs mF cm-2
Reference
Ni 1 M NaOH 0.03 4
Ni 0.5 M KOH 0.04 5
Ni 31% KOH 0.03 6
Ni 4 N KOH 0.022 7
Ni-Co 1 M NaOH 0.026 8
Pt 1M KOH 0.028 9
Pt/C 1M KOH 0.03 10
Table S3: Reported overpotential values for Ni-based electrocatalysts.11
Electrocatalyst Alkaline electrolyte conc.
and catalyst synthesis method
Overpotential
(mV)
Reference
NiOx
1 M NaOH
(Electrochemical deposition on
Ni substrate and reported at 16 mA/cm2)
420 12
NiCeOx
1 M NaOH
(Electrochemical deposition on
Ni substrate and reported at 16 mA/cm2)
280 mV 12
NiCoOx
5 M KOH
(Electrochemical deposited on Cu substrate
and reported at 10 mA/cm2)
400 mV 13
NiCuOx
1 M NaOH
(Electrochemical deposited onto
Ni substrate and reported at 100 mA/cm2 and 80
0C)
420 mV 14
NiFeOx
1 M NaOH
(Electrochemical deposited onto Pt
and reported at 100 mA/cm2)
290 mV 15
NiFe2O4 1M KOH
(Hard template method and reported at 10 mA/cm2)
360 mV 16
Ni-NGr nanocage water-in-oil emulsion technique 270 mV Present work
S22
4. References
1. Marcano, D. C.; Kosynkin, D. V.; Berlin, A.; Sinitskii, Z.; Sun, A.; Slesarev, L. B.; Alemany, W.;
Tour, J. M. ACS Nano, 2010, 8, 4806-4814.
2. Bard, A. J.; Faulkner, L. R. Electrochemical Methods: Fundamentals and Applications, Second
Edition, Wiley, ISBN: 978-81-265-0807-5.
3. Hong, S.; Shin, Y-H.; Ihm, J. Jpn. J. Appl. Phys., 2002, 41, 6142-6144.
4. Lasia, A.; Rami, A.; J. Electroanal. Chem. 1990, 294, 123-141.
5. Gu, P.; Bai, L.; Gao, L.; Brousseau, R.; Conway, B. E. Electrochim. Acta, 1992, 37, 2145.
6. Gagnon, E. G. J. Electrochem. Soc. 1973, 120, 1052-1056.
7. Weininger, J. L.; Breiter, M. W. J. Electrochem. Soc. 1963, 110, 484-490; J. Electrochem. Soc. 1964,
111, 707-712.
8. Wu, G.; Li, N.; Zhou, D.-R.; Mitsuo, K.; Xu, B.-Q. J. Solid State Chem. 2004, 177, 3682-3692.
9. Bai, L.; Gao, L.; Conway, B. E. J. Chem. Soc., Faraday Trans. 1993, 89, 235-242.
10. Fournier, J.; Brossard, L.; Tilquin, J.-Y.; Cote, R.; Dodelet, J.-P.; Guay, D.; Menard, H. J.
Electrochem. Soc. 1996, 143, 919-926.
11. McCrory, C. C. L.; Jung, S.; Peters, J. C.; Jaramillo, T. F. J. Am. Chem. Soc. 2013, 135, 16977.
12. Corrigan, D. A.; Bendert, R. N. J. Electrochem. Soc. 1989, 136, 723−728.
13. Ho, J. C. K.; Piron, D. L. J. Appl. Electrochem. 1996, 26, 515−521.
14. Li, X.; Walsh, F. C.; Pletcher, D. Phys. Chem. Chem. Phys., 2011, 13, 1162−1167.
15. Merrill, M. D.; Dougherty, R. C. J. Phys. Chem. C 2008, 112, 3655−3666.
16. Landon, J.; Demeter, E.; Inoglu, N.; KEturakis, C.; Wachs, I. E.; Vasic, R.; Frenkel, A. I.; Kitchin, J.
R. ACS Catal. 2012, 2, 1793-1801.
17. Hurst, J. K. Science, 2010, 328, 315; Kanan, M. W.; Nocera, D. G. Science, 2008, 321, 1072.