“supply-side tax cuts and the truth about the reagan ... · supply-side tax cuts and the truth...
TRANSCRIPT
Cato Institute Policy Analysis No. 261:Supply-Side Tax Cuts and the Truth about the ReaganEconomic Record
October 22, 1996
William A. Niskanen, Stephen Moore
William A. Niskanen is chairman and Stephen Moore is director of fiscal policy studies at the Cato Institute.
Executive Summary
Bob Dole's proposal for a 15 percent income tax cut has reignited the long-standing debate about the economic impactof Reaganomics in the 1980s. This study assesses the Reagan supply-side policies by comparing the nation's economicperformance in the Reagan years (1981-89) with its performance in the immediately preceding Ford-Carter years(1974-81) and in the Bush-Clinton years that followed (1989-95).
On 8 of the 10 key economic variables examined, the American economy performed better during the Reagan yearsthan during the pre- and post-Reagan years.
Real economic growth averaged 3.2 percent during the Reagan years versus 2.8 percent during the Ford-Carteryears and 2.1 percent during the Bush-Clinton years.
Real median family income grew by $4,000 during the Reagan period after experiencing no growth in the pre-Reagan years; it experienced a loss of almost $1,500 in the post-Reagan years.
Interest rates, inflation, and unemployment fell faster under Reagan than they did immediately before or after hispresidency.
The only economic variable that was worse in the Reagan period than in both the pre- and post-Reagan yearswas the savings rate, which fell rapidly in the 1980s. The productivity rate was higher in the pre-Reagan yearsbut much lower in the post-Reagan years.
This study also exposes 12 fables of Reaganomics, such as that the rich got richer and the poor got poorer, the Reagantax cuts caused the deficit to explode, and Bill Clinton's economic record has been better than Reagan's.
Introduction
Bob Dole's call for a 15 percent across-the-board income tax cut has provoked yet another fierce debate about theReagan economic record. Because Dole's tax plan is at least partly modeled after Reagan's tax cuts of 1981, theReagan record has recently been put squarely back on trial. [1]

Judging from the partisan political discourse in Washington, there is virtually no agreement about what that record tellsus. Republicans describe the 1980s as an era of prosperity--a decade when America reasserted its economic andmilitary might. Democrats, on the other hand, portray the Reagan presidency as a period of record budget deficits,economic decline, and widening income gaps between rich and poor. Senator Bill Bradley (D-N.J.) recently describedthe 1980s as a decade of "discredited supply side economics." President Clinton recently warned that, like the Reagantax cuts, the Dole tax cut would "balloon the deficit, raise interest rates, and weaken the economy." [2]
Often partisanship and ideology prevent a dispassionate assessment of the Reagan years. The political left has adoptedthe convention of arguing that the beneficial economic changes in the 1980s--the conquering of inflation, the surge inemployment, and the sustained economic expansion--had little to do with Reagan's policies, whereas any negativechange--the explosion in the budget deficit, the savings and loan crisis, and so forth--was a direct consequence of thefailed theology of Reaganomics. [3] Meanwhile, the right argues that only the triumphs of Reagan's record deservemuch attention, and that any blemishes--again the big budget deficits--were inconsequential or the fault of theDemocrats in Congress. [4]
This study attempts to cut through the fog created by this partisan dialogue and spotlight the real economic record ofthe 1980s--sticking to "just the facts." All the figures provided in this study come from standard statistical sources:Bureau of the Census, the Economic Report of the President, and Historical Tables, Budget of the U.S. Government.To judge how well the economy performed under Reagan's policies, we compare the economic performance of theReagan years (1981-89) with that of the immediate pre-Reagan years (1974-81) and the post-Reagan years (1989-95).
In the last part of the study we provide some interpretation of these economic and fiscal data and sort out fact fromfable regarding the 1980s. We also examine the implications of the economic data as they relate to the advisability ofan income tax rate cut in 1997.
The Era of Reaganomics
In 1981 Ronald Reagan entered the White House and immediately implemented a dramatic new economic policyagenda for the country that was dubbed "Reaganomics." [5]Reaganomics consisted of four key elements to reverse thehigh-inflation, slow-growth economic record of the 1970s: (1) a restrictive monetary policy designed to stabilize thevalue of the dollar and end runaway inflation; (2) a 25 percent across-the-board tax cut enacted (The EconomicRecovery Tax Act of 1981) designed to spur savings, investment, work, and economic efficiency; (3) a promise tobalance the budget through domestic spending restraint; and (4) an agenda to roll back government regulation.
Clearly, some of those goals were accomplished; others were not. The most objective way to assess whether thepolicies were a success is to examine the economic evidence for the Reagan years once the policies were implemented.
A Model for Assessing the Reagan Record
There is some disagreement about what date should be used to measure the economic starting point of the Reagan era.A common ploy of Reagan's critics is to measure the economy's performance from 1979 to 1989 and falsely describethe record over this period as "the Reagan years." For example, in 1991 the Democrats on the Joint EconomicCommittee of Congress released a report entitled "Falling Behind: The Growing Income Gap in America," whichpurportedly proves that the victims of Reaganomics were the least affluent Americans. The report concluded that"families in the lowest forty percent of the income distribution actually had lower real incomes on average in 1989than they did in 1979." Upon closer inspection, however, what the income data really show is that when JimmyCarter's economic policies were in effect, family incomes plummeted by 9 percent, but that after Reagan's economicpolicies took effect (1982-89), family incomes rose by 11 percent. In the Joint Economic Committee report,Reaganomics is blamed for the poor performance of the economy under Carter. Ronald Reagan had many seeminglymagical qualities, but his policies were never able to influence the economic direction of the nation at least two yearsbefore they took effect. Some of Reagan's supporters, on the other hand, define the Reagan years as only the sevenyears of economic expansion, 1983-89, while conveniently omitting the recession years of 1981 and 1982. [6]

There are two defensible methods of measuring the performance of the economy on Reagan's watch. One method is toexamine the economic record from the month Reagan formally took office, January 1981, through the month he leftthe White House, January 1989.
An alternative approach is to allow a one-year lag for the policy changes to be enacted and take effect on the economy.Reagan's tax cuts were not even passed by Congress until midsummer of 1981 and did not begin to take effect untilOctober 1, 1981. His first budget proposal was for fiscal year 1982. Hence, if we define the beginning of the Reaganyears as the first full year when the policies were in effect, the eight years in which Reagan's policies were in effectwere 1982-89. This latter approach seems to provide a more accurate gauge of the economy's reaction to the change inpolicies Reagan enacted in 1981, and for this reason we adopt this as the standard for analysis in this study--that is, wemeasure the economic effects of Reagan policies beginning with January 1982 and using 1981 as the base year ofcomparison. (This still picks up the deep recession of the early 1980s.) For those who are unsatisfied with this methodof measuring the Reagan record, in Table 1 we present the data both ways: first, from the month Reagan entered officethrough the month he left office, and second, with a one-year lag to adjust for the timing of the policy changes. Theresults do not differ substantially regardless of which dates are used.
Just as controversial is the issue of when the Reagan era ended. Again, Reagan's political foes often describe the entire12 years of the Reagan and Bush administrations as the "Reagan years." [7]At first blush this seems logical: twoRepublican administrations in succession would normally suggest a continuation of policy from one to the other. Yetthe real and dramatic shift in economic policy in Washington occurred not in 1993, with the start of the Clintonadministration, but rather in 1990, with George Bush's repudiation of his "no new taxes" pledge that led to both theenactment of a large anti-supply-side tax increase and a flurry of legislation--from the Clean Air Act amendments, tothe Civil Rights Act of 1991, to the Americans with Disabilities Act--that began the reregulation of America in the1990s. [8] Indeed, the Clinton economic program in most respects has been closest to that of George Bush, particularlywith respect to the direction of fiscal policy.
In sum, we delineate two years as marking turning points in economic policy in the United States: 1981 and 1990.Because these two years represent dramatic policy shifts, they provide a convenient and unique laboratory-like testingground for assessing the success or failure of Reaganomics. In this study we compare the economic performance in thepre-Reagan years (1974-81), the Reagan years (1981-89), and the post-Reagan years (1989-95). [9]
For fiscal variables examined at the end of this report, there is much less controversy over the start and the end of theReagan presidency. Reagan's first budget was for fiscal 1982 (not 1981), and his last budget was for fiscal 1989. [10]
The Real Reagan Economic Record
Table 1 contrasts side by side the economy's performance for the three periods of analysis--1974-81, 1981-89, and1989-95--for 10 key variables. We measure the change in each economic variable from the start of the period throughthe end and present the annualized change. [11] On 8 of the 10 key variables, the Reagan record unambiguouslyoutperformed the records of the pre- and post-Reagan years. The two exceptions were the savings rate, which declinedin the Reagan years at a faster rate than in the pre- and post-Reagan years, and productivity, which grew faster in thepre-Reagan years but slower in the post-Reagan years. [12] The following is a summary for each of the 10 variables:
Economic Growth. The average annual growth rate of real gross domestic product (GDP) from 1981 to 1989 was3.2 percent per year, compared with 2.8 percent from 1974 to 1981 and 2.1 percent from 1989 to 1995. The 3.2percent growth rate for the Reagan years includes the recession of the early 1980s, which was a side effect ofreversing Carter's high-inflation policies, and the seven expansion years, 1983-89. During the economicexpansion alone, the economy grew by a robust annual rate of 3.8 percent. By the end of the Reagan years, theAmerican economy was almost one-third larger than it was when they began. [13] Figure 1 shows the economicgrowth rate by president since World War II. That rate was higher in the 1980s than in the 1950s and 1970s butwas substantially lower than the rapid economic growth rate of more than 4 percent per year in the 1960s. TheKennedy income tax rate cuts of 30 percent that were enacted in 1964 generated several years of 5 percentannual real growth.

Economic Growth per Working-Age Adult. When we adjust the economic growth rates to take account ofdemographic changes, we find that the expansion in the Reagan years looks even better and that the 1970s'performance looks worse. GDP growth per adult aged 20-64 in the Reagan years grew twice as rapidly, onaverage, as it did in the pre- and post-Reagan years.Median Household Incomes. Real median household income rose by $4,000 in the Reagan years--from $37,868in 1981 to $42,049 in 1989, as shown in Figure 2. This improvement was a stark reversal of the income trends inthe late 1970s and the 1990s: median family income was unchanged in the eight pre-Reagan years, and incomeshave fallen by $1,438 in the anti-supply-side 1990s, following the 1990 and 1993 tax hikes. [14] Most of thedeclines in take-home pay occurred on George Bush's watch. Under Bill Clinton's tenure, there has been zeroincome growth in median household income.Employment. From 1981 through 1989 the U.S. economy produced 17 million new jobs, or roughly 2 millionnew jobs each year. Contrary to the Clinton administration's claims of vast job gains in the 1990s, the UnitedStates has averaged only 1.3 million new jobs per year in the post-Reagan years. The labor force United Stateshas averaged only 1.3 million new jobs expanded by 1.7 percent per year between 1981 and 1989, but by just 1.2percent per year between 1990 and 1995. [15]
Hours Worked. Table 1 confirms that hours worked per adult aged 20-64 grew much faster in the 1980s than inthe pre -or post-Reagan years.Unemployment Rate. When Reagan took office in 1981, the unemployment rate was 7.6 percent. In the recessionof 1981-82, that rate peaked at 9.7 percent, but it fell continuously for the next seven years. When Reagan leftoffice, the unemployment rate was 5.5 percent. This reduction in joblessness was a clear triumph of the Reaganprogram. Figure 3 shows that in the pre-Reagan years, the unemployment rate trended upward; in the Reaganyears, the unemployment rate trended downward; and in the post-Reagan years, the unemployment rate hasfluctuated up and down but today remains virtually unchanged from the 1989 rate.Productivity. For real wages to rise, productivity must rise. Over the past 30 years there has been a seculardownward trend in U.S. productivity growth. Under Reagan, productivity grew at a 1.5 percent annual rate, asshown in Figure 4. This was lower than in the 1950s, 1960s, and 1970s but much higher than in the post-Reaganyears. Under Clinton, productivity has increased at an annual rate of just 0.3 percent per year--the worstpresidential performance since that of Herbert Hoover.Inflation. The central economic evil that Ronald Reagan inherited in 1981 from Jimmy Carter was three years ofdouble-digit inflation. In 1980 the consumer price index (CPI) rose to 13.5 percent. By Reagan's second year inoffice, the inflation rate fell by more than half to 6.2 percent. In 1988, Reagan's last year in office, the CPI hadfallen to 4.1 percent. Figure 5 shows the inflation and interest rate trend.Interest Rates. In 1980 the interest rate on a 30-year mortgage was 15 percent; this rate rose to its all-time peakof 18.9 percent in 1981. The prime rate steadily fell over the subsequent six years to a low of 8.2 percent in 1987as the inflationary expectation component of interest rates fell sharply. The prime rate hit its 20-year low in 1993at 6.0 percent. The Treasury Bill rate also fell dramatically in the 1980s--from 14 percent in 1981 to 7 percent in1988. In the 1990s, interest rates have continued to migrate gradually downward, as shown in Figure 5.Savings. The savings rate did not rise in the 1980s, as supply-side advocates had predicted. In fact, in the 1980sthe personal savings rate fell from 8 percent to 6.5 percent. [16]In the 1990s the average savings rate has falleneven further to an average of 4.9 percent [17]--although the rate of decline has slowed.
The decline in the personal savings rate in the 1980s was disappointing, but two factors mitigate the implications ofthese statistics. First, the drop in the savings rate was partly a natural response to demographic changes in America--namely, the baby boomers entering their peak spending years. Second, the savings rate data fail to account for realgains in wealth, which clearly are an important form of savings. The real value of capital assets and property doubledfrom 1980 to 1990. The Dow Jones Industrial Average nearly tripled from a low of 884 in 1982 to 2,509 in 1989.These increases in the value of stocks, bonds, homes, businesses, and so forth added to Americans' balance sheetshundreds of billions of dollars of wealth that are not accounted for in the savings rate statistics. [18]
Table 1The Real Reagan Economic Record
Start of Presidency to End of One-Year Policy Lag

PresidencyPre-Reagan Reagan Post-
ReaganPre-Reagan Reagan Post-
Reagan
1973-80 1980-88 1988-95 1974-
811981-89
1989-95
Annual Percentage ChangeReal GDP (chained 1992 dollars) 2.4 3.1 2.0 2.8 3.2 2.1Real GDP (chained 1992 dollars),per member of the adultworking-age population* 0.5 1.7 1.1 0.9 1.9 0.8
Real median family income 0.0 0.8 -0.3 0.0 1.4 -0.6Total civilian employment, per member of the adultworking-age population* 0.3 0.5 0.2 0.2 0.7 0.1
Total hours worked, business sector, per member of the adultworking-age population* -0.5 0.5 0.2 -0.5 0.8 0.0
Productivity (business sector output per hour) 1.2 1.5 1.1 1.6 1.3 1.1Annual Percentage Point Change
Unemployment rate 0.3 -0.2 0.0 0.2 -0.3 0.0Inflation rate (change in GDP chain-type price index) 0.4 -0.8 -0.2 -0.2 -0.5 -0.3Long-term interest rate (corporate bonds, Moodys Aaa) 0.6 -0.3 -0.3 0.8 -0.6 -0.3Personal savings rate -0.2 -0.4 0.0 0.0 -0.5 -0.1
Source: Cato Institute calculations, based on data from Economic Report of the President, 1996; and Department ofCommerce.*Figures were divided by the working-age adult population (defined as those aged 20-64).


The Reagan Fiscal Record
The fiscal record of the 1980s was much less impressive than the economic record. The major outcomes of Reagan'sbudgetary policies, as well as of the pre- and post-Reagan budgetary policies, are summarized in Table 2. Highlightsare as follows:
Budget Deficit. The budget deficit exploded in the 1980s. Figure 6 shows that in 1981, the budget deficit was$101 billion (in 1987 dollars) and 2.7 percent of GDP. In 1983 it peaked at $236 billion and 6.3 percent of GDP.

By the time Reagan left office in 1989, however, it had fallen to $141 billion and 2.9 percent of GDP. Thesedeficits were higher in real dollars than those under any other post-World War II president except for GeorgeBush.National Debt. The national debt (public debt) in real 1987 dollars doubled from $1,004 billion in 1981 to$2,028 billion in 1989. As a share of GDP, the debt increased from 27 percent to 42 percent, as shown in Figure7. In the 1990s the debt has risen to 52 percent of GDP. The rise in the national debt in the 1980s was large andhas imposed significant repayment costs on future generations.Total Revenue Growth. Nominal federal revenues dou-bled in the 1980s from $517 billion to $1.031 trillion.From 1981 to 1989 real federal revenues climbed by 20 percent. As a share of GDP, however, federal taxrevenues fell by 1.0 percentage point during that period.Income Tax Receipts. Even income tax revenues grew substantially in the 1980s. In 1981 income tax receiptstotaled $347 billion; in 1989 they totaled $549 billion, a 58 percent increase. In fact, income tax collections grewonly slightly slower in the 1980s than in the 1990s despite income tax rate reductions in the Reagan years andincreases in the Bush-Clinton years. Real income tax revenues rose by 16.3 percent from 1982 to 1989 after thetop income tax rate had been reduced from 70 percent to 50 percent in 1983, and then to 28 percent in 1986.According to the latest (August 1996) Congressional Budget Office (CBO) forecast, real income tax revenueswill have grown by 17.9 percent from 1990 to 1997, following the raising of the top income tax rate from 28percent to 31 percent in 1990 and then to 39.6 percent in 1993. [19] On a purely static basis, the 1990 taxincrease raised $380 billion less in income tax revenues from 1991 to 1995 than had been predicted. [20] Federal Spending. The federal budget was not cut under Reagan. In fact, it was 69 percent larger when Reaganleft office than when he entered it--22 percent larger in real terms. As a share of GDP, federal outlays declinedby less than 1 percentage point. [21]
Defense Spending. From 1981 to 1989, the Pentagon budget doubled from $158 billion to $304 billion. The yearsof the greatest spending hike in the military budget were 1978-87, when the Pentagon's expenditures rose from$180 billion to $280 billion in real 1987 dollars.[22] Domestic Spending. Overall domestic spending growth was relatively constrained during the Reagan presidency,particularly compared with that of other presidencies, as shown in Table 3. In fact, domestic spending grew at aslower real rate under Reagan than under all other recent presidents. Moreover, domestic outlays as a share ofGDP fell from 15.3 to 12.9 percent from 1981 to 1989 (Table 2). But the reductions in domestic spending weresubstantially smaller than required to balance the federal budget, cut taxes, and finance a military build-up.
Table 2Budget Trends before, during, and after the Reagan Years
Percentage ChangePre-Reagan Reagan Post-Reagan
FY1973 FY1981 FY1989 FY1996 1973-81 1981-89 1989-96Billions of 1987 Dollars
Total outlays 620.3 867.7 1,057.2 1,170.5 39.9 21.8 10.7Defense 197.2 198.2 285.9 197.0 0.5 44.2 -31.1Domestic 380.0 581.1 615.0 790.0 52.9 5.8 28.5Interest 43.1 88.4 156.3 183.5 105.1 76.8 17.4Receipts 582.7 766.6 916.2 1,062.1 31.6 19.5 15.9Individual income tax revenue 260.7 365.8 412.2 469.6 40.3 12.7 13.9Deficit 37.6 101.0 141.0 108.4 168.6 39.6 -23.1Debt held by the public 860.7 1,004.7 2,025.2 2,805.4 16.7 101.6 38.5GDP (chain-weighted 1992 $)* 3,902.3 4,724.9 6,060.4 6,742.9 21.1 28.3 11.3
Percentage of GDPTotal outlays 19.3 22.9 22.1 21.4 3.6 -0.8 -0.7

Defense 6.0 5.3 5.9 3.6 -0.7 0.6 -2.3Domestic 11.9 15.3 12.9 14.5 3.4 -2.4 1.6Interest 1.4 2.3 3.3 3.3 0.9 1.0 0.0Receipts 18.1 20.2 19.2 19.4 2.1 -1.0 0.2Individual income tax revenue 8.1 9.6 8.6 8.6 1.5 -1.0 0.0Deficit 1.2 2.7 2.9 2.0 1.5 0.2 -0.9Debt held by the public 26.8 26.5 42.3 51.4 -0.3 15.8 9.1
Table 3Growth of Domestic Spending, by President
Annual PercentageAnnual Increase in Billions
President Increaseof 1995 dollars
Truman 5.5 5Eisenhower 7.5 12Kennedy/Johnson 8.0 21Nixon/Ford 8.5 42Carter 3.5 34Reagan 1.0 17Bush 4.5* 29Clinton 3.0* 23
Source: Historical Tables, Budget of the United States Government, Fiscal Year 1996.

*Includes nondefense spending in the defense budget.


The 1980s: Facts versus Fables
In this section we depart from the purely factual presentation of the economic and fiscal performance of the 1980spresented above and interpret what these data say about the Reagan years. We find in many cases that the historicalevidence contradicts much of the most commonly cited conventional wisdom of the Reagan years. Specifically, thereare 12 common fables about the 1980s that are at odds with the facts.
Fable 1: The Reagan Administration Relied on "Pie-in-the-Sky" Predictions That Tax Rate Cuts Would Payfor Themselves
Supply-siders predicted their tax cuts would pay for themselves. This was nonsense from day one, because the credibleevidence overwhelmingly indicates that revenue feedbacks from tax cuts is 35 cents per dollar, at most. Are we reallygullible enough to accept a free dinner while still suffering the indigestion from our "free" lunch? [23]
This is one of the great enduring myths of Reaganomics: that the White House relied on wild supply-side assumptionsregarding the revenue impact of the tax cuts. The Reagan administration never assumed that the tax cuts would pay forthemselves. In fact, "America's New Beginning: A Program for Economic Recovery," the White House budget planreleased on February 18, 1981, included a table entitled "Direct Revenue Effects of Proposed Tax Reductions." [24]
That table predicted a huge $700 billion revenue loss from the tax cuts through 1986, as shown in Table 4.
Table 4Reagan Administration's Scoring of the 1981 Tax Cut--Revenue Impact, in Billions of Dollars1981 1982 1983 1984 1985 1986 1981-86-8.8 -53.9 -100.0 -148.1 -185.7 -221.7 -718.2
Source: Office of the President, "America's New Beginning: A Program for Economic Recovery," February 18, 1981,p. 16.
Fable 2: The Reagan Tax Cuts "Caused" the Budget Deficit to Explode in the 1980s
Fifteen years ago, marginal tax rates and the progressivity of the tax system were dramatically reduced. Somesuggested that these policies would so spur economic growth that tax revenue would actually increase. The outcome ofthat experiment is now a matter of record: not only did this response not occur, but the national debt quadrupled in thespan of a dozen years. [25]
This is the most common and overly simplistic interpretation of the budgetary events of the 1980s. Further, it isfactually untrue that the Reagan tax cuts were a major cause of the budget deficits of the 1980s and the "quadrupling"of the debt. (In the 1980s the real debt doubled; it did not quadruple.) Real federal revenues grew at a faster pace afterthe Reagan tax cuts than after the Bush and Clinton tax hikes. From 1982 to 1989, they expanded by 24.1 percent.Over a comparable seven-year period, 1990-97, a period that accounts for both the Bush and the Clinton tax increases,real federal revenues will have grown by 19.3 percent (see Table 5). The lesson of the 1980s and 1990s is consistentwith the supply-side theory that there are behavioral and investment responses to changes in tax rates.
Figure 8 shows that, as a share of GDP, federal revenues fell from 20.2 percent in 1981 (the peak year for taxes as ashare of GDP in the post-World War II period) to a low of 18.0 percent of GDP in 1984, and rose back up to 19.2percent by 1989. This would suggest that the Reagan tax cuts were a small contributing factor to the increase in thebudget deficit over the course of the 1980s. From 1950 to 1995, federal receipts have averaged 18.4 percent of GDP.Hence, throughout most of the Reagan years and clearly by the end, taxes as a share of national output weresubstantially above the postwar average.
If the Reagan tax cut was not the major contributing factor to the increasing deficit in the 1980s, what was? Therewere two primary explanations: (1) a large and sustained defense build-up; and (2) the unexpected rapid decline ininflation and the recession in the early 1980s.

The Defense Buildup and the Deficit. Table 6 shows that the cumulative increase in defense spending from 1981 to1989 ($806 billion) was larger than the entire cumulative increase in the budget deficit ($779 billion) in those years.That is, if defense spending had been held to the rate of inflation from 1981 to 1989, the total real deficit would havefallen in the 1980s rather than risen. It is also true that the decline in the military budget accounts for almost the entirefall in the deficit from 1988 to 1996. [26]
Table 5Reagan Tax Cuts vs. Bush-Clinton Tax Hikes:Overall Real Revenue GrowthAfter Reagan Tax Cuts After Bush-Clinton Tax HikesYear Total Revenue* Percentage Change Year Total Revenue* Percentage Change1982 738 1990 9141983 684 -7.3 1991 895 -2.11984 730 6.7 1992 895 0.01985 777 6.4 1993 922 3.71986 790 1.7 1994 982 6.51987 854 8.1 1995 1,034 5.31988 877 2.7 1996 1,082 4.6**1989 916 4.4 1997 1,090 0.7**Total 24.1 19.3
Source: Historical Tables, Budget of the United States Government, Fiscal Year 1997.
*Billions of 1987 dollars.**Congressional Budget Office, August 1996 revenue forecast.

Table 6Defense Spending and Deficits in the 1980s
As % of GDP $ Billions BuildupYear Defense Deficit Defense Deficit Defense Deficit1981 5.3 2.7 134 791982 5.9 4.1 158 128 24 491983 6.3 6.3 185 208 51 1291984 6.2 5.0 210 185 76 1061985 6.4 5.4 227 212 93 1331986 6.5 5.2 253 221 119 1421987 6.3 3.4 273 150 139 711988 6.0 3.2 282 155 148 761989 5.9 2.9 290 152 156 73Change1981-89 0.2 0.6 156 73 806 779
Source: Historical Tables, Budget of the United States Government, Fiscal Year 1997.
If the entire accumulation of debt in the 1980s went to finance the Reagan defense build-up, the key policy questionwould shift to whether it was appropriate to borrow for those large military expenditures. Was the Reaganadministration justified in paying for this one-time increase in "public investment" spending through debt rather thantaxes? Or, put another way, was it appropriate to have asked our children and grandchildren to help defray the cost ofdefeating the Soviet menace?
The answer to that question rests to some extent on the issue of whether the defense build-up materially contributed tothe collapse of the Soviet Union and, if so, on the discounted present value to our children and grandchildren of nolonger having the "Evil Empire" imperiling the security of the planet. The figure could easily be in the trillions ofdollars.
In any case, Reagan's critics were proven right when they said that the administration would not be able to cut taxrates, increase the defense budget, and balance the budget all at the same time.
The Fall in Inflation and the 1981-82 Recession. The unexpectedly steep decline in inflation in 1981 and 1982contributed significantly to the rise in the deficit in the early 1980s. [27] When inflation falls sharply and unexpectedly,so too do nominal revenues while real expenditures rise sharply and unexpectedly. Both Reagan and Congress hadapproved spending increases for 1982-85 on the assumption, mostly due to erroneous inflation forecasts, that nominalGDP would be some $2.5 trillion higher than it was between 1981 and 1986. The abrupt reduction in inflation createdan estimated $300-$400 billion spending windfall for defense and domestic programs. [28]
Fable 3: The Federal Reserve, Not Ronald Reagan, Deserves the Credit for Ending the 1970s Era of HighInflation
One man is more responsible for the political success of the Reagan presidency than any other, and hisname is not Ronald Reagan. It is Paul Volcker, the man Jimmy Carter appointed as chairman of theFederal Reserve Board. A relatively stable currency has been the basis . . . for the economic boom ofrecent years. . . .
And Volcker did it. In October 1979 he persuaded his colleagues to starve inflation of the dollars it feedson. President Reagan did little to help. In fact, his deficits worked against Volcker's efforts. [29]

The conquering of inflation in a very short time was primarily a result of tightening monetary policy under FederalReserve Board chairman Paul Volcker. Volcker deserves high praise for the change in policy. But Reagan clearlywarrants a large part of the credit for endorsing the overdue correction in Federal Reserve policy from the high-inflation 1970s. A major element of Reaganomics, in addition to the tax cuts, was sound money--a policy the nationhad not followed since the late 1960s. The Federal Reserve's policy of sweating out inflation took place with theexplicit approval of the Reagan administration, even though that policy contributed to the deep recession of 1981-82and the unexpectedly large and immediate fall in inflation was a major factor in the budget deficit explosion in theearly 1980s.
The Reagan-Volcker anti-inflation policy may seem noncontroversial today, but it is noteworthy that at the time thedecisions were made, there was very little consensus about how to defeat inflation. [30] In 1980, for example,economist Paul Samuelson wrote that "two-digit price inflation is a distinct possibility for much of the decade of the1980s." [31]He predicted an inflation rate from 1982 to 1987 of 9.4 percent a year. The Democratic party wasendorsing a host of inflation-fighting measures that were economically wrongheaded and almost certain to fail. Duringthe 1980 Democratic presidential primaries, Jimmy Carter's anti-inflation policy included credit controls and gasrationing while Ted Kennedy, his opponent, endorsed wage and price controls.
Most Keynesian economists had predicted that Reaganomics would make inflation worse, not better. Hobart Rowen ofthe Washington Post stated the conventional wisdom by arguing that the Kemp-Roth tax cuts would be "dangerouslyinflationary." [32] He added, "There is nothing in the [Reagan] fiscal program--in the view of those not addicted tosupply-side theory--that works against inflation." James Tobin, a Nobel prize winner and an informal Clintonadministration adviser, also had warned of the inflationary impact of Reagan's tax cuts and had called instead for "afive-year period of gradually declining wage-increase guide-posts."[33] The late Walter Heller, a Keynesian who hadserved as John Kennedy's chief economic adviser, summarized the conventional wisdom most succinctly in 1980: "The[Reagan] tax cut would simply overwhelm our existing productive capacity with a tidal wave of demand," thusaccelerating inflation.[34]
Amazingly, even after inflation had fallen by more than half by late 1982, Reagan's skeptics believed the progress onprices was a temporary aberration. Economist Paul Krugman, now of Massachusetts Institute of Technology, and LarrySummers of the Clinton Treasury Department warned in November 1982 of a coming "inflation time bomb." "It isreasonable to expect a significant reacceleration of inflation in the near future," they wrote. "A significant portion ofthe slowing of consumer price inflation since 1980 does not represent a reduction in the underlying rate." [35]
Fable 4: Reagan Had Little to Do with Ending the Energy Crisis; He Was the Fortunate Beneficiary of theDemise of the Organization of Petroleum Exporting Countries
Luck was on Reagan's side in the 1980s. OPEC crumbled and world commodity prices fell.[36]
OPEC's demise clearly contributed to the end of high inflation in the 1980s. But luck is not what caused the downfallof OPEC. Reagan's first official act as president was, by executive order, to immediately terminate oil price controls, apolicy that instantly reenergized America's domestic production and exploration of oil.
Moreover, the energy crisis in the 1970s was not purely a result of external factors beyond the control of politicians.With respect to dealing with OPEC, virtually every government energy policy in the 1970s--those under Nixon, Ford,and Carter-- exacerbated the energy crisis, from the windfall profits tax to energy price controls. Reagan hastened theend of the energy crisis by repealing all of these misguided policies.[37]
Fable 5: Clinton's Economic Record Has Outperformed Reagan's
Our economy is the soundest it's been in a generation.[38]
The growth rate under Clinton has been 2.7 percent, half a percent below the 3.2 percent growth rate under Reagan

and a full percentage point below the 3.8 percent growth rate during the 1983-89 expansion. Standard governmentforecasts predict a 2-2.5 percent growth rate through the end of the decade. Yet, if even the high end of that forecastproves to be accurate, the 1990s will be the lowest economic growth decade since the Great Depression and the secondlowest in the 20th century.
Fable 6: The 1980s Expansion Was a Classic Keynesian Economic Recovery Driven by the Stimulative Effectsof High Deficits
Reagan's economic program actually amounted to the longest and most successful Keynesian recovery theworld has yet seen. [39]
If the 1980s expansion had been a classic, demand-driven Keynesian recovery, nominal demand should have grownrapidly in the 1980s. However, as Figure 9 shows, over the course of the 1980s the rate of nominal demand growthfell.
The Keynesian explanation of the economic recovery in the 1980s is also fundamentally inconsistent with the sharpfall in inflation throughout that decade. If the recovery had been driven by a hike in the demand for goods and servicesrather than by a supply-side effect of greater output, inflation would have risen rather than fallen. But it did fall. Thisis why the near-universal predictions by Reagan's opponents from 1979 to 1981 of higher inflation from tax cutsproved to be entirely misguided.
Finally, if budget deficits are highly stimulative, the post-Reagan period of 1990-95 should have produced strongeconomic growth. The budget deficits of that period were very nearly of the same magnitude as the deficits of 1982-89(4.2 percent of GDP versus 3.9 percent of GDP); in the 1980s, however, we had rapid growth and in the 1990s wehave had anemic growth. The answer seems to be the supply-side effects of tax and regulatory reductions in the 1980sversus the tax hikes and reregulation in the 1990s.
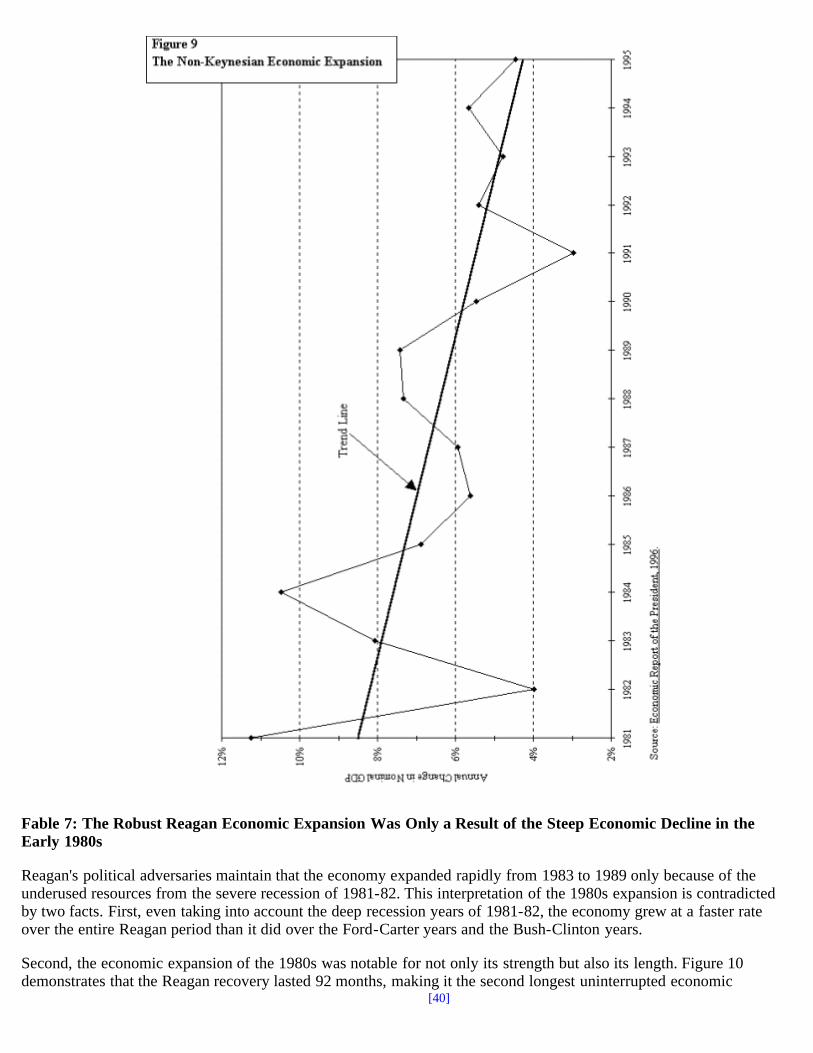
Fable 7: The Robust Reagan Economic Expansion Was Only a Result of the Steep Economic Decline in theEarly 1980s
Reagan's political adversaries maintain that the economy expanded rapidly from 1983 to 1989 only because of theunderused resources from the severe recession of 1981-82. This interpretation of the 1980s expansion is contradictedby two facts. First, even taking into account the deep recession years of 1981-82, the economy grew at a faster rateover the entire Reagan period than it did over the Ford-Carter years and the Bush-Clinton years.
Second, the economic expansion of the 1980s was notable for not only its strength but also its length. Figure 10demonstrates that the Reagan recovery lasted 92 months, making it the second longest uninterrupted economic
[40]

expansion in the century--outlasted only by the 1961-69 boom.
Fable 8: Bush and Clinton Inherited a Future of High and Rising Deficits from Reagan
The supply-side turkey has come home to roost. [41]
It is a popular misconception that Presidents Bush and Clinton inherited large deficits "baked in the cake" from Reaganpolicies. When Reagan left the White House in January 1989, the fiscal outlook was expected to continue to improverather than worsen. In that month, the CBO released its long-term forecast for the economy and the budget deficit.
Table 7 shows that the deficit was expected to continue to fall steadily to $110 billion and 1.5 percent of GDP by1995.[42]These forecasts reflected in large part a continuation of the modest fiscal progress achieved during Reagan'ssecond term. The CBO concluded that continued deficit reduction would occur even if Bush were to do nothing toimprove the budget outlook and simply left fiscal policy on automatic pilot. In reality, the national debt was $622billion higher than anticipated and as a share of GDP, the budget deficits were nearly 2 percentage points higher.Measured in real dollars, the 1990-94 period showed the worst five-year deficit performance in the post-World War IIera. [43]
Table 7Deficits in the 1990s: Reagan Baseline vs. Actual Performance
CBO, 1989 Actual Difference
Year $ Billions % GDP $ Billions % GDP $ Billions % GDP
1990 141 2.6 121 4.0 80 1.4
1991 140 2.4 269 4.7 129 2.3

1992 135 2.2 290 4.9 155 2.7
1993 129 2.0 255 4.1 126 1.9
1994 122 1.7 203 3.1 81 1.4
1995 110* 1.5* 161 2.4 51 0.9
Total 777 1,399 622
Total% GDP 2.1 3.9 1.5
Source: Congressional Budget Office, "Economic and Budget Outlook," January 1989.
*1995 projections come from the CBO's March 1990 report.
Fable 9: Workers Had to Work Harder for Smaller Paychecks in the 1980s
Caught between the lawmakers in Washington and the dealmakers on Wall Street have been millions ofAmerican workers forced to move from jobs that once paid $15 an hour into jobs that now pay $7. [44]
Barlett and Steele never back up such anecdotal claims with any facts. Here they are: the correct way to measurechanges in worker pay from one period to the next is not by examining wages alone, but by tallying the totalcompensation per hour--a measure that includes wages and benefits--paid to a worker. [45] Nonwage benefits havebeen an increasing share of total hourly worker compensation. In 1960, 9 percent of worker compensation was in theform of fringe benefits; in 1975, 16 percent of worker compensation was wage supplements; and by 1990, thatpercentage had risen to 20 percent. [46]So although it is true that average real wages have been falling over the past 20years, real compensation has been generally rising. The average real wage in 1990 dollars fell from about $11.00 anhour in 1980 to about $10.00 in 1988, a 9 percent decline. But real compensation per hour rose from $15.00 per hourin 1981 to $16.50 an hour in 1988. [47]
Fable 10: In the 1980s the Rich Got Richer and the Poor Got Poorer
During the 1980s the bucket of liberty and economic freedom rose, while the bucket of income equalityfell. Upper-tier Americans significantly expanded their share of national wealth, while low-incomecitizens lost ground. Reagan policies were critical to the shift. [48]
During the Reagan years, the total share of national income tilted toward the wealthiest Americans. From 1980 to 1988the wealthiest 5 percent of Americans increased their share of total income from 16.5 to 18.3 while the poorest fifthsaw their share fall from 4.2 to 3.8 percent. [49]
Yet it is not true that the gains by the wealthiest Americans came at the expense of low-income Americans. From 1981to 1989, every income quintile--from the richest to the poorest--gained income according to the Census Bureaueconomic data (see Figure 11). [50] The reason the wealthiest Americans saw their share of total income rise is thatthey gained income at a faster pace than did the middle class and the poor. But Reaganomics did create a rising tidethat lifted nearly all boats.
Table 8 shows that by 1989 there were 5.9 million more Americans whose salaries exceeded $50,000 a year than therewere in 1981 (adjusting for inflation). Similarly, there were 2.5 million more Americans earning more than $75,000 ayear, an 83 percent increase. And the number of Americans earning less than $10,000 a year fell by 3.4 millionworkers.

Table 8Workers' Incomes in the 1980s (millions of workers and billions of 1981 dollars)Year < $10,000 > $50,000 > $75,0001981 66.0 9.9 3.01989 62.6 15.8 5.5Difference -3.4 5.9 2.5% Change -5% 60% 83%
Source: Cato Institute calculations based on Bureau of the Census, U.S. Statistical Abstract, 1996, p. 478, Table 740.Note: Earning levels are adjusted for inflation between 1981 and 1989.
The gains in incomes of all income groups is all the more impressive when we examine data on income mobility. Tens

of millions of Americans moved up the income scale in the 1980s--an economic fact that is obscured when only thestatic income quintile data from the start of the decade to the end are examined. Figure 12 shows that 86 percent ofhouseholds that were in the poorest income quintile in 1980 had moved up the economic ladder to a higher incomequintile by 1990. Incredibly, a poor household in 1980 was more likely to have moved all the way up to the richestincome quintile by 1990 (15 percent) than to still be in the poorest quintile (14 percent).
Fable 11: The Poor and Minorities Lost Ground under Reagan's Economic Policies
The 1980s was the first decade since the 1930s in which large numbers of Americans actually suffered aserious decline in living standard. [51]
The poorest 20 percent of Americans experienced a 6 percent gain in real income in the 1980s and have suffered a 3percent loss in income in the 1990s. Figure 13, which compares the income trends for the poorest fifth of Americansover the past 20 years, shows that the poor did the best during the Reagan years. Black Americans saw their incomesgrow at a slightly faster pace (11.0%) than whites (9.8%) in the Reagan years (see Table 9).

Table 9Real Household Incomes
1973-81 1981-88 1988-94
Whites -2.2% 9.8% -3.8%
Blacks -4.4% 11.0% 2.0%
Source: Bureau of the Census, "Money Income and Poverty Status in the United States, 1995," Current PopulationReports (Washington, D.C.: Bureau of the Census, 1995).
Fable 12: The Rich Saw Their Tax Bills Go Down in the 1980s While Everyone Else Paid More
Contrary to popular rhetoric, the wealthiest Americans did not pay less taxes; rather, they paid more taxes after theincome tax rate cuts in 1981. In constant dollars, the richest 10 percent of Americans paid $177 billion in federalincome taxes in 1980 but paid $237 billion in 1988. The remaining 90 percent of households paid $5 billion less inincome taxes over this period. [52] They earned more and they paid more. In fact, Federal Reserve Board memberLawrence Lindsey has shown that taxes paid by the wealthy were substantially higher than they would have been if thetop tax rate had remained at 70 percent.[53] Figure 14 shows that the share of total income taxes paid by the wealthiest1 percent of all Americans actually rose from 18 percent in 1981 to 25 percent in 1990. The wealthiest 5 percent ofAmericans saw their tax share rise from 35 to 44 percent. So the rise in the deficit was clearly not a result of "tax cuts

for the rich."
Conclusion
The 1980s were years of economic progress, not decline. Real GDP grew by about one-third in the 1980s. Theeconomic gains were widely distributed among income groups, with every income quintile, from the richest fifth to thepoorest fifth, gaining ground in the Reagan years.
The Reagan tax cuts were not a primary cause
of the eruption of the deficit in the 1980s. The main two causes were an unexpectedly sharp reduction in inflation inthe early 1980s that led to large real increases in federal spending, and a nearly $1 trillion military build-up during thelast phase of the cold war.
Most significantly, the economy of the 1980s outperformed that of the 1990s in virtually every measurable category.Economic growth was higher, job creation was faster, incomes rose much faster, and productivity climbed at ahealthier pace.
Footnotes
[1]. The Economic Recovery and Tax Act of 1981 (the Kemp-Roth tax bill) reduced income tax rates by 25 percentover three years.
[2]. White House Press Release, Office of the Press Secretary, August 5, 1996. Remarks by the President at signingceremony for Iran-Libya Sanctions Act of 1996.

[3]. See, for example, Donald Barlett and James B. Steele, America: What Went Wrong? (Kansas City, Mo.: UniversalPress Syndicate, 1992), p. 3. The authors argue that "In the 1980s the already rich got richer than ever . . . while life forthe working class deteriorated, and those at the bottom were trapped."
[4]. See, for example, "Promises Made, Promises Kept," White House Office of Public Affairs, December 1988.
[5]. For a detailed description of the economic policies of the Reagan administration, see William Niskanen,Reaganomics: An Insider's Account (New York: Oxford University Press, 1988).
[6]. For a good summary of the economy's performance during the expansion years 1983-89, see Robert Bartley, TheSeven Fat Years: And How to Do It Again (New York: Free Press, 1992), p. 2.
[7]. See Bill Clinton's 1992 "Putting People First," campaign document Democratic National Committee, Washington,D.C.: August 1992.
[8]. Stephen Moore, "Broken Promises: What's Gone Wrong with the Economy of the 1990s?" Report no. 136(Lewisville, Texas: Institute for Policy Innovation, April 1996).
[9]. Most of the economic data are only available through 1995. Where we have more recent data that includepreliminary estimates for 1996, we include them.
[10]. Actually, the lame-duck Reagan administration released a fiscal 1990 budget in early January 1989, but the Bushadministration mostly ignored it.
[11]. To account for the fact that the 1990-95 period is shorter than the eight Reagan and eight pre-Reagan years, allthe economic variables are shown on an average annual basis.
[12]. On the no-policy-lag basis, however, productivity growth was highest in the Reagan years.
[13]. Richard McKenzie argues that this expansion was the equivalent of adding another California to the Americaneconomy. See Richard B. McKenzie, What Went Right in the Nineteen Eighties (San Francisco: Pacific ResearchInstitute for Public Policy, 1993) p. 121.
[14]. Chris Frenze, "Reagan Income Growth versus Clinton Crunch," Joint Economic Committee of Congress, March1996. Based on U.S. Census Budget Data.
[15]. Alan Reynolds, "The Seven Lean Years," Hudson Institute Policy Report (Indianapolis, Ind.: Hudson Institute,1996.)
[16]. Net national investment in the 1980s showed a similar pattern to that of savings: the net investment rate fell from10.5 percent in the 1960s to 5.3 percent in the 1980s to an all-time low of 3.8 percent in the 1990s. Yet, according tothe Department of Commerce's Bureau of Economic Analysis, net foreign investment in the United States explodedfrom -$31 billion in 1980 to a high of $115 billion in 1987. Over the course of the Reagan years, net foreigninvestment in the United States increased by nearly one-half trillion dollars. In the global marketplace, lower tax ratestend to attract capital because the after-tax rate of return on capital investment rises as the tax rates fall.
[17]. H. Erich Heinemann, "Dead on Arrival Autopsy Report," Washington Times, April 4, 1996, p. A15.
[18]. Arthur B. Laffer, "Les Hauts Taux Les Totaux," A.B. Laffer, V.A. Canto and Associates, San Diego, Calif.,March 25, 1996.
[19]. CBO Budget and Economic Update, August 1996.
[20]. Congressional Budget Office, "Economic and Budget Outlook," December 1990.
[21]. Historical Tables, Budget of the U.S. Government, Fiscal Year 1997.

[22]. Ibid.
[23]. Lawrence Chimerine, chief economist at the Economic Strategies Institute, "Return of the Supply-Siders,"Washington Post, July 23, 1996, p. A24.
[24]. Office of the President, "America's New Beginning: A Program for Economic Recovery," February 18, 1981, p.16.
[25]. Economic Report of the President, 1996
[26]. This is not to argue against the wisdom of a defense build-up in the early 1980s. Even the Carter administrationhad called for large defense spending hikes in its last budget. Reagan increased defense spending faster than Carterwould have, but some large increase in military spending was no doubt inevitable given the geopolitical situation in1980 and the almost universally acknowledged inadequacy of America's military in those years.
[27]. David Stockman, The Triumph of Politics: The Inside Story of the Reagan Revolution (New York: Avon Books,1987).
[28]. Paul Craig Roberts, The Supply Side Revolution (Cambridge, Mass.: Harvard University Press, 1984).
[29]. New Republic editorial, September 9, 1985, p. 7.
[30]. See Stephen Moore, "Clinton's Dismal Scientists,"
National Review, March 15, 1993, pp. 32-39.
[31]. Paul Samuelson, cited in Moore, "Clinton's Dismal Scientists," p. 34.
[32]. Hobart Rowen, cited in ibid., p. 36.
[33]. James Tobin, cited in ibid., p. 34.
[34]. Walter Heller, cited in ibid., p. 35.
[35]. Paul Krugman and Larry Summers, "Inflation during the 1983 Recovery," U.S. Government Memorandum,September 9, 1982. Significantly, Summers and Krugman are two of the most vocal opponents of the Dole tax cutproposal.
[36]. Stephen Moore, "Clinton's Dismal Scientists," National Review, March 15, 1993, p. 38.
[37]. Stephen Moore, "Doomsday Delayed: America's Surprisingly Bright Natural Resource Future," Report no. 118(Lewisville, Texas: Institute for Policy Innovation, August 1992),
pp. 47-50.
[38]. Bill Clinton, August 17, 1996.
[39]. Newsday editorial page, November 15, 1988.
[40]. The current economic expansion is in its sixth year and may eventually exceed the Reagan recovery.
[41]. Robert Kuttner, Los Angeles Times, October 14, 1991.
[42]. Congressional Budget Office, "Economic and Budget Outlook," January 1989.

[43]. What is unique about the big deficits in the 1990s is that, unlike the very high deficits of the Reagan years, whichcorresponded with high and growing cold war expenditures, the Bush-Clinton deficits have occurred despite ashrinking defense budget. Normally at the end of a war period, the deficit falls sharply or even turns into a surplus aswartime expenditures fall. But as discussed earlier, under the Bush-Clinton administrations, reductions in wartimeexpenditures have given way to large increases in the budgets of most all other civilian programs.
[44]. Barlett and Steele, p. 2.
[45]. The best discussion of this issue is found in McKenzie, What Went Right, or see Richard McKenzie, "America:What Went Right," Cato Institute Policy Analysis no. 172, June 1, 1992.
[46]. McKenzie, What Went Right, p. 232. McKenzie argues that these percentages probably understate the totalamount of wage supplements provided to workers.
[47]. Ibid.
[48]. Kevin Phillips, The Politics of Rich and Poor: Wealth and the American Electorate in the Reagan Aftermath(New York: Harper Perennial, 1991), p. 52.
[49]. Bruce Bartlett, "Trickle-Down Economics," National Review, September 2, 1996, p. 63.
[50]. Bureau of the Census, Income Statistics Branch, Current Population Reports, Series P60 (Washington, D.C.:Bureau of the Census, 1996).
[51]. Paul R. Krugman, The Age of Diminished Expectations: U.S. Economic Policy in the 1990s (Cambridge, Mass.:MIT Press, 1990), p. 22.
[52]. Lawrence Lindsey, The Growth Experiment: How the New Tax Policy Is Transforming the U.S. Economy (NewYork: Basic Books, 1991).
[53]. Ibid.