supplementary tables for economics of education review (2019)
TRANSCRIPT

Supplementary Tables for
“Snooze or Lose: High School Start Times and Academic Achievement”
Economics of Education Review (2019)
https://doi.org/10.1016/j.econedurev.2019.05.011
Jeffrey A. Groen
U.S. Bureau of Labor Statistics 2 Massachusetts Ave. NE, Rm. 4945
Washington, DC 20212 E-mail: [email protected]
Corresponding Author: Sabrina Wulff Pabilonia
U.S. Bureau of Labor Statistics 2 Massachusetts Ave. NE, Rm. 2180
Washington, DC 20212 E-mail: [email protected]
1
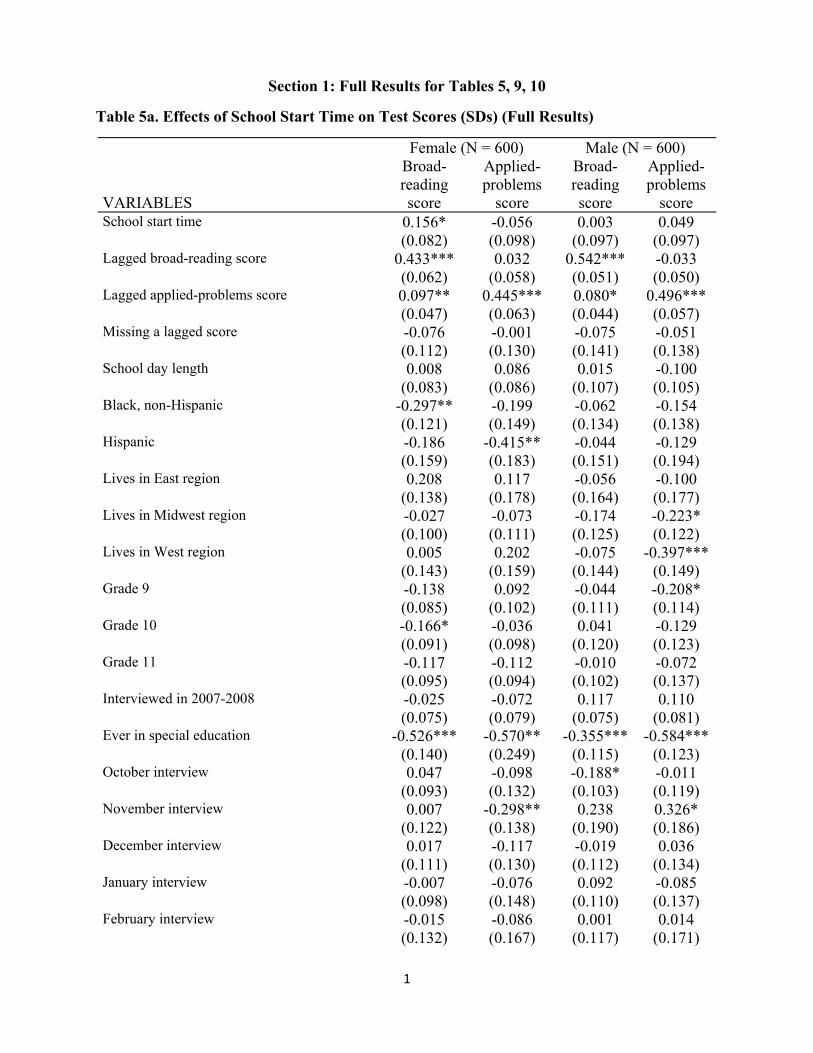
Section 1: Full Results for Tables 5, 9, 10
Table 5a. Effects of School Start Time on Test Scores (SDs) (Full Results)
Female (N = 600) Male (N = 600)
VARIABLES
Broad-reading score
Applied-problems
score
Broad-reading score
Applied-problems
score School start time 0.156* -0.056 0.003 0.049 (0.082) (0.098) (0.097) (0.097) Lagged broad-reading score 0.433*** 0.032 0.542*** -0.033 (0.062) (0.058) (0.051) (0.050) Lagged applied-problems score 0.097** 0.445*** 0.080* 0.496*** (0.047) (0.063) (0.044) (0.057) Missing a lagged score -0.076 -0.001 -0.075 -0.051 (0.112) (0.130) (0.141) (0.138) School day length 0.008 0.086 0.015 -0.100 (0.083) (0.086) (0.107) (0.105) Black, non-Hispanic -0.297** -0.199 -0.062 -0.154 (0.121) (0.149) (0.134) (0.138) Hispanic -0.186 -0.415** -0.044 -0.129 (0.159) (0.183) (0.151) (0.194) Lives in East region 0.208 0.117 -0.056 -0.100 (0.138) (0.178) (0.164) (0.177) Lives in Midwest region -0.027 -0.073 -0.174 -0.223* (0.100) (0.111) (0.125) (0.122) Lives in West region 0.005 0.202 -0.075 -0.397*** (0.143) (0.159) (0.144) (0.149) Grade 9 -0.138 0.092 -0.044 -0.208* (0.085) (0.102) (0.111) (0.114) Grade 10 -0.166* -0.036 0.041 -0.129 (0.091) (0.098) (0.120) (0.123) Grade 11 -0.117 -0.112 -0.010 -0.072 (0.095) (0.094) (0.102) (0.137) Interviewed in 2007-2008 -0.025 -0.072 0.117 0.110 (0.075) (0.079) (0.075) (0.081) Ever in special education -0.526*** -0.570** -0.355*** -0.584*** (0.140) (0.249) (0.115) (0.123) October interview 0.047 -0.098 -0.188* -0.011 (0.093) (0.132) (0.103) (0.119) November interview 0.007 -0.298** 0.238 0.326* (0.122) (0.138) (0.190) (0.186) December interview 0.017 -0.117 -0.019 0.036 (0.111) (0.130) (0.112) (0.134) January interview -0.007 -0.076 0.092 -0.085 (0.098) (0.148) (0.110) (0.137) February interview -0.015 -0.086 0.001 0.014 (0.132) (0.167) (0.117) (0.171)
2
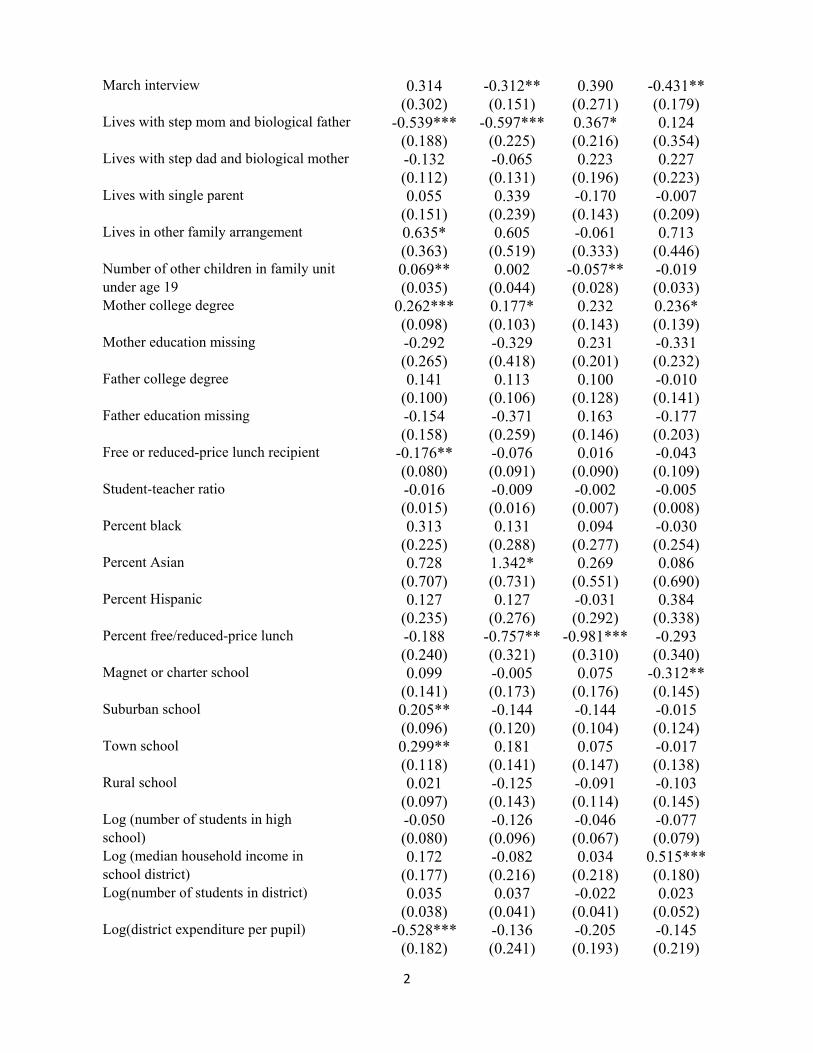
March interview 0.314 -0.312** 0.390 -0.431** (0.302) (0.151) (0.271) (0.179) Lives with step mom and biological father -0.539*** -0.597*** 0.367* 0.124 (0.188) (0.225) (0.216) (0.354) Lives with step dad and biological mother -0.132 -0.065 0.223 0.227 (0.112) (0.131) (0.196) (0.223) Lives with single parent 0.055 0.339 -0.170 -0.007 (0.151) (0.239) (0.143) (0.209) Lives in other family arrangement 0.635* 0.605 -0.061 0.713 (0.363) (0.519) (0.333) (0.446) Number of other children in family unit 0.069** 0.002 -0.057** -0.019 under age 19 (0.035) (0.044) (0.028) (0.033) Mother college degree 0.262*** 0.177* 0.232 0.236* (0.098) (0.103) (0.143) (0.139) Mother education missing -0.292 -0.329 0.231 -0.331 (0.265) (0.418) (0.201) (0.232) Father college degree 0.141 0.113 0.100 -0.010 (0.100) (0.106) (0.128) (0.141) Father education missing -0.154 -0.371 0.163 -0.177 (0.158) (0.259) (0.146) (0.203) Free or reduced-price lunch recipient -0.176** -0.076 0.016 -0.043 (0.080) (0.091) (0.090) (0.109) Student-teacher ratio -0.016 -0.009 -0.002 -0.005 (0.015) (0.016) (0.007) (0.008) Percent black 0.313 0.131 0.094 -0.030 (0.225) (0.288) (0.277) (0.254) Percent Asian 0.728 1.342* 0.269 0.086 (0.707) (0.731) (0.551) (0.690) Percent Hispanic 0.127 0.127 -0.031 0.384 (0.235) (0.276) (0.292) (0.338) Percent free/reduced-price lunch -0.188 -0.757** -0.981*** -0.293 (0.240) (0.321) (0.310) (0.340) Magnet or charter school 0.099 -0.005 0.075 -0.312** (0.141) (0.173) (0.176) (0.145) Suburban school 0.205** -0.144 -0.144 -0.015 (0.096) (0.120) (0.104) (0.124) Town school 0.299** 0.181 0.075 -0.017 (0.118) (0.141) (0.147) (0.138) Rural school 0.021 -0.125 -0.091 -0.103 (0.097) (0.143) (0.114) (0.145) Log (number of students in high -0.050 -0.126 -0.046 -0.077 school) (0.080) (0.096) (0.067) (0.079) Log (median household income in 0.172 -0.082 0.034 0.515*** school district) (0.177) (0.216) (0.218) (0.180) Log(number of students in district) 0.035 0.037 -0.022 0.023 (0.038) (0.041) (0.041) (0.052) Log(district expenditure per pupil) -0.528*** -0.136 -0.205 -0.145 (0.182) (0.241) (0.193) (0.219)
3
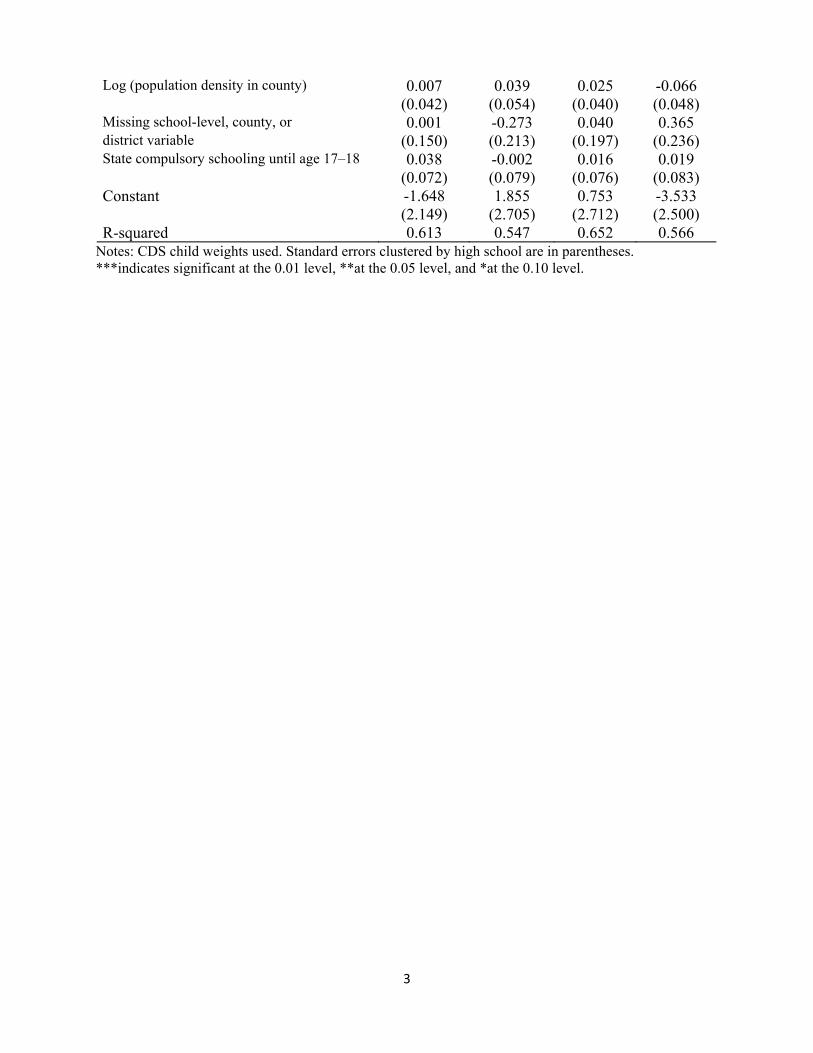
Log (population density in county) 0.007 0.039 0.025 -0.066 (0.042) (0.054) (0.040) (0.048) Missing school-level, county, or 0.001 -0.273 0.040 0.365 district variable (0.150) (0.213) (0.197) (0.236) State compulsory schooling until age 17–18 0.038 -0.002 0.016 0.019 (0.072) (0.079) (0.076) (0.083) Constant -1.648 1.855 0.753 -3.533 (2.149) (2.705) (2.712) (2.500) R-squared 0.613 0.547 0.652 0.566
Notes: CDS child weights used. Standard errors clustered by high school are in parentheses. ***indicates significant at the 0.01 level, **at the 0.05 level, and *at the 0.10 level.
4
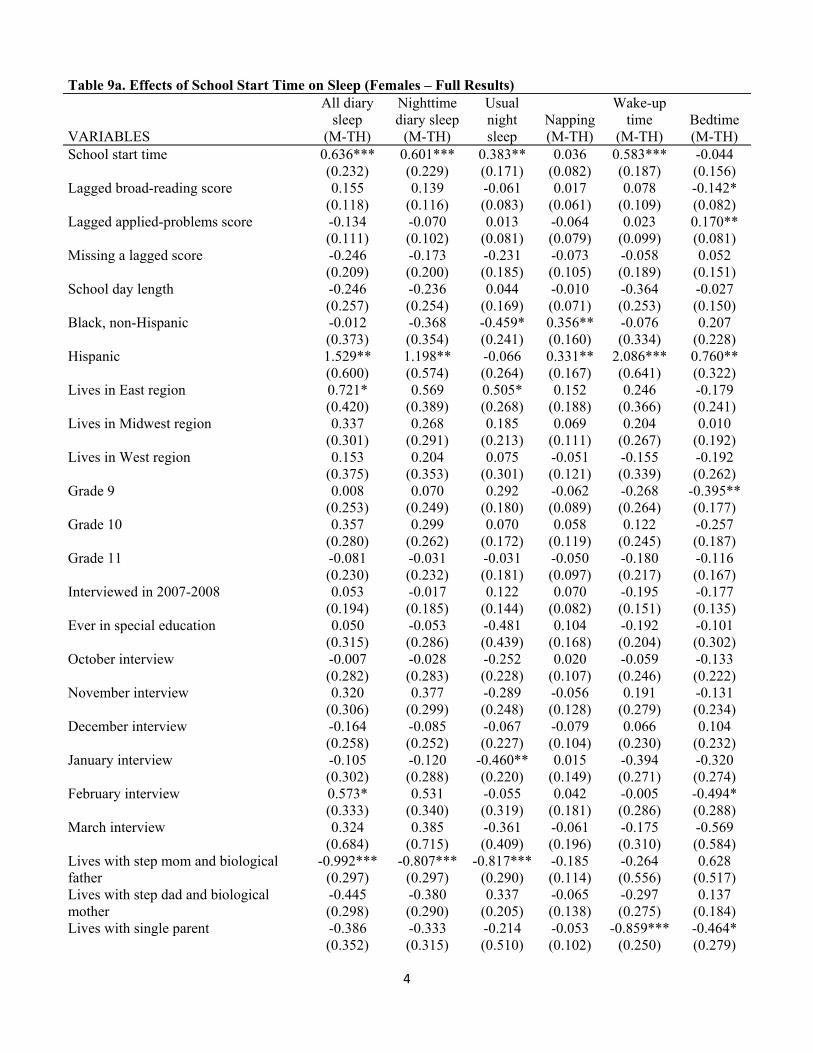
Table 9a. Effects of School Start Time on Sleep (Females – Full Results)
VARIABLES
All diary sleep
(M-TH)
Nighttime diary sleep
(M-TH)
Usual night sleep
Napping (M-TH)
Wake-up time
(M-TH) Bedtime (M-TH)
School start time 0.636*** 0.601*** 0.383** 0.036 0.583*** -0.044 (0.232) (0.229) (0.171) (0.082) (0.187) (0.156) Lagged broad-reading score 0.155 0.139 -0.061 0.017 0.078 -0.142* (0.118) (0.116) (0.083) (0.061) (0.109) (0.082) Lagged applied-problems score -0.134 -0.070 0.013 -0.064 0.023 0.170** (0.111) (0.102) (0.081) (0.079) (0.099) (0.081) Missing a lagged score -0.246 -0.173 -0.231 -0.073 -0.058 0.052 (0.209) (0.200) (0.185) (0.105) (0.189) (0.151) School day length -0.246 -0.236 0.044 -0.010 -0.364 -0.027 (0.257) (0.254) (0.169) (0.071) (0.253) (0.150) Black, non-Hispanic -0.012 -0.368 -0.459* 0.356** -0.076 0.207 (0.373) (0.354) (0.241) (0.160) (0.334) (0.228) Hispanic 1.529** 1.198** -0.066 0.331** 2.086*** 0.760** (0.600) (0.574) (0.264) (0.167) (0.641) (0.322) Lives in East region 0.721* 0.569 0.505* 0.152 0.246 -0.179 (0.420) (0.389) (0.268) (0.188) (0.366) (0.241) Lives in Midwest region 0.337 0.268 0.185 0.069 0.204 0.010 (0.301) (0.291) (0.213) (0.111) (0.267) (0.192) Lives in West region 0.153 0.204 0.075 -0.051 -0.155 -0.192 (0.375) (0.353) (0.301) (0.121) (0.339) (0.262) Grade 9 0.008 0.070 0.292 -0.062 -0.268 -0.395** (0.253) (0.249) (0.180) (0.089) (0.264) (0.177) Grade 10 0.357 0.299 0.070 0.058 0.122 -0.257 (0.280) (0.262) (0.172) (0.119) (0.245) (0.187) Grade 11 -0.081 -0.031 -0.031 -0.050 -0.180 -0.116 (0.230) (0.232) (0.181) (0.097) (0.217) (0.167) Interviewed in 2007-2008 0.053 -0.017 0.122 0.070 -0.195 -0.177 (0.194) (0.185) (0.144) (0.082) (0.151) (0.135) Ever in special education 0.050 -0.053 -0.481 0.104 -0.192 -0.101 (0.315) (0.286) (0.439) (0.168) (0.204) (0.302) October interview -0.007 -0.028 -0.252 0.020 -0.059 -0.133 (0.282) (0.283) (0.228) (0.107) (0.246) (0.222) November interview 0.320 0.377 -0.289 -0.056 0.191 -0.131 (0.306) (0.299) (0.248) (0.128) (0.279) (0.234) December interview -0.164 -0.085 -0.067 -0.079 0.066 0.104 (0.258) (0.252) (0.227) (0.104) (0.230) (0.232) January interview -0.105 -0.120 -0.460** 0.015 -0.394 -0.320 (0.302) (0.288) (0.220) (0.149) (0.271) (0.274) February interview 0.573* 0.531 -0.055 0.042 -0.005 -0.494* (0.333) (0.340) (0.319) (0.181) (0.286) (0.288) March interview 0.324 0.385 -0.361 -0.061 -0.175 -0.569 (0.684) (0.715) (0.409) (0.196) (0.310) (0.584) Lives with step mom and biological -0.992*** -0.807*** -0.817*** -0.185 -0.264 0.628 father (0.297) (0.297) (0.290) (0.114) (0.556) (0.517) Lives with step dad and biological -0.445 -0.380 0.337 -0.065 -0.297 0.137 mother (0.298) (0.290) (0.205) (0.138) (0.275) (0.184) Lives with single parent -0.386 -0.333 -0.214 -0.053 -0.859*** -0.464* (0.352) (0.315) (0.510) (0.102) (0.250) (0.279)

5
Lives in other family arrangement -2.214** -2.321** -0.006 0.107 -2.415*** 0.141 (0.948) (0.915) (0.948) (0.302) (0.882) (0.595) Number of other children in family unit -0.093 -0.088 0.077 -0.005 -0.228*** -0.099 under age 19 (0.095) (0.092) (0.066) (0.038) (0.088) (0.074) Mother college degree -0.064 -0.024 -0.014 -0.040 0.089 -0.041 (0.218) (0.215) (0.176) (0.079) (0.196) (0.161) Mother education missing 1.546* 1.629* -0.064 -0.083 1.717** -0.107 (0.821) (0.850) (0.553) (0.167) (0.842) (0.428) Father college degree 0.146 0.124 -0.026 0.023 -0.120 -0.188 (0.262) (0.257) (0.188) (0.099) (0.243) (0.165) Father education missing 0.645* 0.532 0.259 0.113 0.536* 0.098 (0.383) (0.340) (0.514) (0.142) (0.282) (0.297) Free or reduced-price lunch recipient -0.291 -0.122 -0.127 -0.168 -0.018 0.121 (0.243) (0.207) (0.185) (0.128) (0.198) (0.166) Student-teacher ratio -0.036 -0.035 0.003 -0.001 0.009 0.019 (0.043) (0.042) (0.029) (0.013) (0.038) (0.030) Percent black -0.289 -0.253 0.727 -0.035 0.104 0.245 (0.745) (0.757) (0.500) (0.355) (0.658) (0.416) Percent Asian -0.409 -0.361 -0.675 -0.048 -1.112 -0.846 (1.244) (1.311) (1.225) (0.615) (1.473) (0.809) Percent Hispanic -1.032 -1.089 0.274 0.057 -1.257 -0.176 (0.796) (0.793) (0.466) (0.254) (0.798) (0.478) Percent free/reduced-price lunch 1.213 1.340* 0.100 -0.127 0.823 -0.560 (0.802) (0.777) (0.517) (0.287) (0.745) (0.489) Magnet or charter school -0.287 -0.305 0.081 0.018 -0.254 0.134 (0.279) (0.329) (0.303) (0.175) (0.282) (0.275) Suburban school -0.252 -0.245 -0.325* -0.006 -0.310 -0.139 (0.270) (0.248) (0.181) (0.120) (0.246) (0.158) Town school 0.020 -0.105 0.246 0.125 -0.357 -0.275 (0.276) (0.251) (0.231) (0.135) (0.245) (0.206) Rural school -0.259 -0.149 0.194 -0.109 -0.293 -0.221 (0.307) (0.294) (0.218) (0.103) (0.250) (0.216) Log (number of students in high -0.234 -0.207 -0.178 -0.027 -0.186 0.020 school) (0.223) (0.224) (0.158) (0.073) (0.201) (0.145) Log (median household income in 0.230 0.135 -0.387 0.096 0.157 0.069 school district) (0.416) (0.431) (0.282) (0.180) (0.374) (0.294) Log(number of students in district) 0.039 0.011 0.036 0.029 -0.022 0.016 (0.111) (0.112) (0.084) (0.041) (0.104) (0.083) Log(district expenditure per pupil) -1.198** -0.959* -0.649 -0.238 -0.173 0.700* (0.543) (0.550) (0.434) (0.205) (0.485) (0.372) Log (population density in county) 0.053 0.064 0.208** -0.010 -0.025 -0.081 (0.106) (0.108) (0.085) (0.029) (0.088) (0.073) Missing school-level, county, or 0.069 0.004 0.222 0.065 -0.108 -0.211 district variable (0.434) (0.487) (0.273) (0.188) (0.540) (0.305) State compulsory schooling until age 0.061 0.104 0.090 -0.043 -0.017 -0.020 17–18 (0.194) (0.183) (0.129) (0.082) (0.173) (0.139) Constant 6.728 7.198 9.097** -0.470 5.455 21.328*** (5.468) (5.313) (3.741) (1.855) (4.713) (3.600) Number of observations 450 450 550 450 450 450 R-squared 0.193 0.191 0.182 0.087 0.231 0.147 Notes: CDS child weights used. Standard errors clustered by high school are in parentheses.
***indicates significant at the 0.01 level, **at the 0.05 level, and *at the 0.10 level.

6
Table 9b. Effects of School Start Time on Sleep (Males – Full Results)
VARIABLES
All diary sleep
(M-TH)
Nighttime diary sleep (M-TH)
Usual night sleep
Napping (M-TH)
Wake-up time
(M-TH) Bedtime (M-TH)
School start time -0.141 0.324 0.212 -0.466 0.575*** 0.270 (0.382) (0.228) (0.169) (0.283) (0.205) (0.191) Lagged broad-reading score 0.114 0.102 0.110 0.012 0.165* 0.019 (0.127) (0.108) (0.087) (0.080) (0.095) (0.080) Lagged applied-problems score -0.070 -0.125 -0.137 0.055 -0.253** -0.115 (0.128) (0.114) (0.099) (0.066) (0.099) (0.082) Missing a lagged score 0.669** 0.254 -0.267 0.416** 0.176 -0.008 (0.312) (0.286) (0.195) (0.194) (0.238) (0.174) School day length 0.560 0.382* 0.141 0.179 -0.073 -0.366** (0.381) (0.231) (0.199) (0.287) (0.198) (0.185) Black, non-Hispanic -0.456 -0.503* 0.086 0.047 -0.422* 0.103 (0.417) (0.268) (0.214) (0.314) (0.228) (0.258) Hispanic 0.586 0.595 0.888*** -0.009 -0.219 -0.701 (0.629) (0.513) (0.326) (0.346) (0.299) (0.493) Lives in East region -0.411 -0.258 0.498 -0.153 -0.654* -0.287 (0.521) (0.377) (0.318) (0.362) (0.357) (0.250) Lives in Midwest region -0.684 -0.418 0.192 -0.266 -0.466 0.040 (0.482) (0.318) (0.244) (0.342) (0.287) (0.216) Lives in West region -0.697 -0.383 0.247 -0.313 -0.349 0.112 (0.436) (0.367) (0.255) (0.203) (0.307) (0.283) Grade 9 0.402 0.578** 0.091 -0.176 0.501** -0.159 (0.362) (0.226) (0.169) (0.274) (0.204) (0.171) Grade 10 0.071 0.444* 0.301 -0.373 0.438* -0.019 (0.405) (0.268) (0.196) (0.277) (0.243) (0.197) Grade 11 -0.130 0.042 -0.060 -0.173 -0.020 -0.052 (0.311) (0.227) (0.180) (0.202) (0.169) (0.187) Interviewed in 2007-2008 0.285 -0.150 -0.108 0.435** -0.240 -0.138 (0.279) (0.200) (0.153) (0.210) (0.181) (0.140) Ever in special education 1.046*** 0.825** 0.093 0.221 0.599 -0.254 (0.355) (0.367) (0.223) (0.227) (0.375) (0.204) October interview 0.730 0.251 -0.013 0.479 0.162 -0.157 (0.540) (0.241) (0.227) (0.455) (0.201) (0.229) November interview 0.237 0.229 0.061 0.008 0.171 -0.158 (0.389) (0.319) (0.248) (0.187) (0.261) (0.232) December interview 0.328 0.274 -0.125 0.054 0.435* -0.067 (0.283) (0.273) (0.219) (0.171) (0.229) (0.191) January interview 0.078 0.222 0.067 -0.144 0.213 -0.186 (0.332) (0.319) (0.279) (0.198) (0.292) (0.225) February interview 0.651 0.531 -0.576* 0.120 0.244 -0.426 (0.444) (0.429) (0.310) (0.278) (0.285) (0.428) March interview 0.358 -0.290 -0.183 0.648* -0.041 0.085 (0.440) (0.312) (0.316) (0.370) (0.257) (0.263) Lives with step mom and biological -0.745 -0.773 0.179 0.027 -0.508* 0.308 father (0.584) (0.597) (0.483) (0.239) (0.291) (0.465) Lives with step dad and biological -0.379 -0.693** -0.400 0.314 -0.638** 0.170 mother (0.359) (0.317) (0.273) (0.210) (0.289) (0.224) Lives with single parent 1.038 0.436 -0.497 0.603 -0.086 -0.568* (0.767) (0.724) (0.542) (0.566) (0.629) (0.341)
7
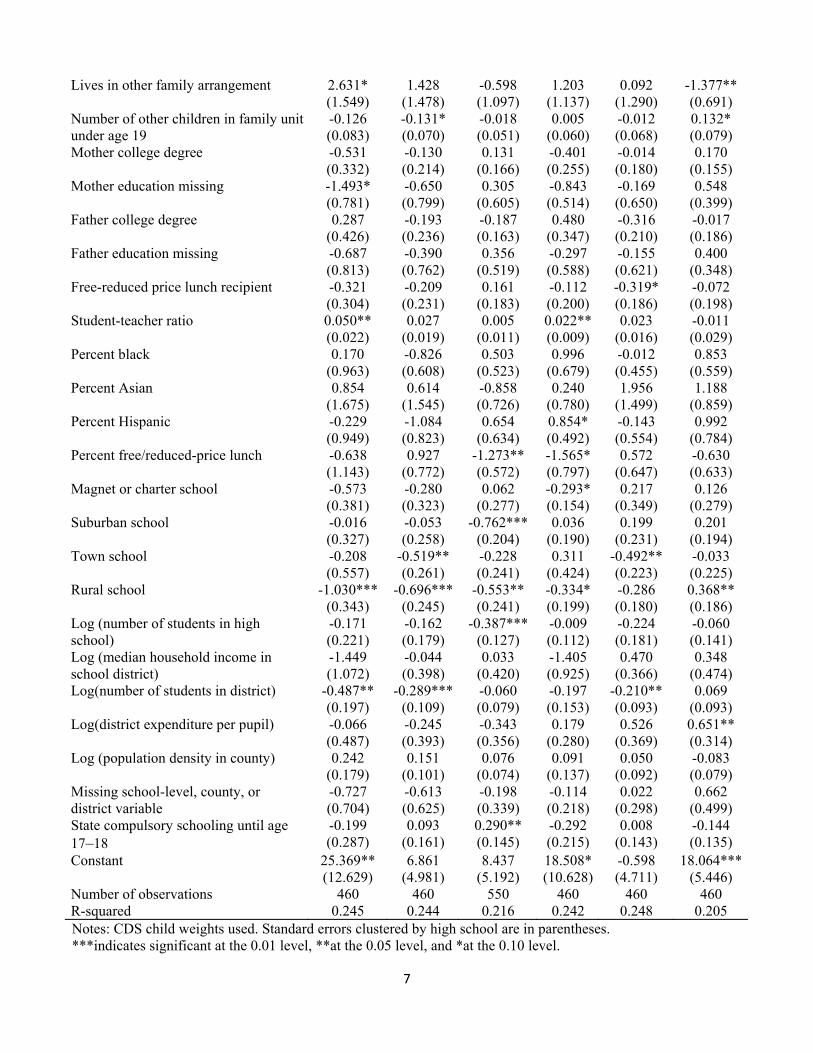
Lives in other family arrangement 2.631* 1.428 -0.598 1.203 0.092 -1.377** (1.549) (1.478) (1.097) (1.137) (1.290) (0.691) Number of other children in family unit -0.126 -0.131* -0.018 0.005 -0.012 0.132* under age 19 (0.083) (0.070) (0.051) (0.060) (0.068) (0.079) Mother college degree -0.531 -0.130 0.131 -0.401 -0.014 0.170 (0.332) (0.214) (0.166) (0.255) (0.180) (0.155) Mother education missing -1.493* -0.650 0.305 -0.843 -0.169 0.548 (0.781) (0.799) (0.605) (0.514) (0.650) (0.399) Father college degree 0.287 -0.193 -0.187 0.480 -0.316 -0.017 (0.426) (0.236) (0.163) (0.347) (0.210) (0.186) Father education missing -0.687 -0.390 0.356 -0.297 -0.155 0.400 (0.813) (0.762) (0.519) (0.588) (0.621) (0.348) Free-reduced price lunch recipient -0.321 -0.209 0.161 -0.112 -0.319* -0.072 (0.304) (0.231) (0.183) (0.200) (0.186) (0.198) Student-teacher ratio 0.050** 0.027 0.005 0.022** 0.023 -0.011 (0.022) (0.019) (0.011) (0.009) (0.016) (0.029) Percent black 0.170 -0.826 0.503 0.996 -0.012 0.853 (0.963) (0.608) (0.523) (0.679) (0.455) (0.559) Percent Asian 0.854 0.614 -0.858 0.240 1.956 1.188 (1.675) (1.545) (0.726) (0.780) (1.499) (0.859) Percent Hispanic -0.229 -1.084 0.654 0.854* -0.143 0.992 (0.949) (0.823) (0.634) (0.492) (0.554) (0.784) Percent free/reduced-price lunch -0.638 0.927 -1.273** -1.565* 0.572 -0.630 (1.143) (0.772) (0.572) (0.797) (0.647) (0.633) Magnet or charter school -0.573 -0.280 0.062 -0.293* 0.217 0.126 (0.381) (0.323) (0.277) (0.154) (0.349) (0.279) Suburban school -0.016 -0.053 -0.762*** 0.036 0.199 0.201 (0.327) (0.258) (0.204) (0.190) (0.231) (0.194) Town school -0.208 -0.519** -0.228 0.311 -0.492** -0.033 (0.557) (0.261) (0.241) (0.424) (0.223) (0.225) Rural school -1.030*** -0.696*** -0.553** -0.334* -0.286 0.368** (0.343) (0.245) (0.241) (0.199) (0.180) (0.186) Log (number of students in high -0.171 -0.162 -0.387*** -0.009 -0.224 -0.060 school) (0.221) (0.179) (0.127) (0.112) (0.181) (0.141) Log (median household income in -1.449 -0.044 0.033 -1.405 0.470 0.348 school district) (1.072) (0.398) (0.420) (0.925) (0.366) (0.474) Log(number of students in district) -0.487** -0.289*** -0.060 -0.197 -0.210** 0.069 (0.197) (0.109) (0.079) (0.153) (0.093) (0.093) Log(district expenditure per pupil) -0.066 -0.245 -0.343 0.179 0.526 0.651** (0.487) (0.393) (0.356) (0.280) (0.369) (0.314) Log (population density in county) 0.242 0.151 0.076 0.091 0.050 -0.083 (0.179) (0.101) (0.074) (0.137) (0.092) (0.079) Missing school-level, county, or -0.727 -0.613 -0.198 -0.114 0.022 0.662 district variable (0.704) (0.625) (0.339) (0.218) (0.298) (0.499) State compulsory schooling until age -0.199 0.093 0.290** -0.292 0.008 -0.144 17–18 (0.287) (0.161) (0.145) (0.215) (0.143) (0.135) Constant 25.369** 6.861 8.437 18.508* -0.598 18.064*** (12.629) (4.981) (5.192) (10.628) (4.711) (5.446) Number of observations 460 460 550 460 460 460 R-squared 0.245 0.244 0.216 0.242 0.248 0.205 Notes: CDS child weights used. Standard errors clustered by high school are in parentheses. ***indicates significant at the 0.01 level, **at the 0.05 level, and *at the 0.10 level.

8
Table 10a. Effects of School Start Time on Time-Diary Outcomes (Females – Full Results) (N = 550)
VARIABLES Sleep Market work
Nonmarket work
Care activities
Class time
Other schooling Homework
Extra-curricular activities/
sports
Screen time and
other leisure
Personal care
Missing activities
School start time 0.591*** 0.097 0.072 0.023 -0.192 -0.128* -0.188 0.277 -0.628* 0.015 0.061 (0.175) (0.193) (0.133) (0.076) (0.273) (0.065) (0.139) (0.211) (0.335) (0.080) (0.039) Lagged broad-reading score 0.101 -0.228 0.042 -0.002 0.071 -0.088* 0.035 0.034 0.082 -0.036 -0.011 (0.091) (0.141) (0.068) (0.030) (0.141) (0.047) (0.075) (0.086) (0.189) (0.042) (0.022) Lagged applied-problems -0.045 0.186** -0.006 -0.033 -0.147 0.115* 0.027 0.038 -0.217 0.075 0.006 score (0.085) (0.092) (0.054) (0.026) (0.127) (0.063) (0.071) (0.083) (0.153) (0.049) (0.019) Missing a lagged score -0.045 -0.137 0.068 0.096 0.583** -0.002 0.305* -0.459** -0.318 -0.086 -0.006 (0.176) (0.173) (0.132) (0.092) (0.245) (0.081) (0.163) (0.180) (0.317) (0.085) (0.057) School day length -0.126 0.235 -0.072 0.047 0.392 0.181 -0.003 -0.013 -0.639** 0.040 -0.041 (0.170) (0.176) (0.190) (0.069) (0.280) (0.119) (0.141) (0.202) (0.288) (0.065) (0.050) Black, non-Hispanic 0.186 0.110 0.246 -0.024 -0.581 -0.252** -0.205 0.329 0.245 -0.111 0.057 (0.300) (0.225) (0.220) (0.093) (0.460) (0.119) (0.220) (0.267) (0.431) (0.106) (0.057) Hispanic 0.378 0.010 0.814** 0.189 -2.100*** -0.011 -0.580** -0.585* 1.896*** -0.017 0.007 (0.445) (0.243) (0.323) (0.241) (0.621) (0.169) (0.235) (0.313) (0.617) (0.125) (0.081) Lives in East region 0.351 -0.074 0.090 0.379 -0.714 0.082 -0.054 -0.268 0.280 -0.075 0.004 (0.292) (0.321) (0.335) (0.292) (0.577) (0.216) (0.225) (0.312) (0.519) (0.127) (0.061) Lives in Midwest region 0.204 0.200 0.059 0.093 -0.369 -0.044 0.035 -0.214 -0.092 0.022 0.105* (0.231) (0.240) (0.198) (0.096) (0.404) (0.093) (0.159) (0.244) (0.452) (0.092) (0.060) Lives in West region 0.058 0.086 0.319 0.053 -0.063 -0.177* 0.492** -0.299 -0.586 0.074 0.044 (0.283) (0.272) (0.204) (0.101) (0.440) (0.100) (0.229) (0.385) (0.552) (0.112) (0.070) Grade 9 0.019 -0.839*** 0.031 -0.257* 0.900*** -0.045 0.008 0.048 0.234 -0.049 -0.050 (0.184) (0.182) (0.200) (0.148) (0.316) (0.065) (0.143) (0.232) (0.328) (0.097) (0.047) Grade 10 0.280 -0.735*** -0.055 -0.178 0.548* -0.157* -0.117 -0.357* 0.786** 0.022 -0.038 (0.191) (0.200) (0.156) (0.132) (0.323) (0.092) (0.136) (0.201) (0.334) (0.104) (0.039) Grade 11 -0.001 -0.261 -0.275 -0.132 0.706** -0.029 0.306* -0.275 0.008 -0.117 0.069 (0.178) (0.243) (0.179) (0.148) (0.290) (0.071) (0.172) (0.209) (0.312) (0.090) (0.072) Interviewed in 2007-2008 0.092 0.012 -0.161 -0.063 0.211 0.131** -0.092 0.096 -0.098 -0.116* -0.012 (0.146) (0.143) (0.101) (0.087) (0.208) (0.051) (0.122) (0.147) (0.255) (0.065) (0.033) Ever in special education 0.444* -0.072 -0.079 -0.194** 0.373 0.012 -0.186 -0.307** -0.174 0.007 0.177 (0.230) (0.256) (0.179) (0.076) (0.330) (0.079) (0.221) (0.154) (0.387) (0.115) (0.158) October interview -0.053 0.258 0.097 -0.115 -0.223 -0.061 -0.116 -0.303 0.676* -0.025 -0.135** (0.210) (0.237) (0.177) (0.198) (0.320) (0.082) (0.158) (0.272) (0.389) (0.085) (0.055) November interview 0.084 -0.057 0.260 -0.263 -0.714* -0.122 -0.089 0.018 1.053** -0.065 -0.106* (0.249) (0.270) (0.185) (0.214) (0.404) (0.120) (0.199) (0.307) (0.510) (0.103) (0.061)
9
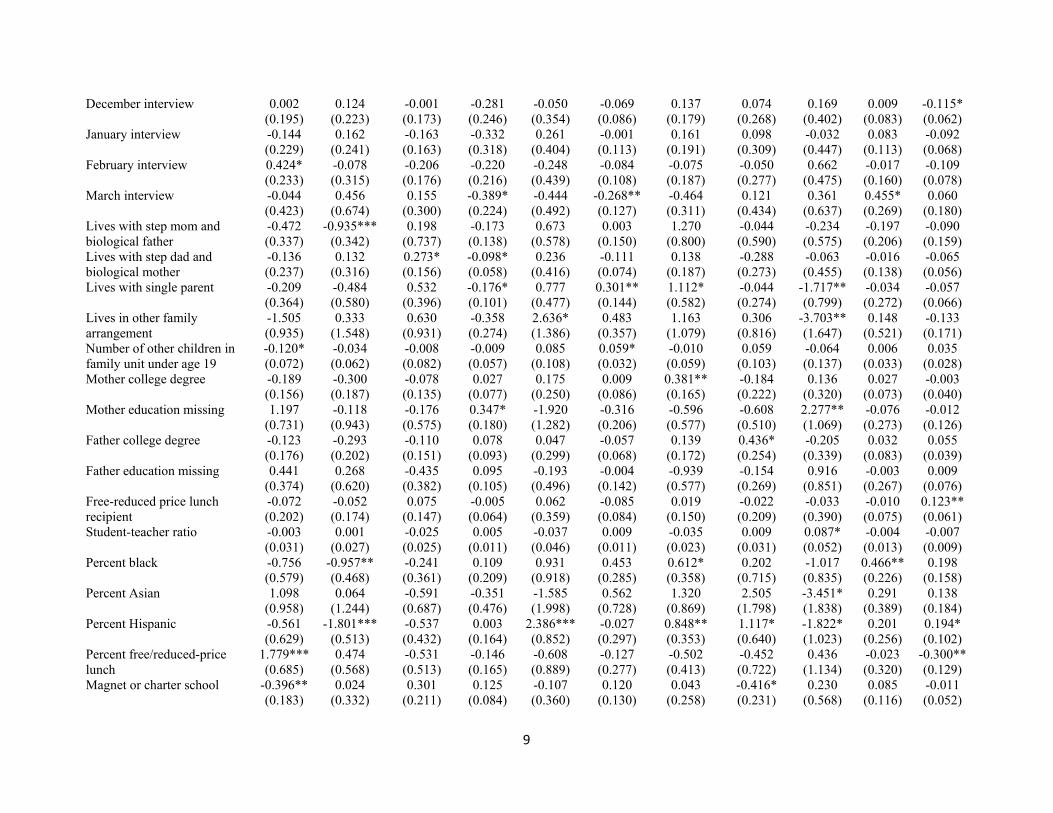
December interview 0.002 0.124 -0.001 -0.281 -0.050 -0.069 0.137 0.074 0.169 0.009 -0.115* (0.195) (0.223) (0.173) (0.246) (0.354) (0.086) (0.179) (0.268) (0.402) (0.083) (0.062) January interview -0.144 0.162 -0.163 -0.332 0.261 -0.001 0.161 0.098 -0.032 0.083 -0.092 (0.229) (0.241) (0.163) (0.318) (0.404) (0.113) (0.191) (0.309) (0.447) (0.113) (0.068) February interview 0.424* -0.078 -0.206 -0.220 -0.248 -0.084 -0.075 -0.050 0.662 -0.017 -0.109 (0.233) (0.315) (0.176) (0.216) (0.439) (0.108) (0.187) (0.277) (0.475) (0.160) (0.078) March interview -0.044 0.456 0.155 -0.389* -0.444 -0.268** -0.464 0.121 0.361 0.455* 0.060 (0.423) (0.674) (0.300) (0.224) (0.492) (0.127) (0.311) (0.434) (0.637) (0.269) (0.180) Lives with step mom and -0.472 -0.935*** 0.198 -0.173 0.673 0.003 1.270 -0.044 -0.234 -0.197 -0.090 biological father (0.337) (0.342) (0.737) (0.138) (0.578) (0.150) (0.800) (0.590) (0.575) (0.206) (0.159) Lives with step dad and -0.136 0.132 0.273* -0.098* 0.236 -0.111 0.138 -0.288 -0.063 -0.016 -0.065 biological mother (0.237) (0.316) (0.156) (0.058) (0.416) (0.074) (0.187) (0.273) (0.455) (0.138) (0.056) Lives with single parent -0.209 -0.484 0.532 -0.176* 0.777 0.301** 1.112* -0.044 -1.717** -0.034 -0.057 (0.364) (0.580) (0.396) (0.101) (0.477) (0.144) (0.582) (0.274) (0.799) (0.272) (0.066) Lives in other family -1.505 0.333 0.630 -0.358 2.636* 0.483 1.163 0.306 -3.703** 0.148 -0.133 arrangement (0.935) (1.548) (0.931) (0.274) (1.386) (0.357) (1.079) (0.816) (1.647) (0.521) (0.171) Number of other children in -0.120* -0.034 -0.008 -0.009 0.085 0.059* -0.010 0.059 -0.064 0.006 0.035 family unit under age 19 (0.072) (0.062) (0.082) (0.057) (0.108) (0.032) (0.059) (0.103) (0.137) (0.033) (0.028) Mother college degree -0.189 -0.300 -0.078 0.027 0.175 0.009 0.381** -0.184 0.136 0.027 -0.003 (0.156) (0.187) (0.135) (0.077) (0.250) (0.086) (0.165) (0.222) (0.320) (0.073) (0.040) Mother education missing 1.197 -0.118 -0.176 0.347* -1.920 -0.316 -0.596 -0.608 2.277** -0.076 -0.012 (0.731) (0.943) (0.575) (0.180) (1.282) (0.206) (0.577) (0.510) (1.069) (0.273) (0.126) Father college degree -0.123 -0.293 -0.110 0.078 0.047 -0.057 0.139 0.436* -0.205 0.032 0.055 (0.176) (0.202) (0.151) (0.093) (0.299) (0.068) (0.172) (0.254) (0.339) (0.083) (0.039) Father education missing 0.441 0.268 -0.435 0.095 -0.193 -0.004 -0.939 -0.154 0.916 -0.003 0.009 (0.374) (0.620) (0.382) (0.105) (0.496) (0.142) (0.577) (0.269) (0.851) (0.267) (0.076) Free-reduced price lunch -0.072 -0.052 0.075 -0.005 0.062 -0.085 0.019 -0.022 -0.033 -0.010 0.123** recipient (0.202) (0.174) (0.147) (0.064) (0.359) (0.084) (0.150) (0.209) (0.390) (0.075) (0.061) Student-teacher ratio -0.003 0.001 -0.025 0.005 -0.037 0.009 -0.035 0.009 0.087* -0.004 -0.007 (0.031) (0.027) (0.025) (0.011) (0.046) (0.011) (0.023) (0.031) (0.052) (0.013) (0.009) Percent black -0.756 -0.957** -0.241 0.109 0.931 0.453 0.612* 0.202 -1.017 0.466** 0.198 (0.579) (0.468) (0.361) (0.209) (0.918) (0.285) (0.358) (0.715) (0.835) (0.226) (0.158) Percent Asian 1.098 0.064 -0.591 -0.351 -1.585 0.562 1.320 2.505 -3.451* 0.291 0.138 (0.958) (1.244) (0.687) (0.476) (1.998) (0.728) (0.869) (1.798) (1.838) (0.389) (0.184) Percent Hispanic -0.561 -1.801*** -0.537 0.003 2.386*** -0.027 0.848** 1.117* -1.822* 0.201 0.194* (0.629) (0.513) (0.432) (0.164) (0.852) (0.297) (0.353) (0.640) (1.023) (0.256) (0.102) Percent free/reduced-price 1.779*** 0.474 -0.531 -0.146 -0.608 -0.127 -0.502 -0.452 0.436 -0.023 -0.300** lunch (0.685) (0.568) (0.513) (0.165) (0.889) (0.277) (0.413) (0.722) (1.134) (0.320) (0.129) Magnet or charter school -0.396** 0.024 0.301 0.125 -0.107 0.120 0.043 -0.416* 0.230 0.085 -0.011 (0.183) (0.332) (0.211) (0.084) (0.360) (0.130) (0.258) (0.231) (0.568) (0.116) (0.052)
10
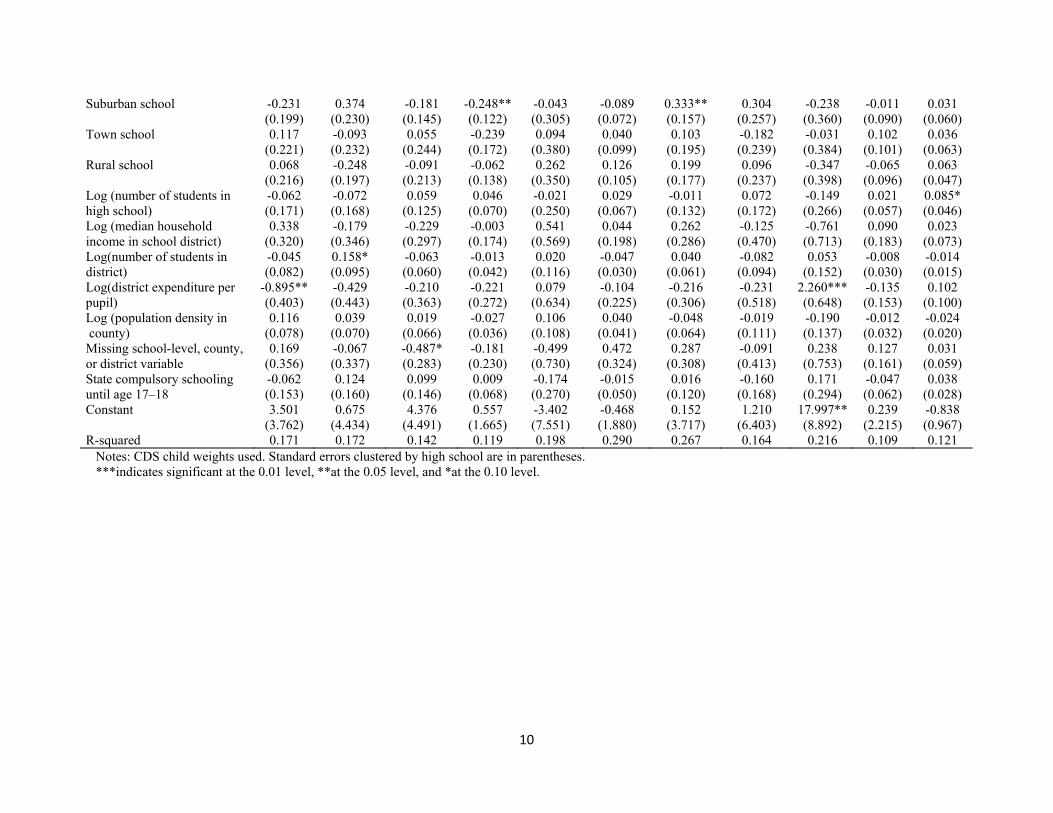
Suburban school -0.231 0.374 -0.181 -0.248** -0.043 -0.089 0.333** 0.304 -0.238 -0.011 0.031 (0.199) (0.230) (0.145) (0.122) (0.305) (0.072) (0.157) (0.257) (0.360) (0.090) (0.060) Town school 0.117 -0.093 0.055 -0.239 0.094 0.040 0.103 -0.182 -0.031 0.102 0.036 (0.221) (0.232) (0.244) (0.172) (0.380) (0.099) (0.195) (0.239) (0.384) (0.101) (0.063) Rural school 0.068 -0.248 -0.091 -0.062 0.262 0.126 0.199 0.096 -0.347 -0.065 0.063 (0.216) (0.197) (0.213) (0.138) (0.350) (0.105) (0.177) (0.237) (0.398) (0.096) (0.047) Log (number of students in -0.062 -0.072 0.059 0.046 -0.021 0.029 -0.011 0.072 -0.149 0.021 0.085* high school) (0.171) (0.168) (0.125) (0.070) (0.250) (0.067) (0.132) (0.172) (0.266) (0.057) (0.046) Log (median household 0.338 -0.179 -0.229 -0.003 0.541 0.044 0.262 -0.125 -0.761 0.090 0.023 income in school district) (0.320) (0.346) (0.297) (0.174) (0.569) (0.198) (0.286) (0.470) (0.713) (0.183) (0.073) Log(number of students in -0.045 0.158* -0.063 -0.013 0.020 -0.047 0.040 -0.082 0.053 -0.008 -0.014 district) (0.082) (0.095) (0.060) (0.042) (0.116) (0.030) (0.061) (0.094) (0.152) (0.030) (0.015) Log(district expenditure per -0.895** -0.429 -0.210 -0.221 0.079 -0.104 -0.216 -0.231 2.260*** -0.135 0.102 pupil) (0.403) (0.443) (0.363) (0.272) (0.634) (0.225) (0.306) (0.518) (0.648) (0.153) (0.100) Log (population density in 0.116 0.039 0.019 -0.027 0.106 0.040 -0.048 -0.019 -0.190 -0.012 -0.024 county) (0.078) (0.070) (0.066) (0.036) (0.108) (0.041) (0.064) (0.111) (0.137) (0.032) (0.020) Missing school-level, county, 0.169 -0.067 -0.487* -0.181 -0.499 0.472 0.287 -0.091 0.238 0.127 0.031 or district variable (0.356) (0.337) (0.283) (0.230) (0.730) (0.324) (0.308) (0.413) (0.753) (0.161) (0.059) State compulsory schooling -0.062 0.124 0.099 0.009 -0.174 -0.015 0.016 -0.160 0.171 -0.047 0.038 until age 17–18 (0.153) (0.160) (0.146) (0.068) (0.270) (0.050) (0.120) (0.168) (0.294) (0.062) (0.028) Constant 3.501 0.675 4.376 0.557 -3.402 -0.468 0.152 1.210 17.997** 0.239 -0.838 (3.762) (4.434) (4.491) (1.665) (7.551) (1.880) (3.717) (6.403) (8.892) (2.215) (0.967) R-squared 0.171 0.172 0.142 0.119 0.198 0.290 0.267 0.164 0.216 0.109 0.121
Notes: CDS child weights used. Standard errors clustered by high school are in parentheses. ***indicates significant at the 0.01 level, **at the 0.05 level, and *at the 0.10 level.
11
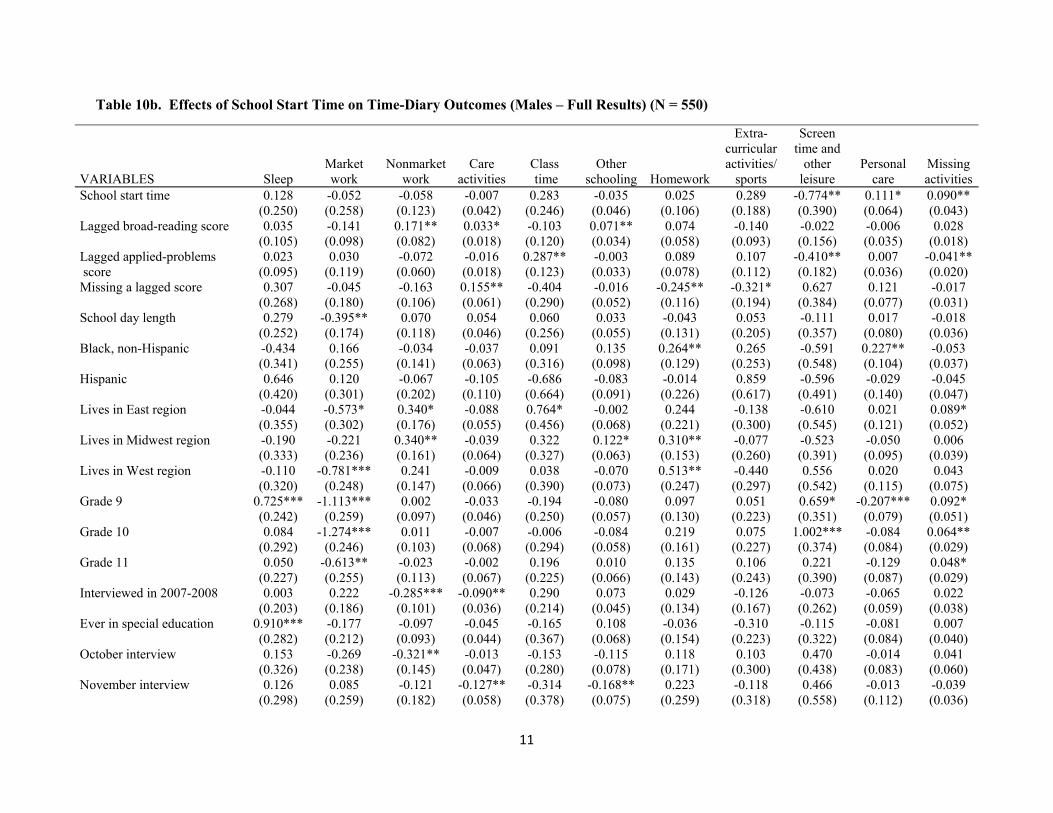
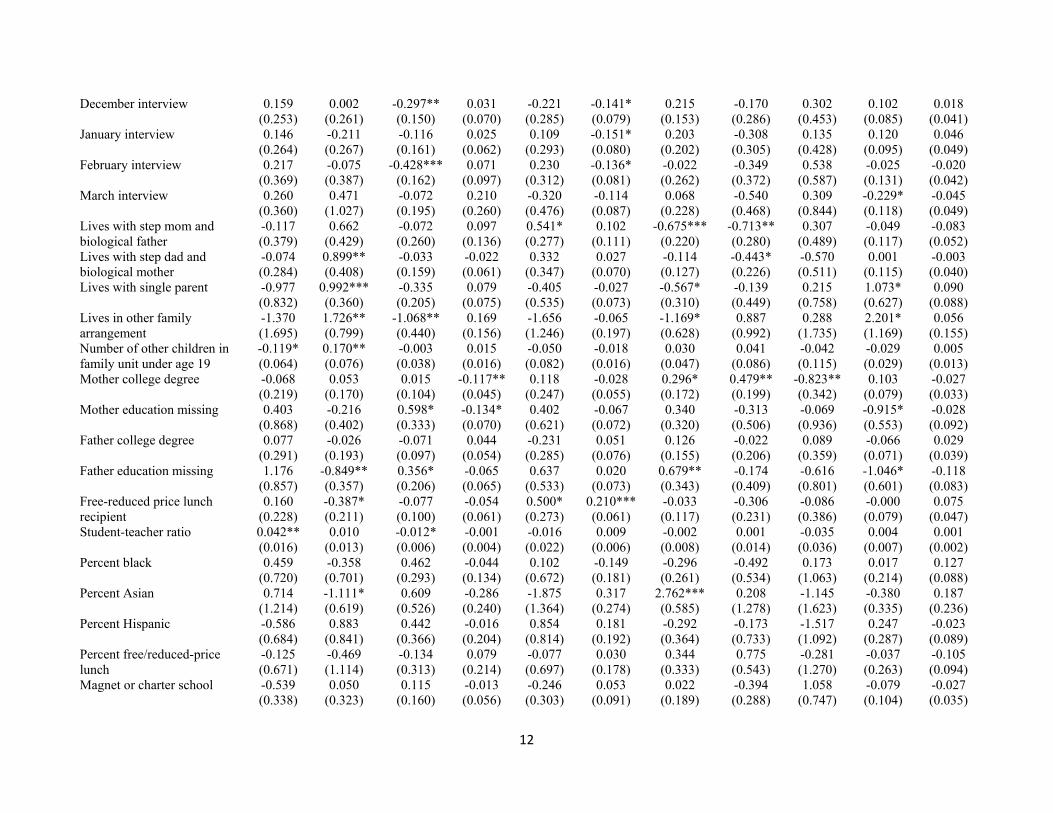
Table 10b. Effects of School Start Time on Time-Diary Outcomes (Males – Full Results) (N = 550)
VARIABLES Sleep Market work
Nonmarket work
Care activities
Class time
Other schooling Homework
Extra- curricular activities/
sports
Screen time and
other leisure
Personal care
Missing activities
School start time 0.128 -0.052 -0.058 -0.007 0.283 -0.035 0.025 0.289 -0.774** 0.111* 0.090** (0.250) (0.258) (0.123) (0.042) (0.246) (0.046) (0.106) (0.188) (0.390) (0.064) (0.043) Lagged broad-reading score 0.035 -0.141 0.171** 0.033* -0.103 0.071** 0.074 -0.140 -0.022 -0.006 0.028 (0.105) (0.098) (0.082) (0.018) (0.120) (0.034) (0.058) (0.093) (0.156) (0.035) (0.018) Lagged applied-problems 0.023 0.030 -0.072 -0.016 0.287** -0.003 0.089 0.107 -0.410** 0.007 -0.041** score (0.095) (0.119) (0.060) (0.018) (0.123) (0.033) (0.078) (0.112) (0.182) (0.036) (0.020) Missing a lagged score 0.307 -0.045 -0.163 0.155** -0.404 -0.016 -0.245** -0.321* 0.627 0.121 -0.017 (0.268) (0.180) (0.106) (0.061) (0.290) (0.052) (0.116) (0.194) (0.384) (0.077) (0.031) School day length 0.279 -0.395** 0.070 0.054 0.060 0.033 -0.043 0.053 -0.111 0.017 -0.018 (0.252) (0.174) (0.118) (0.046) (0.256) (0.055) (0.131) (0.205) (0.357) (0.080) (0.036) Black, non-Hispanic -0.434 0.166 -0.034 -0.037 0.091 0.135 0.264** 0.265 -0.591 0.227** -0.053 (0.341) (0.255) (0.141) (0.063) (0.316) (0.098) (0.129) (0.253) (0.548) (0.104) (0.037) Hispanic 0.646 0.120 -0.067 -0.105 -0.686 -0.083 -0.014 0.859 -0.596 -0.029 -0.045 (0.420) (0.301) (0.202) (0.110) (0.664) (0.091) (0.226) (0.617) (0.491) (0.140) (0.047) Lives in East region -0.044 -0.573* 0.340* -0.088 0.764* -0.002 0.244 -0.138 -0.610 0.021 0.089* (0.355) (0.302) (0.176) (0.055) (0.456) (0.068) (0.221) (0.300) (0.545) (0.121) (0.052) Lives in Midwest region -0.190 -0.221 0.340** -0.039 0.322 0.122* 0.310** -0.077 -0.523 -0.050 0.006 (0.333) (0.236) (0.161) (0.064) (0.327) (0.063) (0.153) (0.260) (0.391) (0.095) (0.039) Lives in West region -0.110 -0.781*** 0.241 -0.009 0.038 -0.070 0.513** -0.440 0.556 0.020 0.043 (0.320) (0.248) (0.147) (0.066) (0.390) (0.073) (0.247) (0.297) (0.542) (0.115) (0.075) Grade 9 0.725*** -1.113*** 0.002 -0.033 -0.194 -0.080 0.097 0.051 0.659* -0.207*** 0.092* (0.242) (0.259) (0.097) (0.046) (0.250) (0.057) (0.130) (0.223) (0.351) (0.079) (0.051) Grade 10 0.084 -1.274*** 0.011 -0.007 -0.006 -0.084 0.219 0.075 1.002*** -0.084 0.064** (0.292) (0.246) (0.103) (0.068) (0.294) (0.058) (0.161) (0.227) (0.374) (0.084) (0.029) Grade 11 0.050 -0.613** -0.023 -0.002 0.196 0.010 0.135 0.106 0.221 -0.129 0.048* (0.227) (0.255) (0.113) (0.067) (0.225) (0.066) (0.143) (0.243) (0.390) (0.087) (0.029) Interviewed in 2007-2008 0.003 0.222 -0.285*** -0.090** 0.290 0.073 0.029 -0.126 -0.073 -0.065 0.022 (0.203) (0.186) (0.101) (0.036) (0.214) (0.045) (0.134) (0.167) (0.262) (0.059) (0.038) Ever in special education 0.910*** -0.177 -0.097 -0.045 -0.165 0.108 -0.036 -0.310 -0.115 -0.081 0.007 (0.282) (0.212) (0.093) (0.044) (0.367) (0.068) (0.154) (0.223) (0.322) (0.084) (0.040) October interview 0.153 -0.269 -0.321** -0.013 -0.153 -0.115 0.118 0.103 0.470 -0.014 0.041 (0.326) (0.238) (0.145) (0.047) (0.280) (0.078) (0.171) (0.300) (0.438) (0.083) (0.060) November interview 0.126 0.085 -0.121 -0.127** -0.314 -0.168** 0.223 -0.118 0.466 -0.013 -0.039 (0.298) (0.259) (0.182) (0.058) (0.378) (0.075) (0.259) (0.318) (0.558) (0.112) (0.036)
12
December interview 0.159 0.002 -0.297** 0.031 -0.221 -0.141* 0.215 -0.170 0.302 0.102 0.018 (0.253) (0.261) (0.150) (0.070) (0.285) (0.079) (0.153) (0.286) (0.453) (0.085) (0.041) January interview 0.146 -0.211 -0.116 0.025 0.109 -0.151* 0.203 -0.308 0.135 0.120 0.046 (0.264) (0.267) (0.161) (0.062) (0.293) (0.080) (0.202) (0.305) (0.428) (0.095) (0.049) February interview 0.217 -0.075 -0.428*** 0.071 0.230 -0.136* -0.022 -0.349 0.538 -0.025 -0.020 (0.369) (0.387) (0.162) (0.097) (0.312) (0.081) (0.262) (0.372) (0.587) (0.131) (0.042) March interview 0.260 0.471 -0.072 0.210 -0.320 -0.114 0.068 -0.540 0.309 -0.229* -0.045 (0.360) (1.027) (0.195) (0.260) (0.476) (0.087) (0.228) (0.468) (0.844) (0.118) (0.049) Lives with step mom and -0.117 0.662 -0.072 0.097 0.541* 0.102 -0.675*** -0.713** 0.307 -0.049 -0.083 biological father (0.379) (0.429) (0.260) (0.136) (0.277) (0.111) (0.220) (0.280) (0.489) (0.117) (0.052) Lives with step dad and -0.074 0.899** -0.033 -0.022 0.332 0.027 -0.114 -0.443* -0.570 0.001 -0.003 biological mother (0.284) (0.408) (0.159) (0.061) (0.347) (0.070) (0.127) (0.226) (0.511) (0.115) (0.040) Lives with single parent -0.977 0.992*** -0.335 0.079 -0.405 -0.027 -0.567* -0.139 0.215 1.073* 0.090 (0.832) (0.360) (0.205) (0.075) (0.535) (0.073) (0.310) (0.449) (0.758) (0.627) (0.088) Lives in other family -1.370 1.726** -1.068** 0.169 -1.656 -0.065 -1.169* 0.887 0.288 2.201* 0.056 arrangement (1.695) (0.799) (0.440) (0.156) (1.246) (0.197) (0.628) (0.992) (1.735) (1.169) (0.155) Number of other children in -0.119* 0.170** -0.003 0.015 -0.050 -0.018 0.030 0.041 -0.042 -0.029 0.005 family unit under age 19 (0.064) (0.076) (0.038) (0.016) (0.082) (0.016) (0.047) (0.086) (0.115) (0.029) (0.013) Mother college degree -0.068 0.053 0.015 -0.117** 0.118 -0.028 0.296* 0.479** -0.823** 0.103 -0.027 (0.219) (0.170) (0.104) (0.045) (0.247) (0.055) (0.172) (0.199) (0.342) (0.079) (0.033) Mother education missing 0.403 -0.216 0.598* -0.134* 0.402 -0.067 0.340 -0.313 -0.069 -0.915* -0.028 (0.868) (0.402) (0.333) (0.070) (0.621) (0.072) (0.320) (0.506) (0.936) (0.553) (0.092) Father college degree 0.077 -0.026 -0.071 0.044 -0.231 0.051 0.126 -0.022 0.089 -0.066 0.029 (0.291) (0.193) (0.097) (0.054) (0.285) (0.076) (0.155) (0.206) (0.359) (0.071) (0.039) Father education missing 1.176 -0.849** 0.356* -0.065 0.637 0.020 0.679** -0.174 -0.616 -1.046* -0.118 (0.857) (0.357) (0.206) (0.065) (0.533) (0.073) (0.343) (0.409) (0.801) (0.601) (0.083) Free-reduced price lunch 0.160 -0.387* -0.077 -0.054 0.500* 0.210*** -0.033 -0.306 -0.086 -0.000 0.075 recipient (0.228) (0.211) (0.100) (0.061) (0.273) (0.061) (0.117) (0.231) (0.386) (0.079) (0.047) Student-teacher ratio 0.042** 0.010 -0.012* -0.001 -0.016 0.009 -0.002 0.001 -0.035 0.004 0.001 (0.016) (0.013) (0.006) (0.004) (0.022) (0.006) (0.008) (0.014) (0.036) (0.007) (0.002) Percent black 0.459 -0.358 0.462 -0.044 0.102 -0.149 -0.296 -0.492 0.173 0.017 0.127 (0.720) (0.701) (0.293) (0.134) (0.672) (0.181) (0.261) (0.534) (1.063) (0.214) (0.088) Percent Asian 0.714 -1.111* 0.609 -0.286 -1.875 0.317 2.762*** 0.208 -1.145 -0.380 0.187 (1.214) (0.619) (0.526) (0.240) (1.364) (0.274) (0.585) (1.278) (1.623) (0.335) (0.236) Percent Hispanic -0.586 0.883 0.442 -0.016 0.854 0.181 -0.292 -0.173 -1.517 0.247 -0.023 (0.684) (0.841) (0.366) (0.204) (0.814) (0.192) (0.364) (0.733) (1.092) (0.287) (0.089) Percent free/reduced-price -0.125 -0.469 -0.134 0.079 -0.077 0.030 0.344 0.775 -0.281 -0.037 -0.105 lunch (0.671) (1.114) (0.313) (0.214) (0.697) (0.178) (0.333) (0.543) (1.270) (0.263) (0.094) Magnet or charter school -0.539 0.050 0.115 -0.013 -0.246 0.053 0.022 -0.394 1.058 -0.079 -0.027 (0.338) (0.323) (0.160) (0.056) (0.303) (0.091) (0.189) (0.288) (0.747) (0.104) (0.035)

13
Suburban school 0.034 -0.485** 0.003 -0.042 -0.696*** 0.150** -0.145 -0.150 1.235*** 0.003 0.093*** (0.251) (0.240) (0.120) (0.050) (0.250) (0.062) (0.153) (0.231) (0.362) (0.077) (0.033) Town school -0.176 -0.705*** -0.105 -0.070 -0.075 0.063 -0.199 -0.099 1.344*** -0.080 0.102*** (0.367) (0.258) (0.141) (0.062) (0.330) (0.054) (0.181) (0.244) (0.493) (0.101) (0.037) Rural school -0.559** -0.560* 0.312* -0.070 -0.110 0.173** 0.212 0.021 0.497 -0.051 0.134** (0.274) (0.300) (0.160) (0.058) (0.238) (0.069) (0.193) (0.248) (0.410) (0.077) (0.054) Log (number of students in -0.235 -0.181 -0.016 -0.002 0.181 0.022 0.028 -0.203 0.463 -0.073 0.016 high school) (0.160) (0.201) (0.101) (0.045) (0.174) (0.050) (0.170) (0.154) (0.296) (0.066) (0.027) Log (median household -0.842 -0.204 -0.029 0.154* 0.319 -0.034 0.205 0.933** -0.449 -0.039 -0.013 income in school district) (0.630) (0.451) (0.231) (0.088) (0.544) (0.100) (0.290) (0.393) (0.709) (0.159) (0.092) Log(number of students in -0.240* 0.049 0.016 -0.012 0.132 0.032 0.112 0.056 -0.153 0.004 0.005 district) (0.127) (0.086) (0.053) (0.018) (0.121) (0.029) (0.087) (0.091) (0.164) (0.037) (0.019) Log(district expenditure per 0.221 1.020* -0.342 0.054 -0.829* 0.090 -0.318 -0.712* 0.885 0.002 -0.069 pupil) (0.367) (0.562) (0.243) (0.072) (0.498) (0.095) (0.314) (0.379) (0.778) (0.187) (0.070) Log (population density in 0.157 -0.062 0.001 -0.018 -0.012 -0.035 -0.078 0.023 0.015 0.009 -0.000 county) (0.121) (0.070) (0.041) (0.019) (0.117) (0.023) (0.058) (0.091) (0.137) (0.032) (0.013) Missing school-level, county, -0.588 -0.356* -0.126 -0.039 0.210 -0.044 0.261 -0.174 0.737 0.160 -0.043 or district variable (0.486) (0.204) (0.161) (0.105) (0.431) (0.054) (0.170) (0.314) (0.549) (0.207) (0.033) State compulsory schooling -0.086 -0.182 0.004 -0.021 0.338* -0.023 0.051 -0.193 0.064 0.034 0.015 until age 17–18 (0.189) (0.158) (0.092) (0.037) (0.196) (0.040) (0.114) (0.149) (0.289) (0.062) (0.041) Constant 16.645** 6.007 1.829 -1.549 -1.644 -0.107 -2.264 -8.550 13.507 0.670 -0.545 (7.181) (6.197) (2.994) (1.295) (6.444) (1.281) (3.411) (5.238) (8.671) (1.961) (1.276) R-squared 0.206 0.276 0.131 0.154 0.149 0.194 0.245 0.138 0.210 0.205 0.055
Notes: CDS child weights used. Standard errors clustered by high school are in parentheses. ***indicates significant at the 0.01 level, **at the 0.05 level, and *at the 0.10 level.
14
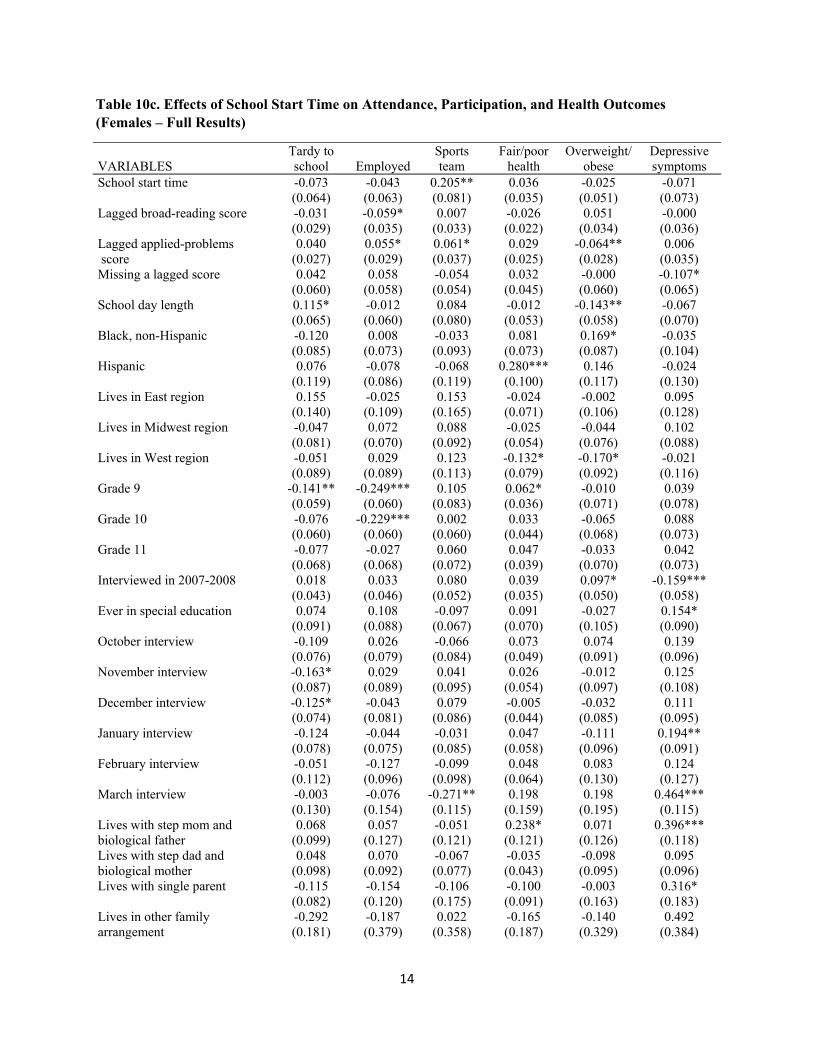
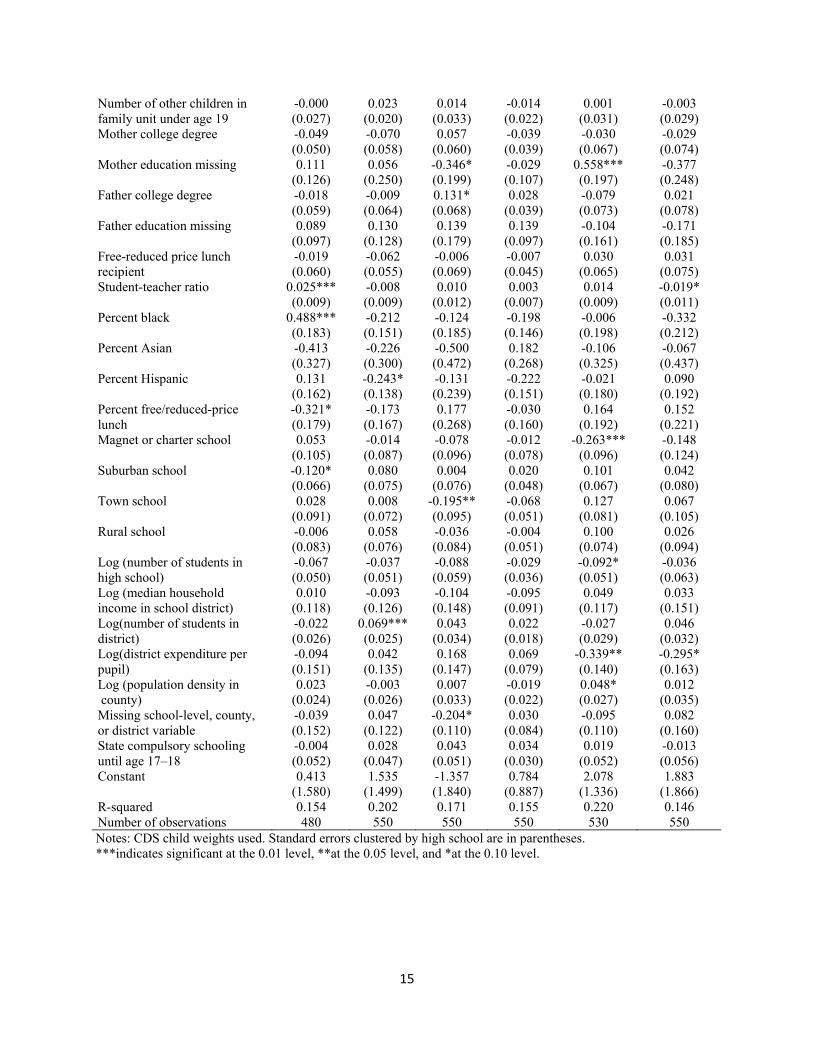
Table 10c. Effects of School Start Time on Attendance, Participation, and Health Outcomes (Females – Full Results)
VARIABLES Tardy to school Employed
Sports team
Fair/poor health
Overweight/ obese
Depressive symptoms
School start time -0.073 -0.043 0.205** 0.036 -0.025 -0.071 (0.064) (0.063) (0.081) (0.035) (0.051) (0.073) Lagged broad-reading score -0.031 -0.059* 0.007 -0.026 0.051 -0.000 (0.029) (0.035) (0.033) (0.022) (0.034) (0.036) Lagged applied-problems 0.040 0.055* 0.061* 0.029 -0.064** 0.006 score (0.027) (0.029) (0.037) (0.025) (0.028) (0.035) Missing a lagged score 0.042 0.058 -0.054 0.032 -0.000 -0.107* (0.060) (0.058) (0.054) (0.045) (0.060) (0.065) School day length 0.115* -0.012 0.084 -0.012 -0.143** -0.067 (0.065) (0.060) (0.080) (0.053) (0.058) (0.070) Black, non-Hispanic -0.120 0.008 -0.033 0.081 0.169* -0.035 (0.085) (0.073) (0.093) (0.073) (0.087) (0.104) Hispanic 0.076 -0.078 -0.068 0.280*** 0.146 -0.024 (0.119) (0.086) (0.119) (0.100) (0.117) (0.130) Lives in East region 0.155 -0.025 0.153 -0.024 -0.002 0.095 (0.140) (0.109) (0.165) (0.071) (0.106) (0.128) Lives in Midwest region -0.047 0.072 0.088 -0.025 -0.044 0.102 (0.081) (0.070) (0.092) (0.054) (0.076) (0.088) Lives in West region -0.051 0.029 0.123 -0.132* -0.170* -0.021 (0.089) (0.089) (0.113) (0.079) (0.092) (0.116) Grade 9 -0.141** -0.249*** 0.105 0.062* -0.010 0.039 (0.059) (0.060) (0.083) (0.036) (0.071) (0.078) Grade 10 -0.076 -0.229*** 0.002 0.033 -0.065 0.088 (0.060) (0.060) (0.060) (0.044) (0.068) (0.073) Grade 11 -0.077 -0.027 0.060 0.047 -0.033 0.042 (0.068) (0.068) (0.072) (0.039) (0.070) (0.073) Interviewed in 2007-2008 0.018 0.033 0.080 0.039 0.097* -0.159*** (0.043) (0.046) (0.052) (0.035) (0.050) (0.058) Ever in special education 0.074 0.108 -0.097 0.091 -0.027 0.154* (0.091) (0.088) (0.067) (0.070) (0.105) (0.090) October interview -0.109 0.026 -0.066 0.073 0.074 0.139 (0.076) (0.079) (0.084) (0.049) (0.091) (0.096) November interview -0.163* 0.029 0.041 0.026 -0.012 0.125 (0.087) (0.089) (0.095) (0.054) (0.097) (0.108) December interview -0.125* -0.043 0.079 -0.005 -0.032 0.111 (0.074) (0.081) (0.086) (0.044) (0.085) (0.095) January interview -0.124 -0.044 -0.031 0.047 -0.111 0.194** (0.078) (0.075) (0.085) (0.058) (0.096) (0.091) February interview -0.051 -0.127 -0.099 0.048 0.083 0.124 (0.112) (0.096) (0.098) (0.064) (0.130) (0.127) March interview -0.003 -0.076 -0.271** 0.198 0.198 0.464*** (0.130) (0.154) (0.115) (0.159) (0.195) (0.115) Lives with step mom and 0.068 0.057 -0.051 0.238* 0.071 0.396*** biological father (0.099) (0.127) (0.121) (0.121) (0.126) (0.118) Lives with step dad and 0.048 0.070 -0.067 -0.035 -0.098 0.095 biological mother (0.098) (0.092) (0.077) (0.043) (0.095) (0.096) Lives with single parent -0.115 -0.154 -0.106 -0.100 -0.003 0.316* (0.082) (0.120) (0.175) (0.091) (0.163) (0.183) Lives in other family -0.292 -0.187 0.022 -0.165 -0.140 0.492 arrangement (0.181) (0.379) (0.358) (0.187) (0.329) (0.384)
15
Number of other children in -0.000 0.023 0.014 -0.014 0.001 -0.003 family unit under age 19 (0.027) (0.020) (0.033) (0.022) (0.031) (0.029) Mother college degree -0.049 -0.070 0.057 -0.039 -0.030 -0.029 (0.050) (0.058) (0.060) (0.039) (0.067) (0.074) Mother education missing 0.111 0.056 -0.346* -0.029 0.558*** -0.377 (0.126) (0.250) (0.199) (0.107) (0.197) (0.248) Father college degree -0.018 -0.009 0.131* 0.028 -0.079 0.021 (0.059) (0.064) (0.068) (0.039) (0.073) (0.078) Father education missing 0.089 0.130 0.139 0.139 -0.104 -0.171 (0.097) (0.128) (0.179) (0.097) (0.161) (0.185) Free-reduced price lunch -0.019 -0.062 -0.006 -0.007 0.030 0.031 recipient (0.060) (0.055) (0.069) (0.045) (0.065) (0.075) Student-teacher ratio 0.025*** -0.008 0.010 0.003 0.014 -0.019* (0.009) (0.009) (0.012) (0.007) (0.009) (0.011) Percent black 0.488*** -0.212 -0.124 -0.198 -0.006 -0.332 (0.183) (0.151) (0.185) (0.146) (0.198) (0.212) Percent Asian -0.413 -0.226 -0.500 0.182 -0.106 -0.067 (0.327) (0.300) (0.472) (0.268) (0.325) (0.437) Percent Hispanic 0.131 -0.243* -0.131 -0.222 -0.021 0.090 (0.162) (0.138) (0.239) (0.151) (0.180) (0.192) Percent free/reduced-price -0.321* -0.173 0.177 -0.030 0.164 0.152 lunch (0.179) (0.167) (0.268) (0.160) (0.192) (0.221) Magnet or charter school 0.053 -0.014 -0.078 -0.012 -0.263*** -0.148 (0.105) (0.087) (0.096) (0.078) (0.096) (0.124) Suburban school -0.120* 0.080 0.004 0.020 0.101 0.042 (0.066) (0.075) (0.076) (0.048) (0.067) (0.080) Town school 0.028 0.008 -0.195** -0.068 0.127 0.067 (0.091) (0.072) (0.095) (0.051) (0.081) (0.105) Rural school -0.006 0.058 -0.036 -0.004 0.100 0.026 (0.083) (0.076) (0.084) (0.051) (0.074) (0.094) Log (number of students in -0.067 -0.037 -0.088 -0.029 -0.092* -0.036 high school) (0.050) (0.051) (0.059) (0.036) (0.051) (0.063) Log (median household 0.010 -0.093 -0.104 -0.095 0.049 0.033 income in school district) (0.118) (0.126) (0.148) (0.091) (0.117) (0.151) Log(number of students in -0.022 0.069*** 0.043 0.022 -0.027 0.046 district) (0.026) (0.025) (0.034) (0.018) (0.029) (0.032) Log(district expenditure per -0.094 0.042 0.168 0.069 -0.339** -0.295* pupil) (0.151) (0.135) (0.147) (0.079) (0.140) (0.163) Log (population density in 0.023 -0.003 0.007 -0.019 0.048* 0.012 county) (0.024) (0.026) (0.033) (0.022) (0.027) (0.035) Missing school-level, county, -0.039 0.047 -0.204* 0.030 -0.095 0.082 or district variable (0.152) (0.122) (0.110) (0.084) (0.110) (0.160) State compulsory schooling -0.004 0.028 0.043 0.034 0.019 -0.013 until age 17–18 (0.052) (0.047) (0.051) (0.030) (0.052) (0.056) Constant 0.413 1.535 -1.357 0.784 2.078 1.883 (1.580) (1.499) (1.840) (0.887) (1.336) (1.866) R-squared 0.154 0.202 0.171 0.155 0.220 0.146 Number of observations 480 550 550 550 530 550 Notes: CDS child weights used. Standard errors clustered by high school are in parentheses. ***indicates significant at the 0.01 level, **at the 0.05 level, and *at the 0.10 level.

16
Table 10d. Effects of School Start Time on Attendance, Participation, and Health Outcomes (Males – Full Results)
VARIABLES Tardy to school
Employed Sports team
Fair/poor health
Overweight/ obese
Depressive symptoms
School start time -0.053 0.089 0.035 -0.010 -0.029 -0.037 (0.050) (0.057) (0.063) (0.033) (0.071) (0.068) Lagged broad-reading score -0.023 -0.017 -0.034 -0.022 0.010 0.008 (0.026) (0.030) (0.033) (0.019) (0.036) (0.035) Lagged applied-problems 0.030 0.057* 0.014 -0.001 -0.019 0.006 score (0.025) (0.032) (0.035) (0.020) (0.035) (0.038) Missing a lagged score -0.048 0.045 -0.037 0.017 -0.039 0.047 (0.054) (0.062) (0.069) (0.037) (0.076) (0.079) School day length 0.004 0.041 0.018 -0.086** -0.068 0.083 (0.048) (0.056) (0.078) (0.040) (0.078) (0.073) Black, non-Hispanic 0.062 0.062 0.056 -0.010 0.185* 0.098 (0.062) (0.080) (0.084) (0.049) (0.096) (0.108) Hispanic 0.032 0.061 -0.080 -0.103 0.097 -0.160 (0.099) (0.134) (0.135) (0.066) (0.163) (0.146) Lives in East region 0.057 0.146 0.367*** -0.081* -0.007 0.009 (0.083) (0.105) (0.118) (0.048) (0.119) (0.132) Lives in Midwest region 0.046 0.138** 0.120 0.013 0.093 -0.062 (0.064) (0.067) (0.087) (0.042) (0.089) (0.092) Lives in West region 0.060 -0.048 -0.003 -0.008 0.178 0.079 (0.074) (0.077) (0.096) (0.063) (0.108) (0.108) Grade 9 -0.030 -0.261*** -0.019 0.030 0.026 0.255*** (0.060) (0.073) (0.071) (0.041) (0.074) (0.081) Grade 10 -0.054 -0.264*** 0.023 -0.003 -0.003 0.186** (0.058) (0.067) (0.076) (0.032) (0.083) (0.078) Grade 11 -0.005 -0.034 -0.033 -0.034 -0.047 0.092 (0.067) (0.075) (0.079) (0.032) (0.076) (0.083) Interviewed in 2007-2008 -0.019 -0.066 0.132** 0.065** 0.101 0.041 (0.043) (0.049) (0.059) (0.028) (0.063) (0.066) Ever in special education 0.051 -0.048 -0.229*** 0.038 -0.046 0.226*** (0.051) (0.053) (0.072) (0.041) (0.088) (0.077) October interview 0.121* -0.080 0.002 0.005 0.148* -0.045 (0.066) (0.079) (0.089) (0.043) (0.082) (0.099) November interview 0.140* -0.050 -0.145 0.090* 0.220** 0.036 (0.075) (0.086) (0.100) (0.053) (0.106) (0.118) December interview 0.057 -0.067 0.014 0.025 0.201** 0.083 (0.059) (0.081) (0.087) (0.043) (0.086) (0.109) January interview 0.045 -0.030 -0.141 -0.011 0.143 0.091 (0.072) (0.090) (0.098) (0.045) (0.096) (0.108) February interview 0.135 -0.083 0.062 0.119* 0.232* 0.289** (0.094) (0.102) (0.124) (0.067) (0.128) (0.127) March interview 0.085 -0.052 -0.186 0.029 0.267* -0.042 (0.097) (0.185) (0.180) (0.079) (0.154) (0.191) Lives with step mom and -0.139** -0.099 -0.178 -0.033 -0.061 0.203 biological father (0.068) (0.099) (0.159) (0.053) (0.165) (0.169) Lives with step dad and -0.105* 0.028 -0.184** -0.055** 0.052 0.109 biological mother (0.053) (0.082) (0.085) (0.028) (0.111) (0.089) Lives with single parent 0.273 0.385*** 0.169 0.126 -0.211 -0.080 (0.202) (0.108) (0.170) (0.094) (0.146) (0.138) Lives in other family 0.376 0.520** 0.501 0.194 -0.068 -0.212 arrangement (0.398) (0.234) (0.356) (0.191) (0.332) (0.328)

17
Number of other children in 0.037* 0.008 -0.013 0.001 0.013 0.016 family unit under age 19 (0.022) (0.016) (0.025) (0.017) (0.026) (0.025) Mother college degree -0.047 0.049 0.111* -0.044 -0.102 -0.186** (0.049) (0.055) (0.063) (0.034) (0.065) (0.076) Mother education missing -0.096 -0.117 -0.234 -0.174* 0.066 -0.015 (0.222) (0.136) (0.184) (0.103) (0.164) (0.183) Father college degree 0.087 -0.019 -0.014 0.037 0.011 0.153* (0.054) (0.062) (0.071) (0.036) (0.073) (0.079) Father education missing -0.260 -0.411*** -0.365** -0.038 0.081 0.247* (0.192) (0.107) (0.162) (0.090) (0.152) (0.132) Free-reduced price lunch -0.071* -0.042 -0.113 -0.004 -0.044 -0.110 recipient (0.041) (0.059) (0.071) (0.034) (0.074) (0.081) Student-teacher ratio 0.005 0.003 0.009** -0.003 -0.001 0.001 (0.009) (0.005) (0.005) (0.004) (0.005) (0.005) Percent black -0.032 -0.406*** -0.047 0.023 -0.094 -0.100 (0.115) (0.150) (0.184) (0.084) (0.200) (0.184) Percent Asian -0.173 -0.650** -0.322 0.019 -0.646 0.216 (0.195) (0.257) (0.301) (0.118) (0.464) (0.407) Percent Hispanic 0.066 -0.138 -0.059 0.391*** 0.130 0.288 (0.182) (0.191) (0.200) (0.130) (0.251) (0.237) Percent free/reduced-price 0.321** 0.342** 0.395** -0.023 0.060 -0.661*** lunch (0.150) (0.166) (0.196) (0.105) (0.242) (0.227) Magnet or charter school 0.082 -0.037 -0.047 -0.083 0.023 -0.186* (0.066) (0.076) (0.102) (0.058) (0.105) (0.095) Suburban school -0.009 0.036 -0.088 0.004 0.198** -0.004 (0.058) (0.063) (0.072) (0.046) (0.082) (0.082) Town school 0.022 0.045 0.071 -0.063 0.173 -0.004 (0.078) (0.086) (0.099) (0.051) (0.124) (0.122) Rural school 0.044 0.089 -0.051 -0.007 0.262*** -0.079 (0.058) (0.073) (0.079) (0.050) (0.096) (0.108) Log (number of students in 0.032 0.027 -0.063 -0.016 0.034 -0.048 high school) (0.034) (0.040) (0.053) (0.032) (0.066) (0.055) Log (median household 0.056 -0.090 0.419*** 0.080 -0.144 -0.376** income in school district) (0.109) (0.126) (0.132) (0.079) (0.150) (0.160) Log(number of students in -0.048* 0.022 0.039 0.024 0.018 0.015 district) (0.026) (0.024) (0.030) (0.021) (0.039) (0.034) Log(district expenditure per 0.092 0.075 -0.261* -0.027 0.034 -0.009 pupil) (0.114) (0.108) (0.140) (0.057) (0.142) (0.138) Log (population density in 0.029 0.010 -0.047 -0.027 0.034 0.041 county) (0.026) (0.025) (0.029) (0.017) (0.032) (0.030) Missing school-level, county, 0.118 0.071 -0.139 0.180 -0.044 0.188 or district variable (0.127) (0.126) (0.123) (0.120) (0.116) (0.120) State compulsory schooling -0.042 -0.055 0.018 0.011 0.060 -0.028 until age 17–18 (0.043) (0.047) (0.054) (0.029) (0.060) (0.062) Constant -0.567 -0.330 -3.726** -0.032 1.480 4.116** (1.278) (1.369) (1.702) (0.881) (1.918) (1.768) R-squared 0.158 0.228 0.212 0.231 0.158 0.197 Number of observations 490 550 550 550 540 520 Notes: CDS child weights used. Standard errors clustered by high school are in parentheses. ***indicates significant at the 0.01 level, **at the 0.05 level, and *at the 0.10 level.
18
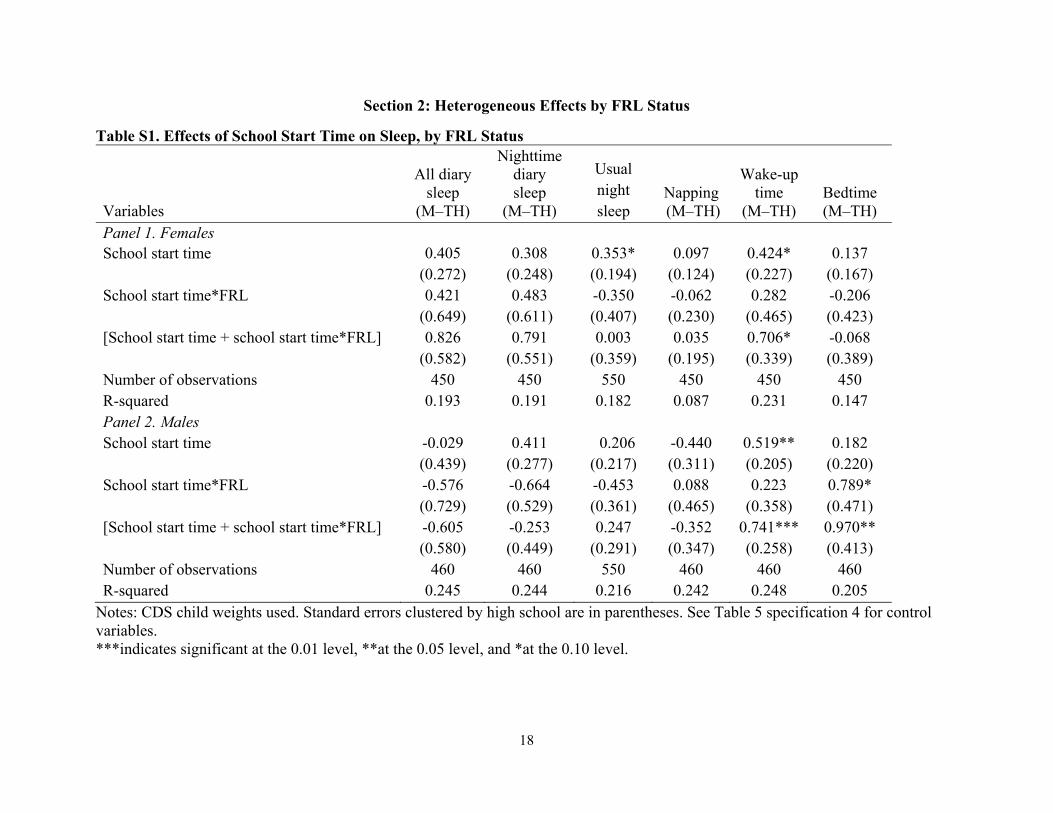
Section 2: Heterogeneous Effects by FRL Status
Table S1. Effects of School Start Time on Sleep, by FRL Status
Variables
All diary sleep
(M–TH)
Nighttime diary sleep
(M–TH)
Usual night sleep
Napping (M–TH)
Wake-up time
(M–TH) Bedtime (M–TH)
Panel 1. Females School start time 0.405 0.308 0.353* 0.097 0.424* 0.137 (0.272) (0.248) (0.194) (0.124) (0.227) (0.167) School start time*FRL 0.421 0.483 -0.350 -0.062 0.282 -0.206 (0.649) (0.611) (0.407) (0.230) (0.465) (0.423) [School start time + school start time*FRL] 0.826 0.791 0.003 0.035 0.706* -0.068 (0.582) (0.551) (0.359) (0.195) (0.339) (0.389) Number of observations 450 450 550 450 450 450 R-squared 0.193 0.191 0.182 0.087 0.231 0.147 Panel 2. Males School start time -0.029 0.411 0.206 -0.440 0.519** 0.182 (0.439) (0.277) (0.217) (0.311) (0.205) (0.220) School start time*FRL -0.576 -0.664 -0.453 0.088 0.223 0.789* (0.729) (0.529) (0.361) (0.465) (0.358) (0.471) [School start time + school start time*FRL] -0.605 -0.253 0.247 -0.352 0.741*** 0.970** (0.580) (0.449) (0.291) (0.347) (0.258) (0.413) Number of observations 460 460 550 460 460 460 R-squared 0.245 0.244 0.216 0.242 0.248 0.205
Notes: CDS child weights used. Standard errors clustered by high school are in parentheses. See Table 5 specification 4 for control variables. ***indicates significant at the 0.01 level, **at the 0.05 level, and *at the 0.10 level.
19
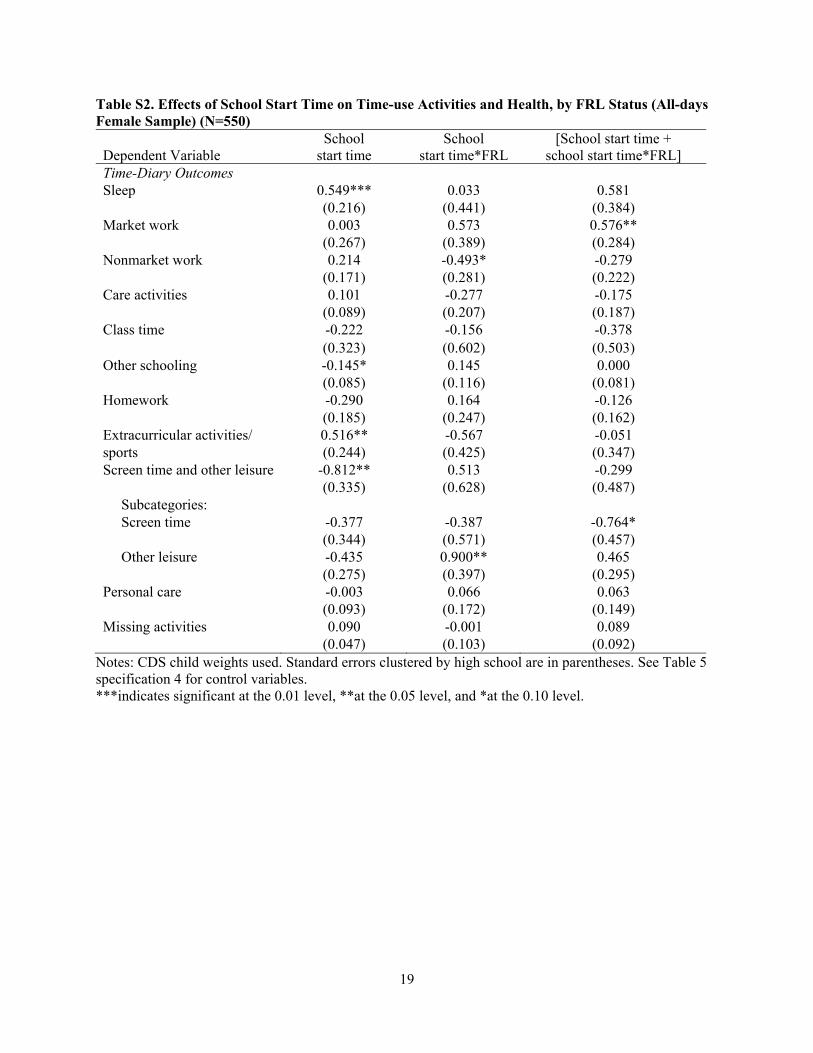
Table S2. Effects of School Start Time on Time-use Activities and Health, by FRL Status (All-days Female Sample) (N=550) Dependent Variable
School start time
School start time*FRL
[School start time + school start time*FRL]
Time-Diary Outcomes Sleep 0.549*** 0.033 0.581 (0.216) (0.441) (0.384) Market work 0.003 0.573 0.576** (0.267) (0.389) (0.284) Nonmarket work 0.214 -0.493* -0.279 (0.171) (0.281) (0.222) Care activities 0.101 -0.277 -0.175 (0.089) (0.207) (0.187) Class time -0.222 -0.156 -0.378 (0.323) (0.602) (0.503) Other schooling -0.145* 0.145 0.000 (0.085) (0.116) (0.081) Homework -0.290 0.164 -0.126 (0.185) (0.247) (0.162) Extracurricular activities/ 0.516** -0.567 -0.051 sports (0.244) (0.425) (0.347) Screen time and other leisure -0.812** 0.513 -0.299 (0.335) (0.628) (0.487) Subcategories: Screen time -0.377 -0.387 -0.764* (0.344) (0.571) (0.457) Other leisure -0.435 0.900** 0.465 (0.275) (0.397) (0.295) Personal care -0.003 0.066 0.063 (0.093) (0.172) (0.149) Missing activities 0.090 -0.001 0.089 (0.047) (0.103) (0.092)
Notes: CDS child weights used. Standard errors clustered by high school are in parentheses. See Table 5 specification 4 for control variables. ***indicates significant at the 0.01 level, **at the 0.05 level, and *at the 0.10 level.
20
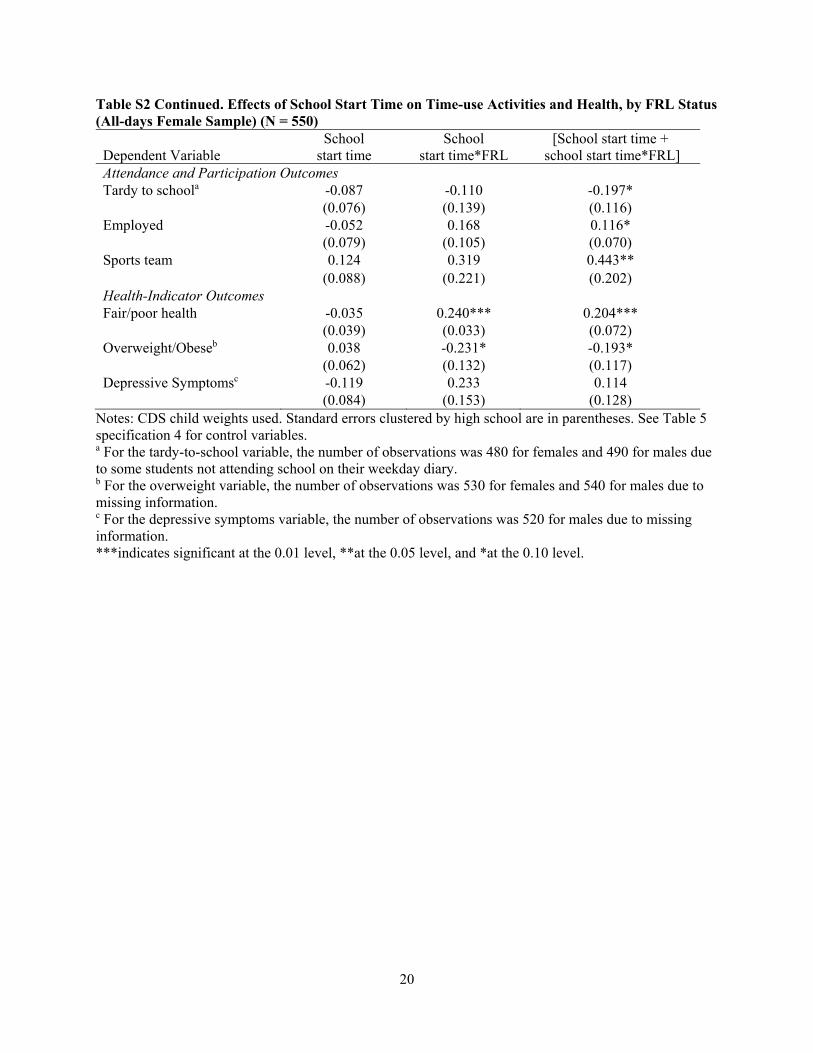
Table S2 Continued. Effects of School Start Time on Time-use Activities and Health, by FRL Status (All-days Female Sample) (N = 550) Dependent Variable
School start time
School start time*FRL
[School start time + school start time*FRL]
Attendance and Participation Outcomes Tardy to schoola -0.087 -0.110 -0.197* (0.076) (0.139) (0.116) Employed -0.052 0.168 0.116* (0.079) (0.105) (0.070) Sports team 0.124 0.319 0.443** (0.088) (0.221) (0.202) Health-Indicator Outcomes Fair/poor health -0.035 0.240*** 0.204*** (0.039) (0.033) (0.072) Overweight/Obeseb 0.038 -0.231* -0.193* (0.062) (0.132) (0.117) Depressive Symptomsc -0.119 0.233 0.114 (0.084) (0.153) (0.128)
Notes: CDS child weights used. Standard errors clustered by high school are in parentheses. See Table 5 specification 4 for control variables. a For the tardy-to-school variable, the number of observations was 480 for females and 490 for males due to some students not attending school on their weekday diary. b For the overweight variable, the number of observations was 530 for females and 540 for males due to missing information. c For the depressive symptoms variable, the number of observations was 520 for males due to missing information. ***indicates significant at the 0.01 level, **at the 0.05 level, and *at the 0.10 level.

21
Table S3. Effects of School Start Time on Time-use Activities and Health, by FRL Status (All-days Male Sample) (N = 550) Dependent Variable
School start time
School start time*FRL
[School start time + school start time*FRL]
Time-Diary Outcomes Sleep 0.148 -0.374 -0.225 (0.314) (0.606) (0.517) Market work 0.084 -0.666 -0.581* (0.275) (0.446) (0.350) Nonmarket work -0.054 0.015 -0.040 (0.174) (0.232) (0.153) Care activities -0.021 -0.100 -0.121* (0.065) (0.095) (0.070) Class time 0.502* -1.420** -0.918* (0.304) (0.583) (0.494) Other schooling -0.056 0.391* 0.334* (0.045) (0.202) (0.197) Homework 0.073 0.143 0.216 (0.139) (0.224) (0.176) Extracurricular activities/ 0.273 -0.157 0.116 sports (0.246) (0.367) (0.270) Screen time and other leisure -1.176** 2.377*** 1.200** (0.479) (0.760) (0.583) Subcategories: Screen time -1.391*** 2.035*** 0.644* (0.440) (0.775) (0.632) Other leisure 0.214 0.341 0.557 (0.265) (0.494) (0.418) Personal care 0.179** -0.284 -0.105 (0.076) (0.207) (0.192) Missing activities 0.047 0.075 0.123 (0.039) (0.112) (0.105)
Notes: CDS child weights used. Standard errors clustered by high school are in parentheses. See Table 5 specification 4 for control variables. ***indicates significant at the 0.01 level, **at the 0.05 level, and *at the 0.10 level.

22
Table S3 Continued. Effects of School Start Time on Time-use Activities and Health, by FRL Status (All-days Male Sample) (N = 550) Dependent Variable
School start time
School start time*FRL
[School start time + school start time*FRL]
Attendance and Participation Outcomes Tardy to schoola -0.069 0.011 -0.058 (0.063) (0.107) (0.088) Employed 0.110* -0.058 0.051 (0.066) (0.118) (0.098) Sports team -0.015 0.319 0.443** (0.077) (0.221) (0.202) Health-Indicator Outcomes Fair/poor health -0.026 0.118 0.091 (0.034) (0.080) (0.073) Overweight/Obeseb -0.051 0.093 0.042 (0.085) (0.167) (0.142) Depressive Symptomsc -0.014 -0.086 -0.100 (0.075) (0.134) (0.110) Number of observations 550 550 1,100
Notes: CDS child weights used. Standard errors clustered by high school are in parentheses. See Table 5 specification 4 for control variables. a For the tardy-to-school variable, the number of observations was 480 for females and 490 for males due to some students not attending school on their weekday diary. b For the overweight variable, the number of observations was 530 for females and 540 for males due to missing information. c For the depressive symptoms variable, the number of observations was 520 for males due to missing information. ***indicates significant at the 0.01 level, **at the 0.05 level, and *at the 0.10 level.